Towards Sustainable Solvent-Based Affinity Separations
374
TOWARDS SUSTAINABLE SOLVENT-BASED AFFINITY SEPARATIONS Thomas Brouwer
-
Upload
khangminh22 -
Category
Documents
-
view
0 -
download
0
Transcript of Towards Sustainable Solvent-Based Affinity Separations

TOWARDS SUSTAINABLESOLVENT-BASED AFFINITY
SEPARATIONS
Thomas Brouwer

TOWARDS SUSTAINABLE SOLVENT-BASEDAFFINITY SEPARATIONS
PROEFSCHRIFT
ter verkrijging vande graad van doctor aan de Universiteit Twente,
op gezag van de rector magnificus,prof. dr. ir. A. Veldkamp
volgens besluit van het College voor Promoties,in het openbaar te verdedigen
op donderdag 8 april 2021 om 16:45 uur
door
Thomas Brouwergeboren op 5 april 1991te Deventer, Nederland

Dit proefschrift is goedgekeurd door de promotoren
prof. dr. ir. Boelo Schuur (promotor)prof. dr. Sascha R. A. Kersten (promotor)
This has been an ISPT (Institute for Sustainable Process Technology) project(TEEI314006/BL-20-07), cofunded by the Topsector Energy by the Dutch Min-istry of Economic Affairs and Climate Policy
Towards Sustainable Solvent-Based Affinity SeparationsCover Design: Thomas van TilburgPrinted by: GildeprintISBN: 978-90-365-5123-6DOI: 10.3990/1.9789036551236URL: https://doi.org/10.3990/1.9789036551236
© 2021 Thomas Brouwer, Enschede, The Netherlands. All rights reserved. No partsof this thesis may be reproduced, stored in a retrieval system or transmitted in anyform or by any means without permission of the author. Alle rechten voorbehouden.Niets uit deze uitgave mag worden vermenigvuldigd, in enige vorm of op enige wijze,zonder voorafgaande schriftelijke toestemming van de auteur.

Promotiecomissie
Voorzitter: prof. dr. J.L. Herek Universiteit Twente
Promotor: prof. dr. ir. B. Schuur Universiteit Twenteprof. dr. S.R.A. Kersten Universiteit Twente
Leden: prof. dr. ir. H.A. Kooijman Shell / Clarkson Universityprof. dr. ir. N.E. Benes Universiteit Twenteprof. dr. ing. M.B. Franke Universiteit Twenteprof. dr. ir. I.M. Marrucho University of Lisbonprof. dr. ir. G. Bargeman Nouryon / Universiteit Twente


"I learned very early the difference between knowing the name of something and knowingsomething",
Richard P. Feynman, (1918 - 1988)


Summary
In the present, a global effort towards a sustainable future is high on theagenda. The Paris Agreement aims for an emission reduction of 40% of green-house gasses (compared to 1990 levels). To achieve this, all sectors need topitch in and the chemical industry is certainly not excluded. Separation pro-cesses in the chemical industry are one of the main energy consumers, withup to 50% of the total energy usage within a chemical plant, and about 15%of the global energy consumption. Hence, any improvement in separationprocesses can make a considerable contribution towards reducing global en-ergy consumption. The world is however not only dependent on energy, butalso raw materials are essential to facilitate our way of living. Currently, amajor part of the raw materials is produced from fossil resources. Not onlyis the use of fossil resources not sustainable, as it is finite, also fossil-basedchemicals are eventually burned and add to the increasing amount of CO2 inthe atmosphere. A switch towards sustainable resources is required. Theseresources need to be part of the current circular environment, which entailsthat the resources are produced from the same products after being discarded,recycled, or burned. In this situation, greenhouse gasses are still emitted butare in balance with the withdrawal of these gasses by nature. This disserta-tion will focus on creating specific separation processes, called Solvent-basedAffinity Processes, in which not only the energy requirements will be lowerthan current state-of-the-art processes, but also evaluate the use of sustain-able solvents which can be produced from sustainable resources.
Solvent-based Affinity Processes apply separation methods in which the addi-tion of a solvent is essential. The adding of a solvent changes the characteris-tics of the separation by either changing the relative volatility in a distillationcolumn or causing a phase split and consequently can selectively extract cer-
i Towards Sustainable Solvent-Based Affinity Separations

SUMMARY
tain molecules. To understand the effect a solvent has on the separation, theinteractions between the solvent molecule and the other molecules need tobe understood. The search towards alternative, better functioning, solvents istherefore not a new research topic and has been done for many decades. InChapter 3, we start by taking a look backward and evaluate all solvents whichhave been assessed over the last decades. A comprehensive database is com-piled of infinite diluted activity coefficients (γ∞i ) which is a highly specific pa-rameter that describes interactions between the solute and solvent. From thisdatabase, it was realized that these γ∞i are reported at many different temper-atures. Knowing that the γ∞i is temperature dependent, this disabled a faircomparison of as many solvents as possible at the same temperature. Hence,a data analysis algorithm was written to significantly increase the amount ofγ∞i at room temperature, 298.15K, via inter- and extrapolation using the Van’t Hoff equation. Ultimately, several general trends could be distinguishedand visualized for a wide range of solutes which may act as a guide for se-lecting appropriate solvents. A particular potential was identified for ionicliquids with multivalent cations. These ionic liquids show to be able to lowerthe activity coefficient without losing the particular selective interactions. Of-ten these two characteristics compete with each other and this seems not tobe so in this case.
The use of γ∞i is however limited, as they describe an industrially unreach-able situation of infinitely high solvent to feed ratios. Hence, in Chapter 4,a methodology using the 3-component Margules equation was developed toextend the applicability of the γ∞i towards realistic solvent to feed ratios, orin other words, finite concentrations. This methodology verified various in-dustrially used solvents, hence confirming its applicability. In the vast varietyof cation-anion combinations in ionic liquids and deep eutectic solvents, themorpholinium and ammonium-type cations were additionally identified tohave the highest potential in sense of inducing desired relative volatility ofseveral separation cases. Overall, the method proposed in this chapter servesas a pre-selection for solvents to focus the research in the field of solvent-based affinity separations in which rigorous experimentation and simulationswith new solvents are essential.
Experimentally determining γ∞i requires however specialized equipment and
Towards Sustainable Solvent-Based Affinity Separations ii

SUMMARY
is not easy, hence in Chapter 5 the possibility of predicting these γ∞i by us-ing theoretical models was investigated. Eight different models were assessedand the average relative deviation of each model to the combination of a widerange of different solvents and solutes was determined. Overall, for tradi-tional (or molecular) solvents the Abraham model performed most accurately,while the MOSCED model was appropriate for ionic liquids. Still, the averagerelative deviation easily exceeds 65% for the prediction of γ∞i in ionic liquids,and screening of ionic liquids using these predictions should be done withcare.
In Chapter 6, a different methodology was evaluated which attempts to screensolvents from another angle. The activity coefficients (γi) are not estimatedfrom theoretical models but correlated from a very simple experiment wherethe heat of mixing is measured between 2 molecules. These activity coef-ficients were then combined with the pure component vapor pressures topredict a vapor-liquid equilibrium. Following the Gibbs equation, the onlyunknown parameter to do this is the entropy. This entropic term cannot bemeasured but can be defined by the choice of a thermodynamic model. Liq-uid activity coefficient models, such as NRTL, were however observed to beinappropriate, as they are dependent on the initial guess values, and multi-ple local solutions could be found when correlating the enthalpy of mixing.For this reason, the robust cubic equation of states where used and found toperform well for systems where all molecules could not self-associate. Thisproblem can be resolved by extended to a cubic equation of state to includean association term, via either the CPA-model or PC-SAFT.
All previous chapters were highly theoretical by nature, though experimentalwork was certainly done. In Chapter 7, 25 biobased solvents were screenedfor 2 industrially important separation, namely a aliphatic/aromatic (methyl-cyclohexane/toluene) and paraffin/olefin (n-heptane/1-heptene) separation.Cyrene was seen to most effectively entrain toluene by inducing an excel-lent relative volatility of 3.17±0.16 (at a 50/50 wt. % feed mixture), be-ing even higher than the industrial state-of-the-art Sulfolane. Especially athigher methylcyclohexane fractions, Cyrene significantly increases the rela-tive volatility in the system, whereas the use of Sulfolane in this composi-tion range results in a pinch point. The absence of the pinch point when
iii Towards Sustainable Solvent-Based Affinity Separations

SUMMARY
using Cyrene lowers the minimum reflux ratio from 2.21 for Sulfolane to1.25 for Cyrene, corresponding to an expected energy usage reduction of ap-proximately 30%. A relative volatility towards n-heptane over 1-heptenewas increased from 0.83 to 1.03 and 1.20 for a Cyrene to feed ratio of 1and 3 respectively. Though this is less than the state-of-the-art solvent n-methylpyrrolidone, we expect that the use of Cyrene for the industrially highlyrelevant butadiene (another olefin) splitting from n-butane is still suitable.This offers the opportunity to replace n-methylpyrrolidone, which is subjectto strong environmental restrictions.
The search for biobased solvents continued for polar systems in Chapter 8,where the industrial separation case of acetone/diisopropyl ether was per-formed. Polar hydrogen-bonding solvents induce less repulsion towards themore dipolar aprotic polar compound (acetone) compared to the less polaraprotic compound (diisopropyl ether), while apolar solvents repel the morepolar compound. In the full (quasi-) binary vapor-liquid equilibrium, theazeotrope in the acetone/diisopropyl ether separation was only broken by DL-limonene because it was selectively repelling the low boiling compound (ace-tone). Hence, DL-limonene was fitted with the NRTL and UNIQUAC modelas it is adequate as a biobased solvent for the acetone/diisopropyl ether sepa-ration.
Due to the fact, Cyrene was seen to be a biobased solvent with a high po-tential for apolar separation, the evaluation of this solvent was extended inChapter 9 to liquid-liquid extractions. Four biphasic ternary systems havebeen assessed in which methylcyclohexane and Cyrene were kept constant.As third compound toluene, cyclohexanol, cyclohexanone and cyclopentylmethyl ether were applied. For each ternary system a selective extraction wasfound at the three studied temperatures of 298.15K, 323.15K and 348.15K.Cyclohexanol and cyclohexanone were most selectively extracted, while tolu-ene and cyclopentyl methyl ether were extracted with considerably lowerselectivity. While Cyrene was outperformed by Sulfolane and several ionicliquids in the extraction of toluene, the potential of Cyrene in the cyclohex-anol/cyclohexanone systems was observed. Although a lower selectivity wasseen than with water, due to the high boiling point of Cyrene, recovery canbe much less costly. Overall, we conclude that Cyrene can be applied as a
Towards Sustainable Solvent-Based Affinity Separations iv

SUMMARY
biobased extraction solvent for a variety of separations, although for severalsystems the phase envelop is relatively narrow and narrower at higher tem-peratures.
In Chapter 10, the evaluation of Cyrene to separate the apolar mixture methyl-cyclohexane/toluene was scaled up and process simulations were performedand compared to the state-of-the-art industrial solvent Sulfolane. Both liquid-liquid extraction (LLX)-based and extractive distillation (ED)-based processeshave been simulated and the total annual costs (TAC) are compared. TheCyrene-based LLX process was economically least feasible due to the largemiscibility region reported earlier. The Cyrene-based ED process was seen tobe more efficient than the Sulfolane-based equivalent due to the absence ofthe pinch point in the vapor-liquid equilibrium, which reduced the solventrequirements. Also, the lower boiling point of Cyrene allowed for less re-boiler duty. Eventually, the earlier mentioned 30% energy reduction was notachieved due to heat integration. The Sulfolane-based LLX-process is how-ever still the most economically attractive option if the aromatic feed contentis below 30 mol%, mainly due to the large immiscibility of Sulfolane and thesaturated hydrocarbon
v Towards Sustainable Solvent-Based Affinity Separations


Samenvatting
Tegenwoordig staat de wereldwijde inspanning voor een duurzamere toekomsthoog op de agenda. Het Akkoord van Parijs beoogt niet voor niets een emissiere-ductie van 40% van de broeikasgassen (ten opzichte van 1990). Om dit tebereiken moeten alle sectoren hun steentje bijdragen en de chemische indus-trie is zeker niet uitgesloten. Scheidingsprocessen in de chemische indus-trie zijn een van de grootste energieverbruikers, met tot wel 50% van hettotale energieverbruik binnen een chemische fabriek en ongeveer 15% opglobaal niveau. Daarom kan elke verbetering van deze scheidingsprocesseneen aanzienlijke bijdrage leveren aan het verminderen van het wereldwijdeenergieverbruik. De wereld is echter niet alleen afhankelijk van energie, ookgrondstoffen zijn essentieel om door te gaan met onze manier van leven. Mo-menteel wordt het grootste deel van de grondstoffen geproduceerd uit fossielebronnen. Niet alleen is het gebruik van fossiele bronnen niet duurzaam, hetis ook eindig. Verder worden fossiele chemicaliën uiteindelijk verbrand endragen ze bij aan de toenemende hoeveelheid CO2 in de atmosfeer. Een om-schakeling naar duurzame bronnen is daarom vereist. Deze bronnen makendeel uit van de huidige circulaire omgeving, wat inhoudt dat deze bronnen,waar vanuit de chemicaliën worden gemaakt, zijn ontstaan uit dezelfde pro-ducten nadat ze zijn weggegooid, hergebruikt of verbrand. In deze situatieworden nog steeds broeikasgassen uitgestoten, maar deze zijn in evenwichtmet dezelfde gassen die zijn onttrokken uit de natuur. Dit proefschrift zalzich richten op het ontwikkelen van specifieke scheidingsprocessen, zoge-heten oplosmiddelgebaseerde affiniteitsprocessen, waarbij niet alleen de en-ergiebehoefte lager zal zijn dan de huidige industriële processen, maar ookhet gebruik van duurzame, natuurlijke oplosmiddelen die geproduceerd kun-nen worden uit de circulaire economie.
vii Towards Sustainable Solvent-Based Affinity Separations

SAMENVATTING
Oplosmiddelgebaseerde affiniteitsprocessen passen gespecialiseerde scheid-ingsmethoden toe waarvan een oplosmiddel essentieel is. Het toevoegen vaneen oplosmiddel verandert de karakteristieken van de scheiding door ofwelde relatieve vluchtigheid in een destillatie kolom te veranderen, ofwel eenvloeibare fasescheiding te veroorzaken. Om het effect van een oplosmiddelop een scheiding te begrijpen moeten de interacties tussen het oplosmiddelmolecuul en de andere moleculen worden begrepen. De zoektocht naar alter-natieve en beter werkende oplosmiddelen is daarom geen nieuw onderzoeks-thema en wordt al decennia bedreven. In Hoofdstuk 3 kijken we eerst terug inde tijd en evalueren we alle oplosmiddelen die reeds zijn onderzocht. Een uit-gebreide databank is samengesteld met oneindig verdunde activiteitscoëffi-ciënten (γ∞i ), wat een zeer specifieke parameter is die de interacties beschrijfttussen een opgelost molecuul en het oplosmiddel molecuul. Uit deze data-bank bleek dat deze γ∞i bij veel verschillende temperaturen wordt gerap-porteerd. Wetende dat de γ∞i temperatuurafhankelijk is, maakt dit een eer-lijke vergelijking van zoveel mogelijk oplosmiddelen bij dezelfde temperatuurlastig. Daarom werd een data analyse algoritme geschreven om de hoeveel-heid γ∞i bij kamertemperatuur, dat is 25°C of 298.15K, significant te verhogenvia inter- en extrapolatie door middel van de Van ’t Hoff-vergelijking. Uitein-delijk zijn verschillende algemene trends gevisualiseerd voor een breed scalaaan opgeloste moleculen in bepaalde oplosmiddelen die als richtlijn kan die-nen voor het selecteren van geschikte oplosmiddelen. Een bijzonder poten-tieel werd geïdentificeerd voor ionische vloeistoffen met meerwaardige kat-ionen. Deze ionische vloeistoffen blijken namelijk in staat de activiteitscoëf-ficiënt te verlagen zonder de specifieke selectieve interacties te verminderen.Vaak zijn deze twee kenmerken namelijk in concurrentie met elkaar en ditbleek met deze oplosmiddelen minder het geval te zijn.
Het gebruik van de γ∞i heeft echter limitaties, aangezien deze parameters eenindustrieel onpraktische situatie beschrijven van een oneindig hoge verhoud-ing tussen oplosmiddel en voeding. Daarom is in Hoofdstuk 4 een methodiekontwikkeld die gebruik maakt van de 3-componenten Margules vergelijking.Zodoende kan de toepasbaarheid van de γ∞i uit worden gebreid naar realistis-che verhoudingen tussen oplosmiddel en voeding, of m.a.w. eindige concen-traties. Deze methodiek identificeerde verschillende reeds toegepaste indus-triële oplosmiddelen, en bevestigde daarmee de toepasbaarheid ervan. In de
Towards Sustainable Solvent-Based Affinity Separations viii

SAMENVATTING
enorme verscheidenheid aan kation-anion combinaties in ionische vloeistof-fen en combinaties mogelijk in diep eutactische vloeistoffen, werd bovendiengeïdentificeerd dat het morfolinium en ammonium-type kation een hoog po-tentieel heeft. Een potentieel in de zin van het opwekken van de gewensterelatieve vluchtigheid van verschillende scheidingen. Over het algemeen di-ent deze methodiek als een voorselectie van oplosmiddelen met als doel hetonderzoek scherp te stellen op het gebied van affiniteitsscheidingen, waarbijrigoureus experimenteren en simuleren met nieuwe oplosmiddelen essentieelzijn.
Het experimenteel bepalen van γ∞i vereist echter gespecialiseerde apparatuuren is niet eenvoudig, vandaar dat in Hoofdstuk 5 de mogelijkheid om dezeγ∞i te bepalen met behulp van theoretische modellen is onderzocht. Achtverschillende modellen werden beoordeeld en de gemiddelde relatieve af-wijking van elk model is bepaald. De globale afwijking is weergegeven, maarook de specifieke afwijking met betrekking tot specifieke combinaties vanoplosmiddelen en opgeloste moleculen. Over het algemeen presteerde hetAbraham model voor traditionele (of moleculaire) oplosmiddelen het meestnauwkeurig, terwijl het MOSCED model het meest geschikt was voor ion-ische vloeistoffen. Toch overschrijdt de gemiddelde relatieve afwijking voorionische vloeistoffen gemakkelijk 65% en zodoende moet het beoordelen vanionische vloeistoffen met behulp van deze voorspellingen met zorg gebeuren.
In Hoofdstuk 6 werd een andere methodiek geëvalueerd die probeert oplos-middelen via een andere hoek door te lichten. De activiteitscoëfficiënten (γi)worden niet geschat op basis van theoretische modellen, maar gecorreleerdop basis van de mengwarmte tussen twee moleculen. Deze activiteitscoëffi-ciënten worden vervolgens gecombineerd met de dampdrukken van de zui-vere componenten om een damp-vloeistof evenwicht te voorspellen. Vol-gens de Gibbs vergelijking is de enige onbekende parameter om dit te doende entropie. Deze entropische term kan echter niet worden gemeten, maarkan gedefinieerd worden door de keuze van een thermodynamisch model.Vloeibare activiteitscoëfficiënt modellen, zoals het NRTL model, bleken echterongeschikt te zijn, omdat ze o.a. afhankelijk waren van de initiële gokwaar-den, en er meerdere lokale oplossingen gevonden konden worden. Om dezereden werden robuuste kubische toestandsvergelijkingen gebruikt en deze
ix Towards Sustainable Solvent-Based Affinity Separations

SAMENVATTING
bleken goed te presteren voor systemen waarin alle moleculen geen zelfas-sociatie gedrag vertoonden. Dit probleem kan wellicht worden opgelost doorde kubische toestandsvergelijking uit te breiden met een associatie term, viabijvoorbeeld het CPA-model of PC-SAFT model.
Alle voorgaande hoofdstukken waren theoretisch van aard, terwijl er ookzeker experimenteel werk is verricht. In Hoofdstuk 7 werden veel natuur-lijke oplosmiddelen door gelicht op twee industrieel belangrijke scheidingen,namelijk een alifatische/aromatische scheiding, bijvoorbeeld die van methyl-cyclohexaan (MCH) en tolueen (TOL) en een paraffine/olefine (n-heptaan/1-hepteen) scheiding. Cyreen bleek het meest effectief tolueen te kunnen af-vangen met een uitstekende relatieve vluchtigheid van 3.17 ± 0.16 te induc-eren (bij een 50/50 g.% voedingsmengsel). Dit is zelfs hoger dan het in-dustriële Sulfolaan oplosmiddel. Vooral bij hogere MCH fracties induceertCyreen een significante relatieve vluchtigheid in het systeem, terwijl gebruik-makend van Sulfolaan in deze samenstellingsgebied resulteert in een raakpuntmet de evenwichtigslijn. De afwezigheid van dit raakpunt bij gebruik vanCyreen verlaagt de minimale terugvloei verhouding van 2.21 voor Sulfolaantot 1.25 voor Cyreen. Dit komt overeen met een verwachte energieverbruikvermindering van ongeveer 30%. Een relatieve vluchtigheid ten opzichte vann-heptaan ten opzichte van 1-hepteen werd verhoogd van 0.83 tot 1.03 en1.20 voor een verhouding van Cyreen tot voeding van respectievelijk 1 en 3.Hoewel dit minder is dan het industriële oplosmiddel n-methylpyrrolidon,verwachten we dat het gebruik van Cyreen voor de industrieel zeer relevantebutadieen (een andere olefine) scheiding nog steeds geschikt is. Dit biedt demogelijkheid om n-methylpyrrolidon (gedeeltelijk) te vervangen.
De zoektocht naar biogebaseerd of natuurlijke oplosmiddelen ging verdervoor polaire systemen in Hoofdstuk 8, waar de industrieel relevante ace-ton/diisopropyl ether scheiding werd geëvalueerd. Polaire waterstofbindendeoplosmiddelen induceerde een minder hevige afstoting naar de meer apro-tische polaire verbinding (aceton). Terwijl apolaire oplosmiddelen de meerpolaire verbinding afstootten. In het volledige (quasi-) binaire damp-vloeistofevenwicht werd de azeotroop in de aceton/ diisopropyl ether scheiding enkelverbroken door het oplosmiddel DL-limoneen. Dit was vanwege het feit dathet selectief de laagkokende verbinding (aceton) afstootte. Daarom is het
Towards Sustainable Solvent-Based Affinity Separations x
SAMENVATTING
damp-vloeistof evenwicht van DL-limoneen gecorreleerd met het UNIQUACen NRTL modellen en is het geschikt voor de scheiding van aceton en diiso-propyl ether.
Omdat Cyreen werd gezien als een natuurlijk oplosmiddel met een hoog po-tentieel voor apolaire scheiding, werd de evaluatie van dit oplosmiddel inHoofdstuk 9 uitgebreid tot vloeistof-vloeistof extracties. Er zijn vier bifasis-che ternaire systemen onderzocht waarin methylcyclohexaan en Cyreen con-stant werden gehouden. Als derde verbinding werden of tolueen, of cyclo-hexanol, of cyclohexanon, of cyclopentylmethyl ether toegepast. Voor elk ter-nair systeem werd een selectieve extractie gevonden bij de drie bestudeerdetemperaturen van 298.15K, 323.15K en 348.15K. Cyclohexanol en cyclohex-anon werden het meest selectief geëxtraheerd, terwijl tolueen en cyclopentyl-methyl ether met aanzienlijk lagere selectiviteit werden geëxtraheerd. On-danks dat Cyreen minder presteerde dan Sulfolaan en verschillende ionis-che vloeistoffen bij de extractie van tolueen, werd het potentieel van Cyreenin de cyclohexanol and cyclohexanon systemen waargenomen. Hoewel eenlagere selectiviteit werd waargenomen dan met water als oplosmiddel, kan deterugwinning door het hoge kookpunt van Cyreen veel minder duur zijn. Almet al concluderen we dat Cyreen kan worden toegepast als natuurlijk oplos-middel voor een verscheidenheid aan scheidingen, hoewel voor verschillendesystemen het fasescheidingsgebied relatief smal is en nog smaller wordt bijhogere temperaturen.
In Hoofdstuk 10 werd de evaluatie van Cyreen om het apolaire mengsel MCH/ TOL te scheiden opgeschaald en werden processimulaties gedaan en ver-geleken met het industriële oplosmiddel Sulfolaan. Zowel het op vloeistof-vloeistof extractie (LLX)-gebaseerde proces als het op extractieve destillatie(ED)-gebaseerde proces zijn gesimuleerd en de totale jaarlijkse kosten (TAC)werden vergeleken. Het op Cyreen-gebaseerde LLX-proces was economischhet minst haalbaar vanwege de grote mengbaarheid die eerder werd gerap-porteerd. Het op Cyreen gebaseerde ED-proces bleek efficiënter te zijn danhet op Sulfolaan gebaseerde equivalent. Dit is vanwege de afwezigheid vanhet knelpunt in het damp-vloeistof evenwicht, waardoor er minder oplosmid-del nodig was. Ook zorgde het lagere kookpunt van Cyreen voor een lagereenergiehoeveelheid op de reboilers. Uiteindelijk werd de eerder genoemde
xi Towards Sustainable Solvent-Based Affinity Separations

SAMENVATTING
30% energiereductie niet behaald door warmte-integratie. Het op Sulfolaan-gebaseerde LLX proces is echter nog steeds het economisch meest aantrekke-lijk als het aromaat gehalte in de voeding lager is dan 30 mol %. Dit is voor-namelijk vanwege de grote onmengbaarheid van Sulfolaan en de verzadigdekoolwaterstof.
Towards Sustainable Solvent-Based Affinity Separations xii


Table of Contents
1 Introduction 1
2 Theory 9
3 Literature Review and Visualisation 25
4 Solvent Pre-Selection for Extractive Distillation 59
5 Comparison of γ∞ Prediction Methods 91
6 VLE Prediction from the Heat of Mixing 123
7 Biobased Entrainers for Apolar Separations 157
8 Biobased Entrainers for Polar Separations 177
9 Liquid-Liquid Extractions with Cyrene 197
10 Process Simulation of Solvent-Based Affinity Processes 221
11 Conclusion, Reflection and Perspective 257
12 Appendices 275
13 Acknowledgements 337
xv Towards Sustainable Solvent-Based Affinity Separations


1
1Introduction
"All in all, you’re just another brick in the wall",Pink Floyd

1
INTRODUCTION
1.1 Towards a Sustainable Future
During the twentieth century, humankind went through a magnificent lifestyletransformation. Nowadays, it is not uncommon that our dinner has been cul-tivated around the globe and that we go on a long weekend trip by plane toanother part of Europe or even another continent. We enjoy this luxuriouslifestyle, however, this comes at a price. The global consumption of resourceshas increased 14-fold between 1900 and 2015, and is estimated to double to-wards 2050 relative to 2015.1 The enormous consumption of fossil resourcesresults in emitting a tremendous amount of greenhouse gasses into our envi-ronment. Furthermore, there is a large overuse of freshwater supplies.
In an attempt to formulate necessary steps towards a more sustainable way ofliving, the United Nations have set up the 2030 Agenda for Sustainable De-velopment in September 2015 during the United Nations General Assembly.In this agenda, countries around the world agreed on 17 Sustainable Develop-ment Goals, see Figure 1.1.1 Among these goals are social, humanitarian aimssuch as to end poverty, eliminate hunger, and gender equality, but also goalswhich may require technical solutions such as to provide everyone with cleanwater and sanitation, affordable and clean energy, take climate action, and theintroduction of new technologies in industries, innovation and infrastructure.
Together with the Paris Agreement on Climate Change,2 these policies are thecurrent road-maps to guide the way towards a more sustainable future. Fol-lowing the Paris Agreement, the European Union (EU) aims to reduce green-house gas emissions by 40% in 2030 (compared to 1990 levels).2 With about24% of the total energy use in the EU allocated to industrial activities, improv-ing the energy efficiency of the industry will have a tremendous impact.3 Inthe chemical industry, separation processes are significant energy consumerswhere these processes can be responsible for up to 50% of the total energycost of the plant.4
Sholl and Lively report a global energy usage, allocated to separation pro-cesses, of 10-15%5 which may be a highly rough estimation. A significantamount of this energy usage can be traced back to the working-horse of thechemical separations, namely the distillation column where molecules are
Towards Sustainable Solvent-Based Affinity Separations 2

1
INTRODUCTION
Figure 1.1: The 17 sustainable development goals within the 2030 UN Agenda for Sustain-able Development.1
separated using their differences in boiling point. The main employer of dis-tillation columns is the petrochemical industry. Hence, an accurate estimationof the energy cost allocated to separation processes, is highly dependent one.g. the complexity of the process and the extent of heat integration. Never-theless, due to the sheer size of the chemical industry, enabling improvementsfor even a small fraction of the total energy costs is still significant. Hence,in this dissertation, I investigate not only a way of increasing the efficiency ofthese distillation columns by adding a solvent, but also systematically showwhy certain solvents increase the efficiency and why other solvents do not.Solely these improvements will not allow us to reach the goals set by the Parisagreement, but they will contribute to the overall integral efforts.
The aim of higher energy efficiency is evident (defined as the energy (or work)introduced in the distillation column compared to the thermodynamic mini-mum6). In this dissertation I also assess the efficiency of the path towards newprocesses. Ideally, a chemical engineer knows all required data without anyerror margin to optimally design a new (distillation) process. This is howevernot the case, as experimental data points are often laborious to obtain, andtime costs money. Hence, I investigate from several angles different screen-
3 Towards Sustainable Solvent-Based Affinity Separations

1
INTRODUCTION
ing methods that can help chemical engineers to focus their design processand reduce the required amount of expensive, time-consuming experimen-tal efforts. Improving the energy efficiency of separation processes must notnegatively affect other sustainability aspects. As currently, we are dependenton fossil resources, and it would be preferential to switch to sustainable re-sources. Resources, such as biomass, take up CO2 from the atmosphere in thesame period as the CO2 is expelled by using these resources. For this reason,we know biomass to be sustainable, while fossil resources are not.
In this dissertation, I combine the search for ways of increasing the energy-efficiency of separation processes primarily by finding alternative, biobased,solvents produced from sustainable resources and the application of the var-ious screening methods to speed up the design processes. Ultimately, severalindustrial relevant examples were examined to assess the potential of thesesustainable alternative solvents.
1.2 Thesis Outline
In this dissertation, I will first give a short introduction to separation pro-cesses in Chapter 2. The screening of molecules that can act as solvents inseparation processes has been done for a long time, therefore in Chapter 3, Istarted with the collection of the previously done screening reported in liter-ature. The focus was on the temperature-dependent infinite dilution activitycoefficient (γ∞), which is a molecular descriptor of the solvent interactionswith other molecules. The initially scattered data is now present in an exten-sive database, which in combination with a data handling algorithm, madeit possible to compare a vast amount of solvents and assess their potential influid separations.
In Chapter 4, a new screening methodology is proposed, which does not re-quire any sophisticated software package and uses the γ∞-database collectedin the previous chapter. The extended Margules equation was applied to con-vert the solvent effects from infinite dilution to realistic industrial conditions.Consequently, I could estimate the minimal required amount of solvent for anenergy-efficient distillation operation.
Towards Sustainable Solvent-Based Affinity Separations 4

1
INTRODUCTION
The previous two chapter focus on the infinite dilution activity coefficient(γ∞), which is an experimentally determined data point, though is not eas-ily measured. Hence, I assessed in Chapter 5 the possibility of using variousmathematical models to approximate these data points. Eight models weresystematically assessed and their accuracy for various solvent-solute combi-nations were determined.
In Chapter 6, a second new screening methodology was developed, whichdoes not focus upon the infinite dilution activity coefficient (γ∞i ), but attemptsto predict vapor-liquid equilibria (VLE) from solely the amount of energy thatis released upon mixing. A throughout assessment of cubic equation of statesand liquid activity model is done and a considerable amount of binary sys-tems could be accurately predicted. However, an inability to predict the phaseequilibria of self-associating molecules was observed, which may be resolvedby using more advanced models that include association effects.
All this theoretical work is complemented by an experimental screening of23 biobased solvents for apolar separations in Chapter 7. The biobased sol-vent, dihydrolevoglucosenone or Cyrene, was seen to have a comparable abil-ity to separate aromatic and aliphatic compounds than the industrial bench-mark solvent Sulfolane. Chapter 8 extended the experimental screening of35 biobased solvents to the polar separation of acetone and diisopropyl ether.Water and ethylene carbonate were observed to be able to entrain acetone,while DL-limonene could entrain diisopropyl ether. Only the latter, was ableto break the azeotrope of the system and has the potential of being an ad-equate biobased solvent for this separation. In Chapter 9, the investigationinto the biobased solvent Cyrene was extended towards liquid-liquid extrac-tion applications. Although a limited operating window was observed forapolar systems, the potential of Cyrene in the separation of cyclohexanol andcyclohexanone was shown.
Chapter 10 is a continuation of the evaluation of Cyrene as an entrainer for theseparation of aliphatic and aromatic compounds. As the potential of Cyreneis already established, a detailed comparison on a process level is performedhere. A liquid-liquid extraction-based process and an extractive distillation-
5 Towards Sustainable Solvent-Based Affinity Separations

1
INTRODUCTION
based process using either Cyrene or Sulfolane were simulated. From the eval-uation of the total annual costs, it was seen that the Sulfolane-based liquid-liquid extraction process is most economically attractive until an aromaticfeed content of 30 mol%. For higher aromatic feed contents, the Cyrene-basedextractive distillation is most attractive, outperforming the Sulfolane-basedequivalent.
A reflection and perspective will be given in Chapter 11, as there are stillmany subjects to be evaluated and ideas to be worked out. Understandingfluid separations, the equilibria behind each operation, and the non-ideal be-havior behind these phase separations are not possible without a throughoutknowledge of thermodynamics and the model derived from this mathemati-cal description of our everyday life. For this reason, Chapter 12 is written toallow for more background knowledge which has been used throughout thisdissertation.
1.3 References
[1] European Commission, “Reflection Paper Towards a Sustainable Europe by 2030,” Jan. 2019.[2] United Nations, “Paris Agreement on Climate Change,” Dec. 2015.[3] European Environment Agency, “Final energy consumption by sector and fuel in Europe,” 2020.[4] A. A. Kiss, J.-P. Lange, B. Schuur, D. W. F. Brilman, A. G. van der Ham, and S. R. Kersten, “Separation
technology–making a difference in biorefineries,” Biomass and Bioenergy, vol. 95, pp. 296–309, 2016.[5] D. S. Sholl and R. P. Lively, “Seven chemical separations to change the world,” Nature, vol. 532, no. 7600,
pp. 435–437, 2016.[6] R. Agrawal and R. T. Gooty, “Misconceptions about efficiency and maturity of distillation,” AIChE Journal,
p. e16294.
Towards Sustainable Solvent-Based Affinity Separations 6


222Theory
"You cannot teach a man anything, you can only help him discover it in him-self",Galileo Galilei, (1564 - 1642)

22
THEORY
2.1 Introduction
Chemistry is for many as mysterious as magic, due to the fact you cannot seewhat is going on. Still, throughout many millennia, people have performedalchemy or attempted to do this. In ancient China and Egypt, alchemists triedto transform cheap metals into high-valuable silver and gold. Nowadays, weknow this can be done via nuclear reactions which are not very cost-effectiveand cheap, but back then it was completely impossible. Another, more prac-tical, branch of alchemy was to constantly improve instruments such as heat-ing methods. Eventually, these instruments were refined into, for example,an alembic (see Figure 2.1), which is a very crude heater and condenser whichcould concentrate alcohol to produce aqua vitae which can be compared tovodka or to distill the fragrance of roses and produce perfume.1
Figure 2.1: An example of an alembic, with (left) a condenser and (right) the kettle in whichthe liquid is heated up. The picture was taken (with my own permission) of my own alembic.
Where the alchemists started with the improvement of their instruments,chemical engineers are still attempting to improve their instruments. Al-though the alembic has been replaced by distillation towers in most indus-trial applications of distillation, and the essence of roses can also be extractedwith solvents in extraction columns, the aim to improve these separation tech-niques still exists. In the following sections, an introduction will be made intosome general aspects of separation techniques, and specifically solvent-basedseparation techniques. The behavior of fluids in the separation techniques
Towards Sustainable Solvent-Based Affinity Separations 10

22
THEORY
can be traced back to the intermolecular interactions and therefore the mostpredominant interactions will be introduced.
2.2 General Separation Techniques
In the chemical industry, many different aspects related to the production pro-cesses are of importance for the overall performance. Generally, a feedstock,which can either be a pure component or a mixture, is entered into processes.Various processing stages then take place. These can be a (pre-)treatmentof the feedstock, a reaction, and one or more separation operation(s). Fur-thermore, operations like heat exchange operations enhances the efficiencyby minimizing the total energy requirement of the plant. Conditional to thetopic of this thesis, the focus in this section is on the separation operations.A variety of basic separation techniques may be identified. Each techniquehas its unique way of facilitating the separation of a mixture. Separations al-ways require an effort, being in the form of heat or work to separate a chaoticmixture into orderly pure components as this is not a spontaneous process.The description of spontaneity can be expressed through the Gibbs energy(G). This Gibbs energy is a function of the temperature (T), enthalpy (H) andentropy (S), as can be seen in Equation 2.1.
∆G = ∆H − T∆S (2.1)
where the enthalpy is the quantity that describes the energy content of thecomponents, while the entropy describes the amount of chaos. It is commonpractice to only indicate the difference in Gibbs energy (∆G), enthalpy (∆H)and entropy (∆S), as we are only interested in the difference between two (ormore) situations and not the absolute value. A chemical system (or mixture)will always end up in the lowest possible Gibbs energy state. Hence, a mixturewill often not spontaneously separate into its components, of course, excep-tions are known, and overcome the Gibbs energy of mixing, see Figure 2.2.The entire essence of separation technology and the affiliated research is per-forming and/or finding a way of delivering the required Gibbs energy toseparate a mixture as efficiently as possible. To overcome the Gibbs energyof mixing most efficiently is however not straight-forward and several tech-niques can be applied. Seader, Henley and Roper2 describe five basic separa-
11 Towards Sustainable Solvent-Based Affinity Separations

22
THEORY
Figure 2.2: A schematic representation of the relative Gibbs energy levels between segregatedand mixed compounds, which is the Gibbs energy of mixing.
tion strategies, which cover in general all methods of performing a separation.These strategies are;
1. Phase Creation 4. Solid Agent2. Phase Addition 5. Force field or Gradient3. Barrier
The first technique covers the heating or cooling of the mixture to create asecond phase. The alchemist already did this in an alembic. Nowadays com-mon operations are distillation (where a liquid mixture is partly vaporized)and crystallization (where a liquid mixture is partly solidified).2
The second technique adds a phase to the mixture. This phase can be eitherliquid or gas. The added liquid, or solvent, to a liquid mixture may be im-miscible and a 2-layer system will be formed. This is the basis of a commonseparation technique named liquid-liquid extraction (LLX). Other exampleswhere a phase is added are stripping (where an additional gas phase is intro-duced to partly strip the liquid mixture) and absorption (where an additionalliquid phase is added to the gas mixture to partly absorb the gas mixture).2
The last three options contain techniques such as (3) membrane separationse.g. removal of medicinal traces from water,3 (4) the capture of CO2 from theair with solid particles,4 and (5) refinement of uranium isotopes with ultra-centrifuges.5 This thesis will focus on the addition and/or creation of a liquid
Towards Sustainable Solvent-Based Affinity Separations 12

22
THEORY
phase or often referred to as a solvent. The latter three will be excluded,though this doesn’t mean that these have no potential. Often a combinationof multiple techniques can be applied for a separation challenge.
2.3 Solvent-Based Affinity Separations
The addition of a solvent is the cornerstones in solvent-based affinity sepa-rations. When a solvent is applied to distillation, this preferably results in asingle liquid phase, whereas in liquid-liquid extraction, the addition of a sec-ond liquid phase is aimed for. In the following subsections, more details willbe given on the fundamentals of (advanced) distillation (see: phase creation)and liquid-liquid extraction (see: phase addition).
2.3.1 Distillation
In the most simple words, distillation is heating a mixture, evaporating partof the mixture and collecting (and condensing) it separately from the remain-ing liquid. Consequentially, the composition of the mixtures obtained fromthe evaporated fraction and the remaining liquid differ, which is essential toinduce a separation. The development of this separation method cannot bedetached from the history of alcohol which has been used in medicine or to"enjoy". Chemists from the Alexandrian time or early Asiatic (see Chinese)people have been credited to know about alcohol and therefore distillation(see the alembic), however, these stories may be part of legends. The discoveryof alcohol and thus the scientific understanding of distillation can be tracedback to the South of Italy in the 11th of 12th century.6 Although, this techniqueis mature and a proven separation technique, still research is being performedin this field.7
As mentioned before, distillation is a method that heats a liquid mixture andconsequently condenses the gas phase and cools down the remaining liquid.Therefore, a certain amount of energy needs to be added to the mixture andafterward has to be withdrawn from the system. These amounts can be differ-ent, but also equal under equal molar overflow and saturated liquid feed. Theseparation work required to overcome the Gibbs energy of mixing originatesfrom the work potential. It is linked to the flow of high-temperature energy atthe reboiler to the energy at a lower temperature in the cooler (or condenser),
13 Towards Sustainable Solvent-Based Affinity Separations

22
THEORY
Figure 2.3: (left) A schematic representation of the Gibbs energy levels between liquidmixed compounds, the heated (partly evaporated) mixture and the liquid segregated mix-ture. (right) A schematic representation of a corresponding distillation column, where thefeed and products as shown, and also the reflux and boil-up streams are indicated.
as can be seen in Figure 2.3.
The amount of energy required to (partly) evaporates the mixture is highly de-pendent on the components present in the mixture. For instance, the amountof energy required to evaporate compounds (enthalpy of evaporation, ∆vapH)and the relative tendency of compounds to move from the liquid to the gasphase at a specific temperature (relative volatility, α) are among the crucialparameters, as can be seen in Equation 2.2,8
Qreb = nFxFA
(1
xFA(α − 1)+ 1
)∆vapHA (2.2)
where Qreb is the reboiler duty (J/s) , nF is the molar feed flow (mol/s), xFA isthe mole fraction in the feed of compound A, α is the relative volatility and∆vapHA (J/mol) is the enthalpy of evaporation of compound A.
The overall costs of a distillation column can be minimized by reducing thenumber of trays (lowers the Capital Expenditures, CAPEX) and by keeping
Towards Sustainable Solvent-Based Affinity Separations 14

22
THEORY
the reflux ratio close to minimum (affects the Operational Expenditure, OPEX).Distillation is currently the most used separation method in the chemical in-dustry, however, it has limitations. First of all, the relative volatility (α) whichis a measure of the partial pressures (P o) and the activity coefficient (γA), seeEquation 2.3, needs to be (preferably much) unequal to 1, otherwise, the num-ber of trays and the reflux ratio will be too high for an economically feasibleoperation.
α =P oAγAP oBγB
(2.3)
In non-ideal cases, the vapor-liquid equilibrium may include (a) curve(s) (pinch-point(s)) or may even cross the equal composition (diagonal) line (azeotrope),see Figure 2.4. These phenomena can complicate the distillation operationsand can result in more trays, higher reflux ratios, and may even (in the azeotropecase) make distillation impossible.
Figure 2.4: A schematic representation of three types of vapor-liquid equilibria. An idealcase, a case including a pinch-point and an azeotrope.
In these cases adding a solvent can solve these problems. The addition ofa solvent may solve such problems by altering the relative volatility of themixture to be separated. Another limitation, that will not be addressed here,
15 Towards Sustainable Solvent-Based Affinity Separations

22
THEORY
is the challenge of sensitive separations. The separation of mixtures whichare unstable at higher temperatures (such as delicate (bio)molecules), or areprone to undergo (undesired) reactions.
2.3.2 Advanced Distillation
As mentioned earlier, one is not limited to a single separation technique,hence advanced distillation techniques are being applied and researched tominimize the required energy that is needed to perform a specific separation.Many of these advanced distillation techniques combine several basic tech-niques with the most mature (distillation) technique, such as Azeotropic Dis-tillation (Phase addition),9 Extractive Distillation (Phase addition),10 Mem-brane Distillation (Barrier),11 HiGee Distillation (Force Field or Gradient).12
Not all of these advanced distillation techniques will be reviewed, but onlythe solvent-based extractive and azeotropic distillation will be discussed in alittle more detail. Extractive distillation is a technique that combines a solventthat has a higher boiling point than the components in the feed, see Figure 2.5,and consequently, the feed and the solvent are introduced in a distillation col-umn at different locations. A high-boiling solvent is often fed above the feedstage at a low temperature.
The solvent affects the relative volatility of the feed by changing the activitycoefficients of the components. As previously stated, these activity coefficientsare a measure of the non-ideality of the mixture, thus the solvent changes thenon-ideality of the overall mixture and this advanced distillation techniqueattempts to benefit from it. However, it can also be seen that an additionaldistillation column is required to separate eventually the solvent from (oneof) the components. Initially, this may seem to be irrational to replace a sin-gle (traditional) distillation column, with an extractive distillation operationthat has an additional solvent and 2 columns. The justification lays in the ef-ficiency of these operations. Blahušiak et al.8, and King13 in a more generalsense regarding reversible heat engines, showed the minimum reboiler dutyof an extractive distillation column (Equation 2.4a) including solvent regen-eration (Equation 2.4b) to be a function of the nF,ED which is the molar feedflow entering the extractive distillation (ED) column (mol/s), xi which are thevarious mole fractions of either the high-boiling compound B or low-boiling
Towards Sustainable Solvent-Based Affinity Separations 16

22
THEORY
Figure 2.5: (left) A schematic representation of the Gibbs energy levels between the liquidmixture (incl. solvent), the heated (partly evaporated) mixture and the liquid segregatedmixture. (right) A schematic representation of a corresponding extractive distillation col-umn and the solvent recovery column, where the heavy boiling component and solvent areseparated.
compound A, α which is the relative volatility between either compound Band the solvent (αBS ) or in the ED column (αED ), the solvent-to-feed ratio(S/F) and ∆vapHi is the enthalpy of evaporation (J/mol) of compound i.
ED: Qreb = nF,ED
(1
αED − 1+ xFA
)∆vapHA (2.4a)
SR: Qreb = nF,ED
(xFB + S/FαBS − 1
+ xFB
)∆vapHB (2.4b)
As the αED is enhanced by the solvent, and the αBS is high due to the lowvolatility of the chosen solvent, the reboiler duties of both columns (Qreb)can be lower than a single distillation column which a low αAB. The vaporphase non-ideality was neglected in this mathematical framework, and con-sequently for systems which behave highly non-ideally in the vapor phase, seecarboxylic acids, these equations are not applicable.
Azeotropic distillation is also a technique that adds a solvent to a distillationcolumn, though this solvent has a lower boiling point than the feed mixture.Often these solvents cause a low boiling azeotrope with a specific component
17 Towards Sustainable Solvent-Based Affinity Separations

22
THEORY
in the feed mixture and hence this facilitates the separation and increases theefficiency of the column. Again, an additional distillation column is requiredto separate the solvent and one of the components (homogeneous azeotropicdistillation), though sometimes (after cooling) a phase split occurs (see LLX)which can be used (heterogeneous azeotropic distillation). Also for these ad-vanced distillation operations, the McCabe-Thiele methods can be used to ob-tain initial design specifications of the distillation column through the liquidand vapor flow of the solvent should also be included.
2.3.3 Liquid-Liquid Extraction
An entirely different separation technique uses the addition of a (liquid) phase,see solvent, to induce a separation. This phenomenon seems exotic to most,however, is quite common in the kitchen. For instance, after cooking Italiandough in water, a little bit of (olive)oil can be added to prevent agglomerationof the fancy Italian dough wisps or shards. By doing this, you will see that theoil will not mix with the water. This is exactly the cornerstone of liquid-liquidextraction (LLX). The first extractions, although being solid-liquid extraction,have been done millennia ago as proven by Mesopotamian remains whichshowed a hot-water extractor for organic matter (3500 BC).14 An automatedprocedure is however accredited to a German chemist Franz Ritter von Soxh-let (1848-1926) who developed the first procedure to separate fats from milksolids, although this idea was already pitched by the French chemist AnselmePayen (1795-1871).14
As can be seen in Figure 2.6, a LLX will never be a stand-alone operation. Atleast one distillation column is required to obtain all components in a pureform. This is due to the fact, even though 2 liquid phases are formed, allcomponents will distribute between both liquids phases and additional pu-rification is required. Nevertheless, this operation can be more efficient thana single distillation. A LLX procedure will, therefore, (counter-intuitively)initially worsen the separation problem as an additional component is addedto a mixture. This can be compensated by the increase in regeneration effi-ciency and overall the separation will be more efficient.
Blahušiak et al.8 have shown, see Equation 2.5, that the separation work(Wsep) required to deliver the reboiler duty (Qreb) is subjected to two differ-
Towards Sustainable Solvent-Based Affinity Separations 18

22
THEORY
Figure 2.6: (left) A schematic representation of the relative Gibbs energy levels betweenliquid mixed compounds and a solvent, the created 2 liquid phases (I and II) system and theliquid segregated mixture. (right) A schematic representation of a corresponding Liquid-Liquid Extraction column, where the feed, solvent and products as show which are obtainedafter distillation, Figure 2.3
ent efficiencies, namely the Carnot efficiency (ηC) and the internal efficiency(ηI ).
Wsep = QrebηCηI (2.5)
While the Carnot efficiency is predefined as a function of the ratio in temper-ature present in the top and bottom of the column, the internal efficiency isstrongly correlated to the relative volatility (α) and the molar fraction in thefeed (xFA) see Equation 2.6.8
ηI = −xFAln(xFA) + (1− xFA)ln(1− xFA)
ln(α) ·(
1(α−1) + xFA
) (2.6)
Here, it can be seen that an increase in the relative volatility increases theinternal efficiency of the distillation column, which is key in a LLX process.In the LLX itself, the distribution of the components between both phases is akey parameter. In essence, at equilibrium, all compounds will have the sameactivity in each phase. This means that for every compound the followingequation holds,
[xiγi]I = [xiγi]II ∨ ai,I = ai,II (2.7)
19 Towards Sustainable Solvent-Based Affinity Separations

22
THEORY
where the activity (ai) which is defined as the product of the mole fraction(xi) and activity coefficient (γi) of each compound is equal in both phases.The distribution coefficient is consequently defined as in Equation 2.8,
KD,i =[xi]I[xi]II
=[γi]II[γi]I
(2.8)
where the distribution coefficient (KD ) is the ratio between the (molar or weight)concentration of compound x in phases I and II. Commonly, the solvent phaseis called the extract (E) phase, while the remainder (which is not extracted) iscalled the raffinate (R) phase.
Figure 2.7: (left) A schematic representation of a type I ternary diagram between compoundsA and B, and a solvent.
In the case of a binary mixture, a KD value will be obtained for 2 compo-nents and the ratio between these KD values is called the selectivity, see Equa-tion 2.9,
Sij =KD,iKD,j
=
(γiγj
)I(
γiγj
)II
(2.9)
Additionally, it can be seen that also the selectivity is a function of the activitycoefficients (γi and γj ), almost identically as seen in the non-ideal term of the
Towards Sustainable Solvent-Based Affinity Separations 20

22
THEORY
relative volatility in distillation.
Similarly to the distillation column, a single LLX stage is not sufficient dueto the fact the distribution coefficient is not large enough or the selectivity isnot sufficient. It is therefore often required to repeat the extraction procedureseveral times. An ideal solvent has a large KD value, an infinite selectivity andis completely immiscible with the other liquid phase. This is however neverthe case and the "best" trade-off between these parameters should be found.A ternary diagram, see Figure 2.7, is the most illustrative way of giving asignificant amount of information regarding the equilibrium between 2 partlymiscible liquids (LLE) and the corresponding LLX between both liquids. In aspecific composition region, a phase split will occur, while the remainder ofthe compositions is miscible. These diagrams will be used in the thesis.
2.3.4 Concluding remarks
In this chapter, I only explained the most basic theory regarding fluid sepa-rations. Much more will be explained in the course of this dissertation, butis outside of the scope of this chapter. Throughout this chapter, it is (hope-fully) clear that the activity coefficient (γ) is such an important parameter andnot surprisingly many types of thermodynamic models with various degreesof complexity have been developed over the years. Many models have beenapplied in this dissertation and will be discussed in the appropriate sections.In Chapter 3, we will apply the Van ‘t Hoff equation in a data handling al-gorithm, while in Chapter 4 the (extended) Margules equation will be used.Chapter 5 includes a comparison of eight different models, while Chapter 6includes next to twelve different cubic equation of states combined with eightdifferent mixing rules, also various liquid activity models. An additional ap-pendix is written about this work in Chapter 12. State-of-the-art models suchas UNIQUAC and NRTL are primarily used in Chapters 7, 8, 9 and 10 toenable accurate phase equilibria.
21 Towards Sustainable Solvent-Based Affinity Separations

22
THEORY
2.4 References
[1] F. Aftalion, A history of the international chemical industry. Chemical Heritage Foundation, 2001.[2] J. D. Seader, E. J. Henley, and D. K. Roper, Separation process principles, vol. 25. Wiley New York, 1998.[3] J. De Grooth, M. G. Elshof, and H. D. W. Roesink, “Polyelectrolyte multilayer (pem) membranes and their
use,” May 28 2020. US Patent App. 16/613,727.[4] M. Bos, S. Pietersen, and D. Brilman, “Production of high purity co2 from air using solid amine sorbents,”
Chemical Engineering Science: X, vol. 2, p. 100020, 2019.[5] S. Whitley, “The uranium ultracentrifuge,” Physics in Technology, vol. 10, no. 1, pp. 26–33, 1979.[6] A. J. Liebmann, “History of distillation,” Journal of Chemical Education, vol. 33, no. 4, p. 166, 1956.[7] A. A. Kiss, “Distillation technology–still young and full of breakthrough opportunities,” Journal of Chem-
ical Technology & Biotechnology, vol. 89, no. 4, pp. 479–498, 2014.[8] M. Blahušiak, A. A. Kiss, K. Babic, S. R. Kersten, G. Bargeman, and B. Schuur, “Insights into the selection
and design of fluid separation processes,” Separation and purification technology, vol. 194, pp. 301–318,2018.
[9] S. Widagdo and W. D. Seider, “Journal review. azeotropic distillation,” AIChE Journal, vol. 42, no. 1,pp. 96–130, 1996.
[10] Z. Lei, C. Li, and B. Chen, “Extractive distillation: a review,” Separation & Purification Reviews, vol. 32,no. 2, pp. 121–213, 2003.
[11] A. Alkhudhiri, N. Darwish, and N. Hilal, “Membrane distillation: A comprehensive review,” Desalination,vol. 287, pp. 2–18, 2012.
[12] G. E. Cortes Garcia, J. van der Schaaf, and A. A. Kiss, “A review on process intensification in higee distil-lation,” Journal of Chemical Technology & Biotechnology, vol. 92, no. 6, pp. 1136–1156, 2017.
[13] C. J. King, Separation Processes, ch. Energy requirements of Separation Processes. McGraw-Hill ChemicalEngineering, McGraw-Hill, 2nd ed., 1980.
[14] W. B. Jensen, “The origin of the soxhlet extractor,” Journal of chemical education, vol. 84, no. 12, p. 1913,2007.
Towards Sustainable Solvent-Based Affinity Separations 22


333
3Solvent Pre-Selection via LiteratureReview and Visualisation
"The farther back you can look, the farther forward you are likely to see",Winston Churchill, (1874 - 1965)
This chapter is adapted from:Brouwer, T., Kersten, S.R.A., Bargeman, G. and Schuur, B. "Trends in Sol-vent Impact on Infinite Dilution Activity Coefficients of Solutes Reviewed andVisualized Using an Algorithm to Support Selection of Solvents for GreenerFluid Separations", (Article Submitted)

333
LITERATURE REVIEW AND VISUALISATION
3.1 Introduction
The chemical industry produces large quantities of chemical compounds. Tho-ugh processes have been operated and constantly optimized for many decades,the pursuit of reducing energy usage and lessen the environmental impact is aconstant endeavor. Separation processes are among the most energy-intensiveoperations which can account for up to 50% of the total costs of the chemi-cal plant.1 Even on a global scale in the production of chemicals and fuels,these separation processes account for 10-15% of the world’s energy usage.2
Solvent-based affinity processes aim to enhance the separation efficiency byselectively tuning the interactions present in the separation mixture whichis done via the addition of a solvent.3 For example, in applications whereazeotropic behavior is encountered, the addition of a solvent can enable sep-aration by distillation, and proper solvent selection has a significant impacton the overall energy demand of the process. Recently, we projected4 thatby replacing fossil-based Sulfolane in an oil refinery extractive distillation bybio-based solvent Cyrene, a maximum of 30% energy savings can be achieved.This projection can be found in Figure 7.7. However, how to select a solventis not straight-forward, and is typically labor- and time-intensive.
To reduce the labor intensity of the solvent screening process, a prompt sol-vent pre-selection is crucial in the early development and/or improvement ofnovel solvent-based affinity processes. Pre-selection can be done using activ-ity coefficients. These activity coefficients of the molecules in the mixture arecompared in different solvents, hence the solvent performances in a solvent-based separation can be evaluated. Generally, the maximum effect can beachieved by having a close to the pure solvent present. Thus, the solute willonly interact with solvent molecules. The close to pure solvent situation cor-responds to an infinite dilution of the individual solutes and therefore, theinfinite dilution activity coefficient (γ∞i ) is a good first measure of the achiev-able separation performance of the solvent.5 Some systems containing self-association and/or complexation behavior show a maximum deviation fromideality at a composition different from infinite dilution.6 However, these sys-tems are exceptions and these effects have not been taken into considerationin our current study focusing on the infinite dilution activity coefficient.
Towards Sustainable Solvent-Based Affinity Separations 26

333
LITERATURE REVIEW AND VISUALISATION
The activity coefficient, interpreted by Lewis in 1901 as “the tendency to escapethe phase in which it is in”,7 is an important feature in biphasic systems be-cause it describes deviations from Raoult’s law. The tendency of the solute toescape the phase in which it is in is reduced when the attractive intermolecu-lar interaction between the solute and solvent is stronger than those betweenthe solvent molecules. The γi will in this situation be lower than unity, γi < 1.Oppositely, if the tendency is enhanced and the attractive interaction betweenthe solvent molecules is stronger, then a net repulsion is induced and a posi-tive deviation from Raoult’s law is seen. This is described by a γi higher thanunity, γi > 1. In the ideal situation, where no intermolecular interactions oc-cur (as in an ideal gas), or they are all identical, γi = 1.
The γi is, however, both temperature and composition-dependent and the γ∞isimplifies this to a single compositional point. Although the γ∞i can be usedto find the maximum separation performance of solvents, it does not reflectthe actual values that may be observed in real separations, since for infinitedilutions a solute mole fraction between 10−7 and 10−4 may suffice, depend-ing on the relative molar weights of solute and solvent.8 Often, actual con-centrations are much larger, although in several chemical processes such asstripping operations and the extraction of highly dilute species, this quantitymay be directly used.9 However, in this manuscript, the γ∞i will be used as amolecular descriptor for solvent pre-selection for solvent-based affinity sepa-rations.
Several experimental techniques are available to determine the temperature-dependent γ∞i , such as Gas-Liquid Chromatography10, Inert Gas StrippingMethod11,12, Headspace Analysis Method13, Indirect Headspace Chromatog-raphy14, Dew Point Method15, Differential Static Cell Method16, DifferentialEbulliometry Method17 and Rayleigh Distillation Method18. An excellent re-view of all techniques is given by Dohnal.19 Mathematical models are alsopresent which can predict γ∞i , such as several UNIFAC variations20–22, theAbraham model23, MOSCED24 and COSMO-RS.25 Significant deviations be-tween simulated values and experimental values occur however for severalclasses of molecules and care should be taken when using these estimations.26
Due to the rich literature on experimental γ∞i , proper analysis of literaturedata might give good insights, and allow for trend analysis in various sol-
27 Towards Sustainable Solvent-Based Affinity Separations

333
LITERATURE REVIEW AND VISUALISATION
vents of the same family and between different solvent families. To map thesetrends, it is of importance to have comparable data available, which entailsisothermal γ∞i at for instance 298.15K.
Several literature reviews with the focus on γ∞i in particular ionic liquids(ILs) are present, though often with another emphasis. Various reviews em-phasized the differences between various ILs on the n-hexane/1-hexene27,28
or aliphatic/aromatic separation.28 Heintz29 reviewed ILs for more thermo-physical properties and focused on alkanes, aromatic molecules and alco-hols. Articles describing the γ∞i of molecular solvents generally focus on onesolvent, several solvents or combinations of several molecular solvents.5,30
Pierotti et al.31 showed a methodology of evaluating γ∞i trends of certainsolute-solvent combination as function of the number of carbon atoms. More-over, an important limitation to the use of literature data is that the data is notalways available at the same temperature. To enable a trend map for a widerange of solvents, and having ample data present, but not at the right tem-perature, an approach needs to be developed. In recent years, Deep EutecticSolvents (DES’s) have been introduced as a new type of solvent. However, onlya very limited amount of γ∞i for solutes in DES’s have been published32–35,hence these solvents are excluded from this evaluation.
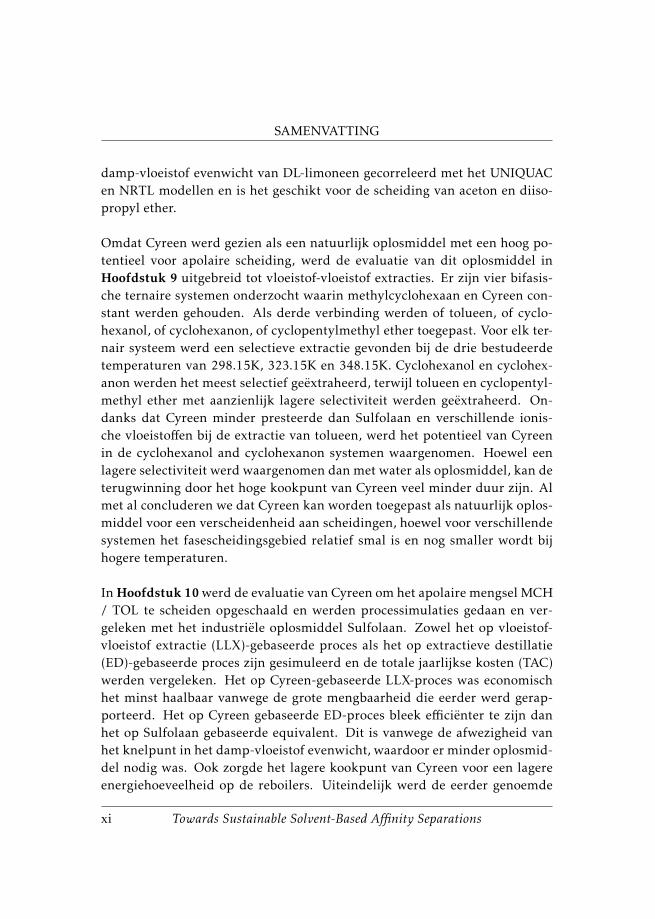
In this work, we have developed a data analysis algorithm, and applied itto analyze a large set of data for the γ∞i of five solutes, being n-hexane, ben-zene, chloroform, acetone and ethanol, see Figure 3.1, in many solvents. Thesolutes have been selected as examples of respectively apolar saturated hy-drocarbons, slightly polar unsaturated hydrocarbons, halogenated molecules,aprotic polar molecules and protic polar molecules. For these molecules, theγ∞i at 298.15 K is mapped for a wide range of molecular solvents and ILs.The resulting overview enables a discussion on the impact of solute and/orsolvent molecular structural changes on the γ∞i of the solutes.
Towards Sustainable Solvent-Based Affinity Separations 28
333
LITERATURE REVIEW AND VISUALISATION
Figure 3.1: The investigated molecules, from left to right n-hexane, benzene, chloroform,acetone and ethanol. The electron distribution profile was generated by COSMOthermXC30_1705 with a TZVP parameterization. The color indicators are a range from electroneg-ative (red), slightly electronegative (yellow), neutral (green) to electropositive (blue) regions.
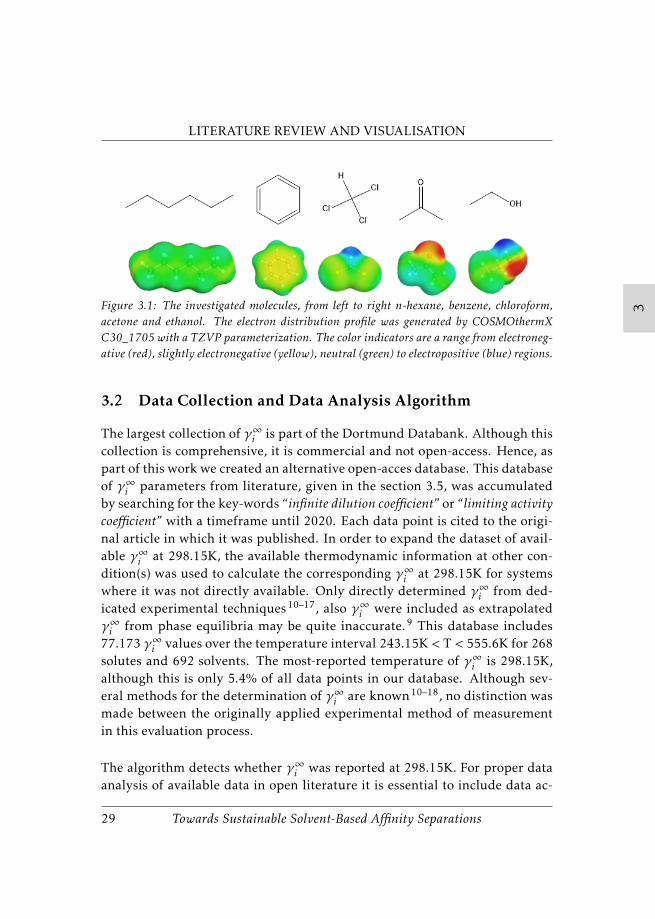
3.2 Data Collection and Data Analysis Algorithm
The largest collection of γ∞i is part of the Dortmund Databank. Although thiscollection is comprehensive, it is commercial and not open-access. Hence, aspart of this work we created an alternative open-acces database. This databaseof γ∞i parameters from literature, given in the section 3.5, was accumulatedby searching for the key-words “infinite dilution coefficient” or “limiting activitycoefficient” with a timeframe until 2020. Each data point is cited to the origi-nal article in which it was published. In order to expand the dataset of avail-able γ∞i at 298.15K, the available thermodynamic information at other con-dition(s) was used to calculate the corresponding γ∞i at 298.15K for systemswhere it was not directly available. Only directly determined γ∞i from ded-icated experimental techniques10–17, also γ∞i were included as extrapolatedγ∞i from phase equilibria may be quite inaccurate.9 This database includes77.173 γ∞i values over the temperature interval 243.15K < T < 555.6K for 268solutes and 692 solvents. The most-reported temperature of γ∞i is 298.15K,although this is only 5.4% of all data points in our database. Although sev-eral methods for the determination of γ∞i are known10–18, no distinction wasmade between the originally applied experimental method of measurementin this evaluation process.
The algorithm detects whether γ∞i was reported at 298.15K. For proper dataanalysis of available data in open literature it is essential to include data ac-
29 Towards Sustainable Solvent-Based Affinity Separations

333
LITERATURE REVIEW AND VISUALISATION
curacy properly. If only a single γ∞i was reported at 298.15K, an error of5% was assumed, in line with reported typical experimental error marginsof 1-6%.11,36,37 When multiple data points were reported, the average valueand the standard deviation was determined, which could not be lower than5%, as this is the accuracy of a single data point. When no data was avail-able at 298.15K, but data at other temperatures were available, the infinitedilution dissolution enthalpy (∆H∞i ) and entropy (∆S∞i ) were calculated forsystems with data at different (at least 3) temperatures and a minimal tem-perature difference of 20K by performing a non-linear last square minimiza-tion38 routine in combination with the Van ‘t Hoff equation (Equation 3.1).A temperature-independent ∆H∞i and ∆S∞i were assumed. This is generallya good approximation, although this may be invalid for aqueous or complex-ing systems. This limitation can be surpassed by taking into considerationthe changes in heat capacity39,40, this was however not included here as it re-quired additional data.
lnγ∞i =∆H∞iRT
−∆S∞iR
(3.1)
The average of multiple γ∞i at 298.15K was preferred over the γ∞i obtainedfrom the Van ‘t Hoff correlation. Generally, this is can only be statistically jus-tified by large data sets, still this is done as this is the most straight-forwardmethod of including all data-points. Using the algorithm, the amount of datapoint at 298.15K increases from 5.4% of all data points to 23.5% of the re-ported solute-solvent combinations within an accuracy of 5%.
3.3 Mapping solute γ∞i confidence intervals for solventfamilies
Rather than considering a single solvent in a solvent pre-screening, valuableinsight can be gained by mapping the γ∞i for a family of solvents, and toplot the γ∞i confidence interval as a function of the molar weight. A similarapproach was also done by Pierotti et al.31 which used the number of carbonatoms. This was done for all five solutes investigated in this study, and for arange of solvent families. In this subsection, we elaborate on the approach forn-hexane in alcohols, see Figure 3.2, as an example of the data analysis
Towards Sustainable Solvent-Based Affinity Separations 30

333
LITERATURE REVIEW AND VISUALISATION
Figure 3.2: The infinite dilution activity coefficient of n-hexane (γ∞n−hexane) in various al-cohol solvents as a function of the molecular weight of the solvent. The experimental val-ues41–49,63–71 are depicted as well as, and tableted in Table 3.1.
Alcohol (Cn )γ∞i (298.15K) ∆H∞i ∆S∞i
Exp. (range ; nr) Algorithm (kJ·mol−1) (J·mol−1·K−1)C1 25.9–46.0 ; 5 30.6±8.61 16.3±5.24 27.8±16.9C2 10.6–12.0 ; 5 11.2±0.72 6.45±0.91 1.39±2.9C3 6.73–9.70 ; 3 7.68±1.75 -0.30±4.65 -17.8±15.0C4 5.12–5.31 ; 3 5.21±0.14 0.02±1.55 -13.4±4.99C5 4.14 ; 1 4.14±0.21 n.a. n.a.C7 3.07-3.10 ; 2 3.10±0.15 n.a. n.a.C8 2.58–2.80 ; 5 2.68±0.11 0.63±1.05 -6.04±3.45C12 n.a. 2.11±7.41 -0.63±1.90 -4.12±6.03C14 n.a. 1.71±8.72 0.09±2.36 -4.46±7.09C16 n.a. 1.63±0.70 0.62±0.48 -1.99±1.33C18 n.a. 1.26±2·103 2.55±9.5 6.66±27.8
Table 3.1: The infinite dilution activity coefficient of n-hexane in various linear saturatedalcohol solvents as function of the molecular weight of the solvent. The experimental val-ues41–49,63–71 are depicted as well as the γ∞i , dissolution enthalpy (∆H∞i ) and dissolutionentropy (∆S∞i ) values generated by the data handling algorithm.
31 Towards Sustainable Solvent-Based Affinity Separations
333
LITERATURE REVIEW AND VISUALISATION
algorithm. The γ∞i at 298.15K of n-hexane in 10 different normal alcohols arepublished in 9 different papers.41–49 Nevertheless, additional experimentaldata is available at different temperatures.18,50–62
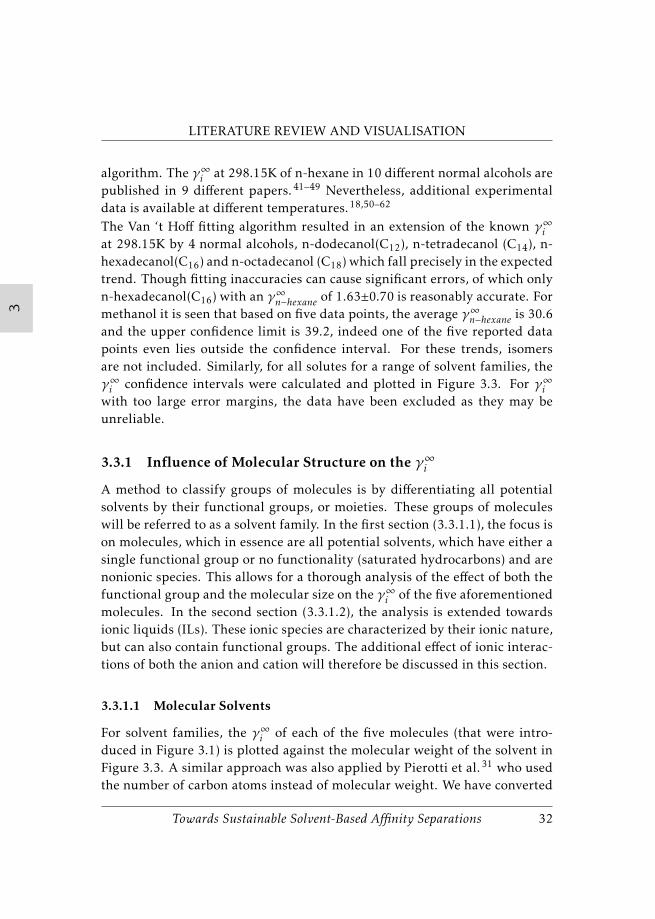
The Van ‘t Hoff fitting algorithm resulted in an extension of the known γ∞iat 298.15K by 4 normal alcohols, n-dodecanol(C12), n-tetradecanol (C14), n-hexadecanol(C16) and n-octadecanol (C18) which fall precisely in the expectedtrend. Though fitting inaccuracies can cause significant errors, of which onlyn-hexadecanol(C16) with an γ∞n−hexane of 1.63±0.70 is reasonably accurate. Formethanol it is seen that based on five data points, the average γ∞n−hexane is 30.6and the upper confidence limit is 39.2, indeed one of the five reported datapoints even lies outside the confidence interval. For these trends, isomersare not included. Similarly, for all solutes for a range of solvent families, theγ∞i confidence intervals were calculated and plotted in Figure 3.3. For γ∞iwith too large error margins, the data have been excluded as they may beunreliable.
3.3.1 Influence of Molecular Structure on the γ∞i
A method to classify groups of molecules is by differentiating all potentialsolvents by their functional groups, or moieties. These groups of moleculeswill be referred to as a solvent family. In the first section (3.3.1.1), the focus ison molecules, which in essence are all potential solvents, which have either asingle functional group or no functionality (saturated hydrocarbons) and arenonionic species. This allows for a thorough analysis of the effect of both thefunctional group and the molecular size on the γ∞i of the five aforementionedmolecules. In the second section (3.3.1.2), the analysis is extended towardsionic liquids (ILs). These ionic species are characterized by their ionic nature,but can also contain functional groups. The additional effect of ionic interac-tions of both the anion and cation will therefore be discussed in this section.
3.3.1.1 Molecular Solvents
For solvent families, the γ∞i of each of the five molecules (that were intro-duced in Figure 3.1) is plotted against the molecular weight of the solvent inFigure 3.3. A similar approach was also applied by Pierotti et al.31 who usedthe number of carbon atoms instead of molecular weight. We have converted
Towards Sustainable Solvent-Based Affinity Separations 32

333
LITERATURE REVIEW AND VISUALISATION
the available correlations proposed by Pierotti et al.31 from carbon numberto molecular weight for systems evaluated by us. The results can be seen inFigure 3.3 where four of the converted Pierotti correlations (for n-hexane inketone solvents, ethanol in alkane solvents, and acetone in alcohol and alkanesolvents, respectively) are shown. The molecular weight of the solvent waschosen as the parameter to display the variation within the families. In thiscase, maintaining a single moiety and increasing the hydrocarbon backbonein a family results in a polarity decrease of the solvent. Therefore, the impactof the London dispersion forces increases with increasing molecular weight.These dispersion forces will reduce the impact of intermolecular interactionsassociated with specific functional groups, and accordingly limit the impactof these interactions on the γ∞i .
33 Towards Sustainable Solvent-Based Affinity Separations

333
LITERATURE REVIEW AND VISUALISATION
Figure 3.3: The infinite dilution activity coefficient of (A) n-hexane, (B) benzene, (C) chlo-roform, (D) acetone and (E) ethanol as function of the molecular weight of the solvent.Homologue series of solvents having no or a single functional group. Within the legend,cyclic solvents are indicated with (C), and linear amides are specifically noted with (L).Additionally, the trends predicted by Pierotti et al.31 are included.
In Figure 3.3, it can be seen that a declining effect in γ∞i for an increase in sol-vent molecular weight for n-hexane, benzene and chloroform in several sol-vent families, whereas for acetone and ethanol another effect is visible. Thesignificant observed decline is associated with the most dissimilar solvent-solute combination, as well as for the lightest solvents. The increased hydro-carbon (-CH2) fraction in heavier solvents causes the mitigation of the non-ideality. For acetone and ethanol the trend is seen to be largely independentof the hydrocarbon fraction of the solvent, indicating that the non-ideality isnot mitigated by additional hydrocarbon groups.
The relative extent of this effect can be related to the overall apolar characterof the solute (see the electron density profiles in Figure 3.1), which is mostsignificant for n-hexane, having an almost absent multipole moment, whilebenzene has a significant quadrupole moment, and chloroform with its dipolemoment shows the smallest impact. The effect of the solvent molecular weighton the γ∞i for ethanol and acetone is even smaller.For these solutes, the non-ideal behavior is predominately characterized bydipole and hydrogen bond interactions, though dispersive interactions arestill omnipresent.72 Several solvent families and solute combinations, for in-
Towards Sustainable Solvent-Based Affinity Separations 34

333
LITERATURE REVIEW AND VISUALISATION
stance, chloroform in esters, show a net attractive interaction, (γ∞chlorof orm < 1),which intensifies with the increasing molecular weight of the solvent. Thismay be due to the fact, that the liquid ester structure is stabilized by dipoleinteractions. These interactions become less pronounced as the hydrocarbonfraction is increased. As the solvent-solvent interactions are mitigated, the netattraction of the chloroform is enhanced which results in a lower γ∞chlorof orm.
For each compound, the difference between the absolute values of the γ∞i be-tween the solvent families stems from a change in the Gibbs energy causedby the introduction of an infinitely small quantity of the solute molecule inthe liquid solvent matrix. This change reflects the change in the sum of allinteractions in the system (interactions between the solvent and solute andthe interactions between the solvent molecules). The stability of the liquidstructure of the solvent changes due to the changed interactions upon intro-duction of the solute, and is, therefore, an important aspect in understand-ing the overall behavior of mixtures.72 A highly stable liquid solvent struc-ture can be induced by hydrogen bonds, i.e. in amides73,74 and alcohols74–77,or by strong dipole-dipole interactions, i.e. with dimethylsulfoxide78 or ni-tromethane.79 The relative stability of the liquid structures can differ, as theO −H · · ·O hydrogen bond in alcohols are stronger than the N −H · · ·O andN −H · · ·N hydrogen bonds possibly present in amides.80
The combined effect of the dispersive, multipole and hydrogen bonding in-teractions results in the non-ideality observed in Figure 3.3. n-Hexane cannotform hydrogen bonds, is neutrally charged and lacks a significant dipole mo-ment. Therefore, solvents with a small hydrocarbon backbone and a signifi-cant electronegative moiety, such as sulfones, amides and carbonates, inducethe most significant γ∞n−hexane, see Figure 3.3A. The highest activity coefficientcorresponds to the most intense net repulsive interaction. Also, it can be seenthat the trend of Pierotti et al.31 for alkanes (in this case n-hexane) in ketonesclosely follows the visualization. In Figure 3.3B, it can be seen that less severenet repulsive interactions are induced for benzene, due to the mitigating effectof a slightly electronegative region induced by the quadruple moment of theπ-ring which allows multipole interactions with solvent moieties. Small alco-hols which have a highly structured liquid structure through hydrogen bond-ing74–77, in which benzene is unable to partake, induce the largest γ∞benzene.
35 Towards Sustainable Solvent-Based Affinity Separations

333
LITERATURE REVIEW AND VISUALISATION
Chloroform has a strong dipolar character with relatively large electronega-tive chlorine atoms, which withdraw the electron from the remaining proton,hence creating an electropositive region. These halogen atoms can partici-pate in dipole interactions and can also form hydrogen bonds, although thesebonds are less strong than oxygen- or nitrogen-based bonds.81 These inter-actions (see Figure 3.3C) induce a net attractive interaction with amides,82
resulting in a γ∞chlorof orm lower than unity, as explained earlier. Similarly, dis-solving a halogenated solute in solvents with a considerable dipole momentsuch as esters, dimethylsulfoxide and ketones is energetically favorable. Sol-vents lacking a dipole moment, such as alkanes, induce net repulsive inter-actions towards the electropositive proton. Furthermore, strongly hydrogenbonding solvents, including alcohols, induce a net repulsion as well since thehydrogen bond strength of the chloroform is lower than that of the alcoholsthemselves.
Acetone has a significant dipole moment and is solely a hydrogen bond ac-ceptor, indicated by the highly electronegative oxygen. In Figure 3.3D it canbe seen that most solvent families are almost indifferent to include acetonein their liquid structure and therefore induce either a γ∞acetone of around unityor slightly above. Acetone is however repelled by alkane solvents due to theineptness of these solvents to accommodate the strong dipole moment of ace-tone in their liquid structure. The results for acetone in alkane solvents andin alcohol solvents reported in this study are also in these cases in line withresults of Pierotti et al.31 (see Figure 3.3D).
Ethanol can either accept, due to a strong electronegative region, or donate,due to a strong electropositive region, hydrogen bonds and therefore has astrong hydrogen bonding network. This results in a highly stable and orderedliquid structure for pure ethanol.83 The relatively small alcohol with rela-tively polar areas within the molecule is therefore easily repelled by apolarsolvents as can be seen in Figure 3.3E, where significant γ∞ethanol are inducedby apolar solvents. Other protic polar solvents, such as amides73,74, allowinteractions between the dipole and the hydrogen bonding capability of theethanol. Although ethanol will disturb the liquid solvent structure, it can beaccommodated hence the induced γ∞ethanol is around or even below unity. The
Towards Sustainable Solvent-Based Affinity Separations 36
333
LITERATURE REVIEW AND VISUALISATION
results for ethanol in alkane solvents obtained in this study and the resultsof Pierotti et al.31 both show strong repulsion of the ethanol by the alkanes,however, reported γ∞ethanol differ more strongly than the maximum deviationof 7.5% reported by Pierotti et al.31 (see Figure 3.3E).
Summarizing, Figure 3.3 gives an overview of the γ∞i of the five investigatedmolecules in various solvent families. It enables immediate comparison of theeffect different functional groups have on the γ∞i . Additionally, if a particularγ∞i is targeted, the observed trends allow a pre-selection of the required func-tional group and molecular weight of the solvent. The SES holds γ∞i of manyother solutes and therefore these analyses can be extended to other solutesand solvents. In the next section, the discussion is extended towards ionicinteractions by mapping the effect of various cations and anions on the samefive example molecules.
3.3.1.2 Ionic Liquids (ILs)
Regularly, ILs are named green solvents due to the negligible vapor pres-sure.84 Although the classification as green solvents needs to be used withcare as some ILs are much less environmentally benign than others,85 ILs cer-tainly form a solvent class that is of interest to fluid separation scientists andtechnologists. The flexibility of independently changing either the cation oranion gives a vast amount of possible ILs which can be tuned to a specificseparation. For this reason, ILs are also called designer solvents.86 The influ-ence of the cation structure on the γ∞i is discussed in subsubsection 3.3.1.3,while the influence of the anion structure on the γ∞i is discussed in subsub-section 3.3.1.4.
3.3.1.3 Cations
To fairly compare cations of different natures, cations with equal combinedlengths of the alkyl tails attached to the central cationic structure were stud-ied, see Table 3.2. In total ten different central cation structures combinedwith the bis(trifluorosulfonyl)-imide anion (NT f −2 ) have been reviewed.More specifically, the γ∞i of the five solutes are evaluated for ILs with cationswith a methyl and a butyl hydrocarbon tails except for the 1,2,3-tris(diethylami-no)cyclopropenylium [TDC]+ and methyl-1,3,5-triazabicyclo[4.4.0]dec-5-ene
37 Towards Sustainable Solvent-Based Affinity Separations

333
LITERATURE REVIEW AND VISUALISATION
NR1
N+R2
R1
N+R2
N+R1
R2
N+R1
R2
(dialkyl-)Imidazolium[R1R2IM]+
(dialkyl-)Pyridinium[R1R2P y]+
(dialkyl-)Pyrrolidinium[R1R2P yr]+
(dialkyl-)Piperidinium[R1R2P ip]+
O
N+R1
R2N
N
N+
R1
N+ R1
R2
R3
R4
P+ R1
R2
R3
R4
(dialkyl-)Morpholinium[R1R2Mor]+
(alkyl-)Guanidinium super-base [R1MTBDH]+
Ammonium[NR1R2R3R4 ]+
Phosphonium[PR1R2R3R4 ]+
S+ R1
R2
R3N(R1)2
N(R1)2
+
N(R1)2
Sulphonium [SR1R2R3]+ Cyclopenylium [R1CP ]+
Table 3.2: The ten classes of cations (in combination with the bis(trifluorosulfonyl)-imideanion) have been included in the evaluation concerning the γ∞i of all solutes.
[MTBDH]+ cations, where the alkyl tails do not exactly match. The compari-son is displayed in Figure 3.4.
The morpholinium [BMMor]+ cation appears to induce a slightly larger γ∞n−hexanethan the other cations. An effect may be induced by the distinct negativecharge on the oxygen atom. The presence of a distinct localized negativecharge in an overall positively charged cation creates the possibility of self-associating behavior,87 which enhances the liquid structure of the ILs. Thiscan for instance be seen from a relatively high morpholinium ILs viscosity ascompared to other ILs.88 Consequently, larger γ∞i are induced for solutes thatcannot participate in (self-)associative interactions that stabilize the (ionic-)liquid structure. [TDC]+ seems to induce a smaller γ∞n−hexane, although the ac-curacy range for obtained γ∞n−hexane for several ILs is relatively large and the
Towards Sustainable Solvent-Based Affinity Separations 38

333
LITERATURE REVIEW AND VISUALISATION
γ∞n−hexane value falls within this range. This seemingly low value might be dueto not only the larger amount of alkyl tails, but also the delocalized chargedensity over all three carbon atoms.89 The γ∞i of benzene, chloroform andacetone show net attractive interactions independent of cationic nature. Thisindicates significant ion-multipole interactions,90 because net repulsive inter-actions were seen in molecular solvents.
Figure 3.4: The γ∞i of (left to right) n-hexane, benzene, chloroform, acetone and ethanolfor thirteen different cations from nine classes. Additionally, 3 functionalized cationsand 2 multivalent cations are assessed. All cations are coupled with a (or multiple)bis(trifluoromethanesulfonyl)imide [NTf2]− anion(s) at 298.15K.The values of the multi-functional cations are at 323.15K.
Ethanol shows a γ∞i > 1, even though it does exhibit a dipole moment. An ex-planation for this observation is that ethanol interacts predominately through
39 Towards Sustainable Solvent-Based Affinity Separations

333
LITERATURE REVIEW AND VISUALISATION
hydrogen bonding, whereas ILs have stronger internal ionic interactions (ap-prox. 300-400 kJ·mol−1).91,92 An IL needs to give up (partly) the ionic inter-actions to accept a hydrogen bond of ethanol, which is less favorable, result-ing in a net negative interaction. Consequently, apolar solutes and stronglyhydrogen bonding solutes show a γ∞i > 1, whereas polar molecules with nohydrogen bonding donation ability show a γ∞i < 1.
Various functionalizations of the alkyl chain on the cation have been reported,e.g. by adding a chlorine93, silicon94, ether95, cyano96–98, alcohol98–100,boronic acid101 or sulfone102 group. Unfortunately, is was not possible tocompare all functionalizations at the same conditions. Yet, as can be seenin Figure 3.4, the etherification of the alkyl chain appears to have an in-significant effect concerning the γ∞i , as the γ∞n−hexane for [EMIM]+[NTf2]− and[MO-EMIM]+[NTf2]− are 27.9±13.6κ and 25.9±1.29κ, respectively, althoughit is effective in reducing the viscosity of the IL.103 The addition of an alco-hol moiety, such as in [HO-EMIM]+[NTf2]−, does have a significant effect onthe γ∞i , as it elevates the γ∞n−hexane from 27.9±13.6κ to 83.6±4.18κ , and ap-pears to lower the γ∞ethanol from 1.96±0.10κ to 1.38±0.07κ in comparison to thefunctionalized [MO-EMIM]+[NTf2]−. The enhanced polarity of the alcohol-functionalized IL and the associated solvent-to-solvent hydrogen bond forma-tion causes an increase in γ∞i of the non-hydrogen bonding solutes, whereasethanol can take part in the hydrogen bond network, resulting in a lowerγ∞ethanol .
Combining these results with all trends observed in section 3.3.1.1, enables abetter insight in the way that the γ∞i adapts to a structural cation change. Theaddition of other highly polar moieties, such as cyano-96–98, boronic acid-101
or sulfone-102 groups, will most likely elevate the γ∞i for apolar and slightlypolar hydrocarbons. These functionalizations may however lower the γ∞i forprotic polar molecules, such as ethanol, compared to unfunctionalized ILs.Furthermore, elongation of the length of the alkyl tails will probably lowerthe γ∞i for apolar and slightly polar hydrocarbon solutes. An estimation of therelative effect of the functional group addition may be guided by the trendsseen in Figure 3.4, where the γ∞i of numerous solvent families are compared.
As an additional structural adaption possibility, multivalent cations have been
Towards Sustainable Solvent-Based Affinity Separations 40

333
LITERATURE REVIEW AND VISUALISATION
introduced by Mutelet et al.104–106 and Heydar et al.107 as a novel extensionto the ILs. Direct comparison between various multivalent ILs is difficult dueto the additional molecular structure combining the local positively charged(monovalent) centers. However, the combined effect of the bridging structureand molar ratio change of the anions and (multivalent) cations in combina-tion with the [NT f2]− anion(s) appears to decrease the γ∞i of all solutes, ascan be seen in Figure 3.4. When multiple solutes in a mixture show a similarreduction in γ∞i , this implies that the capacity is increased while maintainingthe selectivity.108 This approach may therefore be a way to counteract a lowsolute capacity in an IL due to high γ∞i .
Lastly, in Figure 3.5, ammonium, phosphonium and sulphonium cations areassessed. These cations were taken separately, due to the fact a large varietyof these ILs are described in literature.95,109–120 It can be seen that the γ∞iof n-hexane, benzene and chloroform decreases as the molecular weight ofthe ammonium, phosphonium and sulphonium cations increase. Exactly, thesame trend is observed for molecular solvents in section 3.3.1.1, indicatingthat the central nitrogen, phosphorus or sulfur atom acts like a moiety andbecomes insignificant at high molecular weights of the solvent. Still, under-standing the effect of the central atom is required when a well-considerationchoice between these ILs is required.
Carvalho et al.112 discussed the effect of the central atom in these cations anddetermined with molecular simulations that the smaller nitrogen atom hasa higher electron density and therefore is more strongly polarized than thelarger phosphonium atom. This causes a stronger cation-anion interaction
41 Towards Sustainable Solvent-Based Affinity Separations

333
LITERATURE REVIEW AND VISUALISATION
Figure 3.5: The comparison of the γ∞i of (A) n-hexane, (B) benzene, (C) chloroform, (D)acetone and (E) ethanol in ammonium, phosphonium and sulphonium ionic liquids with avariation of functionalized alkyl tails with a bis(trifluoromethanesulfonyl)imide [NT f2]−
anion at 298.15K.
and a more rigid liquid structure than the phosphonium equivalent, whichmakes the anion less mobile. The higher mobility of the anions in phospho-nium ILs induces more intermolecular interactions with the solutes and con-sequently a larger γ∞i for the non-polar solutes and slightly lower γ∞i for polarsolutes. This effect will be more significant at low IL molar weights, otherwise,the intermolecular interactions of the ILs will be dominated by the alkyl tails.The differences observed by Carvalho et al.112 are most likely still present inour comparison, even though we could not unequivocally claim this due tothe larger imposed error margins.
Following the reasoning of Carvalho et al.112, the γ∞i decrease observed forthe apolar solutes (n-hexane and benzene) in multivalent cation ILs, shouldbe caused by less mobility of the anions due to a stronger (multivalent) cation-
Towards Sustainable Solvent-Based Affinity Separations 42

333
LITERATURE REVIEW AND VISUALISATION
anion interaction and consequently less repulsive interactions. This may bethe case, as Shirota et al.121 showed that dicationic ILs have a larger den-sity and a stronger surface tension than their monovalent equivalent, whichthey also attributed to stronger cation-anion interactions for the dicationicILs. Additionally, the bridging structure between the local positively chargedmonovalent centers increases the hydrophobic surface of the cation and canalso decrease the γ∞i of the apolar solutes.
The γ∞i of the more polar solutes (chloroform, acetone and ethanol) are lowerthan unity for the monovalent IL, and the presence of multivalent cations inthe IL causes a further decrease. This may be explained by a higher anionmobility for the multivalent ion-containing ILs, in line with observations re-ported by Carvalho et al.112 It is reasonable to assume that, through steric hin-drance and competitive interactions between the polar solute and the anions,the cation-anion interaction between the 2nd (and 3rd) anion(s) and the cationin the IL will be less strong when solutes with higher polarity are present inthe IL solvent. This consequently causes more anion mobility, which lowersthe γ∞i for polar solutes even further. Furthermore, it is reasonable to assume,that the anion mobility for apolar solutes is lower than for polar solutes due tothe absence of the competing polar interaction, and in this case the increasedhydrophobic character of the bigger multivalent cation containing IL causesthe reduction in γ∞i for apolar solutes.
To summarize, most cations show similar interactions with the selected sol-vent and only when the cations are functionalized the interaction can be chang-ed significantly. Functionalization in the central cationic structure by an elec-tronegative atom or by including a functional group in one of the alkyl tailscan change certain γ∞i . The functional group choice can be guided by thetrends observed in the molecular solvents due to the fact the γ∞i originatesfrom the same underlying intermolecular forces. Increasing the solvent ca-pacity while maintaining the separation selectivity improves the separationprocess. Since the multivalent cationic ILs did not show a significant viscosityincrease,108 and reduced γ∞i for all evaluated solutes similarly as compared tomonovalent cationic ILs, the use of ILs based on multivalent cations appearsto have a high potential for fluid separations.
43 Towards Sustainable Solvent-Based Affinity Separations

333
LITERATURE REVIEW AND VISUALISATION
3.3.1.4 Anions
As every (liquid) electrolyte is bound to charge neutrality, cations are insep-arable from anions. Therefore, in this second section, the effect of the molec-ular structure of the anion is assessed. The anionic structure can be greatlydiverse, although many anions show similarities and are variations around acentral atom or functional group. Twenty anions (twelve basic structures withdifferent side groups for some of the structures) in total have been evaluated,as can be seen in Table 3.3.
Various anions can be categorized into groups, having for example a centralphosphorous atom or an –SO3 end-group. This highlights the flexibility inthe anion choice. Besides the selection of the anion nature, also the lengthof the alkyl tails can be tuned independently of anion nature. In Figure 3.6,an overview is shown incorporating the combination of twenty anions and sixcations. The γ∞i for the solutes in ILs with the same anion and up to six
P− F
R1F
R1
F R1
B− R1
R1R1
R1
R1
N−
R1
R1 = −F : [P F6]− R1 = −F : [BF4]− R1 = −SO2F : [FSI]−R1 = −C2F5 : [FAP ]− R1 = −CN : [B(CN )4]− R1 = −SO2CF3 : [NTF2]−
R1 = −CN : [DCA]−
P OR1
O−OR1
O
C−
C
N
C N
C
N
R1O−
O
R1 = −C4H9 :Dibutyl phosphate [DBP ]− Tricyanomethanide [TCM]− R1 = −CH3 : [Ac]−
S
O−
OR1
O
S C N−
CF3
N
C
N
C
N
N−
R1 = −CF3 : [CF3SO4]− T hiocyanate[SCN ]− 4,5−Dicyano−R1 = −C6H4CH3 : [TOS]− 2− (trif luoromethyl)−R1 = −OCH3 : [MSO4]− imidazolide[TDI]−R1 = −OC8H19 : [OSO4]−R1 = −O(C2H4O)2CH3 :[MDEGSO4]−
Towards Sustainable Solvent-Based Affinity Separations 44

333
LITERATURE REVIEW AND VISUALISATION
Sb− F
R1F
R1
F R1 O
O
B−
O
O
OOO
O
Cl− O
O
O
OHexaf luoroantimonite[SbF6]− Bis(oxalato)borate[BOB]− P erchlorate[ClO4]−
Table 3.3: The twenty anions, presented in twelve anion groups are included in the evalua-tion concerning the γ∞i of all solutes.
different monovalent cations show insignificant deviations independent of thecorresponding anions. This confirms the earlier statement done in subsubsec-tion 3.3.1.2. that monovalent cations without any additional functionalizationdo not affect the γ∞i significantly as compared to the effect that the anion hason γ∞i . Interchanging monovalent cations in an IL will therefore not alter theintermolecular interactions noticeably. This is also implied by Dománska etal.27, where they underscore only the effect of the anion and not of the cation.
The largest γ∞n−hexane is obtained using a small linear anion with a lack of neu-tral regions and a significant electronegativity122, for example thiocyanate[SCN]−.27,123,124 This allows for a highly structured IL with strong anion-cation interactions125 which induces strong net repulsion to neutral solutes.Anions with increasingly larger neutral regions, e.g. methylsulfate [MSO4]and octylsulfate [OSO4], mitigates these interactions and allow for a less struc-tured packing, hence lowering the γ∞n−hexane.
125
The net repulsive behavior of the ILs towards more polar solutes is less sig-nificant, due to mitigating Van der Waals interactions. It can be seen that themethylsulfate [MSO4]− anion induces larger γ∞benzene and γ∞acetone than otheranions. Lü et al.126 show that attractive interactions may occur on the C2-hydrogen adjacent to the sulfate structure, while the overall negative surfacerepels the negatively charged π-ring and the double-bonded oxygen of ben-zene and acetone, respectively. Together, these interactions result in a netrepulsion.
Although the γ∞chlorof orm induced by the [MSO4]− anion is not reported, it canbe seen from the γ∞chlorof orm in the [MDEGSO4]− containing IL that the sulfate
45 Towards Sustainable Solvent-Based Affinity Separations

333
LITERATURE REVIEW AND VISUALISATION
Figure 3.6: The γ∞i of (from left to right) n-hexane, benzene, chloroform, acetone andethanol for twenty anions at 298.15K.
group is repulsive towards the chlorinated solute. In the case of ethanol, an-ions with large neutral regions and a small tendency for hydrogen bonding,such as [FAP]− 127, are seen to induce the largest γ∞ethanol . Small anions capa-ble of hydrogen bonding result in a γ∞ethanol of unity or lower, for example for[DCA]− and [SCN]−.128,129
Based on the observations in this review, two main decisions can be made inthe pre-selection of anions in ILs. Both decisions affect the interactions inthe ILs. Firstly, the size of the anion affects the packing and the cation-anioninteraction intensity within the IL. Secondly, with the choice of the nature ofthe anion, hydrogen bond behavior can either be enhanced or suppressed.
Towards Sustainable Solvent-Based Affinity Separations 46

333
LITERATURE REVIEW AND VISUALISATION
3.4 Conclusion
An open-source γ∞i -database is compiled and presented in section 3.5, con-taining 77.173 γ∞i values for 268 solutes and 692 solvents. From this database,five solutes (n-hexane, benzene, chloroform, acetone and ethanol) were se-lected and evaluated in detail in this study. A data analysis algorithm waspresented which uses the Van ‘t Hoff equation to inter- and extrapolate γ∞ivalues at different conditions to the desired temperature, here 298.15K.
From the γ∞i of the five evaluated solutes in a wide range of molecular sol-vents and ionic liquids (ILs) various trends between the molecular solventstructure and the γ∞i were visualized. Using this visual overview, the ob-served trends within solvent families facilitate the pre-selection of solventswhen a particular γ∞i is targeted. This approach can be applied complemen-tary to brute force simulating thousands of potential solvents with simulationsoftware, and helps to better understand and interpret which of the solventsfound with such tools perform well. As the obtained γ∞i and observed trendswere explained according to the molecular structure of both solute and sol-vent and the intermolecular interactions they induce.
General conclusions that can be drawn based on the trend visualization arefirst, that increasing the solvent molecular size can strongly affect the γ∞i , es-pecially for solutes with much less intermolecular interaction abilities thanthe solvent family. This also holds for ionic liquids in which the ionic inter-actions present an additional type of intermolecular interaction. Second, theionic liquid section showed the importance of an appropriate anion selection,whereas the nature of the non-functionalized monovalent cation is of less im-portance. Besides the nature of the anion, also the molecular size of the anion,which can be altered independently from the cation, must be appropriatelyselected. Third, multivalent cations particularly show interesting potentialfor use in fluid separations, because ILs containing these cations show over-all lower activity coefficients at infinite dilution than their monovalent cationanalogs, thus improving the capacity without compromising the selectivity.
47 Towards Sustainable Solvent-Based Affinity Separations
333
LITERATURE REVIEW AND VISUALISATION
3.5 Supplementary Excel Sheet
The actual γ∞i database, attached as the SES, is present under the tab “RawData”, while all γ∞i used in the manuscript including the results from thedata analysis algorithm are present under the tab “Data Treatment”. This γ∞idatabase is available free of charge at https://www.scribd.com/document/-492160543/SES-Chapter-3, due to the fact this chapter is not yet published.
3.6 Nomenclature
γi = Activity Coefficient of compound iγ∞i = Infinite Dilution Activity Coefficient of compound i∆H∞i = Infinite Dilution Dissolution Enthalpy of compound i∆S∞i = Infinite Dilution Dissolution Entropy of compound i
κ =This value is obtained from the data regression method.(superscript)
[4BMP y]+ = 1-butyl-4-methylpyridinium[Ac]− = acetate[B(CN )4]− = tetracyanoborate[BF4]− = tetrafluoroborate[BMIM]+ = 1-butyl-3-methylimidazolium[BMMor]+ = 1-butyl-1-methylmorpholinium[BMP IP ]+ = 1-butyl-1-methylpiperidinium[BMP yr]+ = 1-butyl-1-methylpyrrolidinium[BOB]− = bis(oxalate)borate[CF3SO3]− = trifluoromethanesulfonate[ClO4]− = perchlorate[DBP ]− = dibutylphosphate[DCA]− = dicyanamide[EMIM]+ = 1-ethyl-3-methylimidazolium[EMMOR]+ = 1-ethyl-1-methylmorpholinium[FAP ]− = tris-(perfluoroalkyl)-trifluorophosphate[FSI]− = bis(fluorosulfonyl)imide
Towards Sustainable Solvent-Based Affinity Separations 48

333
LITERATURE REVIEW AND VISUALISATION
[HO −EMIM]+ = 1-(2-hydroxyethyl)-3-methylimidazolium[MDEGSO4]− = 2-(2-methoxyethoxy)ethylsulfate[MO −EMIM]+ = 1-(2-methoxyethyl)- 3-methylimidazolium[MO −EMP IP ]+ = 1-(2-methoxyethyl)- 3-methylpiperidinium[MSO4]− = methylsulfate[MTBDH]+ = methyl-1,3,5-triazabicyclo[4.4.0]dec-5-ene[NR1R2R3R4
]+ = (tetra-alkyl-)ammonium[NT f2]− = bis(trifluoromethanesulfonyl)imide[OMIM]+ = 1-octyl-3-methylimidazolium[OSO4]− = octylsulfate[P F6]− = hexafluorophosphonate[PR1R2R3R4
]+ = (tetra-alkyl-)phosphonium[R1CD]+ = (alkyl)cyclopenylium[R1DABCO]+ = (alkyl-)4-diaza[2.2.2]-bicyclooctanium[R1MTBDH]+ = (alkyl-)(alkyl-)guanidinium superbase[R1R2IM]+ = (dialkyl-)imidazolium[R1R2Mor]+ = (dialkyl-)morpholinium[R1R2P IP ]+ = (dialkyl-)piperidinium[nR1R2P y]+ = (1-alkyl-n-alkyl-)pyridinium[R1R2P yr]+ = (dialkyl-)pyrrolidinium[SbF6]− = hexafluoroantimonate[SCN ]− = thiocyanaat[SR1R2R3
]+ = (tri-alkyl-)sulphonium[TCD]+ = 1,2,3-Tris(diethylamino)-cyclopropenylium[TCM]− = tricyanomethanide[TDI]− = 4,5-dicyano-2-(trifluoromethyl)-imidazolium[TOS]− = tosylateCOSMO-RS = Conductor like Screening Model for Real SolventsDES’s = Deep Eutectic Solvents
di-cation =1,1’-[1,2-ethanediylbis(oxymethylene)]bis[3-octyl-1-imidazolium]
ILs = Ionic Liquidsmono-cation = 1-octyl-3-methylimidazolium or [OMIM]+
49 Towards Sustainable Solvent-Based Affinity Separations

333
LITERATURE REVIEW AND VISUALISATION
MOSCED = Modified Separation of Cohesive Energy Density modelS = Solvent (subscript)SES = Supplementary Excel Sheet
tri-cation =3,3’,3”-[1,2,3-propanetriyltris(oxymethylene)]tris[1-octyl-1-imidazolium]
TZVP = Triple Zeta Valence Plus Polarization
UNIFAC =Universal Quasichemical Functional-group Activity Coef-ficients
3.7 References
[1] A. A. Kiss, J.-P. Lange, B. Schuur, D. W. F. Brilman, A. G. van der Ham, and S. R. Kersten, “Separationtechnology–making a difference in biorefineries,” Biomass Bioenergy, vol. 95, pp. 296–309, 2016.
[2] D. S. Sholl and R. P. Lively, “Seven chemical separations to change the world,” Nature, vol. 532, no. 7600,pp. 435–437, 2016.
[3] M. Blahušiak, A. A. Kiss, K. Babic, S. R. Kersten, G. Bargeman, and B. Schuur, “Insights into the selectionand design of fluid separation processes,” Separation and purification technology, vol. 194, pp. 301–318,2018.
[4] T. Brouwer and B. Schuur, “Bio-based solvents as entrainers for extractive distillation in aro-matic/aliphatic and olefin/paraffin separation,” Green Chem., vol. 22, no. 16, pp. 5369–5375, 2020.
[5] M. Krummen, D. Gruber, and J. Gmehling, “Measurement of activity coefficients at infinite dilution insolvent mixtures using the dilutor technique,” Industrial & Engineering Chemistry Research, vol. 39, no. 6,pp. 2114–2123, 2000.
[6] T. Hiak, K. Kurihara, and K. Kojima, “Vapor-liquid equilibria for acetone+ chloroform+ methanol andconstituent binary systems at 101.3 kpa,” Journal of Chemical and Engineering Data, vol. 39, no. 4,pp. 714–719, 1994.
[7] G. N. Lewis, “The law of physico-chemical change,” in Proceedings of the American Academy of Arts andSciences, vol. 37, pp. 49–69, JSTOR, 1901.
[8] P. Alessi, M. Fermeglia, and I. Kikic, “Significance of dilute regions,” Fluid Phase Equilib., vol. 70, no. 2-3,pp. 239–250, 1991.
[9] S. Sandler, “Infinite dilution activity coefficients in chemical, environmental and biochemical engineer-ing,” Fluid Phase Equilib., vol. 116, no. 1-2, pp. 343–353, 1996.
[10] T. M. Letcher, “Activity coefficients at infinite dilution from gas–liquid chromatography,” in FaradaySymposia of the Chemical Society, vol. 15, pp. 103–112, Royal Society of Chemistry, 1980.
[11] J.-C. Lerol, J.-C. Masson, H. Renon, J.-F. Fabries, and H. Sannier, “Accurate measurement of activitycoefficient at infinite dilution by inert gas stripping and gas chromatography,” Industrial & EngineeringChemistry Process Design and Development, vol. 16, no. 1, pp. 139–144, 1977.
[12] D. Richon, P. Antoine, and H. Renon, “Infinite dilution activity coefficients of linear and branched alka-nes from c1 to c9 in n-hexadecane by inert gas stripping,” Industrial & Engineering Chemistry ProcessDesign and Development, vol. 19, no. 1, pp. 144–147, 1980.
[13] A. Hussam and P. W. Carr, “Rapid and precise method for the measurement of vapor/liquid equilibriaby headspace gas chromatography,” Anal. Chem., vol. 57, no. 4, pp. 793–801, 1985.
[14] J. Li and P. W. Carr, “Measurement of water-hexadecane partition coefficients by headspace gas chro-matography and calculation of limiting activity coefficients in water,” Anal. Chem., vol. 65, no. 10,pp. 1443–1450, 1993.
[15] C. A. Eckert and S. R. Sherman, “Measurement and prediction of limiting activity coefficients,” FluidPhase Equilib., vol. 116, no. 1-2, pp. 333–342, 1996.
[16] A. Paolo, F. Maurizio, and K. Ireneo, “A differential static apparatus for the investigation of the infinitely
Towards Sustainable Solvent-Based Affinity Separations 50

333
LITERATURE REVIEW AND VISUALISATION
diluted region,” Fluid Phase Equilib., vol. 29, pp. 249–256, 1986.[17] M. Gautreaux Jr and J. Coates, “Activity coefficients at infinite dilution,” AIChE J., vol. 1, no. 4, pp. 496–
500, 1955.[18] V. Dohnal and I. Horáková, “A new variant of the rayleigh distillation method for the determination of
limiting activity coefficients,” Fluid Phase Equilib., vol. 68, pp. 173–185, 1991.[19] V. Dohnal, “14 measurement of limiting activity coefficients using analytical tools,” Measurement of the
Thermodynamic Properties of Multiple Phases, p. 359, 2005.[20] A. Fredenslund, R. L. Jones, and J. M. Prausnitz, “Group-contribution estimation of activity coefficients
in nonideal liquid mixtures,” AIChE J., vol. 21, no. 6, pp. 1086–1099, 1975.[21] U. Weidlich and J. Gmehling, “A modified unifac model. 1. prediction of vle, he, and. gamma.. infin.,”
Industrial & engineering chemistry research, vol. 26, no. 7, pp. 1372–1381, 1987.[22] B. L. Larsen, P. Rasmussen, and A. Fredenslund, “A modified unifac group-contribution model for pre-
diction of phase equilibria and heats of mixing,” Industrial & engineering chemistry research, vol. 26,no. 11, pp. 2274–2286, 1987.
[23] M. H. Abraham, “Scales of solute hydrogen-bonding: their construction and application to physico-chemical and biochemical processes,” Chem. Soc. Rev., vol. 22, no. 2, pp. 73–83, 1993.
[24] J. H. Park and P. W. Carr, “Predictive ability of the mosced and unifac activity coefficient estimationmethods,” Anal. Chem., vol. 59, no. 21, pp. 2596–2602, 1987.
[25] F. Eckert and A. Klamt, “Fast solvent screening via quantum chemistry: Cosmo-rs approach,” AIChE J.,vol. 48, no. 2, pp. 369–385, 2002.
[26] T. Brouwer and B. Schuur, “Model performances evaluated for infinite dilution activity coefficients pre-diction at 298.15 k,” Industrial & Engineering Chemistry Research, vol. 58, no. 20, pp. 8903–8914, 2019.
[27] U. Domańska, M. Wlazło, and M. Karpińska, “Activity coefficients at infinite dilution of organic sol-vents and water in 1-butyl-3-methylimidazolium dicyanamide. a literature review of hexane/hex-1-eneseparation,” Fluid Phase Equilib., vol. 417, pp. 50–61, 2016.
[28] A. Marciniak, “Influence of cation and anion structure of the ionic liquid on extraction processes basedon activity coefficients at infinite dilution. a review,” Fluid Phase Equilib., vol. 294, no. 1-2, pp. 213–233,2010.
[29] A. Heintz, “Recent developments in thermodynamics and thermophysics of non-aqueous mixtures con-taining ionic liquids. a review,” The Journal of Chemical Thermodynamics, vol. 37, no. 6, pp. 525–535,2005.
[30] V. Dohnal, P. Vrbka, K. Řehák, A. Böhme, and A. Paschke, “Activity coefficients and partial molar excessenthalpies at infinite dilution for four esters in water,” Fluid Phase Equilib., vol. 295, no. 2, pp. 194–200,2010.
[31] G. Pierotti, C. Deal, and E. Derr, “Activity coefficients and molecular structure,” Industrial & EngineeringChemistry, vol. 51, no. 1, pp. 95–102, 1959.
[32] S. P. Verevkin, A. Y. Sazonova, A. K. Frolkova, D. H. Zaitsau, I. V. Prikhodko, and C. Held, “Separa-tion performance of biorenewable deep eutectic solvents,” Industrial & Engineering Chemistry Research,vol. 54, no. 13, pp. 3498–3504, 2015.
[33] N. Nkosi, K. Tumba, and S. Ramsuroop, “Measurements of activity coefficient at infinite dilution fororganic solutes in tetramethylammonium chloride+ ethylene glycol deep eutectic solvent using gas-liquid chromatography,” Fluid Phase Equilibria, vol. 462, pp. 31–37, 2018.
[34] N. Nkosi, K. Tumba, and S. Ramsuroop, “Tetramethylammonium chloride+ glycerol deep eutectic sol-vent as separation agent for organic liquid mixtures: Assessment from experimental limiting activitycoefficients,” Fluid Phase Equilibria, vol. 473, pp. 98–105, 2018.
[35] N. Nkosi, K. Tumba, and S. Ramsuroop, “Activity coefficients at infinite dilution of various solutes intetrapropylammonium bromide+ 1, 6-hexanediol deep eutectic solvent,” Journal of Chemical & Engineer-ing Data, vol. 63, no. 12, pp. 4502–4512, 2018.
[36] U. Domańska, M. Karpińska, A. Wiśniewska, and Z. Dabrowski, “Ammonium ionic liquids in extractionof bio-butan-1-ol from water phase using activity coefficients at infinite dilution,” Fluid Phase Equilib.,vol. 479, pp. 9–16, 2019.
[37] P. Vrbka and V. Dohnal, “Limiting activity coefficient measurements in binary mixtures ofdichloromethane and 1-alkanols (c1–c4),” Fluid Phase Equilib., vol. 411, pp. 59–65, 2016.
51 Towards Sustainable Solvent-Based Affinity Separations

333
LITERATURE REVIEW AND VISUALISATION
[38] J. Tellinghuisen, “Can you trust the parametric standard errors in nonlinear least squares? yes, withprovisos,” Biochimica et Biophysica Acta (BBA)-General Subjects, vol. 1862, no. 4, pp. 886–894, 2018.
[39] K. Murphy and S. Gill, “Calorimetric measurement of the enthalpy of dissolution of diketopiperazine inwater as a function of temperature,” Thermochimica acta, vol. 139, pp. 279–290, 1989.
[40] P. P. Syamala, B. Soberats, D. Görl, S. Gekle, and F. Würthner, “Thermodynamic insights into the entropi-cally driven self-assembly of amphiphilic dyes in water,” Chemical science, vol. 10, no. 40, pp. 9358–9366,2019.
[41] C. B. Castells, D. I. Eikens, and P. W. Carr, “Headspace gas chromatographic measurements of limitingactivity coefficients of eleven alkanes in organic solvents at 25 c. 1,” Journal of Chemical & EngineeringData, vol. 45, no. 2, pp. 369–375, 2000.
[42] Y. G. Dobrjakov, I. M. Balashova, and G. Maurer, “Experimental results for the limiting activity coeffi-cients in some binary and ternary mixtures of organic components,” Journal of Chemical & EngineeringData, vol. 45, no. 2, pp. 185–193, 2000.
[43] V. Dohnal and P. Vrbka, “Limiting activity coefficients in the 1-alkanol+ n-alkane systems: survey, crit-ical evaluation and recommended values, interpretation in terms of association models,” Fluid PhaseEquilib., vol. 133, no. 1-2, pp. 73–87, 1997.
[44] G. Tse and S. I. Sandler, “determination of infinite dilution activity coefficients and 1-octanol/waterpartition coefficients of volatile organic pollutants,” J. Chem. Eng. Data, vol. 39, no. 2, pp. 354–357,1994.
[45] R. K. Kuchhal, K. L. Mallik, and P. L. Gupta, “Studies on thermodynamics of solution by gas chro-matography: solubility measurements of hydrocarbons in cycloalkanols,” Can. J. Chem., vol. 55, no. 7,pp. 1273–1278, 1977.
[46] J.-P. Monfort, J. Vidal, and H. Renon, “N° 108.—coefficients d’activité a dilution infinie des hydrocar-bures dans deux familles de solvants les effets de la structure du solvant,” Journal de Chimie Physique,vol. 67, pp. 748–756, 1970.
[47] C. Deal and E. Derr, “Selectivity and solvency in aromatics recovery,” Industrial & Engineering ChemistryProcess Design and Development, vol. 3, no. 4, pp. 394–399, 1964.
[48] S. O’shea and R. Stokes, “Activity coefficients and excess partial molar enthalpies for (ethanol+ hexane)from 283 to 318 k,” The Journal of Chemical Thermodynamics, vol. 18, no. 7, pp. 691–696, 1986.
[49] A. Vega and J. Coca, “Activity coefficients at infinite dilution of organic compounds in acetonitrile andmethanol by liquid chromatography,” J. Liq. Chromatogr., vol. 13, no. 4, pp. 789–801, 1990.
[50] M. Boussaha, K. Khimeche, and A. Dahmani, “Activity coefficients at infinite dilution for hydrocarbonsin fatty alcohols determined by gas- liquid chromatography,” Journal of Chemical & Engineering Data,vol. 56, no. 4, pp. 850–858, 2011.
[51] R. Vilcu and E. Puricel, “Thermodynamic properties of some nonelectrolyte solutions at infinite dilutionby gas chromatography. ii-activity coefficient at infinite dilution,” Rev. Roum. Chim., vol. 43, no. 12,pp. 1121–1132, 1998.
[52] D. E. Martire and L. Z. Pollara, “Solute activity coefficients at infinite dilution and specific retentionvolumes measured by gas-liquid chromatography.,” J. Chem. Eng. Data, vol. 10, no. 1, pp. 40–43, 1965.
[53] E. Turek, R. A. Greenkorn, and K. Chao, “Infinite dilution activity coefficients for selected binary mix-tures of hydrocarbons, alcohols, and ketones,” J. Chem. Eng. Data, vol. 24, no. 4, pp. 296–298, 1979.
[54] P. Alessi, I. Kikic, A. Alessandrini, and M. Fermeglia, “Activity coefficients at infinite dilution by gas-liquid chromatography. 1. hydrocarbons and n-chloroparaffins in organic solvents,” J. Chem. Eng. Data,vol. 27, no. 4, pp. 445–448, 1982.
[55] D. Gruber, D. Langenheim, J. Gmehling, and W. Moollan, “Measurement of activity coefficients at in-finite dilution using gas- liquid chromatography. 6. results for systems exhibiting gas- liquid interfaceadsorption with 1-octanol,” Journal of Chemical & Engineering Data, vol. 42, no. 5, pp. 882–885, 1997.
[56] I. Landau, A. J. Belfer, and D. C. Locke, “Measurement of limiting activity coefficients using non-steady-state gas chromatography,” Industrial & engineering chemistry research, vol. 30, no. 8, pp. 1900–1906,1991.
[57] E. R. Thomas, B. A. Newman, T. C. Long, D. A. Wood, and C. A. Eckert, “Limiting activity coefficients ofnonpolar and polar solutes in both volatile and nonvolatile solvents by gas chromatography,” J. Chem.Eng. Data, vol. 27, no. 4, pp. 399–405, 1982.
Towards Sustainable Solvent-Based Affinity Separations 52

333
LITERATURE REVIEW AND VISUALISATION
[58] E. R. Thomas, B. A. Newman, G. L. Nicolaides, and C. A. Eckert, “Limiting activity coefficients fromdifferential ebulliometry,” Journal of Chemical and Engineering Data, vol. 27, no. 3, pp. 233–240, 1982.
[59] P. Vrbka, V. Dohnal, L. M. Trejo, and M. Costas, “Molecular shape effects on limiting activity coefficients:normal, branched and cyclic alkanes in 1-propanol or 2-propanol,” Fluid Phase Equilib., vol. 137, no. 1-2,pp. 133–140, 1997.
[60] L. Dallinga, M. Schiller, and J. Gmehling, “Measurement of activity coefficients at infinite dilution usingdifferential ebulliometry and non-steady-state gas-liquid chromatography,” J. Chem. Eng. Data, vol. 38,no. 1, pp. 147–155, 1993.
[61] C. S. Schacht, L. Zubeir, T. W. de Loos, and J. Gross, “Application of infinite dilution activity coeffi-cients for determining binary equation of state parameters,” Industrial & Engineering Chemistry Research,vol. 49, no. 16, pp. 7646–7653, 2010.
[62] G. M. Lobien and J. M. Prausnitz, “Infinite-dilution activity coefficients from differential ebulliometry,”Industrial & Engineering Chemistry Fundamentals, vol. 21, no. 2, pp. 109–113, 1982.
[63] M. J. Hait, C. L. Liotta, C. A. Eckert, D. L. Bergmann, A. M. Karachewski, A. J. Dallas, D. I. Eikens, J. J.Li, and P. W. Carr, “Space predictor for infinite dilution activity coefficients,” Industrial & engineeringchemistry research, vol. 32, no. 11, pp. 2905–2914, 1993.
[64] S. A. Wieczorek and J. Stecki, “Vapour pressures and thermodynamic properties of hexan-1-ol+ n-hexane between 298.230 and 342.824 k,” The Journal of Chemical Thermodynamics, vol. 10, no. 2, pp. 177–186, 1978.
[65] S. A. Wieczorek, “Vapour pressure and thermodynamic properties of dodecan-1-ol+ n-hexane between298.230 and 342.824 k,” The Journal of Chemical Thermodynamics, vol. 10, no. 2, pp. 187–194, 1978.
[66] S. A. Wieczorek, “Vapour pressures and thermodynamic properties of decan-1-ol+ n-hexane between283.160 and 333.151 k,” The Journal of Chemical Thermodynamics, vol. 11, no. 3, pp. 239–245, 1979.
[67] M. Gracia, F. Sánchez, P. Pérez, J. Valero, and C. G. Losa, “Vapour pressures of (butan-1-ol+ hexane) attemperatures between 283.10 k and 323.12 k,” The Journal of Chemical Thermodynamics, vol. 24, no. 5,pp. 463–471, 1992.
[68] M. Hongo, T. Tsuji, K. Fukuchi, and Y. Arai, “Vapor-liquid equilibria of methanol+ hexane, methanol+heptane, ethanol+ hexane, ethanol+ heptane, and ethanol+ octane at 298.15 k,” J. Chem. Eng. Data,vol. 39, no. 4, pp. 688–691, 1994.
[69] V. Rodriguez, J. Pardo, M. Lopez, F. Royo, and J. Urieta, “Vapor pressures of binary mixtures of hex-ane+ 1-butanol,+ 2-butanol,+ 2-methyl-1-propanol, or+ 2-methyl-2-propanol at 298.15 k,” J. Chem.Eng. Data, vol. 38, no. 3, pp. 350–352, 1993.
[70] S. G. Sayegh and G. A. Ratcliff, “Excess gibbs energies of binary systems of isopentanol and n-pentanolwith hexane isomers at 25. deg. c: measurement and prediction by analytical group solution model,” J.Chem. Eng. Data, vol. 21, no. 1, pp. 71–74, 1976.
[71] V. C. Smith and R. L. Robinson Jr, “Vapor-liquid equilibriums at 25. deg. in the binary mixtures formedby hexane, benzene, and ethanol,” J. Chem. Eng. Data, vol. 15, no. 3, pp. 391–395, 1970.
[72] J. N. Israelachvili, “Van der waals forces between particles and surfaces,” Intermolecular and surfaceforces, vol. 3, pp. 253–289, 2011.
[73] Y. J. Chang and E. W. Castner Jr, “Femtosecond dynamics of hydrogen-bonding solvents. formamideand n-methylformamide in acetonitrile, dmf, and water,” The Journal of chemical physics, vol. 99, no. 1,pp. 113–125, 1993.
[74] R. C. Castells, A. M. Nardillo, E. L. Arancibia, and M. R. Delfino, “Solution and adsorption thermody-namics in propylene glycol by gas chromatography: A comparative study with other polyhydroxylatedsolvents,” J. Chromatogr. A, vol. 259, pp. 413–422, 1983.
[75] A. N. Fletcher and C. A. Heller, “Self-association of alcohols in nonpolar solvents,” The Journal of PhysicalChemistry, vol. 71, no. 12, pp. 3742–3756, 1967.
[76] E. Arancibia and J. Catoggio, “Gas chromatographic study of solution and adsorption of hydrocarbonson glycols: I. diethylene glycol and triethylene glycol,” J. Chromatogr. A, vol. 197, no. 2, pp. 135–145,1980.
[77] E. Arancibia and J. Catoggio, “Gas chromatographic study of solution and adsorption of hydrocarbonson glycols: Ii. ethylene glycol,” J. Chromatogr. A, vol. 238, no. 2, pp. 281–290, 1982.
[78] R. Figueroa, E. Roig, and H. Szmant, “Infrared study on the self-association of dimethyl sulfoxide,”
53 Towards Sustainable Solvent-Based Affinity Separations

333
LITERATURE REVIEW AND VISUALISATION
Spectrochim. Acta, vol. 22, no. 4, pp. 587–592, 1966.[79] R. Brakaspathy and S. Singh, “Studies on self-association of nitromethane using a cndo/force method,”
J. Mol. Struct. THEOCHEM, vol. 164, no. 3-4, pp. 319–324, 1988.[80] H. H. Freedman, “Intramolecular h-bonds. i. a spectroscopic study of the hydrogen bond between hy-
droxyl and nitrogen,” J. Am. Chem. Soc., vol. 83, no. 13, pp. 2900–2905, 1961.[81] C. Laurence and M. Berthelot, “Observations on the strength of hydrogen bonding,” Perspect. Drug Dis-
covery Des., vol. 18, no. 1, pp. 39–60, 2000.[82] W. Klemperer, M. W. Cronyn, A. H. Maki, and G. C. Pimentel, “Infrared studies of the association of
secondary amides in various solvents,” J. Am. Chem. Soc., vol. 76, no. 22, pp. 5846–5848, 1954.[83] A. Laaksonen, P. Kusalik, and I. Svishchev, “Three-dimensional structure in water- methanol mixtures,”
J. Phys. Chem. A, vol. 101, no. 33, pp. 5910–5918, 1997.[84] K. N. Marsh, A. Deev, A. C. Wu, E. Tran, and A. Klamt, “Room temperature ionic liquids as replacements
for conventional solvents–a review,” Korean J. Chem. Eng., vol. 19, no. 3, pp. 357–362, 2002.[85] B. Schuur, T. Brouwer, D. Smink, and L. M. J. Sprakel, “Green solvents for sustainable separation pro-
cesses,” Current Opinion in Green and Sustainable Chemistry, vol. 18, pp. 57–65, 2019.[86] L. Crowhurst, P. R. Mawdsley, J. M. Perez-Arlandis, P. A. Salter, and T. Welton, “Solvent–solute interac-
tions in ionic liquids,” Physical Chemistry Chemical Physics, vol. 5, no. 13, pp. 2790–2794, 2003.[87] D. C. Khara and A. Samanta, “Fluorescence response of coumarin-153 in n-alkyl-n-
methylmorpholinium ionic liquids: Are these media more structured than the imidazolium ionicliquids?,” The Journal of Physical Chemistry B, vol. 116, no. 45, pp. 13430–13438, 2012.
[88] M. H. Ibrahim, M. Hayyan, M. A. Hashim, A. Hayyan, and M. K. Hadj-Kali, “Physicochemical propertiesof piperidinium, ammonium, pyrrolidinium and morpholinium cations based ionic liquids paired withbis (trifluoromethylsulfonyl) imide anion,” Fluid Phase Equilib., vol. 427, pp. 18–26, 2016.
[89] P. J. Griffin, J. L. Freyer, N. Han, N. Geller, X. Yin, C. D. Gheewala, T. H. Lambert, L. M. Campos, andK. I. Winey, “Ion transport in cyclopropenium-based polymerized ionic liquids,” Macromolecules, vol. 51,no. 5, pp. 1681–1687, 2018.
[90] C. Hanke, A. Johansson, J. Harper, and R. Lynden-Bell, “Why are aromatic compounds more solublethan aliphatic compounds in dimethylimidazolium ionic liquids? a simulation study,” Chem. Phys. Lett.,vol. 374, no. 1-2, pp. 85–90, 2003.
[91] C. Hanke, N. Atamas, and R. Lynden-Bell, “Solvation of small molecules in imidazolium ionic liquids: asimulation study,” Green Chem., vol. 4, no. 2, pp. 107–111, 2002.
[92] K. Fumino, A. Wulf, and R. Ludwig, “The cation–anion interaction in ionic liquids probed by far-infraredspectroscopy,” Angew. Chem. Int. Ed., vol. 47, no. 20, pp. 3830–3834, 2008.
[93] K. Paduszyński and M. Królikowska, “Effect of side chain functional group on interactions in ionic liq-uid systems: Insights from infinite dilution thermodynamic data,” The Journal of Physical Chemistry B,vol. 121, no. 43, pp. 10133–10145, 2017.
[94] B. Yoo, W. Afzal, and J. M. Prausnitz, “Henry’s constants and activity coefficients of some organic solutesin 1-butyl, 3-methylimidazolium hydrogen sulfate and in 1-methyl, 3-trimethylsilylmethylimidazoliumchloride,” The Journal of Chemical Thermodynamics, vol. 57, pp. 178–181, 2013.
[95] U. Domańska and A. Marciniak, “Activity coefficients at infinite dilution measurements for or-ganic solutes and water in the 1-hexyloxymethyl-3-methyl-imidazolium and 1, 3-dihexyloxymethyl-imidazolium bis (trifluoromethylsulfonyl)-imide ionic liquids—the cation influence,” Fluid Phase Equi-lib., vol. 286, no. 2, pp. 154–161, 2009.
[96] J. Zhang, Q. Zhang, B. Qiao, and Y. Deng, “Solubilities of the gaseous and liquid solutes and theirthermodynamics of solubilization in the novel room-temperature ionic liquids at infinite dilution by gaschromatography,” Journal of Chemical & Engineering Data, vol. 52, no. 6, pp. 2277–2283, 2007.
[97] K. Paduszyński and M. Królikowski, “An effect of cation’s cyano group on interactions between organicsolutes and ionic liquids elucidated by thermodynamic data at infinite dilution,” J. Mol. Liq., vol. 243,pp. 726–736, 2017.
[98] A.-L. Revelli, F. Mutelet, J.-N. Jaubert, M. Garcia-Martinez, L. M. Sprunger, W. E. Acree Jr, and G. A.Baker, “Study of ether-, alcohol-, or cyano-functionalized ionic liquids using inverse gas chromatogra-phy,” Journal of Chemical & Engineering Data, vol. 55, no. 7, pp. 2434–2443, 2010.
[99] A. Marciniak and M. Wlazło, “Activity coefficients at infinite dilution and physicochemical properties
Towards Sustainable Solvent-Based Affinity Separations 54

333
LITERATURE REVIEW AND VISUALISATION
for organic solutes and water in the ionic liquid 1-(2-hydroxyethyl)-3-methylimidazolium trifluorotris(perfluoroethyl) phosphate,” The Journal of Chemical Thermodynamics, vol. 64, pp. 114–119, 2013.
[100] E. F. Órfão, V. Dohnal, and A. Blahut, “Infinite dilution activity coefficients of volatile organic com-pounds in two ionic liquids composed of the tris (pentafluoroethyl) trifluorophosphate ([fap]) anion anda functionalized cation,” The Journal of Chemical Thermodynamics, vol. 65, pp. 53–64, 2013.
[101] F. Mutelet, J.-N. Jaubert, M. Rogalski, M. Boukherissa, and A. Dicko, “Thermodynamic properties ofmixtures containing ionic liquids: Activity coefficients at infinite dilution of organic compounds in 1-propyl boronic acid-3-alkylimidazolium bromide and 1-propenyl-3-alkylimidazolium bromide usinginverse gas chromatography,” Journal of Chemical & Engineering Data, vol. 51, no. 4, pp. 1274–1279,2006.
[102] Z. Bensaid, F. Mutelet, M. Bouroukba, and A. Negadi, “Experimental and theoretical study of interac-tion between organic compounds and 1-(4-sulfobutyl)-3-methylimidazolium based ionic liquids,” FluidPhase Equilib., vol. 378, pp. 34–43, 2014.
[103] H. Shirota and E. W. Castner, “Why are viscosities lower for ionic liquids with- ch2si (ch3) 3 vs- ch2c(ch3) 3 substitutions on the imidazolium cations?,” The Journal of Physical Chemistry B, vol. 109, no. 46,pp. 21576–21585, 2005.
[104] F. Mutelet, J.-C. Moise, and A. Skrzypczak, “Evaluation of the performance of trigeminal tricationic ionicliquids for separation problems,” Journal of Chemical & Engineering Data, vol. 57, no. 3, pp. 918–927,2012.
[105] F. Mutelet, P. Carre, and A. Skrzypczak, “Study of interaction between organic compounds and mono ordicationic oxygenated ionic liquids using gas chromatography,” Fluid Phase Equilib., vol. 387, pp. 59–72,2015.
[106] F. Mutelet, D. Alonso, S. Ravula, G. A. Baker, B. Jiang, and W. E. Acree Jr, “Infinite dilution activity coef-ficients of solutes dissolved in anhydrous alkyl (dimethyl) isopropylammonium bis (trifluoromethylsul-fonyl) imide ionic liquids containing functionalized-and nonfunctionalized-alkyl chains,” J. Mol. Liq.,vol. 222, pp. 295–312, 2016.
[107] K. T. Heydar, M. Nazifi, A. Sharifi, M. Mirzaei, H. Gharavi, and S. H. Ahmadi, “Determination of activitycoefficients at infinite dilution of solutes in new dicationic ionic liquids based on morpholine usinggas–liquid chromatography,” Chromatographia, vol. 76, no. 3-4, pp. 165–175, 2013.
[108] J. L. Anderson, R. Ding, A. Ellern, and D. W. Armstrong, “Structure and properties of high stabilitygeminal dicationic ionic liquids,” J. Am. Chem. Soc., vol. 127, no. 2, pp. 593–604, 2005.
[109] U. Domańska and K. Paduszyński, “Gas–liquid chromatography measurements of activity coefficients atinfinite dilution of various organic solutes and water in tri-iso-butylmethylphosphonium tosylate ionicliquid,” The Journal of Chemical Thermodynamics, vol. 42, no. 6, pp. 707–711, 2010.
[110] T. M. Letcher and P. Reddy, “Determination of activity coefficients at infinite dilution of organic solutesin the ionic liquid, tributylmethylphosphonium methylsulphate by gas–liquid chromatography,” Fluidphase equilibria, vol. 260, no. 1, pp. 23–28, 2007.
[111] U. Domańska, M. Wlazło, M. Karpińska, and M. Zawadzki, “New ionic liquid [p4, 4, 4, 4][ntf2] inbio-butanol extraction on investigation of limiting activity coefficients,” Fluid Phase Equilibria, vol. 475,pp. 89–94, 2018.
[112] P. J. Carvalho, S. P. Ventura, M. L. Batista, B. Schröder, F. Gonçalves, J. Esperança, F. Mutelet, and J. A.Coutinho, “Understanding the impact of the central atom on the ionic liquid behavior: phosphonium vsammonium cations,” The Journal of chemical physics, vol. 140, no. 6, p. 064505, 2014.
[113] T. M. Letcher and P. Reddy, “Determination of activity coefficients at infinite dilution of organic solutesin the ionic liquid, trihexyl (tetradecyl)-phosphonium tris (pentafluoroethyl) trifluorophosphate, by gas–liquid chromatography,” Fluid phase equilibria, vol. 235, no. 1, pp. 11–17, 2005.
[114] U. Domańska, M. Wlazło, M. Karpińska, and M. Zawadzki, “High selective water/butan-1-ol separa-tion on investigation of limiting activity coefficients with [p8, 8, 8, 8][ntf2] ionic liquid,” Fluid PhaseEquilibria, vol. 449, pp. 1–9, 2017.
[115] M. Wlazło, M. Karpińska, and U. Domańska, “Separation of water/butan-1-ol mixtures based on limitingactivity coefficients with phosphonium-based ionic liquid,” The Journal of Chemical Thermodynamics,vol. 113, pp. 183–191, 2017.
[116] E. L. Arancibia, R. C. Castells, and A. M. Nardillo, “Thermodynamic study of the behaviour of two
55 Towards Sustainable Solvent-Based Affinity Separations

333
LITERATURE REVIEW AND VISUALISATION
molten organic salts as stationary phases in gas chromatography,” Journal of Chromatography A, vol. 398,pp. 21–29, 1987.
[117] S. P. Verevkin, D. H. Zaitsau, B. Tong, and U. Welz-Biermann, “New for old. password to the thermody-namics of the protic ionic liquids,” Physical Chemistry Chemical Physics, vol. 13, no. 28, pp. 12708–12711,2011.
[118] J. Ziemblińska-Bernart, P. Bielecki, and W. Wasiak, “Measurements of activity coefficients at infinite di-lution for organic solutes in two quaternary ammonium-based ionic liquids [dda][clo4] and [dda][bf4],”Fluid Phase Equilibria, vol. 482, pp. 99–107, 2019.
[119] U. Domańska, A. Wiśniewska, Z. Dąbrowski, and M. Karpińska, “Separation of binary mixtures basedon limiting activity coefficients data using specific ammonium-based ionic liquid and modelling of ther-modynamic functions,” Fluid Phase Equilibria, vol. 460, pp. 155–161, 2018.
[120] W. E. Acree Jr, G. A. Baker, F. Mutelet, and J.-C. Moise, “Partition coefficients of organic compoundsin four new tetraalkylammonium bis (trifluoromethylsulfonyl) imide ionic liquids using inverse gaschromatography,” Journal of Chemical & Engineering Data, vol. 56, no. 9, pp. 3688–3697, 2011.
[121] H. Shirota, T. Mandai, H. Fukazawa, and T. Kato, “Comparison between dicationic and monocationicionic liquids: liquid density, thermal properties, surface tension, and shear viscosity,” Journal of Chemical& Engineering Data, vol. 56, no. 5, pp. 2453–2459, 2011.
[122] A. Blahut, M. Sobota, V. Dohnal, and P. Vrbka, “Activity coefficients at infinite dilution of organic solutesin the ionic liquid 1-ethyl-3-methylimidazolium methanesulfonate,” Fluid Phase Equilib., vol. 299, no. 2,pp. 198–206, 2010.
[123] F. Allal, F. Mutelet, A. Dahmani, and B. Saidat, “Measurements of activity coefficients at infinite dilutionof organic solutes in the ionic liquid 1-ethyl-3-methylimidazolium ethylphosphonate [emim][(eto)(h)po2] using gas-liquid chromatography,” J. Mol. Liq., vol. 220, pp. 243–247, 2016.
[124] A. Blahut, V. Dohnal, and P. Vrbka, “Interactions of volatile organic compounds with the ionic liq-uid 1-ethyl-3-methylimidazolium tetracyanoborate,” The Journal of Chemical Thermodynamics, vol. 47,pp. 100–108, 2012.
[125] A. M. Fernandes, M. A. Rocha, M. G. Freire, I. M. Marrucho, J. A. Coutinho, and L. M. Santos, “Evaluationof cation- anion interaction strength in ionic liquids,” The Journal of Physical Chemistry B, vol. 115, no. 14,pp. 4033–4041, 2011.
[126] R. Lü, J. Lin, and Z. Qu, “Theoretical study on interactions between ionic liquids and organosulfurcompounds,” Comput. Theor. Chem., vol. 1002, pp. 49–58, 2012.
[127] Q. Zhao, J. Eichhorn, W. R. Pitner, and J. L. Anderson, “Using the solvation parameter model to charac-terize functionalized ionic liquids containing the tris (pentafluoroethyl) trifluorophosphate (fap) anion,”Anal. Bioanal.Chem., vol. 395, no. 1, pp. 225–234, 2009.
[128] J. M. Pringle, J. Golding, C. M. Forsyth, G. B. Deacon, M. Forsyth, and D. R. MacFarlane, “Physicaltrends and structural features in organic salts of the thiocyanate anion,” J. Mater. Chem., vol. 12, no. 12,pp. 3475–3480, 2002.
[129] X. Xuan, M. Guo, Y. Pei, and Y. Zheng, “Theoretical study on cation–anion interaction and vibrationalspectra of 1-allyl-3-methylimidazolium-based ionic liquids,” Spectrochim. Acta, Part A, vol. 78, no. 5,pp. 1492–1499, 2011.
[130] X. Song, H. Hamano, B. Minofar, R. Kanzaki, K. Fujii, Y. Kameda, S. Kohara, M. Watanabe, S.-i. Ishiguro,and Y. Umebayashi, “Structural heterogeneity and unique distorted hydrogen bonding in primary am-monium nitrate ionic liquids studied by high-energy x-ray diffraction experiments and md simulations,”The Journal of Physical Chemistry B, vol. 116, no. 9, pp. 2801–2813, 2012.
Towards Sustainable Solvent-Based Affinity Separations 56


4444
4Solvent Pre-Selection for ExtractiveDistillation: a Ternary Margules
Approach"Everything must be made as simple as possible. But not simpler",Albert Einstein, (1879 - 1955)
This chapter is adapted from:Brouwer, T., Kersten, S.R.A., Bargeman, G. and Schuur, B. "Solvent Pre-Selection for Extractive Distillation using the Infinite Diluted Activity Coeffi-cient and the 3-component Margules Equation", (Ready for Submission)

4444
SOLVENT PRE-SELECTION FOR EXTRACTIVE DISTILLATION
4.1 Introduction
Several chemical separations have been identified by Sholl and Lively1 which,if replaced by more energy-efficient alternatives, would imply a huge leapforward towards a more sustainable society, considering that 10-15% of theworld’s energy usage originated from separation processes.1 Being membranescientists, Sholl and Lively proposed mostly membrane separations as possi-ble improvements, and for some of the mentioned separations the suggestedpotential gain is seen as too optimistic and a similar or even better gain canbe obtained, for instance, by using heat-pump assisted distillation.2 Never-theless, for some of the challenges, e.g. the aromatics/aliphatics separation,alternatives for traditional distillation appear to be interesting and solvent-based separation processes can be very effective and efficient.1
Most separations rely on the addition of heat in a distillation tower. Althoughthese towers are often highly effective2 and well-known to the engineers inindustry, if the mixture properties are unfavorable distillation can be a veryenergy-intensive and costly operation.3 A known modification in distillationoperation is the addition of an affinity agent, or solvent, to enhance the sep-aration. This modification is called extractive or azeotropic distillation de-pending on the volatility of the solvent.4
Separation processes using affinity agents are well-known in the chemical in-dustry. For instance, state-of-the-art solvents in the petroleum industry in-clude Sulfolane, N-methylpyrrolidone (NMP)5 and N,N-dimethylformamide(DMF).6 Although, statements vary regarding the toxicity of NMP7–12, it hasbeen shown to have adverse effect on the reproductive system.13 As these sol-vents are, at this moment, mentioned in chemical legislation (REACH)14 itrestricts in combination with environmental laws the presence of these chem-icals in consumer products. We see this as a trigger to search for green, alter-native chemicals with comparable properties, which can also enhance the en-ergy efficiency of distillation operations and thus cause energy-savings.14–17
Next to these specific examples, many new challenges will appear in the nextyears due to the required shift towards a more bio-based economy. For manyof the new separations in the bio-based processes, solvent-enhanced distilla-tions are likely to yield effective fractionation processes.
Towards Sustainable Solvent-Based Affinity Separations 60
4444
SOLVENT PRE-SELECTION FOR EXTRACTIVE DISTILLATION
Solvent identification is however not straightforward. Countless solvent se-lection or computer-aided molecular design (CAMD) strategies are alreadydescribed,18–20 however, these strategies generally require a specific interac-tive tool,21 the UNIFAC mathematical framework22,23 present in commercialsoftware such as Aspen Plus®, the COSMO-RS software22,24,25 and/or special-ized software to solve mixed-integer nonlinear programming (MINP) prob-lems.26
These approaches may not be accessible for all people who wish to developnew solvent-assisted distillations. Therefore, with this work, we present anextension to the pre-selection method based on visualization of trends ininfinite dilution activity coefficients, γ∞i .27 In that method, the visualizedtrends give good insights into solvent effects on the mixture constituents, butazeotrope and/or pinch point predictions cannot be done. Here, we proposeto use the 3-component Margules equation28 to simulate vapor-liquid equi-libria (VLE) under finite dilution conditions. Since the γ∞i database and thedata handling algorithm are open source,27 and the Margules equation nottoo difficult, anybody with basic knowledge on thermodynamic modeling cansimulate VLE using the Margules equation. This approach is thus very acces-sible to everyone and can be a valuable addition to the arsenal of selectionmethods already existing in literature.The 3-component Margules equation has been sparsely used in the field ofchemical engineering and solely Schulz and co-workers applied the equa-tion in computing mixed micellar systems.29–32 More frequently, the equationhas been used in the calculation of non-ideality of metal alloys,33 and sev-eral other geological studies of minerals.34–37 Therefore, the accuracy of theMargules equation in describing isothermal and isobaric binary and ternaryVLE behavior was first studied for a wide range of compound classes, af-ter which application of the method was studied for solvent screening inaromatic-aliphatic separations.
4.2 Methodology
In a previous study,27 we have developed a data handling algorithm to fitthe γ∞i at 298.15K, but also the infinite dilution enthalpy (∆H∞i ) and infinite
61 Towards Sustainable Solvent-Based Affinity Separations

4444
SOLVENT PRE-SELECTION FOR EXTRACTIVE DISTILLATION
dilution entropy (∆S∞i ) via extra- and interpolation of thermodynamic datafrom other temperatures using the Van ‘t Hoff equation, see Equation 4.1.
lnγ∞i =∆H∞iRT
−∆S∞iR
(4.1)
The temperature-dependent activity coefficient is essential in vapor-liquidequilibria (VLE) because it describes differences from Raoult’s law. As a re-sult of non-ideal behavior, phase splitting, pinch points and azeotropes maybe observed which may aid the separation, but may also make it more dif-ficult.38,39 In vapor-liquid separations, the temperature-dependent relativevolatility (αij ) is a key parameter and can be expressed as the product of theideal part and the non-ideal part, see Equation 4.2.40
Finite dilution: αij (T ) =P oiP oj
(γiγj
)S
= αIDij Sji (4.2a)
Infinite dilution: α∞ij (T ) =P oiP oj
γ∞iγ∞jS
= αIDij S∞ji (4.2b)
In Equation 4.2, the ideal part, αIDij , is the ratio of the pure component vaporpressures (P oi /P
oj ) and the non-ideal part, Sji , is also known as the selectivity
which is the ratio of the activity coefficients of both components. The ratio ofactivity coefficients is indicated with (γi /γj ) in the absence and with (γi /γj )Sin presence of a solvent. The binary relative volatility in the presence of asolvent is called pseudo-binary relative volatility. Equation 4.2a can also beapplied specifically in the infinite diluted case, this is indicated by the corre-sponding superscript in Equation 4.2b. Non-ideality in the gas phase can alsobe included via these fugacity coefficients (ϕi), although at moderate pres-sures the ratio of these fugacity coefficients is often close to one, so its contri-bution to the relative volatility is negligible. This assumption does not holdfor some systems, such as carboxylic acids, where non-ideal behavior in thevapor phase is significant.
The relative volatility as defined in Equation 4.2b reflects the maximum im-pact a solvent can have, and any solvent to feed ratio (S:F) lower than in-finite yields a lower impact. To gain insight into how much solvent would
Towards Sustainable Solvent-Based Affinity Separations 62

4444
SOLVENT PRE-SELECTION FOR EXTRACTIVE DISTILLATION
be needed, it is essential to understand what the target relative volatility forthe intended separation is. Based on the relative volatility (αij ) in absenceof the solvent, the opportunity for energy saving by applying a solvent-basedfluid separation was estimated by Blahušiak et al.,40 who distinguished threeoperation windows for distillation, see Figure 4.1. At αij < 1.3, distillation isenergy-intensive and applying a solvent-based technology can save significantenergy. For the regime 1.3 < αij < 10 the heat duty for ordinary distillationinitially still drops significantly at increasing relative volatility, but for αij > 3the energy reduction is much less. In the last regime, αij ≥ 10, single-stageevaporation may be applied.
Figure 4.1: Heat duty as function of relative volatility (αAB = αij ) for various molar frac-tions of the volatile compound (xFA) in the feed, normalized to the required heat to va-porize the more volatile compound. Lines: solid: (xFA)=0.1; dashed: (xFA)=0.5; dotted:(xFA)=0.9. Regimes A,B and C indicate conditions where (A) ordinary distillation is lessfavorable, (B) ordinary distillation suggested, (C) single stage evaporation suggested. (re-produced with permission from Blahušiak et al.40)
As the energy-requirement for distillation reduces considerably up to at a αijaround 3, but levels off at higher αij , it makes sense to aim for this αij . In-dustrial extractive distillation cases are known to operate at lower αij , suchas dimethylcarbonate-methanol separation41 with phenol (αij = 2.5), ethylbenzoate (αij = 2.2) and methyl isobutyl ketone (αij = 2.1) and the dimethoxy-methane/methanol separation with n,n-dimethylformamide (αij = 1.8)42, tho-
63 Towards Sustainable Solvent-Based Affinity Separations

4444
SOLVENT PRE-SELECTION FOR EXTRACTIVE DISTILLATION
ugh for this work, we aim for αij,min of 3 as suggested by Blahušiak et. al.40
Therefore in the solvent evaluations, increasing the αij to a value of 3 is thetarget. Because the vapor-liquid behavior studied in this work are far fromideal, we apply the Blahušiak et al.40 approach over the entire compositionalrange and determine the minimum relative volatility present in the non-idealvapor-liquid equilibria, αij,min, of the pseudo-binary VLE. An additional con-sideration for solvent pre-selection is the boiling point of the solvent. Thisshould be 40 to 50°C higher than the highest boiling solute, because this al-lows for easy recoverability of the high boiling solute from the solvent in therecovery operation.43
The minimal required selectivity that can be achieved at infinite dilution, andis defined by the required relative volatility of 3, follows from Equation 4.3.
S∞ji,min =α∞ij,min
αIDij(4.3)
This would allow for a straight determination of the S∞ji,min from the abun-dantly available vapor pressures and the open-source γ∞i data. However,as mentioned before, infinite dilution entails a tremendously high S:F ra-tio. This consequentially eliminates non-ideal effects, such as pinch pointand azeotrope formation. Therefore, a correlation between γ∞i and γi(x) thatwill be obtained with realistic S:F ratios is needed as well.The extended Margules equation can describe vapor-liquid equilibria basedon γ∞i , and Mukhopadhyay et al.28 generalized the well-known Margulesequation via a pth order Taylor series towards multi-component systems withboth symmetric and asymmetric binary interaction parameters. In Equa-tion 4.4, the relations for the 3-component Margules equation with asymmet-ric binary parameters are shown.
ln(γ1) = 2(x1x2A21 + x1x3A31) + x2
2A12 + x23A13 + x2x3B123 − 2GE
ln(γ2) = 2(x2x3A32 + x2x1A12) + x23A23 + x2
1A21 + x3x1B123 − 2GE
ln(γ3) = 2(x3x1A13 + x3x2A23) + x21A31 + x2
2A32 + x1x2B123 − 2GE(4.4a)
GE = x1x2(A12 + x1A21) + x1x3(x3A13 + x1A31)+
x2x3(x3A23 + x2A32) + x1x2x3B123(4.4b)
Towards Sustainable Solvent-Based Affinity Separations 64

4444
SOLVENT PRE-SELECTION FOR EXTRACTIVE DISTILLATION
B123 = 0.5(A12 +A21 +A13 +A31 +A23 +A32)−A123 (4.4c)
Aij = ln(γ∞i
)∗(4.4d)
*i is infinitely diluted in compound j.
Aij is a function of γ∞i which means the activity coefficient of compound iinfinitely diluted in compound j, and the liquid molar fractions (xi). B123is a ternary interaction term, which is dependent on the binary interactionterms A12, A21, A13, A31, A23 and A32, and the ternary interaction coefficientA123. This latter interaction coefficient cannot be completely defined by afunction of binary interaction coefficients.28 Here, it is assumed that A123 iszero, which is the same assumption as commonly made in, for instance, thenonrandom two-liquid (NRTL) model.44
This approach can be used to predict isothermal vapor-liquid equilibria, whereonly the γ∞i of that specific temperature is used but can also be used to predictisobaric VLE. In the latter procedure, the Van ‘t Hoff equation (Equation 4.1)is required to describe the temperature dependency of the γ∞i . In each case,pure component vapor pressures, which can be found in online libraries suchas the National Institute of Standard and Technology (NIST)45 or handbookssuch as Yaw’s Handbook are used.46
In the specific case of isobaric ternary vapor-liquid equilibria, the saturatedvapor pressures of each component are required as well as the ∆H∞i and ∆S∞iof the three components (solutes and solvent). For a ternary system thus six∆H∞i and six ∆S∞i parameters are required. Often all the ∆H∞i and ∆S∞i of thesolutes in each other and in a solvent are known, however the ∆H∞i and ∆S∞iof the solvent in the solutes is often missing. This frequently absent link canbe circumvented by assuming either an ideal solvent, the γ∞i of the solventin the solutes is then set at one (A31 = A32 = 0), or by assuming a symmet-ric behavior of the solute and solvent and thus assuming a partly symmetricMargules form (A31 = A13 and A32 = A23), in the screening methodology. Al-though both assumptions are fundamentally incorrect, this can have a mini-mal impact on the temperature profile for solvents with a vapor pressure thatstrongly deviates from the solutes. The assumption of the γ∞i for the solventwould not change the overall pressure of the system as the partial pressure
65 Towards Sustainable Solvent-Based Affinity Separations

4444
SOLVENT PRE-SELECTION FOR EXTRACTIVE DISTILLATION
of the solvent in extractive distillation is already small. The assumption canhowever impact the temperature profile if the solvent is (moderately) volatile,which subsequently can affect the temperature-dependency which impactsthe γ∞i of all compounds. Furthermore, because in the equations for γ1 andγ2 the coefficients A31 and A32 are present, for those solvents where these arenot available, both methods based on the assumptions have been compared.Of course, this can be avoided if all desired parameters are known and can beimplemented directly.
The validity of the Margules equation is evaluated in terms of the averagedeviation of parameter χ (ADχ), see Equation 4.5, which is either the vaporphase composition (y) within the xy-diagram or the temperature (T) in theTxy-diagram.
ADχ =
(∑Ndata |χexp −χpred |)
Ndata(4.5)
4.3 Separation Examples
This approach can be done independently of the chosen component. Fromprevious work,27 in which the γ∞i of 622 solutes and 999 solvents were col-lected, we selected several separations of classes of hydrocarbons that are in-dustrially relevant to establish the feasibility of this approach. As summa-rized in Table 4.1, the separation of complex hydrocarbon streams containingthe lowest boiling aromatic compound, benzene, and either a range of C4-to C9-alkanes in pyrolysis oil47 or a part of the hydrocarbon in naphtha48 isevaluated. As C4- and C5-alkanes are easily separable from benzene, they areexcluded from the assessment.Additionally, a paraffin/olefin example (n-hexane/1-hexene separation) hasbeen studied. Industrially, the n-butane/2-butene52,53 and n-propane/propy-lene52,54 separations are done, but for these systems limited γ∞i data are avail-able. Therefore, the C6-paraffin/olefin example was evaluated instead. Inthe last examples, removal of polar compounds from hydrocarbon streamsis evaluated in the methanol-to-olefins (MTO) process,49 and for upgradingpyrolysis oil50 or microalgal oil.51
Towards Sustainable Solvent-Based Affinity Separations 66

4444
SOLVENT PRE-SELECTION FOR EXTRACTIVE DISTILLATION
Table 4.1: The binary mixtures selected for each case and the industrial relevant processesthey represent.
Case Binary Compounds Separation Applications
1Benzene – C6− to C9−Alkane Separation of aromatic and aliphatic
compounds in for example, pyrolysisoil47 and naphtha.48n-Hexane – 1-Hexene
2n-Hexane - C1− to C3−Alkanol Oxygenate removal from hydrocarbon
streams, e.g. in the MTO process49 or toupgrade pyrolysis50 or microalgal oil51.n-Hexane - C1− to C2−Ketones
4.4 Results
4.4.1 Validation of the use of the 3-component Margules equation
In Figure 4.2, an overview is given regarding the accuracy of the Margulesequation. In the form of a heat (accuracy) map, the ADχ,
is given for 24 molecule-type combinations for isobaric and isothermal binaryVLE diagrams of which 55 and 35 systems, respectively, are assessed. For sys-tems that only contain molecules that are not hydrogen bond donating, theADy is < 5% and the ADT is < 4K. The ADy thus approaches typical experi-mental errors of several percentages.
Highly non-ideal systems such as alkane or aromatic and alcohol, or aque-ous systems, show more deviation (up to ADy > 10%) and are therefore lessreliable. The predictions of isobaric ternary VLE are more difficult, not onlythe accuracy of the experimental data may be less, due to the increased com-plexity of the systems, also fewer data points are available for comparison.In Figure 4.3, the validation of the ternary systems was differentiated into4 types of solvents; non-hydrogen bonding (NHB), hydrogen bond accepting(HBA), hydrogen bond donating (HBD) and ionic liquids (ILs).
Furthermore, 6 binary systems ranging from 2 NHB, HBA or HBD solutes,and each combination thereof NHB/HBA, NHB/HBD and HBA/HBD are dis-tinguished. A table is included in the ESI which shows each assessed system.The assumptions of either ideal solvent or (party) symmetric Margules be-tween the solvent and solutes were assessed and the results are displayed in
67 Towards Sustainable Solvent-Based Affinity Separations

4444
SOLVENT PRE-SELECTION FOR EXTRACTIVE DISTILLATION
Figure 4.2: A heat map overview regarding the average deviation of the concentration pro-file in isothermal vapor-liquid equilibria and the average deviation of the concentration andtemperature profile in isobaric vapor-liquid equilibria of binary systems. The number indi-cations in the ADχ matrices indicate the assessed number of systems.
Figure 4.3.As can be seen in Figure 4.3, no apparent preference can be made betweenboth assumptions. For that reason, the following methodology will be doneusing the (partly) symmetric Margules, which is physically more likely to beappropriate than the ideal solvent assumption as the latter is certainly not thecase.
4.4.2 Effect of S:F ratio on vapor-liquid equilibrium
By simulating ternary systems using the three-component Margules equationthe influence of the solvent-to-feed ratio (S:F ratio) on the quasi-binary VLEwas studied. As can be seen in Figure 4.4, where the quasi-binary VLE of n-heptane and benzene is shown, the effect of the solvent NMP increases whenthe S:F ratio is increased. In the binary mixture of n-heptane and benzene,benzene is the lowest boiling compound. Upon the addition of NMP, ben-
Towards Sustainable Solvent-Based Affinity Separations 68

4444
SOLVENT PRE-SELECTION FOR EXTRACTIVE DISTILLATION
Figure 4.3: A heat map overview regarding the average deviation of the concentration andtemperature profile in ternary isobaric vapor-liquid equilibria under (left) the ideal solventassumption and (right) the (partly) symmetric Margules assumption. The number indica-tions in the ADχ matrices indicate the assessed number of systems.
zene is entrained and n-heptane is preferentially expelled to the vapor phase.At a sufficient S:F ratio, the natural boiling order is even reversed and theolefin can be separated as the bottom product. By assuming that the solventfeed temperature is not affecting the temperature profile in the column, theassumption is made that the solvent is fed at the same temperature as the col-umn at the particular solvent feed stage.
This is only a single example showing that, using the 3-component Margulesequation in combination with the open-source γ∞i values, a proper assessmentof whether a solvent can increase the αij,min to at least 3 can be made succes-fully, and even the required S:F ratio can be estimated to some extent, as theexperimental S:F = 2.0 values coincide with the predicted S:F = 1.0 values.
4.4.3 Relationship between S∞ji,min and S : Fmin
The experimental determination of the γ∞i of various solutes in a solvent isoften extended with the determination of specific S∞ji which represents in-dustrial cases. Hence, the S∞ji is a commonly used indicator to establish the
performance of a solvent for particular separations.57,58 However, in practice,
69 Towards Sustainable Solvent-Based Affinity Separations

4444
SOLVENT PRE-SELECTION FOR EXTRACTIVE DISTILLATION
Figure 4.4: A xy-diagram of an example of the predicted solvent effect of n-methylpyrrolidone on the system n-heptane and benzene via the (partly symmetric) Mar-gules equation at 1 bar. It is compared to literature data of the binary system withoutn-methylpyrrolidone55 and with a solvent-to-feed ratio of 2.0.56
much lower S:F ratios are used and larger Sji values are required to be able tofacilitate the separation adequately, as can be seen in Figure 4.5. For this sce-nario, ternary isothermal VLE at 298.15K have been calculated in Figure 4.5,and it shows a direct correlation between these S∞ji and the S : Fmin, whichintuitively confirms that the S : Fmin can be lowered as the S∞ji increased.
It is apparent that solely interpreting a single S∞ji is useful, and more infor-mation, i.e. the required S:F ratio, can be obtained by combining S∞ji with theMargules equation.
4.4.4 Separation of Apolar Hydrocarbon Streams
In the category apolar hydrocarbon separations where solvents are neededand typically applied, we find two types of separations of unsaturated hydro-carbons from saturated hydrocarbons, i.e. aromatic – aliphatic separationsand olefin – paraffin separations. In both categories, when applying a solvent,typically the unsaturated hydrocarbons exhibit a lower value of the activitycoefficients in the solvent than the saturated hydrocarbons, which is due to the
Towards Sustainable Solvent-Based Affinity Separations 70
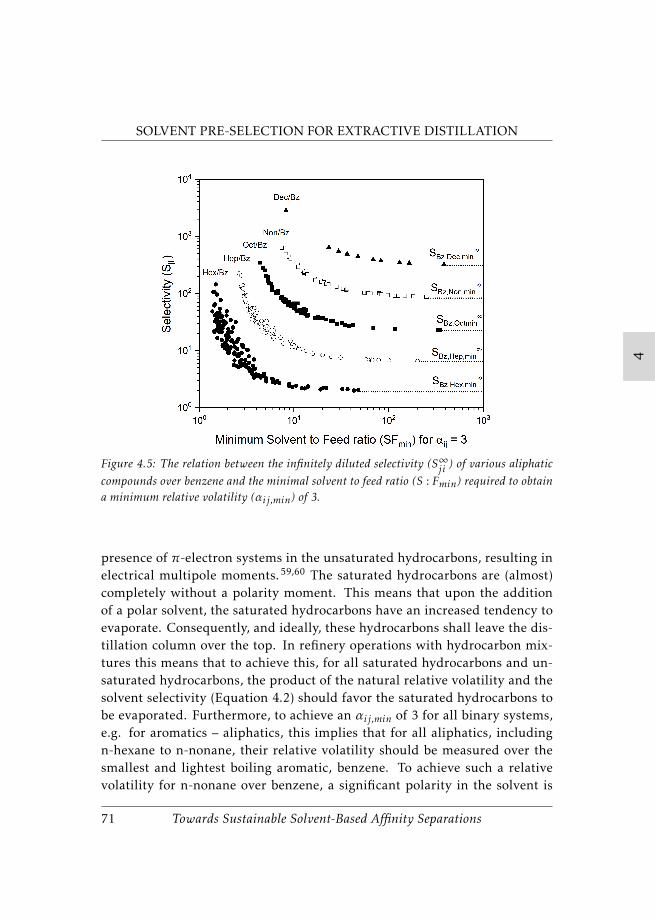
4444
SOLVENT PRE-SELECTION FOR EXTRACTIVE DISTILLATION
Figure 4.5: The relation between the infinitely diluted selectivity (S∞ji ) of various aliphaticcompounds over benzene and the minimal solvent to feed ratio (S : Fmin) required to obtaina minimum relative volatility (αij,min) of 3.
presence of π-electron systems in the unsaturated hydrocarbons, resulting inelectrical multipole moments.59,60 The saturated hydrocarbons are (almost)completely without a polarity moment. This means that upon the additionof a polar solvent, the saturated hydrocarbons have an increased tendency toevaporate. Consequently, and ideally, these hydrocarbons shall leave the dis-tillation column over the top. In refinery operations with hydrocarbon mix-tures this means that to achieve this, for all saturated hydrocarbons and un-saturated hydrocarbons, the product of the natural relative volatility and thesolvent selectivity (Equation 4.2) should favor the saturated hydrocarbons tobe evaporated. Furthermore, to achieve an αij,min of 3 for all binary systems,e.g. for aromatics – aliphatics, this implies that for all aliphatics, includingn-hexane to n-nonane, their relative volatility should be measured over thesmallest and lightest boiling aromatic, benzene. To achieve such a relativevolatility for n-nonane over benzene, a significant polarity in the solvent is
71 Towards Sustainable Solvent-Based Affinity Separations

4444
SOLVENT PRE-SELECTION FOR EXTRACTIVE DISTILLATION
needed to repel the alkane to a greater extent than benzene and to increasethe volatility of the alkane.27
4.4.4.1 Aromatic - Aliphatic Separation
The need to elevate the tendency of the heaviest aliphatic compounds to va-porize over that of benzene is a challenging matter. It has been shown atan infinite dilution that the repulsion towards aliphatic compounds increasesas the molecular weight of the compound increases. For instance, in the ILn-ethyl-n-methylmorpholinium dicyanamide61, [EMMOR]+[DCA]−, the γ∞iincreases from 608±30 for n-hexane to 2071±17 for n-nonane at 298.15K (theerrors stem from the data handling algorithm described in section 3.2). How-ever, the ideal relative volatility, αIDij , of the aliphatic compounds over ben-zene will decrease as a function of the molecular weight of the aliphatic com-pounds. The αIDij at 298.15 of n-hexane over benzene is 1.72, while n-nonane
over benzene is 2.69 · 10−2, indicating that an increasingly large selectivityis required to elevate the αij towards preferably 3. This is indicated in Fig-ure 4.5, where for the increasing molecular weight of the aliphatic component,the required S:F ratio to reach a relative volatility of 3, strongly increases. Forexample, at S∞ji =100 it follows that for n-hexane, n-heptane and n-octane therequired S:F ratio increases from approximately 15 for n-hexane via 30 forn-heptane to 80 for n-octane. For the larger aliphatic hydrocarbons n-nonaneand n-decane the desired volatility of 3 cannot be reached at this S∞ji , and evenhigher S∞ji,min are required to obtain the desired relative volatility.The most interesting molecular solvents and most significant ILs concerningthe minimum S:F required are highlighted in Figures 4.2 and 4.3. Since noknown γ∞i values are known for n-decane in benzene, it was not possible topredict solvent performances in the separation of the heaviest alkane, how-ever, the n-nonane – benzene system could be evaluated.
Sulfolene is predicted to be one of the most suitable molecular solvent as anentrainer, with a S : Fmin of 0.3 for hexane over benzene. However, sulfolenesare highly reactive and thermally unstable.62 Sulfolane is a widely used en-trainer that is also identified, and because it does not possess a carbon-carbondouble bond, it is much more stable than sulfolene. Other interesting molec-ular solvents in Table 4.2 are dimethylsulfoxide,63 n-formyl-morpholine,64
Towards Sustainable Solvent-Based Affinity Separations 72

4444
SOLVENT PRE-SELECTION FOR EXTRACTIVE DISTILLATION
Table 4.2: The minimal Solvent-to-Feed ratio (S : Fmin) required to obtain an αij,min of 3 ofthe top 15 molecular solvents for n-hexane to n-octane over benzene. No molecular solventwas found with an αij,min of 3 for the benzene/n-nonane case. The full list is present insection 4.5.
Molecular SolventMinimum Solvent-to-Feed Ratio for αij,min of 3n-Hexane n-Heptane n-Octane
Ethylene Glycol 1.3 4.12-pyrrolidone 0.3 1.6 17Sulfolene 0.3Sulfolane 0.5 1.9 4.9Ethylene Carbonate 0.5Dimethylsulfoxide 0.5 2.6Diethylene Glycol 0.6 1.8 4.7N-formylmorpholine 0.6 1.6Triethylene Glycol 0.7 2.0 6.2Tetraethylene Glycol 2.2Propylene Carbonate 0.7 2.5Glycerol 0.8 4.2N-methylpyrrolidone 0.8 3.2N,N-dimethylformamide 0.8Furfural 0.9 3.8
glycols,65,66 which are all known as industrially applied entrainer. This isa strong indication of the value of this methodology, as it correctly predictsthe potential of known industrial solvents. Solvents that are not preferred asentrainer (see section 4.5) for this separation are for example aniline (S:Fmin of4.5 for n-hexane/benzene) and n-pentanol (S:Fmin of 2.5 for n-hexane/benzene)Ethylene carbonate, being a possible negative emission solvent,67 may be suit-able as a potential alternative entrainer for this separation case. Ethylene car-bonate has already been mentioned as an extraction agent for the same pur-pose earlier.68
Each of the identified solvents in these assessments can be seen as the firststep in the selection process for alternative entrainers. As the S:F ratio is notthe only important parameter that affects the distillation operation, also thethermal stability, (see sulfolene62), tendency to hydrolyze in presence of water(see ethylene carbonate69), auto-decomposition (see ethylene glycol70), auto-catalytic decomposition (see dimethylsulfoxide71), the boiling point of the
73 Towards Sustainable Solvent-Based Affinity Separations

4444
SOLVENT PRE-SELECTION FOR EXTRACTIVE DISTILLATION
solvent, and more, need to be considered prior to the final solvent choice.
Table 4.3: The minimal Solvent-to-Feed ratio (S : Fmin) required to obtain an αij,min of 3 ofthe top 15 ILs for n-hexane to n-nonane over benzene. The full list is present in section 4.5.
Ionic liquid SolventMinimum Solvent-to-Feed Ratio for αij,min of 3n-Hexane n-Heptane n-Octane n-Nonane
[CpMPyr]+[SCN]− 0.8 1.3[(HOE)MIM]+[DCA]− 0.6 1.1 1.6[CpMIM]+[DCA]− 0.3 1.0 1.8[HO-EMPYR]+[DMPO4]− 1.8[(ClE)MIM]+[DCA]− 0.6 1.1 1.8[EMMOR]+[DCA]− 0.4 0.6 1.0 1.8[EMIM]+[SCN]− 0.3 0.7 1.2 1.8[HO-PPy]+[DCA]− 0.3 0.7 1.3 2.1[(HOP)MIM]+[DCA]− 0.3 0.7 1.3 2.2[(HOP)MMor]+[DCA]− 1.1 2.3[EMIM]+[BF4]− 0.4 0.8 1.6 2.4[EMIM]+[MDEGSO4]− 0.3 0.8 1.5 2.4[BMIM]+[Cl]− 1.2 2.5[BMIM]+[SCN]− 0.3 0.7 1.4 2.6[MP=IM]+[DCA]− 0.4 0.8 1.5 2.6
The removal of aromatic compounds from a hydrocarbon stream has been ex-tensively studied over the past decades and thus it is not surprising that nonew molecular solvents have been identified. This approach is however veryuseful in pre-selecting unconventional solvents, such as potential ILs. As canbe seen in Table 4.3, small polar anions, thiocyanate [SCN]−, dicyanamide[DCA]− and tetrafluoroborate [BF4]− are essential for strong repulsion of thealkanes. This observation is in agreement with the findings of Meindersma etal.72 Cation modifications can increase the repulsion even further as can beseen for the cyano-modified 1-(3-cyanopropyl)-1-methylpyrrolidinium [CpM-Pyr]+ 73 and 1-(2-hydroxyethyl)-3-methylimidazolium cation [(HOE)MIM]+.74
Nevertheless, the IL with the highest potential is 1-(3-cyanopropyl)-1-methylpyrrolidinium thiocyanate [CpMPyr]+[SCN]−. This IL has a cyano functionalgroup on both the cation and the anion, which elevates the αij,min of n-nonaneover benzene to 3 at a S:F ratio of only 1.3, and should therefore also be ade-quate to increase the relative volatility of lighter aliphatic compounds.
More recently, deep eutectic solvents (DES’s) have been identified as potential
Towards Sustainable Solvent-Based Affinity Separations 74

4444
SOLVENT PRE-SELECTION FOR EXTRACTIVE DISTILLATION
Table 4.4: The minimal Solvent-to-Feed ratio (S : Fmin) required to obtain an αij,min of theDES’s for n-hexane to n-octane over benzene. No DES was found with an αij,min of 3 forthe benzene/n-nonane case.
Deep eutectic Solvent pair (mole ratio)Minimum Solvent-to-Feed Ratio for αij,min of 3n-Hexane n-Heptane n-Octane
Choline Chloride:Glycerol (1:1) 0.3 0.7Choline Chloride:Ethylene Glycol (1:3) 0.4 0.7[N3333]+[Br]−:1,6-hexanediol (1:2) 0.8 3.0 14
aAbbreviations: [N3333]+[Br]− = tetrapropyl ammonium bromide
replacements of ILs. In Table 4.4, it can be seen that several DES’s can separaten-nonane as a distillate from benzene with a relative volatility of 3 as well.This indicates that among the DES’s groups potentially good entrainers forthese separations can be found as well, as indicated by i.a. Larriba et al.75
and Rodriguez et al.76 earlier.
4.4.4.2 Olefin – Paraffin Separation
The olefin and paraffin separation is a highly relevant industrial separationof apolar compounds. In Table 4.5, the assessment of the 1-hexene/n-hexanecase has been shown for several relative volatilities, e.g. 2.0 and 1.5, becauseno solvent was able to induce a relative volatility of 3 and no molecular solventis even seen to induce a relative volatility of 2.0. This indicates the difficultyof separating compounds based on the difference of a single unsaturated bondonly.
Table 4.5: The minimal Solvent-to-Feed ratio (S : Fmin) required to obtain an αij,min of 1.5of molecular solvents for 1-hexene over n-hexane.
Molecular SolventMinimum Solvent-to-Feed Ratio for 1-hexene/n-hexane caseαij,min = 1.5
2-pyrrolidone 3.7Dimethylsulfoxide 3.8N-formylmorpholine 4.8N,N-dimethylformamide 5.5N-methylpyrrolidone 14N-methylformamide 18
75 Towards Sustainable Solvent-Based Affinity Separations

4444
SOLVENT PRE-SELECTION FOR EXTRACTIVE DISTILLATION
Table 4.6: The minimal Solvent-to-Feed ratio (S : Fmin) required to obtain an αij,min of 1.5,2.0 and 2.5 of the top 15 ionic liquids for 1-hexene over n-hexane. The full list is present insection 4.5.
Ionic liquid SolventMinimum Solvent-to-Feed Ratio for 1-hexene/n-hexane caseαij,min = 1.5 αij,min = 2.0 αij,min = 2.5
[BMIM]+[SCN]− 1.1 2.5 5.9[BMPIP]+[SCN]− 1.3 3.2[EMIM]+[SCN]− 1.4 3.3[(HOP)MIM]+[DCA]− 1.6 4.0[HO-PPy]+[DCA]− 1.7 4.2[EMIM]+[NTf2]− 1.6 5.1[OMIM]+[NTf2]− 2.8 12 30[Py]+[EOESO4]− 1.7 12 30[4BMPy]+[SCN]− 1.7 14[(BzM)MIM]+[DCA]− 1.8 16[MP=IM]+[DCA]− 2.0 25[HO-PMMOR]+[NTf2]− 1.5 27[BMMOR]+[TCM]− 2.0[4BMPy]+[DCA]− 2.2[EMIM]+[TCM]− 2.2
*All abbreviations can be found in the symbol list.
Industrially, a process to separate n-butane/2-butene is licensed by Krupp-Koppers which uses a mixture of morpholine derivatives.48,52 Although thismorpholine mixture is not part of the prediction results, amides such as n-formylmorpholine, 2-pyrrolidone and n,n-dimethylformamide are indicatedwhereas n,n-dimethylformamide43,77 and n-formylmorpholine78 are shownto be adequate solvents. Dimethylsulfoxide is also predicted to be amongthe most preferred molecular solvents, which agrees with the liquid-liquidextraction patent by Carter et al.79 and the extractive distillation patent ofBerg80 which focuses on the separation of 1-heptene/n-heptane. For the samereasons as for the aromatic – aliphatic separation, ILs with small highly polaranions, see Table 4.6, e.g. thiocyanate [SCN]−, dicyanamide [DCA]− are pre-ferred, though also the more hydrophobic bis(trifluoromethylsulfonyl)imide[NTf2]− is seen to be able to induce a relative volatility of 1.5 or even 2.0.Overall, the ionic nature of the ILs allows for a lower S:F ratio to achieve therequired relative volatility due to the additional ion-dipole interactions withthe olefin.
Towards Sustainable Solvent-Based Affinity Separations 76

4444
SOLVENT PRE-SELECTION FOR EXTRACTIVE DISTILLATION
4.4.5 Deoxygenation of Hydrocarbon streams
The deoxygenation of hydrocarbon streams is required in several applications,e.g. for the upgrading of pyrolysis oil50,81 or microalgal oil51 and to purifythe product stream in the methanol to olefins process.49
Table 4.7: The minimal Solvent-to-Feed ratio (S : Fmin) required to obtain an αij,min of 3of the top 15 molecular solvents for methanol, ethanol, n-propanol, 2-propanol, acetone and2-butanone over n-hexane. The full list is present in section 4.5.
Molecular SolventMinimum Solvent-to-Feed Ratio for αij,min of 3MeOH EtOH PrOH IPA Acetone 2-Butanone
Dimethylsulfoxide 0.6 0.6 1.6 0.72-pyrrolidone 1.0 0.7 2.0 0.5N-methylformamide 1.7 0.9 2.3 0.9N-formylmorpholine 1.7 0.9 0.5 0.9 2.1 0.8Ethylene Carbonate 2.2 1.2 1.1N-methylpyrrolidone 2.4 1.2 0.6 15 1,4N-ethylacetamide 3.7 1.7 1.5 2.6N,N-dimethylacetamide 2.0 1.6n-Octadecanol 2.1 1.2 2.5Acetonitrile 2.2Octane-1,8-diamine 2.7 9.8N,N-Diethylacetamide 2.8 2.4 24n-Butanol 4.8 1.5 8.1Acetone 5.0 2.0Triphenyl Phosphate 8.2 15
MeOH = Methanol, EtOH = Ethanol, PrOH = n-Propanol, IPA = 2-propanol
Oxygenates are often removed via a reactive pathway, even though a purifica-tion pathway does not reduce the value of these oxygenated chemicals. Sev-eral patents describe ways of performing this purification with a solvent thathas a higher affinity towards the oxygenated solute82 or mentions methanol,83
propylene carbonate84 and dimethylsulfoxide85 as potential solvents. In ourpre-selection, indeed dimethylsulfoxide, alcohols and a carbonate are iden-tified as potential solvents for the deoxygenation of alcohols from hydrocar-bons, as can be seen in Table 4.7. Additionally, the aprotic oxygenates acetoneand 2-butanone are more difficult to remove than the protic oxygenates, dueto the absence of hydrogen bond donating capabilities. While the required S:Fratio is higher for the aprotic oxygenates, it is still possible to separate themfrom n-hexane.
77 Towards Sustainable Solvent-Based Affinity Separations

4444
SOLVENT PRE-SELECTION FOR EXTRACTIVE DISTILLATION
Table 4.8: The minimal Solvent-to-Feed ratio (S : Fmin) required to obtain an αij,min of 3 ofthe top 15 ILs for methanol, ethanol, n-propanol, 2-propanol, acetone and 2-butanone overn-hexane. The full list count be found in section 4.5.
Ionic liquids SolventMinimum Solvent-to-Feed Ratio for αij,min of 3MeOH EtOH PrOH IPA Acetone 2-Butanone
[N1122OH ]+[DEP]− 0.6 0.5 0.2 0.4 0.4[EMIM]+[EPO3H]− 0.7 0.5 0.5 0.5 0.6[BMPIP]+[SCN]− 0.7 0.5 0.8[HO-PMMOR]+[NTf2]− 0.7 0.5 0.3 0.5 0.5[BMIM]+[SCN]− 0.7 0.6 0.4[CpMIM]+[DCA]− 0.8 0.6 0.4 0.6 0.8[(HOP)MIM]+[DCA]− 0.8 0.6 0.8 0.7[EMIM]+[TFA]− 0.8 0.6 0.5[HO-PPy]+[DCA]− 0.8 0.6 0.5 0.6 0.7[BMIM]+[TOS]− 0.8 0.6 0.4 1.6[EMIM]+[SCN]− 0.8 0.6 0.5[EMIM]+[ESO4]− 0.8 0.6 0.5 1.1[4BMPy]+[SCN]− 0.8 0.6 1.0[MMIM]+[MSO4]− 0.8 0.4[(BzM)MIM]+[DCA]− 0.8 0.6 0.5 0.6 0.8
MeOH = Methanol, EtOH = Ethanol, PrOH = n-Propanol, IPA = 2-propanol
In Table 4.8, it can be seen that overall the separation of oxygenates is feasiblewith all kinds of ILs with a low S:F ratio. [N1122OH ]+[DEP]− is observed to bethe most efficient in increasing the relative volatility of all oxygenates to atleast 3. However, many other ILs can perform this task with a low S:F ratio aswell.
In Table 4.9, it is illustrated that DES’s are just as able to separate the oxy-genates from a hydrocarbon stream as ILs. An interesting observation is thatthe best performing IL contains a cation that is highly similar to the cholinecation in the DES’s. The strong repulsion of n-hexane can, among others,be attributed to the intermolecular cation-cation interaction through hydro-gen bonds within the [N1122OH ]+-based IL and choline chloride-based DES.86
The alcohols can participate in these hydrogen-bonding interactions, whichincreases the relative volatility even further. This also explains why a lowerrelative volatility is seen with ketones, as they cannot donate a hydrogen bond,and can only interact via hydrogen bond acceptation. The [N1122OH ]+-based
Towards Sustainable Solvent-Based Affinity Separations 78

4444
SOLVENT PRE-SELECTION FOR EXTRACTIVE DISTILLATION
IL incorporates a diethylphosphate, [DEP]−, anion, while the DES has ethy-lene glycol as the counterpart. These counterparts induce significantly differ-ent interactions, as [DEP]− primarily accepts hydrogen bonds, whereas ethy-lene glycol forms hydrogen-bond networks and can both accept- and donatehydrogen bonds.87 Overall, both solvents can entrain the oxygenates with lowS:F ratios and can facilitate the removal of hydrocarbons.
Table 4.9: The minimal Solvent-to-Feed ratio (S : Fmin) required to obtain an αij,min of 3of the DES’s for methanol, ethanol, n-propanol, 2-propanol, acetone and 2-butanone overn-hexane.
Deep Eutectic Solvent pair(mole ratio)
Minimum Solvent-to-Feed Ratio for αij,min of 3MeOH EtOH PrOH IPA Acetone 2-Butanone
CC:Ethylene Glycol (1:3) 0.4 0.9 0.8 0.7 0.7 0.5CC:Glycerol (1:1) 0.37 0.9 0.8 0.7 0.7 0.5CC:Glycerol (1:2) 0,9 0.7 0.5 0.7 2.4 1.3[N3333]+[Br]−:1,6-hexanediol(1:2)
1.2 0.7 0.4 0.8 0.7 1.1
CC = Choline Chloride, [N3333]+[Br]− = tetrapropylammonium bromide, MeOH = Methanol,EtOH = Ethanol, PrOH = n-Propanol, IPA = 2-propanol
Thus far, solvents have been discussed that increase the volatility of the n-hexane, while entraining the oxygenates. Considering that the oxygenates areminor compounds in many hydrocarbon streams, solvents that may inducethe opposite effect are also evaluated, see Table 4.10.
Apolar solvents, such as C6 to C16 alkanes, and to a lesser extent toluene andchloroform, are predicted to be able to separate the oxygenates as low-boilingsolute. This is in line with the earlier mentioned azeotropic distillation withalkanes,88–91 where the more polar compounds, in that case, water, could becollected over the top. At much higher S:F ratios, also the IL [BMIM]+[BOB]−
appears to repulse the oxygenates and entrain the hydrocarbon. This is un-expected, as the ionic nature of the ILs repel alkanes significantly, as couldbe seen in the apolar separations. However, the imidazolium cation in com-bination with the structurally similar bis(oxalato)borate [BOB]− may cause astrongly ordered cation-anion stacking92 and shields the charges sufficientlyto induce a relative volatility increase towards the oxygenates.
79 Towards Sustainable Solvent-Based Affinity Separations

4444
SOLVENT PRE-SELECTION FOR EXTRACTIVE DISTILLATION
Table 4.10: The minimal Solvent-to-Feed ratio (S : Fmin) required to obtain an αij,min of3 of solvents for n-hexane over methanol, ethanol, n-propanol, 2-propanol and acetone overn-hexane. No solvent was found with an αij,min of 3 for the n-hexane/2-butanone case.
SolventsMinimum Solvent-to-Feed Ratio for αij,min of 3MeOH EtOH PrOH IPA Acetone
Cyclohexane 1.5 3.3 4.8n-Heptane 1.5 3.1 6.8 3.7 2.7n-Octane 1.3 3.2 13 4.5 2.7n-Nonane 2.5n-Hexadecane 1.5 3.9Sunflower Oil 3.8Toluene 4.2Chloroform 9.0Diisodecyl phthalate 12Dibutyl tetrachlorophthalate 12n-Octadecanol 22[BMIM]+[BOB]− 28 27 27
MeOH = Methanol, EtOH = Ethanol, PrOH = n-Propanol, IPA = 2-propanol
4.5 Conclusions
An easily accessible approach is presented which uses an open-access γ∞ijdatabase and the 3-component Margules equation to allow fast pre-selectionof solvents, including ILs and deep eutectic solvents, for extractive distillationfluid separations at isobaric conditions. In this manner, binary and ternaryvapor-liquid equilibria can be determined under both isothermal and isobaricconditions and the solvent-to-feed effect can be determined. Generally, the in-finite diluted selectivity (S∞ji ) is often determined as an early indication of theapplicability of the solvent for certain industrial separations. Although theS∞ji gives a measure of the solvent’s affinity, it cannot evaluate non-idealitiesthat occur at finite concentration, e.g. the occurrence of an azeotrope or apinch-point. Nevertheless, via this approach, a strong correlation could bemade between the S∞ji and the minimal Solvent-to-Feed ratio (S : Fmin) atisothermal conditions.
The identified molecular solvents based on the proposed pre-selection method-ology for industrial examples are in line with literature results or are alreadyapplied on an industrial level. This indicates the validity of this pre-selection
Towards Sustainable Solvent-Based Affinity Separations 80

4444
SOLVENT PRE-SELECTION FOR EXTRACTIVE DISTILLATION
method. For each separation example, various solvents were identified. Itshould be realized that structurally similar solvents, for which the γ∞ij are notknown, can potentially perform similarly. It was seen that overall either smallpolar molecules (ethylene glycol, dimethylsulfoxide) and/or cyclic molecules(Sulfolane, n-formylmorpholine) are preferred. Potential alternatives to beconsidered are ethylene carbonate (already present in the evaluation), dihy-drolevoglucosenone15 and γ-valerolactone.93 The next step is to investigatethese molecules to additional criteria such as thermal stability, tendency tohydrolyze in presence of water, auto(catalytic)-decomposition and the theboiling point of the solvent, before the final solvent choice can be made.
The method has also proven to be useful in the pre-selection of ILs, and poten-tially DES’s. In the vast variety of possible combinations, the morpholiniumand the ammonium-type cation were identified to have the highest potentialto increase the relative volatilities. The similar ammonium-based ILs/DES’sare highly interesting and should be the first point of attention in new solventdevelopment, based on the choline chloride-based DES and [N−1122OH ]-basedIL comparison shown. The morpholinium cation is also seen to exhibit prefer-ential behavior and as Germani et al.94 have shown, also structurally similarDES’s can be made containing a morpholinium-type HBA. Although more γ∞ijvalues of DES’s are required to evaluate more of these solvents, their potentialwas shown for aromatic/aliphatic separations.
81 Towards Sustainable Solvent-Based Affinity Separations

4444
SOLVENT PRE-SELECTION FOR EXTRACTIVE DISTILLATION
4.6 Electronic Supplementary Information
All values and errors of the γ∞i used for the methodology used in this Chapterare the same as used in chapter 3.
All results concerning the determination of the S:Fmin is available free ofcharge at https://www.scribd.com/document/492159366/ESI-Chapter-4, dueto the fact this chapter is not yet published.
4.7 Nomenclature
[(BzM)MIM]+ = 1-benzyl-3-methylimidazolium[(ClE)MIM]+ = 1-(2-chloroethyl)-3-methylimidazolium[(HOE)MIM]+ = 1-(2-hydroxyethyl)-3-methylimidazolium[HO −EMIM]+ = 1-(2-hydroxyethyl)-3-methylimidazolium[(HOP )MIM]+ = 1-(3-hydroxypropyl)-3-methylimidazolium[(HOP )MMor]+ = 1-(3-hydroxypropyl)-1-methylmorpholinium[HO − PMMor]+ = 1-(3-hydroxypropyl)-1-methylmorpholinium[4BMP y]+ = 4-methyl-n-butylpyridinium[BMIM]+ = 1-butyl-3-methylimidazolium[BMMOR]+ = 1-butyl-1-methylmorpholinium[BMP IP ]+ = 1-butyl-1-methylpiperidinium[BMP yr]+ = 1-butyl-1-methylpyrrolidinium[CpMIM]+ = 1-(3-cyanopropyl)-1-methylimidazolium[CpMP yr]+ = 1-(3-cyanopropyl)-1-methylpyrrolidinium[EMIM]+ = 1-ethyl-3-methylimidazolium[EMMOR]+ = 1-ethyl-1-methylmorpholinium[HO −EMP yr]+ = 1-hydroxyethyl-1-methylpyrrolidinium[HO − P P y]+ = 1-(3-Hydroxypropyl)pyridinium[MMIM]+ = 1,3-dimethylimidazolium[MP = IM]+ = 1-allyl-3-methylimidazolium[N1,1,1,2OH ]+ = trimethylhydroxyethyl ammonium or choline[N1,1,2,2OH ]+ = dimethylethylhydroxyethyl ammonium
Towards Sustainable Solvent-Based Affinity Separations 82

4444
SOLVENT PRE-SELECTION FOR EXTRACTIVE DISTILLATION
[N3,3,3,3]+ = tetrapropyl ammonium[OMIM]+ = 1-octyl-3-methylimidazolium[P y]+ = pyridinium[BF4]− = tetrafluoroborate[BOB]− = bis(oxalato)borate[Br]− = bromide[Cl]− = chloride[DCA]− = dicyanamide[DEP ]− = diethylphosphate[EOESO4]− = ethoxyethylsulfate[EPO3H]− = ethylphosphonate[ESO4]− = ethylsulfate[LA]− = lactate[MDEGSO4]− = diethylenegycol monomethyl ether sulfate[MSO3]− = methylsulfonate[MSO4]− = methylsulfate[NT f2]− = bis(trifluoromethylsulfonyl)imide[SCN ]− = thiocyanate[TCM]− = tricyanomethanide[T FA]− = trifluoroacetateAADT = average deviation of temperatureAADx = average deviation of concentration
Aij =binary interaction coefficient between compounds iand j
Aijk =ternary interaction coefficient between compounds, i,j and k
αIDij = ideal relative volatilityαij = relative volatility of compound i over compound j
αij,min =minimum relative volatility of compound i over com-pound j
Bijk =ternary interaction term between compounds i, j andk
CAMD = computer-aided molecular designCC = choline chloride or [N1,1,1,2OH ]+[Cl]−
COSMO-RS = conductor like screening model for real solvents
83 Towards Sustainable Solvent-Based Affinity Separations

4444
SOLVENT PRE-SELECTION FOR EXTRACTIVE DISTILLATION
∆H∞i =molar enthalpy at infinite dilution of compound i insolvent j
∆S∞i =molar entropy at infinite dilution of compound i in sol-vent j
DES = deep eutectic solventDMF = n,n-dimethylformamideγi = activity coefficient of compound iγ∞i = infinite dilution activity coefficient of compound iGE = excess Gibbs energy termHBA = hydrogen bond acceptorHBD = hydrogen bond donorIL = ionic liquidMINP = mixed-integer nonlinear programmingN = number of data points or systemsNHB = non hydrogen bondingNIST = national institute of standard and technologyNMP = n-methylpyrrolidoneP oi = saturation vapor pressure of compound i (mbar)R = universal gas constant
REACH =registration, evaluation, authorisation and restrictionof chemicals
S (subscript) = solventS:F = solvent-to-feed ratio (mole basis)S : Fmin = minimum solvent-feed ratio (mole basis)Sji = selectivity of compound j over compound iSji,min = minimum Selectivity of compound j over compound i
S∞ji,min =minimum Selectivity of compound j over compound Iat infinite dilution
UNIFAC =universal quasichemical functional-group activity coef-ficients
VLE = vapor-liquid equilibriumχexperimental = experimental pointxi = molar fraction of compound iχmodel = modeled pointϕi = fugacity coefficient of compound i
Towards Sustainable Solvent-Based Affinity Separations 84
4444
SOLVENT PRE-SELECTION FOR EXTRACTIVE DISTILLATION
4.8 References
[1] D. S. Sholl and R. P. Lively, “Seven chemical separations to change the world,” Nature, vol. 532, no. 7600,pp. 435–437, 2016.
[2] R. Agrawal and R. T. Gooty, “Misconceptions about efficiency and maturity of distillation,” AIChE Journal,p. e16294.
[3] M. Blahušiak, A. A. Kiss, S. R. Kersten, and B. Schuur, “Quick assessment of binary distillation efficiencyusing a heat engine perspective,” Energy, vol. 116, pp. 20–31, 2016.
[4] J. D. Seader, E. J. Henley, and D. K. Roper, Separation process principles, vol. 25. Wiley New York, 1998.[5] M. Fahim and A. Elkilani, “Prediction of optimum composition of the mixed solvent n-
methylpyrrolidone/ethylene glycol for the extraction of aromatics,” Separation Science and Technology,vol. 25, no. 13-15, pp. 1803–1815, 1990.
[6] Z. Lei, R. Zhou, and Z. Duan, “Process improvement on separating c4 by extractive distillation,” ChemicalEngineering Journal, vol. 85, no. 2-3, pp. 379–386, 2002.
[7] M. E. Andersen, R. A. Jones, R. G. Mehl, T. A. Hill, L. Kurlansik, and L. J. Jenkins Jr, “The inhalationtoxicity of sulfolane (tetrahydrothiophene-1, 1-dioxide),” Toxicology and applied pharmacology, vol. 40,no. 3, pp. 463–472, 1977.
[8] H. Senoh, S. Aiso, H. Arito, T. Nishizawa, K. Nagano, S. Yamamoto, and T. Matsushima, “Carcinogenicityand chronic toxicity after inhalation exposure of rats and mice to n, n-dimethylformamide,” Journal ofoccupational health, vol. 46, no. 6, pp. 429–439, 2004.
[9] A. Jouyban, M. A. A. Fakhree, and A. Shayanfar, “Review of pharmaceutical applications of n-methyl-2-pyrrolidone,” Journal of Pharmacy & Pharmaceutical Sciences, vol. 13, no. 4, pp. 524–535, 2010.
[10] E. A. Greene, L. M. Gieg, D. L. Coy, and P. M. Fedorak, “Sulfolane biodegradation potential in aquifersediments at sour natural gas plant sites,” Water research, vol. 32, no. 12, pp. 3680–3688, 1998.
[11] S. Cai, T. Cai, S. Liu, Q. Yang, J. He, L. Chen, and J. Hu, “Biodegradation of n-methylpyrrolidone by para-coccus sp. nmd-4 and its degradation pathway,” International Biodeterioration & Biodegradation, vol. 93,pp. 70–77, 2014.
[12] World Health Organization, “Concise international chemical assessment document 35 n-methyl-2-pyrrolidone,” World Health Organization, 2001.
[13] K. Sitarek and J. Stetkiewicz, “Assessment of reproductive toxicity and gonadotoxic potential of n-methyl-2-pyrrolidone in male rats,” International journal of occupational medicine and environmental health, vol. 21,no. 1, pp. 73–80, 2008.
[14] L. Bergkamp and N. Herbatschek, “Regulating chemical substances under reach: the choice betweenauthorization and restriction and the case of dipolar aprotic solvents,” Review of European, Comparative &International Environmental Law, vol. 23, no. 2, pp. 221–245, 2014.
[15] T. Brouwer and B. Schuur, “Bio-based solvents as entrainers for extractive distillation in aro-matic/aliphatic and olefin/paraffin separation,” Green Chemistry, 2020.
[16] B. Schuur, T. Brouwer, D. Smink, and L. M. J. Sprakel, “Green solvents for sustainable separation pro-cesses,” Current Opinion in Green and Sustainable Chemistry, vol. 18, pp. 57–65, 2019.
[17] M. Skiborowski, “Process synthesis and design methods for process intensification,” Current Opinion inChemical Engineering, vol. 22, pp. 216–225, 2018.
[18] A. S. Alshehri, R. Gani, and F. You, “Deep learning and knowledge-based methods for computer aidedmolecular design–toward a unified approach: State-of-the-art and future directions,” arXiv preprintarXiv:2005.08968, 2020.
[19] R. Gani, B. Nielsen, and A. Fredenslund, “A group contribution approach to computer-aided moleculardesign,” AIChE Journal, vol. 37, no. 9, pp. 1318–1332, 1991.
[20] P. M. Harper, R. Gani, P. Kolar, and T. Ishikawa, “Computer-aided molecular design with combined molec-ular modeling and group contribution,” Fluid Phase Equilibria, vol. 158, pp. 337–347, 1999.
[21] P. M. Piccione, J. Baumeister, T. Salvesen, C. Grosjean, Y. Flores, E. Groelly, V. Murudi, A. Shyadligeri,O. Lobanova, and C. Lothschutz, “Solvent selection methods and tool,” Organic Process Research & Devel-opment, vol. 23, no. 5, pp. 998–1016, 2019.
[22] P. Kolář, J.-W. Shen, A. Tsuboi, and T. Ishikawa, “Solvent selection for pharmaceuticals,” Fluid PhaseEquilibria, vol. 194, pp. 771–782, 2002.
85 Towards Sustainable Solvent-Based Affinity Separations

4444
SOLVENT PRE-SELECTION FOR EXTRACTIVE DISTILLATION
[23] E. J. Pretel, P. A. López, S. B. Bottini, and E. A. Brignole, “Computer-aided molecular design of solventsfor separation processes,” AIChE Journal, vol. 40, no. 8, pp. 1349–1360, 1994.
[24] F. Eckert and A. Klamt, “Fast solvent screening via quantum chemistry: Cosmo-rs approach,” AIChEJournal, vol. 48, no. 2, pp. 369–385, 2002.
[25] J. Scheffczyk, C. Redepenning, C. M. Jens, B. Winter, K. Leonhard, W. Marquardt, and A. Bardow, “Mas-sive, automated solvent screening for minimum energy demand in hybrid extraction–distillation usingcosmo-rs,” Chemical Engineering Research and Design, vol. 115, pp. 433–442, 2016.
[26] T. Zhou, K. McBride, S. Linke, Z. Song, and K. Sundmacher, “Computer-aided solvent selection and designfor efficient chemical processes,” Current Opinion in Chemical Engineering, vol. 27, pp. 35–44, 2020.
[27] T. Brouwer, S. Kersten, G. Bargeman, and B. Schuur, “Trends in solvent impact on infinite dilution activitycoefficients of solutes reviewed and visualized using an algorithm to support selection of solvents forgreener fluid separations,” Separation and Purification Technology, (In progress).
[28] B. Mukhopadhyay, S. Basu, and M. J. Holdaway, “A discussion of margules-type formulations for mul-ticomponent solutions with a generalized approach,” Geochimica et Cosmochimica Acta, vol. 57, no. 2,pp. 277–283, 1993.
[29] E. P. Schulz and G. A. Durand, “Equation oriented mixed micellization modeling based on asymmetricmargules-type formulations,” Computers & Chemical Engineering, vol. 87, pp. 145–153, 2016.
[30] R. B. Pereyra, E. P. Schulz, G. A. Durand, J. L. Rodriguez, R. M. Minardi, H. A. Ritacco, and P. C. Schulz,“Equation-oriented mixed micellization modeling of a subregular ternary surfactant system with poten-tial medical applications,” Industrial & Engineering Chemistry Research, vol. 56, no. 39, pp. 10972–10980,2017.
[31] P. Serafini, M. F. Leyes, R. B. Pereyra, E. P. Schulz, G. A. Durand, P. C. Schulz, H. A. Ritacco, et al., “Theaqueous triton x-100–dodecyltrimethylammonium bromidemicellar mixed system. experimental resultsand thermodynamic analysis,” Colloids and Surfaces A: Physicochemical and Engineering Aspects, vol. 559,pp. 127–135, 2018.
[32] R. B. Pereyra, G. A. Durand, M. F. Leyes, H. Ritacco, and E. P. Schulz, “Homologous mixed micellar sys-tems with non-ideal and asymmetric thermodynamic behavior,” Colloids and Surfaces A: Physicochemicaland Engineering Aspects, p. 124626, 2020.
[33] A. Rohrbach and M. W. Schmidt, “Redox freezing and melting in the earth’s deep mantle resulting fromcarbon–iron redox coupling,” Nature, vol. 472, no. 7342, pp. 209–212, 2011.
[34] C. DeCapitani and M. Kirschen, “A generalized multicomponent excess function with application to im-miscible liquids in the system cao-sio2-tio2,” Geochimica et cosmochimica acta, vol. 62, no. 23-24, pp. 3753–3763, 1998.
[35] R. T. Pabalan and F. P. Bertetti, “Experimental and modeling study of ion exchange between aqueoussolutions and the zeolite mineral clinoptilolite,” Journal of solution chemistry, vol. 28, no. 4, pp. 367–393,1999.
[36] M. Holdaway, “Application of new experimental and garnet margules data to the garnet-biotite geother-mometer,” American Mineralogist, vol. 85, no. 7-8, pp. 881–892, 2000.
[37] C.-M. Wu, J. Zhang, and L.-D. Ren, “Empirical garnet–biotite–plagioclase–quartz (gbpq) geobarometry inmedium-to high-grade metapelites,” Journal of Petrology, vol. 45, no. 9, pp. 1907–1921, 2004.
[38] A. A. Kiss, S. J. F. Landaeta, and C. A. I. Ferreira, “Towards energy efficient distillation technologies–making the right choice,” Energy, vol. 47, no. 1, pp. 531–542, 2012.
[39] M. Doherty and M. Malone, “Conceptual design of distillation systems mcgraw-hill,” New York, 2001.[40] M. Blahušiak, A. A. Kiss, K. Babic, S. R. Kersten, G. Bargeman, and B. Schuur, “Insights into the selection
and design of fluid separation processes,” Separation and purification technology, vol. 194, pp. 301–318,2018.
[41] C.-C. Hu and S.-H. Cheng, “Development of alternative methanol dimethyl carbonate separation sys-tems by extractive distillation—a holistic approach,” Chemical Engineering Research and Design, vol. 127,pp. 189–214, 2017.
[42] Q. Wang, B. Yu, and C. Xu, “Design and control of distillation system for methylal/methanol separa-tion. part 1: Extractive distillation using dmf as an entrainer,” Industrial & engineering chemistry research,vol. 51, no. 3, pp. 1281–1292, 2012.
[43] Z. Lei, B. Chen, and Z. Ding, Special distillation processes. Elsevier, 2005.
Towards Sustainable Solvent-Based Affinity Separations 86

4444
SOLVENT PRE-SELECTION FOR EXTRACTIVE DISTILLATION
[44] I. Nagata and J. Nakajima, “Modification of the nrtl model for ternary and quaternary liquid-liquid equi-librium calculations,” Fluid phase equilibria, vol. 70, no. 2-3, pp. 275–292, 1991.
[45] D. Siderius, “Nist standard reference simulation website,” 2012.[46] C. L. Yaws, The Yaws handbook of vapor pressure: Antoine coefficients. Gulf Professional Publishing, 2015.[47] F. Abushwireb, H. Elakrami, and M. Emtir, “Recovery of aromatics from pyrolysis gasoline by con-
ventional and energy-integrated extractive distillation,” Computer Aided Chemical Engineering, vol. 24,p. 1071, 2007.
[48] J. Liu, X. Chen, S. Zhao, X. Cao, and B. Shen, “Multicycle investigation of normal paraffin separation fromnaphtha to improve olefin and aromatic feed,” Industrial & Engineering Chemistry Research, vol. 54, no. 50,pp. 12664–12670, 2015.
[49] P. Barger, “Methanol to olefins (mto) and beyond,” CATALYTIC SCIENCE SERIES, vol. 3, pp. 239–260,2002.
[50] F. de Miguel Mercader, M. Groeneveld, S. Kersten, N. Way, C. Schaverien, and J. Hogendoorn, “Produc-tion of advanced biofuels: Co-processing of upgraded pyrolysis oil in standard refinery units,” AppliedCatalysis B: Environmental, vol. 96, no. 1-2, pp. 57–66, 2010.
[51] C. Zhao, T. Brück, and J. A. Lercher, “Catalytic deoxygenation of microalgae oil to green hydrocarbons,”Green Chemistry, vol. 15, no. 7, pp. 1720–1739, 2013.
[52] R. B. Eldridge, “Olefin/paraffin separation technology: a review,” Industrial & engineering chemistry re-search, vol. 32, no. 10, pp. 2208–2212, 1993.
[53] G. Emmrich, “Advances in the separation of c4 hydrocarbons: separation of paraffinic and olefinic c4hydrocarbons,” Krupp Koppers Tech. Publ, 1986.
[54] R. KUMAR, J. M. Prausnitz, and C. J. King, “Process design considerations for extractive distillation:separation of propylene-propane,” ACS Publications, 1972.
[55] T. Michishita, Y. Arai, and S. Saito, “Vapor-liquid equilibria of hydrocarbons at atmospheric pressure,”Kagaku Kogaku, vol. 35, no. 1, pp. 111–116, 1971.
[56] B. Blanco, M. T. Sanz, S. Beltran, J. L. Cabezas, and J. Coca, “Vapor- liquid equilibria of the ternary systembenzene+ n-heptane+ n-methylpyrrolidone (nmp) at 101.33 kpa,” Journal of Chemical & Engineering Data,vol. 47, no. 5, pp. 1167–1170, 2002.
[57] U. Domańska, M. Karpińska, A. Wiśniewska, and Z. Dąbrowski, “Ammonium ionic liquids in extractionof bio-butan-1-ol from water phase using activity coefficients at infinite dilution,” Fluid Phase Equilibria,vol. 479, pp. 9–16, 2019.
[58] A. Marciniak, “Influence of cation and anion structure of the ionic liquid on extraction processes basedon activity coefficients at infinite dilution. a review,” Fluid phase equilibria, vol. 294, no. 1-2, pp. 213–233,2010.
[59] K. Shimizu, M. F. Costa Gomes, A. A. Padua, L. P. N. Rebelo, and J. N. Canongia Lopes, “On the role of thedipole and quadrupole moments of aromatic compounds in the solvation by ionic liquids,” The Journal ofPhysical Chemistry B, vol. 113, no. 29, pp. 9894–9900, 2009.
[60] C. A. Hunter, K. R. Lawson, J. Perkins, and C. J. Urch, “Aromatic interactions,” Journal of the ChemicalSociety, Perkin Transactions 2, no. 5, pp. 651–669, 2001.
[61] U. Domańska, M. Karpińska, and M. Wlazło, “Thermodynamic study of molecular interaction-selectivityin separation processes based on limiting activity coefficients,” The Journal of Chemical Thermodynamics,vol. 121, pp. 112–120, 2018.
[62] R. Kuchhal, P. Dogra, K. Sharma, K. Jauhri, and P. Gupta, “Determination of 3-sulfolene in sulfolane byreaction gas chromatography,” Fresenius’ Zeitschrift für analytische Chemie, vol. 286, no. 3-4, pp. 219–221,1977.
[63] J. C. Gentry, L. Berg, J. C. McIntyre, and R. W. Wytcherley, “Process to recover benzene from mixedhydrocarbons by extractive distillation,” Mar. 21 1995. US Patent 5,399,244.
[64] H. Zhu, X.-l. Shi, and W.-y. Zhou, “Process simulation and parameter optimization of separating aromaticsand non-aromatics by extractive distillation with n-formylmorpholine,” Journal of East China Universityof Science and Technology (Natural Science Edition), vol. 34, no. 3, pp. 309–31, 2008.
[65] G. Somekh and B. Friedlander, “Tetraethylene glycol—a superior solvent for aromatics extraction,” ACSPublications, 1970.
[66] R. M. Butler and J. A. Bichard, “Separation of aromatics from hydrocarbon streams,” Dec. 17 1963. US
87 Towards Sustainable Solvent-Based Affinity Separations

4444
SOLVENT PRE-SELECTION FOR EXTRACTIVE DISTILLATION
Patent 3,114,783.[67] M. North, P. Villuendas, and C. Young, “A gas-phase flow reactor for ethylene carbonate synthesis from
waste carbon dioxide,” Chemistry–A European Journal, vol. 15, no. 43, pp. 11454–11457, 2009.[68] M. Mohsen-Nia and F. M. Doulabi, “Separation of aromatic hydrocarbons (toluene or benzene) from
aliphatic hydrocarbon (n-heptane) by extraction with ethylene carbonate,” The Journal of Chemical Ther-modynamics, vol. 42, no. 10, pp. 1281–1285, 2010.
[69] W. Peppel, “Preparation and properties of the alkylene carbonates,” Industrial & Engineering Chemistry,vol. 50, no. 5, pp. 767–770, 1958.
[70] O. Yamamoto, T. Sasamoto, and M. Inagaki, “Indium tin oxide thin films prepared by thermal decompo-sition of ethylene glycol solution,” Journal of materials research, vol. 7, no. 9, pp. 2488–2491, 1992.
[71] Y. Deguchi, M. Kono, Y. Koizumi, Y.-i. Izato, and A. Miyake, “Study on autocatalytic decomposition ofdimethyl sulfoxide (dmso),” Organic Process Research & Development, vol. 24, no. 9, pp. 1614–1620, 2020.
[72] G. W. Meindersma, A. R. Hansmeier, and A. B. de Haan, “Ionic liquids for aromatics extraction. presentstatus and future outlook,” Industrial & Engineering Chemistry Research, vol. 49, no. 16, pp. 7530–7540,2010.
[73] K. Paduszyński, M. Królikowski, and P. Orzeł, “Thermodynamic properties of infinitely diluted solutionsof organic solutes in in silico designed task-specific ionic liquid,” Journal of Molecular Liquids, vol. 279,pp. 733–739, 2019.
[74] K. Paduszynéski and M. Kroélikowska, “Effect of side chain functional group on interactions in ionicliquid systems: Insights from infinite dilution thermodynamic data,” The Journal of Physical Chemistry B,vol. 121, no. 43, pp. 10133–10145, 2017.
[75] M. Larriba, M. Ayuso, P. Navarro, N. Delgado-Mellado, M. Gonzalez-Miquel, J. Garciéa, and F. Rodríguez,“Choline chloride-based deep eutectic solvents in the dearomatization of gasolines,” ACS SustainableChemistry & Engineering, vol. 6, no. 1, pp. 1039–1047, 2018.
[76] N. R. Rodriguez, P. F. Requejo, and M. C. Kroon, “Aliphatic–aromatic separation using deep eutecticsolvents as extracting agents,” Industrial & Engineering Chemistry Research, vol. 54, no. 45, pp. 11404–11412, 2015.
[77] D. H. Sarno, “Extractive distillation with dimethylformamide,” July 25 1961. US Patent 2,993,841.[78] L. Kerker and R. Malzkorn, “Method for separating butenes and butanes by extractive distillation pro-
vided with a polar extraction agent,” May 11 2006. US Patent App. 10/527,322.[79] C. O. Carter, “Separating olefins from paraffins with dimethyl sulfoxide extractant,” May 12 1981. US
Patent 4,267,034.[80] L. Berg, “Separation of heptane from 1-heptene by extractive distillation,” Aug. 22 1995. US Patent
5,443,697.[81] F. de Miguel Mercader, M. J. Groeneveld, S. R. Kersten, C. Geantet, G. Toussaint, N. W. Way, C. J. Schave-
rien, and K. J. Hogendoorn, “Hydrodeoxygenation of pyrolysis oil fractions: process understanding andquality assessment through co-processing in refinery units,” Energy & environmental science, vol. 4, no. 3,pp. 985–997, 2011.
[82] L. A. Baird, D. B. Galloway, and T. N. Kalnes, “Methods of and apparatuses for upgrading a hydrocarbonstream including a deoxygenated pyrolysis product,” Nov. 13 2014. US Patent App. 13/890,343.
[83] J. P. De Wet, W. Jansen, and P. Jacobson, “Extraction of oxygenates from a hydrocarbon stream,” Dec. 162008. US Patent 7,465,846.
[84] R. C. Binning and J. T. Kelly, “Extraction of alcohols with propylene carbonate,” Dec. 22 1959. US Patent2,918,486.
[85] P. N. Rylander, “Solvent extraction of oil-soluble water-immiscible alcohols using dimethylsulfoxide,”Sept. 27 1960. US Patent 2,954,392.
[86] A. Knorr, K. Fumino, A.-M. Bonsa, and R. Ludwig, “Spectroscopic evidence of ‘jumping and pecking’ofcholinium and h-bond enhanced cation–cation interaction in ionic liquids,” Physical Chemistry ChemicalPhysics, vol. 17, no. 46, pp. 30978–30982, 2015.
[87] A. Kaiser, O. Ismailova, A. Koskela, S. E. Huber, M. Ritter, B. Cosenza, W. Benger, R. Nazmutdinov, andM. Probst, “Ethylene glycol revisited: Molecular dynamics simulations and visualization of the liquid andits hydrogen-bond network,” Journal of molecular liquids, vol. 189, pp. 20–29, 2014.
[88] A. Chianese and F. Zinnamosca, “Ethanol dehydration by azeotropic distillation with a mixed-solvent
Towards Sustainable Solvent-Based Affinity Separations 88

4444
SOLVENT PRE-SELECTION FOR EXTRACTIVE DISTILLATION
entrainer,” The Chemical Engineering Journal, vol. 43, no. 2, pp. 59–65, 1990.[89] V. Gomis, A. Font, R. Pedraza, and M. Saquete, “Isobaric vapor–liquid and vapor–liquid–liquid equilib-
rium data for the system water+ ethanol+ cyclohexane,” Fluid Phase Equilibria, vol. 235, no. 1, pp. 7–10,2005.
[90] V. Gomis, A. Font, and M. D. Saquete, “Vapour–liquid–liquid and vapour–liquid equilibrium of the systemwater+ ethanol+ heptane at 101.3 kpa,” Fluid phase equilibria, vol. 248, no. 2, pp. 206–210, 2006.
[91] S. Young, “Lxxiii.—the preparation of absolute alcohol from strong spirit,” Journal of the Chemical Society,Transactions, vol. 81, pp. 707–717, 1902.
[92] Y.-L. Wang, A. Laaksonen, and M. D. Fayer, “Hydrogen bonding versus π–π stacking interactions inimidazolium–oxalatoborate ionic liquid,” The Journal of Physical Chemistry B, vol. 121, no. 29, pp. 7173–7179, 2017.
[93] K. Yan, Y. Yang, J. Chai, and Y. Lu, “Catalytic reactions of gamma-valerolactone: A platform to fuels andvalue-added chemicals,” Applied Catalysis B: Environmental, vol. 179, pp. 292–304, 2015.
[94] R. Germani, M. Orlandini, M. Tiecco, and T. Del Giacco, “Novel low viscous, green and amphiphilicn-oxides/phenylacetic acid based deep eutectic solvents,” Journal of Molecular Liquids, vol. 240, pp. 233–239, 2017.
89 Towards Sustainable Solvent-Based Affinity Separations


55555
5Comparison of Infinite DilutedActivity Coefficient Prediction
Methods"All models are wrong, but some are useful",George Box , (1919 - 2013)
This chapter is adapted from:Brouwer, T. and Schuur, B. "Model performances evaluated for infinite dilu-tion activity coefficients prediction at 298.15 K.", Industrial & EngineeringChemistry Research 58.20 (2019): 8903-8914.

55555
COMPARISON OF γ∞ PREDICTION METHODS
5.1 Introduction
The global community relies on the chemical industry for the production ofgoods from complex raw materials, such as oil and biomass. The separationprocesses required in these production routes account for up to 50% of the to-tal energy costs in refineries1, and improving the efficiency of separations cansignificantly reduce the environmental impact of the chemical industry.2 Thiscan only be achieved when the separation processes are understood on themolecular level, which includes a good description of thermodynamic equi-libria. An accurate description of these equilibria is possible with models suchas UNIQUAC and NRTL, but requires labor-intensive experimental data. Forthe initial stages of process design, including solvent selection and/or design,less labor-intensive approaches for understanding intermolecular interactionsare desired. A range of predictive models is available to provide engineerswith first estimates for (inter-)molecular behavior.3–11
Activity coefficients (γ) describe the thermodynamic non-ideality betweentwo substances due to intermolecular interactions. These intermolecular in-teractions are induced by van der Waals interactions12–14 and electrostaticinteractions, such as intermolecular or intramolecular hydrogen bonding ef-fects15, consequently causing either a positive or negative deviation fromRaoult’s law. Net attractive interactions result in an γ below unity, and netrepulsive interactions result in a γ above unity. Activity coefficients are how-ever composition-dependent and a limiting case is where a solute is infinitelydiluted in a solvent. The non-ideal behavior of the solute at infinite dilutionis solely induced by solvent-solute interaction, i.e., the effect of the molecularproperties of the solvent on the activity coefficient of the solute. The activitycoefficient in this limiting case can be used as an appropriate indicator of in-termolecular interactions and is called the γ∞i .16
Various methods are in use to estimate activity coefficients. Eight modelswere evaluated, as these are most commonly used, see Figure 5.1. Seven ofthem have many similarities and one has a completely separate theoreticalframework. Three solvation models (SMs) are chosen, which are, in orderof increasing complexity, the Hildebrand parameter7, the Hansen SolubilityParameters (HSP)8, and the MOdified Separation of Cohesive Energy Density
Towards Sustainable Solvent-Based Affinity Separations 92

55555
COMPARISON OF γ∞ PREDICTION METHODS
(MOSCED) model.6 These models attempt to describe the intermolecular in-teraction strength by increasingly more molecular parameters. The GroupContribution Methods (GCMs) are similar in form to SMs, but differ in origin.GCMs attempt to describe the intermolecular interactions by the empirical fit-ting of binary interaction coefficients of segments of the interacting molecules.The three GCMs that are included in this work are the original UNIversalQuasichemical Functional-group Activity Coefficients (UNIFAC) method11,and two modifications thereof (Lyngby5 and Dortmund4).
Figure 5.1: Number of publications where both the model and activity coefficient is men-tioned extracted from Scopus. The search terms where "model” AND “infinite dilution ac-tivity coefficient” retrieved on December 3, 2018.
Despite these differences, all of these models still use the same entropic for-mulations. Next to these, a software package called the COnductor-like Scree-ning MOdel for Realistic Solvents (COSMO-RS) is also evaluated. COSMO-RShas an entirely different theoretical framework and does not require any inputparameters from the user besides the molecular structures. Similar to GCMs,COSMO-RS also divides molecules into segments. COSMO-RS divides thesurface of molecules, as calculated by the quantum chemical density func-
93 Towards Sustainable Solvent-Based Affinity Separations

55555
COMPARISON OF γ∞ PREDICTION METHODS
tional theory (DFT) approach in segments, and calculates the interaction en-ergy for each segment. The molecular properties are then calculated by takingthe integral over all segments.10
GCMs such as variations on UNIFAC, and COSMO-RS are most commonlyapplied, as can be seen in Figure 5.1. However, this does not imply that thesemodels are always the most accurate in predicting the γi . Because the existingliterature is inconclusive,6,17–24 the aim of this contribution is to extensivelycompare the performance of all these fundamentally different approaches forprediction of the γ∞i of (a)polar solutes in (a)polar solvents. The performancesof all evaluated models in predictions for a variety of chemical systems wereevaluated and explained based on their fundamental assumptions. Examplesof such assumptions include that the entropy of the system does not differfrom the ideal entropy, that the volume of the molecule does not change ina changing environment, or that there is no distinction between hydrogen-bond-accepting and hydrogen-bond-donating molecules.
The extensive evaluation of model performances yielded insight into the ap-plicability of the models for systems with variations in intermolecular interac-tions and which models give the most accurate description of γ∞i at 298.15K.A heuristic approach for the model choice is given for all binary combina-tions of solute and solvent classes, e.g., apolar compounds, aromatic com-pounds, halogenated compounds, polar aprotic compounds, and polar proticcompounds.
5.2 Theoretical Framework
In this section, all of the models that were compared for the prediction ofγ∞i are described. The models can be categorized into SMs, GCMs, LinearSolvation Energy Relations (LSERs), and COSMO-RS predictions that are ofstatistical thermodynamic nature. Because both the solvation models and theGCMs make use of combinatorial and residual contributions that find theirorigin in the Flory-Huggins model; this model and the variations thereof arefirst discussed.
Towards Sustainable Solvent-Based Affinity Separations 94

55555
COMPARISON OF γ∞ PREDICTION METHODS
5.2.1 Flory-Huggins-Based Models
Nonideal behavior in mixtures can be induced by intermolecular interactionssuch as polarity, as well as by shape differences,15 The simplest cause of non-ideal behavior is due to shape differences without polarity differences. Thissituation occurs in alkane mixtures for which activity coefficients can be de-scribed by the Flory-Huggins theory (Equation 5.1), where the combinato-rial contribution to the activity coefficient, γci is formulated solely in terms ofmolecular volume differences,25,26
lnγci = ln(Φi
xi
)+ 1− Φi
xi(5.1)
where Φi and xi are the volume fraction and molar fraction of compound i,respectively.
The Flory-Huggins combinatorial approach assumes a very large number ofnearest-neighbor sites, hence ignoring the fact that neighboring sites can beoccupied by a segment of the same molecule. Consequently, the Flory-Hugginscorrelation overestimates the combinatorial contribution.27 The Stavermann-Guggeheim modification attempts to correct this by incorporating the proba-bility of vacant sites for polymer segments, although the combinatorial termis still overestimated, because the coordination number of all molecules isset.28 The Kikic modification attempted to correct the correlation by addingan exponent to the number of lattice sites,30 but this resulted in an underpre-diction of the combinatorial term. Recently, Krooshof et al.29 generalized theapproach of Guggenheim and set loose the fixed coordination number. In thiswork, the Krooshof generalization was however not used and the industrialstandard model, with the Guggenheim or Kikic description, was used.
When there is also a difference in the polarity of the molecules in the mix-ture, a residual correction can be added, γRi . This can be described by theFlory-Huggins free-energy parameter χij , as equated in Equation 5.2. The γiresulting from both combinatorial and residual terms is given in Equation 5.3,
lnγRi = χijΦ2i (5.2)
lnγi = lnγCi + lnγRi (5.3)
95 Towards Sustainable Solvent-Based Affinity Separations

55555
COMPARISON OF γ∞ PREDICTION METHODS
A wide range of models has been developed that vary in their formulation ofγCi and γRi . In the next subsections, the most relevant solvation models andGCMs are described.
5.2.2 Solvation Models
In an early attempt to describe and understand the strength of intermolec-ular interactions, Hildebrand7 defined the cohesive pressure or cohesive en-ergy density (c) as the net result of the sum of all intermolecular interactionsbetween the molecules. As a measurable quantity for the cohesive energydensity in liquids below their boiling point, the molar vaporization energy(∆Uvap) or enthalpy (∆Hvap) is considered,31 and correlated to the Hildebrandparameter (δ), according to Equation 5.4,
δ =√c =
√∆UvapVm,i
=
√∆Hvap −RT
Vm,i(5.4)
where Vm,i is the molar volume of the molecule i.The cohesive pressure is the sum of all attractive interactions, which must bebroken to vaporize the liquid, and large δ values are therefore obtained forhighly polar substances and small δ values are obtained for weakly interact-ing substances (e.g., fluorocarbons).31 Considering mixtures, the difference inδ of the constituents of that mixture can be interpreted as the difference in na-ture of these molecules and may be used as a measure for nonideality. In theHildebrand-Scatchard equation (Equation 5.5),7 the difference in δ is used inthe expression for the Flory-Huggins free-energy parameter (χij ),
χij =Vm,jRT
(δi − δj )2 (5.5)
where δi and δj are, respectively, the Hildebrand parameters of the solute iand solvent j. Hansen8 proposed an extension of the Hildebrand parameter byseparating the dispersion (δD ), polar (δP ), and hydrogen bonding (δHB) con-tribution. These three parameters are called the Hansen solubility parameters(HSP) and are linked to the Hildebrand parameter, as defined in Equation 5.6.
δ2i = δ2
D,i + δ2P ,i + δ2
HB,i (5.6)
Towards Sustainable Solvent-Based Affinity Separations 96

55555
COMPARISON OF γ∞ PREDICTION METHODS
Often, the dispersive component was determined by homomorph methods,which estimate the dispersive parameter by evaluating an apolar moleculewith almost the same size and shape of the polar compound.31 The remaindercan be subtracted from the Hildebrand parameter and split into the polar andhydrogen-bonding term. By optimizing the miscibility description an optimalsplit between both terms was chosen.31 Common practice in using HSP isto plot the solute and solvents in a 3D Hansen space. The spatial distancebetween solute and solvent can be correlated to the solvation capability of thesolvent, where shorter distances in the Hansen space allow better solubility.Hansen32 also suggested that the Flory-Huggins parameter can be determinedusing Equation 5.7,
χij = αVm,iRT
[(δD,i − δD,j )2 + 0.25(δP ,i − δP ,j )2 + (δHB,i − δHB,j )2
](5.7)
where, initially, α was taken to be 1, although Lindvig et al.9 showed that anα value of 0.6 increases the average accuracy of the model.
The Modified Separation of Cohesive Energy Density (MOSCED) model maybe one of the most-extensive solvation models.20 In the MOSCED model, ad-ditional contributions to the Flory-Huggins parameter are considered thatarise from significant variations in the cybotactic region due to the local or-ganization, as a result of electrostatic interactions, such as hydrogen bond-ing. This local organization causes the geometric mean assumption not tobe valid anymore for highly polar and associating compounds.20 To accountfor hydrogen bonding, the MOSCED model distinguishes acidic (α) and basic(β) contributions to hydrogen bonding. Similar to the HSP model, the sum-mation of the terms results in the Hildebrand parameter, as can be seen inEquation 5.8,33
δ2i = λ2
i + τ2i + (αβ)2
i (5.8)
where the dispersion constant λi and polarity constant τi are identical to theHSP parameters δD,i and δP ,i , respectively. In addition, the interaction be-tween induced dipoles is accounted for by the induction parameter, qi . Themodel furthermore contains two empirical asymmetry factors: ψ and ξ. Moreinformation on the MOSCED parameters can be found in section 12.1.6 The
97 Towards Sustainable Solvent-Based Affinity Separations

55555
COMPARISON OF γ∞ PREDICTION METHODS
resulting MOSCED-based equation for the Flory-Huggins parameter is givenin Equation 5.9.
χij =Vm,jRT
(λi −λj ) +q2i q
2j (τTi − τ
Tj )2
ψi+
(αTi −αTj )(βTi − β
Tj )
ξi
(5.9)
5.2.3 Group Contribution Methods (GCMs)
Also, the GCMs of UNIFAC and modifications thereof are the sum of a com-binatorial part and a residual part. Each GCM model uses a different descrip-tion for the combinatorial term. The UNIFAC and the modified UNIFAC(Do)models use the Guggenheim-Stavermann term34 (Equation 5.10a and 5.10b),while the modified UNIFAC(Ly) uses the Kikic modification,30 as given inEquation 5.10c,
UNIFAC: lnγci = lnΦi + 1−Φi −F (5.10a)
mod. UNIFAC (Do): lnγci = lnΦ′i + 1−Φ
′i −F (5.10b)
mod. UNIFAC (Ly): lnγci = lnΦ′′i + 1−Φ
′′i (5.10c)
where: F =( z
2
)qi
[1− Φi
θi+ ln
(Φi
θi
)](5.10d)
where Φi , θi , and qi are, respectively, the volume fraction, surface fraction,and the coordination number (z), which is often set at 10. The modified UNI-FAC(Do) model also has a modified volume fraction, more information on theequations can be found in section 12.2. The residual contribution of all UNI-FAC models is determined via Equation 5.11a and 5.11b,
lnγRi =∑k
ν(i)k
(lnΓk − lnΓ
(i)k
)(5.11a)
lnΓk =Qk
1− ln∑m
θmΨmk
−∑m
θmΨkm∑nθnΨnm
(5.11b)
where Γk is the overall activity of moiety k, Γ (i)k the activity of moiety k solely
surrounded by moiety i, ν(i)k the occurrence of each moiety k in surrounded
Towards Sustainable Solvent-Based Affinity Separations 98

55555
COMPARISON OF γ∞ PREDICTION METHODS
by moiety i, Qk the van der Waals surface of group k, and Ψkm the group bi-nary interaction parameter.4,5,11 The exact mathematical framework is givenin section 12.2.
5.2.4 Linear Solvation Energy Relationship (LSER)
Linearly combining solute and solvent descriptors was pioneered by Kam-let, Abboud, and Taft,35–39 and later Abraham3 introduced a now widelyused LSER that consisted of five solute and five solvent descriptors (Equa-tion 5.12a). An extension is made for ILs, where both the cation and anionhave five unique solvent descriptors (Equation 5.12b).40 The Abraham modelcan be used to obtain either the gas-solvent partition coefficient (KS ) or thewater-solvent partition coefficient (PS ).
10log(PS ) = c+ eE + sS + aA+ bB+ vV10log(KS ) = c+ eE + sS + aA+ bB+ lL
(5.12a)
10log(PS ) = c+ (ec + ea)E + (sc + sa)S + (ac + aa)A+
(bc + ba)B+ (vc + va)V10log(KS ) = c+ (ec + ea)E + (sc + sa)S + (ac + aa)A+
(bc + ba)B+ (lc + la)L
(5.12b)
The capital variables in Equation 5.12a and 5.12b are defined as the solutedescriptors and the lowercase variables are the solvent descriptors. Whilethe c-variable is a fitting constant, the latter terms are respectively the excessmolar refraction (dm3mol−1/10), the dipolarity/polarizability, hydrogen-bondacidity and basicity, the McGowan characteristic volume (dm3mol−1/100), andthe gas-hexadecane partition coefficient at 298.15K. The descriptors describethe tendency to interact via σ - and π-electrons (e/E), the tendency to inter-act with (induced) multipole moments (s/S), the tendency to accept hydrogenbonds or donate electrons (A/b), the tendency to donate hydrogen bonds oraccept electrons (a/B), and the tendency to either form (V/L) or the work re-quired to form (v/l) cavities.
The determination of solute and solvent descriptors is done by multilinearregression of experimental γ∞i data of either a set of solutes in a solvent or
99 Towards Sustainable Solvent-Based Affinity Separations

55555
COMPARISON OF γ∞ PREDICTION METHODS
a solute in various solvents. The gas-solvent partition coefficient can conse-quently be linked to the γ∞i parameter by Equation 5.13:40
10log(γ∞i ) = log
RTP oj Vm,j
− log(KS ) (5.13)
where P oj and Vm,j are, respectively, the vapor pressure and molar volume ofthe pure solvent.
5.2.5 Conductor-like Screening Model for Real Solvents.
The ab initio method developed by Klamt et al.,41 called COSMO-RS, pre-dicts chemical potentials, which can be used to calculate the value of γ∞i . Thefirst step is always to perform quantum mechanical calculations to obtain thestate of the geometrically optimized molecule. This step must be done onlyonce, and the result can be stored in a database. The second step estimatesthe interaction energy of the optimized molecules with other molecules andcan henceforth estimate molecular properties such as the γ∞i parameter.41
The energy of this state can be determined via dielectric continuum solvationmethods. However, empirical parameters (e.g., atomic radii) are required toconstruct the molecular cavity within the conductor exterior. COSMO-RS im-plements element-specific radii, which are 17% larger than van der Waalsradii. The state of the molecule is consequently determined using any Self-Consistent Field (SCF) model, e.g., Hartree-Fock (HF) and density functionaltheory (DFT). Combining the COSMO approach with a SCF model results innot only the total energy of the molecule, but also the polarization chargedensity, or σ .41 The σ -profile is “frozen” into place, while the conductor en-vironment is “squeezed out”. A thin film of a conductor is left in the placeswhere different molecules will have an interface. The sum of the σ -value atthe interface, (σ + σ
′), is then the net polarization charge density. As the con-
ductor is removed, the polarization charge density differences resemble inter-molecular interactions with local contact energy, which may be described byEquation 5.14.
Econtact(σ,σ′) = Emisf it(σ,σ
′) +EHB(σ,σ
′) (5.14)
Towards Sustainable Solvent-Based Affinity Separations 100

55555
COMPARISON OF γ∞ PREDICTION METHODS
An interaction distinction is made between the misfit energy (Emisf it) and theenergy that is due to hydrogen bonding effects (EHB). Both energy terms dis-sipate when the conjugant polarization charge densities are equal. If not, themisfit between both σ -values represents the electrostatic interaction energybetween those segments. Additional interaction energy can be induced by twovery polar surfaces with opposite signs via hydrogen bonding. The capabilityof COSMO-RS to predict a large number of chemical potentials of solutes ineither a pure or mixed solvent enabled fast and versatile predictions regardingvarious equilibria and also γ∞i .41
5.3 Methods
For all γ∞i predictions, a systematic assessment was done at 298.15 K andall model specific-parameters were imported from literature sources, as canbe seen in section 5.6. All simulations with COSMO-RS were performed withCOSMOthermX C30_1705, in which a pure solvent phase was defined and theactivity coefficient of the solute in that phase was estimated. Molecules thatwere not available in the databases were created with TurboMole TmoleX 3.4,using the TZVPD-Fine parametrization, while molecular conformers weredisregarded.
5.4 Results
5.4.1 General Averaged Model Predictions
The accuracy of all models was determined by comparing the predictions withexperimental values taken from the literature. An extensive overview of allexperimental data is presented in the ESI. The accuracy of the models is eval-uated by determining the average relative deviation (ARD) between the pre-dicted and experimental γ∞i values, as given in Equation 5.15.
ARD =
∑Ni=1
∣∣∣∣∣γ∞i,model−γ∞i,expγ∞i,exp
∣∣∣∣∣N
(5.15)
The ARD for prediction of γ∞i for all solutes in molecular solvents and ILs byeach model, and their 95% confidence intervals, are depicted in Figure 5.2.
101 Towards Sustainable Solvent-Based Affinity Separations

55555
COMPARISON OF γ∞ PREDICTION METHODS
Figure 5.2: Evaluation of various predictive models for γ∞i for (A) molecular solvents and(B) ionic liquids (ILs) at 298.15 K. On the y-axis, the ARD is presented within the boxes thetotal amount of comparisons made. The experimental γ∞i can be found in section 5.6. Theintegrated scatter plot depicts similar comparison made in the literature for various models,e.g., modified UNIFAC(Ly),18,21,23 UNIFAC,17,18,20–23,42,43, COSMO-RS,21,44 modifiedUNIFAC(Do),17,18,23,24,45–47 and MOSCED.6,17,19,20,22
For molecular solvents, eight predictive models have been evaluated; for ILs,seven predictive models due to lack of MOSCED parameters for ILs have beenevaluated. The ARD of the various models differs significantly, as can be seenin Figure 5.2. For both the molecular solvents and the ILs, the most inaccu-rate model is the Hildebrand model. Evidently, using only the evaporationenthalpy and the molar volume is insufficient to accurately describe γ∞i insystems where intermolecular interactions such as hydrogen bonding occur.7
This accumulates in a significant ARD of > 105% in the γ∞i prediction.
Using the HSP to calculate the γ∞i with Equation 5.7 is a significant improve-ment, compared to the Hildebrand model (Equation 5.5), which is due totaking into account hydrogen bonding and polarity effects.8 Still, an ARDof 66.4±14.4% is observed for molecular solvents. This may be explained bythe inability to differentiate between hydrogen acidity and basicity effects.6
Further refining the model using hydrogen acidity and hydrogen basicity, as
Towards Sustainable Solvent-Based Affinity Separations 102

55555
COMPARISON OF γ∞ PREDICTION METHODS
well as polarizability effects, as taken into account in the MOSCED model,which shows from Figure 5.2a to be, on average, the most accurate model,with an ARD of 16.2±1.35%. Unfortunately, no parameters for ILs are avail-able, and therefore this model could not be evaluated for ILs. The three groupcontribution models that were also evaluated showed comparable ARD val-ues of 32.2±1.84%, 31.1±1.66%, and 24.3±1.63%, respectively, for the modi-fied UNIFAC(Ly), UNIFAC, and modified UNIFAC(Do) for molecular solvents.The ARD of COSMO-RS is within 28.3±1.07%, which is similar to that ob-served for the GCM methods. The Abraham model is more accurate thanGCM methods and COSMO-RS with an ARD of 21.7±1.19%. The better ac-curacy of the Abraham model is due to a more elaborate description of thevarious intermolecular interactions via all descriptors.
For ILs, the ARD of all models (see Figure 5.2b) increase due to the presenceof not only dispersion, dipole, and hydrogen bonding interactions, but alsoionic interactions between the ionic species and the solute. The ARD of theHSP model is determined to be 168±54.5%, while the GCM methods performbetter with an ARD of 86.2±14.6%, 86.5±15.7%, and 122±55.9%, respectively,for the modified UNIFAC(Ly), UNIFAC, and modified UNIFAC(Do). AlthoughCOSMO-RS performance for molecular solvents is comparable to that of theGCMs, for ILs, the ARD is larger (182±16.7%). The larger ARD for ILs isknown to be (at least partly) caused by neglecting long-range ion-ion inter-actions and insufficient description of extreme polarization charge densitiesof ions.10 The Abraham model performs most accurately for ILs, with anARD value of 65.1±4.50%. The accuracy of the Abraham model is interest-ing for solvent screening purposes, because of the availability of ion-specificAbraham parameters for 60 cations and 17 anions, allowing rapid assessmentof 1020 ILs, since they are binary combinations of these ions. (see the sec-tion 5.6).
The ARDs reported in Figure 5.2 appear to be larger than the errors describedin various literature sources.6,17–24,42,43,45–48 Similar comparisons have beenmade by Gmehling et al.,18 who assessed the accuracy of the UNIFAC models,and Thomas et al.,22 who assessed the accuracy of the MOSCED model. Theyreported lower ARD values, correspondingly 25.8% (instead of 31.1±1.66%)and 9.10% (instead of 16.2±1.35%). Because the error calculation method
103 Towards Sustainable Solvent-Based Affinity Separations

55555
COMPARISON OF γ∞ PREDICTION METHODS
is the same, and only the used dataset differs, the logical conclusion is thatthe dataset used in this work includes γ∞i with a higher average error mar-gin. This will be the case for each of the assessed models; hence, these errormargins in the dataset will not affect the comparison of the relative accuraciesbetween all models. For comparison with the work of Gmehling et al.18, thereis a difference in the selected data, because they state that γ∞i values of >100were excluded, whereas, in this manuscript, these values were included.
5.4.2 Molecular Solvents
Although from the averaged model predictions, one general guideline formodel selection can be distilled, a more detailed analysis of subgroups of so-lutes and solvents allows one to provide a more-sophisticated directive to theuse of thermodynamic models for the prediction of γ∞i for various specificchemical families. To this end, all solvents and solutes were classified intofive categories, i.e., aliphatic compounds, aromatic compounds, compoundscontaining a halogen atom, polar aprotic compounds and polar protic com-pounds, and the model accuracies were evaluated per combination of solventand solute class.
In Table 5.1, all model evaluations are shown per combination of solvent andsolute categories. Comparison of the Hildebrand, HSP, and MOSCED modelsclearly shows that models with increasing complexity, i.e., taking hydrogenbonding and polarity into account, and describing the hydrogen bonding ba-sicity and acidity separately, as well as including polarizability, predict γ∞iwith increasing accuracy. All of these models show the largest ARD for pro-tic compounds, including amines, alcohols, and aldehydes, which is a logicalresult due to the number and type of intermolecular interactions occurring inthese systems.
There is no single model that predicts γ∞i most accurately for all solvent andsolute category combinations. Each of the models, except for the Hildebrandand HSP models, most accurately predicts a category of solute-solvent pairs.COSMO-RS performs best in systems with only (induced) dipole interactionsand in the absence of hydrogen bonding formation. When polarity and hy-drogen bonding systems are concerned, COSMO-RS becomes less accurate.
Towards Sustainable Solvent-Based Affinity Separations 104

55555
COMPARISON OF γ∞ PREDICTION METHODS
Table 5.1: Accuracy of the Hildebrand Solubility Parameter, Hansen Solubility Parameter,MOSCED model, Abraham model, COSMO-RS, UNIFAC, mod. UNIFAC (Ly) and mod.UNIFAC (Do) differentiated towards aliphatic, aromatic, halogen, aprotic polar, and proticpolar compounds in molecular solvents.a
Hildebrand Solubility ParameterSolute
Aliphatic Aromatic Halogen Aprotic polar Protic polarAliphatic 20,5% 28,3% >100% >300% >105%Aromatic 40,3% 17,0% 14,8% >100% >500%Halogen 56,5% 29,2% 32,5% 73,7% >100%
Aprotic polar >100% >100% >100% >100% >100%Solv
ent
Protic polar >100% 51,6% 45,2% >100% 67,7%Hansen Solubility Parameters
SoluteAliphatic Aromatic Halogen Aprotic polar Protic polar
Aliphatic 22,3% 43,3% 44,7% 64,5% 84,5%Aromatic 31,1% 18,2% 20,4% 28,7% 75,5%Halogen 32,9% 25,1% 30,5% 70,0% 62,4%
Aprotic polar 47,3% 64,3% 47,1% 39,8% 62,4%Solv
ent
Protic polar >100% 57,7% 45,2% >300% 27,8%MOSCED model
SoluteAliphatic Aromatic Halogen Aprotic polar Protic polar
Aliphatic 7,4% 6,7% 7,7% 39,5% 89,1%Aromatic 14,3% 19,6% 9,7% 24,2% >100%Halogen 18,1% 9,8% 18,3% 23,2% 37,3%
Aprotic polar 15,7% 14,8% 15,8% 15,0% 37,3%Solv
ent
Protic polar 24,6% 16,7% 32,7% 29,8% 19,7%Abraham model
SoluteAliphatic Aromatic Halogen Aprotic polar Protic polar
Aliphatic 17,8% 11,8% 6,8% 46,3% 12,5%Aromatic 11,8% 20,0% 13,0% 22,9% 27,9%Halogen 34,6% 31,8% 16,1% 34,9% 31,7%
Aprotic polar 21,2% 21,2% 21,7% 22,4% 31,7%Solv
ent
Protic polar 20,6% 17,5% 22,3% 39,5% 34,1%COSMO-RS
SoluteAliphatic Aromatic Halogen Aprotic polar Protic polar
Aliphatic 8,6% 15,4% 20,4% 35,6% 45,2%Aromatic 10,7% 13,2% 26,7% 24,4% 56,9%Halogen 27,6% 36,6% 15,7% 31,4% 33,4%
Aprotic polar 32,7% 34,4% 32,5% 19,9% 33,4%Solv
ent
Protic polar 36,3% 32,0% 35,0% 38,1% 23,6%
105 Towards Sustainable Solvent-Based Affinity Separations

55555
COMPARISON OF γ∞ PREDICTION METHODS
UNIFACSolute
Aliphatic Aromatic Halogen Aprotic polar Protic polarAliphatic 12,4% 11,0% 26,6% 47,6% 45,6%Aromatic 16,6% 18,9% 20,9% 32,4% 24,9%Halogen 34,8% 19,4% 18,0% 25,6% 38,4%
Aprotic polar 40,3% 23,7% 23,0% 27,9% 38,4%Solv
ent
Protic polar 35,8% 28,3% 32,7% 36,3% 23,4%mod. UNIFAC (Ly)
SoluteAliphatic Aromatic Halogen Aprotic polar Protic polar
Aliphatic 9,4% 11,9% 21,7% 47,9% 43,6%Aromatic 24,9% 19,4% 23,9% 27,3% 43,1%Halogen 34,0% 24,7% 19,9% 29,1% 43,0%
Aprotic polar 41,0% 20,8% 23,7% 23,0% 43,0%Solv
ent
Protic polar 39,3% 41,3% 34,2% 37,5% 16,8%mod. UNIFAC (Do)
SoluteAliphatic Aromatic Halogen Aprotic polar Protic polar
Aliphatic 7,1% 5,6% 10,6% 56,8% 18,3%Aromatic 17,6% 17,0% 17,1% 26,2% 47,8%Halogen 32,0% 13,5% 17,5% 27,9% 35,3%
Aprotic polar 30,1% 17,4% 25,9% 23,6% 35,3%Solv
ent
Protic polar 23,2% 18,9% 28,2% 43,4% 28,5%aAll 25 binary solute-solvent combinations have been made at 298.15 K. The colors areindicative: white, ARD<100%; light gray, 100%<ARD<300%; medium gray, 300%<ARD<500%; dark gray, 500%<ARD<103%; and black, ARD>105%.
The MOSCED and Abraham models perform much better in hydrogen bond-ing systems, because of the multiple parameters that describe these direc-tional interactions. The various UNIFAC models appear to be most accuratefor a few categories of chemical interaction systems, which may arise fromthe empirical nature of the UNIFAC models based on fitting the model pa-rameters to experimental data. The variation between the UNIFAC modelscan also arise from the different fitting procedures for the determination oftheir empirical constants. Finally, the differences in the formulation of theircombinatorial term can induce variation in activity coefficient prediction.
5.4.3 Ionic Liquids
Overall, the ARD in predicted γ∞i in ILs is larger than that observed in molec-ular solvents. Not only is the additional electrostatic intermolecular interac-
Towards Sustainable Solvent-Based Affinity Separations 106

55555
COMPARISON OF γ∞ PREDICTION METHODS
tion of the charges on the ions with the solutes responsible for this, but alsothe additional competition between the solute-related intermolecular interac-tions and the interactions between the ions in the IL plays an important role.Furthermore, ILs with a cation containing, besides the central ionic moiety,also a second moiety (e.g. ether, hydroxyl, or unsaturated bond), are collec-tively evaluated as functionalized ionic liquids (FILS).
5.4.3.1 Cations
A systematic analysis was made for various classes of cations, and the cationclass-specific model performances are listed in Table 5.2 and 5.3. A largerARD is generally obtained for FILs, because of the fact additional intermolec-ular and intramolecular interactions occur with the moieties present on thecation tails. Also, COSMO-RS has severe difficulties in predicting accurateγ∞i values. Analogous to the trends observed in molecular solvents, the ARDincrease from apolar to polar solutes, because of hydrogen bonding effects.Overall, the performance of the Abraham model is superior to that of theother models, although some systems can be more accurately described usinga variant of UNIFAC. For instance, the predictions for aliphatic, aromatic, andhalogen solutes in imidazolium cations are more accurately predicted withmodified UNIFAC(Do). This is most likely due to the large dataset availablefor imidazolium cations, hence improving the empirical fit of the modifiedUNIFAC(Do).
Table 5.2: Accuracy of COSMO-RS, UNIFAC, mod. UNIFAC (Ly), mod. UNIFAC (Do)and Abraham model differentiated towards aliphatic, aromatic, halogen, aprotic polar, andprotic polar compounds in non-functionalized ionic liquids cations.a
COSMO-RSSolute
Aliphatic Aromatic Halogen Aprotic polar Protic polar
Cat
ion
Imidazolium 198% 273% 291% 115% 217%Pyrrolidinium 60% 182% 37% 100%
Pyridinium 85% 204% 63% 104%Phosphonium 218% 127% 46% 16%Sulphonium 69% 223% 154% 139%
107 Towards Sustainable Solvent-Based Affinity Separations

55555
COMPARISON OF γ∞ PREDICTION METHODS
UNIFACSolute
Aliphatic Aromatic Halogen Aprotic polar Protic polar
Cat
ion
Imidazolium 64% 60% 59% 44% 156%Pyrrolidinium 27% 37% 26% 94%
Pyridinium 106% 44% 327% 594%PhosphoniumSulphonium 30% 118% 29% 94%
mod. UNIFAC (Ly)Solute
Aliphatic Aromatic Halogen Aprotic polar Protic polar
Cat
ion
Imidazolium 67% 65% 64% 45% 142%Pyrrolidinium 32% 34% 29% 89%
Pyridinium 109% 41% 309% 508%PhosphoniumSulphonium 34% 138% 28% 88%
mod. UNIFAC (Do)Solute
Aliphatic Aromatic Halogen Aprotic polar Protic polar
Cat
ion
Imidazolium 40% 33% 8% 222% 103%Pyrrolidinium 62% 66% 27% 53%
Pyridinium 59% 228% 47% 51%PhosphoniumSulphonium 11%
Abraham modelSolute
Aliphatic Aromatic Halogen Aprotic polar Protic polar
Cat
ion
Imidazolium 56% 60% 60% 36% 86%Pyrrolidinium 51% 54% 54% 69%
Pyridinium 51% 48% 27% 30%PhosphoniumSulphonium 54% 70% 7% 30%
aAll 25 binary solute-solvent combinations have been made at 298.15 K. The colors areindicative: white, ARD<100%; light gray, 100%<ARD<300%; medium gray, 300%<ARD<500%; dark gray, 500%<ARD<103%; and black, ARD>105%.
Towards Sustainable Solvent-Based Affinity Separations 108

55555
COMPARISON OF γ∞ PREDICTION METHODS
Table 5.3: Accuracy of COSMO-RS, UNIFAC, mod. UNIFAC (Ly), mod. UNIFAC (Do)and Abraham models differentiated towards aliphatic, aromatic, halogen, aprotic polar, andprotic polar compounds in functionalized ionic liquids cations.
COSMO-RSSolute
Aliphatic Aromatic Halogen Aprotic polar Protic polar
Cat
ion
Imidazolium 238% 322% 166% 170% 128%Pyrrolidinium 112% 53%
Pyridinium 194%Morpholinium 67%
UNIFACSolute
Aliphatic Aromatic Halogen Aprotic polar Protic polar
Cat
ion
Imidazolium 48% 81% 102% 208% 183%Pyrrolidinium 77%
Pyridinium 80%Morpholinium
mod. UNIFAC(Ly)Solute
Aliphatic Aromatic Halogen Aprotic polar Protic polar
Cat
ion
Imidazolium 51% 90% 113% 189% 164%Pyrrolidinium 79%
Pyridinium 80%Morpholinium
mod. UNIFAC(Do)Solute
Aliphatic Aromatic Halogen Aprotic polar Protic polar
Cat
ion
Imidazolium 59% 29% 99% 527% 578%Pyrrolidinium
Pyridinium 28%Morpholinium
Abraham modelSolute
Aliphatic Aromatic Halogen Aprotic polar Protic polar
Cat
ion
Imidazolium 98% 90% 67% 78% 116%Pyrrolidinium 30%
Pyridinium 19%Morpholinium
aAll 25 binary solute-solvent combinations have been made at 298.15 K. The colors areindicative: white, ARD<100%; light gray, 100%<ARD<300%; medium gray, 300%<ARD<500%; dark gray, 500%<ARD<103%; and black, ARD>105%.
109 Towards Sustainable Solvent-Based Affinity Separations

55555
COMPARISON OF γ∞ PREDICTION METHODS
5.4.3.2 Anions
The nature of the anion in ILs has been identified as a key factor determiningthe γ∞i parameter for solutes,49 therefore, it is also important to list the anioncategory- specific ARD in the predictions of γ∞i , which is done in Table 5.4.By combining the information in Table 5.2, 5.3 and 5.4, it becomes clearthat the large ARD observed with various UNIFAC models and the Abrahammodel originate from very large ARD observed for a few anions. ARD val-ues of >100% are caused by the bis- (trifluoromethane)sulfonimide [NT f2]−,tetrafluoroborate [BF4]−, and diethylene glycolmonomethyl ether sulfate [MD-EGSO4]− anions, which indicates that improving these correlations will greatlyimprove the overall average accuracy of these models. COSMO-RS appears tohave difficulties in each anion, indicating that the problems of COSMO-RS donot arise from a particular intermolecular interaction induced by one or morespecific anion(s).
Table 5.4: Accuracy of COSMO-RS, UNIFAC, mod. UNIFAC (Ly), mod. UNIFAC (Do)and Abraham model differentiated towards aliphatic, aromatic, halogen, aprotic polar, andprotic polar compounds in various anions.
COSMO-RSSolute
Aliphatic Aromatic Halogen Aprotic polar Protic polar
Ani
on
[NT f2]− 159% 211% 163% 154% 162%[BF4]− 504% 468% 206% 216%
[SCN ]− 123% 274% 48% 104%[CF3SO3]− 88% 139% 116% 84%
[MDEGSO4]− 184% 118% 526% 46% 16%[OSO4]− 246% 125% 206% 199%[P F6]− 208% 371% 9%
[B(CN )4]− 241% 330% 137% 337%[T FA]− 287% 263%
[DMPO4]− 112% 53%[DCA] 194%
Towards Sustainable Solvent-Based Affinity Separations 110

55555
COMPARISON OF γ∞ PREDICTION METHODS
UNIFACSolute
Aliphatic Aromatic Halogen Aprotic polar Protic polar
Ani
on
[NT f2]− 64% 74% 100% 266% 279%[BF4]− 118% 89% 25% 184%
[SCN ]− 66% 61% 39% 89%[CF3SO3]− 55% 50% 54% 57%
[MDEGSO4]− 34% 23% 8%[OSO4]− 19% 17% 86% 65%[P F6]− 76% 73% 94%
[B(CN )4− 16% 39% 15% 53%[T FA]− 25% 24%
[DMPO4]− 77%[DCA]− 80%
mod. UNIFAC (Ly)Solute
Aliphatic Aromatic Halogen Aprotic polar Protic polar
Ani
on
[NT f2]− 66% 85% 109% 246% 253%[BF4]− 115% 89% 32% 129%
[SCN ]− 70% 61% 39% 86%[CF3SO3]− 58% 51% 48% 57%
[MDEGSO4]− 45% 40% 24%[OSO4]− 36% 31% 86% 38%[P F6]− 80% 77% 93%
[B(CN )4]− 22% 38% 30% 61%[T FA]− 28% 34%
[DMPO4]− 79%[DCA]− 80%
mod. UNIFAC (Do)Solute
Aliphatic Aromatic Halogen Aprotic polar Protic polar
Ani
on
[NT f2]− 48% 35% 88% 442% 453%[BF4]− 66% 38% 163% 136%
[SCN ]− 47% 12%[CF3SO3]− 65% 50% 90% 69%
[MDEGSO4]− 61% 61%[OSO4]− 15% 28% 11% 50%[P F6]− 34% 16%
[B(CN )4]−
[T FA]−
[DMPO4]−
[DCA]− 28%
111 Towards Sustainable Solvent-Based Affinity Separations

55555
COMPARISON OF γ∞ PREDICTION METHODS
Abraham modelSolute
Aliphatic Aromatic Halogen Aprotic polar Protic polar
Ani
on
[NT f2]− 80% 102% 64% 68% 114%[BF4]− 69% 21% 33% 114%
[SCN ]− 61% 48% 42% 64%[CF3SO3]− 41% 46% 24% 41%
[MDEGSO4]− 124%[OSO4]− 28% 26% 19% 30%[P F6]− 57% 98% 11%
[B(CN )4]− 52% 57% 17% 56%[T FA]− 61% 54%
[DMPO4]− 30%[DCA]− 28%
aAll 25 binary solute-solvent combinations have been made at 298.15 K. The colors areindicative: white, ARD<100%; light gray, 100%<ARD<300%; medium gray, 300%<ARD<500%; dark gray, 500%<ARD<103%; and black, ARD>105%.
5.5 Model Selection
In Table 5.5, for each combination of chemical systems, the model that mostaccurately predicts for that combination of chemical classes is listed. How-ever, this is not the only selection criteria of importance. Solvation models,such as MOSCED and the Abraham model, can only be used when all molec-ular parameters are known. GCMs and COSMO-RS are much more flexible,in the sense that (almost) every molecular structure can be drawn and the γ∞iparameter can be predicted. To improve the applicability range of MOSCEDand the Abraham model, recent efforts are made to predict the molecular pa-rameters for MOSCED by using a GCM50 or by using quantum mechanicalcharge density calculations.51,52 Moreover, isobaric vapor-liquid predictionsusing MOSCED have been shown to outperform UNIFAC.33 Regarding theAbraham model, it has been shown that solute parameters can be predictedby multilinear regression analysis and computational neural networks.53 Thelimited temperature range of, often, only 298.15 K is a drawback for SMs andLSER, and attempts have been made toward temperature-independent pa-rameters;54 however, this is not generalized yet.
It should be taken into consideration that the accuracy for predicting γ∞i by
Towards Sustainable Solvent-Based Affinity Separations 112

55555
COMPARISON OF γ∞ PREDICTION METHODS
Table 5.5: An overview of the most accurate predictive model of each specific category ofbinary molecular solvent – solute mixturesa
Best practiceSolute
Aliphatic Aromatic Halogen Aprotic polar Protic polar
Solv
ent
Aliphatic m.UNI(Do) m.UNI(Do) Abraham COSMO AbrahamAromatic COSMO COSMO MOSCED Abraham UNIFACHalogen MOSCED MOSCED COSMO MOSCED Abraham
Aprotic polar MOSCED MOSCED MOSCED MOSCED AbrahamProtic polar Abraham MOSCED Abraham MOSCED m.UNI(Ly)
aAbbreviations: m.UNI(Do) = mod. UNIFAC (Do), m.UNI(ly) = mod. UNIFAC (Ly) and COSMO =COSMO-RS.
GCMs can be improved when only γ∞i data are regressed and not the thermo-dynamic data of other forms (excess enthalpy for example). However, this willreduce the accuracy of other thermodynamic properties.4 Therefore, a sugges-tion could be made to regress a separate γ∞i -specific GCM that can obtain themost accurate γ∞i predictions. Overall, the model choice for the most accu-rate γ∞i must be a stepwise procedure. First, it should be ascertained whetherall molecular parameters of the chosen molecules are available in the litera-ture. If this is not the case, they may be predicted using theoretical or regres-sion methods, although the accuracy of these methods should always be takeninto consideration. When satisfactory molecular parameters are available, thebest practice matrix in Table 5.5 can be used to select the best model. Whenthe molecular parameters are lacking or are questionable (strongly deviatingfrom the same parameters for comparable molecules), then GCMs or COSMO-RS should be used for the prediction. Regarding ILs, the Abrahams model isthe most accurate model when the molecular parameters are known. Oth-erwise, GCMs of COSMO-RS must be used, although this will significantlyincrease the probability of deviation from the true value. Lastly, the applica-tion should be taken into consideration. GCMs and COSMO-RS can predict amuch wider range of molecular properties than the SMs and LSER.
113 Towards Sustainable Solvent-Based Affinity Separations

55555
COMPARISON OF γ∞ PREDICTION METHODS
5.6 Conclusions
Several models have been assessed for their ability to predict the infinite dilu-tion activity coefficient (γ∞i ) for solutes of various classes, in molecular sol-vents categorized in the same classes, and in ionic liquids (ILs). A largerARD was observed for ILs than for molecular solvents, because of the ad-ditional ionic interactions. Overall on average, the MOSCED model was themost accurate model for the prediction of γ∞i of all solute classes in molec-ular solvents, with an ARD of 16.2±1.35%. The UNIFAC group contributionmethods (GCMs), COSMO-RS, and the Abraham models perform compara-bly, with ARD values of 24.3-32.2%. Models using the Hildebrand parameterand the Hansen solubility parameters (HSP) are significantly less accurate,because of an insufficient description of intermolecular interactions such ashydrogen bonds. To predict the γ∞i in ILs, overall, the Abraham model is themost accurate model, with an ARD value of 65.1±4.50%. The GCMs are lessaccurate, with ARD values of 86.2-122%, while COSMO-RS is far less accu-rate, with an ARD value of 182±16.7%, because of a deficient description oflong-range interactions.
Upon classification of solutes and molecular solvents and evaluating the modelprediction accuracy for each of the solvent and solute classes, it is observedthat each of the models, except for the Hildebrand parameter and HSP, is mostaccurate for specific classes of binary solute-solvent pairs, although the accu-racy decreases with the polarity of the solute. For ILs, using the overall aver-ages, the Abraham model is most accurate, although several cations are moreaccurately described with modified UNIFAC (Ly) or modified UNIFAC (Do).The large ARD values from the UNIFAC models and the Abraham model aremainly due to large ARD values for the [NTF2]−, [BF4]−, and [MDEGSO4]−
anions. Hence, improving the prediction of these anions will greatly increasetheir overall prediction accuracy. Also, the most accurate model for molecularsolvents (MOSCED) could not be assessed for ILs. Therefore, an extension ofMOSCED toward ILs may become an accurate tool in predicting accurate γ∞ivalues in ILs. These evaluation results are applicable when each molecularparameter is either known or accurately predicted. If so, the most accuratemodel for estimation of γ∞i is dependent on both the solute and solvent cate-gories under evaluation. Still, using a γ∞i model to predict γ∞i for IL screening
Towards Sustainable Solvent-Based Affinity Separations 114

55555
COMPARISON OF γ∞ PREDICTION METHODS
should be done with caution, since these, on average, easily exceed deviationsof 65%.
5.7 Electronic Supplementary Information
All Electronic Supplementary Information is available free of charge on theACS Publications website at DOI: 10.1021/acs.iecr.9b00727. Specific param-eters, equations, and predictions for the various models; all experimental γ∞iused in the comparison, along with the corresponding references.
5.8 Nomenclature
AD = average deviationARD = average relative deviationUNIQUAC = Universal QuasichemicalUNIFAC = UNIQUAC Functional-group Activity CoefficientsCOSMO-RS = Conductor like Screening Model for Real SolventsDFT = density functional theoryESI = electronic Supporting InformationMOSCED = Modified Separation of Cohesive Energy DensityILs = ionic liquidsFILs = functionalized ionic liquidsNRTL = nonrandom two-liquid modelGCM = group contribution methodHSP = Hansen solubility parametersHF = Hartree-FockSCF = self-consistent fieldSM = solvation modelsTZVPD-Fine = fine grid triple-ζ valence polarized basis set[NT f2]− = bis(trifluoromethylsulfonyl)imide[BF4]− = tetrafluoroborate[SCN ]− = thiocyanate[CF3SO3]− = trifluoromethanesulfone
115 Towards Sustainable Solvent-Based Affinity Separations
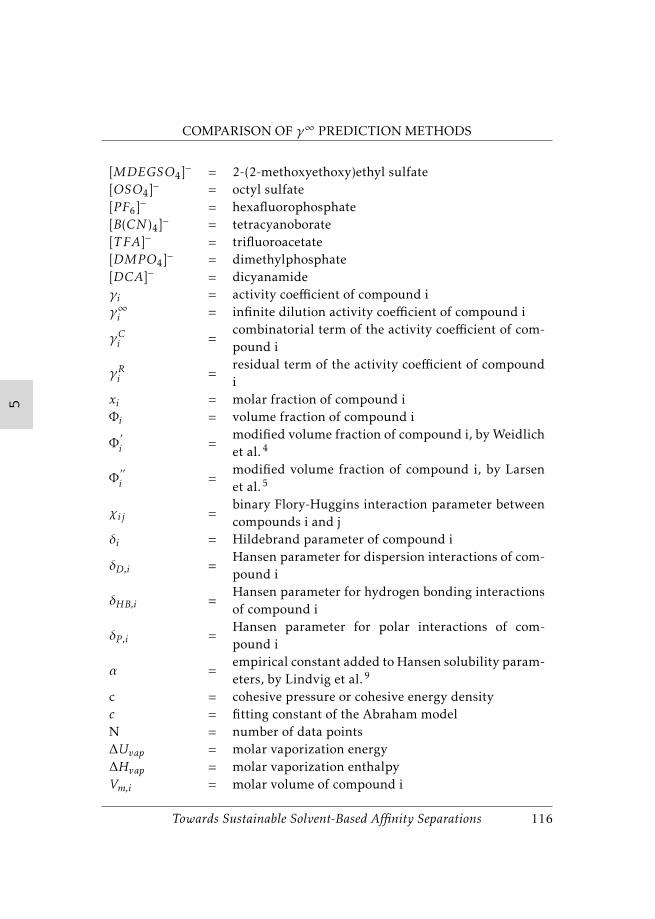
55555
COMPARISON OF γ∞ PREDICTION METHODS
[MDEGSO4]− = 2-(2-methoxyethoxy)ethyl sulfate[OSO4]− = octyl sulfate[P F6]− = hexafluorophosphate[B(CN )4]− = tetracyanoborate[T FA]− = trifluoroacetate[DMPO4]− = dimethylphosphate[DCA]− = dicyanamideγi = activity coefficient of compound iγ∞i = infinite dilution activity coefficient of compound i
γCi =combinatorial term of the activity coefficient of com-pound i
γRi =residual term of the activity coefficient of compoundi
xi = molar fraction of compound iΦi = volume fraction of compound i
Φ′i =
modified volume fraction of compound i, by Weidlichet al.4
Φ′′i =
modified volume fraction of compound i, by Larsenet al.5
χij =binary Flory-Huggins interaction parameter betweencompounds i and j
δi = Hildebrand parameter of compound i
δD,i =Hansen parameter for dispersion interactions of com-pound i
δHB,i =Hansen parameter for hydrogen bonding interactionsof compound i
δP ,i =Hansen parameter for polar interactions of com-pound i
α =empirical constant added to Hansen solubility param-eters, by Lindvig et al.9
c = cohesive pressure or cohesive energy densityc = fitting constant of the Abraham modelN = number of data points∆Uvap = molar vaporization energy∆Hvap = molar vaporization enthalpyVm,i = molar volume of compound i
Towards Sustainable Solvent-Based Affinity Separations 116
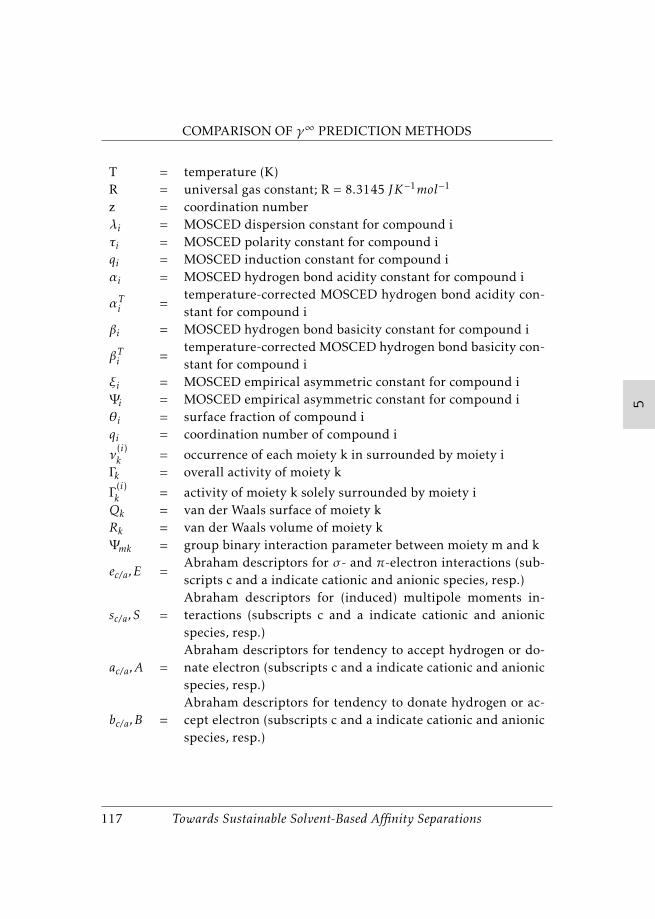
55555
COMPARISON OF γ∞ PREDICTION METHODS
T = temperature (K)R = universal gas constant; R = 8.3145 JK−1mol−1
z = coordination numberλi = MOSCED dispersion constant for compound iτi = MOSCED polarity constant for compound iqi = MOSCED induction constant for compound iαi = MOSCED hydrogen bond acidity constant for compound i
αTi =temperature-corrected MOSCED hydrogen bond acidity con-stant for compound i
βi = MOSCED hydrogen bond basicity constant for compound i
βTi =temperature-corrected MOSCED hydrogen bond basicity con-stant for compound i
ξi = MOSCED empirical asymmetric constant for compound iΨi = MOSCED empirical asymmetric constant for compound iθi = surface fraction of compound iqi = coordination number of compound i
ν(i)k = occurrence of each moiety k in surrounded by moiety i
Γk = overall activity of moiety k
Γ(i)k = activity of moiety k solely surrounded by moiety iQk = van der Waals surface of moiety kRk = van der Waals volume of moiety kΨmk = group binary interaction parameter between moiety m and k
ec/a,E =Abraham descriptors for σ - and π-electron interactions (sub-scripts c and a indicate cationic and anionic species, resp.)
sc/a,S =Abraham descriptors for (induced) multipole moments in-teractions (subscripts c and a indicate cationic and anionicspecies, resp.)
ac/a,A =Abraham descriptors for tendency to accept hydrogen or do-nate electron (subscripts c and a indicate cationic and anionicspecies, resp.)
bc/a,B =Abraham descriptors for tendency to donate hydrogen or ac-cept electron (subscripts c and a indicate cationic and anionicspecies, resp.)
117 Towards Sustainable Solvent-Based Affinity Separations

55555
COMPARISON OF γ∞ PREDICTION METHODS
vc/a,V =Abraham descriptors for the work/tendency required toform cavities (subscripts c and a indicate cationic and anionicspecies, resp.)
lc/a,L =Abraham descriptors for the work/tendency required toform cavities (subscripts c and a indicate cationic and anionicspecies, resp.)
POi = vapor pressure of the pure solventKS = gas-solvent partition coefficientPS = water-solvent partition coefficientEcontact = local contact energyEmisf it = misfit energyEHB = energy due to hydrogen bonding effectsσ = polarization charge densityσ ′ = polarization charge density on the opposite side
5.9 References
[1] A. A. Kiss, J.-P. Lange, B. Schuur, D. W. F. Brilman, A. G. van der Ham, and S. R. Kersten, “Separationtechnology–making a difference in biorefineries,” Biomass and Bioenergy, vol. 95, pp. 296–309, 2016.
[2] D. S. Sholl and R. P. Lively, “Seven chemical separations to change the world,” Nature, vol. 532, no. 7600,pp. 435–437, 2016.
[3] M. H. Abraham, “Scales of solute hydrogen-bonding: their construction and application to physicochem-ical and biochemical processes,” Chemical Society Reviews, vol. 22, no. 2, pp. 73–83, 1993.
[4] U. Weidlich and J. Gmehling, “A modified unifac model. 1. prediction of vle, he, and. gamma.. infin.,”Industrial & engineering chemistry research, vol. 26, no. 7, pp. 1372–1381, 1987.
[5] B. L. Larsen, P. Rasmussen, and A. Fredenslund, “A modified unifac group-contribution model for predic-tion of phase equilibria and heats of mixing,” Industrial & engineering chemistry research, vol. 26, no. 11,pp. 2274–2286, 1987.
[6] M. J. Lazzaroni, D. Bush, C. A. Eckert, T. C. Frank, S. Gupta, and J. D. Olson, “Revision of mosced param-eters and extension to solid solubility calculations,” Industrial & engineering chemistry research, vol. 44,no. 11, pp. 4075–4083, 2005.
[7] J. H. Hildebrand et al., Solubility of Non-electrolytes. Reinhold Pub., 1936.[8] C. M. Hansen, “Three dimensional solubility parameter-key to paint-component affinities: Dyes, emulsi-
fiers, mutual solubility and compatibility, and pigments.,” J. Paint. Technol., vol. 39, p. 505, 1967.[9] T. Lindvig, M. L. Michelsen, and G. M. Kontogeorgis, “A flory–huggins model based on the hansen solu-
bility parameters,” Fluid Phase Equilibria, vol. 203, no. 1-2, pp. 247–260, 2002.[10] A. Klamt, F. Eckert, and W. Arlt, “Cosmo-rs: an alternative to simulation for calculating thermodynamic
properties of liquid mixtures,” Annual review of chemical and biomolecular engineering, vol. 1, pp. 101–122,2010.
[11] A. Fredenslund, R. L. Jones, and J. M. Prausnitz, “Group-contribution estimation of activity coefficientsin nonideal liquid mixtures,” AIChE Journal, vol. 21, no. 6, pp. 1086–1099, 1975.
[12] F. London, “The general theory of molecular forces,” Transactions of the Faraday Society, vol. 33, pp. 8b–26,1937.
Towards Sustainable Solvent-Based Affinity Separations 118

55555
COMPARISON OF γ∞ PREDICTION METHODS
[13] P. Debye, “Van der waals cohesion forces,” Physikalische Zeitschrift, vol. 21, pp. 178–187, 1920.[14] W. Keesom, “Van der waals attractive force,” Physikalische Zeitschrift, vol. 22, pp. 129–141, 1921.[15] J. N. Israelachvili, Intermolecular and surface forces. Academic press, 2015.[16] P. Alessi, M. Fermeglia, and I. Kikic, “Significance of dilute regions,” Fluid Phase Equilibria, vol. 70, no. 2-
3, pp. 239–250, 1991.[17] C. B. Castells, P. W. Carr, D. I. Eikens, D. Bush, and C. A. Eckert, “Comparative study of semitheoretical
models for predicting infinite dilution activity coefficients of alkanes in organic solvents,” Industrial &engineering chemistry research, vol. 38, no. 10, pp. 4104–4109, 1999.
[18] J. Gmehling, J. Li, and M. Schiller, “A modified unifac model. 2. present parameter matrix and results fordifferent thermodynamic properties,” Industrial & Engineering Chemistry Research, vol. 32, no. 1, pp. 178–193, 1993.
[19] M. J. Hait, C. L. Liotta, C. A. Eckert, D. L. Bergmann, A. M. Karachewski, A. J. Dallas, D. I. Eikens, J. J.Li, and P. W. Carr, “Space predictor for infinite dilution activity coefficients,” Industrial & engineeringchemistry research, vol. 32, no. 11, pp. 2905–2914, 1993.
[20] J. H. Park and P. W. Carr, “Predictive ability of the mosced and unifac activity coefficient estimationmethods,” Analytical Chemistry, vol. 59, no. 21, pp. 2596–2602, 1987.
[21] R. Putnam, R. Taylor, A. Klamt, F. Eckert, and M. Schiller, “Prediction of infinite dilution activity coeffi-cients using cosmo-rs,” Industrial & engineering chemistry research, vol. 42, no. 15, pp. 3635–3641, 2003.
[22] E. R. Thomas and C. A. Eckert, “Prediction of limiting activity coefficients by a modified separation ofcohesive energy density model and unifac,” Industrial & Engineering Chemistry Process Design and Devel-opment, vol. 23, no. 2, pp. 194–209, 1984.
[23] E. C. Voutsas and D. P. Tassios, “Prediction of infinite-dilution activity coefficients in binary mixtureswith unifac. a critical evaluation,” Industrial & engineering chemistry research, vol. 35, no. 4, pp. 1438–1445, 1996.
[24] Z. Xue, T. Mu, and J. Gmehling, “Comparison of the a priori cosmo-rs models and group contributionmethods: original unifac, modified unifac (do), and modified unifac (do) consortium,” Industrial & engi-neering chemistry research, vol. 51, no. 36, pp. 11809–11817, 2012.
[25] P. J. Flory, “Thermodynamics of high polymer solutions,” The Journal of chemical physics, vol. 10, no. 1,pp. 51–61, 1942.
[26] M. L. Huggins, “Some properties of solutions of long-chain compounds.,” The Journal of Physical Chem-istry, vol. 46, no. 1, pp. 151–158, 1942.
[27] S. Sayegh and J. Vera, “Lattice-model expressions for the combinatotial entropy of liquid mixtures: acritical discussion,” The Chemical Engineering Journal, vol. 19, no. 1, pp. 1–10, 1980.
[28] G. J. Krooshof, R. Tuinier, and G. de With, “Generalization of guggenheim’s combinatorial activity coeffi-cient equation,” Journal of Molecular Liquids, vol. 266, pp. 467–471, 2018.
[29] G. J. P. Krooshof, “Combinatorial and dispersion activity coefficient models for molecular solutions,”2019.
[30] I. Kikic, P. Alessi, P. Rasmussen, and A. Fredenslund, “On the combinatorial part of the unifac and uni-quac models,” The Canadian Journal of Chemical Engineering, vol. 58, no. 2, pp. 253–258, 1980.
[31] A. Barton, “M.(1991) handbook of solubility parameters and other cohesion parameters.”[32] C. M. Hansen, Hansen solubility parameters: a user’s handbook. CRC press, 2007.[33] P. Dhakal, S. N. Roese, E. M. Stalcup, and A. S. Paluch, “Application of mosced to predict limiting activity
coefficients, hydration free energies, henry’s constants, octanol/water partition coefficients, and isobaricazeotropic vapor–liquid equilibrium,” Journal of Chemical & Engineering Data, vol. 63, no. 2, pp. 352–364,2018.
[34] A. Staverman, “The entropy of high polymer solutions. generalization of formulae,” Recueil des TravauxChimiques des Pays-Bas, vol. 69, no. 2, pp. 163–174, 1950.
[35] J. L. Abboud, M. J. Kamlet, and R. Taft, “Regarding a generalized scale of solvent polarities,” Journal ofthe American Chemical Society, vol. 99, no. 25, pp. 8325–8327, 1977.
[36] M. J. Kamlet, J. L. Abboud, and R. Taft, “The solvatochromic comparison method. 6. the. pi.* scale ofsolvent polarities,” Journal of the American Chemical Society, vol. 99, no. 18, pp. 6027–6038, 1977.
[37] M. J. Kamlet, P. W. Carr, R. Taft, and M. H. Abraham, “Linear solvation energy relationships. 13. rela-tionship between the hildebrand solubility parameter,. delta. h, and the solvatochromic parameter,. pi.,”
119 Towards Sustainable Solvent-Based Affinity Separations

55555
COMPARISON OF γ∞ PREDICTION METHODS
Journal of the American Chemical Society, vol. 103, no. 20, pp. 6062–6066, 1981.[38] M. J. Kamlet and R. Taft, “The solvatochromic comparison method. i. the. beta.-scale of solvent hydrogen-
bond acceptor (hba) basicities,” Journal of the American chemical Society, vol. 98, no. 2, pp. 377–383, 1976.[39] R. Taft, J.-L. M. Abboud, and M. J. Kamlet, “Solvatochromic comparison method. 20. linear solvation
energy relationships. 12. the d. delta. term in the solvatochromic equations,” Journal of the AmericanChemical Society, vol. 103, no. 5, pp. 1080–1086, 1981.
[40] L. Sprunger, M. Clark, W. E. Acree, and M. H. Abraham, “Characterization of room-temperature ionicliquids by the abraham model with cation-specific and anion-specific equation coefficients,” Journal ofchemical information and modeling, vol. 47, no. 3, pp. 1123–1129, 2007.
[41] F. Eckert and A. Klamt, “Fast solvent screening via quantum chemistry: Cosmo-rs approach,” AIChEJournal, vol. 48, no. 2, pp. 369–385, 2002.
[42] J. Wang, W. Sun, C. Li, and Z. Wang, “Correlation of infinite dilution activity coefficient of solute in ionicliquid using unifac model,” Fluid Phase Equilibria, vol. 264, no. 1-2, pp. 235–241, 2008.
[43] Z. Lei, C. Dai, X. Liu, L. Xiao, and B. Chen, “Extension of the unifac model for ionic liquids,” Industrial &engineering chemistry research, vol. 51, no. 37, pp. 12135–12144, 2012.
[44] R. Kato and J. Gmehling, “Systems with ionic liquids: Measurement of vle and γ∞ data and prediction oftheir thermodynamic behavior using original unifac, mod. unifac (do) and cosmo-rs (ol),” The Journal ofChemical Thermodynamics, vol. 37, no. 6, pp. 603–619, 2005.
[45] S. Nebig, R. Bölts, and J. Gmehling, “Measurement of vapor–liquid equilibria (vle) and excess enthalpies(he) of binary systems with 1-alkyl-3-methylimidazolium bis (trifluoromethylsulfonyl) imide and predic-tion of these properties and γ∞ using modified unifac (dortmund),” Fluid phase equilibria, vol. 258, no. 2,pp. 168–178, 2007.
[46] S. Nebig, V. Liebert, and J. Gmehling, “Measurement and prediction of activity coefficients at infinitedilution (γ∞), vapor–liquid equilibria (vle) and excess enthalpies (he) of binary systems with 1, 1-dialkyl-pyrrolidinium bis (trifluoromethylsulfonyl) imide using mod. unifac (dortmund),” Fluid phase equilibria,vol. 277, no. 1, pp. 61–67, 2009.
[47] K. Paduszyński and U. Domańska, “Extension of modified unifac (dortmund) matrix to piperidiniumionic liquids,” Fluid Phase Equilibria, vol. 353, pp. 115–120, 2013.
[48] S. Nebig and J. Gmehling, “Prediction of phase equilibria and excess properties for systems with ionicliquids using modified unifac: Typical results and present status of the modified unifac matrix for ionicliquids,” Fluid phase equilibria, vol. 302, no. 1-2, pp. 220–225, 2011.
[49] G. W. Meindersma, A. J. Podt, and A. B. de Haan, “Selection of ionic liquids for the extraction of aromatichydrocarbons from aromatic/aliphatic mixtures,” Fuel Processing Technology, vol. 87, no. 1, pp. 59–70,2005.
[50] P. Dhakal, S. N. Roese, E. M. Stalcup, and A. S. Paluch, “Gc-mosced: A group contribution method for pre-dicting mosced parameters with application to limiting activity coefficients in water and octanol/waterpartition coefficients,” Fluid Phase Equilibria, vol. 470, pp. 232–240, 2018.
[51] S. Diaz-Rodriguez, S. M. Bozada, J. R. Phifer, and A. S. Paluch, “Predicting cyclohexane/water distributioncoefficients for the sampl5 challenge using mosced and the smd solvation model,” Journal of computer-aided molecular design, vol. 30, no. 11, pp. 1007–1017, 2016.
[52] J. R. Phifer, K. J. Solomon, K. L. Young, and A. S. Paluch, “Computing mosced parameters of nonelectrolytesolids with electronic structure methods in smd and sm8 continuum solvents,” AIChE Journal, vol. 63,no. 2, pp. 781–791, 2017.
[53] J. Jover, R. Bosque, and J. Sales, “Determination of abraham solute parameters from molecular structure,”Journal of chemical information and computer sciences, vol. 44, no. 3, pp. 1098–1106, 2004.
[54] C. Mintz, T. Ladlie, K. Burton, M. Clark, W. E. Acree Jr, and M. H. Abraham, “Characterization of thepartitioning of gaseous solutes into humic acid with the abraham model and temperature-independentequation coefficients,” QSAR & Combinatorial Science, vol. 27, no. 4, pp. 483–491, 2008.
Towards Sustainable Solvent-Based Affinity Separations 120


666666
6Vapor-Liquid Equilibria Predictionfrom Exces Molar Enthalpy
"Mathematics is a language",Josiah Willard Gibbs, (1839 - 1903)
This chapter is adapted from:Brouwer, T., Crespo, E.A., Bargeman, G., ten Kate, A.J.B., Coutinho, J.A.P.,Kersten, S.R.A. and Schuur, B., "Isobaric Vapor-Liquid Equilibrium predic-tion from the Excess Molar Enthalpy using cubic Equation of States and PC-SAFT.", (Article in Preparation)

666666
VLE PREDICTION FROM THE HEAT OF MIXING
6.1 Introduction
For the design of separation columns, including distillation columns, know-ing the equilibrium between two phases is vital. The vapor-liquid equilib-rium (VLE) is for instance required for an accurate design of a distillationcolumn, while the liquid-liquid equilibrium (LLE) is for a liquid-liquid ex-traction column. We will focus on the equilibrium between the vapor andliquid phase. Experimental measurements of these equilibria are commontechniques, but laborious. Practitioners in industry and academia requirea significant amount of samples and measurements are time-consuming.1
Hence, finding and/or developing an alternative method that requires only afew measurements, which are ideally uncomplicated, could be a way of savingnot only time but also money. Ten Kate et al.2 showed this may be possible viathe correlation of spectroscopic results and a liquid phase activity coefficientmodel, they applied UNIQUAC. In this chapter, it is attempted to develop acomparable method, though from another angle which is based around theidea of the measurement of the heat of mixing between two components.
An approach is formulated which can convert the mixing heat, or also calledthe excess molar enthalpy (HE), via a thermodynamic description to a pre-diction of the isobaric VLE behavior. In essence, three types of component-specific parameters describe the VLE behavior as can be seen in Equation 6.1for a binary case,
αij =P 0i
P 0j
(γiϕjγjϕi
)= αIDij Sji (6.1)
which are the pure component vapor pressure (P 0i ), the activity coefficient (γi)
and the fugacity coefficient (ϕi). The vapor pressure describes the temperature-dependent volatility of a compound in its pure form and is the only parameterof significance in an ideal case. The ratio of these vapor pressures is thereforereferred to as the ideal relative volatility (αIDij ). In an ideal mixture, where theassumption is that there is no distinction between all compounds and there-fore all intermolecular interactions appear to be equal, Raoult’s law will befollowed (Pi = P 0
i xi). This law states that the partial pressure (Pi) of a com-pound is directly proportional to the molar fraction of the compound in the
Towards Sustainable Solvent-Based Affinity Separations 124

666666
VLE PREDICTION FROM THE HEAT OF MIXING
liquid phase (xi) and the pure-component vapor pressure (P 0i ).3
This is, however, not always applicable, as most mixtures do depart from ide-ality as the compounds differ in chemical nature. This requires a distinctionbetween the different compounds and the corresponding molecular proper-ties, which ultimately results in distinct intermolecular interactions that can-not be ignored. The activity and fugacity coefficients describe this deviationor departure from ideality in resp. the liquid and the vapor phase. This istaken into account in the modified Raoult’s law, see Equation 6.2,4
ϕiPi = P 0i ai = P 0
i xiγi (6.2)
where the molar fraction of the compound is replaced by the activity of thecompound (ai), which is, in turn, the multiplication of the molar fraction andthe activity coefficient of that specific compound (γi). The expression of theactivity of each compound in each phase is a crucial requirement for describ-ing equilibrium, as was referred to in chapter 2, since at this dynamic equi-librium the activity of each compound in each phase is by definition alwaysequal, to allow for no net transfer of the compound between the phases.
When differences in intermolecular interactions are insignificant, near-idealbehavior can be observed. This occurs when the γi and ϕi both approach1. Deviation from this situation can arise when either net attractive interac-tions occur (γi or/and ϕi < 1) or net repulsive interactions are induced (γior/and ϕi > 1). Possible consequences of this non-ideal behavior can manifestin pinch-point and/or azeotrope formation which complicates the separationof that mixture via traditional distillation. A pinch-point is a (local) reduc-tion of the relative volatility which makes the separation more difficult, as theachieved concentration increase in the vapor phase is lessened, though notinfeasible as the vapor- and liquid composition do not reach equality. In the(worst) case, the vapor and liquid compositions become equal and no separa-tion is possible. This is called an azeotrope.
The pure-component vapor pressures of molecules needed for the VLE de-scription, see Equation 6.1, are extensively tabulated using for instance An-toine coefficients, see Yaws Handbook5 or the National Institute of Standards
125 Towards Sustainable Solvent-Based Affinity Separations

666666
VLE PREDICTION FROM THE HEAT OF MIXING
and Technology of the U.S. Department of Commerce (NIST) database.6 Theactivity and fugacity coefficients are however not always available, becausethey are composition- and temperature-dependent. A limiting case is the in-finite dilution activity coefficient, γ∞i . By describing the γ∞i , the composi-tion dependency is eliminated and the non-ideality of a compound (or solute)within a solvent that is (almost) pure can be described with a single value ata certain temperature. For a VLE diagram, the activity coefficient is, however,required over the entire composition range and, still, the measurement of newγ∞i is not easy and specialized equipment is required.7 Therefore it was cho-sen to investigate an alternative method where new experimental data is ef-fectively obtained while using only small quantities of chemicals through themeasurement of the heat that is either released or absorbed during the mixingof liquids, or also named the excess molar enthalpy (HE).
The method developed in this chapter describes how to correlate HE to theactivity coefficient (γi , the derivative of the excess Gibbs energy) and the fu-gacity coefficient (ϕi). To make this possible, it is necessary to formulate theexcess (molar) Gibbs energy (Jmol−1), Equation 6.3,
GE =HE − T SE (6.3)
While the HE (Jmol−1, specifically a mol of the entire mixture) can be directlymeasured as the heat of mixing, the excess entropy (SE , Jmol−1K−1) is not di-rectly measurable. There are, however, many models available which defineand describe the entropy.8 For this reason, the entropy can mathematically bedescribed using a thermodynamic model. Pinpointing and modeling the ap-propriate thermodynamic models which can accurately describe the entropyis for this method essential and the core of this method.
Hanks et al.9 already mentioned almost 20 years ago the possibility of usingthe NRTL or Wilson model to predict VLE diagrams from excess molar en-thalpy. The limitation of the Wilson equation was however seen to be thataccurate results can only occur when the maximum HE was lower than 0.69kJmol−1,10 which was also stated by Voňka et al.11 The NRTL equation suffersfrom a significant limitation that in the case of extreme parameters (∼ 106),the NRTL equation degenerates towards an ideal solution model, and accurate
Towards Sustainable Solvent-Based Affinity Separations 126

666666
VLE PREDICTION FROM THE HEAT OF MIXING
predictions are only made if the maximum HE is lower than 0.42 kJ/mol.10
Additionally, Voňka et al. stated the inability of NRTL equation to fit specifi-cally S-shaped entropic contributions.11 These observations direct towards aconclusion that the approach would work for systems relatively close to ideal,with small HE and a subsequent neglectable excess entropy (SE). This seemsto be confirmed by the results of Calzón et al.12 who showed that the VLEof n-octane and hexane isomers can be accurately predicted from the excessmolar enthalpy using either the Wilson equation or the NRTL model with afixed non-randomness factor (αij ).
Simultaneous representation of the excess molar enthalpy (HE) and the iso-baric VLE has been considered an important goal in the application of cubicEquations of States (cEoS), and was seen to be accurate for some systems. Ex-cess molar enthalpy can be correlated with high accuracy and may even out-perform liquid phase activity coefficient models.13,14 However, only crude es-timations could be obtained via cross-prediction between VLE and HE . Usingbinary interaction parameters (BIPs) obtained fromHE correlations to predictVLE was seen to be the least accurate.13,14 This was, however, only checkedfor a single system, and a systematic approach for developing cEoS parame-ters based on HE data has not been reported to the best of our knowledge.
In this chapter, both the use of activity coefficient models and the cEoS mod-els are evaluated on their usefulness for predicting VLE from HE data. Inthe following subsections, first, the theory on both the liquid phase activitycoefficient models and the cubic equations of state (cEoS) models includingvariations with associative terms will be introduced. Then, the applicabilityof these models will be investigated to correlate the activity coefficients withHE , allowing for the prediction of the VLE behavior.
6.2 Thermodynamic models
6.2.1 Liquid phase activity coefficient models
Several liquid phase activity coefficient models of varying complexity are -known which are based on the molar Gibbs energy, such as the van Laarmodel,15 Wilson model,16 Margules model,17 Universal Quasichemical (UNI-
127 Towards Sustainable Solvent-Based Affinity Separations

666666
VLE PREDICTION FROM THE HEAT OF MIXING
QUAC) model18 and Non-Random Two-Liquid (NRTL) model.19 The Gibbsenergy can be defined as the summation of the Gibbs energy of an ideal solu-tion (GID ) and an excess term which accounts for the non-ideal behavior (GE),see Equation 6.4,
G = GID +GE (6.4)
where theGID can subsequently be defined as a summation of all molar Gibbsenergies (Gi) multiplied by the specific molar fraction, xi . The excess term ofthe Gibbs energy (GE) is related to the activity coefficient at constant temper-ature and pressure, as the latter is the partial derivative, as can be seen inEquation 6.5,
RT lnγi =(∂GE
∂xi
)T ,P
= GE (6.5)
In a binary system, the well-known Gibbs-Duhem equation can be used toconvert the excess Gibbs energy of a binary system into the individual excessmolar Gibbs energies.Each liquid activity coefficient model has a different manner of incorporatinginteraction parameters in the activity coefficient description to estimate/pre-dict the non-ideality in a mixture. Because we are specifically interested inthe correlation between the Gibbs energy and the excess molar enthalpy (HE),we need to describe how the Gibbs energy changes as a function of the tem-perature and pressure. By following the Gibbs-Helmholtz relation, see Equa-tion 6.6, a generic expression which correlates the Gibbs energy and the en-thalpy, the excess Gibbs energy can be correlated with the excess molar en-thalpy (HE).20
((∂GE/T )∂T
)P
= −HE
T 2 (6.6)
6.2.2 cubic Equation of State
The second type of model incorporated in this work is the Equation of State(EoS). These models are mathematical constructions that detail the depen-dence of three observable parameters, namely temperature (T), pressure (P),
Towards Sustainable Solvent-Based Affinity Separations 128

666666
VLE PREDICTION FROM THE HEAT OF MIXING
and (molar) volume (V or Vm = V/n). The most simple EoS is the ideal gaslaw, see Equation 6.7, which was first stated by Claperyon in 1834,21
P V = nRT ∨ P Vm = RT (6.7)
This law incorporates the three observable parameters, the molar amount (n),and the universal gas constant, R. Both academia and industry use EoS to cal-culate thermodynamic properties. Accurate temperature, pressure, and com-position profiles can be determined for a wide range of mixtures and corre-sponding processes.22 Cubic Equations of States (cEoS) are the most popularclass and originates from the Van der Waals (VdW) equation of state. Vander Waals for the first time formulated a thermodynamic model for both fluidphases as the ideal gas law does not differentiate between gas and vapor, seeEquation 6.8, and though is still generally only applied to gasses.23
P =RTVm − b
− a
V 2m
(6.8)
From a statistical point of view, these parameters can be obtained by a Lennard-Jones type of potential, where the hard-core volume of the molecule can beconsidered to be a repulsive parameter (b) and the intermolecular attractionparameter (a) is associated with the ε parameter which is a representation ofthe intermolecular interactions.
Since Van der Waals in 1873 published his dissertation, numerous adaptionsof the VdW cEoS have been published to include more extreme conditionsand/or to accurately incorporate increasingly more complex molecules be-having non-ideal. Commonly applied adaptations are the (Soave-)Redlich-Kwong,24,25 Peng-Robinson,26 and the Petal-Teja27 cEoS, though many othersare present in literature and they all originate and follow the Van der Waalsmathematical framework. These equations are named cubic as they can berewritten as a cubic function of the molar volume, expressed as the compress-ibility factor (Z). This Z-value is indicative of the non-ideality of the fluid, andis defined according to Equation 6.9,
Z =P VmRT
(6.9)
129 Towards Sustainable Solvent-Based Affinity Separations

666666
VLE PREDICTION FROM THE HEAT OF MIXING
This definition allows quick comparison with ideal fluids because, for an idealfluid, the Z-value is equal to unity, which results in the ideal gas law. For non-ideal cases where two fluid phases can co-exist, to describe the system, theZ-value is essential.
In the mathematical framework of the cEoS the Z-values of both fluid phasescan be determined by finding the three roots of which the smallest and largestroot each correlate to resp. the liquid (ZL) phase and the gas or vapor phase(ZV ) in subcritical conditions. The middle root does not have a physical mean-ing. The determination of the Z-value allows the description of a variety ofother thermodynamic quantities arising from the deviation or departure fromideality. Collectively these quantities are known as departure functions. Allthese departure functions have the form seen in Equation 6.10,
Xdep = X −Xig (6.10)
Where the departure function of quantity X (Xdep) is always the difference be-tween the absolute quantity (X) and of a reference state. In the mathematicalframework of cEoS, this reference state is an ideal gas (ig).
For this work, we are interested in the excess molar enthalpy and the fugac-ity. These quantities can be derived from the compressibility description as afunction of i.a. the molar volume.28 Deriving the departure functions fromcEoS is not straight-forward, and requires some elaboration, which is coveredin chapter 12, which is an Appendix dedicated to more details concerningthermodynamics. In conclusion, the excess molar enthalpy and fugacity as afunction of the compressibility factor relation are seen in resp. Equation 6.11and Equation 6.12,
Hdep =HE =H −H ig = RT∫ ρ
0−T
(∂Z∂T
)ρ
dρ
ρ+ (Z − 1) (6.11)
lnfi =∫ ρ
0(Z − 1)
dρ
ρ+ (Z − 1)− lnZ (6.12)
where it can be seen that each quantity is a function of the compressibilityfactor (Z), the universal gas constant (R), the temperature (T) and the molardensity (ρ) which is the inverse of the molar volume (Vm). Upon the choice of
Towards Sustainable Solvent-Based Affinity Separations 130

666666
VLE PREDICTION FROM THE HEAT OF MIXING
the Z-factor, the fugacity can be distinguished between the liquid- or vaporphase fugacity. These quantities are at isobaric conditions, though isochoricrelations can also be derived.
Mixing rules are introduced to extend the cEoS description from pure com-ponents towards mixtures. These relations describe the way pure componentparameters, for instance, the a and b parameters, of the Van der Waals equa-tion vary as a function of the composition. These mixing rules are in a generalform of,
M =n∑i
n∑j
xixjmij (6.13)
where mij can be all binary interaction parameters which are a function ofpure component parameters, such as a and b resp. the binary attraction andrepulsion term. There are various mixing rules, which deviate in the mannerof the attraction and/or repulsion term description. The most simple mixingrule is the linear average of the pure component parameters, which does notinclude any binary interaction parameters (BIPs). More rigorous mixing rulesare often used, which do include one or multiple BIPs which can be fitted tobest describe a specific mixture.
More complex equations of states attempt to include the high non-ideality ofi.a. hydrogen bonding with an associative term. These models are for exam-ple PC-SAFT29 or the Cubic equation of state Plus Association (CPA) model.30
These models add the associative term (Zass), see Equation 6.14 which is de-scribed by Michelsen and Hendriks.31
P VmRT
= Z = Zrep +Zatt +Zass(εAiBj ,βAiBj ) (6.14)
In the center of this term is a correlation between the amount of bonded- andnon-bonded sites, which is a way of describing the self-association of com-ponents. For an accurate description, 2 additional physical pure componentcompounds are required. The association interaction is a function of the as-sociation energy (εAiBj ) and volume (βAiBj ), where Ai and Bj are specifiedbinding sites for the association for components i and j. Additionally, vari-
131 Towards Sustainable Solvent-Based Affinity Separations

666666
VLE PREDICTION FROM THE HEAT OF MIXING
ous association schemes can be chosen which increases the flexibility of thismodel even further.30
6.3 Methodology
In this proposed methodology, we evaluate various thermodynamic modelsthat can fit excess molar enthalpy (HE) by fitting the binary interaction pa-rameter(s) (BIP(s)), and via the subsequent entropic description by these mod-els, can predict the Gibbs energy which in turn sets the activity- and fugacitycoefficients to allow for a VLE prediction, see Figure 6.1.
Figure 6.1: A schematic representation of the proposed methodology where either a cubicequation of state (cEoS) in combination with mixing rule (MR) with critical constants aspure-component input parameters or a liquid phase activity coefficient model (LACM) isfitted to experimental excess molar enthalpy (HE) which determines the binary interactionparameter(s) (BIP(s)). This allows for a prediction of the isobaric vapor-liquid equilibrium(VLE) which can be compared with the experimental equivalent. The average relative devia-tion (ARD) of theHE , concentration (y) and temperature (T) profile eventually determined.
To assess the applicability of this methodology properly, the following foursteps have been established:1. Experimental data collection: the excess molar enthalpy or heat of mix-ing (HE), isobaric VLE data and the necessary constants (e.g. TC , PC and ω)of as many different binary systems as possible have been collected. This is
Towards Sustainable Solvent-Based Affinity Separations 132

666666
VLE PREDICTION FROM THE HEAT OF MIXING
essential, as this allows for the assessment of the applicability range of themethodology.
Figure 6.2: An overview of 204 binary systems, which is a combination of two moleculeswith a specific functional group. Additionally, the color indication represents the amountbinary system that has experimental excess molar enthalpy (HE) and experimental isobaricvapor-liquid equilibrium (VLE). All experimental data are from 913 research articles andcan be found in section 6.6
In Figure 6.2, an overview of the types of molecules is presented in which alltypes of evaluated binary systems (204 in total) are categorized on the func-tional groups present in either compound. Both experimental excess molarenthalpy and isobaric vapor-liquid equilibrium (VLE) data are required to as-sess the methodology of fitting the HE to predict the isobaric VLE behavior(xy- and Txy-diagrams) regarding their accuracy.
2. Enthalpy Fitting: Each of the binary systems, represented in Figure 6.2 isindividually fitted with a thermodynamical model. During this fitting, thebinary interaction parameters (BIPs) are found. This thermodynamic modelcan either be a liquid activity coefficient model of a cEoS with a mixing rule,shown in the previous sections. To illustrate the procedure, a single system (n-heptane / 2-butanone) is fitted with a single thermodynamic model, i.e. thePeng-Robinson (PR) cEoS with the Stryjek-Vera Margules-type mixing rule.
133 Towards Sustainable Solvent-Based Affinity Separations

666666
VLE PREDICTION FROM THE HEAT OF MIXING
The fit of the experimental HE 32–36 with this model can be seen in Figure 6.3.The fitting was done by minimizing the overall deviation relative to the ex-perimental HE by variation of the binary interaction parameters (BIPs) in themixing rule.
Figure 6.3: Experimental excess molar enthalpy32–36 of the binary n-heptane/2-butanonemixture at 298K, 318K and 328K was fitted with the Peng-Robinson equation of state withStryjek-Vera Margules-type mixing rule.
As can be seen in Figure 6.3, this thermodynamic model accurately describesthe HE , while the difference in HE at each of the temperatures is insignifi-cant in this case. This does not immediately mean that the differences in theactivity- and fugacity coefficients are also insignificant. This is evaluated inthe third step.
3. Activity- and fugacity coefficient prediction: Following the fitting of theHE
at different temperatures, the temperature-dependent BIPs can be either useddirectly, be averaged if they do not change significantly, or a temperature-dependent correlation can be made. In this case, the average was used of thefitted BIPs. In Figure 6.4, the activity coefficients and fugacity coefficients forthe same binary system n-heptane/2-butanone are shown.It can be seen, that there are some differences in the activity coefficient as a
Towards Sustainable Solvent-Based Affinity Separations 134

666666
VLE PREDICTION FROM THE HEAT OF MIXING
Figure 6.4: Predicted (left) activity and (right) fugacity coefficients of the binary mixturen-heptane and 2-butanone at 298K, 318K and 328K was fitted with the Peng-Robinsonequation of state with Stryjek-Vera Margules-type mixing rule.
function of the temperature, while a neglectable deviation is seen in the fu-gacity coefficient. The non-ideality decreases as the temperature increases,which is due to the temperature dependency of the entropy. Additionally, thefugacity coefficients are much smaller than the activity coefficients, indicat-ing that non-ideality in the vapor phase is less pronounced. This is due to thefact the vapor density is much smaller compared to the liquid phase, hencethe probability of molecules to interact is much smaller. Also, it can be seenthat the fugacity coefficient is not 1 in the pure component situation. Thisis a direct consequence of the different definitions of the fugacity coefficientcompared to the activity coefficient.
4. Vapor-liquid equilibrium prediction: The obtained temperature-dependentactivity and fugacity coefficients are essential for the accurate temperature(Txy) profile and the concentration (xy) profile of an isobaric vapor-liquidequilibrium (VLE). For each composition, a Van ’t Hoff type correlation (seeEquation 6.15) was made to allow inter-and extrapolation of the non-idealityto other temperatures,
lnγxi =∆Hx
i
RT−∆SxiR
(6.15)
135 Towards Sustainable Solvent-Based Affinity Separations

666666
VLE PREDICTION FROM THE HEAT OF MIXING
ϕyi P yi = γxi xiP
0i (6.16)
where at either the liquid or vapor composition (xi or yi) a specific molar en-thalpy (∆Hx
i )) and entropy (∆Sxi ) is determined. This is done for both theactivity- (γxi ) and the fugacity (ϕyi ) coefficient. By doing this, the non-idealbehavior predicted by the fitted thermodynamic model is expressed and com-bined with the phase criterion of equal activity, see Equation 6.16. Because allparameters in Equation 6.16 are temperature-dependent and the temperatureprofile is composition-dependent, this system is iteratively solved to obtain atemperature profile that corresponds to the isobaric situation. These profiles,of the same n-heptane/2-butanone mixture, are shown in Figure 6.5.
Figure 6.5: The comparison between the experimental vapor-liquid equilibrium data37,38
and the predicted (left) concentration (xy) and (right) temperature (Txy) profile of the binarymixture n-heptane and 2-butanone which was fitted with excess molar enthalpy data32–36
at 298K, 318K and 328K was fitted with the Peng-Robinson equation of state with Stryjek-Vera Margules-type mixing rule.
The accuracy of the methodology is determined by assessing the average rel-ative deviation (ARD), though also the absolute average deviation (AAD) canbe determined, see Equation 6.17,
ARDχ =
(∑Ndata |χexp−χpred |χexp
)Ndata
∧AADχ =
(∑Ndata |χexp −χpred |)
Ndata(6.17)
Towards Sustainable Solvent-Based Affinity Separations 136

666666
VLE PREDICTION FROM THE HEAT OF MIXING
where χ represents either the vapor concentration in the xy-diagram (y), thetemperature in the Txy-diagram (T), or the excess molar enthalpy (HE). Therelative deviation between each experimental data point (χexp) and the pre-dicted data point (χpred) is summed up and averaged over the number of datapoints (Ndata).
Although the prediction is not perfect, still the azeotropic point is predictedcorrectly, and only a small ARD of 7.05%, defined in Equation 6.17, which cor-responds to an AAD of 1.56%, is present in the xy-diagram. A temperatureminimum, positive azeotrope, is also correctly predicted in the Txy-diagram,although an absolute average deviation of 2.03 Kelvin is seen, which is on av-erage <1% of the absolute temperature.
The developed four-step methodology, shown for the n-heptane/2-butanonesystem, will be applied to assess liquid phase activity models and cubic equa-tions of state, and the accuracy will be shown for these models. This accuracywill be dependent on several factors, such as the quality and quantity of theexcess enthalpy data (HE), the complexity of the model, and the complexityof the molecular interactions in the system.
6.4 Results
The results will be shown in three parts. In the first part (section 6.4.1), liq-uid activity coefficient models will be shown and their applicability in ourmethodology will be discussed. The remainder of this section (section 6.4.2)will be about the performance of the cubic equations of state, and specificallytowards different binary systems (section 6.4.2.1) and the type of cubic equa-tion of state (section 6.4.2.2).
6.4.1 Liquid Activity Coefficient models
Liquid phase activity coefficient models are the first to be discussed and areoften a favorite in the fitting of highly non-ideal VLE behavior.39 Hence, thisis not the first time that VLE is predicted from excess molar enthalpy usingliquid phase activity coefficient models.9–12 The UNIQUAC model has beenexcluded from the assessment as this model requires additional compound-
137 Towards Sustainable Solvent-Based Affinity Separations

666666
VLE PREDICTION FROM THE HEAT OF MIXING
specific volume- and surface parameters. The NRTL model is beside the UNI-QUAC model, the most well-used liquid phase activity coefficient model andwill be discussed first.
Consistently, in NRTL fitting procedures the non-randomness factor (αij ) iskept constant, otherwise, convergence issues arise. This is a clear disadvan-tage, as an a priori guess of the αij is not always present.
Figure 6.6: Experimental (left) HE at 298.15K32–36 and (right) vapor-liquid equilibriumdata37,38 is compared with predicted excess molar enthalpy and concentration (xy) us-ing the NRTL-model which was fitted from experimental HE data and with different non-randomness factors (αij ) and/or different initial guess values.
Additionally, which is not stated in the articles that couple the HE and thephase equilibria prediction is the initial guess dependency. Stevens and cowork-ers40 show the complexity of the ∆-Gibbs surface and the existence of localminima. In Figure 6.6, the NRTL model is fitted to the same experimentalHE data, while changing either the non-randomness factor (αij ) or the initialguess value of the interaction parameter (Gji = Gij ).
Multiple starting values, either different αij or guess values Gij and Gji , resultin different vapor-liquid equilibrium and excess molar enthalpy predictions.Most strikingly, the best fit of the HE , results in the least accurate VLE pre-diction. This is a highly unwanted result if this methodology aims to predictunknown VLE behavior from known HE experimental data. Similar depen-dencies were shown by Nicolaides et al.13 In Figure 6.7, also the Wilson and
Towards Sustainable Solvent-Based Affinity Separations 138

666666
VLE PREDICTION FROM THE HEAT OF MIXING
Van Laar models are additionally fitted and the vapor-liquid equilibrium pre-diction is shown and compared with a prediction of the NRTL model. As canbe seen, the most complex model (NRTL) does not necessarily obtain the mostaccurate prediction. The Wilson seems also not to be able to fit the HE well,while still a lower deviation is seen in the xy profile compared to the NRTLmodel with an αij of 0.2.
Figure 6.7: Experimental (left)HE at 298.15K32–36 and experimental vapor-liquid equilib-rium data37,38 and the predicted concentration (xy) using the NRTL (αij=0.2, init. guess:Gij=103), Wilson (init. guess: Aij=103) and Van Laar (init. guess: Aij=103) modelswhich was fitted from experimental HE data.
This same trend is seen in the NRTL model at higher αij values, in Figure 6.6.The van Laar equation seems to be accurately corresponding with the exper-imental HE data, with a similar VLE behavior prediction as to the Wilsonequation. Together with the disadvantage of the Wilson model of needing liq-uid molar volumes of the components in the mixture, makes it is a reasonableconclusion that the van Laar model may be preferred over the Wilson equa-tion.
Overall, liquid phase activity coefficient models have difficulties predictingnon-ideality from excess molar enthalpy data. Tan et al.41 also signified theinherent disadvantage of using a model based on the excess Gibbs energy topredict VLE behavior from excess molar enthalpy as the procedure requires adifferentiation step. This will result in a substantial loss of accuracy if exper-imental data points are not perfect. Hence, a more robust model is preferred
139 Towards Sustainable Solvent-Based Affinity Separations

666666
VLE PREDICTION FROM THE HEAT OF MIXING
in the methodology. The “best” performing model can be considered to bethe van Laar model,15 which is derived from the well-known Van der Waalsequation. However, it is known that the van Laar model is not able to repre-sent multicomponent mixtures.42 The Van der Waals cubic equation of state,and many others, can be the robust model needed for this approach.
6.4.2 cubic Equation of State
In this section, the performance of cubic equations of state (cEoS) are system-atically evaluated as a thermodynamic model in the methodology proposed inthe previous section. During this assessment, three different possible errorsare identified and separately discussed. A deviation between the modeled andexperimental HE data points will induce an error. A large deviation in thisearly stage is an indication that the thermodynamic model is not physicallyrepresenting the binary system. The second and third errors are seen betweenthe experimental and the predicted VLE behavior. In both the concentrationprofile (xy) and in the temperature profile (Txy), errors can occur. Each errorwill be assessed by the average relative deviation (ARD), see Equation 6.17.In the case of a certain function group combination or a specific equation ofstate and mixing rule combination which includes multiple binary systems,then the overall performance is assessed by averaging Equation 6.17 over theamount of specific binary systems (Nsys), see Equation 6.18,
ARDχ =
∑Nsys
∑Ndata |χexp−χpred |
χexp
Ndata
Nsys
(6.18)
To explain the procedure of analyzing the applicability of a specific equationof state – mixing rule combination to describe VLE profiles for mixtures ofcertain classes of molecules, this is first done for one combination, the Soave-Redlich-Kwong cEoS with the one-parameter Van der Waals mixing rule. Af-terward, a more detailed investigation into various cubic equations of stateand mixture rule combinations will be made.
Towards Sustainable Solvent-Based Affinity Separations 140

666666
VLE PREDICTION FROM THE HEAT OF MIXING
6.4.2.1 Performance of Soave-Redlich-Kwong cEoS for VLE prediction ofvarious Functional Groups
The predictive performance overview for the Soave-Redlich-Kwong cEoS withthe one-parameter Van der Waals mixing rule is represented in the form of aheat-map in Figure 6.8. Each cell in this map represents a combination oftwo functional groups that are present on either one of the components inthe binary mixture. The color indicates the predictive accuracy, where greenindicates an ARDy of ≤ 10% and increasingly intense red indicates a moresignificant ARDy . A distinction can be made between functional groups ofwhich the vapor-liquid equilibrium can be predicted with significantly higheraccuracy, and those for which the prediction is inaccurate (ARDy > 10%).
Figure 6.8: The average of all average relative deviation in the predicted and experimentalconcentration in the isobaric VLE profile (ARDy) for the Soave-Redlich-Kwong Equation ofStates in combination with the 1-parameter Van der Waals mixing rule, specified for eachfunctional group combination
Since equations of state have difficulties in the description of self-associationnetworks mainly trough hydrogen bonds, such as with water,43 carboxylicacid,44 amines,45 aldehydes,46 alcohols,46,47 amides,48 nitriles,49 or via strongdipolar interactions, such as with nitro compounds50 and dimethylsulfoxide.51
Additionally, formate esters,52 chloroform53 and acetone54 are known to self-associate.
141 Towards Sustainable Solvent-Based Affinity Separations

666666
VLE PREDICTION FROM THE HEAT OF MIXING
It is therefore clear that this approach using this cEoS is more robust than theapproach with activity coefficient models, as it does not have the initial guessdependency seen in the liquid phase activity coefficient models, and accuratefor binary systems that are not able to self-associate.
Several systems can however be accurately described by this cEoS, as shownin Figure 6.8. These systems comprise alkanes, aromatic compounds, chlori-nated compounds (excluding chloroform), thiophenes, pyridines, ethers, ke-tones (excluding acetone) and esters (excluding formates). All these moleculesare not able to self-associate and the excess molar enthalpy can therefore befitted by the cEoS and accurately predict the isobaric VLE behavior. Thatdoesn’t mean that all self-associating compounds cannot be described by anycEoS. As can be seen in Figure 6.8, the diagonal line through the matrix rep-resents similar compounds and exhibits smaller deviations compared to dis-similar compounds located further from the diagonal line.
In the next section, not only the effect of different cEoS and mixing rules areassessed, but also a distinction will be made between assessing the binarymixtures which are inapt in self-association (section 6.4.2.2) and mixtures thatform liquid networks via association interactions (section 6.4.2.2).
6.4.2.2 Effect of different Equation of State and Mixing Rule
Equations of State are versatile models, as they can quite easily be adjustedwith new PVT-equations that deviate from the initial Van der Waals equation.Furthermore, also the mixing rules can be varied, e.g. to better cope with theassociation in the system. In an attempt to evaluate the usefulness of cEoSto predict VLE while fitting on HE widely inclusive, in this section, a total oftwelve different cEoS were each combined with eight mixing rules (MR). Theevaluated combinations include,
Towards Sustainable Solvent-Based Affinity Separations 142

666666
VLE PREDICTION FROM THE HEAT OF MIXING
cubic Equation of State (cEoS): Mixing rule (MR):1. Van der Waals23 (VdW) 1. 1-parameter Van der Waals23
2. Redlich-Kwong24 (RK) (VdW1)3. Soave-Redlich-Kwong24,25 (SRK) 2. 2-parameter Van der Waals23
4. Peng-Robinson26 (PR) (VdW2)5. Peng-Robinson-Stryjek-Vera55 (PRSV) 3. Adachi-Sugie56 (AS)6. Petal-Teja27 (PT) 4. Huron-Vidal57 (HV)7. Petal-Teja-Valderrama58 (PTV) 5. Panagiotopoulos-Reid59 (PR)8. Esmaeilzadeh-Roshanfekr60 (ER) 6. Sandoval61
9. Nasrifar-Moshfeghian62 (NM) 7. Stryjek-Vera Margules-type55
10. Twu-Sim-Tassone63 (TST) (SVm)11. Harmens-Knapp64 (HK) 8. Stryjek-Vera van Laar-type55
12. Trebble-Bishnoi65 (TB) (SVvL)
In the case of the instability of the methodology, in essence, a convergenceissue, when using a cEoS/MR combination in more than 10% of the assessedsystems, the combination is indicated in the following heatmaps as undesired.
Non-self-associating mixtures In Figure 8, an overview of the accuracy ofthe methodology is given using the heatmap approach. For each average rel-ative deviation (ARD) within the methodology, this is done, thus in the fit-ting of the excess molar enthalpy (ARDHE ) and the prediction of the concen-tration profile (ARDy) and temperature profile (ARDT ) in the VLE behavior.The Petal-Teja (PT)27 and Esmaeilzadeh-Roshanfekr (ER)60 cEoS show con-vergence issues in the fitting of the HE , hence are identified to be not pre-ferred for this methodology. The Petal-Teja-Valderrama (PTV)58 cEoS, whichis a generalization of the PT cEoS is more accurate (and robust) than the PTcEoS. This is due to the fact the PT cEoS has fewer known parameters for non-self-associating binary systems included in this work. Whereas, the PTV cEoScan, via its generalization of parameters, include all non-self-associative bi-nary mixtures and therefore the deviation shown is an average of more binarysystems that are accurately described. The 4-parameter Trebble-Bishnoi65 isalso less accurate, indicating that a 4-parameters cEoS is over-parameterizedfor describing these systems and a cEoS with fewer parameters is preferred.Regarding the mixing rules, not much difference can be seen, however, the
143 Towards Sustainable Solvent-Based Affinity Separations
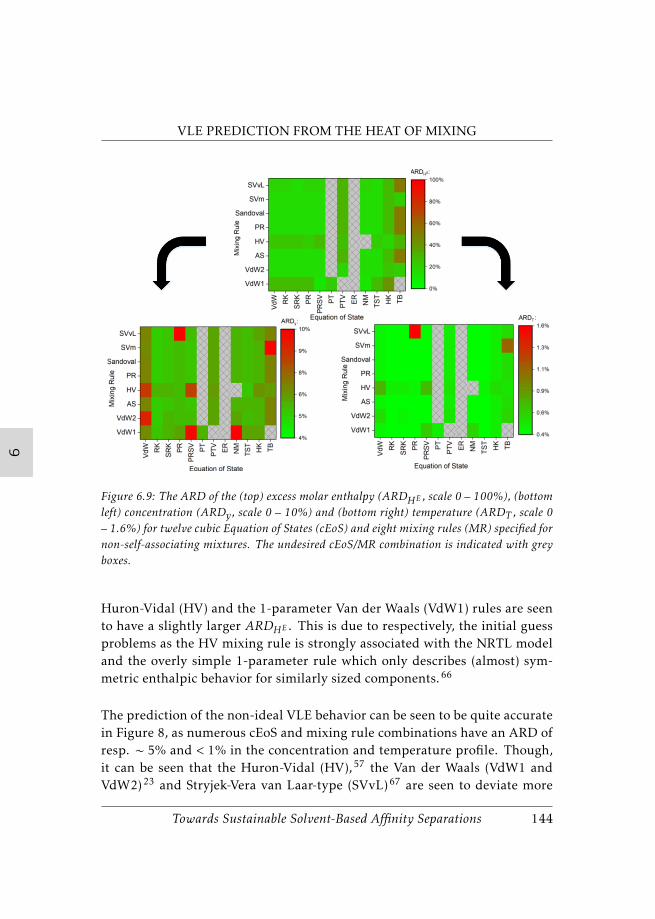
666666
VLE PREDICTION FROM THE HEAT OF MIXING
Figure 6.9: The ARD of the (top) excess molar enthalpy (ARDHE , scale 0 – 100%), (bottomleft) concentration (ARDy , scale 0 – 10%) and (bottom right) temperature (ARDT , scale 0– 1.6%) for twelve cubic Equation of States (cEoS) and eight mixing rules (MR) specified fornon-self-associating mixtures. The undesired cEoS/MR combination is indicated with greyboxes.
Huron-Vidal (HV) and the 1-parameter Van der Waals (VdW1) rules are seento have a slightly larger ARDHE . This is due to respectively, the initial guessproblems as the HV mixing rule is strongly associated with the NRTL modeland the overly simple 1-parameter rule which only describes (almost) sym-metric enthalpic behavior for similarly sized components.66
The prediction of the non-ideal VLE behavior can be seen to be quite accuratein Figure 8, as numerous cEoS and mixing rule combinations have an ARD ofresp. ∼ 5% and < 1% in the concentration and temperature profile. Though,it can be seen that the Huron-Vidal (HV),57 the Van der Waals (VdW1 andVdW2)23 and Stryjek-Vera van Laar-type (SVvL)67 are seen to deviate more
Towards Sustainable Solvent-Based Affinity Separations 144

666666
VLE PREDICTION FROM THE HEAT OF MIXING
than other combinations. Where the VdW1 mixing rule is most likely an over-simplification, and the other mixing rules (VdW2, HV and SVvL) are eitherover-complicated or have convergence issues, see local minima, which are alsoseen in the liquid phase activity coefficient models. Overall, the most com-mon cEoS, e.g. (Soave-)Redlich-Kwong (RK or SRK)24,25 and Peng-Robinson(PR)26, are seen to be the most accurate though other cEoS can be used such asTwu-Sim-Tassone cEoS.68 The mixing rule choice has a less significant impact,though the above-mentioned mixing rules are less preferred.
Self-associating mixtures In Figure 6.10, it can be seen that HE can be cor-related to approximately the same accuracy as for non-self-associative mix-tures. The Petal-Teja (PT) cEoS27 appears nevertheless to be slightly less ac-curate in combination with several mixing rules. Again the Esmaeilzadeh-Roshanfekr (ER) cEoS60 is not stable, also Trebbe-Bishnoi cEoS65 and theNasrifar-Moshfeghian62 i.c.w. the Huron-Vidal MR is unable to converge.Overall, the Huron-Vidal (HV) and the 1-parameter Van der Waals (VdW1)rules are seen to have a slightly larger ARDHE , either due to over-simplicity inthe first MR, and complexity in the latter MR.
Several equations of state are observed to be more accurate to predict the non-ideal VLE behavior of these self-associating mixtures, see Figure 6.10, such asthe Peng-Robinson-Styrjek-Vera (PRSV)67, Petal-Teja (PT)27] and the Petal-Teja-Valderrama (PTV).58 Lowering the average relative deviation in the con-centration profile from > 60% (seen in various cEoS) to ∼ 20%. The PRSV- andPT-equation of states accomplished this adding pure-component parameters,especially for high polar components.Although, this limits the applicability of these equations of state, as not onlythe critical parameters are required. The PTV-equation of state is a gener-alization of the PT-equation of state, where Valderamma58 generalized theadditional parameters in terms of the critical parameters, hence significantlyincreasing the applicability window. For this reason, the PTV-equation ofstate is preferable to the original PT-equation of state.
The (original) Van der Waals equation of state appears to have a lower over-all deviation than the well-known (Soave-)Redlich-Kwong24,25 (RK, SRK) andPeng-Robinson26 (PR), though this not a fair comparison. The VdW-equation
145 Towards Sustainable Solvent-Based Affinity Separations

666666
VLE PREDICTION FROM THE HEAT OF MIXING
Figure 6.10: The ARD of the (top) excess molar enthalpy (ARDHE , scale 0 – 100%), (bottomleft) concentration (ARDy ,scale 0 – 100%) and (bottom right) temperature (ARDT , scale0 – 3.2%) for twelve cubic Equation of States (cEoS) and eight mixing rules (MR) specifiedfor self-associating mixtures. The undesired cEoS/MR combination is indicated with greyboxes.
of state is much more unstable and could fit much less (between 79 and104) binary systems than the other equation of states (between 197 and 201).Hence, as many binary systems containing self-associative components are ex-cluded in the VdW-equation of state evaluation, the overall accuracy appearsto be greater. The inaccuracy of the VdW-equation of state can also be seen inthe increased inaccuracy of only the systems with non-self-associative com-pounds.
The severe inaccuracies seen in the self-associative mixtures can be reducedusing the complex EoS which includes associative terms, such as PC-SAFT. As
Towards Sustainable Solvent-Based Affinity Separations 146

666666
VLE PREDICTION FROM THE HEAT OF MIXING
Figure 6.11: The comparison between the experimental vapor-liquid equilibrium data69,70
and the predicted (left) concentration (xy) and (right) temperature (Txy) profile of the binarymixture ethanol and n-hexane which was fitted with excess molar enthalpy data71–73 at298K, 308K and 318K was fitted with the Redlich-Kwong (RK) equation of state with1-parameter Van der Waals (VdW1) mixing rule and PC-SAFT. PC-SAFT pure-componentparameters were used from Spyriouni et al.74
can be seen in Figure 6.11, where an example of the n-hexane/ethanol systemis shown. The PC-SAFT model predicts more accurately the azeotropic be-havior of the system, as it decreases the ARD within the concentration profilefrom 42% to 25% and the ARD within the temperature profile from 3.1% to1.2%. This is still not satisfactory. There can however be refinements, as onlythe 2B-association scheme30 is included in the Aspen Plus® software package.Also, a variation of pure-components parameters are present in literature andappropriate parameter choice is essential for accurate VLE predictions.
6.5 Conclusion
It is possible to predict the non-ideal vapor-liquid equilibrium behavior fromthe excess molar enthalpy via a thermodynamic model. However, not allbinary systems can be accurately described. The preferred thermodynamicmodels are cubic equations of state, and not liquid phase activity coefficientmodels as they are prone to local optimization minima which reduce the pre-dictive accuracies. Although, it has been shown that for nearly ideal systems,where the excess entropy can be neglected, these models can be applied. In us-
147 Towards Sustainable Solvent-Based Affinity Separations

666666
VLE PREDICTION FROM THE HEAT OF MIXING
ing cubic equations of state, in general, most mixing rules perform similarly,though it can be seen that the 2-parameter Van der Waals (VdW2), Huron-Vidal (HV) and Stryjek-Vera Van Laar-type (SVvL) are seen to be less stableand robust, hence may be less accurate in the predictive ability. Various cubicequations of state and mixing rules can be used, such as the most commonRK-, SRK- and PR-equation of states, though PTV-, Nasrifar-Moshfeghian62
(NM), Twu-Sim-Tassone68 (TST) and Harmens-Knapp64 (HK) cubic equationsof states can also be used. Also, various mixing rules can be used, thoughVdW2-, HV- and SVvL-mixing rules are not preferred. Mixtures without(self-)associative compounds can be accurately predicted without an initialguess value problem. Unfortunately, this excluded a large number of highlycommon mixtures containing for instance alcohols, or (and most challeng-ing) aqueous mixtures. The accuracy of mixtures with self-associative behav-ior can be 10 times less accurate in the concentration profile and twice lessaccurate in the temperature profile. Thus, part of the envisioned approachis realized by cubic equation of states. The approach can be completed bythe addition of the PC-SAFT and/or CPA model, which includes associativeterms, though a systematic validation including various association schemesneeds to be done.
6.6 Electronic Supplementary Data-Analysis
For the validation of this approach, experimental Excess Molar Enthalpy (HE)and isobaric vapor-liquid equilibria (VLE) were used from literature. Due tothe fact, 913 articles are behind all relevant information and this would haveresulted in a large number of reference pages. It was chosen not to includethese references and data in this printed version. The reference overviewwas published online at https://www.scribd.com/document/484671815/All-References-of-Chapter-6. While, all data points is published online in anExcel sheet; https://www.scribd.com/document/484672433/All-References-Data-of-Chapter-6 (with the associated references).
Towards Sustainable Solvent-Based Affinity Separations 148

666666
VLE PREDICTION FROM THE HEAT OF MIXING
6.7 Nomenclature
αij = Relative volatility of component i and jβAiBj = Association volume function between Ai and BjεAiBj = Association energy function between Ai and Bj∆Hx
i = Excess molar enthalpy of component i at a molar fraction of xi∆Sxi = Excess molar entropy of component i at a molar fraction of xiω = Acentric factorγi = Activity coefficient of component iγxi = Activity coefficient of component i at a molar fraction of xiγ∞i = Infinite dilution activity coefficient of component iϕi = Fugacity coefficient of component i
ϕyi =
Fugacity coefficient of component i at a molar vapor fraction ofyi
ρ = Molar densitya = Van der Waals interaction parameterAAD = Average absolute deviationAi = Association binding site A for component iAij = Van Laar or Wilson binary interaction parameterARD = Average relative deviationAS = Adachi-Sugieb = Van der Waals volume parameterBIP = Binary interaction parameterBj = Association binding site B for component jcEoS = Cubic equation of stateCPA = Cubic equation of state plus associationER = Esmaeilzadeh-Roshanfekrfi = FugacityGE = Excess Gibbs energyGE = Excess molar Gibbs energyGij = NRTL binary interaction parameterH = EnthalpyHdep = Enthalpy Departure functionHE = Excess molar enthalpyH ig = Ideal gas enthalpy
149 Towards Sustainable Solvent-Based Affinity Separations

666666
VLE PREDICTION FROM THE HEAT OF MIXING
HK = Harmens-KnappHV = Huron-VidalLLE = Liquid-Liquid equilibriumM = Mixing rule functionmij = Binary interaction parameter functionMR = Mixing rulen = Amount of molen = Numbers of componentsNdata = Number of data pointsNsys = Number of systemsNM = Nasrifar-MoshfeghianNRTL = Non-random two-LiquidP = Pressure (bar)P 0i = Pure component (i) vapor pressurePc = Critical pressure (bar)PC-SAFT = Perturbed-chain statistical associating fluid theoryPR = Peng-RobinsonPR = Panagiotopoulos-ReidPRSV = Peng-Robinson-Stryjek-VeraPT = Petal-TejaPTV = Petal-Teja-ValderramaR = Universal gas constantRK = Redlich-KwongSE = Excess entropySji = Selectivity of component j over iSRK = Soave-Redlich-KwongSVm = Stryjek-Vera Margules-typeSVvL = Stryjek-Vera van Laar-typeT = Absolute temperatureTB = Trebble-BishnoiTc = Critical temperatureTST = Twu-Sim-TassoneUNIQUAC = Universal quasichemicalVdW = Van der Waals
Towards Sustainable Solvent-Based Affinity Separations 150

666666
VLE PREDICTION FROM THE HEAT OF MIXING
VdW1 = 1-parameter Van der WaalsVdW2 = 2-parameter Van der WaalsVLE = Vapor-liquid equilibriumVm = Molar volumeX = quantity XXdep = Departure function of quantity XXig = Ideal gas function of quantity Xxi = Molar liquid fraction of component iyi = Molar vapor fraction of component iZ = Compressibility functionZass = Association term of compressibility factorZatt = Attraction term of compressibility factorZL = Compressibility factor of liquid phaseZrep = Repulsion term of compressibility factorZV = Compressibility factor of vapor phase
6.8 References
[1] A. Muhlbauer and J. Raal, “Measurement and thermodynamic interpretation of high-pressurevapour—liquid equilibria in the toluene co2 system,” Fluid phase equilibria, vol. 64, pp. 213–236, 1991.
[2] A. J. ten Kate, J. Gerretzen, H.-J. van Manen, G. M. Kontogeorgis, and G. Bargeman, “Methodology topredict thermodynamic data from spectroscopic analysis,” Industrial & Engineering Chemistry Research,2020.
[3] F.-M. Raoult, “Loi générale des tensions de vapeur des dissolvants,” CR Hebd. Seances Acad. Sci, vol. 104,pp. 1430–1433, 1887.
[4] G. N. Lewis and M. Randall, Thermodynamics and the free energy of chemical substances. McGraw-Hill,1923.
[5] C. L. Yaws, The Yaws handbook of vapor pressure: Antoine coefficients. Gulf Professional Publishing, 2015.[6] D. Siderius, “Nist standard reference simulation website,” 2012.[7] J.-C. Lerol, J.-C. Masson, H. Renon, J.-F. Fabries, and H. Sannier, “Accurate measurement of activity co-
efficient at infinite dilution by inert gas stripping and gas chromatography,” Industrial & EngineeringChemistry Process Design and Development, vol. 16, no. 1, pp. 139–144, 1977.
[8] A. Wehrl, “General properties of entropy,” Reviews of Modern Physics, vol. 50, no. 2, p. 221, 1978.[9] R. W. Hanks, A. C. Gupta, and J. J. Christensen, “Calculation of isothermal vapor-liquid equilibrium data
for binary mixtures from heats of mixing,” Industrial & Engineering Chemistry Fundamentals, vol. 10, no. 3,pp. 504–509, 1971.
[10] R. W. Hanks, R. L. Tan, and J. J. Christensen, “Limits on the simultaneous correlation of ge and he databy the nrtl, lemf and wilson’s equations,” Thermochimica Acta, vol. 23, no. 1, pp. 41–55, 1978.
[11] P. VOŇKA, J. P. NOVÁK, J. SUŠKA, and J. PICK, “An a priori analysis of temperature dependence ofwilson and nrtl equations,” CHEMICAL ENGINEERING COMMUNICATIONS, vol. 2, no. 1, pp. 51–55,1975.
[12] J. G. Calzón, C. Pando, and J. Renuncio, “Simultaneous correlation of vapor-liquid equilibrium and ex-cess enthalpies for binary mixtures of n-hexane and n-octane with hexane isomers,” Thermochimica acta,vol. 106, pp. 219–231, 1986.
151 Towards Sustainable Solvent-Based Affinity Separations

666666
VLE PREDICTION FROM THE HEAT OF MIXING
[13] G. L. Nicolaides and C. A. Eckert, “Optimal representation of binary liquid mixture nonidealities,” In-dustrial & Engineering Chemistry Fundamentals, vol. 17, no. 4, pp. 331–340, 1978.
[14] H. Orbey and S. I. Sandler, “A comparison of various cubic equation of state mixing rules for the simul-taneous description of excess enthalpies and vapor-liquid equilibria,” Fluid Phase Equilibria, vol. 121,no. 1-2, pp. 67–83, 1996.
[15] J. Van Laar, “Zur theorie der dampfspannungen von binären gemischen,” Zeitschrift für PhysikalischeChemie, vol. 83, no. 1, pp. 599–608, 1913.
[16] G. M. Wilson, “Vapor-liquid equilibrium. xi. a new expression for the excess free energy of mixing.,”Journal of the American Chemical Society, vol. 86, no. 2, pp. 127–30, 1964.
[17] M. Margules, “Uber die zusammensetzung der gesattigten dampfe von mischungen,” Sitzungsber AkadWiss Wien, vol. 104, pp. 1243–1278, 1895.
[18] D. S. Abrams and J. M. Prausnitz, “Statistical thermodynamics of liquid mixtures. new expression for theexcess gibbs energy of partly or completely miscible systems.,” AIChE Journal, vol. 21, no. 1, pp. 116–28,1975.
[19] H. Renon and J. M. Prausnitz, “Local compositions in thermodynamic excess functions for liquid mix-tures.,” AIChE Journal, vol. 14, no. 1, pp. 135–44, 1968.
[20] J. M. Prausnitz, R. N. Lichtenthaler, and E. G. De Azevedo, Molecular thermodynamics of fluid-phase equi-libria. Pearson Education, 1998.
[21] É. Clapeyron, “Mémoire sur la puissance motrice de la chaleur,” Journal de l’École polytechnique, vol. 14,pp. 153–190, 1834.
[22] I. G. Economou, “Cubic and generalized van der waals equations of state,” Applied Thermodynamics ofFluids, vol. 4, no. 1, p. 53, 2010.
[23] J. D. Van der Waals, Over de Continuiteit van den Gas-en Vloeistoftoestand, vol. 1. Sijthoff, 1873.[24] O. Redlich and J. N. Kwong, “On the thermodynamics of solutions. v. an equation of state. fugacities of
gaseous solutions.,” Chemical reviews, vol. 44, no. 1, pp. 233–244, 1949.[25] G. Soave, “Equilibrium constants from a modified redlich-kwong equation of state,” Chemical engineering
science, vol. 27, no. 6, pp. 1197–1203, 1972.[26] D.-Y. Peng and D. B. Robinson, “A new two-constant equation of state,” Industrial & Engineering Chemistry
Fundamentals, vol. 15, no. 1, pp. 59–64, 1976.[27] N. C. Patel and A. S. Teja, “A new cubic equation of state for fluids and fluid mixtures,” Chemical Engi-
neering Science, vol. 37, no. 3, pp. 463–473, 1982.[28] J. R. Elliott and C. T. Lira, Introductory chemical engineering thermodynamics, vol. 184. Prentice Hall PTR
Upper Saddle River, NJ, 1999.[29] J. Gross and G. Sadowski, “Application of the perturbed-chain saft equation of state to associating sys-
tems,” Industrial & engineering chemistry research, vol. 41, no. 22, pp. 5510–5515, 2002.[30] G. M. Kontogeorgis, M. L. Michelsen, G. K. Folas, S. Derawi, N. von Solms, and E. H. Stenby, “Ten years
with the cpa (cubic-plus-association) equation of state. part 1. pure compounds and self-associating sys-tems,” Industrial & engineering chemistry research, vol. 45, no. 14, pp. 4855–4868, 2006.
[31] M. L. Michelsen and E. M. Hendriks, “Physical properties from association models,” Fluid phase equilibria,vol. 180, no. 1-2, pp. 165–174, 2001.
[32] D. Hanson and M. Van Winkle, “Relation of binary heats of mixing and distribution of ketone betweenphases in some ketone-water-solvent ternaries.,” Journal of Chemical and Engineering Data, vol. 5, no. 1,pp. 30–34, 1960.
[33] J. Biroš, A. Živny, and J. Pouchly, “Heats of mixing of butanone and chloroform with alkanes: binarysystems,” Collection of Czechoslovak Chemical Communications, vol. 43, no. 3, pp. 829–836, 1978.
[34] O. DUSART, S. PIEKARSKI, and J. GROLIER, “Enthalpies of normal-alkyl alkanoates and 2-alkanones inhomologous series with a normal alkane,” JOURNAL DE CHIMIE PHYSIQUE ET DE PHYSICO-CHIMIEBIOLOGIQUE, vol. 76, no. 5, pp. 433–437, 1979.
[35] O. Kiyohara, Y. P. Handa, and G. C. Benson, “Thermodynamic properties of binary mixtures containingketones iii. excess enthalpies of n-alkanes+ some aliphatic ketones,” The Journal of Chemical Thermody-namics, vol. 11, no. 5, pp. 453–460, 1979.
[36] R. Fuchs, L. Krenzer, and J. Gaube, “Excess properties of binary mixtures composed of a polar componentand an alkane,” Berichte der Bunsengesellschaft für physikalische Chemie, vol. 88, no. 7, pp. 642–649, 1984.
Towards Sustainable Solvent-Based Affinity Separations 152

666666
VLE PREDICTION FROM THE HEAT OF MIXING
[37] H. H. Steinhauser and R. R. White, “Vapor-liquid equilibria data for ternary mixtures: methyl ethyl keton-n-heptane-toluene system,” Industrial & Engineering Chemistry, vol. 41, no. 12, pp. 2912–2920, 1949.
[38] E. Lladosa, N. F. Martínez, J. B. Montón, and J. de la Torre, “Measurements and correlation of vapour–liquid equilibria of 2-butanone and hydrocarbons binary systems at two different pressures,” Fluid phaseequilibria, vol. 307, no. 1, pp. 24–29, 2011.
[39] Y. Demirel and H. Gecegörmez, “Simultaneous representation of excess enthalpy and vapor—liquid equi-librium data by the nrtl and uniquac models,” Fluid Phase Equilibria, vol. 65, pp. 111–133, 1991.
[40] Z. Li, K. A. Mumford, Y. Shang, K. H. Smith, J. Chen, Y. Wang, and G. W. Stevens, “Analysis of the non-random two-liquid model for prediction of liquid–liquid equilibria,” Journal of Chemical & EngineeringData, vol. 59, no. 8, pp. 2485–2489, 2014.
[41] R. L. Tan, R. W. Hanks, and J. J. Christensen, “The prediction of isothermal phase equilibria for non-idealmulticomponent mixtures from heats of mixing,” Thermochimica Acta, vol. 21, no. 2, pp. 157–170, 1977.
[42] D.-Y. Peng, “Extending the van laar model to multicomponent systems,” The Open Thermodynamics Jour-nal, vol. 4, no. 1, 2010.
[43] R. Bentwood, A. Barnes, and W.-J. Orville-Thomas, “Studies of intermolecular interactions by matrixisolation vibrational spectroscopy: Self-association of water,” Journal of Molecular Spectroscopy, vol. 84,no. 2, pp. 391–404, 1980.
[44] H. T. Flakus and A. Tyl, “Polarized ir spectra of the hydrogen bond in acetic acid crystals,” ChemicalPhysics, vol. 336, no. 1, pp. 36–50, 2007.
[45] J. Spencer, W. Wolbach, J. Hovick, L. Ansel, and K. Modarress, “Hydrogen bonding by alcohols andamines,” Journal of solution chemistry, vol. 14, no. 11, pp. 805–814, 1985.
[46] F. Besseau, M. Luçon, C. Laurence, and M. Berthelot, “Hydrogen-bond basicity p k hb scale of aldehydesand ketones,” Journal of the Chemical Society, Perkin Transactions 2, no. 1, pp. 101–108, 1998.
[47] W. M. Bartcak, “Model of the self-association of primary alcohols,” Berichte der Bunsengesellschaft fürphysikalische Chemie, vol. 83, no. 10, pp. 987–992, 1979.
[48] D. A. Dixon, K. D. Dobbs, and J. J. Valentini, “Amide-water and amide-amide hydrogen bond strengths,”The Journal of Physical Chemistry, vol. 98, no. 51, pp. 13435–13439, 1994.
[49] A. Loewenstein and Y. Margalit, “Nuclear magnetic resonance studies of nitriles and isocyanides: Ace-tonitrile and methyl isocyanide,” The Journal of Physical Chemistry, vol. 69, no. 12, pp. 4152–4156, 1965.
[50] R. Brakaspathy and S. Singh, “Studies on self-association of nitromethane using a cndo/force method,”Journal of Molecular Structure: THEOCHEM, vol. 164, no. 3-4, pp. 319–324, 1988.
[51] R. Figueroa, E. Roig, and H. Szmant, “Infrared study on the self-association of dimethyl sulfoxide,” Spec-trochimica Acta, vol. 22, no. 4, pp. 587–592, 1966.
[52] G. V. Tiers, J. Stevens, and W. L. Stebbings, “Nmr detection of oriented association via dilution shifts intetramethylsilane solvent. 2. aliphatic esters,” Magnetic resonance in chemistry, vol. 37, no. 9, pp. 613–619,1999.
[53] C. M. Huggins, G. C. Pimentel, and J. N. Shoolery, “Proton magnetic resonance studies of chloroform insolution: evidence for hydrogen bonding,” The Journal of Chemical Physics, vol. 23, no. 7, pp. 1244–1247,1955.
[54] B. Tiffon, B. Ancian, and J.-E. Dubois, “Natural abundance 17o nmr as a tool for intermolecular interactionstudies: acetone self-association,” Chemical Physics Letters, vol. 73, no. 1, pp. 89–93, 1980.
[55] R. Stryjek and J. Vera, “Prsv—an improved peng-robinson equation of state with new mixing rules forstrongly nonideal mixtures,” The Canadian Journal of Chemical Engineering, vol. 64, no. 2, pp. 334–340,1986.
[56] Y. Adachi and H. Sugie, “A new mixing rule—modified conventional mixing rule,” Fluid Phase Equilibria,vol. 28, no. 2, pp. 103–118, 1986.
[57] M.-J. Huron and J. Vidal, “New mixing rules in simple equations of state for representing vapour-liquidequilibria of strongly non-ideal mixtures,” Fluid Phase Equilibria, vol. 3, no. 4, pp. 255–271, 1979.
[58] J. O. Valderrama, “A generalized patel-teja equation of state for polar and nonpolar fluids and their mix-tures,” Journal of chemical engineering of Japan, vol. 23, no. 1, pp. 87–91, 1990.
[59] A. Panagiotopoulos and R. Reid, “New mixing rule for cubic equations of state for highly polar, asymmet-ric systems,” ACS Publications, 1986.
[60] F. Esmaeilzadeh and M. Roshanfekr, “A new cubic equation of state for reservoir fluids,” Fluid Phase
153 Towards Sustainable Solvent-Based Affinity Separations

666666
VLE PREDICTION FROM THE HEAT OF MIXING
Equilibria, vol. 239, no. 1, pp. 83–90, 2006.[61] R. Sandoval, G. Wilczek-Vera, and J. Vera, “Prediction of ternary vapor-liquid equilibria with the prsv
equation of state,” Fluid Phase Equilibria, vol. 52, pp. 119–126, 1989.[62] K. Nasrifar and M. Moshfeghian, “A new cubic equation of state for simple fluids: pure and mixture.,”
Fluid Phase Equilibria, vol. 190, no. 1-2, pp. 73–88, 2001.[63] C. H. Twu, J. E. Coon, and J. R. Cunningham, “An approach for the extension of a 3-parameter cubic
equation of state to heavy hydrocarbons,” Fluid phase equilibria, vol. 104, pp. 83–96, 1995.[64] A. Harmens and H. Knapp, “Three-parameter cubic equation of state for normal substances,” Industrial
& Engineering Chemistry Fundamentals, vol. 19, no. 3, pp. 291–294, 1980.[65] M. A. Trebble and P. R. Bishnoi, “Development of a new four-parameter cubic equation of state.,” Fluid
Phase Equilibria, vol. 35, no. 1-3, pp. 1–18, 1987.[66] R. L. Scott and P. H. van Konynenburg, “Static properties of solutions. van der waals and related models
for hydrocarbon mixtures,” Discussions of the Faraday society, vol. 49, pp. 87–97, 1970.[67] R. Stryjek and J. Vera, “Prsv2: a cubic equation of state for accurate vapor—liquid equilibria calculations,”
The Canadian Journal of Chemical Engineering, vol. 64, no. 5, pp. 820–826, 1986.[68] C. H. Twu, W. D. Sim, and V. Tassone, “A versatile liquid activity model for srk, pr and a new cubic
equation-of-state tst,” Fluid Phase Equilibria, vol. 194, pp. 385–399, 2002.[69] J. Sinor and J. H. Weber, “Vapor-liquid equilibria at atmospheric pressure. systems containing ethyl alco-
hol, n-hexane, benzene, and methylcyclopentane.,” Journal of Chemical and Engineering Data, vol. 5, no. 3,pp. 243–247, 1960.
[70] L. Kudryavtseva and M. Susarev, “Liquid-vapor equilibriums in the systems acetone-hexane and hexane-ethyl alcohol at 35, 45, and 55 and 760mmhg,” Zh. Prikl. Khim, vol. 36, pp. 1471–1477, 1963.
[71] I. Brown, W. Fock, and F. Smith, “Heats of mixing. v. systems of n-alcohols with n-hexane,” AustralianJournal of Chemistry, vol. 17, no. 10, pp. 1106–1118, 1964.
[72] V. Bykov, “Heats of mixing of liquids,” Zh. Fiz. Khim, vol. 13, pp. 1013–1019, 1939.[73] R. Stokes and C. Burfitt, “Enthalpies of dilution and transfer of ethanol in non-polar solvents,” The Journal
of Chemical Thermodynamics, vol. 5, no. 5, pp. 623–631, 1973.[74] T. Spyriouni, X. Krokidis, and I. G. Economou, “Thermodynamics of pharmaceuticals: Prediction of sol-
ubility in pure and mixed solvents with pc-saft,” Fluid phase equilibria, vol. 302, no. 1-2, pp. 331–337,2011.
Towards Sustainable Solvent-Based Affinity Separations 154


7777777
7Biobased Entrainers for ExtractiveDistillation for Apolar Separations
"I consider nature a vast chemical laboratory in which all kinds of compositionand decompositions are formed",Antoine Lavoisier, (1743 - 1794)
This chapter is adapted from:Brouwer, T. and Schuur, B. "Bio-based Solvents as Entrainers for ExtractiveDistillation in Aromatic/Aliphatic and Olefin/Paraffin Separation", Green Chem-istry (2020), 22, 16, 5369-5375.

7777777
BIOBASED ENTRAINERS FOR APOLAR SEPARATIONS
7.1 Introduction
Well-known industrial solvents in the petroleum industry are Sulfolane,1 n-methylpyrrolidone (NMP)2,3 and N,N-dimethylformamide (DMF).4 The ap-plication of these traditional solvents is not always as benign as desired; forinstance, NMP is going to be banned for certain industrial applications dueto the REACH legislation.5 Therefore, increasingly more attention has beengiven to the search for alternative, more benign, solvents. For example, ionicliquids (ILs),6 deep eutectic solvents (DES’s)7 and switchable solvents8 areamong the studied alternatives. Bio-based solvents may be considered an-other class of solvents, including both natural DES’s (mixtures exhibiting aneutectic behavior)9,10 and single-component bio-based solvents.11,12 The single-component solvents are most similar to traditional solvents in terms of molec-ular properties but they differ in the feedstock.
In this contribution, our study to find bio-based alternative solvents for ex-tractive distillation is described, aiming at replacing fossil-based solvents tominimize the environmental impact associated with solvent production. Inthe comparison of the sustainability aspect of bio-based solvents and tradi-tional solvents, the difference in the feedstock is apparent. In contrast to tra-ditional solvents that are almost all derived from fossil oil,13 the feedstockfor bio-based solvents is diverse, and includes lignocellulosic biomass,14 fer-mentation broths15 or (air-captured) carbon dioxide.16 On the condition thataccess to such bio-based chemicals involves clean processes, this approach canlessen the impact on the environment due to the use of carbon from the shortcarbon cycle.17
As lignocellulosic biomass consists mainly of C5- and C6-sugars and lignin,a large variety of platform chemicals may be derived from them. Access tohighly interesting chemistry can be realized by pyrolysis; see for examplethe route to dihydrolevoglucosenone in Figure 7.1. Upon further refinement,from biomass-derived sugars, for instance, propylene glycol, levulinic acid,γ-valerolactone, glycerol and furfural can be produced.14 With an additionalsynthetic step, the variety of accessible bio-based chemicals increases evenfurther, e.g. nucleophilic addition of methanol to produce cyclopentyl methylether,18 fermentation of glycerol to propionic acid,19 trimerization of acetone
Towards Sustainable Solvent-Based Affinity Separations 158

7777777
BIOBASED ENTRAINERS FOR APOLAR SEPARATIONS
to isophorone,20 and esterification of acetic acid and glycerol to triacetin21
and levulinic acid and ethanol to ethyl levulinate.22 Fast (catalytic) pyroly-sis or hydrolysis of lignin can yield aromatic chemicals such as guaiacol,23
phenol24 and acetophenone.25 Ethylene carbonate can be produced by thecycloaddition of carbon dioxide to epoxides.16,17
Dihydrolevoglucosenone, or Cyrene, shown in Figure 7.1, has been mentionedas a promising bio-based alternative polar aprotic compound. It was synthe-sized in 1978 by Brimacombe et al.26 by the reduction of levoglucose-noneand also shown by the group of Weckhuysen.27 Levoglucosenone itself canbe obtained by the fast pyrolysis of cellulose.28–31 The recent rediscovery ofCyrene has resulted in various application assessments, including as a sol-vent for several reactions (fluorination,31 Menschutkins-,31 Sonogashira- andCacchi-type annulation,32,33 basic reactions,32 acyl substitution,32 Suzuki–Miyaura cross-coupling,32,34 amide synthesis,32,35 urea synthesis,36 MOF syn-thesis,37 solid-phase synthesis38), as a starting material for platform chemi-cals,39 as a hydrotropic solvent due to the capabilities via its germinal diol40
and as a solvent for liquid exfoliation in graphene processing.41
Figure 7.1: Synthetic steps of a bio-based solvent via pyrolysis of cellulose to levoglucosenonewhich is subsequently hydrogenated to dihydrolevoglucosenone (Cyrene).32
We decided to include Cyrene in the aforementioned range of bio-based sol-vents to be evaluated as an entrainer in two highly relevant industrial ex-tractive distillation processes. The separation of methylcyclohexane (MCH)and toluene is a model system for the separation of aromatics and aliphat-ics. Although this particular separation is challenging due to the close boil-ing nature of the binary mixture, it also represents a wider range of sepa-rations in a complex industrial hydrocarbon mixture. Relatively low-boiling
159 Towards Sustainable Solvent-Based Affinity Separations

7777777
BIOBASED ENTRAINERS FOR APOLAR SEPARATIONS
aromatic compounds (BTX, i.e. benzene, toluene, and xylenes) are to be en-trained from a wide range of aliphatic compounds which can be as volatile asthe BTX compounds, but also much heavier. The addition of a solvent musttherefore achieve a reversal of the boiling point order, hence separation ofall aliphatic compounds over the top of the distillation column as the distil-late.42,43 For this challenging task, many solvents do not show high-enoughselectivity.43 The solvent screening results of this study will include a com-parison with Sulfolane to identify which of the bio-based solvents performsimilarly or better, and may be applied in a wider range of separations of aro-matics and aliphatics. Furthermore, for promising solvents, the application asan entrainer in another challenging separation problem, the olefin/paraffinseparation,44 will be investigated, for which n-heptane and 1-heptene werechosen as the model system.
A first estimate, or performance prediction, was performed using the modi-fied UNIFAC (Do) model,45 known to be among the best predicting modelsfor vapor–liquid equilibria.46
7.2 Experimental Section
7.2.1 Materials
All purchased chemicals were used without any additional purification. FromHoneywell methylcyclohexane (Reagent Grade, 99%) was purchased, whiletoluene (ACS, Reag.Ph.Eur) was purchased from VWR Chemicals. Merck wasthe supplier for acetone (LiChrosolv) and ethylene glycol (Empure, Reag.Ph.-Eur.). Acros Organics supplied us with γ-valerolactone (98%), levulinic acid(98+%), triacetin (99%) and tributyl phosphate (99+%). n-Heptane (99%) waspurchased from Alfa Aesar and d-chloroform (99.5%) was supplied Cam-bridge Isotope Laboratories, Inc. We are grateful for the Circa Group whosupplied us with Cyrene. The remainder was purchased from Sigma Aldr-ich; Sulfolane (99%), propylene glycol (≥99.5%), propionic acid (≥99.5%),methyl salicylate (>99%), ethylene carbonate (98%), isophorone (97%), gua-iacol (≥99%), phenol (≥99%), furfural (99%), acetophenone (99%), 1-heptene(99%) and n-methylpyrrolidone (99.5%).
Towards Sustainable Solvent-Based Affinity Separations 160

7777777
BIOBASED ENTRAINERS FOR APOLAR SEPARATIONS
7.2.2 Experimental setup
Fischer Labodest VLE602 ebulliometers, see for an ebulliometer example inFigure 7.2, were used for the measurement of the isobaric vapor–liquid equi-libria (VLE). Each mixture, containing the binary mixture and optionally asolvent, was heated to reach an equilibrium temperature at a pre-set pres-sure. For each measurement, a total amount of about 85 g of the liquid wasadded to the ebulliometer, which ensured adequate liquid and vapor flowsthroughout the ebulliometer system.
Figure 7.2: A schematic representation of an ebulliometer. (1) Heating bulb, (2) circula-tion (Cottrell) pump, (3) Equilibrium chamber, (4) Condenser, (5) Mixing Chamber, (6)Temperature sensor, (7) Liquid phase sampling point, (8) Condensed vapor phase samplingpoint, (9 and 10) Alternative (not used) sampling points. Copied from Srirachat et al.47
Each measurement was left to equilibrate for approximately 60 min, and afterreaching the equilibrium, 0.5–1.0 mL of liquid samples were taken from theliquid and condensed vapor flows. A solvent-to-feed ratio of 1 was used if notspecified otherwise. A 50/50 wt. % mixture of MCH and toluene was usedfor the screening of the bio-based solvents, while a 90/10 wt. % mixture wasused for the measurements with n-heptane/1-heptene. Distillation results are
161 Towards Sustainable Solvent-Based Affinity Separations

7777777
BIOBASED ENTRAINERS FOR APOLAR SEPARATIONS
typically reported in mole fractions, so these were calculated as well.
7.2.3 Analysis Method
7.2.3.1 Gas Chromatography
A Thermo Scientific Trace 1300 gas chromatograph with two parallel ovensand an autosampler TriPlus 100 Liquid Samples was used for the analyses.The samples of the methylcyclohexane/toluene system were analyzed usingan Agilent DB-1MS column (60m × 0.25mm × 0.25µm) with an injection vol-ume of 1 µl diluted in analytical acetone. A ramped temperature profile wasused, following the program; an initial temperature of 50°C, with a ramp of10 °C/min to 200°C. The second ramp of 50 °C/min to 320 °C finished theprogram, which lasts 20 min. The FID temperature was 330°C. A columnflow of 2 ml/min with a split ratio of 5, an airflow of 350 ml/min, a heliummake-up flow of 40 ml/min and a hydrogen flow of 35 ml/min was used.
7.2.3.2 1H-NMR
The samples of the n-heptane/1-heptene system were analyzed by proton Nu-clear Magnetic Resonance (1H-NMR) spectroscopy using a Bruker 400 MHzspectrometer. The samples were diluted in deuterated chloroform (d-chloro-form). The intensities of the characteristic peaks of n-heptane, 1-heptene,Cyrene and NMP of respectively 0.74 ppm, 5.74 ppm, 3.95 ppm and 2.80ppm were used to determine the composition.
7.3 Results and Discussion
The potential of various bio-based solvents to increase the relative volatility inthe MCH–toluene binary mixture was evaluated experimentally by measuringthe pseudo-binary vapor–liquid equilibrium (VLE), pseudo-binary meaningthat the composition of the solvent is not taken into account in the calcula-tions for the MCH–toluene binary mixture. The relative volatility (αij ) is theratio of the activity coefficients (γi) and the saturated vapor pressures (P 0
i ) ofboth compounds, as shown in Equation 7.1. For more information see, sub-section 2.3.1.
Towards Sustainable Solvent-Based Affinity Separations 162
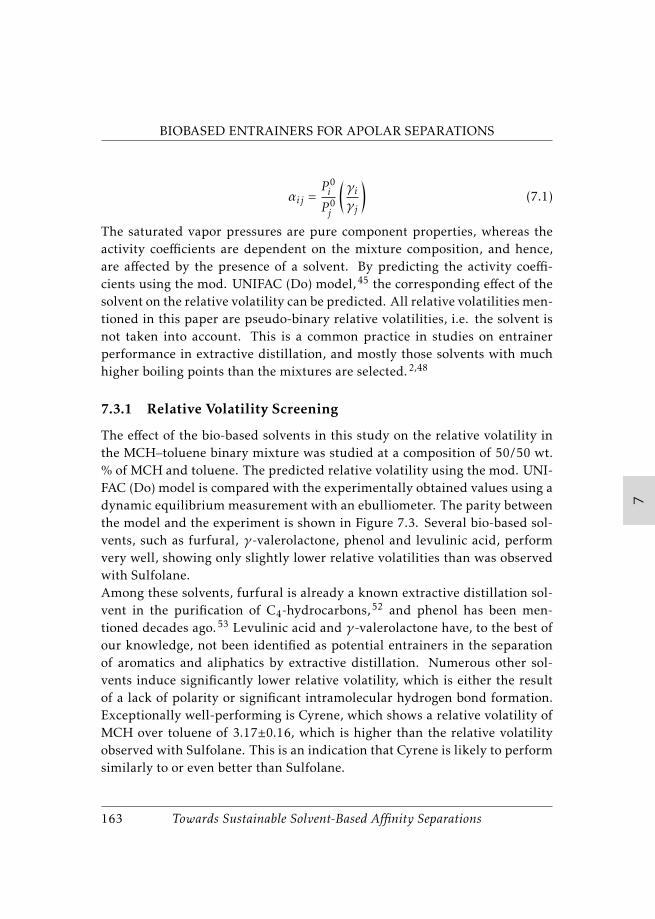
7777777
BIOBASED ENTRAINERS FOR APOLAR SEPARATIONS
αij =P 0i
P 0j
(γiγj
)(7.1)
The saturated vapor pressures are pure component properties, whereas theactivity coefficients are dependent on the mixture composition, and hence,are affected by the presence of a solvent. By predicting the activity coeffi-cients using the mod. UNIFAC (Do) model,45 the corresponding effect of thesolvent on the relative volatility can be predicted. All relative volatilities men-tioned in this paper are pseudo-binary relative volatilities, i.e. the solvent isnot taken into account. This is a common practice in studies on entrainerperformance in extractive distillation, and mostly those solvents with muchhigher boiling points than the mixtures are selected.2,48
7.3.1 Relative Volatility Screening
The effect of the bio-based solvents in this study on the relative volatility inthe MCH–toluene binary mixture was studied at a composition of 50/50 wt.% of MCH and toluene. The predicted relative volatility using the mod. UNI-FAC (Do) model is compared with the experimentally obtained values using adynamic equilibrium measurement with an ebulliometer. The parity betweenthe model and the experiment is shown in Figure 7.3. Several bio-based sol-vents, such as furfural, γ-valerolactone, phenol and levulinic acid, performvery well, showing only slightly lower relative volatilities than was observedwith Sulfolane.Among these solvents, furfural is already a known extractive distillation sol-vent in the purification of C4-hydrocarbons,52 and phenol has been men-tioned decades ago.53 Levulinic acid and γ-valerolactone have, to the best ofour knowledge, not been identified as potential entrainers in the separationof aromatics and aliphatics by extractive distillation. Numerous other sol-vents induce significantly lower relative volatility, which is either the resultof a lack of polarity or significant intramolecular hydrogen bond formation.Exceptionally well-performing is Cyrene, which shows a relative volatility ofMCH over toluene of 3.17±0.16, which is higher than the relative volatilityobserved with Sulfolane. This is an indication that Cyrene is likely to performsimilarly to or even better than Sulfolane.
163 Towards Sustainable Solvent-Based Affinity Separations

7777777
BIOBASED ENTRAINERS FOR APOLAR SEPARATIONS
Figure 7.3: The screening results of twenty-four bio-based solvents regarding the relativevolatility of a 50/50 wt. % MCH/toluene mixture with a solvent-to-feed ratio of 1 (massbasis) at 1000 mbar. On the x-axis, the experimental relative volatility is plotted againstthe relative volatility predicted by the mod. UNIFAC (Do) model on the y-axis. Additionalliterature values are included.49–51 The error bars indicate the standard deviation of duplomeasurements.
Several biobased solvents are however too volatile to be used as an extrac-tive distillation agent, such as p-xylene (bp = 412K), 1-butanol (bp = 390K),2-propanol (bp = 356K), 2-butanone (bp = 353K), acetic acid (bp = 391K),ethyl acetate (bp = 350K), ethanol (bp = 351K), propionic acid (bp = 414K),methanol (bp = 338K) and acetone (bp = 329K). Even tough acetone does en-hances the relative volatility significantly.
From Figure 7.3, it can further be concluded that the mod. UNIFAC (Do)predictive model, even though being among the best predictive models forthis task,46 shows significant deviations in the predictions. Although manypredictions are accurate within a deviation of 10%, there are several solventsfor which a larger inaccuracy was observed. From the previous work,46 at
Towards Sustainable Solvent-Based Affinity Separations 164

7777777
BIOBASED ENTRAINERS FOR APOLAR SEPARATIONS
infinite dilution, the activity coefficient deviation of the mod. UNIFAC (Do)model was on an average 24.3%. This prediction is however more accuratefor similar molecules, but can also be highly inaccurate, for instance betweenaliphatic compounds and aprotic and protic compounds (56.8% deviation).These trends are shown in Figure 7.3, where the performance prediction ofthe aprotic polar solvent, acetophenone, is >10%. The deviation decreases ifthe polar character is decreased, such as in isophorone. Overall, these resultsare in agreement with the earlier conclusions at infinite dilution.46
7.3.2 Vapor-Liquid Equilibrium of MCH-TOL-Cyrene
Based on the excellent results for the MCH–toluene separation, the use ofCyrene for extractive distillation of this mixture was further studied for theentire pseudo-binary composition range and compared with the effect of Sul-folane on the MCH–toluene pseudo-binary VLE. For each measurement, thesolvent-to-feed (S:F) ratio was maintained at 1 (mass basis) and the pressurewas varied between 1000, 800 and 500 mbar. In Figure 7.4. It can be seen thatat smaller MCH mole fractions, until approximately 0.4, the relative volatil-ity induced by Cyrene appears to be comparable with that of Sulfolane, orslightly less. However, at higher fractions of MCH, with Sulfolane, a distinctpinch point is observed, whereas with Cyrene in that part of the diagram,a much higher relative volatility is observed, resulting in the absence of thepinch point or at least a much less severe pinch point.
165 Towards Sustainable Solvent-Based Affinity Separations

7777777
BIOBASED ENTRAINERS FOR APOLAR SEPARATIONS
Figure 7.4: The pseudo-binary isobaric vapour liquid equilibrium (xy- and Txy-) diagramswith Sulfolane and Cyrene as the solvents with a solvent-to-feed (S : F) ratio of 1 on massbasis at 1000, 800 and 500 mbar. The literature values of Quiggle et al.54 were used as thebinary reference.
This is likely due to phase splitting that can occur for Sulfolane at high MCHcontent, while for Cyrene this is not observed. Phase splitting reduces in-teractions of the solvent towards both toluene and MCH, hence diminishingthe solvent effects on the relative volatility and resulting in a pinch point.Furthermore, an insignificant Cyrene fraction was found in the vapor phase,which varies between 0.07 and 1.62 wt. % mainly depending on the solvent-to-feed (S:F) ratio and the operational pressure. The stability of Cyrene wasconfirmed by 1H-NMR (see Figure 7.5) after its recovery using a rotary evap-orator.
Towards Sustainable Solvent-Based Affinity Separations 166

7777777
BIOBASED ENTRAINERS FOR APOLAR SEPARATIONS
Figure 7.5: The 1H-NMR spectrum of used and fresh Cyrene compared.
To explain the observations in the VLE experiments, the charge distributionsin n-heptane, 1-heptene, toluene, MCH and Cyrene have been simulated us-ing the COSMO-RS software (Conductor like Screening Model for RealisticSolvents). Based on density functional theory, the molecular geometries havebeen optimized, and then the screening charge around the surface of themolecules was calculated and plotted. For the five molecules in this study,the so-called σ -profiles are shown in Figure 7.6, together with the surfaces.Negative screening charge density indicates an electropositive region, whilepositive screening charge density corresponds with an electronegative region.Cyrene is the most polar of the displayed molecules, which is reflected in botha peak at a positive screening charge density and a peak at a negative screen-ing charge density. n-Heptane and MCH, in contrast, exhibit a single peakaround 0, exemplary for their apolar character. This charge mismatch causesnet repulsive interactions, resulting in high activity coefficients.
The π-orbitals in the unsaturated hydrocarbons responsible for the electricquadrupole moments result in screening charge profiles that are off-centered,
167 Towards Sustainable Solvent-Based Affinity Separations

7777777
BIOBASED ENTRAINERS FOR APOLAR SEPARATIONS
i.e. with clear maxima at the positive screening charge, and most pronouncedfor toluene, also at the negative screening charge. The presence of these pos-itive and negative screening charges induces attractive dipole–dipole interac-tions, and for this reason, both unsaturated hydrocarbons are less repelled byCyrene than their corresponding saturated hydrocarbons. As a result, theiractivity coefficients are lower which results in an increased relative volatility,as indeed is shown in Figure 7.4 for the MCH–toluene system.
Figure 7.6: The charge distribution (σ -profile) of toluene, methylcyclohexane, n-heptane,1-heptene and Cyrene. Calculated with COSMOthermX C30_1705 using the TZVP-parameterization.
These results are additionally fitted using the UNIQUAC model for eventualprocess simulations. This model requires however the Van der Waals area(ri) and volume (qi) of each component. These parameters are known formethylcyclohexane and toluene, however not of Cyrene.The unknown parameters are estimated with Density Functional Theory witha B3LYP 6-311+G** parameterization in combination with the methodologyof Banerjee et al.55
The equilibrium line from the fitted UNIQUAC model was used as input forthe energy estimations. The energy requirements of a distillation column
Towards Sustainable Solvent-Based Affinity Separations 168

7777777
BIOBASED ENTRAINERS FOR APOLAR SEPARATIONS
Table 7.1: The UNIQUAC parameters for methylcyclohexane, toluene and Cyrene and thefitted binary interaction coefficients.
Component ri qi (ref)MCH 5.174 4.396 Chen et al.56
TOL 3.920 2.970 Gupta et al.57
Cyrene 4.843 3.322 (-)
i j aij aji bij bji cij cjiMCH
Cyrene-7.904 15.97 533.5 -418.1 1.022 -2.592
TOL 76.88 -13.22 815.3 -799.8 -13.59 2.666MCH TOL 0.198 -0.0405 -93.56 5.613 (-) (-)
*The pure component vapor pressure of Cyrene has been used from. 58
(reboiler and condenser) are highly dependent on the minimum reflux ra-tio (Rmin), which influences the amount of liquid that needs to be evaporatedin the reboiler. The Rmin was estimated by the graphical McCabe–Thiele ap-proach59 and found to be 2.21 for Sulfolane and only 1.25 for Cyrene, seeFigure 7.7. This shows the strong effect of removing the pinch point whenreplacing Sulfolane with Cyrene, resulting in a significant decrease of 43% inRmin,
Figure 7.7: McCabe-Thiele method and the determination of the Rmin. For more informationsee subsection 2.3.1.
169 Towards Sustainable Solvent-Based Affinity Separations

7777777
BIOBASED ENTRAINERS FOR APOLAR SEPARATIONS
which could correspond to a projected energy savings in the reboiler dutyof maximum 30%, depending on the exact conditions of operation, such assolvent feed temperatures and excluding the use of an anti-solvent such aswater.
7.3.3 Olefin/Paraffin Separation: n-Heptane and 1-Heptene
Based on the potential of Cyrene as a bio-based alternative for Sulfolane, theremay be other applications where Cyrene can replace polar non-protic entrain-ers. An important class is the separation of olefin/paraffin. Therefore theevaluation of Cyrene was extended towards olefin/paraffin separation. Themodel system of n-heptane and 1-heptene was selected because of the ex-perimentally convenient boiling temperatures, and was examined at a singlebinary composition of 90 wt. % n-heptane and 10 wt. % 1-heptene. Thisis the composition where the solvent effect for the MCH–toluene separationwith Cyrene was the largest.
Figure 7.8: The relative volatility of n-heptane over 1-heptene without a solvent, withCyrene at a S : F ratio of 1 and 3 and with n-methylpyrrolidone (NMP) at 1000 mbar andS:F = 1 with a feed composition of 90 wt. % n-heptane and 10 wt. % 1-heptene. S:F ratiosare all on mass basis. These are single experiments. An overall uncertainty of experimentaland analytical error of 3% was found for similar experiments
Towards Sustainable Solvent-Based Affinity Separations 170

7777777
BIOBASED ENTRAINERS FOR APOLAR SEPARATIONS
As can be seen in Figure 7.8, Cyrene increases the relative volatility from 0.83to 1.03 (S:F = 1 on mass basis) and 1.20 (S:F = 3) due to the impact of the dif-ference in screening charge distributions between n-heptane and 1-heptene,as shown in Figure 7.6. The experiments thus showed that it was possible toachieve the desired natural boiling order reversal effect. In comparison withone of the industrial standards, NMP, which induces a higher relative volatil-ity of 1.65 (S:F ratio = 1), the performance of Cyrene is lower. This is due tothe less pronounced positive screening charge area of 1-heptene compared totoluene; see Figure 7.6. Nevertheless, the effect of Cyrene can be further en-hanced by using a larger S:F ratio.
Furthermore, we speculate that the effect of the solvent will be more pro-nounced in the industrially relevant separation of butadiene,44 as butadienehas twice the number of unsaturated bonds in comparison with 1-heptene.This allows for significantly more dipole interactions of the solvent via theπ-bonds, which lowers the activity coefficient, and thus increases the rela-tive volatility towards the saturated compound. This has been shown by DeOliveira et al. for 1,3-butadiene and isobutene in the presence of NMP.60,61
Based on the observed results for the studied systems, we project that the bio-based solvent Cyrene has the potential of phasing out toxic solvents such asNMP62 in extractive distillation applications, though detailed energy require-ments via rigorous process simulations are required for verification.
7.4 Conclusion
From a wide-range screening of bio-based solvents to separate a 50/50 wt.% mixture of MCH and toluene, Cyrene was seen to most effectively entraintoluene to induce an excellent relative volatility of 3.17 ± ±0.16, being evenhigher than the industrial state-of-the-art Sulfolane. Especially at higher MCHfractions, Cyrene significantly induces the relative volatility in the system,whereas the use of Sulfolane in this composition range results in a pinch point.The absence of the pinch point when using Cyrene lowers the minimum refluxratio from 2.21 for Sulfolane to 1.25 for Cyrene, corresponding to an expectedenergy usage reduction of approximately 30%.The potential of Cyrene was additionally evaluated for the olefin/paraffin sep-
171 Towards Sustainable Solvent-Based Affinity Separations

7777777
BIOBASED ENTRAINERS FOR APOLAR SEPARATIONS
aration of n-heptane and 1-heptene. Based on the observed relative volatilitytowards n-heptane of 1.03 and 1.20 for the S:F ratio of 1 and 3 respectively,we expect that the use of Cyrene for the industrially highly relevant butadienesplitting is also suitable. This offers the opportunity to replace NMP, which issubject to strong environmental restrictions.
7.5 Nomenclature
Cyrene = DihydrolevoglucosenoneDMF = n,n-DimethylformamideFID = Flame Ionization DetectionMCH = MethylcyclohexaneMod. UNIFAC (Do) = Dortmund modification of UNIFACNMP = n-MethylpyrrolidoneNMR = Nuclear Magnetic Resonance
REACH =Registration, Evaluation, Authorisation and Re-striction of Chemicals
S:F Ratio = Solvent to Feed RatioSulfolane = Tetrahydrothiophene-1,1-dioxideTOL = TolueneTZVP = Triple valence plus polarizationUNIFAC = UNIQUAC functional-group activity coefficientsUNIQUAC = Universal quasichemicalVLE = Vapour Liquid equilibriumαij = Relative volatility (-)P oi = Pure component vapor pressure (bar)xi = Molar fraction of compound i
7.6 References
[1] Y. J. Choi, K. W. Cho, B. W. Cho, and Y.-K. Yeo, “Optimization of the sulfolane extraction plant basedon modeling and simulation,” Industrial & engineering chemistry research, vol. 41, no. 22, pp. 5504–5509,2002.
[2] M. Fahim and A. Elkilani, “Prediction of optimum composition of the mixed solvent n-methylpyrrolidone/ethylene glycol for the extraction of aromatics,” Separation Science and Technology,vol. 25, no. 13-15, pp. 1803–1815, 1990.
Towards Sustainable Solvent-Based Affinity Separations 172

7777777
BIOBASED ENTRAINERS FOR APOLAR SEPARATIONS
[3] R. J. Noe, B. R. Beadle, and L. E. Sullivan, “Aromatics recovery by extractive distillation,” Oct. 8 2013. USPatent 8,552,247.
[4] Z. Lei, R. Zhou, and Z. Duan, “Process improvement on separating c4 by extractive distillation,” ChemicalEngineering Journal, vol. 85, no. 2-3, pp. 379–386, 2002.
[5] J. Sherwood, T. J. Farmer, and J. H. Clark, “Catalyst: Possible consequences of the n-methyl pyrrolidonereach restriction,” Chem, vol. 4, no. 9, pp. 2010–2012, 2018.
[6] Z. Lei, C. Dai, J. Zhu, and B. Chen, “Extractive distillation with ionic liquids: a review,” AIChE Journal,vol. 60, no. 9, pp. 3312–3329, 2014.
[7] N. R. Rodriguez, A. S. Gonzalez, P. M. Tijssen, and M. C. Kroon, “Low transition temperature mixtures(lttms) as novel entrainers in extractive distillation,” Fluid Phase Equilibria, vol. 385, pp. 72–78, 2015.
[8] B. Schuur, M. Nijland, M. Blahušiak, and A. Juan, “Co2-switchable solvents as entrainer in fluid separa-tions,” ACS sustainable chemistry & engineering, vol. 6, no. 8, pp. 10429–10435, 2018.
[9] Y. Liu, J. B. Friesen, J. B. McAlpine, D. C. Lankin, S.-N. Chen, and G. F. Pauli, “Natural deep eutecticsolvents: properties, applications, and perspectives,” Journal of natural products, vol. 81, no. 3, pp. 679–690, 2018.
[10] B. Sharma, N. Singh, and J. P. Kushwaha, “Natural deep eutectic solvent-mediated extractive distillationfor separation of acetonitrile+ water azeotropic mixture,” Journal of Chemical & Engineering Data, vol. 65,no. 4, pp. 1497–1505, 2020.
[11] F. Jérôme and R. Luque, Bio-based solvents. John Wiley & Sons, 2017.[12] B. Schuur, T. Brouwer, D. Smink, and L. M. Sprakel, “Green solvents for sustainable separation processes,”
Current Opinion in Green and Sustainable Chemistry, vol. 18, pp. 57–65, 2019.[13] E. Clark, “Sulfolane and sulfones,” Kirk-Othmer encyclopedia of chemical technology, 2000.[14] F. H. Isikgor and C. R. Becer, “Lignocellulosic biomass: a sustainable platform for the production of bio-
based chemicals and polymers,” Polymer Chemistry, vol. 6, no. 25, pp. 4497–4559, 2015.[15] J.-Y. Dai, Y.-Q. Sun, and Z.-L. Xiu, “Separation of bio-based chemicals from fermentation broths by
salting-out extraction,” Engineering in Life Sciences, vol. 14, no. 2, pp. 108–117, 2014.[16] M. North, P. Villuendas, and C. Young, “A gas-phase flow reactor for ethylene carbonate synthesis from
waste carbon dioxide,” Chemistry–A European Journal, vol. 15, no. 43, pp. 11454–11457, 2009.[17] Y. P. Patil, P. J. Tambade, S. R. Jagtap, and B. M. Bhanage, “Carbon dioxide: a renewable feedstock for the
synthesis of fine and bulk chemicals,” Frontiers of Chemical Engineering in China, vol. 4, no. 2, pp. 213–235,2010.
[18] K. Watanabe, N. Yamagiwa, and Y. Torisawa, “Cyclopentyl methyl ether as a new and alternative processsolvent,” Organic process research & development, vol. 11, no. 2, pp. 251–258, 2007.
[19] A. Ekman and P. Börjesson, “Environmental assessment of propionic acid produced in an agriculturalbiomass-based biorefinery system,” Journal of Cleaner Production, vol. 19, no. 11, pp. 1257–1265, 2011.
[20] C. Kelkar and A. Schutz, “Efficient hydrotalcite-based catalyst for acetone condensation to α-isophorone—scale up aspects and process development,” Applied clay science, vol. 13, no. 5-6, pp. 417–432, 1998.
[21] S. Kale, U. Armbruster, S. Umbarkar, M. Dongare, and A. Martin, “Esterification of glycerol with aceticacid for improved production of triacetin using toluene as an entrainer,” STA, vol. 11, no. 206, pp. 274–5,2013.
[22] D. Fernandes, A. Rocha, E. Mai, C. J. Mota, and V. T. Da Silva, “Levulinic acid esterification with ethanol toethyl levulinate production over solid acid catalysts,” Applied Catalysis A: General, vol. 425, pp. 199–204,2012.
[23] X. Li, L. Su, Y. Wang, Y. Yu, C. Wang, X. Li, and Z. Wang, “Catalytic fast pyrolysis of kraft lignin withhzsm-5 zeolite for producing aromatic hydrocarbons,” Frontiers of Environmental Science & Engineering,vol. 6, no. 3, pp. 295–303, 2012.
[24] S. Nenkova, T. Vasileva, and K. Stanulov, “Production of phenol compounds by alkaline treatment oftechnical hydrolysis lignin and wood biomass,” Chemistry of Natural Compounds, vol. 44, no. 2, pp. 182–185, 2008.
[25] C. Amen-Chen, H. Pakdel, and C. Roy, “Production of monomeric phenols by thermochemical conversionof biomass: a review,” Bioresource technology, vol. 79, no. 3, pp. 277–299, 2001.
[26] J. S. Brimacombe, B. JS, T. LCN, et al., “The stereochemistry of the reduction of 1, 6-anhydro-3, 4-dideoxy-
173 Towards Sustainable Solvent-Based Affinity Separations
7777777
BIOBASED ENTRAINERS FOR APOLAR SEPARATIONS
beta-d-glycero-hex-3-enopyranos-2-ulose (levoglucosenone) with lithium aluminium hydride.,” 1978.[27] C. Sener, D. D. Petrolini, D. J. McClelland, J. He, M. R. Ball, Y. Liu, L. Martins, J. A. Dumesic, G. W. Huber,
B. M. Weckhuysen, et al., “Catalytic hydrogenation of dihydrolevoglucosenone to levoglucosanol with ahydrotalcite/mixed oxide copper catalyst,” Green Chemistry, vol. 21, no. 18, pp. 5000–5007, 2019.
[28] F. Cao, T. J. Schwartz, D. J. McClelland, S. H. Krishna, J. A. Dumesic, and G. W. Huber, “Dehydration ofcellulose to levoglucosenone using polar aprotic solvents,” Energy & Environmental Science, vol. 8, no. 6,pp. 1808–1815, 2015.
[29] S. H. Krishna, D. J. McClelland, Q. A. Rashke, J. A. Dumesic, and G. W. Huber, “Hydrogenation of lev-oglucosenone to renewable chemicals,” Green chemistry, vol. 19, no. 5, pp. 1278–1285, 2017.
[30] S. Kudo, N. Goto, J. Sperry, K. Norinaga, and J.-i. Hayashi, “Production of levoglucosenone and dihy-drolevoglucosenone by catalytic reforming of volatiles from cellulose pyrolysis using supported ionicliquid phase,” ACS Sustainable Chemistry & Engineering, vol. 5, no. 1, pp. 1132–1140, 2017.
[31] J. Sherwood, A. Constantinou, L. Moity, C. R. McElroy, T. J. Farmer, T. Duncan, W. Raverty, A. J. Hunt, J. H.Clark, et al., “Dihydrolevoglucosenone (cyrene) as a bio-based alternative for dipolar aprotic solvents,”Chemical Communications, vol. 50, no. 68, pp. 9650–9652, 2014.
[32] J. E. Camp, “Bio-available solvent cyrene: Synthesis, derivatization, and applications,” ChemSusChem,vol. 11, no. 18, pp. 3048–3055, 2018.
[33] K. L. Wilson, A. R. Kennedy, J. Murray, B. Greatrex, C. Jamieson, and A. J. Watson, “Scope and limitationsof a dmf bio-alternative within sonogashira cross-coupling and cacchi-type annulation,” Beilstein journalof organic chemistry, vol. 12, no. 1, pp. 2005–2011, 2016.
[34] K. L. Wilson, J. Murray, C. Jamieson, and A. J. Watson, “Cyrene as a bio-based solvent for the suzuki–miyaura cross-coupling,” Synlett, vol. 29, no. 05, pp. 650–654, 2018.
[35] K. L. Wilson, J. Murray, C. Jamieson, and A. J. Watson, “Cyrene as a bio-based solvent for hatu mediatedamide coupling,” Organic & biomolecular chemistry, vol. 16, no. 16, pp. 2851–2854, 2018.
[36] L. Mistry, K. Mapesa, T. W. Bousfield, and J. E. Camp, “Synthesis of ureas in the bio-alternative solventcyrene,” Green Chemistry, vol. 19, no. 9, pp. 2123–2128, 2017.
[37] J. Zhang, G. B. White, M. D. Ryan, A. J. Hunt, and M. J. Katz, “Dihydrolevoglucosenone (cyrene) as a greenalternative to n, n-dimethylformamide (dmf) in mof synthesis,” ACS Sustainable Chemistry & Engineering,vol. 4, no. 12, pp. 7186–7192, 2016.
[38] S. Lawrenson, M. North, F. Peigneguy, and A. Routledge, “Greener solvents for solid-phase synthesis,”Green Chemistry, vol. 19, no. 4, pp. 952–962, 2017.
[39] G. Bonneau, A. A. Peru, A. L. Flourat, and F. Allais, “Organic solvent-and catalyst-free baeyer–villigeroxidation of levoglucosenone and dihydrolevoglucosenone (cyrene®): a sustainable route to (s)-γ-hydroxymethyl-α, β-butenolide and (s)-γ-hydroxymethyl-γ-butyrolactone,” Green chemistry, vol. 20,no. 11, pp. 2455–2458, 2018.
[40] M. De Bruyn, V. L. Budarin, A. Misefari, S. Shimizu, H. Fish, M. Cockett, A. J. Hunt, H. Hofstetter, B. M.Weckhuysen, J. H. Clark, et al., “Geminal diol of dihydrolevoglucosenone as a switchable hydrotrope:A continuum of green nanostructured solvents,” ACS Sustainable Chemistry & Engineering, vol. 7, no. 8,pp. 7878–7883, 2019.
[41] H. J. Salavagione, J. Sherwood, V. Budarin, G. Ellis, J. Clark, P. Shuttleworth, et al., “Identification ofhigh performance solvents for the sustainable processing of graphene,” Green Chemistry, vol. 19, no. 11,pp. 2550–2560, 2017.
[42] F. Abushwireb, H. Elakrami, and M. Emtir, “Recovery of aromatics from pyrolysis gasoline by con-ventional and energy-integrated extractive distillation,” Computer Aided Chemical Engineering, vol. 24,p. 1071, 2007.
[43] M. Blahušiak, A. A. Kiss, K. Babic, S. R. Kersten, G. Bargeman, and B. Schuur, “Insights into the selectionand design of fluid separation processes,” Separation and purification technology, vol. 194, pp. 301–318,2018.
[44] R. B. Eldridge, “Olefin/paraffin separation technology: a review,” Industrial & engineering chemistry re-search, vol. 32, no. 10, pp. 2208–2212, 1993.
[45] U. Weidlich, J. Gmehling, and A. M. U. Model, “1. prediction of vle, he, and gamma infinta dilution,” Ind.Eng. Chem. Res, vol. 26, pp. 1372–1381, 1987.
[46] T. Brouwer and B. Schuur, “Model performances evaluated for infinite dilution activity coefficients pre-
Towards Sustainable Solvent-Based Affinity Separations 174

7777777
BIOBASED ENTRAINERS FOR APOLAR SEPARATIONS
diction at 298.15 k,” Industrial & Engineering Chemistry Research, vol. 58, no. 20, pp. 8903–8914, 2019.[47] W. Srirachat, K. Maneeintr, U. Pancharoen, and S. Kheawhom, “Isobaric vapor-liquid equilibrium for
binary system related to the organophosphoric extractant of d2ehpa + n-dodecane and tbp + n-dodecaneat 0.13, 2.40 and 6.67 kpa,” Vacuum, vol. 160, pp. 60 – 69, 2019.
[48] Q. Wang, J. Y. Chen, M. Pan, C. He, C. C. He, B. J. Zhang, and Q. L. Chen, “A new sulfolane aromaticextractive distillation process and optimization for better energy utilization,” Chemical Engineering andProcessing-Process Intensification, vol. 128, pp. 80–95, 2018.
[49] J. Coca and J. J. Pis, “Effect of morpholine on the vapor-liquid equilibrium of the systemmethylcyclohexane-toluene,” Journal of Chemical and Engineering Data, vol. 24, no. 2, pp. 103–105, 1979.
[50] L. Berg, “Separation of toluene from non-aromatic hydrocarbons by extractive distillation,” Dec. 14 1982.US Patent 4,363,704.
[51] M. Fenske, C. Carlson, and D. Quiggle, “Solvent separation of hydrocarbon mixtures by vapor-liquidextraction,” Industrial & Engineering Chemistry, vol. 39, no. 10, pp. 1322–1328, 1947.
[52] C. Buell and R. Boatright, “Furfural extractive distillation,” Industrial & Engineering Chemistry, vol. 39,no. 6, pp. 695–705, 1947.
[53] G. R. Lake, “Separation of hydrocarbons by distillation,” Aug. 27 1946. US Patent 2,406,695.[54] D. Quiggle and M. R. Fenske, “Vapor—liquid equilibria of methylcyclohexane—toluene mixtures,” Jour-
nal of the American Chemical Society, vol. 59, no. 10, pp. 1829–1832, 1937.[55] T. Banerjee, M. K. Singh, R. K. Sahoo, and A. Khanna, “Volume, surface and uniquac interaction pa-
rameters for imidazolium based ionic liquids via polarizable continuum model,” Fluid Phase Equilibria,vol. 234, no. 1-2, pp. 64–76, 2005.
[56] D. Chen, H. Ye, and H. Wu, “Liquid–liquid equilibria of methylcyclohexane–benzene–n-formylmorpholine at several temperatures,” Fluid phase equilibria, vol. 255, no. 2, pp. 115–120,2007.
[57] S. Gupta, B. Rawat, A. Goswami, S. Nanoti, and R. Krishna, “Isobaric vapour—liquid equilibria of thesystems: Benzene—triethylene glycol, toluene—triethylene glycol and benzene—n-methylpyrrolidone,”Fluid phase equilibria, vol. 46, no. 1, pp. 95–102, 1989.
[58] Z. S. Baird, P. Uusi-Kyyny, J.-P. Pokki, E. Pedegert, and V. Alopaeus, “Vapor pressures, densities, andpc-saft parameters for 11 bio-compounds,” International Journal of Thermophysics, vol. 40, no. 11, p. 102,2019.
[59] W. L. McCabe, J. C. Smith, and P. Harriott, Unit operations of chemical engineering, vol. 5. McGraw-hillNew York, 1967.
[60] J. V. de Oliveira and A. C. Uller, “Solubility of 1, 3-butadiene and methyl propene in n-methyl-2-pyrrolidone,” Fluid phase equilibria, vol. 46, no. 2-3, pp. 267–280, 1989.
[61] J. V. de Oliveira and A. C. Uller, “Solubility of pure 1, 3 butadiene and methyl propene and their mix-tures in pure n-methyl-2-pyrrolidone and in its aqueous solutions,” Fluid phase equilibria, vol. 118, no. 1,pp. 133–141, 1996.
[62] L. Malley, G. Kennedy, G. Elliott, T. Slone, W. Mellert, K. Deckardt, K. Kuttler, B. Hildebrand, M. Banton,R. Parod, et al., “Chronic toxicity and oncogenicity of n-methylpyrrolidone (nmp) in rats and mice bydietary administration,” Drug and chemical toxicology, vol. 24, no. 4, pp. 315–338, 2001.
175 Towards Sustainable Solvent-Based Affinity Separations


88888888
8Biobased Entrainers for ExtractiveDistillation for Polar Separations
"We can only see a short distance ahead, but we can see plenty there that needsto be done",Alan Turing, (1912 - 1954)
This chapter is adapted from:Brouwer, T. and Schuur, B. Biobased Entrainer Screening for Extractive Dis-tillation of Acetone and Diisopropyl ether, (Article Submitted)

88888888
BIOBASED ENTRAINERS FOR POLAR SEPARATIONS
8.1 Introduction
Distillation is the workhorse of the chemical industry as it can separate many,complex, mixtures with high efficiencies.1,2 However, the efficiency of a tradi-tional distillation column is reduced by non-ideal behavior, such as a pinch-point, or even made infeasible when an azeotrope is present. Improvingthe efficiency of these distillation operations can be achieved by smart de-sign3,4 and/or by the addition of a solvent that can break the azeotrope and/orremove the pinch point. Enhancing the distillation technique with a sol-vent has been done throughout the years and is called either extractive orazeotropic distillation, where the solvent in extractive distillation is typicallyhigh-boiling and in azeotropic distillation typically low-boiling.5 Commonexamples for extractive distillation are the separation of aliphatic and aro-matic compounds with Sulfolane6 and the separation of olefin and paraffinswith n-methylpyrrolidone (NMP).7 Azeotropic distillation is applied for ex-ample to dehydration of alcohol with benzene8,9 and acetic acid dehydrationwith ethyl acetate.10,11
To facilitate enhanced solvent-based distillations such as extractive distilla-tion while omitting the use of toxic solvents, there is a need for more benignalternative solvents. Recently, we have reported the use of biobased solventCyrene for extractive distillation of distilling unsaturated hydrocarbons fromsaturated hydrocarbons.12 Not only in apolar hydrocarbon mixtures, but alsoin polar mixtures azeotropes occur, and solvents are needed to fully fraction-ate azeotropic mixtures. We report here a study on the use of alternative sol-vents produced from sustainable, biobased feedstocks for the separation ofacetone and diisopropyl ether. This separation is relevant in the industrialprocess of catalytic dehydrogenation of 2-propanol to produce acetone.13 Aside-reaction herein is the dehydration of 2-propanol to diisopropyl ether,14
and the removal of diisopropyl ether from the acetone product is challengingas an azeotrope is present.14
In the case of acetone (bp = 56°C) and diisopropyl ether (bp = 69°C), a tem-perature-minimum, or positive, azeotrope is present. This means that thevapor pressure of the high boiling compound (diisopropyl ether) is higherthan in the ideal situation and a positive deviation is observed from Raoult’s
Towards Sustainable Solvent-Based Affinity Separations 178

88888888
BIOBASED ENTRAINERS FOR POLAR SEPARATIONS
law.15,16 This is due to the fact diisopropyl ether has a larger tendency to enterthe vapor phase, a consequence of net repulsive intermolecular interactionswhich is mathematically described with a γi > 1.
Since both compounds are polar but not protic, this case study adds to theseries of studies we completed earlier on the more apolar systems,17 on mix-tures of hydrogen bond donating and hydrogen bond accepting groups18 andthe highly polar and highly hydrogen bond donating systems of carboxylicacids.17,18 In Figure 8.1, the molecular structures of acetone and diisopropylether are shown.
Figure 8.1: The molecular structures acetone and diisopropyl ether. The electron densityprofiles of the 3D-molecule rendering was done with COSMOthermX C30_1705 using theTZVP-parameterization
Generally, multiple inter- and intramolecular interactions may occur in mix-tures, ranging from strong hydrogen bonds to dipole interactions and dis-persive, London, interactions.19 Within the binary mixture of acetone anddiisopropyl ether (or more generally in ether and ketone systems), no hy-drogen bonds are possible, though dipole interactions occur between the ke-tone and ether molecules, but also between the ketones molecules and be-tween ether molecules. These dipole interactions are strongly related to thedipole moment of the compounds. Due to the fact, the dipole moment ofacetone (3.68D20) is much larger compared to diisopropyl ether (1.13D21),acetone molecules will preferentially interact with themselves, hence diiso-propyl ether will tend to escape a phase with primarily acetone molecules.
179 Towards Sustainable Solvent-Based Affinity Separations

88888888
BIOBASED ENTRAINERS FOR POLAR SEPARATIONS
This is the reason that the positive azeotrope in the system occurs at higheracetone concentrations. The addition of a solvent can either introduce moredipole interactions (a polar aprotic solvent), can introduce more dipole inter-actions and hydrogen bond interactions (a polar protic solvent) or can reducethe relative extent of dipole interactions (apolar solvent).
In Figure 8.2, an overview has been presented where the solvent affinity ismapped within ketone and ether mixtures.14,22–27 The solvent effect on thetwo aprotic polar compounds, or more specifically between a ketone andether, is assessed in several combinations. Overall, oxygenated solvents suchas alcohols,22,23 butyronitrile28 and ketones25,28 have more affinity towardsthe ketone than the ether. This is due to the fact these solvents have dipole mo-ments and/or hydrogen bonding donating capabilities, which preferentiallyinteract with the larger dipole moment of acetone.
Figure 8.2: The qualitative literature overview of solvent effects in vapor-liquid equilibriaconcerning two aprotic compounds (ketones and ethers)14,22–27. The positioning is not onscale and relative to the other class.
n-Butanol is observed to have the opposite affinity, due to the long hydrocar-bon tail.28 Observations by Berg et al.14 are similar, as they propose nitriles,alcohols, glycols, dimethylsulfoxide (DMSO), Sulfolane, n,n-dimethylformami-de and combinations thereof as possible ketone entrainers. Additionally, Zhao
Towards Sustainable Solvent-Based Affinity Separations 180

88888888
BIOBASED ENTRAINERS FOR POLAR SEPARATIONS
simulated the extractive distillation of diisopropyl ether and acetone withethylene glycol as entrainer as part of a larger Hybrid Azeotropic-ExtractiveDistillation process.29 Apolar solvents such as alkanes,26,27,30 ethers28 andaromatic compounds28 have more affinity towards ethers, because these sol-vents are structurally more similar to ethers. They do not possess (large)dipole moment, and dispersive interactions are predominant. By the addi-tion of these solvents, the relative extent of the dipole interactions is reduced,which lowers the net repulsive interactions toward diisopropyl ether. Conse-quently, the ethers are entrained instead of the ketone molecules.
Figure 8.3: A graphical presentation of sustainable recourses, such as water, (atmosphericor captures) CO2, natural oils and lignocellulosic materials where (hemi-)cellulose can beconverted to pentose (C5), hexose (C6) sugars and consequently in biobased molecules suchas 2-methyltetrahydrofuran (MTHF) and Cyrene, and lignin can be converted to aromatics.
It thus appears that many solvent classes can possibly break the azeotrope inthe acetone/diisopropyl ether mixture. Here, we report our studies aiming tofind solvents that can break the azeotrope, and also can be made from sus-tainable resources. Several bio-based sources are available, such as naturaloils, lignocelullosic materials, of which sugars and lignin can be obtained, (at-mospheric or captured) CO2 and water, see Figure 8.3. Biobased solvents arefor example, DL-limonene which can be obtained from natural oils presentin citrus peel or fruit juices31, already has annual commercial production of
181 Towards Sustainable Solvent-Based Affinity Separations
88888888
BIOBASED ENTRAINERS FOR POLAR SEPARATIONS
60 kton/year and costs about 9-10 $/kg32 and ethylene carbonate which canbe synthesized using waste CO2 emissions over a heterogeneous catalyst.33,34
These two, but also many other biobased chemicals, have been assessed in thiswork for the separation of acetone and diisopropyl ether using extractive dis-tillation.
8.2 Theory
A key parameter in the assessment and design of distillation columns is therelative volatility (αij ). This parameter describes the relative tendency of thecomponents in the mixture to escape the liquid phase and enter the vaporphase. In Equation 8.1, the mathematical description can be seen where the
αij is the product of the non-ideal part(γiγj
)and the ideal part
(P 0i
P 0j
).5
αij =γiP
0i
γjPoi
(8.1)
The activity coefficients (γi) are indicative of the intermolecular interactionswithin the mixture and describe either net attractive interactions (γi < 1) orrepulsive interactions (γi > 1) between the solute i and the solvent. The idealpart is comprised of the ratio of the pure component vapor pressures (P oi ) ofboth compounds. The addition of a solvent changes the activity coefficientsand consequently alters the relative volatility. Although the vapor phase fu-gacity coefficients (ϕi) are also present in the non-ideal part of Equation 8.1,these parameters approach 1 for the molecules considered in this study atatmospheric pressures and will therefore be neglected from now on.
8.3 Thermodynamic models
Next to the experimental evaluation of the biobased solvents, also the per-formance of a state-of-the-art predictive method, namely modified DortmundUNIFAC,35 was performed during the solvent screening. This method is agroup contribution method (GCM) which predicts the activity coefficients viathe sum of a combinatorial (γci ) and a residual term (γRi ). The combinatorial
Towards Sustainable Solvent-Based Affinity Separations 182

88888888
BIOBASED ENTRAINERS FOR POLAR SEPARATIONS
term uses the Guggenheim-Stavermann term,36 and the residual term. De-tails of the modified Dortmund UNIFAC mathimatical framework is presentin Appendix, section 12.2. This framework requires the determination of theφ, φ
′and θ which are respectively the volume-, modified volume- and surface
fractions. Additionally, Γk , Γ(i)k ,ν(i)
k ,Qk , Rk and Ψnm are respectively the overallactivity of moiety k, the overall activity of moiety k solely surrounded by moi-ety i, the occurrence of each moiety k in surrounded by moiety i, the Van derWaals volume of group k, the Van der Waals surface of group k and the groupbinary interaction parameter which may include temperature (in)dependentparameters (anm, bnm and cnm).35,37,38 The coordination number (q) is oftenset at 10.
The experimentally determined (quasi-) binary vapor-liquid equilibria werefitted with the UNIQUAC and Non-Random Two-Liquid (NRTL) model. TheUNIQUAC model uses the same mathematical framework, though the molec-ular volume (qk) and molecular surface (rk) parameters are fixed from liter-ature values or estimations,39 and binary interaction parameters are fittedinstead of estimated via the group contribution method. The molecular vol-ume and surface parameters are q =2.34 and r = 2.57 [44] for acetone40, q =4.088 and r = 4.7421 for diisopropyl ether41, and q = 5.592 and r = 6.736 forDL-limonene.42
The NRTL model was developed by Renon and Prausnitz,43 which replacedthe Flory-Huggins44,45 volumetric expression within modified the Wilson equa-tion46 to the local composition theory which is similar to the quasichemicaltheory of Guggenheim.47 This resulted in, equations 8 to 10;
lnγi =
∑j xjτjiGji∑k xkGki
+∑j
xjGij∑k xkGkj
(τij −
∑m xmτmjGmj∑
k xkGkj
)(8.2)
lnGij = −αijτij (8.3)
τij = aij +bijT
+cijT 2 (8.4)
Where the non-randomness factors, aij , are generally set equal to 0.2, 0.3 or0.45 to represent physically feasible values and to predict multi-component
183 Towards Sustainable Solvent-Based Affinity Separations

88888888
BIOBASED ENTRAINERS FOR POLAR SEPARATIONS
systems from their binaries.48 The dimensionless interaction parameter τijmay include temperature (in)dependent parameters (aij , bij and cij ). Thetemperature-dependent vapor pressures located in the Aspen Plus® V10 Data-bank were used for acetone and diisopropyl ether, while experimental tempera-ture-dependent vapor pressures of D-limonene was used.49
8.4 Materials and Methods
8.4.1 Chemicals
In this work, the diisopropyl ether (Emsure, ACS, Reag. Ph. Eur.) and acetone(LiChrosolv) were both purchased at Merck. 2-Butanone (Emplura), ethyleneglycol (Emsure, Reag.Ph.Eur), 2-methyltetrahydrofuran (Emplura), methanol(LiChrosolv), ethanol (Emsure) and DL-Limonene (≥ 95%) were purchased atMerck. Sigma Aldrich supplied the solvents Sulfolane (99%), propylene gly-col (≥ 99.5%), propionic acid (≥ 99.5%), guaiacol (≥ 99%), ethylene carbon-ate (98%), phenol (≥ 99%), furfural (99%), acetophenone (99%), isophorone(97%), vanillin (≥ 97%), catechol (≥ 99%), acetic acid (≥ 99%), dimethyl-sulfoxide (≥ 99.9%), ethyl acetate (99.9%), n-butanol (≥ 99.4%), 4-methyl-2-pentanone (≥ 98.5%), n-pentanol (≥ 99.9%), ethyl levulinate (99%), cumene(98%) and glycerol (≥ 99%). Acros Organics provided γ-valerolactone (98%),levulinic acid (98 + %), triacetin (99%), tributyl phosphate (99 + %), while2-propanol (LC-MS ChromaSolv) and 2-methyl-2-propanol (≥ 99.7%) werepurchased at Fluka. p-Xylene was bought at VWR chemicals, and Cyrene wasprovided by the Circa Group. MilliQ water was additionally used.
8.4.2 Experimental Methods
The measurements were carried out using 2 Fischer Labodest VLE602 ebul-liometers where the pressure was controlled. Each mixture, comprised of thebinary system and (optionally) a solvent, was introduced in the ebulliometerand consequently 1000 mbar was set. The temperature was tracked, and themixture was left to equilibrate for approximately 60 min. A total amount of85±5 grams liquid was needed in the ebulliometer to guarantee sufficient liq-uid and vapor flow through the set-up. An aliquot of 0.5-1.0 mL of liquidsample was collected of the liquid and condensed vapor flow. If a solvent
Towards Sustainable Solvent-Based Affinity Separations 184

88888888
BIOBASED ENTRAINERS FOR POLAR SEPARATIONS
was used, a solvent to feed ratio of 1 (on a mass basis) was kept constant,and the VLE diagrams were displayed as pseudo-binary system, where thecompositions of acetone and diisopropyl ether sum up to unity. The (near)azeotropic composition of the diisopropyl ether/acetone system at 16/84 mol% was used.
8.4.3 Analysis
A Thermo Scientific Trace 1300 gas chromatograph with two parallel ovensand an autosampler TriPlus 100 Liquid Samples were used for the analy-ses. All samples were analyzed using an Agilent DB-WAX column (60m ×0.25mm × 0.25µm) with an injection volume of 1 µl. The system of ace-tone/diisopropyl ether was diluted in analytical ethanol. A TCD detector(with 200°C) and a ramped temperature profile were used, following the pro-gram in which the initial temperature was 30°C, starting immediately afterinjection with a ramp of 10 °C/min to 60°C, followed by a second ramp of 5°C/min to 80°C and a third ramp of 50°C/min to 250°C with a 2 min holdon the final temperature which finished the program, which lasts 15 min. Acolumn flow of 2 ml/min with a split ratio of 100, an airflow of 350 ml/min,a helium make-up flow of 40 ml/min and a hydrogen flow of 35 ml/min wasused.
8.5 Results
8.5.1 Relative Volatility Screening near azeotropic composition
The separation of acetone and diisopropyl ether was screened in this section.At a single composition containing 16 mol.% diisopropyl ether, the effect of35 (biobased) solvents were evaluated (the results are displayed in Figure 8.4).This composition was chosen as this is (near) the azeotropic inflection pointof the binary mixture, and in this situation, both components are (almost)equally volatile. Near the azeotropic point, the majority of the polar sol-vents enhance the relative volatility of diisopropyl ether, as can be seen inFigure 8.4. Diisopropyl ether relative volatility increase is due to hydrogenbonds and/or stronger dipole-dipole interactions of these solvents with ace-tone compared to diisopropyl ether, which lowers the acetone activity coef-
185 Towards Sustainable Solvent-Based Affinity Separations

88888888
BIOBASED ENTRAINERS FOR POLAR SEPARATIONS
Figure 8.4: The screening of 35 (biobased) solvent for the extractive Distillation of diiso-propyl ether/acetone (16/84 mol. %) with a S:F ratio (mass based) of 1 at 1000 mbar. Theexperimental relative volatility is depicted on the x-axis, while the predicted relative volatil-ity is depicted on the y-axis.
ficient more than that of diisopropyl ether. Water, dimethylsulfoxide, ethy-lene glycol and ethylene carbonate are experimentally shown to induce thelargest relative volatility towards diisopropyl ether. Mod. UNIFAC (Do) canbe seen in Figure 8.4 to generally underpredict the relative volatility increasesof diisopropyl ether over acetone with apolar solvents. The relative volatilityincrease of diisopropyl ether over acetone is overpredicted for the multifunc-tional glycerol and catechol solvents, and water as solvent. The effect of var-ious solvents on the relative volatility of acetone and diisopropyl ether arepredicted generally to exceed 10% deviation.
Ethylene glycol has already been shown to be an adequate entrainer,14 whiledimethylsulfoxide is not preferred due to its toxicity50 and auto-catalytic de-composition tendency51. Hence, water and ethylene carbonate are potentialbiobased solvents to distill diisopropyl ether as the top product. Apolar sol-vents were found to repel acetone, reversing the natural boiling point order.
Towards Sustainable Solvent-Based Affinity Separations 186

88888888
BIOBASED ENTRAINERS FOR POLAR SEPARATIONS
The most effective biobased apolar solvent is observed to be DL-limonene,although also cumene, 2-methyl tetrahydrofuran and p-xylene show similareffect, entraining diisopropyl ether. From the large variety of biobased sol-vents that have been assessed, several are less preferred due to possible recov-ery difficulties resulting from their boiling point. Recovery difficulties can beminimized by applying a solvent with a boiling point 40 to 50°C higher thanthe highest boiling solute.52 These solvents include 2-methyltetrahydrofuran(bp:80°C), ethanol (78°C), ethyl acetate (77°C), 2-propanol (83°C), 2-butanone(80°C), 2-methyl-2-propanol or tert-butanol (83°C) and methanol (64.7°C).Excluding these, only DL-limonene and ethylene carbonate pass the boilingpoint criterion. Nevertheless, water is also evaluated as a potential, biobasedentrainer for this separation. This was done as it allows a comparison of threesolvents which either are inept in hydrogen bonding (DL-limonene), is a hy-drogen bond acceptor (ethylene carbonate) or a hydrogen bond donor and ac-ceptor (water). For a complete process design and optimization of processconditions, full phase equilibria (vapor-liquid (VL) and liquid-liquid (LL))that need to be determined.53 Only the vapor-liquid equilibria of the selectedsolvents will be further discussed in the next section, hence the completeliquid-liquid equilibria of these solvents are kept out of the scope.
8.5.2 Vapor-Liquid Equilibria of Diisopropyl ether – Acetone –Ethylene Carbonate/DL-Limonene/water
In Figure 8.5, the (pseudo) binary vapor-liquid equilibria of acetone, diiso-propyl ether and optionally a solvent is shown. It was also attempted to fitNRTL and UNIQUAC equations, which unfortunately was not successful forsome systems due to (partial) immiscibility of diisopropyl ether with ethylenecarbonate and water. From an extractive distillation perspective liquid phasesplitting is unwanted. For the systems where good correlations with the ex-perimental data were found, the found parameters are shown in Table 8.1.Around the azeotropic point, it can indeed be seen that water and ethylenecarbonate induce significant relative volatility towards diisopropyl ether.Unfortunately, the intense induced non-ideality does not eliminate the azeo-trope, but shifts the azeotrope towards lower acetone fractions. This is aconsequence of repelling the high boiling compound, diisopropyl ether, toa greater extent than the lower boiling compound, acetone. This is seen at
187 Towards Sustainable Solvent-Based Affinity Separations

88888888
BIOBASED ENTRAINERS FOR POLAR SEPARATIONS
Figure 8.5: The (a) xy- and (b) Txy-diagrams of the (Quasi-) binary vapor-liquid equilibriaof diisopropyl ether and acetone with a S:F ratio (mass based) of 1 (or 5) at 1000 mbar withthe solvents, ethylene carbonate, DL-limonene and water. The standard deviation is deter-mined by an experimental duplicate measurement. The NRTL and UNIQUAC correlationsfor the binary and DL-limonene system are present in Table 8.1, while visual aid guide-linesare added for the ternary systems with water and ethylene carbonate. All experimental datais present in Table 8.2.
Table 8.1: The NRTL and UNIQUAC parameters of the binary acetone-diisopropyl ether(DIPE) and the solvent DL-limonene
NRTLCompound i Compound j Aij Aji Bij Bji Cij / αij
Acetone DIPE 0,5686 0,3931 2,0750 -0,4741 0,5Acetone
DL-Limonene-24,531 31,709 8362,2 -10000 0,3
DIPE -9,7604 -4,6236 4057,3 1221 0,2UNIQUAC
Compound i Compound j Aij Aji Bij BjiAcetone DIPE 0,18578 -0,3263 8,0123 -105,86Acetone
DL-Limonene-6,83415 17,7539 2431,1 -6447,1
DIPE 0,1655 4,995 163,27 -213057*No adequate NRTL and UNIQUAC correlation could be obtained with ethylene carbonate and water, due tothe (partial) immiscibility of diisopropyl ether in these solvents. The root-mean-square deviation of all liquid-and vapor fractions within the ternary system is 7.6 · 10−3 and 4.9 · 10−3 for respectively the NRTL andUNIQUAC correlations.
a solvent to feed (S:F) ratio of 1 (on a mass basis). In the case of water as asolvent, applying a S:F ratio of 5 increases the relative volatility towards ace-
Towards Sustainable Solvent-Based Affinity Separations 188

88888888
BIOBASED ENTRAINERS FOR POLAR SEPARATIONS
tone at ∼20 mol% acetone, though still an azeotrope may be present as wateris shown to repel diisopropyl ether, which is more pronounced at higher ace-tone molar fractions.
Table 8.2: The pseudo binary liquid and vapor molar fractions at 1000 mbar for the ace-tone (1), diisopropyl ether (2), and the solvent DL-limonene, ethylene carbonate and water.From a duplicate measurement it was found that the experimental standard deviation in theconcentration is 2.5 mol.%
Solvent: DL-limonene Solvent: Ethylene Carbonatex1 x2 y1 y2 T (K) x1 x2 y1 y2 T (K)
0,659 0,000 0,984 0,000 336,15 0,608 0,000 1,000 0,000 342,250,630 0,050 0,935 0,053 335,35 0,558 0,030 0,874 0,126 341,550,559 0,090 0,888 0,100 336,35 0,517 0,060 0,733 0,267 338,950,476 0,130 0,848 0,139 337,25 0,453 0,081 0,643 0,357 338,450,430 0,186 0,791 0,196 337,75 0,440 0,134 0,535 0,465 336,050,346 0,243 0,733 0,254 338,65 0,392 0,158 0,433 0,567 335,050,333 0,295 0,692 0,293 336,15 0,317 0,163 0,372 0,628 335,050,216 0,362 0,570 0,414 343,15 0,087 0,400 0,295 0,705 336,050,198 0,409 0,552 0,429 341,25 0,064 0,416 0,216 0,784 337,650,038 0,486 0,110 0,862 362,150,000 0,504 0,000 0,964 364,95
Solvent: waterx1 x2 y1 y2 T (K)
0,257 0,000 0,782 0,000 336,550,210 0,002 0,759 0,036 337,050,176 0,002 0,754 0,044 337,650,163 0,010 0,487 0,381 327,050,160 0,019 0,452 0,418 327,150,131 0,043 0,416 0,474 327,750,077 0,102 0,378 0,496 328,150,023 0,148 0,207 0,700 331,250,012 0,142 0,093 0,668 332,550,000 0,149 0,000 0,917 334,75
DL-limonene is capable of breaking the azeotrope at this S:F ratio, by repellingthe low boiling acetone more than the high boiling diisopropyl ether, thougha pinch-point remains. At room temperature DL-limonene is miscible withacetone54 and was also seen, during experimentation, to be miscible with the
189 Towards Sustainable Solvent-Based Affinity Separations

88888888
BIOBASED ENTRAINERS FOR POLAR SEPARATIONS
less polar DIPE. This was also seen in the NRTL and UNIQUAC correlationsin which the activity coefficient of both solutes are above unity and the ratio ofthe activity coefficients (γacetone/γDIP E) were at an equimolar ratio resp. 1.19and 1.21. Also it has been shown by Pakdel et al.55 that DL-limonene is stableup to 210°C, and only decomposes around 450°C which is much higher thanthe distillation temperature. The solvent to feed ratio was kept constant onmass basis which is a fair comparison on industrial level, but has implicationon a molecular level. Smaller solvents (water) will be much more abundantthan larger solvents (ethylene carbonate). Hence, a direct comparison of in-termolecular interactions is not appropriate between the solvents.
8.6 Conclusion
The industrial separation of two aprotic polar compounds, acetone and di-isopropyl ether, via extractive distillation was evaluated. After a literatureoverview, where it was seen that polar hydrogen-bonding solvents have moreaffinity towards the more dipolar aprotic polar compounds (acetone) com-pared to the less polar aprotic compounds (diisopropyl ether), while apolarsolvents entrain the less polar diisopropyl ether. In the acetone/diisopropylether separation, water and ethylene carbonate induce the largest relativevolatility towards diisopropyl ether near the binary azeotropic point, whileDL-limonene induces the largest relative volatility towards acetone. In thefull (quasi-) binary vapor-liquid equilibrium, the azeotrope was only bro-ken by the DL-limonene since it was selectively repelling the low boilingcompound (acetone) instead of the other solvents, though a pinch-point re-mains. This shows that experimentally determining the solvent effect at theazeotropic point is not sufficient to assess the performance of the solvent,as the azeotrope can shift towards lower low boiling solute fractions if theheavy boiling compound is selectively repelled by the solvent. DL-limonenewas found to be most adequate as a biobased azeotrope breaker for the ace-tone/diisopropyl ether system.
Towards Sustainable Solvent-Based Affinity Separations 190

88888888
BIOBASED ENTRAINERS FOR POLAR SEPARATIONS
8.7 Nomenclature
αij = Relative Volatilityαij = Non-Randomness factor
anm or aij =Temperature independent interaction parame-ter
bnm or bij = Temperature dependent interaction parameterBp = Boiling pointcnm or cij = Temperature dependent interaction parameterγi = Activity coefficient of compound i
γci =Combinatorial term of the activity coefficient ofcompound i
γRi =Residual term of the activity coefficient of com-pound i
DMSO = Dimethylsulfoxide
mod. UNIFAC (Do) =Modified UNIQUAC Functional-group ActivityCoefficient Dortmund
MTHF = 2-MethyltetrahydrofuranNMP = n-MethylpyrrolidoneNRTL = Non-Random Two-Liquid Model
ν(i)k =
Occurrence of each moiety k in surrounded bymoiety i
φ = Volume fractionφ′
= Modified volume fractionΦk = Overall activity of moiety k
Φ(i)k =
Activity of moiety k solely surrounded by moi-ety i
P oi = Vapor pressure of compound iΨnm = Group binary interaction parameterqi = Coordination number (general equal to 10)Qk or qi = Van der Waals volume of group k or molecule iRk or ri = Van der Waals surface of group k or molecule i
191 Towards Sustainable Solvent-Based Affinity Separations

88888888
BIOBASED ENTRAINERS FOR POLAR SEPARATIONS
S:F Ratio = Solvent to feed ratio (on mass basis)Sulfolane = Tetrahydrothiophene-1,1-dioxideT (K) = Absolute temperatureτij = Dimensionless interaction parameterθ = Surface fractionUNIQUAC = Universal quasichemicalϕi = Fugacity coefficient of compound ixi = liquid weight fraction of component iyi = vapour weight fraction of component i
8.8 References
[1] R. Agrawal and R. T. Gooty, “Misconceptions about efficiency and maturity of distillation,” AIChE Journal,p. e16294, 2020.
[2] A. A. Kiss and R. Smith, “Rethinking energy use in distillation processes for a more sustainable chemicalindustry,” Energy, p. 117788, 2020.
[3] A. A. Kiss, “Distillation technology–still young and full of breakthrough opportunities,” Journal of Chem-ical Technology & Biotechnology, vol. 89, no. 4, pp. 479–498, 2014.
[4] H. Wang, C. Cui, H. Lyu, and J. Sun, “Design and economic evaluation of energy-saving industrial distil-lation processes for separating close-boiling cyclohexanone-cyclohexanol mixture,” Separation and Purifi-cation Technology, vol. 211, pp. 279–289, 2019.
[5] M. Blahušiak, A. A. Kiss, K. Babic, S. R. Kersten, G. Bargeman, and B. Schuur, “Insights into the selectionand design of fluid separation processes,” Separation and purification technology, vol. 194, pp. 301–318,2018.
[6] Y. J. Choi, K. W. Cho, B. W. Cho, and Y.-K. Yeo, “Optimization of the sulfolane extraction plant basedon modeling and simulation,” Industrial & engineering chemistry research, vol. 41, no. 22, pp. 5504–5509,2002.
[7] Y. Kim, S. Kim, and B. Lee, “Simulation of 1, 3-butadiene extractive distillation process using n-methyl-2-pyrrolidone solvent,” Korean Journal of Chemical Engineering, vol. 29, no. 11, pp. 1493–1499, 2012.
[8] A. Chianese and F. Zinnamosca, “Ethanol dehydration by azeotropic distillation with a mixed-solvententrainer,” The Chemical Engineering Journal, vol. 43, no. 2, pp. 59–65, 1990.
[9] S. Young, “Lxxiii.—the preparation of absolute alcohol from strong spirit,” Journal of the Chemical Society,Transactions, vol. 81, pp. 707–717, 1902.
[10] E. Reyhanitash, T. Brouwer, S. R. Kersten, A. van der Ham, and B. Schuur, “Liquid–liquid extraction-basedprocess concepts for recovery of carboxylic acids from aqueous streams evaluated for dilute streams,”Chemical Engineering Research and Design, vol. 137, pp. 510–533, 2018.
[11] W. D. Seider, J. D. Seader, and D. R. Lewin, PRODUCT & PROCESS DESIGN PRINCIPLES: SYNTHESIS,ANALYSIS AND EVALUATION, (With CD). John Wiley & Sons, 2009.
[12] T. Brouwer and B. Schuur, “Bio-based solvents as entrainers for extractive distillation in aro-matic/aliphatic and olefin/paraffin separation,” Green Chemistry, vol. 22, no. 16, pp. 5369–5375, 2020.
[13] S. Lokras, P. Deshpande, and N. Kuloor, “Catalytic dehydrogenation of 2-propanol to acetone,” Industrial& Engineering Chemistry Process Design and Development, vol. 9, no. 2, pp. 293–297, 1970.
[14] L. Berg and A.-I. Yeh, “Separation of isopropyl ether from acetone by extractive distillation,” July 10 1984.US Patent 4,459,179.
[15] G. N. Lewis and M. Randall, Thermodynamics and the free energy of chemical substances. McGraw-Hill,1923.
Towards Sustainable Solvent-Based Affinity Separations 192

88888888
BIOBASED ENTRAINERS FOR POLAR SEPARATIONS
[16] F.-M. Raoult, “Loi générale des tensions de vapeur des dissolvants,” CR Hebd. Seances Acad. Sci, vol. 104,1887.
[17] L. M. Sprakel, P. Kamphuis, A. L. Nikolova, D. J. Keijsper, and B. Schuur, “Solvent selection for extractivedistillation processes to separate close-boiling polar systems,” Chemical Engineering Research and Design,vol. 144, pp. 123–134, 2019.
[18] T. Brouwer, R. van Lin, A. ten Kate, B. Schuur, and G. Bargeman, “The influence of solvent and acidproperties on the relative volatility and separation selectivity for extractive distillation of close-boilingacids,” Industrial & Engineering Chemistry Research, (submitted).
[19] J. N. Israelachvili, Intermolecular and surface forces. Academic press, 2011.[20] R. G. Pereyra, M. L. Asar, and M. A. Carignano, “The role of acetone dipole moment in acetone–water
mixture,” Chemical Physics Letters, vol. 507, no. 4-6, pp. 240–243, 2011.[21] G. Arivazhagan, R. Shanmugam, and A. Elangovan, “Molecular interaction study of the diisopropyl ether–
propionic acid mixture by spectroscopic and dielectric studies,” Spectrochimica Acta Part A: Molecular andBiomolecular Spectroscopy, vol. 81, no. 1, pp. 172–177, 2011.
[22] M.-J. Lee and C.-H. Hu, “Isothermal vapor-liquid equilibria for mixtures of ethanol, acetone, and diiso-propyl ether,” Fluid phase equilibria, vol. 109, no. 1, pp. 83–98, 1995.
[23] S. Bernatová, J. Pavlíček, and I. Wichterle, “Isothermal vapour–liquid equilibria in the binary and ternarysystems composed of tert-butyl methyl ether, 3, 3-dimethyl-2-butanone and 2, 2-dimethyl-1-propanol,”Fluid phase equilibria, vol. 278, no. 1-2, pp. 129–134, 2009.
[24] H. Kirss, M. Kuus, and E. Siimer, “Isobaric vapor- liquid equilibria of the ternary system methylbutylketone+ 1-pentanol+ anisole,” Journal of Chemical & Engineering Data, vol. 54, no. 7, pp. 2128–2131,2009.
[25] J. M. Resa, S. Echebarría, M. A. Betolaza, A. Ruiz, and B. Moradillo, “Isobaric vapor- liquid equilibriaof 3-pentanone with acetone and isopropyl ether at 101.3 kpa,” Journal of Chemical & Engineering Data,vol. 41, no. 1, pp. 63–65, 1996.
[26] A. Mejía, H. Segura, M. Cartes, L. Cifuentes, and M. Flores, “Phase equilibria and interfacial tensions inthe systems methyl tert-butyl ether+ acetone+ cyclohexane, methyl tert-butyl ether+ acetone and methyltert-butyl ether+ cyclohexane,” Fluid phase equilibria, vol. 273, no. 1-2, pp. 68–77, 2008.
[27] J. Pavlíček, A. Andresová, G. Bogdanić, and I. Wichterle, “Vapour–liquid equilibria in binary and ternarysystems composed of 2, 3-dimethylbutane, diisopropyl ether, and 3-methyl-2-butanone at 313.15, 323.15and 313.15 k,” Fluid Phase Equilibria, vol. 344, pp. 59–64, 2013.
[28] J. Resa, C. González, and A. Ruiz, “Experiments of extractive distillation at laboratory scale for the ruptureof the azeotropic mixture acetone+ isopropyl ether,” Separation and purification technology, vol. 18, no. 2,pp. 103–110, 2000.
[29] T. Zhao, M. Li, J. Yang, K. Ma, Z. Zhu, and Y. Wang, “Separation of acetone/isopropyl ether/water ternarymixture via hybrid azeotropic-extractive distillation,” Chemical Engineering Transactions, vol. 61, pp. 661–666, 2017.
[30] A. Mejía, H. Segura, M. Cartes, and C. Calvo, “Vapor–liquid equilibria and interfacial tensions for theternary system acetone+ 2, 2’-oxybis [propane]+ cyclohexane and its constituent binary systems,” Fluidphase equilibria, vol. 270, no. 1-2, pp. 75–86, 2008.
[31] V. Negro, G. Mancini, B. Ruggeri, and D. Fino, “Citrus waste as feedstock for bio-based products recovery:Review on limonene case study and energy valorization,” Bioresource Technology, vol. 214, pp. 806–815,2016.
[32] E. Jongedijk, K. Cankar, M. Buchhaupt, J. Schrader, H. Bouwmeester, and J. Beekwilder, “Biotechnolog-ical production of limonene in microorganisms,” Applied microbiology and biotechnology, vol. 100, no. 7,pp. 2927–2938, 2016.
[33] M. North, P. Villuendas, and C. Young, “A gas-phase flow reactor for ethylene carbonate synthesis fromwaste carbon dioxide,” Chemistry–A European Journal, vol. 15, no. 43, pp. 11454–11457, 2009.
[34] A. Decortes, A. M. Castilla, and A. W. Kleij, “Salen-complex-mediated formation of cyclic carbonates bycycloaddition of co2 to epoxides,” Angewandte Chemie International Edition, vol. 49, no. 51, pp. 9822–9837, 2010.
[35] U. Weidlich and J. Gmehling, “A modified unifac model. 1. prediction of vle, he, and. gamma.. infin.,”Industrial & engineering chemistry research, vol. 26, no. 7, pp. 1372–1381, 1987.
193 Towards Sustainable Solvent-Based Affinity Separations

88888888
BIOBASED ENTRAINERS FOR POLAR SEPARATIONS
[36] A. Staverman, “The entropy of high polymer solutions. generalization of formulae,” Recueil des TravauxChimiques des Pays-Bas, vol. 69, no. 2, pp. 163–174, 1950.
[37] A. Fredenslund, R. L. Jones, and J. M. Prausnitz, “Group-contribution estimation of activity coefficientsin nonideal liquid mixtures,” AIChE Journal, vol. 21, no. 6, pp. 1086–1099, 1975.
[38] B. L. Larsen, P. Rasmussen, and A. Fredenslund, “A modified unifac group-contribution model for predic-tion of phase equilibria and heats of mixing,” Industrial & engineering chemistry research, vol. 26, no. 11,pp. 2274–2286, 1987.
[39] T. Banerjee, M. K. Singh, R. K. Sahoo, and A. Khanna, “Volume, surface and uniquac interaction pa-rameters for imidazolium based ionic liquids via polarizable continuum model,” Fluid Phase Equilibria,vol. 234, no. 1-2, pp. 64–76, 2005.
[40] T. Anderson and J. Prausnitz, “Application of the uniquac equation to calculation of multicomponentphase equilibria. 1. vapor-liquid equilibria,” Industrial & Engineering Chemistry Process Design and Devel-opment, vol. 17, no. 4, pp. 552–561, 1978.
[41] H.-C. Ku and C.-H. Tu, “Vapor–liquid equilibria for binary and ternary mixtures of diisopropyl ether,ethanol, and 2, 2, 4-trimethylpentane at 101.3 kpa,” Fluid phase equilibria, vol. 248, no. 2, pp. 197–205,2006.
[42] F. Gironi, I. Gonzalez Farias, and L. Lamberti, “Liquid-liquid equilibria for the water+ ethanol+ citraland water+ ethanol+ limonene systems at 293 k,” Journal of Chemical and Engineering Data, vol. 40, no. 3,pp. 578–581, 1995.
[43] H. Renon and J. M. Prausnitz, “Local compositions in thermodynamic excess functions for liquid mix-tures,” AIChE journal, vol. 14, no. 1, pp. 135–144, 1968.
[44] P. J. Flory, “Thermodynamics of high polymer solutions,” The Journal of chemical physics, vol. 10, no. 1,pp. 51–61, 1942.
[45] M. L. Huggins, “Solutions of long chain compounds,” The Journal of chemical physics, vol. 9, no. 5, pp. 440–440, 1941.
[46] G. M. Wilson, “Vapor-liquid equilibrium. xi. a new expression for the excess free energy of mixing,”Journal of the American Chemical Society, vol. 86, no. 2, pp. 127–130, 1964.
[47] E. A. Guggenheim, Mixtures: the theory of the equilibrium properties of some simple classes of mixtures, solu-tions and alloys. Clarendon Press, 1952.
[48] F. A. Mato, R. B. Mato, and F. Mato, “A simple expression for the nonrandomness parameter. alpha. ijin the nrtl equation for completely miscible systems,” Industrial & engineering chemistry research, vol. 28,no. 9, pp. 1441–1446, 1989.
[49] R. A. Clará, A. C. G. Marigliano, and H. N. Sólimo, “Density, viscosity, and refractive index in the range(283.15 to 353.15) k and vapor pressure of α-pinene, d-limonene,(±)-linalool, and citral over the pressurerange 1.0 kpa atmospheric pressure,” Journal of Chemical & Engineering Data, vol. 54, no. 3, pp. 1087–1090, 2009.
[50] I. Barbosa, R. Martins, M. S. e Melo, and A. Soares, “Acute and chronic toxicity of dimethylsulfoxide todaphnia magna,” Bulletin of environmental contamination and toxicology, vol. 70, no. 6, pp. 1264–1268,2003.
[51] Y. Deguchi, M. Kono, Y. Koizumi, Y.-i. Izato, and A. Miyake, “Study on autocatalytic decomposition ofdimethyl sulfoxide (dmso),” Organic Process Research & Development, vol. 24, no. 9, pp. 1614–1620, 2020.
[52] Z. Lei, B. Chen, and Z. Ding, Special distillation processes. Elsevier, 2005.[53] B. Thomas and S. K. Hans, “Knowledge integrating system for the selection of solvents for extractive and
azeotropic distillation,” Computers & chemical engineering, vol. 18, pp. S25–S29, 1994.[54] A. K. El-Deen and K. Shimizu, “Application of d-limonene as a bio-based solvent in low density-dispersive
liquid–liquid microextraction of acidic drugs from aqueous samples,” Analytical Sciences, vol. 35, no. 12,pp. 1385–1391, 2019.
[55] H. Pakdel, D. M. Pantea, and C. Roy, “Production of dl-limonene by vacuum pyrolysis of used tires,”Journal of Analytical and Applied Pyrolysis, vol. 57, no. 1, pp. 91–107, 2001.
Towards Sustainable Solvent-Based Affinity Separations 194


999999999
9Liquid-Liquid Extractions withCyrene
"If I should not be learning now, when should I be?",Lacydes of Cyrene, (241 - 205 BC)
This chapter is adapted from:Brouwer, T. and Schuur, B. "Dihydrolevoglucosenone (Cyrene), a BiobasedSolvent for Liquid–Liquid Extraction Applications", Sustainable Chemistry& Engineering, American Chemical Society, 2020, 8, 39, 14807-14817.

999999999
LIQUID-LIQUID EXTRACTIONS WITH CYRENE
9.1 Introduction
Insights in the liquid-liquid extraction (LLX) applicability of dihydrolevogly-cosenone, or Cyrene, was obtained by performing LLX using four differentternary systems. Cyrene, a bio-based polar solvent, attracted recent attentionas being versatile for various applications, e.g. as a medium to perform chem-ical reactions1–7 and to prepare membranes by phase inversion8, though nomention for LLX applications has been found as of yet.
Cyrene can be an alternative aprotic dipolar solvent3,8, solvents of this classare typically used in a range of molecular separations, from aromatic/ali-phatic separation9–11 to carboxylic acid separation from water.12 Industriallyimportant members of the solvent class of aprotic dipolar solvents include N-methyl-pyrrolidone (NMP) and N,N-dimethylformamide (DMF). Cyrene is re-ported to have a much lower toxicity,1,16 and additionally since it is a biobasedproduct, it offers chances for the chemical industry to reduce the consumptionof fossil oil by replacing their fossil oil-based solvents with a biobased alterna-tive.17 In a recent communication, the Circa Group announced a productioncapacity of Cyrene of 1 kton per annum, which signifies the mass productionof this new biobased solvent.18 Although, bulk prices may not be publicallyavailable, Krishna et al. state that the bulk price of Cyrene may be approxi-mately 2 AC/kg19 which is comparable with traditional solvents.
Two key classes of molecular separation processes using solvents include ex-tractive distillation (ED) and LLX. In another article20, we showed the poten-tial of Cyrene as entrainer in ED of aromatic/aliphatic mixtures and paraf-fin/olefin mixtures. Similarly, next to the already proven entrainer functionin extractive distillations, Cyrene may be useful for LLX as well. In orderto investigate the applicability of Cyrene in LLX processes, we assessed theliquid-liquid equilibrium (LLE) behavior of several ternary systems formedwith Cyrene. The investigated systems include (1) methylcyclohexane (MCH)and toluene (TOL), (2) MCH and cyclohexanol (CHOH), (3) MCH and cyclo-hexanone (CHO) and (4) MCH and cyclopentyl methyl ether (CPME). Themolecular structures of all species used in this study are displayed in Fig-ure 9.1.These ternary mixtures have specifically been chosen to firstly represent aro-
Towards Sustainable Solvent-Based Affinity Separations 198

999999999
LIQUID-LIQUID EXTRACTIONS WITH CYRENE
Figure 9.1: All molecules used in the Liquid-Liquid Extractions, from left to right: methyl-cyclohexane (MCH), toluene (TOL), cyclohexanol (CHOH), cyclohexanone (CHO), cy-clopenthylmethyl ether (CPME) and Cyrene.
matics/aliphatics separations. These separations using LLX have been thesubject of study for a variety of model compounds, including benzene, toluene,xylenes, (methyl)cyclohexane and n-alkanes.21–26 The model systems varyas the related industrial mixture is complex.27 The results in this study onliquid-liquid equilibria with Cyrene, MCH and TOL will be compared to theelaborate work done in the past concerning molecular solvents21,22,25, ionicliquids (ILs)11,24,28 and deep eutectic solvents (DES’s).29–31 The separation ofalcohols and ketones from aliphatics was chosen because the compounds pos-sess either an alcohol or a ketone functionality, and they are relevant indus-trial chemicals, for example in the industrial oxidation process of cyclohexaneto CHO and CHOH.32,33 Kim et al. and Pei et al. investigated similar systemswith CHO and CHOH, though used cyclohexane as hydrocarbon and studieddimethyl sulfoxide (DMSO) and water as a solvent.34,35 The last ternary mix-ture with MCH and CPME was chosen for the ether functionality. CPME alsohas the potential of being a biobased solvent.36–38 The extraction of CPMEfrom an aliphatic stream has not been studied yet. Next to an evaluation of theextraction performance of Cyrene for each of the systems, the LLE were alsocorrelated using the UNIQUAC model. Lastly, by maintaining MCH as the
199 Towards Sustainable Solvent-Based Affinity Separations

999999999
LIQUID-LIQUID EXTRACTIONS WITH CYRENE
constant, it became possible to compare all the systems with each other andinvestigate trends between different functional groups, and thus study the ap-plicability of Cyrene for separating molecules with these different functionalgroups.
9.2 Material and Methods
9.2.1 Materials
Chemicals, if not otherwise specified, were used without any additional pu-rification. Cyclopentylmethyl ether (≥ 99.9%), cyclohexanone (≥ 99.9%) andcyclohexanol (99%) were obtained from Sigma Aldrich, while methylcylohex-ane (Reagent Grade. 99%) was purchased from Honeywell. Toluene (ACS,reag.Ph.Eu) was procured from VWR Chemicals, while analytical acetone (Li-Chrosolv®) was acquired from Merck. A 1L bottle of dihydrolevoglucosenone,or Cyrene, (99.3%) was gratefully supplied by the Circa Group for this re-search.
9.2.2 Methods
9.2.2.1 Liquid-Liquid Extraction Procedure
For the liquid-liquid extraction experiments, 10mL glass vials were used. Allcompounds were weighed with an accuracy of 0.5 mg on an analytical bal-ance. Consecutively a vortex mixer and a temperature-controlled shakingbath were used in the equilibration. The mixture was shaken at 200 rpmfor at least 12h at a constant temperature and subsequently settled for at least1h prior to the sample-taking. The experiments were conducted at 298.15K,323.15K or 348.15K with a temperature variation of 0.02K. A solvent to feedratio on a weight basis of 1 was maintained and the total mass of each phasewas kept approximately constant at 3 grams. A sample of 0.5-1 mL was takenwith a 2mL syringe with an injection needle from both phases. Both phaseswere analyzed following the analysis procedure.
Towards Sustainable Solvent-Based Affinity Separations 200
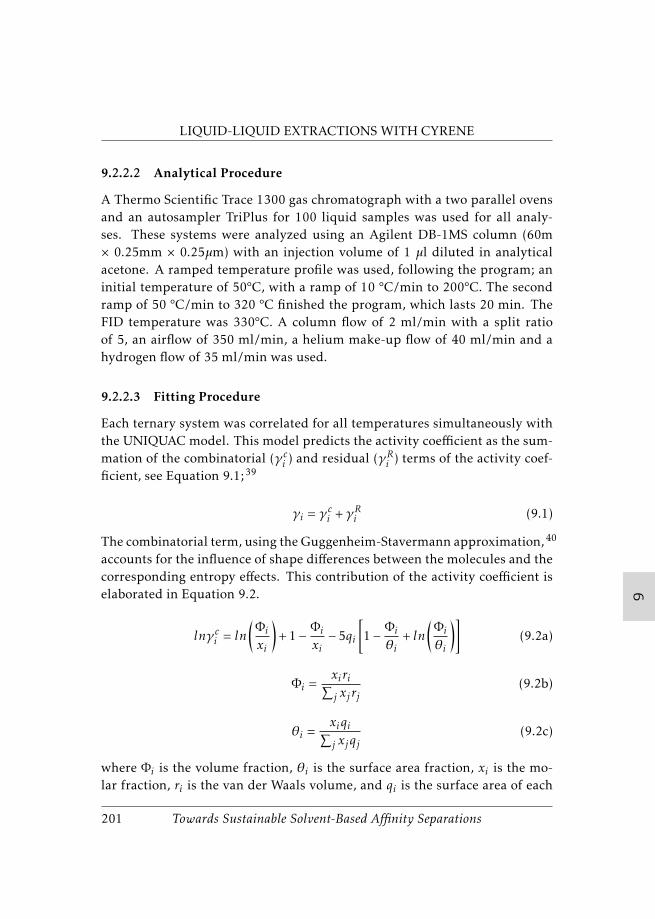
999999999
LIQUID-LIQUID EXTRACTIONS WITH CYRENE
9.2.2.2 Analytical Procedure
A Thermo Scientific Trace 1300 gas chromatograph with a two parallel ovensand an autosampler TriPlus for 100 liquid samples was used for all analy-ses. These systems were analyzed using an Agilent DB-1MS column (60m× 0.25mm × 0.25µm) with an injection volume of 1 µl diluted in analyticalacetone. A ramped temperature profile was used, following the program; aninitial temperature of 50°C, with a ramp of 10 °C/min to 200°C. The secondramp of 50 °C/min to 320 °C finished the program, which lasts 20 min. TheFID temperature was 330°C. A column flow of 2 ml/min with a split ratioof 5, an airflow of 350 ml/min, a helium make-up flow of 40 ml/min and ahydrogen flow of 35 ml/min was used.
9.2.2.3 Fitting Procedure
Each ternary system was correlated for all temperatures simultaneously withthe UNIQUAC model. This model predicts the activity coefficient as the sum-mation of the combinatorial (γci ) and residual (γRi ) terms of the activity coef-ficient, see Equation 9.1;39
γi = γci +γRi (9.1)
The combinatorial term, using the Guggenheim-Stavermann approximation,40
accounts for the influence of shape differences between the molecules and thecorresponding entropy effects. This contribution of the activity coefficient iselaborated in Equation 9.2.
lnγci = ln(Φi
xi
)+ 1− Φi
xi− 5qi
[1− Φi
θi+ ln
(Φi
θi
)](9.2a)
Φi =xiri∑j xjrj
(9.2b)
θi =xiqi∑j xjqj
(9.2c)
where Φi is the volume fraction, θi is the surface area fraction, xi is the mo-lar fraction, ri is the van der Waals volume, and qi is the surface area of each
201 Towards Sustainable Solvent-Based Affinity Separations

999999999
LIQUID-LIQUID EXTRACTIONS WITH CYRENE
component.
The residual term, see Equation 9.3, is determined using the same parametersand the additional empirical binary interaction parameters τji . This value isfitted using the temperature-independent parameter (Aij ) and temperature-dependent parameter (Bij ).
lnγRi = qi
1− ln(∑
j qjxjτji∑j qjxj
)−∑j
qjxjτji∑k qkxjτkj
(9.3a)
τij = Aij +BijT (K)
(9.3b)
For the correlation, known van der Waals volumes and surface areas wereused, see Table 9.1.
Table 9.1: The UNIQUAC parameters for methylcyclohexane (MCH), toluene (TOL), cyclo-hexanol (CHOH), cyclohexanone (CHO), cyclopentylmethyl ether (CPME) and Cyrene.
Component ri qi (ref)
MCH 5,174 4,396 Chen et al.22
TOL 3,920 2,970 Gupta et al.41
CHOH 4,274 3,284 Pei et al.35
CHO 4,114 3,340 Pei et al.35
CPME 4,214 3,248 Zhang et al.42
Cyrene 4,843 3,322 (-)For Cyrene, the parameters were not available in the literature, and were estimated with Density FunctionalTheory with a B3LYP 6-311+G** parameterization in combination with the methodology of Banerjee et al. 43
9.3 Results
9.3.1 Liquid-Liquid Extraction
The four ternary systems that were investigated in this study are presented ina subsection for each of the systems. All of the systems showed type I phasebehavior44 for all temperatures investigated. For each of the ternary systems
Towards Sustainable Solvent-Based Affinity Separations 202

999999999
LIQUID-LIQUID EXTRACTIONS WITH CYRENE
the selectivity (Sij ) of the solute (i) (Equation 9.5), being toluene, cyclohex-anol, cyclohexanone or CPME, over MCH (j) was examined. This selectivityis defined as the ratio of the distribution coefficients (KD,i) of each of the so-lutes, which in turn is defined as the ratio of the concentration of the solute,on a weight basis, in the solvent ([Xi]S ) and the organic phase ([Xi]O) as inEquation 9.4.
KD,i =[Xi]S[Xi]O
(9.4)
Sij =KD,iKD,j
(9.5)
All experimental results have been correlated using the UNIQUAC model us-ing the pure component parameters as can be seen in Table 9.1. Addition-ally, the correlation was checked on its thermodynamic consistency using theHessian Matrix test in section 12.5.26,27,45,46 This allows an approximate de-scription of the binodal curve. The UNIQUAC parameters for each of theternary systems will be disclosed in each subsection. After describing the re-sults for each of the ternary systems individually, in the last subsection, allternary systems are compared to enable a general description of the affinitiesof Cyrene towards different moieties. Additionally, rough short-cut calcula-tions were performed of the combined CHOH/MCH and CHO/MCH cases toassess the potential of Cyrene in a LLX process. In section 12.4, all the weightfractions, distribution coefficients and selectivities of the ternary diagrams aredisplayed and/or tableted.
9.3.1.1 Methylcyclohexane - Toluene
The results for the MCH – toluene – Cyrene ternary system are displayed inFigure 9.2. As can be seen from the binodal curves, a significant miscibilityregion can be seen. For 298.15K, only below 35 wt. % toluene a biphasicsystem is observed, which further reduces with increasing temperatures. Thisis in line with our work on extractive distillation at a temperature above 373K,where no phase splitting was observed for this system.20
A selectivity of 11.99±0.89 was induced with a toluene concentration of ∼0.74wt. % in the Cyrene phase at 298.15K. This selectivity decreases to 6.76±0.65
203 Towards Sustainable Solvent-Based Affinity Separations

999999999
LIQUID-LIQUID EXTRACTIONS WITH CYRENE
Figure 9.2: The ternary diagram of the LLE of toluene, MCH and Cyrene with the tie-lines,feed compositions and binodal curves at (a) 298.15K, (b) 323.15K and (c) 348.15K, and (d)the STOL,MCH of Cyrene at the same temperatures. The UNIQUAC fit is added throughout.
and 4.91±0.58 at respectively 323.15K and 348.15K for similar toluene con-centrations. This is due to a lower activity coefficient of MCH in Cyrene, aconsequence of a polarity decrease of the solvent phase, which is a conse-quence of the higher hydrocarbon (MCH and TOL) solubility at elevated tem-peratures which in turn is caused by the larger entropic contribution at highertemperatures. The correlated UNIQUAC parameters are given in Table 9.2.
The LLX performance of Cyrene has been put in perspective by the compari-
Towards Sustainable Solvent-Based Affinity Separations 204

999999999
LIQUID-LIQUID EXTRACTIONS WITH CYRENE
Table 9.2: Correlated UNIQUAC parameter for the MCH-toluene-Cyrene system
Component i Component j Aij Aji Bij Bji
MCHToluene 0 0 -191 171.5
Cyrene4.587 -2.627 -1749 773.7
Toluene 2.708 -4.999 -772.6 1463
son with solvents, such as Sulfolane, n-formylmorpholine22, methanol26 andvarious ILs,47–49. As can be seen in Figure 9.3, Sulfolane is outperformingCyrene regarding selectivity and n-formylmorpholine22 has a higher selectiv-ity at high toluene fractions in the solvent phase. Also, both solvents havea more significant phase split than Cyrene. A comparable performance wasseen towards methanol26, though Cyrene has a more significant phase split.
Figure 9.3: (left) A comparison of (left) the LLE and (right) Sij at 298.15K of toluene,MCH and several solvents; Cyrene, Sulfolane, methanol26, n-formylmorpholine22,[EMIM]+[ESO4]− 47, [HMIM]+[B(CN )4]−,∗ 48, [BMIM]+[B(CN )4]−,∗ 48 and[BMIM]+[MSO4].49 ∗These systems were measured at 293.15K.
The ILs induce an almost complete immiscibility, due to lower distributioncoefficients compared to traditional solvents. This immiscibility is due totheir ionic nature, which does not allow them to stabilize in the highly apolarhydrocarbon mixture. Additionally, for low toluene fractions in the solvent
205 Towards Sustainable Solvent-Based Affinity Separations

999999999
LIQUID-LIQUID EXTRACTIONS WITH CYRENE
phase, a similar selectivity towards toluene is observed for the ILs comparedto Sulfolane. Although, at higher toluene fraction the tetracyanoborate ILs48
can retain a higher selectivity compared to Sulfolane. A consequence of lowerdistribution coefficients in ILs is however that a larger solvent quantity is re-quired for the LLX, and the equipment diameter will increase. On the otherhand, due to the larger selectivity, fewer stages are required, reducing theequipment height. Higher selectivity means that fewer aliphatic compoundsneed to be boiled from the solvent in the solvent regeneration, which is bene-ficial for the energy requirement, which seems to be in favor of ILs. Overall,it is not straight-forward to decide which solvent is better and a more thor-ough process simulation including total annual cost estimation is suggestedbut outside the scope.
9.3.1.2 Methylcyclohexane - Cyclopentylmethyl ether
As can be seen in Figure 9.4, Cyrene induces a selectivity of 6.42±0.08, 4.55±0.41and 3.91±0.31 at respectively 298.15K, 323.15K and 348.15K for ∼0.65 wt. %of CPME in the solvent phase.
Towards Sustainable Solvent-Based Affinity Separations 206

999999999
LIQUID-LIQUID EXTRACTIONS WITH CYRENE
Figure 9.4: The ternary diagram of the LLE of cyclopentylmethyl ether, MCH and Cyrenewith the tie-lines, feed compositions and binodal curves at (a) 298.15K, (b) 323.15K and (c)348.15K, and (d) the SCPME,MCH of Cyrene at the same temperatures. The UNIQUAC fitis added throughout.
The results indicate that Cyrene is selective towards the polar ether moietyover the aliphatic MCH. A substantial miscibility region at CPME contentsover ∼35 wt. % CPME is observed, which resembles the LLX-application win-dow of the MCH-toluene case. In Table 9.3, the UNIQUAC parameters of thecorrelation are displayed. This indicates that the dipolar characteristics ofthe ether moiety induce similar intermolecular interactions as the delocalizedπ-system of toluene.
Table 9.3: Correlated UNIQUAC parameter for the MCH-cyclopentylmethyl ether (CPME)-Cyrene system
Component i Component j Aij Aji Bij Bji
MCHCPME 0 0 -61.53 19.21
Cyrene3.332 -2.020 -1356 588.3
CPME 2.319 -3.522 -661.0 899.1
207 Towards Sustainable Solvent-Based Affinity Separations

999999999
LIQUID-LIQUID EXTRACTIONS WITH CYRENE
9.3.1.3 Methylcyclohexane - Cyclohexanol
The results for the system MCH – CHOH – Cyrene are given in Figure 9.5.Cyrene induces a selectivity of 61.42±4.33, 32.8±5.83 and 16.6±2.26 at respec-tively 298.15K, 323.15K and 348.15K at ∼0.80 wt. % of CHOH in the solventphase. This is lower than observed with DMSO34 and water35, which havea selectivity of resp. 155 and 1450, at low CHOH concentrations. The lowerselectivity of Cyrene can mainly be attributed to the larger hydrocarbon back-bone of Cyrene, compared to the small DMSO and water molecules, whichmitigates the multipole interactions with the relatively unselective Londondispersion interactions.50 Also in the ternary system MCH – CHOH – Cyrenea large miscibility region is observed, for concentrations above ∼25 wt. % cy-clohexanol. Due to the large miscibility in the system, only a small operationwindow is available for LLX, and the two-phase region decreases at increas-ing temperature. The larger miscibility region indicates also that the capacityof Cyrene (KD,CHOH= 4.64 at ∼0.80 wt. % of CHOH in the solvent phase) forCHOH is larger than water (KD,CHOH= 1.60† 35). Cyrene would be preferredwhen high CHOH capacities are required, while water is preferred when alarger immiscibility and selectivity are required. DMSO has been shown to bequite toxic51 and is for that reason not the preferred choice. The UNIQUACparameters for this system are present in Table 9.4.
Towards Sustainable Solvent-Based Affinity Separations 208
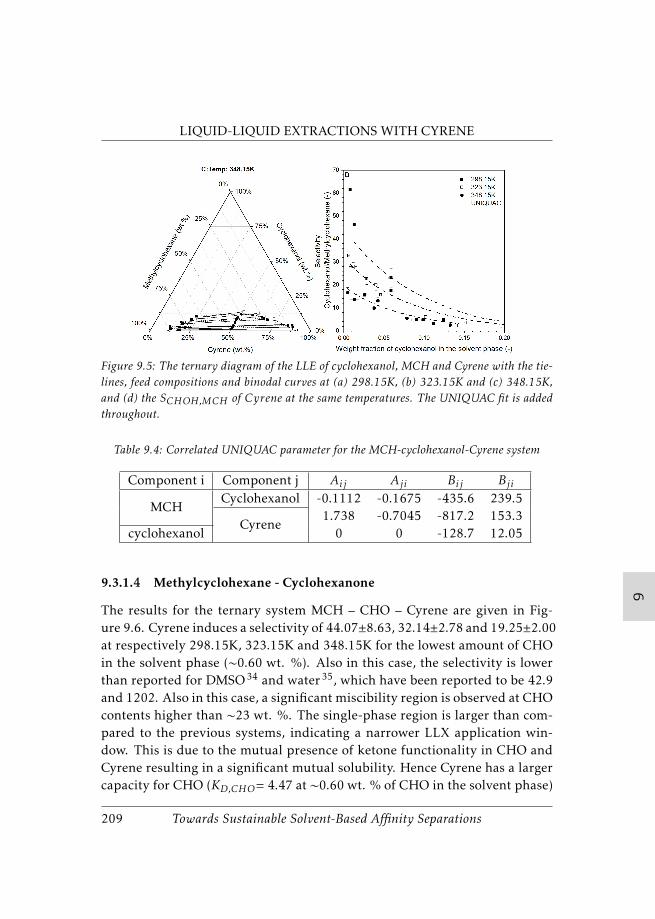
999999999
LIQUID-LIQUID EXTRACTIONS WITH CYRENE
Figure 9.5: The ternary diagram of the LLE of cyclohexanol, MCH and Cyrene with the tie-lines, feed compositions and binodal curves at (a) 298.15K, (b) 323.15K and (c) 348.15K,and (d) the SCHOH,MCH of Cyrene at the same temperatures. The UNIQUAC fit is addedthroughout.
Table 9.4: Correlated UNIQUAC parameter for the MCH-cyclohexanol-Cyrene system
Component i Component j Aij Aji Bij Bji
MCHCyclohexanol -0.1112 -0.1675 -435.6 239.5
Cyrene1.738 -0.7045 -817.2 153.3
cyclohexanol 0 0 -128.7 12.05
9.3.1.4 Methylcyclohexane - Cyclohexanone
The results for the ternary system MCH – CHO – Cyrene are given in Fig-ure 9.6. Cyrene induces a selectivity of 44.07±8.63, 32.14±2.78 and 19.25±2.00at respectively 298.15K, 323.15K and 348.15K for the lowest amount of CHOin the solvent phase (∼0.60 wt. %). Also in this case, the selectivity is lowerthan reported for DMSO34 and water35, which have been reported to be 42.9and 1202. Also in this case, a significant miscibility region is observed at CHOcontents higher than ∼23 wt. %. The single-phase region is larger than com-pared to the previous systems, indicating a narrower LLX application win-dow. This is due to the mutual presence of ketone functionality in CHO andCyrene resulting in a significant mutual solubility. Hence Cyrene has a largercapacity for CHO (KD,CHO= 4.47 at ∼0.60 wt. % of CHO in the solvent phase)
209 Towards Sustainable Solvent-Based Affinity Separations

999999999
LIQUID-LIQUID EXTRACTIONS WITH CYRENE
than water (KD,CHO = 2.79† 35).
Figure 9.6: The ternary diagram of the LLE of cyclohexanone, MCH and Cyrene with the tie-lines, feed compositions and binodal curves at (a) 298.15K, (b) 323.15K and (c) 348.15K,and (d) the SCHO,MCH of Cyrene at the same temperatures. The UNIQUAC fit is addedthroughout.
Also for this case, Cyrene and water may be preferred solvent choices, if eitherCHO capacity or immiscibly window and selectivity are the selection criteria.As previously mentioned, DMSO is toxic and is preferentially avoided. InTable 9.5, the UNIQUAC parameters of the correlation are displayed. As pre-viously mentioned, DMSO is toxic and is preferentially avoided, though water
Towards Sustainable Solvent-Based Affinity Separations 210

999999999
LIQUID-LIQUID EXTRACTIONS WITH CYRENE
appears to be an excellent solvent also for the extraction of cyclohexanone. InTable 9.5, the UNIQUAC parameters of the correlation are displayed.
Table 9.5: Correlated UNIQUAC parameter for the MCH-cyclohexanone-Cyrene system
Component i Component j Aij Aji Bij Bji
MCHCyclohexanone -1.090 -1.090 364.9 364.9
Cyrene4.587 -2.627 -1749 773.7
cyclohexanone 2.507 -7.521 -531.6 2133
9.3.1.5 Comparative Study
By considering the combined data from all ternary systems with toluene (TOL),cyclohexanol (CHOH), cyclohexanone (CHO) and CPME, from MCH, the per-formance of Cyrene towards particular moieties can be evaluated. Cyrene isa bi-cyclic organic molecule in which a double ether moiety, one in each ring,and a ketone functionality are present. All moieties are aprotic and there-fore can only act as a hydrogen bond acceptor and will induce next to theomnipresent London dispersion interactions also Keesom and Debye interac-tions.50 Comparing the results, it is concluded that selectivity order is foundto be mostly CHOH > CHO >> TOL > CPME. A larger temperature depen-dency is seen for CHOH, likely due to intra- and intermolecular hydrogenbonding, resulting in lower selectivity than CHO at higher temperatures.
Comp. i Comp. j[Xj ]S (wt.%) KD,j (-) Selectivity (-)
(298.15K / 323.15K / 348.15K )
MCH
CHOH 0.80 / 0.65 / 0.51 4.64 / 2.94 / 1.64 61.4 / 32.8 / 16.6CHO 0.87 / 0.60 / 0.56 4.47 / 3.15 / 2.20 44.1 / 32.1 / 19.3TOL 0.74 / 0.82 / 0.72 0.98 / 0.54 / 0.51 12.0 / 5.80 / 5.32
CPME 0.83 / 0.63 / 0.57 0.30 / 0.40 / 0.40 5.15 / 4.27 / 3.54
CHOH and CHO are extracted with significantly higher selectivity than tol-uene and CPME. This is due to respectively the hydrogen bond donating char-acter of CHOH and the significant dipole moment of 2.75D52 of CHO whichinduces substantial Keesom and Debye interactions with Cyrene. Toluene andCPME do not have hydrogen bonding donating capabilities and have much
211 Towards Sustainable Solvent-Based Affinity Separations

999999999
LIQUID-LIQUID EXTRACTIONS WITH CYRENE
lower dipole moments compared to CHO, respectively 0.37D53 and 1.27D54,hence a lower selectivity is induced. Toluene does, however, exhibit a signifi-cant quadrupole moment,55 which is responsible for more extensive Keesomand Debye interactions and therefore a larger selectivity is induced comparedto CPME. When the CHO and CHOH cases are combined and their extrac-tion performances are compared, a measure of selectivity towards both so-lutes may be estimated for the lowest weight fractions of solute in the solventphase. A selectivity ratio (SCHOH,MCH/SCHO,MCH ) of 1.42 and 1.2137 is ob-tained for resp. Cyrene and water. We speculate that Cyrene is a slightly moreselective solvent for the combined extraction of CHO and CHOH than wa-ter, though this may be caused by the different alkane used in both studies.A Cyrene-based LLX process for this separation was further investigated byshort-cut energy calculations in the next section.
9.4 Process Considerations
Liquid-Liquid Equilibria are cornerstones in an accurate description of Liquid-Liquid Extractions (LLX) that arguably form the heart of LLX processes. Assolvents are rarely completely immiscible and selective, several additional pu-rification steps are required to recover the solvent and obtain a pure product.An example is given by de Graff et al.56 where two distillation columns areused to recover the solvent and pure products from a LLX column. The raf-finate can also be distilled to recover the solvent, though for polar solventsthe use of a water wash column to recover the solvent can be applied to saveenergy. Subsequently, the water is then evaporated from the solvent-rich wa-ter phase and the vapor is used to strip extracted solutes from the extractstream.57–59 To thoroughly compare Cyrene with all conventional solvents forall studied applications will require rigorous process simulations for all theseprocess steps, and even consideration on which of the steps are required andpreferred. This is beyond the scope of this paper, in which the applicability ofCyrene is explored and a first indication of the usefulness of the application isdiscussed based on miscibility, distribution coefficients and selectivity. On thebasis of a short-cut calculation an estimation of the required heat duty will begiven for the combined case of MCH/CHO and MCH/CHOH. This case waschosen as being most interesting for industrial application in the industrial
Towards Sustainable Solvent-Based Affinity Separations 212

999999999
LIQUID-LIQUID EXTRACTIONS WITH CYRENE
oxidation process of cyclohexane to CHO and CHOH32,33.
The MCH-TOL case which certainly is also of industrial interest was not sim-ulated because based on the liquid-liquid equilibrium data it can be seen thatboth Sulfolane and ILs are clearly superior over Cyrene with regard to selec-tivity and immiscibility. The most significant difference between water andCyrene is related to the recovery of the CHO and CHOH from the solvent,which boils at resp. 429K and 433K. Cyrene is a high-boiling solvent (bp:500K8), whereas water is a low-boiling solvent (bp: 373K). Recovery of waterthus implies that the solvent has to be boiled off from the solutes, whereasthe solutes can be boiled off from the Cyrene. Cyrene has therefore a signifi-cant advantage over water, due to the fact the energy-penalty associated withthe evaporation enthalpy of the solvent is avoided in using the high-boilingCyrene. Also, the capacity of CHO and CHOH in water is lower compared toCyrene. This entails a larger amount of water is required to extract a certainamount of CHO and/or CHOH than Cyrene. To estimate the magnitude of theenergy advantage, a set of rough calculations on the heat duty in the recoveryprocesses were performed. Using the LLE description by UNIQUAC, the min-imum solvent to feed (S:F) ratio (on mass basis) was determined by simulationin Aspen Plus® of the LLX process with 1000 equilibrium stages, a feed con-taining 90 wt. % MCH, and obtaining >99.9 wt. % MCH purity. Afterward,for the heat duty in the solvent recovery stage, a short-cut calculation was ap-plied. Assuming that most of the sensible heat may be recoverable using heatexchangers, the latent heat of vaporization (∆Hvap) of the most volatile com-pound was used as an estimate. For water as solvent, a minimum S:F ratio of1.8 was obtained for CHOH and 7.3 for CHO. Since water for these systems isa volatile solvent, evaporation of all the water resulted in a heat duty of 41.3MJ/kgCHOH and 166 MJ/kgCHO.
For Cyrene, a lower minimum S:F ratio was required which is a direct conse-quence of the larger capacity towards CHO and CHOH, being 1.2 for CHOHand CHO. Furthermore, since Cyrene in these systems is a high boiling sol-vent, the solutes CHOH and CHO should be boiled off. Due to solvent leach-ing, MCH should be boiled off from the raffinate to recover the solvent, andthe evaporation of MCH from the raffinate is included in the calculations. Thisresulted for CHOH in a heat duty of 3.86 MJ/kgCHOH and for CHO in 3.87
213 Towards Sustainable Solvent-Based Affinity Separations

999999999
LIQUID-LIQUID EXTRACTIONS WITH CYRENE
MJ/kgCHO. These short-cut calculations show that extraction processes usingCyrene instead of water may be 11 times more efficient for the separation ofCHOH from MCH and 43 times more efficient for CHO from MCH. This isa rough heat duty estimate, and in an accurate process simulation, the finalheat duty may be less beneficial. However, with the current figures, it showsa high potential for a significant advantage of the high boiling Cyrene overthe low boiling water. The fact that most energy savings compared to waterwere accomplished by the higher boiling point of the solvent, suggests that forthis application the use of ionic liquids (ILs) might be interesting too, on thecondition that beneficial behavior is observed in LLE. However, no LLE datahas been found for MCH/CHOH or CHO with an IL. The separation of CHOand CHOH may also be accomplished with Cyrene due to the fact a largerselectivity is observed toward CHOH than CHO. Although no phase separa-tion is expected and LLX is not possible, other separation techniques may beused such as extractive distillation or perhaps with an extractive divided wallconfiguration.
9.5 Conclusions
Four biphasic ternary systems have been assessed in which methylcyclohex-ane (MCH) and Cyrene were kept constant. As third compound toluene,cyclohexanol, cyclohexanone and cyclopentyl methyl ether (CPME) were ap-plied. For each ternary system, a selective extraction was found at the threestudied temperatures of 298.15K, 323.15K and 348.15K. Cyclohexanol (up toSCHOH,MCH = 61.42±4.33) and cyclohexanone (up to SCHO,MCH = 44.07±8.63)were most selectively extracted, while toluene (up to STOL,MCH = 11.99±0.89)and CPME (up to SCPME,MCH = 6.42±0.08) were extracted with considerablylower selectivity. While Cyrene was outperformed by Sulfolane and severalionic liquids in the extraction of toluene, the potential of Cyrene in the cyclo-hexanol/cyclohexanone systems was observed. Although a lower selectivitywas seen than with water, due to the high boiling point of Cyrene, recoverycan be much less costly. Overall, we conclude that Cyrene can be applied asbiobased extraction solvent for a variety of separations, although for severalsystems the phase envelop is relatively narrow and narrower at higher tem-peratures.
Towards Sustainable Solvent-Based Affinity Separations 214

999999999
LIQUID-LIQUID EXTRACTIONS WITH CYRENE
9.6 Nomenclature
[BMIM]+[B(CN )4]− = 1-butyl-3-methylimidazolium tetracyanoborate[BMIM]+[MSO4]− = 1-butyl-3-methylimidazolium methylsulfate[EMIM]+[ESO4]− = 1-ethyl-3-methylimidazolium ethylsulfate[HMIM]+[B(CN )4]− = 1-hexyl-3-methylimidazolium tetracyanoborate[Xi]O = Weight Fraction of compound i in the organic phase[Xi]S = Weight Fraction of compound i in the solvent phaseAij = Temperature independent UNIQUAC fit parameterBij = Temperature-dependent UNIQUAC fit parameterBp = Boiling pointCHO = CyclohexanoneCHOH = CyclohexanolCPME = Cyclopentylmethyl etherCyrene = DihydrolevoglycosenoneD = DebyeDMF = N,N-dimethylformamideDMSO = DimethylsulfoxideED = Extractive DistillationKD,i = Distributation coefficient of solute iFID = Flame Ionization DetectorLLE = Liquid-liquid equilibriumLLX = Liquid-liquid extractionMCH = MethylcyclohexaneNMP = N-methylpyrrolidoneqi = Van der Waals surface area of solute iri = Van der Waals volume of solute iSij = Selectivity of solute i over solute jS:F ratio = Solvent to Feed ratioSulfolane = Tetrahydrothiophene-1,1-dioxideT (K) = Absolute temperatureTOL = TolueneUNIFAC = UNIQUAC functional-group Activity Coefficients
215 Towards Sustainable Solvent-Based Affinity Separations

999999999
LIQUID-LIQUID EXTRACTIONS WITH CYRENE
UNIQUAC = Universal Quasichemicalγi = Activity Coefficient of solute iγCi = Combinatorial term of the activity Coefficient of solute iγRi = Residual term of activity Coefficient of solute iΦi = volume fractionθi = surface area fractionτij = binary interaction parameter between solutes i and j† = Extrapolated from corresponding literature to similar solute
concentration in solvent phase
9.7 References
[1] J. E. Camp, “Bio-available solvent cyrene: Synthesis, derivatization, and applications,” ChemSusChem,vol. 11, no. 18, pp. 3048–3055, 2018.
[2] L. Mistry, K. Mapesa, T. W. Bousfield, and J. E. Camp, “Synthesis of ureas in the bio-alternative solventcyrene,” Green Chemistry, vol. 19, no. 9, pp. 2123–2128, 2017.
[3] J. Sherwood, A. Constantinou, L. Moity, C. R. McElroy, T. J. Farmer, T. Duncan, W. Raverty, A. J. Hunt, J. H.Clark, et al., “Dihydrolevoglucosenone (cyrene) as a bio-based alternative for dipolar aprotic solvents,”Chemical Communications, vol. 50, no. 68, pp. 9650–9652, 2014.
[4] K. L. Wilson, A. R. Kennedy, J. Murray, B. Greatrex, C. Jamieson, and A. J. Watson, “Scope and limitationsof a dmf bio-alternative within sonogashira cross-coupling and cacchi-type annulation,” Beilstein journalof organic chemistry, vol. 12, no. 1, pp. 2005–2011, 2016.
[5] K. L. Wilson, J. Murray, C. Jamieson, and A. J. Watson, “Cyrene as a bio-based solvent for hatu mediatedamide coupling,” Organic & biomolecular chemistry, vol. 16, no. 16, pp. 2851–2854, 2018.
[6] K. L. Wilson, J. Murray, C. Jamieson, and A. J. Watson, “Cyrene as a bio-based solvent for the suzuki–miyaura cross-coupling,” Synlett, vol. 29, no. 05, pp. 650–654, 2018.
[7] J. Zhang, G. B. White, M. D. Ryan, A. J. Hunt, and M. J. Katz, “Dihydrolevoglucosenone (cyrene) as a greenalternative to n, n-dimethylformamide (dmf) in mof synthesis,” ACS Sustainable Chemistry & Engineering,vol. 4, no. 12, pp. 7186–7192, 2016.
[8] T. Marino, F. Galiano, A. Molino, and A. Figoli, “New frontiers in sustainable membrane preparation:Cyrene™ as green bioderived solvent,” Journal of membrane science, vol. 580, pp. 224–234, 2019.
[9] M. Blahušiak, A. A. Kiss, K. Babic, S. R. Kersten, G. Bargeman, and B. Schuur, “Insights into the selectionand design of fluid separation processes,” Separation and purification technology, vol. 194, pp. 301–318,2018.
[10] Y. J. Choi, K. W. Cho, B. W. Cho, and Y.-K. Yeo, “Optimization of the sulfolane extraction plant basedon modeling and simulation,” Industrial & engineering chemistry research, vol. 41, no. 22, pp. 5504–5509,2002.
[11] Q. Wang, J. Y. Chen, M. Pan, C. He, C. C. He, B. J. Zhang, and Q. L. Chen, “A new sulfolane aromaticextractive distillation process and optimization for better energy utilization,” Chemical Engineering andProcessing-Process Intensification, vol. 128, pp. 80–95, 2018.
[12] E. Reyhanitash, T. Brouwer, S. R. Kersten, A. van der Ham, and B. Schuur, “Liquid–liquid extraction-basedprocess concepts for recovery of carboxylic acids from aqueous streams evaluated for dilute streams,”Chemical Engineering Research and Design, vol. 137, pp. 510–533, 2018.
[13] L. Bergkamp and N. Herbatschek, “Regulating chemical substances under reach: the choice betweenauthorization and restriction and the case of dipolar aprotic solvents,” Review of European, Comparative &International Environmental Law, vol. 23, no. 2, pp. 221–245, 2014.
[14] K. Lee, N. Chromey, R. Culik, J. Barnes, and P. Schneider, “Toxicity of n-methyl-2-pyrrolidone (nmp):
Towards Sustainable Solvent-Based Affinity Separations 216

999999999
LIQUID-LIQUID EXTRACTIONS WITH CYRENE
teratogenic, subchronic, and two-year inhalation studies,” Fundamental and Applied Toxicology, vol. 9,no. 2, pp. 222–235, 1987.
[15] J. Sherwood, T. J. Farmer, and J. H. Clark, “Catalyst: Possible consequences of the n-methyl pyrrolidonereach restriction,” Chem, vol. 4, no. 9, pp. 2010–2012, 2018.
[16] Z. R. E. J. N. Waaijers-van der Loop, S. L.; Dang, “Toxicity screening of potential bio-based polar aproticsolvents (pas),” 2018.
[17] M. Mccoy, “New solvent seeks to replace nmp,” Chemical & Engineering News, vol. 97, no. 22, pp. 14–14,2019.
[18] B. International, “Circa group to head resolute to resolve commercial bio-based solvent production,” Dec.2019.
[19] S. H. Krishna, K. Huang, K. J. Barnett, J. He, C. T. Maravelias, J. A. Dumesic, G. W. Huber, M. De Bruyn,and B. M. Weckhuysen, “Oxygenated commodity chemicals from chemo-catalytic conversion of biomassderived heterocycles,” AIChE Journal, vol. 64, no. 6, pp. 1910–1922, 2018.
[20] T. Brouwer and B. Schuur, “Bio-based solvents as entrainers for extractive distillation in aro-matic/aliphatic and olefin/paraffin separation,” Green Chemistry, vol. 22, no. 16, pp. 5369–5375, 2020.
[21] I. Ashour and S. I. Abu-Eishah, “Liquid- liquid equilibria of ternary and six-component systems includingcyclohexane, benzene, toluene, ethylbenzene, cumene, and sulfolane at 303.15 k,” Journal of Chemical &Engineering Data, vol. 51, no. 5, pp. 1717–1722, 2006.
[22] D. Chen, H. Ye, and H. Wu, “Liquid–liquid equilibria of methylcyclohexane–benzene–n-formylmorpholine at several temperatures,” Fluid phase equilibria, vol. 255, no. 2, pp. 115–120,2007.
[23] D. Chen, H. Ye, and H. Wu, “Measurement and correlation of liquid- liquid equilibria of methylcyclo-hexane+ toluene+ n-formylmorpholine at (293, 303, 313, and 323) k,” Journal of Chemical & EngineeringData, vol. 52, no. 4, pp. 1297–1301, 2007.
[24] J. García, A. Fernández, J. S. Torrecilla, M. Oliet, and F. Rodríguez, “Liquid–liquid equilibria for hexane+benzene+ 1-ethyl-3-methylimidazolium ethylsulfate at (298.2, 313.2 and 328.2) k,” Fluid phase equilibria,vol. 282, no. 2, pp. 117–120, 2009.
[25] S. M. R. S. Ghannad, M. N. Lotfollahi, and A. H. Asl, “(liquid+ liquid) equilibria for mixtures of (ethyleneglycol+ benzene+ cyclohexane) at temperatures (298.15, 308.15, and 318.15) k,” The Journal of ChemicalThermodynamics, vol. 43, no. 3, pp. 329–333, 2011.
[26] M. B. Gramajo, J. H. Veliz, M. C. Lucena, and D. A. González, “Liquid–liquid equilibria of the methanol+toluene+ methylcyclohexane ternary system at 278.15, 283.15, 288.15, 293.15, 298.15 and 303.15 k,”Journal of Solution Chemistry, vol. 42, no. 10, pp. 2025–2033, 2013.
[27] W. K. Robbins and C. S. Hsu, “Petroleum, composition,” Kirk-Othmer Encyclopedia of Chemical Technology,2000.
[28] T. Zhou, Z. Wang, L. Chen, Y. Ye, Z. Qi, H. Freund, and K. Sundmacher, “Evaluation of the ionic liq-uids 1-alkyl-3-methylimidazolium hexafluorophosphate as a solvent for the extraction of benzene fromcyclohexane:(liquid+ liquid) equilibria,” The Journal of Chemical Thermodynamics, vol. 48, pp. 145–149,2012.
[29] Y. Hou, Z. Li, S. Ren, and W. Wu, “Separation of toluene from toluene/alkane mixtures with phosphoniumsalt based deep eutectic solvents,” Fuel Processing Technology, vol. 135, pp. 99–104, 2015.
[30] S. Ma, J. Li, L. Li, X. Shang, S. Liu, C. Xue, and L. Sun, “Liquid–liquid extraction of benzene and cyclohex-ane using sulfolane-based low transition temperature mixtures as solvents: Experiments and simulation,”Energy & fuels, vol. 32, no. 7, pp. 8006–8015, 2018.
[31] N. R. Rodriguez, P. F. Requejo, and M. C. Kroon, “Aliphatic–aromatic separation using deep eutecticsolvents as extracting agents,” Industrial & Engineering Chemistry Research, vol. 54, no. 45, pp. 11404–11412, 2015.
[32] J. D. Druliner, S. D. Ittel, P. J. Krusic, and C. A. Tolman, “Process for producing a mixture containingcyclohexanol and cyclohexanone from cyclohexane,” Apr. 20 1982. US Patent 4,326,084.
[33] U. Schuchardt, D. Cardoso, R. Sercheli, R. Pereira, R. S. Da Cruz, M. C. Guerreiro, D. Mandelli, E. V.Spinacé, and E. L. Pires, “Cyclohexane oxidation continues to be a challenge,” Applied Catalysis A: General,vol. 211, no. 1, pp. 1–17, 2001.
[34] S. Y. Kim, J. Choe, and K. H. Song, “(liquid+ liquid) equilibria of (cyclohexane+ dimethyl sulfoxide+
217 Towards Sustainable Solvent-Based Affinity Separations

999999999
LIQUID-LIQUID EXTRACTIONS WITH CYRENE
cyclohexanone) and (cyclohexane+ dimethyl sulfoxide+ cyclohexanol) at t= 303.2 k,” Journal of Chemical& Engineering Data, vol. 55, no. 3, pp. 1109–1112, 2010.
[35] Y. Pei, Q. Wang, X. Gong, F. Lei, and B. Shen, “Distribution of cyclohexanol and cyclohexanone betweenwater and cyclohexane,” Fluid Phase Equilibria, vol. 394, pp. 129–139, 2015.
[36] M. C. Molina, R. Mariscal, M. Ojeda, and M. L. Granados, “Cyclopentyl methyl ether: A green co-solventfor the selective dehydration of lignocellulosic pentoses to furfural,” Bioresource technology, vol. 126,pp. 321–327, 2012.
[37] T. Oshima, N. Ohkubo, I. Fujiwara, T. Horiuchi, T. Koyama, K. Ohe, and Y. Baba, “Extraction of gold (iii)using cyclopentyl methyl ether in hydrochloric acid media,” Solvent Extraction Research and Development,Japan, vol. 24, no. 2, pp. 89–96, 2017.
[38] E. Yara-Varon, A.-S. Fabiano-Tixier, M. Balcells, R. Canela-Garayoa, A. Bily, and F. Chemat, “Is it possibleto substitute hexane with green solvents for extraction of carotenoids? a theoretical versus experimentalsolubility study,” RSC Advances, vol. 6, no. 33, pp. 27750–27759, 2016.
[39] G. Maurer and J. Prausnitz, “On the derivation and extension of the uniquac equation,” Fluid Phase Equi-libria, vol. 2, no. 2, pp. 91–99, 1978.
[40] A. Staverman, “The entropy of high polymer solutions. generalization of formulae,” Recueil des TravauxChimiques des Pays-Bas, vol. 69, no. 2, pp. 163–174, 1950.
[41] S. Gupta, B. Rawat, A. Goswami, S. Nanoti, and R. Krishna, “Isobaric vapour—liquid equilibria of thesystems: Benzene—triethylene glycol, toluene—triethylene glycol and benzene—n-methylpyrrolidone,”Fluid phase equilibria, vol. 46, no. 1, pp. 95–102, 1989.
[42] H. Zhang, “Measurements and comparative study of ternary liquid–liquid equilibria for water+ acrylicacid+ cyclopentyl methyl ether at (293.15, 303.15, and 313.15) k and 100.249 kpa,” Journal of Chemical &Engineering Data, vol. 60, no. 5, pp. 1371–1376, 2015.
[43] T. Banerjee, M. K. Singh, R. K. Sahoo, and A. Khanna, “Volume, surface and uniquac interaction pa-rameters for imidazolium based ionic liquids via polarizable continuum model,” Fluid phase equilibria,vol. 234, no. 1-2, pp. 64–76, 2005.
[44] R. E. Treybal, “Liquid extraction,” tech. rep., 1963.[45] B. L. Beegle, M. Modell, and R. C. Reid, “Thermodynamic stability criterion for pure substances and
mixtures,” AIChE Journal, vol. 20, no. 6, pp. 1200–1206, 1974.[46] A. Marcilla, M. Serrano, J. Reyes-Labarta, and M. Olaya, “Checking liquid–liquid plait point conditions
and their application in ternary systems,” Industrial & engineering chemistry research, vol. 51, no. 13,pp. 5098–5102, 2012.
[47] E. J. González, N. Calvar, E. Gómez, and Á. Domínguez, “Application of [emim][eso4] ionic liquid assolvent in the extraction of toluene from cycloalkanes: Study of liquid–liquid equilibria at t= 298.15 k,”Fluid Phase Equilibria, vol. 303, no. 2, pp. 174–179, 2011.
[48] J. P. Gutierrez, W. Meindersma, and A. B. De Haan, “Binary and ternary (liquid+ liquid) equilibriumfor methylcyclohexane (1)+ toluene (2)+ 1-hexyl-3-methylimidazolium tetracyanoborate (3)/1-butyl-3-methylimidazolium tetracyanoborate (3),” The Journal of Chemical Thermodynamics, vol. 43, no. 11,pp. 1672–1677, 2011.
[49] I. Domínguez, N. Calvar, E. Gómez, and Á. Domínguez, “Separation of toluene from cyclic hydrocarbonsusing 1-butyl-3-methylimidazolium methylsulfate ionic liquid at t= 298.15 k and atmospheric pressure,”The Journal of Chemical Thermodynamics, vol. 43, no. 5, pp. 705–710, 2011.
[50] J. N. Israelachvili, “Van der waals forces between particles and surfaces,” Intermolecular and surface forces,vol. 3, pp. 253–289, 2011.
[51] J. Galvao, B. Davis, M. Tilley, E. Normando, M. R. Duchen, and M. F. Cordeiro, “Unexpected low-dosetoxicity of the universal solvent dmso,” The FASEB Journal, vol. 28, no. 3, pp. 1317–1330, 2014.
[52] D. O’Reilly, E. Peterson, and D. Hogenboom, “Self-diffusion coefficients and rotational correlation times inpolar liquids. v. cyclohexane, cyclohexanone, and cyclohexanol,” The Journal of Chemical Physics, vol. 57,no. 9, pp. 3969–3976, 1972.
[53] A. J. Petro, “The dipole moment of the carbon-carbon bond,” Journal of the American Chemical Society,vol. 80, no. 16, pp. 4230–4232, 1958.
[54] K. Watanabe, N. Yamagiwa, and Y. Torisawa, “Cyclopentyl methyl ether as a new and alternative processsolvent,” Organic process research & development, vol. 11, no. 2, pp. 251–258, 2007.
Towards Sustainable Solvent-Based Affinity Separations 218

999999999
LIQUID-LIQUID EXTRACTIONS WITH CYRENE
[55] M. Schauer and E. Bernstein, “Calculations of the geometry and binding energy of aromatic dimers: ben-zene, toluene, and toluene–benzene,” The Journal of chemical physics, vol. 82, no. 8, pp. 3722–3727, 1985.
[56] R. R. De Graff and M. W. Perga, “Method for aromatic hydrocarbon recovery,” Sept. 9 1969. US Patent3,466,346.
[57] E. A. Jones and D. B. Broughton, “Solvent extraction process for recovery of aromatic hydrocarbons,”Mar. 16 1965. US Patent 3,173,966.
[58] R. D. Morin, J. B. Fishel, and A. E. Bearse, “Separation of aromatic hydrocarbons from non-aromatichydrocarbons utilizing a lactam-water solvent,” Apr. 19 1960. US Patent 2,933,448.
[59] H. L. Thompson, “Process for the extraction and recovery of aromatic hydrocarbons,” Dec. 1 1970. USPatent 3,544,453.
[60] H. C. Van Ness, Classical thermodynamics of non-electrolyte solutions. Elsevier, 2015.[61] J. M. Sørensen, T. Magnussen, P. Rasmussen, and A. Fredenslund, “Liquid—liquid equilibrium data: Their
retrieval, correlation and prediction part ii: Correlation,” Fluid Phase Equilibria, vol. 3, no. 1, pp. 47–82,1979.
219 Towards Sustainable Solvent-Based Affinity Separations


10
10
10
10
10
10
10
10
10
10
10Process Simulation of Solvent-BasedAffinity Processes using Cyrene and
Sulfolane"To do for a penny what any fool can do for a two pence",Peter Danckwerts (1916-1984)
This chapter is adapted from:Brouwer, T. and Schuur, B., "Comparison of Solvent-based Affinity Sepa-ration Processes using Cyrene and Sulfolane for Aromatic/Aliphatic Separa-tions", (Article Submitted)

10
10
10
10
10
10
10
10
10
10
PROCESS SIMULATION OF SOLVENT-BASED AFFINITY PROCESSES
10.1 Introduction
The fractionation of crude oils into numerous intermediates and products ispracticed all around the world. Oil fractionation is an energy-intensive pro-cess due to the complexity of the feed that requires an extensive separationtrain. Yearly a huge amount of crude oil is being produced, (4.4 billion tonsin 20191), which resembles about 12.0% of the global energy usage by thepetrochemical industry.2 In our path towards a more sustainable future, theelimination of crude oil will take time, and in the short term, will not befeasible as the world cannot function without carbon-based products. For thelonger term, fossil-based crude oils can be replaced with bio-crude oils,3,4 butalso bio-crude oils need to be refined.5,6 While in the further future the useof bio-crudes might take significant impact, further greening of traditionalindustrial crude processing should also be pursued to reduce environmentalimpact. Part of this can be realized by increasing the energy efficiency of theseprocesses by replacing traditional solvents with bio-based solvents.7,8
Crude oil feeds, for instance, naphtha, are complex mixtures that may containC6- to C9-hydrocarbons,9,10 though other composition ranges are also seen.Various hydrocarbons are either close-boiling compounds, form pinch pointsand/or form azeotropes between each other.9,10 This is the major reason forthe large energy requirements of the subsequent separation train. The moti-vation of separating the aromatic compounds from the aliphatic compoundsapart from their individual value is that the presence of aromatic compoundshinders the production of ultra-low sulfur fuels11 which adds load on the sep-aration train and tends to foul radiation sections and transfer line exchang-ers.12
Traditional distillation columns are due to the overlapping boiling ranges andazeotropes not able to facilitate all the required separations and thereforesolvent-based affinity processes including liquid-liquid extraction (LLX),13–15
extractive distillation (ED)16,17 and azeotropic distillation (AD)18,19 are inuse to enhance the relative volatility. Other processes have also been re-ported such as pervaporation,20,21 adsorption22,23 or using supported liq-uid membranes with ionic liquids (ILs)24 and polymeric membranes.25 Re-garding solvent-based affinity processes, the solvent choice has a significant
Towards Sustainable Solvent-Based Affinity Separations 222

10
10
10
10
10
10
10
10
10
10
PROCESS SIMULATION OF SOLVENT-BASED AFFINITY PROCESSES
effect on the overall energy-efficiency of the process. The capacity, the se-lectivity and the boiling point of the solvent are among the selection crite-ria. A current state-of-the-art polar solvent used in these affinity processesis tetrahydrothiophene-1,1-dioxide or commonly known as Sulfolane.10 ILshave been widely studied as potential superior solvents,12,26–28 as shown forinstance by Meindersma et al.12 who found that the LLX process can be drasti-cally improved by using 4-methyl-N-butylpyridinium tetrafluoroborate. Morerecently, Deep Eutectic Solvents (DES’s) are stated to be an additional newclass of alternative solvents.29–32 Because DES’s are composite solvents andnot bound by charge neutrality as seen with ILs, leaching is not necessarythe same for both (all) constituents,33,34 and the risk remains of changing thesolvent composition during subsequent extraction stages.35 For this reason, asingle molecule solvent may be better suited than composite solvents such asDES’s for treating complex streams such as naphtha.
In this study, both LLX-based processes and ED-based processes will be com-pared, because both are of relevance due to the wide range of aromatic con-tents found in industrial applications. The number of aromatic compoundspresent in the feed highly depends on the nature of the feed. For exam-ple, in ethylene crackers, the aromatic content is often 10-25%,12 while thenaphtha fractions of respectively Arab and Kurdish crude oil contains about9-15 vol.%36 and 16.3 vol. %37 aromatic compounds. After catalytic re-forming, the subsequent reformate can contain up to 55 wt.% of aromaticcompounds36 and vacuum gas oil may contain 33.3 wt.%.38 The last exam-ple is pyrolytic light naphtha oil from used tires, which can contain 51.8wt.% of aromatic compounds.39 This highlights the necessity of assessingprocesses over a wide range of aromatic content in the feed. Weissermeland Arpe18 described that for the separation of aromatic and aliphatic mix-tures, three solvent-based affinity processes are preferred at different aromaticfeed concentrations. Liquid-liquid extraction (LLX) processes are most suit-able at an aromatic feed between 20% and 65%, while extractive distillation(ED) processes are most preferred between 65% and 90%. For higher aro-matic content (>90%) azeotropic distillation (AD) processes are preferred.They mention a lack of economically feasible processes for mixed hydrocar-bon feeds containing <20% of aromatic compounds. In these processes severalpolar solvents have been used, such as Sulfolane,40–42 n-methylpyrrolidone
223 Towards Sustainable Solvent-Based Affinity Separations

10
10
10
10
10
10
10
10
10
10
PROCESS SIMULATION OF SOLVENT-BASED AFFINITY PROCESSES
(NMP),41,43 n-formylmorpholine (NFM),42,44 propylene carbonate45,46 andvarious glycols.47,48
In this manuscript, we compare the process performance of one of these recentbiobased solvent advances (dihydrolevoglucosenone or Cyrene) with the per-formance of Sulfolane, one of the industrial standards for aromatics/aliphaticsseparations ranging from 10 to 80 mol.% of aromatic content. Because forCyrene a very limited amount of binary interaction parameters are currentlyavailable, it was not possible to properly simulate processes of complex crudemixtures, and therefore the study is limited to a model system comprised ofone aromatic compound (toluene, TOL) and one aliphatic compound (methyl-cyclohexane, MCH), for which the parameters have recently been reported.7,8
Both LLX and ED processes have been compared, we report here on their pro-cess configurations, simulation results and corresponding costs.
10.2 Solvent-Based Affinity Separation Processes
For all solvent-based separation processes holds that after the primary sep-aration, a solvent regeneration is necessary. In LLX-based processes, at leasttwo, though often even more, main columns are necessary for solvent regen-eration. Because the initial extraction of the feed with the solvent is not fullyselective towards the target solute, additional fractionation is required uponsolvent recovery, and due to solvent leaching, raffinate treatment is required.Different purification strategies have been described (and patented) to purifythe product streams and recover the solvent. For instance, Van de Graff etal.49 described a combination of two distillation columns after an extractionto recover all hydrocarbons from the solvent. A water wash is often applied toremove the leached solvent from the raffinate (aliphatic) stream. To preventsignificant solvent losses, this water is returned in the solvent regenerationcolumn, where evaporation of the water enhances the distillation efficiencydue to the (steam) stripping effect of the (low boiling) water.50–52 Though ithas been reported that water can also sometimes added into the extractioncolumn53, this was not done in this work.The exact amount of unit operations, being distillation or extraction columns
Towards Sustainable Solvent-Based Affinity Separations 224

10
10
10
10
10
10
10
10
10
10
PROCESS SIMULATION OF SOLVENT-BASED AFFINITY PROCESSES
Figure 10.1: The liquid-liquid extraction (LLX) process containing an initial LLX column,where the raffinate is washed in a water wash column. The extract is led to a first distillationcolumn to recover the co-extracted aliphatic compounds and lastly into a distillation columnwith an additional water inlet of the solvent containing water from the water wash column.The water that leaves over the top is decanted from the toluene product stream and recycledto the water wash column. Several heat exchangers and pumps are used to recover heat fromthe solvent recycle stream and adjust the pressure in the various equipment.
or decanter vessels, and the precise connections between all columns varyamong the patents/processes.45,49–52 The optimal configuration may not onlydepend on the solvent, but also the feed composition, feed throughput, utilitycosts and the surface availability at the plant. As our objective is to assess thepotential of Cyrene and compare it to Sulfolane, it is our main interest to makethe comparison as fair as possible. Therefore, for all processes, the processconfiguration was identical for both solvents. For LLX-based processes, theprocess configuration is shown in Figure 10.1. A process was chosen whereinthe solvent is washed from the raffinate with water, and the water containingthe solvent is returned to the solvent recovery (SR) column, where it is appliedas strip gas to strip the TOL from the solvent. Next to the SR column, in thefirst distillation column, the co-extracted MCH is distilled from the solvent,
225 Towards Sustainable Solvent-Based Affinity Separations

10
10
10
10
10
10
10
10
10
10
PROCESS SIMULATION OF SOLVENT-BASED AFFINITY PROCESSES
while TOL leaves that column in the bottom with the solvent. The distillatepurity of the first distillation column is not essential as this stream is returnedto the LLX column, but it should be considered because it affects the perfor-mance in the LLX process.
Figure 10.2: The extractive distillation (ED) process consisting of two distillation columns.The methylcyclohexane product is withdrawn from the process as the distillate of the firstcolumn, while the toluene product is withdrawn from the second column. Also, several heatexchangers and pumps are present to recover heat from the solvent recycle stream and toadjust the pressure in the various sections.
The second process, see Figure 10.2, is designed around an extractive distilla-tion (ED) column. Generally, for ED processes the main units are distillationcolumns. In the (first) ED column, the feed is introduced in the bottom sec-tion of the column, while the (high boiling) solvent is introduced in the topsection. The presence of the solvent elevates the relative volatility of the sat-urated hydrocarbon in the hydrocarbon mixture. In the second distillationcolumn, the solvent recovery (SR) column, the solvent is recovered from theentrained part of the feed. In practice, several heat exchangers, coolers andpumps may be added when pressure is changed between each of the columns.Besides or due to the solvent choice, adaptations have been patented such asa phase-splitter in the condenser of the SR column when using a highly polarsolvent which is not fully miscible with the aromatic compounds,54 and intro-ducing side-stream withdrawal and external reflux.55 However, for a proper
Towards Sustainable Solvent-Based Affinity Separations 226

10
10
10
10
10
10
10
10
10
10
PROCESS SIMULATION OF SOLVENT-BASED AFFINITY PROCESSES
comparison as aimed at in this work, a basic ED process scheme, as can beseen in Figure 10.2, has been applied.49,56
10.3 Process modeling and operational and capitalexpenditures
10.3.1 Equilibrium stage model
The processes described in the previous section were modeled using equilib-rium stage models to describe the vapor-liquid equilibria (VLE) and liquid-liquid equilibria (LLE). The process simulation is subjected to the MESH (Ma-terial, Equilibrium, Summation and Heat balance) equations to uphold theconservation laws which was performed using the software package AspenPlus® V10. This software package is a common tool to solve both Liquid-Liquid Extraction (LLX) process57–59 and Extractive Distillation (ED) pro-cess.60,61 The RadFrac model was applied in all (extractive) distillation col-umns and the rigorous counter-current extraction column was used in com-bination with the inside-outside approach of Boston and Britt for the liquid-liquid extraction columns.62 All pumps were simulated with a distinct dis-charge pressure of either 1 bar or 0.08 bar dependent on the location in theprocess. For heat integration, heat-exchangers were modeled with the Shelland Tube model and a logarithmic temperature difference of 10 K was as-sumed between the hot outlet- and cold inlet stream.63
10.3.2 Thermodynamics and experimental data acquisition
Accurate descriptions of VLE are essential in the simulation of each distilla-tion operation, and in the simulations, the modified Raoult’s law was used tohandle non-ideal behavior. The pure component vapor pressure regressionsof TOL, MCH, water and Sulfolane were used from the Aspen Plus® databank,while the recent vapor pressure data of Cyrene,64 see Figure 10.3, was man-ually added and regressed following the Antoine equation. In Table 10.1, theAntoine coefficients of all compounds are tabled. The boiling point of Cyreneis lower than of Sulfolane, which are respectively at 1 bar 226°C and 285°C.
227 Towards Sustainable Solvent-Based Affinity Separations

10
10
10
10
10
10
10
10
10
10
PROCESS SIMULATION OF SOLVENT-BASED AFFINITY PROCESSES
Figure 10.3: The Antoine coefficient correlation of Cyrene from experimental data obtainedfrom Baird et al.64
Table 10.1: Antoine parameters, P (bar) = exp(A− B
T (K)+C
), of Cyrene, Sulfolane, toluene,
methylcyclohexane (MCH) and water.
A B CCyrene 8.029 3407.318 -97.7166Sulfolane 9.904 4767.089 -75.9420Toluene 9.948 3455.379 -36.3863MCH 9.346 3068.515 -45.1859Water 11.866 3933.389 -41.3592
Additional parameters, such as the density, heat capacity and enthalpy of va-porization of MCH, TOL, Sulfolane and water were taken from the AspenPlus® databank, while the density and enthalpy of vaporization of Cyrenewere manually added to the simulator.64,67 No isobaric heat capacity (Cp) ofCyrene could be found in literature, hence it was estimated using the Jobackmethodology which gave a Cp of 1.86 J · g−1 ·mol−1 at 303.15K, which is com-parable, though 23% higher than the Cp of Sulfolane being 1.51 J ·g−1 ·mol−1 at303.15K.68 Via the Joback methodology the Cp of Sulfolane was determinedto be 0.97 J · g−1 ·mol−1 at 303.15K, which deviates strongly from the exper-imental value. Therefore, experimental determination of the Cp of Cyreneshould be done.
Towards Sustainable Solvent-Based Affinity Separations 228

10
10
10
10
10
10
10
10
10
10
PROCESS SIMULATION OF SOLVENT-BASED AFFINITY PROCESSES
10.3.2.1 LLE and VLE with Sulfolane
The aim of using thermodynamic models is to most accurately describe allequilibria. This could be realized by using either the Non-Random Two-Liquid (NRTL) model65 or the UNIQUAC model.66 Either model can be cho-sen, as they do no outperform each other, and can correlate VLE and LLE equi-libria accurately if fitted appropriately. The ternary VLE MCH-TOL-Sulfolanewere simulated with NRTL using binary interaction parameters (BIPs) presentin the Aspen Plus® databank, see Figure 10.4 and Table 10.2.
Figure 10.4: The (left) XY-diagram and (right) TXY-diagram of the (quasi)-binary VLE di-agram of MCH-TOL and Sulfolane with a solvent to feed ratio of 1 on mass basis7, includinga NRTL fit of which the results are located in Table 10.2
Table 10.2: Correlated (or applied) NRTL parameter for the MCH-toluene-Sulfolane VLEsystem. Additional, interaction parameters with water are additionally given.
Comp. i Comp. j Aij Aji Bij Bji Cij Originated from:
MCHToluene 0 0 -43.24 134.1 0.3 APV100- VLE-IG
Sulfolane-3.473 -1.702 2487 1270 0.28 NISTV100 NIST-RK
Toluene 1.398 -0.331 71.41 223.1 0.3 APV100- VLE-IGMCH
Water-9.473 9.765 4601 340.6 0.2 APV100 LLE-ASPEN
Toluene -7.236 3.988 4292 996.7 0.2 APV100 VLE-IGSulfolane 0 0 333.4 432.7 0.6 APV100 VLE-IG
For the description of ternary LLE of MCH-TOL-Sulfolane, the second set ofNRTL (NRTL-2) BIPs was required. In absence of literature data, the BIPs be-
229 Towards Sustainable Solvent-Based Affinity Separations

10
10
10
10
10
10
10
10
10
10
PROCESS SIMULATION OF SOLVENT-BASED AFFINITY PROCESSES
tween MCH and Sulfolane required additional experimental LLE to be fitted,see Figure 10.5 and Table 10.3. The experimental and analytical proceduresare present in section 12.6.
Figure 10.5: The ternary diagram of the LLE of TOL, MCH and Sulfolane with the ex-tract phase (open) and raffinate phase (closed), and (right) the TOL, MCH of Sulfolane at298.15K. The NRTL-2 parameters are located in Table 10.3.
Table 10.3: Correlated (or applied) NRTL-2 parameter for the MCH-TOL-Sulfolane LLEsystem
Comp i Comp j Aij Aji Bij Bji Cij Originated from:
MCHToluene 0,532 -0,839 208,1 29,705 0,1 NISTV100 NIST-RK
Sulfolane-3,473 -1,703 2487 1270 0,22 Fitted
Toluene 1,398 -0,331 71,408 223,1 0,3 APV100 VLE-IGMCH
Water-9.473 9.765 4601 340.6 0.2 APV110 LLE-ASPEN
Toluene -7.236 3.988 4292 996.7 0.2 APV110 VLE-IGSulfolane 0 0 333.4 432.7 0.6 APV110 VLE-IG
10.3.2.2 LLE and VLE with Cyrene
The ternary VLE of MCH-TOL-Cyrene was also fitted to experimental datapublished by Brouwer et al.7, see Figure 10.6, and simulated with NRTL usingBIPs, while the BIPs of MCH-TOL were used from the Aspen Plus® databank.
Towards Sustainable Solvent-Based Affinity Separations 230

10
10
10
10
10
10
10
10
10
10
PROCESS SIMULATION OF SOLVENT-BASED AFFINITY PROCESSES
The BIPs of MCH-Cyrene and TOL-Cyrene were fitted to the ternary VLE, seeTable 10.4.
Figure 10.6: The (left) XY-diagram and (right) TXY-diagram of the (quasi)-binary VLEdiagram of MCH-TOL and Cyrene with a solvent to feed ratio of 1 on mass basis,7 includinga NRTL fit of which the results are located in Table 10.4.
Table 10.4: Correlated NRTL parameters for the MCH-TOL-Cyrene system. Additionally,the applied interaction parameters with water are presented.
Comp. i Comp. j Aij Aji Bij Bji Cij Originated from:
MCHToluene 0 0 48,7154 48,9226 0,3 APV100- VLE-Lit
Cyrene-4,2301 18,6081 2158,53 -6064,12 0,3 Fitted
Toluene 33,2804 -7,00837 -10000 1631,93 0,1 FittedMCH
Water-9,473 9,7648 4601,1 340,627 0,2 APV100 LLE-ASPEN
TOL -7,2357 3,9884 4292,44 996,703 0,2 APV100 VLE-IGCyrene 0 0 -459,44 1534,23 0,3 UNIFAC Prediction
The UNIQUAC description of the ternary LLE of MCH-TOL-Cyrene, seen inFigure 10.7, was published by Brouwer et al.8 and the UNIQUAC correlationsare seen in Table 10.5. Additionally, the applied interaction parameters withwater are presented.
231 Towards Sustainable Solvent-Based Affinity Separations

10
10
10
10
10
10
10
10
10
10
PROCESS SIMULATION OF SOLVENT-BASED AFFINITY PROCESSES
Figure 10.7: (left) The ternary diagram of the LLE of TOL, MCH and Cyrene with theextract phase (open) and raffinate phase (closed), and (right) the TOL,MCH of Cyrene at298.15K, 323.15K and 348.15K. (reproduced with permission from Brouwer et al.8). TheUNIQUAC fit parameters are located in Table 10.5.
Table 10.5: Correlated (or applied) UNIQUAC parameter for the MCH-TOL-Cyrene system.Additional, interaction parameters with water are additionally given.
Comp. i Comp. j Aij Aji Bij Bji Originated from:
MCHToluene 0 0 -191,0 171,5 8
Cyrene4,587 -2,627 -1749 773,7 8
Toluene 2,708 -4,999 -772,6 1463 8
MCHWater
0 0 -1208 -534,02 APV100 LLE-LITTOL 0 0 -950,6 -350,21 APV100 LLE-LITCyrene 0 0 578,867 -1627,09 UNIFAC Prediction
10.3.3 Model input
Both processes, either with Cyrene or Sulfolane, were simulated with a feed of100 metric tons per hour, while the TOL molar fraction was varied between 10and 80 mol.% at a room temperature of 293.15K. The product specificationsof MCH and TOL were both set at 99.85 wt.% which coincides with the in-dustrial aromatics specifications.69 The countercurrent liquid-liquid extrac-tion column and the extractive distillation column were kept at 1 bar, whilethe additional recovery columns are at 0.08 bar. These pressures were chosenaccording to rigorous simulations of Qin et al.70, and enable significant heat
Towards Sustainable Solvent-Based Affinity Separations 232

10
10
10
10
10
10
10
10
10
10
PROCESS SIMULATION OF SOLVENT-BASED AFFINITY PROCESSES
integration between the various columns. Thermal instabilities of Sulfolaneand Cyrene are not present.7
10.3.4 OPEX , CAPEX and TAC
Economic estimation of all processes was performed by assessing the opera-tional expenditures (OPEX), the capital expenditures (CAPEX) and the totalannual costs (TAC). The energy requirements of each process were providedby the Aspen Plus® simulations, and a yearly operating time of 8400 hoursper year was used.71 The costs of various utilities are shown in Table 10.6.Any costs associated with specific locations were not taken into consideration.
Table 10.6: The specifications of used utilities and the associated costs.
Utility CostsChilled cooling water 72 4.50 AC / GJ
Medium pressure steam 72 11.34 AC / GJElectricity 73 18.97 AC / GJ
Sulfolane bulk price 74 2.55 AC / kgCyrene bulk price 75 2.00 AC / kg
*Conversion from $ to AC of 0.84976 of the 20th of October 2020 was used**The bulk price of Sulfolane may vary between 2500 – 3500 $/ton, 3000 $/ton was used. 74
The CAPEX was estimated using the Aspen Plus ® Process Economic Analyzer(APEA), which includes a sizing tool for distillation columns and standardoverall heat transfer coefficients. No further investigations were done on thetype of construction materials. APEA is not able to size extraction columns.Cost estimation of the extraction columns was therefore done by taking a con-ventional distillation column without reboiler and condenser and analyzingthe costs for different capacities and number of stages. It was stated by Pe-ters et al.76 that the cost for extraction columns can be obtained by using theassumption that the stages for the extraction column have the same spacingas in a distillation column. This was confirmed by a literature comparison,where the tray spacing of a distillation column is 0.305-0.915m76 and for arotating disk contactor is 0.6096-1.2192m.63 A value of 0.6096m is also usedin the Aspen Plus® simulations for a distillation column. With this method,
233 Towards Sustainable Solvent-Based Affinity Separations

10
10
10
10
10
10
10
10
10
10
PROCESS SIMULATION OF SOLVENT-BASED AFFINITY PROCESSES
the cost estimation of the extraction columns could be made, see section 12.7for the cost correlation. The solvent costs were determined by adding up thesolvent content of each product stream and combining it with the bulk pricesshown in Table 10.6.The economic analysis is finalized by the Total Annual Costs (TAC), whereboth the CAPEX as OPEX have been evaluated using Equation 10.1,
TACACyr
=OPEX +CAPEXPBP
(10.1)
where a payback period (PBP) of 3 years is applied.77–79
10.4 Results
To explain the interpretation of the simulation results, in the first two follow-ing sub-sections the LLX and ED processes with both solvents are elaboratedfor a feed containing 40 mol.% TOL. All other simulations with variations inthe feed composition were done similarly. First (section 10.4.1) the LLX pro-cess will be discussed, where the effect of the solvent-to-feed ratio, the water-to-extract ratio, the number of extraction stages, the effect of reflux ratios inthe recovery columns and the (water) feed location are shown. The OPEX ofthe optimized configuration is shown in section 10.4.1.1. Secondly (section10.4.2), a similar assessment was done for ED process, where the solvent-to-feed ratio, the reflux ratios, the (solvent) feed location and the OPEX (10.4.2.1)were assessed. In section 10.4.3, the TAC (and all OPEX) is calculated andcompared for all processes with a 10 to 80 mol. %, aromatic content range.
10.4.1 Liquid-Liquid Extraction Process
The LLX process includes two extraction operations, namely the main LLXcolumn where the aromatic compound is extracted from the hydrocarbonfeed, and the washing step where the leached solvent is washed from the raf-finate stream. Firstly, the influence of the solvent-to-feed (SF) ratio in the LLXcolumn and the number of equilibrium stages are assessed in Figure 10.8a. Inthe LLX column, the TOL impurity should be low enough to realize the MCHproduct specification. It can be seen that both the SF ratio and the number ofequilibrium trays affect the TOL impurity (maximum of 1.5·10−3 mol.%), and
Towards Sustainable Solvent-Based Affinity Separations 234

10
10
10
10
10
10
10
10
10
10
PROCESS SIMULATION OF SOLVENT-BASED AFFINITY PROCESSES
with only 5 equilibrium stages, it is not possible to reach the allowed maxi-mum TOL impurity within the simulated SF range for the Sulfolane process,though with a SF range higher than 3, it is possible for the Cyrene processand even higher SF ranges based on the observed trend, is expected also forthe Sulfolane process. It can be seen that less amount of Cyrene is requiredcompared to Sulfolane, which is due to the larger aromatic capacity of Cyrene.The amount of solvent can be reduced by increasing the number of equilib-rium stages, and this will also affect the first distillation column where theco-extracted MCH needs to be distilled. In any case, a certain amount of sol-vent is leached into the raffinate stream, which is easily recovered by the washcolumn, as both Sulfolane and Cyrene as fully miscible in water in contraryto MCH which is highly immiscible with water.
Figure 10.8: The effect of (a) the solvent-to-feed (molar) ratio of the liquid-liquid extraction(LLX) column and (b) the water-to-feed ratio in the wash column located after the LLXcolumn with a SF ratio of 3.5 and with a 40 mol.% aromatic feed and Sulfolane or Cyreneas solvent.
The WF ratio directly affects the second distillation column, as this (contam-inated) water is reused as a stripping agent.40,80 The solvent-contaminatedwater from the water wash is sent to the 2nd distillation column, where itevaporates to steam and strips the TOL from the solvent. This allows an ef-ficient separation, and the water can be collected via a phase separation stepafter the condenser. As can be seen in Figure 10.8b, the amount of water used
235 Towards Sustainable Solvent-Based Affinity Separations

10
10
10
10
10
10
10
10
10
10
PROCESS SIMULATION OF SOLVENT-BASED AFFINITY PROCESSES
in the wash column also directly impacts the second recovery column, wherethe aromatic compounds are stripped with steam. It can be seen that only asmall amount of water is required in the wash column to remove the leachedSulfolane or Cyrene, which is in accordance with the findings of Lee et al.80
and Wang et al.40 who determined that at least respectively 1 wt.% and 0.89-1.1 wt. % of water in Sulfolane was required for adequate stripping of thearomatic compounds.
Figure 10.9: The effect of (a) the reflux ratio of the first distillation column and (b) the effectof the feed stage with a 40 mol.% aromatic feed using Sulfolane or Cyrene as solvent (SFratio of 3.5). The column was operated at 0.08 bar.
The influence of the process conditions to remove the co-extracted MCH inthe first distillation column was investigated. In Figure 10.9, the impact ofvariation of the reflux ratio and the location of the feed stage in the first dis-tillation column (keeping a SF ratio of 3.5) are displayed. From Figure 10.9a,it is clear that in the simulations with six stages the MCH impurity specs arenever met, and more stages are needed. With eight stages it appears possiblefor both solvents, although in the plotted area for Sulfolane the spec is justnot met at R = 0.30. An important conclusion from this figure is that the pu-rity in the bottom stream is largely independent of the reflux ratio, which isindicative of the small amount of co-extracted MCH (and some TOL) whichis distilled over the top. In Figure 10.9b, it can be seen that the feed location
Towards Sustainable Solvent-Based Affinity Separations 236

10
10
10
10
10
10
10
10
10
10
PROCESS SIMULATION OF SOLVENT-BASED AFFINITY PROCESSES
has a significant influence on the MCH impurity in the bottom streams. Thefeed should be near the top of the column, this allows sufficient MCH removal.
Figure 10.10: The effect of (a) the reflux ratio of the second distillation column and (b) thelocation of the stripping water with a 40 mol.% aromatic feed (traces of MCH remain fromthe first column) using Sulfolane or Cyrene as solvent (SF ratio of 3.5, reflux ratio of 1.5,WE ratio of 0.5). The toluene concentration is given after the phase separation of water. Thecolumn was operated at 0.08 bar.
Also, the impact of the reflux ratio and the water feed stage on the perfor-mance in the second distillation column was studied. In Figure 10.10a, it canbe seen that Sulfolane requires a lower minimum reflux ratio than Cyrene,which is a consequence of the lower volatility of Sulfolane. Secondly, in Fig-ure 10.10b, the optimal feed location of the stripping water is not very strict,although the stripping water should not be introduced near the top or bot-tom of the column as this would diminish the TOL purity below specification.Near the bottom, the temperature is significantly higher and causes the waterto be mostly in the vapor phase which diminishes its repulsive interactionstowards the hydrocarbons in the liquid phase. Also, it can be seen that only6 equilibrium stages are inadequate when using Cyrene as a solvent. Even-tually, the amount of water is kept as low as possible without compromisingthe stripping ability. This is required as the energy penalty of evaporating thewater needs to be minimized.
237 Towards Sustainable Solvent-Based Affinity Separations

10
10
10
10
10
10
10
10
10
10
PROCESS SIMULATION OF SOLVENT-BASED AFFINITY PROCESSES
In the case of 8 equilibrium stages, the vapor concentration profiles in bothdistillation columns are presented for both solvents are shown in Figure 10.11.The recycling back to the LLX column of the co-extracted MCH as distillate isseen in Figure 10.11a and 10.11b, which simultaneously purifies the bottomfraction containing afterward solely TOL and solvent.
Figure 10.11: (a) The first distillation column with of the Cyrene-based LLX-process (feed:15 mol.% MCH, 15 mol.% TOL, 70 mol.% Cyrene, SF ratio of 2.5, reflux ratio of 0.1), (b)the first distillation column with of the Sulfolane-based LLX-process (feed: 4.1 mol.% MCH,13 mol.% TOL, 82 mol.% Sulfolane, SF ratio of 3.25, reflux ratio of 0.62), (c) the seconddistillation column of the Cyrene-based LLX-process (feed: trace MCH, 14 mol.% TOL, 86mol.% Cyrene, SF ratio of 2.5, reflux ratio of 1.4, 2.7 mol.% (0.39 wt.%) water relativeto Cyrene, stripping water contains 9.0 mol. % Cyrene) (d) the second distillation columnof the Sulfolane-based LLX-process (feed: trace MCH, 11 mol.% TOL, 89 mol.% Sulfolane,SF ratio of 3.25, reflux ratio of 0.7, 3.7 mol.% (0.55 wt. %) water relative to Sulfolane,stripping water contains 0.9 mol. % Sulfolane).
Towards Sustainable Solvent-Based Affinity Separations 238

10
10
10
10
10
10
10
10
10
10
PROCESS SIMULATION OF SOLVENT-BASED AFFINITY PROCESSES
This first distillation column operates at a temperature in which the solventlargely remains liquid. The distillate contains a fraction of TOL, a conse-quence of a low reflux ratio, which minimized the reboiler duty and is of noconsequence for the process as the distillate is returned to the LLX columnwhere the TOL is again extracted to the solvent phase. The TOL fraction inthe Sulfolane-based process is much higher, which is required to lower theimpact of the pinch-point at higher MCH fractions. Cyrene-based processesdo not have this problem and allow for a higher MCH purity as a top product.
In Figure 10.11c and 10.11d, the concentration profiles are plotted for thesecond distillation column for Cyrene and Sulfolane, respectively. The addi-tion of the stripping water (vapor) is seen through the concentration profileof water in the vapor phase. This stripping water is contaminated with theleached solvent from the LLX raffinate stream. The water strips the TOL fromthe solvent and a distillate containing water and TOL which are separated viaa phase splitter in the condenser. Although the molar fraction of water inthe vapor phase is considerable, it is still comparatively a small weight frac-tion. A comparable amount of steam is introduced in the SR columns of bothprocesses, and due to the higher temperature in the Sulfolane-based process,a larger molar vapor fraction of water is observed. A high solvent purity isrequired at the bottom as this is returned to the LLX column and unwantedsolute recycling is prevented. Although water in the solvent recycle-stream isnot necessarily detrimental for the process, the water fraction in the bottomstage of the SR column is low, due to the much lower boiling point of watercompared to either solvent.
10.4.1.1 OPEX
In Figure 10.12, the OPEX of all LLX processes is shown. A distinction ismade between costs associated with heating, cooling, electrical duty and sol-vent losses. Overall, the OPEX of the Cyrene-based LLX process is signifi-cantly higher than a Sulfolane-based LLX process. This is due to primarily thelower selectivity towards TOL, which causes additional load on the first dis-tillation column which recovers the co-extracted MCH and the boiling pointof Cyrene is lower than Sulfolane, which causes higher reflux requirements
239 Towards Sustainable Solvent-Based Affinity Separations

10
10
10
10
10
10
10
10
10
10
PROCESS SIMULATION OF SOLVENT-BASED AFFINITY PROCESSES
in the recovery column. Nevertheless, less Cyrene is required than Sulfolane(due to a larger capacity towards TOL) to extract all TOL. The larger capacityalso causes a larger miscibility region of Cyrene with the TOL/MCH mixtureand a limited operation region up to 40 mol.% of TOL in the feed is thereforeonly possible as higher aromatic concentrations will not cause a phase splitwhich makes LLX impossible. A clear trend is observed regarding the OPEXof the Sulfolane-based LLX process with a decreasing OPEX from 80 mol %to 50 mol % TOL in the feed, the costs reach a minimum of around 50 mol% of toluene in the feed, and stay very similar to 20 mol %, under which itincreases again. This is due to the fact the distillation costs within the processare equally distributed between both distillation columns. At lower aromaticfractions, the load is placed more on the first distillation column whereas ata higher aromatic fraction the load is shifted towards the aromatic productrecovery from the solvent in the second distillation column.
Figure 10.12: Operating costs (OPEX) of the LLX processes with a range of aromatic con-tents in the feed. For (a) the Cyrene and (b) the Sulfolane case.
10.4.2 Extractive Distillation Process
The extractive distillation (ED) process is simpler than the LLX process, asthere are only two main distillation columns. In the first distillation column,
Towards Sustainable Solvent-Based Affinity Separations 240

10
10
10
10
10
10
10
10
10
10
PROCESS SIMULATION OF SOLVENT-BASED AFFINITY PROCESSES
or the Extractive Distillation (ED) column, the MCH is separated from theTOL/solvent mixture, here the key parameters are the MCH impurity in thebottom stream and the MCH purity in the top stream. As can be seen in Fig-ure 10.13, an increasing number of equilibrium stages allows for a deeperremoval of MCH, thereby lowering the MCH impurity in the bottom streamwith less solvent to achieve the maximum allowed MCH impurity in the bot-tom stream. Cyrene is seen to require less solvent to obtain the desired MCHpurity than Sulfolane, due to the lack of pinch-point in the ternary VLE be-havior of Cyrene-TOL-MCH.7
Figure 10.13: The effect of the solvent-to-feed (molar) ratio in the (first) extractive distilla-tion (ED) column on the (a) MCH purity in the top stream and (b) the MCH impurity inthe bottom stream with a 40 mol.% aromatic feed using Sulfolane or Cyrene as solvent anda reflux ratio of 2.0.
It can be seen in Figure 10.14, that a lower reflux ratio can be used in the Sul-folane system compared to the Cyrene system, though this is a consequenceof the higher SF ratio used for the Sulfolane system. The SF ratio and refluxratio in the Cyrene system appears to have a much smaller effect comparedto the Sulfolane system. This is likely due to the fact a higher SF ratio in theSulfolane system strongly affects the severity of the pinch-point, which is notoccurring in the Cyrene system. In general, the MCH purity specification isobtained, and the MCH impurity in the bottom stream is the key parameter
241 Towards Sustainable Solvent-Based Affinity Separations

10
10
10
10
10
10
10
10
10
10
PROCESS SIMULATION OF SOLVENT-BASED AFFINITY PROCESSES
to consider, as this directly influences the toluene purity in the second distil-lation column.
Figure 10.14: The effect of the reflux ratio in the (first) extractive distillation (ED) columnon the (a) MCH purity in the top stream and (b) the MCH impurity in the bottom streamwith a 40 mol.% aromatic feed using Sulfolane or Cyrene as solvent and resp. a Solvent-to-Feed ratio of 5.0 and 2.0.
In Figure 10.15, the effect of the feed location of the hydrocarbon stream inthe ED column is assessed. Overall, the hydrocarbon feed should not be in-troduced close to the top as it reduces the rectifying ability and both solventsrequire the feed location to be introduced at least lower than the 15th stage.This is necessary to not only obtain a MCH product purity, but also to allowsufficient removal of the MCH from the bottom stream. An introduction ofthe hydrocarbon too low in the column will result in insufficient removal ofthe MCH from the bottom stream, which consequently will result in an in-ability to purity the toluene product in the subsequent column.
Besides the hydrocarbon feed location, also the location at which the solventis introduced in the ED column is essential. The effect of this location is seenin Figure 10.16. Similar trends are observed as seen in Figure 10.15, hence theintroduction of the solvent too high up to column will reduce the MCH purityin the top below specification. While adding the solvent too low in
Towards Sustainable Solvent-Based Affinity Separations 242

10
10
10
10
10
10
10
10
10
10
PROCESS SIMULATION OF SOLVENT-BASED AFFINITY PROCESSES
Figure 10.15: The effect of the feed location in the (first) extractive distillation (ED) col-umn on the (a) MCH purity in the top stream and (b) the MCH impurity in the bottomstream with a 40 mol.% aromatic feed using Sulfolane or Cyrene as solvent and respectivelya Solvent-to-Feed ratio of 5.0 and 2.0 and respectively a reflux ratio of 0.5 and 1.0.
Figure 10.16: The effect of the solvent feed location in the (first) extractive distillation (ED)column on the (a) MCH purity in the top stream and (b) the MCH impurity in the bottomstream with a 40 mol.% aromatic feed using Sulfolane or Cyrene as solvent and respectivelya Solvent-to-Feed ratio of 5.0 and 2.0 and respectively a reflux ratio of 0.5 and 1.0.
243 Towards Sustainable Solvent-Based Affinity Separations

10
10
10
10
10
10
10
10
10
10
PROCESS SIMULATION OF SOLVENT-BASED AFFINITY PROCESSES
the column will result in insufficient MCH removal from the bottom streamand again adversely affect the possible TOL purity in the subsequent recov-ery column. Sulfolane can be introduced higher up in the column due to thelower vapor pressure, while Cyrene can be introduced lower in the columnas it evaporates more easily and therefore less likely to be withdrawn in thebottom stream.
Figure 10.17: (a) The effect of the reflux ratio and (b) the feed location in the solvent recovery(SR) column on the TOL purity in the top stream with a 40 mol.% aromatic feed usingSulfolane or Cyrene as solvent and respectively a Solvent-to-Feed ratio of 5.0 and 2.0 and in(b) a reflux ratio of 1.5.
In the (second) distillation column or solvent recovery (SR) column, the TOLpurity is the key parameter. In Figure 10.17a, the minimum reflux ratio can beseen to be slightly dependent on the number of equilibrium stages, indicatingthat the relative volatility of the solvent is much lower than that of the hy-drocarbons. Also, fewer equilibrium stages are required compared to the EDcolumn. Again indicating that the separation in the SR column is less diffi-cult, which was expected based on the much larger relative volatility betweensolvent and TOL than between TOL and MCH. It can be seen that the Cyrene-based ED process requires more equilibrium stages and a larger reflux ratioin the SR column. This is due to the higher volatility of the Cyrene comparedto Sulfolane. In Figure 10.17b, it can be seen that the feed location follows
Towards Sustainable Solvent-Based Affinity Separations 244

10
10
10
10
10
10
10
10
10
10
PROCESS SIMULATION OF SOLVENT-BASED AFFINITY PROCESSES
the same trends as seen before. A feed entrance too high up the column re-duces the TOL purity and may even be insufficient to achieve the requiredspecification.
Figure 10.18: (a) The (first) extractive distillation column with of the Cyrene-based ED-process (feed: 60 mol.% MCH, 40 mol.% TOL, a SF ratio of 1.6, reflux ratio of 0.27), (b)the (first) extractive distillation column with of the Sulfolane-based ED-process (feed: 60mol.% MCH, 40 mol.% TOL, SF ratio of 3.5, reflux ratio of 1.6), (c) the (second) distillationcolumn of the Cyrene-based ED-process (feed: trace MCH, 20 mol.% TOL, 80 mol.% Cyrene,reflux ratio of 0.78) and (d) the (second) distillation column of the Sulfolane-based ED-process (feed: trace MCH, 10 mol.% TOL, 90 mol.% Sulfolane, reflux ratio of 0.8).
Overall, an interplay between sufficient solvent to allow an efficient MCH sep-aration in the ED column and a minimization of the energy penalty in the SRcolumn is required. In Figure 10.18, an example of the concentration profilesin each column is seen. In the ED column, it is seen that the heavy boilingsolvent, which is added in the top section of the ED column, is remaining
245 Towards Sustainable Solvent-Based Affinity Separations

10
10
10
10
10
10
10
10
10
10
PROCESS SIMULATION OF SOLVENT-BASED AFFINITY PROCESSES
in the liquid phase, while the top product reaches the targeted MCH purity.The vapor-liquid equilibrium of MCH and TOL with Sulfolane present hasa pinch point hence more equilibrium trays are required to obtain the MCHspecification. In the SR column, TOL is distilled from the solvent without anystripping water. Also in this process, the purity of the recycled solvent is highto prevent unwanted solute recycling.
10.4.2.1 OPEX
In Figure 10.19, the OPEX of all ED processes is shown. Also, in this case, adistinction is made between costs associated with heating, cooling, electricalduty and solvent losses. As can be seen, both Cyrene-based and Sulfolane-based processes operate at a minimum OPEX around an equimolar MCH/TOLfeed mixture. This minimum was also seen in the LLX-based process, and isagain due to the load is being shared equally in this case between both dis-tillation columns. Also, the operation window of the Cyrene-based processis larger, as it includes TOL feed composition of 10 mol.%., due to the largermiscibility region of Cyrene compared to Sulfolane.
Figure 10.19: Operating costs (OPEX) of the LLX processes with a range of aromatic con-tents in the feed. For (a) the Cyrene and (b) the Sulfolane case.
The larger miscibility was detrimental in the LLX-process, but is an advantage
Towards Sustainable Solvent-Based Affinity Separations 246
10
10
10
10
10
10
10
10
10
10
PROCESS SIMULATION OF SOLVENT-BASED AFFINITY PROCESSES
in this process as it is not limited by liquid-liquid phase split at lower TOLconcentrations. In the Cyrene-based and Sulfolane-based ED processes, theOPEX increases at higher (>50 mol.%) TOL concentration and low concentra-tion (<50 mol.%). Increasing the amount of MCH present, upturns the loadon the ED columns, as higher refluxes are required to obtain the required tar-get purity of MCH. Increasing the amount of TOL, increases the load on theSR column, as more TOL needs to be stripped from the solvent which alsorequired higher reflux ratios. A small amount of solvent is lost in the productstreams. Further optimization can be done to minimize these losses. Over-all comparing both processes, a similar trend can be recognized in the OPEX,although a lower OPEX is seen for the Cyrene-based process, which is a com-bined result from the lower temperatures required in both columns and theabsence of the detrimental pinch point present only in the ternary Sulfolane-MCH-TOL mixture.
10.4.3 Total Annual Cost (TAC) Comparison
In this comparison of the costs related to the entire process, both the OPEXand the CAPEX are taken into consideration in the TAC. A detailed equip-ment list and associated costs for each process can be seen in (appendix) tablesS1 to S4 in the ESI. The CAPEX differences between the Cyrene-based LLX-process (3.11 – 4.67 MAC/yr or 3.70 – 5.56 AC/tonf eed/yr) and Sulfolane-basedLLX-process (1.56 – 2.27 MAC/yr or 1.85 – 2.70 AC/tonf eed/yr) are significant.Cyrene exhibits unfavorable miscibility which increases the solvent volume.The CAPEX differences between the Cyrene-based ED-process (1.41 – 2.25MAC/yr or 1.68 – 2.68 AC/tonf eed/yr) and Sulfolane-based ED-process (1.58 –2.68 MAC/yr or 1.88 – 3.19 AC/tonf eed/yr) are not very large, although presentdue to a variance in equilibrium stages, in temperatures and solvent volume.
As can be seen in Figure 10.20 where all processes are compared, a Cyrene-based LLX-process is economically least attractive. The LLX process with Sul-folane and also the ED processes with both solvents are much more efficientand should be preferred. The same trend as described by Weissermel andArpe18 was observed, at the lower TOL feed concentrations for Sulfolane aLLX process is preferred over an ED process and can be seen by the lowest
247 Towards Sustainable Solvent-Based Affinity Separations

10
10
10
10
10
10
10
10
10
10
PROCESS SIMULATION OF SOLVENT-BASED AFFINITY PROCESSES
TAC of the Sulfolane-based LLX process at TOL feed concentrations of <30mol.%. If the performances of the Cyrene-based and Sulfolane-based ED pro-cesses are compared, it can be seen that the Cyrene-based ED process out-performs the Sulfolane-based ED process. This corresponds to the fact thatthe unfavorable pinch-point present in the Sulfolane-based processes are athigher MCH fractions. While the TAC difference between both processes di-minishes at higher TOL feed concentrations. This signifies the potential ofCyrene to replace Sulfolane as an entrainer in ED processes.
Figure 10.20: The TAC comparison of Cyrene-based LLX and ED processes and theSulfolane-based LLX and ED processes.
Reflecting these performances on actual feedstocks, the LLX process with Sul-folane is still preferred as many feedstocks have a low aromatic content, suchas 10-25% from an ethylene cracker12 and 9-14.3 vol. % in Arab crude oil.36
The possibility of a LLX-process using a mixture of Cyrene and Sulfolane mayhave potential, as Sulfolane upholds the phase-splitting, while Cyrene canpotentially lower the reboiler temperatures and remove the pinch-point. Al-ternative processes, for these low TOL feed concentrations, are IL-based pro-
Towards Sustainable Solvent-Based Affinity Separations 248

10
10
10
10
10
10
10
10
10
10
PROCESS SIMULATION OF SOLVENT-BASED AFFINITY PROCESSES
cesses, as described by Meindersma et al.12 After catalytic reforming, the aro-matic content can be elevated to typically 55 wt. %.81 In these situations, theCyrene-based ED process is seen be to the most efficient, again showing thepotential of Cyrene as this is a bio-based entrainer in an ED process.
10.5 Conclusion
The bio-based solvent dihydrolevoglucosenone commercialized as Cyrene,-which was already investigated for vapor-liquid7 and liquid-liquid equilib-ria8, was studied extensively as solvent in fluid separation processes for tolu-ene and methylcyclohexane at a process level. The liquid-liquid extraction(LLX)-based and extractive distillation (ED)-based processes with Cyrene werecompared to the bench-mark Sulfolane. Based on simulations of conceptualprocesses the total annual costs (TAC) have been calculated and compared forboth solvents and both LLX and ED. The Cyrene-based LLX process was eco-nomically least attractive due to the large miscibility region, while the Sulfo-lane-based LLX was most efficient if the toluene feed concentration was lowerthan 30 mol.%. For higher toluene feed concentration the Cyrene-based EDprocess is most efficient. Overall, this study showed the potential use of abio-based solvent, Cyrene, in economically competitive separation processesin the petroleum industry. A suggestion for further research is to investigatethe application of mixtures of Cyrene and Sulfolane, which can be of interest,as Sulfolane upholds the phase-splitting, while Cyrene can potentially lowerthe reboiler temperatures and remove the pinch-point.
249 Towards Sustainable Solvent-Based Affinity Separations

10
10
10
10
10
10
10
10
10
10
PROCESS SIMULATION OF SOLVENT-BASED AFFINITY PROCESSES
10.6 Nomenclature
AD = Azeotropic DistillationAPEA = Aspen Plus® process economic analyzerCAPEX = Capital expenditureCp = isobaric heat capacity (J · g−1 ·K−1)Cyrene = DihydrolevoglucosenoneDES = Deep eutectic solventED = Extractive distillationIL = Ionic liquidLLE = Liquid-liquid equilibriumLLX = Liquid-liquid extractionMCH = methylcyclohexaneNFM = N-formylmorpholineNMP = N-methylpyrrolidoneNRTL = Non-random two liquidOPEX = Operational expenditurePBP = Payback periodSF = Solvent-to-Feed ratio (mass ratio)SR = Solvent recoverySulfolane = Tetrahydrothiophene-1,1-dioxideTAC = Total annual costTOL = TolueneUNIQUAC = Universal quasichemicalVLE = Vapor-liquid equilibriumWF = Water-to-feed ratio (mass ratio)
10.7 References
[1] International Energy Agency, “World oil supply and demand, 1971-2019,” 2019.[2] International Energy Agency, “The future of petrochemicals,” 2018.[3] A. Dimitriadis and S. Bezergianni, “Hydrothermal liquefaction of various biomass and waste feedstocks
for biocrude production: A state of the art review,” Renewable and Sustainable Energy Reviews, vol. 68,pp. 113–125, 2017.
[4] S. Oudenhoven, R. J. M. Westerhof, N. Aldenkamp, D. W. F. Brilman, and S. R. Kersten, “Demineral-ization of wood using wood-derived acid: towards a selective pyrolysis process for fuel and chemicalsproduction,” Journal of analytical and applied pyrolysis, vol. 103, pp. 112–118, 2013.
Towards Sustainable Solvent-Based Affinity Separations 250

10
10
10
10
10
10
10
10
10
10
PROCESS SIMULATION OF SOLVENT-BASED AFFINITY PROCESSES
[5] R. J. Westerhof, D. W. F. Brilman, M. Garcia-Perez, Z. Wang, S. R. Oudenhoven, W. P. van Swaaij, and S. R.Kersten, “Fractional condensation of biomass pyrolysis vapors,” Energy & fuels, vol. 25, no. 4, pp. 1817–1829, 2011.
[6] X. Li, L. C. Luque-Moreno, S. R. Oudenhoven, L. Rehmann, S. R. Kersten, and B. Schuur, “Aromatics ex-traction from pyrolytic sugars using ionic liquid to enhance sugar fermentability,” Bioresource technology,vol. 216, pp. 12–18, 2016.
[7] T. Brouwer and B. Schuur, “Bio-based solvents as entrainers for extractive distillation in aro-matic/aliphatic and olefin/paraffin separation,” Green Chemistry, 2020.
[8] T. Brouwer and B. Schuur, “Dihydrolevoglucosenone (cyrene™), a bio-based solvent for liquid-liquid ex-traction applications,” ACS Sustainable Chemistry & Engineering, 2020.
[9] F. Abushwireb, H. Elakrami, and M. Emtir, “Recovery of aromatics from pyrolysis gasoline by con-ventional and energy-integrated extractive distillation,” Computer Aided Chemical Engineering, vol. 24,p. 1071, 2007.
[10] M. Blahušiak, A. A. Kiss, K. Babic, S. R. Kersten, G. Bargeman, and B. Schuur, “Insights into the selectionand design of fluid separation processes,” Separation and purification technology, vol. 194, pp. 301–318,2018.
[11] M. Sharma, P. Sharma, and J. N. Kim, “Solvent extraction of aromatic components from petroleum derivedfuels: a perspective review,” RSC advances, vol. 3, no. 26, pp. 10103–10126, 2013.
[12] G. W. Meindersma and A. B. de Haan, “Conceptual process design for aromatic/aliphatic separation withionic liquids,” chemical engineering research and design, vol. 86, no. 7, pp. 745–752, 2008.
[13] W. Meindersma, F. Onink, A. R. Hansmeier, and A. B. de Haan, “Long term pilot plant experience onaromatics extraction with ionic liquids,” Separation Science and Technology, vol. 47, no. 2, pp. 337–345,2012.
[14] F. Onink, C. Drumm, G. W. Meindersma, H.-J. Bart, and A. B. de Haan, “Hydrodynamic behavior anal-ysis of a rotating disc contactor for aromatics extraction with 4-methyl-butyl-pyridinium· bf4 by cfd,”Chemical Engineering Journal, vol. 160, no. 2, pp. 511–521, 2010.
[15] G. W. Meindersma, A. R. Hansmeier, and A. B. de Haan, “Ionic liquids for aromatics extraction. presentstatus and future outlook,” Industrial & Engineering Chemistry Research, vol. 49, no. 16, pp. 7530–7540,2010.
[16] P. Navarro, I. de Dios-García, M. Larriba, N. Delgado-Mellado, M. Ayuso, D. Moreno, J. Palomar, J. Gar-cía, and F. Rodríguez, “Dearomatization of pyrolysis gasoline by extractive distillation with 1-ethyl-3-methylimidazolium tricyanomethanide,” Fuel Processing Technology, vol. 195, p. 106156, 2019.
[17] Y. Zhang, Y. Wang, F. Chen, S. Liu, L. Zhao, J. Gao, T. Hao, and C. Xu, “Research on a dual solvent toseparate olefin/aromatic–sulfide from heavy fluid catalytic cracking naphtha,” Energy & Fuels, vol. 32,no. 3, pp. 4057–4064, 2018.
[18] K. Weissermel and H.-J. Arpe, Industrial organic chemistry. John Wiley & Sons, 2008.[19] S. Widagdo and W. D. Seider, “Journal review. azeotropic distillation,” AIChE Journal, vol. 42, no. 1,
pp. 96–130, 1996.[20] H. Matuschewski and U. Schedler, “Mse—modified membranes in organophilic pervaporation for aro-
matics/aliphatics separation,” Desalination, vol. 224, no. 1-3, pp. 124–131, 2008.[21] F. Pithan, C. Staudt-Bickel, S. Hess, and R. N. Lichtenthaler, “Polymeric membranes for aromatic/aliphatic
separation processes,” ChemPhysChem, vol. 3, no. 10, pp. 856–862, 2002.[22] R. M. Dessau, “Selective sorption of linear aliphatic compounds by zeolites,” May 14 1985. US Patent
4,517,402.[23] A. Takahashi, F. H. Yang, and R. T. Yang, “Aromatics/aliphatics separation by adsorption: New sorbents
for selective aromatics adsorption by π-complexation,” Industrial & engineering chemistry research, vol. 39,no. 10, pp. 3856–3867, 2000.
[24] M. Matsumoto, Y. Inomoto, and K. Kondo, “Selective separation of aromatic hydrocarbons through sup-ported liquid membranes based on ionic liquids,” Journal of Membrane Science, vol. 246, no. 1, pp. 77–81,2005.
[25] R. D. Partridge, D. G. Peiffer, D. C. Dalrymple, and W. Weissman, “Polymer membrane for separatingaromatic and aliphatic compounds,” Nov. 30 2010. US Patent 7,842,124.
[26] A. Arce, M. J. Earle, H. Rodríguez, and K. R. Seddon, “Separation of aromatic hydrocarbons from alkanes
251 Towards Sustainable Solvent-Based Affinity Separations

10
10
10
10
10
10
10
10
10
10
PROCESS SIMULATION OF SOLVENT-BASED AFFINITY PROCESSES
using the ionic liquid 1-ethyl-3-methylimidazolium bis (trifluoromethyl) sulfonyl amide,” Green Chem-istry, vol. 9, no. 1, pp. 70–74, 2007.
[27] A. Arce, M. J. Earle, H. Rodríguez, K. R. Seddon, and A. Soto, “1-ethyl-3-methylimidazolium bis(trifluoromethyl) sulfonyl amide as solvent for the separation of aromatic and aliphatic hydrocarbonsby liquid extraction–extension to c 7-and c 8-fractions,” Green Chemistry, vol. 10, no. 12, pp. 1294–1300,2008.
[28] G. W. Meindersma, A. J. Podt, and A. B. de Haan, “Ternary liquid–liquid equilibria for mixtures oftoluene+ n-heptane+ an ionic liquid,” Fluid phase equilibria, vol. 247, no. 1-2, pp. 158–168, 2006.
[29] M. K. Hadj-Kali, Z. Salleh, E. Ali, R. Khan, and M. A. Hashim, “Separation of aromatic and aliphatichydrocarbons using deep eutectic solvents: A critical review,” Fluid Phase Equilibria, vol. 448, pp. 152–167, 2017.
[30] S. Mulyono, H. F. Hizaddin, I. M. Alnashef, M. A. Hashim, A. H. Fakeeha, and M. K. Hadj-Kali, “Sepa-ration of btex aromatics from n-octane using a (tetrabutylammonium bromide+ sulfolane) deep eutecticsolvent–experiments and cosmo-rs prediction,” RSC Advances, vol. 4, no. 34, pp. 17597–17606, 2014.
[31] Y. Hou, Z. Li, S. Ren, and W. Wu, “Separation of toluene from toluene/alkane mixtures with phosphoniumsalt based deep eutectic solvents,” Fuel Processing Technology, vol. 135, pp. 99–104, 2015.
[32] N. R. Rodriguez, P. F. Requejo, and M. C. Kroon, “Aliphatic–aromatic separation using deep eutecticsolvents as extracting agents,” Industrial & Engineering Chemistry Research, vol. 54, no. 45, pp. 11404–11412, 2015.
[33] D. Smink, S. R. Kersten, and B. Schuur, “Recovery of lignin from deep eutectic solvents by liquid-liquidextraction,” Separation and purification technology, vol. 235, p. 116127, 2020.
[34] D. Smink, S. R. Kersten, and B. Schuur, “Comparing multistage liquid–liquid extraction with cold waterprecipitation for improvement of lignin recovery from deep eutectic solvents,” Separation and PurificationTechnology, vol. 252, p. 117395, 2020.
[35] F. Bezold and M. Minceva, “Liquid-liquid equilibria of n-heptane, methanol and deep eutectic solventscomposed of carboxylic acid and monocyclic terpenes,” Fluid Phase Equilibria, vol. 477, pp. 98–106, 2018.
[36] S. H. HAMID and M. A. ALI, “Comparative study of solvents for the extraction of aromatics from naph-tha,” Energy Sources, vol. 18, no. 1, pp. 65–84, 1996.
[37] A. R. Karim, P. Khanaqa, and D. A. Shukur, “Kurdistan crude oils as feedstock for production of aromat-ics,” Arabian Journal of Chemistry, vol. 10, pp. S2601–S2607, 2017.
[38] N. D. Ristic, M. R. Djokic, E. Delbeke, A. Gonzalez-Quiroga, C. V. Stevens, K. M. Van Geem, and G. B.Marin, “Compositional characterization of pyrolysis fuel oil from naphtha and vacuum gas oil,” Energy& Fuels, vol. 32, no. 2, pp. 1276–1286, 2018.
[39] S. Mirmiran, H. Pakdel, and C. Roy, “Characterization of used tire vacuum pyrolysis oil: nitrogenouscompounds from the naphtha fraction,” Journal of analytical and applied pyrolysis, vol. 22, no. 3, pp. 205–215, 1992.
[40] Q. Wang, J. Y. Chen, M. Pan, C. He, C. C. He, B. J. Zhang, and Q. L. Chen, “A new sulfolane aromaticextractive distillation process and optimization for better energy utilization,” Chemical Engineering andProcessing-Process Intensification, vol. 128, pp. 80–95, 2018.
[41] R. Krishna, “Extraction of aromatics from 63-69 naphtha fraction for food grade hexane productionusing sulpholane and nmp as solvents,” Indian Journal of Technology, vol. 25, pp. 602–606, 1987.
[42] J. Mahmoudi and M. N. Lotfollahi, “(liquid+ liquid) equilibria of (sulfolane+ benzene+ n-hexane),(n-formylmorpholine+ benzene+ n-hexane), and (sulfolane+ n-formylmorpholine+ benzene+ n-hexane) attemperatures ranging from (298.15 to 318.15) k: Experimental results and correlation,” The Journal ofChemical Thermodynamics, vol. 42, no. 4, pp. 466–471, 2010.
[43] E. Muller, B. Enkheim, and K. P. John, “Process of separating pure aromatic hydrocarbons from hydrocar-bon mixtures,” July 6 1971. US Patent 3,591,490.
[44] H. Zhu, X.-l. Shi, and W.-y. Zhou, “Process simulation and parameter optimization of separating aromaticsand non-aromatics by extractive distillation with n-formylmorpholine,” Journal of East China Universityof Science and Technology (Natural Science Edition), vol. 34, no. 3, pp. 309–31, 2008.
[45] S. Adolph, S. Martin, and K. K. Von, “Recovery of aromatic hydrocarbon by extractive distillation withanhydrous liquid propylene carbonate,” Jan. 4 1966. US Patent 3,227,632.
[46] A. B. S. Salem and E. Z. Hamad, “Liquid-liquid equilibrium of the five component system of n-hexane-
Towards Sustainable Solvent-Based Affinity Separations 252

10
10
10
10
10
10
10
10
10
10
PROCESS SIMULATION OF SOLVENT-BASED AFFINITY PROCESSES
n-heptane- toluene-o-xylene- propylene carbonate,” Fluid phase equilibria, vol. 108, no. 1-2, pp. 231–241,1995.
[47] G. Somekh and B. Friedlander, “Tetraethylene glycol—a superior solvent for aromatics extraction,” ACSPublications, 1970.
[48] G. Somekh, D. Kubek, and A. Kosseim, “Process for the separation of aromatic hydrocarbons from a mixedhydrocarbon feedstock,” Jan. 30 1973. US Patent 3,714,033.
[49] R. R. De Graff and M. W. Perga, “Method for aromatic hydrocarbon recovery,” Sept. 9 1969. US Patent3,466,346.
[50] H. L. Thompson, “Process for the extraction and recovery of aromatic hydrocarbons,” Dec. 1 1970. USPatent 3,544,453.
[51] R. D. Morin, J. B. Fishel, and A. E. Bearse, “Separation of aromatic hydrocarbons from non-aromatichydrocarbons utilizing a lactam-water solvent,” Apr. 19 1960. US Patent 2,933,448.
[52] E. A. Jones and D. B. Broughton, “Solvent extraction process for recovery of aromatic hydrocarbons,”Mar. 16 1965. US Patent 3,173,966.
[53] G. Preusser, M. Schulze, K. Richter, and W. Huwels, “Process for recovering highly pure aromatics from amixture of aromatics and non-aromatics,” Mar. 28 1978. US Patent 4,081,355.
[54] J. C. Gentry, L. Berg, J. C. McIntyre, and R. W. Wytcherley, “Process to recover benzene from mixedhydrocarbons by extractive distillation,” Mar. 21 1995. US Patent 5,399,244.
[55] T. D. Funkhouser, “Method of purifying unsaturated hydrocarbons by extractive distillation with sidestream removal and solvent mix,” Aug. 1 1972. US Patent 3,681,202.
[56] B. Cline, “Extractive distillation of aromatic compounds,” Apr. 25 1961. US Patent 2,981,661.[57] M. Larriba, J. de Riva, P. Navarro, D. Moreno, N. Delgado-Mellado, J. García, V. R. Ferro, F. Rodríguez,
and J. Palomar, “Cosmo-based/aspen plus process simulation of the aromatic extraction from pyrolysisgasoline using the [4empy][NTf2]+[emim][DCA] ionic liquid mixture,” Separation and Purification Tech-nology, vol. 190, pp. 211–227, 2018.
[58] E. Reyhanitash, T. Brouwer, S. R. Kersten, A. van der Ham, and B. Schuur, “Liquid–liquid extraction-basedprocess concepts for recovery of carboxylic acids from aqueous streams evaluated for dilute streams,”Chemical Engineering Research and Design, vol. 137, pp. 510–533, 2018.
[59] M. T. Fouladvand, J. Asadi, and M. N. Lotfollahi, “Simulation and optimization of aromatic extrac-tion from lube oil cuts by liquid-liquid extraction,” Chemical Engineering Research and Design, vol. 165,pp. 118–128, 2020.
[60] I. Díaz, J. Palomar, M. Rodríguez, J. de Riva, V. Ferro, and E. J. González, “Ionic liquids as entrainers for theseparation of aromatic–aliphatic hydrocarbon mixtures by extractive distillation,” Chemical EngineeringResearch and Design, vol. 115, pp. 382–393, 2016.
[61] Q. Wang, B. Zhang, C. He, C. He, and Q. Chen, “Optimal design of a new aromatic extractive distillationprocess aided by a co-solvent mixture,” Energy Procedia, vol. 105, pp. 4927–4934, 2017.
[62] J. Boston and H. Britt, “A radically different formulation and solution of the single-stage flash problem,”Computers & Chemical Engineering, vol. 2, no. 2-3, pp. 109–122, 1978.
[63] W. D. Seider, J. D. Seader, and D. R. Lewin, PRODUCT & PROCESS DESIGN PRINCIPLES: SYNTHESIS,ANALYSIS AND EVALUATION, (With CD). John Wiley & Sons, 2009.
[64] Z. S. Baird, P. Uusi-Kyyny, J.-P. Pokki, E. Pedegert, and V. Alopaeus, “Vapor pressures, densities, andpc-saft parameters for 11 bio-compounds,” International Journal of Thermophysics, vol. 40, no. 11, p. 102,2019.
[65] H. Renon and J. M. Prausnitz, “Local compositions in thermodynamic excess functions for liquid mix-tures,” AIChE journal, vol. 14, no. 1, pp. 135–144, 1968.
[66] A. Fredenslund, R. L. Jones, and J. M. Prausnitz, “Group-contribution estimation of activity coefficientsin nonideal liquid mixtures,” AIChE Journal, vol. 21, no. 6, pp. 1086–1099, 1975.
[67] A. Misefari, Investigation of the spectroscopic, chemical and physical properties of Cyrene and its hydrate. PhDthesis, University of York, 2017.
[68] Dortmund Databank: Molar Heat Capacity Sulfolane, 2020.[69] P.-H. Chao, H.-W. Lin, C.-H. Chen, P.-Y. Wang, Y.-F. Chen, H.-T. Sei, and T.-C. Tsai, “Precoking selecti-
vation for improving benzene product purity in heavy aromatics transalkylation,” Applied Catalysis A:General, vol. 335, no. 1, pp. 15–19, 2008.
253 Towards Sustainable Solvent-Based Affinity Separations

10
10
10
10
10
10
10
10
10
10
PROCESS SIMULATION OF SOLVENT-BASED AFFINITY PROCESSES
[70] J. Qin, Q. Ye, X. Xiong, and N. Li, “Control of benzene–cyclohexane separation system via extractivedistillation using sulfolane as entrainer,” Industrial & Engineering Chemistry Research, vol. 52, no. 31,pp. 10754–10766, 2013.
[71] M. T. Jongmans, E. Hermens, M. Raijmakers, J. I. Maassen, B. Schuur, and A. B. de Haan, “Conceptual pro-cess design of extractive distillation processes for ethylbenzene/styrene separation,” Chemical EngineeringResearch and Design, vol. 90, no. 12, pp. 2086–2100, 2012.
[72] G. Towler and R. Sinnott, Chemical engineering design: principles, practice and economics of plant and processdesign. Elsevier, 2012.
[73] U.S. Energy Information Administration, “Electricity,” 2020.[74] Alibaba, “Sulfolane bulk price,” Nov. 2020.[75] S. H. Krishna, K. Huang, K. J. Barnett, J. He, C. T. Maravelias, J. A. Dumesic, G. W. Huber, M. De Bruyn,
and B. M. Weckhuysen, “Oxygenated commodity chemicals from chemo-catalytic conversion of biomassderived heterocycles,” AIChE Journal, vol. 64, no. 6, pp. 1910–1922, 2018.
[76] M. S. Peters, K. D. Timmerhaus, R. E. West, K. Timmerhaus, and R. West, Plant design and economics forchemical engineers, vol. 4. McGraw-Hill New York, 1968.
[77] L. Li, Y. Tu, L. Sun, Y. Hou, M. Zhu, L. Guo, Q. Li, and Y. Tian, “Enhanced efficient extractive distillationby combining heat-integrated technology and intermediate heating,” Industrial & Engineering ChemistryResearch, vol. 55, no. 32, pp. 8837–8847, 2016.
[78] W. L. Luyben and I.-L. Chien, Design and control of distillation systems for separating azeotropes. John Wiley& Sons, 2011.
[79] J. R. Knight and M. F. Doherty, “Optimal design and synthesis of homogeneous azeotropic distillationsequences,” Industrial & engineering chemistry research, vol. 28, no. 5, pp. 564–572, 1989.
[80] F. M. Lee and D. M. Coombs, “Two-liquid-phase extractive distillation for aromatics recovery,” Industrial& Engineering Chemistry Research, vol. 26, no. 3, pp. 564–573, 1987.
[81] M. Fandary, G. Aly, M. Fahim, and C. Mumford, “Extraction of btx from naphtha reformate using a mixer-settler cascade,” Solvent Extraction and Ion Exchange, vol. 7, no. 4, pp. 677–703, 1989.
[82] A. C. P. Alves, J. Sherwood, A. Zhenova, C. R. McElroy, A. J. Hunt, H. L. Parker, T. J. Farmer, A. Constanti-nou, M. B. De, A. C. Whitwood, et al., “Intelligent approach to solvent substitution: The identification ofa new class of levoglucosenone derivatives.,” ChemSusChem, vol. 9, no. 24, pp. 3503–3512, 2016.
Towards Sustainable Solvent-Based Affinity Separations 254


11
11
11
11
11
11
11
11
11
11
11
11Conclusion, Reflection andPerspective
"The more I learn, the more I realize how much I don’t know",Albert Einstein (1879 - 1955)

11
11
11
11
11
11
11
11
11
11
11
CONCLUSION, REFLECTION AND PERSPECTIVE
In the last years, I touched upon many different aspects of (solvent-based)separation technology. Deliberately, this thesis does not only include an ex-perimental section, but also a fair amount of theoretical work and a simula-tion chapter. Still, the feeling of unfinished business remains, hence in thischapter I would like to firstly give an overview of what was incorporated inmy dissertation and what has been left out, together with the main findingsbased on the results. Secondly, an outlook will be given based on the find-ings of my dissertation, and lastly, several topics will be discussed, that I haveworked on, but which did not make it into this dissertation, and are worth-while to investigate in the future.
11.1 Conclusion and Outlook
The aim of my dissertation was not only to assess new solvents for extrac-tive distillation and/or liquid-liquid extraction applications, but more im-portantly also to develop new and more efficient ways of screening, or pre-selecting potential solvents for separation applications was a goal. For thescreening options, both existing models and data were reviewed, and toolsbased on new measurements were investigated, and for those, primarily inter-molecular interactions and affinity was studied. It was attempted to developan affinity scale-approach instead of a heuristic approach to assess separationperformances.
In Chapters 3, 4 and 5, the main focus was laid on the infinite dilution ac-tivity coefficient (γ∞i ). This molecular descriptor is a common parameter toassess the interactions between two molecules and is used to screen, or pre-select solvents. The first task was to collect a large database with reportedγ∞i found in literature, which enabled us to get a clear picture of what hasalready been done in the past, and what can we learn from this. As the γ∞i isa temperature-dependent parameter, it is important to compare only γ∞i thatwere reported for the same temperature. Among all temperatures at whichγ∞i were reported, most were at 298.15K. It was found that only 5.4% ofthe reported solute-solvent combinations were reported at 298.15K, and forall other reported temperatures, the share was even less. Since a fair com-parison between solvents performances could only be obtained at the same
Towards Sustainable Solvent-Based Affinity Separations 258

11
11
11
11
11
11
11
11
11
11
11
CONCLUSION, REFLECTION AND PERSPECTIVE
temperature, it was necessary to develop a data handling algorithm to inter-and extrapolate data to other temperatures to make them comparable. Usingthe Van ’t Hoff equation this interpolation and extrapolation has been real-ized while keeping track of the 95% confidence interval. This increased theavailable γ∞i at 298.15K of solute-solvent combinations to 23.5% of the to-tal database which contains 77.173 data points. Eventually, it allowed us tovisualize and compare a total of 268 solutes and 692 solvents and share thisability in an open-source γ∞i database. The effect of the molecular structureof both molecular solvents and ionic liquids could be visualized and com-pared for numerous separation challenges of which only several are assessedin this chapter. A particular potential was identified for ionic liquids withmultivalent cations. These ionic liquids show to be able to lower the activ-ity coefficient without losing the particular selective interactions. Often thesetwo characteristics compete with each other and this seems to be less so inthis case. In the future, this database can be consulted before experimentalplanning and work, as it can help with the solvent choice for all thinkableseparations between the 622 solute molecules.
The choice of the γ∞i as a molecular descriptor is however not perfect, as thisvalue is indicative for infinite dilution scenarios. This limiting case does notwell reflect realistic situations at real solvent-to-feed ratios (smaller than infi-nite), and several effects related to non-ideal vapor-liquid equilibrium behav-ior may be overseen which are vital in fluid-based affinity separations. Theseeffects are for instance pinch point and azeotrope formation in an (extrac-tive) distillation column. In the next chapter, we incorporated these effects inthe γ∞i -based framework by using the 3-component Margules equation. Thisequation could extend the application of γ∞i in quick screening to finite con-centrations. This allowed us to assess not only the selectivity of a solvent atinfinite dilution, but also we could determine the minimal required Solvent-to-Feed ratio for efficient distillation operation. Following the suggestion ofBlahušiak,1 a minimal relative volatility of 3 was a prerequisite in the entirecomposition range. For each assessed industrial example, several of the bestperforming solvents coincide with (patented) state-of-the-art solvents, indi-cating the validity of the approach. Next to the state-of-the-art solvents, otherinnovative solvents were found, showing that there are certain windows ofopportunity to go beyond the current state-of-the-art concerning sustainabil-
259 Towards Sustainable Solvent-Based Affinity Separations

11
11
11
11
11
11
11
11
11
11
11
CONCLUSION, REFLECTION AND PERSPECTIVE
ity. For example, the approach showed to be useful to pre-select potentialionic liquids and deep eutectic solvents as more environmentally benign al-ternatives. In the validation of this methodology, only a few ternary systemscould be found to validate the accuracy of the assumptions made. Thereforeit would be wise to measure more ternary vapor-liquid equilibria and use theresults to more extensively test the approach. Also, this approach was nowapplied for vapor-liquid equilibria only, though it is believed this can also bedone for liquid-liquid equilibria. The ability to predict immiscibility regions,distribution coefficients and selectivities from solely the γ∞i is of great benefitfor the design of liquid-liquid extraction processes.
Another aspect of using the γ∞i is the fact that specialized equipment is re-quired to accurately measure these molecular descriptors. Therefore, in thethird chapter, the research question was whether a mathematical model couldpredict these γ∞i accurately, and if so which model was most accurate andwhy. Again, the investigation spanned both molecular solvents and ionic liq-uids. It was found that overall the ionic nature of ionic liquids was muchmore difficult to capture in a model, thus the overall average relative devia-tion was much higher (> 65%) and the predictions of molecular solvents. TheMOSCED model was found to be most accurate in the latter case with an aver-age relative deviation of 16.2± 1.35%. So, predicted γ∞i for IL should alwaysbe used with extreme care, while for molecular solvents they may be useful.However, a critical side-note should be given, when using a model, such asMOSCED, as not all γ∞i can be predicted as the MOSCED parameters are re-quired.
For that reason, an entirely different approach was developed and investi-gated in Chapter 6, which only requires experimental data which can bemeasured with less specialized equipment and only well-known input pa-rameter are required. In this approach, we assessed a pre-selection methodthat requires only the measurement of the heat of mixing and via a thermody-namic model can predict the isobaric vapor-liquid behavior of a mixture. Thethermodynamic model is necessary to describe the entropic behavior whichis inherently defined within the model choice. Before doing experimentalstudies on the heat of mixing, for in total 204 binary systems the heat ofmixing was found in literature, and these systems were evaluated based on
Towards Sustainable Solvent-Based Affinity Separations 260

11
11
11
11
11
11
11
11
11
11
11
CONCLUSION, REFLECTION AND PERSPECTIVE
the literature data. A range of thermodynamic models was evaluated for thevarious classes of compounds. The vapor-liquid equilibria of many binarymixtures could be accurately predicted from the heat of mixing by using cu-bic Equation of States (cEoS) in combination with mixing rules. CommoncEoS such as the (Soave)-Redlich-Kwong and Peng-Robinson, but also othercEoS performed adequately. It was however found that the self-associationof molecules was the origin of erroneous vapor-liquid equilibrium predictionfrom the heat of mixing. The heat of mixing as a sole input parameter is notsufficient to capture the entropic behavior in these cases. Also, liquid activ-ity coefficient models, such as NRTL, are not preferred due to local minimain the solutions, while cEoS are robust and could successfully be applied fornon-self-associating mixtures. This approach is not yet complete, however,due to the fact the vapor-liquid equilibrium of self-associating mixtures couldnot yet be accurately predicted from the heat of mixing using the evaluatedmodel. More complex models that include association behavior, such as thePC-SAFT or CPA model, are the next step and should be assessed to completethis approach.
Until Chapter 6, the primary focus lay on the assessment and developmentof new ways of screening or pre-selecting, new potential solvents. The ac-tual assessment of solvents was done in the next few chapters. In Chapter 7,25 (biobased) solvents were assessed for firstly the apolar separation of aro-matic and aliphatic compounds. Although almost all solvents could enhancethe relative volatility of the model system toluene (TOL)/methylcyclohexane(MCH), only the biobased dihydrolevoglucosenone, or named Cyrene, wasseen to induce similar relative volatility compared to the state-of-the-art in-dustrial solvent Sulfolane, without any thermal degradation. The VLE ofCyrene-TOL-MCH was experimentally determined over the entire (pseudo)-binary composition diagram at 1000 mbar, 800 mbar and 500 mbar and com-pared with the also experimentally determined Sulfolane-TOL-MCH system.It was found that the detrimental pinch-point, present in the Sulfolane sys-tem, was not found in the Cyrene-system. This promising feature could resultin a reduction of the minimum reflux ratio of 43% which may correspond toa 30% reduction in the reboiler duty. Detailed process simulation was out-side the scope of this chapter, but was done in Chapter 10. Cyrene was alsocompared with n-methylpyrrolidone (NMP) for the olefin/paraffin separation
261 Towards Sustainable Solvent-Based Affinity Separations
11
11
11
11
11
11
11
11
11
11
11
CONCLUSION, REFLECTION AND PERSPECTIVE
(n-heptane – 1-heptene), however, it was found that NMP was still far supe-rior. Although Cyrene is not the best solvent for the olefin/paraffin separa-tion, using Cyrene in a composite solvent with for instance NMP can be thesolution that can reduce the amount of NMP needed drastically. A synergisticeffect may occur by using both solvents. More importantly, another (sustain-ability) reason is that partly replacing NMP with Cyrene reduces the toxicityof the solvent. In this chapter, a model system n-heptane/1-heptene was ap-plied to assess the olefin/paraffin separations due to the fact the boiling pointis about 100°C. This is however not an industrial case. The most commonolefin/paraffin separation is the C4-hydrocarbon separation, and most prefer-ably this system must be assessed. These compounds have however a boilingpoint below 0°C and therefore a set-up needs to be created which can handlelow temperatures. This may take some time and effort, but will pay-off in theend.
A similar investigation into the polar separation of acetone and diisopropylether was done with 35 biobased solvents in Chapter 8. In this case, twotypes of entrainers could be distinguished, namely apolar solvents which en-trained diisopropyl ether, while polar solvents could entrain acetone. In thefirst category, DL-limonene was most suitable in the screening experiments,while in the latter category water and ethylene carbonate were seen to in-duce the largest relative volatility. Complete vapor-liquid equilibria were de-termined for all three solvents and the NRTL and UNIQUAC correlation ofthe azeotrope-breaking solvent DL-limonene system were reported. The onlysolvent that could eliminate the azeotrope present in the binary system wasDL-limonene, while water and ethylene carbonate only shifted the azeotropicpoint as they repelled the high-boiling compound, diisopropyl ether. Thischapter shows the potential of biobased solvents for an industrial polar sep-aration, though this is still only one example. In the future, a similar assess-ment should be done for more industrially relevant polar separations, whichmust also include aqueous separations. Eventually, a biobased alternative sol-vent should be made available for each (polar) separation process.
Chapter 9 describes a more extensive study on the use of Cyrene for fluid sep-arations based on the highly promising results of Cyrene in the separation ofMCH and TOL via extractive distillation. In this chapter, the applicability of
Towards Sustainable Solvent-Based Affinity Separations 262

11
11
11
11
11
11
11
11
11
11
11
CONCLUSION, REFLECTION AND PERSPECTIVE
Cyrene in liquid-liquid extraction (LLX) application was assessed for four bi-nary systems; MCH-TOL, MCH-cyclohexanol (CHOH), MCH-cyclo-hexanone(CHO) and MCH-cyclopentyl methyl ether (CPME). The nature of the Cyrenemolecule, including a significant hydrocarbon part that is more apolar of na-ture in combination with the more polar oxygenate functional groups, resultsin a net less polar nature than for example Sulfolane, which causes a limitedimmiscibility region in each of the investigated systems. Where this was bene-ficial for extractive distillation applications, this is undesired in LLX applica-tions. Nevertheless, this chapter showed for the first time liquid-liquid phasebehavior of Cyrene. Additionally, a selectivity towards CHOH over CHO wasobserved, which may indicate an application of Cyrene in the industrial oxida-tion process of cyclohexane to CHO and CHOH. Via short-cut calculations, itwas found that the separation of CHOH and CHO from MCH could be resp.11 and 43 times more efficient using Cyrene than another reported solvent,water. This is primarily due to the high boiling point of Cyrene, making it ahigh-boiling solvent instead of the low-boiling water.
Chapter 10 is also a continuation of the promising results of Cyrene for theseparation of TOL and MCH. In this chapter detailed process simulationswere performed which allowed a thorough comparison of Cyrene and Sul-folane in an extractive distillation (ED) process and a liquid-liquid extraction(LLX) process. This could only be done using the experimental results shownin Chapters 7 and 9. The Cyrene-based LLX process was economically leastfeasible due to the large miscibility region reported earlier. The Cyrene-basedED process was seen to be more efficient than the Sulfolane-based equivalentdue to the absence of the pinch point in the vapor-liquid equilibrium, whichreduced the solvent requirements. Also, the lower boiling point of Cyreneallowed for less reboiler duty. The Sulfo-lane-based LLX-process is howeverstill the most economically attractive option if the aromatic feed content isbelow 30 mol%, mainly due to the large immiscibility of Sulfolane and thesaturated hydrocarbon. The earlier mentioned 30% energy reduction was notachieved due to heat integration.Although these simulations are detailed and many optimization steps havebeen performed, not all options are exhausted. In this chapter, we kept thesame process configuration in the ED-based and LLX-based process. Severalother configurations have been reported and it would be interesting to com-
263 Towards Sustainable Solvent-Based Affinity Separations
11
11
11
11
11
11
11
11
11
11
11
CONCLUSION, REFLECTION AND PERSPECTIVE
pare different process configurations for each process. In the LLX-based pro-cesses, a steam-stripping effect was introduced in the second distillation col-umn. It should be investigated if this is optimal, as the water can also beintroduced in the first distillation column, or be split in a certain ratio be-tween both columns. The option of a dividing wall column configuration maybe considered, as well as changing the model hydrocarbon feed to a realis-tic industrial hydrocarbon feed. The latter does however require a significantamount of experimental vapor-liquid and liquid-liquid equilibrium data ofCyrene and maybe also Sulfolane. Lastly, the liquid heat capacity of Cyreneis not known, and we were not able to measure it accurately by ourselves.Now, we estimated this using the Joback method, but it would be preferableif experimental values could be added to the process simulations.
11.2 Reflection and Perspectives
Several types of experiments and analyses were performed over the years,some have entered the thesis, some have not. The determination of liquid-liquid equilibria (LLE), vapor-liquid equilibria (VLE), performing gas chro-matography analysis (GC) and the measurement of mixing enthalpy (HE) cor-respond to the chapters in this dissertation. Though several side-projects alsoarose during the last years, as often scientific curiosity knows no bounds.Among these projects were the measurements of solid-liquid equilibria (SLE),the chemical synthesis of biobased solvents, determining Kamlet-Taft param-eters, theoretical investigation about molar Gibbs energy curves and deriva-tives thereof, and use of complex coacervates as a solvent. Although thesesubjects did not result in additional thesis chapters, I would like to discusseach of these subjects one-by-one in this perspective part of this chapter.GC analysis: The emphasis is often laid on the experimental measurements,while in my opinion, the analysis procedure is more important. The GC anal-ysis is a robust method, but if you are not careful, you may obtain erroneousresults. As this procedure requires high temperatures, the thermal stabilityof compounds can form an issue. Also, inter- and intramolecular reactionscan occur during the GC procedure, which may not occur during the experi-ment. Hence, before rigorous experimentation, the analysis procedure shouldalways be validated before and during these analyses. Also, the retention time
Towards Sustainable Solvent-Based Affinity Separations 264

11
11
11
11
11
11
11
11
11
11
11
CONCLUSION, REFLECTION AND PERSPECTIVE
of a compound observed during a GC analysis can tell us about the interac-tions between the compound and the lining of the column. This can be used todetermine for instance the infinite dilution activity coefficient, γ∞, of a com-pound in a certain solvent.2 This is regularly done in literature, though wedid not manage to do this by ourselves. Hence, developing an own procedureto pack a GC column with a new, e.g. biobased, solvent and determine the γ∞
of many compounds in these solvents would be of great academic interest andwould complement the current application-driven work done in our group.
HE experiment: The measurement of heat of mixing (HE) in the isothermalcalorimetry (ITC) apparatus is in theory simple, though many inaccuraciescan arise. Again, patience is the key, as stabilization of the baseline signal (be-fore and) after calibration, can take up to a day. Additionally, the stabilizationtime after each injection can vary from 30min to several hours.
Figure 11.1: The comparison of the reported heat of mixing (HE) literature values at 25°C reported by Murakami et al.3, Garriga et al.4 and Chao et al.5 and the experimentalresults using the ITC at 20°C of the binary system 2-butanol/2-butanone. The error marginsindicate are the standard deviation between two measurements.
In this dissertation, no experimental HE data are reported, partly due to thefact consistently a mismatch was observed between 2 measurements, and thefocus was on the mathematical description of literature data, which was given
265 Towards Sustainable Solvent-Based Affinity Separations

11
11
11
11
11
11
11
11
11
11
11
CONCLUSION, REFLECTION AND PERSPECTIVE
priority. The observed experimental mismatch, see Figure 11.1, was seenwhen compound 1 (in this case 2-butanol) was titrated into compound 2 (inthis case 2-butanone) and vice versa, though this mismatch was seen for allmixtures. One of the identified sources of systematic error is the absolute er-ror induced by each injection. Hence, a decrease in the number of injectionslowers the systematic error. Also, the absolute error in each injection will beless significant in systems with large heat of mixings, e.g. in the mixing ofacids and bases. Nevertheless, in the future, a detailed investigation into theorigin of this systematic error needs to be done and a measurement protocolshould be developed to measure accurately the heat of mixing of all mixtures.
Theoretical activity coefficient considerations: Understanding activity coef-ficients is key to understand how to design (extractive) distillation operationsand liquid-liquid extractions. They describe not only the tendency to escapethe phase in which a component is in, but they can also be used to predictwhether a phase-split may occur or not.
Figure 11.2: A schematic representation of a (left) liquid-liquid phase split in the molarGibbs energy profile, and (right) of activity coefficient profile
I did not assess this feature, though it is optional. It would be highly inter-esting if the interplay between phase-splitting and relative volatility wouldbe investigated. As a liquid-liquid phase split should be avoided in an ex-tractive distillation operation, while the activity coefficients should be highlynon-ideal to maximize the relative volatility. As can be seen in Figure 11.2, theGibbs energy profile of a mixture can be determined by the summation of each
Towards Sustainable Solvent-Based Affinity Separations 266

11
11
11
11
11
11
11
11
11
11
11
CONCLUSION, REFLECTION AND PERSPECTIVE
molar Gibbs energy (Gi) and their corresponding molar fractions, while theactivity coefficients (γ) are the derivative of the Gibbs energy. A theoreticalcombination to determine where a liquid-liquid phase split occurs and whichrelative volatility may be obtained could create an operation window for ex-tractive distillation purposes, and/or liquid-liquid extraction purposes. Thismethodology can even be combined with the 3-component Margules equa-tion, which can link the envisioned operation window to the γ∞.
Kamlet-Taft Solvatochromic method: During the course of this dissertation,I became fascinated by the solvatochromic method developed by Kamlet, Ab-boud and Taft, and later also Abraham.6–8 They developed several param-eters, which can provide useful information regarding intermolecular inter-actions that underlie spectroscopic properties. The α and β respectively de-scribe the hydrogen donating ability (acidity) and hydrogen accepting ability(basicity) of a solvent through red- or blue shift in the UV-VIS spectrum of anaromatic nitro or aniline-based dye.6,7 In combination with the π-parameter,which includes polarity-polarizability effects, these parameters can give cru-cial information about which intermolecular interaction a solvent can induce.8
This, in turn, strongly influences the activity coefficient as could be seen inchapter 3. A systematic determination of these parameters for, for instancedeep eutectic solvents (DES’s) and modifications of biobased solvents willbe a highly valuable addition to the overall understanding of these solvents.Specifically, it would be interesting if the exact temperature of the eutecticpoint seen in DES’s can be described (and thus predicted) using the Kamlet-Taft parameters. Another feature that may be explored is the cybotactic polar-ity increment (CPI) which can be determined by determining the Kamlet-Taftfor binary mixtures.9 The cybotactic region is the local liquid structuring ofa solvent surrounded by a solute, in this case, a dye. By determining Kamlet-Taft parameters for 2 solvents and mixtures thereof, the relative strength ofthe liquid structure can be assessed. This can give valuable insights into the(self-) associative behavior of molecules.
SLE experiment: In recent years, deep eutectic solvents (DES’s) have beenreported as a new, or rather rediscovered, type of mixtures which opens upnumerous possibilities in among others fluid separations. In several chapters,these DES’s are mentioned though no experiments of our own were reported.
267 Towards Sustainable Solvent-Based Affinity Separations

11
11
11
11
11
11
11
11
11
11
11
CONCLUSION, REFLECTION AND PERSPECTIVE
The definition of a DES is still fluid, though as the name suggests, the eutecticpoint of the mixture should be deep. Deep enough that a mixture, which canconsist out of two solids, can be used as a liquid at room temperature. In otherwords, the solid-liquid equilibrium has to be known. Together with a student,we set out to measure these SLE of particular mixtures and we managed toreplicate the results with the simple use of a cooling unit with a poly glycolsolvent and a rudimentary sample suspension set-up, see Figure 11.3.
Figure 11.3: Experimental determined solid-liquid equilibrium (SLE) from thymol andmenthol compared with literature values by Abranches et al.10 Also the ideal SLE is shownas well as a prediction of COSMO-RS.
It is however tricky to measure the equilibrium between solid and liquidphases. First of all, water should always be taken into consideration. Hygro-scopic molecules attract water and this will greatly influence the SLE behav-ior. Secondly, the liquid viscosity increases as the temperature drops. Con-sequently, the diffusion kinetics slow down considerably, and the risk is realthat the equilibrium state is not reached. Switching to a differential scan-ning calorimetry (DSC) measurement may be key in establishing more accu-rate (and reliable) SLE data, however, very low temperatures are preferable
Towards Sustainable Solvent-Based Affinity Separations 268

11
11
11
11
11
11
11
11
11
11
11
CONCLUSION, REFLECTION AND PERSPECTIVE
and are not often possible in standard DSC apparatus. Our rudimentary set-up could however be upgraded with another coolant and more insulation, tolower the temperature even further, as often SLE data is not reported below-15°C and many eutectic points fall far below this temperature. It is my opin-ion, that DES’s can only be used in fluid separation applications if the SLE ofthis solvent is accurately determined experimentally and it is justified to calla certain mixture and a deep eutectic mixture.
Synthesis of biobased solvents: Although a huge amount of (biobased) sol-vents can be purchased from chemical vendors, still many (new) moleculesthat can be used as solvents are not commercially available or are too expen-sive to be synthesized by external companies. The combination of synthesisof new (biobased) solvent and the application thereof in fluid separations ishighly academically interesting. In the last few years, we also set out to dojust that.The first attempt to synthesizing our own (biobased) solvent was accordingto an article from Alves et al.11 They stated a synthetic route to convert Cyr-ene, which we use extensively throughout this dissertation, into a new classof molecules called Cygnet, as can be seen in Figure 11.4.
Figure 11.4: The conversion of Cyrene (left) to a new class of molecules called Cygnets (right)
At this moment, Cygnet molecules are being synthesized and in the processof being applied in various fluid separation applications. A simple synthe-sis procedure needs to be established to produce quantities of ∼ 100 gram ofCygnet with a minimum required purity of ∼ 99%. If this is achieved, the realobjective can begin which is to investigate the potential of Cygnet moleculesin fluid separation processes.
Also, following the article by Byrne et al.,12 a (biobased) ether, named 2,2,5,5-
269 Towards Sustainable Solvent-Based Affinity Separations

11
11
11
11
11
11
11
11
11
11
11
CONCLUSION, REFLECTION AND PERSPECTIVE
tetramethyltetrahydrofuran (TMTHF), was synthesized in a one-pot synthesisfrom the readily available 2,5-dimethylhexane-2,5-diol. A 1H-NMR analysisconfirmed only traces of the reagent, indicating a highly pure TMTHF prod-uct was produced. This furan solvent, which has strong similarities with thecommon solvent tetrahydrofuran (THF) and the less harmful, biobased, al-ternative 2-methyltetrahydrofuran (2-MTHF), is shown to be immiscible withwater and can therefore be a highly interesting hydrophobic solvent for futureapplications.
Complex Coacervates: It was several years ago, that I got introduced to the"strange" world of complex coacervates. These complex coacervates can beseen as a bundle of polyelectrolyte molecules (anions and cations) which canbe seen as a viscous, gel-like, fluid, and not like any other solvents used inthis dissertation. These complex coacervates have been studies for encap-sulation of biological agents, such as proteins and amino acids,13,14 thoughhave not been assessed as extraction agents for smaller molecules. One of theapplications addressed was the removal of carboxylic acids from waste wa-ter streams using complex coacervates. In preliminary experiments, we sawthat these carboxylic acids could be easily extracted from water, however, theremoval of these carboxylic acids from the complex coacervates was very dif-ficult. Possibly, the carboxylic acid could be chemically bonded to one of thepolyelectrolytes in the complex coacervate. To investigate this, we performedSmall Angle Scattering (SANS) experiments in the Lamor neutron scatteringinstrument at ISIS Neutron and Muon Source in Oxfordshire.
Our results, shown in Figure 11.5, indicate that the scattering curve of thecomplex coacervate and the acetic acid is additive and at this q-range, whichis indicative of the size of the micro-structures, no change in the structure ofthe complex is observed. Also, the small angle neutron scattering of complexcoacervates with deuterated acetic acid was measured, these also did not showa change in complex structure in the presence of acids. We have further no-ticed that the formation of the complex coacervates is significantly differentinD2O. InH2O at the same concentrations of polyelectrolytes and acetic acid,we obtain very viscous liquid phases, whereas in D2O more precipitate-likestructures are formed. Since the partitioning behavior of the acids may bedifferent in the precipitate-like structures it is difficult to conclude this SANS
Towards Sustainable Solvent-Based Affinity Separations 270

11
11
11
11
11
11
11
11
11
11
11
CONCLUSION, REFLECTION AND PERSPECTIVE
experiment.
Figure 11.5: (a) SANS curves of (branched) polyethyleneimine (b-PEI)/ polyacrylic acid(PAA) complex coacervates and different amounts of H-acetic acid, D2O was subtracted asa background. (b) SANS curves of b-PEI-/PAA complex coacervates and different amountsof H-acetic acid, the scattering curve of the respective acid was subtracted as a background.(Many thanks to Saskia Lindhoud for arranging all and performing the experiments withme)
Although the results were inconclusive, it gave a strong correlation that nostructural changes occurred in the complex coacervate in presence of a car-boxylic acid. These types of experiments are rarely used in the field of solvent-based affinity separations, though it may open-up an alternative way of di-rectly observed structural effects as the result of extracted solutes, such ascarboxylic acids.
Student Supervision: During my time as a PhD-student I had the privilegeto work together with a lot of students, though specifically, I supervised 11BSc. students and 13 MSc. students with their thesis. Many of them didnot directly do something relevant for my work, while others worked from a"hunch" or an idea I had. Nevertheless, I always gave them a lot of freedomto work and figure out stuff by themselves. This was maybe not always theeasiest or time-efficient way of performing scientific research, but it is (in myopinion) by far the best way. It enabled them to work independently, be cre-
271 Towards Sustainable Solvent-Based Affinity Separations

11
11
11
11
11
11
11
11
11
11
11
CONCLUSION, REFLECTION AND PERSPECTIVE
ative with solving problems, and figure out things without only calling forhelp. In the end, not only did the students learn a lot but also did they learnme loads of things. As a perspective, I would highly stress to not microman-age students, don’t give them preassigned lists of experiments which he/sheshould do and only give them a general assignment with not many details.
Overall, I set out to assess not only new solvents for extractive distillationand/or liquid-liquid extraction applications, but also develop an affinity scale-approach instead of a heuristic approach to assess separation performances.This dissertation showed several developments in pre-selecting approachesusing an affinity scale, but also the experimental search and evaluation of(biobased) solvents for (a)polar separation via extractive distillation and liquid-liquid extraction, and the simulation of both processes for the apolar separa-tion. Although, I collected, visualized and used many solvents for my as-sessments. Almost all these solvents were already more or less known fromliterature. Hence, the greatest possibility is the combination of biobased sol-vent synthesis, phase behavior evaluations and correlations (VLE, LLE, SLE)and process simulations. Additionally, the use of (entirely or partly) biobasedcomposite solvents and also complex coacervates must be evaluated not onlyon their phase behavior and factors that influence the phase behavior butalso on the process simulation level. Lastly, I set out to develop a method topredict vapor-liquid equilibria from the heat of mixing. As could be seen inthis dissertation, this was only partly successful, though still, I am convincedthat more complex thermodynamic models that include association effect cancomplete this method and learn us a great deal about the inherent entropicdescription within these models.
Towards Sustainable Solvent-Based Affinity Separations 272

11
11
11
11
11
11
11
11
11
11
11
CONCLUSION, REFLECTION AND PERSPECTIVE
11.3 References
[1] M. Blahušiak, A. A. Kiss, K. Babic, S. R. Kersten, G. Bargeman, and B. Schuur, “Insights into the selectionand design of fluid separation processes,” Separation and purification technology, vol. 194, pp. 301–318,2018.
[2] J.-C. Lerol, J.-C. Masson, H. Renon, J.-F. Fabries, and H. Sannier, “Accurate measurement of activity co-efficient at infinite dilution by inert gas stripping and gas chromatography,” Industrial & EngineeringChemistry Process Design and Development, vol. 16, no. 1, pp. 139–144, 1977.
[3] S. Murakami, K. Amaya, and R. Fujishiro, “Heats of mixing for binary mixtures. the energy of hydrogenbonding between alcohol and ketone molecules,” Bulletin of the Chemical Society of Japan, vol. 37, no. 12,pp. 1776–1780, 1964.
[4] R. Garriga, S. Martınez, P. Pérez, and M. Gracia, “Vapour pressures at several temperatures, and excessfunctions att= 298.15 k of (butanone+ 2-butanol),” The Journal of Chemical Thermodynamics, vol. 31, no. 1,pp. 117–127, 1999.
[5] J. Chao and M. Dai, “Studies of thermodynamic properties of binary mixtures containing an alcohol xvi.excess molar enthalpies of each of (one of the four butanols+ methyl ethyl ketone or methyl isobutylketone) at the temperature 298.15 k,” The Journal of Chemical Thermodynamics, vol. 23, no. 2, pp. 117–121, 1991.
[6] M. J. Kamlet and R. Taft, “The solvatochromic comparison method. i. the. beta.-scale of solvent hydrogen-bond acceptor (hba) basicities,” Journal of the American chemical Society, vol. 98, no. 2, pp. 377–383, 1976.
[7] R. Taft and M. J. Kamlet, “The solvatochromic comparison method. 2. the. alpha.-scale of solventhydrogen-bond donor (hbd) acidities,” Journal of the American Chemical Society, vol. 98, no. 10, pp. 2886–2894, 1976.
[8] M. H. Abraham, M. J. Kamlet, and R. W. Taft, “Linear solvation energy relationships. part 19. correlationof the free energies of solution of 41 solutes in select solvents with hildebrand’s solubility parameter, δh, and with the solvatochromic parameter, π,” Journal of the Chemical Society, Perkin Transactions 2, no. 8,pp. 923–928, 1982.
[9] M. J. Kamlet, E. G. Kayser, M. E. Jones, J. L. Abboud, J. W. Eastes, and R. Taft, “The solvatochromiccomparison method. 4. dilution studies,” The Journal of Physical Chemistry, vol. 82, no. 23, pp. 2477–2483,1978.
[10] D. O. Abranches, M. A. Martins, L. P. Silva, N. Schaeffer, S. P. Pinho, and J. A. Coutinho, “Phenolic hydro-gen bond donors in the formation of non-ionic deep eutectic solvents: the quest for type v des,” ChemicalCommunications, vol. 55, no. 69, pp. 10253–10256, 2019.
[11] A. C. P. Alves, J. Sherwood, A. Zhenova, C. R. McElroy, A. J. Hunt, H. L. Parker, T. J. Farmer, A. Constanti-nou, M. B. De, A. C. Whitwood, et al., “Intelligent approach to solvent substitution: The identification ofa new class of levoglucosenone derivatives.,” ChemSusChem, vol. 9, no. 24, pp. 3503–3512, 2016.
[12] F. Byrne, B. Forier, G. Bossaert, C. Hoebers, T. J. Farmer, J. H. Clark, and A. J. Hunt, “2, 2, 5, 5-tetramethyltetrahydrofuran (tmthf): a non-polar, non-peroxide forming ether replacement for hazardoushydrocarbon solvents,” Green Chemistry, vol. 19, no. 15, pp. 3671–3678, 2017.
[13] S. Lindhoud and M. M. Claessens, “Accumulation of small protein molecules in a macroscopic complexcoacervate,” Soft Matter, vol. 12, no. 2, pp. 408–413, 2016.
[14] S. Lindhoud, R. de Vries, W. Norde, and M. A. C. Stuart, “Structure and stability of complex coacervatecore micelles with lysozyme,” Biomacromolecules, vol. 8, no. 7, pp. 2219–2227, 2007.
273 Towards Sustainable Solvent-Based Affinity Separations


12
12
12
12
12
12
12
12
12
12
12
12
12Appendices
"Only a few know, how much one must know to know how little one knows",Werner Heisenberg (1901 - 1976)

12
12
12
12
12
12
12
12
12
12
12
12
APPENDICES
12.1 Appendix A: Detailed Description of MOSCED
The MOSCED has 5 adjustable parameters for each molecule. The dispersionconstant λi and polarity constant τi . The interaction between induced dipolesis accounted for by the induction parameter, qi . To account for hydrogenbonding, the MOSCED model distinguishes acidic (αi) and basic (βi) contribu-tions to hydrogen bonding. These parameters, αi , βi and τi , are temperature-corrected via the following empirical correlation.1
αTi = αi293T
0.8(12.1a)
βTi = βi293T
0.8(12.1b)
τTi = τi293T
0.4(12.1c)
The 2 empirical asymmetry terms, ψi and ξi , are defined as;
POL = q4i
(1.15− 1.15exp
(−0.002337(τTi )3
))+ 1 (12.2a)
ξi = 0.68(POL− 1) +(3.24− 2.4exp
(−0.002687(αiβi)
1.5))(293/T )2
(12.2b)
ψi = POL+ 0.002629αTi βTi (12.2c)
Lastly, an empirical correction of the combinatorial term has been added. Toaccount for the inaccuracies of the Guggenheim-Stavermann approach;
aa = 0.953− 0.002314((τTi
)2−αTi β
Ti
)(12.3a)
lnγci = d12 = ln(Φi
xi
)aa+ 1−
(Φi
xi
)aa(12.3b)
Towards Sustainable Solvent-Based Affinity Separations 276

12
12
12
12
12
12
12
12
12
12
12
12
APPENDICES
12.2 Appendix B: Additional UNIFAC Equations
Regarding the combinatorial term, the surface fraction description θi , is keptthe same;
θi =
∑j ν
(i)m Qk∑
j xjν(j)m Qk
∧Xm =
∑j ν
(i)m xj∑
j∑nν
(j)n xj
∧θm =QmXm∑nQnXn
(12.4)
where volume fraction, Φi , differs in each UNIFAC variationUNIFAC:
Φi =
∑j ν
(i)k Rk∑
j xj∑j ν
(j)k Rk
(12.5a)
UNIFAC (Ly):
Φ′′i =
(∑j ν
(i)k Rk
) 23
∑j xj
(∑j ν
(j)k Rk
) 23
(12.5b)
UNIFAC (Do):
Φ′i =
(∑j ν
(i)k Rk
) 34
∑j xj
(∑j ν
(i)j Rk
) 34
(12.5c)
In the residual term, the group binary interaction parameter Ψ , is made temperature-dependent by the temperature-independent group binary interaction param-eter anm for the UNIFAC and mod. UNIFAC (Ly) variations.
Ψnm = exp(−anmT
)(12.6)
and by the temperature independent group binary interaction parametersanm, bnm and cnm for the mod. UNIFAC (Do) variation
Ψnm = exp(−anm + bnmT + cnmT 2
T
)(12.7)
277 Towards Sustainable Solvent-Based Affinity Separations
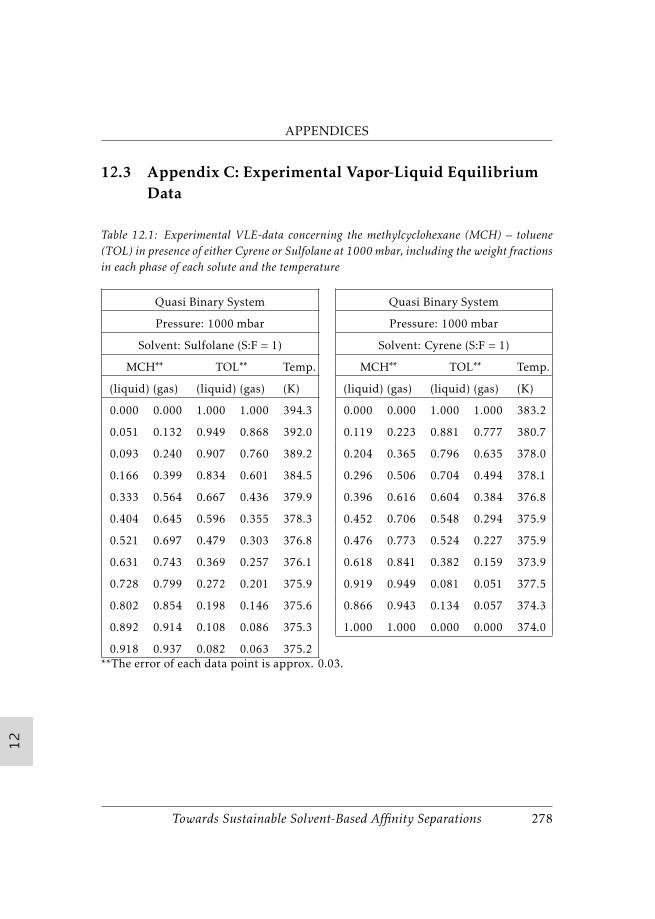
12
12
12
12
12
12
12
12
12
12
12
12
APPENDICES
12.3 Appendix C: Experimental Vapor-Liquid EquilibriumData
Table 12.1: Experimental VLE-data concerning the methylcyclohexane (MCH) – toluene(TOL) in presence of either Cyrene or Sulfolane at 1000 mbar, including the weight fractionsin each phase of each solute and the temperature
Quasi Binary System Quasi Binary System
Pressure: 1000 mbar Pressure: 1000 mbar
Solvent: Sulfolane (S:F = 1) Solvent: Cyrene (S:F = 1)
MCH∗∗ TOL∗∗ Temp. MCH∗∗ TOL∗∗ Temp.
(liquid) (gas) (liquid) (gas) (K) (liquid) (gas) (liquid) (gas) (K)
0.000 0.000 1.000 1.000 394.3 0.000 0.000 1.000 1.000 383.2
0.051 0.132 0.949 0.868 392.0 0.119 0.223 0.881 0.777 380.7
0.093 0.240 0.907 0.760 389.2 0.204 0.365 0.796 0.635 378.0
0.166 0.399 0.834 0.601 384.5 0.296 0.506 0.704 0.494 378.1
0.333 0.564 0.667 0.436 379.9 0.396 0.616 0.604 0.384 376.8
0.404 0.645 0.596 0.355 378.3 0.452 0.706 0.548 0.294 375.9
0.521 0.697 0.479 0.303 376.8 0.476 0.773 0.524 0.227 375.9
0.631 0.743 0.369 0.257 376.1 0.618 0.841 0.382 0.159 373.9
0.728 0.799 0.272 0.201 375.9 0.919 0.949 0.081 0.051 377.5
0.802 0.854 0.198 0.146 375.6 0.866 0.943 0.134 0.057 374.3
0.892 0.914 0.108 0.086 375.3 1.000 1.000 0.000 0.000 374.0
0.918 0.937 0.082 0.063 375.2**The error of each data point is approx. 0.03.
Towards Sustainable Solvent-Based Affinity Separations 278

12
12
12
12
12
12
12
12
12
12
12
12
APPENDICES
Table 12.2: Experimental VLE-data concerning the methylcyclohexane (MCH) – toluene(TOL) in presence of Cyrene at 800 and 500 mbar, including the weight fractions in eachphase of each solute and the temperature
Quasi Binary System Quasi Binary System
Pressure: 800 mbar Pressure: 500 mbar
Solvent: Cyrene (S:F = 1) Solvent: Cyrene (S:F = 1)
MCH∗∗ TOL∗∗ Temp. MCH∗∗ TOL∗∗* Temp.
(liquid) (gas) (liquid) (gas) (K) (liquid) (gas) (liquid) (gas) (K)
0.000 0.000 1.000 1.000 376.0 0.000 0.000 1.000 1.000 363.0
0.107 0.221 0.893 0.779 373.3 0.089 0.183 0.911 0.817 360.5
0.195 0.369 0.805 0.631 371.3 0.191 0.354 0.809 0.646 358.0
0.298 0.507 0.702 0.493 372.2 0.263 0.512 0.737 0.488 356.0
0.373 0.606 0.627 0.394 369.7 0.365 0.621 0.635 0.379 355.2
0.474 0.702 0.526 0.298 368.5 0.431 0.706 0.569 0.294 355.4
0.539 0.774 0.461 0.226 368.2 0.496 0.781 0.504 0.219 353.3
0.628 0.841 0.372 0.159 367.2 0.644 0.845 0.356 0.155 352.3
0.895 0.949 0.105 0.051 370.5 0.861 0.945 0.139 0.055 356.2
0.875 0.937 0.125 0.063 367.0 0.855 0.944 0.145 0.056 352.0
1.000 1.000 0.000 0.000 366.8 1.000 1.000 0.000 0.000 352.3**The error of each data point is approx. 0.03.
279 Towards Sustainable Solvent-Based Affinity Separations

12
12
12
12
12
12
12
12
12
12
12
12
APPENDICES
12.4 Appendix D: Experimental Liquid-Liquid EquilibriumData
Table 12.3: Experimental LLE-data concerning the methylcyclohexane (MCH) – toluene(TOL)– Cyrene (Cy) ternary system, including the weight fractions in each phase of eachsolute, the distribution coefficient (KD,i) of MCH and toluene and the selectivity of tolueneover MCH (Sij ) at 298.15K, 323.15K and 348.15K.
Temperature: 298.15KOrganic Phase Solvent Phase KD,i Sij
Cy TOL MCH Cy TOL MCH MCH TOL TOL/MCH(wt. %)
2.12% 0.76% 97.10% 91.30% 0.74% 7.94% 0.082±0.003 0.981±0.031 11.990±0.8852.81% 1.50% 95.70% 91.40% 1.21% 7.37% 0.077±0.001 0.802±0.013 10.455±0.3273.17% 2.86% 94.00% 89.70% 2.28% 8.00% 0.085±0.002 0.795±0.015 9.370±0.3643.54% 4.35% 92.10% 88.70% 3.18% 8.10% 0.088±0.005 0.732±0.042 8.310±0.9213.71% 5.90% 90.40% 87.60% 4.25% 8.20% 0.090±0.003 0.720±0.026 7.987±0.5126.68% 15.20% 78.10% 60.60% 20.80% 18.60% 0.238±0.017 1.363±0.071 5.725±0.70014.00% 31.40% 54.60% 45.80% 32.10% 22.20% 0.401±0.028 1.021±0.056 2.548±0.3195.03% 9.30% 85.70% 87.10% 5.57% 7.35% 0.086±0.000 0.598±0.003 6.974±0.04712.00% 21.90% 66.10% 74.00% 14.90% 11.20% 0.169±0.003 0.679±0.009 4.017±0.129
Temperature: 323.15KOrganic Phase Solvent Phase KD,i S[ij]
Cy TOL MCH Cy TOL MCH MCH TOL TOL/MCH(wt. %)
5.90% 0.64% 93.50% 93.60% 0.28% 6.08% 0.065±0.002 0.441±0.025 6.760±0.6466.49% 1.52% 92.00% 90.70% 0.82% 8.48% 0.093±0.006 0.538±0.049 5.804±0.9245.89% 3.18% 90.90% 89.80% 1.68% 8.53% 0.094±0.005 0.528±0.030 5.603±0.5876.20% 4.61% 89.20% 89.20% 2.33% 8.44% 0.095±0.001 0.505±0.008 5.331±0.1256.84% 6.06% 87.10% 90.50% 2.54% 6.98% 0.080±0.000 0.419±0.002 5.223±0.03913.80% 15.10% 71.10% 79.20% 8.45% 12.40% 0.174±0.006 0.561±0.032 3.218±0.29315.20% 18.10% 66.70% 69.30% 13.40% 17.30% 0.261±0.004 0.740±0.022 2.839±0.12720.40% 21.80% 57.80% 62.40% 17.10% 20.50% 0.358±0.005 0.783±0.007 2.188±0.05225.70% 24.10% 50.20% 56.40% 19.60% 23.90% 0.480±0.004 0.815±0.019 1.698±0.054
Temperature: 348.15KOrganic Phase Solvent Phase KD,i Sij
Cy TOL MCH Cy TOL MCH MCH TOL TOL/MCH(wt. %)
17.80% 0.60% 81.60% 92.00% 0.28% 7.74% 0.094±0.005 0.461±0.029 4.913±0.57819.10% 1.41% 79.40% 91.60% 0.72% 7.67% 0.096±0.004 0.513±0.057 5.320±0.79619.10% 2.92% 78.00% 87.50% 1.84% 10.70% 0.138±0.011 0.630±0.064 4.564±0.81320.70% 4.25% 75.00% 87.10% 2.44% 10.50% 0.141±0.007 0.575±0.052 4.076±0.57619.60% 5.62% 74.80% 85.30% 3.40% 11.30% 0.153±0.011 0.606±0.067 3.953±0.71535.40% 12.50% 52.20% 73.70% 8.54% 17.80% 0.341±0.001 0.685±0.020 2.011±0.066
Towards Sustainable Solvent-Based Affinity Separations 280

12
12
12
12
12
12
12
12
12
12
12
12
APPENDICES
Table 12.4: Experimental LLE-data concerning the methylcyclohexane (MCH) – cyclohex-anol (CHOH)– Cyrene (Cy) ternary system, including the weight fractions in each phaseof each solute, the distribution coefficient (KD,i) of MCH and toluene and the selectivity oftoluene over MCH (Sij ) at 298.15K, 323.15K and 348.15K.
Temperature: 298.15KOrganic Phase Solvent Phase KD,i Sij
Cy CHOH MCH Cy CHOH MCH MCH CHOH CHOH/MCH(wt. %)
3.25% 0.17% 96.60% 91.90% 0.80% 7.31% 0.076±0.002 4.638±0.207 61.423±4.3343.42% 0.44% 96.10% 92.50% 1.30% 6.17% 0.064±0.003 2.971±0.258 46.305±5.8743.57% 1.03% 95.40% 90.10% 2.62% 7.30% 0.076±0.037 2.552±0.542 33.371±23.1954.42% 2.46% 93.10% 84.40% 5.90% 9.72% 0.104±0.004 2.395±0.339 23.022±4.1755.90% 4.23% 89.90% 87.00% 5.90% 7.15% 0.079±0.000 1.383±0.003 17.529±0.09813.50% 16.60% 69.90% 76.40% 12.40% 11.10% 0.162±0.004 0.763±0.010 4.701±0.185
Temperature: 323.15KOrganic Phase Solvent Phase KD,i Sij
Cy CHOH MCH Cy CHOH MCH MCH CHOH CHOH/MCH(wt. %)
4.62% 0.22% 95.20% 90.80% 0.65% 8.51% 0.090±0.005 2.941±0.363 32.763±5.8345.89% 0.55% 93.60% 91.70% 1.18% 7.08% 0.076±0.001 2.132±0.105 28.074±1.6845.63% 1.22% 93.10% 87.40% 2.88% 9.74% 0.105±0.002 2.369±0.214 22.626±2.4676.31% 1.91% 91.80% 86.40% 4.03% 9.61% 0.105±0.003 2.105±0.199 20.039±2.5207.07% 2.61% 90.30% 85.10% 4.64% 10.30% 0.114±0.007 1.779±0.139 15.644±2.13117.90% 13.50% 68.60% 73.60% 10.20% 16.20% 0.36±0.006 1.268±0.028 3.521±0.13411.50% 8.39% 80.10% 58.40% 17.10% 24.60% 0.202±0.004 1.216±0.051 6.017±0.372
Temperature: 348.15KOrganic Phase Solvent Phase KD,i Sij
Cy CHOH MCH Cy CHOH MCH MCH CHOH CHOH/MCH(wt. %)
17.30% 0.31% 82.40% 91.40% 0.51% 8.14% 0.099±0.006 1.643±0.116 16.623±2.26318.00% 0.77% 81.20% 88.50% 1.32% 10.20% 0.126±0.003 1.722±0.034 13.706±0.59712.00% 1.50% 86.50% 87.80% 2.62% 9.56% 0.111±0.003 1.742±0.036 15.753±0.72520.40% 2.41% 77.20% 83.90% 3.80% 12.30% 0.160±0.000 1.577±0.017 9.866±0.12910.90% 2.99% 86.10% 86.40% 4.24% 9.35% 0.109±0.000 1.422±0.146 13.047±1.39217.90% 4.87% 77.30% 69.10% 7.87% 23.00% 0.299±0.008 1.617±0.050 5.411±0.31117.60% 5.78% 76.60% 66.30% 9.05% 24.70% 0.322±0.011 1.565±0.003 4.857±0.18216.20% 6.37% 77.40% 65.10% 10.00% 24.90% 0.324±0.003 1.564±0.036 4.822±0.15821.70% 8.11% 70.10% 58.40% 11.20% 30.40% 0.437±0.005 1.380±0.024 3.154±0.09523.70% 10.40% 65.90% 52.00% 13.30% 34.80% 0.527±0.015 1.280±0.004 2.430±0.077
281 Towards Sustainable Solvent-Based Affinity Separations
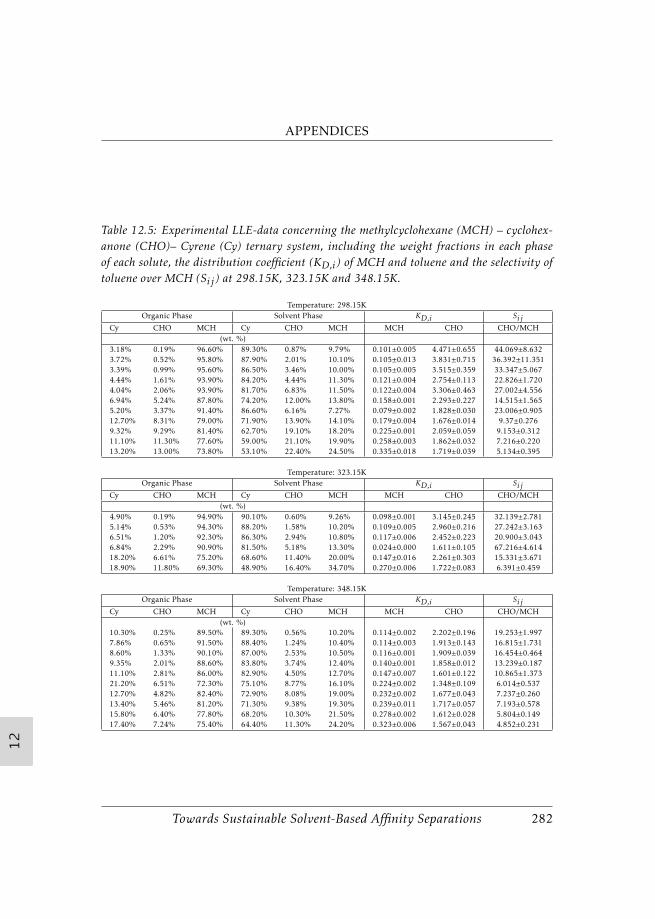
12
12
12
12
12
12
12
12
12
12
12
12
APPENDICES
Table 12.5: Experimental LLE-data concerning the methylcyclohexane (MCH) – cyclohex-anone (CHO)– Cyrene (Cy) ternary system, including the weight fractions in each phaseof each solute, the distribution coefficient (KD,i) of MCH and toluene and the selectivity oftoluene over MCH (Sij ) at 298.15K, 323.15K and 348.15K.
Temperature: 298.15KOrganic Phase Solvent Phase KD,i Sij
Cy CHO MCH Cy CHO MCH MCH CHO CHO/MCH(wt. %)
3.18% 0.19% 96.60% 89.30% 0.87% 9.79% 0.101±0.005 4.471±0.655 44.069±8.6323.72% 0.52% 95.80% 87.90% 2.01% 10.10% 0.105±0.013 3.831±0.715 36.392±11.3513.39% 0.99% 95.60% 86.50% 3.46% 10.00% 0.105±0.005 3.515±0.359 33.347±5.0674.44% 1.61% 93.90% 84.20% 4.44% 11.30% 0.121±0.004 2.754±0.113 22.826±1.7204.04% 2.06% 93.90% 81.70% 6.83% 11.50% 0.122±0.004 3.306±0.463 27.002±4.5566.94% 5.24% 87.80% 74.20% 12.00% 13.80% 0.158±0.001 2.293±0.227 14.515±1.5655.20% 3.37% 91.40% 86.60% 6.16% 7.27% 0.079±0.002 1.828±0.030 23.006±0.90512.70% 8.31% 79.00% 71.90% 13.90% 14.10% 0.179±0.004 1.676±0.014 9.37±0.2769.32% 9.29% 81.40% 62.70% 19.10% 18.20% 0.225±0.001 2.059±0.059 9.153±0.31211.10% 11.30% 77.60% 59.00% 21.10% 19.90% 0.258±0.003 1.862±0.032 7.216±0.22013.20% 13.00% 73.80% 53.10% 22.40% 24.50% 0.335±0.018 1.719±0.039 5.134±0.395
Temperature: 323.15KOrganic Phase Solvent Phase KD,i Sij
Cy CHO MCH Cy CHO MCH MCH CHO CHO/MCH(wt. %)
4.90% 0.19% 94.90% 90.10% 0.60% 9.26% 0.098±0.001 3.145±0.245 32.139±2.7815.14% 0.53% 94.30% 88.20% 1.58% 10.20% 0.109±0.005 2.960±0.216 27.242±3.1636.51% 1.20% 92.30% 86.30% 2.94% 10.80% 0.117±0.006 2.452±0.223 20.900±3.0436.84% 2.29% 90.90% 81.50% 5.18% 13.30% 0.024±0.000 1.611±0.105 67.216±4.61418.20% 6.61% 75.20% 68.60% 11.40% 20.00% 0.147±0.016 2.261±0.303 15.331±3.67118.90% 11.80% 69.30% 48.90% 16.40% 34.70% 0.270±0.006 1.722±0.083 6.391±0.459
Temperature: 348.15KOrganic Phase Solvent Phase KD,i Sij
Cy CHO MCH Cy CHO MCH MCH CHO CHO/MCH(wt. %)
10.30% 0.25% 89.50% 89.30% 0.56% 10.20% 0.114±0.002 2.202±0.196 19.253±1.9977.86% 0.65% 91.50% 88.40% 1.24% 10.40% 0.114±0.003 1.913±0.143 16.815±1.7318.60% 1.33% 90.10% 87.00% 2.53% 10.50% 0.116±0.001 1.909±0.039 16.454±0.4649.35% 2.01% 88.60% 83.80% 3.74% 12.40% 0.140±0.001 1.858±0.012 13.239±0.18711.10% 2.81% 86.00% 82.90% 4.50% 12.70% 0.147±0.007 1.601±0.122 10.865±1.37321.20% 6.51% 72.30% 75.10% 8.77% 16.10% 0.224±0.002 1.348±0.109 6.014±0.53712.70% 4.82% 82.40% 72.90% 8.08% 19.00% 0.232±0.002 1.677±0.043 7.237±0.26013.40% 5.46% 81.20% 71.30% 9.38% 19.30% 0.239±0.011 1.717±0.057 7.193±0.57815.80% 6.40% 77.80% 68.20% 10.30% 21.50% 0.278±0.002 1.612±0.028 5.804±0.14917.40% 7.24% 75.40% 64.40% 11.30% 24.20% 0.323±0.006 1.567±0.043 4.852±0.231
Towards Sustainable Solvent-Based Affinity Separations 282

12
12
12
12
12
12
12
12
12
12
12
12
APPENDICES
Table 12.6: Experimental LLE-data concerning the methylcyclohexane (MCH) – cy-clopentylmethyl ether (CPME)– Cyrene (Cy) ternary system, including the weight fractionsin each phase of each solute, the distribution coefficient (KD,i) of MCH and toluene and theselectivity of toluene over MCH (Sij ) at 298.15K, 323.15K and 348.15K.
Temperature: 298.15KOrganic Phase Solvent Phase KD,i Sij
Cy CPME MCH Cy CPME MCH MCH CPME CPME/MCH(wt. %)
2.62% 0.65% 96.70% 90.10% 0.41% 9.51% 0.098±0.001 0.632±0.003 6.419±0.0833.61% 1.54% 94.90% 93.60% 0.52% 5.91% 0.062±0.003 0.337±0.020 5.385±0.6263.77% 2.73% 93.50% 93.70% 0.83% 5.49% 0.059±0.002 0.303±0.013 5.146±0.3734.27% 4.58% 91.10% 92.80% 1.41% 5.81% 0.064±0.001 0.309±0.013 4.851±0.2804.83% 6.08% 89.10% 85.40% 3.55% 11.00% 0.124±0.019 0.584±0.084 4.696±1.3926.75% 15.70% 77.50% 77.30% 9.85% 12.80% 0.166±0.003 0.628±0.010 3.772±0.11627.20% 27.90% 44.90% 67.70% 18.30% 14.00% 0.316±0.009 0.656±0.018 2.076±0.1165.24% 9.50% 85.30% 92.60% 2.40% 4.97% 0.058±0.001 0.252±0.004 4.326±0.15710.80% 22.30% 66.90% 87.50% 6.47% 6.03% 0.090±0.000 0.290±0.001 3.210±0.013
Temperature: 323.15KOrganic Phase Solvent Phase KD,i Sij
Cy CPME MCH Cy CPME MCH MCH CPME CPME/MCH(wt. %)
5.09% 0.75% 94.20% 92.50% 0.26% 7.27% 0.077±0.003 0.350±0.016 4.545±0.4055.14% 1.56% 93.30% 90.50% 0.63% 8.85% 0.095±0.004 0.404±0.020 4.274±0.3885.65% 2.99% 91.40% 90.60% 1.10% 8.35% 0.091±0.002 0.366±0.001 4.017±0.0845.57% 4.50% 89.90% 89.40% 1.68% 8.89% 0.099±0.005 0.374±0.024 3.787±0.4306.54% 6.04% 87.40% 89.40% 2.20% 8.38% 0.079±0.004 0.301±0.023 3.816±0.50315.00% 14.40% 70.60% 86.30% 3.34% 10.40% 0.144±0.003 0.400±0.003 2.788±0.07615.30% 19.10% 65.60% 74.40% 10.80% 14.80% 0.227±0.003 0.566±0.011 2.492±0.08318.20% 22.20% 59.60% 67.60% 13.90% 18.50% 0.313±0.004 0.627±0.007 2.003±0.05021.10% 24.60% 54.30% 63.70% 16.10% 20.20% 0.375±0.005 0.653±0.016 1.740±0.06829.80% 26.60% 43.60% 60.30% 19.10% 20.60% 0.473±0.000 0.717±0.001 1.515±0.003
Temperature: 348.15KOrganic Phase Solvent Phase KD,i Sij
Cy CPME MCH Cy CPME MCH MCH CPME CPME/MCH(wt. %)
15.00% 0.69% 84.30% 90.90% 0.28% 8.77% 0.104±0.004 0.406±0.016 3.913±0.31016.60% 1.42% 82.00% 90.20% 0.57% 9.24% 0.113±0.004 0.399±0.014 3.544±0.25116.20% 2.79% 81.00% 91.00% 0.93% 8.03% 0.099±0.002 0.332±0.010 3.357±0.15817.60% 4.12% 78.30% 88.10% 1.69% 10.20% 0.131±0.010 0.412±0.038 3.130±0.53211.60% 6.06% 82.30% 89.40% 1.90% 8.74% 0.106±0.001 0.314±0.019 2.976±0.21621.10% 13.70% 65.20% 80.70% 6.46% 12.90% 0.198±0.003 0.471±0.020 2.372±0.13220.90% 19.00% 60.10% 67.60% 12.40% 20.00% 0.333±0.001 0.650±0.001 1.953±0.01024.10% 20.70% 55.20% 60.40% 14.80% 24.80% 0.453±0.007 0.713±0.023 1.573±0.076
283 Towards Sustainable Solvent-Based Affinity Separations

12
12
12
12
12
12
12
12
12
12
12
12
APPENDICES
12.5 Appendix E: Thermodynamic Consistency ofLiquid-liquid equilibrium
A common thermodynamic consistency test was described by Van Ness.2 Thistest evaluated the coupling of activity coefficient derivatives of all compo-nents via the Gibbs-Duhem equation. Though, this can be applied in vapor-liquid equilibria where the activity coefficients of each component can be esti-mated independently, this is not possible in liquid-liquid equilibria.3 There-fore, the test stated by Marcilla et al.4 was used in this work.
Marcilla et al.4 state criteria for the assessment of the stability of a ternary sys-tem by the second derivative of the Gibbs energy of mixing (G) in the form ofa Hessian Matrix, see Equation 12.8. A positive determinant indicates a con-vex Gibbs energy surface,3 which indicates a stable equilibrium. A negativeresult indicates however an intrinsically unstable point. The ternary spinodalcurves are thereby assessed by the zero solution. This is the unstable pointof phase splitting (though is still meta-stable) which must not be mistaken bythe binodal curve, where it is the thermodynamic boundary between the im-miscibility and miscibility region. Hence, a very small Hessian determinantindicates a stable thermodynamic solution near the spinodal curve, being thebinodal curve.
G =
∂2G∂x2
i
∂2G∂xi∂xj
∂2G∂xi∂xj
∂2G∂x2
j
(12.8)
det(G) =∂2G
∂x2i
· ∂2G
∂x2j
− 2 · ∂2G
δxi∂xj= 0 (12.9)
Towards Sustainable Solvent-Based Affinity Separations 284

12
12
12
12
12
12
12
12
12
12
12
12
APPENDICES
Figure 12.1: Thermodynamic consistency analysis via the determinant determination of theHessian matrix of each binary system of the tertiary systems toluene(TOL)/cyclohexanol(CHOH), methylcyclohexane (MCH) and Cyrene at 298.15K, 323.15K and 348.15K
285 Towards Sustainable Solvent-Based Affinity Separations

12
12
12
12
12
12
12
12
12
12
12
12
APPENDICES
Figure 12.2: Thermodynamic consistency analysis via the determinant determina-tion of the Hessian matrix of each binary system of the tertiary system cyclohex-anone(CHO)/cyclopentylmethyl ether (CPME), methylcyclohexane (MCH) and Cyrene at298.15K, 323.15K and 348.15K
Towards Sustainable Solvent-Based Affinity Separations 286
12
12
12
12
12
12
12
12
12
12
12
12
APPENDICES
12.6 Appendix F: Liquid-Liquid Equilibrium ExperimentalProcedure
The experimental LLE data of Sulfolane was done following this experimentaland analysis procedure;
Experimental Procedure:The liquid-liquid extraction experiments were carried out in 10 mL glassvials. A Mettler AT200 analytical balance was used to weigh the compo-nents with an accuracy of 0.1 mg. A fixed solvent to feed molar ratio of 1was used with a varied mole fraction of toluene from 0.05-0.7. The two-phasesystems in the glass vials were shaken vigorously in the vortex mixer and af-terward shaken for 5 hours in a shaking water bath at 25 ± 0.02°C and 200rpm. Thereafter, the mixtures were left to settle overnight to guarantee thatthe equilibrium state was reached. Samples of the top and the bottom phasewere collected with a needled syringe and analyzed.
Analytical Procedure:A Varian CP-3800 gas chromatograph was used to analyze all samples. Forthe analysis, the samples were diluted with analytical acetone and an inter-nal standard, n-nonane, was added. The gas chromatograph was equippedwith a flame ionization detector (280°C) and an Agilent J&W DB-1ms (60m x0.25mm x 0.25µm) column was used. The analysis started at a temperatureof 50°C and was ramped to 300°C. The injector temperature was set at 300°C.The used carrier gas was helium with a constant flow rate of 2.0 mL/min. Allsamples were analyzed three times to take the error of the gas chromatographinto account.
287 Towards Sustainable Solvent-Based Affinity Separations
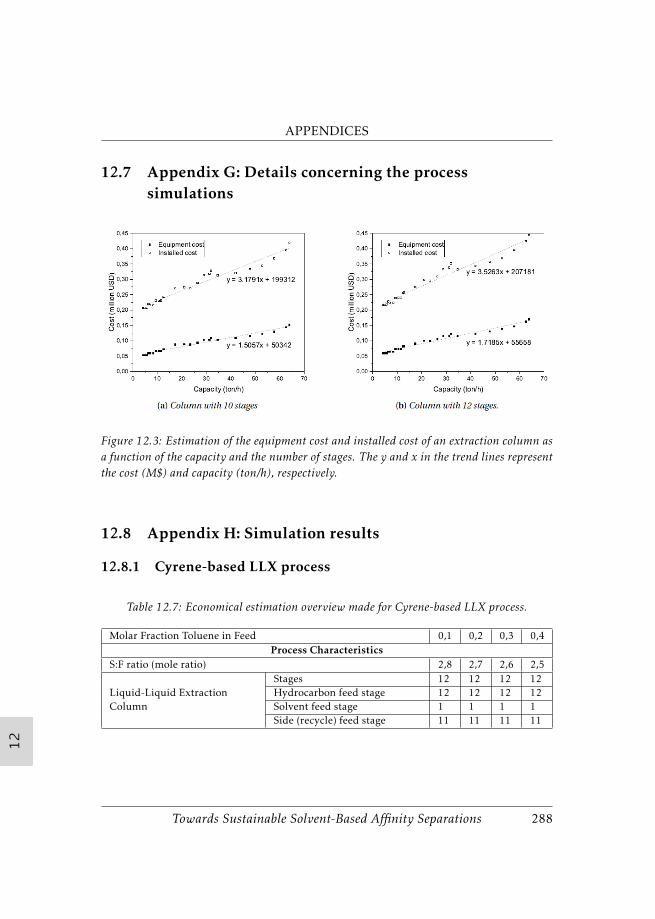
12
12
12
12
12
12
12
12
12
12
12
12
APPENDICES
12.7 Appendix G: Details concerning the processsimulations
Figure 12.3: Estimation of the equipment cost and installed cost of an extraction column asa function of the capacity and the number of stages. The y and x in the trend lines representthe cost (M$) and capacity (ton/h), respectively.
12.8 Appendix H: Simulation results
12.8.1 Cyrene-based LLX process
Table 12.7: Economical estimation overview made for Cyrene-based LLX process.
Molar Fraction Toluene in Feed 0,1 0,2 0,3 0,4Process Characteristics
S:F ratio (mole ratio) 2,8 2,7 2,6 2,5
Liquid-Liquid ExtractionColumn
Stages 12 12 12 12Hydrocarbon feed stage 12 12 12 12Solvent feed stage 1 1 1 1Side (recycle) feed stage 11 11 11 11
Towards Sustainable Solvent-Based Affinity Separations 288

12
12
12
12
12
12
12
12
12
12
12
12
APPENDICES
2nd (SR) DistillationColumn
Stages 12 12 12 12Feed Stage 5 5 5 5Water feed stage 8 8 8 8Reflux Ratio 4,5 3 1,4 1,4Pressure (bar) 0,08 0,08 0,08 0,08
Wash Column Water Wash (kmole/hr) 10 9,5 8 25Product Purities
Product Purity (wt.fraction)
MCH 0,9995 0,9998 0,9998 0,9999Toluene 0,9985 0,9995 0,9995 0,9995
Process Equipment Duty
ED Column (MW)Condensor 2,14 0,90 0,79 0,77Reboiler 6,16 4,12 3,55 3,19
SR Column (MW)Condensor 1,25 1,32 1,14 1,24Reboiler 1,62 1,67 1,46 1,55
Coolers / Heater (MW)
Cooler 1 0,02 0,02 0,02 0,02Cooler 2 0,17 0,07 0,06 0,05Cooler 3 10−2 10−2 10−2 10−2
Cooler 4 4,17 3,44 2,97 2,62Cooler 5 10−2 10−2 10−2 10−2
Pumps (kW)
Pump 1 1,09 0,60 0,56 0,55Pump 2 0,09 0,18 0,27 0,37Pump 3 1,11 1,08 1,05 1,02Pump 4 0,02 0,01 0,01 0,01Pump 5 0,68 0,46 0,45 0,45Pump 6 <10−2 <10−2 <10−2 <10−2
Process Equipment Costs (kAC)Liquid-Liquid Extrac-tion Column
200 199 199 199
1st Distillation Column 1004 780 764 7882nd Distillation Column 905 798 773 797Water Wash Column 199 199 199 199Pumps 207 196 198 198Coolers 125 123 123 117Heat exchangers 158 179 181 182Operational Costs (OPEX) (kAC / yr)
Solvent Make-up 12 7 12 10Electrical 2 1 1 1Heating 2668 1986 1721 1628Cooling 1054 783 677 639
Capital Costs (CAPEX) (MAC)All Equipment 2,80 2,47 2,44 2,48
Total Annual Costs (TAC) (MAC / yr)Total Annual Costs 4,67 3,60 3,22 3,11
289 Towards Sustainable Solvent-Based Affinity Separations

12
12
12
12
12
12
12
12
12
12
12
12
APPENDICES
12.8.2 Sulfolane-based LLX process
Table 12.8: Economical estimation overview made for Sulfolane-based LLX process.
Molar Fraction Toluene in Feed 0,1 0,2 0,3 0,4Process Characteristics
S:F ratio (mole ratio) 4,1 3,85 3,6 3,25
Liquid-LiquidExtraction Column
Stages 12 12 12 12Hydrocarbon feed stage 12 12 12 12Solvent feed stage 1 1 1 1Side (recycle) feed stage 11 11 11 11
1st (ED) DistillationColumn
Stages 8 8 8 8Feed Stage 2 2 2 2Reflux Ratio 3.2 2.1 1.0 0.62Pressure (bar) 0,08 0,08 0,08 0,08
2nd (SR) DistillationColumn
Stages 8 8 8 8Feed Stage 4 4 4 4Water feed stage 6 6 6 6Reflux Ratio 2,5 1,3 0,9 0,63Pressure (bar) 0,08 0,08 0,08 0,08
Wash Column Water Wash (kmole/hr) 13 11 10 12Product Purities
Product Purity (wt.fraction)
MCH 0,9988 0,9987 0,9985 0,9985Toluene 0,9990 0,9994 0,9988 0,9988
Process Equipment Duty
ED Column (MW)Condensor 1,03 0,79 0,61 0,50Reboiler 1,01 0,76 0,67 0,58
SR Column (MW)Condensor 0,95 0,78 0,67 0,58Reboiler 1,15 0,96 0,99 1,08
Coolers / Heater (MW)
Cooler 1 < 10−2 < 10−2 < 10−2 < 10−2
Cooler 2 0,01 0,01 0,02 0,02Cooler 3 < 10−2 0,01 0,01 0,01Cooler 4 0,20 0,18 0,16 0,14Cooler 5 < 10−2 < 10−2 < 10−2 < 10−2
Pumps (kW)
Pump 1 0,22 0,24 0,29 0,31Pump 2 0,09 0,19 0,28 0,37Pump 3 1,83 1,74 1,64 1,51Pump 4 0,02 0,02 0,02 0,02Pump 5 0,66 0,64 0,63 0,59Pump 6 0,22 0,24 0,29 0,31
Towards Sustainable Solvent-Based Affinity Separations 290

12
12
12
12
12
12
12
12
12
12
12
12
APPENDICES
Process Equipment Costs (kAC)Liquid-Liquid ExtractionColumn
200 199 199 199
1st Distillation Column 602 556 540 5612nd Distillation Column 707 776 675 776Water Wash Column 199 199 199 199Pumps 179 179 173 173Coolers 169 169 175 175Heat exchangers 261 249 223 215
Operational Costs (OPEX) (kAC / yr)Solvent Make-up 12 12 32 25Electrical 2 2 2 2Heating 740 590 569 572Cooling 299 241 227 228
Capital Costs (CAPEX) (MAC)All Equipment 2,32 2,33 2,18 2,30
Total Annual Costs (TAC) (MAC / yr)Total Annual Costs 1,82 1,62 1,56 1,59
Molar Fraction Toluene in Feed 0,5 0,6 0,7 0,8Process Characteristics
S:F ratio (mole ratio) 3,0 2,9 2,7 2,5
Liquid-LiquidExtraction Column
Stages 12 12 12 12Hydrocarbon feed stage 12 12 12 12Solvent feed stage 1 1 1 1Side (recycle) feed stage 11 11 11 11
1st (ED) DistillationColumn
Stages 8 8 8 8Feed Stage 2 2 2 2Reflux Ratio 0,2 0,5 0,3 0,25Pressure (bar) 0,08 0,08 0,08 0,08
2nd (SR) DistillationColumn
Stages 8 8 8 8Feed Stage 4 4 4 4Water feed stage 6 6 6 6Reflux Ratio 0,6 0,35 0,42 0,5Pressure (bar) 0,08 0,08 0,08 0,08
Wash Column Water Wash (kmole/hr) 10 8 7 6Product Purities
Product Purity (wt.fraction)
MCH 0,9987 0,9995 0,9998 0,9999Toluene 0,9997 0,9999 0,9999 0,9999
291 Towards Sustainable Solvent-Based Affinity Separations

12
12
12
12
12
12
12
12
12
12
12
12
APPENDICES
Process Equipment Duty
ED Column (MW)Condensor 0,47 0,70 0,94 1,20Reboiler 0,58 0,82 1,08 1,38
SR Column (MW)Condensor 1,06 1,19 1,20 1,41Reboiler 1,12 1,24 1,23 1,43
Coolers / Heater (MW)
Cooler 1 < 10−2 < 10−2 < 10−2 < 10−2
Cooler 2 0,03 0,04 0,05 0,07Cooler 3 0,02 0,02 0,02 0,03Cooler 4 0,13 0,12 0,11 0,10Cooler 5 < 10−2 < 10−2 < 10−2 < 10−2
Pumps (kW)
Pump 1 0,39 0,45 0,53 0,63Pump 2 0,42 0,47 0,51 0,55Pump 3 1,42 1,38 1,31 1,23Pump 4 0,02 0,01 0,01 0,01Pump 5 0,58 0,61 0,63 0,66Pump 6 0,39 0,45 0,53 0,63
Process Equipment Costs (kAC)Liquid-Liquid Extrac-tion Column
199 199 199 199
1st Distillation Column 546 588 621 6692nd Distillation Column 1032 1044 1085 1153Water Wash Column 199 199 199 199Pumps 170 174 177 178Coolers 189 189 189 196Heat exchangers 209 207 173 172Operational Costs (OPEX) (kAC / yr)
Solvent Make-up 16 0,3 5 0,2Electrical 2 2 2 2Heating 586 710 793 962Cooling 234 283 316 382
Capital Costs (CAPEX) (MAC)All Equipment 2,54 2,60 2,64 2,77
Total Annual Costs (TAC) (MAC / yr)Total Annual Costs 1,69 1,86 2,00 2,27
Towards Sustainable Solvent-Based Affinity Separations 292

12
12
12
12
12
12
12
12
12
12
12
12
APPENDICES
12.8.3 Cyrene-based ED process
Table 12.9: Economical estimation overview made for Cyrene-based ED process.
Molar Fraction Toluene in Feed 0,1 0,2 0,3 0,4Process Characteristics
S:F ratio (molar ratio) 1,8 1,8 1,7 1,6
ExtractiveDistillation(ED) Column
Stages 30 30 30 30Solvent Feed Stage 10 10 10 10Hydrocarbon Feed Stage 21 21 21 21Reflux Ratio 0,3 0,25 0,25 0,27Pressure (bar) 1 1 1 1
SolventRecovery (SR)Column
Stages 10 10 10 10Feed Stage 7 7 7 7Reflux Ratio 17 5 1,7 0,78Pressure (bar) 0,08 0,08 0,08 0,08
Product PuritiesProduct Purity(wt. fraction)
MCH 0,9998 0,9996 0,9996 0,9994Toluene 0,9986 0,9988 0,9992 0,9988
Process Equipment DutyEDColumn (MW)
Condensor 1,01 0,86 0,76 0,66Reboiler 3,22 2,37 1,65 1,20
SR Column(MW)
Condensor 1,86 1,24 0,84 0,74Reboiler 0,37 0,32 0,44 0,64
Pumps (kW)Pump 1 0,25 0,26 0,26 0,26Pump 2 0,86 0,86 0,83 0,79Pump 3 0,09 0,18 0,27 0,37
Process Equipment Costs (kAC)ED Column 778 753 728 704SR Column 675 657 639 621Pumps 184 182 179 178Heat exchangers 133 131 130 128
Operational Costs (OPEX) (kAC / yr)Solvent Make-up 25 43 38 44Electrical 0,7 0,7 0,8 0,8Heating 1231 924 718 630Cooling 390 286 217 190
Capital Costs (CAPEX) (MAC)All Equipment 1,82 1,77 1,72 1,68
Total Annual Costs (TAC) (MAC / yr)Total Annual Costs 2,25 1,84 1,55 1,42
293 Towards Sustainable Solvent-Based Affinity Separations

12
12
12
12
12
12
12
12
12
12
12
12
APPENDICES
Molar Fraction Toluene in Feed 0,5 0,6 0,7 0,8Process Characteristics
S:F ratio (molar ratio) 1,75 2,1 2,5 2,8
Extractive Distillation(ED) Column
Stages 30 30 30 30Solvent Feed Stage 10 10 10 10Hydrocarbon Feed Stage 21 21 21 21Reflux Ratio 0,38 0,45 0,72 1,7Pressure (bar) 1 1 1 1
Solvent Recovery (SR)Column
Stages 10 10 10 10Feed Stage 7 7 7 7Reflux Ratio 0,62 0,61 0,62 0,62Pressure (bar) 0,08 0,08 0,08 0,08
Product PuritiesProduct Purity (wt.fraction)
MCH 0,9988 0,9985 0,9985 0,9986Toluene 0,9986 0,9986 0,9986 0,9994
Process Equipment Duty
ED Column (MW)Condensor 0,60 0,50 0,45 0,47Reboiler 1,03 0,90 0,86 0,88
SR Column (MW)Condensor 0,84 1,00 1,18 1,34Reboiler 0,82 0,98 1,13 1,31
Pumps (kW)Pump 1 0,30 0,37 0,46 0,53Pump 2 0,84 0,96 1,10 1,20Pump 3 0,42 0,46 0,51 0,55
Process Equipment Costs (kAC)ED Column 699 695 723 730SR Column 639 656 698 744Pumps 180 182 182 185Heat exchangers 135 171 194 237Operational Costs (OPEX) (kAC / yr)
Solvent Make-up 17 31 77 29Electrical 0,9 1,0 1,2 1,3Heating 634 644 681 751Cooling 195 205 221 246
Capital Costs (CAPEX) (MAC)All Equipment 1,70 1,75 1,84 1,94
Total Annual Costs (TAC) (MAC / yr)Total Annual Costs 1,41 1,46 1,59 1,67
Towards Sustainable Solvent-Based Affinity Separations 294

12
12
12
12
12
12
12
12
12
12
12
12
APPENDICES
12.8.4 Sulfolane-based ED process
Table 12.10: Economical estimation overview made for Sulfolane-based ED process.
Molar Fraction Toluene in Feed 0,1 0,2 0,3 0,4Process Characteristics
S:F ratio (molar ratio) 7 5 3,5
ED Column
Stages 40 40 40Solvent Feed Stage 9 9 9Hydrocarbon Feed Stage 33 33 33Reflux Ratio 1,3 1,6 1,7Pressure (bar) 1 1 1
SR Column
Stages 8 8 8Feed Stage 4 4 4Reflux Ratio 1,5 0,8 0,4Pressure (bar) 0,08 0,08 0,08
Product PuritiesProduct Purity (wt.fraction)
MCH 0,9999 0,9998 0,9994Toluene 0,9991 0,9992 0,9989
Process Equipment Duty
ED Column (MW)Condensor 1,18 1,39 1,35Reboiler 3,88 1,97 1,06
SR Column (MW)Condensor 1,90 0,88 0,74Reboiler 0,45 0,78 1,13
Cooler (MW) Cooler 1 0,38 0,33 0,28
Pumps (kW)Pump 1 2,85 2,15 1,61Pump 2 0,19 0,28 0,37Pump 3 1,38 0,94 0,65
Process Equipment Costs (k=C)ED Column 960 902 918SR Column 789 592 608Pumps 132 133 123Coolers 51 58 65Heat exchangers 83 83 97
Operational Costs (OPEX) (kAC / yr)Solvent Make-up 26 23 0,8Electrical 2,5 1,9 1,5Heating 1485 942 750Cooling 472 358 328
Capital Costs (CAPEX) (MAC)All Equipment 2,09 1,84 1,88
Total Annual Costs (TAC) (MAC / yr)Total Annual Costs 2,68 1,94 1,71
295 Towards Sustainable Solvent-Based Affinity Separations

12
12
12
12
12
12
12
12
12
12
12
12
APPENDICES
Molar Fraction Toluene in Feed 0,5 0,6 0,7 0,8Process Characteristics
S:F ratio (molar ratio) 2,6 2,5 2,5 2,4
ED Column
Stages 40 40 40 40Solvent FeedStage
9 9 9 9
HydrocarbonFeed Stage
33 33 33 33
Reflux Ratio 2 3,5 5,5 1,3Pressure (bar) 1 1 1 1
SR Column
Stages 8 8 8 8Feed Stage 4 4 4 4Reflux Ratio 0,3 0,3 0,3 8Pressure (bar) 0,08 0,08 0,08 0,08
Product PuritiesProduct Purity(wt. fraction)
MCH 0,9992 0,9986 0,9985 0,9989Toluene 0,9991 0,9988 0,9993 0,9997
Process Equipment DutyEDColumn (MW)
Condensor 1,17 1,21 1,04 1,12Reboiler 0,77 0,71 0,75 0,89
SR Column (MW)Condensor 0,72 0,81 0,93 1,07Reboiler 1,18 1,28 1,42 1,56
Cooler (MW) Cooler 1 0,24 0,19 0,14 0,09
Pumps (kW)Pump 1 1,27 1,23 1,23 1,23Pump 2 0,43 0,47 0,51 0,55Pump 3 0,49 0,49 0,51 0,53
Process Equipment Costs (kAC)ED Column 895 891 924 918SR Column 591 617 639 657Pumps 116 116 115 117Coolers 65 65 65 65Heat exchangers 101 121 122 121
Operational Costs (OPEX) (kAC / yr)Solvent Make-up 1,9 11 0,5 0,4Electrical 1,3 1,3 1,3 1,3Heating 667 682 744 839Cooling 295 307 296 321
Capital Costs (CAPEX) (MAC)All Equipment 1,84 1,88 1,93 1,94
Total Annual Costs (TAC) (MAC / yr)Total Annual Costs 1,58 1,63 1,69 1,81
Towards Sustainable Solvent-Based Affinity Separations 296

12
12
12
12
12
12
12
12
12
12
12
12
APPENDICES
12.9 Appendix I: Thermodynamic Background
Heat and work are everyday concepts that everybody knows. Though it wasnot until it was discovered that heat can be transformed into work and viceversa, that the science of thermodynamics appeared. Its initially purely prac-tical usefulness was to increase the efficiency of engines. Although, nowadaysthermodynamics are used in (almost) every field, from the study of the galaxyto the extremely small molecular scale.5 The universal applicability of ther-modynamics was already told by Lewis et al.5 almost 100 years ago and evenstated the choice of solvents in the chemical industry as an example, which isexactly our aim!
Thermodynamics describes the manner of a system, which is a general termused to indicate specific compound(s) in (a) certain phase(s) under certainconditions, is dependent on main measurable variables such as pressure (P),volume (V) and temperature (T). The pressure and temperature are intensiveproperties, meaning that they do not depend on the size of the system. Whilethe volume, is an extensive property and is dependent on the system size.Other quantities are also known, such as the mass (intensive), density (ex-tensive) and others. Thermodynamics is the study of all these quantities andmost importantly how they behave if the system changes. For instance, aninfinitely small change in the volume (V) can be written as a function of thetemperature (T) and pressure (P), see Equation 12.10.
dV =(∂V∂T
)P
dT +(∂V∂P
)T
dP (12.10)
This relation shows that the volume of a system can change by changing oftemperature or pressure. If the volume is fixed however as seen in Equa-tion 12.11; (
∂V∂T
)P
dT = −(∂V∂P
)T
dP (12.11)
then the thermodynamic relation allows the prediction of the temperaturechange if the pressure is adjusted and vice versa. Imagine the usefulness ofthis relation when you want to know how cold aerosols are when they leavethe pressurized deodorant container. This is just a single example, though
297 Towards Sustainable Solvent-Based Affinity Separations

12
12
12
12
12
12
12
12
12
12
12
12
APPENDICES
these relations are in essence thermodynamics at its finest. In this short chap-ter about thermodynamics, a very small fraction will be explained and muchbackground information is left out. For the interested reader, I would highlyrecommend reading the manuscript of Lewis and Randall from 1923 which iscalled "Thermodynamic and the free energy of chemical substances".5
As mentioned before thermodynamics describes the interplay between vari-ous (among others) measurable quantities. Pressure, temperature and volumeare easily understandable concepts, though 4 additional quantities are highlyimportant for our purposes but less known to everyone. These quantities arethe internal energy (U), enthalpy (H), entropy (S) and the Gibbs energy (G),of which some have been shortly before in Equation 6.3. These quantities arequite essential in the chemical engineering field and therefore will be shortlyintroduced.
1. Internal energy (U), is a quantity that describes simply how much en-ergy a thermodynamic system holds, for instance considering a molecule.The internal energy can be interpreted as the kinetic energy originatedfrom vibrations, rotations and translations, and the potential energywithin the chemical bonds of the molecule. The internal energy is de-fined as the difference between a reference (zero) state and the state ofinterest.
2. Enthalpy (H), is a thermodynamic quantity that includes not only theinternal energy of a system or molecule, but also the work that is re-quired to occupy space which is the product of volume and pressure(H = U + P V )). The total enthalpy is highly difficult to determine as itincludes the internal (kinetic and potential) energy. Therefore, gener-ally the difference between a reference state and the state of interest isdetermined.
3. Entropy (S), is the quantity firstly coined by Clausius6,7 and can be in-terpreted in various ways. It can be considered a measure of chaos that isproportional to the number of possible microscopic configurations (Ω))in the system, (S = kBlnΩ) expressed by Boltzmann.8 This aligns withthe second law of thermodynamics postulates which states; "The en-tropy of an isolated system will never decrease over time", which means
Towards Sustainable Solvent-Based Affinity Separations 298

12
12
12
12
12
12
12
12
12
12
12
12
APPENDICES
the path to more chaos is spontaneous and the creation of order is notspontaneous. Following this law, for some processes, it is impossible torestore the system to its original state, these processes are called "irre-versible" processes. As such, the entropy can also be interpreted as theextend of irreversibility5. This can be defined as the received heat, q, di-vided over the absolute temperature. As the change in entropy describeshow far the process is from being reversible, the change in entropy isdS = q/T . This is also the exact original definition used by Clausius7 toformulate the entropy.
4. Gibbs energy (G), this quantity describes the maximum amount of workthat can be done in a "reversible" process. This reversible process is de-fined as such that no overall entropy change occurs. In accordance withthe second law of thermodynamics, which is not violated as the entropyis not decreased but stays constant. Thus after a change in the system,the system can be restored to its original state. It is a measure of theinternal energy, the occupied space, but also compensates for the tem-perature and the entropy of the system; G =H − T S. Also, this quantityis often determined relative to a standard state, therefore generally a ∆Gis determined.
These quantities are not only subjected to temperature, volume and pressurechanges, as shown in Equation 12.10. Also composition changes affect thesequantities when a thermodynamic system includes a mixture. For instance thechange in the Gibbs energy can dependent on changes in the composition of inumber of components where xi is the total amount of moles of component i,see Equation 12.12;
dG =(∂G∂xi
)T ,P
dx1 +(∂G∂x2
)T ,P
dx2 + ...+(∂G∂xi
)T ,P
dxi (12.12)
where the overall change in Gibbs energy is the summation of its partialderivative towards each component multiplied by the change in that specificconcentration. A common nomenclature of the partial quantity, in this casethe molar Gibbs energy is a bar superscript, as can be seen in Equation 12.12;
dG = G1dx1 + G2dx2 + ...+ Gidxi (12.13)
299 Towards Sustainable Solvent-Based Affinity Separations

12
12
12
12
12
12
12
12
12
12
12
12
APPENDICES
These equations still describe the change in the Gibbs energy and can be inte-grated if all molar ratios are kept equal, which results in Equation 12.14;
G = G1x1 + G2x2 + ...+ Gixi (12.14)
In the specific binary case, where only two components are present and thetotal amount of moles are kept equal the relation in Equation 12.15 can beobtained, which is commonly known as the Gibbs-Duhem equation;
G1x2 = −G2x2,which isG1
G2=−x2
x1(12.15)
This relation enables the description of the interplay between the change inthe molar Gibbs energies of two components in the same mixture. This hasas a consequence that the molar Gibbs energies are equal at a molar fractionof 0.5, and if one of the curves exhibits a maximum, the other variable willhave a minimum. The Gibbs-Duhem equation is essential in the developedapproach (see chapter 6) to convert the Gibbs energy of a binary system intomolar Gibbs energies.
In the special case of infinite dilution, a mathematical problem arises. If acomponent is infinitely diluted in a binary system and thus x2⇒ 0, then eitherG1 ⇒ 0 or G2 ⇒ −∞. This mathematical discontinuity is a limitation of the(molar) Gibbs energy and therefore Lewis introduced the fugacity, fi .5
The molar Gibbs energy, Gi , and the fugacity, fi , are two manners of describ-ing the tendency of a compound to escape the phase it is in. A system with2 phases is in equilibrium with each other if the Gi or fi are equal to eachother. Also the vapor pressure can be used to describe this, namely the vaporpressure of ice and water are equal at boiling point. Though, this is only validfor ideal gases, hence the fugacity defined by Lewis is an "ideal" or "corrected"vapor pressure. The relation between the Gi and the fi was defined by Lewis5
to be, see Equation 12.16.
Gi = RT lnfi +B (12.16)
where B is term that is solely dependent on the temperature.
Towards Sustainable Solvent-Based Affinity Separations 300

12
12
12
12
12
12
12
12
12
12
12
12
APPENDICES
Due to the fact, the fugacity is directly related to the partial pressure, in thelimited case that a component is infinitely diluted, n2 ⇒ 0, also the partialpressure will go to zero, which entails that also f2 ⇒ 0. Hence, by using thefugacity (fi) and not the molar Gibbs energy, Gi , the discontinuity at the ex-tremes is eliminated.5
The tendency to escape, fi , is of great interest to chemical engineers as it helpsthe understanding of, for instance the behavior of fluids in distillation- andliquid-liquid extraction columns. The effect of pressure (P), temperature (T)and volume (V) are always considered, as they affect the fi of the componentsdirectly. It is highly interesting to note, that Lewis5 also mentioned that theshape or curvature of the liquid phase also affects the fi . Though this mayoften be neglected, the fi is greater as the radius of a liquid droplet decreases.Hence, fine dispersedness of the liquid phase could in essence also increasethe performance of fluid separation columns. This is also shown by a morerecent paper by Zhang et al.9. Although, this factor will not be included inthis work as it goes into too much detail regarding process equipment design,it needs to be recognized and may be an additional pathway to manipulateseparation performances via the design of gas and/or liquid dispersion.
The absolute fugacity is however not often used, though often the nomencla-ture can be confusing. Lewis proposed the relative fugacity, called the activity,to be;
ai =fif 0i
(12.17)
where the f 0i is the fugacity in a chosen reference state. This correlates to the
relation of the difference in Gi and the reference state G0i to be;
Gi − G0i = RT lnai (12.18)
The definition of the activity is defined differently for the gas- and the liquidphase.
1. Gas phase: due to fact the activity is proportional to the partial pressure,which in turn is proportional to the fugacity. The activity is equalizedto the fugacity, where the reference state is chosen to be as such that thef 0i = 1. As the gas phase fugacity of a certain component is proportional
301 Towards Sustainable Solvent-Based Affinity Separations

12
12
12
12
12
12
12
12
12
12
12
12
APPENDICES
to the partial pressure (P oi = yiP ), the fugacity is defined as; fi = ϕiyiP ,where ϕi is the fugacity coefficient.
2. Liquid phase: the activity is in this phase proportional to the mole frac-tion, and by definition, the activity is unity when the molar fraction xiis unity, thus ai /xi = 1 for pure components. For solutions, the activityis defined as; ai = γixi , where γi is the activity coefficient.
Summarizing, the non-ideality seen in phase equilibria can be described viathe fugacity derived from the above-mentioned thermodynamic correlations.In the next sections, two types of models will be discussed which apply thesethermodynamic correlations to correlate actual phase equilibria. First, liquidactivity coefficients models will be discussed which originate from γi rep-resentations, while secondly Equations of State (EoS) will be discussed whichoriginally attempts to predict correctly the pressure, volume and temperature(PVT) interplay and consequently can estimate the non-ideality parameters.
12.9.1 Liquid Activity Coefficient models
Several liquid activity coefficient models of varying complexity are knownwhich are based on the molar Gibbs energy, such as the van Laar model10,Wilson model11, Margules model12, Universal Quasichemical (UNIQUAC)model13 and Non-Random Two-Liquid (NRTL) model14. Though it was pre-viously shown in the Gibbs-Duhem equation (Equation 12.13) that the Gibbsenergy can be described as the summation of all molar Gibbs energies. TheGibbs energy can also be defined as the summation of the Gibbs energy ofan ideal solution (GID ) and an excess term that accounts for the non-idealbehavior (GE);
G = GID +GE (12.19)
where, the GID can subsequently be defined as a summation of all molarGibbs energies (Gi) multiplied by the specific molar fraction, and the idealentropic term;
GID =n∑i=1
xiGi +RTn∑i=1
xi lnxi (12.20a)
Towards Sustainable Solvent-Based Affinity Separations 302

12
12
12
12
12
12
12
12
12
12
12
12
APPENDICES
consequently, the Gibbs is defined as
G =n∑i=1
xiGi +RTn∑i=1
xi lnxi +GE (12.20b)
or,
G =n∑i=1
xi(Gi +RT lnxi + GE) (12.20c)
The excess term of the Gibbs energy (GE) is related to the activity coefficientas it is the partial derivative of it, see Equation 12.21;
RT lnγi =(∂GE
∂xi
)T ,P
= GE (12.21)
Each liquid activity coefficient model has a different manner of incorporatinginteraction parameters in the activity coefficient description to estimate/pre-dict the non-ideality in a mixture. More details can be found in section 12.9.2.In our case, we are specifically interested in also the excess molar enthalpy(HE). Therefore, we first need to describe the manner in which the Gibbsenergy changes as a function of the temperature and pressure. By followingthe derivation, firstly made by Gibbs and Helmholtz, as can be seen in Equa-tion 12.22;
d(GT
)=
((∂G/T )∂T
)P
dT +(
(∂G/T )∂P
)T
dP (12.22a)
this can be rewritten as;
d(GT
)= − H
T 2 dT +VTdP (12.22b)
This relation holds also for the Excess Gibbs energy. By performing thisderivation, a well-known thermodynamic relation is obtained at isobaric con-ditions, see Equation 12.23, which can correlate the measurable excess molarenthalpy (HE) which the Gibbs energy in Liquid Activity Coefficient models.This equation is known as the Gibbs-Helmholtz equation;(
(∂GE/T )∂T
)P
= −HE
T 2 (12.23)
303 Towards Sustainable Solvent-Based Affinity Separations

12
12
12
12
12
12
12
12
12
12
12
12
APPENDICES
12.9.2 Equations of State
An Equation of State (EoS) is a mathematical construction that details thedependence of 3 observable parameters, temperature (T), pressure (P) and(molar) volume (V or Vm). The most simple EoS is the ideal gas law, see Equa-tion 12.24, which was first stated by Clapeyron in 183415;
P V = nRT ∨ P Vm = RT (12.24)
The universal gas constant, R, is equal to 8.3145 Jmol−1K−1 and can be derivedfrom combining the fact that all substances behave ideally when the pressureapproaches 0 and the triple point temperature of water. This law is accuratefor ideal gases, and was formulated by combining Boyle’s law which describedan isothermal situation (P1V1 = P2V2), Charles’ Law which describes the iso-baric state (Vm,1/T1 = Vm,2/T2), the isochoric state is described by Amonton’sLaw (P1/T1 = P2/T2) and Avogadro’s Law is valid at constant pressure and tem-perature (V1/n1 = V2/n2).
Equations of State (EoS) are widely used in both academia and industry to cal-culate thermodynamic properties. Accurate temperature, pressure and com-position profiles can be determined for a wide range of mixtures and corre-sponding processes.16 Cubic Equation of States (cEoS) are the most popularclass and originate from the van der Waals equation of state, which for thefirst time formulated a thermodynamic model for both fluid phases.17
Johannes Diderik van der Waals started his dissertation17 with the fascinationto understand the quantity in the theory of capillary force which describedthe molecular pressure on the surface of an entrapped liquid. He developedthe theoretical framework as a necessity, as he said (in Dutch);"Daar mij geenweg open schijnt om langs proefondervindelijken weg het bedrag dier constantete vinden, was het noodig om zo door theoretische beschouwingen the bepalen".Translated, he explained in the dissertation preface that the behavior of thatquantity could not be found via an experimental route, hence a theoreticalframework needed to be made. Eventually, Van der Waals postulated the firstequation of state which does not assume that molecules possess no volumeand do not interact (ideal gas law), and takes into account the molecular size(b) and attractive interactions (a), see Equation 12.25;17
Towards Sustainable Solvent-Based Affinity Separations 304

12
12
12
12
12
12
12
12
12
12
12
12
APPENDICES
P =RTVm − b
− a
V 2m
(12.25)
From a statistical point of view, these parameters can be obtained by a Lennard-Jones type of potential, where the hard-core volume of the molecule is canbe considered to be a repulsive parameter (b) and the intermolecular attrac-tion parameter (a) is associated with the ε parameter which is a representa-tion of the intermolecular interactions. The absolute values of the interactionparameters are determined by conditions set at the critical point (C.P.), seeEquation 12.26 and for derivative details see subsection 12.11.1;(
∂P∂Vm
)Tc
=(∂2P
∂V 2m
)Tc
= 0 (12.26)
For the Van der Waals equation the attractive (a) and repulsive (b) pure-component constants are ultimately determined to be;
a =27R2T 2
c
64Pc(12.27a)
b =RTc8Pc
(12.27b)
Since Van der Waals in 1873 published his dissertation, numerous adaptionsof the Van der Waals equation have been published to include more extremeconditions and/or to accurately incorporate increasingly more non-ideal mole-cules (see section 12.10.4). Well-known adaptations are the (Soave-)Redlich-Kwong,18,19 Peng-Robinson20 and the Petal-Teja21 cEoS, though many othersare present in literature and they all originate and follow the Van der Waalsmathematical framework.
In Figure 12.4, the equilibrium between two non-ideal fluid phases, see gasand liquid, is represented by the binodal curve. It shows the gas and liquidvolumes at which both phases co-exists at various temperatures. Between thebinodal curve are the results of the "Van der Waals loop", a prediction of thecubic Equation of State, which describes the state between both phases. Thisoscillation or "loop" contradicts the experimental observations, as there are no3 stable volumes at a given pressure, but only one for each fluid phase. Also
305 Towards Sustainable Solvent-Based Affinity Separations

12
12
12
12
12
12
12
12
12
12
12
12
APPENDICES
Figure 12.4: The gas-liquid equilibrium profile of a pure component as a function of thepressure and volume. Additionally, the critical point (C.P. or C) and the binodal curve aredepicted.
the positive slope (∂P /∂Vm)T > 0 between the minimum and the maximumof the "loop" would mean that when the pressure increases, also the molarvolume does, which is doesn’t make sense. Hence, the horizontal line throughthis "loop" is called the co-existence line. This described the phase-splittingbehavior by equalizing both surface areas beneath and above the co-existingline following the Maxwell equal area rule.22 This equalization is justified asthe PV-diagram corresponds to mechanical work and the work done "left" and"right" of the inflection point and should be equal as it is a reversible process.This Equation of State predicts the "loops" seen in Figure 12.4 and a particularbranch are the cubic Equation of States, of which the Van der Waals equationis one. These equations are named cubic as they can be rewritten as a cubicfunction of the molar volume, or the compressibility factor (Z). This Z-valueis indicative of the non-ideality of the fluid, and is associated with the idealgas law as seen in Equation 12.28;
Z =P VmRT
(12.28)
Towards Sustainable Solvent-Based Affinity Separations 306

12
12
12
12
12
12
12
12
12
12
12
12
APPENDICES
For an ideal fluid, the Z-value is equal to one, which results in the ideal gaslaw. For non-ideal cases, as seen in Figure 12.4, where two fluid phases canco-exist and the Z-value is essential. (note: the ideal gas law does not predicta distinction between gas and liquid)
In the mathematical framework of the cEoS the Z-values of both fluid phasescan be determined by solving the cubic equation (see Equation 12.29) andfinding the three roots.
Z3 + ξ1Z2 + ξ2Z
2 + ξ3 = 0 (12.29)
in this cubic equation, each ξ value is dependent on the type cEoS, see sec-tion 12.11.12. Three types of solutions can be obtained, when the cEoS aresolved. The subcritical isotherm solution (T < Tc) has three different roots, ofwhich the smallest and largest roots correlate to resp. the liquid (ZL) phaseand the gas or vapor phase (ZV ). The middle root does not have a physicalmeaning as it corresponds to the inflection point seen in Figure 12.4. The crit-ical isotherm solution (T = Tc) has three equal real root solutions at preciselythe critical point, though if the pressure deviates a unique real root will beobtained with two complex conjugates. Supercritical solutions (T > Tc) obtaina single real root and two complex conjugates, as only one phase exists abovethe critical point.
The determination of the Z-value allows the description of a variety of otherthermodynamic quantities which arise from the deviation or departure fromideality. Collectively these quantities are known as departure functions. Forthis work, shown in chapter 6, we are interested in the excess molar enthalpyand the fugacity. These quantities are described in Equation 12.30 and Equa-tion 12.31;23
Hdep =HE =H −H ig = RT∫ ρ
0−T
(∂Z∂T
)ρ
dρ
ρ+ (Z − 1) (12.30)
lnfi =∫ ρ
0(Z − 1)
dρ
ρ+ (Z − 1)− lnZ (12.31)
where it can be seen that each quantity is a function of the compressibilityfactor (Z), the universal gas constant (R), the temperature (T) and the molar
307 Towards Sustainable Solvent-Based Affinity Separations

12
12
12
12
12
12
12
12
12
12
12
12
APPENDICES
density (ρ) which is the inverse of the molar volume (Vm). Upon the choice ofthe Z-factor, the fugacity can be distinguished between the liquid- or vaporphase fugacity. These quantities are at isobaric conditions, though isochoriccan also be derived.
Additionally, other thermodynamic properties, such as the heat capacity, iso-thermal compressibility coefficients, etc., can be determined at various tem-peratures, volumes and pressure. The principle of predicting unknown prop-erties of many fluids from known properties of a few is called the Correspond-ing State Principle (CSP) and is considered the most important by-product ofthe Van der Waals equation of state.24 Until now, solely pure fluids have beenconsidered, though the extension towards binary mixture (and further) canbe made. For our needs, the enthalpy departure function corresponds to theheat of mixing or excess molar enthalpyHE , while the departure of the fugac-ity from the pure component fugacity is a measure of the activity coefficient(γi) in the liquid phase and the fugacity coefficient (ϕi) in the gas phase.
The Gibbs-Duhem equation, seen in Equation 12.15, describes the equilib-rium between multiple phases, where the molar Gibbs energy, Gi , or in otherwords chemical potential, µi , of each phase is equal. Darken25, additionallyshowed that this equation can be applied to distinguish the individual partialquantity in a multi-component system from the overall quantity. The overallfugacity (f ), can be differentiated into the partial coefficients, both in the gas-(ϕi) or liquids (γi) phase for each component, as can be seen in Equation 12.32for a binary case;
lnf1 = lnf + (1− x1)(∂lnf
∂x1
), lnf2 = lnf + x1
(∂lnf
∂x1
)(12.32)
Mixing rules are introduced to extend the EoS description from pure compo-nents towards mixtures. These relations describe the way pure componentparameters, for instance, the a and b parameters, of the Van der Waals equa-tion vary as a function of the composition. These mixing rules are in a generalform of;
Towards Sustainable Solvent-Based Affinity Separations 308

12
12
12
12
12
12
12
12
12
12
12
12
APPENDICES
M =n∑i
n∑j
xixjmij (12.33)
where mij can be all binary interaction parameters which are a function ofpure component parameters, such as a and b resp. the binary attraction andrepulsion term. There are various mixing rules, which deviate in the mannerof the attraction and/or repulsion term description. The most simple mixingrule is the linear average of the pure component parameters, e.g. a = x1a1 +x2a2, which do not include any binary interaction parameter. Though morerigorous mixing rules are often used, as can be seen in 1-parameter Van derWaals mixing rule in Equation 12.34;
a = x21a1 + x2
2a2 + 2(x1x2√a1a2(1−Kij )
)(12.34)
where the attractive parameter (a) is a function of the composition, xi , thepure component a-parameters, and the binary interaction parameter (BIP),Kij . This is however just one of the many types of mixing rules, and moredescribed in section 12.11.12.
12.10 Liquid Activity Models
Each model will be separately explained and the equation will show the bi-nary mixture formulation, though each equation can be generalized to covermulticomponent mixtures.
12.10.1 Margules
Margules12 introduced a simple description of the Gibbs energy in mixtures,and decades later after Lewis5 introduced the fugacity concept, this equationcould also be used to describe the activity coefficients. Margules used a powerseries expansion to describe the Gibbs energy for mixtures;
GE
RT= xixj (Ajixi +Aijxj )+x2
i x2j (Bjixi +Bijxj )+ ...+xmi x
mj (Mjixi +Mijxj ) (12.35)
where xi is the molar fraction of component i. Generally, higher order param-eters (Bij →Mij ) are considered neglectable and therefore equalized to zero.
309 Towards Sustainable Solvent-Based Affinity Separations

12
12
12
12
12
12
12
12
12
12
12
12
APPENDICES
This model can be distinguished between a symmetrical and asymmetricalvariant. In the asymmetrical variant, 2 interaction parameters are introduced(when considering a binary mixture), namely Aij and Aji ;
ln(γi) = x2j
(Aij + 2xi(Aji −Aij )
)(12.36a)
ln(γj ) = x2i
(Aji + 2xj (Aij −Aji)
)(12.36b)
In a limited case, where Aij = Aji = A, Equation 12.36 reduces to the symmet-ric Margules equation;
ln(γi) = x2j A (12.37a)
ln(γj ) = x2i A (12.37b)
An important realization of the Margules equation is the fact that Aij = lnγ∞iand Aji = lnγ∞j . where in γ∞i is the infinitely dilution activity coefficient ofcomponent i. A feature that is used in chapter 4.
A direct correlation of the Margules equation between the excess molar en-thalpy HE , via the Gibbs-Duhem equation (see Equation 12.23), and the ex-cess molar Gibbs energy is however not possible. As the Gibbs-Duhem equa-tion required a temperature derivation of the molar Gibbs energy description,which in the Margules case is temperature-independent. Hence, an ideal sit-uation will always occur in which the excess molar enthalpy is equal to zero.
12.10.2 Van Laar
The Van Laar equation was developed by Johannes van Laar,10 and was de-rived from the Van der Waals equation of state, which will be elaborated uponin a later section. Van Laar obtained, from the Van der Waals equation, theexcess molar enthalpy,
HE =bixibjxjbixi + bjxj
(√aibi−√ajbj
)2
(12.38)
Towards Sustainable Solvent-Based Affinity Separations 310

12
12
12
12
12
12
12
12
12
12
12
12
APPENDICES
where a and b are resp. the attraction and hard-core volume (or repulsion)term of the Van der Waals equation of state. Eventually, the a-parameterswere excluded from the equation and a reduced form became the van Laarequation;
GE
RT=
AijxiAjixjAijxi +Ajixj
(12.39)
Identically to the Margules equation, an asymmetric and symmetric variant ispresent where also two binary interaction parameters are introduced, namelyAij and Aji ;
ln(γi) = Aij
(Ajixj
Aijxi +Ajixj
)2
(12.40a)
ln(γj ) = Aji
(Aijxi
Aijxi +Ajixj
)2
(12.40b)
In the symmetric variant, again Aij = Aji = A, and the Van Laar equation willreduce to the same equation as the symmetric Margules equation, see Equa-tion 12.37.
The difference is however in the description of the binary interaction parame-ters. As in the Margules equation it was a function of the infinite dilution ac-tivity coefficient (γ∞i ), this is not the case in the Van Laar model. In this modelthe temperature-dependent Aij parameter is a function of the temperature-independent Aij parameter, the universal gas constant and the temperature,see Equation 12.41
Aij =AijRT∧Aji =
AjiRT
(12.41)
Though this decouples the activity coefficient and the binary interaction co-efficient, it allows the description of the excess molar enthalpy as the Gibbsenergy equation by Van Laar is temperature-dependent. Following the Gibbs-Helmholtz equation, the excess molar enthalpy can be rewritten as;
HE = RTAijxiAjixjAijxi +Ajixj
(12.42)
311 Towards Sustainable Solvent-Based Affinity Separations

12
12
12
12
12
12
12
12
12
12
12
12
APPENDICES
12.10.3 Wilson
Wilson proposed an activity coefficient-based model which could fit highlynon-ideal, though miscible, mixtures11 The equation takes into account boththe molecular size and intermolecular forces, and applied a local compositionapproach. This entailed that locally, the composition of the mixtures may bedifferent than the overall composition. Wilson assumed however a the Flory-Huggins volumetric expression.26,27 For a binary mixture, the Gibbs Excessenergy is given by;
GE
RT= −xi ln(xi +Aijxj )− xj ln(xj +Ajixi) (12.43)
Following the Gibbs-Duhem equation, the activity coefficients are thereforedefined as;
ln(γi) = −ln(xi +Aijxj ) + xj
(Aij
xi +Aijxj−
Ajixj +Ajixi
)(12.44a)
ln(γj ) = −ln(xj +Ajixi)− xi(
Aijxi +Aijxj
−Aji
xj +Ajixi
)(12.44b)
where the temperature-dependent binary interaction parameter (Aij and Aji)are defined as;
Aij =vj,Lvi,L
exp
− AijRT
(12.45a)
Aji =vi,Lvj,L
exp
− AjiRT
(12.45b)
which in turn are a function of the liquid molar volume (vi,L) and the tempera-ture-independent binary interaction coefficient (Aij )Lastly, following the Gibbs-Helmholtz equation, the excess molar enthalpy isdefined as;
HE = −(xi(xi +Aijxj ) + xj (xj +Ajixi)
)+xixjRT
(AijAij + AjiAji) (12.46)
Towards Sustainable Solvent-Based Affinity Separations 312

12
12
12
12
12
12
12
12
12
12
12
12
APPENDICES
12.10.4 Non-Random Two Liquid (NRTL) model
Not only the Wilson equation, also the Non-Random Two Liquid (NRTL)model proposed by Renon and Prausnitz14 uses the local composition ap-proach to describe highly non-ideal components. Though where Wilson useda Flory-Huggins volumetric description26,27, the NRTL model assumed alsofor this term a local composition expression and introduced a non-randomnessfactor (α).
GE =n∑i=1
xi
∑nj=1 xjgjiτji∑nk=1 xkgki
(12.47a)
where
lngji = −αjiτji (12.47b)
and
τji =GjiRT
(12.47c)
Via the Gibbs-Duhem equation, for a binary mixture, this reduces to an activ-ity coefficient description of;
ln(γi) = x2j
τji ( Gjixi + xjGji
)2
+τijGij
(xj + xiGij )2
(12.48a)
ln(γj ) = x2i
τij ( Gijxj + xiGij
)2
+τjiGji
(xi + xjGij )2
(12.48b)
These equations reduce to the symmetric Margules and Van Laar equation,when the non-randomness factor is zero (αij = 0)Lastly, via the Gibbs-Helmholtz equation, the excess molar enthalpy of a bi-nary mixture is described as;
HE = xixj
(gjiGji(xi + xjgji − xiτjiαji)
(xi + xjgji)2 +gijGij (xj + xigij − xjτijαij )
(xj + xigij )2
)(12.49)
313 Towards Sustainable Solvent-Based Affinity Separations

12
12
12
12
12
12
12
12
12
12
12
12
APPENDICES
12.11 cubic Equation of States (cEOS)
12.11.1 Van der Waals (VdW) EoS
Van der Waals tackled two of the most elemental simplifications of the idealgas law, which is that the molecules don’t occupy any space, i.e. are pointsources, and all molecules are isolated and thereby do not interact. For thisreason, all substances behave ideally as the pressure goes to 0, where all mole-cules are infinity far apart and molecular volume and interactions are ne-glectable. Van der Waals corrected this firstly by stating that molecules canbe considered as hard spheres that occupy space. The available space is hencereduced. For this reason, the term (Vm − b) is introduced, where b is the ex-cluded volume that originated from the molecule. The excluded volume ishowever not the same as the actual volume of the molecules, but about 4x aslarge due to the fact 2 hard spheres cannot overlap in space.
The second adaptation is the attractive force between the molecules. A homo-geneous density and a very small range of these forces were the assumptionsmade. The force exerted on the molecules is identified to be inversely pro-portional to the square of the density and so the additional term of a/V 2
m wasintroduced. Hence, Van der Waals formulated17;
P =RTVm − b
− a
V 2m
(12.50)
One of the features of the Van der Waals EoS is the fact it is cubic by nature,it can be rewritten as;
V 3m − (b+
RTP
)V 2m +
aPVm −
abP
= 0 (12.51)
Solving this cubic equation at a certain temperature gives the correspondingmolar gas and liquid volumes. This will be discussed in a later section. Atthe critical point, only 1 solution will however be present, as no distinctionbetween gas and liquid are possible anymore. In that case a criterion of (Vm −Vm,c)3 = 0 where the Vm,c is the molar volume at the critical point. Expandingthis criterion gives the following expression;
V 3m − 3VmV
2m + 3V 2
mVm −V 3m = 0 (12.52)
Towards Sustainable Solvent-Based Affinity Separations 314

12
12
12
12
12
12
12
12
12
12
12
12
APPENDICES
As this closely resembles the cubic expression of the Van der Waals EoS, thenext correlations can be found;
V 3m,c =
abPc∧ 3V 2
m,c =aPc∧ 3Vm,c = b+
RTcPc
(12.53)
Which, consequently, allows the description of the critical parameters as afunction of the pure-components parameters (a and b);
Vm,c = 3b∧ Pc =a
27b2 ∧ Tc =8a
27bR(12.54)
Inversely, after rearrangement, the pure-component parameters can also bedefined as a function of the critical parameter;
a =27R2T 2
c
64Pc∧ b =
RTc8Pc
(12.55)
If this is applied to the compressibility factor, which is Z = P Vm/RT , in theVan der Waals EoS at critical conditions. The results will be, independent ofthe pure-component parameters, 0.375. This means that all compounds be-have the same at the critical point according to the Van der Waals EoS. Thisis the law of Corresponding States, or Corresponding States Principle (CSP),which states that all fluids have approximately the same compressibility fac-tor, and thus behave similarly, at the same reduced temperature (Tr = T /Tc)and pressure (Pr = P /Pc).
The Van der Waals EoS has however short-comings, as the Van der Waals equa-tion can be rewritten as P = RT ρ−aρ2, there are densities (ρ) that are equal tothe inverse of the molar volume (Vm), at which the pressure becomes negative.This is of course not possible and highlights the need for more detailed EoSthat can describe a wider range.
12.11.2 Redlich-Kwong (RK) EoS
Redlich and Kwong18 published an empirical equation that resembles theVan der Waals equation with some adjustments. The performance of the newequation was compared with, among others, the Van der Waals equation forthe description of the compressibility factor of ethane and was found to be
315 Towards Sustainable Solvent-Based Affinity Separations

12
12
12
12
12
12
12
12
12
12
12
12
APPENDICES
more accurate at both low and high pressures. This new Equation of State byRedlich and Kwong is;18
P =RTVm − b
− a√T Vm(Vm + b)
(12.56)
with the pure-component parameter description;
a = 0.42748R2T 2.5
c
Pc∧ b = 0.08664
RTcPc
(12.57)
12.11.3 Soave-Redlich-Kwong (SRK) EoS
Soave19 stated that the Redlich-Kwong EoS was the best two-parameter EoSfor the prediction of pure-component properties, though the accuracy dropsfor multi-component vapor-liquid equilibria (VLE) predictions. Soave as-cribed the inaccuracy to the temperature-dependency description of the Red-lich-Kwong EoS. Hence, the postulation was made that an improvement inthe saturation condition of pure compounds, which is highly temperature de-pendent, also improved the temperature-dependency of mixtures which ul-timately improves the VLE prediction. The first modification was made toEquation 12.56, where the a/
√T was replaced by a general a(T ) term. The
temperature-dependent vapor pressures of a number of hydrocarbons werefitted with the general a(T ) term with an additional pure-component param-eter, namely the acentric factor (ω). This factor describes the non-sphericityof molecules and is defined as a function of the reduced saturation pressures(at a reduced temperature of 0.7) and was introduced by Pitzer et al.28. In theend, Soave fitted a 3rd-order-polynomial function with the acentric factor andestablished the α(Tr ,ω)-function.
P =RTVm − b
− a(T )Vm(Vm + b)
(12.58)
with the pure-component parameter description;
a = 0.42748α(Tr ,ω)R2T 2
c
Pc∧ b = 0.08664
RTcPc
(12.59a)
α =(1 +
(1−
√Tr
)(0.48 + 1.574ω − 0.176ω2)
)2(12.59b)
Towards Sustainable Solvent-Based Affinity Separations 316

12
12
12
12
12
12
12
12
12
12
12
12
APPENDICES
12.11.4 Peng-Robinson (PR) EoS
Although Peng and Robinson20 recognized the ability of the Soave-Redlich-Kwong EoS to fairly accurately predict VLE behavior and vapor densities,they also stated that this equation fails to predict liquid densities. The Peng-Robinson EoS, therefore, improves the liquid density prediction as well as thevapor pressure and the VLE description. The appropriate choice of the gen-eral a(T )- or α-function was stated to be essential in improving the descrip-tions, hence Peng and Robinson proposed the following equations. Note thata similar α-function has been obtained compared to the Soave’s α-function;
P =RTVm − b
− a(T )Vm(Vm + b) + b(Vm − b)
(12.60)
with the pure-component parameter description;
a = 0.45724α(Tr ,ω)R2T 2
c
Pc,b = 0.0778
RTcPc
(12.61a)
α =(1 +
(1−
√Tr
)(0.37464 + 1.54226ω − 0.26992ω2)
)2(12.61b)
12.11.5 Peng-Robinson-Stryjek-Vera (PRSV) EoS
In a series of articles,29,30 Stryjek and Vera showed modifications of the Peng-Robinson Equation of State. They focused on the α-function in which Pengand Robinson20 determined a single 3rd-order-polynomial function with theacentric factor similar to the Soave function.19. They recognized large errorsfor components with large acentric factors, which increased rapidly when thetemperature deviated from the critical point. Stryjek and Vera modified theα-function to;
α = κ0 +κ1
(1 +
√Tr
)(0.7− Tr ) (12.62a)
κ0 = 0.378893 + 1.4897153ω − 0.17131848ω2 + 0.0196554ω3 (12.62b)
where, an additional (totally empirical) pure-component parameter was in-troduced κ1 and are valid between a certain indicated temperature range,
317 Towards Sustainable Solvent-Based Affinity Separations
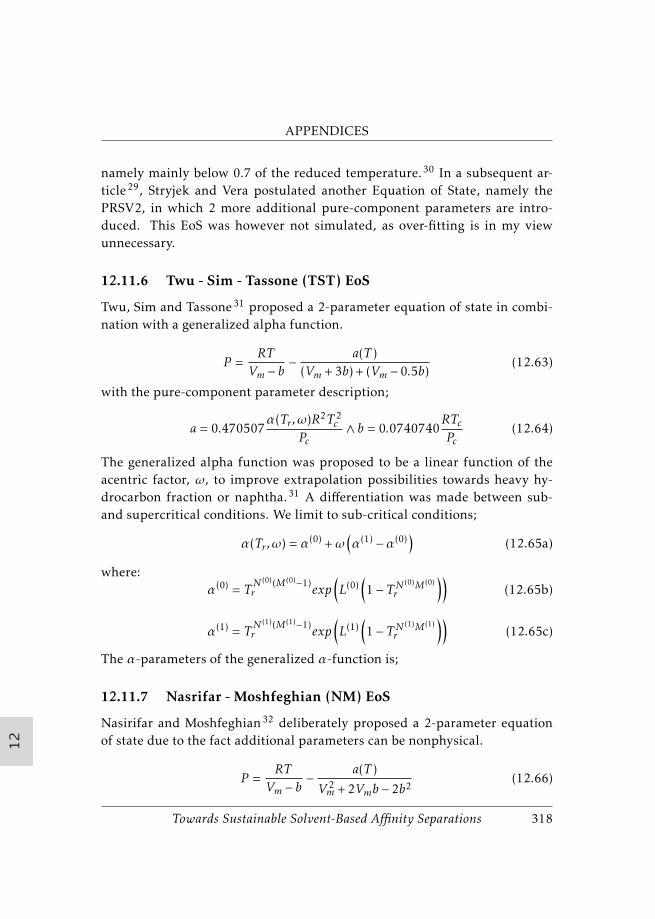
12
12
12
12
12
12
12
12
12
12
12
12
APPENDICES
namely mainly below 0.7 of the reduced temperature.30 In a subsequent ar-ticle29, Stryjek and Vera postulated another Equation of State, namely thePRSV2, in which 2 more additional pure-component parameters are intro-duced. This EoS was however not simulated, as over-fitting is in my viewunnecessary.
12.11.6 Twu - Sim - Tassone (TST) EoS
Twu, Sim and Tassone31 proposed a 2-parameter equation of state in combi-nation with a generalized alpha function.
P =RTVm − b
− a(T )(Vm + 3b) + (Vm − 0.5b)
(12.63)
with the pure-component parameter description;
a = 0.470507α(Tr ,ω)R2T 2
c
Pc∧ b = 0.0740740
RTcPc
(12.64)
The generalized alpha function was proposed to be a linear function of theacentric factor, ω, to improve extrapolation possibilities towards heavy hy-drocarbon fraction or naphtha.31 A differentiation was made between sub-and supercritical conditions. We limit to sub-critical conditions;
α(Tr ,ω) = α(0) +ω(α(1) −α(0)
)(12.65a)
where:α(0) = T N
(0)(M(0)−1)r exp
(L(0)
(1− T N
(0)M(0)
r
))(12.65b)
α(1) = T N(1)(M(1)−1)
r exp(L(1)
(1− T N
(1)M(1)
r
))(12.65c)
The α-parameters of the generalized α-function is;
12.11.7 Nasrifar - Moshfeghian (NM) EoS
Nasirifar and Moshfeghian32 deliberately proposed a 2-parameter equationof state due to the fact additional parameters can be nonphysical.
P =RTVm − b
− a(T )
V 2m + 2Vmb − 2b2
(12.66)
Towards Sustainable Solvent-Based Affinity Separations 318

12
12
12
12
12
12
12
12
12
12
12
12
APPENDICES
αTr ≤ 1
α(0) α(1)
L 0,196545 0,704001
M 0,906437 0,790407
N 1,26251 2,13086
with the pure-component parameter description;
a = 0.497926α(Tr ,ω)R2T 2
c
Pc∧ b = 0.094451
RTcPc
(12.67)
A Soave-type19 of α-function was proposed, which included the pseudo triplepoint temperature (Tpt). Though this is an additional parameter, it is a phys-ical parameter. Nevertheless, including this temperature point was not donein our work and the original α-function of Soave was used.
12.11.8 Petal-Teja (PT) EoS
Petal and Teja21 recognized the successful SRK and PR Equations of States,though continued on the refinement of the assumption that the critical com-pressibility factors of all substances are identical. They were not the first totackle this assumption by incorporating substance-dependent critical com-pressibility factors.33,34 Petal and Teja proposed therefore a new Equation ofState with additional pure component dependent parameters, F and ζ.
P =RTVm − b
− a(T )Vm(Vm + b) + c(Vm − b)
(12.68)
This equation form is not new, and is the same as the three-parameter EoS ofHarmens and Knapp35. Also it is quite similar to the PR Equation of Stateif the c-parameter was equal to the b-parameter. Besides the "normal" set ofconstraints for the 2-parameter EoS, which are the zero solutions of the firstorder and second order derivatives of the pressure to the molecular volumeat the critical temperatures, see Equation 12.26, an additional third constrainis imposed which is the component-specific compressibility factor at criticalconditions;
319 Towards Sustainable Solvent-Based Affinity Separations

12
12
12
12
12
12
12
12
12
12
12
12
APPENDICES
PcVcRTc
= ζc (12.69)
The critical compressibility factor was however not chosen to be the experi-mentally determined value, but the value was adjusted to increase accuracy.This is the same approach as Schmidt and Wenzel.34.
Application of the constraints at critical conditions yield the a-, b- and c-parameters to be;
a(T ) =Ωaα(Tr ,ω)R2T 2
c
Pc(12.70a)
b =ΩbRTcPc
(12.70b)
c =ΩcRTcPc
(12.70c)
where:Ωc = 1− 3ζc (12.70d)
Ωa = 3ζ2c + 3(1− 2ζc)Ωb +Ω2
b + 1− 3ζc (12.70e)
and Ωb is the smallest root of the cubic equation
Ω3b + (2− 3ζc)Ω
2b + 3ζ2
cΩb − ζ3c = 0 (12.70f)
For the α-function, Petal and Teja chose the same function as Soave19 pro-posed, though adapted to include the pure-component specific parameter, F;
α =(1 +F
(1−
√Tr
))2(12.71)
12.11.9 Petal-Teja-Valderrama (PTV) EoS
Valderrama36 stated several shortcomings of the Petal-Teja Equation of State,namely the validity of the 2 additional empirical constants, F and ζ, whichhad been correlated to apolar compounds, and the complexity of the math-ematical framework which differs from the other 2-parameter equation ofStates. Valderrama kept the form of the PT equation of state, but generalized
Towards Sustainable Solvent-Based Affinity Separations 320

12
12
12
12
12
12
12
12
12
12
12
12
APPENDICES
the a-, b- and c-parameters by a linear correlation of the critical compressibil-ity factor, Zc or ζc.
Ωa = 0.66121− 0.76105ζc (12.72a)
Ωb = 0.02207 + 0.20868ζc (12.72b)
Ωc = 0.57765− 1.87080ζc (12.72c)
Additionally, Valderrama found a strong correlation of the empirical F-para-meter with the product of the acentric factor, ω, and the critical compressibil-ity factor,ζc.
F = 0.46283 + 3.58230(ωζc) + 8.19417(ωζc)2 (12.73)
12.11.10 Esmaeilzadeh-Roshanfekr (ER) EoS
The equation of state proposed by Esmaeilzadeh and Roshanfekr37 followsthe line of Petal and Teja and contains 3-parameters, see Equation 12.74, andis an attempt to improve the performance of equations of state on reservoirfluids.
P =RTVm − b
− a(T )Vm(Vm + c) + c(Vm − c)
(12.74)
The following mathematical, which is solved at critical conditions, was pro-posed which ultimately resulted in an improved saturated liquid density, com-pared to the PTV, PT and PR equations of state, though the PTV equation ofstate was more accurate for the saturated vapor density.
a(T ) =Ωaα(Tr ,ω)R2T 2
c
Pc(12.75a)
b =ΩbRTcPc
(12.75b)
c =ΩcRTcPc
(12.75c)
321 Towards Sustainable Solvent-Based Affinity Separations

12
12
12
12
12
12
12
12
12
12
12
12
APPENDICES
where:Ωb = 2Ωc − 1 + 3ζc (12.75d)
Ωa = 3ζ2c +Ω2
c + 2ΩbΩc + 2Ωc (12.75e)
and Ωc is the smallest root of the cubic equation
Ω3c +
(3ζc −
58
)Ω2c +
(3ζ2
c −34ζc
)Ωc + ζ3
c −38ζ2c = 0 (12.75f)
where, the ζc was generalized to
ζc = 0.3284438− 0.0690264ω+ 0.0078711ω2 (12.75g)
For the α-function, Esmaeilzadeh and Roshanfekr37 chose a similar functionas Soave19 proposed and generalized it to;
α =(m1 +m2
(1−
√Tr
))2(12.76a)
where,
m1 = 0.999035− 0.01061842ω − 0.0081174ω2 (12.76b)
m2 = 0.4400108 + 1.5297151ω − 0.4710752ω2 (12.76c)
12.11.11 Harmens - Knapp (HK) EoS
Harmens and Knapp preferred the following 3-parameter equation of state.This form was chosen as c = 1 reduces to the Redlich-Kwong equation of stateand c=2 reduces to Peng-Robinson equation of state.35
P =RTVm − b
− a(T )
V 2m +Vmcb − (c − 1)b2
(12.77)
Similar to the other 3-parameter equation of states, the following parameter-framework, which is solved at critical conditions, is present;
a(T ) =Ωaα(Tr ,ω)R2T 2
c
Pc(12.78a)
b =ΩbRTcPc
(12.78b)
Towards Sustainable Solvent-Based Affinity Separations 322

12
12
12
12
12
12
12
12
12
12
12
12
APPENDICES
c = 1 +1− 4ζcβcζc
(12.78c)
where:Ωa = 1− 3ζc + 3ζ2
c + βcζc(3− 6ζc + βcζc) (12.78d)
Ωb = βcζc (12.78e)
ζc = 0.3211− 0.080ω+ 0.0384ω2 (12.78f)
βc = 0.10770ζc + 0.76405ζc − 1.24828ζ2c + 0.96210ζ3
c (12.78g)
Additionally, they expanded the Soave-function19 towards;
α =(1 +A
(1−
√Tr
)−B
(1− 1
Tr
))2
(12.79a)
where, if ω ≤ 0.2;
A = 0.50 + 0.27767ω+ 2.17225ω2,B = −0.22 + 0.338ω − 0.845ω2 (12.79b)
and, if ω > 0.2;A = 0.41311 + 1.14654ω,B = 0.0118 (12.79c)
12.11.12 Trebble - Bishnoi (TB) EoS
In the previous equations of state, either compressibility factor (ζc) and thecritical repulsion (βc or bc) term were kept constant (2-parameter equation ofstate), or one of these terms was kept constant (3-parameter equation of state).Trebble and Bishnoi38 chose to keep both terms variable, hence creating a 4-parameter equation of state.
P =RTVm − b
− a(T )
V 2m + (b+ c)Vm − bc − d2)
(12.80)
Similar to the 3-parameter equation of states, the 4-parameter equation ofstate framework, which is solved at critical conditions, is as following;
a(T ) =Ωaα(Tr ,ω)R2T 2
c
Pc(12.81a)
323 Towards Sustainable Solvent-Based Affinity Separations

12
12
12
12
12
12
12
12
12
12
12
12
APPENDICES
b =ΩbRTcPc
(12.81b)
c =ΩcRTcPc
(12.81c)
d =ΩdRTcPc
(12.81d)
where:Ωa = 3ζc + 2ΩbΩc +Ωb +Ωc +Ω2
b +Ω2d (12.81e)
Ωc = −3ζc + 1 (12.81f)
Ωd = 0.341Vc − 0.005 (12.81g)
and Ωb is the smallest root of the cubic equation
Ω3b + (2− 3ζc)Ω
2b + 3ζ2
cΩb − (Ω2d + ζ2
c ) = 0 (12.81h)
The α−function of Soave19 was used in this equation of state.
12.12 Generalization of cEoS
Generalization of various Equation of States allows the creation of an univer-sal mathematical framework that allows the usage of various EoS in the samemanner. The generic cubic EoS can be written as39;
P =RTVm − b
− a(T )(V − εb)(V + σb)
(12.82)
Again, the a(T) and b values are determined from the critical point, as shownin Equation 12.26. This results in;
b =ΩRTcPc∧ a(Tc) = Ψ
R2T 2c
Pc(12.83)
of which the a(T )-term is extended to other temperatures via;
a(T ) = Ψα(Tr ,ω)R2T 2
c
Pc(12.84)
Towards Sustainable Solvent-Based Affinity Separations 324

12
12
12
12
12
12
12
12
12
12
12
12
APPENDICES
The Ω and Ψ are component independent and specific to a particular Equa-tion of State.
Z3 +((σ +ε)β−(1+β))Z2 +β(q+εσβ−(1+β)(σ +ε))Z−β2(q+(1+β)εσ ) (12.85)
where;
β =bPRT
=ΩPrTr∧ q =
a(T )bRT
=Ψ α(Tr ,ω)ΩTr
, (12.86)
Table 12.11: A summary of the Equation of State specific parameters
EoS σ ε Ω Ψ
VdW 0 0 0.12500 0.42188RK 1 0 0.08664 0.42748
SRK 1 0 0.08664 0.42748PR 1 +
√2 1−
√2 0.07780 0.45724
PRSV 1 +√
2 1−√
2 0.07780 0.45724TST 3 -0.5 0.07741 0.47051NM 1 +
√3 −2/(1 +
√3) 0.09445 0.49793
PT(f +
√f 2 + g
)/2 −2(f − 1)2/
(f +
√f 2 + g
)Ωb Ωa
PTV(f +
√f 2 + g
)/2 −2(f − 1)2/
(f +
√f 2 + g
)Ωb Ωa
ER (f − 1)(1 +√
2)
(1− f )(1 +√
2)
Ωb ΩaHK
(c+√c2 + i
)/2 −(i/2)/
(c+√c2 + i
)Ωb Ωa
TB(f +
√f 2 + 4m
)/2 −2m/
(f +
√f 2 + 4m
)Ωb Ωa
Abbreviations: f = c/b+ 1, g = 4c/b, h = c(4 + c), j = c+ 4b, i = 4(c − 1), k =c+ 3b, m = c/b+ d2/b2
12.13 Mixing Rules
Equation of State models have been developed to predict pure componentproperties, such as the density. To extend these models towards mixtures,additional correlations have been introduced in an attempt to preserve theaccuracy of these models. This is however quite difficult as many kinds of in-teractions can be induced between molecules, such as dipolar interactions and
325 Towards Sustainable Solvent-Based Affinity Separations

12
12
12
12
12
12
12
12
12
12
12
12
APPENDICES
most severely hydrogen bond formation. A serious shortcoming of some mix-ing rules is described by Michelsen and Kistenmacher.40 They showed that amixing rules can be invariant towards over-defined mixtures. For example, a50/50% binary mixture of compounds A and B, is the same mixture as ternarymixtures of 50/25/25% of compounds A, B and (the same) B. A mixing rulecan however offer different results. This is named the Michelsen-Kistenmachersyndrome. In this work, we consider 8 mixing rules. These are chosen to re-flect the variety of the much more mixing rules reported in literature and adifferent selection of rules can also be made;
1. 1-parameter Van der Waals (VdW1): it is a simple rule which is mostwidely used for mainly non-polar and slightly polar mixtures;
a =∑i
∑j
xixj(√aiaj (1−Kij )
)(12.87a)
b =∑i
xibi (12.87b)
Only 1 binary interactions parameter, Kij , is incorporated in the attrac-tion term and a linear average of the molecular volume, b, is incorpo-rated.
2. 2-parameter Van der Waals (VdW2): this is a small extension of theprevious rule. The attractive term description has been kept constant,though the molecular volume description is changed to;
b =
∑i∑j xixj (bi + bj )(1−Lij )
2(12.88)
where Lij a second binary interaction parameter is.
3. Adachi - Sugie (AS): proposed a new form of a mixing rule which origi-nates from a Redlich-Kister type of equation;41
a =∑i
∑j
xixj√aiaj
(1−Kij +Lij (xi − xj )
)(12.89)
where two binary interaction parameter are introduced for the attractiveinteractions term. A linear average of the b-parameter was maintained(see Equation 12.87b).
Towards Sustainable Solvent-Based Affinity Separations 326

12
12
12
12
12
12
12
12
12
12
12
12
APPENDICES
4. Panagiotopoulos - Reid (PR): proposed an empirical modification of theVan der Waals mixing rule, namely;42
a =∑i
∑j
xixj√aiaj
(1−Kij + (Kij −Kji)xi)
)(12.90)
where the normally symmetric Kij is replaced by an asymmetric Kij .This is however an apparent symmetry, as the final a-parameter is sym-metric meaning that a 50/50% A/B mixture is the same as a 50/50%B/A mixture.
5. Sandoval: proposed a generalized equivalent of the Margules-type ofmixing rule;43
a =∑i
∑j
xixj√aiaj
(1− (Kijxi +Lijxj )−
(Kij +Lij )(1− xi − xj )2
)(12.91)
Also here, a linear average of the b-parameter is used (see Equation 12.87b).
6. Stryjek-Vera (SVm): proposed a nonsymmetric binary interaction pa-rameter is a similar form as the Margules equation;30
a =∑i
∑j
xixj√aiaj
(1−Kijxi +Kjixj
)(12.92)
where, the b-parameter is again assumed to be the linear average (seeEquation 12.87b).
7. Stryjek-Vera (SVvL): proposed a nonsymmetric binary interaction pa-rameter is a similar form as the van Laar equation;30
a =∑i
∑j
xixj√aiaj
(1−
KijKjiKijxi +Kjixj
)(12.93)
where, the b-parameter is again assumed to be the linear average (seeEquation 12.87b).
8. Huron-Vidal Huron and Vidal44 introduced a mixing rule which ap-plied the local composition approach previously seen in the Wilson and
327 Towards Sustainable Solvent-Based Affinity Separations

12
12
12
12
12
12
12
12
12
12
12
12
APPENDICES
NRTL equations. Hence, exactly the same equation is used to describethe Gibbs energy at infinite pressure as in the NRTL equation;
gE∞ =n∑i=1
xi
∑nj=1 xjGjiτji∑nk=1 xkGki
(12.94a)
where
τji = bjexp(−αji
GjiRT
)(12.94b)
In this mixing rule, the bj-parameter is different from the Gibbs excessmodels, and this links the volume, or repulsion, parameter of the equa-tion of state together with the attraction term. Finally, Huron and Vi-dal44 showed these mixing rules;
a = bn∑i=1
xi
aibi − 1√
2
n∑i=1
xi
∑nj=1 xjGjiτji∑nk=1 xkGki
(12.95a)
andb =
∑i
xibi (12.95b)
Note that when the non-randomness factor (αji) is equalized to 0, thena combination of the Van der Waals mixing rules are obtained again.
12.14 Departure Function Derivations
12.14.1 Internal Energy
The non-ideal behavior of a fluid, or the departure from ideality, can be de-scribed by following a pathway. A pathway of a function, e.g. the internal en-ergy, relative to the ideal gas function whereby firstly the temperature, pres-sure and volume are kept constant, and secondly the total deviation with avariation in the volume is subtracted in the ideal situation at isobaric condi-tions.23
Udep = (U −U ig ) = (U −U ig )T V −V ig∫V
(∂U∂V
)igT
dV (12.96)
Towards Sustainable Solvent-Based Affinity Separations 328

12
12
12
12
12
12
12
12
12
12
12
12
APPENDICES
Also, the first right-hand-side term can be written as an integral, which reachesfrom infinity to the volume of the non-ideal fluid;
Udep = (U −U ig ) =
V∫∞
(∂U∂V)T
−(∂U∂V
)igT
dV − V ig∫V
(∂U∂V
)igT
dV (12.97)
The interal energy of an ideal gas is not volume dependent, thus;
Udep = (U −U ig ) =
V∫∞
(∂U∂V
)T
dV (12.98)
For non-ideal fluids, the volume dependency of the internal energy can beanalyzed as follows;(
∂U∂V
)T
=(∂S∂V
)T
(∂U∂S
)T
+(∂U∂V
)(∂T∂T
)(12.99)
With one of the Maxwell relations; (∂S/∂V )T = (∂P /∂T )V and the known re-lations of (∂U/∂S)T = T and (∂U/∂V ) = −P .(
∂U∂V
)T
=(∂P∂T
)V
(∂U∂S
)T
+(∂U∂V
)(∂T∂T
)(12.100)
(∂U∂V
)T
= T(∂P∂T
)V
− P (12.101)
Udep = (U −U ig ) =∫ V
∞
(T
(∂P∂T
)V
− P)dV (12.102)
For convenience, the departure function needs to be rewritten to density andthe compressibility factor, resp. ρ = 1/V and Z. Firstly, converting the equa-tion to the compressibility variable. Knowing that the result has to be in theform of (∂Z/∂T )V , via integration by substitution. The following correlationis obtained;
T
(∂Z∂T
)V
= T((∂P∂T
)V
(∂Z∂P
)V
+(∂Z∂T
)(∂T∂T
))(12.103)
329 Towards Sustainable Solvent-Based Affinity Separations

12
12
12
12
12
12
12
12
12
12
12
12
APPENDICES
T
(∂Z∂T
)V
= T(VRT
(∂P∂T
)V
− P VRT 2
)(12.104)
T
(∂Z∂T
)V
= T(VR
(∂P∂T
)V
−Z)
(12.105)
RT 2
V
(∂Z∂T
)V
+ZRTV
= T(∂P∂T
)V
(12.106)
RT 2
V
(∂Z∂T
)V
+ P = T(∂P∂T
)V
(12.107)
Putting this back in to the departure function.
Udep = (U −U ig ) =∫ V
∞
(RT 2
V
(∂Z∂T
)V
+ P − P)dV (12.108)
Udep = (U −U ig ) = RT∫ V
∞
(TV
(∂Z∂T
)V
)dV (12.109)
Now, the transformation from the volume to density via integration by sub-stitution;
ρ =1V→− 1
ρ2 dρ = dV (12.110)
Udep = (U −U ig ) = −RT∫ ρ
0
T (∂Z∂T
)ρ
dρρ (12.111)
12.14.2 Entropy
The non-ideal behavior of a fluid, or the departure from ideality, can be de-scribed by following a pathway. A pathway of a function, e.g. the entropy,relative to the ideal gas function firstly at which the temperature, pressureand volume are kept constant, and secondly the total deviation with a varia-tion in the volume is subtracted in the ideal situation at isobaric conditions.
Sdep = (S − S ig ) = (S − S ig )T V −V ig∫V
(∂S∂V
)igT
dV (12.112)
Towards Sustainable Solvent-Based Affinity Separations 330

12
12
12
12
12
12
12
12
12
12
12
12
APPENDICES
Also, the first right-hand-side term can be written as an integral, which reachesfrom infinity to the volume of the non-ideal fluid;
Sdep = (S − S ig ) =
V∫∞
( ∂S∂V)T
−(∂S∂V
)igT
dV − V ig∫V
(∂S∂V
)igT
dV (12.113)
Following one of the Maxwell relations; (∂S/∂V )T = (∂P /∂T )V
Sdep = (S − S ig ) =
V∫∞
(∂P∂T)V
−(∂P∂T
)igV
dV − V ig∫V
(∂P∂T
)igT
dV (12.114)
First solving the ideal gas terms, knowing that P = RTV →
(∂P∂T
)V
= RV
Sdep = (S − S ig ) =
V∫∞
((∂P∂T
)V
− RV
)dV −
V ig∫V
(RV
)dV (12.115)
Sdep = (S − S ig ) =
V∫∞
((∂P∂T
)V
− RV
)dV +Rln
( VV ig
)(12.116)
Furthermore, the VV ig
term, can be rewritten via V = ZRTP for an ideal gas
Z = 1, to VV ig
= Z;
Sdep = (S − S ig ) =
V∫∞
((∂P∂T
)V
− RV
)dV +Rln(Z) (12.117)
Sdep = (S − S ig ) = R
V∫∞
(1R
(∂P∂T
)V
− 1V
)dV + ln(Z))
(12.118)
For convenience, the departure function needs to be rewritten to density andthe compressibility factor, resp. ρ = 1
V and Z.Firstly, converting the equation to the compressibility variable. Knowing thatthe result has to be in the form of (∂Z/∂T )V , via integration by substitution.The following correlation is obtained;
331 Towards Sustainable Solvent-Based Affinity Separations

12
12
12
12
12
12
12
12
12
12
12
12
APPENDICES
T
(∂Z∂T
)V
= T((∂P∂T
)V
(∂Z∂P
)V
+(∂Z∂T
)(∂T∂T
))(12.119)
T
(∂Z∂T
)V
= T(VRT
(∂P∂T
)V
− P VRT 2
)(12.120)
T
(∂Z∂T
)V
= T(VR
(∂P∂T
)V
−Z)
(12.121)
TV
(∂Z∂T
)V
+ZV
=1R
(∂P∂T
)V
(12.122)
Putting this back into the departure function;
Sdep = (S − S ig ) = R(∫ V
∞
(TV
(∂Z∂T
)V
+ZV− 1V
)dV + ln(Z)
)(12.123)
Now, the transformation from the volume to density via integration by sub-stitution;
ρ =1V→− 1
ρ2 dρ = dV (12.124)
Sdep = (S − S ig ) = R
∫ ρ
0−
(T ρ
(∂Z∂T
)ρ
+Zρ − ρ)dρ
ρ2 + ln(Z)
(12.125)
Sdep = (S − S ig ) = R
∫ ρ
0−T
(∂Z∂T
)ρ
− (Z − 1)dρ
ρ+ ln(Z)
(12.126)
12.14.3 Enthalpy
Knowing the fact that the enthalpy is related to the internal energy in thefollowing manner;
H =U + P V (12.127)
Then, the departure function for enthalpy holds for;
Towards Sustainable Solvent-Based Affinity Separations 332

12
12
12
12
12
12
12
12
12
12
12
12
APPENDICES
Hdep =Udep + (P V )dep (12.128)
H −H ig
RT=U −U ig
RT+P V − (P V )ig
RT(12.129)
As the ideal gas law is P V = RT ;
H −H ig
RT=U −U ig
RT+P V −RTRT
(12.130)
Then substitute in the result for the internal energy;
Hdep =H −H ig = RT
∫ ρ
0−T
(∂Z∂T
)ρ
dρ
ρ+ (Z − 1)
(12.131)
12.14.4 Fugacity
The excess Gibbs energy has an enthalpic and entropic contribution;
GE = Gdep =Hdep − T Sdep (12.132)
Additionally, the excess Gibbs energy is a function of the fugacity.
GE = Gdep = RT lnϕ (12.133)
By combining the enthalpic and entropic departure functions (Equation 12.126and Equation 12.129), the departure function of the fugacity is obtained;
RT lnf = RT
∫ ρ
0T
(∂Z∂T
)ρ
dρ
ρ+ (Z − 1)
−RT
∫ ρ
0−T
(∂Z∂T
)ρ
− (Z − 1)dρ
ρ− ln(Z)
(12.134)
which results in finally;
lnf =∫ ρ
0(Z − 1)
dρ
ρ+ (Z − 1)− ln(Z) (12.135)
333 Towards Sustainable Solvent-Based Affinity Separations

12
12
12
12
12
12
12
12
12
12
12
12
APPENDICES
12.15 References
[1] M. J. Lazzaroni, D. Bush, C. A. Eckert, T. C. Frank, S. Gupta, and J. D. Olson, “Revision of mosced param-eters and extension to solid solubility calculations,” Industrial & engineering chemistry research, vol. 44,no. 11, pp. 4075–4083, 2005.
[2] H. C. Van Ness, Classical thermodynamics of non-electrolyte solutions. Elsevier, 2015.[3] J. M. Sørensen, T. Magnussen, P. Rasmussen, and A. Fredenslund, “Liquid—liquid equilibrium data: Their
retrieval, correlation and prediction part ii: Correlation,” Fluid Phase Equilibria, vol. 3, no. 1, pp. 47–82,1979.
[4] A. Marcilla, M. Serrano, J. Reyes-Labarta, and M. Olaya, “Checking liquid–liquid plait point conditionsand their application in ternary systems,” Industrial & engineering chemistry research, vol. 51, no. 13,pp. 5098–5102, 2012.
[5] G. N. Lewis and M. Randall, Thermodynamics and the free energy of chemical substances. McGraw-Hill,1923.
[6] R. Clausius, “Über die bewegende kraft der wärme und die gesetze, welche sich daraus für die wärmelehreselbst ableiten lassen,” Annalen der Physik, vol. 155, no. 3, pp. 368–397, 1850.
[7] R. Clausius, “Über eine veränderte form des zweiten hauptsatzes der mechanischen wärmetheorie,” An-nalen der Physik, vol. 169, no. 12, pp. 481–506, 1854.
[8] L. Boltzmann, Über die Beziehung zwischen dem zweiten Hauptsatze des mechanischen Wärmetheorie und derWahrscheinlichkeitsrechnung, respective den Sätzen über das Wärmegleichgewicht. Kk Hof-und Staatsdruck-erei, 1877.
[9] J. Zhang and B. Wang, “Effect of capillarity at liquid–vapor interface on phase change without surfactant,”International Journal of Heat and Mass Transfer, vol. 45, no. 13, pp. 2689–2694, 2002.
[10] J. Van Laar, “Zur theorie der dampfspannungen von binären gemischen,” Zeitschrift für PhysikalischeChemie, vol. 83, no. 1, pp. 599–608, 1913.
[11] G. M. Wilson, “Vapor-liquid equilibrium. xi. a new expression for the excess free energy of mixing.,”Journal of the American Chemical Society, vol. 86, no. 2, pp. 127–30, 1964.
[12] M. Margules, “Uber die zusammensetzung der gesattigten dampfe von mischungen,” Sitzungsber AkadWiss Wien, vol. 104, pp. 1243–1278, 1895.
[13] D. S. Abrams and J. M. Prausnitz, “Statistical thermodynamics of liquid mixtures. new expression for theexcess gibbs energy of partly or completely miscible systems.,” AIChE Journal, vol. 21, no. 1, pp. 116–28,1975.
[14] H. Renon and J. M. Prausnitz, “Local compositions in thermodynamic excess functions for liquid mix-tures.,” AIChE Journal, vol. 14, no. 1, pp. 135–44, 1968.
[15] É. Clapeyron, “Mémoire sur la puissance motrice de la chaleur,” Journal de l’École polytechnique, vol. 14,pp. 153–190, 1834.
[16] I. G. Economou, “Cubic and generalized van der waals equations of state,” Applied Thermodynamics ofFluids, vol. 4, no. 1, p. 53, 2010.
[17] J. D. Van der Waals, Over de Continuiteit van den Gas-en Vloeistoftoestand, vol. 1. Sijthoff, 1873.[18] O. Redlich and J. N. Kwong, “On the thermodynamics of solutions. v. an equation of state. fugacities of
gaseous solutions.,” Chemical reviews, vol. 44, no. 1, pp. 233–244, 1949.[19] G. Soave, “Equilibrium constants from a modified redlich-kwong equation of state,” Chemical engineering
science, vol. 27, no. 6, pp. 1197–1203, 1972.[20] D.-Y. Peng and D. B. Robinson, “A new two-constant equation of state,” Industrial & Engineering Chemistry
Fundamentals, vol. 15, no. 1, pp. 59–64, 1976.[21] N. C. Patel and A. S. Teja, “A new cubic equation of state for fluids and fluid mixtures,” Chemical Engi-
neering Science, vol. 37, no. 3, pp. 463–473, 1982.[22] J. Clerk-Maxwell, “On the dynamical evidence of the molecular constitution of bodies,” 1875.[23] J. R. Elliott and C. T. Lira, Introductory chemical engineering thermodynamics, vol. 184. Prentice Hall PTR
Upper Saddle River, NJ, 1999.[24] T. W. Leland and P. S. Chappelear, “The corresponding states principle—a review of current theory and
practice,” Industrial & Engineering Chemistry, vol. 60, no. 7, pp. 15–43, 1968.[25] L. Darken, “Application of the gibbs-duhem equation to ternary and multicomponent systems,” Journal
Towards Sustainable Solvent-Based Affinity Separations 334

12
12
12
12
12
12
12
12
12
12
12
12
APPENDICES
of the American Chemical Society, vol. 72, no. 7, pp. 2909–2914, 1950.[26] P. J. Flory, “Thermodynamics of high polymer solutions,” The Journal of chemical physics, vol. 10, no. 1,
pp. 51–61, 1942.[27] M. L. Huggins, “Some properties of solutions of long-chain compounds.,” The Journal of Physical Chem-
istry, vol. 46, no. 1, pp. 151–158, 1942.[28] K. S. Pitzer, D. Z. Lippmann, R. Curl Jr, C. M. Huggins, and D. E. Petersen, “The volumetric and ther-
modynamic properties of fluids. ii. compressibility factor, vapor pressure and entropy of vaporization1,”Journal of the American Chemical Society, vol. 77, no. 13, pp. 3433–3440, 1955.
[29] R. Stryjek and J. Vera, “Prsv2: a cubic equation of state for accurate vapor—liquid equilibria calculations,”The Canadian Journal of Chemical Engineering, vol. 64, no. 5, pp. 820–826, 1986.
[30] R. Stryjek and J. Vera, “Prsv: An improved peng—robinson equation of state for pure compounds andmixtures,” The canadian journal of chemical engineering, vol. 64, no. 2, pp. 323–333, 1986.
[31] C. H. Twu, W. D. Sim, and V. Tassone, “A versatile liquid activity model for srk, pr and a new cubicequation-of-state tst,” Fluid Phase Equilibria, vol. 194, pp. 385–399, 2002.
[32] K. Nasrifar and M. Moshfeghian, “A new cubic equation of state for simple fluids: pure and mixture.,”Fluid Phase Equilibria, vol. 190, no. 1-2, pp. 73–88, 2001.
[33] G. G. Fuller, “A modified redlich-kwong-soave equation of state capable of representing the liquid state,”Industrial & Engineering Chemistry Fundamentals, vol. 15, no. 4, pp. 254–257, 1976.
[34] G. Schmidt and H. Wenzel, “A modified van der waals type equation of state,” Chemical EngineeringScience, vol. 35, no. 7, pp. 1503–1512, 1980.
[35] A. Harmens and H. Knapp, “Three-parameter cubic equation of state for normal substances,” Industrial& Engineering Chemistry Fundamentals, vol. 19, no. 3, pp. 291–294, 1980.
[36] J. O. Valderrama, “A generalized patel-teja equation of state for polar and nonpolar fluids and their mix-tures,” Journal of chemical engineering of Japan, vol. 23, no. 1, pp. 87–91, 1990.
[37] F. Esmaeilzadeh and M. Roshanfekr, “A new cubic equation of state for reservoir fluids,” Fluid PhaseEquilibria, vol. 239, no. 1, pp. 83–90, 2006.
[38] M. A. Trebble and P. R. Bishnoi, “Development of a new four-parameter cubic equation of state.,” FluidPhase Equilibria, vol. 35, no. 1-3, pp. 1–18, 1987.
[39] J. M. Smith, “Introduction to chemical engineering thermodynamics,” 1950.[40] M. Michelson, “On composition-dependent interaction coefficients,” Fluid Phase Equilib., vol. 5, pp. 229–
230, 1990.[41] Y. Adachi and H. Sugie, “A new mixing rule—modified conventional mixing rule,” Fluid Phase Equilibria,
vol. 28, no. 2, pp. 103–118, 1986.[42] A. Panagiotopoulos and R. Reid, “New mixing rule for cubic equations of state for highly polar, asymmet-
ric systems,” ACS Publications, 1986.[43] R. Sandoval, G. Wilczek-Vera, and J. Vera, “Prediction of ternary vapor-liquid equilibria with the prsv
equation of state,” Fluid Phase Equilibria, vol. 52, pp. 119–126, 1989.[44] M.-J. Huron and J. Vidal, “New mixing rules in simple equations of state for representing vapour-liquid
equilibria of strongly non-ideal mixtures,” Fluid Phase Equilibria, vol. 3, no. 4, pp. 255–271, 1979.
335 Towards Sustainable Solvent-Based Affinity Separations


13
13
13
13
13
13
13
13
13
13
13
13
13
13Acknowledgements
"I only read the Acknowledgements",Pretty much everyone

13
13
13
13
13
13
13
13
13
13
13
13
13
ACKNOWLEDGEMENTS
The last chapter to write, though for most, the first chapter to be read. Thecreation of a booklet like this could never be done without the support, collab-oration and all non-essential, but very important, (food and drink) activitieswith so many people around me over the past 5 years.
The first person I would like to thank is Boelo. The start of this adventurecan be traced back to a bar in Chile. I realize now that this was already in2014. I don’t know anymore how it came to the subject of my master assign-ment. But, after that night I chose a subject and after my internship I startedto work on liquid-liquid extractions. Not knowing, that I would stay in thisresearch field until 2021! You are someone with an endless enthusiasm andknowledge about separation technology and life as an academic scholar. Icould not have wished for a better supervisor, as you gave me a lot of freedomto explore my own ideas. Though when I needed some advice, guidance ora critical comment, you always helped me along. In the end, I am proud todeliver this dissertation and this could never happened without you. ManyPhD’ers often say that 4 years of research is more than enough. I am happyto say that I am not one of them. If I could continue this research for another4 years, I would have done this with absolute pleasure. The very pleasantcollaboration between us is I think a big reason behind this. Secondly, I wantto the thank Sascha. Your part in guiding me to (re)think about everythingfrom another point of view was crucial to the quality of this work. Your open-ness to always discuss light subject matters (or hobbies) such as fundamentalthermodynamics, helped me out tremendously. Also, your way of performingresearch appealed to me and together with Boelo made me the researcher Iam today.Furthermore, I want to thank all members of the SPT-group. Louis, you area pillar within the student chemical engineering community. I can say somany things, but I will always remember the courses we gave together. Itwas the first time I gave lectures, and I really enjoyed doing that. Wim, Iadmire your infinite enthusiasm, ideas and energy in everything you do. I en-joyed the years I could work closely with you in teaching transport phenom-ena and thinking of new projects to prickle students to enjoy this complextheory. Jean-Paul, I enjoyed our discussions we had over the years. Your real-istic vision about the sustainable future allowed me to distinguish many factsfrom fiction. Pilar, last year you were bombarded with many new (COVID19)-
Towards Sustainable Solvent-Based Affinity Separations 338

13
13
13
13
13
13
13
13
13
13
13
13
13
ACKNOWLEDGEMENTS
responsibilities and this didn’t kept you from spreading the air of positivity.I enjoyed working together with you to fill-up (legally) the offices in theseweird times. Lastly, I want to thank Wim, Henk, Edwin and Maik for beingpart of the ever so growing SPT group.Everything can break, and definitely in the presence of me. Therefore, theskilled hands of Benno, Johan, Karst and Ronald have been indispensable.Thank you so much! Erna, I enjoyed our many talks regarding the vari-ous analysis equipments I was super-user of. I always appreciated the quickresponses to my questions or notification that something broke in the lab.Yvonne, thank you for the support over the years and your essential knowl-edge about by-passing the hopeless, unnecessary and bureaucratic systems ofthe UT. How you manage to do this for all SPT members is still a mystery forme. Floris, why didn’t you join us a few years earlier? I really enjoyed work-ing with you in synthesizing new solvents, if we started earlier we could havedone so many more things!
I want to thanks all committee members for agreeing to be part of my pro-motion committee and reading my dissertation. In particular, I want to thankGerrald for the many, very constructive, discussions we had over the years.Your critical eye was highly valued and improved all my publications of whicha couple we share. In addition, I would like to thank Antoon for the discus-sions about thermodynamics. I also want to thank Saskia for introducing meinto the fascinating world of complex coacervates. I enjoyed our trip to Ox-fordshire and working with a particle accelerator is something I will neverforget.
It took 5 years to finish this dissertation. During this time I worked together,shared an office and did so many fun stuff with many fellow PhD/PDEng/Post-Doc students. Though firstly, I want to mention my paranympfs. Vincent, wemet back in 2009. You introduced me to the student life, we were both (a lit-tle bit) active as bartenders. Although our opinion on many subject mattersdiffer, this doesn’t withhold us of having much fun. Martijn, we know eachother from 2011, though we spoke much more during the COVID19-times,where we worked back-to-back in an almost empty office. You say that no-body understands electrochemistry, though I believe if someone can figure itout, it is you. (and otherwise, just drink your Amstel beer). I am very glad
339 Towards Sustainable Solvent-Based Affinity Separations

13
13
13
13
13
13
13
13
13
13
13
13
13
ACKNOWLEDGEMENTS
that both of you agreed to be my paranympfs!And here comes the summation.... Vahideh, good luck with your researchand the damn difficult PHA analyses. I will keep an eye on your paper in thefuture! Angelo, the most awesome Swiss person I know. We met several timesin Enschede, but also abroad and I really enjoyed your company. Please al-ways remember your Dutch one-liner, may it be a nice subtitle of your thesis.Tomas, extreme (chemical) engineering, that is the first thing that comes tomind if I think of your research. High temperatures, burning stuff, right upyour alley and you do it with a wide smile :). Tessa, you just started up yourproject and gave immediately an atmosphere boost in the office. I know thateverything will work out and you can combine your interest in textiles withCO2 capture. Thimo, besides our shared interest of Formula 1, I enjoyed ourmany discussions about our projects. They may be very different, but I havelearned much from our conversations and admire your way of navigating themaze called biomass research. Lionel, I envy your skills in simulating reac-tive distillation and your way of explaining complex matter simply, and I lookforward to your publications. Enas, I enjoyed our trip to Barcelona when wewere in Sitges. It was so much fun. Michel, my office neighbour, I will alwaysremember our "nareis" in Peru and Bolivia. It was a great trip. Yordi, thoughmost of the time you worked in your own bunker, I liked working with you inthe PCT course. Mahsa, good luck with the centrifugal extractors and thankyou for co-supervising several students. Tim, you are a wizard. Everythingyou touch, a computer gets a feeling. A feeling of compiling a working codewhich can accurately simulate complex reactors. I am very curious whereyour research will bring you. Shahab, many weekends we discuss at lengthwhy some Formula 1 drivers suck, and send (in)appropriate messages illus-trating that. I wish you still good-luck with all your deadly cyano-compounds.Jasper, you have taken over many of my teaching responsibilities. So far Icould see, you can handle it with ease. I think you will help Wim to improvethe course even more! Alan, good luck with your research in modelling DESsand biomass, this is not a easy feat! Ehsan, you were my neighbor for thefirst 3 years. I enjoyed our joined efforts in writing up and modeling "funky"processes and your kind and always interested presence in the office and thelab. Lisette, I am always amazed how much you can do every week. I re-ally think your days have 40 hours in it. Thank you for the many trips wehad together, I always enjoyed it. Chiel, the PDEng pioneer. We go way back
Towards Sustainable Solvent-Based Affinity Separations 340
13
13
13
13
13
13
13
13
13
13
13
13
13
ACKNOWLEDGEMENTS
and I remember our many long evenings/nights as bartenders. You are amaz-ing in creating new set-ups and still your potato drying set-up is being used!Pushkar, I will never forget your wedding. I was honored to attend. Also, Iadmire your scientific curiosity and appreciate the many discussions we hadover the years. Varsha, thank you for being such a nice colleague. I alwayswill remember your fanatic you were with card games. Marek, thank youfor supervising me during my master assignment. Your detailed knowledgeabout separation technology was very valuable. I wish you much happinesswith Sandra. Surika, I really enjoyed our trip to Florence. You are a great(supercritical) colleague to have, and not only because the African languageis amazing. Martin, hidden away at the end of the office, but always know-ing exactly what is happening. I was sad to miss your wedding, but we willsee each other in the future as (again) colleagues! :) Rick, I always admiredyour attention to detail and the depth of your research. You make everythingseem so simple. Also, you are immensely sociable and undoubtedly we willsee each other in the future. Juraj, awesome dancing skills. That is the firsttime that comes to mind. Thank you for your time at SPT, I always enjoyedbeing around you. Natalia, I always enjoyed for company, the many sweetsyou made and of course the (light) alcoholic drinks you needed to share withus all. Dion, I enjoyed our trip to Sitges. Urmi, I liked our discussions andyour scientific curiosity. You will do well as an (assistant) professor in In-dia. Lastly, I would like to mention the remaining PhD’ers, Evelyn, Catarina,Maryam and An.
Over the years I had the privilege of supervising many students. Many ideasdidn’t end up in my dissertation, but was nonetheless essential to its comple-tion. As Bachelor students; Joep and Peter for working on my idea of addingelectrolytes in solvent extraction. Vera and Sjoerd for your extraction work.Joram, Joey and Nikki for the Deep Eutectic Solvent extraction work. Daniel,Rick and Thijs for your work in applying complex coacervates for separationcases and Remko for your process simulation work.As Master students; Esther for being my first student to supervise. Your workcould directly be applied in several chapters. Bas for your ability to conquerCOSMO-RS, simulating and experimentally determining SLE behavior of hy-drophobic DESs. Emma, I enjoyed our short time in chiral separations. KoenE., thank you for so much effort in the xylene isomer separations. My idea
341 Towards Sustainable Solvent-Based Affinity Separations
13
13
13
13
13
13
13
13
13
13
13
13
13
ACKNOWLEDGEMENTS
didn’t worked out, it wasn’t easy, but your research was very sound. Besidesmy "regular" work, I enjoyed supervising work on the magnetic extractor (orBoelo Extractor). Stef, your theoretical work into the drag of slugs throughthe micro channels. Styrmir, for extending the theoretical work with Jeffto greater heights in COMSOL and proposing essential set-up adaptations tosolve operation issues. Bob, your experimental work in finding the operationwindow. Rutger and Koen W. for developing a reproduceable ferrofluid syn-thesis. Erik, your extractive distillation work with DESs had many troubles,but your enthusiasm will not be forgotten. The projects of Hilbert (extractivedistillation of acids), Jesse (styrene/ethylbenzene separation using Cyrenewith or without a divided wall column configuration), Jorrit (olefin/paraffinseparation with Cyrene and Cygnet) and Simon (olefin/paraffin separationwith mixed composite solvents containing Cyrene) are not yet finished, butwill undoubtedly end with very nice theses.
Of course, work is not all. I want to mention Gerardo, Kristianne, Carmen,Floris, Mitchel, Robin, Roy, Steven and Wilmar. We started our studies to-gether and still we see each other regularly. I hope this will never end :). Ialways enjoy a good wine/beer, much food, sometimes an (online) pubquiztogether with Mariël, and the opportunity to share this with many other cou-ples (you know who I mean) hopefully never end.Natuurlijk kan ik de familie niet vergeten. Wout en Karin voor altijd julliesupport. Al jaren snappen mijn broertjes precies wat ik doe. Protonen, ionenen neutronen doen namelijk dingen. Nou dat klopt. Veel leesplezier, Freek enSuus, Alex en Bas. Verder wil ik mijn schoonfamilie (Johan, Wilma, Nadine,Jordi, Bertwin en Aada) ook enorm bedanken (kiitos) voor alle gezelligheidover de jaren heen. Ik had me geen leukere schoonfamilie kunnen wensen.
Tenslotte, wil ik natuurlijk Mariël gigantisch in het zonnetje zetten. Wijzijn samen in het PhD avontuur gestapt. Alhoewel de afgelopen jaren onzePhD ervaring flink uiteenliepen, konden we altijd alles met elkaar bespreken.Wellicht was het soms niet zo evident, maar ik heb net zo veel aan jou gehadals jij aan mij. We hebben veel gezamelijk interesses zoals reizen en vaakuiteten gaan en ik prijs me daarom erg gelukkig met het feit dat wij hetzelfdein het leven staan. Op naar een gelukkig en erg lange toekomst, van mij komje niet meer af. ;)
Towards Sustainable Solvent-Based Affinity Separations 342


About the Author
Thomas Brouwer was born on April 5th 1991 in Deventer, The Netherlands.He grew up in Diepenveen, after which he moved to Enschede in 2009 tostudy Chemical Engineering at the University of Twente. The title of hisBachelor’s thesis was “Fabrication and Photocatalytic Assessment of a PDMS-based Microreactor with Focus on Atrazine as an Organic Degradation ModelCompound” at the Soft Matter, Fluidics and Interfaces (SFI) group. Duringhis master’s, he did an internship at the South Africa Institute of AdvancedMaterial Chemistry (SAIAMC) at the University of the Western Cape. He per-formed research on “Commissioning a Pd-membrane set-up combination with aPEMFC fuel Cell”. He did his master thesis at the Sustainable Process Tech-nology (SPT) group at the University of Twente on “Reactive Extraction andRecovery of Levulinic Acid from an acidic aqueous solution" under the supervi-sion of Marek Blahušiak and Boelo Schuur.This dissertation was written at the time when hewas working on "Affinity Separations" in the Sus-tainable Process Technology Group (SPT) under theguidance of Boelo Schuur. This project is part of theInstitute of Sustainable Process Technology cluster"Energy Efficient Bulk Liquid Separation". The aimof the project is the development of Liquid-LiquidExtractions and Extractive Distillations as alterna-tives for traditional distillations. The emphasis willbe on the fundamental understanding of affinities inseparations, though not excluded the sustainability aspects. The last 2 yearsof he performed this research part-time, as the remainder of the time wasspent as a teacher within the SPT group.
345 Towards Sustainable Solvent-Based Affinity Separations


Publications
Main Articles in Peer-reviewed Journals
Brouwer, T. and Schuur, B., "Model performances evaluated for infinite dilutionactivity coefficients prediction at 298.15 K", Industrial & Engineering Chem-istry Research, ACS Publications, 2019, 58, 20, 8903-8914.
Brouwer, T., Kersten, S.R.A., Bargeman, G. and Schuur, B., "Trends in SolventImpact on Infinite Dilution Activity Coefficients of Solutes Reviewed and Visual-ized Using an Algorithm to Support Selection of Solvents for Greener Fluid Sepa-rations", (Article Submitted)
Brouwer, T., Kersten, S.R.A., Bargeman, G. and Schuur, B., "Solvent Pre-Selectionfor Extractive Distillation using Infinite Diluted Activity Coefficients and the 3-component Margules Equation", (Ready for Submission)
Brouwer, T. and Schuur, B., "Bio-based Solvents as entrainers for ExtractiveDistillation in Aromatic/Aliphatic and Olefin/Paraffin Separation", Green Chem-istry, The Royal Society of Chemistry, 2020, 22, 16, 5369-5375.
Brouwer, T. and Schuur, B., "Dihydrolevoglucosenone (Cyrene), a Biobased Sol-vent for Liquid–Liquid Extraction Applications", Sustainable Chemistry & Engi-neering, American Chemical Society, 2020, 8, 39, 14807-14817.
Brouwer, T. and Schuur, B., "Biobased Entrainer Screening for Extractive Distil-lation of Acetone and Diisopropyl ether ", (Article Submitted)
Brouwer, T. and Schuur, B., "Comparison of Solvent-based Affinity Separation
347 Towards Sustainable Solvent-Based Affinity Separations

PUBLICATIONS
Processes with Cyrene and Sulfolane for Aromatic/Aliphatic Separations", (ArticleSubmitted)
Brouwer, T., Crespo, E.A., Bargeman, G., ten Kate, A.J.B., Coutinho, J.A.P.,Kersten, S.R.A. and Schuur, B., "Isobaric Vapor-Liquid Equilibrium predictionfrom the Excess Molar Enthalpy using cubic Equation of States and PC-SAFT.",(Article in Preparation)
Other Articles in Peer-reviewed Journals
Brouwer, T., Blahusiak, M., Babic, K. and Schuur, B., "Reactive extraction andrecovery of levulinic acid, formic acid and furfural from aqueous solutions con-taining sulphuric acid", Separation and purification technology, Elsevier, 2017,185, 186-195.
Reyhanitash, E., Brouwer, T., Kersten, S.R.A., Van der Ham, A.G.J. and Schuur,B., "Liquid–liquid extraction-based process concepts for recovery of carboxylic acidsfrom aqueous streams evaluated for dilute streams", Chemical Engineering Re-search and Design, Elsevier, 2018, 137, 510-533.
Schuur, B., Brouwer, T., Smink, D. and Sprakel, L.M.J.,"Green solvents forsustainable separation processes",Current Opinion in Green and SustainableChemistry, Elsevier, 2019, 18, 57-65.
Schuur, B., Brouwer, T. and Sprakel, L.M.J.,"Recent developments in solventbased fluid separations", Chemical and Biomolecular Engineering, Annual Re-views, 2021, .(Article Submitted)
Van Lente, J., Pazos Urea, M., Brouwer, T., Schuur, B. and Lindhoud, S.,"ComplexCoacervates as Extraction Solvents", (Article Submitted)
Brouwer, T., van Lin, R., ten Kate, A.J.B., Schuur, B. and Bargeman, G., "TheInfluence of Solvent and Acid Properties on the Relative Volatility and Separation
Towards Sustainable Solvent-Based Affinity Separations 348

PUBLICATIONS
Selectivity for Extractive Distillation of Close-Boiling Acids", (Article Submitted)
Brouwer, T., Dielis, B., Bock, J.M. and Schuur, B, "Hydrophobic Deep EutecticSolvents for Recovery of Secondary Metabolites" (working title), (Article in Prepa-ration)
Conference Contributions
Oral Presentation
Brouwer, T. and Schuur, B., "Reactive Extraction of Levulinic acid, Formic acidand Furfural from Aqueous Solutions containing Sulphuric Acid” at DECHEMAat Cologne, Germany (8th of March 2017)
Brouwer, T. and Schuur, B., "Reactive Extraction of Levulinic acid, Formic acidand Furfural from Aqueous Solutions containing Sulphuric Acid” at CHAINS atVeldhoven, The Netherlands (7th of December 2017)
Brouwer, T. and Schuur, B., "Predictive Models for Infinite Diluted Activity Co-efficients” at 5th International Conference on Methods and Materials for Sep-aration Processes “Separation Science – Theory and Practice 2018 at KudowaZdrój, Poland (28th of August 2018)
Brouwer, T., Slouwerhof, E. and Schuur, B., "Deep Eutectic Solvents: A NewGeneration of Extractive Distillation Agents” at 4th International Conference onIonic Liquids in Separation and Purification Technology, Sitges, Spain (9th ofSeptember 2019)
Brouwer, T. and Schuur, B., "Evaluation of Biobased Solvents for Solvent-BasedAffinity Separations” at CHAINS at Veldhoven, The Netherlands (10th of De-cember 2019)
Brouwer, T. and Schuur, B., "Biobased Solvents for the Separation of Apolar Mix-tures using Extractive Distillation” at ARISE-GIN Conference, Enschede, The
349 Towards Sustainable Solvent-Based Affinity Separations

PUBLICATIONS
Netherlands (Digital) (6th of October 2020)
Poster Presentation
Brouwer, T. and Schuur, B., "Predictive models for γ∞” at Nederlands Proces-technologen Symposium 15 at Enschede, The Netherlands (30th and 31st ofMay 2018)
Brouwer, T., Oosterhoff, R.C., Engelen, T.R., Schuur, B. and Lindhoud, S.,"The Extraction and Recovery of Volatile Fatty Acids with a Complex Coacervate”at CHAINS at Veldhoven, The Netherlands (4th and 5th of December 2018)
Brouwer, T. and Schuur, B., "Model Performances Evaluated for Infinite Dilu-tion Activity Coefficients Prediction at 298.15K at 12th European Congress ofChemical Engineering at Florence, Italy (15th to 19th of September 2019)
Towards Sustainable Solvent-Based Affinity Separations 350