
Sub-second liquid chromatographic separations by means of shear-driven chromatography
10
Journal of Chromatography A, 979 (2002) 33–42 www.elsevier.com / locate / chroma Sub-second liquid chromatographic separations by means of shear-driven chromatography a, a b c d d d * D. Clicq , N. Vervoort , R. Vounckx , H. Ottevaere , J. Buijs , C. Gooijer , F. Ariese , a a G.V. Baron , G. Desmet a Department of Chemical Engineering, Vrije Universiteit Brussel, Pleinlaan 2, 1050 Brussels, Belgium b Department of Electronics, Vrije Universiteit Brussel, Pleinlaan 2, 1050 Brussels, Belgium c Department of Applied Physics & Photonics, Vrije Universiteit Brussel, Pleinlaan 2, 1050 Brussels, Belgium d Department of Analytical Chemistry and Applied Spectroscopy, Vrije Universiteit Amsterdam, De Boelelaan 1105, 1081 HV Amsterdam, The Netherlands Abstract Utilizing the concept of shear-driven chromatography, we have been able to realize reversed-phase LC separations in flat rectangular nano-channels coated with a C monolayer and being as thin as 100 nm. At this scale, the separation kinetics are 8 strongly enhanced, as is witnessed by the extremely short time (,0.1 s) needed to separate a mixture of coumarin dyes. The observed plate numbers are still relatively small, because the experiments were conducted in ultra-short columns (#1 mm) and under injection band width-limiting conditions. 2002 Published by Elsevier Science B.V. Keywords: Shear-driven chromatography; Instrumentation; Injection bands; Coumarins; Dyes 1. Introduction analysis has, amongst others, been presented by Moore and Jorgenson [4], Jacobson et al. [5] and ¨ In the past decades, large experimental efforts Kutter et al. [6]. Demonstrations of the generation of have been devoted to increase the velocity of LC over 1 000 000 theoretical plates in less then 46 s separations. With the advent of the so-called labora- [7], the separation of five polycyclic aromatic hydro- tory on-a-chip approach [1–3], allowing one to carbons in less than 5 s [8], and even sub-milli- pursue the kinetic advantages of miniaturized flow second separations of Rhodamin B and dichloro- and separation systems, and with the ever growing fluorescein [9] have been reported as well. demand for increased separation capacity coming In a novel approach, aiming at the omission of the from the field of pharmaceutical research and clinical problems related to the lack of robustness and the diagnostics, the interest in rapid separations has even fluid composition dependence of the migration times further increased. By switching to electrically driven in capillary electrochromatography (CEC) [10], we systems, groundbreaking work in the field of rapid have recently proposed [11] the technique of shear- driven flow chromatography (SDC). This novel approach is based on the use of an axially split *Corresponding author. Tel.: 132-2-629-3617; fax: 132-2- channel system, consisting out of two highly 629-3248. E-mail address: [email protected] (D. Clicq). polished flat surfaces, into one of which a half-open 0021-9673 / 02 / $ – see front matter 2002 Published by Elsevier Science B.V. PII: S0021-9673(02)01264-5
-
Upload
independent -
Category
Documents
-
view
3 -
download
0
Transcript of Sub-second liquid chromatographic separations by means of shear-driven chromatography

Journal of Chromatography A, 979 (2002) 33–42www.elsevier.com/ locate/chroma
S ub-second liquid chromatographic separations by means ofshear-driven chromatography
a , a b c d d d*D. Clicq , N. Vervoort , R. Vounckx , H. Ottevaere , J. Buijs , C. Gooijer , F. Ariese ,a aG.V. Baron , G. Desmet
aDepartment of Chemical Engineering, Vrije Universiteit Brussel, Pleinlaan 2, 1050Brussels, BelgiumbDepartment of Electronics, Vrije Universiteit Brussel, Pleinlaan 2, 1050Brussels, Belgium
cDepartment of Applied Physics & Photonics, Vrije Universiteit Brussel, Pleinlaan 2, 1050Brussels, BelgiumdDepartment of Analytical Chemistry and Applied Spectroscopy, Vrije Universiteit Amsterdam, De Boelelaan 1105,
1081 HV Amsterdam, The Netherlands
Abstract
Utilizing the concept of shear-driven chromatography, we have been able to realize reversed-phase LC separations in flatrectangular nano-channels coated with a C monolayer and being as thin as 100 nm. At this scale, the separation kinetics are8
strongly enhanced, as is witnessed by the extremely short time (,0.1 s) needed to separate a mixture of coumarin dyes. Theobserved plate numbers are still relatively small, because the experiments were conducted in ultra-short columns (#1 mm)and under injection band width-limiting conditions. 2002 Published by Elsevier Science B.V.
Keywords: Shear-driven chromatography; Instrumentation; Injection bands; Coumarins; Dyes
1 . Introduction analysis has, amongst others, been presented byMoore and Jorgenson [4], Jacobson et al. [5] and
¨In the past decades, large experimental efforts Kutter et al. [6]. Demonstrations of the generation ofhave been devoted to increase the velocity of LC over 1 000 000 theoretical plates in less then 46 sseparations. With the advent of the so-called labora- [7], the separation of five polycyclic aromatic hydro-tory on-a-chip approach [1–3], allowing one to carbons in less than 5 s [8], and even sub-milli-pursue the kinetic advantages of miniaturized flow second separations of Rhodamin B and dichloro-and separation systems, and with the ever growing fluorescein [9] have been reported as well.demand for increased separation capacity coming In a novel approach, aiming at the omission of thefrom the field of pharmaceutical research and clinical problems related to the lack of robustness and thediagnostics, the interest in rapid separations has even fluid composition dependence of the migration timesfurther increased. By switching to electrically driven in capillary electrochromatography (CEC) [10], wesystems, groundbreaking work in the field of rapid have recently proposed [11] the technique of shear-
driven flow chromatography (SDC). This novelapproach is based on the use of an axially split*Corresponding author. Tel.:132-2-629-3617; fax:132-2-channel system, consisting out of two highly629-3248.
E-mail address: [email protected](D. Clicq). polished flat surfaces, into one of which a half-open
0021-9673/02/$ – see front matter 2002 Published by Elsevier Science B.V.PI I : S0021-9673( 02 )01264-5

34 D. Clicq et al. / J. Chromatogr. A 979 (2002) 33–42
channel is recessed. By axially moving one part past thickness of 4mm, confirming that LC type sepa-the other, a flow system is obtained wherein the fluid rations can indeed be effectuated without an exter-velocity is mechanically imposed along each point of nally imposed flow driving gradient [15]. In thethe channel length [12]. As a consequence, the present contribution, we report on the recent progressestablished flow-rates are perfectly predictable and we made. Due to a switch to more advancedreproducible and do not depend upon a sensitive detection technology, we have now been able toparameter such as the channel wall zeta-potential, as downscale the thickness of our separation channelsis the case in electrically driven systems. Further- to the ultimately pursued 100-nm level. Using anmore, as the SDC concept is devoid of any pressure air-cooled fluorescence CCD camera and injectingof voltage gradient limitation, and as there are no strongly fluorescing coumarin dyes, real-time imagesproblems of double-layer overlap, it opens the road of nano-channel separations could be made.towards a new range of enhanced separation kinetics:as it allows to use channels with a sub-micronthickness (which is highly advantageous because the
2 . Experimentalspeed of chromatographic separation is known to
22scale according tod [13]) without any limitationon the applicable fluid velocity, it has the potential to 2 .1. Apparatus and experimental set-upbreak the 100 000 plates/s limit [11]. The majorhurdle on the road to the realization of the full A schematic view of the used experimental set-upseparation potential of SDC is, however, the required is shown in Fig. 1. The heart of the set-up is andegree of miniaturization of the injection and de- upright epi-fluorescence microscope (Nikon Mi-tection facilities. The need to inject and detect crophot-FXA, Cetec, Belgium), equipped with a UV-minute sample amounts in a reproducible and suffi- 1 filter cube set (UV-2A, MBE-14100, Cetec), withciently sensitive way is a problem which is common excitation at 350 nm and emission above 450 nm,to all miniaturized separation techniques, but with allowing to use the light of a Hg-vapor lamp (Nikonthe envisioned extreme dimensions of the SDC HB 101-AF, Cetec) to excite the coumarin dyes ofchannels, the problem is of course more critical. The the test samples in the UV and to detect the emittedSDC system, however, also displays a number of fluorescent light around 460 nm. The (movable)unique features which can be exploited to facilitate bottom part of the SDC channels is attached to theand enhance the injection and detection [14]: the microscope table by putting it in a stainless steelopen-channel format enabling the application ofnovel stationary phase micromachining techniques,the sub-micron channel thickness enabling the in-corporation of a transversally running light pipe forUV–Vis absorption detection.
In a series of progressively demanding experi-ments, we are now working on the demonstration ofthe practical feasibility of the SDC concept. First aseries of nano-channel tracer flow experiments hasbeen conducted [12], showing that the establishedfluid velocity in SDC always exactly equals one-halfof the imposed moving wall velocity, independentlyof the viscosity, the pH and the conductivity of theliquid, and showing that the use of axially splitchannels does not create any undesired side-waysleakages. In a next step, we have realized a series ofFig. 1. Schematic drawing (not to scale) of the experimentalpreliminary separations of Methylene Blue/ set-up (motorized linear displacement system used to translate theRhodamin B colour tracers in printed channels with a microscope table is not represented).
D. Clicq et al. / J. Chromatogr. A 979 (2002) 33–42 35
fixation frame mounted on top of the microscope 2 .2. Channel manufacturingtable. The (stationary) top part of the SDC channelsis then positioned underneath the objective lens (34 The half-open nano-channels needed for themagnification and UV transparent, Nikon CE Plan stationary wall part of the SDC channels wereAchromat, Cetec) using an in-house made attachment obtained by reactive ion etching using a CHF -3
piece already described previously [14]. With this plasma in a Plasma-therm Batchtop IV-oven (TPS,approach, the set-up is kept very compact and the UK). The channels were recessed in flat polishedposition of the channel can be controlled very fused-silica substrates (Plan Plate 390116, Linosprecisely. Photonics, The Netherlands) and always ran across
The separations were visualized using an air- the entire length (L515 mm) of the stationary wallcooled CCD fluorescence camera (ORCA-ER substrates. They were typically 4 mm wide. ChannelsC4742-95, Hamamatsu Photonics, Belgium) mounted with different etch depths, all ranging between 100on the video adapter of the microscope. The camera and 1000 nm, were prepared. The exact depth of thecould be operated at a frame rate of 53 Hz when channels was investigated using a WYKO depth-operated in the 838 binning mode. The video frames profiling system (Veeco Instruments, UK). With thiswere digitally captured using a Matrox-Meteor2-Dig laser-interferrometry based measurement system,card (Hamamatsu Photonics). The video images were large parts of the surface (scan field50.9131.2 mm)subsequently analyzed with the accompanying Sim- can be inspected in a single step with a spatial
2ple-PCI 4.0 software. resolution of about 12mm (3683238 pixels for theThe microscope was mounted on a breadboard 0.9131.2-mm scan field) and with a depth resolution
(M-IG 23-2, Newport, The Netherlands), together around 1 nm. As the apparatus furthermore enableswith a linear displacement stage (M-TS100DC.5, stitching mode measurements, highly accurate depthNewport) equipped with a stepping motor profile scans of the entire channel can be made. For(UE611CC, Newport) and a speed controller (MM, the moving wall part of the SDC channels, another4006 Newport). This system offers a positioning flatly polished fused-silica glass plate (Plan Plateaccuracy of 0.5mm and provides a displacement 390118, Linos Photonics) was used. This plate had avelocity range going from 1mm/s up to 10 cm/s. flatness ofl /20 (l5512 nm), and was substantiallyUsing another in-house made connection piece, the larger (i.e., 5 cm) than the stationary wall plate. Themotorized displacement stage was used to automat- latter is needed to ensure a sufficient travel length.ically translate the microscope table, both during the For the derivatization of the channel walls, ainjection procedure (see Section 2.3) and the sub- protocol similar to the one described in Ref. [16] hassequent separation runs. been used. Briefly, the fused-silica plates were first
Prior to each series of runs, it was ensured that the sequentially rinsed with 1M potassium hydroxide,stationary and moving channel part were in perfect 0.03M hydrochloric acid, purified water and HPLC-contact, by verifying that no fluorescence light is grade methanol (cas no. 67-56-1, Fluka, Belgium) foremitted from the surface parts adjacent to the 30 s each. The plates were then dried overnight atrecessed channel. At this position, both channel parts 1108C. Subsequently, the fused-silica plates werenormally should be in intimate contact. When the put into a 10% (w/w) solution of chloro-sample liquid spreads outside the recessed channel dimethyloctylsilane (cas no. 14799-93-0, Sigma–Al-opening, this is an indication of the fact that the drich, Belgium) in toluene for 24 h at room tempera-channel parts are not well positioned (e.g., because ture. Afterwards, the silica plates were sequentiallyof the presence of a dust particle). This also implies washed with toluene and methanol, and dried withthat the thickness of the fluid layer in the channel is purified air.much larger than the nominal depth of the channel.This of course leads to undesired peak broadening. 2 .3. Injection mode, and sample and mobile phaseWhen such a mismatch of the channel parts was compositionnoted, both parts were removed and thoroughlycleaned with pure methanol. The test samples were prepared by mixing and

36 D. Clicq et al. / J. Chromatogr. A 979 (2002) 33–42
dissolving two different coumarin dyes (coumarin of the limited capture rate of our CCD detectionC440, cas no. 26093-31-2; and coumarin C460, cas system.no. 91-44-1, both purchased from Across Organics,Geel, Belgium) into different water–methanol solu-tions with variable volume ratio. In all the separation 3 . Experimental resultsexperiments, the coumarins C440 and C460 were
23injected at a concentration of 1.5310 M each, in3 .1. Channel manufacturingorder to have a sufficientS /N ratio. Working in the
838 binning mode, and carefully selecting the rightFig. 2 shows a cross-sectional WYKO scan of onefocal plane, the detection limit for the coumarins was
24 of the reactive ion etched SDC channels used in thefound to be of the order of 1310 M. The mobilepresent study. The channel cross-section clearlyphase was prepared by mixing the appropriate per-displays the desired rectangular shape. The readercentage of HPLC-grade methanol in purified watershould also note the extreme aspect ratio: thex-scale(Nanopure II, Barnstead, Van Der Heyden, Belgium).is in millimeters, whereas they-scale is in nanome-Narrow sample plugs (order 100mm) were in-ters. The average depth of the channel is aboutjected using a dedicated injection procedure already120 nm. The maximal average depth variation overdescribed previously [14]. Briefly, the procedurethe entire channel length of 15 mm typically is aboutoccurs in four successive steps. In the first step, the10 nm. The surface roughness of the fused-silicamobile phase present in the reservoir in front of thesubstrates is clearly increased by the etching process,channel is removed by aspirating it away using aas can be noted from the fact that the surface in theflexible tube with a modified pipette-tip mounted onrecessed parts displays a much larger roughness thanits top and connected to a vacuum pump (Adeb 63,the non-etched higher parts. The increased roughnessAEG, Belgium). This first step currently occursis probably due to the presence of impurities in themanually and has no strict time limitation. In thefused-silica glass. Future work will be conducted tosecond step, sample is loaded in front of the channelinvestigate this more closely.inlet (see arrow indication in Fig. 1) using a standard
micropipette. During the third step, the moving wallis displaced rapidly (u 510 mm/s) over a given 3 .2. Injection and tracer flow experimentswall
prescribed distance. To inject a 100-mm band, thewall has to be displaced over exactly 200mm, Fig. 3 shows a series of video frame images ofbecause the liquid inside the channel is known to different injected tracer bands. The frames wereflow at exactly one-half of the moving wall velocity taken at about the same position in the channel (i.e.,[12,14]. During the fourth and final step, the motion about 200mm downstream of the channel inlet). Inof the moving wall is briefly interrupted to aspirate these experiments, the coumarin C460 was injected
22away the non-entered sample and to replace it by at a concentration of 10M, in order to have afresh mobile phase liquid. To avoid excessive in-jection band broadening due to the inevitable inwarddiffusion effects taking place during steps 2–4, thesesteps have to be kept as short as possible. Currently,these steps are effectuated in a time frame of about4–6 s, but obviously this has to be reduced tominimize the contribution of the undesired diffusiveflux to the total injection flux [14].
All the experiments were performed at ambienttemperature (T(20 8C). The imposed mobile phasevelocity during the separation runs was varied be-tween 1 mm/s and 1 cm/s. The range of velocities Fig. 2. Wyko-scan measurement of the cross-section of one of thelarger than 2 cm/s is currently inaccessible because RIE etched nano-channels employed in the current study.
D. Clicq et al. / J. Chromatogr. A 979 (2002) 33–42 37
image analysis software, and averaged over they-direction. The latter was found to be absolutelyindispensable for the achievement of a sufficientS /Nratio. The corresponding frame times are given aswell, showing that the two coumarins are clearlybase-line separated within a time span of about 0.06
Fig. 3. Still CCD camera images of three different injections s. Injection of the individual components revealedperformed in the 100-nm channel. Each image corresponds to the
that the most rightward peak (i.e., the least retainedfirst video frame (t50.018 s) obtained after retaking the transla-peak) was the coumarin C440, in agreement with thetion of the moving wall.reversed-phase CEC measurements presented in
betterS /N ratio of the images. As can be noted, the Refs. [5,6].reproducibility of the injections is very good. Fig. 5 shows the most rapid separation performed
in a channel with nominal depthd5120 nm. To3 .3. Separation experiments increase the speed of the peaks to the level of that in
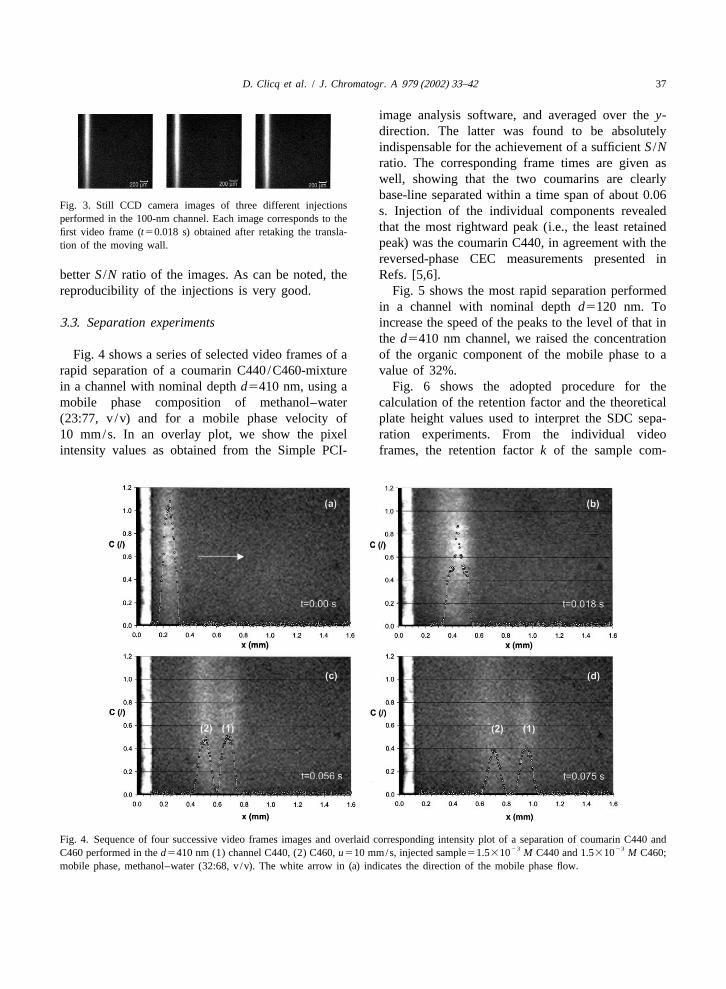
the d5410 nm channel, we raised the concentrationFig. 4 shows a series of selected video frames of a of the organic component of the mobile phase to a
rapid separation of a coumarin C440/C460-mixture value of 32%.in a channel with nominal depthd5410 nm, using a Fig. 6 shows the adopted procedure for themobile phase composition of methanol–water calculation of the retention factor and the theoretical(23:77, v /v) and for a mobile phase velocity of plate height values used to interpret the SDC sepa-10 mm/s. In an overlay plot, we show the pixel ration experiments. From the individual videointensity values as obtained from the Simple PCI- frames, the retention factork of the sample com-
Fig. 4. Sequence of four successive video frames images and overlaid corresponding intensity plot of a separation of coumarin C440 and23 23C460 performed in thed5410 nm (1) channel C440, (2) C460,u510 mm/s, injected sample51.5310 M C440 and 1.5310 M C460;
mobile phase, methanol–water (32:68, v /v). The white arrow in (a) indicates the direction of the mobile phase flow.

38 D. Clicq et al. / J. Chromatogr. A 979 (2002) 33–42
Fig. 5. Sequence of four successive video frames images and overlaid corresponding intensity plot of a separation of coumarin C440 and23 23C460 performed in thed5120 nm channel. (1) C440, (2) C460,u510 mm/s, injected sample51.5310 M C440 and 1.5310 M
C460; mobile phase, methanol–water (33:77, v /v). The white arrow in (a) indicates the direction of the mobile phase flow.
ponents could be derived from the difference be- L 2L0 eff]]]tween the positionL of a virtual line representing k 5 (1)0 Leffthe velocity of the non-retained mobile phase liquid
(moving with exactly one-half of the moving wall From the peaks in the colour intensity plots,velocity, see Ref. [12]), and the actual positionLeff estimates of the theoretical plate height could be
2of the moving dye peak, using: made, using the variances of the peak, using:x
2s x]H 5 (2)exp Leff
2Thes values were determined from the widths ofx
the peaks in the intensity plots. For the situation inFig. 6, the above analysis yields a value ofk 50.111
(60.02) andH 51.3 mm (60.1 mm) for the firstexp,1
peak and k 50.44 (60.03) and H 52.2 mm2 exp2
(60.1mm) for the second peak. The first peak yieldsa plate number of aboutn5370, the second peakyields aboutn5190. It should be recalled that thesedata have been calculated using Eq. (2), implyingthat they are strongly influenced by the injectionFig. 6. Elaboration of the graphical procedure adopted to calculate
the peak retention factors. band width (see Section 4).

D. Clicq et al. / J. Chromatogr. A 979 (2002) 33–42 39
In principle, theseH values can be corrected by the 410-nm channel and for a mobile phase com-exp2subtracting the variances of the injected peak position of methanol–water (23:77, v /v), the re-x,inj
using: tention factors were, respectively, found to bek 51
0.11 (standard deviation50.02) for the first peak,2 2
s 2s and k 50.48 (standard deviation50.03) for thex x,inj 2]]]H 5 (3)exp,corr second peak.Leff
The thus obtained values were however found tobe too error sensitive to be used for a statistically 4 . Discussionrelevant data analysis.
A summary of theH data for two series of As is well-known from the field of ultra-rapid CE,exp
separation runs, one conducted in thed5410 nm it is critical to accurately inject narrow tracer bandschannel, one in thed5120 nm channel, is given in (axial width of the order of 100mm or less) [17,18].Fig. 7. All data were evaluated from a video frame Even with the highly efficient injection deviceswherein the first peak was near thex51 mm developed for on-chip CE, the achievable plateposition. Although only theH values for the number of rapid separations occurring over veryexp
second peak are given, it should be noted that the short channel lengths is nearly completely deter-H values for the first peak relate in a fully similar mined by the injection band width [6,18]. With theexp
manner to the theoretical expectations. Each experi- semi-automated injection procedure, and due to thement was performed twice. The error bars give the high displacement accuracy of the employed transla-lowest and smallest value of the experiments. Com- tion stage, we are now able to very reproduciblyparing thed5410 nm data to those for thed5120 inject tracer bands of the order of 100mm. This isnm channel, no really significant difference can be clearly evidenced by the sequence of injectionobserved. This is for a large part due to the fact that experiments presented in Fig. 3. Making a statisticalthe presently presented experiments are conducted in analysis of the conducted injection experiments, wethe injection band width-limited regime (see also can state that the motorized translation stage nowSection 4). The averagek values for the experiments allows to inject narrow bands of the order of 100mmconducted in the 120-nm channel and for a mobile with a standard deviation of about 10%. As wasphase composition of methanol–water (32:68, v /v) outlined in a more in-depth study of the currentlywere, respectively, found to be given byk 50.09 employed injection process [14], the major contribu-1
(standard deviation50.02), andk 50.54 (standard tion to this variance originates from the variable2
deviation50.04). For the experiments conducted in timing of steps 2–4 of the injection process (cf.
Fig. 7. Comparison between the experimental theoretical plate height values and the theoretical expectation (dashed lines5H valuescol,theo
calculated from Eq. 4, full lines5H values calculated from Eq. 5) for the second peak (C460) in the chromatograms. (a)H valuestot,theo exp210 2for the d5410 nm channel (data used for theoretical curves:d5410 nm,D 55310 m /s,w5100mm, k50.48) and (b)H valuesmol exp
210 2for the d5120 nm channel (data used for theoretical curves:d5120 nm,D 55310 m /s,w5100 mm, k50.54).mol

40 D. Clicq et al. / J. Chromatogr. A 979 (2002) 33–42
Section 2.3). These are still effectuated manually and the order of 10–20 s, although the conditions of thetake about 4–6 s. During this time, a significant separation and the achieved efficiencies are clearlydiffusive inward leakage occurs. With a fully auto- different from ours, hence it is difficult to do amated injection system, capable of reducing the correct comparison. The presently proposed sub-injection step duration to about 0.5 s, it should be 0.1-s separations however clearly reflect the rapidpossible to reduce the injection band width variation separations kinetics of the SDC system. As alreadyto below 1% [14]. Considering that the employed mentioned, these enhanced separation kinetics stemtranslation stage has a displacement resolution of from two different advantages: (i) the possibility to0.5 mm, it should be obvious that the injection of apply mobile phase velocities significantly largermore narrow sample bands (of the order of 50mm or than those in electrically driven and pressure-driveneven smaller) is perfectly feasible. However, the systems, and (ii) the possibility to use nanometriccontribution of the diffusive leakage becomes much thin channels without the complication of double-more pronounced in this case, and, furthermore, the layer overlap and without any limitation on thedetectability of the peaks also strongly diminishes. It applicable mobile phase velocity. Due to the verytherefore turns out that 100-mm injections currently short radial dimensions, nanometric thin channelsyield the best compromise between reproducibility yield extremely short radial diffusion times (of the
25 29 2and detectablity on the one hand, and resulting order of 10 s for a solute withD 510 m /s inmol
separation resolution on the other hand. a channel withd5100 nm, as can be calculated fromWith the microscope set-up we are limited to CCD Einstein’s diffusion law [19]). The mobile phase
recordings of the first 1.6 mm of the channel. We mass transfer resistance then reduces corresponding-therefore selected the chromatographic conditions ly.such that the peaks became base-line separated in Considering the achieved separation efficiencies, itthis first section. With the disposition of a system has to be noted that they are still far away from thewith extremely short radial diffusional distance, the theoretical expectations. The major reason for thiscurrent set-up is hence especially suited to explore deviation has to be found in the large contribution ofthe separation speed limits of LC. the injection band width. As demonstrated earlier
Figs. 4–5 clearly demonstrate that the coumarin [11], the theoretical plate height of an SDC systemC440–C460 mixture can easily be separated in less with flat rectangular cross-section and with a negli-than 0.1 s. Using only a monolayer C coating, gible stationary phase contribution (corresponding to8
without the application of any specific roughening the fact that we only employed monolayer stationarytreatment to increase the specific surface of the phase coatings in the SDC channels) is given by:stationary channel wall, the channels nevertheless
2 2D 2 11 7k 1 16k dmclearly yields sufficient retention capacity to separate] ] ]]]] ]H 52 1 ? ? u ? (4)col,theo 2u 30 Dthe coumarins in a very short distance. This is due to (11 k) m
the unusually small channel thickness, greatly in-The dashed lines in Fig. 7a–b are calculated oncreasing the phase ratio over other mono-layer
the basis of this theoretical expression. The full linescoated open-tubular channel systems with a diameterin Fig. 7a–b correspond to the total theoretical plateof the order of for example 5–10mm. The base-lineheightH including the effect of the widthw oftot,theoseparation time of less than 0.1s is about two ordersthe injection band:of magnitude smaller than in the coumarin separation
2chromatograms presented by Kutter et al. [6]. To the w 1]]H 5H 1 (5)best of our knowledge, they have reported the fastest tot,theo col,theo 12 Leffcoumarin separation achieved thus far. They per-
formed microchip open-channel electrochromatog- From the large difference between the dashed andraphy in channels with different depths varying the full lines, it can readily be concluded that thebetween 10.2 and 2.9mm. The analysis times which observed separation efficiencies indeed are stronglycan be estimated from their chromatograms are of limited by the injection band width. For ultra-short
D. Clicq et al. / J. Chromatogr. A 979 (2002) 33–42 41
column experiments, such as the ones currently try and perfectly compatible with the open-channelpresented, this is however quasi inevitable (see, e.g., format of the SDC channels [20].Refs. [6,18]). To obtainH values coming near thetheoreticalH values, the passage of the peakscol,theo
should be recorded at positions much further down- 5 . Conclusionsstream in our channels (around sayL510 mm orbeyond). With the current set-up, this is momentarily With a relatively simple set-up, we have been ableimpossible. Current work is therefore underway to to perform ultra-rapid reversed-phase LC separationsbuild a photomultiplier-based set-up, allowing to in channels as thin as 100. In such channels, themonitor the separations further downstream of the separation kinetics are considerably enhanced withchannel inlet. As can be denoted from Fig. 7b, the respect to the 5–10-mm channels typically used inH values which can be obtained in the absence open-channel CEC. The present demonstration ofcol,theo
of injection band width limitation can be as small as sub-0.1-s separations of a coumarin C440–460 mix-about 0.2mm when using mobile phase velocities of ture is a first indication of this fact. Since theu.1 cm/s. presented data relate to ultra-short column sepa-
Fig. 7 also shows that the currently investigated rations, the obtained efficiencies are to a great extentrange of mobile phase velocities is still sub-optimal, reduced by the injection band width.such that it should be possible to achieve even faster Before the SDC system can become a practicalseparations. For this purpose, the sampling frequency research tool, a huge leap in detection sensitivity andof the detection system needs to be increased con- retention capacity however still needs to be made.siderably beyond that of the currently employedCCD system. This will also be resolved whenswitching to a PMT-based detection scheme. 6 . Nomenclature
The remaining difference between the experimen-tal H values (calculated according to Eq. (2)) and C tracer concentration dchannel thickness (m)exp
the theoreticalH values should most probably d channel thickness (m)tot,theo2be attributed to deviations from the perfect flat- D molecular diffusion coefficient (m /s)mol
rectangular channel cross-section shape and to im-H height of equivalent theoretical plate (m)perfections in the stationary phase coating. For the k retention factor (–)latter, we do not really dispose of an effective quality N theoretical plate number (–)inspection method. t time coordinate (s)
Future research efforts will focus on the develop- u mean mobile phase velocity (m/s)ment of the detection gutter system presented in Ref. u velocity of moving wall (m/s)wall
[14]. This system is based on the use of a transver- w axial width of injected sample plug (m)sally placed flow-through channel acting as a light x axial coordinate (m)pipe and running across the entire channel width, andperfectly combining the advantages of the largechannel width (offering large optical path length) and Greek symbolthe unique sub-micron channel thickness (preventing
2 2the light to escape from the light pipe) to potentially s peak variance in the space domain (m )x
yield UV–Vis absorption detection limits similar tothose in conventional HPLC and with an affordableloss in theoretical plate number. Another point of Subscriptsattention will be the application of a thicker station-ary phase. For this purpose, we will in a first instance col columnresort to the porous silicon anodisation techniques eff effectiveoriginally developed for the micro-electronics indus- exp experimental

42 D. Clicq et al. / J. Chromatogr. A 979 (2002) 33–42
¨[6] J.P. Kutter, S.C. Jacobson, N. Matsubara, J.M. Ramsey,inj injectionAnal. Chem. 70 (1998) 3291.theo theoretical
[7] C.T. Culbertson, S.C. Jacobson, J.M. Ramsey, Anal. Chem.72 (2000) 5814.
[8] R. Dadoo, R.N. Zare, C. Yan, D.S. Anex, Anal. Chem. 70A cknowledgements (1998) 4787.
[9] S.C. Jacobson, C.T. Culbertson, J.E. Daler, J.M. Ramsey,Anal. Chem. 70 (1998) 3476.The authors greatly acknowledge the financial
[10] W. Kok, Chromatographia (Suppl.) 51 (2000) S28.support from the Fonds voor Wetenschappelijk On- [11] G. Desmet, G.V. Baron, J. Chromatogr. A 855 (1999) 57.derzoek (FWO, grant no. KN 81/00), the University [12] G. Desmet, G.V. Baron, Anal. Chem. 72 (2000) 2160.Research Council (grant nos. OZR 746 and OZR [13] H. Poppe, J. Chromatogr. A 778 (1997) 3.
[14] G. Desmet, N. Vervoort, D. Clicq, P. Gzil, A. Huau, G.V.597) and the Instituut voor Wetenschap en tech-Baron, J. Chromatogr. A 948 (2002) 19.nologie (IWT, grant no. GBOU/010052). D.C. is
[15] G. Desmet, N.Vervoort, D. Clicq, G.V. Baron, J. Chromatogr.supported through a specialization grant from the A 924 (2001) 111.IWT (grant no. SB/1279/00). [16] N. Gottschlich, S.C. Jacobson, C.T. Culbertson, J.M. Ram-
sey, Anal. Chem. 73 (2001) 2669.[17] A.P. O’Neill, P. O’Brien, J. Alderman, D. Hoffman, M.
McEnery, J. Murrihy, J. Chromatogr. A 924 (2001) 259.R eferences[18] L. Bousse, B. Dubrow, K. Ulfedler, in: A. van den Berg, J.D.
Harisson (Eds.), Micro Total Analysis Systems 98, Kluwer,[1] A. Manz, D.J. Harrison, E. Verpoorte, J.C. Fettinger, A. Dordrecht, 1998, p. 271.
¨Paulus, H. Ludi, H.M. Widmer, Adv. Chromatogr. 33 (1993) [19] T.K. Sherwood, R.L. Pigford, C.R. Wilke, in: Mass Transfer,1. McGraw-Hill, New York, 1975.
[2] D.J. Harrison, K. Fluri, K. Seiler, Z. Fan, C.S. Effenhauser, [20] R.W. Tjerkstra, M. De Boer, E. Berenschot, J.G.E. Gar-A. Manz, Science 261 (1993) 895. deniers, A. van den Berg, M.C. Elwenspoek, Electrochim.
[3] Y. Fintschenko, A. van den Berg, J. Chromatogr. A 819 Acta 42 (1997) 3399.(1998) 3.
[4] A.W. Moore, J.W. Jorgenson, Anal. Chem. 65 (1993) 3550.[5] S.C. Jacobson, R. Hergenroder, L.B. Koutny, R.J. Warmack,
J.M. Ramsey, Anal. Chem. 66 (1994) 1107.


![[Cool] Gas Chromatography and Lipids](https://static.fdokumen.com/doc/165x107/6325a4b1852a7313b70e98e9/cool-gas-chromatography-and-lipids.jpg)


