
Decoherence in a Fermion Environment: Non-Markovianity and Orthogonality Catastrophe

Published: September 13, 2011
r 2011 American Chemical Society 7676 dx.doi.org/10.1021/ac2017772 |Anal. Chem. 2011, 83, 7676–7681
ARTICLE
pubs.acs.org/ac
Orthogonality of Two-Dimensional Separations Based onConditional EntropyMohammad Reza Pourhaghighi,† Mohammad Karzand,‡ and Hubert H. Girault*,†
†Laboratoire d’Electrochimie Physique et Analytique, Station 6, Ecole Polytechnique F�ed�erale de Lausanne, CH-1015,Lausanne, Switzerland‡Information Theory Laboratory, Station 14, Ecole Polytechnique F�ed�erale de Lausanne, CH-1015, Lausanne, Switzerland
The separation of complex samples requires the hyphenationof different separation techniques, as a single separation method
does not usually possess a peak capacity sufficient to separate allthe components. In 2-D separation systems, the theoretical peakcapacity (P2D) can be calculated by multiplying the individualpeak capacities of each dimension.1 Nevertheless, the theoreticalpeak capacity can barely be attained and is often limited to thepractical peak capacity (Np). As explained by Giddings, toachieve the maximum peak capacity (P2D), the two separationmechanisms must be completely independent and the peaksmust uniformly occupy the 2-D separation space.2 Since theevaluation of the orthogonality degree is essential to estimatethe resolving power of different multidimensional separationprotocols, it is important to develop a method that can cope witha wide range of experimental data.
Different approaches have already been developed to evaluatethe orthogonality in 2-D separation systems. Liu et al. developeda geometrical approach based on the factor analysis.3 They usedthe retention times and capacity factors of each separationdimension to establish a correlation matrix and a peak spreadingangle matrix. The orthogonality is then defined by a correlationmatrix with correlation coefficients that vary from 0 for an ideallyorthogonal to 1 for a nonorthogonal system. The main drawbackof this approach is that the calculation of the orthogonality isbased on the geometric distribution of the peaks along thediagonal of the 2-D separation space, which is not enough todescribe the orthogonality between two separation methods,especially when the analytes are not diagonally distributed in the2-D separation space.
Through a comprehensive study of different liquid chroma-tography (LC) modes for peptide separation, Gilar et al. proposed asimple geometrical approach to evaluate the orthogonality of dif-ferent 2-D separation protocols.4 In their approach, a normalized2-D separation space is first plotted and data points are placedinto rectangular bins. With the total number of bins (Pmax) andthe number of bins occupied by data points (Σbins) known, the
orthogonality of a 2-D separation system is calculated by thefollowing equation:
O ¼ ∑bins� ffiffiffiffiffiffiffiffiffiPmax
p0:63Pmax
ð1Þ
In Gilar’s approach, the surface coverage of a normalized sep-aration space varies from 10% in a nonorthogonal system to 63%for an ideally orthogonal system. Since 0.63 is only valid forsomeP values (= (Pmax)
1/2),Watson et al.modified eq 1 as follows:5
O ¼ ∑bins� P
0:63P2 � Pð2Þ
The main advantage of Gilar’s geometrical approach was itssimplicity, but since the orthogonality calculated only dependson the separation space surface coverage and not on the distributionpattern of the peaks, it does not describe the correlation betweentwo separation mechanisms. For instance, if 50 out of 100 bins ina separation space are occupied by peaks (50% surface coverage),the orthogonality calculated using eq 2 is 75% without consider-ing how these 50 bins are distributed. Furthermore, the surfacecoverage depends on the number of data points in the separationspace, which undermines the orthogonality comparison whenusing different data sets.
Slonecker et al. proposed to describe the orthogonality of 2-Dseparation systems by information theory.6 Therein, “informa-tional similarity” was used to describe the orthogonality of the2-D separation system and its value varied between 0 for a completelyorthogonal and 1 for a nonorthogonal 2-D separation system.Moreover, the % synentropy that was determined by dividing theinformational entropy from data diagonally aligned by the total2-D informational entropy was introduced to describe the degree
Received: April 5, 2011Accepted: September 13, 2011
ABSTRACT: A new approach to assess the orthogonality of two-dimensional (2-D) separation systemsbased on conditional entropy is developed. It considers the quantitative distribution of peaks in the entireseparation space such that the orthogonality obtained is independent of the number of peaks observed foreach separation technique. Therefore, it can be used to compare the orthogonality of different 2-Dseparation protocols for a given sample. Herein, the developed method has been employed to estimate theorthogonality of peptide separation by off-gel electrophoresis (OGE) hyphenated to capillary zoneelectrophoresis (CZE).

7677 dx.doi.org/10.1021/ac2017772 |Anal. Chem. 2011, 83, 7676–7681
Analytical Chemistry ARTICLE
of nonorthogonality along the diagonal of the 2-D separationspace. Consequently, a synentropy percentage equal to 0% de-scribes a 2-D separation system in which the two dimensions arecompletely orthogonal. Despite a valuable effort to expand theapplication of information theory to orthogonality calculationsby using different descriptors to estimate the orthogonality of theseparation systems, the method proposed is not able to describethe orthogonality of 2-D systems where the correlation betweenthe separation mechanisms is not along the diagonal (i.e., off-diagonal correlations).
In the present study, we propose a novel approach to evaluatethe orthogonality of 2-D separation systems based on conditionalentropy. This approach considers the quantitative data distribu-tion in the entire separation space, as off-diagonal correlationsbetween the two separations mechanisms are also considered inthe orthogonality calculation. Furthermore, since the orthogon-ality calculated is independent of the number of peaks in theseparation space, a methodology based on conditional entropycan be employed to compare, for a given sample, the orthogon-ality of different 2-D separation protocols. For a peptide separation,it is for example possible to compare the merits of hyphenatingdifferent protocols such as reverse phase chromatography coupledto strong cation exchange chromatography (RP/SCX) and off-gelelectrophoresis to capillary zone electrophoresis (OGE/CZE).
’EXPERIMENTAL SECTION
Materials andReagents.All chemicals used were of analyticalgrade and obtained from Sigma-Aldrich (Schnelldorf, Switzerland).All buffer and protein solutions were prepared with water pro-duced by an alpha Q Millipore system (Zug, Switzerland).Tryptic Digest. Bovine serum albumin (BSA), myoglobin
(Myo), β-lactoglobulin (β-Lac) and cytochrome C (Cyt. C) weredissolved in 50mMammoniumbicarbonate (pH 8.2) and heatedat 100 �C for 5min. Then, trypsin was added to the protein solutionwith a 1:100 enzyme to protein ratio, and the tryptic digestionwas performed overnight at 37 �C.Off-Gel Electrophoresis. OGE separations were performed
with the Agilent 3100 OFFGEL fractionator (Waldbronn,Germany). An 18 cm immobilized pH gradient (IPG) strip pH3�10 (Amersham Biosciences, Otelfingen, Switzerland) wasused for the experiments allowing the collection of 18 fractions.The focusing was carried out with voltage and current limited to4.5 kV and 150 μA, respectively, and stopped after achieving45 kVh. At the end of the fractionation, the peptide solution ineach well was collected and further analyzed by CE without anyparticular treatment.Capillary Electrophoresis. CE experiments were performed
with a Hewlett-Packard3D CE system (Waldbronn, Germany).Fused silica capillaries (50 μm i.d., 26.5 cm effective length, 35 cmtotal length) were obtained from BGB Analytik AG (Boeckten,Switzerland) and coated with 5% hydroxypropyl cellulose(HPC) in the laboratory according to the procedure describedby Shen et al.7 Phosphate buffer (66 mM) pH 3.0 was used asbackground electrolyte (BGE) for CZE separations. Sampleswere injected electrokinetically (2 kV, 60 s), and peptide separa-tion was performed by applying 20 kV across the capillary (0.57kV/cm) while the UV absorbance of analytes was monitored at200 nm. Precise analysis of the electropherograms was per-formed with 32 Karat software (Beckman Coulter, CA), andmigration times of the peaks detected were first normalized and
then transferred to a program written in MATLAB for ortho-gonality calculation.Orthogonality Calculation. A program was written in
MATLAB8 to calculate the information entropy for each separa-tion dimension, the joint entropy, the mutual information (inbits), as well as the orthogonality of the 2-D separation system asare explained in the Theory section.
’THEORY
Information Entropy. Information theory was first developedby Shannon.9 In this theory, entropy is defined as a measure ofthe random variable uncertainty. Suppose X is a discrete randomvariable within an alphabet χ, then the probability mass functionp(x) = Pr, x ∈ χ, the entropy of X is defined by (in unit of bits):10
HðXÞ ¼ �∑x∈χ
pðxÞ log2 pðxÞ ð3Þ
Note that the entropy is a function of the distribution of X anddoes not depend on the actual value of X but only on theprobability of occurrence of each output.Similarly, the joint entropy of a pair of discrete random
variables, H(X,Y), with a joint distribution p(x,y) can be defined as
HðX , YÞ ¼ � ∑x∈χ∑y∈Y
pðx, yÞ log2 pðx, yÞ ð4Þ
As already described in refs 6 and 11 in a 2-D separation, p(X)is the probability of a peak to appear at a particular retention time.Accordingly, referring to the distribution of peaks at differentretention times, the entropy of each individual separationdimension as well as the joint entropy of the entire 2-D separationsystem can be calculated using eqs 3 and 4, respectively.Conditional Entropy. The entropy of the variable Y condi-
tioned on the variable X quantifies the remaining entropy oruncertainty of a random variable Y, conditioned on the variable Xtaking a certain value x and is written asH(Y |X) and defined as10
HðY jXÞ ¼ ∑x∈χ
pðxÞHðY jX ¼ xÞ ð5Þ
From these definitions, the entropy of Y conditional on X canbe obtained from the following equation (chain rule for condi-tional entropy):
HðX , YÞ ¼ HðY jXÞ þ HðXÞ ð6ÞConsidering X and Y as the two dimensions of a 2-D
separation protocol, the H(X,Y) bit of information is neededto reconstruct the 2-D system. With the values of the firstdimension (X) revealed (e.g., the retention times), H(X) bitsof information are known andH(Y|X) bits of uncertainty are stillremaining in the 2-D system.Consequently, if and only if the 2-D separation system is
completely nonorthogonal, for instance the retention timesin the second dimension (Y) are completely determined bythe first dimension (X), H(Y | X) is equal to zero. On the con-trary, in a fully orthogonal system where the two separationmechanisms (X and Y) are completely independent, H(Y | X)is equal to H(Y).Therefore, we propose the following equation to quantify the
orthogonality in a 2-D separation system
O% ¼ HðY jXÞHðYÞ � 100 ð7Þ
7678 dx.doi.org/10.1021/ac2017772 |Anal. Chem. 2011, 83, 7676–7681
Analytical Chemistry ARTICLE
where H(Y|X) represents the entropy of the second dimensionconditional on the first dimension andH(Y) is the entropy of thesecond dimension. The orthogonality obtained by this methodvaries between 0 for a nonorthogonal system and 100% for a fullyorthogonal 2-D separation system.
’RESULTS AND DISCUSSION
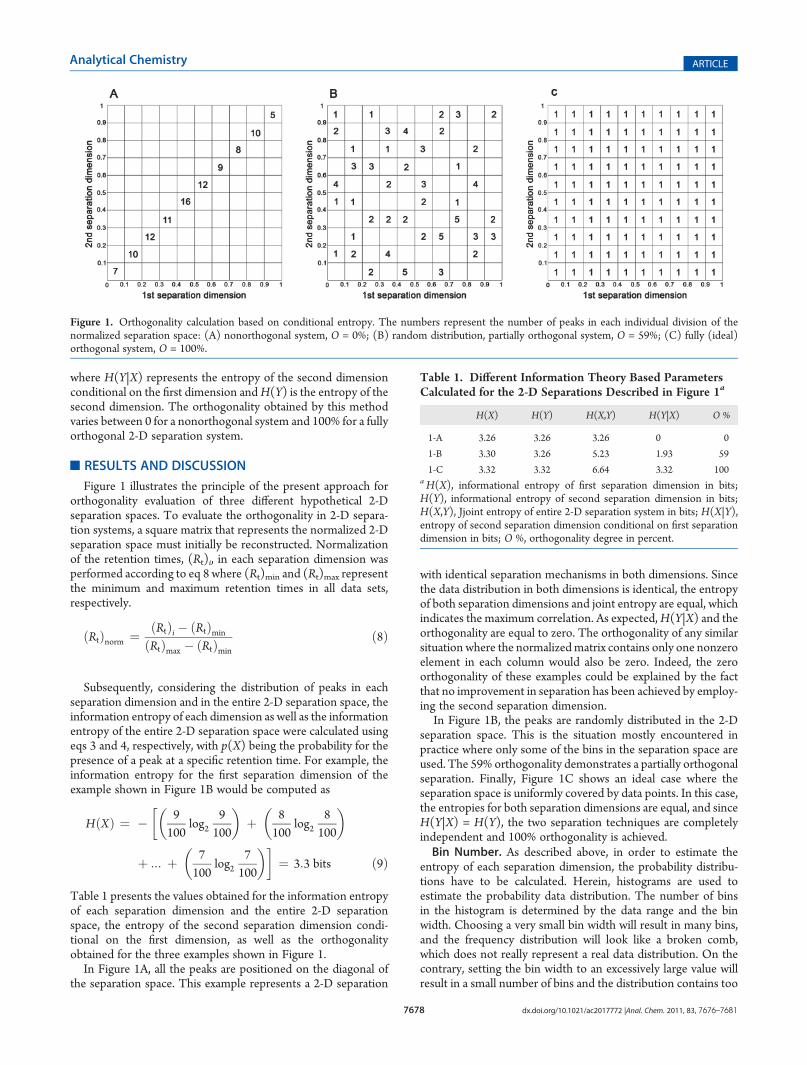
Figure 1 illustrates the principle of the present approach fororthogonality evaluation of three different hypothetical 2-Dseparation spaces. To evaluate the orthogonality in 2-D separa-tion systems, a square matrix that represents the normalized 2-Dseparation space must initially be reconstructed. Normalizationof the retention times, (Rt)i, in each separation dimension wasperformed according to eq 8 where (Rt)min and (Rt)max representthe minimum and maximum retention times in all data sets,respectively.
ðRtÞnorm ¼ ðRtÞi � ðRtÞminðRtÞmax � ðRtÞmin
ð8Þ
Subsequently, considering the distribution of peaks in eachseparation dimension and in the entire 2-D separation space, theinformation entropy of each dimension as well as the informationentropy of the entire 2-D separation space were calculated usingeqs 3 and 4, respectively, with p(X) being the probability for thepresence of a peak at a specific retention time. For example, theinformation entropy for the first separation dimension of theexample shown in Figure 1B would be computed as
HðXÞ ¼ � 9100
log29100
� �þ 8
100log2
8100
� ��
þ ::: þ 7100
log27100
� ��¼ 3:3 bits ð9Þ
Table 1 presents the values obtained for the information entropyof each separation dimension and the entire 2-D separationspace, the entropy of the second separation dimension condi-tional on the first dimension, as well as the orthogonalityobtained for the three examples shown in Figure 1.
In Figure 1A, all the peaks are positioned on the diagonal ofthe separation space. This example represents a 2-D separation
with identical separation mechanisms in both dimensions. Sincethe data distribution in both dimensions is identical, the entropyof both separation dimensions and joint entropy are equal, whichindicates the maximum correlation. As expected,H(Y|X) and theorthogonality are equal to zero. The orthogonality of any similarsituation where the normalizedmatrix contains only one nonzeroelement in each column would also be zero. Indeed, the zeroorthogonality of these examples could be explained by the factthat no improvement in separation has been achieved by employ-ing the second separation dimension.
In Figure 1B, the peaks are randomly distributed in the 2-Dseparation space. This is the situation mostly encountered inpractice where only some of the bins in the separation space areused. The 59% orthogonality demonstrates a partially orthogonalseparation. Finally, Figure 1C shows an ideal case where theseparation space is uniformly covered by data points. In this case,the entropies for both separation dimensions are equal, and sinceH(Y|X) = H(Y), the two separation techniques are completelyindependent and 100% orthogonality is achieved.Bin Number. As described above, in order to estimate the
entropy of each separation dimension, the probability distribu-tions have to be calculated. Herein, histograms are used toestimate the probability data distribution. The number of binsin the histogram is determined by the data range and the binwidth. Choosing a very small bin width will result in many bins,and the frequency distribution will look like a broken comb,which does not really represent a real data distribution. On thecontrary, setting the bin width to an excessively large value willresult in a small number of bins and the distribution contains too
Figure 1. Orthogonality calculation based on conditional entropy. The numbers represent the number of peaks in each individual division of thenormalized separation space: (A) nonorthogonal system, O = 0%; (B) random distribution, partially orthogonal system, O = 59%; (C) fully (ideal)orthogonal system, O = 100%.
Table 1. Different Information Theory Based ParametersCalculated for the 2-D Separations Described in Figure 1a
H(X) H(Y) H(X,Y) H(Y|X) O %
1-A 3.26 3.26 3.26 0 0
1-B 3.30 3.26 5.23 1.93 59
1-C 3.32 3.32 6.64 3.32 100a H(X), informational entropy of first separation dimension in bits;H(Y), informational entropy of second separation dimension in bits;H(X,Y), Jjoint entropy of entire 2-D separation system in bits; H(X|Y),entropy of second separation dimension conditional on first separationdimension in bits; O %, orthogonality degree in percent.

7679 dx.doi.org/10.1021/ac2017772 |Anal. Chem. 2011, 83, 7676–7681
Analytical Chemistry ARTICLE
little information to be useful. The only general rule is that theideal number of bins is related to the size of the data set. If thefrequency distribution tabulates the frequency of a huge numberof values, it makes sense to use a small bin width. If the frequencydistribution is for a small data set, a larger bin width makes sense.Many algorithms were devised to define the ideal bin width.Here, on the basis of Sturges’ method,12 the following equationwas employed to optimize the number of bins.
bin count ¼ 1 þ log2ðpeak numbersÞ ð10Þ
bin width ¼ ½ðRtÞmax � ðRtÞmin�bin count
ð11ÞThe optimum number of bins in each separation dimension
versus the number of peak present in the 2-D separation space ispresented in Figure 2. Although varying the bin number maycause minute changes in the orthogonality calculated (normallyless than 5%), considering that the number of peaks in most 2-Dseparations varies between 100 and 500, the separation space washere divided into 10 � 10 rectangular bins to illustrate themethod for a peptide separation.Effect of the Peak Number. Since each individual sample
used in 2-D separation provides a different number of peaks, it isimportant that the orthogonality assessment methodology isindependent of the total number of data points in the separationspace. As explained before, the entropy of each separation dimen-sion is a function of the peak distribution along the respectiveseparation axis and does not depend on the number of the peaks.Therefore, except the abnormal cases with very low number ofpeaks (i.e., 1, 2), the orthogonality calculated by this conditionalentropy method is independent of the total number of peaks inthe separation space. This feature is a key advantage when compar-ing the orthogonality of different 2-D separation methodologies.Figure 3 illustrates the effect of the peak number and their
distribution in the separation space on the calculated orthogon-ality. The two examples shown in Figure 3 have a geometricaldistribution similar to Figure 1B. Figure 3A shows an examplewhere the number of peaks in the separation space is uniformly
doubled relative to Figure 1B without disturbing the geometricaldistribution pattern. In spite of twice the number of peaks in theseparation space, the orthogonality of the 2-D system remainsunchanged (59%) since there is no evidence to demonstratehigher or lower correlation between the two separation mechan-isms. In Figure 3B, doubling the total number of peaks by increasingthe number of peaks on the diagonal of the normalized separa-tion space only points toward more correlation between the twoseparation mechanisms. As a consequence, the orthogonality ofsuch a system based on conditional entropy is reduced to 43%.These models demonstrate that even if the method proposed
is sensitive to quantitative peak distribution in the separationspace, it does not depend on the number of peaks except if itchanges the correlation between the two separation mechanisms.Orthogonality of OGE-CZE. Off-gel electrophoresis is a
technique developed in our laboratory for high-resolution frac-tionation of peptides and proteins according to their isoelectricpoint (pI) at the micropreparative scale.13,14 Taking advantage ofthe reproducibility of the IPGs, the separated compounds arerecovered in solution unlike in classical gel isoelectric focusing(IEF). In comparison to capillary IEF (CIEF), a lower concentra-tion of carrier ampholytes (CAs) can be used and neither anolyte
Figure 2. Optimum bin number in each separation dimension depend-ing on the total number of peaks in separation space.
Figure 3. Effect of increasing the number of peaks on orthogonalitycalculated with hypothetical examples: (A) O = 60% and (B) O = 43%.

7680 dx.doi.org/10.1021/ac2017772 |Anal. Chem. 2011, 83, 7676–7681
Analytical Chemistry ARTICLE
nor catholyte are needed for separation. These features facilitatethe integration of OGE into any proteomics workflow as demon-strated by its previous use as a first dimension before liquid chro-matography�tandemmass spectrometry (LC�MS/MS)15�18 andCZE.19
Busnel et al. showed that the hyphenation of OGE with CZEcan be successfully employed for the high-resolution separationof complex peptide samples.19 Furthermore, the orthogonality ofthe OGE-CZE hyphenation estimated by Gilar’s geometricalmethod was determined to be comparable with 2-D LC separa-tion systems.Herein, to demonstrate the potential of the present approach
for orthogonality evaluation, a standard peptide mixture contain-ing tryptic digest of BSA, myoglobin, Cyt. C, and β-Lac was firstseparated by OGE and then each off-gel fraction was analyzed byCZE as the second separation dimension. The normalized 2-D
separation plot obtained is shown in Figure 4A. Because of theacidic BGE (pH 3.0) used for the CZE separation of the off-gelfractions, the number of peaks in the acidic pIs of the separationspace is less than expected. Consequently, the best separation isobtained for off-gel fractions with pIs ranging from 4 to 7. Formore basic off-gel fractions, as shown in figure 4, the separationefficiency is limited by a reduced migration time of highly chargedpeptides.Afterward, to calculate the orthogonality of the separation,
since about 440 peaks are present in this separation space, thenormalized separation space was divided to 10 � 10 rectangularbins. Figure 4B demonstrates the quantitative distribution ofpeaks in divided normalized 2-D separation space. Accordingly,the informational entropy of each separation dimension, the jointentropy of the entire 2-D separation system, and the entropy ofthe second dimension (CZE) conditional to the first dimension(OGE) were calculated using the aforementioned equations.Finally, the orthogonality of CZE-OGE hyphenation with theconditional entropy approach was calculated by eq 7 to be 86%.As a comparison, the highest degree of orthogonality for
peptide separation by 2D-LC systems that is reported refers tothe hyphenation of hydrophilic interaction chromatography andreverse-phase chromatography (HILIC-RP 2D-LC)4 and wasalso calculated by a conditional entropy approach with a value ofabout 86%.It is important to notice that while the orthogonality of a 2-D
separation describes the potential correlation between twodimensions, other parameters such as the 2-D peak capacityare also required to evaluate the separation efficiency. Therefore,the practical peak capacity of OGE-CZE hyphenation was alsocalculated using the following equation:
Np ¼ ðP1P2ÞO ð12Þ
Np represents the practical peak capacity, P1 and P2 are therespective peak capacities of the first and second dimensions, andO is the orthogonality degree of the 2-D separation system. In the2-D OGE-CZE experiment presented here, the peak capacity ofOGE corresponds to the number of fractions, which is equal to18. In the second dimension, CZE separation of each OGEfraction, the average peak width was calculated to be about 0.035min over a separation window of 11.3 min providing a peakcapacity around 323. As a result, from eq 8, the practical peakcapacity of 2-D OGE-CZE separation of peptides is about 5800.
’CONCLUSIONS
A novel approach to evaluate the orthogonality in 2-Dseparation systems based on conditional entropy is presented.Compared with previous methods for orthogonality calculation,the present approach considers the quantitative peak distributionin the entire 2-D separation space. Therefore, even off-diagonalcorrelations are considered. Moreover, since the orthogonalitycalculated by conditional entropy does not depend on thenumber of peaks in the separation space but on their quantitativedistribution, the method developed can be employed to comparethe orthogonality of different 2-D separation protocols.
’AUTHOR INFORMATION
Corresponding Author*E-mail: [email protected]. Phone: [+41 21 69] 33151. Fax:[+41 21 69] 33667.
Figure 4. Normalized 2-D OGE-CZE separation plot of standardpeptide mixture (separation conditions are described in the Experi-mental Section): (A) actual peak distribution and (B) graphic illustra-tion of quantitative peak distribution in normalized separation spaceused for orthogonality calculation.
7681 dx.doi.org/10.1021/ac2017772 |Anal. Chem. 2011, 83, 7676–7681
Analytical Chemistry ARTICLE
’ACKNOWLEDGMENT
The authors would like to thank “Agilent Technologies Founda-tion” for financial support.
’REFERENCES
(1) Giddings, J. C. J. High Resolut. Chromatogr. 1987, 10, 319–323.(2) Giddings, J. C. Unified Separation Science; Wiley: New York,
1991.(3) Liu, Z.; Patterson, D. G.; Lee, M. L. Anal. Chem. 1995, 67,
3840–3845.(4) Gilar, M.; Olivova, P.; Daly, A. E.; Gebler, J. C.Anal. Chem. 2005,
77, 6426–6434.(5) Watson, N. E.; Davis, J. M.; Synovec, R. E. Anal. Chem. 2007,
79, 7924–7927.(6) Slonecker, P. J.; Li, X.; Ridgway, T. H.; Dorsey, J. G. Anal. Chem.
1996, 68, 682–689.(7) Shen, Y.; Smith, R. D. J. Microcolumn Sep. 2000, 12, 135–141.(8) MATLAB, version 7.9. (R2009b); The Math Work Inc.: Natick,
MA, 2009; http://www.mathworks.com.(9) Shannon, C. E. Bell Syst. Tech. J. 1948, 27, 623–656.(10) Cover, T, M; Thomas, J. A. Elements of Information Theory;
Wiley: New York, 2006.(11) David, V.; Medvedovici, A. J. Chemom. 2005, 19, 16–22.(12) Sturges, H. A. J. Am. Stat. Assoc. 1926, 21, 65–66.(13) Ros, A.; Faupel, M.; Mees, H.; Van Oostrum, J.; Ferrigno, R.;
Michel, P.; Rossier, J. S.; Girault, H. H. Proteomics 2002, 2, 151–156.(14) Michel, P. E.; Reymond, F.; Arnaud, I. L.; Josserand, J.; Girault,
H. H.; Rossier, J. S. Electrophoresis 2003, 24, 3–11.(15) Heller, M.; Michel, P. E.; Morier, P.; Crettaz, D.; Wenz, C.;
Tissot, J. D.; Reymond, F.; Rossier, J. S. Electrophoresis 2005,26, 1174–1188.(16) Geiser, L.; Dayon, L.; Vaezzadeh, A. R.; Hochstrasser, D. F.
Methods Mol. Biol. 2011, 681, 459–472.(17) Waller, L. N.; Shores, K.; Knapp, D. R. J. Proteome Res. 2008,
7, 4577–4584.(18) Michel, P. E.; Crettaz, D.; Morier, P.; Heller, M.; Gallot, D.;
Tissot, J. D.; Reymond, F.; Rossier, J. S. Electrophoresis 2006, 27,1169–1181.(19) Busnel, J. M.; Lion, N.; Girault, H. H. Anal. Chem. 2007, 79,
5949–5955.
Copyright © 2022 FDOKUMEN