SENSORS AND LIQUID CHROMATOGRAPHY
412
UNIVERSITY OF VALENCIA FACULTY OF CHEMISTRY DEPARTMENT OF ANALYTICAL CHEMISTRY PhD Thesis (NANO)MATERIALS: SENSORS AND LIQUID CHROMATOGRAPHY Thesis presented to obtaine the PhD degree in Chemistry under the “Programa de Doctorado en Química con Mención de Excelencia (R.D. 99/2011)” Ana Isabel Argente García Supervisors: Prof. Dr. Pilar Campíns Falcó Prof. Dr. Yolanda Moliner Martínez Valencia, June 2018
-
Upload
khangminh22 -
Category
Documents
-
view
5 -
download
0
Transcript of SENSORS AND LIQUID CHROMATOGRAPHY

UNIVERSITY OF VALENCIA
FACULTY OF CHEMISTRY
DEPARTMENT OF ANALYTICAL CHEMISTRY
PhD Thesis
(NANO)MATERIALS: SENSORS AND LIQUID
CHROMATOGRAPHY
Thesis presented to obtaine the PhD degree in Chemistry under the “Programa de
Doctorado en Química con Mención de Excelencia (R.D. 99/2011)”
Ana Isabel Argente García
Supervisors:
Prof. Dr. Pilar Campíns Falcó
Prof. Dr. Yolanda Moliner Martínez
Valencia, June 2018

Dña. Pilar Campins Falcó, Profesora Catedrática, y Dña. Yolanda Moliner Martínez,
Profesora Ayudante Doctor, ambas del Departamento de Química Analítica de la
Universidad de Valencia,
CERTIFICAN
Que la presente memoria, titulada “(Nano)materials: sensors and liquid
chromatography”, constituye la Tesis Doctoral de Ana Isabel Argente García para
optar al grado de Doctora en Química, y que ha sido realizada en los laboratorios
del Departamento de Química Analítica de la Universidad de Valencia, bajo su
dirección y supervisión.
Y para que así conste a los efectos oportunos, firman el presente certificado en
Valencia, a 1 de Junio de 2018.
Fdo. Dra. Pilar Campins Falcó Fdo. Yolanda Moliner Martínez
Directora de Tesis Codirectora de Tesis


This thesis has been completed thanks to a PhD research grant (FPU13/5220)
funded by the Ministery of Education, Culture and Sports of Spain (MECD) in the
Analytical Chemistry Department of the University of Valencia. A research stay of
three months in IMS Laboratoire of the University of Bordeaux (Talance,
Bordeaux) was carried out supported by MECD.


Si no conozco una cosa, la investigaré.
(Louis Pasteur)


i
AGRADECIMIENTOS
Tras estos años de trabajo, el esfuerzo ha tenido recompensa dando como resultado esta Tesis. En este camino recorrido me han acompañado personas a las que quiero agradecer el tiempo que me han dedicado. GRACIAS a Pilar por haberme ofrecido la oportunidad de trabajar en este grupo y dedicar tu tiempo en enseñarme todos tus conocimientos. De ti he aprendido que con esfuerzo y dedicación se pueden alcanzar los objetivos que te propongas. GRACIAS a Yolanda por haberme enseñado tanto a nivel profesional como personal. Me gustaría darte las gracias por tu comprensión, ánimos y valiosos consejos dados con la serenidad y el cariño que te caracterizan. Sabes que te admiro como científica, pero sobre todo como persona. Gracias por no dejarme caer cuando tropezaba con las piedras de este camino, gracias por estar siempre ahí. GRACIAS a Carmen, Rosa y Jorge, por haberme ofrecido vuestra ayuda en cada momento que la he necesitado. Gracias por hacer fácil este trabajo, ha sido un placer compartir estos años con vosotros. Los 5 habéis conseguido crear un grupo puntero de investigación en el que predomina algo tan importante como una buena atmósfera de trabajo. GRACIAS a Hélene Débeda y todos los componentes del grupo de investigación PRIMS por permitirme realizar mi estancia doctoral en el Laboratorio IMS de la Universidad de Burdeos y hacerme sentir tan cómoda. GRACIAS también a Marcela, compañera de piso y amiga. Quiero darte las gracias por hacerme sentir como en casa cuando estaba lejos de mi familia. Me ha encantado conocerte, siempre serás mi mon amour. GRACIAS a todos mis compañeros doctorandos del grupo MINTOTA (Lusine, Sara, Lorenzo, Rodrigo, Xavi, Neus, Henry, Maria y Pasu) por todas las experiencias compartidas. Ha sido una experiencia muy enriquecedora haber podido aprender de cada uno de vosotros. Quiero dar un especial agradecimiento a mis “chaticos”. GRACIAS Maria y Pascu, por ofrecerme vuestra amistad, por haber aguantado mis indignaciones con bailes de conga, por criticar mis modelitos, por nuestras pruebas de sonido y mil historietas más. Gracias por acompañarme y ayudarme tanto dentro como fuera del laboratorio, pero sobre todo por compartir tantas

ii
risas y lágrimas. No puedo describir con palabras lo agradecida que os estoy. “Espero que nunca se corte la cordeta”. María, gracias por ser mi guía y amiga. Me encanta nuestra loca complicidad. Siempre estaré muy agradecida por tu ayuda y tiempo que me ha permitido llegar al final del camino. También me gustaría extender los agradecimientos a los miembros del Departamento de Química Analítica y en especial a los compañeros de doctorado por las comidas, cenas y congresos compartidos. GRACIAS a Amparo, Eli, Omar y Duarte por haberos encontrado en el camino. Espero que el tiempo potencie nuestra amistad. GRACIAS a Miguel, Oreto, Belinda y Jesús, por haber sido mis compañeros de carrera y poder agradeceros ahora vuestra amistad. Gracias a Alejandro por todas las experiencias compartidas con el cariño que te caracteriza. A Mª Carmen y Lorena por haber sido mi segunda familia todos estos años. Gracias por haberme cuidado tan bien. Gracias a Rodrigo por haber sido y seguir siendo mi mejor amigo. Gracias por hacerme reir en cada una de nuestras quedadas. Estés donde estés yo seguiré a tu lado ofreciéndote el mismo cariño. Gracias por todos estos años. Gracias a Pep por enseñarme tu capacidad de disfrutar del presente, recordarme a estar agradecida, amenizar este período con tus chistes, bailes y conversaciones patunas, pero sobretodo por pagar el plus. Por esto y más, gracias. GRACIAS a mis padres, Alpidia y Heliodoro, por su apoyo incondicional. Gracias por los valores que me habéis inculcado, por protegerme y cuidarme. Me siento muy orgullosa y afortunada de tener unos padres como vosotros, os quiero. GRACIAS a mi hermano, Soraya y Jannis por vuestra admiración en todo lo que hago y ofrecerme vuestra ayuda siempre que la necesito. GRACIAS A TODOS LOS QUE ME HABÉIS ACOMPAÑADO EN ESTE CAMINO.

iii
RESUMEN

iv

v
RESUMEN
El progreso de la Química Analítica está gobernado por la implantación de
nuevas tecnologías así como el desarrollo de nuevos (nano)materiales y los
cambios sociales. Gracias al avance tecnológico, los métodos clásicos están siendo
reemplazados por nuevas herramientas e instrumentación que reducen el tiempo
de análisis y mejoran las figuras de mérito de los procedimientos analíticos. En
este contexto, el avance informático está permitiendo llevar a cabo una
automatización, miniaturización y simplificación tanto en los sistemas de análisis
como en el tratamiento de datos.
La irrupción de nuevos (nano)materiales es otro punto importante a tener en
cuenta en la evolución de la Química Analítica. De hecho, el estudio de
(nano)materiales para mejorar las técnicas existentes y/o desarrollar nuevas
técnicas es un área de investigación en pleno crecimiento. Por ello, el principal
objetivo de esta Tesis ha sido la investigación de (nano)materiales para su
aplicación a técnicas de detección, extracción y separación. La meta que pretende
alcanzar la Química Analítica Verde es el desarrollo de metodologías analíticas
sostenibles que garanticen el mantenimiento del medio ambiente para las
generaciones futuras. Así, las estrategias analíticas empleadas en esta Tesis han
tenido presente para su desarrollo los principios de sostenibilidad.
A pesar del progreso en instrumentación analítica, la preparación de la
muestra sigue siendo una etapa crítica del proceso analítico. Para conseguir una
respuesta analítica adecuada se requieren diferentes operaciones de extracción,
concentración, purificación y/o transformación del compuesto de interés. Dentro
de la etapa de preparación de muestra, las técnicas de extracción juegan un papel
importante. El analito es transferido desde la matriz hacia la fase extractante con
la que interacciona, por lo que la elección del material que actúa como
extractante es uno de los parámetros clave. La investigación de nuevos materiales
y estrategias de extracción para mejorar la selectividad y eficiencias de extracción
es un campo de investigación emergente hoy en día. La extracción de los analitos
puede llevarse a cabo a través de la extracción en fase líquida (LPE, Liquid Phase
Extraction) o en fase sólida (SPE, Solid Phase Extraction). Estas técnicas permiten
además preconcentrar y aislar los analitos de otros componentes antes de aplicar
una técnica de detección. La SPE es más utilitzada que la LPE debido al menor
consumo de disolvente que requiere. Esta técnica es ampliamente utilizada en la

vi
preparación de muestras biológicas, farmacéuticas, medioambientales y
alimentarias. La SPE no sólo se puede llevar a cabo con matrices líquidas sino
también sólidas, como es el caso de la dispersión de la matriz en fase sólida
(MSPD, Matrix Solid Phase Disperson). Así, el proceso analítico es
considerablemente simplificado, reduciendo el consumo de muestra y
disolventes, además de no requerir instrumentación de elevado coste. Debido a
las ventajas de la MSPD, es una técnica empleada en diversos campos como el
medioambiental, toxicológico y alimentario. La selectividad y eficiencia de esta
técnica depende principalmente del material extractante y del disolvente
empleado. En cuanto a los materiales, el C18 y C8 son los más utilzados para la
retención de analitos lipofílicos, como es el caso de esta Tesis.
Teniendo en cuenta los principios de la Química Analítica Verde, las técnicas
convencionales (SPE y LPE) se han ido sustituyendo por técnicas miniaturizadas y
automatizadas que permiten reducir el consumo de disolventes/reactivos y la
generación de residuos, además de mejorar la selectividad y preconcentración en
un menor tiempo de análisis. En este sentido, la microextracción en fase sólida
(SPME, Solid Phase MicroExtraction), introducida por Arthur y Pawliszyn en 1990,
se propuso como alternativa miniaturizada a la SPE. Inicialmente, la SPME se
desarrolló mediante una fibra recubierta en su superficie externa con una fase
extractante polimérica. Esta técnica presentaba ventajas como la reducción de
disolventes y el tiempo de extracción. Sin embargo, presentaba limitaciones como
la fragilidad de la fibra, baja capacidad de extracción, sangrado del recubrimiento
de la fibra y dificultad de acoplamiento a cromatografía líquida (LC, Liquid
Chromatography). Para superar estas limitaciones, se propuso como alternativa la
microextracción en fase sólida en tubo (IT-SPME, In-tube Solid Phase
MicroExtraction). En 1997, Eisert y Pawliszyn desarrollaron la primera IT-SPME
acoplada en línea con cromatografía líquida de alta resolución (HPLC, High
Performance Liquid Chromatography). La IT-SPME se basa en el uso de un capilar
de sílica fundida empacado o recubierto en su superficie interna con una fase
extractante. Cuando la muestra circula a través del capilar, los analitos son
extraídos y concentrados mediante interacción con el recubrimiento interno del
capilar. Después, los analitos son desorbidos mediante un disolvente apropiado, el
cual puede ser recogido para su posterior procesamiento (desorción estática) o
puede ser transferido hacia el sistema analítico mediante un flujo de disolvente
(desorción dinámica). Aunque la IT-SPME se ha utilizado generalmente en
combinación con cromatografía de gases (GC, Gas Chromatography),
vii
recientemente es más utilitzada con la LC. La IT-SPME se ha desarrollado
principalmente desarrollada con el objetivo de extender la SPE hacia el camino de
la automatización y acomplamiento en línea con un sistema cromatográfico. De
este modo se llevan a cabo la limpieza, preconcentración, separación y detección
de los analitos en un único paso. Además, esta técnica miniaturizada puede ser
considerada una técnica respetuosa con el medio ambiente gracias a la reducción
de disolventes, residuos, energía y costes, mejorando parámetros analíticos como
la sensibilidad, precisión y exactitud.
La IT-SPME es una técnica versátil que puede llevarse a cabo en diferentes
tipos de configuración:
(i) Modalidad de carga/expulsión: la columna capilar se inserta entre la aguja y
el bucle de un inyector automático programable. A continuación, una
fracción de la muestra es aspirada y expulsada repetidamente a través de la
columna capilar hasta alcanzar el equilibrio. Finalmente, se desorben los
analitos y se transfieren a la columna analítica mediante un disolvente (modo
estático) o mediante el flujo de fase móvil (modo dinámico).
(ii) Modalidad de circulación o IT-SPME en válvula: una columna capilar es
empleada como bucle de inyección del sistema cromatográfico. Los analitos
son retenidos en el capilar durante la carga de la muestra y después son
transferidos a la columna analítica mediante el cambio de posicicón de la
válvula a inyección.
Otra tendencia que suscita especial interés en la Química Analítica actual es
el desarrollo de nuevos dispositivos para análisis in-situ. Los métodos que
permiten un análisis in-situ en tiempo real incluyen potenciales ventajas como la
miniaturización del tratamiento de muestra y la consiguiente reducción del
tiempo y costes de análisis. Además, el riesgo de contaminación o degradación de
la muestra durante el transporte al laboratorio es eliminado.
Algunos de los aspectos a tener en cuenta a la hora de elegir un método de
análisis in-situ son la disponibilidad de recursos y personal cualificado. En ciertas
ocasiones, los sistemas complejos que proporcionan un alto rendimiento analítico
pueden ser inadecuados debido a la necesidad de personal especializado y
equipos caros. Gracias a las posibilidades que ofrecen los sensores in-situ, son
aplicados en un amplio rango de campos como el medioambiental, industrial,

viii
médico, forense y seguridad. A pesar de que las publicaciones sobre métodos
analíticos siguen siendo principalmente dedicadas a métodos cromatográficos, los
sensores ópticos y electromecánicos que permiten realizar medidas in-situ están
adquiriendo una mayor importancia.
Entre los diferentes tipos de sensores ópticos destacan los colorimétricos, ya
que su cambio de color en presencia del analito puede detectarse fácilmente a
simple vista. Estos sensores se basan en un cambio de color a través de una
reacción química entre un cromóforo y el compuesto de interés. Los colores
resultantes están relacionados con la concentración de analito. Por tanto, se
puede llevar a cabo un análisis cualitativo mediante inspección visual y un análisis
cuantitativo mediante medida de absorbancia por reflectancia difusa y/o valores
del color de una fotografía.
En base a los progresos tecnológicos, el análisis de imagen mediante
teléfonos móviles es una alternativa emergente para propósitos cuantitativos.
Para ello, se toma una imagen digital mediante un dispositivo electrónico
comercial, como puede ser un teléfono móvil o un escáner, y los colores de la
imagen son convertidos en valores numéricos mediante programas de imágenes
como Adobe®Photoshop, GNU Image Manipulation Program (GIMP) and ImageJ.
En función del método que representa los colores, se encuentran diferentes
modelos de color: rojo-verde-azul (RGB, red-green-blue), cian-magenta-amarillo-
negro (CMYK, cyan-magenta-yellow-black), tonalidad de saturación (HSV, hue-
saturation-value) y luminancia-color (CIELAB). El modo RGB es usado en muchos
trabajos, por eso ha sido seleccionado en la presente Tesis. En este modo, los
colores son creados por una mezcla de colores basada en rojo, verde y azul.
Aunque los métodos basados en teléfonos móviles han abierto una poderosa
alternativa a los equipos convencionales de medida, se deben tener en cuenta
una serie de parámetros relacionados con la imagen. Uno de los parámetros más
influyentes son las condiciones luminosas bajo las que se captura la fotografía.
Con el objetivo de corregir las variaciones de luz, se han propuesto diferentes
opciones como integrar el teléfono móvil en una caja oscura a medida, tomar
áreas de referencia, incorporar una fuente de luz con los parámetros de la cámara
fijos y usar un escáner para adquirir la fotografía.
En algunos ensayos colorimétricos, el cambio de color se lleva a cabo en
disolución. Sin embargo, el cambio de color en otros ensayos se lleva a cabo
mediante un soporte sólido donde los reactivos colorimétricos son inmovilizados.
ix
Los dispositivos sólidos evitan problemas de manipulación y estabilidad de los
reactivos derivatizantes en disolución. Algunos de los materiales propuestos como
soportes sólidos para el diseño de sensores in-situ son los polímeros, papel y
sílice. El papel despierta gran interés para el desarrollo de sensores debido a su
bajo coste, versatilidad, abundancia, simplicidad y compatibilidad. Además, la
amplia variedad de papeles disponibles en el mercado permite la elección de un
papel óptimo para cada tipo de ensayo. Por otra parte, el polidimtilsiloxano
(PDMS, polydimthylsiloxane) es el polímero más usado como soporte
encapsulante de diferentes especies como por ejemplo, reactivos colorimétricos,
quantum dots y nanopartículas (NPs).
Continuando con los sensores in-situ, los sensores electromecánicos, y
particularmente los sistemas microelectromecánicos (MEMS,
microelectromechanical systems), han recibido especial atención. Los MEMS son
utilizados en campos tan diversos como la automoción, electrónica, diagnóstico
clínico, comunicación y control medioambiental. Una de las estructuras más
destacadas dentro de los MEMS son las micropalancas en forma de T, donde una
parte está unida a una base y la otra queda suspendida. Estos sistemas son
ampliamente estudiados como sensores para la detección de gases debido a sus
ventajas como sensibilidad, miniaturización y bajo precio. Debido a su pequeña
escala, pequeños cambios físicos o mecánicos debido a la interacción del analito
es suficiente para ser detectado, por lo que son altamente sensibles.
Para poder utilizar las micropalancas como sensores, deben ser
funcionalizadas en su superficie superior mediante una capa de material que
tenga afinidad por el analito. La interacción de los compuestos de interés con la
puede ser física o química. Estas micropalnacas pueden trabajar en dos modos
diferentes. En modo estático, la interacción de los analitos con la capa sensible
genera una tensión superficial, resultando en una desviación de la micropalanca.
En modo dinámico, la micropalanca entra en resonancia y la interacción de los
analitos con la capa sensible causa un desplazamiento de esa frecuencia de
resonancia asociada al cambio de masa. El modo estático se puede llevar a cabo
en diferentes medios, comúnmente en líquidos. Sin embargo, el modo dinámico
se usa en medio gas debido a que en medio líquido surgen amortiguaciones de las
oscilaciones debido a la alta viscosidad del medio. Las micropalancas que trabajan
en modo dinámico se utilizan como sensores gravimétricos sensibles y rápidos.

x
Se require un sistema de lectura para monitorizar la flexión o los cambios en
la frecuencia de resonancia de la micropalanca. Los sensores electromecánicos
pueden clasificarse en los siguientes tipos en función del principio de detección:
capacitivo, óptico, piezorresistivo y piezoeléctrico. Para el modo dinámico, las
micropalancas piezoeléctricas son las más adecuadas por ventajas como rápida
respuesta, alta sensibilidad a escala miniaturizada y bajo coste. Estos sensores
consisten en una capa piezoeléctrica entre dos electrodos de oro. Las
formulaciones de PbZrxTi1-xO3 son el material más ampliamente utilizado para
sensors piezoeléctricos. Este material exhibe propiedades piezoeléctricas después
de su polarización ya que se produce el alineamiento de sus dominios
conduciendo a una polarización remanente.
Existen dos efectos piezoeléctricos. El efecto piezoeléctrico directo consiste
en la generación de un campo eléctrico cuando se aplica una tensión mecánica,
mientras que el efecto piezoeléctrico inverso sucede cuando el material sujeto a
un campo eléctrico causa una tensión mecánica. En el caso de las micropalancas
piezoeléctricas resonantes, experimentan un efecto piezoeléctrico inverso
mediante la aplicación de un campo eléctrico para alcanzar la resonancia, pero la
detección se lleva a cabo mediante cambios de frecuencia debido a la interacción
del analito a través del efecto directo. Entre las diferentes técnicas para la
fabricación de estos sensores, la técnica de impresión serigráfica junto con el
método de la capa de sacrificio permite la fabricación de MEMS piezoeléctricos a
bajo coste, obteniendo una buena reproducibilidad y resolución.
De acuerdo con lo comentado, se observan dos tendencias en la Química
Analítica durante los últimos años que se basan en la necesidad de simplificar las
metodologías analíticas. Por una parte, existe una tendencia hacia la
automatización del tratamiento de la muestra con el objetivo de reducir la
manipulación de la muestra y por tanto el tiempo de análisis. En relación con esto,
también se buscan técnicas miniaturizadas que permitan disminuir el consumo de
disolventes y la generación de residuos, además de mejorar parámetros como la
sensibilidad. Por otra parte, hay un creciente interés en el desarrollo de sensores
para el análisis in-situ, muchos de ellos basados en el análisis de imagen digital.
Algunos de los beneficios que ofrecen estos sensores son la simplicidad, rapidez y
análisis en tiempo real, sin necesidad de personal altamente cualificado.
xi
Ambas tendencias están asociadas a la necesidad de desarrollar
metodologías sostenibles, como destaca la Química Analítica Verde. El desarrollo
de estas metodologías que se enmarcan dentro de las tendencias actuales de la
Química Analítica se rige por el uso de nuevos (nano)materiales. Por eso, el
principal objetivo de esta Tesis ha sido el estudio de (nano)materiales para
mejorar metodologías analíticas existentes, así como también desarrollar nuevas
metodologías analíticas con alto rendimiento en términos de operación y
sostenibilidad. Concretamente, esta tesis se ha focalizado en el estudio de
(nano)materiales para su aplicación en técnicas de extracción, separación y
detección para llevar a cabo la estimación de diferentes compuestos en campos
tan diversos como el forense, medioambiente, industria y medicina. Los
materiales investigados se han clasificado en tres grupos: basados en sílica,
basados en carbono y basados en metal.
Los objetivos específicos de esta Tesis se han organizado en función de las
aplicaciones analíticas de los materiales estudiados:
1. Desarrollo de metodologías analíticas basadas en IT-SPME acoplada en línea
con cromatografía líquida miniaturizada, como es la cromatografía líquida
capilar (CapLC, capillary liquid chromatography), consiguiendo así
automatizar y miniaturizar el proceso. Para abordar este objetivo, el polímero
PDMS, un material basado en sílica, se ha evaluado como fase extractante de
IT-SPME para su aplicación en la determinación de compuestos de interés
medioambiental, industrial y forense en diferentes tipos de matrices: (i) Di(2-
etilhexil)ftalato (DEHP, Di(2-ethylhexyl)phtalate) en sedimentos y agua, (ii)
Cloruro de benzalconio (BAK, benzalkonium chloride) en formulaciones
industriales y (iii) Difenilamina (DPA, diphenylamine) en manos de un tirador.
En el mismo contexto, se han evaluado los nanotubos de carbono (CNTs,
carbon nanotubes), que son uno de los materiales basados en carbono más
populares, para la funcionalización de capilares basados en PDMS y así
mejorar las eficiencias de extracción en el análisis de drogas de tipo
anfetamínicas en fluido oral.
2. Desarrollo de una herramienta analítica basada en la MSPD empleando el
material basado en sílica C18 para la dispersion, preconcentración y
derivatización de anfetaminas en matriz de pelo. Esta técnica también ha sido
utilizada en el tratamiento de sedimentos para la extracción de DEHP. En el
mismo contexto de preparación de muestra, se ha evaluado un nuevo metal-

xii
organic framework (MOF) de Cu (II) 3D tripeptídico (Gly-L-His-Gly) como fase
quiral en SPE para la separación enantioselectiva de metanfetamina y
efedrina.
3. Diseño de sensores colorimétricos basados en el encapsulamiento de
cromóforos dentro de PDMS como soporte sólido para llevar a cabo el
análisis in-situ de compuestos de interés en la industria (estimación de
caseína en efluentes de la industria láctea y control del biocida N-(3-
aminopropil)-N-dodecil-1,3- propandiamina, ADP, en formulaciones
industriales de detergentes) y control policial (estimación de anfetamina y
ketamina en muestras ilegales de droga). También se ha desarrollado otro
tipo de sensor colorimétrico basado en la inmovilización de nanopartículas de
plata (AgNPs) en una membrana de nailon. Este nanomaterial metálico se ha
estudiado para diseñar un kit clínico con el que poder detectar compuestos
sulfúricos volátiles en el aliento, los cuales son responsables de la halitosis
que puede estar relacionada con enfermedades como la periodontitis o
gingivitis. Diferentes parámetros que afectan a la respuesta analítica han sido
estudiados. Además, se ha investigado el análisis mediante imagen digital
para simplificar y abaratar el análisis.
Las técnicas empleadas a lo largo de esta tesis pueden clasificarse en tres
grupos: espectroscópicas, cromatográficas y microscópicas.
Las metodologías llevadas a cabo para desarrollar los tratamientos de
muestra fuera de línea como la SPE y la MSPD se detallan a continuación. Para la
separación enantiomérica de metanfetamina y efedrina con el MOF peptídico, se
rellena un cartucho de SPE con Cu(GHG) y se hace pasar a través una mezcla
racemica. Para su identificación quiral, se lleva a cabo su derivatización y
procesado en el sistema cromatográfico.
Para la MSPD, un cartucho de SPE se rellena con la muestra de pelo mezclada
con la fase extractante C18 y seguidamente los analitos son derivatizados y
desorbidos con el reactivo de derivatización para su posterior procesado en el
sistema cromatográfico.
En cuanto al tratamiento de muestra en línea llevado a cabo en esta Tesis, IT-
SPME en válvula, consiste en sustituir el bucle de acero inoxidable de la válvula de
inyección por un segmento de columna capilar de GC, generalment basado en
PDMS. La muestra o disolución de trabajo se procesa manualmente mediante la

xiii
válvula en posición de carga quedando los analitos adsorbidos. Seguidamente son
desorbidos y transferidos a la columna analítica mediante la fase móvil al cambiar
la válvula a posición de inyección.
La fabricación de los sensores poliméricos ha consistido en encapsular los
reactivos colorimétricos (NQS o Co(SCN)2) en una matriz basada en PDMS. Para
ello, el agente gelificante se adiciona en una proporción 1:10 respecto de la base
polimérica. En el caso de los sensores de NQS, también se adicionan
tetraetilortosilicato (TEOS) y nanopartículas de sílice (SiO2NPs). Después de
homogeneizar la dispersión, la mezcla se vierte en moldes y se deja gelificar en la
estufa a 30 ºC. Estos sensores se ponen en contacto con la muestra basificada
(calentada para el caso sólo de la caseina) y tras 10 min de reacción, los sensores
que han cambiado de color son extraídos para medir la señal analítica.
Para la fabricación del sensor basado en AgNPs, se sitúa una membrana de
nailon en un portafiltros acoplado a una jeringa y se hace pasar una dispersión de
AgNPs (20 nm) de modo que queden atrapadas. Este sensor se cuelga en una
botella de dilución estática donde se ha adicionado ácido fosfórico. Una vez
cerrada la botella, se adiciona la disolución de Trabajo para generar H2S y se deja
bajo agitación durante 10 min. A continuación, el sensor se extrae de la botella y
se procede a la medida de la señal analítica.
El análisis cuantitativo de estos sensores coloreados se lleva a cabo mediante
medida de absorbancia por reflectancia difusa y/o medida del valor rojo, verde y
azul a través de una imagen digital obtenida mediante dispositivos de captura de
imágenes como un teléfono móvil.
Para la fabricación de los MEMS, concretamente micropalancas y discos
piezoeléctricos, se emplea la técnica de impresión serigráfica en combinación con
el método de la capa de sacrificio. En primer lugar se fabrica el material
piezoeléctrico con composición 97 % en peso de PbZr0.52Ti0.48O3 y 3 % de LBCu
(≈25 wt % Li2CO3, 40 wt % Bi2O3, 35 wt % CuO) para ayudar a la sinterización. Esta
mezcla tras ser homogeneizada con etanol en un mezclador en espiral se deja
secar, se mezcla con un aglutinante comercial en un 14 % en peso y finalmente se
lleva a un molino de tres rodillos para que adquiera las propiedades reológicas
requeridas. A continuación se lleva a cabo la impresión de los sensores por
deposición sucesiva de cada capa. Una vez impresos, cada capa se deja secar en la
estufa para eliminar los disolventes. Posteriormente, los sensores se prensan

xiv
isostáticamente para mejorar la densificación y después se sinterizan en un horno
que llega a los 900 ºC donde se elimina la capa de sacrificio. Finalmente los
sensores son polarizados y funcionalizados mediante deposición de una
dispersión acuosa de sílica mesoporosa. Para evaluar el potencial como sensor de
gases, la micropalanca se introduce en una cámara conectada a un analizador de
impedancia que lleva a cabo la lectura en tiempo real. Los vapores del analito se
generan y controlan gracias a un generador de vapor. El principio de
funcionamiento consiste en inducir una vibración a la micropalanca hasta alcanzar
el estado de resonancia. Debido a que la frecuencia de resonancia es sensible a la
masa, se produce un desplazamiento de la frecuencia (vibración 31-longitudinal)
asociado al cambio de masa cuando el analito se adhiere permitiendo así su
detección.
En conclusión, las aplicaciones de los (nano)materiales estudiados en esta
tesis se han centrado en dos de las actuales tendencias de la Química Analítica:
(i) Técnicas de tratamiento de muestra y de separación miniaturizadas
(ii) Sensores para análisis in-situ
Uno de los puntos más importantes de las técnicas para el tratamiento de
muestra es el uso de un adecuado material extractante. En esta Tesis, el C18 ha
sido evaluado como fase en MSPD para la disrupción, limpieza y derivatización de
anfetaminas en pelo. Este método ha permitido una estimación sencilla y rápida
de anfetamina, metanfetamina, efedrina y metilendioximetanfetamina en pelo,
con límite de detección (LOD, limit of detection) de 0.25–0.75 ng mg-1. La MSPD se
considerada una alternativa a los métodos clásicos que consisten en múltiples
pasos, ya que el proceso analítico se simplifica y el consumo de muestra y
disolvente se reducide. Por otra parte, el MOF peptídico Cu(GHG) ha sido
estudiado como material quiral en SPE para la separación enantioselectiva de
metanfetamina y efedrina. Dicho MOF ha sido capaz de separar ˃50 % de (+)-
Efedrina de una mezcla racémica. Este es un resultado prometedor teniendo en
cuenta la limitada disponibilidad de cartuchos de SPE para separaciones quirales
que hay en el mercado.
En base a los principios de la Química Analítica Verde, se ha utilizado una
técnica de fácil miniaturización y automatización como es la IT-SPME en válvula,
donde el PDMS ha jugado un papel importante como fase extractante. En esta

xv
Tesis se ha propuesto la combinación de IT-SPME-CapLC con detector de fila de
diodos y fluorescencia para estimar DEHP, BAK y DPA.
La determinación de DEHP en sedimentos y agua mediante la combinación
de MSPD usando C18 y IT-SPME-CapLC usando un capilar basado en PDMS95 se ha
llevado a cabo satisfactoriamente en menos de 20 min. Los LODs obtenidos han
sido adecuados para control de calidad medioambiental (90-270 µg kg-1). Además
la reducción del consumo de muestra y disolventes, así como también de los
pasos de extracción evitan el riesgo de contaminación.
Se ha demostrado la versatilidad de IT-SPME-CapLC con capilares basados en
PDMS65 para el análisis de homólogos de BAK en mezclas de biocidas. El método
propuesto ha mostrado que se requiere la evaluación del efecto matriz para
analizar BAK en mezclas de biocidas. Diferentes efectos han sido observados en
función del tipo de co-biocida presente, relación co-biocida/BAK homólogo y de
cantidad total de surfactante, posiblemente por la formación de mezcla de
micelas. En todos los casos, la respuesta del homólogo C12 se ha visto más
afectada que la del homólogo C14. Por lo que el método propuesto se puede
considerar una vía de bajo coste para controlar procesos industrials donde el BAK
es un producto indeseado en una formulación.
También se ha llevado a cabo una satisfactoria estimación de DPA mediante
IT-SPME-CapLC usando un capilar de PDMS65. La utilidad del método propuesto ha
sido probado para estimar DPA muestreada de las manos de tiradores mediante
un hisopo de algodón y extracción mediante vórtex. El método propuesto permite
obtener información de interés judicial en una investigación forense.
Con el objetivo de mejorar la capacidad de extracción de la IT-SPME, se han
utilizado CNTs para funcionalizar capilares de PDMS. Gracias a la alta relación
superficie-volumen de estos nanomateriales, se incrementa la eficiencia de
extracción, lo que permite extender la IT-SPME a problemas analíticos donde el
volumen de muestra está limitado como es el caso de la saliva. La presencia de
CNTs mejora la eficiencia de extracción y los perfiles cromatográficos, resultando
en una opción interesante para el análisis de anfetaminas en saliva. El método
propuesto resulta muy simple y económico, además de proporcionar adecuada
selectividad, precisión y sensibilidad a niveles de concentración de µg mL-1 (LODs =
0.5–0.8 µg mL-1).

xvi
Es importante destacar los satisfactorios parámetros analíticos y satisfactoria
aplicación a muestras que se han obtenido mediante IT-SPME-CapLC en los
trabajos descritos en esta Tesis. Estos resultados han demostrado la idoneidad del
método IT-SPME-CapLC para detectar los analitos presentes en diferentes tipos de
matrices.
El segundo enfoque de esta tesis ha sido el desarrollo de sensores
colorimétricos que permiten un análisis in-situ.
Los sensores fabricados en se han basado por una parte en el encrustamiento
de reactivos colorimétricos (NQS y Co(SCN)2) en una matriz de PDMS, y por otra
parte, en la inmovilización de AgNPs en un soporte de nailon. En ambos casos, el
analito interaccciona con el cromóforo o las AgNPs del sensor cambiando así de
color. El análisis semicuantitativo se lleva a cabo mediante inspección visual y el
cuantitativo mediante la medida de absorbancia por reflectancia difusa o y/o
medida de valores de color de una imagen digital. También se han estudiado
micropalancas piezoeléctricas como sensores in-situ.
En esta Tesis, los sensores se han desarrollado para la determinación de
caseína en aguas residuales de industrias lácteas, ADP en productos industriales,
drogas de tipo anfetamínico y ketamina en drogas ilícitas en formato pastilla o
polvo, así como también, la detección de compuestos sulfúricos volátiles en
aliento.
Para la estimación de caseína se ha desarrollado un sensor de
PDMS/TEOS/SiO2NPs/NQS con satisfactorio LOD= 15 mg L-1. El método propuesto
supera una de las principales limitaciones del método convencional en disolución
con ácido biocincónico, la degradación del reactivo. Teniendo en cuenta las
ventajas de rapidez, sencillez, portabilidad y estabilidad que presenta este sensor,
se considera una potencial herramienta para su aplicación en el control in-situ de
la cantidad de caseína en efluentes de industrias lácteas.
Para la estimación del biocida ADP en formulaciones industriales, se ha
desarrollado un sensor basado en PDMS/TEOS/SiO2NPs/NQS con satisfactorio LOD
de 0.018 % en peso. Este sensor permite llevar cabo un análisis sostenible,
económico y rápido para el control de ADP, lo que sugiere buenas perspectivas
para su implantación a nivel industrial.

xvii
Para la estimación de drogas ilegales, se han desarrollado dos tipos de
sensores poliméricos. Un kit colorimétrico basado en un sensor de
PDMS/TEOS/SiO2NPs/NQS para la identificación y determinación in-situ de drogas
de tipo anfetamínico y otro basado en un sensor de PDMS/Co(SCN)2 para la
estimación de ketamina. Satisfactorios LOD fueron obtenidos para esta aplicación
(0.002-0.005 g mL-1 y 30 µg para los tipo anfetamínicos y ketamina,
respectivamente). Ambos kits son herramientas muy útiles para el cribado
instantáneo de las drogas ilícitas más utilizadas en las pruebas en carretera debido
a su simplicidad, rapidez, estabilidad y portabilidad, a un coste muy bajo. De
modo que los tiempos de demora podrían minimizarse a través de esta prueba en
campo.
Con respecto al sensor basado en AgNP, los compuestos sulfúricos volátiles
se han detectado satisfactoriamente con LOD de 45 ppb (v /v, µL m-3). Este sensor
pasivo no requiere una fuente de energía externa y, por lo tanto, el coste de
energía es cero. Sus ventajas tales como estabilidad, simplicidad, rapidez (10 min)
y bajo coste lo convierten en una potencial kit clínico para el control del mal
aliento, así como en atmósferas o áreas cerradas.
Finalmente, las micropalancas piezoeléctricas has sido evaluadas como
sensores de gas. Se han estudiado nuevos procedimientos de fabricación, diseño y
composición. Las mejores propiedades electromecánicas se han conseguido con
0.75% de Li2O3, 1.2% de Bi2O3 y 1.05% de composición de CuO (Keff ≈ 33.5% para la
vibración planar de los discos). El uso de un material comercial polimérico para la
capa de sacrificio ha permitido simplificar el procedimiento de fabricación debido
a que éste es eliminado durante la sinterización. También se ha funcionalizado
exitosamente mediante deposición de una dispersión de sílica mesoporosa tipo
MCF (Mesoporous Cellullar Foam) en la capa superior del electrodo de oro. La baja
sensibilidad (0.1 Hz ppm-1) obtenida para la humedad sugiere una potencial
aplicabilidad como sensor de compuestos orgánicos volátiles para fines
ambientales.
Es decir, los sensores in-situ propuestos en esta Tesis pueden ser
considerados como una alternativa sostenible y eficaz a los métodos
instrumentales convencionales. La inmobilización de reactivos o nanopartículas en
un soporte sólido evita la necesidad de preparar disoluciones que resultan ser
inestables y no se requieren equipos de elevado coste.

xviii
La importancia de los (nano)materiales para desarrollar metodologías
analíticas ha quedado demostrada:
1. El PDMS es un excelente material extractante y encapsulante de colorantes
gracias a sus coeficientes de partición, permeación y transparencia.
2. El C18 es ampliamente usado como material abrasivo en MSPD debido a su
hidrofobicidad y fácil empacado.
3. La sílica mesoporosa MCF es un material con una potencial aplicabilidad
como capa sensible en micropalancas resonantes gracias a su gran área
superficial.
4. Los CNTs en las columnas capilares para IT-SPME mejoran las eficiencias de
extracción y la resolución para analitos que interaccionan a través de
interacciones π-π.
5. El MOF peptídico Cu(GHG) es un material adecuado para el reconocimiento
enantioselectivo de drogas quirales como la efedrina debido a su interacción
preferente por uno de los enantiómeros a través de puentes de H adicionales
o más fuertes.
6. Las AgNPs son materiales muy sensibles para el diseño de sensores in-situ en
soporte de nailon.

xix
ABSTRACT

xx

xxi
ABSTRACT
The research on materials and new strategies to improve sample
pretreatment and/or instrumental techniques has attracted great attention in the
current developments of Analytical Chemistry. This Thesis presents interesting
uses of (nano)materials to improve or develop sensing, extraction and separation
techniques. The recent goal in Analytical Chemistry is the development of
ecofriendly methodologies. In order to achieve this aim, analytical strategies
focused on green aspects have been carried out: (i) miniaturized sample
pretreatment and separation techniques and (ii) in-situ sensors. The materials
studied in this Thesis have been organized in silicon-based (PDMS, C18 and MCF),
carbon-based (MWCNTs and SWCNTs) and metallic-based (MOF and AgNPs).
The versatile properties and low cost of PDMS has promoted its use as
extractive phase in SPME and support for sensing devices has grown in
importance. PDMS has been studied as extractive phase in IT-SPME-Cap-LC for
estimating DEHP, BAK and DPA at trace levels in several matrices of
environmental, industrial and forensic interest. The potential use of CNTs as
extractive phase has been widely reported. Thus, CNTs have been studied to
functionalize capillary columns for IT-SPME. Due to the enhancement on
extraction efficiency and chromatographic profiles, CNTs have proved to be a
reliable alternative to conventional phases in IT-SPME for estimating
amphetamines in oral fluids. The proposed IT-SPME approach coupled to CapLC
integrates on-line extraction, preconcentration and separation, reducing the
sample treatment steps.
Another important application of PDMS is its use as embedding material of
dyes for developing optical sensors for in-situ analysis. In this context, colorimetric
sensors for on-site estimation of amino compounds such as casein, a biocide,
amphetamine-like compounds and ketamine have been developed.
Moreover, a sensor based on AgNPs has been also developed as clinical kit
for the in-situ and real time detection of volatile sulfur compounds, which are
related to oral malodour. AgNPs are highly sensitive materials for their application
as plasmonic sensor.
xxii
A new application of the material C18 has been carried out. Thanks to the
retentive capacity for amphetamine compounds, and thus, the capacity of C18 to
disrupt as well as to clean-up the sample, this material has been successfully
evaluated as dispersant phase for MSPD. This approach integrates matrix
disruption, clean-up and derivatization to simplify sample preparation for the
determination of amphetamines in hair.
A potential applicability of MCF silica as sensing layer for resonant
piezoelectric microcantilevers has been tested. In addition, an alternative
fabrication procedure by using a polymeric commercial material for the sacrificial
layer has been developed. Thus, the fabrication procedure is simplified due to
sacrificial layer is removed during the firing step.
To our knowledge, the first example of a MOF capable of separating chiral
polar drugs by using SPE has been studied in this Thesis. A chiral Cu(II) 3D MOF
based on the tripeptide Gly-L-His-Gly has been used as extractive phase for the
enantioselective separation of ephedrine.
The potential applicability of the materials studied has been demonstrated by
the determination of several target compounds in different matrices. The
proposed methodologies have reported improvements in terms of cost, rapidity,
simplicity and sensitivity, besides protecting the operator and the environment.

xxiii
INDEX

xxiv

xxv
INDEX
CHAPTER 1. INTRODUCTION ..................................................................................... 1
1.1 RECENT TRENDS IN ANALYTICAL CHEMISTRY ................................................. 3
1.2 MINIATURIZED SYSTEMS ................................................................................. 6
1.2.1 Miniaturized sample pretreatment techniques ....................................... 6
1.2.1.1 IT-SPME configurations ................................................................... 10
1.2.1.2 Trends in extractive phases ............................................................ 12
1.2.2 Miniaturized separation techniques ...................................................... 14
1.2.3 Figures of merit of the online IT-SPME-LC ............................................. 18
1.3 IN-SITU DEVICES ............................................................................................ 19
1.3.1 Optical sensors ....................................................................................... 24
1.3.2 Electromechanical sensors ..................................................................... 29
1.4 (NANO)MATERIALS AND APPLICATIONS ....................................................... 35
1.4.1 Si-based materials .................................................................................. 36
1.4.1.1 PDMS ............................................................................................... 36
1.4.1.2 Bondesil C18 ..................................................................................... 39
1.4.1.3 Mesoporous silica ............................................................................... 40
1.4.2 C-based materials................................................................................... 42
1.4.3 Metallic-based materials ........................................................................ 44
1.4.3.1 AgNPs and AuNPs ............................................................................ 44
1.4.3.2 MOFs ............................................................................................... 49
1.5 ANALYTES AND ANALYTICAL TECHNIQUES ................................................... 50
1.5.1 Phthalates .............................................................................................. 50
1.5.2 Biocides .................................................................................................. 52
1.5.2. 1 Benzalkonium chloride (BAK) ......................................................... 53
1.5.2.2 ADP .................................................................................................. 55
1.5.3 Casein ..................................................................................................... 55

xxvi
1.5.4 Drugs ...................................................................................................... 57
1.5.4.1 Amphetamine-like designed drugs ................................................. 57
1.5.4.2 Ketamine ......................................................................................... 61
1.5.6 Volatile sulfure compounds (VSCs) ........................................................ 64
CHAPTER 2. OBJECTIVES ......................................................................................... 67
CHAPTER 3. METHODOLOGY .................................................................................. 77
3.1 CHEMICALS AND REAGENTS ......................................................................... 79
3.2 INSTRUMENTATION ...................................................................................... 82
3.2.1 Spectroscopic techniques ...................................................................... 82
3.2.1.1 UV-Vis spectrophotometry ............................................................. 82
3.2.1.2 Infrared spectroscopy ..................................................................... 83
3.2.1.3 RAMAN spectroscopy ..................................................................... 84
3.2.1.4 Electro-mechanical Impedance spectroscopy .................................... 85
3.2.2 Chromatographic techniques ................................................................. 86
3.2.2.1 HPLC–FLD ........................................................................................ 86
3.2.2.2 CapLC-DAD ...................................................................................... 87
3.2.2.3 CapLC–FLD ....................................................................................... 89
3.2.3 Microscopic techniques ......................................................................... 90
3.2.3.1 Light microscopy ............................................................................. 90
3.2.3.2 Scanning electronic miscroscopy (SEM).......................................... 91
3.2.3.3 Surface profiler microscopy ............................................................ 91
3.3 SAMPLE PRETREATMENT TECHNIQUES ........................................................ 92
3.3.1 Off-line sample pretreatment techniques ............................................. 92
3.3.1.1 SPE ................................................................................................... 92
3.3.1.2 Vortex-assited extraction (VAE) ...................................................... 93
3.3.1.3 Ultrasound-assisted extraction (UAE) ............................................. 93
3.3.1.4 MSPD ............................................................................................... 94
3.3.2 On-line extraction techniques................................................................ 96

xxvii
3.3.2.1 In-valve IT-SPME ............................................................................. 96
3.4 FABRICATION OF SENSORS ........................................................................... 97
3.4.1 PDMS/TEOS/SiO2NPs-NQS sensors (Patent 201300436) ....................... 97
3.4.2 PDMS-Co(SCN)2 sensors ..................................................................... 98
3.4.3 AgNPs-based sensors (Patent 201600440) ...................................... 100
3.4.4 Screen-printed piezoelectric MEMS ................................................ 100
3.5 PROCEDURES AND EXPERIMENTAL CONDITIONS ....................................... 106
3.5.1 Chromatographic conditions................................................................ 106
3.5.2 IT-SPME conditions .............................................................................. 108
3.5.3 Derivatization procedures .................................................................... 109
3.5.4 Response of polymeric sensors ............................................................ 110
3.5.5 Response of AgNPs based sensors ....................................................... 112
3.5.6 Response of screen-printed sensors .................................................... 113
3.6 SAMPLES ..................................................................................................... 114
3.6.1 ENVIRONMENTAL SAMPLES................................................................. 114
3.6.1.1 Sediments ..................................................................................... 114
3.6.1.2 Water ............................................................................................ 114
3.6.2 BIOLOGICAL SAMPLES .......................................................................... 115
3.6.2.1 Oral fluid ....................................................................................... 115
3.6.2.2 Hair ................................................................................................ 115
3.6.2.3 Breath ............................................................................................ 116
3.6.3 INDUSTRIAL SAMPLES .......................................................................... 116
3.6.4 FORENSIC SAMPLES ............................................................................. 117
3.6.4.1 Street drug samples ...................................................................... 117
3.6.4.2 Shooter hands ............................................................................... 117
CHAPTER 4. RESULTS AND DISCUSSION ................................................................ 119
4.1 Si-BASED MATERIAL .................................................................................... 121
4.1.1 PDMS AS EXTRACTIVE PHASE FOR IT-SPME ......................................... 121

xxviii
4.1.1.1 A cost-effective method for estimating DEHP in coastal sediments
by IT-SPME-CapLC............................................................................................... 122
4.1.1.2 IT-SPME-CapLC method for BAK determination as a component or
contaminant in mixtures of biocides. ................................................................. 130
4.1.1.3 A new method for estimating DPA in GSRs as a new tool for
identifying both, inorganic and organic ones, in the same sample ................... 141
4.1.2 PDMS AS SUPPORTING MATERIAL FOR SENSORS DEVELOPING .......... 159
4.1.2.1 PDMS sensor containing NQS as unique dispositive for the
estimation of casein in effluents from dairy industries ..................................... 160
4.1.2.2 A solid device based on doped hybrid composites for controlling
the dosage of ADP in industrial formulations .................................................... 171
4.1.2.3 A solid colorimetric sensor for the analysis of amphetamine-like
street samples .................................................................................................... 185
4.1.2.4 A passive solid sensor for in-situ colorimetric estimation of the
presence of ketamine in illicit drug samples ...................................................... 196
4.1.3 C18 AS PHASE FOR MSPD ...................................................................... 208
4.1.3.1 Determination of amphetamines in hair by integrating sample
disruption, clean-up and solid phase derivatization .......................................... 208
4.1.4 Mesoporous silica as sensing layer for MEMS .................................... 222
4.2 C-BASED MATERIAL ..................................................................................... 237
4.2.1 Application of CNTs modified coatings for the determination of
amphetamines by IT-SPME-CapLC ................................................................ 237
4.3 METALLIC-BASED MATERIALS ..................................................................... 252
4.3.1 MOF ...................................................................................................... 252
4.3.1.1 Peptide MOF for enantioselective separation of chiral drugs ...... 252
4.3.2 AgNPs and AuNPs ................................................................................. 265
4.3.2.1 Colorimetric sensor based on silver nanoparticles for detecting
volatile sulfur compounds .................................................................................. 265
CHAPTER 5. GENERAL CONCLUSIONS ................................................................... 275
REFERENCES .......................................................................................................... 285

xxix
ANNEX ................................................................................................................... 337
A1. Abbreviations .................................................................................................. 339
A2. Figure list ........................................................................................................ 339
A3. Table list .......................................................................................................... 339
A4. PhD contributions to publications .................................................................. 339
345
361
367


1
CHAPTER 1. INTRODUCTION

2
Chapter 1. Introduction
3
The development of Analytical Chemistry is governed by the implementation
of new technologies and internet, the development of (nano)materials and the
social changes produced in the last years. Thanks to technological progress, the
tendency is that classical methods are being replaced with new tools and
instruments reducing the time analysis and improving the figures of merit of the
analytical procedures. In addition, the advance in computing is supporting the
automatization, miniaturization and simplification of systems and data treatment.
The miniaturization of instruments is a key point since the small scale is giving rise
to more sustainable methods thanks to the reduction of solvents, reagents and
wastes. This is the starting point to develop portable instruments for in-situ
analysis. In the same direction, it should be note the use of new analytical
responses as the image analysis by smartphones. Their responses have opened
alternative tools providing real-time measurements for in-situ analysis. The
irruption of new (nano)materials is another break point in the global evolution of
Analytical Chemistry. Indeed, the study of (nano)materials to enhance the existing
techniques and develop new techniques remains a growing area of research.
1.1 RECENT TRENDS IN ANALYTICAL CHEMISTRY
From the concern about environmental issues such as chemical pollution and
resource depletion, Green Chemistry emerges in 1990´s. This chemical area is
foccused on the development of environmental friendly technologies in order to
reduce or eliminate the use and generation of hazardous substances. Paul Anastas
and John Warner developed the following list of twelve principles guides the
practice of Green chemistry (Anastas, P.T. et al., 1998):
1. Prevention: it is better to prevent waste than to treat or clean up waste after
it is created.
2. Atom Economy: synthetic methods should be designed to maximize the
incorporation of all materials used in the process into the final product.
3. Less Hazardous Chemical Syntheses: wherever practicable, synthetic
methods should be designed to use and generate substances that possess
little or no toxicity to human health and the environment.

Chapter 1. Introduction
4
4. Designing Safer Chemicals: chemical products should be designed to affect
their desired function while minimizing their toxicity.
5. Safer Solvents and Auxiliaries: the use of auxiliary substances (e.g., solvents,
separation agents, etc.) should be made unnecessary wherever possible and
innocuous when used.
6. Design for Energy Efficiency: energy requirements of chemical processes
should be recognized for their environmental and economic impacts and
should be minimized. If possible, synthetic methods should be conducted at
ambient temperature and pressure.
7. Use of Renewable Feedstocks: a raw material or feedstock should be
renewable rather than depleting whenever technically and economically
practicable.
8. Reduce Derivatives: unnecessary derivatization (use of blocking groups,
protection/ deprotection, temporary modification of physical/chemical
processes) should be minimized or avoided if possible, because such steps
require additional reagents and can generate waste.
9. Catalysis: catalytic reagents (as selective as possible) are superior to
stoichiometric reagents.
10. Design for Degradation: chemical products should be designed so that at the
end of their function they break down into innocuous degradation products
and do not persist in the environment.
11. Real-time analysis for Pollution Prevention: analytical methodologies need
to be further developed to allow for real-time, in-process monitoring and
control prior to the formation of hazardous substances.
12. Inherently Safer Chemistry for Accident Prevention: substances and the
form of a substance used in a chemical process should be chosen to minimize
the potential for chemical accidents, including releases, explosions, and fires.

Chapter 1. Introduction
5
The application of these principles to Green Analytical Chemistry entailed a
revision in order to fulfill the requirements and characteristics of Analytical
Chemistry. In this context, concise guidelines in the form of Green Analytical
Chemistry principles were reported to be helpful in greening analytical laboratory
(Gałuszka, A. et al., 2013):
1. Direct analytical techniques should be applied to avoid sample treatment.
2. Integration of analytical processes and operations to reduce the consumption
of reagents and energy.
3. Reduction in generated amounts of wastes and proper management of
wastes.
4. Energy saving.
5. Automated and miniaturized methods should be selected.
6. Reagents obtained from renewable source should be preferred.
7. Safety for operator should be increased.
8. In situ measurements should be performed.
9. Derivatization should be avoided.
10. Minimal size and number of samples are goals.
11. Multi-analyte or multi-parameter methods are preferred versus methods
using one analyte at a time.
12. Eliminate or replace toxic reagents.
Therefore, the goal of Green Analytical Chemistry is the developement or
improvement of analytical methodologies to reduce the negative impacts on
health and environment. As a consequence of the principles of the Green
Analytical Chemistry, the current trends in analytical chemistry are focused on the
development of new techniques amenable to miniaturization and automatization,
as well as in-situ analysis.
Hence, the general aim of this Thesis is the investigation of (nano)materials
for their application in miniaturized systems, particularly for extraction and
separation techniques, and in-situ devices in order to achieve the new challenges
of the analytical chemistry.

Chapter 1. Introduction
6
1.2 MINIATURIZED SYSTEMS
Despite of the progress in analytical instrumentation, sample preparation is
still a critical step. In order to obtain a reliable analytical response, many
operations are required to extract, concentrate, purify and/or transform the
analyte. Within the sample preparation, extraction techniques play an important
role since the analytes are transferred from the matrix to an extractive phase.
Although an efficient extraction depends on each extraction technique, the most
important point is the use of a suitable extractive phase. In this sense, the
research of new extractive strategies and new materials to improve the extraction
efficiencies and selectivity is an emerging field as will explain later.
1.2.1 Miniaturized sample pretreatment techniques
The extraction of the analytes from different matrices can be carried out
through liquid-phase extraction (LPE) or through solid-phase extraction (SPE).
However, in the last decades, the use of SPE is preferred mainly due to the
pressure to decrease organic solvent usage which encouraged the requeriments
for solvent-free procedures. SPE has been widely used for the preparation of
biological, pharmaceutical, environmental and food samples (Lindsey et al., 2001;
Picó, Y. et al., 1994, 2007; Ridgway, K. et al., 2007). This technique is based on the
interaction of analytes dissolved in a liquid with a solid sorbent through which the
sample passes. The result is the separation between desired and undesired
components from the sample. The portion that passes through the sorbent is
collected or discarded, depending on whether it contains the analytes or
impurities. In the case that the analytes are retained on the sorbent, they can be
removed by rinsing with an adequate eluent for their collection (Figure 1). SPE is a
powerful technique used to pre-concentrate and isolate the analytes prior to the
determination technique.

Chapter 1. Introduction
7
Figure 1. Scheme of the SPE procedure.
SPE is not only carried out in liquid matrix but also in solid matrix, this is the
case of matrix solid phase dispersion (MSPD) (Barker, S.A., 2007; García-López, M.
et al., 2008; Moliner-Martínez, Y. et al., 2012a). This technique involves the
grinding of a portion of the sample with an abrasive solid material. The grinding
process disrupts the sample structure and disperses it over the surface of the
extractive material. The blend is then packed into a pre-fritted SPE tube, and
finally the analytes are selectively desorbed with an appropriate solvent. The
analytical process is considerably simplified, and typical problems encountered
when using other treatments (e.g. emulsion formation) are avoided. This
technique also reduces sample and solvents consumption and does not need
special instrumentation. Due to the inherent advantages, MSPD is widely applied
in the environmental and toxicological fields as well as in food analysis (Capriotti,
A.L. et al., 2010; Míguez-Framil, M. et al., 2010; Freitas, S.S. et al., 2018; Souza,
I.D. et al., 2018). The selectivity and efficiency of MSPD is mainly dependent on
the sorbent and extractive solvent used. As regards the sorbents, most reported
methods used reversed phase SPE materials, such as C18 and C8 phases for the
dispersion and retention of lipophilic analytes, whereas silica and alumina
particles are the normal phase sorbents most frequently used. More recently,
sorbents such as graphene (Liu, Q. et al., 2011; Li, C. et al., 2014; Peng, L.Q. et al.,
Analyte InterferencesC
on
dit
ion
ing
Sam
ple
load
ing
Was
hin
g
Elu
tin
g

Chapter 1. Introduction
8
2017), polymeric materials (Wang, T. et al., 2011 and 2018) and metal-organic
frameworks (MOFs) (Santos Barreto, A. et al., 2018) have been reported.
According to the principles of Green Analytical Chemistry, many of the
research contributions in analytical chemistry have been focused on the
development of easy and ecofrindly techniques. Consequently, traditional
extraction techniques such as SPE, LPE and others are being gradually replaced by
techniques amenable to miniaturization and automatization that provide the
reduction of solvent/reagent consumption and waste generation (Belay, K., 2016),
and also the improvement on selectivity and preconcentration in lower times.
Many attemps have been carried out in this sense; one of them is the solid phase
microextraction (SPME) as miniaturized alternative to SPE introduced by Arthur
and Pawliszyn in 1990 (Arthur, C.L. and Pawliszyn, J., 1990).
Initially, SPME was developed using silica fiber coated on its outer surface
with a polymeric extractive phase, mainly polydimethylsiloxane (PDMS), which is
inside a device, similar to a syringe with needle (fiber-SPME). The needle
protecting the fiber is retracted and the fiber is immersed in the sample solution
or the headspace of sample for the adsorption of the analytes on the polymer
coating. After equilibrium is reached, the fiber is withdrawn and transferred into
the chromatograph for desorption and analysis of analytes. This new technique
eliminated the problems related with SPE remaining the advantages; elimination
of solvents, reduction of blanks values and reduction of extraction time.
Despite the advantages of fiber-SPME, this technique showed some
limitations such as fiber fragility, low extraction capability, bleeding from coatings
of fiber and also difficult coupling to liquid chromatography. To overcome the
limitations of fiber-SPME, in-tube solid phase microextraction (IT-SPME) was
proposed as an alternative. In 1997, Eisert and Pawliszyn (Eisert, R. and Pawliszyn,
J., 1997) developed the first on-line IT-SPME copupled to High Performance Liquid
Chromatography (HPLC) system. IT-SPME is based on the use of a fused-silica
capillary tube packed or coated on its inner surface with an extractive phase.
When the sample is passed through the capillary, the analytes are extracted and
concentrated by adsorption/absorption into the internally coating of the capillary.
After that, the extracted analytes are desorbed by filling the capillary with a
proper solvent, which can be collected for further processing (static desorption)
or can be transferred to the analytical instrument by means of a solvent stream
(dynamic desorption). Static mode is usually applied when analytes have strong

Chapter 1. Introduction
9
interactions with the extractive phase and cannot be desorbed easily by the
mobile phase. Although this technique has been used in combination with gas
chromatography (GC) (Aguilar, C. et al., 2000; Globig, D. and Weickhardt, C.,
2005), liquid chromatography (LC) is by far the most used system in IT-SPME-
based assays (Andrade, M.A. and Lancas, F.M., 2017; Fernández-Amado, M. et al.,
2017; Kataota, H., 2002; Mei, M. and Huang, X., 2017; Wang, R. et al., 2018). IT-
SPME has been also coupled with other analytical instruments such as direct
analysis in real time mass spectrometry (DART-MS) (Wang, X. et al., 2014) and
hybrid generation atomic absorption spectrometry (HG-AAS) (Asiabi, H. et al.,
2016a) for on-line conditioning. IT-SPME has been mainly developed to extend
the SPME towards the path of automatization and on-line coupling to analytical
instrumentation. Cleaning, preconcentration, separation and detection of analytes
are carried out at the same step. In addition, this miniaturized technique can be
consider an environmental friendly technique due to the reduction of solvents
and wastes, energy, and so costs, maintaining or improving the reliability of the
analytical performance parameters, such as sensitivity, precision and accuracy
(Turner, C., 2013). From the advantages mentioned, IT-SPME has managed a
widespread acceptance as preferential technique for many applications,
illustrated by the increasing number of citations since its discovery (Figure 2).
Figure 2. Evolution of the number of citations on Web of Science for matching the search
items “IT-SPME” OR “In-tube SPME” OR “In-tube solid phase microextraction”.
0
200
400
600
800
1000
1200
19
98
19
99
20
00
20
01
200
2
20
03
20
04
20
05
20
06
20
07
20
08
20
09
20
10
20
11
20
12
20
13
20
14
20
15
20
16
20
17
Nu
mb
er o
f ci
tati
on
s
Year

Chapter 1. Introduction
10
Among the different modalities to perform SPME, IT-SPME is a versatile
technique that can be effected with several configurations. The on-line
configuration combines extraction and separation/detection in one step,
therefore the process can be automated (Moliner-Martínez, Y. et al., 2015). IT-
SPME involves the on-line coupling of the extraction to a LC system. There are two
main modes to carry out this coupling, known as draw/eject and flow-through
modes (Figure 3).
1.2.1.1 IT-SPME configurations
a) Draw/eject IT-SPME
The sample is repeatedly aspirated and dispensed through the extractive
capillary a number of cycles until partition equilibrium between analytes and
extractive phase is reached or until the amount of analyte extracted is enough.
For this purpose, a programmed autosampler is required (Cháfer-Péricas, C. et al.,
2008; Chaves, A.R. et al., 2011; Mizuno, K. and Kataoka, H., 2015; Saito, K. et al.,
2012; Zhang, S. et al, 2010). The extractive capillary is placed between the needle
and the loop of an autosampler. The extracted analytes are statically desorbed
from the capillary coating by filling the capillary with an appropriate solvent and
then transferred to the chromatographic column. Alternatively, extracted analytes
can be desorbed and transported to the analytical column by mobile-phase flow
(Figure 3A). In this mode, cleaning and conditioning of the capillary between runs
is required. For this, many systems incorporate an additional pump for
transferring, cleaning and conditioning.
b) In flow-through IT-SPME
The sample is passed through the extractive capillary (one time) to retain the
analytes. Next, the retained analytes are desorbed and transferred to the
chromatographic column by delivering the appropriate solvent, statically or
dynamically. In this case, conditioning, loading, cleaning and transferring
operations can be carried out manually or automatically. Different setups can be
used. The simplest setup named in-valve IT-SPME (Figure 3B) entails the
replacement of the loop of an injection valve by the extractive capillary (Jornet-
Martínez, N. et al., 2015a; Li, Y. and Xu, H., 2015; Wang, S. et al., 2015). The
analytes are extracted during sample loading, and transferred to the separative

Chapter 1. Introduction
11
column with the mobile phase by changing the valve position to inject position.
Another setup consists of two valves (Figure 3C). The extracted analytes can be
desorbed and transferred from the capillary of first valve to the injection loop of
the second valve by means of an auxiliary pump. Next, the plug of solvent in the
loop with the desorbed analytes is sent to the chromatographic column with the
mobile phase by changing the valve position from load to inject (Masià, A. et al.,
2013).
Figure 3. Schematic representation of configurations used for IT-SPME-LC: A) draw/eject
cycle mode, B) flow-through in-valve IT-SPME and C) flow-through with an additional
pumping system.
Pump
Chromatographic columnDetector
Extractive capillary
Injection loop
draw/eject
Chromatographic column DetectorPump
Extractive capillarySample
Chromatographic column
Auxiliarypump
Extractive capillarySample
DetectorPump
A)
B)
C)
Valve 1
Valve 2

Chapter 1. Introduction
12
In the draw/eject system, the extraction efficiency can be enhanced by
increasing the number of cycles, so relatively high recoveries can be reached.
Although extraction recoveries in flow-through systems are lower than in
draw/eject approach, the amount of analytes extracted can be increased by
increasing the sample volume loaded into the capillary. Due to this fact,
flow/through configuration is suited for the analysis of water samples, where
volumes up to 2-4 mL can be passed through the extractive capillary without
causing its deterioration or clogging. Satisfactory selectivity has been reported for
many organic pollutants in environmental waters (Wu, J.C. and Pawliszyn, J., 2001;
Cháfer-Péricas, C. et al., 2008; Aufartová, J. et al., 2012).
In this Thesis, the in-valve IT-SPME modalities has been studied to determine
contaminants in coastal sediments and water, biocides in industrial mixtures,
organic gunshot compound deposited on hands and amphetamine compounds in
oral fluid.
1.2.1.2 Trends in extractive phases
The extraction, cleanup and preconcentration is related to the interactions
between the analytes and the extractive phase (hydrogen bonding, acid-base, π-π,
dipole-dipole, dipole-induced-dipole and dispersion forces), and so depend on
several parameters of capillary column such as coating type and thickness, and
length and internal diameter (Moliner-Martínez, Y. et al., 2015a). With the aim to
improve the performance, the study of new materials for its application as
extractive phases is an expanding field of research. Tipically, segments of
commercial capillary columns such as those used in GC have been employed as
extractive capillaries, taking advantage of the fact a variety of extractive phases
are available for compounds of different polarities. Figure 4 summarizes the
percentages of studies about materilas used as extractive phases in the last five
years. The extractive phases mainly employed to perform IT-SPME can be divided
into silicon-based (Si-based) and carbon-based (C-based). Diphenyl-modified
PDMS has been deeply researched, although dimethylsiloxane and cyanomethyl
silicones are reported in the literature (Campins-Falcó, P. et al., 2008, 2009, 2010;
Cháfer-Pericás, C. et al., 2006, 2007; Fernández-Amado, J. et al., 2016; Hakobyan,
L. et al., 2018; Jornet-Martínez, N. et al, 2014a, 2015a; Masià, A. et al. 2013;
Moliner-Martínez, Y. et al., 2010, 2011, 2015b, ; Muñoz-Ortuño, M. et al., 2012;
Pla-Tolós, J. et al., 2015, 2016a; Prieto-Blanco, M.C. et al., 2008, 2011, 2012,

Chapter 1. Introduction
13
2013a, 2013b; Vitta, Y. et al., 2010). With regard to C-based sorbents,
polyethylenglycol (PEG) (Gou, Y. and Pawliszyn, J., 2000), divinylbenzene
(Kataoka, H. et al., 2009; Nonaka, Y. et al., 2009; Saito, K. et al., 2010) and carbon-
(nano)materials-based such as graphene, carbon nantotubes (CNTs) and fibres (Li,
Y. and Xu, H., 2015; Liu, X.-Y. et al., 2008; Moliner-Martínez, Y. et al., 2015b;
Wang, X. et al., 2013; Zhang, W.P. et al., 2013) are the most widely studied. Si-
based sorbents have been mainly used for environmental, food and industrial
products analysis, while C-based sorbents have been proposed for biological and
food sample analysis. Extraction efficiency provided by some conventional
capillary coatings is limited due to low loading capacity, stability and slow
diffusion of the analytes from the sample to the coating. Hence, the main
challenges in microexctraction-based techniques, particularly IT-SPME, are the
improvement on selectivity, sensitivity, stability and extraction time. As a
consequence, the study of new extractive phases is a subject matter that arouses
great interest. In this regard, a wide range of sorbents are documented in the
literature, including polypyrrole (Mullet et al., 2002; Wang, S. et al., 2015: Wu, J.C.
and Pawliszyn, J. 2001), magnetic nanoparticles (NPs) (González-Fuenzalida, R.A.
et al., 2014; Manbohi, A. and Ahmadi, S.H., 2015; Moliner-Martínez, Y. et al.,
2012b, 2014a; Shamsayei, M. et al. 2018), antibodies-based (Chaves, A.R. et al.,
2011, 2013; Xu, B. et al., 2015; Ying, L.-L. et al., 2017), molecular imprinted
polymers (MIPs) (Asiabi, H. et al., 2016b; Chaves, A.R. and Queiroz, M.E.U., 2013b;
Souza, I.D. et al., 2016; Zarejousheghani, M. et al., 2013), MOFs (Shih, Y.H. et al.,
2016; Zhang, J. et al., 2015), silver-nanostructures (Sun, M. et al., 2015) and
monolithic capillary columns (Wang, T. et al., 2016; Wu, F. et al., 2016; Zheng, M.-
M. et al. 2009). Among these materials, C-based nanomaterials are the most
widely used as extractive phases in IT-SPME. Thereby, the application of C-based
nanomaterials will be further discussed in detall. In addition, the application of
external sources such as magnetism, electrical fields and thermal energy have
been also tested to enhance the affinity of analytes towards the extractive phases
(Mei, M. et al., 2016; Moliner-Martínez, Y. et al., 2012b). These approaches have
been effected in the flow-through modality due to the easy implement of
equipment to provide magnetic, electric or thermal field that provide this
modality.

Chapter 1. Introduction
14
Figure 4. Percentage of studies using several materials as extractive phases for the last five
years. Data from Web of Science matching the search terms “IT-SPME” OR “In-tube solid
phase microextraction” OR “In-tube SPME”.
1.2.2 Miniaturized separation techniques
Another challenge of the Analytical Chemistry, as regards chromatographic
techniques, has been the reduction of mobile phase flow to microliters (µL) or
nanoliters (nL) per time. In this context, IT-SPME coupled to miniaturized
chromatographic techniques has received special attention. IT-SPME on-line
combined with conventional LC is well-documented. Many references have
applied IT-SPME-HPLC with Ultraviolet-Visible (UV-Vis) detector (Campíns-Falcó, P.
et al, 2008; Li, T. et al., 2009; Prieto-Blanco, M.C. et al, 2009a; Wang, T.T et al.,
2015), fluorescence detector (FLD) (Campins-Falcó, P. et al 2009; Prieto-Blanco,
M.C. et al, 2008; Zhang, J. et al., 2015) or mass spectrometry (MS) (Kataoka, H. et
al., 2009; Tan, F. et al., 2015; Zheng, M.-M. et al., 2009 and 2010) for the analysis
of biological, food, environmental or industrial samples. However, current trends
focused on the miniaturization have triggered the development of IT-SPME
coupling to chromatographic techniques with reduced dimensions (i.e. capillary
liquid chromatography, Cap-LC, and liquid nanochromatography, nano-LC). The
operational parameters and dimensions used in several miniaturized designs of IT-
SPME-LC are shown in Table 1. The direct combination of IT-SPME with the
PDMS-based 22%
MIP-based7%
MOF-based2%Polypyrrole-based
8%
Fe3O4 NPs-based4%
Antibodies-based4%Divinylbenzene
5%
C-based nanomaterial 10%
Monolithic (sol-gel, acrylate,others)
12%
Ionic liquid4%
Fibers (silk, basalt, Cu, polyester)
8%
Others 14%
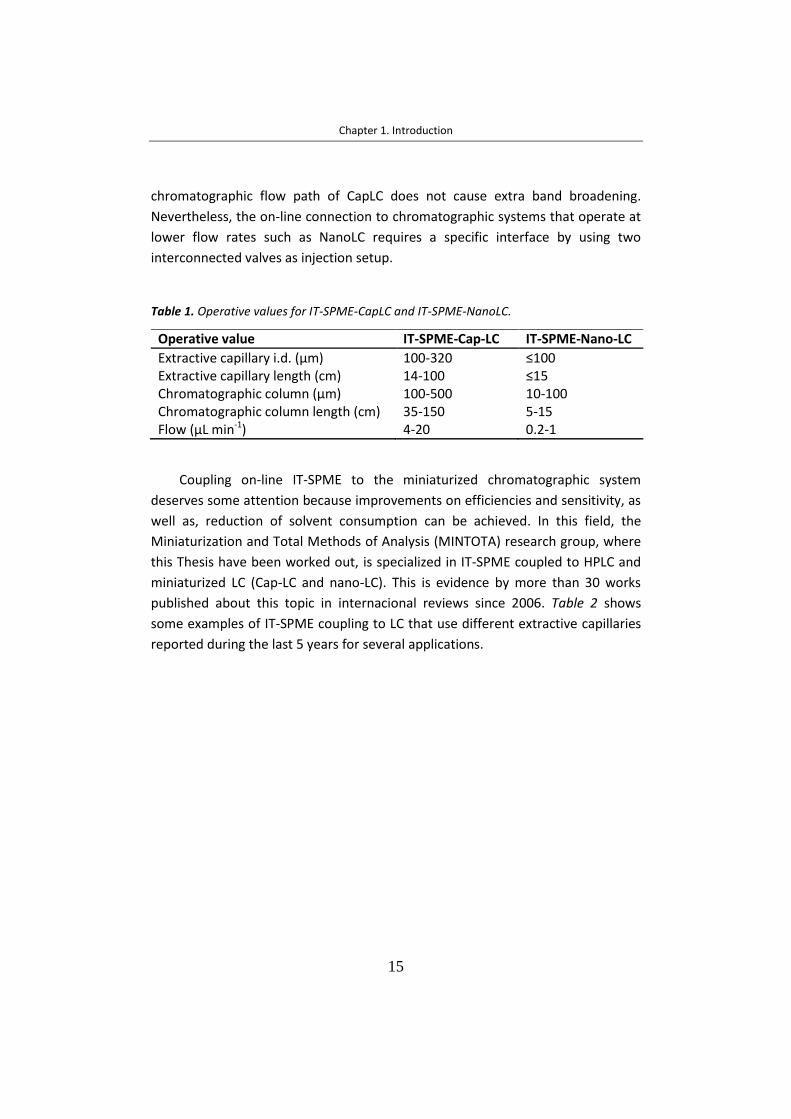
Chapter 1. Introduction
15
chromatographic flow path of CapLC does not cause extra band broadening.
Nevertheless, the on-line connection to chromatographic systems that operate at
lower flow rates such as NanoLC requires a specific interface by using two
interconnected valves as injection setup.
Table 1. Operative values for IT-SPME-CapLC and IT-SPME-NanoLC.
Operative value IT-SPME-Cap-LC IT-SPME-Nano-LC
Extractive capillary i.d. (µm) 100-320 ≤100 Extractive capillary length (cm) 14-100 ≤15 Chromatographic column (µm) 100-500 10-100 Chromatographic column length (cm) 35-150 5-15 Flow (µL min-1) 4-20 0.2-1
Coupling on-line IT-SPME to the miniaturized chromatographic system
deserves some attention because improvements on efficiencies and sensitivity, as
well as, reduction of solvent consumption can be achieved. In this field, the
Miniaturization and Total Methods of Analysis (MINTOTA) research group, where
this Thesis have been worked out, is specialized in IT-SPME coupled to HPLC and
miniaturized LC (Cap-LC and nano-LC). This is evidence by more than 30 works
published about this topic in internacional reviews since 2006. Table 2 shows
some examples of IT-SPME coupling to LC that use different extractive capillaries
reported during the last 5 years for several applications.

Chapter 1. Introduction
16
Ta
ble
2.
Sum
ma
ry o
f A
pp
lica
tio
ns
of
IT-S
PM
E d
escr
ibed
in t
he
liter
atu
re b
etw
een
20
13
an
d 2
01
8.
Tech
niq
ue
Ex
trac
tive
cap
illar
y
An
alyt
e
Mat
rix
Re
fere
nce
IT-S
PM
E–C
apLC
–DA
D-M
S
PD
MS 6
5 an
d n
itri
le
Ho
mo
logu
es o
f b
enza
lko
niu
m c
hlo
rid
e
Ind
ust
rial
sa
mp
les
and
w
ash
es w
ater
P
riet
o-B
lan
co, M
.C. e
t al
., 2
01
3a
IT-S
PM
E–C
apLC
–DA
D-M
S P
DM
S 65
ald
ehyd
es
Wat
er
Pri
eto
-Bla
nco
, M.C
. et
al.,
20
13
b
IT-S
PM
E-U
HP
LC-M
S/M
S P
DM
S 95
Atr
azin
e, c
hlo
rfen
vin
ph
os,
ch
lorp
yrip
ho
s,
DEH
P, d
iuro
n, i
sop
rotu
ron
, sim
azin
e,
terb
uth
ylaz
ine
and
tri
flu
ralin
Was
te
wat
er,
infl
ue
nts
, ef
lue
nts
, ri
ver
wat
er
and
co
asta
l wat
er
Mas
ià, A
., e
t al
., 2
01
3
Mag
net
ic IT
-SP
ME-
Cap
LC-D
AD
Fe
3O4
-SiO
2
Ch
lorf
envi
np
ho
s an
d c
hlo
rpyr
ifo
s
Was
te w
ater
M
olin
er-M
artí
nez
, Y.
, et
al.,
20
14
IT-S
PM
E-C
apLC
-DA
D
PD
MS 9
5
Di(
2-e
thyl
hex
yl)
(DEH
P),
d
ieth
yl
(DEP
),
dib
uty
l (D
BP
) an
d m
on
o-e
thyl
hex
yl (
MEH
P)
ph
thal
ates
Co
ast
wat
er
Jorn
et-M
artí
nez
, N
. et
al
., 2
01
4
Mag
net
ic IT
-SP
ME-
Cap
LC-D
AD
Fe
3O4
-SiO
2
Atr
azin
e, t
erb
uty
lazi
ne
and
sim
azin
e
Wat
er
Go
nza
lez-
Fue
nza
lida,
R
.A. e
t al
., 2
01
4
IT-S
PM
E-C
apLC
-DA
D
PD
MS 9
5
DEH
P, D
EP, D
BP
an
d M
EHP
U
rin
e
Jorn
et-M
artí
nez
, N
. et
al
., 2
01
5a
IT-S
PM
E-C
apLC
-DA
D
PD
MS 9
5
Mo
no
chlo
ram
ine
Tap
an
d
swim
min
g p
oo
l w
ater
P
la-T
oló
s,
J.
et
al.,
20
15
IT-S
PM
E-C
apLC
-DA
D
PD
MS 9
5 an
d P
DM
S 65
mo
dif
ied
w
ith
ca
rbo
xyla
ted
si
ngl
e an
d
mu
ltiw
all c
arb
on
nan
otu
bes
(c-
SWC
NTs
an
d c
-MW
CN
Ts)
Tria
zin
es a
nd
deg
rad
atio
n p
rod
uct
s W
ater
M
olin
er-M
artí
nez
, Y.
, et
al.,
20
15
IT-S
PM
E-C
apLC
-DA
D
PD
MS 9
5 an
d P
DM
S 65
mo
dif
ied
w
ith
c-S
WC
NTs
an
d c
-MW
CN
Ts
Tria
zin
es a
nd
PA
HS
Wat
er
Jorn
et-M
artí
nez
, N
. et
al
., 2
01
5b
IT-S
PM
E-LC
-MS/
MS
Car
bo
xen
10
06
PLO
T 8
-Hyd
roxy
-2´-
deo
xygu
ano
sin
e
Uri
ne
K
atao
ka,
H.
et
al.,
20
16
IT-S
PM
E-H
PLC
-UV
P
oly
(eth
er
eth
er
keto
ne)
(P
EEK
) an
d
po
ly(a
cryl
amin
e-et
hyl
en
egly
cold
imet
hac
ryla
te)
mo
no
lith
Pro
tob
erb
erin
e al
kalo
ids
Rat
pla
sma
Lin
g, X
. et
al.,
20
16
IT-S
PM
E-LC
-UV
St
ain
less
st
eel
tu
be
co
ated
w
ith
gra
ph
eme/
po
lyan
ilin
e
Ald
eh
yde
s H
um
an e
xhal
ed b
reat
h
Wan
g, S
. et
al.,
20
15

Chapter 1. Introduction
17
C
on
tin
ua
tio
n T
ab
le 2
. Su
mm
ary
of
Ap
plic
ati
on
s o
f IT
-SP
ME
des
crib
ed in
th
e lit
era
ture
bet
wee
n 2
01
3 a
nd
20
18
. Te
chn
iqu
e
Extr
acti
ve c
apill
ary
A
nal
yte
M
atri
x R
efe
ren
ce
IT-S
PM
E-C
apLC
-MS
PD
MS 6
5
Car
bo
nyl
co
mp
ou
nd
s A
qu
eou
s fr
acti
on
p
arti
cula
te
mat
ter
(PM
2.5)
P
riet
o-B
aln
co,
M.C
. et
al
., 2
01
3b
IT-S
PM
E-LC
-FLD
P
EEK
tu
be
coat
ed w
ith
zeo
litic
im
idaz
ola
te f
ram
ewo
rk
PA
Hs
Wat
er a
nd
so
il Zh
ang,
J. e
t al
., 2
01
5
IT-S
PM
E-LC
-UV
P
EEK
tu
be
coat
ed
wit
h
nan
ost
ruct
ure
d s
ilve
r P
AH
s R
iver
an
d r
ain
wat
er
Sun
, M. e
t al
., 2
01
5
IT-S
PM
E-LC
-DA
D
Po
lyte
traf
luo
roet
hyl
en
e tu
be
coat
ed w
ith
a p
oly
do
pam
ine/
d
iald
eh
yde
star
ch/c
hit
osa
n
Hex
anal
an
d 2
-bu
tan
on
e
Blo
od
W
u, S
. et
al.,
20
16
IT-S
PM
E-C
apLC
-DA
D
PD
MS 6
5
AgN
Ps
Wat
er
Go
nza
lez-
Fue
nza
lida,
R
.A. e
t al
., 2
01
6a
IT-S
PM
E-LC
-DA
D-F
LD
PD
MS 9
5
PA
Hs
Rai
n w
ater
Fe
rnán
dez
-Am
ado
, M
, et
al.,
20
16
Mag
net
ic-I
T-SP
ME-
LC-U
V
Stai
nle
ss
ste
el
tub
e
pac
ked
w
ith
so
diu
m
do
dec
yl
sulf
ate
coat
ed F
e 3O
4 N
Ps
Mo
xifl
oxa
cin
U
rin
e
Bu
, Y. e
t al
20
16
IT-S
PM
E-C
apLC
-DA
D
PD
MS 6
5
Irga
rol-
10
51
an
d d
iuro
n
Wat
er
Pla
-To
lós,
J.
et
al
. 2
01
6a
IT-S
PM
E-N
ano
LC-D
AD
Si
lica
cap
illar
y co
ated
w
ith
Si
O2/
PEG
-sp
her
ical
Fe 3
O4
Dic
lofe
nac
R
iver
wat
er
Go
nza
lez-
Fue
nza
lida,
R
.A. e
t al
., 2
01
6b
IT-S
PM
E-N
ano
LC-D
AD
TE
OS-
MTE
OS-
SiO
2NP
s P
ola
r tr
iazi
nes
an
d
thei
r d
egra
dat
ion
p
rod
uct
s W
aste
wat
er
Serr
a-M
ora
, P
. Et
al.,
2
01
7
IT-S
PM
E-H
PLC
-DA
D
Rt®
-S-
BO
ND
P
hth
alat
es
and
th
eir
deg
rad
atio
n p
rod
uct
s
Atm
osp
he
ric
par
ticu
late
m
atte
r Fe
rnán
dez
-Am
ado
, M
. et
al.,
20
17
IT-S
PM
E-C
apLC
-DA
D
PD
MS 6
5 P
DM
S 80
and
PD
MS 5
M
ero
pen
em
End
otr
ach
eal t
ub
es
Hak
ob
yan
, L. e
t al
.,
20
18
IT-S
PM
E-H
PLC
-DA
D
Bas
alt
fib
er f
un
ctio
nal
ized
wit
h
Au
NP
s P
AH
s W
ater
Fe
ng,
J. e
t al
., 2
01
8
Mag
net
ism
-en
han
ced
m
on
olit
h-b
ase
d IT
-SP
ME-
HP
LC-D
AD
Mo
no
lith
do
pe
d w
ith
mag
net
ic
Fe3O
2-Si
O2
NP
s O
rgan
ic U
V f
ilter
s W
ater
M
ei,
M.
and
Hu
an,
X.
20
17
IT-S
PM
E-C
G-F
ID
MO
F-C
J3
Aro
mat
ic p
osi
tio
nal
iso
mer
s
- Fa
ng,
Z.-
L. e
t al
20
13

Chapter 1. Introduction
18
1.2.3 Figures of merit of the online IT-SPME-LC
By online IT-SPME-LC, high sensitivity and no matrix effects can be achieved
in less than 30 min, in the majority of procedures. Table 3 shows a summary of
the analytical parameters obtained for different applications of IT-SPME-LC. The
environmental impact of an analytical procedure has been traditionally
categorized with qualitative parameters, but the establishment of a quantitative
environmental performance indicator, as the carbon footprint, is mandatory
(Moliner-Martínez, Y. et al., 2015a). Carbon footprint represents the amount of
greenhouse gases emissions produced by an activity, expressed as KgCO2eq.
Carbon footprint can be calculated by the following equation:
KgCO2eq = Σ(electricity consumed, KWh) x emission factor for electricity, KgCO2/
KWh)
Where the electricity consumed can be obtained from the electrical company
or from the technical data of apparatus, and the emission factor converts the
electrical activity data in emission values, depending on the season, time and
supplier. Recently, our group has calculated the carbon footprint to evaluate the
environmental performance of an analytical method (Pla-Tolós, J. et al., 2016).
The environmentally friendliness of IT-SMPE has been demonstrated by carbon
footprint, which depends on injection system (atomatic or manual), extraction
setup (one or two pumps), separation technique (conventional or miniaturized
chromatograph) and detector (optical, electrochemical, mass spectrometry, etc.).
Values from 1.1 to 3.0 KgCO2eq can be obtained for different modalities of on-line
IT-SPME (data calculated using diode array detection, DAD, and a reference
emission factor of 0.247 KgCO2/ KWh) (Moliner-Martínez, Y. et al., 2015b).
However, off-line extraction technique exhibit carbon footprint one order of
magnitude higher due to the use of additional instrumentation (ultrasound,
evaporator, etc.). These results show the potential of online IT-SPME in Green
Analytical Chemistry.

Chapter 1. Introduction
19
Table 3. Summary of analytical parameters (precision, limits of detection (LODs) and recoveries) for different applications of IT-SPME.
Application Separation/Detection
Precision LODs Recoveries
Environmental analysis
HPLC-FLD ˂20 0.005-400 ng L-1*
72-110
HPLC-UV ˂10 0.001-200 µg L-1
70-120 LC-MS ˂10 2-5 µg L
-1 88-105
LC-MS/MS ˂7 0.5-5 ng L-1
82-112 CapLC-DAD ˂19 8-5000 ng L
-1 81-120
Clinical analysis HPLC-FLD ˂13 8-15 µg L-1
- HPLC-UV ˂7 0.01-0.1 µg L
-1 70-108
LC-MS ˂11 9-1000 ng L-1
75-113 LC-MS/MS ˂8 3 ng L
-1 92
CapLC-DAD ˂20 0.05-1.5 µg L-1
50-90 Food analysis HPLC-FLD ˂8 0.3-5 ng L
-1 -
HPLC-UV ˂7 0.02-21 µg L-1
80-110 HPLC-MS ˂11 0.01-20 µg L
-1 80-88
Industrial analysis CapLC-DAD ˂18 6-30 µg L-1
117 NanoLC-DAD ˂4 1 µg L
-1 50
*up to 2 µg L-1
for the determination of PAHS in soil and dust (Zhang, W. et al., 2014).
1.3 IN-SITU DEVICES
Another trend in current Analytical Chemistry is the development of new
devices for in-situ analysis, which means at the same place where the target
compound is present. The progress in technology, (nano)materials and society
have attracted attention for methods that allow measurements in real time and
on site. These methods entail potential benefits including the minimization of
sample treatment and the subsequent reduction of time and costs (Nightingale,
A.M. et al., 2015; Pandey, S.K. et al., 2012). Additionally, the risk of contamination
or degradation of sample during its transport to the laboratory can be avoided.
Well known in-situ sensors are today marked, for example glucometer, pregnancy
test, alcohol breathalyzer or test drug kit. Besides, it is important to remark that
not trained personnel are usually required due to the easy-to-use of these
sensors. Thanks to the great possibilities offered by in-situ sensors, they are
applied to wide range of fields such as environmental, health, industrial, medical,
forensic and security. Some examples of in-situ sensors are given in Table 4.
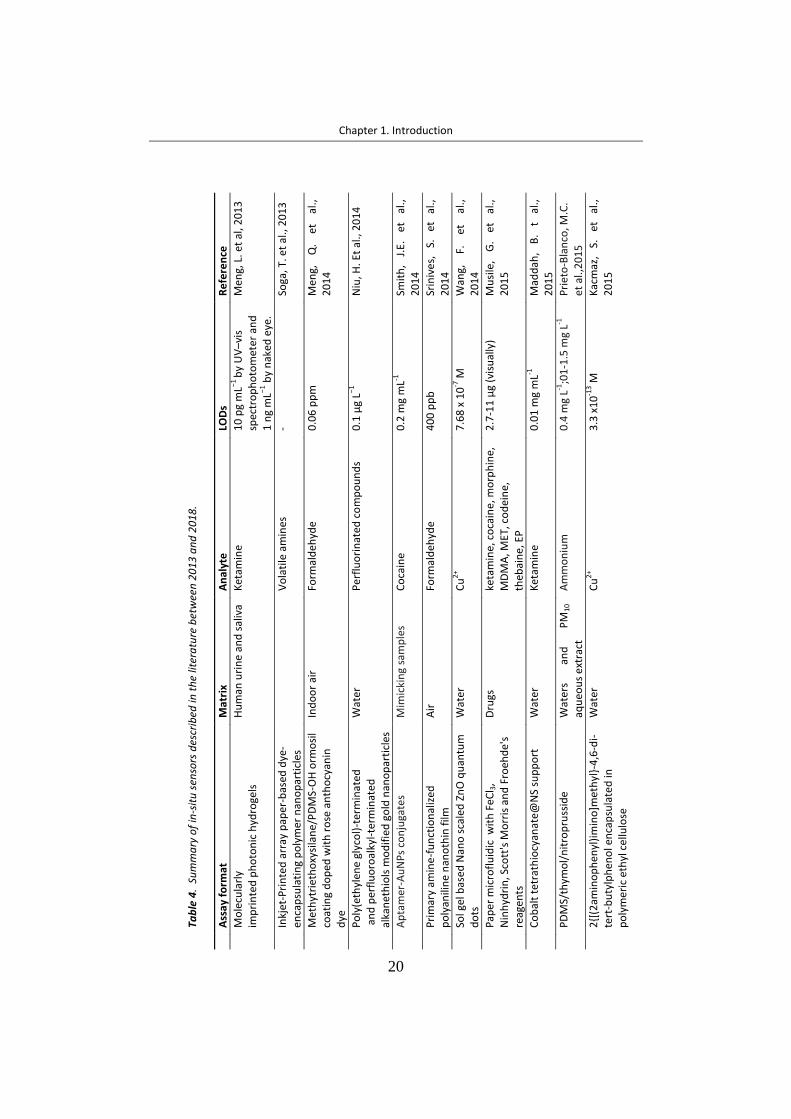
Chapter 1. Introduction
20
Tab
le 4
. Su
mm
ary
of
in-s
itu
sen
sors
des
crib
ed in
th
e lit
era
ture
bet
wee
n 2
01
3 a
nd
20
18
.
A
ssa
y fo
rmat
M
atri
x A
nal
yte
LO
Ds
Re
fere
nce
M
ole
cula
rly
imp
rin
ted
ph
oto
nic
hyd
roge
ls
Hu
man
uri
ne
and
sal
iva
K
etam
ine
1
0 p
g m
L−1 b
y U
V–
vis
spec
tro
ph
oto
met
er a
nd
1
ng
mL−1
by
nak
ed e
ye.
Men
g, L
. et
al, 2
01
3
In
kjet
-Pri
nte
d a
rray
pap
er-b
ased
dye
-en
cap
sula
tin
g p
oly
mer
nan
op
arti
cles
Vo
lati
le a
min
es
- So
ga, T
. et
al.,
20
13
M
eth
ytri
eth
oxy
sila
ne/
PD
MS-
OH
orm
osi
l co
atin
g d
op
ed w
ith
ro
se a
nth
ocy
anin
d
ye
Ind
oo
r ai
r Fo
rmal
deh
yde
0
.06
pp
m
Men
g,
Q.
et
al.,
2
01
4
P
oly
(eth
ylen
e gl
yco
l)-t
erm
inat
ed
an
d p
erfl
uo
roal
kyl-
term
inat
ed
al
kan
eth
iols
mo
dif
ied
go
ld n
ano
par
ticl
es
Wat
er
Per
flu
ori
nat
ed c
om
po
un
ds
0.1
μg
L−1
Niu
, H. E
t al
., 2
01
4
A
pta
mer
-Au
NP
s co
nju
gate
s M
imic
kin
g sa
mp
les
Co
cain
e
0.2
mg
mL-1
Sm
ith
, J.
E.
et
al.,
2
01
4
P
rim
ary
amin
e-f
un
ctio
nal
ized
p
oly
anili
ne
nan
oth
in f
ilm
Air
Fo
rmal
deh
yde
4
00
pp
b
Srin
ive
s,
S.
et
al.,
2
01
4
So
l gel
bas
ed N
ano
sca
led
Zn
O q
uan
tum
d
ots
W
ater
C
u2+
7
.68
x 1
0-7
M
Wan
g,
F.
et
al.,
2
01
4
P
aper
mic
rofl
uid
ic w
ith
Fe
Cl 3
, N
inh
ydri
n, S
cott
's M
orr
is a
nd
Fro
ehd
e's
reag
ents
Dru
gs
keta
min
e, c
oca
ine,
mo
rph
ine,
M
DM
A, M
ET, c
od
ein
e,
theb
ain
e, E
P
2.7
-11
µg
(vis
ual
ly)
Mu
sile
, G
. et
al
.,
20
15
C
ob
alt
tetr
ath
iocy
anat
e@N
S su
pp
ort
W
ater
K
etam
ine
0
.01
mg
mL-1
M
add
ah,
B.
t al
., 2
01
5
P
DM
S/th
ymo
l/n
itro
pru
ssid
e
Wat
ers
and
P
M10
aq
ueo
us
extr
act
Am
mo
niu
m
0.4
mg
L-1;0
1-1
.5 m
g L-1
P
riet
o-B
lan
co, M
.C.
et a
l.,2
01
5
2
{[(2
amin
op
hen
yl)i
min
o]m
eth
yl}-
4,6
-di-
tert
-bu
tylp
hen
ol e
nca
psu
late
d in
p
oly
mer
ic e
thyl
ce
llulo
se
Wat
er
Cu
2+
3.3
x1
0-1
3 M
Kac
maz
, S.
et
al
.,
20
15

Chapter 1. Introduction
21
Co
nti
nu
ati
on
Ta
ble
4.
Sum
ma
ry o
f in
-sit
u s
enso
rs d
escr
ibed
in t
he
liter
atu
re b
etw
een
201
3 a
nd
20
18
.
Ass
ay
form
at
Mat
rix
An
alyt
e
LOD
s R
efe
ren
ce
N
,N-d
imet
hyl
-ph
enyl
ened
iam
ine/
FeC
l 3
on
pap
er
Wat
er a
nd
at
mo
sph
eres
H
ydro
gen
su
lph
ide
0.5
mg
L-1
Cam
pin
s-Fa
lcó
, P.
et a
l., 2
01
6
P
lati
nu
m N
Ps
and
3,3
,5,5
-te
tram
eth
ylb
en
cid
ine
(TM
B)
pap
er-
bas
ed
Wat
er a
nd
fis
h
Hg2+
0
.01
µM
C
hen
, W. e
t al
.,
20
16
P
DM
S/TE
OS/
NQ
S o
r ET
HT 4
00
1
Atm
osp
her
e an
d f
ish
d
egra
dat
ion
A
liph
atic
am
ine
and
am
mo
nia
1
mg
m-3
; 3-3
0 m
g m
-3
Jorn
et-M
artí
nez
, N
. et
al.,
20
16
a
Ze
in-a
lkal
ine
ph
osp
hat
ase
W
ater
, sa
live
and
p
esti
cid
es
Ph
osp
hat
e, a
lkal
ine
ph
osp
hat
ase,
ch
lorp
yrif
os
0.2
mg
L-1; 0
.5-5
mg
L-1
Jorn
et-M
artí
nez
, N
. et
al.,
20
16
b
P
DM
S/TM
B/e
nzy
me
s C
om
mer
cial
pro
du
cts
Hyd
roge
n p
ero
xid
e 0
.04
m
g L-1
;0.1
42
-2
.44
8 m
g L-1
P
la-T
olò
s, J
. et
al.,
2
01
6b
P
atte
rned
mic
rofl
uid
ic p
aper
-bas
ed o
f tr
ich
loro
sila
ne
H
um
an b
loo
d
Glu
cose
1
3 m
g d
L-1
Lam
, T. E
t al
.,
20
17
Sm
artp
ho
ne
-bas
ed p
ort
able
sys
tem
—B
ion
ic e
-Eye
M
uss
el e
xtra
cts
Mar
ine
toxi
ns
0.0
07
5-0
.00
96
pp
b
Su, K
. et
al.,
20
17
Si
lver
nit
rate
pap
er-b
ased
W
ater
A
s 1
.1 n
g m
L-1
Pen
a-P
erei
ra, F
.,
et a
l., 2
01
8
O
pti
cal-
fib
er-b
ased
ap
tase
nso
r co
ated
w
ith
ap
tam
er-m
od
ifie
d g
old
nan
oro
ds
Gra
pe
juic
e
Myc
oto
xin
, och
rato
xin
A
12
.0 p
M
Lee,
B. e
t al
.,
20
18
G
rap
hen
e q
uan
tum
do
t-lu
min
ol-
AgN
P
nan
oco
mp
osi
tes
wit
h lu
min
ol,
H
um
an s
eru
m
Glu
cose
8
µM
Sa
leh
nia
, F.,
et
al.,
2
01
8
G
rap
hen
e sh
eet-
nan
ori
bb
on
/nic
kel
nan
op
arti
cles
hyb
rid
mat
eria
l mo
dif
ied
el
ectr
od
e
Hu
man
ser
um
G
luco
se
2.5
nM
Jo
thi,
L. e
t al
.,
20
18
P
ort
able
ele
ctro
chem
ilum
ine
scen
ce
bio
sen
sor
wit
h t
he
scre
en-p
rin
ted
el
ectr
od
e
Bio
logi
cal
Ab
rin
0
.1 n
g m
L-1
Liu
, S. e
t al
., 2
01
8

Chapter 1. Introduction
22
Figure 5 shows the different modalities of analytical processes based on the
way in which they are carried out. In off-line process, the sample is transported to
the laboratory for its analysis, whereas in-situ analysis can be carried out by
introduction the device at sampling place (in-line) or can be carried out in fixed
station close to sampling place (on-line). In addition, in-situ devices can be
classified as passive or active in function of the sampling type. Active devices
require an energy source for sampling (e.g. pump). Whereas, passive devices not
required energy consumption because sampling is carried out by diffusion.
In this Thesis we have focused on the development of passive sensors for on-
line analysis.
Figure 5. Schematic representation of in-line, on-line and off-line analytical methods and
their relationship with in-situ analysis.
Table 5 outlines the current methods for in-situ analysis, which can be
divided in monitoring stations, portable instruments, electromechanical devices
and optical devices (Jornet-Martínez, N. et al., 2017). The availability of resource
and skilled personnel, and also the monitoring purposes are some of factors to
take into account when choosing one of these methods. In some cases, complex
systems that provide high analytical performance can be unsuitable due to their
requirement of qualified personnel and expensive equipment.
Laboratory
OFF-LINE
Device
Device IN-LINE
ON-LINE
IN-SITU
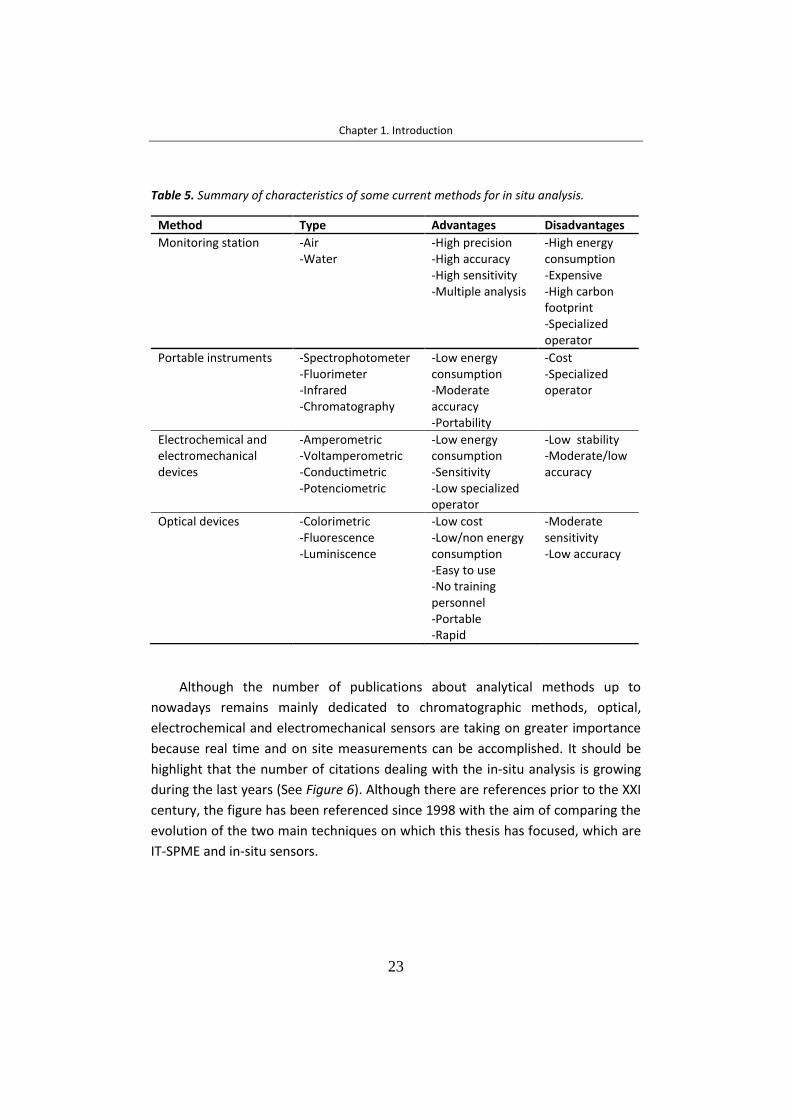
Chapter 1. Introduction
23
Table 5. Summary of characteristics of some current methods for in situ analysis.
Method Type Advantages Disadvantages
Monitoring station -Air -Water
-High precision -High accuracy -High sensitivity -Multiple analysis
-High energy consumption -Expensive -High carbon footprint -Specialized operator
Portable instruments -Spectrophotometer -Fluorimeter -Infrared -Chromatography
-Low energy consumption -Moderate accuracy -Portability
-Cost -Specialized operator
Electrochemical and electromechanical devices
-Amperometric -Voltamperometric -Conductimetric -Potenciometric
-Low energy consumption -Sensitivity -Low specialized operator
-Low stability -Moderate/low accuracy
Optical devices -Colorimetric -Fluorescence -Luminiscence
-Low cost -Low/non energy consumption -Easy to use -No training personnel -Portable -Rapid
-Moderate sensitivity -Low accuracy
Although the number of publications about analytical methods up to
nowadays remains mainly dedicated to chromatographic methods, optical,
electrochemical and electromechanical sensors are taking on greater importance
because real time and on site measurements can be accomplished. It should be
highlight that the number of citations dealing with the in-situ analysis is growing
during the last years (See Figure 6). Although there are references prior to the XXI
century, the figure has been referenced since 1998 with the aim of comparing the
evolution of the two main techniques on which this thesis has focused, which are
IT-SPME and in-situ sensors.

Chapter 1. Introduction
24
Figure 6. Number of citations on Web of Science for matching the following search term
“in-situ analysis” AND “sensors” in the 1998-2017 period.
From all the methods shown in Table 5, this thesis pays special attention to
optical and electromechanical sensors due to their interesting characteristics such
as portability and low-cost.
1.3.1 Optical sensors
Among the different optical sensors, colorimetric devices are highlighted
because their color change in presence of the analyte can be easily detected by
naked eyes. These sensors are based on a color change through a chemical
reaction between a chromophore and the target compound. The resulting
intensity colors are related to the concentration of analyte. Thereby, a qualitative
determination can be carried out by visual inspection, but a quantitative
determination can also be done by absorbance or diffuse reflectance (DR)
measurements (Jornet-Martínez, N. et al., 2016a; Prieto-Blanco, M.C. et al., 2015).
Following current trends in technology, image analysis by mobile phones is an
emerging alternative for quantification purposes (Capitán-Vallvey, L.F. et al.,
2017; Ogirala, T. et al., 2017; Roda, A. et al., 2016; Su, K. et al., 2015, 2017;
0
5000
10000
15000
20000
25000
19
98
19
99
20
00
20
01
20
02
20
03
20
04
20
05
20
06
20
07
20
08
20
09
20
10
20
11
20
12
20
13
20
14
20
15
20
16
20
17
Nu
mb
er
of
cita
tio
ns
Year
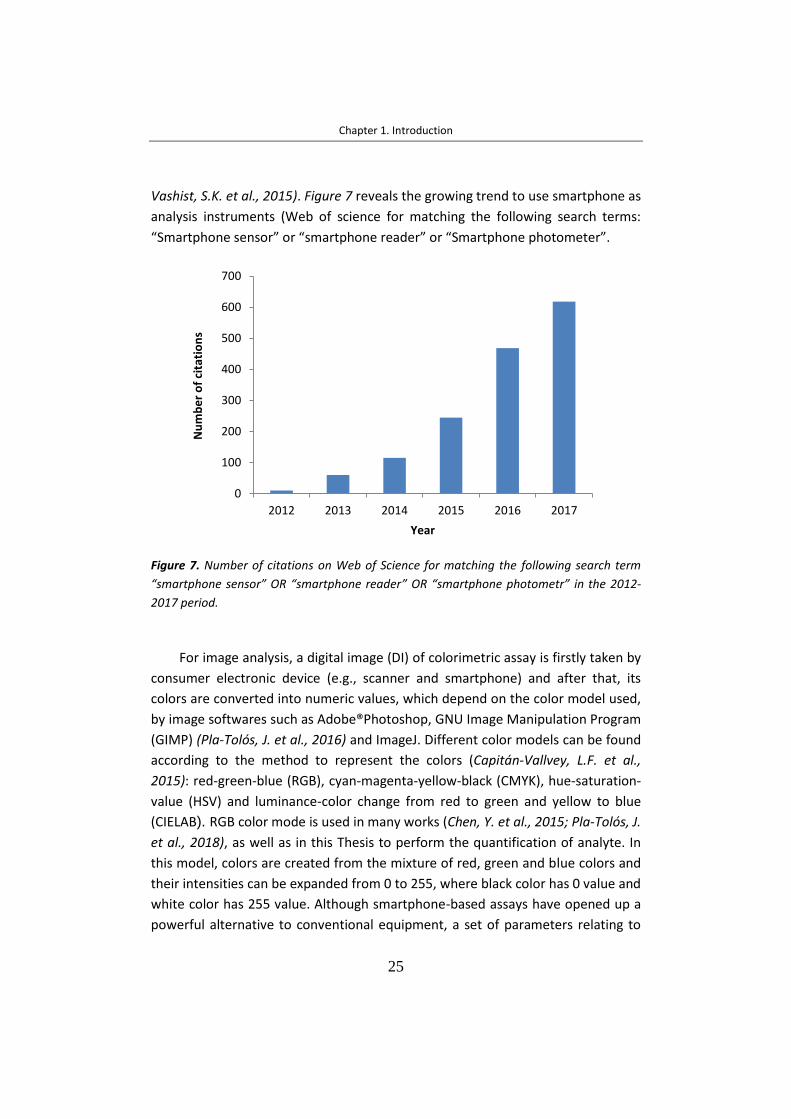
Chapter 1. Introduction
25
Vashist, S.K. et al., 2015). Figure 7 reveals the growing trend to use smartphone as
analysis instruments (Web of science for matching the following search terms:
“Smartphone sensor” or “smartphone reader” or “Smartphone photometer”.
Figure 7. Number of citations on Web of Science for matching the following search term
“smartphone sensor” OR “smartphone reader” OR “smartphone photometr” in the 2012-
2017 period.
For image analysis, a digital image (DI) of colorimetric assay is firstly taken by
consumer electronic device (e.g., scanner and smartphone) and after that, its
colors are converted into numeric values, which depend on the color model used,
by image softwares such as Adobe®Photoshop, GNU Image Manipulation Program
(GIMP) (Pla-Tolós, J. et al., 2016) and ImageJ. Different color models can be found
according to the method to represent the colors (Capitán-Vallvey, L.F. et al.,
2015): red-green-blue (RGB), cyan-magenta-yellow-black (CMYK), hue-saturation-
value (HSV) and luminance-color change from red to green and yellow to blue
(CIELAB). RGB color mode is used in many works (Chen, Y. et al., 2015; Pla-Tolós, J.
et al., 2018), as well as in this Thesis to perform the quantification of analyte. In
this model, colors are created from the mixture of red, green and blue colors and
their intensities can be expanded from 0 to 255, where black color has 0 value and
white color has 255 value. Although smartphone-based assays have opened up a
powerful alternative to conventional equipment, a set of parameters relating to
0
100
200
300
400
500
600
700
2012 2013 2014 2015 2016 2017
Nu
mb
er
of
cita
tio
ns
Year

Chapter 1. Introduction
26
image should be taken into account. One of the most influential parameter on DI
is the lighting conditions under which the image is captured (Chaplan, C.A. et al.,
2014). In order to correct intensity variations of light, several options have been
proposed in the literature such as integrating the smartphone with a custom-
made dark box (Hosu, O. et al., 2017; Su, K. et al., 2017; Vashist, S.K. et al., 2014)
taking reference areas to normalize (Jia, M.Y. et al., 2015), incorporating light
source with fixed camera parameters (Oncescu, V. et al., 2013) and using scanner
to take pictures (Alkasir, R.S.J. et al., 2012; Christodouleas, D.C., et al., 2015;
Gabrielson, J. et al., 2002).
Several colorimetric devices can be found in the literature. Devices for
delivery reagents are based on the immobilization of derivatizing reagents in solid
supports, mainly polymers and paper. In this kind of device, the reagent diffuses
from the support to the solution, where is the analyte, and so the derivatization
reaction occurs. An example of this is reported by Prieto-Blanco et al., 2015,
where thymol and nitroprusside are embedded into PDMS for determining
ammonium in waters. Also, Pla-Tolós, J. et al., 2016 embedded 3,3,5,5-
tetramethylbencidine (TMB) and horseradish peroxidase enzyme (HRP) into
PDMS-tetraethylortosilicate (TEOS)-silicon dioxide NPs (SiO2NPs) for determining
hydrogen peroxide in commercial products. Conversely in solid sensors, the
chromophore reagent is immovilized into solid support and the analyte diffuse
from the sample matrix to the sensor in order to react with the reagent. Our
research group has developed a paper-based sensor for hydrogen sulphide
determination both water and air (Pla-Tolós, J. et al., 2016c). Additionally, other
optical sensor based on sodium 1,2-naphtoquinone-4-sulfonate (NQS) embedded
in PDMS matrix have been design to several applications such as discrimination of
volatile amines (Jornet-Martínez, N. et al., 2016), determine casein in effluents
from dairy industries (Section 4.1.2.1 of this Thesis) and analysis of a biocide in
industrial formulations (Section 4.1.2.2 of this Thesis). NQS/PDMS-based sensor
has also used to develop a test kit for amphetamine-like drugs (Section 4.1.2.3 of
this Thesis). Test kit generally contains a testing solution with reagents and/or
buffer and its color change when the sample is added. In this context, colorimetric
kits for chlorine and pH estimation in swimming pools, as well as kits for forensic
applications are frequently used (Commercial Pool Test Kits). Along this line, test
strips have also given rise remarkable appilcations in the biomedical, food and
environmental fields (Ngom, B. et al., 2010). The most known test strip is the
pregnancy test (Leuvering, J.H.W. et al., 1980). Test strips involve chromophores

Chapter 1. Introduction
27
or biological components immobilized on a paper strip. The advantages of these
strips are the speed, specificity and low-cost. Nevertheless, the results obtained
by test strips are qualitative, and so quantification cannot be carried out (Chin,
C.D. et al., 2007). On the other hand, there are microfluidic platforms in which
sample flows by capillary along a channel on paper, where reagents are pre-
deposited, and color change when sample reach the reagent and interact with it.
Microfluidic platforms allow the opportunity to analyze multiple compounds on
the same platform by creating different reaction zones (López‐Ruiz, N. et al.,
2014). For air analysis, colorimetric tubes are active monitoring devices. These
tubes contain an impregnated material with a chromophore through which the air
passes manually or by a battery-operated pump, producing a color change in
presence of the analyte (Coffey, C.C. et al., 2010). Besides the requirement of a
pump, the unespecificity is the main limitation of colorimetric tubes. Other optical
sensors are the colorimetric arrays. They are based on chemical dyes adsorbed on
a support, providing a characteristic pattern of response when they are exposed
to a mixture of analytes. The sensing mechanism for volatile compound relies on
optical or optoelectronic noses, this means molecular recognition of patterns of
response rather than specific recognition of enzymes lock-and-key. In the
literature, we can find application examples of colorimetric arrays for the analysis
of bacteria (Lim, S.H. et al., 2014), explosives (Kangas, M.J. et al., 2016), soft
drinks (Zhang, C. et al., 2007) and volatile organic compounds (VOCs) (Janzen,
M.C. et al., 2006).
More recently, the use of metallic NPs (MNPs) as a new alterative of reagents
to carry out colorimetric tests has caused the development of plasmonic sensors.
MNPs such as silver nanoparticles (AgNPs) and gold nanoparticles (AuNPs) have
color in the visible region due to localized surface plasmon resonance, whereas
their aggregates analyte-induced exhibit different color (Stewart, M.E. et al.,
2008). Hence, the gradual optical changes can be measured by absorbance or DR
for quantification purposes. Due to advantages like high-sensitivity and selectivity
offered by AuNPs and AgNPs as plasmonic sensors, they are widely used for food
(Caelen, I. et al, 2004), medicine (Masson, J.F., 2017) and environmental analysis
(Mauriz, E. et al., 2006). The characteristic properties of MNPs are related to their
synthesis and functionalization. In most cases, functionalization of NPs is
necessary (Chai, F. et al., 2010; Chen, Y.-C. et al., 2013), although the use of
pseudo-naked AuNPs have been managed to increase sensitivity (Jornet-Martínez,
N. et al., 2014).

Chapter 1. Introduction
28
In some colorimetric assays, the color change can be carried out in solution
(Hatamie, A. et al., 2014; Jose, D.A. et al., 2007), whereas in other assays, the
color change takes place in/on solid support where the colorimetric reagents are
immobilized (Chen, Y. et al., 2015; Endo, T. et al, 2007; Jornet-Martínez, N. et al.,
2016a; Peters, K.L. et al., 2015; Pla-Tolós, J. et al. 2016b, 2016c, 2018). Compared
to the solution assays, solid devices overcomer undeniable limitations concerning
stability of chromophores and management. Polymers, paper, silica and glass are
some of materials proposed as solid support for designing in-situ sensors. Table 6
exposes the properties of some substrates reviewed in the literature.
Table 6. Features of differente type of solid supports.
Features Silica Glass PDMS Paper
Surface/volume ratio Low Low Low High Flexibility No No Yes Yes Fluid flow Forced Forced Diffusion Capillarity Humidity effect No No No Yes Biocompatibility Yes Yes Yes Yes Biodegradability No No Yes Yes Easy availability No No No Yes Easy handling No No Medium Yes Homogeneity Yes Yes Yes No Cost High Medium Low Low
The paper has raised considerable interest for developing in-situ devices
owing to its low-cost, versatility, abundance, simplicity as well as chemical
compatibility. Moreover, the huge variety of papers in the market allows the
selection of the optimal paper for each kind of assay (Liana, D.D. et al., 2012).
Paper-based sensors have become a sensing platform for many application areas
including environmental monitoring (Chang, J. et al., 2016; Sicard, C. et al., 2015),
quality control (Saraz, J.A.O. et al., 2015) and clinical diagnosis (Zhao, W. et al.,
2008). On the other hand, PDMS is the most used polymer as support for
embedding several species such as chromogenic reagents, quantum dots and NPs
(Campins-Falcó, P. et al., 2016; Prieto-Blanco, M.C. et al., 2015). Another polymer
used is polyvinylchloride (PVC), for example, a colorimetric sensor based on
dicyclohexylamine entrapped in PVC matrix plasticized with dioctylphtalate is

Chapter 1. Introduction
29
described for trinitrotoluene sensing (Ercag, E. et al., 2009). Glass is also used as
substrate, a glass dipstick device with the reagent aza-boro-dipiromethane is
reported to detect nitrites ions in natural water resources (Adarsh, N. et al.,
2013).
From all these materials, paper and PDMS have been selected in this Thesis as
supporting materials for developing in-situ sensors due to their advantages that
will be assessed below.
1.3.2 Electromechanical sensors
According to the trends in exploring sensors for in-situ analysis,
electromechanical sensors, and microelectromechanical systems (MEMS) in
particular, have received intensive attention. Since their development in 1970,
MEMS have expanded substantially. MEMS are considered successful devices
widespread used in such diverse fields as automotive, aerospace, consumer
electronics, point-of-care diagnostics, communication and industrial and
environmental control (Boisen, A. et al., 2011; Guo, Y. et al., 2017; Khalid, N. et al.,
2017; Sheikhaleh, A. et al., 2017). Microcantilever-type is the most ubiquitous
structure in the field of MEMS (Bouchaala, A. et al., 2016), mainly for gas
detection (Boudjiet, M.-T. et al., 2015) due to their advantages such as high
sensitivity, integration into a circuit, miniaturization, in-situ detection, low-price
and large scale array construction (Chaudhary, M. and Gupta, A., 2009; Li, X. and
Lee, D.W., 2015).
The structure of a microcantilever is based on a dividing board, which is
anchored at one end and the rest is suspended. As their name suggests, the
dimensions of these sensors can be from micrometers up to a few milimeters. At
such a small scale, small physical or mechanical changes due to analyte interaction
achieve high sensitivity. To perform it as a sensor, the top surface of cantilever is
coated with a sensing layer of a material, commonly known as functionalized
layer, which has the affinity towards the analyte. The interaction between the
target molecules and the functionalized layer can be physical or chemical.
Depending on the material of the sensing layer, cantilevers can be used in several
sensing applications. Figure 8 shows the structure of the sensor aforedescribed.
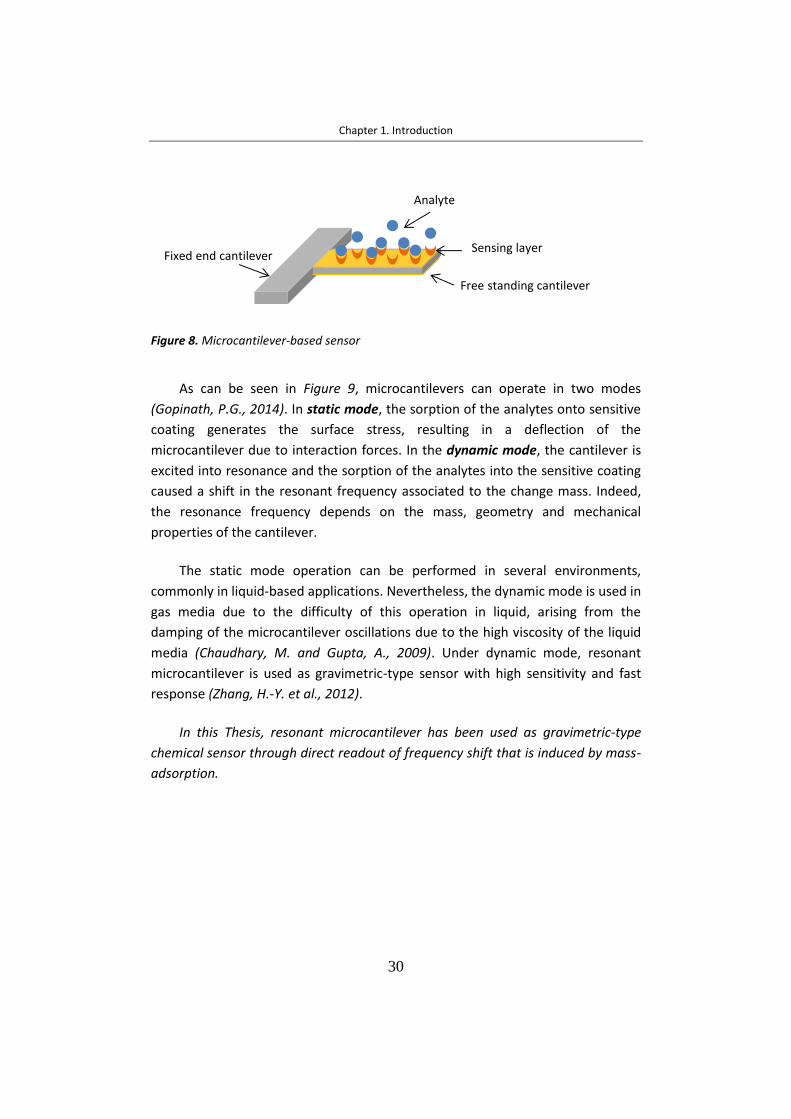
Chapter 1. Introduction
30
Figure 8. Microcantilever-based sensor
As can be seen in Figure 9, microcantilevers can operate in two modes
(Gopinath, P.G., 2014). In static mode, the sorption of the analytes onto sensitive
coating generates the surface stress, resulting in a deflection of the
microcantilever due to interaction forces. In the dynamic mode, the cantilever is
excited into resonance and the sorption of the analytes into the sensitive coating
caused a shift in the resonant frequency associated to the change mass. Indeed,
the resonance frequency depends on the mass, geometry and mechanical
properties of the cantilever.
The static mode operation can be performed in several environments,
commonly in liquid-based applications. Nevertheless, the dynamic mode is used in
gas media due to the difficulty of this operation in liquid, arising from the
damping of the microcantilever oscillations due to the high viscosity of the liquid
media (Chaudhary, M. and Gupta, A., 2009). Under dynamic mode, resonant
microcantilever is used as gravimetric-type sensor with high sensitivity and fast
response (Zhang, H.-Y. et al., 2012).
In this Thesis, resonant microcantilever has been used as gravimetric-type
chemical sensor through direct readout of frequency shift that is induced by mass-
adsorption.
Fixed end cantilever
Analyte
Sensing layer
Free standing cantilever

Chapter 1. Introduction
31
Figure 9. Principle of micro-cantilever-based sensors for chemical detection: static and dynamic mode.
There are four resonant modes for a parallelepipedal microcantilever.
Analytical expressions of each mode in terms of the simple harmonic oscillator
model are illustrated in Table 7. For each type of vibration, there are also different
modes of vibration that occur for different frequencies.
Massmodificationc
Stress/strainmodification
Dyn
amic
mo
de
Modification of resonant frequency Modification of deflection
Stat
icm
od
e
Interactionanalyte/sensing coating

Chapter 1. Introduction
32
Table 7. Summary of cantilever resonant modes in terms of the simple harmonic oscillator
model, where L is the length, t is the thickness, E is the Young’s modulus, w is the width,
is the eigenvalue (n is a positive integer) and m is the cantilever mass.
Mode Resonant Frequency
Spring Constant ( ) Mode scheme
Transverse
√
Torsional
√
Lateral
√
Longitudinal
√
where i = Transverse (Tr), Torsional (To), Lateral (La), or Longitudinal (Lo) modes
A readout system for monitoring the bending or changes in resonance
frequency induced on the cantilever is required. Based on the sensing principle,
electromechanical sensors can be classified into the following main types:
capacitive, optical, piezoresistive and piezoelectric (Chaudhary, M. and Gupta, A.,
2009). Among these sensors, piezoelectric method is better suited for the
dynamic mode presenting advantageous features such as rapid response, high
resolution, integration of actuation and detection in miniaturized scale and low
cost (Clément, P. et al., 2016).
One part of this Thesis has been focused on the development of resonant
piezoelectric microcantilevers for gas detection.
Piezoelectric microcantilever consists of a piezoelectric layer between gold
electrode layers inducing transient charge due to cantilever movement.
Piezoelectric materials can be natural and man-made such as ceramics, polymers
and composites. Ceramics-based are physically strong, chemically inert, and
relatively inexpensive to manufacture. Within ceramics, formulations of lead

Chapter 1. Introduction
33
zirconate titanate, known as PZT (PbZrxTi1-xO3), are the most widely used material
for piezoelectric sensors (Debéda, H. and Lucat, C., 2014; Debéda, H., et al., 2015)
due to their benefit properties of high sensitivity and operating temperatures, as
well as satisfactory electromechanical coupling and piezoelectric constants. These
materials exhibit the piezoelectric properties after poling it because the aligment
of domains lead to a remanent polarization (Figure 10a). Indeed, there are two
piezoelectric effects. Direct piezoelectric effect consists of an electric field
generation when mechanical stress is applied (Figure 10b and c), whereas
converse piezoelectric effect happens when the material is subjected to an
electrical field which causes a mechanical strain (Figure 10d and e). In the case of
resonant piezoelectric microcantilevers, they are driven via converse effect by
applying electric field to achieve the resonance but the sensing is performed by
frequency changes due to analyte interaction through the direct effect.
Figure 10. Summary of piezoelectric effect a) after polarization, b) output voltage of same
polarity as material due to a compressive stress, c) output voltage of opposite polarity as
material due to a tensile stress, d) applied voltage of same polarity as material produce a
contraction of material and e) applied voltage of same polarity as material produce a
expansion of material.
Previous works have shown that screen-printed cantilevers based on PZT are
an alternative technology to the traditional silicon micromachining for gas sensors
(Débeda, H. et al., 2013). Among different technologies, screen-printing is one of
the most cheap, fast, flexible and simple technology that offers good resolution
and repeatability. It is based on additional process, overcoming lot of steps
required in the conventional process. The print cycle is schematized in Figure 11.
+
-
+
-+
- +
-
+
-
+
--
+
+
-
-
+
a) b) c) d) e)
CONVERSE PIEZOELECTRIC EFFECTDIRECT PIEZOELECTRIC EFFECT
Po
ilin
gvo
ltag
e

Chapter 1. Introduction
34
All these features show that screen-printed piezoelectric microcantilevers are
good candidates for gas sensing applications.
Figure 11. Print cycle of the screen-printing procedure. The screen is located just above the
substrate (1). Then, the mesh of the screen is brought into line contact with the squeegee
and scanned across the screen (2). The mesh should peel away from the surface
immediately behind the squeegee, leaving all the ink that was in the mesh deposited onto
the printing surface (3).
The selection of the material for the sensitive layer is very important in the
gas sensor development. This material should be sensitive, selective, stable and
short time of response, allowing the reversible sorption/desorption of target
componds. Table 8 summarizes several works of resonant sensors coated with
different materials to detect gases. Advanced sensing materials include polymers
(Betts, T.A. et al., 2000; Débeda, H. et al., 2013), nanorods (Kilinc, N. et al., 2014),
CNTs (Clément, P. et al., 2016) and MOFs (Xu, T. et al., 2016). Compared to the
aforementioned materials, mesoporous materials feature higuer specific surface
area and porosity (up to 1500 m2 g-1) (Wan, Y. and Zhao, D. Y., 2007). In this
Screen frame
Substrate
SqueegeeInk
Screen mesh
Nest
Emulsion
1
2
3
Printing

Chapter 1. Introduction
35
context, mesoporous silicas are good candidates to provide more sensing sites for
gas adsorption (Bao, Y.Y. et al., 2018; Stassi, S. et al., 2015; Xu, P.C. et al., 2014).
Specifically in this Thesis, a resonant PZT microcantilever coated with mesoporous
silica as sensing layer has been tested for gas detection.
Table 8. Summary of resonant microcantilevers coated with different sensitive layers reported.
Sensing layer Analyte LOD References
polyethyleneoxide, polyethylenevinylacetate, polyvinylalcohol
Hexane, Octane, Toluene, Benzene, Acetone, Ethanol
- Dong, Y. et al., 2010
Polyetherurethane Toluene 80 ppm Debéda, H. et al., 2013
ZnO nanotubes ZnO nanorods
Diethylamine 10 ppm Kilinc, N. et al., 2014
Zeolite 2-nitrotoluene 0.1 ppm García-Romeo, D. et al., 2014
MOF (HKUST-1) Xylene 0.4 ppm Xu, T. et al., 2016
Functionalized-CNTs Benzene 1 ppm Clément, P. et al., 2016
Functionalized mesoporous silica
Aniline and acetic acid ≈ppm Bao, Y.Y. et al., 2018
1.4 (NANO)MATERIALS AND APPLICATIONS
(Nano)materials and their applications are an important part in several
research fields and in particular in Analytical Chemistry. Indeed, the Analytical
nanotechnology is considered a breakpoint in the Analytical Chemistry field.
Special attention has been paid to the study of (nano)materials for improving or
developing techniques to give rise numerous analytical applications. Nowadays,
there are a wide variety of (nano)materials that can be used to improve the
performance of analytical process. The materials studied in the present Thesis
have been organized in three groups depending on the building framework: Si-
based, C-based and metallic-based materials. Specifically, PDMS, mesoporous
silica and C18 as Si-based materials, CNTs as C-based materials and AgNPs and
MOF as metallic materials. The selection of these materials is due to their notable
use in Analytical Chemistry, which are the 66% of all the materials used (data from

Chapter 1. Introduction
36
Web of Science). Within these classifications, some materials can be also
organized as function of the scale of size such as the nanomaterials. In our case,
AgNPs, CNTs and mesoporous silica have specific properties due to their
nanometric size and so they can also be classified as nanomaterials.
1.4.1 Si-based materials
1.4.1.1 PDMS
PDMS is an organosilicon compound based on units of Si(CH3)2O (See Figure
12). This polymer is one of the most used in several fields due to its optical clarity,
chemical inertness, biocompatibility, non-bioaccumulable, non-toxic, flexibility,
thermal stability, low cost and easy of processing (Dittrich, P. S. and Manz, A.,
2006; Lee, J.N. et al., 2003; Löttersy, J.C. et al., 1997; Nazari, A.M. et al., 2016;
Stankova, N.E. et al., 2015).
Figure 12. Chemical structure of PDMS.
This thesis is mainly focused in two different applications of PDMS: (a) as
extractive phase for in-valve IT-SPME coupled on-line to different systems, mainly
miniaturized liquid chromatography and (b) as polymeric matrix to develop in-situ
sensing devices.

Chapter 1. Introduction
37
a) PDMS as extractive phase
PDMS is the most commonly used polymer as extractive phase for GC
commercial capillary columns. It is crosslinked and chemically bonded as coating
on the inner surface of capillary. In the market, there are GC capillary columns
with several percentages of PDMS, usually from 95 to 50%. PDMS-based
capillaries can be applied in IT-SPME thanks to inherent hydrophobicity (Bodas, D.
and Khan-Malek, C., 2007) of PDMS, together with its other interesting properties.
This hydrophobicity does not enable aqueous solvents to penetrate and to swell
the polymer, allowing the extraction of analytes from aqueous media or other
hydrophilic solvents frequently used in analytical chemistry. Under these
conditions, analytes from the solvents are transported to the PDMS where the
extraction takes place. Satisfactory results are reported by using capillary columns
based on PDMS coupled to LC systems (Campins-Falcó, P. et al., 2010;
Seethapathy, S. and Górecki, T., 2012). The weak point of PDMS used in IT-SPME is
the commonly low extraction efficiencies achieved. As a consequence, a current
research trend is focused on the improvement of extraction efficiencies,
selectivity and stability either by functionalization of capillaries or by the synthesis
of new (nano)materials. In this way, nanostructured coatings appear as an
interesting alternative to improve the extraction efficiency (See section 4.2.1 of
this Thesis). As can be observed in Figure 13, the evolution of citations about
PDMS as extractive phase evidences the continuous interest in this polymer
during the last five years.
Figure 13. Number of citations on Web of Science for matching the following search
terms: “PDMS” OR “Polydiemthylsiloxane” AND “extractive phase” between 2013 and
2017 (March 2018).
0
5000
10000
15000
20000
25000
2013 2014 2015 2016 2017
Nu
mb
er
of
cita
tio
ns
Year

Chapter 1. Introduction
38
b) PDMS as support for sensing devices
Another of the multiple applications of the PDMS derived from its benefit
properties is the development of colorimetric sensors, both in air and water. That
is why some authors have used PDMS as supporting material for embedding
chromophores into the polymeric matrix. In this respect, Table 9 presents several
works in which PDMS has been used as supporting material in sensing devices.
Working in the same direction, MINTOTA group have developed a patent based
on a passive sensor where the chromophores NQS or 4-N,N-dioctylamino-4′-
trifluoroacetylazobenzene (ETHT4001) are immobilized into PDMS for in-situ
detection of amines in atmospheres (Campins-Falcó, P. et al., 2016). From this
patent, PDMS-based matrix has been evaluated as encapsulant of dyes,
specifically NQS and Co(SCN)2, for developing sensors that allow in-situ detection
of analytes as diverse as a biocide in industrial products, casein in effluents from
dairy industries and amphetamine-like compounds and ketamine in street drugs.
Table 9. Examples of PDMS-based colorimetric sensors reported in the literature between
2010-2018.
Device Matrix Analyte Analytical signal Reference
CdSe/CdS-QDs embedded in PDMS
Atmosphere Hydrogen sulfide
- Fluorescence quenching
- Visual color change
Xu, H. et al., 2010.
PDMS- 6-(4´-methoxyphenoxy)-5,12-naphthacenequinone
Atmosphere n-Butylamine - Visual color change Park, I.S. et al., 2012.
Methytriethoxysilane/PDMS-OH ormosil coating doped with rose anthocyanin
Indoor air Formaldehyde - UV-Vis absorbance - Visual color change - Atomic Force
microscopy
Meng, Q. et al., 2014.
PDMS-Thymol/Nitroprusside
Water Ammonium - UV-Vis absorbance Prieto-Blanco, M.C. et al., 2015
NQS or ETHT4001
embedded in PDMS/TEOS
Atmosphere Ammonia Aliphatic amines
-UV-Vis absorbance (reflectance mode) -Visual color change
Campins-Flcó, P. et al., 2016.
PDMS-TEOS-SiO2NPs-TMB-HRP
Commercial product
Hydrogen peroxide
- UV-Vis absorbance Pla-Tolós, J. Et al., 2016 b.
PDMS-TEOS-SiO2NPs-TMB-HRP-Glucose oxidase
Human serum
Glucose - Image analysis (color intensity)
- UV-Vis absorbance
Pla-Tolós, J. Et al., 2018.
Chapter 1. Introduction
39
Even though the favorable properties of PDMS, its use for sensors in aqueous
samples with polar compounds is difficult because of its hydrophobicity. To
overcome this limitation, hydrophilic compouns such as tetraethyl ortosilicate can
added to increase the hidrophilicity (Campins-Flcó, P. et al., 2016; Jornet-
Martínez, N. et al., 2016a). Copolymerization reactions between polymeric
fraction (PDMS) and silicon alcoxyde, specifically TEOS, give, as a result, a hybrid
material in which both PDMS (organic fraction) and TEOS (inorganic fraction) take
part in the mixed network (Tamayo, A. and Rubio, J., 2010). Chemical-physical
treatments by UV/ozone (Ma, K. et al., 2011) or oxygen plasma (Tan, F. et al.,
2010) which required expensive equipment and tedious steps can be replace by
the easy copolymerization between PDMS and TEOS in order to achieve
hidrophilicity. Moreover, this polymeric mixture is usually cracked when the
network is gelled. In order to prevent the cracks, SiO2NPs can be added in the
polymeric mixture. Li et al., 2013 have already performed the incorporation of
SiO2NPs into the coating sol and concluded that NPS cause an increase of pore
sized that prevents the cracking.
In fact, hybrid PDMS/TEOS/SiO2NPs material has been studied for developing
the sensors based on NQS in this Thesis.
1.4.1.2 Bondesil C18
Bondesil C18 phase is based on a hydrocarbon of 18 carbon atoms which is
chemically bonded to silica (Figure 14). Silica particles are available in many
shapes (regular spherical or irregular), sizes (0.9-10 µm and larger), porosities (as
large as 1000 Ȧ), and is either fully porous or they have a solid core by design.
Since the surface of the silica is covered with hydrocarbons, the polarity of the
material is very low. As is well known, this material has been widely used as
adsorbent phase. The popularity of a C18 stationary phase is that it offers a simple
hydrophobic interaction. Due to its hydrophobicity and easy packing, the main use
of C18 is in a reverse phase chromatography, as well as in treatment samples
techniques. It should be remember the main characteristics of bondesil C18 such
as wide pH range stability, reproducible, high throughput, easy packing in columns
(capillary, stainless steel, peek and glass) that have made it a very popular
material.

Chapter 1. Introduction
40
Figure 14. Chemical structure of bondesil C18.
Bondesil C18 is tipically used as abrasive solid material for MSPD which is used
for the analysis of solid and semisolid samples. Many times a chemical
derivatization of analytes retained onto the sorbent is required. This methodology
offers clear advantages over derivatizations carried out in liquid phase, such as
the improvement of the reaction rates and the simplification of the overall
derivatization procedure. A solid phase derivatization approach could be
combined with MSPD by using C18.
In the present thesis, we have evaluated for the first time the possibility of use
bondesil C18 material for combining MSPD and the solid phase derivatization
technique as an alternative to simplify sample preparation for the determination
of amphetamines in hair. In addition, C18 has been also employed as dispersant
phase in MSPD for the determination of a phtalate in sediments.
1.4.1.3 Mesoporous silica
Mesoporous silica materials have received considerable attention due to
their excellent features such as ordered pore structure, high surface area, large
pore volume, tunable mesostructure, narrow pore size distribution and their
possible synthesis in a wide range of morphologies, as for instance spheres, rods,
discs, among others (Dou, B. et al., 2011; Kosuge, K. et al., 2007; Qin, Y., 2013).
Since the size of pore can be varied from 2 to 50 nm, mesoporous silica is
considered a nanomaterial. From 2016, almost 8000 publications have dealt with
mesoporous silica (data from Web of Science searching mesoporous silica as
topic). Indeed, this material is employed in a wide range of application areas.
These include its use as adsorbent for environmentally hazardous (Hamdi, K. et
al., 2016), catalysis (Liu, C.C et al., 2018; Tsai, C.H. et al., 2018), drug delivery
Si SiOCH3
CH3
CH3
CH3
CH3
CH3
CH3
CH3
CH3
CH3
CH3
CH3
CH3
CH3
CH3
CH3
CH3
CH3
CH3
CH3

Chapter 1. Introduction
41
(Gary-Bobo, M. et al., 2012; Saroj, S. and Rajput, S.J., 2018; Wang, L.Y. et al., 2018)
and electronics (Yamben, S.D. et al., 2017). In this case, we will focus on its
capacity as adsorbents. Many works reported the great potential of mesoporous
silicas as adsorbents for VOCs (Dou, B., et al., 2011; Hamdi, K. et al., 2016; Hung,
C. and Bai, H., 2008). Following this context, mesoporous silica has been used in
resonant microcantilevers to enhance the sensing performance. Their huge
surface area allows the adsorption of more molecules and thus, higher mass-
adding is leaded inducing a higher frequency-shift sensing signal. Various types of
mesoporous silica are well documented in the literature (SBA-15, SBA-16, MCM-
41, MCM-48, KIT-6, MCF, etc). Table 10 shows the main characteristics of the
most common mesoporous silica types.
Table 10. Characteristics of SBA-15, MCM-41 and MCF-types mesoporous silica. MCM:
Mobile Composition of Matter, SBA: Santa Barbara Amorphous, MCF: Mesoporous Cellular
Foam (Beck, J. S. et al., 1992; Kruk, M. et al., 2000; Selvam, P. et al., 2001).
Characteristics MCM-41 SBA-15 MCF
Pore geometry hexagonal round spherical Internal structure 2-D hexagonal array 2-D hexagonal
array 3-D mesocellular foam
Pore diameter (nm) 1.5-10 4-30 22-42 Pore volume (cm
3 g
-1) 0.84 1.06 1.6
Surface area (m2 g
-1) ˃1000 680 445-618
Among mesoporous silica material, MCM-41 and SBA-15 are considered the
most common adsorbents studied for VOCs (Gibson, L. T., 2014). MCF silica is
another most recently type of mesostructured material studied that have
attracted a great deal of attention. MCF is a three-dimensional material with
ultra-large mesopores (up to 50 nm) that are hydrothermally robust. In terms of
structure, MCF is composed of spherical cells interconnected by window pores
with a narrow size distribution (≈10 nm) (Li, Q. et al., 2010; On, D.T. and
Kaliaguine, S., 2003; Schmidt-Winkel, P. et al., 1999). Due to its 3D system based
on cellular form with larger pores than MCM-41 or SBA-15 and so, showing
enhanced adsorption, MCF seems to be an interesting candidate to be used as
sensing layer of resonant microcantilevers.
The aim of this thesis has been to investigate the ability of MCF silica as
sensing material for microcantilever development.

Chapter 1. Introduction
42
1.4.2 C-based materials
Among the different varieties of C-based nanomaterials described for
analytical purposes, carbon nanotubes have been the most widely used in several
applications. In this thesis, we will focus on carbon nanotubes due to their
outstanding properties.
CNTs are based on sheets of carbon atoms organized in a hexagonal pattern
(graphite lamella) rolled up either on a single tube (SWCNTs) or concentric
SWCNTs held together by van der Waals forces (MWCNTs). MWCNTs can range
from one outer and one inner tube (double-walled nanotube) up to more than
100 tubes. The lengths of CNTs can varied from a few hundred nanometers to
several microns. With regard to the outer diameters, SWCNTs have diameters
range from 1 to 10 nm while diameters of MWCNTs ranged from 5 to a few
hundred nm. The surface areas of CNTs can vary from 150 to 150- 1500 m2 g-1. In
general, MWCNTs presents superior adsorption capacity than SWCNTs. Thus,
CNTs characteristics depend on the different factors such as lengths, diameters
and number of layers.
From the discovery of CNTs in 1991 (Iijima, S., 1991), a new era in materials
science and nanotechnology has been opened. During the last five years, more
than 85.500 publications reported the use of CNTs in a wide variety of
applications in electronic devices, drug carriers, electrochemical and biological
sensors, among many others (Bin, L. et al., 2018; Ghrera, A.S. et al., 2018; Pérez-
López, B. and Merkoçi, A., 2011; Wu, Z.X. et al., 2018). Due to the high surface-to-
volume ratio of CNTs, they are considered attractive sorbents for extraction and
microextraction techniques, increasing the extraction efficiencies. CNTs have been
extensively tested as sorbents for SPE and fiber SPME because they can interact
with a variety of compounds through different mechanisms such as hydrogen
bonding, π–π stacking interactions, electrostatic and van der Waals forces, and
hydrophobic interactions (Bahzadi, M. et al., 2013; Feng, X. et al., 2014; Kueseng,
P. and Pawliszyn, J., 2013; Liang, X. et al., 2014; Ravelo-Pérez, L.M. et al., 2010;
Song, X.Y. et al., 2014; Xu, J. et al., 2013; Zhang, B.-T., 2013).
In the first application of CNTs as SPME sorbent, MWCNTs coatings were
prepared by dipping silica fibers into a suspension of MWCNTs in
dimethylformamide (Wang, J-X. et al., 2006). The fibers were used for the

Chapter 1. Introduction
43
extraction of polybrominated diphenyl ethers in water and milk samples by
immersing them directly into the samples. Then, the fibers were inserted into a
GC injector at 295 ºC for desorption of the analytes. Considerable enhancement
factors in the responses compared to typical coatings such as PDMS and activated
carbon were achieved. Additionally, the surface of CNTs can be modified by
changing their polarity or functionalizing in order to improve the sensitivity and
selectivity of the extraction process (Pyrzynska, K., 2011; Valcarcel, M. et al.,
2008). In this context, acidic oxidation of CNTs leads to the introduction of
carboxylic groups in the surface which enhances the retention efficiency for
charged or polar compounds at proper pHs. Liu et al. immobilized –COOH
functionalized MWCNTs onto the external surface of a fused silica fiber using
epoxy resin glue. The fibre was then inserted into a polyether ether ketone (PEEK)
tube which was used as the injection loop in an in-valve IT-SPME configuration.
The proposed device was applied to the extraction of aniline compounds from
water (Liu, X.-Y. et al., 2008). Although there are many works using CNTs as
adsorbent material for SPME, the use of CNTs for IT-SPME is still a challenge.
Indeed, a few examples of CNTs functionalized capillary columns for IT-SPME are
described in the literature. In recent studies, the use of different PDMS-based
capillary columns modified covalently with CNTs has been reported. Figure 15
shows a MWCNTs coating capillary, as an example. The new coatings provided
high efficiencies for the extraction of some pollutants from water samples (Jornet-
Martínez, N. et al., 2015b; Moliner-Martínez, Y. et al., 2015b).
In the present thesis, the extraction capabilities of CNTs modified PDMS-
based capillaries for amphetamines have been explored in order to extend the IT-
SPME methodology to drug analysis in oral fluid. To our knowledge CNTs modified
coating have never been used for the extraction of drugs by in-valve IT-SPME.
Figure 15. Schematic representation of MWCNTs coating.

Chapter 1. Introduction
44
1.4.3 Metallic-based materials
1.4.3.1 AgNPs and AuNPs
When a metallic NP is excited by light with higher wavelength than NP size,
the conduction electrons on the metal surface undergo a collective oscillation
with electromagnetic wave frequency but confined in the nanometric size. As a
consequence of oscillations of electric charges, scattering of the incident light is
produced (Figure 16). Thus, a new absorbance band known as Surface Plasmon
Resonance band (SPR) is observed in the UV-vis spectrum. The characteristics of
this band depend on several parameters of NPs such as shape, size and dielectric
constant. At nanometric scale, the movement of electrons is confined and color is
result from the absorption and scattering of light instead of the free movement of
electrons and metallic color originated from the reflection of light at macroscopic
scale.
Figure 16. Illustration of the excitation of localized SPR where electrons in the metal
nanoparticle are driven into oscillation due to coupling with incident light; d is the
diameter of sphere and λ is the wavelength of the light.
AgNPs and AuNPs are extraordinarily efficient at absorbing and scattering
light and, unlike many dyes, their color depends on the size and the shape of the
particle. Figure 17 shows an example of surface plasmon band of spheral AgNPs of
15-20 nm and their characteristic color (used in this Thesis). The peak wavelength
and width and the effect of secondary peaks due to secondary resonances yield a
e- e- e-
e- e- e-
e- e- e-
Electric field
Metallic nanoparticle
λ
d

Chapter 1. Introduction
45
unique spectral fingerprint for a plasmonic nanoparticle with specific size and
shape.
Figure 17. Surface plasmon band of spherical AgNPs of 15-20 nm.
AgNPs are relevant materials; around 66000 articles of AgNPs have been
published from 2007 in several fields of science (data from Web of Science,
researching “AgNPs” OR “silver nanoparticles” in the title). Figure 18 shows the
impact of this topic in our society in the last years.
AgNPs are used in numerous fields owing to their unique properties:
- Nanometric size and high surface area.
- Functionalizable surfaces.
- Sensitivity to physical-chemical changes.
- Stability in aqueous media.
- Biocompatibility.
- Antibacterial.
- High electrtical conductivity.
- Low sintering temperature.
0
0.1
0.2
0.3
0.4
0.5
0.6
0.7
0.8
0.9
350 400 450 500 550 600
Ab
sorb
ance
Wavelength (nm)

Chapter 1. Introduction
46
From these optical, electrical, thermal and biological properties, AgNPs have become one of the most widly marketed nanomaterials for several applications, including medical devices, food, antibacterial agents, household, healthcare, optical sensors, cosmetics, orthopedics, drug delivery and industry purposes (Bala, R. et al., 2018; Nowack, N. et al., 2011; Zhang, X.F. et al., 2016).
Figure 18. Evolution of number of citations about AgNPs from the year 2008 in the web of
science by searching “AgNPs” OR “Silver nanoparticles” in the field of “Title”.
Although AgNPs are exploted for various applications, we will focus on their
potential application as sensors. Thanks to the novel optical properties before
mentioned, AgNPs are considered suitable materials for the development of
(bio)sensors (Jornet-Martínez, N. et al., 2014; Ma, X.-M. et al., 2018; Saha, K. et
al., 2012). From the discovery of the SPR in 1980, the interest in using the optical
properties of NPs to detect several chemical compounds has grown considerably.
Table 11 evidences the huge number of publications where AgNPs have been
applied as colorimetric sensors of diferent analytes based on their SPR band.
0
2000
4000
6000
8000
10000
12000
20
00
20
01
20
02
20
03
20
04
20
05
20
06
20
07
20
08
20
09
20
10
20
11
20
12
20
13
20
14
20
15
20
16
20
17
Nu
mb
er
of
pu
blic
atio
ns
Year

Chapter 1. Introduction
47
Table 11. Selected examples of plasmonic assays.
Assay Analyte Matrix LOD Reference
AgNPs in solution
Melamine Raw milk 0.01-1.26 mg L-1
Ma, Y. et al., 2011.
AuNPs on paper
Mercury (II) Water 50 nM Chen, G.H. et al., 2014.
TMB–H2O2 system catalyzed-bare AuNPs
Sulfide Water 80 nM Deng, H.-H. et al., 2014.
Antiaggregation of AuNPs
Hydrogen Sulphide
Air 0.5 ppm (v/v) Zhang, Z. et al., 2014
AuNPs in solution
Spermine Urine 15 ng L-1
Jornet-Martínez, N. et al., 2015a.
AuNPs-aptamers
MAMP MDMA
Water 10-4
M 5 mM
Yarbakht, M. and Nikkhah, M., 2016.
Anti-aggregation of AgNPs
Manganese (II) Water 20 nM He, Y. and Zhang, X., 2016.
Citrate-capped silver nanoparticles
Creatinine Urine 53.4 nM Alula, M.T. et al., 2018
Sucrose capped gold nanoparticles
Vitamins B1 and B6
Rice 8 ng mL-1
for B1 and 15 ng mL
-1
for B6
Shrivas, K. et al., 2018.
The analytical signal of the plasmonic sensors is based on changes in the SPR
band. In presence of the analyte, the monodisperse solution of AgNPs (≈400 nm)
changes from yellow to brownish due to an aggregation of these NPs (≈500 nm).
Different colors are observed according to their dispersion/aggregation state. As a
consequence, the SPR band is shifted to longer wavelengths and broadened when
the analyte is present (Figure 19).

Chapter 1. Introduction
48
Figure 19. Schematic picture of the AgNPs aggregation in presence of sulphure compounds
(See Section 4.3.2.1).
These changes on the SPR band can be monitored by UV-Vis spectroscopy
allowing a rapid colorimetric detection of analytes. Moreover, the quantification
of analyte concentration can also carried out observing the band changes because
the aggregation of NPs is function of the analyte concentration. The main
advantage of the nano-plasmonic sensors is their high sensitivity from nanomolar
up to picomolar levels. In fact, nano-plasmonic sensors offer a viable detection
technique in some medical diagnostics where the concentration of biomarkers
secreted is usually very low. Additionally, it is remarkable the simplicity by visual
inspection without expensive equipment and energy sources.
Although AgNPS are not as widely used as AuNPs, considerable efforts are
being directed toward the development of new plasmonic sensors for different
applications. Most works about plasmonic sensors has been concerned with using
AuNPs instead of AgNPs due the difficulty of AgNPs synthesis. However, AgNPs
have specific characteristics which are advantages such as higher molar extinction
coefficient increasing sensitivity when using absorption spectroscopy.
In this Thesis, a plasmonic sensor based on AgNPs immobilized on nylon has
been developed to detect sulphur compounds from breath which are responsible
of oral malodour.
-S-2,-S-
Sulphure compounds:
Aggregated AgNPsMonodisperseAgNPs
Characterization by High Resolution
Transmission Electron Microscope
-S-2,-S-
Sulphure compounds:
Aggregated AgNPsMonodisperseAgNPs
Ag2S-AgNPs
(a) (b) (c)(a) (b) (c)AgNPs dispersed AgNPs aggregated
AgNPs
-S2-, -S-
-_
_
_ __
___
_ __
_
_
_
___
___ _
_
_ _ __
_

Chapter 1. Introduction
49
1.4.3.2 MOFs
Self-assembled structures of metal oxide cations and organic electron donor
linkers are the basis of MOFs. These compounds are crystalline materials built
from the interconnection of metal ions or clusters and organic linkers to produce
porous architectures. Figure 20 shows an example of MOF compound with its
porous (Figure 20A) and crystalline (Figure 20B) characteristic structure.
Figure 20. A) Porous structure and B) Crystalline structure of Cu(GHG) MOF.
MOFs are nanostructured materials increasingly used in sample preparation
because they present surfaces areas in the 1000-10400 m2 g-1 range. They also
offer excellent thermal stability. Examples of the utility of MOFs-based coatings
for fiber SPME have been reported for the extraction of benzene homologues
from air samples (Chang, N. et al., 2012) or alkanes from fuel and biological
samples by the head space SPME (HS-SPME) approach (Cui, X-Y. et al., 2009),
among others. Besides other applications like catalysis or sensing, the unlimited
structural/chemical flexibility of MOFs enables rational tailoring of the chemical
function and pore dimensions for more efficient and selective separation of gases
(Nugent, P. et al., 2013), hydrocarbons (Blonch, E. et al., 2012; Cadiau, A. et al.,
2016) or aromatic compounds (Warren, J. E. et al., 2014). In this context, the
separation of chiral molecules is also very relevant.
Compared to classical adsorbents like zeolites or activated carbons, MOFs are
arguably more promising candidates for chiral separation. They can be more easily
engineered to deploy a periodic array of chiral channels that are accessible to
guest sorption and can be modified in size, shape, and chemical function to
optimize mass-transfer rates and chiral recognition. However, the application of
A B

Chapter 1. Introduction
50
MOFs in enantioselective separation is still limited by the small number of
homochiral phases available (Duerinck, T. and Denayer, J. F. M., 2015; Kutzscher,
C. et al., 2016). These are typically prepared either by using chiral templates that
drive enantiomeric resolution, by postsynthetic linker exchange for partial grafting
of chiral linkers in the metal struts at the expense of accessible porosity, or by
direct synthesis from enantiopure linkers. This last route is compatible with the
use of naturally occurring chiral linkers like camphoric and tartaric acid, amino
acids (aa’s) or oligopeptides. Among these, peptides are well suited to producing
functional, chiral MOFs whose robustness, chemical stability, and porous response
can be effectively modulated by suitable choice of aa’s in the peptidic sequence
(Katsoulidis, A. P. et al., 2014; Martí-Gastaldo, C. et al., 2012, 2014; Rabone, J. et
al., 2010). The broad choice of side-chain groups available from proteinogenic aa’s
can be also used to engineer the chiral pockets in their structure with specific
functions. Due to their crystalline nature, peptide MOFs are also well suited for
theoretical modeling of the enantiomer interactions in a confined space, which is
important to accelerate screening of materials already available and guide the
design of more efficient systems.
This thesis reports the ability of a chiral Cu(II) three-dimensional (3D) MOF
based on the tripeptide Gly-L-His- Gly (GHG) for the separation of chiral drugs.
1.5 ANALYTES AND ANALYTICAL TECHNIQUES
The materials investigated during this Thesis have been applied to develop
analytical methodologies in order to determine compounds related to fields as
diverse as health, environment, industry and forensic control. The characteristics
of these diverse analytes as well as the interest of their determination are
detailed. In addition, a bibliographic review of the documented methods for their
analysis is included.
1.5.1 Phthalates
Phthalates are esters of phthalic acid. They are synthetic compounds widely
used as plasticizers in plastic, rubber, cellulose, and styrene production to
increase their flexibility, strength, optical clarity and resistance. These compounds
are present in many consumer products such as food preservatives, children toys

Chapter 1. Introduction
51
cosmetics, medical equipment, flooring, organic solvents, personal care products,
detergents, packaging, adhesives, paper coating, lacquers, and insecticides,
among other products (Biedermann-Brem, S. et al., 2008; Gonzalez-Castro, M. I. et
al., 2011; Green, R. et al., 2005; Schettler, T., 2006). Due to the phthalates are not
chemically bound in the polymer matrix, they can leach into the environment
(Chaler, R. et al., 2004; Muñoz-Ortuño, M. et al., 2012; Net, S. et al., 2015). For this
reason, phthalates are nowadays considered as ubiquitous environmental
pollutants. Indeed, the United States Environmental Protection Agency (USEPA)
and the European Union (EU) have established limits of certain phthalates in
drinking and natural waters (Directive 2008/105/EC; USEPA, 1991). This is the case
of di(2-ethylhexyl)phthalate (DEHP), which is the most widespread phthalate
produced and used (Figure 21).
Figure 21. Structure of the phthalate analyzed in this thesis, DEHP.
DEHP is commonly found in drinking water, and it is also the most persistent
phthalate found in wastewaters (Alatriste-Mondragon, F. et al., 2003). The
maximum annual average concentration established for DEHP by Directive
2008/105/CE in surface waters is 1.3 g L-1, whereas the USEPA has set the
maximum concentration level for this compound in water systems at 6 g L-1. It is
important to note that DEHP have been classified as very dangerous substance in
EU regulation on chemicals (REACH Regulation (CE) n. 1907/2006).
Owing to the low solubility and highly hydrophobic nature of DEHP, it is
preferentially absorbed and/or adsorbed to the organic matter suspended in

Chapter 1. Introduction
52
water as well as to the organic fraction of soils and sediments. Furthermore, DEHP
tends to bio-accumulate in fats, and a considerable transfer of this compound
from sediments to aquatic organisms may occur (Huang, P.-C. et al., 2008).
Therefore, the development of simple and sensitive methods for the
determination of DEHP in sediments is of great interest for the characterization of
aquatic ecosystems.
Due to the low concentration of DEHP in environmental matrices, extensive
sample preparation is often obligatory to reach the required sensitivity. Several
extraction methods have been proposed like Soxhlet, ultrasonic extraction, SPE or
LPE with high sample, solvent and energy consumption (Hui, I. et al., 2010; Huang,
P.-C. et al., 2008; Wen, X. L. et al; 2008; Yuan, S.-Y. et al., 2010). In addition,
special efforts are necessary during sample manipulation to prevent
contamination by DEHP, as this compound is present in packages, solvents, or
glassware (Frankhauser-Noti, A. and Grob, K., 2007). Obviously, elimination or
simplification of the sample preparation would reduce the risk of contamination.
As discussed above, simplified and miniaturized analytical methods which reduce
the sample handling as well as the consumption of sample and reagents are an
interesting alternative. In this sense, in-valve IT-SPME has been used as reliable
technique for the enrichment of traces of DEHP from water samples or extracts
obtained after the treatment of solid samples to be analyzed by LC. A further
improvement of the sensitivity can be achieved by coupling IT-SPME to capillary
LC (Campíns-Falco, P. et al., 2010; Cháfer-Péricas, C. Et al., 2008; Muñoz-Ortuño,
et al., 2012).
In this thesis, the analysis of DEHP in sediment and water samples have been
effected by a new method based on MSPD and on-line IT-SPMECapLC-DAD, with
the subsequent reduction of sample, organic solvent, and energy consumption and
no evaporation step required in comparison with other methods.
1.5.2 Biocides
According to Directive 98/8/EC of the European Parliament and of the
Council Official Journal of the European Communities, biocidal products are
defined as active substances and preparations containing one or more active
substances, put up in the form in which they are supplied to the user, intended to
destroy, deter, render harmless, prevent the action of, or otherwise exert a

Chapter 1. Introduction
53
controlling effect on any harmful organism by chemical or biological means. These
products are present in detergents used in many areas such as food industry,
household, institutions and hospitals (Ash, M. and Ash, I., 2004), for disinfecting or
preserving. Patents about cleaning products including compounds like the biocide
N-(3-aminopropyl)-N-dodecyl-1,3-propanediamine (ADP), trimethyl-tetradecyl-
ammonium chloride (TMTDAC) (See Figure 22), and quaternary ammonium
compounds (QACs) mixtures have been published (Tezel, U., 2009). However,
their use can pose risks to humans, animals and the environment owing to their
intrinsic properties. In fact, the use of these agents is subject to regulations.
Therefore, quantification of biocides is mandatory in two scenarios, in industrial
formulations and waste samples for monitoring environmental impacts. This
Thesis is focused on two widely used biocides listed below.
1.5.2. 1 Benzalkonium chloride (BAK)
The main active ingredients of biocide formulations are QACs or sodium
hypochlorite (Biondi, C.A.M., 2011). The QACs are most effective against
microorganisms at neutral or slightly alkaline pH and become virtually inactive
below pH 3.5. They are incompatible with anionic detergents, demonstrating a
high degree of binding to non-ionic surfactants. The (bio)available QAC
concentration reaches a maximum at the critical micellar concentration (CMC).
Any agent or factor that decreases the CMC also diminishes the available QAC
concentration, and so the biocidal activity. It was demonstrated that anions
decrease the CMC of QACs by reducing the polarity of the head and in turn
increase the hydrophobicity of the overall molecule as they form ion pairs with
the QACs.
QACs with high CMCs are more mobile in engineered and natural systems but
also more toxic than the ones with lower CMCs. The combination of these two
facts brings out a detrimental environmental impact associated with QACs, that is,
QACs which are more mobile and (bio)available are more toxic. This information
may be used in the selection of mixtures of QACs in industrial applications by
assessing the trade off between sanitation efficiency and their impact on the
treatment of QAC-bearing wastewaters. The most employed QAC is BAK, which
has activity against yeast, fungi and positive and negative Gram bacteria. BAK is
classed as a Category III antiseptic active ingredient by the United States Food and
Drug Administration, meaning “available data are insufficient to classify as safe

Chapter 1. Introduction
54
and effective and further testing is required”. BAK (See Figure 22) is a mixture of
homologues of the alkylbenzyl dimethylammoiun chlorides with predominance of
the alkyl chain of 12 carbon atoms C12-BAK (CMC 3.80 mM,), followed in a minor
proportion by the chain of 14 carbon atoms C14-BAK (CMC 1.70 mM).
Figure 22. Structure of several biocides studied in this Thesis.
Several methods for BAK determination in industrial production (Prieto-
Blanco, M.C. et al., 1999; 2009b; 2013a) and environmental monitoring are
documented (Bassarab, P. et al., 2011; Boyacı, e. et al., 2014; Chen, Y. et al., 2012;
Martínez-Carballo, E. et al., 2007; Peng, X.-T. et al., 2011). Specific problems
related with their surfactant nature have been reported in some works (Prieto-
Blanco, M.C. et al., 2012). The chemistry of surfactants is different from that of
other analytes due to the formation of direct/reversed micelles or monomers that
may cause specific matrix effects. The mixtures of surfactants in biocide
formulations are one of the complex cases in which new parameters should be
considered for establishing analytical procedures. In most methods of the
C12-BAK
C14-BAK
ADP
TMTDAC

Chapter 1. Introduction
55
literature, the conditions are optimized from standard solutions containing a
similar amount of all surfactants studied or for developing their determination in
water samples. However, the matrix effect for samples, in which one of the
surfactants (in this case BAK) is a minor component or impurity, is not covered for
these methods.
Thus, the present Thesis establishes the parameters under which matrix
effects may occur in formulations containing BAK as minor component and other
co-biocides and provides new strategies of analysis combining on-line IT-
SPME/CapLC. For commercial formulation, this method allows the control of BAK
as potential impurity when different formulations are made in the same
production plant or when the cleaning of an installation requires biocides.
1.5.2.2 ADP
Another effective biocide is the ADP, a polyamine with an alkyl chain of 12
carbon atoms (See Figure 22). This compound is used to formulate several
commercialized disinfectants due to its activity against enveloped viruses and
positive and negative Gram bacteria. Some authors have described episodes of
allergic contact dermatitis due to the ADP (Schliemann, S. et al., 2010). Analytical
techniques such as NMR spectroscopy, LC coupled MS and acid–base titration
have been employed in the literature for the characterization and quantification
of ADP (Mondin, A. et al., 2014). Also, derivatization techniques can be used
thanks to the primary amine groups of this biocide.
Due to one of the trends in analytical chemistry is to develop in-situ sensors, a
colorimetric sensor based on NQS/TEOS/ SiO2NPs embedded into PDMS has been
developed in this Thesis for controlling ADP dosage in industrial formulations.
1.5.3 Casein
Casein is the major protein component of milk, comprising about 80% of the
total milk protein. It is made up of different proteins, including αS1‐, αS2‐, β‐, and
k‐casein, which together with calcium phosphate form aggregates, known as
casein micelles. These proteins, have a primary amino acid sequence (See Figure

Chapter 1. Introduction
56
23) different from each other and occupy different positions in micelle performing
specific functions (Steinhauer, T. et al., 2014).
The cleaning procedures are important in dairy industries to ensure the
hygiene in food processing lines by completely removing the organic or inorganic
materials and bacteria from the surfaces. In these industries, a cleaning in place
(CIP) process is used for cleaning and disinfection of circuits, tanks, pasteurizers
and packing, filling and metering equipments. In this process, large amounts of
wastewaters mainly composed of diluted milk, which is based on fat, protein
(mainly casein), calcium and lactose, are generated. These effluents may cause
serious environmental problems, without the appropriate treatment. Indeed, the
organic matter load of these wastewaters enables the reproduction of
microorganisms producing significant changes in the biological oxygen demand.
Therefore, the dairy industry should treat its effluents efficiently and effectively
before disposal into public drainage. Considering these aspects, a method for the
determination of the main components such as the casein in these effluents is still
needed to control these effluents.
Figure 23. Structure of casein (data from PubChem).
There are different methods proposed in the literature for the determination
of proteins. The most traditional method is the Kjeldahl method (Lynch, J.M. et al.,
1998), followed by colorimetric and spectrophotometric methods
(Chutipongtanate, S. et al., 2012) such as Biuret (Oftedal, O.T. et al., 2014),
Bradford (Aminian, M. et al., 2013; Kamizake, N.K.K. et al., 2003), Lowry
(Kusunoki, H. et al., 2012), Ninhydrin (Drochioiu, G. et al., 2006) and bicinchoninic
acid (BCA) (Kralj, J.G. et al., 2014). More selective methods, such as
chromatographic techniques with different detectors (Pierri, G. Et al., 2013;
Ramirez-Palomino, P. et al., 2014) or immunoassay test (ELISA Kit) (Stumr, F. et al.,

Chapter 1. Introduction
57
2010) have also been described for the determination of casein in food. Most of
these methods are not in situ analysis and require long analysis time.
In response to the aforementioned demand of in-situ analysis, casein from
dairy effluents has been estimated in this Thesis by in-situ sensor based on the
entrapment of NQS/TEOS/SiO2NPs in PDMS.
1.5.4 Drugs
1.5.4.1 Amphetamine-like designed drugs
The consumption, production and commercialization of illicit synthetic drugs
remain a serious problem in many countries. Amphetamine-type drugs have
become popular drugs of abuse because they are powerful stimulants of the
central nervous system. Figure 24 shows the structure of these compounds, based
on an aromatic group linked to an aliphatic amine, primary and secondary amine
for amphetamine (AMP) and methamphetamine (MAMP), respectively, and an
additional methylendioxy group in the case of 3,4-methylenedioxyamphetamine
(MDA) and 3,4-methylenedioxymethamphetamine (MDMA).
Figure 24. Structure of the amphetamine-like drugs studied in this Thesis.
Although AMP has been traditionally the most used compound, there are
recent signs of the increasing availability of MAMP. Under the generic name
“ecstasy” a wide variety of illicit tablets are sold in which MDMA is usually the
active substance, but they may also contain other methylendioxylated
amphetamines such as MDA and 3,4- methylenedioxyethylamphetamine (MDEA)
(Freudenmann, R.W., Spitzer, M., 2004). According to official investigations, the
confiscated amounts of amphetamines and ecstasy samples have increased in
recent years (European Drug Report, 2017; Vidal Giné, C. et al., 2016). The
identification and quantification of amphetamine-like drugs in illicit tablets have
Chapter 1. Introduction
58
been described using several methods such as capillary electrophoresis (Piette, V.
and Parmentier, F., 2002), infrared spectroscopy (Schneider, R.C. and Kovar, K.A.,
2003), GC (El-Haj, B.M. et al., 2013) and LC (Cháfer-Pericas, C. et al., 2004;
Herráez-Hernández, R. et al., 2001). However, these methods require strict
laboratory conditions and trained personnel. The development of suitable assays
for instant detection of the most frequently used drugs in roadside drug testing
would facilitate to take legal actions quickly. Uncertainty and delay times could be
also minimized through the development of workplace screening tests. Therefore,
there is an increasing interest in the development of affordable, easy-to-use and
handheld devices for the detection and identification of these illicit substances in
the field.
Fast detection of illicit drugs has been reported using portable ion mobility
(Verkouteren, J.R. and Staymates, J.L., 2010), Fourier transform infrared (FTIR)
(Tsujikawa, K. et al., 2008) and Raman spectrometers (Weyerman, C. et al., 2011).
It is important to note that street drugs are usually modified with excipients (i.e.
adulterants or diluents) because they are typically sold by weight. Adulterants are
added to mimic the effects of the active substance in order to increase its
perceived quality, whereas diluents are simply added to increase the bulk and,
consequently, the profits of the drug dealer. Owing to the wide range of
excipients and their proportions in illicit preparations, the utility of spectral
libraries available is limited hindering the characterization of some street samples.
Moreover, these spectrometers are expensive and trained personnel may be
required to interpret the results.
The employment of colorimetric tests such as Marquis, Mandelin, Mecke and
Simon's tests can be an inexpensive and fast alternative for on-site screening of
suspected illicit substances. However, some of these tests are hazardous; for
example, the Marquis and the Mandelin reagents involve concentrated sulfuric
acid. Also the reagent solutions may be instable and solutions have to be
prepared daily. For on-site control tests, the employment of solid sensors is
generally considered a more convenient alternative.
From previous works, a solid sensor based on NQS/TEOS/SiO2NPs embedded
into PDMS has been developed in this Thesis for the in-situ screening of
amphetamine-like compounds (AMP, MAMP, MDMA, MDA).

Chapter 1. Introduction
59
On the other hand, these substances are frequently detected in biological
samples such as blood, urine, oral fluid, sweat and hair samples (Wada, M. et al.,
2010). Immunoassays are generally used for screening tests, whereas
chromatographic methods are required for quantitative purposes. Usually, LC
methods entail previous chemical derivatization to convert the analytes into
highly detectable products due to the poor sensitivity achieved with typical LC
detectors. In this respect, a variety of methods have been proposed using
different reagents (Cháfer-Pericas, C. ET AL., 2004; Herráez-Hernández, R. et al.,
2002; Tomita, M. et al., 2007). According to the results obtained in previous
studies, fluorogenic reagent 9-Fluorenylmethyl chloroformate (FMOC) has been
selected for derivatization in this Thesis (Cháfer-Pericás, C. et al., 2004). Although
there are several methods available for drugs in plasma and urine samples, there
is an increasing interest in the analysis of alternative biological matrices such oral
fluid or hair (Baciu, T. et al., 2015; Lledo-Fernandez, C. and Banks, C.E., 2011;
Vogliardi, S. et al., 2015; Wada, M. et al., 2010).
Oral fluid has gained popularity as an alternative to urine and blood for the
investigation of illicit drug consumption because sample collection is non-invasive
and it can be done under supervision. The main difficulty encountered in the
analysis of these fluids is the low amount of sample available and the low
concentration of analyte present in the sample. Thus, a selective and sensitive
method is required such as in-valve IT-SPME-CapLC. In addition, the extraction
capability of the capillary coating is the key factor to extend the applicability of in-
valve IT-SPME to drug analysis in oral fluid whose volume is limited.
In the present thesis, CNTs modified coating of capillary column has been
evaluated for the extraction of AMP, MAMP and ephedrine (EP) derivatives in oral
fluid by in-valve IT-SPME coupled online to CapLC-FLD.
Another biological sample of growing importance in the investigation of illicit
amphetamines consumption is the hair. Besides being a non-invasive collection,
hair can be used to establish long intake history of abusers. In addition, the risk of
sample adulteration and/or deterioration during storage and transportation is
minimized. Consequently, an increasing number of methods are being developed
to identify and quantify amphetamines in hair samples. However, the isolation of
amphetamines from hair continues to be a critical step of the analysis. Successful
examples for the extraction of amphetamines from hair by microwave (Chang, Y.J.
et al., 2014) and ultrasound (Zhu, K.Y. et al., 2012) have been reported. MSPD has

Chapter 1. Introduction
60
emerged as an attractive approach for the isolation of drugs from hair (Míguez-
Framil, M et al., 2010, 2011, 2013).
In the present thesis, we have evaluated for the first time the possibility of
combining MSPD and the solid phase derivatization technique as an alternative to
simplify sample preparation for the determination of drugs such as AMP, MAMP,
EP and MDMA in hair, which integrates sample disruption, analyte isolation and
derivatization.
A large number of drug compounds are often dosed as racemic mixtures.
Enantiomers generally display different pharmacological and/or toxicological
properties which can lead to a loss in activity or even to undesired side reactions.
This is the case of MAMP and EP, which are chiral compounds used as recreational
drugs, but also as components in pharmaceutical preparations of therapeutic use
as bronchodilators and respiratory stimulants. Both compounds possess a chiral
center and exist as a pair of enantiomers (See Figure 25) which may differ in their
pharmacological activity as well as in their metabolic and pharmacokinetic
characteristics. Separation of MAMP or EP enantiomers is frequently required in
clinical, forensic, and toxicology laboratories. In this context, the discovery of
chiral adsorbents that permit rapid separation of individual enantiomers is of
utmost importance in the early stages of drug research in the pharmaceutical
industry. This type of separation relies on chiral recognition rather than
shape/size selectivity. Hence, preferential interaction of one of the enantiomers
with the adsorbent must lead to the formation of a transient diastereomeric
adsorbate, whose free energy shall be sufficiently different for enantiomeric
separation to take place.
In this Thesis, a chiral Cu(II) 3D MOF based on the tripeptide GHG for the
enantioselective separation of MAMP and EP is reported.
Figure 25. Structures of chiral A) MAMP and B) EP.
MAMP
B)A)

Chapter 1. Introduction
61
1.5.4.2 Ketamine
Ketamine is an anesthetic drug widely prescribed for human and animal use.
It is also used as an analgesic in the treatment of certain diseases. Figure 26
illustrates the structure of ketamine. Since its introduction in the market, this
compound is increasingly used for recreational purposes, probably because it can
be produced at low cost and has a relatively favorable safety profile, although at
high doses it can cause severe dysfunctions. Its main effects associated with
recreational use are diminishing of attention and learning ability, floating
sensations, loss of memory, and distortion of time and space (Giorgetti, R. et al.,
2015).
Today, the consumption of ketamine for recreational purposes has become a
major problem, especially among young people. Moreover, as ketamine is
colorless, tasteless and odorless it can be added to drinks or illicit drug
preparations, which facilitates sexual assaults (Demoranville, T. and Verkouteren,
J.R., 2013). There is also an increasing concern about the role of ketamine in
traffic accidents (Waddell-Smith, R.J.H., 2007). The United Nations Office on Drugs
and Crime (UNODC) and the European Monitoring Centre for Drugs and Drug
Addiction (EMCDDA) have included this drug in their respective lists of new
psychoactive substances (Smith, J.P. et al., 2015). For these reasons ketamine has
become a controlled substance in most countries, and there is an increasing
demand of tests for the rapid identification of suspected samples at the sites of
trafficking and consumption, as well as for roadside tests (Gjerde, H. et al., 2016;
Vidal Giné, C. Et al., 2016).
Figure 26. Structure of ketamine.

Chapter 1. Introduction
62
In spite of the high level of sensitivity, accuracy and specificity of
chromatographic methods, they are not suitable for on-site analysis because the
instrumentation is complex, and strict laboratory conditions and trained
personnel are required. So far, only a few portable chromatographs are
commercially available and they do not allow high speed high resolution
separations (Sharma, S. et al., 2015; Smith, P.A. et al., 2012). Different assays with
portable instrumentation have been proposed for ketamine detection such as IMS
(Demoranville, T. and Verkouteren, J.R., 2013) and deep UV-Vis reflected optical
fiber sensors (Li, Q. et al., 2012). Nevertheless, because of their simplicity,
colorimetric test are the option preferred for a rapid preliminary on-site detection
of ketamine in suspected samples; positive findings are then derived to the
laboratory for confirmatory chromatographic analysis.
Different reagents have been proposed for presumptive colorimetric tests,
such as the Mandelin reagent (ammonium metavanadate in concentrated
sulphuric acid), which produces reddish-orange derivative in the presence of
ketamine that can be distinguished from the colors originated by other drugs, or
the Janovsky reagent (a mixture of m-dinitrobenzene and potassium hydroxide in
ethanol) which forms with ketamine a brown-purple precipitate. Another reagent
used for presumptive detection of ketamine is cobalt (II) thiocyanate (Co(SCN)2).
Under basic conditions, this reagent produces an insoluble purplish blue
derivative with ketamine (Morris test) (Morris, J.A., 2007). A modification of the
test has been reported by Maddah et al. based on the immobilization of the
Co(SCN)2 reagent onto silica NPs (Maddah, B. et al., 2015). A portion of the
developed material is added to a solution of the suspected sample in a spot plate,
so that the formation of a purple precipitate is indicative of the presence of
ketamine. The same reagent was used by Musile et al. in a paper-based
microfluidic device for the presumptive detection of different drugs, including
ketamine (Musile, G. et al., 2015). On-site colorimetric detection of illicit drugs by
solid sensors is a popular alternative because the manipulation of solutions is
minimized and they can be operated by unskilled personnel, as aforementioned.
Thereby, a colorimetric sensor for ketamine estimation has been developed in
this Thesis based on the entrapment of Co(SCN)2 onto PDMS. Experimental
parameters have been optimized.

Chapter 1. Introduction
63
1.5.5 Diphenylamine (DPA)
An important component of gun propellants is the DPA. Figure 27 shows the
DPA structure. This organic compound is used as a stabilizer in order to deter the
decomposition of the explosive products nitrocellulose and nitroglycerine, which
are present in some smokeless powders used as propellant (Burleson, G. L. et al.,
2009; Laza, D. et al., 2007). Thus, this stabilizer remains on the shooter body,
mainly onto the index fingers and thumbs of the hands, after discharge a firearm
and it may be used as an indicator of gunshot residues (GSRs). A suspect in
firearm-related crime can be successfully identified if GSRs are reliably analyzed.
Figure 27. Structure of DPA.
Several techniques have been described for the DPA estimation such as LC
(Laza, D. et al., 2007; Mei, H. et al., 2016), GC (Tarifa, A. and Almirall, J. R., 2015)
and capillary electrophoresis (Bernal Morales, E. et al., 2004). Although MS
coupled to GC or LC offers suitable sensitivity, the chromatographic techniques
present issues. Thermal degradation of DPA can occur by GC and the wide range
of polarities of compounds present in GSRs can limit the LC. Many works have
successfully identified DPA by using MS without any chromatographic system such
as tandem MS (Tong, Y. et al., 2001), desorption electrospray ionization-MS
(Morelato, M. et al., 2012), nanoelectrospray ionization MS (Scherperel, G. et al.,
2009) and IMS (Arndt, J. et al., 2012).
In addition, the analysis of inorganic gunshot residues (IGSRs) combined with
the organic gunshot residue (OGSR) analysis, such as DPA, may strength the
probative value of forensic sample. IGSRs are usually spherical particles mainly
composed of barium (Ba), lead (Pb) and tin (Sb) (Tarifa, A. and Almirall, J. R.,
2015). Other metallic elements such as calcium (Ca), aluminium (Al), cupper (Cu),
iron (Fe), zinc (Zn), nickel (Ni), silicon (Si), and potassium (K) can also be found.
The presence of these metallic particles has been traditionally confirmed by

Chapter 1. Introduction
64
electronic microscopy coupled to Energy Dispersion X-ray (EDX) detector (Bailey,
M. J. et al., 2009; Dalby, O. et al., 2010). However, the analysis of IGSRs has
limitations. False positive results can be produced from inorganic particles derived
from environmental and occupational sources (Farokhcheh, A. and Alizadeh, N. et
al., 2013; Grima, M. et al., 2012). Moreover, the commercial growth of lead and
other toxic metals free ammunition can also produce false negative results when
only IGSR are analysed (Oommen, Z. and Pierce, S. M., 2006). The issues related to
false positives and negatives can be overcome by combining IGSR and OGSR
analysis.
The present Thesis reports the detection of DPA from shooter hands by IT-
SPME-Cap-LC-DAD with easy sampling by cotton swab and vortex-assisted
extraction. A complementary analysis of IGSRs has been carried out in order to
confirm the presence of gunshot residues on shooter hands.
1.5.6 Volatile sulfure compounds (VSCs)
VSCs such as hydrogen sulphide (H2S), methyl mercaptan (CH3SH) and
dimethyl sulphide (CH3)2S in breath are the main responsible for oral malodor
(Hunter, C.M. et al., 2005). They are produced by various oral bacterial species
that degrade and metabolize sulfur-containing amino acids. This symptom is one
of the most common problems to people in their day to day life and interpersonal
relations. In addition, halitosis can be related to different diseases, as for example,
periodontitis and gingivitis (Amou, T. et al., 2014). According to several studies
reported (Alagirisamy, N. et al., 2010; Bolle, C.M. and Beikler, T., 2012), levels
˂100-200 µL m-3 of VSCs are normal, while levels ˃300-400 µL m-3 would be due to
a persistent oral odor and severe halitosis. These VSCs are considered suitable
biomarkers for breath quality evaluation (Tangerman, A. and Winkel, E.G., 2007).
Thus, the quantitative analysis of sulfide compounds from the breath allows the
evaluation of the efficiency of therapeutic treatment on halitosis (Suarez, F.L. et
al., 2000).
GC is the most commonly used method for the detection of VSCs (Wardencki,
W., 2000) due to its sensitivity and precision. However, GC is expensive and
requires special knowledge for operation. Instead of GC, several portable and easy
to use breath clinics have been proposed including HalimeterTM and Oral

Chapter 1. Introduction
65
ChromaTM (Salako, N.O. and Philip, L., 2011; Tangerman, A. et al., 2008).
Electromechanical sensors based on the absorption of sulfur on semiconductor
metal oxide or condictive polymer producing an electrical signal have been also
proposed (Pandey, S.K et al., 2012). Nevertheless, many electromechanical
sensors present problems of stability to environmental factors. Optical sensors
have advantages in terms of applicability easy-functionality and low-cost, allowing
in situ detection with zero energy cost. Several optical sensors have been
described in the literature for sulphure compounds detection. Bismuth-paper
based sensor has been proposed as colorimetric sensor for testing human bad
breath (Rosolina, S. M. et al., 2016). The detection of H2S in air has been also
carried out by bubbling the air through AgNPs solution and measuring UV-Vis
spectra (Zhang, Z. et al., 2014). In the same way, another work has used colloidal
AgNPs in solution to detect organo-sulfur compounds generated during onion
deterioration (Sachdev, D. et al., 2016). Althouh NPs in solution allow satisfactory
sensitivity, the development of solid sensor is an interesting alternative as in-situ
clinical kit.
In this Thesis, a rapid and portable AgNPs paper-based sensor has been
developed to detect H2S, SH-, S2- at µL m-3 levels as a potential enabler for oral
malodour.

66

67
CHAPTER 2. OBJECTIVES

68

Chapter 2. Objectives
69
During the last years, the need to simplify analytical methodologies has
prompted a thorough review of the fundamental pillars upon which the
conventional analytical techniques have been built. From the revision of the
literature in analytical chemistry, there is a tendency aiming to automate the
pretreatment of the sample in order to reduce the manipulation of sample as well
as the time of analysis. Related to this, miniaturized techniques for carrying out
the extraction, separation and detection are also being sought to decrease the
solvent consumption and waste generation, besides enhancing the sensitivity.
On the other hand, there is also a growing interest in developing sensors for
in-situ determinations, most of them based on image analysis and bearing in mind
the internet. Some of the benefits of these sensors are the simplicity, speed and
on-site analysis without highly trained personnel requirement and in some case
with connectivity. Both trends are associated to the emerge of Green Analytical
Chemistry which highlights the need to develop ecofriendly methodologies. The
development of these sustainable methodologies, which are framed within the
current trends in analytical chemistry, is governed by the use of new
(nano)materials.
Thus, the main aim of this Thesis is to propose new (nano)materials for the
improvement of the existing analytical methods, as well as the development of
new analytical methods and tools with high-throughput in terms of operation and
sustainability. Specifically, this Thesis is focused on the study of (nano)materials
for their application in extraction, separation and detection techniques. These
materials have been classified in three groups, metallic based, Si-based and C-
based materials. Listed below are the three specific objectives in which the Thesis
has been divided based on the applications of the investigated materials.
1. Development of analytical methodologies based on IT-SPME on-line coupled
to CapLC to achieve the features of miniaturization and automatization. To
address this objective, the polymer polydimethylsiloxane, a silicone-based
material, has been evaluated as extractive phase of IT-SPME for its
application in the determination of compounds of environmental, industrial
and forensic interest in different types of matrices, such as (i) DEHP in
sediments, (ii) BAK in industrial formulations and (iii) DPA on shooter hands.
In the same context, PDMS coating functionalized with CNTs (SWCNTs and
MWCNTs), one of the most popular C-based materials, have been evaluated

Chapter 2. Objectives
70
for enhancing the extraction efficiencies in the analysis of AMP-like drugs in
oral fluids. For carrying out these methodologies, the analytical performance
and the application to real samples has been evaluated.
2. Development of analytical tool based on MSPD using the C-based material C18
as dispersant phase for the disruption, preconcentration and derivatization of
amphetamines from hair matrix. This technique has been also used in the
treatment of sediments for the extraction of DEHP. MSPD is considered an
alternative to classical multi-step methods for sample treatment. The
analytical process is considerably simplified; it reduces sample and solvents
consumption and it does not need special instrumentation. Moreover, MSPD
is well-suited for miniaturization. In the context of sample treatment, a novel
chiral Cu(II) 3D MOF based on tripeptide GHG has been evaluated as chiral
phase in SPE for the enantioselective separation of MAMP and EP.
3. Design of colorimetric sensors based on the embedding of derivatizing
reagents into PDMS as solid support for the in-situ analysis of compounds of
interest in industrial (e.g. casein estimation in effluents from dairy industries
and biocide control in industry formulations) and police control fields (e.g.
amphetamine-type and ketamine estimation in illicit street drugs). Another
type of colorimetric sensor based on the immobilization of AgNPs on nylon
membrane has been developed. This nanosized metallic-based material can
be used as clinical kit since it allows the detection of sulfide compounds from
breath, which are responsible of halitosis. Several parameters that affect the
analytical response and stability have been tested, as well as the analytical
performance has been evaluated. In addition, the benefits that offer the DI
analysis have been also tested.
It should be marked that the three objectives of this Thesis have been carried
out taking into account the principles of Analytical Chemistry. The objectives
presented above have become possible thanks to the pre-doctoral scolarships:
FPU13/05220 Ayudas para la formación de profesorado universitario, Spanish
Ministry of Education, Culture and Sports, 4 years.
EST16/00962 Ayudas a la movilidad para estancias breves y traslados
temporales - Programa Estatal de Promoción del Talento y su Empleabilidad,

Chapter 2. Objectives
71
Spanish Ministry of Education, Culture and Sports. Internship in IMS
Laboratoire of University of Bordeaux, 3 months.
In addition, the results of the present Thesis are part of the following
research projects granted to MINTOTA research group of the Analytical Chemistry
Department at the University of Valencia.
CTQ 2011-26760 Project, granted by Spanish Ministry of Economy and
competitiveness - Proyectos de Investigación Fundamental no Orientada,
“Nuevas estrategias de análisis en técnicas cromatográficas miniaturizadas
que incorporan la microextracción en fase sólida en tubo con nuevos
(nano)materiales”, 2011-2014.
PROMETEO 2012/045 Project, granted by Generalitat Valenciana - Programa
Prometeo para grupos de investigación de Excelencia, “Desarrollo de nuevas
estrategias para el diseño de dispositivo de análisis in situ”, 2012-2015.
CTQ2014-53916-P Project, granted by Spanish Ministry of Economy and
competitiveness and EU from FEDER - Programa Estatal de Fomento de la
Investigación Científica y Técnica de Excelencia Subprograma Estatal de
Generación de Conocimiento, “Desarrollo de nuevas estrategias para el
diseño de técnicas de cromatografía líquida miniaturizada en línea:
nanopartículas, contaminación secundaria”, 2015-2017.
OTR2015-15329ASESO, University of Valencia - ITENE Company contract to
study smart inks field, “Estudios de viraje de distintas etiquetas frente a dos
variables, el tiempo y la concentración de H2S”.
PROMETEO 2016/109 Project, granted by Generalitat Valenciana - Programa
Prometeo para grupos de investigación de Excelencia, “Desarrollo de nuevas
estrategias para el diseño de dispositivos de análisis in situ: nano y
biomateriales”, 2016-2019.
Thanks to both scholarship and projects, ten scientific papers (one of them
submitted), one book chapter and one patent have been resulted from this PhD
Thesis. The corresponding impact factors from the Journal of Citation Reports are
shown in each paper.
I. M. Muñoz-Ortuño, A. Argente-García, Y. Moliner-Martínez, J. Verdú-Andrés,
R. Herráez-Hernández, M.T. Picher, P. Campíns-Falcó, A cost-effective method

Chapter 2. Objectives
72
for estimating di (2-ethylhexyl) phthalate in sediments, Journal of
Chromatography A. 1324 (2014) 57-62. Impact factor (JCR 2018): 3.981.
II. M. Muñoz-Ortuño, A. Argente-García, Y. Moliner-Martínez, C. Molins-Legua,
P. Campíns-Falcó, Polydimethylsiloxane composites containing 1,2-
naphtoquinone 4-sulphonate as unique dispositive for estimation of
casein in effluents from dairy industries, Analytica Chimica Acta. 873 (2015)
31-37. Impact factor (JCR 2018): 4.950.
III. A. Argente-García, M. Muñoz-Ortuño, C. Molins-Legua, Y. Moliner-Martínez,
P. Campíns-Falcó, A solid device based on doped hybrid composites for
controlling the cdosage of the biocide N-(3-aminopropyl)-N-dodecyl-1,3-
propanediamine in industrial formulations, Talanta. 147 (2016) 147-154.
Impact factor (JCR 2018): 4.162.
IV. M.C. Prieto-Blanco, A. Argente-García, P. Campíns-Falcó, A capillary liquid
chromatography method for benzalkonium chloride determination as a
component or contaminant in mixtures of biocides, Journal of
Chromatography A, 1431 (2016) 176-183. Impact factor (JCR 2018): 3.981.
V. A. Argente-García, Y. Moliner-Martínez, E. López-García, P. Campíns-Falcó, R.
Herráez-Hernández, Application of Carbon Nanotubes Modified Coatings for
the Determination of Amphetamines by In-Tube Solid-Phase Microextraction
and Capillary Liquid Chromatography, Chromatography, 3 (2016) 7-21.
VI. A. Argente-García, Y. Moliner-Martínez, P. Campíns-Falcó, J. Verdú-Andrés, R.
Herráez-Hernández, Determination of amphetamines in hair by integrating
sample disruption, clean-up and solid phase derivatization, Journal of
Chromatography A. 1447 (2016) 47-56. Impact factor (JCR 2018): 3.981.
VII. A. Argente-García, N. Jornet-Martínez, C. Molins-Legua, Y. Moliner-Martinez,
P. Campíns-Falcó, A solid colorimetric sensor for the analysis of
amphetamine-like street samples, Analytica Chimica Acta. 943 (2016) 123-
130. Impact factor (JCR 2018): 4.950.
VIII. J. Navarro-Sánchez, A. Argente-García, Y. Moliner-Martínez, D. Roca-Sanjuán,
Dmytro Antypov, P. Campíns-Falcó, Matthew J. Rosseinsky, C. Martí-
Gastaldo, Peptide Metal−Organic Framework for Enantioselective Separation
Chapter 2. Objectives
73
of Chiral Drugs, Journal of the American Chemical Society. 139 (2017) 4292-
4297. Impact factor (JCR 2018): 13.858.
IX. A. Argente-García, N. Jornet-Martínez, R. Herráez-Hernández, P. Campíns-
Falcó, A passive solid sensor for in-situ colorimetric estimation of the presence
of ketamine in illicit drug samples, Sensors and Actuators B. 253 (2017) 1137-
1144. Impact factor (JCR 2018): 5.401.
X. A. Argente-García, L. Hakobyan, C. Guillem, P. Campíns-Falcó, A new method
for estimating diphenylamine in gunshot residues as a new tool for identifying
both, inorganic and organic ones, in the same sample. Submitted
XI. Y. Moliner-Martínez, A. Argente-García, R. Herráez-Hernández, J. Verdú-
Andrés, C. Molins-Legua, P. Campins-Falcó, Environmental Applications of
Instrumental Chemical Analysis, Determination of organic pollutants in
environmental samples, Part II, Chapter 14, Mahmood Barbuooti. Apple
Academic Press. CRCpress, a Taylor & Francis Group, 471-532, 2015, ISBN
9781771880619.
XII. A. Argente-García, N. Jornet-Martínez, C. Molins-Legua, Y. Moliner-Martínez,
J. Verdú-Andrés, R. Herráez-Hernández, P.Campins-Falcó, Sensor
colorimétrico basado en nanopartículas de plata para la determinación de
compuestos volátiles de sulfuro, Patent 201600440, Presentation data:
24/05/2016.
Below are listed the International and National Conferences where several
works carried out during the Thesis have been presented.
I. A. Argente-García, Y. Moliner-Martínez, M. Muñoz-Otruño, J. Verdú-
Andrés, R. Herráez-Hernández y P. Campíns-Falcó, Capillary liquid
chromatography coupled to in-tube solid-phase microextraction for
estimating Di(-ethylhexyl) phthalate in different matrices, Poster, 3rd SCARCE
International Conference: Bridging toxicants, stressors and risk-based
management under water scarcity, Valencia (Spain), 2012.
II. N. Jornet-Martínez, M. Muñoz-Ortuño, Y. Moliner-Martínez, R. Herráez-
Hernández, A. Argente-García, P. Campíns-Falcó, Cost effective
methodology as analytics tools for DEHP and their degradation products in

Chapter 2. Objectives
74
waters, Poster, 4th Scarce. Towards a better understanding of the links
between stressors, hazard assessment and ecosystem services under water
scarcity, Cádiz (Spain), 2013.
III. M. Muñoz-Ortuño, A. Argente-García, R. Herráez-Hernández, Y. Moliner-
Martínez, C. Molins-Legua, J. Verdú-Andres, P. Campins-Falcó, NQS based
optical sensor for on site real time determination of casein in affluents from
dairy industries, Poster, Extech2014. 16th International symposium on
advances in extraction technologies, Creta (Greece), 2014.
IV. Y. Moliner-Martinez, A. Argente-García, M. Muñoz-Ortuño, R. Herráez-
Hernández, J. Verdú-Andrés, C. Molins-Legua and P. Campíns-Falcó,
Development of an in-situ sensor for estimating biocice amine (Bis(3-
aminopropyl) dodecylamine) in detergents for food industry, Poster,
Extech2014. 16th International symposium on advances in extraction
technologies, Creta (Greece), 2014.
V. Y. Moliner-Martinez, A. Argente-García, M. Muñoz-Ortuño, P. Serra-Mora
and P. Campíns-Falcó, A new approach for in-tube solid-phase
microextraction-nano-LC coupling: evaluation of carbon nanotubes based
adsorbent phases for environmental analysis, Poster, 30th International
Syposium on Chromatography, Salzburg (Austria), 2014.
VI. A. Argente-García, S. Aparicio-Antón, Y. Moliner-Martinez, C. Molins-Legua,
J. Verdú-Andrés and P. Campíns-Falcó, Determination of Irgarol in coastal
waters of the Region of Valencia by in-tube solid phase microextraction
coupled to capillary liquid chromatography, Assistance and poster, Final
SCARCE International Conference. River Conservation under Water Scarcity,
Tarragona (Spain), 2014.
VII. A. Argente-García, M.C. Prieto-Blanco, M. Muñoz-Ortuño, M. Hurtado-
Jiménez, Y. Moliner-Martínez y P. Campíns-Falcó, Analysis of benzalkonium
chloride in biocidal formulation producing matrix effect by using in-tube
solid-phase microextraction, Assistance and poster, HPLC2015. 42nd
International Symposium on high performence liquid-phase separations and
related techniques, Geneva (Switzerland), 2015.
VIII. A. Argente-García, N. Jornet-Martínez, B. Marí-Boluda, R. Herráez-
Hernández, C. Guillem-Villar y P. Campíns-Falcó, Determination of

Chapter 2. Objectives
75
diphenylamine deposited onto shooter hands by using in-tube solid-phase
microextraction coupled to capillary liquid chromatography, Assistance and
poster, HPLC2015. 42nd International Symposium on high performence
liquid-phase separations and related techniques, Geneva (Switzerland),
2015.
IX. C. Molins-Legua, Y. Moliner-Martínez, N. Jornet-Martínez, A. Argente-
García, J. Pla-Tolos, P. Campins-Falcó, NQS doped PDMS composite as an
alternative environmental observation technology: application to estimate
NH3 emissions from animal production industries, Poster, XXSEQA 2016,
Santiago de Compostela (Spain), 2015.
X. A. Argente-García, N. Jornet-Martínez, Y. Moliner-Martínez, R. Herráez-
Hernández, y P. Campíns-Falcó, Colorimetric kit based on SiO2 Nanoparticles
modified PDMS-TEOS composite for on-site screening of illicit drugs,
Assistance and poster, Workshop NYNA2015. Nanocience and analytical
nanotechnology, Salamanca (Spain), 2015.
XI. P. Campíns-Falcó, Y. Moliner-Martínez, C. Molins-Legua, R.Herráez-
Hernández, P. Serra-Mora, A. Argente-García, New strategies for designing
on-line miniaturized liquid chromatography techniques by coupling in-tube
solid phase microextraction, Oral communication, Extech & ISSS: 18th
International symposium on advances in extraction technologies and 22nd
international symposium on separation sciences, Torun (Polonia), 2016.
XII. A. Argente-García, N. Jornet-Martínez, J. Pla-Tolos, C. Molins-Legua and P.
Campíns-Falcó, Sensitive colorimetric sensor based on silver nanoparticles
for sulphur compound detection in water, Assistance and poster, NET-
SCARCE International Conference, Rivers Under Water Scarcity, Threats and
Challenges, Barcelona (Spain), 2016.
XIII. Y. Moliner-Martinez, A. Argente-Garcia, J. Pla-Tolos, P. Serra-Mora, L.
Hakobyan and P. Campins-Falcó, Evaluation of in-tube solid phase
microextraction coupled to capillary LC with mass spectrometry for the
estimation of irgarol-1051 and its polar transformation products in water
samples, Assistance and poster, NET-SCARCE International Conference,
Rivers Under Water Scarcity, Barcelona (Spain), 2016.

Chapter 2. Objectives
76
XIV. A. Argente-García, L. Hakobyan, Y. Moliner-Martínez and P. Campíns-Falcó,
Optimization of sampling and treatment of forensic samples for fast and
sensitive estimation of diphenylamine using on-line in-tube solid phase
microextraction coupled to capillary liquid chromatography, Assistance and
poster, 2nd Caparica Christmas Conference on Sample Treatment, Caparica
(Portugal), 2016.
XV. A. Argente-García, Y. Moliner-Martínez, P. Campíns-Falcó, J. Verdú-Andrés,
R. Herráez-Hernández, Matrix solid phase dispersion integrating sample
disruption, clean-up and solid phase derivatization for amphetamine
analysis in hair, Assistance and poster, ExTech2017, 19th International
Symposium on Advances in Extraction Technologies, Spain (Santiago de
Compostela), 2017.
XVI. C. Molins-Legua, N. Jornet-Martínez, A. Argente-García, Y. Moliner-
Martínez, J. Verdú,-Andrés, R. Herráez-Hernámdez, P. Campíns-Falcó,
Immobilization of nobel nanoparticles on solid supports: application to
detection of sulphur compouns, Oral communication, ExTech2017,
19th International Symposium on Advances in Extraction Technologies,
Spain (Santiago de Compostela), 2017.
XVII. A. Argente-García, N. Jornet-Martínez, R. Herráez-Hhernández, P. Campins-
Falcó, A colorimetric sensor for the on-site detection and quantification of
ketamine in illicit drug samples, Poster, XXI SEQA, Spain (Valencia), 2017.
XVIII. Y. Moliner-Martínez, J. Navarro-Sanchez, A. Argente-García, D. Roca-
Sanjuan, D. Antypov, P. Campins-Falcó, M. J. Rosseinsky, C. Martí-Gastaldo,
Peptide Metal-Organic frameworks as chiral solid-phase extraction sorbents
for enantioselective separations of chiral drugs, Oral presentation, ISSS
2017 23rd International Symposium on Separation Sciences, Austria
(Vienna), 2017.
XIX. J. Navarro-Sanchez, A. Argente-García, Y. Moliner-Martínez, D. Roca-
Sanjuan, D. Antypov, P. Campins-Falcó, M. J. Rosseinsky, C. Martí-Gastaldo,
Peptide Metal-Organic for enantioselective separations of chiral drugs,
Poster, International Symposium on composites of metal and covalent
organic frameworks: fundamental designs and applications, Granada
(Spain), 2017.

77
CHAPTER 3. METHODOLOGY

78

Chapter 3. Methodology
79
3.1 CHEMICALS AND REAGENTS
The chemicals and reagents (analytical grade) employed in this Thesis are
summarized in Table 12. Commercial suppliers and GHS (Globally Harmonized
System of classification and labeling of chemicals) hazard pictograms are also
included. The pictograms classify the chemical products by the standardized
symbols according to European Union.
Table 12. Summary of reagents and chemicals used in this Thesis, with their suppliers and
GHS pictograms, where = Flammable (GHS02); = Corrosive (GHS05); = Toxic
(GHS06); =Harmful (GHS07); =Health hazard (GHS08); = Environmental hazard
(GHS09).
Chemical/Reagent Supplier
Acetone Merck X X
Acetonitrile Romil X X
Acetylsalicylic acid Sigma
3-Aminopropyltriethoxysilane Aldrich X X X
Amphetamine sulfate Aldrich X X
Ammonium acetate Panreac X
Arginine Sigma-Aldrich X
Bicinchoninic acid disodium salt hydrate
Sigma-Aldrich X
Bismuth (III) oxide Alfa Aesar X
Bondesil C18 (40, 50 µm) Varian/ Phenomenex
Caffeine Guinama X X X
Cannabinol Sigma-Aldrich X
Cannabidiol Sigma-Aldrich X X X
Cocaine hydrochloride Sigma-Aldrich X X X
Cobalt (II) thiocyanate Sigma-Aldrich X X
Copper (II) acetate Sigma-Aldrich X X X X
Copper (II) oxide Sigma-Aldrich X X
Copper (II) sulfate pentahydrate
Merck X
1, 3-Dicyclohexylcarbodiimide Sigma-Aldrich X X X
Di (2-etylhexyl) phtalate Aldrich X
Dimethylformamide Scharlau X X X
Dimethyl sulphide Sigma-Aldrich X X X X
Diphenylamine Sigma-Aldrich X X X
Ephedrine hydrochloride Sigma-Aldrich X X
Ethanol Scharlau X

Chapter 3. Methodology
80
Florisil Aldrich X
9-Fluorenylmethyl chloroformate
Sigma X X
Glacial acetic acid Merck X X X X
Glycerol Sigma X
Glucose anhydrous Scharlau
Glutaraldehyde Sigma-Aldrich X X X X
Gold nanoparticlesa Sigma-Aldrich
Hydrochloric acid Scharlau X X
Ibuprofen Sigma-Aldrih X X X
Levamisole hydrochloride Fluka X
Leucine Sigma-Aldrich
Lithium carbonate Alfa Aesar X X
Lysine Sigma-Aldrich
Magnesium sulfate Probus X
Maltose-1-hydrate Panreac
Mannitol Scharlau
Methanol Scharlau X X X
Methamphetamine hydrochloride
Sigma-Aldrich
3,4-Methylenedioxyamphetamine
Sigma-Aldrich X X
3,4- Methylenedioxymetamphetamine
Sigma-Aldrich X X
Methyl mercaptan Sigma-Aldrich X X X X
Multiwall carbon nanotubes Sigma-Aldrich X
N-Benzyl-N-dodecyl-N,N-dimethylammonium chloride
Sigma-Aldrich X X X
N-benzyl-N-tetradecyl-N,N-dimethylammonium chloride
Sigma-Aldrich X X X
Nitric Acid Panreac X
n-Hexane Scharlau X X X X
Paracetamol Guinama X
Polydimethylsiloxane Sylgard®184 Kit
Dow corning
Phosphoric acid Sigma-Aldrich X X X X
Potassium sodium tartrate tetrahydrate
Scharlau X
Procaine hydrochloride Sigma-Aldrich X X
Proline Sigma-Aldrich X
PZT Ferroperm Piezoceramics Meggit
X X X
Saccharose Guinama
Silica gel (70-230 mesh) Aldrich
Silicon dioxide nanoparticles Sigma-Aldrich X
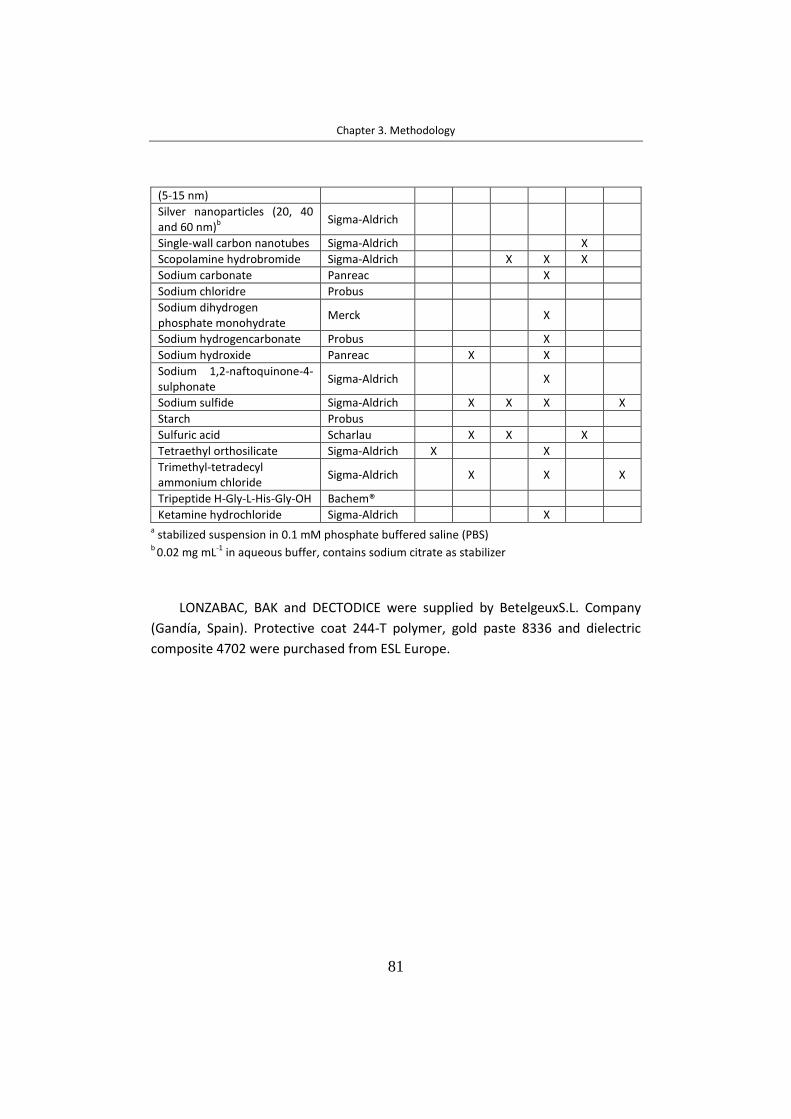
Chapter 3. Methodology
81
(5-15 nm)
Silver nanoparticles (20, 40 and 60 nm)b Sigma-Aldrich
Single-wall carbon nanotubes Sigma-Aldrich X
Scopolamine hydrobromide Sigma-Aldrich X X X
Sodium carbonate Panreac X
Sodium chloridre Probus
Sodium dihydrogen phosphate monohydrate
Merck X
Sodium hydrogencarbonate Probus X
Sodium hydroxide Panreac X X
Sodium 1,2-naftoquinone-4-sulphonate
Sigma-Aldrich X
Sodium sulfide Sigma-Aldrich X X X X
Starch Probus
Sulfuric acid Scharlau X X X
Tetraethyl orthosilicate Sigma-Aldrich X X
Trimethyl-tetradecyl ammonium chloride
Sigma-Aldrich X X X
Tripeptide H-Gly-L-His-Gly-OH Bachem®
Ketamine hydrochloride Sigma-Aldrich X
a stabilized suspension in 0.1 mM phosphate buffered saline (PBS) b 0.02 mg mL-1 in aqueous buffer, contains sodium citrate as stabilizer
LONZABAC, BAK and DECTODICE were supplied by BetelgeuxS.L. Company
(Gandía, Spain). Protective coat 244-T polymer, gold paste 8336 and dielectric
composite 4702 were purchased from ESL Europe.

Chapter 3. Methodology
82
3.2 INSTRUMENTATION
The development of the experimental procedure of this Thesis has been
carried out by using several instruments and materials:
Ultrasonic bath Sonitech (TerraTech, Spain)
Magnetic stirrer (450 W) (Sstuart Scientific)
Crison micropH 2000 pH-meter (Crison Instruments, Spain)
Nanopure II water system (Barnstead, UK)
ZX3 vortex mixer (VELP Scientifica, Italy)
Thermostat LT200 (Hagh Lange United for water quality, Sapin)
Nylon membranes (0.45 and 0.22 μm) (Teknokroma, Spain)
Polypropylene SPE tube (3 mL) (Supelco, USA)
Polyethylene frits (20 μm porosity) (Supelco, USA)
Double-sided carbon adhesive tape (8 mm wide x 0.16 mm thick x 1 cm long) (Ted Pella Inc. Redding, US)
Tape lift kit (Sirchie Finger Print Laboratories, USA)
Plastic well-plates (Sharlau, Spain)
Ricoh Aficio MP2550 PCL6 multifunctional printer
Nikon CoolPix S2600 digital camera (14 megapixels and 5xwide optical zoom)
Bond Elut C18 100 mg cartridges (Varian,USA)
The analytical techniques used along this Thesis can be classified into three
groups: spectroscopic, chromatographic and microscopic. The sample
pretreatment techniques and sensor fabrication will be explained separately.
3.2.1 Spectroscopic techniques
3.2.1.1 UV-Vis spectrophotometry
Spectrophotometric measurements were carried out using a Cary 60 Fiber
Optic UV-Vis sectrophotometer (Agient Tecnologies, USA). This
spectrophotometer is fitted with a remote fiber optic DR accessory from Harrick
Scientific Products (Pleasantville, NY) for DR measurements of solid sensors. Data
were recorded and processed using a Cary WinUV software (Agilent Technologies

Chapter 3. Methodology
83
Products, Australia). The spectral range measured was from 200-1000 nm (Figure
28).
Figure 28. A) Cary 60 Fiber Optic UV-Vis spectrophotometer and B) Remote fiber optic DR
accessory.
3.2.1.2 Infrared spectroscopy
Fourier-transform infrared-attenuated total reflectance (FTIR-ATR)
measurements were performed on an Agilent Cary 630 FTIR spectrophotometer
fitted with a diamond ATR accessory (Agilent Technologies, Böblingen, Germany).
Spectra were recorded in the frequency range of 4000-600 cm-1 at a resolution of
4 cm-1. A background scan was made against the air, and 8 scans were averaged
for each measurement. For data collection and processing, MicroLab FTIR and
ResolutionPro software (Agilent Technologies) were used, respectively (Figure 29).
FTIR Nicolet 5700 spectrometer in the 4000-400 cm-1 range from ground crystals
diluted in a KBr pellet was used for the Cu(GHG) characterization.
A) B)

Chapter 3. Methodology
84
Figure 29. Cary 630 FTIR-ATR spectrophotometer.
3.2.1.3 RAMAN spectroscopy
Raman measurements for AgNPs sensors characterization were done using
Raman spectrometer Horiba-MTB (a Perkin Elmer Raman Station 400). For the
laser at 785 nm, 50% of its power was applied with acquisition time of 60 s and 2
accumulations, objective x10 and grating 600 g mm-1 (Figure 30).
Figure 30. Horiba-MTB RAMAN spectrophotometer.

Chapter 3. Methodology
85
3.2.1.4 Electromechanical Impedance spectroscopy
Electromechanical characterization of screen-printed MEMS was carried out
with the impedance analyzer (Agilent E5061B) of Figure 31, in the range from 5 Hz
to 3 GHz. The planar and the first 31-longitudinal vibration mode were measured
for the disks and cantilevers, respectively. During the humidity test, the
conductance of the first 31-longitudinal mode was monitorized.
Figure 31. Impedancemeter HP4194A.
Table 13 summarizes the spectrometric techniques and experimental details
used for the several purposes of this Thesis.
Table 13. Spectrometric techniques and experimental details used in the present Thesis.
Technique Experimental details
Purpose Section
UV-Vis reflectance
200-1000 nm range Quantification of casein, ADP, amphetamine-type drugs and ketamine by PDMS-based sensor
4.1.2.1 4.1.2.2 4.1.2.3 4.1.2.4
Quantification of VSCs by AgNPs-based nylon sensor
4.3.2.1
UV-Vis absorbance
200-1000 nm range BCA assay
4.1.2.1
C18 solid support derivatization as validating method for ADP detection
4.1.2.2
Study of NQS stability in solution.
4.1.2.2
Chapter 3. Methodology
86
UV-Vis absorbance
300-800 nm Colorimetric detection of sulphur compounds in solution by AgNPs.
4.3.2.1
FTIR 4000-600 cm-1
(ATR) Sediment and illicit drug samples characterization
4.1.1.1 4.1.2.3
4000-400 cm-1
Cu(GHG) characterization 4.3.1.1
RAMAN 785 nm laser; 60 s acquisition time; 2 accumulations, x10;600 g/mm
AgNPs-sensor characterization
4.3.2.1
Impedance 5 Hz to 3 GHz MEMS characterization and humidity test.
4.1.4.1
3.2.2 Chromatographic techniques
HPLC and CapLC have been used. The miniaturized system was coupled to IT-
SPME in order to extract and pre-concentrate the analytes before their separation
and detection. The detectors employed were a FLD for both systems and a DAD
for the CapLC.
3.2.2.1 HPLC–FLD
HPLC-FLD was employed in two methods to determine amphetamine
compounds. For one hand, drug chiral separation was carried out by a
chromatographic system consisted of a quaternary pump (Jasco, PU-2089 Plus,
Tokyo, Japan), a six port injection valve equipped with a 20 µL stainless steal
sample injector loop (Rheodyne 7725), and a FLD (Jasco FP-2020 Plus, Tokyo,
Japan). The detector was coupled to a data system (Jasco ChromNAV
Chromatography Data System, Jasco Corparation, Tokyo, Japan) for data
acquisition and calculation (Figure 32A). On the other hand, HPLC-FLD was used to
validate the results obtained for estimating amphetamine compounds by PDMS-
based sensor (See Section 4.1.2.3). In this case, the chromatographic system
consisted of a quaternary pump (Hewlett-Packard 1050 Series, Palo Alto, CA,
USA), a high-pressuresix-port injection valve (Rheodyne Model 7000) and a FLD
(Hewlett-Packard, 1046Series). The detector was linked to a datasystem (Hewlett-
Packard, HPLC ChemStation) for data acquisition and calculation (Figure 32B). In

Chapter 3. Methodology
87
both cases, the analytical signal was recorded at excitation and emission
wavelengths of 264 nm and 313 nm, respectively.
Figure 32. HPLC-FLD System A) Jasco and B) Hewlett-Packard.
3.2.2.2 CapLC-DAD
Depending on the analytes, two different equipments were employed. For
the analysis of DEHP, the chromatographic system consisted of an isocratic
capillary pump (Jasco Corporation micro 21PU-01, Tokio, Japón), a high‐pressure
six‐port injection valve (7725 Reodyne, Rohnert Park, CA, USA) and UV-Vis DAD
(Agilent, 1200 series, Waldbronn, Alemania) equipped with a 80 nL flow cell
(Figure 33).
A) B)

Chapter 3. Methodology
88
Figure 33. CapLC-DAD system for isocratic mode.
For the study of BAK and DPA, the chromatographic system consisted of a
binary capillary pump (Agilent 1100 series, Waldbronn, Alemania), an on-line
degasser, a high-pressure six-port valve (7725 Reodhyne) and a DAD (Agilent,
1260 Series) equipped with a 80-nL flow cell and linked to a data system (Agilent,
HPLC ChemStation) (Figure 34).
In both systems, the detector was linked to a data system (Agilent, HPLC
ChemStation) for data acquisition and calculation. The analytical signal was
recorded from 190 to 400 nm.
Figure 34. CapLC system with binary capillary pump.

Chapter 3. Methodology
89
3.2.2.3 CapLC–FLD
The comparison of the extractive phase of IT-SPME to estimate
amphetamine-like compounds was carried out by CapLC system. It consisted of an
isocratic capillary pump (Micro 21PU-01, Jasco, Tokyo, Japan), a six‐port injection
valve (7725 Reodyne, Rohnert Park, CA, USA), a LC‐Net II/ADC interface and a FLD
(Micro 21FP‐01, Jasco Corporation, Tokyo, Japan). The detector was coupled to a
data system (Jasco ChromNAV Chromatography Data System, Jasco Corparation,
Tokyo, Japan) for data acquisition and calculation. The analytical signal was
recorded at excitation and emission wavelengths of 285 nm and 320 nm,
respectively (Figure 35).
Figure 35. CapLC-FLD system in isocratic mode.
In Table 14 are summarized the separation and detection techniques used in
this Thesis, as well as their application.

Chapter 3. Methodology
90
Table 14. Summary of the chromatographic techniques used in this Thesis.
Separation technique
Detection technique
Analyte Matrix Section
HPLC FLD AMP, MAMP, EP, MDMA Hair 4.1.3.1 AMP, MAMP, MDA,
MDMA Illicit street drugs 4.1.2.3
CapLC DAD DEHP Sediment and water 4.1.1.1 BAK Biocide mixture 4.1.1.2 DPA Hands 4.1.1.3
(±)-MET, (±)-EP - 4.3.1.1
CapLC FLD AMP, MET, EP Oral fluid 4.2.1 (±)-MET, (±)-EP - 4.3.1.1
3.2.3 Microscopic techniques
3.2.3.1 Light microscopy
Microscopic images were taken with a Nikon microscope ECLIPSE E200LED
MV Series (Nikon Corporation, Tokyo, Japan) under bright-field illumination with
three objective lens (10x, 50x, 100x). For acquiring the images a Nis-Elements
4.20.02 software (Nikon) was used (Figure 36).
Figure 36. Nikon microscope.

Chapter 3. Methodology
91
3.2.3.2 Scanning electronic miscroscopy (SEM)
Two microscopes were employed in this Thesis: HITACHI-S4100 equipment
for the characterization of AgNPs based sensors; and Philips XL30 ESEM with EDAX
system incorporated into the microscope for elemental analysis of GSRs. Both
microscopes operated at 20 kV. Samples were coated with Au/Pd for electron
conduction (Figure 37).
Figure 37. SEM A) Hitachi S-4100 and B) Philips XL 30 ESEM.
3.2.3.3 Surface profiler microscopy
The profile analysis of the microelectromecalical sistems was carried out with
the surface profilometer Veeco Dektak 150 Surface Profiler before firing (Figure
38).
Figure 38. Dektak 150 profilometer.

Chapter 3. Methodology
92
3.3 SAMPLE PRETREATMENT TECHNIQUES
In the present Thesis, off-line and on-line sample pretreatment techniques
have been studied. For the details of optimization, see the Chapter of Results and
discussion.
3.3.1 Off-line sample pretreatment techniques
3.3.1.1 SPE
SPE was employed to evaluate the chiral capacity of Cu(GHG) MOF. For this
aim, a SPE cartridge (polypropylene SPE tube, 1 mL, Supelco, USA) was filled with
50 mg of Cu(GHG) with upper and lower polyethylene frits (20 μm pore size,
Supelco). For enantioselective separation of (±)-EP and (±)-MAMP, a racemic
mixture of enantiomers (200 μg mL-1 of each enantiomer) in 1 mL of
ethanol:hexane (1:4) was passed through the cartridge by gravity (approximately
4 min of contact time). Eluted solution was collected and evaporated to dryness
using nitrogen. Then, the extract was dissolved in 1 mL of water and derivatized
following the procedure described in Section 3.5.3 for chiral identification by HPLC
(See Figure 39).
Figure 39. Scheme of the experimental setup used for SPE enantioseparation.
SPE
cart
rid
ge
(+)EP
(-)EP
Evaporation todryness
Reconstitutedwith 1 mL water
250 µL
DERIVATIZATIONMOF
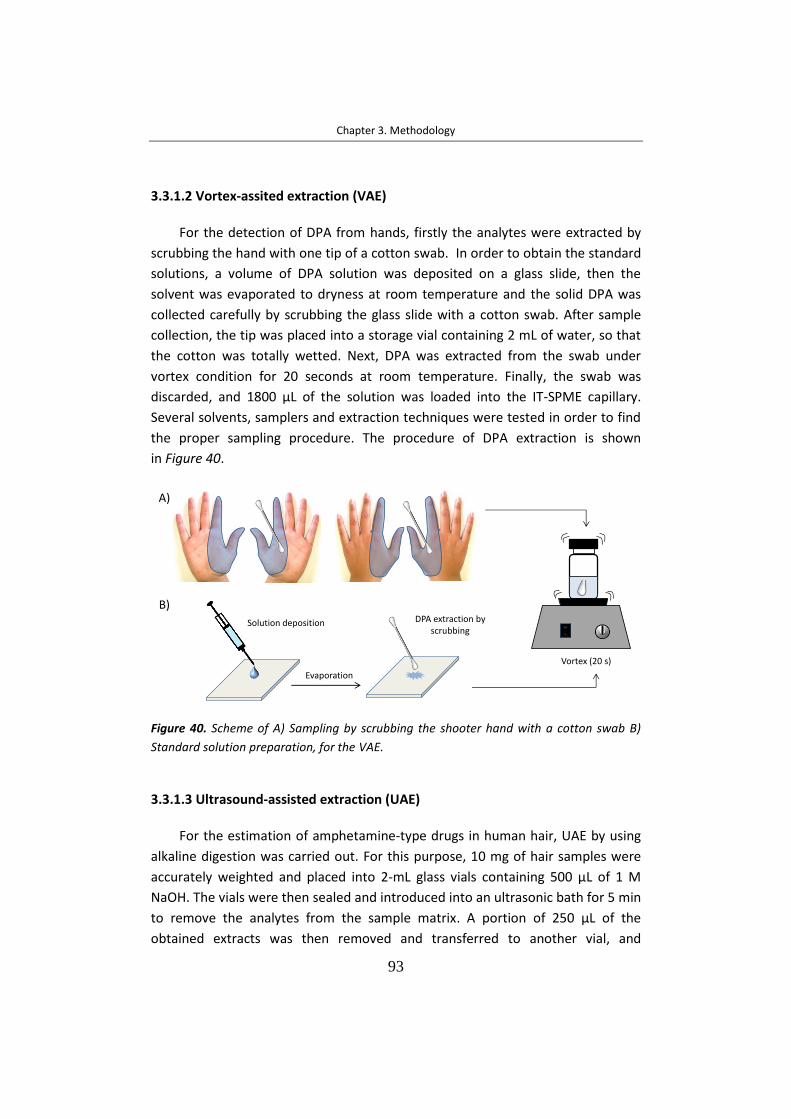
Chapter 3. Methodology
93
3.3.1.2 Vortex-assited extraction (VAE)
For the detection of DPA from hands, firstly the analytes were extracted by
scrubbing the hand with one tip of a cotton swab. In order to obtain the standard
solutions, a volume of DPA solution was deposited on a glass slide, then the
solvent was evaporated to dryness at room temperature and the solid DPA was
collected carefully by scrubbing the glass slide with a cotton swab. After sample
collection, the tip was placed into a storage vial containing 2 mL of water, so that
the cotton was totally wetted. Next, DPA was extracted from the swab under
vortex condition for 20 seconds at room temperature. Finally, the swab was
discarded, and 1800 µL of the solution was loaded into the IT-SPME capillary.
Several solvents, samplers and extraction techniques were tested in order to find
the proper sampling procedure. The procedure of DPA extraction is shown
in Figure 40.
Figure 40. Scheme of A) Sampling by scrubbing the shooter hand with a cotton swab B)
Standard solution preparation, for the VAE.
3.3.1.3 Ultrasound-assisted extraction (UAE)
For the estimation of amphetamine-type drugs in human hair, UAE by using
alkaline digestion was carried out. For this purpose, 10 mg of hair samples were
accurately weighted and placed into 2-mL glass vials containing 500 µL of 1 M
NaOH. The vials were then sealed and introduced into an ultrasonic bath for 5 min
to remove the analytes from the sample matrix. A portion of 250 µL of the
obtained extracts was then removed and transferred to another vial, and
Vortex (20 s)
A)
Evaporation
DPA extraction byscrubbing
Solution deposition
B)

Chapter 3. Methodology
94
neutralized by adding 250 µL of 1 M HCl. The neutralized extracts were then
derivatized with FMOC (See Section 3.5.3 for details), so neutralization was
necessary because FMOC is not stable under highly basic pHs.
3.3.1.4 MSPD
This technique was carried out for the estimation of DEHP in sediments and
the determination of amphetamine compounds in hair samples (See 4.1.1.1 and
4.1.3.1 Sections). For this aim, accurately weighted sample (0.1 - 0.3 g of sediment
and 0.025 g of hair) was placed in a glass mortar and blended with 0.4 g of C18 by a
pestle for 5 min (other dispersants such as silica and florisil were also tested). The
resulting blend was then transferred to a polypropylene SPE tube (3 mL) with a
polyethylene frit (20 µm) (Supelco, USA) placed at the bottom. Another frit was
then placed at the top of the tube with the aid of a syringe plunger. Next, the
analytes were desorbed with acetonitrile (1.2 and 1.5 mL for sediments and hair,
respectively) by applying positive pressure and collected into glass vial.
For the DEHP estimation, the desorbed analytes were diluted with 2.6 mL of
Milli-Q water and finally, the extract obtained (3 mL) was processed in the
chromatographic system. C18 phase used for MSPD of sediments was previously
cleaned by UAE. For this purpose, portions of 2.5 g of the C18 were placed into a
pre-fritted glass SPE tube (6 mL) with polyethylene frits (20 µm). The tube was
rinsed with 3 mL of acetonitrile. Once the solvent reached the exit by gravity, the
tube was plugged with a PVC cap and introduced into an ultrasonic bath until the
level of water in the bath was above the extraction solvent level inside the tube.
Next, sonication was applied for 5 min. Then, the tube was removed from the
bath, PVC cap was removed, and acetonitrile was flushed out by vacuum. The
ultrasonic extraction process was repeated with 3 mL of 0.01 M NaOH prepared in
water, 3 mL of 0.01 M phosphate buffer of pH 7.0, and 3 mL of water. Finally, the
sorbent was dried with air.
In the case of drug estimation, before the desorption step, 2 mL of carbonate
buffer was flushed through the tube by applying positive pressure in order to
remove unwanted compounds, and then the blend was dried by passing air.
Previously to the MSPD, hair samples were treated (See Section 3.6.2.2). Different
MSPD/derivatization methods were tested: MSPD/solution derivatization and

Chapter 3. Methodology
95
Integrated MSPD/solid support derivatization. Figure 41 depicts the scheme of
several MSPD procedures developed in this Thesis.
Figure 41. Scheme of A) MSPD for DEHP determination in sediments, B) MSPD/solution
derivatization (b.1) and Integrated MSPD/solid support derivatization (b.2) for
amphetamines estimation in hair.
C18 (0.4 g) + sample (0.1-0.3 g)(5 min)
Desorption withCH3CN (1.2 mL)
SPE tubeDilution with
water (2.6 mL)
A)
C18 (0.4 g)+ sample (0.025 g)(5 min)
Carbonate buffer (2 mL)
cleaning
SPE tube
Drying
B)
Desorption withCH3CN (1.5 mL)
Solid support derivatizationDerivatization-desorption
with FMOC (1.5 mL)
Solution derivatization(125 µL FMOC + 125 µL
buffer carbonate)
LC
LC
LC
250 µL
b.1
b.2

Chapter 3. Methodology
96
3.3.2 On-line extraction techniques
3.3.2.1 In-valve IT-SPME
For in-valve IT-SPME procedure, the stainless steel loop of the conventional
six port injection valve was replaced by a segment of open tubular capillary
columns of GC. Several PDMS-based extractive phases with different dimensions
were used depending on the analytes. The capillary columns were connected to
the valve by using 2.5 cm sleeves of 1/16 in. PEEK tubing and 1/16 in PEEK nuts
and ferrules. Aliquots of the solutions (samples and/or working solutions) were
manually procesed into the extractive capillary, in load valve position, by means of
a 100-1000 µL precision syringes. Finally, the valve was manually rotated to the
injection position, so the analytes were desorbed from the extractive capillary
coating with the mobile-phase and transferred to the analytical column for their
separation and detection. In-valve IT-SPME integrates the on-line cleaning,
extraction and preconcentration of the analytes from the matrix in one single
step. Figure 42 shows the schematic diagram of in-valve IT-SPME coupled to
CapLC or HPLC-FLD system with the valve positions.
Figure 42. In-valve IT-SPME-LC with six port valve A) In load position B) In inject position.
Capillary column
Waste
DetectorPump
Capillary column
Waste
DetectorPump
Analytical Column
Analytical Column
A)
B)
LOAD POSITION
INJECT POSITION

Chapter 3. Methodology
97
3.4 FABRICATION OF SENSORS
3.4.1 PDMS/TEOS/SiO2NPs-NQS sensors (Patent 201300436)
Different sensing devices have been studied. Table 15 summarizes the
sensores developed. The sensors highlighted in blue were the optimum sensors
used in each work of this Thesis.
Table 15. Composition, size and curing time of the developed sensors. Optimum sensor
highlighted in blue.
PDMS:TEOS*
weight ratio Ethanol (%, w/w)
NQS (%, w/w)
SiO2NPs (%, w/w)
Size (diameter; thickness, mm)
Cure time (hours)
Section
50:50 - 0.05 0.1 15; 1 8
4.1.2.1
50:50 - 0.1 0.1 15; 1 8 50:50 - 0.2 0.1 15; 1 8 50:50 - 0.2 1 15; 1 8 50:50 - 0.2 - 15; 1 - 40:60 - 0.2 0.1 15; 1 ˃8
70:30 - 0.1 0.1 3; 1 ˂8
4.1.2.2
50:50 - 0.1 - 3; 1 - 50:50 - 0.1 0.1 3; 1 8 50:50 - 0.1 1 3; 1 8 50:50 - 0.05 0.1 3; 1 8 50:50 - 0.2 0.1 3; 1 8 40:60 - 0.1 0.1 3; 1 ˃8
100:0 3.6 0.1 0.1 2; 1 (square)
4
4.1.2.3 50:50 - 0.1 0.1 8; 1 8 50:50 - 0.1 0.1 3; 1 8 40:60 - 0.1 0.1 3; 1 ˃ 8
*Large amounts of TEOS (˃80%) were also tested but resulted in difficult gelation process.
PDMS-based sensors were prepared by the following procedure; the NQS
reagent was dissolved in ethanol under ultrasonic condition, and this solution was
added to the PDMS base. The mixture was stirred vigorously at room temperature
for 15 min to get homogeneous dispersion. Then, PDMS curing agent was added
at a weight ratio of 1:10 to the PDMS base, and stirred for 15 min at room

Chapter 3. Methodology
98
temperature. Finally, amounts of the resulting mixture were deposited on plastic
molds and cured at room temperature for 2 days.
PDMS/TEOS-based sensors were prepared following a similar procedure, but
the NQS and SiO2-NPs were dispersed in TEOS (instead of ethanol) under
ultrasonic condition for 10 min. The resulting dispersion was added to the PDMS
base under vigorous magnetic stirring for 15 min at room temperature to get
homogeneous dispersion. Then PDMS curing agent was added with a weight ratio
of 1:10 to PDMS base and was stirred for 15 min at room temperature. Finally, the
mixture was poured on molds, and then cured at 30 ºC for days or hours,
depending on its composition (Table 15). All the sensors were stored dry in
polyethylene bags at room temperature until use. Figure 43 shows the procedure
of the PDMS/TEOS/SiO2NPs-NQS sensors fabrication.
Figure 43. Procedure of PDMS/TEOS/SiO2NPs-NQS sensors fabrication.
3.4.2 PDMS-Co(SCN)2 sensors
According to previous studies, the best approach to prepare PDMS-based
sensors is to mix a solution of the reagent in an organic solvent such as acetone or
methanol with the PDMS base andthe curing agent. However, all attempts made
in preliminary experiments with solutions of Co(SCN)2 failed because no
gelification was observed even after several days of curing. For this reason, in the
present study the bulk solid reagent was directly embedded into the polymer. The
PDMS base
Ultrasonic bath for 10 min
Add PDMS Curing
2 hat 30 :C
Sensor readyto use
TEOS + NQS + SiO2NPs
1 23
Add mixture to PDMS base
Mixture magnetic- stirred 15 min
45
Magnetic-Stir 15 min
6
7
Pour on mold

Chapter 3. Methodology
99
reagent was previously ground in a glassmortar in order to obtain suitable
homogeneity. PDMS-based sensors were prepared by mixing the appropriate
amounts of Co(SCN)2, PDMS base and curing agent. After curing, the sensors were
removed from the plates (6 mm of diameter) and stored in polyethylene bags at
ambient temperature until use (Figure 44).
Figure 44. Procedure of PDMS-Co(SCN)2 sensors fabrication.
As the PDMS is a hydrophobic material, the addition of TEOS to facilitate the
diffusion of the analyte molecules from the solution to the sensors was also
tested. PDMS-TEOS sensors were prepared by dispersing the solid Co(SCN)2
reagent in the appropriate amount of TEOS under ultrasonic conditions for 10
min; then, the resulting dispersion was added to the PDMS base-curing agent
mixture. In all cases the resulting reagent/polymerization mixtures were
vigorously stirred for 15 min. Finally, this mixture was placed in well polystyrene
plates and cured at 35 ◦C inside an oven for 8 hours. Different sensor compositions
were assayed (see Table 16). The sensors highlighted in blue are the optimum
sensors used.
Table 16. Compositions of the different PDMS- Co(SCN)2 tested sensors.
Co(SCN)2 (%, w/w) PDMS (%, w/w)
(base + curing agent)a TEOS (%, w/w)
0.1 99.9 -
0.3 99.7 -
0.6 99.4 -
0.9 99.1 -
0.3 91.4 8.3
0.3 49.85 49.85 a For a 10:1 base:curing agent ratio
Cure, 30 :C
Sensor to use
PDMS (base and curing) + Co(SCN)2
1 2 3
Magnetic- stirring 15 min
Pour on molds

Chapter 3. Methodology
100
3.4.3 AgNPs-based sensors (Patent 201600440)
A nylon membrane (0.45 µm) was placed into a filter holder which is coupled
to a syringe. Then, 200 µL of citrate-AgNPs dispersion of 20 nm (0.02 mg mL-1 in
aqueous buffer, containing sodium citrate as stabilizer) was loaded into a syringe
and it was passed through the membrane. AgNPs were trapped and the
membrane became coloured. The surplus dispersion was passed through the
membrane in order to retain the maximum AgNPs. A retention of 60 % of AgNPs
(0.0024 ± 0.0002 mg) was obtained. The sensing membranes were stored by
parafilm in the dark at room temperature.
Figure 45. Procedure of the AgNPS immobilization on nylon membrane.
3.4.4 Screen-printed piezoelectric MEMS
Resonant piezoelectric MEMS composed of a PZT layer between two gold
electrodes were fabricated on a substrate by combining screen-printing
technology and the sacrificial layer method. This technique included different
steps:
a) Ink fabrication The gold ink (ESL8836) and sacrificial ink (ESL protactive coat 244-T polymer)
are commercially available (ElectroScience Laboratories, UK). However, the PZT
AgNPs dispersion
AgNPs-membrane

Chapter 3. Methodology
101
ink was prepared at the IMS laboratory. This ink was composed of 97 wt % of
commercial piezoelectric PZT (PbZr0.52Ti0.48O3) powder (PZ26, Ferroperm,
Denmark) and 3 wt % of LBCu (≈25 wt % Li2CO3, 40 wt % Bi2O3, 35 wt % CuO) as
sintering aid. The piezoelectric powder PZT: LBCu (40 g) in ethanol (60 mL) was
firstly rotated during 18 h in a Turbula mixer with 8 zircone balls (5 mm) (Figure
46A). The homogenized powder was afterwards dried in an oven at 60 ºC (4 days).
Then, the piezoelectric paste was prepared by blending the PZT:LBCu powder
(86%, w/w) with the organic binder ESL400 (ElectroScience Laboratories) (14%,
w/w) in order to achieve good viscosity. After manual mixing in a mortar, the
dispersion was optimized during 5 min using a three-roll mill (EXAKT 80S) to fulfill
the required rheological properties (Figure 46B).
Figure 46. A) Turbula mixer and B) three-roll mill (EXAKT 80S).
b) Screen fabrication
Two kinds of screens were used: a steel stencil for printing PZT layers (Figure
47A) and a screen based on a piece of stainless steel mesh for printing gold,
sacrificial or dielectric layers (Figure 47B), both screens are stretched over a
frame. A stencil on the mesh was formed by blocking off parts of the screen by a
mask with the pattern in the negative image of the design to be printed; that is,
the open spaces are where the ink will appear on the substrate. For preparing the
mesh screen, a photosensible and water soluble emulsion was firstly deposited on
the mesh. Next, a mask with the pattern selected (Figure 47C) is placed on the
emulsion and the selected pattern was formed by the screen copy unit Variocop S
(Figure 47D).
A) B)

Chapter 3. Methodology
102
Figure 47. A) Stencil for PZT printing; B) Screen with emulsion with patterns on mesh for
gold, sacrificial and dielectric printings; C) Mask with pattern of disks and fiducials for
reveling; D) Screen copy unit Variocop S for insolation.
As can be seen in Figure 48, which shows the mesh revelation procedure, the
soluble photosensible emulsion turned insoluble in water when it is exposed to
UV light (λ=350 nm). However, the zones with the black pattern were not
irradiated remaining soluble and so, the emulsion was removed by water allowing
open spaces where the ink passes to the substrate.
mesh emulsion pattern
B) A)
C) D)
frame

Chapter 3. Methodology
103
Figure 48. Procedure of mesh revelation.
Table 17 shows the different materials and screens used for the step
deposition to fabricate sensors by screen-printing technique.
Table 17. Summary of materials and screen characteristics used to fabricate disks and cantilevers
Layer Material
Screen thickness (µm) Shime board (µm)
Photoresist Mesh
Sacrificial layer
ESL protective coat 244-T polymer (ESL Erope)
50 70 250
Bottom electrode
ESL 8336 gold paste (ESL Erope) 15 325 300
Top electrode
ESL 8336 gold paste (ESL Erope) 15 325 400
PZT PZT paste prepared in Laboratory
150 (steel stencil) 300
Anchor pad PZT paste or glass-ceramic paste 4702 overglaze
50 70 300
UV light
1Frame
Photosensible emulsion(soluble)
Canvas (mesh)
Mask with pattern
Insoluble
Open weft (pattern)
2
3
4

Chapter 3. Methodology
104
c) Screen-printing:
The fabrication process by the DEK Horizon 03iX screen printing platform
(ASM, Switzerland) consists of the successive deposition of each pattern for
printing each layer (Figure 49).
Figure 49. A) Overal view of DEK Horizon 03iX screen printing platform and B) view of the print cycle.
d) Drying
Once printed, each layer was dried at 120 ºC for 15-30 min, depending on the
layer, in an oven to remove the solvents of the ink. In case of the piezoelectric
layer, a specific drying of 1 ºC min-1 up to 120 ºC before its maintaining 30 min at
this temperature was carried out in order to limit cracks or holes.
e) Pressing Subsequently, the dried sensors were isostatically pressed at 40 MPa for 4
minutes at 65 ºC (Exxelia Temex Parc Industriel, Pessac, France) to improve the
sensor densification before firing.
A) B)

Chapter 3. Methodology
105
f) Firing
Afterwards, the sensors were fired in an AET Technologies furnace (Figure
50A). Taking into account the temperatures of organic blinder elimination (30˂
T(ºC)˂350), sacrificial layer elimination (450 ºC), LBCu eutectic fusion (600 ºC) and
PbO evaporation (920 ºC), the temperature programme used to prevent cracks
and deformations is shown in Figure 50B. The temperature increased from 50 ºC
to 250 ºC for 5 min; then, it was increased to 450 ºC with heating rate of 1ºC min-1
for a slow elimination of organic blinder and sacrificial layer; next temperature
was increased up to 900 ºC with heating rate of 40 ºC min-1 and this temperature
was holding for 2 hours to sinter PZT; and finally, sensors were cooled down to
room temperature at 40 ºC/min (Figure 50B). After firing, sensors were released
from substates.
Figure 50. A) Furnace and B) Time-temperature profile in the firing process.
g) Polarization
Before polarization, platinum wires of 50.8 µm diameter (Alfa Aesar, Ward
hill) were glued on the center of the gold electrodes and bonded to tin-plated
copper tubes (Schneider Electric DZ5CE) using an epoxy-silver paste (ESL1901,
ElectroScience); then they were cured for 1 h at 120 ºC. Afterthat, the sensors
were poled to reach the piezoelectric behavior by AET Technologies polarizing
(Figure 51). Firstly, vacuum was generated inside the polarization chamber under
0.1 mbar of pressure to remove ambient humidity and prevent electric arc
discharges at high voltages. Next, the samples were polarized under nitrogen
0
100
200
300
400
500
600
700
800
900
1000
0 100 200 300 400
Tem
per
atu
re (
ºC)
Time (min)
A) B)

Chapter 3. Methodology
106
atmosphere (avoiding material spoilage) at 280 ºC, just below the Curie
temperature (284 ºC) of PZT. A maximum electric field of 55 kV·cm-1 is increasingly
applied while the leakage current intensity is monitored below 5 μA. Then the
system was cooled down while reaching and keeping constant the maximum
electric field.
Figure 51. Polarization equipment AET.
The process described above was applied for the fabrication of two types of
MEMS, disks and cantilevers.
h) Functionalization
Cantilevers were coated with mesoporous silica as sensitive coating to
perform detection of gas. For this purpose, mesoporous silica MCF (1.60 cm3 g-1
volume pore) was dispersed in water (100 mg mL-1) under ultrasonic condition.
The dispersion was then deposited on the top gold electrode by drop-casting with
a microdispenser and finally, the solvent was evaporated at room temperature.
3.5 PROCEDURES AND EXPERIMENTAL CONDITIONS
3.5.1 Chromatographic conditions
Table 18 summarized the chromatographic conditions for each procedure
developed in this Thesis. All solvents were filtered through 0.45 mm nylon
membranes (Teknokroma) before use.

Chapter 3. Methodology
107
Tab
le 1
8.
Ma
in c
ha
ract
eris
tics
of
the
chro
ma
tog
rap
hic
wo
rks
des
crib
ed in
th
is T
hes
is.
An
alyt
eSa
mp
leM
eth
od
IT-S
PM
E ca
pill
ary
An
alyt
ical
colu
mn
Mo
bil
ph
ase
Elu
tio
nFl
ow
Sam
ple
inje
ctio
nvo
lum
eλ
(nm
)Se
ctio
n
DEH
PSe
dim
ent
Wat
er
Cap
LC-D
AD
PD
MS 9
5
Zorb
axSB
C1
8
(35
mm
x 0
.5 m
m,5
µm
, A
gile
nt)
CH
3C
N:H
2O
95
:5Is
ocr
atic
10
µ
Lm
in-1
3m
LA
CN
:wat
er,
1:3
.25
v/v
(+
50
µL
wat
er)
23
04
.1.1
.1
BA
KB
ioci
de
mix
ture
Cap
LC-D
AD
PD
MS 6
5
Iner
tsil
CN
-3
(15
0 m
m ×
0.5
mm
, 3 µ
m,
Suge
lab
or)
Zo
rbax
C1
8
(35
mm
×0
.5 m
m, 5
µm
, A
gile
nt)
CH
3C
N:A
ceta
te b
uff
er8
5:1
56
5:3
5Is
ocr
atic
10
-20
µ
Lm
in-1
10
0-1
00
0 µ
L (+
34
µL
met
han
ol:w
ater
, 4
0:6
0)
21
24
.1.1
.2
DP
AH
and
sC
apLC
-DA
D
PD
MS 9
5
PD
MS 8
0
PD
MS 6
5
PD
MS 5
0
PEG
Zorb
axSB
C1
8
(15
0m
m x
0.5
mm
,3.5
µ
m, A
gile
nt)
CH
3C
N:H
2O
70
:30
(0
-12
min
)1
00
:0 (
12
-16
min
)7
0:3
0 (
16
-20
min
)
Gra
die
nt
10
µL
min
-11
80
0 µ
L (+
12
0 µ
L w
ater
)2
80
4.1
.1.3
AM
PM
AM
PEP
MD
MA
Hai
rH
PLC
-FLD
-Li
chro
sph
er1
00
RP
18
(12
5 m
m ×
4 m
m, 5
µm
,M
erck
)
CH
3C
N:H
2O
60
:40
(0
-12
min
) 8
0:2
0 (
12
-16
min
)G
rad
ien
t1
mL
min
-12
0 µ
L2
64
(λ e
xcit
atio
n)
31
3 (
λ em
issi
on)
4.1
.3.1
AM
PM
AM
PM
DA
MD
MA
Illic
itst
reet
dru
gsH
PLC
-FLD
-Li
chro
sph
er1
00
RP
18
(12
5 m
m ×
4 m
m, 5
µm
,M
erck
)
CH
3C
N:H
2O
60
:40
(0
-12
min
) 8
0:2
0 (
12
-16
min
)G
rad
ien
t1
mL
min
-12
0 µ
L2
64
(λ e
xcit
atio
n)
31
3 (
λ em
issi
on)
4.1
.2.3
Ke
tam
ine
Illic
itst
reet
dru
gsC
apLC
-DA
D-
Zorb
axSB
C1
8
(15
0 m
m x
0.5
mm
i.d
., 5
μ
m, A
gile
nt)
CH
3C
N:H
2O
90
:10
Iso
crat
ic8
µL
min
-12
0 µ
L2
30
4.1
.2.4
AM
PM
AM
PEP
Ora
l flu
idC
apLC
-FLD
PD
MS 9
5, P
DM
S 65
c-SW
CN
Ts-P
DM
S 95
c-SW
CN
Ts-P
DM
S 65
c-M
WC
NTs
-PD
MS 6
5
Zorb
axSB
C1
8
(35
mm
x 0
.5 m
m,3
.5 µ
m,
Agi
len
t)
CH
3C
N:H
2O
50
:50
70
:30
Iso
crat
ic2
0 µ
Lm
in -1
20
-50
µL
(+ 2
0 µ
L w
ater
)2
85
(λ e
xcit
atio
n)
32
0 (
λ em
issi
on)
4.2
.1
(±)-
MA
MP
(±)-
EP-
Cap
LC-D
AD
a
HP
LC-F
LDb
-
Zorb
axC
18
colu
mn
(35
mm
x 0
.5 m
m i.
d.,
5 μ
m,
Agi
len
t)a
Hyp
ersi
lOD
S-C
18
(25
0 m
m x
4 m
m i.
d.,
5 μ
m,
Ther
mo
Fish
er)b
CH
3C
N:H
2O
60
:40
Iso
crat
ic1
5 µ
Lm
in -1
a
0.5
mL
min
-1b
20
µL
26
4a
26
4 (
λ exc
itat
ion)b
31
3 (
λ em
issi
on)
4.3
.1.1
*PD
MS 9
5: c
om
mer
cial
TRB
-5 (
95
%D
imet
hyl
-5%
dip
hen
ylp
oly
silo
xan
e);
PD
MS 8
0: c
om
mer
cial
TRB
-20
(8
0 %
Dim
eth
yl-2
0%
dip
hen
ylp
oly
silo
xan
e);
PD
MS 6
5: c
om
mer
cial
TRB
-35
(6
5%
Dim
eth
yl-3
5%
dip
hen
ylp
oly
silo
xan
e);P
DM
S 50: c
om
mer
cial
TRB
-50
(50
%D
imet
hyl
-50
%d
iph
enyl
po
lysi
loxa
ne
)

Chapter 3. Methodology
108
As can be seen, the main differences between HPLC and Cap-LC are the inner
diameter dimensions of analytical columns and the flow rates of mobile phase.
The i.d. of CapLc analytical columns and HPLC columns used in this Thesis were 0.5
mm and 4 mm, respectively. Flow rates for CapLC and HPLC were 10-20 µL min-1
and 0.5-1 mL min–1, respectively.
3.5.2 IT-SPME conditions
Different PDMS-based commercial capillary columns modified with CNTs
were investigated for the determination of amphetamine compounds in Section
4.2.1. The functionalization of the capillary columns for IT-SPME was carried out
by following the procedure described in (Jornet-Martínez, N. et al., 2015). CNTs
were carboxylated prior to their immobilization on the capillary column. To
carboxylate SWCNTs, 5 mL of H2SO4:HNO3 (3:1) were added to 0.025 g of SWNTs
and ultrasonicated for 90 min (50 W, 60 Hz). Next, this suspension was diluted
with 500 mL of water and filtered through a cellulose acetate filter (0.45 μm).
Finally, c-SWNTs were washed with 1 M HCl and left to dry at room temperature.
To carboxylate MWCNTs, 80 mL of a mixture of sulfuric and nitric acids (3:1, v/v)
were added to 0.02 g of MWCNTs and ultrasonicated for 5 h (50 W, 60Hz). Then,
this mixture was diluted with water (1.5 L), filtered and washed with water. The
following step was immobilization of c-CNTs on the inner surface of the PDMS
capillary columns. Firstly, the PDMS capillary columns were activated by passing
successively 2 M NaOH (24 h), water (5 min), (3-aminopropyl)triethoxysilane
(APTS) (2%, v/v) of in anhydrous acetone (15 min), water (5min), methanol (5 min)
to eliminated APTS excess and glutaraldehyde (10%, v/v) prepared in 50 mM
borate buffer of pH 9.0 (10 min). Then, suspensions of c-CNTs (5 mg mL-1)
prepared in dimethylformamide (4.5 mL) containing 1,3-dicyclohexylcarbodiimide
(DCC) (0.5 mg) were passed through the activated capillaries for 30 min in order
to immobilize the c-CNTs into the PDMS-based coating. Finally, unreacted c-CNTs
were eliminated by flushing water through the capillaries. The total time required
for preparation of the capillaries after activation of the PDMS phase was about 2
h.

Chapter 3. Methodology
109
3.5.3 Derivatization procedures
The determination of amphetamines by LC entailed a previous chemical
derivatization step to enhance the sensitivity. In this Thesis, the fluorogenic
reagent FMOC was selected (Figure 52).
Figure 52. Scheme of the reaction between amphetamines tested and A) FMOC B) FMOC-L-
Proline and DCC.
For the derivatization in solution, aliquots of analyte solution were mixed
with carbonate buffer solution and with derivatizing reagent solution of FMOC.
After reaction time of 5 min, 20 µL of the resulting solution was injected into the
chromatograph. For quiral identification in solution (Section 4.3.1), 125 µL of
FMOC-L-proline and 125 µL of DCC were mixed for 5 min and dded to 250 µL of
hydrogencarbonate buffer. The resulting solution was allowed to react for 2 min
and then was injected (20 µL) into the chromatographic system. For the
derivatization in solid support (Section 4.1.3.1), 1.5 mL of FMOC was transferred
to the SPE tubes containing the sorbet-sample blends by applying positive
pressure, and after 2-3 min of contact time the resulting solution was flushed out
the tubes and collected into glass vials. Unlessotherwise stated, the extract (20
µL) was injected after 5 min (counted from the addition of the reagent to the
tube). The FMOC solutions were prepared daily by dissolving the pure compound
in acetonitrile. The hydrogencarbonate buffer was prepared by dissolving the
Compound R1 R2
AMP H H
MAMP CH3 H
EP CH3 OH
MDMA* H CH3
* -O-CH2-O- (3, 4 position )
3
4
Analyte FMOC Analyte-FMOC derivative
DCC
COOH
Analyte FMOC-L-Pro Analyte-FMOC-L-Pro derivative
A)
B)

Chapter 3. Methodology
110
appropriate amount of sodium hydrogencarbonate in water, then adjusting the
pH to 10.0 with a solution of sodium hydroxide (10%, w/v). Table 19 illustrates
several volumes and conditions of derivatization procedures carried out in this
Thesis.
Table 19. Conditions for derivatization procedures of this Thesis.
Sample volume (µL)
Carbonate buffer Derivatizing reagent Section
250 125 µL; 0.05 M; pH 10.5 125 µL FMOC (1 mM) 4.1.3.1
125 125 µL; 0.01 M; pH 10 250 µL FMOC (1 mM) 4.1.2.3
125 125 µL; 0.01 M; pH 10 250 µL FMOC (0.1 mM) 4.3.1.1
250 250 µL; 4 %(m/v); pH 10 125 µL FMOC-L-proline (1 mM) + 125 µL DCC (10 mM)
4.3.1.1
3.5.4 Response of polymeric sensors
The experimental conditions for obtaining the response of polymeric sensors
are shown in Table 20.
Table 20. Experimental conditions used in several works of this Thesis based on polymeric sensors.
Analyte Matrix Sensor Reagents Sample volume
(µL)
Reaction time (min)
λ (nm) Section
Caseine Effluent PDMS/TEOS/SiO
2NPs/NQS NaOH 2.5 10 525 4.1.2.1
ADP Industrial product
PDMS/TEOS/SiO
2NPs/NQS
Hydrogen carbonate buffer (8%,
w/v, pH 11.0)
1 6 525 600
4.1.2.2
AMP
MAMP
MDA
MDMA
Illicit street drug
PDMS/TEOS/SiO
2NPs/NQS
Hydrogen carbonate buffer (8%,
w/v, pH 11.0)
1 10 525 4.1.2.3
Ketamine Illicit street
drug
PDMS-Co(SCN)
2
NaOH (0.1Mm)
100 10 625 4.1.2.4

Chapter 3. Methodology
111
The estimation of casein by PDMS/TEOS/SiO2NPs/NQS sensor,consisted of
soacking the sensor into 2.5 mL of sample, basified to pH 12 with NaOH, and
heating at 100 ºC for 10 min. For estimating amphetamines and ADP biocide by
PDMS/TEOS/SiO2NPs/NQS sensor, 1 mL of sample in hydrogen carbonate buffer
(8%, w/v, pH 11.0) was placed in a glass vial and then three sensors were added.
After reaction time, sensors were removed from the vials and the analytical signal
was measured. The quantitative analysis was carried out by absorbance
measurements by DR and color measurements by DI (Figure 53).
Figure 53. Procedure to obtain the colorimetric response of polymeric sensors.
In order to measure absorbanceby DR, first, a back ground scan was made
against a white paper and a blank was also measured. Then, the sensor after
analyte reaction was placed under the camera of the DR accessory and the
absorbance measurements were registered. For the color intensity
measurements, firstly DI was obtained. In the caseine and biodice works, colored
sensors were scanned with a conventional scanner, at a resolution of 300 dots per
inch. For the amphetamine work, photographic images of the sensors were taken
with a Nikon CoolPix S2600 digital camera with 14 megapixels and 5x wide optical
zoom. The camera was programmed without flashlight and the object distance
was 10 cm. Next, the images were imported into a computer, and their color
differences were analyzed by the free image editor software GIMP (version 2.8).
The color intensity was assessed using the color picker tool on GIMP, with an
average of 35x35 pixels for the amphteamine and biocide determination and
50x50 pixels for caseine determination. An area composite of approximately
100x100 pixels (amphetamine and biocide determination) and 132x132 pixels
(casein determination) was selected using the ellipse select tool. The RGB color
10 min
Analyte1 mL
Manual agitationVisual inspection
DR DI
1
2
34
5

Chapter 3. Methodology
112
mode was applied to transform the DI into numerical color values. Color
difference paterns were obtained by calculating the difference of the red, green,
and blue values at the center of scanned composites. The intensity of green color
was selected due to higher signals.
For the estimation of ketamine by PDMS/Co(SCN)2 sensor, aliquots of 100 μL
of sample were mixed with 100 μL of 0.1 M sodium hydroxide in 2 mL glass vials.
Then, sensors were immersed into the mixtures. After the reaction time, the
sensors were removed from the vials and their colors were analyzed by visual
inspection and monitored by recording their absorbance spectra by DR following
the same procedure above mentioned.
3.5.5 Response of AgNPs based sensors
Firstly, the gaseous standard of VSCs was generated into a 2000 mL static
dilution glass bottle under magnetic stirrer as Figure 54 shows. The sensor was
firstly hung by a threat into the static dilution bottle, then 100 µL of phosphoric
acid 85 % in order to facilitate volatilization was added. Once the bottle was
closed, aliquots of standard solutions of the Na2S between 0 – 100 µL were
injected by the bottom of this static dilution bottle and the mixture was stirred for
10 min. Afterthat, the sensor was removed from the bottle and was coated by
glycerol. The analytical response was measured by DR and/or DI (RGB color
analysis). The same protocol was followed for the analytes CH3SH and (CH3)2S and
also, to test interferents as ethanol, acetone and ammonia.
Figure 54. Sensor hanged up into satic dilution bottle to generate gaseous standard.

Chapter 3. Methodology
113
3.5.6 Response of screen-printed sensors
Screen-printed piezoelectric cantilever coated with sensitive layer was used
as gas sensor. To perform the test, the cantilever on alumina substrate was
bonded on printed circuit board (PCB) support with platinum wires (150 μm
diameter) using a silver paste. After drying the silver paste for 20 min at 120ºC,
the cantilever was placed in a gas chamber (35 mL) connected to an impedance
analyzer (Figure 55A), which allowed the real-time reading. The detection
configuration is based on a vapor generator (CALIBRAGE PUL 110) to generate and
control the concentrations of the target vapor from a liquid contained in a heated
bottle (Figure 55B). The vapor particles are transported by constant flow of
nitrogen (100 mL min-1) as a carrier gas. Thus, a sequence of target vapor
concentrations was delivered on the sensor placed inside the chamber.
Previously, a nitrogen flow was carried out for 450 min to ensure stability at room
temperature. Moreover, a nitrogen flow was carried out between each
concentration sequence as rinsing step. Humidity was used as model target vapor
up to 2500 ppm for 10 min each concentration step. During the test, the resonace
frequency shifts (at first 31-longitudinal mode) produced by the mass change due
to the analyte sortion were measured by the impedance analyzer. All detections
were carried out under the same conditions.
Figure 55. A) Gas chamber connected to impedancemeter and gas generator (Inset: top view of cantilever on alumina substrate bonded on PCB support and B) Vapor generator.
A B

Chapter 3. Methodology
114
3.6 SAMPLES
In this Thesis, several kinds of samples have been analyzed, including
environmental, biological, industrial and forensic samples. Table 20 summarizes
the samples and the analytes studied. All samples were analyzed in triplicate at
room temperature.
3.6.1 ENVIRONMENTAL SAMPLES
Sediments and waters were analyzed as environmental samples to detect DEHP.
3.6.1.1 Sediments
Sediments were collected at different points along the coast of the Valencian
Community (Spain) during 2012, from coast zone, transition zone and port. The
coast sediments were collected from Sierra de Irta (Peñíscola) to Cabo de Cervera
(Torrevieja). The sediments from transition zones were collected from Salinas de
Santa Pola, Estany de Cullera and Riu Xúquer. The ports studied were Alicante,
Castellón, Denia, Gandia, Sagunto and Valencia. All sediments were stored in
plastic flasks, previously cleaned with acetonitrile, 2 L capacity. Samples collected
were moved to the laboratory with coolers and were kept at 4 ◦C until analysis in
glass flasks. Fortified samples (before MSPD treatment) were also processed.
3.6.1.2 Water
Two different water samples were analyzed. On the one hand, water samples
collected at the same place that sediments were analyzed. The analyte evaluated
was DEHP. The samples were stored in dark, in brown glass flasks at 4 ºC until
analysis. For the analysis, samples were previously centrifuged in glass tubes for 5
min at 45 rpm. Finally, aliquots of 4 mL were processed by IT-SPME-CapLC.
On the other hand, effluent water samples from dairy industry were analyzed
by using PDMS/TEOS/SiO2NPs/NQS sensors to determine casein. Water samples
were provided by Betelgeux S.A (Gandia, Valencia, Spain). The dairy effluent
samples analyzed were collected from a pilot plant aimed at the production of

Chapter 3. Methodology
115
cheese. The samples were collected at different stages of the CIP process. The CIP
process consisted in four steps: (1) initial rinse with warm water, (2) rinse with a
highly alkaline solution, (3) rinse with acidic solution, (4) heat disinfection with hot
water. In some cases, the last step consists of chemical disinfection followed by
hot water (Dev Satyanarayan, S.R. et al., 2014). Samples were stored at 4 ºC until
analysis. Before the analysis each sample was vigorously shaken. Finally the
samples were alkalinized and diluted if required.
3.6.2 BIOLOGICAL SAMPLES
In this Thesis, biological samples have been analyzed to determine
amphetamine compounds in oral fluid and hair, and VSCs in breath.
3.6.2.1 Oral fluid
Owing to the high viscosity of oral fluid, its direct loading into the IT-SPME
capillary was unsuitable, even after dilution with the buffer and FMOC solutions.
For this reason, cotton swabs were used to collect oral fluid. In order to simplify
the analytical procedure and to avoid excessive dilution of the analytes, the tip of
the swab was directly immersed into vials containing the derivatization solution
(250 µL of carbonate buffer and 250 µL of 0.1 mM FMOC). In such a way, the
analytes were simultaneously extracted from the swabs and derivatized. After the
reaction period (5 min), the swab was discarded and an aliquot of the resulting
solutions was removed from the vials and processed by IT-SPME-CapLC. Drug-free
oral fluid samples were obtained from volunteers after informed consent. Cotton
swaps were purchased from a local market; the amount of cotton on each tip was
of about 0.03 g.
3.6.2.2 Hair
Hair samples were collected from different volunteers. Portions of 1 g of hair
were washed three times with 100 mL of water, and then twice with 100 mL of
methanol in order to eliminate personal care products and other unwanted
compounds that may be present.

Chapter 3. Methodology
116
According to the literature, drugs are firmly enclosed in the hair structure
(Wada, M. et al., 2010) and therefore, it was assumed that the conditioning step
did not modify the amount of the analytes in the samples. After washing, the
samples were dried in air. Dry samples were cut into 1–3 cm segments and then
pulverized with ball mill (Fritsch, Oberstein, Germany) for 15 min. The resulting
hair pieces (<1 mm) were kept in dark glass vials at room temperature until
analysis.
3.6.2.3 Breath
Human oral breath was collected from ten volunteers by exhaling a mixture
of mouth and alveolar air into Nalophan bags of 1L in a single expiration. Prior to
collection, the sensor was hanged up into the bag. To spiked breath sample a
suitable volume of Na2S solution and acid ortophosphoric (85%) and stirred bar
were introduced and mixed on the bottom of the bag. After 10 min of sampling
the sensor was removed from the bag for visual inspection and its absorbance by
DR was registered.
3.6.3 INDUSTRIAL SAMPLES
Three samples containing 4, 3 and 1.6% (w/v) of the ADP biocide were
supplied by Betelgeux S.L (Gandía, Spain). Samples were diluted with water and
aliquots of 1 mL were analyzed by PDMS/TEOS/SiO2NPs/NQS sensors. For the
recovery study, samples were spiked at concentrations from 0.3 to 1% (w/v).
These samples were basic. In order to validate the results, samples were also
analyzed by C18 support derivatization.
On the other hand, two samples containing the ADP biocide and suspicious of
containing BAK were also supplied by Betelgeux Company. Samples, called
DECTOCIDE, which include 4.2% of ADP, as well as water, a non-ionic surfactant,
phosphoric acid andother minor components, were tested by IT-SPME-CapLC.
Standard addition curve was required to determine low concentrations of BAK in
presence of ADP. For this purpose, samples were diluted to 720 µg mL-1 in order
to introduced about 30 µg mL-1 of ADP into the system and moreover, the same
concentration of 30 µg mL-1 of BAK homologues were added on samples.

Chapter 3. Methodology
117
3.6.4 FORENSIC SAMPLES
3.6.4.1 Street drug samples
Illicit street samples, based on MDMA, MAMP, AMP, EP and ketamine were
voluntarily donated by users who were previously informed of the aim of the
study. The samples were finely powdered and homogenized thoroughly. For the
analysis by PDMS/TEOS/SiO2NPs/NQS sensors, accurately weighed portions of the
powdered samples (≈2.5 mg) were transferred to glass vials containing 1 mL of
buffer. For the analysis with PDMS-Co(SCN)2 sensors, powdered samples (20-50
mg) were dissolved in the appropriate volume of nanopure water. Then, aliquots
of 100 μL of the resulting solutions were transferred to glass vials containing 100
μL of 0.1 M NaOH and put into contact with the sensors. After the reaction time,
the absorbance spectra of both sensors were registered. For the analysis of these
samples by the reference LC method, portions of the samples were dissolved in
the proper volume of water and filtered with 0.22 µm nylon syringe filters. Next,
aliquots of the resulting solutions were derivatized with the fluorogenic reagent
FMOC (See Section 3.5.3 for derivatizing conditions), and injected (20 µL) into the
chromatograph. For characterization by FTIR-ATR, bulk powdered samples were
placed in contact with the spectrophotometer ATR crystal, and then the spectra
were registered.
3.6.4.2 Shooter hands
Test shots were carried out by police officers in an indoor range at Police
Headquarters of Valencian Community (Valencia, Spain) under typical shooting
practice conditions. The shots were fired with 9 mm Heckler & Koch pistols model
USP Compact (Oberndorf/Neckar, Germany) which is the most commonly used
firearms among police forces in Spain. Each volunteer police fired a total number
of 25 shots (regulatory number of shots). Only one of these polices fired 12 shots
because his pistol jammed. In order to avoid contamination, each police fired with
his own firearm and did not touch other surfaces with the hands during the
analysis. GSRs samples were collected from the shooter hands immediately after
discharging the firearm. For each police, both hands right and left (palm and back)
were sampled after shooting. Two techniques for GSRs collection from hands
were carried out: swabbing and tape lifting. Swabbing was performed by

Chapter 3. Methodology
118
scrubbing the hand with one of the tips of a cotton swab. The tape lift kit
consisted of a metal stub equipped with a carbon adhesive tape inserted in a
plastic vial with a tightly fitted cap. For the sampling, the metal stub was passed
over the surface of the hand. Once all the collected samples were placed back into
their vials and capped, they were transported to the laboratory and were stored
at room temperature awaiting analysis. A total of 21 hands were sampled by swab
and 6 by tape. Additional swab samples from each volunteer police before test
shots were also analyzed as blanks (hands were not previously washed). After
sample collection, the DPA was extracted from cotton swab as Section 3.3.1.2
described and 1800 µL of the solution was loaded into the IT-SPME capillary. Table
21 presents all the samples and analytes analyzed in this Thesis.
Table 21. Samples per analytes studied.
Sample Analyte Section
Sediment Water
DEHP 4.1.1.1
Industrial biocide formulation
BAK, ADP 4.1.1.2 4.1.2.2
Hands DPA 4.1.1.3
Effluent from dairy industry
Casein 4.1.2.1
Illicit street drugs (powder or pill)
AMP, MAMP, MDA, MDMA, Ketamine 4.1.2.3 4.1.2.4
Hair AMP, MAMP, EP, MDMA 4.1.3.1
Oral fluid AMP, MAMP, EP 4.2.1
Breath Sulphur 4.3.2.1

119
CHAPTER 4. RESULTS AND DISCUSSION

120

Chapter 4. Results and discussion
121
4.1 Si-BASED MATERIAL
4.1.1 PDMS AS EXTRACTIVE PHASE FOR IT-SPME
IT-SPME is a sustainable extractive technique that follows the current trend
of miniaturization in Analytical Chemistry. As mentioned in the Introduction
Chapter, this miniaturized technique entails the reduction of sample handling,
analysis time, sample consumption and waste generation. The automation of the
analytical process can be achieved when IT-SPME is on-line coupled to
chromatographic system. A further improvement of the sensitivity can be
achieved by coupling IT-SPME to a miniaturized LC technique such as CapLC due to
the decrease of the chromatographic dilution. Therefore, IT-SPME coupled to LC
allows an automatized and miniaturized analysis with the required sensitivity. Due
to IT-SPME is based on the affinity of analytes for the coating of a capillary
column, the nature of the capillary coating is a key point. In this section,
commercially PDMS-coated capillaries have been used to determine several
analytes such as DEHP (Section 4.1.1.1), BAK (Section 4.1.1.2) and DPA (Section
4.1.1.3). However, the utility of conventional coatings is limited mainly due to the
low extraction efficiencies. In order to improve the performance, CNTs have been
studied as alternative coating nanomaterials for IT-SPME. As a practical
application, capillary columns functionalized with CNTs have been tested to
detect amphetamines in oral fluid (Section 4.2.1).
This section has been divided in four parts, as listed below:
1. IT-SPME on-line coupled to CapLC-DAD for estimating DEHP in coastal
sediments previous pretreatment by MSPD.
2. Development of new strategies of analysis combining on-line analysis (IT-
SPME-CapLC) and chromatographic conditions for BAK estimation in
formulations with other co-biocides.
3. IT-SPME-CapLC method for estimating DPA with the previously optimization
of the extraction procedure of DPA from hands. A complementary analysis of
IGSRs by SEM-EDX have been carried out. Comparison of several PDMS-based
coatings.
4. Application of CNTs modified coatings for the determination of
amphetamines by IT-SPME-CapLC. Comparation of several coatings,
unmodified and modified by CNTs.

Chapter 4. Results and discussion
122
4.1.1.1 A cost-effective method for estimating DEHP in coastal sediments by IT-
SPME-CapLC
DEHP is the most widespread phthalate produced and used. Owing to the low
solubility and highly hydrophobic nature of DEHP, it is preferentially absorbed
and/or adsorbed to the organic matter suspended in water as well as to the
organic fraction of soils and sediments. Considerable transfer of this compound
from sediments to aquatic organisms may occur (Chaler, R. et al., 2004; Huang, P.-
C. et al., 2008). Therefore, the development of a method for the estimation of
DEHP in sediments is of great interest for the characterization of aquatic
ecosystems. In this work, MSPD and IT-SPME-CapL-DAD by using PDMS-based
capillary have been proposed for estimating DEHP in sediments. Furthermore,
FTIR-ATR has been used to characterize sediments.
Study of MSPD and IT-SPME-CapLC
DEHP is strongly retained into the PDMS-based coating of the extractive
column used for IT-SPME owing to its high hydrophobicity. Therefore, a mobile
phase with high elution strength has been necessary to desorb this compound
from the extractive capillary in a reasonable time. According to previous studies, a
mixture of acetonitrile:water (95:5, v/v) has been an adequate solvent for
desorption of the analyte from the PDMS95 capillary column and using a C18
analytical column (Muñoz-Ortuño, M. et al., 2012). Replicates of solid phase
blanks were processed in order to evaluate the DEHP contamination. Conditions
selected as the best option for MSPD were as follows: 100–300 mg of sample, 400
mg of C18 phase, and 1.2 mL of acetonitrile for analyte desorption. It should be
noted that the final volume of the extracts collected after flushing the extraction
tubes with 1.2 mL of acetonitrile was of about 0.8 mL. After, 2.6 mL of water was
added. Figure 56 shows the FTIR-ATR spectra obtained from sediment, MSPD
mixture, and after-extracted MSPD mixture. The sediment spectra shows only the
features of carbonates and clay materials, C-O absorption peaks in the frequency
1430 cm−1 and Si-O at 1025 cm−1, respectively. C-O bands are also present in the
spectra corresponding to MSPD and after-extracted MSPD mixtures. As it can be
observed, a small amount of matrix passed to the extract with acetonitrile
because the spectra of the mixture after extraction present a smaller absorbance
than that provided by the MSPD mixture.

Chapter 4. Results and discussion
123
Figure 56. FTIR-ATR spectra obtained for C18 used as solid phase in the MSPD procedure,
sediment, MSPD mixture and MSPD mixture after extraction with acetonitrile.
Analytical parameters
Standard solutions of DEHP were prepared in water: acetonitrile (1:3.25, v/v)
since the extraction solvent used for sediment samples after the MSPD was water-
acetonitrile. The reliability of the procedure was also tested for sediments by
obtaining relevant analytical parameters such as the limits of detection (LODs)
and quantification (LOQs), and the linearity. A sediment without DEHP (i.e., with a
content below LOD/3) was selected and amounts of DEHP were added for
obtaining up to 200 µg L-1 in the extracts, which were processed according MSPD
and IT-SPME-CapLC-DAD. Adequate linearity was obtained as can be seen in Table
22.
Ab
sorb
ance
Wavenumber (cm-1)
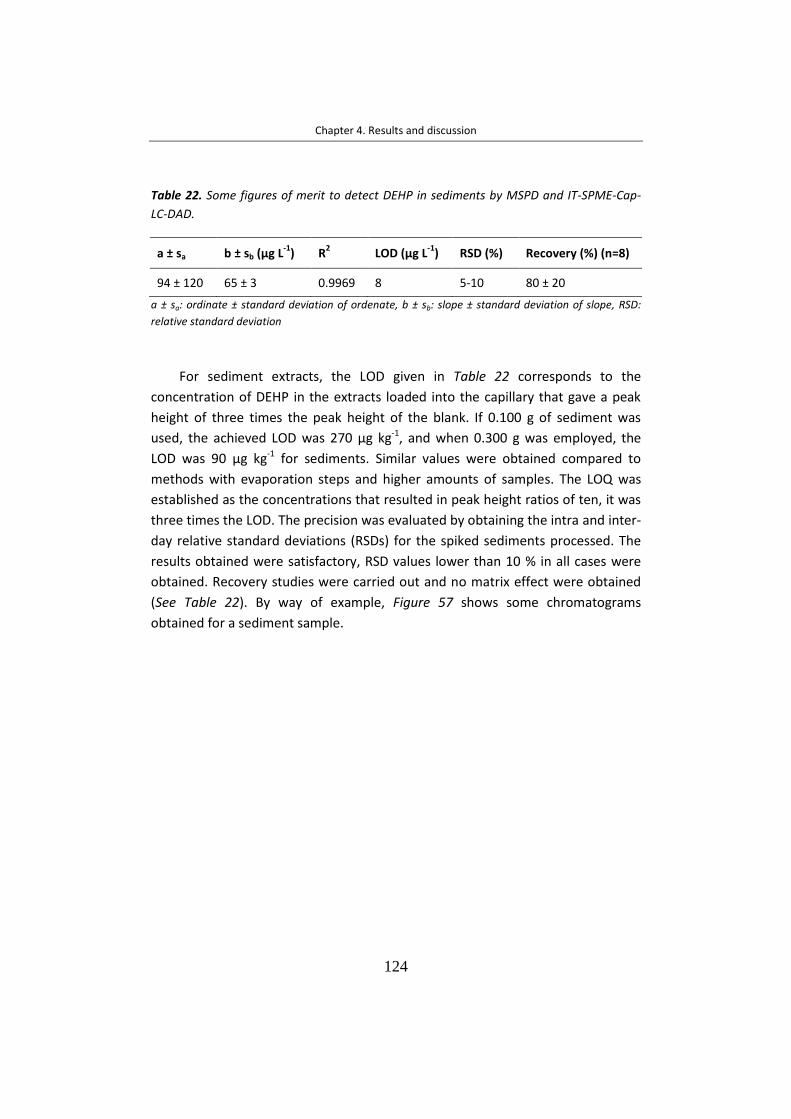
Chapter 4. Results and discussion
124
Table 22. Some figures of merit to detect DEHP in sediments by MSPD and IT-SPME-Cap-
LC-DAD.
a ± sa b ± sb (µg L-1
) R2 LOD (µg L
-1) RSD (%) Recovery (%) (n=8)
94 ± 120 65 ± 3 0.9969 8 5-10 80 ± 20
a ± sa: ordinate ± standard deviation of ordenate, b ± sb: slope ± standard deviation of slope, RSD:
relative standard deviation
For sediment extracts, the LOD given in Table 22 corresponds to the
concentration of DEHP in the extracts loaded into the capillary that gave a peak
height of three times the peak height of the blank. If 0.100 g of sediment was
used, the achieved LOD was 270 µg kg-1, and when 0.300 g was employed, the
LOD was 90 µg kg-1 for sediments. Similar values were obtained compared to
methods with evaporation steps and higher amounts of samples. The LOQ was
established as the concentrations that resulted in peak height ratios of ten, it was
three times the LOD. The precision was evaluated by obtaining the intra and inter-
day relative standard deviations (RSDs) for the spiked sediments processed. The
results obtained were satisfactory, RSD values lower than 10 % in all cases were
obtained. Recovery studies were carried out and no matrix effect were obtained
(See Table 22). By way of example, Figure 57 shows some chromatograms
obtained for a sediment sample.

Chapter 4. Results and discussion
125
Figure 57. Chromatograms at 230 nm obtained for a sediment sample (A), sediment
sample spiked with 47.62 µg L-1
(B), and 69.77 µg L-1
(C) of DEHP (concentrations in the
extracts). The spikes were realized before MSPD treatment. Iinset corresponds to DEHP
spectrum.
Analysis of samples
The proposed conditions have been applied to analyze sediments samples
collected at different points along the coast of the Valencian Community area
(Spain) during 2012. The parameters used to establish the presence or absence of
the analyte in each sample were the concordance between (i) the retention time
and (ii) UV spectra of DEHP and the suspected peak in the chromatogram of the
sample, and (iii) the comparison of the chromatograms obtained for the sample
and after spiking the sample with known amounts of the analyte. Special efforts
were necessary during sample manipulation to prevent contamination by DEHP,
as significant amounts of this compound are present in packages, solvents, or
glassware (Frankhauser-Noti and A., Grob, K., 2007).
Obviously, elimination or simplification of the sample preparation would
reduce the risk of contamination. In general, solvents must be assayed previously,
0
5
10
15
20
25
30
210 260 310 360
Ab
sorb
ance
(m
AU
)
Wavelenght(nm)
0
50
100
150
200
250
300
350
400
450
500
0 1 2 3 4 5 6 7 8 9 10
Ab
sorb
anci
a(m
AU
)
Tiempo total (min)
C
B
A
Ab
sorb
ance
Total run time (min)

Chapter 4. Results and discussion
126
because most of them contain DEHP, increasing blank signal and therefore,
affecting the determination of the analyte of interest. Several kinds of blanks and
fortified samples have been employed in order to test the presence or absence of
bias error. Solid phase blanks have been prepared as samples, but without adding
it. Standards in solution can be used for processing samples provided solid phase
blanks do no present a matrix effect. Solvent blanks and cleaning blanks have
been also tested. In order to estimate the percentages of DEHP recovered by
MSPD, samples providing a signal for DEHP similar to that of solid phase blanks
have been fortified both before MSPD treatment and after the elution process, at
measured levels between 20 and 100 µg L-1 of DEHP. Recoveries as those given in
Table 22 have been obtained. In addition, between 0.3 and 0.1 g of a sample
spiked with 50 µg L-1 (measured concentration) have been processed and the
signals obtained for DEHP were in accordance with the amount of DEHP
processed by the method in a 95 % of the value obtained for 0.1 g. The sediments
have been also characterized by FTIR-ATR. Table 23 shows the particle size of the
sediments assayed (See also Figure 58).
Table 23. Comparison of the composition of the three kind of sediment assayed according
to size of particle after sieving.
Particle size (nm) Coast sample Transition sample Port sample
˃0.4 1.05 27.75 3.94
0.4 4.82 17.31 3.3
0.3 23.68 13.51 13.3
0.2 66.37 15.2 50.2
0.1 2.75 23.62 25.96
Lost in process 1.33 2.61 3.24

Chapter 4. Results and discussion
127
Figure 58. Photographs of the proportions according to particle sizes (A, B, C, D, and E
corresponding to bigger than 0.4, 0.4, 0.3, 0.2, and 0.1 mm, respectively) for different
types of sediments: (1) sediment sample obtained from coast zone, (2) sediment sample
obtained from transition zone, and (3) sediment sample obtained from a port zone.
Figure 59 shows the absorbance ratios Si-O/C-O of sediments studied. Three
kinds of sediments were analyzed: coast, transition, and port zones with different
particle size composition and also absorbance ratios Si-O/C-O as can be seen in
this figure.

Chapter 4. Results and discussion
128
Figure 59. Absorbance ratio Si-O/C-O for the sediments assayed (see also Figure 58 and
Table 23).
DEHP was detected only in one of the sediments analyzed (See Figure 57,
photograph 3 of Figure 58 and sample F of Figure 59), being the LOD 90 µg kg-1
(0.300 g was used of sediment as sample taken). Chromatogram A in Figure 57
presented an analytical signal for DEHP three times higher than that shown for
solid phase blanks. The concentration found in positive sample was in accordance
with the values reported in reference (Lin, Z.P. et al., 2003). The results obtained
for the water samples sampled in the same place than sediments provided mean
concentrations of DEHP below or near LOD achieved in water analysis (0.25 µg L-1)
and were similar for all samples analyzed. The mean concentration of DEHP was
lower than the Environmental Quality Standards (EQS) value, fixed in 1.3 µg L-1
(Directive 2008/105/EC). The water mass in contact with the positive value found
for the sediment contained a value of 0.25 µg L-1 of DEHP. The EQS is the
allowable concentration of pollutant in water, sediment or biota, that should not
exceeded for human and environmental protection. The directive 2008/105/EC
proposes to apply EQS of priority substances for sediment and/or biota where
they tend to accumulate, giving information for long-term trend analysis of those
priority substances.
Muestras
Pro
po
rció
n S
i-O
/C-O
Rat
io S
i-O
/C-O
Samples

Chapter 4. Results and discussion
129
Conclusions
In this work, the possibility to combine the MSPD with IT-SPME-CapLC based
on PDMS-based capillary for determining DEHP in sediment samples has been
studied. The proposed procedure is cost effective and allows the identification
and quantification of DEHP at µg L-1 level concentrations to control environmental
quality. Moreover, the considerable reduction on the amounts of sample and
chemicals in reference to other procedures proposed in the literature, can also
reduce the risk of DEHP overestimation due to background contamination.
Chapter 4. Results and discussion
130
4.1.1.2 IT-SPME-CapLC method for BAK determination as a component or
contaminant in mixtures of biocides.
BAK is one of the most employed QAC in biocide formulations. In many cases,
this compound can be present as pollution when different formulations are made
in the same production plant or when the cleaning of an installation requires the
use of this biocide. The complex chemistry of the surfactants makes necessary an
evaluation of matrix effects that depends on kind of biocides, ratio between
biocides and also total amount of surfactants. Thereby, a suitable method to
control BAK in mixtures of biocides is required. Thus, this work establishes the
parameters under which matrix effects may occur in formulations containing BAK
as a minor component or impurity and other cobiocides, including a tertiary
amine like ADP and TMTDAC. New strategies based on on-line analysis (IT-
SPME/CapLC) by using PDMS-based capillaries for BAK estimation have been
proposed.
Optimization of chromatographic separation of C12-BAK and C14-BAK
homologues
The separation of BAK homologues usually requires chromatographic column
with low hydrophobicity and controlled silanol groups. According to previous work
(Prieto-Blanco, M.C. et al., 2013a), mixtures of organic solvent and aqueous buffer
with adjusted pH were also necessary in the mobile phase to achieve a good
separation. In the present study, cyano propyl column was compared with a short
reversed non end-capped C18 column in terms of separation of homologues,
analysis time and coupling robustness with IT-SPME. Longer C18 columns were
tested, but BAK homologues were not eluted from the columns in the assayed
conditions. Different mixtures of acetonitrile:acetate buffer (50 mM, pH 5)
(ranging from 65:35 to 95:5) in isocratic elution mode were tested by the short C18
column. As can be seen in Figure 60A, a decrease of retention time with the
increase of acetonitrile mainly affected to C14-BAK homologue (25.8 min – 65%
acetonitrile versus 19 min – 85%, at 10 µL min-1). The peaks of the two
homologues were overlapped when 95% of acetonitrile was used in the mobile
phase. When the flow rate was increased to 20 µL min-1, the BAK homologues
were separated in less than 12 min by using 85% of acetonitrile (See Figure 60B).

Chapter 4. Results and discussion
131
Figure 60. A) Effect of acetonitrile (ACN) percentage on the retention of C12-BAK (first peak)
and C14-BAK (second peak) homologues at 0.5 µg mL-1
by using short C18 column. Flow rate
= 10 µL min-1
, B) Comparative separation of BAK homologues (at 0.5 µg mL-1
) on C18 and
nitrile capillary column. Conditions of mobile phase and flow rate: 85% ACN and 20 µL
min-1
for C18 column; 65% ACN and 10 µL min-1
for nitrile column.
For the nitrile column, the analysis time was similar (13.5 min) to that
provided by the non-encapped C18, but the two homologues were not totally
separated by using 65% of acetonitrile and 10 µL min-1 of flow rate. Precision
achieved by the short C18 column was compared with that obtained by the
established nitrile phase (See Table 24) and the results were similar. The short
-5
0
5
10
15
20
25
30
35
5 10 15 20 25 30
Ab
sorb
ance
(m
AU
)
Time (min)
65% ACN
75% ACN
85% ACN
95% ACN
-5
0
5
10
15
20
25
30
35
5 6 7 8 9 10 11 12 13 14
Ab
sorb
ance
(m
AU
)
Time (min)
C18 column
Nitrile column
A)
B)

Chapter 4. Results and discussion
132
non-encapped C18 capillary analytical column improved the time of analysis and
resolution of the BAK homologues.
Table 24. Precision and addition curves of BAK in presence of ADP from the raw material
LONZABAC and from DECTOCIDE with the two chromatographic columns tested.
Column Compound
RSD (%) Standard addition curve
y = a+bx
Working range
(µg mL-1) Retention time (n=10)
Peak area (n=5)
a ± sa b ± sb
(mL µg-1) R2
ADP FROM LONZABAC 12.100
C18
C12-BAK 2 14a 12 b
80 ± 50 492 ± 19 0.995 0.1-5
0.1-5 C14-BAK 2 11a 5 b
CN
C12-BAK 1 15 -
210± 60 930 ± 30 0.998
0.1-5
0.1-5 C14-BAK 1 17 -
ADP FROM DECTOCIDE
C18
C12-BAK 3c 9 d - 15 ± 8 323 ± 15 0.9985 0.1-1.5
C14-BAK 3c 12d 18 55 ± 8 1681 ± 14 0.9999 0.02-1
[Total BAK]= a 0.5 µg mL-1, b 5 µg mL-1; c[C12- BAK, C14- BAK]= d 0.1 µg mL-1
Optimization of the IT-SPME procedure
The extraction efficiency depends on parameters such as diphenyl
percentage of the extractive phase and length of the capillary, replacing solvent in
IT-SPME, sample solvent, processed sample volume and concentration of BAK in
the sample. According to our previous study (Prieto-Blanco, M.C. et al., 2013a), a
PDMS65 GC capillary of 43 cm in length and a mixture of methanol:water (40:60)
for replacing solvent were chosen. In order to optimize sample solvent and
processed volume of sample, the raw material BAK at 80% was assayed by using
the nitrile analytical column. The effect of the presence of acetonitrile in the
processed sample was studied. Thus, two sample solvents were assayed: water
and water:acetonitrile (50:50). Similar extraction efficiencies between the BAK
homologues independently of concentration level were obtained using 50% of
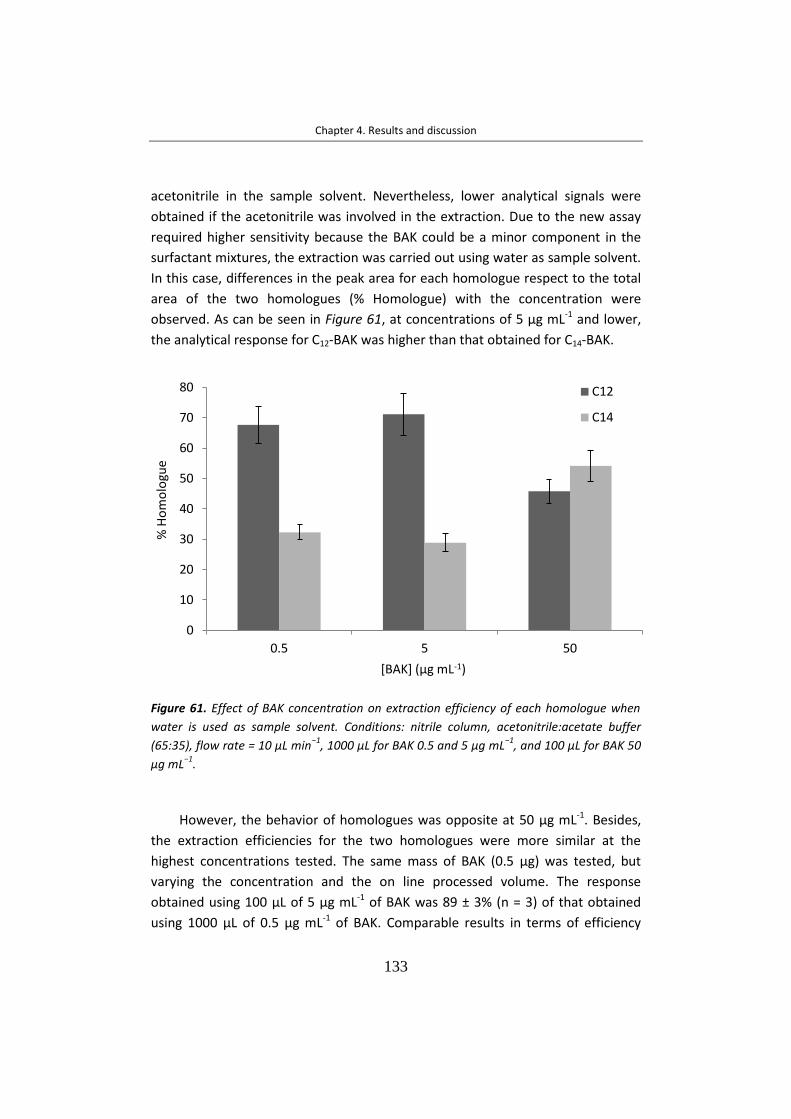
Chapter 4. Results and discussion
133
acetonitrile in the sample solvent. Nevertheless, lower analytical signals were
obtained if the acetonitrile was involved in the extraction. Due to the new assay
required higher sensitivity because the BAK could be a minor component in the
surfactant mixtures, the extraction was carried out using water as sample solvent.
In this case, differences in the peak area for each homologue respect to the total
area of the two homologues (% Homologue) with the concentration were
observed. As can be seen in Figure 61, at concentrations of 5 µg mL-1 and lower,
the analytical response for C12-BAK was higher than that obtained for C14-BAK.
Figure 61. Effect of BAK concentration on extraction efficiency of each homologue when
water is used as sample solvent. Conditions: nitrile column, acetonitrile:acetate buffer
(65:35), flow rate = 10 µL min−1
, 1000 µL for BAK 0.5 and 5 µg mL−1
, and 100 µL for BAK 50
µg mL−1
.
However, the behavior of homologues was opposite at 50 µg mL-1. Besides,
the extraction efficiencies for the two homologues were more similar at the
highest concentrations tested. The same mass of BAK (0.5 µg) was tested, but
varying the concentration and the on line processed volume. The response
obtained using 100 µL of 5 µg mL-1 of BAK was 89 ± 3% (n = 3) of that obtained
using 1000 µL of 0.5 µg mL-1 of BAK. Comparable results in terms of efficiency
0
10
20
30
40
50
60
70
80
0.5 5 50
% H
om
olo
gue
[BAK] (µg mL-1)
C12
C14

Chapter 4. Results and discussion
134
were obtained. Moreover, sample volumes of 100–1000 µL at 5 µg mL-1 of BAK
were passed through the IT-SPME capillary and their responses were measured.
Signals obtained by 1000 µL of sample were about 2–4 times higher
thanthose obtained by 100 µL for C12 and C14-BAK, respectively. As expected,
higher analytical signals were obtained by increasing sample volume. According to
this, 1 mL was the sample volume selected for concentrations lower than 35 µg
mL-1 of total surfactants.
Study of the influence of ADP-BAK mixtures in the BAK response
The effects of a potential competition between BAK and ADP on PDMS65
capillary and/or chromatographic column were examined. For this purpose,
assays were performed with two raw materials: BAK at 80% and LONZABAC with
90% of ADP, both are used to formulate commercial biocides. Different
percentages of BAK in the mixtures with ADP were tested (See Table 25).
Table 25. Mixtures of BAK and ADP or TMTDAC.
BAK
(μg mL-1)
ADP
(μg mL-1)
[ADP]/[BAK] TMTDAC
(μg mL-1)
[TMTDAC]/[BAK]
50 50 1 - -
50 100 2 - -
50 200 4 - -
5 200 40 - -
0.5 30 60 - -
1.5 - - 1.5 1
1.5 - - 30 20
Under these conditions, the peak areas of homologues were similar to those
obtained when the extraction was realized without ADP. Besides, for 50 µg mL−1
of total BAK, the efficiency of extraction of C14-BAK was slightly higher than C12-

Chapter 4. Results and discussion
135
BAK in all cases (Figure 62a–c). Nevertheless, if the [ADP]/[BAK] was high, a matrix
effect was found (Figure 62d and e). For 0.5 µg mL−1 of total BAK representing 60
for [ADP]/[BAK] concentrations ratio, the analytical response of C12-BAK
homologue was 19 ± 3 % of that obtained without presence of ADP. For C14-BAK,
the analytical response represented 61 ± 9 % (n = 6) (Figure 62e). This decreasing
of response was observed with the two columns employed, thus the ADP effect is
not related with the BAK retention on the analytical column (Figure 63).
Figure 62. Percentage response of each homologue in simultaneous IT-SPME of BAK and
ADP with respect of the response in individual BAK extraction (% s-BAK/i-BAK), at several
relations of concentration of ADP and BAK (a) 1 (BAK 50 µg mL−1
and ADP 50 µg mL−1
), (b)
2 (BAK 50 µg mL−1
and ADP 100 µg mL−1
), (c) 3 (BAK 50 µg mL−1
and ADP 200 µg mL−1
),(d)
40 (BAK 5 µg mL−1
and ADP µg mL−1
), (e) 60 (BAK 0.5 µg mL−1
and ADP 30 µg mL−1
).
Optimized conditions for nitrile column were employed.
Due to the low absorptivity of ADP, only BAK homologues are detected at
working concentrations by the DAD detector. In order to determine low
concentration of BAK in presence of ADP, a standard addition curve was
performed with solutions which contained a fixed ADP concentration of 30 µg
mL−1 and concentrations of BAK from 0.1 to 5 µg mL−1. The equations of the
standard addition curves are showed in Table 24. The total area of
0
20
40
60
80
100
120
140
160
1 2 4 40 60
s-B
AK
/i-B
AK
(%)
[ADP]/[BAK]
C12-BAK
C14-BAK
(a) (b) (c)
(d)
(e)

Chapter 4. Results and discussion
136
chromatographic peaks (sum of areas of C12-BAK and C14-BAK) versus total
concentration of BAK added plot was used. The standard addition curves were
performed using the two analytical columns tested obtaining a greater slope with
nitrile column in the working range. This result is in accordance with the different
lengths of the capillary analytical columns. One of the features of the matrix effect
was the decrease of C12-BAK response when the ADP/BAK concentration ratio was
high, such as 40 and 60. The hydrophobic adsorption of BAK on PDMS65 capillary
could be performed by the alkyl chain (Chen, Y. et al., 2012). In the case of ADP
excess, which contains a C12 chain, the C12-BAK homologue could have less sites of
adsorption on PDMS and then, the extraction efficiency could be lower.
Figure 63. IT-SPME of 0.5 µg mL−1
of BAK in water (blue line) and simultaneous IT-SPME of
0.5 µg mL−1
of BAK in presence of 30 µg mL−1
of ADP (red line) by using (A) Nitrile column,
acetonitrile:acetate buffer (65:35), Flow rate = 10 µL min-1
(B) Short C18 column,
acetonitrile:acetate buffer (85:25), Flow rate = 20 µL min−1
.
0
5
10
15
20
25
30
5 6 7 8 9 10 11 12 13 14
Ab
sorb
ance
(m
AU
)
Time (min)
0
5
10
15
20
25
30
35
40
9 9.5 10 10.5 11 11.5 12 12.5 13
Ab
sorb
ance
(m
AU
)
Time (min)
A)
B)

Chapter 4. Results and discussion
137
Study of the influence of TMTDAC-BAK mixtures in the BAK response
Another QAC containing a C14 alkyl chain such as TMTDAC (see Table 25) was
assayed. Figure 64 shows the percentage response of each homologue in IT-SPME,
at 1:1 and 1:20 [TMTDAC]/[BAK] concentrations ratios, with respect of the
response in individual BAK extraction (% s-BAK/i-BAK). As it can be seen from the
assayed mixtures, both BAK homologues have different extraction efficiencies.
From this study it can be concluded that the competition between surfactants
with same length of the alkyl chain is not the main contribution to the matrix
effect. Previous works (Chen, Y. et al., 2012) have observed that the C12-BAK
sorption on polyacrylatefiber decreases with high concentration of electrolyte,
especially in presence of divalent cations. Another phenomenon, that can be
considered, is the formation of mixed micelles in systems with mixtures of cationic
surfactants (Oelschlaeger, C. and Willenbacher, N., 2012). If from a specific
relation of co-surfactant and BAK ([ADP]/[BAK] or [TMTDAC]/[BAK]) micelles with
BAK homologues and co-surfactant are formed, a lower concentration of BAK
monomers in solution is found and a lower area of the chromatographic peak is
recorded.
Figure 64. Effect of TMTDAC on extraction efficiency of C12-BAK and C14-BAK. Mixtures of
1.5 µg mL−1
BAK with 1.5 and 30 µg mL−1
TMTDAC. Conditions: Short C18 column,
acetonitrile:acetate buffer (85:25), Flow rate = 20 µL min−1
.
0
20
40
60
80
100
120
1 20
s-B
AK
/i-B
AK
(%
)
[TMTDAC]/[BAK]
C12-BAK
C14-BAK
Chapter 4. Results and discussion
138
Determination of BAK in unknown biocide products
Three samples, called DECTOCIDE (DC1, DC2 and DC3), which include 4.2% of
ADP, as well as water, a non-ionic surfactant, phosphoric acid and other minor
components were tested. DC1 was a synthetic sample which contained ADP but
not BAK. However, DC2 and DC3 were two unknown industrial samples suspicious
of containing BAK. In order to check the matrix effects, BAK was added on the
synthetic sample (DC1). Different [ADP]/[BAK] relations (1, 10 and 20) were tested
using 1.5 µg mL−1 of BAK and the corresponding concentration of ADP (1.5, 15, 30
µg mL−1) obtained from the biocide product. Figure 65 shows the effect of ADP on
extraction efficiency of BAK homologues. Similar behavior of the two homologues
was observed when the relation [ADP]/[BAK] was 1. Nevertheless, C12-BAK
homologue presented the highest decrease of response at higher [ADP]/[BAK]
relations, such as 10 and 20. For C14-BAK, the matrix effect was produced at the
highest [ADP]/[BAK] relation tested. In order to achieve suitable sensitivity and
suitable conditions of IT-SPME, the biocide formulation was diluted to 720 µg
mL−1. In this way, about 30 µg mL−1 of ADP were introduced in the IT-SPME-CapLC
system. Under these conditions, standard C12 and C14-BAK homologues at the
same concentration (30 µg mL−1) were added on the formulation without BAK
(DC1). Addition standard lines, linear working ranges and correlation coefficients
are shown in Table 24. As expected, the slope of C14-BAK was 5 times greater than
C12-BAK. The LOQs were the lowest levels of the standard addition curves, 0.1 µg
mL−1 for C12-BAK and 0.02 µg mL−1 for C14-BAK. LODs for C12-BAK (0.03 µg mL−1) and
C14-BAK (0.006 µg mL−1) were also verified experimentally, calculated as 3/10 LOQ.
The inter-day precision was evaluated by the RSD for the retention times and peak
area (see Table 24). For studying the recovery of the described procedure, the
sample (DC1) was spiked with 0.5 µg mL−1 of BAK at 80%. The recovery found for
the sum of two homologues was 117 ± 8%. The two samples suspicious of
containing BAK (DC2 and DC3) were analyzed by the optimized method. The
application of method showed the presence of the two BAK homologues at
concentrations of 140 ± 20 µg mL−1 and 43 ± 8 µg mL−1 for C12-BAK and C14-BAK,
respectively in the sample DC2 and below LODs for the sample DC3.

Chapter 4. Results and discussion
139
Figure 65. Effect of ADP on extraction efficiency of BAK. Mixtures of 1.5 µg mL−1
BAK with
1.5, 15 and 30 µg mL−1
of ADP from biocide product (sample DC1). Conditions: Short C18
column, acetonitrile:acetate buffer (85:25), Flow rate = 20 µL min−1
.
Conclusions
New conditions of separation for rapid analysis of C12 and C14-BAK
homologues have been proposed by using a short capillary non end-capped C18
analytical column. Better resolution of homologues and a lower pressure of
system have been achieved under these conditions than those optimized using
nitrile based column. Water as sample solvent instead water-acetonitrile mixtures
as in (Prieto-Blanco, M.C. et al., 2013a) was used, demonstrating the good
versatility of IT-SPME for BAK estimation. Low LODs by an on-line technique
without off-line treatment and using DAD detection have been achieved. The
proposed method shows that for estimating BAK in mixtures of biocides is
necessary to evaluate the matrix effect for obtaining reliable results. Different
behaviors have been shown in function of the kind of co-biocide. If a tertiary
amine like ADP is selected, the response of the BAK homologues compared to that
provided by the BAK alone, depend on the ratio of concentrations ADP/BAK.
While if the co-biocide is a QAC like TMTDAC, the responses of the homologues
are always different. In all cases, C12 homologue response was more affected than
C14 homologue response. These effects on BAK in the assayed mixtures could be
0
20
40
60
80
100
120
1 10 20
s-B
AK
/i-B
AK
(%
)
[ADP]/[BAK]
C12
C14

Chapter 4. Results and discussion
140
due to the formation of mixed micelles. The complex chemistry of the surfactants
makes necessary an evaluation of matrix effects not only with changes of
composition but also with different concentration relationships. Matrix effects
depend on the kind of co-biocide in the mixture, ratio cobiocide/BAK homologue
and amount of total surfactant processed in the on-line system. Those influences
have not been reported in the literature. This work demonstrates the need to
develop new analytical methods for testing new biocides mixtures or to control
industrial processes related with surfactants in a cost-effective way.

Chapter 4. Results and discussion
141
4.1.1.3 A new method for estimating DPA in GSRs as a new tool for identifying
both, inorganic and organic ones, in the same sample
GSRs detection from firearms discharge may provide valuable forensic
information. OGSR and IGSR components are deposited mainly onto hands after
discharge a firearm. DPA is an important OGSR as indicator of firearm discharge
for the identification of suspects. Due to DPA remains at low amounts on hands,
its estimation requires highly sensitive analytical techniques. Thereby, IT-SPME-
CapLC-DAD has been proposed. In order to achieve high sensitivity, factors such as
the nature and length of the extractive phase and volume of sample processed
have been optimized. In addition, several sampling tools such as samplers and
extraction procedures have been studied. A complementary analysis of IGSRs by
SEM-EDX has been carried out in order to confirm the presence of GSRs on
shooter hands. Both analyses could be used as evidence in judicial proceedings of
forensic field.
Optimization of the extraction procedure
a) DPA collecting
Several sampling tools were tested for DPA collection from shooter hands:
adhesive tape lift, PDMS-based device of several PDMS:TEOS proportions (100:0,
70:30 and 50:50), dry cotton swab and wet cotton swab with non-skin-toxic
solvents such as water, acetone and ethanol. According to European Chemical
Agency (ECHA) base date, methanol and acetonitrile were not used due to their
harmfulness and toxicity in contact with the skin, respectively. DPA working
solution was dropped on a glass slide, 3 µL of 10 µg mL-1. After it was air
evaporated to dryness, the solid DPA was collected by the several sampling tools
and extracted with 2 mL of water under vortex conditions. Figure 66A compares
the mean peak areas of DPA extracted from slides and the RSDs to determine the
suitability of the several sampling devices tested. The dry cotton swab achieved
the highest analytical response with acceptable precision. The adhesive tape lift,
which is used in the tape lift kit, showed an analytical response about 14 timer
lower than the dry cotton swab. Similar loss of peak area was observed with pure
PDMS-based device. However, slow increase of analytical response was achieved
when the TEOS proportion increased in the composition device. In the case of

Chapter 4. Results and discussion
142
PDMS:TEOS (30:70) device, the analytical response was improved in 4 times,
compared with the response with pure PDMS device. This effect can be attributed
to the increment on the hydrophilicity of the device as function of TEOS amount,
suggesting the improvement of the analyte extraction. When the cotton swab was
wet with water and ethanol, the analytical response decrease in an 80% and 97%
respectively, compared with the response obtained by dry swab. It could be due
to the wet swab spread the analyte by the slide surface and uncertainty RSD >30%
can be explained based on the difficult-to-control this spread. When acetone was
used as extractive solvent, DPA was not detected but a small peak at a retention
time slightly lower than the analyte was observed (Figure 66B). As can be
confirmed by the spectra depicted in the Figure 65B inset, this peak could be
differentiated from the analyte peak by retention time and spectrum and it could
be corresponds to some compound from cotton swab. From these results, dry
cotton swab was chosen as the best sampling collector of DPA from shooter hands
for the further work.
b) DPA extraction from the collector
Once the collector was selected, the second step was to optimize the
extraction procedure from the collector. For this aim, non-assisted, UAE and VAE
were studied. To test this, 3 µl of 10 µg mL-1 DPA working solution (prepared in
acetonitrile to favor evaporation) was spread on a glass slide. After the solvent
evaporation, the tip of a dry cotton swab was used to extract DPA from the slide.
The tip was introduced into a vial containing 2 mL of water under the three
abovementioned conditions for 5 min (See Section 3.3.1.2 for more details). VAE
offered the best results in term both analytical response (peak area) and RSD, as
can be seen in Figure 66C. For evaluating the extraction efficiencies, the peak area
ratios between non-assisted and assisted-extractions were calculated. Thus, a
ratio of 2 and 5 were obtained by UAE and VAE, respectively. Satisfactory RSD of
9% for VAE was obtained and RSD of 32 % for UAE. From these results, we
concluded that the best extraction procedure of DPA from cotton swab was VAE.

Chapter 4. Results and discussion
143
Figure 66. Comparison of peak areas obtained for standard solution (3 µL of 10 µg mL-1
in
2 mL of water, 15 ng mL-1
) with different (A) sample collectors (B) solvents to wet cotton
swab (at 10 ng mL-1
): dry (a), water(b), acetone (c) and ethanol (d), together with
normalized spectra (inset) of DPA (black dashed line) and unkown compound (black solid
line), (C) extraction modalities and (D) extraction time.
Effect of extraction time
Peak areas of DPA were compared as a function of different extraction times
under optimum conditions: 20 s, 1, 2 and 5 min, as shown in Figure 66D. Longer
times were not tested due to the discomfort with the manual vortex. No
significant differences on peak areas were observed at several extraction times.
Additionally, long times for non-assisted and UAE were also studied in order to
investigate the improvement of analytical response but both procedure were not
as efficient as VAE. Therefore, 20 s of VAE time was selected.
0
10
20
30
40
50
8 9 10 11 12 13 14
Ab
sorb
ance
(A
U)
Time (min)
A B
0
100
200
300
400
500
600
700
800
non-assisted ultrasound-assisted vortex-assisted
Peak
are
a (A
U)
0
100
200
300
400
500
600
700
800
0.3 2 5 10 20
Peak
are
a (A
U)
Extraction time (min)
non-assited
ultrasound-assited
vortex-assisted
C
a
b
d
c
D
0
100
200
300
400
500
600
700
800
Tape PDMS-100 PDMS-50 PDMS-30 Dry swab Wet swab-water
Peak
are
a (A
U) 0
5
10
15
20
200 220 240 260 280 300 320 340
Ab
sorb
ance
Wavelength (nm)
Non-assisted
UAE
VAE

Chapter 4. Results and discussion
144
Effect of extraction solvent
The capacity of three solvents to remove the DPA from the cotton swab was
investigated: acetonitrile, ethanol and water. Mixtures of 90:10 water:actonitrile
and water:ethanol and 100 % water were tested. 51% and 85% of decrease on
peak area was observed when ethanol and acetonitrile, respectively, were
included in the extraction solvent (See Figure 67). This result suggested that the
analyte was not retained on the IT-SPME capillary column. Moreover, high peaks
were observed at a retention time slightly lower than the analyte. These peaks
were not detected when the analysis was carried out in solution, suggesting they
were due to compounds extracted from cotton. Note that ethanol was the solvent
which extracted more amount of interfering compounds. However, water offered
the best results not only in terms of extraction and reduced interferences but also
in terms of environmental performance, since water is a green solvent. Thus,
water was chosen as optimum extraction solvent for this work. Aquous extracts of
DPA from hands were later processed by IT-SPME-Cap-LC as is described in the
next point.
Figure 67. Chromatograms of blanks (dashed lines) and standard solution of 5 ng mL-1
DPA
(solid lines) obtained with different extraction solvents: water (a), 90:10 water: ethanol (b)
and 90:10 water: acetonitrile (c).
0
5
10
15
20
25
30
35
40
45
50
7 8 9 10 11 12 13 14 15 16
Ab
sorb
ance
(AU
)
Time (min)
DPA
a
c
b

Chapter 4. Results and discussion
145
Optimization of the IT-SPME procedure and chromatographic conditions
Experiments were aimed to optimize the DPA extraction by IT-SPME, as well
as the subsequent chromatographic analysis. Initially, two mobile-phase
compositions in isocratic elution mode were tested, 60:40 and 70:30
acetonitrile:water (v/v). As can be seen in Figure 68A, both compositions were
adequate to desorb DPA from the extractive capillary. However, a decrease of
retention time and narrower peaks were achieved with the increase of
acetonitrile and flow. It should be remarked that cross-contamination was
observed when using isocratic elution mode with 70:30 acetonitrile:water. For this
reason, gradient elution program (See Section 3.5.1) with 100% of acetonitrile
during 4 min was employed as cleaning step.
Figure 68. Effect of (A) acetonitrile percentage and mobile phase flow (800 µL at 7 ng mL-1,
PDMS65, 30 cm); (B) nature of the extractive phase (800 µL at 5 ng mL-1
, capillary length 30
cm, optimum mobile phase); (C) capillary length (800 µL, 5 ng mL-1
, PDMS65, optimum
mobile phase) and (D) sample volume processed (5 ng mL-1
, PDMS65, capillary length 90
cm, optimum mobile phase) on the DPA retention in IT-SPME.
0
100
200
300
400
500
600
700
800
0 1000 2000 3000 4000
Peak
are
a (A
U)
Processed volume (µL)
0
2
4
6
8
10
12
5 6 7 8 9 10 11
Ab
sorb
ance
(A
U)
Time (min)
30 cm
60 cm
90 cm
0
2
4
6
8
10
12
14
16
18
5 7 9 11
Ab
sorb
ance
(m
AU
)
Time (min)
70/30; 10 µL/min
60/40; 10 µL/min
70/30; 7 µL/min
0
20
40
60
80
100
120
140
160
TRB-5 TRB-20 TRB-35 TRB-50 PEG
Peak
are
as (
AU
)
A B
C D
PDMS95 PDMS80 PDMS65 PDMS50 PEG

Chapter 4. Results and discussion
146
As mentioned in the Introduction Chapter, IT-SPME is performed using a
capillary column as the loop of the injection valve. The analytes are extracted
during sample loading and transferred to the analytical column with the mobile
phase by changing the valve position. This configuration is advantageous in order
to achieve LODs required for detecting DPA deposited on shooter hands. Herein,
several assays were carried out to optimize the extraction step. The nature of the
extractive phase, the length of the capillary column and the volume of sample
processed were evaluated. Five phases for IT-SPME were assayed: PDMS95,
PDMS80, PDMS65, PDMS50 and 100% PEG (See Table 26).
Table 26. Characteristics of capillary columns employed in IT-SPME.
Extractive capillary Coating Coating thickness
(µm)
PDMS95 5% diphenyl-95% PDMS 3
PDMS80 20% diphenyl-80% PDMS 3
PDMS65 35% diphenyl-65% PDMS 3
PDMS50 50% diphenyl-50% PDMS 3
Zebron ZB-WAXplus PEG 1
Figure 68B compares the analytical response (mean peak area) for DPA (5 ng
mL-1) with the different nature capillaries (30 cm length) when the volume of
standard processed was 800 µL. As can be seen, PDMS65 phase provided the
highest analytical responses. This suggested that higher percentage of diphenyl
groups in the extractive phase lead to increase on the analytical response. This
result indicated that the extraction involves π–π interactions with the aromatic
rings of DPA. However, PDMS50 provided a decrease on the peak area. This effect
could be attributed to the increment on the polarity of the extractive phase and
so, the affinity towards the DPA decreased (log P=3.5). The same effect occurred
with PEG capillary column due to its higher polarity. Thus, the PDMS65 capillary
column was selected for further experiments.
On the other hand, the effect of the capillary length on the analytical
response (peak areas) was also studied by processing 800 µL of working solution
of DPA (5 ng mL-1) with PDMS65 capillaries of 30, 60 and 90 cm. Figure 68C shows

Chapter 4. Results and discussion
147
the increment of the analytical response with the length of the capillary indicating
that the amount of analyte extracted also increased. The peak area for DPA was
improved in a 40% and 47% with the capillary columns of 60 and 90 cm,
respectively, compared with the capillary of 30 cm. Capillaries longer than 90 cm
did not improve the analytical response. As expected, a slight increment on the
time retention of the analyte from 6.2 to 9.4 min was observed when increasing
the capillary length from 30 to 90 cm. Due to the objective of this work requires
high sensitivity, PDMS65 of 90 cm was chosen as the optimal capillary column
length.
Sample volumes processed up to 4 mL at 5 ng mL-1 of DPA solution were
studied. The results obtained are depicted in Figure 68D. As can be seen, a
remarkable increase on the analytical response (peak area) with the increase of
the sample volume was observed up to 2 mL. The signal increased very slightly
from 2 to 4 mL more likely due to the breakthrough of DPA. Taking into account
the required sensitivity, 2 mL was chosen as the optimum sample volume for
further experiments. However, it was found that the swabs used in the present
study absorbed about 125 µL of contact solution (See Section 3.3.1.2). According
to this observation, further experiments were carried out by processing 1800 µL
remaining in vial.
Although low extraction efficiencies (absolute recoveries) are achieved by IT-
SMPE, the analytical responses can be improved significantly owing to the large
volumes of sample that can be processed through the capillary column. The
extraction efficiencies of the proposed methodology were estimated by
comparing the amount of analyte extracted, which is the amount of the analyte
transferred to the analytical column, with the total amount of analyte passed
through the optimum extraction capillary. The amount of analyte extracted was
established from the peak areas in the resulting chromatograms and from the
calibration equations constructed through the direct injection of 72 μL of standard
solutions of the analyte. This volume is the inner volume of the PDMS65 capillary
of 90 cm used for IT-SPME. The extraction efficiency obtained was 7% which is in
accordance with those reported for this technique. In addition, a clean-up step
was examined after sample loading by introducing 120 µL of nanopure water
before changing the valve position. Significant loss of analyte was not observed,
thus clean-up was applied in order to remove fibers or compounds from cotton
which can be remain inside the capillary column. It was also tested to filter

Chapter 4. Results and discussion
148
solutions of DPA extracted from cotton swab through 0.45 μm nylon membranes
to prevent the introduction of fibers from cotton swabs. Nevertheless, the analyte
was not observed, may be owing to it was retained on nylon filter. Hence, samples
were not filtered before injection.
Analytical performance
Relevant analytical parameters such as calibration equations, linear working
range, LOD, LOQ and precision are shown in Table 27, both solution and swab-VAE
procedure. Satisfactory linearity within the tested concentrations was achieved.
The LODs and LOQs were calculated experimentally from solutions containing
concentrations providing signal/noise of 3 and 10, respectively. LODs and LOQs by
swab-VAE were 0.15 ng mL-1 and 0.5 ng mL-1, respectively. Converted into the
equivalent amount of DPA injected onto the system, the LOD and LOQ were 0.3
ng and 1 ng, respectively. These results showed that the sensitivity reached with
the proposed procedure is adequate for estimating DPA on shooter hands. The
precision for the analytical response was suitable at the working concentration
range, with intra and inter-day RSDs of 9 % and 15 %, respectively (n=4). The
precision of the retention times was also estimated obtaining acceptable RSD
values of 1.5 % and 2.5 % for intra and inter-day, respectively (n=3, 15 ng mL-1).
Satisfactory results for the study in solution were obtained as Table 27 shows. To
test the extraction efficiency of DPA from samples (including sample collection by
cotton swab and extraction from swab to water), the peak area of solution
obtained after extraction (2 µL of 10 µg mL-1 DPA spread on glass slide followed by
the protocol described in Section 3.3.1.2) was compared with the peak area
obtained for the equivalent concentration in solution directly injected (5 ng mL-1
of DPA). The extraction efficiency estimated was 37 ± 5 %. Recovery study in
samples at 10 ng mL-1 was performed and value obtained was 108 ± 16 %.

Chapter 4. Results and discussion
149
Table 27. Analytical data for DPA determination by IT-SPME-CapLC-DAD; a: ordinate, b:
slope, sa and sb: standard deviation of the ordinate and slope, respectively, R2:
determination coefficient.
Analysis of samples
Several samples collected from hands of police officers after shooting test
were analyzed by the optimized procedure. Additionally, the same procedure
described for shooting hands (See 3.6.4.1 section) was carried out for the hands of
each police before shooting to obtain blank samples. The samples were analyzed
without identification of volunteers. Figure 69 shows the chromatograms for
shooter (sample 2A) and non-shooter hand samples and UV-Vis spectra of
standard and sample. Although unknown compounds were extracted from
shooter hands, DPA was identified in samples by the concordance between
retention time (9.4 min) and UV-Vis spectra of standard DPA and the suspect peak
in the chromatogram of the sample. As can be seen in the figure, the
chromatogram of a blank showed no peak interferences at the retention time of
DPA.
Procedure
Linear range (ng mL-1)
Linearity y = a + bx (ng mL-1)
Precision (n=4, 15 ng mL-1)
LOD (ng mL-1)
LOQ (ng mL-1)
a ± sa b ± sb R2
RSDintra-day
(%) RSDinter-day
(%)
Solution 0.15 - 50 -7 ± 57 144 ± 2 0.9994 5 10 0.05 0.15
Swab 0.5 - 25 -13 ± 24 49.2 ± 1.7 0.9939 9 14 0.15 0.5

Chapter 4. Results and discussion
150
Figure 69. Chromatograms obtained for sample 2A (black solid line) and blank of non-
shooter hand (black dashed line). The inserts correspond to the matching of the spectra of
DPA found (blue line) in reference to the library of the standard (red line).
Quantification of the samples was carried out based on the regression
equation previously obtained (See Table 27). Table 28 shows the samples
screened and the quantification results. With a total of twenty one swab samples
and six tape kit samples, DPA was found and quantified in seventeen swab
samples (81 % of all swab samples analyzed) and, as can be expected due to tape
lift was worth sampler, three tape samples produced a signal above LOQ but DPA
was not detected in the other three. In the literature, few studies of DPA are
focused in hands and LODs reported are higher to that provided by the proposed
method (Bernal Morales, E. and Revilla Vázquez, A. L., 2004; Mei, H. et al., 2016;
Tong, Y. et al., 2001). The paired t test was used to evaluate statistically
differences between both hands, left and right. The p value obtained at 95%
significant level was higher than 0.05 (p=0.232). From these results, we can
conclude that the results from both hands were statistically equivalents.
0
1
2
3
4
5
6
7
8
9 10 11 12 13
Ab
sorb
ance
(A
.U.)
Time (min)
0
1
2
3
4
5
6
210 230 250 270 290 310 330 350
Ab
sorb
ance
(A
.U.)
Wavelength (nm)
a
b

Chapter 4. Results and discussion
151
Table 28. Samples and quantification by optimized extraction procedure followed by IT-
SPME-CapLC-DAD. *tape lift kit samples quantified by regression equation 14 times lower
than regression equation by cotton swab.
Police officer Sample Hand Number of shots Concentration (ng)
A 1 A left
25 4.4
2 A right 3.8
B 3 B left
12 2.7
4 B right 1.9
C 5 C left
25 3.0
6 C right 3.8
D 7 D left
25 2.8
8 D right ˂ LOD
E 9 E left
25 2.5
10 E right 3.2
F 11 F left
25 16.5
12 F right 3.4
G 13 G left
25 ˂ LOD
14 G right ˂ LOD
H 15 H left
25 4.9
16 H right ˂ LOD
I 17 I left
25 8.4
18 I right 9.5
J 19 J left
25 8.0
20 J right 4.3
K* 21 K left
25 ˂ LOD
22 K right ˂ LOD
L 23 L left and right
25 1.4
M* 24 M left and right
25 3.6
N* 25 N left and right
25 6.6
O* 26 O left and right
25 6.9
P* 27 P left and right
25 ˂ LOD
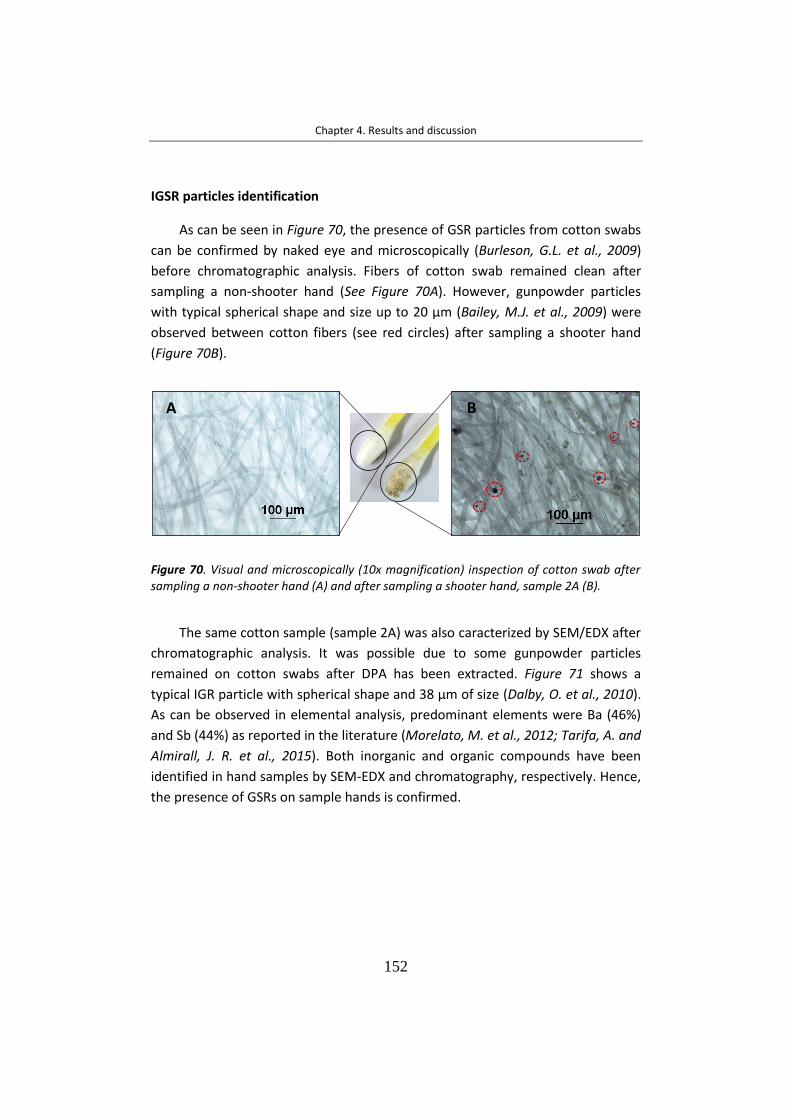
Chapter 4. Results and discussion
152
IGSR particles identification
As can be seen in Figure 70, the presence of GSR particles from cotton swabs
can be confirmed by naked eye and microscopically (Burleson, G.L. et al., 2009)
before chromatographic analysis. Fibers of cotton swab remained clean after
sampling a non-shooter hand (See Figure 70A). However, gunpowder particles
with typical spherical shape and size up to 20 µm (Bailey, M.J. et al., 2009) were
observed between cotton fibers (see red circles) after sampling a shooter hand
(Figure 70B).
Figure 70. Visual and microscopically (10x magnification) inspection of cotton swab after sampling a non-shooter hand (A) and after sampling a shooter hand, sample 2A (B).
The same cotton sample (sample 2A) was also caracterized by SEM/EDX after
chromatographic analysis. It was possible due to some gunpowder particles
remained on cotton swabs after DPA has been extracted. Figure 71 shows a
typical IGR particle with spherical shape and 38 µm of size (Dalby, O. et al., 2010).
As can be observed in elemental analysis, predominant elements were Ba (46%)
and Sb (44%) as reported in the literature (Morelato, M. et al., 2012; Tarifa, A. and
Almirall, J. R. et al., 2015). Both inorganic and organic compounds have been
identified in hand samples by SEM-EDX and chromatography, respectively. Hence,
the presence of GSRs on sample hands is confirmed.
A B

Chapter 4. Results and discussion
153
Figure 71. SEM image (a) and EDX spectra of IGSR found on swab sample (sample 2A)
after shooting (b).
The other main of this work was to examine the morphology and elemental
composition and distribution of GSR particles collected with the lift tape kit, the
typical police collector. Only particles which can be identified as GSR by their
composition and morphology were selected for SEM-EDX analysis. Roughly 6-7
particles per sample were studied. As reported in (Bailey, M.J. et al., 2009), this
number of particles is approximately equivalent to the particles that can be
recovered the shooter hand in a forensic scene. A portion between 3-40% of total
surface of sample was explored to find this number of particles, depending on the
sample. Figures 72 and 73 show the morphology and elemental data of particles
found on adhesive tapes collected after shooting. Most of the particles observed
were spherical. Less than 20 % of particles founded had irregular shape probably
due to they are distorted after shooting. As shown, particles had several surfaces
such as smooth, bumpy or covered with craters with or without metallic shine.
Greater than 60% of the particles founded had smooth surface. Their morphology
is an effect of conditions taking place during the firing. Particles can be
perforated, capped, broken or stemmed (Wallace, J.S. et al., 2008). Results of
SEM/EDX analysis of GRS particles founded on tapes from shooter hands are
displayed in Table 29.
a b

Chapter 4. Results and discussion
154
Figure 72. SEM images (left) and EDX spectra (right) of spherical particles found on tapes
used to collect GSR after shooting a gun: sample 21K.2 (A), sample 22K.7(B), sample
25N.4(C), sample 21K.4 (D) and sample 24 M.6 (E).
C

Chapter 4. Results and discussion
155
Figure 73. SEM images (left) and EDX spectra (right) of non-spherical particles found on
tapes used to collect GSR after shooting a gun: sample 22K.2 (A), sample 25N.3 (B), sample
21K.1 (C), sample 25N.2 (D).
C

Chapter 4. Results and discussion
156
Table 29. Summary of shape, surface and elemental composition of GRS particles founded
on tape lift kit from shooter hands.
As observed, most of the particles had the characteristic elemental
composition of GSRs which is mainly based on Pb, Sb, and Ba. All 37 GSR particles
founded, 35 of which contained on average 61% of Ba, 30 % of Sb and 9% of Pb.
The other two particles were excluded because contained 95 % of Pb and 97% of
Sb probably from bullet, shell or cartridge. The mean values were calculated from
results of Table 29. Moreover, some particles also contained other elements such
as Al, Cu and Fe at trace levels. About 66% of samples contained traces of Cu, 20%
Al and 3% Fe, while 12% of them contained both Al and Cu. Nevertheless, these
minority elements cannot be considered an evidence of shooting. Even though
these particles had similar elemental composition, their size varied over a range
from 3 to 30 µm according to the literature (Brozek-Mucha, Z. et al., 2007).
Elemental Composition (%)
Major Minor/Trace
Sample GSR Particle Shape Surface Ba Sb Pb Cu Al Fe
21 K
21K.1 Irregular Nonmetallic bumpy 62,5 33,2 4,3 X
21K.2 Spherical Nonmetallic smooth 62,4 25,7 11,9 X
21K.3 Spherical Nonmetallic bumpy 65,9 18,8 15,3 X
21K.4 Spherical Nonmetallic bumpy 46,8 40,2 13,0 X
21K.5 Spheroidal Nonmetallic smooth 65,7 14,8 19,5 X
21K.6 Spherical Nonmetallic smooth 87,5 11,1 1,4 X
21K.7 Spherical Nonmetallic bumpy 58,4 28,8 12,8 X
22 K
22K.1 Spherical Metallic smooth 61,5 33,5 5,0 X
22K.2 Irregular Metallic bumpy 98,8 0,7 0,5
22K.3 Spherical Nonmetallic smooth 48,0 37,3 14,7
22K.4 Spherical Metallic smooth 57,0 37,1 5,9 X
22K.5 Spherical Metallic smooth 61,8 32,7 5,5 X
22K.6 Spherical Metallic smooth 79,0 16,8 4,2 X
22K.7 Spherical Nonmetallic with hollows 50,6 33,4 16,0 X
24 M
24M.1 Spherical Metallic smooth 63,0 34,8 2,1
24M.2 Spherical Metallic smooth 63,2 30,6 6,3
24M.3 Spherical Nonmetallic bumpy 0,0 96,7 3,3 X
24M.4 Spherical Metallic smooth 60,4 37,2 2,3 X
24M.5 Spherical Nonmetallic smooth 51,1 34,5 14,3 X X
24M.6 Spherical Metallic smooth 69,2 20,3 10,5 X X
24M.7 Spherical Metallic smooth 54,8 37,3 7,9 X X
25 N
25N.1 Spherical Metallic smooth 68,8 24,7 6,4
X
25N.2 Irregular Nonmetallic bumpy 72,0 17,8 10,2 X
25N.3 Spheroidal Metallic bumpy 63,3 30,0 6,7
25N.4 Spherical Metallic smooth 53,0 39,7 7,4 X
26 O
26O.1 Spherical Metallic smooth 63,6 34,2 2,2
26O.2 Spherical Metallic smooth 61,7 35,2 3,0
X
26O.3 Irregular Nonmetallic bumpy 40,0 33,8 26,2
26O.4 Spherical Metallic smooth 0,3 4,9 94,9 X
26O.5 Spherical Metallic smooth 62,7 31,2 6,3
26O.6 Spherical Metallic smooth 50,6 35,8 13,6
27 P
27P.1 Spherical Nonmetallic bumpy 53,5 38,3 8,2 X X
27P.2 Spherical Nonmetallic bumpy 57,4 30,9 11,7 X
27P.3 Spherical Nonmetallic smooth 60,2 36,9 2,9 X
27P.4 Spherical Nonmetallic smooth 57,6 30,9 11,5 X
27P.5 Spheroidal Nonmetallic bumpy 48,9 30,7 20,5 X
27P.6 Spherical Nonmetallic bumpy 61,3 31,7 7,0 X

Chapter 4. Results and discussion
157
Figure 74. (A) SEM image, (B) overlay X-ray map of singles X-ray of Sb (C); Pb (D) and Ba (E)
of particle found on a tape used to collect GSR on hands after shooting.
Spatial distribution of the majority chemical elements of a GSR particle was
also observed by X-ray mapping. It consist in using colors for representing the
elemental distribution (Cardinetti, B. et al., 2004). In this case, Sb appears red, Pb
is green and Ba is blue. The X-ray mapped of sample 21K is shown together with
its corresponding SEM image (Figure 74A). Both images of single elements (Figure
74B) and their overlay (Figure 74C-E) give us both the distribution and merging of
the elements presents in the sample. As can be seen, dots representing Sb, Ba and
Pb came together and mixed in a GSR although these elements are scattered
throughout all sample. From the images, can be observed that predominant
element was Ba, followed by Sb and Pb. Thus, these mapping results were
according to the previous elemental composition studied. The results obtained by
SEM/EDX can be considered as indicative of IGSRs particles on shooter hands.
Conclusion
This work presents a reduced sample treatment: sampling from shooter
hands by using a cotton swab followed by VAE with water in short time. Aqueous
samples were directly processed in the miniaturized IT-SPME-CapLC-DAD system
for on-line clean-up and preconcentration of sample. It is worth notius that no
toxic solvents and low cost material were employed. The efficiencies of the IT-
10 µm
10 µm10 µm 10 µm
A B
EC D

Chapter 4. Results and discussion
158
SPME have been tested for several natures and lengths of the extractive phase, as
well as sample volume processed in order to improve the sensitivity. Highest
analytical responses were obtained for the longest PDMS65 capillaries (90 cm)
more likely due to π- π interactions and 1.8 mL of sample. The proposed approach
is a rapid, green and cost-effective option for detecting DPA on hand samples.
Satisfactory LOD (0.3 ng) and precision (RSDintra-day = 9%, RSDinter-day = 14%) were
achieved. In order to test the utility of the method for real cases, several shooter
hands were collected by cotton swabs, then DPA extraction was carried out with
water under vortex condition and finally, samples were processed by IT-SPME-
CapLC. The results showed that DPA was found and quantified in 81 % of samples,
so this method provides suitable selectivity and sensitivity at low concentration
levels (ng mL-1), which are concentrations typically found in hand samples.
Additionally, IGSRs inspection of swab samples was carried out by microscopy in
order to confirm the presence of GSRs on shooter hands. Furthermore, a few
shooter hands were collected by tape lift kit obtaining insufficient sensitivity for
DPA stimation. If organic compounds are detected in combination with inorganic
compounds, higher probative value can be achieve and false positives/negatives
can also be reduced for discriminating shooter hands. In this work, a sensible
chromatographic method to detect the organic compound DPA can be combined
with IGSR analysis by microscopy in order to obtain a valuable evidence of GSR
deposited on hands of a suspected shooter. Therefore, the proposed method is
helpful to determine whether a person has fired a gun in a forensic investigation.

Chapter 4. Results and discussion
159
4.1.2 PDMS AS SUPPORTING MATERIAL FOR SENSOR DEVELOPING
The use of PDMS as encapsulant material of derivatizing reagents for the
development of sensors has been studied in this Thesis. This Si-based material is a
suitable support for developing solid sensors to use in aqueous media. The
stabilization of the reagents as well as the diffusion of analytes from aqueous
matrix into PDMS where the reagent is embedded has been studied. In order to
improve the sensitivity, the polymeric matrix based on PDMS has been modified
by adding the inorganic compound TEOS. Several amounts of TEOS have been
tested for each application of these sensors. The derivatizing reagent is dispersed
into TEOS and then this mixture is added into the polymeric matrix. This
fabrication method presents advantages such as: (i) TEOS gives hidrophilicity to
the polymeric matrix avoiding unwanted reactions, (ii) the hybrid matrix mantains
the stability of the structure and (iii) the polymeric matrix protects the dyes
preserving their optical properties. Thus, the derivatizing reaction is carried out in
the sensor producing a color change. In addition, the presence of SiO2NPs in the
sensor has been studied in order to select the best composition which had good
gelation properties, stability and accessibility of the analyte to the reagent.
Semiquantitative analysis can be performed by visual inspection. Absorbance
measurements by DR and/or color values by DI can be carried out for quantitative
analysis. The developed sensors have been used for the in-situ detection of
amines of interest in a wide range of fields, such as environmental, industrial and
forensic. Increasing efforts have chiefly been focused on the search for these kind
of colorimetric sensors that allow simple, rapid, low-cost, green and on-site
analysis without the requirement of trained personnel.
This section has divided in the follow four subsections:
1. PDMS-based sensor containing NQS for the estimation of casein in effluents
from dairy industries.
2. Sensor based on PDMS/TEOS/SiO2NPs/NQS for controlling the dosage of the
biocide ADP in industrial formulations.
3. A solid colorimetric sensor based on PDMS/TEOS/SiO2NPs/NQS for the
analysis of amphetamine-like street samples.
4. A passive solid sensor based on PDMS/Co(SCN)2 for the in-situ colorimetric
estimation of the presence of ketamine in illicit drug samples.

Chapter 4. Results and discussion
160
4.1.2.1 PDMS sensor containing NQS as dispositive for the estimation of casein
in effluents from dairy industries
In this section, a colorimetric sensor based on the embedding of the
derivatizing reagent NQS into a PDMS/TEOS/SiO2NPs is proposed to estimate
casein. As mention before, NQS is a reagent typically used to determine amines.
This non-hazard reagent NQS forms colored derivatives with amines. Brown-grey
and orange derivatives are obtained with primary and secondary amines in
alkaline medium, respectively, making possible their colorimetric determination
(Quan-Min, L., Zhan-Jun, Y., 2007). The fabrication of this sensor is based on the
Patent ES248247B1. The evaluation of the main components in the effluents of
dairy industries such as casein is important due to the environmental problems
that can be caused. Therefore, this proposed sensor allows the in-situ monitoring
of casein in dairy industries effluents. Casein is denatured appling heat and the
amino acids formed are diffused from the solution to the sensor where the
derivatization with NQS is produced. The sensing support changes its color from
yellow to orange depending on the casein concentration. Thus, semiquatitative
analysis of casein can be performed by visual observation. Quantitative analysis
can be carried out by measuring the absorbance with a reflection probe or by an
image-processing tool. The potential parameters which can affect the response of
the sensor have been studied. The method validation has been done by applying
the BCA (Kralj, J.G. et al., 2014).
Optimization of the PDMS–NQS sensor
Taking into account the nature of the analyte, the composition of sensing
devices was optimized. For this aim, the amount of TEOS, SiO2NPs and NQS were
studied. Firstly, by keeping the amount of reagent and SiO2NPs constant, different
proportions of TEOS in the polymeric sensor were tested (50%, 60% and 80%
TEOS). Large amounts of TEOS made more difficult the gelation process (e.g.,
80%), probably owning to the fact that a lower PDMS content causes a slowdown
in the co-condensation (gelification) process. As it was expected, the gelation
process was depended on the ratio TEOS:PDMS. In addition, greater proportions
of PDMS reduced the gelation while the viscosity increased (Illescas, J.F. and
Mosquera, M.J., 2011; Li, D et al., 2013). As can be seen in Figure 75A, sensors
with 50% TEOS–50% PDMS provided higher responses than those using 60%
TEOS–40% PDMS. It should be noted that an increase of TEOS resulted in lower
Chapter 4. Results and discussion
161
responses. Although in these conditions, the viscosity of the gel was expected to
be lower and the diffusion of the analyte higher, the sensor conditions were not
the most adequate for the derivatization reaction. Based on these results, films
with TEOS–PDMS ratio (1:1) were selected for further experiments.
The incorporation of SiO2NPs to increase the porosity has been reported (Li,
D. et al., 2013). The increase in the gel pore size prevents cracking. Therefore,
different proportions of SiO2NPs were studied (0.1% and 1%) and no cracking was
observed in any case. Figure 75B shows, that the addition of higher amounts of
SiO2NPs decreased the analyte response. This effect can be explained by the fact
that the addition of NPs increased surface roughness and it is one of the dominant
factors determining the surface hydrophobicity (Monoudis, P.N. et al., 2009).
Finally, different percentages of NQS reagent were tested (0.05%, 0.1% and 0.2%).
Figure 75C shows the analytical signal (absorbance) versus the concentration of
NQS, as it was expected the response increases as the amount of NQS increases.
According to these results, the selected sensor composition was 50/50 weight
ratio TEOS/PDMS, 0.1% (w/w) SiO2NPs, 0.2% (w/w) NQS. In addition, the effect of
the temperature in response of the NQS sensor was also evaluated. At room
temperature the reaction kinetic was lower than that obtained by heating the
standard solution or the samples at 100 ºC during 10 min; that is to say that the
sensor needed long times to respond to casein concentration (Figure 75D).

Chapter 4. Results and discussion
162
Figure 75. Optimization of sensor composition and temperature conditions. (A) TEOS
percentage: 50% (a1) 60% (a2), (B) Proportion of SiO2NPs: 0.1% (b1) and 1% (b2), (C) NQS
percentage: 0.05% (c1), 0.1% (c2), 0.2% (c3). (D) Sensor at two different temperatures: (d1)
room temperature, (d2) 100 ºC for 10 min. Blue columns represent the signals of blanks
and red columns show the signals of the sensor with casein stock solutions.
The denaturalization and the breakage of the peptide bonds of the casein
takes place at high temperatures in basic or acid conditions. Thus, amino acids
0
0.1
0.2
0.3
0.4
0.05% NQS 0.1% NQS 0.2% NQS0
0.05
0.1
0.15
0.2
unheated heating 10 min
0
0.05
0.1
0.15
0.2
0.1% SiO2 np 1% SiO2 np0
0.05
0.1
0.15
0.2
0.25
0.3
50%TEOS 60% TEOS
Ab
sorb
anci
a
c1
c3
c1
d1
d2d1 d2
c3c2
c2
b1
b2
b1 b2a1A B
DC
a2a1
a2
Ab
sorb
anci
aA
bso
rban
cia
Ab
sorb
anci
a
Ab
sorb
ance
Ab
sorb
ance
0.1% SiO2NPs 1% SiO2NPs50% TEOS 60% TEOS
Ab
sorb
ance
Ab
sorb
ance
Unheated Heating 10 min0.05% NQS 0.1% NQS 0.2% NQS

Chapter 4. Results and discussion
163
from the casein react in the sensor with the NQS by heating the sample in basic
medium. From these results, the procedure to follow was to introduce the sensor
in a basic solution (pH 12) and to heat at 100 ºC during 10 min. The casein
molecule is formed from chains of amino acids. In order to test which amino acids
reacts with the PDMS–NQS sensor, amino acids with different structure were
selected as model compounds (leucine, proline, arginine and lysine). The
analytical responses achieved were higher for lysine and arginine heating for 10
min at 100 ºC than for proline and leucine (Figure 76). As it was expected, these
differences in the reaction were determined by their structures. The typical
structure of amino acids is composed of two functional groups: a carboxylic acid
group (—COOH) and an amine group (—NH2), along with a side-chain specific to
each amino acid. Only lysine, arginine and histidine contain an additional amino
group (Devlin, T.M. et al., 1992). Lysine and arginine are classified as basic-polar
(Timberlake, K.C., 1992) because to the second amino group is protonated and
often participates in hydrogen bonding and as a general base catalysis. The
presence of a second amino group in the molecule enhances the reaction kinetic
and the reaction product is observed quicker than when only one amino group is
present in the molecule.
Figure 76. Sensor absorbance obtained for different amino acids at a concentration level of
0.01 M. Blue: signal from sensor at room temperature for 18 h. Red: sensor heated for 10
min in a water bath.
18h without heating
heating 10 min 0
0.1
0.2
0.3
0.4
0.5
0.6
prolinaarginina
leucina lisina
Ab
sorb
ance
18 h sin calentar
Calentando 10 min
Ab
sorb
anci
aA
bso
rban
ce(A
U)
Heating 10 min
18 h without heating
lisineleucine
arginineproline

Chapter 4. Results and discussion
164
A kinetic study of the reaction between casein and PDMS–NQS sensor was
further investigated. The kinetic data were obtained by registering the absorbance
of colored sensors corresponding to a solution of 1 g L-1 of casein at five different
times (0, 5, 10, 15 and 20 min). As shown in Figure 77A the signal increased as
time progressed. By increasing the time, the analytical signal of the reaction
product increased, however the blank signal also increased due to the
degradation of the reagent in presence of the sample medium at high
temperatures. Finally, an intermediate time (10 min) was chosen taking into
account the maximum analytical response. The sample volume required for the
analysis of casein was also studied. The sample volumes tested were 0.5 mL, 1 mL
and 2.5 mL. Figure 77B shows the absorbance and images of the sensors for each
sample size. The largest volume (2.5 mL) was chosen as the best option.
Figure 77. (A) Kinetic study. Red line: blank, Blue line: signal in presence of casein 1 g L-1
and (B) Optimization of the sample amount for the estimation of casein.
0
0.05
0.1
0.15
0.2
0.25
0.3
0.35
0 min 5 min 10 min 15 min 20 min
Ab
sorb
anci
aA
bso
rban
cia
A
B
0
0.05
0.1
0.15
0.2
0.25
blank 0.5 mL 1 mL 2.5 mL
Ab
sorb
ance
(AU
)A
bso
rban
ce(A
U)
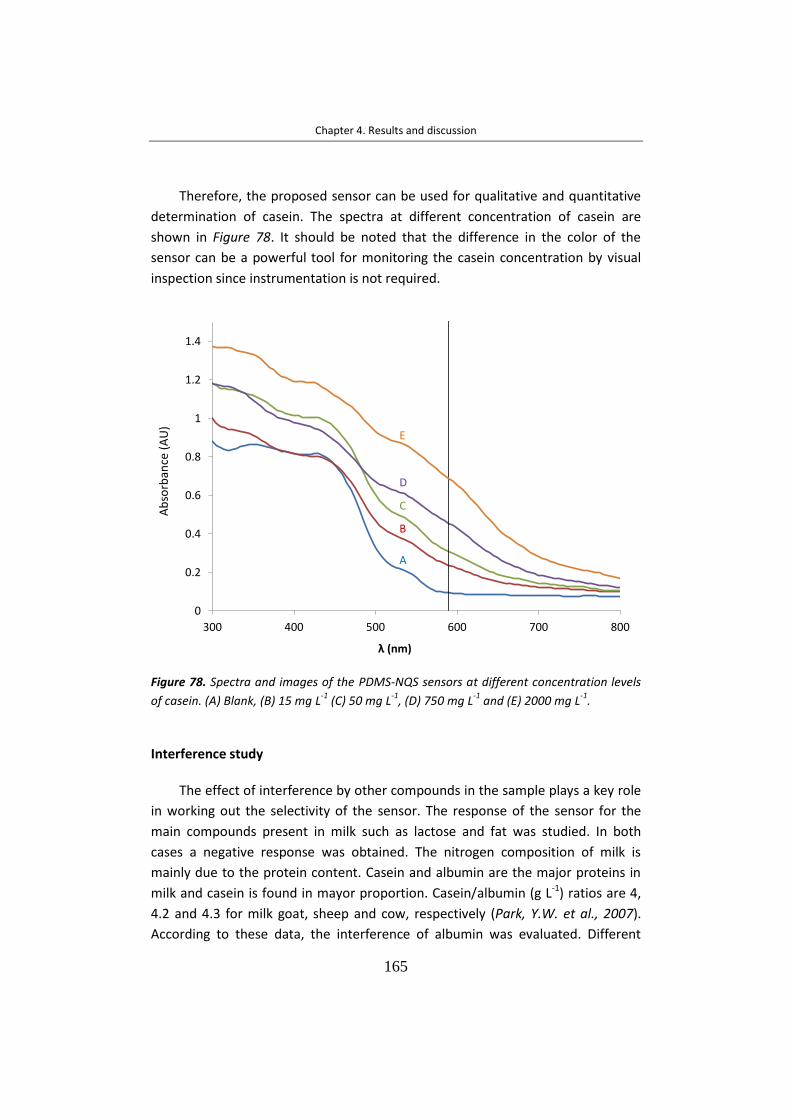
Chapter 4. Results and discussion
165
Therefore, the proposed sensor can be used for qualitative and quantitative
determination of casein. The spectra at different concentration of casein are
shown in Figure 78. It should be noted that the difference in the color of the
sensor can be a powerful tool for monitoring the casein concentration by visual
inspection since instrumentation is not required.
Figure 78. Spectra and images of the PDMS-NQS sensors at different concentration levels
of casein. (A) Blank, (B) 15 mg L-1
(C) 50 mg L-1
, (D) 750 mg L-1
and (E) 2000 mg L-1
.
Interference study
The effect of interference by other compounds in the sample plays a key role
in working out the selectivity of the sensor. The response of the sensor for the
main compounds present in milk such as lactose and fat was studied. In both
cases a negative response was obtained. The nitrogen composition of milk is
mainly due to the protein content. Casein and albumin are the major proteins in
milk and casein is found in mayor proportion. Casein/albumin (g L-1) ratios are 4,
4.2 and 4.3 for milk goat, sheep and cow, respectively (Park, Y.W. et al., 2007).
According to these data, the interference of albumin was evaluated. Different
0
0.2
0.4
0.6
0.8
1
1.2
1.4
300 400 500 600 700 800
Ab
sorb
anci
a
λ (nm)
Blanc
Blanc Bàsic
50ppm
750ppm
2000ppm
A
B
C
D
E
A
B
C
D
E
Ab
sorb
ance
(AU
)

Chapter 4. Results and discussion
166
concentrations (1000 mg L-1/250 mg L-1 and 500 mg L-1/125 mg L-1 for
casein/albumin) were assayed and the relative errors (%) obtained for the
estimation of casein in presence of albumin were 4.5 and 18% for the two
relations studied, respectively. The response of albumin was not significative
compared with casein response at the above mentioned ratios. Thus, we can
conclude that the method was appropriate for estimating casein in presence of
albumin at the concentration level expected in this study.
Analytical parameters
Table 30 shows the calibration equations calculated for the response of the
casein (0–1500 mg L-1) employing PDMS–NQS sensor, and using the DR probe and
DI by measuring the colour of the sensor with a colour processing software. For
casein concentrations higher than that of 2 g L-1 saturation of the sensor was
observed and no significant differences in signals were observed. Linearity
calibration equations were obtained by using the absorbance signal. The precision
of the analysis was also evaluated. The intraday precision was evaluated at
different concentrations (Figure 79). The RSD values were lower than 8%. These
results indicated that the RSD values were independent of the concentration
level.
Figure 79. Intraday precision of DR method obtained from the values of the absorbance at
590 nm for different casein concentration.
Ab
sorb
anci
a
Concentración
Ab
sorb
ance
(AU
)
Concentration (mg L-1)

Chapter 4. Results and discussion
167
For the interday precision, we compared the response of the sensor obtained
with four sensors prepared in four different batches under identical conditions.
The RSD values obtained for a concentration level of casein of 250 mg L-1 were
lower than 12%. The low RSDs indicated that the proposed sensor is a
reproducible device for practical applications. The LOD, calculated as the
concentration that provided a signal-to-noise ratio of 3, and the LOQ were 15 mg
L-1 and 45 mg L-1, respectively. These values indicated that the proposed method is
suitable for the estimation of casein in effluents.
The second procedure to perform quantitative analysis was DI analysis by
GIMP software. The linear calibration equation was obtained with the logarithm
of the concentration vs green RGB value. The analytical parameters are shown in
Table 30. Similar results than those obtained with the DR were reached.
Therefore, both procedures can be used if quantitative analysis is required. In
order to validate the method, the BCA method was applied. In Table 30 are also
shown the analytical parameters obtained by using the BCA method. The BCA
method provided higher slope than that obtained by using the PDMS–NQS sensor,
nevertheless it is more tedious requiring the dairy reagent preparation and longer
analysis time. In addition, the BCA method requires the dilution of the sample;
consequently the concentrations that can be detected or quantified in the sample
are higher than that reached by the sensor. Moreover, sensors were stable during
at least 12 months at room temperature since their analytical response, this is
their composition did not change within this period. The robustness of this sensor
represents an advantage over the derivatizations in solutions due to the instability
of most of the reagents employed.
Table 30. Analytical parameters obtained for casein determination in dairy sewages by the
three methods assayed.
Linearity y=a+bx (mg L-1) (n=6) RSD (%) (n=4)
Method a ± sa b ± sb R2 Intraday Interday
DR (19 ± 0.1) 10-2 (30 ± 2) 10-5 0.991 8 12
BCA (4 ± 1) 10-2 (110 ± 5) 10-5 0.995 7 10
DI 86 ± 1 -10 ± 1 0.991 7 9

Chapter 4. Results and discussion
168
Analysis of samples
Different dairy wastewaters samples from a pilot plant were analyzed by
using the proposed PDMS–NQS sensor. Samples from the different steps of the
CIP process were analyzed. The sample S1 was collected at the end of the first
rinse and the sample S2 was gathered 5 min after starting the acidic rinse. Sample
S3 was collected during the alkaline rinse, when the basic solution had passed
through the pipes for 5 min. Samples S4 and S5 were collected at the end of the
first rinse in the neutral wash at 40 ºC and 60 ºC, respectively. The analysis of fat
and lactose (Moliner-Martínez, Y. et al., 2014b) content provided the following
results: Sample S1 (0.4 g L-1, 0.178 g L-1), Sample S2 (0.15 g L-1, 0.019 g L-1), Sample
S3 (0.25 g L-1, 0.03 g L-1), Sample S4 (0.25 g L-1, 0.007 g L-1), Sample S5 (0.6 g L-1,
0.008 g L-1), for fat and lactose, respectively. Casein values for each sample were
obtained by applying BCA method acid assay and polymeric sensor probe. In Table
31 are shown the found concentrations of casein in the samples. For each sample,
a F-test for homogenous variance (at 95 % significant level) was applied and no
significant differences were obtained, so the methods were considered equally
precise. The paired t test (at 95 % significant level) was used to evaluate the
accuracy of the method. The BCA method was used as a reference method. The p-
value obtained at 95 % significant level was higher than 0.05 in both cases (p-
value = 0.259, by comparing reflectance mode and BCA, and p-value = 0.121, by
comparing DI and BCA). From these results we can conclude that both
methodologies provided statistically equal results, thus the proposed methods
can be used to determine casein in dairy effluent samples. The response of
albumin was negligible for both methods. For samples in which the concentration
of both proteins will be similar, the method would result in the total protein just
as the method of BCA would be.

Chapter 4. Results and discussion
169
Table 31. Found concentrations of casein mg L-1
obtained by the three quantification
methods (bicinchoninic acid assay, and the two methods of measurement for the
colorimetric sensor (DI and DR) in different samples.
Found concentration (mg L-1)
Sample Colorimetric sensor
BCA DR DI
S1 1280 ± 160 1260 ± 150 1090 ± 60
S2 91 ± 11 80 ± 10 90 ± 20
S3 180 ± 20 99 ± 12 120 ± 30
S4 1090 ± 130 940 ± 112 1150 ± 40
S5 1320 ± 160 970 ± 110 1220 ± 50
Qualitative analysis
Recently, some efforts have been dedicated to manufacture of colorimetric
sensors, since semiqualitative analysis by visual inspection avoiding the need of
instrumentation is not only cost-effective, but also is highly required for
application in real-time determination. The PDMS–NQS sensor proposed in this
work, changes its color from yellow to orange-brownish as function of the casein
concentration in the range 45–2000 mg L-1. The sensor color variation was evident
by visual observation, offering an appropriate approach to estimate casein in dairy
wastewaters even at low concentrations. Figure 80 shows the colorimetric images
corresponding to different increasing concentrations of casein. These images
allow a semiqualitative analysis to be deduced by visual inspection of a
colorimetric reference card.
Figure 80. Images of PDMS-NQS sensors at different concentration levels of casein, (a)
Blank, (b) 15, (c) 50, (d) 750 and (e) 2000 mg L-1
.
0
0.2
0.4
0.6
0.81
1.2
1.4
30
04
00
50
06
00
70
08
00
Absorbancia
λ(n
m)
Bla
nc
Bla
nc
Bàs
ic
50
pp
m
75
0p
pm
20
00
pp
m
A B C D E
ABCDE
a b c d e

Chapter 4. Results and discussion
170
Conclusions
In this section, the applicability of PDMS as polymeric support of sensing
devices doped with NQS for the estimation of casein in industial samples has been
demonstrated. The use of sensors sufficient flexible to handle an extensive range
of substrate concentration is required because wastewaters from the dairy
industry are usually produced intermitently, so the flow rates of these effluents
change significantly. PDMS-NQS sensor allows an in-situ analysis, thus
semiquantitative analysis of dairy effluents could be continuously performed.
Reagent preparation and use of expensive equipments are not strictly necessary
for casein determination through a reference color card. Also, quantitative
analysis could be performed by using DR and DI analysis. The results obtained
with both measurement methods were compared with BCA assay. All methods
presented similar sensitivity and precision, but it was found that the BCA reagent
was degraded while the polymeric sensor remained stable. Thus, the proposed
sensor overcomes one of the main limitations of the conventionally used BCA
assay, the degradation of the reagents. The main advantages of the NQS sensor
are the rapidity, simplicity, portability and the minimization of reagent handling.
Chapter 4. Results and discussion
171
4.1.2.2 A solid sensor based on doped hybrid composites for controlling the
dosage of ADP in industrial formulations
As demonstrated above, PDMS/NQS-based sensors change their colour in
presence of primary and secondary amines in alkaline medium. In an attempt to
extent the application of the PDMS-NQS sensor, it was evaluated for the in-situ
estimation of ADP, a primary amine-based biocide, in industrial formulations.
Although this biocide amine is essential component in detergents used in hygiene
to prevent diseases, its potent biological activity can be a threat for human and
environment. Different ratios of NQS, TEOS and SiO2NPs embedded in PDMS have
been optimized in order to improve the performance of the sensing device. Visual
inspection has also been tested for semiquantitative analysis. Absorbance
measurements by DR and/or color intensity mesurements by DI of colored
sensors have been evaluated for quantitative analysis. The validation of the
method has been carried out by comparing these results with the results obtained
with C18 solid suport derivatization. Detergent samples have been analyzed to
demonstrate the performance of the proposed sensor.
Optimization of the sensor composition
The influence of different compounds in the sensor composition was studied
in order to select the best hybrid composite which has good gelation properties,
stability and good accessibility of the analyte to the reagent. First, different
weight ratios of PDMS/TEOS (70/30, 50/50, 40/60, 20/80) were tested. TEOS
modifies the matrix structure giving hydrophilicity, but maintaining the stability
and inertness of PDMS. Additionally, TEOS promoted the better mixing of the
organic and inorganic phase to provide a homogeneous dispersion and so, and
homogeneous gel (Li, T. et al., 2015). As a consequence, the hybrid matrix
protects the embedded reagent and also preserves its optical properties.
However, high percentatges of TEOS (˃80 %) resulted in an increase of the gelling
time to almost 7 days at room temperature and broke easily. In contrast, sensors
with lower percentatges of TEOS were cured after 3h at 30 °C. Therefore, we
tested sensors with TEOS percentatges lower than 80 % to get favorable curing.
Then, we studied the addition of SiO2NPs (0.1 % and 1 %, w/w) in the PDMS/TEOS
matrices, since SiO2NPs can enhance the pore size of the polymeric matrix. As
shown in Figure 81A, NPs prevented cracking of the polymeric film due to the
reduction of the capillary pressure during the drying process (Li, D et al., 2013).
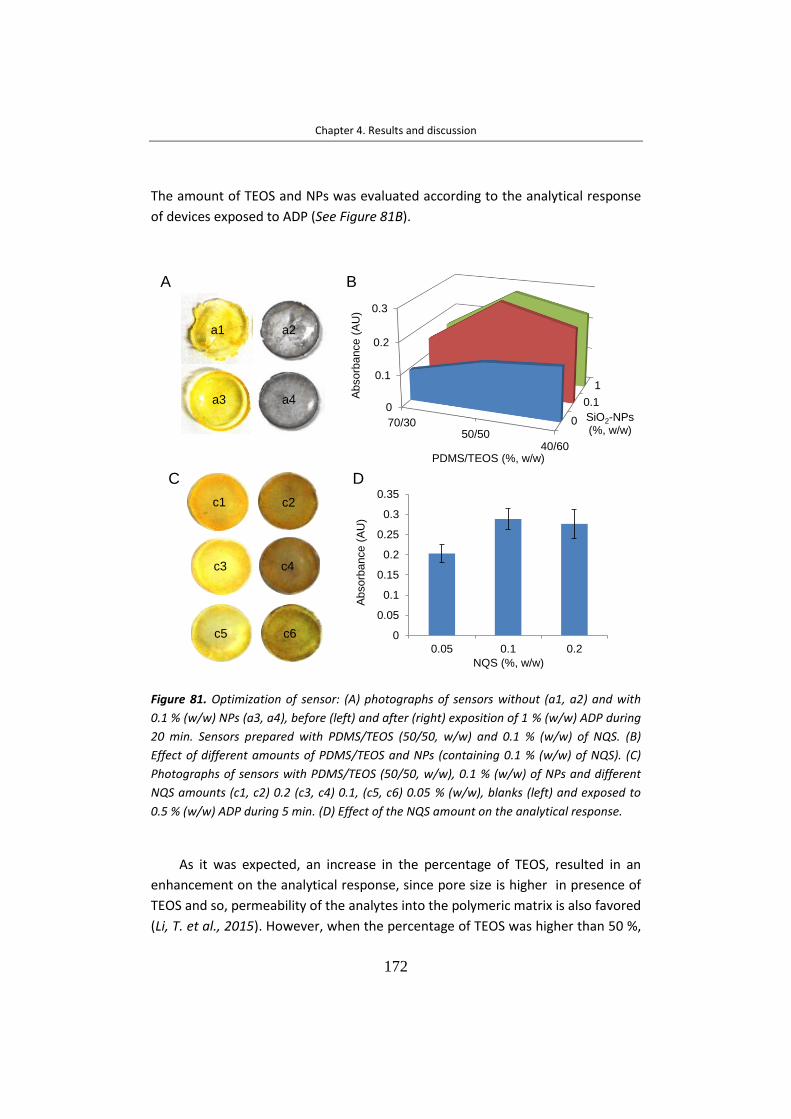
Chapter 4. Results and discussion
172
The amount of TEOS and NPs was evaluated according to the analytical response
of devices exposed to ADP (See Figure 81B).
Figure 81. Optimization of sensor: (A) photographs of sensors without (a1, a2) and with
0.1 % (w/w) NPs (a3, a4), before (left) and after (right) exposition of 1 % (w/w) ADP during
20 min. Sensors prepared with PDMS/TEOS (50/50, w/w) and 0.1 % (w/w) of NQS. (B)
Effect of different amounts of PDMS/TEOS and NPs (containing 0.1 % (w/w) of NQS). (C)
Photographs of sensors with PDMS/TEOS (50/50, w/w), 0.1 % (w/w) of NPs and different
NQS amounts (c1, c2) 0.2 (c3, c4) 0.1, (c5, c6) 0.05 % (w/w), blanks (left) and exposed to
0.5 % (w/w) ADP during 5 min. (D) Effect of the NQS amount on the analytical response.
As it was expected, an increase in the percentage of TEOS, resulted in an
enhancement on the analytical response, since pore size is higher in presence of
TEOS and so, permeability of the analytes into the polymeric matrix is also favored
(Li, T. et al., 2015). However, when the percentage of TEOS was higher than 50 %,
0
0.05
0.1
0.15
0.2
0.25
0.3
0.35
0.05 0.1 0.2
Ab
so
rba
nce
(A
U)
NQS (%, w/w)
A
0
0.1
1
0
0.1
0.2
0.3
70/3050/50
40/60
SiO2-NPs (%, w/w)
Ab
so
rba
nce
(A
U)
PDMS/TEOS (%, w/w)
B
C D
a1 a2
a3 a4
c1 c2
c3 c4
c5 c6

Chapter 4. Results and discussion
173
the free volume decreased. Therefore, the mass transfer resistance increased,
which resulted in a decrease in the permeation to the analyte and so, a decrease
in the response. This effect is particularly appreciable in presence of SiO2NPs,
since the pore size is also influence by NPs. SiO2NPs possess a dual function: to
improve the response owing the enhancement on the permeability of the
material and to provide a more homogenous color distribution, both attributable
to the enhancement of the size of the network pores. It should be noted that
higher amount of SiO2NPs did not provide significant differences on the analytical
response or in the mechanical stability. Herein, the reasonable addition of NPs
was 0.1 % (w/w) in order to reduce the chemical consumption. According to these
results, 50/50 weight ratio of TEOS/PDMS and 0.1 % (w/w) SiO2NPs were chosen
as the optimum composition. Figure 82 shows the topography images obtained by
Atomic Force Microcopy (AFM) for PDMS with embedded NPs and pristine PDMS.
The corresponding height profiles along the marked lines are included at the
bottom of each color map. From the different scales of these figures we can
already conclude that the introduction of NPs in the PDMS matrix considerably
modifies its surface morphology. Figure 82A-B allows the observation of the NPs
distribution at the surface. More quantitatively, the surface of PDMS presents a
roughness of 1 nm, while the same polymer with embedded NPs increases its
roughness to 15 nm. Furthermore, Figure 82C shows SEM image of sensor finally
chosen.
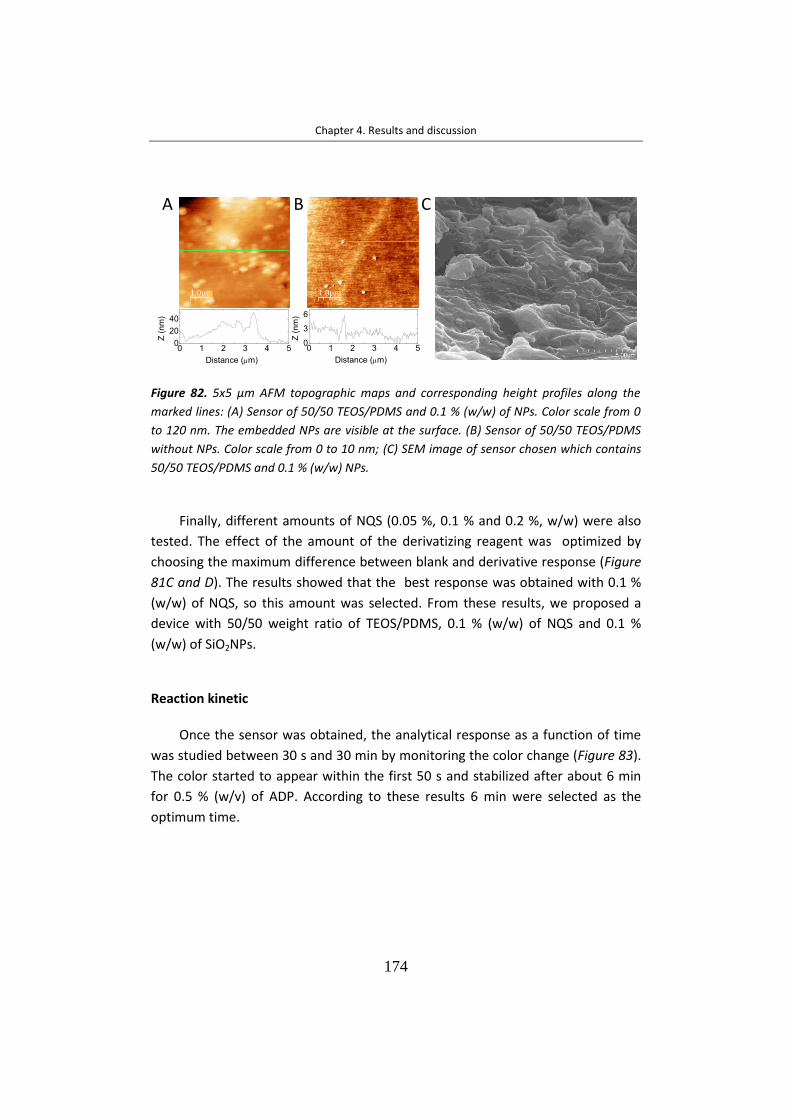
Chapter 4. Results and discussion
174
Figure 82. 5x5 µm AFM topographic maps and corresponding height profiles along the
marked lines: (A) Sensor of 50/50 TEOS/PDMS and 0.1 % (w/w) of NPs. Color scale from 0
to 120 nm. The embedded NPs are visible at the surface. (B) Sensor of 50/50 TEOS/PDMS
without NPs. Color scale from 0 to 10 nm; (C) SEM image of sensor chosen which contains
50/50 TEOS/PDMS and 0.1 % (w/w) NPs.
Finally, different amounts of NQS (0.05 %, 0.1 % and 0.2 %, w/w) were also
tested. The effect of the amount of the derivatizing reagent was optimized by
choosing the maximum difference between blank and derivative response (Figure
81C and D). The results showed that the best response was obtained with 0.1 %
(w/w) of NQS, so this amount was selected. From these results, we proposed a
device with 50/50 weight ratio of TEOS/PDMS, 0.1 % (w/w) of NQS and 0.1 %
(w/w) of SiO2NPs.
Reaction kinetic
Once the sensor was obtained, the analytical response as a function of time
was studied between 30 s and 30 min by monitoring the color change (Figure 83).
The color started to appear within the first 50 s and stabilized after about 6 min
for 0.5 % (w/v) of ADP. According to these results 6 min were selected as the
optimum time.
1.0µm
0 1 2 3 4 50
20
40
Z (
nm
)
Distance (m)
1.0µm
0 1 2 3 4 50
3
6
Z (
nm
)
Distance (m)
a b cA B C

Chapter 4. Results and discussion
175
Figure 83. Variation of device response for 0.5 % (w/v) of ADP as function of the reaction
time. The analytical signal was obtained by DR at 600 nm. Devices studied had optimum
composition.
Sensor stability
The storage stability of the derivatizing reagent in aqueous solution was
evaluated by measuring the absorption of a NQS solution (2.4 x 10⁻⁴ mol L-1) stored
in the dark and exposed to light during different times. Absorbance was measured
at 380 nm against a blank of water. Figure 84 shows the variation on the NQS
solution spectra in response to the two storage conditions over a period of 9 days.
The solution stored in the dark showed decrease in response after 1 day and this
decrease was very significant at 9 days. The degradation of NQS exposed to light
was more rapid than stored at the darkness (Figure 84). Thus, the use of NQS in
solution procedure is limited by the NQS unstability.
Blank
0
0.1
0.2
0.3
0.4
0 5 10 15 20 25 30
Absorb
ance (
AU
)
Reaction time (min)

Chapter 4. Results and discussion
176
Figure 84. Spectra of the stability of NQS in aqueous solution over time under dark (blue
lines) and light (red lines) storage. Responses are quantified as the absorbance at 380 nm
of NQS 2.4 x 10 -4
mol L-1
. Inset: Photography of colorimetric responses of NQS solution
against light at a) 5 min, b) 7 days, c) 0 min, d) 30 days.
The reagent NQS is unstable in solution but it remained stable inside the
PDMS (Figure 85).
Figure 85. Microscopic photographs of (A) sensor of a blank, (B) sensor after 3 min and (C)
after 6 min of 0.5 % (w/v) ADP contact at 100x magnification.
On the other hand, absorbance measurements by DR of sensors stored in the
dark and exposed to light were measured during several times. Absorbance was
measured at 600 nm against a blank. As can be seen in Figure 86, similar analytical
0
0.1
0.2
0.3
0.4
0.5
0.6
0.7
0.8
0.9
250 300 350 400 450 500 550
Ab
so
rba
nce
(A
.U)
Wavelength (nm)
Freshly prepared
5 min-dark
4 days-dark
9 days-dark
5 min-light
15 min-light
9 days-light
a b c d
A B C

Chapter 4. Results and discussion
177
signals were registered for the different storage conditions over time. Therefore,
NQS embedded into PDMS is more stable than NQS in solution. Sensors can be
used for eight months after fabrication providing reproducible responses.
Figure 86. Stability of sensors under two storage conditions over time (in the dark and
exposed to light) without ADP contact. Average responses and standard deviation for n=3.
The storage stability of the proposed sensors was evaluated by measuring
the responses over a period of 8 months under two conditions: dark and light
exposition. Figure 87A shows the variation of the analytical signal as function of
the storage. As can be seen, there were not significative differences in the
response, with RSD values of 4 %. Therefore, these results indicated that the
analytical response obtained with the NQS based sensors did not depend on the
storage conditions. Thus, composites can be directly used without daily reagent
preparation. By another hand, taking into account that one of the main
disadvantages of derivatization procedures is the reagent and reaction products
unstability, the NQS-ADP derivate stability in the sensor was studied from minutes
to months after the reaction. The storage stability was evaluated by measuring
the colorimetric response of sensors stored at room temperature in the dark. An
average stability of (98 ± 3) % (n=8) of the initial response was retained after 4
months of storage (See Figure 87B). These results indicated that derivatives inside
sensors were also stable for long periods of time and so, the colorimetric response
can be remeasured when required.
0
0.01
0.02
0.03
0.04
0.05
Just synthesized 8 days 1 month 8 months
Ab
sorb
an
ce (
AU
)
Storage time
Dark Light
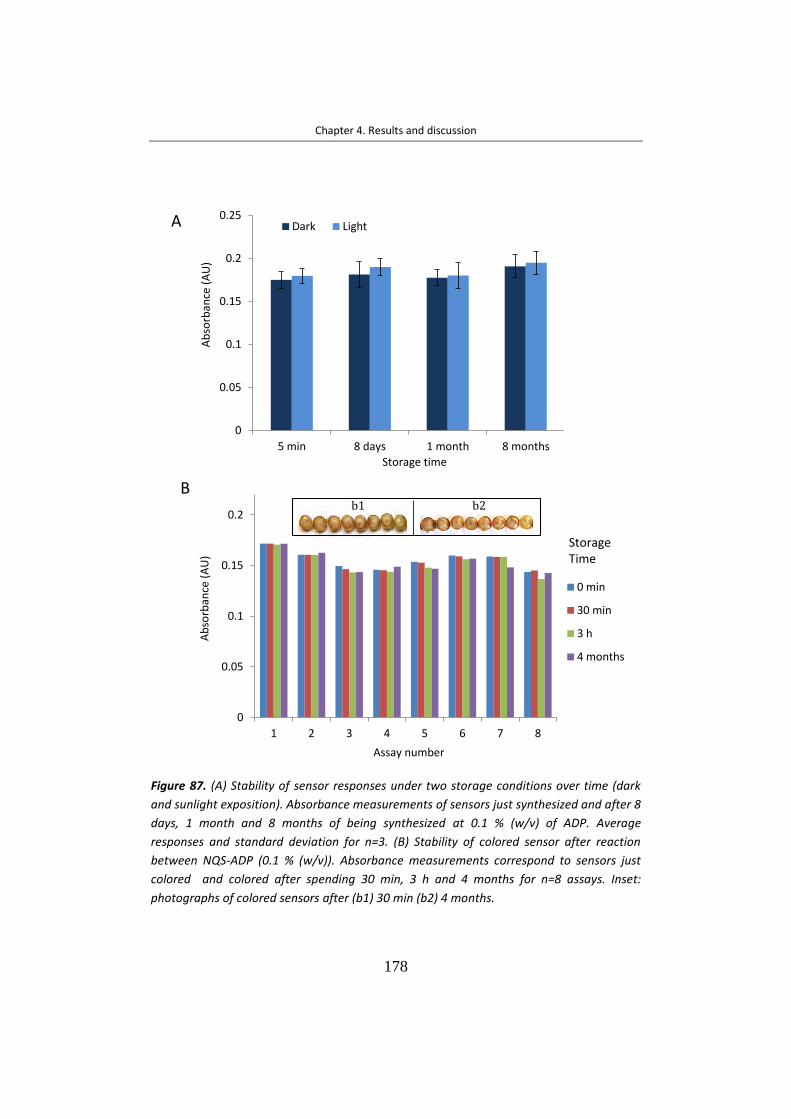
Chapter 4. Results and discussion
178
Figure 87. (A) Stability of sensor responses under two storage conditions over time (dark
and sunlight exposition). Absorbance measurements of sensors just synthesized and after 8
days, 1 month and 8 months of being synthesized at 0.1 % (w/v) of ADP. Average
responses and standard deviation for n=3. (B) Stability of colored sensor after reaction
between NQS-ADP (0.1 % (w/v)). Absorbance measurements correspond to sensors just
colored and colored after spending 30 min, 3 h and 4 months for n=8 assays. Inset:
photographs of colored sensors after (b1) 30 min (b2) 4 months.
0
0.05
0.1
0.15
0.2
1 2 3 4 5 6 7 8
Ab
sorb
ance
(A
U)
Assay number
0 min
30 min
3 h
4 months
Storage Time
b1 b2
B
A
0
0.05
0.1
0.15
0.2
0.25
5 min 8 days 1 month 8 months
Ab
sorb
ance
(A
U)
Storage time
Dark Light

Chapter 4. Results and discussion
179
Colorimetric doped hybrid sensor responses
The optimized sensors were tested for semiquantitative and quantitative
determination of ADP. The primary amine groups of ADP formed a gray–brown
derivative with NQS under basic pH conditions. Thus, the color of the device
changed from yellow-orangish to gray-brownish after 6 min of immersion in the
ADP solution (Figure 88A). Figure 88B shows the colorimetric response as function
of the concentration. The absorbance at 600 nm increased when concentration
increased up to 1 %. At higher concentrations the response kept constant due to
the saturation of the sensing device. Visual inspection of the colored sensors
allows a semiquantitative estimation of ADP concentration (See photograph inset
Figure 88B).
Figure 88. (A) Reaction scheme of ADP with NQS, together with a picture of the
derivatization procedure. (B) Left: spectra of ADP response at different concentrations
together with the photographs of devices (b1) Blank, (b2) 0.015 %, (b3) 0.05 %, (b4) 0.1 %,
(b5) 0.2 %, (b6) 0.5 % and (b7) 1 % (w/v) of ADP. Right: calibration curve and linear plot
(inset) of colored sensors at 600 nm of absorbance. Stoichiometry 2:1 (NQS:ADP).
A
0
0.1
0.2
0.3
0.4
0.5
300 400 500 600 700 800 900 1000
Absorb
ance (
U.A
.)
Wavelength (nm)
b1
b2
b3
b4
b5
b6
b7
b1 b2 b3 b4 b5 b6
B
0
0.05
0.1
0.15
0.2
0.25
0.3
0.35
0 0.2 0.4 0.6 0.8 1
Absorb
ance (
A.U
)
ADP concentration (%, w/v)
0
0.05
0.1
0.15
0.2
0 0.05 0.1
6 minADP

Chapter 4. Results and discussion
180
Analytical performance
Table 32 shows the calibration equations by using two different
measurement modalities (absorbance and color intensity measurements). RGB
color mode was selected according to previous works (Ornatska, M. et al., 2011).
A linear behavior of analytical signal versus ADP concentration was observed at
concentrations up to 0.1 % (w/v) with both modalities. These results were
compared with those obtained with a previously described method based on C18
solid support NQS-derivatization (Moliner-Martínez, Y. et al., 2004). Better
linearity was obtained employing absorbance measurements instead of color
intensity measurements. These results were comparable with those obtained by
using C18 cartridges. Satisfactory intra and inter-day RSDs have been achieved (5-
12 %) by the sensors in both modalities at a concentration level of 0.05 % (w/v) of
ADP. Adequate batch-to-batch precision was obtained for four sensors fabricated
in four different syntheses following the same procedure. Table 32 also shows
LOD and LOQ calculated as 3 sblank/b and 10 sblank/b, respectively, where b is the
slope of linear calibration curve and sblank is the standard deviation of the
absorbance or color intensity of ten blanks. Similar LODs were obtained by C18
solid support and polymeric sensors derivatization with posterior absorbance
measurements. The LOD for ADP reported in previously published works (Mondin,
A. et al., 2014) is lower than that achieved with the proposed PDMS-based sensor.
However, the LOD reached with the proposed method is adequate taking into
account the percentage of ADP in industrial formulations. In order to test the
selectivity of the method, an interference study was carried out. The absorbance
and color intensity of a synthetic matrix containing some common compounds
present in detergents such as lactic acid, ethylenediamine-tetraacetic acid,
isopropyl alcohol, phosphoric acid and nitrilotriacetic acid at percentages of 4 %,
16 %, 2 %, 1.4 % and 7 %, respectively were measured. The analytical response
was compared with the sensor response in synthetic samples that contained ADP.
There was not colorimetric response for the interferents assayed. Moreover,
compounds such as N-dodecyl-1,3-propanediamine and N-dodecylamine can be
present in LONZABAC raw material as impurities at percentages around 9 % and
1%, respectively. No colorimetric response was observed for these compounds at
the concentration levels present in standards and or samples (below 0.01 % and
0.001 % for N-dodecyl-1,3-propanediamine and N-dodecylamine, respectively).
Those percentages were well below the LODs calculated for these compounds,
0.02 % for N-dodecyl-1,3-propanediamine and 0.04 % for N-dodecylamine. Thus,

Chapter 4. Results and discussion
181
it can be concluded that the proposed sensor provides a selective determination
method for ADP in industrial samples.
Table 32. Figures of merits obtained with the different measure approaches for the ADP
determination with the proposed NQS-sensor, and comparison with the figures of merit
obtained with C18-solid-support derivatization.
a Absorbance at 600 nm in DR mode vs concentration (%, w/v);
b (1/green color intensity) vs concentration (%, w/v);
c Absorbance at 480nm vs concentration (%, w/v).
Application to detergent industrial formulations
The applicability of the sensor to estimate ADP was evaluated by analyzing
different formulations of detergent samples (S1-S3). As it was expected in all the
analyzed samples, a semiquantitative analysis could be performed by the color
change observed in the sensor after the addition of ADP. Table 33 shows the
found ADP concentrations in samples. Firstly, a statistical study of the precision
achieved which each procedure, DR and DI, compared with the C18-SPE solid
support NQS-derivatization was carried out. The F-test for homogeneous variance
(at 95 % significance level) was tested for each sample, and no significant
differences were obtained (the values of Fcal for each sample with each procedure
were in the range 0.2067–5.4774, which were lower than Fstat 0.39 at 95 %), so
both methods can be considered equally precise. In order to validate the results
obtained with the sensor, the same samples were analyzed with the C18-SPE solid
support NQS-derivatization. A linear regression with C18 support derivatization
versus the values obtained with sensors was tested to check if the joint
confidence region for slope and intercept included the point (intercept=0,
slope=1). Using as x the values obtained with C18 solid support derivatization and y
the values obtained by using the composites, the point (0,1) was included in the
Procedure
Linear range (%, w/v)
Linearity y = a + bx
a,b,c
RSDIntra-day
(%); (n)
RDSInter-day
(%); (n)
LOD (%, w/v)
LOQ (%, w/v)
a ± sa b ± sb
(%, v/w)
R2
Sensor/DRa 0.016 - 0.1 0.02 ± 0.01 1.32 ± 0.13 0.989 7; (6) 12;(4) 0.018 0.06
Sensor/DIb 0.04 - 0.1 0.011 ± 0.001 0.043 ± 0.003 0.982 5; (6) 11;(4) 0.013 0.04
C18-SPEc 0.04 - 0.1 0.06 ± 0.02 4.9 ± 0.2 0.993 4; (3) 8; (3) 0.012 0.04

Chapter 4. Results and discussion
182
joint confidence region, and thus, there were not statistical differences between
the results provided by both methods, so it can be concluded that both
methodologies provided comparable results (at 95 %). In addition, a statistical
comparison of the results obtained with the proposed PDMS sensor and the
percentages of ADP labeled by the manufacturer were carried out by using a t-
test. The t experimental values calculated when the DR measurements were used,
were 0.3464, 1.7321 and 2.7713 for S1, S2 and S3, respectively. The t
experimental values obtained when the color intensity measurements were
carried out were 0.3464, 3.0311 and 1.0825 for S1, S2 and S3, respectively. In all
cases, these values were in accordance with the labeled values at a significance
level of 95% (ttabulated=4.3027). Matrix effects were evaluated by spiking the
detergent samples with a known concentration of ADP. For C18 solid support
derivatization, the recovery values were between 78 % and 109 % while using
derivatization into sensors, the recovery ranged between 80 % and 112 %. Hence,
in both cases, the recovery values showed that matrix effect was not present
under the optimized experimental conditions. These results demonstrated that
the use of sensors is a good alternative to develop suitable, reliable and precise
device for ADP estimation.
Table 33. Concentration of ADP found in the analysed samples obtained with the PDMS-
based sensor by DR and DI. Comparison with the results obtained with C18 Solid-Support
derivatization.
Procedure S1 (%, w/v) S2 (%, w/v) S3 (%, w/v)
Sensor/DR 4.1 ± 0.5 2.7 ± 0.3 1.52 ± 0.05
Sensor/DI 3.8 ± 0.7 2.3 ± 0.4 1.50 ± 0.16
C18 -SPE 4.4 ± 0.3 3.1 ± 0.2 1.67 ± 0.04
Comparative study of different strategies
Table 34 compares the main analytical properties of the different tested
procedures. The commended strategy is the derivatization into sensors owing to
the simplification of the entire analytical process. The higher stability of the NQS
embedded into the polymeric matrix allows the use of sensors after long time of
their fabrication. Once the sensor is synthesized, it can be directly used for
controlling the ADP dosage in industrial formulations since it does not need

Chapter 4. Results and discussion
183
reagent preparation. The sensors and a vial containing the sample are the unique
material required to perform the analysis. Moreover, the small size of the sensors
reduces costs in reagents and it allows a cost effective analysis. By contrary, C18
solid support derivatization, as well as procedures with NQS in solution require
more steps: NQS solution just prepared before use, derivatization and extraction
of derivatives.
Table 34. Comparison of different properties of the procedures assayed. More +: better
option.
Steps C18-SPE Sensor/DR Sensor/DI
Cartridge and NQS solution preparation, sampling, derivatization, extraction
Derivatization
Derivatization
Portability + ++ +++ LOD (%, w/v) 0.012 0.018 0.013 Rapidity + +++ +++ Cost + ++ +++
Conclusions
This study presents a colorimetric sensor based on NQS immobilized in
PDMS/TEOS/SiO2NPs to control the dosage of ADP in detergent samples from
industrial formulations. The simplicity and the low amounts of reagents required
results in a low cost fabrication process. The sensor is synthetized in
approximately 3 h, and no leaching of the reagent to the solution is observed.
However, it allows the fast diffusion of the analyte from the matrix to the sensor
and the reaction with the entrapped NQS. The main advantage of the proposed
sensor is its long-term stability (more than 8 months after fabrication). Moreover,
the assay does not require addition of external reagents, because all the reagents
needed are immobilized in the sensor allowing a rapid estimation. The color
change is observed when the sensor is immersed in the ADP solution without
sample pretreatment or conditioning. The color change depends on the
concentration level. Thus, semiquantitative analysis can be made by naked eye
and/or quantitative analysis can be carried out by DR and/or DI. In order to avoid
additional instrumentation, a smartphone with a free software could be used to
improve the portability. The sensor provides good LODs and precision and it can

Chapter 4. Results and discussion
184
be considered aviable device owing to its portability, stability, reliability and low
cost. Thus, the developed procedure is a green, rapid, and simple alternative for
ADP estimation without trained personnel or complicated sample treatment.

Chapter 4. Results and discussion
185
4.1.2.3 A solid colorimetric sensor for the analysis of amphetamine-like street
samples
A rapid and low-cost kit for the in-situ screening of illicit drugs such as AMP,
MAMP, MDMA and MDA is developed. The proposed kit is based on the same
sensor used for the casein and ADP detection previously explained, that is, a
sensor constituted of PDMS/TEOS/SiO2NPs doped with NQS reagent. In-situ
screening is possible through the observation of color of the sensor after its
introduction into a basic solution with the sample. After reaction, quantitative
analysis has been carried out in the lab by direct measurement of the absorbance
by DR and also by measurement of color intensity after processing its DI. The kit
has been applied to ecstasy street samples and the accuracy has been validated
by comparing the results with those obtained by LC. The tested samples have
been also characterized by FTIR-ATR spectroscopy.
Effect of sensor shape and composition on the optical response
The sensor composition is a key parameter in order to reach quality analitycal
responses. Moreover, in this work, the shape of the sensing devices was also
evaluated using AMP as model compound. Square sensors of 2 x 2 mm side and 1
mm thickness were tested by introducing them in vials containing 0.01 g of AMP
in 1 mL of buffer (final concentration, 0.01 g mL-1). It was observed that the
formation of the color at the edges of the sensor started a few minutes after its
introduction into the AMP solution, but the complete coloration of the sensor
required approximately 20 min. Circular sensors (8 mm diameter, 1 mm thickness)
were also tested for solutions with the same concentration of AMP. Faster
responses were observed for the circular sensors, and complete color
development was reached in 10-15 min. In order to reduce the amount of reagent
and materials, small circular sensors of 3 mm of diameter and 1 mm of thickness
were selected for further assays. The effect of the proportion of PDMS to TEOS on
the sensor response was evaluated for sensors exposed to AMP and MAMP. The
PDMS/TEOS ratios tested were 100/0, 50/50 and 40/60 (w/w). SiO2NPs at a
percentage of 0.1 % (w/w) were added to increase the matrix porosity and to
reduce the cracking of the sensor (Li, D. et al., 2013). The results of this study are
depicted in Figure 89. As it can be seen from Figure 89A, sensors with a 50/50
PDMS/TEOS weight ratio provided the highest analytical signals. In addition, this
composition also lead to the most homogeneous color distribution, as derived
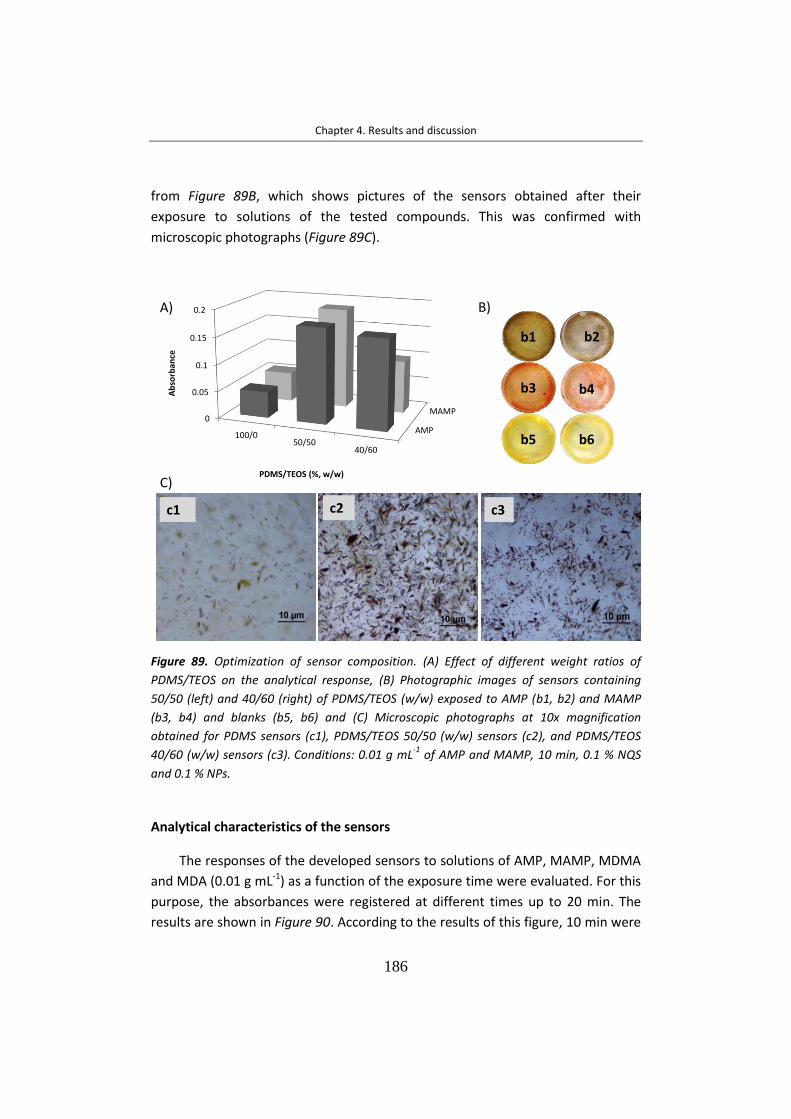
Chapter 4. Results and discussion
186
from Figure 89B, which shows pictures of the sensors obtained after their
exposure to solutions of the tested compounds. This was confirmed with
microscopic photographs (Figure 89C).
Figure 89. Optimization of sensor composition. (A) Effect of different weight ratios of
PDMS/TEOS on the analytical response, (B) Photographic images of sensors containing
50/50 (left) and 40/60 (right) of PDMS/TEOS (w/w) exposed to AMP (b1, b2) and MAMP
(b3, b4) and blanks (b5, b6) and (C) Microscopic photographs at 10x magnification
obtained for PDMS sensors (c1), PDMS/TEOS 50/50 (w/w) sensors (c2), and PDMS/TEOS
40/60 (w/w) sensors (c3). Conditions: 0.01 g mL-1
of AMP and MAMP, 10 min, 0.1 % NQS
and 0.1 % NPs.
Analytical characteristics of the sensors
The responses of the developed sensors to solutions of AMP, MAMP, MDMA
and MDA (0.01 g mL-1) as a function of the exposure time were evaluated. For this
purpose, the absorbances were registered at different times up to 20 min. The
results are shown in Figure 90. According to the results of this figure, 10 min were
A) B)
b1 b2
b3 b4
b5 b6
C)
c1 c2 c3
AMP
MAMP0
0.05
0.1
0.15
0.2
100/050/50
40/60
Ab
sorb
ance
PDMS/TEOS (%, w/w)
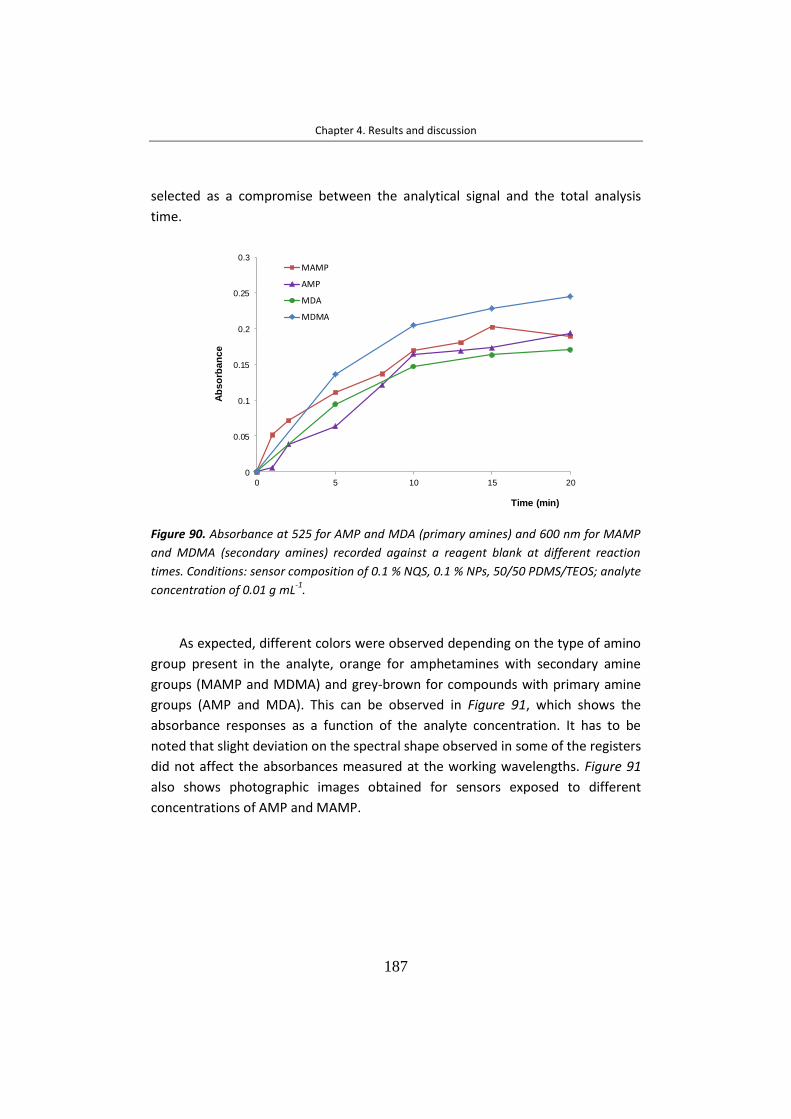
Chapter 4. Results and discussion
187
selected as a compromise between the analytical signal and the total analysis
time.
Figure 90. Absorbance at 525 for AMP and MDA (primary amines) and 600 nm for MAMP
and MDMA (secondary amines) recorded against a reagent blank at different reaction
times. Conditions: sensor composition of 0.1 % NQS, 0.1 % NPs, 50/50 PDMS/TEOS; analyte
concentration of 0.01 g mL-1
.
As expected, different colors were observed depending on the type of amino
group present in the analyte, orange for amphetamines with secondary amine
groups (MAMP and MDMA) and grey-brown for compounds with primary amine
groups (AMP and MDA). This can be observed in Figure 91, which shows the
absorbance responses as a function of the analyte concentration. It has to be
noted that slight deviation on the spectral shape observed in some of the registers
did not affect the absorbances measured at the working wavelengths. Figure 91
also shows photographic images obtained for sensors exposed to different
concentrations of AMP and MAMP.
0
0.05
0.1
0.15
0.2
0.25
0.3
0 5 10 15 20
Ab
so
rba
nc
e
Time (min)
MAMP
AMP
MDA
MDMA

Chapter 4. Results and discussion
188
Figure 91. Photographic image of the analysis by the colorimetric kit (composed by a vial
with basic buffer, NQS-PDMS sensors and powder/pill drug) for AMP (above) and MAMP
(down), together with absorbance spectra at different concentrations a) blank, b) 0.005, c)
0.01, d) 0.03 and f) 0.05 g·mL-1
of AMP (A) and MAMP (B). Inset: photographic image of
sensors containing previous concentration levels. Optimal conditions.
The reliability of the proposed procedure was tested by analyzing aqueous
solutions containing AMP, MAMP, MDA and MDMA. The concentrations studied
were 0.0025-0.05 g mL-1 for AMP and MAMP, and 0.0025-0.025 g mL-1 for the
ecstasy-type analytes (MDMA and MDA). The calibration equations, precision data
and LODs obtained by using DR and DI are shown in Table 35 and Table 36,
respectively. Satisfactory linearity was obtained with the two approaches tested.
The precision was evaluated by obtaining the intra and inter-day precision at a
concentration of 0.015 g mL-1 of the tested drugs. The batch-to-batch RSD values
were lower than 15 % in all instances. These results indicated that the proposed
procedures have adequate precision. The LODs (calculated as 3sa/b, where sa is
the standard deviation of the intercept and b is the slope of linear calibration
graph) were in the 0.002-0.005 g mL-1 range. According to the above results, the
analytical performance of the two proposed approaches is similar, although the
inter-day precision was slightly better with the DI-based approach.
0
0.1
0.2
0.3
0.4
0.5
0.6
300 400 500 600 700 800
Ab
sorb
an
ce
Wavelength (nm)
Basic buffer
10 min
10 min
0
0.1
0.2
0.3
0.4
0.5
0.6
0.7
300 400 500 600 700 800 900
Ab
sorb
an
ce
Wavelength (nm)
abc
d
e
a
b
c
d
e
A)
B)
edcba
edcba

Chapter 4. Results and discussion
189
Table 35. Analytical data for the estimation of AMP, MAMP, MDA and MDMA by using DR.
Absorbances measured at 525 nm and 600 nm for secondary and primary amines,
respectively. Concentrations expresses in g mL-1
; sa and sb: standard deviation of the
ordinate and slope, respectively.
Table 36. Analytical data for the estimation of AMP, MAMP, MDA and MDMA by using
color intensity of the DI. Concentrations expresses in g mL-1
; sa and sb, standard deviations
of the ordinate and the slope, respectively.
The proposed conditions were applied to other substances used as
adulterants and diluents in clandestine samples. The compounds examined were
diluents such as caffeine, EP, procaine, paracetamol, ibuprofen, acetylsalicylic
Compound
Linearity,
y = a + bx (mL g-1
) RSDIntra-day, n=3 (%) RSDInter-day, n =3 (%)
LOD (g mL
-1)
AMP
a; sa : 0.05 ; 0.01 b ;sb: 5.9 ; 0.9 R
2 = 0.985
11 14 0.004
MAMP
a ; sa: 0.119; 0.005 b ; sb: 5.2 ;0.2 R
2 = 0.992
4 12 0.003
MDA
a ; sa: 0.03; 0.003 b ;sb: 3.7 ; 0.5 R
2 = 0.990
10 13 0.002
MDMA a ; sa: 0.05; 0.01 b ;sb: 7.9 ; 0.5 R
2 = 0.996
7 11 0.002
Compound
Linearity,
y = a + bx (mL g-1
) RSDIntra-day, n=3 (%) RSDInter-day, n =3 (%)
LOD (g mL
-1)
AMP
a ; sa: 0.014; 0.001 b ; sb: 0.42 ;0.03 R
2 = 0.968
2 7 0.005
MAMP
a ; sa: 0.012 ; 0.001 b ; sb: 0.212 ; 0.013 R
2 = 0.981
3 7 0.004
MDA
a ; sa: 0.013 ; 0.001 b ; sb: 0.20 ; 0.07 R
2 = 0.983
7 11 0.005
MDMA a ; sa: 0.014; 0.001 b ; sb: 0.28; 0.02 R
2 = 0.994
5 9 0.003

Chapter 4. Results and discussion
190
acid, levamisole, starch, mannitol, sucrose, glucose, lactose and magnesium
sulfate. The sensors were also tested for other drugs such as cocaine, cannabinol,
cannabidiol, tetrahydrocannabinol and scopolamine. All the tested compounds
were assayed individually at a concentration of 0.005 g mL-1. The visual inspection
of the sensors revealed that their colorwas not changed by any of the tested
compounds, except EP and procaine. These two compounds rendered the sensors
indistinguishable to those obtained for primary amphetamines.
Although the two compounds are rarely found in ecstasy pills (Nguyen, T.A.H.
et al., 2015) they possess amino groups which can react with NQS. Thus, if a
sample is positive for primary amphetamines, a confirmatory test would be
required to check the presence of EP and/or procaine. The requirement of a
confirmatory test (typically a chromatographic assay) is a limitation found in most
of the proposed on-site colorimetric tests (Camilleri, A.M. et al., 2005). The
stability of the sensor over the time was also examined. Since the application of
NQS as a colorimetric reagent requires freshly preparation, derivatization with
NQS in solution would not be useful for on-site analysis. Unlike in aqueous
solutions, NQS remains stable inside the PDMS/TEOS matrix (See Section 4.1.2.2).
In the present study, the response of the sensors over the time was evaluated
using MAMP as model compound. The sensors were put into contact with the
solutions of MAMP (0.01 g mL-1). After the reaction time, the sensors were
removed from the sample vials, and stored dry in polyethylene bags at ambient
temperature until measurement. The absorbance of sensors was measured after
different storage times; the responses for blanks were also registered. The results
can be seen in Figure 92. This figure shows excellent storage stability of the
sensors over a period up to three years, with RSD of the signals ≤ 10 %. On the
other hand, once the sensor is removed from the sample solution the response
remained stable within experimental variations for several weeks, which would
allow further processing of the sensor, if required. As an example, RSDs ≤ 7 %
were found for signal values registered 4 months after the first measurement
carried out immediately after exposure of the sensor to MAMP (n =5).
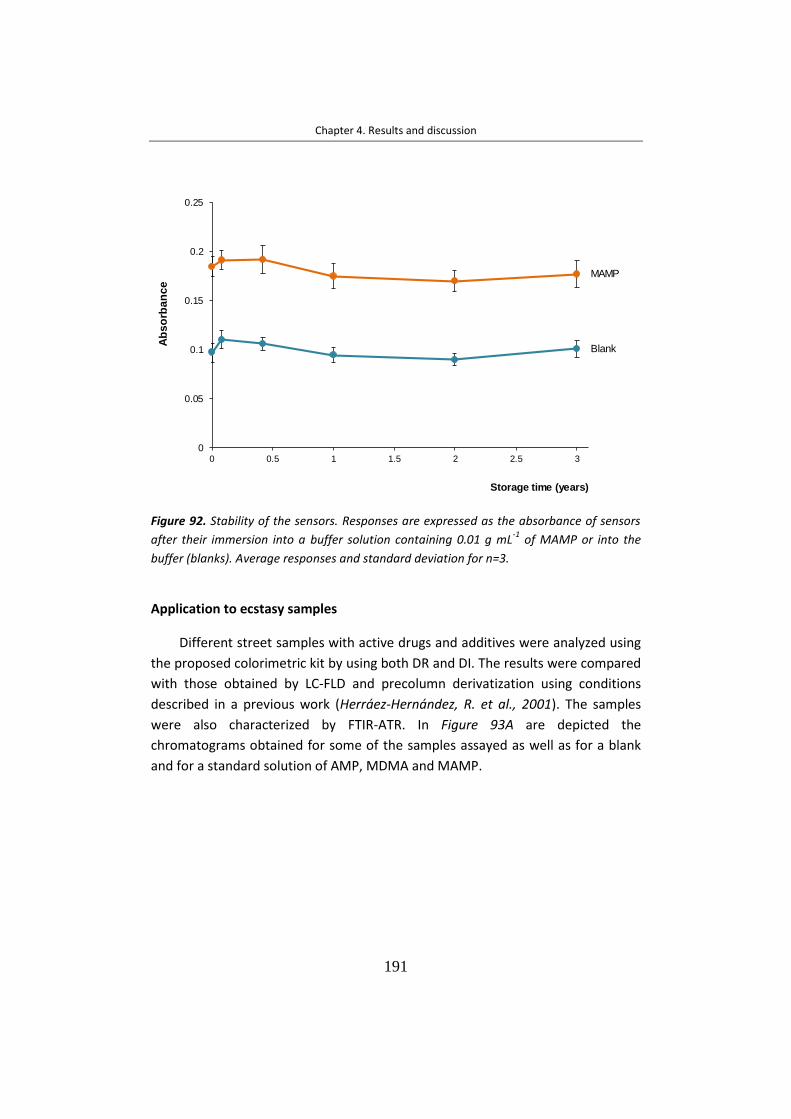
Chapter 4. Results and discussion
191
Figure 92. Stability of the sensors. Responses are expressed as the absorbance of sensors
after their immersion into a buffer solution containing 0.01 g mL-1
of MAMP or into the
buffer (blanks). Average responses and standard deviation for n=3.
Application to ecstasy samples
Different street samples with active drugs and additives were analyzed using
the proposed colorimetric kit by using both DR and DI. The results were compared
with those obtained by LC-FLD and precolumn derivatization using conditions
described in a previous work (Herráez-Hernández, R. et al., 2001). The samples
were also characterized by FTIR-ATR. In Figure 93A are depicted the
chromatograms obtained for some of the samples assayed as well as for a blank
and for a standard solution of AMP, MDMA and MAMP.
0
0.05
0.1
0.15
0.2
0.25
0 0.5 1 1.5 2 2.5 3
Storage time (years)
Ab
so
rba
nc
e
Blank
MAMP

Chapter 4. Results and discussion
192
Figure 93. A) Chromatograms obtained for a blank (water), a standard solution of MDMA
(16.5 mg mL-1
), a street samples containing MDMA (S3), and samples containing mixtures
of MDMA and MAMP (S4: (27.4 ± 0.6) % of MDMA and (46 ± 4) % of MAMP; S5: (65 ± 5) %
of MDMA and (5.1 ± 0.2) % of MAMP; S6: (17 ± 1) % of MDMA and (34 ± 1) % of MAMP).
B) FTIR-ATR spectra obtained for a street sample (S1) and for pure MDMA.
The results obtained by LC showed that MDMA was the only amphetamine-
type compound found in three of the tested samples (S1-S3), whereas the other
samples assayed (S4-S6) contained mixtures of MDMA and MAMP (the
percentages of both drugs composition S4-S6 is indicated in this figure). It should
be noted that the RSDs of the results obtained by the LC approach ranged from 2
to 9 %; which are consistent with those previously reported (Herráez-Hernández,
R. et al., 2001). No other peaks corresponding to compounds reactive towards
0
50
100
150
200
250
300
350
400
450
500
0 2 4 6 8 10 12 14
AM
P
MD
MA
MA
MP
Time (min)
Flu
ore
scen
ce(a
. u.)
blank
S3
S5
standard
S4
S6
A)
0
0.05
0.1
0.15
0.2
0.25
0.3
600110016002100260031003600
Ab
so
rba
nc
e
SampleMDMA
B)
Wavenumber (cm-1)
Flu
ore
sce
nce
(AU
)A
bso
rban
ce(A
U)

Chapter 4. Results and discussion
193
FMOC such as EP were observed in the samples (retention time of the EP-FMOC
derivative under the chromatographic conditions used, 8.7 min). In Figure 93B is
shown the FTIR-ATR spectra obtained for one of the samples (S1) and also the
spectra obtained for pure MDMA. Characteristic bands of MDMA were observed
in the spectrum of illicit sample at 2710 cm-1 (N-H stretching of amine), 2454 cm-1
(C-H stretching of CH3 group), 1488 cm-1 (C-H bend), 1244 and 1030 cm-1 (C-O-C
stretching of methoxy group) and 930 cm-1 (C-O stretching). The absorbances of
sample were lower than those of the pure MDMA. Moreover, the infrared
spectrum of the sample showed an additional band at 3300 cm-1 (O-H stretching).
Thus, it was hypothesized that the illicit sample could contain MDMA together
with other substances such as lactose, starch, mannitol, or paracetamol owing to
their O-H stretching band. Although EP could also be another possible adulterant
in the street samples, the LC registers showed that this compound was not
present in any of the tested samples.
Finally, in order to evaluate the accuracy of the developed sensors, the
percentages of MDMA and MAMP in the street samples were calculated
measuring the absorbance by DR and color intesity of DI and the calibration
equations of Tables 35 and 36. The results were compared with those achieved by
the LC reference method using the external calibration equations obtained from
standard solutions of the analytes at concentrations within the 1-20.0 mg L-1
range. The results obtained are summarized in Table 37. For samples S3-S6 the
sensor responses were proportional to the sum of the percentages of MDMA and
MAMP. It has to be remarked that the same can be expected for other sensors
that have been proposed for MAMP detection (Choodum, A. et al., 2015;
Yarbakht, M. and Nikkhah, M., 2015). The composition of those samples listed in
Table 37 is given as the sum of the percentages of MDMA and MAMP expressed
as MDMA. As observed in this table no significant differences were found
between the results obtained by the proposed sensor-based approaches and by
the reference method. It was therefore concluded that the developed
colorimetric sensor provide accurate results.

Chapter 4. Results and discussion
194
Table 37. Composition of the ecstasy street samples obtained by the sensor-based
approaches and by the LC reference method. (*) Sum of the percentages of MDMA and
MAMP expressed as MDMA.
Conclusions
The purpose of this work has been the development of a colorimetric kit for
in-situ screening of amphetamine-like drugs in street samples. This kit is based on
a sensor obtained by embedding NQS into a PDMS/TEOS/SiO2NPs matrix. The
sensor allows the visual differentiation of the analytes according to their amine
groups: brown-grey color for primary amines (e.g. AMP, MDA) and orange for
secondary amines (e.g. MAMP, MDMA). After a positive finding, the sensor can be
transported to the lab for further quantitative analysis by any of the proposed
methodologies: (i) by measuring the absorbance by DR, or (ii) by taking a
photograph of the sensor and processing the color values of DI; in such case, a
portion of the sample has to be weighed in the field (a portable balance would be
required). If image processing is the option selected, the photographs of the
sensors could be taken in the field. After a positive finding another portion of the
street sample can be moved to the lab, and then analyzed with the sensors by any
of the two proposed methodologies. This would be the option of choice if
quantitative results with a high level of accuracy are required. The main
advantages of the proposed kit for in-situ tests are that it neither needs expensive
instrumentation nor trained personnel, and that is portable easy to use, rapid,
and economic (the estimated cost per sensor is < 0.02 €). The sensors have
excellent long term stability, and do not require special package and/or storage
conditions. Therefore, the proposed colorimetric kit is a very useful tool for on-
site screening of amphetamine-like street samples. Furthermore, the procedure
Sample MDMA percentage (%)
Sensor/DR Sensor/DI LC
S1 36 ± 6 - 36.1 ± 1.4
S2 21.2±1.2 24 ± 3 19.4 ± 0.7
S3 25 ± 8 19 ± 2 21.8 ± 0.9
S4 64 ± 12 52 ± 4 63 ± 2*
S5 76 ± 3 74 ± 5 69 ± 4*
S6 49.6 ± 1.1 41 ± 3 43.5 ± 0.9*

Chapter 4. Results and discussion
195
provided suitable linearity, precision and accuracy for the quantification of the
tested drugs. In principle, many other reagents can be embedded into PDMS,
which suggests that multi-analyte detection kits could be developed through the
combination of different sensors.

Chapter 4. Results and discussion
196
4.1.2.4 A passive solid sensor for in-situ colorimetric estimation of the presence
of ketamine in illicit drug samples
In an attempt to extend the applicability of PDMS as encapsulant material of
derivatizing reagents, a sensor based on Co(SCN)2 immobilization in PDMS has
been developed for the estimation of ketamine in illicit drug samples. The sensor
is exposed to solutions of ketamine at a basic pH and its color changes from
brown to blue-purple due to the interaction between ketamine and Co(SCN)2.
The sensor enables the visual identification of ketamine in a few minutes.
Quantification is also possible through the measurement of the absorbance by DR.
The reliability of the developed sensors has been tested by analyzing illicit drug
samples. The tested samples were also processed by FTIR-ATR and LC for
comparison purposes.
Preparation of the sensors
Different sensor compositions were assayed (See Table 16 in 3.4.2 Section).
Successful polymerization for the PDMS sensors was observed at a 35 0C in
relatively short times (< 8 h) even for the highest percentage of reagent assayed.
However, PDMS/TEOS-based sensors required up to three-five days for
gelification. In all instances, a visual inspection of the sensors revealed that the
distribution of the reagent particles into the polymeric matrix was suitable. This
was confirmed by obtaining the microscopic images (See Figure 94A).

Chapter 4. Results and discussion
197
Figure 94. Microscopic photographs of: (A) Sensor containing 0.6 % of reagent in PDMS
(w/w). (B) Sensors containing 0.3 % of reagent in PDMS (w/w) during (down) reaction and
30 min after reaction (up) exposure to a blank (left) and to a solution of ketamine 25000
µg mL-1
(right); (C) detail of reagent particle in a sensor containing 0.3 % of reagent in
PDMS (w/w) (left), a sensor exposed to a blank (center) and a sensor exposed to a solution
of ketamine 25000 µg mL-1
for 15 min (right).
On the other hand, freshly prepared sensors showed a brown color which is
characteristic of the Co(SCN)2 reagent. However, slow changes to pink-blue pale
tonalities were sometimes observed when the sensors were exposed to different
ambient conditions. Changes were more intense in the presence of TEOS.
According to the literature, color changes can be attributed to the variation of
coordinate water molecules as a function of the humidity (Haddoub, R. et al.,
2011). This is consistent with the fact that blue tonality was also more remarked
for the sensors containing TEOS as they exhibit higher affinity for water
molecules. In the present study, slight changes in the color of unused sensors had
not effect on the test results. This is because the proposed methodology involves
the immersion of the sensors into an aqueous media.
A
C
B

Chapter 4. Results and discussion
198
The effect of the percentage of reagent on the absorbances was evaluated
within the 0.1 - 0.9 % (w/w) range. The responses of the sensors were evaluated
using standard solutions of ketamine at different concentrations of drug. Aliquots
of the samples were mixed with the same volume of 0.1 M NaOH and the sensors
were immersed into them. For the sensors containing the highest reagent
percentage (0.9 %, w/w) a small portion of reagent diffused through the solution.
As a result, the purple precipitate characteristic of the Morris reaction was
observed around the sensors a few min after their exposure to solutions
containing a high concentration of ketamine (25000 µg mL-1) (See Figure 94B).
After a few min, the precipitate disappeared while the sensor color changed from
brown to blue-purple. These observations demonstrated that ketamine diffused
from the solution to the sensor, so that the complex is formed inside the
polymeric matrix. The formation of the ketamine derivative around the reagent
particles immobilized in the PDMS was confirmed by obtaining the microscopic
images of the sensors (See Figure 94C).
For a given concentration of ketamine and reaction time the blue-purple
color of the sensor was more intense as the percentage of reagent increased
(w/w). However, the highest differences on the measured absorbances between
solutions of ketamine and blanks were observed for the sensors containing 0.3 %
of reagent. This is illustrated in Figure 95, which shows the variation of the
absorbances at the working wavelength (625 nm) for both, a blank and a solution
of ketamine (700 µg mL-1). In other words, the contribution of the sensor itself to
the analytical signal increased as the percentage of reagent increased. These
results can be explained by the fact that, as stated earlier, when introduced in an
aqueous media the sensors also developed a blue-pale color due to the hydration
of the reagent. In addition, the reagent exhibits a characteristic band at 672 nm
(brown). For the sensors with the highest reagent content, the brown tonality still
was visible after reaction. Therefore, the employment of PDMS sensors containing
0.3 % of reagent (w/w) was considered the best option for quantitative purposes.
The addition of TEOS was discarded because, as stated earlier, the preparation of
the sensors involved longer times and they exhibited high background
absorbances.

Chapter 4. Results and discussion
199
Figure 95. Effect of the percentage of reagent in PDMS sensors on the absorbances (625
nm) for a blank and for a solution of ketamine (700 µg mL-1
); time of exposure, 10 min.
Inset: Photographic images of sensors containing 0.3% of reagent exposed to (a) a solution
of ketamine, (b) a blank; sensors containing 0.9% of reagent exposed to (c) a solution of
ketamine and (d) a blank. Concentration of ketamine, 1000 µg mL-1
; time of exposure, 10
min; time until measurement, 5 min.
In order to evaluate the effect of the sensor size sensors with the same
composition and two different sizes were compared; according to the above
results, PSMD-based sensors containing 0.3 % (w/w) were selected. Portions of
0.030 g or 0.20 g of the same reagent/PDMS-curing agent dispersion were placed
in 6 mm or in the 15 mm diameter wells, respectively. After curing, the obtained
sensors were tested for working solutions of ketamine at a concentration of 1000
µg mL-1. For the largest sensors, 1 mL of the working and the NaOH solutions were
used. The results showed that complete and homogeneous color development
required longer times when using the largest sensors. Consequently, 6 mm
diameter sensors containing 0.3 % of reagent into PDMS were selected for further
work.
On the other hand, the absorbances at 625 nm of sensors kept at ambient
conditions in polyethylene bags were measured after different storage times over
a period of two months. The results showed signal variations ranging from + 5 %
to - 11 % with respect to those measured for freshly prepared sensors. These
variations were comparable to those observed for the repeated measurements of
b
0
0.05
0.1
0.15
0.2
0.25
0.3
0.1 0.3 0.6 0.9
Ab
so
rbance
Reagent percentage (%, w/w)
ketamine blanka c
d

Chapter 4. Results and discussion
200
freshly prepared sensors. It was therefore concluded that the sensors were stable
for at least two months without using special storage conditions.
Optimization of the reaction conditions
In preliminary experiments it was confirmed that a basic media was
necessary for the reaction to take place (no response was observed for ketamine
in water); however, no significant differences in the absorbances were obtained
within the 10-14 pH range.
In order to study the effect of the reaction time on the absorbance, the
selected sensors were exposed to solutions of ketamine (500 µg mL-1) for different
times. Next, the sensors were removed from the vials, and their colours were
visually monitored; their absorbances at 625 nm were also measured by DR. As
observed in Figure 96A, the color intensity of the derivative formed by ketamine
increased with the reaction time up to 10 min, and then remained approximately
constant. Once removed from the reaction media, the intensity of the color
slightly increased with time, as depicted in Figure 96B. However, according to this
figure the difference between the absorbances measured at different times for a
blank and a solution of ketamine remained approximately constant, at least
within the 0-30 min interval. Based on the above results, a reaction time of 10 min
was selected, and the differences of absorbances registered for a sample and for a
blank, both measured 5 min after the removal of the sensors from the vials, were
used as analytical signal.

Chapter 4. Results and discussion
201
Figure 96. Effect on the absorbances measured for a blank and a solution of ketamine (500
µg mL-1
) of: (A) the time of reaction, and (B) the time elapsed between reaction and
measurement. In (A) the absorbance was measured immediately after the removal of the
sensor from the sample; in (B) the reaction time was of 10 min. The conditions selected as
optima were: reaction time, 10 min; time until absorbance measurement, 5 min.
Analytical parameters
Analytical data for ketamine were established under the experimental
conditions described above. The results obtained are summarized in Table 38. The
proposed assay provided suitable linearity up to concentrations of ketamine of
1000 µg mL-1 (4.21 mM). The LOD was calculated as 3 sblank/b where b is the slope
of the calibration curve and sblank is standard deviation of the ordinate intercept.
The calculated LOD was 100 µg mL-1. It should be noted that visual detection of
ketamine was possible for concentrations of ketamine ≥300 µg mL-1 (equivalent to
30 µg of drug). Thus, the minimum detectable amount of ketamine is three times
higher than the amount detectable by UV spectrophotometry; similar results have
been reported for this reaction using RGB image analysis (Musile, G. et al., 2015).
The precision was evaluated through the processing of ketamine solutions of
an intermediate concentration (500 µg mL-1). The intra and inter-day RSD values
were 7 % and 10 %, respectively (n=3). The batch-to-batch RSD for three different
syntheses of sensors and the same concentration of ketamine was 13 %. These
results indicated that the proposed sensors provide adequate precision.
0
0.01
0.02
0.03
0.04
0.05
0.06
0.07
0.08
0.09
0 10 20 30
Abs
orba
nce
Time (min)
ketamine blank
0
0.02
0.04
0.06
0.08
0.1
0.12
0.14
0.16
0.18
0 10 20 30
Abs
orba
nce
Time (min)
ketamine blank
A B

Chapter 4. Results and discussion
202
The sensor response was examined for other drugs and possible adulterants
or diluents that are often used in combination with ketamine. The compounds
tested were AMP, MAMP, MDMA, cocaine, EP, scopolamine, caffeine,
acetaminophen, ibuprofen, acetylsalicylic acid, starch, saccharose, glucose,
lactose and magnesium sulfate. Individual solutions of the tested compounds at
concentration of 400-1000 µg mL-1 were prepared by dissolving the pure
compounds in nanopure water. Aliquots of 100 µL of these solutions were mixed
with 100 µL of 0.1 M NaOH and analysed with the sensors. Under the proposed
conditions no interference was found.
Table 38. Analytical data obtained by using the developed sensors.
Linearity* (y=a + bx), n= 6 RSDIntraday
(n=3)
RSDinterday (n=3)
LOD
(µg mL-1)
a ± sa b ± sb (mL µg-1 ) R2
0.003 ± 0.003 (8.7 ± 0.6) 10-5 0.99 7 10 100
*tested concentration range: 200-1000 µg mL-1
; b expressed as mL µg-1
.
Application to real samples
The developed sensors were applied to the analysis of three illicit street
samples (S1-S3) suspected to contain ketamine. For this purpose accurately
weighted portions of the samples were diluted in water to adjust the
concentration of ketamine within the linear working interval (Table 38). Then
aliquouts of 100 µL were processed under the proposed conditions. The samples
were also characterized by FTIR-ATR. In order to stablish the identity of possible
sample constituents, the FTIR-ATR spectra of the drugs and adulterants included
in the selectivity study were also registered and compared with those of the
samples. Additionally, a procedure was developed for the identification and
quantification of ketamine in the samples by LC-UV-DAD. The elution and
detection conditions were selected in order to achieve a satisfactory separation of
ketamine from other sample constituents. For quantification purposes, a
calibration graph was obtained for ketamine within the 5-100 µg mL-1
concentration range. When using the developed sensors positive responses to
ketamine were found in two of the samples assayed (S1 and S2). The presence of
ketamine in both samples was confirmed by LC. The later technique also gave a

Chapter 4. Results and discussion
203
negative result for ketamine in sample S3. However, by FTIR-ATR ketamine could
be only identified in one of the samples that gave positive response with the
sensors (S1).
As an illustrative example, the UV, FTIR-ATR and chromatographic registers
obtained for one of the samples assayed (S1) are shown in Figure 97. As observed
in this figure, the color of the sensor indicated a positive response to ketamine;
the characteristic band of the ketamine complex (maximum of absorption at 625
nm) was observed in the spectra recorded for the sensor, as depicted in Figure
97A. The FTIR-ATR spectra (Figure 97B) showed characteristic bands of ketamine
at 2670 cm-1 (N-H stretch amine salt and CH3 stretch), 1719 cm-1 (RC=O stretch
cyclic ketone), 1577 cm-1 (N-H bend amine and C=C aromatic stretch), 1118 cm-1
(in plane C-H bend, C-N stretch), 771 cm-1 (out of plane aromatic C-H bend and
Cphenyl-Cl monosubstituted) and 704 cm-1 (out of plane ring C=C bend and
Cphenyl-Cl monosubstituted). The comparison of the spectrum registered for the
sample with those of the possible adulterants suggested the presence of caffeine
(see also Figure 97B). Characteristic bands of caffeine were observed at 3095-
2935 cm-1 (CH3 stretch), 1690 and 1640 cm-1 (C=Oand phenyl stretch), 1596-1543
cm-1 (C=N and N-C=O stretch), 1477-1428 (Phenyl stretch, CH bend, C=N stretch),
1398-1353 cm-1 (CN stretch), 1282-1182 cm-1 (C=O stretch, CN stretch), 1062-1021
cm-1 (C=O, CN and C-C stretch) and 853 cm-1 (C-C stretch). The high intensities of
bands from caffeine suggested that the sample contained a high percentage of
this compound. Finally, the chromatograms obtained for the sample showed a
peak of suspected ketamine at 8.3 min; the identity of this peak was checked by
comparing the UV spectra of such peak with that registered from a standard
solution of ketamine. As depicted in Figure 97C, good concordance was also
observed between the two spectra. It should be noted that the intense peak at a
retention time of 3.8 min found in the sample was identified as caffeine. This
adulterant was also found in sample S2. As regards sample S3, the FTIR-ATR and
chromatographic registers obtained suggested the presence of a significant
amount of acetaminophen.

Chapter 4. Results and discussion
204
Figure 97. Results obtained for sample S1: (A) sensor absorbance spectra registered for a
blank, for a standard solution of ketamine (500 µg mL-1
) and for the sample solution; inset:
sensor images obtained for a blank and for the sample solution; (B) FTIR-ATR spectra
obtained for the sample, pure ketamine and pure caffeine; (C) left: chromatograms
obtained for a standard solution of ketamine (50 µg mL-1
) and for the sample solution;
right: normalized spectra of ketamine and suspected ketamine in the sample. The sample
solution in (C) was a dilution 1:10 of the sample in (A).
Finally, in order to check the performance of the proposed assays for
quantitative analysis the percentage of ketamine in samples positive to ketamine
(S1 and S2) was established with the developed sensors, and the results were
compared to those obtained by the LC method. The values obtained are listed in
Blank Sample
A
Absorb
ance
Wavelength (nm)
0
0.1
0.2
0.3
0.4
300 400 500 600 700 800 900
blank
sample
ketamine
Absorb
ance
Wavelength (cm-1)
B
0
0.2
0.4
0.6
0.8
1
600110016002100260031003600
ketamine caffeine sample
Wavelength (nm)Time (min)
Norm
aliz
ed
absorb
ance
0
100
200
300
400
500
600
0 2 4 6 8 10 12 200 250 300 350 400
ketamine Sample
Absorb
ance
keta
min
e
C

Chapter 4. Results and discussion
205
Table 39. This table shows that the proposed method provided results
comparable to those obtained by the reference method (sample S1, tcalculated =
1.69, ttabulated = 2.776; sample S2, tcalculated =2.92, ttabulated = 4.30; values of ttabulated at
a 95 % confidence level).
Table 39. Comparison of the results obtained for the drug street samples with the
developed sensors and the LC reference method (n = 3).
Sample Ketamine percentage (%)
Sensor LC
S1 13.7 ± 1.6 12.0 ± 0.6
S2 1.1 ± 0.2 1.24 ± 0.01
S3 negative negative
Utility
In the last years, different modifications of classic colorimetric assays have
been proposed aimed at reducing the manipulation of solutions, thus facilitating
on-site analysis. This is the case of the test for ketamine based on its reaction with
cobalt thiocyanate (Morris test), which was originally proposed under a
conventional solution derivatization scheme (Morris, J.A., 2007). For example, a
solid reagent by immobilizing Co(SCN)42- onto a silica nanostructured support has
been reported (Madda B. et al., 2015). The preparation of the reagent entailed
several operations: synthesis of the tetrathiocyanate complex and its
immobilization onto silica NPs (previously activated with concentrated HCl at 120 0C for 24 hours), isolation, purification with diethyl ether and drying of the
intermediate product, and then, treatment with a solution of NaOH to produce
basic cobalt tetrathiocyanate@NS. The assay involved the treatment of a portion
of the basic cobalt tetrathiocyanate @NS reagent with a drop of the sample.
Musile et al. described a microfluidic device prepared by creating channels onto a
chromatographic paper using wax printing and thermal lamination (Musile, G. et
al., 2015). The device was designed to detect different drugs by placing in the
channels the appropriate reagents. For the detection of ketamine, aliquots of
Co(SCN)2 and a NaOH solutions were placed in different areas of a channel; an

Chapter 4. Results and discussion
206
aliquot of the sample were put into contact with the basic area, and then carried
over the cobalt thiocyanate reagent with a water/acetone mixture. The method
proposed in the present study uses the same reaction but a different detection
mechanism: entrapment of the reagent into PDMS and reaction within the
polymeric matrix (ketamine molecules diffuse from the sample solution to the
PDMS matrix). The above approaches are suitable for the detection of ketamine in
aqueous samples, but they are different in terms preparation and stability of the
reagent/detection device, as well as in their analytical performance.
The main advantage of the method proposed in this work is that the sensors
can be prepared easily and no additional reagents or instrumentation is involved
(only a oven operating at 35 0C is required); the sensors are chip and show
suitable long-term stability (no special storage conditions are required). An
advantage of the microfluidic approach is that different drugs can be tested
simultaneously, although the low stability of this device is a limitation (it can be
used for ten days when stored at ambient temperature, and for 30 days if it is
plasticized and kept away from light sources and at 4 0C). Thus, the PDMS sensors
are better suited for on-site applications (no information on the stability of the
basic cobalt tetrathiocyanate @NS reagent was reported in Madda B. et al.,
2015).
On the other hand, the three approaches allow the rapid detection of
ketamine in aqueous samples, but in the assay proposed by Maddah et al. (Madda
B. et al., 2015) the color change can be observed in shorter times, probably
because the analyte molecules come directly into contact with the active groups
of the solid reagent, whereas in the methods using paper microfluidic devices and
PDMS sensors the diffusion of the analyte molecules from the sample bulk to the
reagent is required for the reaction to take place.
The three methods have been tested for similar concentrations of ketamine,
and the minimum amount of drug detectable by naked eye reported is also
similar. The sensors-based assay provides better linearity and precision than those
attained by the microfluidic-based approach (no information on the linearity,
precision and accuracy achieved with the basic cobalt tetrathiocyanate @NS
reagent was reported in Madda B. et al., 2015). It has to be remarked that only
the PDMS-based sensors procedure has been validated for illicit dug samples. The
sensitivity attained by the proposed procedure is satisfactory for the detection
and quantification of ketamine in illicit samples even if the ketamine is low (Table

Chapter 4. Results and discussion
207
38). However, the sensors cannot be applied to detect ketamine in biological
fluids as the concentration found, even for chronic abusers, are typically in the
low to sub µg mL-1 range (Cheng, W.-C. et al., 2007). To the best of our knowledge,
none of the colorimetric assays proposed as presumptive tests for ketamine allow
the detection of these compounds in biological fluids.
Conclusions
It spite of the increasing consumption of ketamine, the number of
colorimetric assays proposed for the identification of ketamine is still very limited,
and only a few of them have been validated for drug street samples (Musile, G. et
al., 2015; Maddah, B. et al., 2015). In addition, the identification of ketamine by
existing spot colorimetric tests often fails in samples containing other drugs or
adulterants (Camilleri, A.M. and Caldicott, D., 2005). In the present work, a solid
colorimetric sensor has been developed for the presumptive detection of
ketamine based on its reaction with Co(SCN)2 in basic media (Morris reaction).
Sensors were prepared by embedding the solid reagent into a PDMS matrix.
When the sensors are exposed to ketamine solutions, the drug diffuses to the
PDMS matrix and reacts in the surface of the reagent particles, causing a change
in the color from brown to blue-purple. Sensor responses can be obtained in a few
minutes, being 30 µg the minimum detectable amount by naked eye.
Under optimized conditions, the sensor can also be used for the
quantification of ketamine through the measurement of the absorbance by DR.
The results obtained by the proposed assay for illicit street sample show good
concordance with those obtained by LC, even for percentages of ketamine in the
samples as low as 1-2 %.
The sensors are very cost-effective and easy to prepare, and no special
conditions for their storage or employment are required. The proposed assay
minimizes risks associated with the manipulation of harmful liquids, so it is well
suited for on-site presumptive tests.

Chapter 4. Results and discussion
208
4.1.3 C18 AS PHASE FOR MSPD
During the past years many innovative extraction techniques have been
developed as alternative to classical multi-step methods for sample treatment.
Among them, MSPD is a sample preparation technique with increasing acceptance
in solid, semi-solid and viscous samples (García-López, M. et al., 2008; Ramos, L.,
2012) due to the reduction of sample and solvents consumption and does not
need special instrumentation. The selectivity and efficiency of MSPD is mainly
dependent on the sorbent material used. Most reported methods used reversed
phase SPE materials, such as C18 phase for the dispersion and retention of
lipophilic analytes. Based on a previous method developed for the quantification
of DEHP in sediment samples, bondesil C18 phase has been used as MSPD sorbent,
integrating disruption, clean-up and solid phase derivatization for the
determination of amphetamines in air.
4.1.3.1 Determination of amphetamines in hair by integrating sample
disruption, clean-up and solid phase derivatization
The utility of C18 as sorbent phase for MSPD to analyze amphetamines in hair
samples has been evaluated. The proposed approach is based on the employment
of MSPD for matrix disruption and clean-up, followed by the derivatization of the
analytes onto the sample blend. The fluorogenic reagent FMOC has been used for
precolumn derivatization. Different conditions for MSPD, analyte purification and
solid phase derivatization have been tested, using AMP, MAMP, EP and MDMA as
model compounds. The results have been compared with those achieved by using
UAE and by MSPD combined with conventional liquid-phase derivatization. Thus,
a rapid approach is proposed for the analysis of amphetamines-type drugs in hair.
UAE
In Figure 98 are shown the chromatograms obtained for water (Figure 98a)
and for a standard solution of the analytes (Figure 98c), as well as those obtained
for blank hair (Figure 98b) and for hair spiked with the analytes (Figure 98d). As it
can be seen from this figure, the chromatograms obtained for the hair samples
showed chromatographic profiles similar to those of the aqueous solutions,
although higher backgrounds were observed for the hair samples, especially at

Chapter 4. Results and discussion
209
lower retention times. Two intense peaks corresponding to the unreacted FMOC
and a degradation product were observed at 4.7, and 10.4 min, and a minor peak
was also observed at 12.6 min. Such peaks are typically found when using FMOC
as derivatization reagent (Campíns-Falcó, P. et al., 2009; Cháfer-Pericas, C. et al.,
2004; Herráez-Hernández, R., 2001).
Figure 98. Chromatograms obtained for aqueous solutions and for hair samples treated by
the UAE alkaline digestion method: (a) blank (water), (b) blank hair,(c) an standard
solution of the amphetamines (0.5 µg mL-1
, each compound), and (d) a spiked hair sample
(25 ng mg-1
, each compound).
Quantitative studies were performed using hair samples spiked with the
analytes at concentrations within the 25–200 ng mg-1. The results are summarized
in Table 40. As it can be observed, linear responses were obtained for the tested
analytes. The recoveries, established from the slopes of calibration, as well as the
LODs and LOQs are also listed in Table 40.
Flu
ore
scen
ce(A
U)
Time (min)
a
c
b
d
EPE AM
P
MD
MA
MET
0
20
40
60
80
100
120
140
160
180
200
2 4 6 8 10 12 14
EP MEM
P
MD
MA
AM
P

Chapter 4. Results and discussion
210
Table 40. Analytical parameters of the methods tested.
Method Concentration
interval
(ng mg-1)
Analyte Linearity* Recovery
(%)**
LOD
(ng mg-1) y=ax+b (mg ng-1) R2
UAE/
solution
25-200 EP y = (1.06 ± 0.10)x + (17 ± 11) 0.980 67 7.5
AMP y = (2.08 ± 0.11)x + (22 ± 14) 0.993 97 5.0
MDMA y = (0.91) ± 0.04)x + (4 ± 5) 0.993 99 7.5
MAMP y = (3.8 ± 0.16)x + (10 ± 20) 0.996 122 2.5
MSPD/ solution
10-50 EP y = (1.84 ± 0.16)x + (−5 ± 5) 0.990 94 5.0
AMP y = (7.4 ± 0.4)x + (−10 ± 12) 0.980 109 2.5
MDMA y = (2.30 ± 0.08)x + (4 ± 3) 0.990 88 2.5
MAMP y = (18.4 ± 0.8)x + (−9 ± 20) 0.990 110 1.0
MSPD/ solid phase
2-20 EP y = (6.0 ± 0.3)x + (12 ± 4) 0.993 84 0.75
AMP y = (16.9 ± 1.1)x + (−12 ± 9) 0.995 118 0.5
MDMA y = (3.9 ± 0.2)x + (15 ± 4) 0.980 98 0.75
MAMP y = (20.5 ± 1.6)x + (7 ± 20) 0.990 109 0.25
*Established from four concentrations assayed in triplicate. **Established from the ratios of the slope of calibrations (concentration expressed as µg mL
-1 of the analytes in the processed extracts as µg mL
-1) and the slopes of calibrations
obtained from standard solutions of the analytes.
MSPD procedure
A) Type and amount of sorbent material
Initially, the effect of the type of dispersant on sample disruption was
evaluated as an effective sample disaggregation is essential to achieve accurate
results. Silica, alumina and bondesil C18 were the phases tested. In this study, 50
mg of the samples was mixed with 400 mg of the dispersant, and blended gently
with a pestle for 5 min. A visual inspection of the blends obtained after the
grinding step revealed that in all instances the samples were well dispersed,
although when using silica several small pieces of hair were still visible after
grinding. Apparently, the employment C18 phase resulted in suitable sample
disruption. A C18 phase was used in further studies because it is a retentive

Chapter 4. Results and discussion
211
material for amphetamines, and thus, it could be used not only to disrupt the
sample, but also for subsequent clean-up (Herráez-Hernández, R. Et al., 1996a). It
was also tested if the addition of an aliquot of NaOH to the hair samples before
grinding could facilitate sample disruption making possible the use of shorter
grinding times. In this study, 50 mg of the samples was placed in glass mortars and
then, 1 mL of 6 M NaOH was added. After 5 min, 400 mg of C18 phase was added
and the mixture was ground for 5 min. However, for the amounts of sample and
dispersant used, the semi-solid consistence of the sample dispersant mixture
made more difficult to obtain the required homogeneity after the grinding step.
Therefore, this option was discarded. Next, the sample to sorbent ratio was
optimized. MSPD is well suited for miniaturization and thus, it is adequate for the
analysis of hair samples as the amount of sample used for the analysis of drugs in
hair is typically <100 mg (Baciu, T. et al., and Vogliardi, S. et al., 2015). According
to previous experiences with environmental samples, the minimum amount of
sample and sorbent that can be handled in the glass morters with suitable
reproducibility is about 0.4–0.5 g (Campins-Falcó, P. et al., 2008; Moliner-
Martínez, Y. et al., 2012). For this reason, in the present study the amount of
sorbent was fixed at 400 mg and the amount of sample was varied. Hair portions
of 25, 50 and 100 mg were assayed (equivalent to sample to sorbent ratios of
1:16, 1:8 and 1:4, respectively).
Although sample to sorbent ratios of 1:1-1:4 are used in a large majority of
the reported MSPD assays (Ramos, L., 2012), in the present study the blend
obtained for a 1:4 ratio was unsuitable because several hair segments were still
visible after the grinding step. Apparently, the blends obtained when using 1:8
and 1:16 ratios were homogeneous, but in order to ensure a sample disruption as
much effective as possible the amount of sample chosen was 25 mg (sample
tosorbent ratio of 1:16). In Figure 99 are shown the photographs corresponding to
a portion of the 25 mg of hair (Figure 99a), the blend resulting after grinding it
with 400 mg of C18 phase (Figure 99b), as well as the blend once transferred to a
SPE tube (Figure 99c). As observed in this figure the dispersion of the sample in
the blend was satisfactory. This was confirmed by using light microscopy. In Figure
100 are shown the microscopic images obtained for a C18 phase ground for 5 min
(Figure 100a), a hair sample (Figure 100b), and the blend obtained by grinding 400
mg of C18 phase and 25 mg of hair for 5 min (Figure 100c). The dark zones in the
blend (Figure 100c) correspond to the hair fragments obtained after sample
grinding. As it can be deduced from this figure, the grinding step resulted in much

Chapter 4. Results and discussion
212
smaller hair fragments, which confirmed that under the proposed conditions
sample disruption was effective and lead to a homogeneous dispersion of hair in
the blend.
Figure 99. Photographs of: (a) a hair sample (25 mg), (b) the blend obtained after grinding
the sample with 400 mg of the C18 phase, and (c) the blend transferred to an extraction
tube.
Figure 100. Photographs obtained by light microscope of: (a) C18 sorbent ground for 5 min,
(b) a hair sample, and (c) the blend obtained after grinding the sample and the C18
dispersant for 5 min. Ratio sample to dispersant, 1:16.
B) Washing solvent
Next, different conditions were evaluated for washing the cartridges in order
to eliminate matrix components. Spiked hair samples were ground under the
optimized MSPD conditions, and after transferring the obtained blends to the
extraction tubes, clean-up was effected by flushing through them a portion of a
washing solvent. Water and 0.05 M carbonate buffer of pH 10.5 were tested as
a b c
a b c

Chapter 4. Results and discussion
213
washing solvents; acidic solvents were not used in order to prevent losses of the
amphetamines during the washing step due to their protonation (Herráez-
Hernández, R. et al., 1997). After washing, the blends were dried with air, and
acetonitrile was passed through the SPE tubes in order to desorb the analytes. In
this study the volume of acetonitrile used for desorption of the analytes was 2 mL
(the desorption volume optimization is described below). The extracts were
collected into glass vials and then, 250 µL aliquots were derivatized in solution as
described in Section 3.5.3. In Figure 101 are shown the chromatograms obtained
for a spiked hair sample when flushing the sample disperser blend with 2 mL of
water (Figure 101a) and 2 mL of carbonate buffer (Figure 101b). The background
peaks observed in the chromatograms were quite similar but higher analytical
responses were achieved for the analytes when using carbonate buffer as washing
solvent. This indicates that with water the retention of the analytes was lower
because they were partially protonated (pKa values of 9.8–10.3), which is
consistent with previous results (Herráez-Hernández, R. et al., 1996b). It should be
noted that the background chromatograms observed for hair samples after MSPD
were similar to those obtained for hair treated by UAE (Figure 98d). On the other
hand, when increasing the volume of buffer up to 4 mL the peak areas of the
analytes remained constant within experimental variations (Figure 101c).
Therefore, flushing the tubes with 2 mL of carbonate buffer was selected as the
best option for clean-up.
Figure 101. Chromatograms for hair samples spiked with the analytes (25 ng mg-1
) treated
by MSPD/solution derivatization method using in the washing step: (a) 2 mL of water, (b) 2
mL of carbonate buffer, and (c) 4.0 mL of carbonate buffer as washing solvents.
Time (min)
Flu
ore
scen
ce(A
U)
EPE A
MP
MD
MA M
ET
c
a
b
0
20
40
60
80
100
120
140
160
180
200
2 4 6 8 10 12 14
EP
MEM
P
MD
MA
AM
P

Chapter 4. Results and discussion
214
C) Desorption
Indeed, the volume of solvent used for desorption of the analyte should be as
low as possible in order to avoid an excessive dilution of the analytes in the final
extracts. In order to optimize the volume of acetonitrile for desorption, aliquots of
1 mL of this solvent were passed through the extraction tubes after the washing
and drying steps, and collected separately into 2 mL glass vials. Then, 250 µL of
the extracts was subjected to the solution derivatization method. All the tested
amphetamines were mostly found in the first 1 mL fraction of acetonitrile, but
significant portions of the drugs were also found in the second 1 mL fraction. In
further experiments it was observed that highest responses for the analytes were
obtained when flushing through the tubes 1.5 mL of acetonitrile. Consequently,
this was the volume selected in the optimized procedure. Samples spiked with
different amounts of the analytes were processed under the optimized
MSPD/solution derivatization method. The concentrations assayed and analytical
parameters obtained are listed in Table 40.
Integrated MSPD/solid phase derivatization
The possibility of effecting the derivatization of the analytes inside the
cartridge was evaluated. According to the basis of solid support reactions, the pH
conditions necessary for the reactions to take place can be achieved by flushing
through the tubes an aliquot of buffer before adding the reagent solution. When
the same buffer solution can be used for clean-up and derivatization (as in the
present case), the entire procedure can be simplified because after the washing
step, the derivatization and desorption of the analytes can be carried out simply
by flushing an aliquot of the reagent through the SPE tubes, provided that the
reagent solution is prepared in a high elution strength solvent (acetonitrile in the
present instance). The experimental parameters affecting the solid support
assisted derivatization were optimized. In this study spiked hair samples were
subjected to optimized MSPD procedure, and the resulting blends were
transferred to the extraction tubes and then derivatized. The parameters tested
were the reaction time, the pH of the carbonate buffer and the concentration of
FMOC in the derivatization solution. The results are depicted in Figure 102.
According to this figure, the optimum reaction time and pH were 5 min and 10.5
(Figure 102A and B), respectively, which were also the optimum values found for

Chapter 4. Results and discussion
215
the analysis of amphetamines in other matrices (Herráez-Hernández, R. et al.,
2001). It has to be remarked that, unlike the derivatizations in solution, the
employment of 1 mM FMOC was unsuitable because the presence of intense
peaks corresponding to the excess of reagent disturbed the measurement of the
AMP-FMOC peak areas. Therefore, lower concentrations of FMOC (0.1 mM and
0.01 mM) were assayed. Best results were obtained by flushing the tubes with 1.5
mL of 0.1 mM FMOC (Figure 102C). On the basis of the results of the above
sections and also the results of Figure 101, the conditions finally selected for the
estimation of amphetamines in hair samples were: 25 mg of conditioned hair was
mixed with 400 mg of C18 sorbent and ground for 5 min;the mixture was then
transferred to an extraction tube, 2 mL of carbonate buffer (pH = 10.5) was
flushed through the tube and, after drying with air, the tube were flushed with 1.5
mL of 0.1 mM FMOC solution (in acetonitrile). After 5 min, the collected extracts
were injected into the chromatograph.
Figure 102. Effect of the derivatization conditions on the analyte responses obtained with
the integrated MSPD/solid support derivatization method: (a) reaction time, (b) pH of the
buffer, and (c) concentration of the FMOC solution. Tested for a sample containing 20 ng
mg-1
of each analyte.
Under these conditions, the chromatographic profiles were similar to those
observed for the alkaline digestion and MSPD/solution derivatization methods,
but significantly higher signals were registered for amphetamine-FMOC peak.
Therefore, the proposed method could be applied to measure lower
concentrations of the analytes. This is illustrated in Figure 103, which shows the
chromatograms obtained for spiked hair samples treated by the three
methodologies tested. The proposed integrated MSPD/solid phase derivatization
0
50
100
150
200
250
300
1 3 5 7 9 9.5 10 10.5 11 11.5 0 0.5 1
A B C
Time (min) pH Concentration (mM)
Peak
area
(AU
)

Chapter 4. Results and discussion
216
method was applied to samples spiked with 2–20 ng mg-1 of the analytes. As
illustrative examples, in Figure 104 are shown the chromatograms obtained for
blank hair (Figure 104a), and hair spiked with the analytes at different
concentration levels within the tested range (Figure 104b-d). Although different
peaks corresponding to matrix compounds were observed in the elution zone of
the AMP-FMOC derivative, peak areas could be satisfactorily measured. The
linearity, recovery and LODs parameters are listed in Table 40. Accuracy and
precision studies were carried out at three different concentration levels. The
results obtained are summarized in Table 41.
Figure 103. Chromatograms obtained by the three approaches tested: (a) hair sample
spiked with 100 ng mg-1
of each analyte treated by the UAE alkaline digestion/solution
derivatization method, (b) hair sample spiked with 25 ng mg-1
of each analyte treated by
the MSPD/solution derivatization method, and (c) hair sample spikedwith 10 ng mg-1
of
each analyte treated by the integrated MSPD/solid phase derivatization method.
Flu
ore
scen
ce(A
U)
c
a
b
EPE
AM
P
MD
MA
MET
Time (min)
0
50
100
150
200
250
300
350
400
4 5 6 7 8 9 10 11 12 13 14
EP MEM
P
MD
MA
AM
P

Chapter 4. Results and discussion
217
Figure 104. Chromatograms obtained with the integrated MSPD/solid support
derivatization method for: drug-free hair sample (a), and for hair samples spiked to contain
the analytes at concentrations of (b) 2 ng mg-1
, (c) 10 ng mg-1
and (d) 20 ng mg-1
.
Reliability of the proposed method
The results of Table 40 indicate that MSPD is a reliable alternative to alkaline
digestion by UAE for sample treatment in the determination of amphetamines in
hair. Even when combined with a classical solution derivatization approach, the
sensitivity obtained by MSPD is improved with respect to that attainable by the
alkaline digestion method. The sensitivity is further improved if MSPD is combined
with solid phase derivatization. The concentrations that can be detected and
measured are about one order of magnitude lower than those that can be
measured with the alkaline digestion-based procedure. This can be explained by
the fact that solid phase derivatization avoids the dilution of the analyte as
desorption and derivatization are simultaneously effected; the addition of a buffer
to set the pH for the derivatization is also avoided. On the other hand, the LODs
and LOQs achieved with the MSPD/solid phase derivatization method are
comparable to that reported by many of the procedures found in the literature
(Baciu, T. et al., 2015; Vogliardi, M. et al., 2015) but the proposed approach is
generally simpler and more rapid. The LODs reported in a majority of the methods
range from 0.05 to 0.5 ng mg-1, although values lower than 1 pg mg-1 were
reported using a microfluidic device (Zhu, K.Y. et al., 2012); it has to be remarked
Time (min)
Flu
ore
scen
ce(A
U)
c
a
b
dEP
E
AM
P
MD
MA
MET
0
20
40
60
80
100
120
140
160
180
200
7 8 9 10 11 12 13 14
EP
MEM
P
MD
MA
AM
P

Chapter 4. Results and discussion
218
that most of those methods involve solvent evaporation operations to
reconcentrate the analytes after their extraction from the hair matrix. The
employment of a C18 phase allows the simplification of the sample treatment
because this phase can be used not only to disrupt effectively the sample but also
to purify the target analytes as SPE-based procedures. In the present instance, the
selectivity was adequate for LC analysis after derivatization with FMOC, and no
additional clean-up was necessary, not even the employment of an extra sorbent
layer in the SPE tubes. On the other hand, the recovery values indicate that the
analytical responses were similar to those obtained for standard solutions of the
amphetamines; the same behavior was previously observed for urine and plasma
samples (Campíns-Falcó, P. et al., 2009; Herráez-Hernández, R. et al., 1996). The
proposed method also provides suitable accuracy and precision (See Table 41).
Table 41. Accuracy and precision of the proposed integrated MSPD/solid phase
derivatization method.
Analyte Added
concentration
(ng mg-1
)
Intraday (n=3) Interday (n=4)
Found
concentration
(ng mg-1
)
RSD (%) Found
concentration
(ng mg-1
)
RSD (%)
EP 2.0 2.3 ± 0.4 17 2.4 ± 0.4 17
10.0 9.6 ± 0.5 5 9.2± 0.9 10
20.0 20.7 ± 0.8 4 21 ± 2 9
AMP 2.0 1.9 ± 0.2 11 2.2 ± 0.2 9
10.0 10.20 ± 0.16 2 10.5 ± 0.7 7
20.0 20.1 ± 0.8 4 22 ± 2 9
MDMA 2.0 2.4 ± 0.5 20 1.9 ± 0.3 17
10.0 10.7 ± 0.9 8 10.9 ± 0.8 7
20.0 21 ± 1 5 21.0 ± 1.2 6
MAMP 2.0 2.3 ± 0.3 13 2.4 ± 0.3 13
10.0 9.4 ± 0.5 5 9.8 ± 0.7 7
20.0 20.1 ± 0.5 3 20.8 ± 1.1 5
The concentration of the analytes in hair of drug abusers reported in the
literature are typically in the 0.5–10.0 ng mg-1 range (Chang, Y.J. et al., 2014;
Tabernero, M.J. et al., 2009; Zhu, K.Y. et al., 2012) although concentrations < 0.1
ng mg-1 were reported by Wada et al. using alkaline digestion followed by the
extraction of the analytes into n-heptane, evaporation to dryness and

Chapter 4. Results and discussion
219
derivatization of the analytes for their separation by LC with chemiluminescence
detection (Wada, M et al., 2013). Concentrations up to 68.9 ng mg-1 have been
reported for MAMP (Miyaguchi, H. and Inoue, H., 2011). Therefore, the sensitivity
attainable with the proposed method can be considered suitable for the analysis
of abusers’ hair. The proposed method was tested for hair of different volunteers
which had not consumed amphetamine (including dyed hair), as well as for a
sample obtained from an abuser, and no interfering peaks in the elution zone of
the analyte-FMOC derivative were observed in the chromatograms. On the other
hand, for some of the samples assayed (including the abuser’s hair) the solvents
collected during the sample preconditioning were analyzed. The resulting
chromatograms confirmed the absence of the analytes in the washing solvents. In
Figure 105 is shown the chromatogram of a real hair sample obtained from an
abuser. The concordance between the retention times of the sample peaks and
those of spiked hair samples (Figure 105A) indicates the presence of MAMP (at a
concentration < LOQ). This is consistent with the chromatogram obtained after
fortifying the real sample with the analytes (Figure 105B). Nevertheless, for
confirmative tests LC–MS/MS would be required. The sample sorbent blend
resulting after the extraction/derivatization of this sample was transferred to
clean a glass mortar and the analytical procedure was repeated, but none of the
analytes were detected, which is in agreement with the recovery values of Table
40.
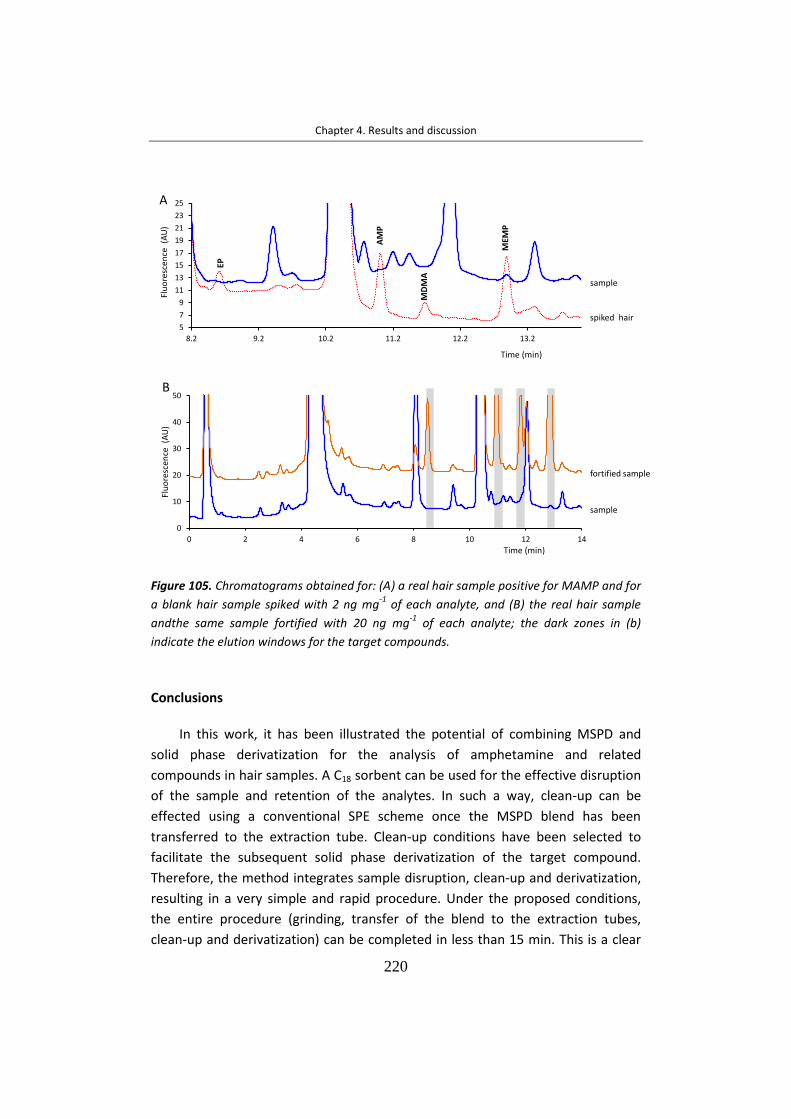
Chapter 4. Results and discussion
220
Figure 105. Chromatograms obtained for: (A) a real hair sample positive for MAMP and for
a blank hair sample spiked with 2 ng mg-1
of each analyte, and (B) the real hair sample
andthe same sample fortified with 20 ng mg-1
of each analyte; the dark zones in (b)
indicate the elution windows for the target compounds.
Conclusions
In this work, it has been illustrated the potential of combining MSPD and
solid phase derivatization for the analysis of amphetamine and related
compounds in hair samples. A C18 sorbent can be used for the effective disruption
of the sample and retention of the analytes. In such a way, clean-up can be
effected using a conventional SPE scheme once the MSPD blend has been
transferred to the extraction tube. Clean-up conditions have been selected to
facilitate the subsequent solid phase derivatization of the target compound.
Therefore, the method integrates sample disruption, clean-up and derivatization,
resulting in a very simple and rapid procedure. Under the proposed conditions,
the entire procedure (grinding, transfer of the blend to the extraction tubes,
clean-up and derivatization) can be completed in less than 15 min. This is a clear
5
7
9
11
13
15
17
19
21
23
25
8.2 9.2 10.2 11.2 12.2 13.2
Flu
ore
scen
ce(A
U)
Time (min)
EP
AM
P
MD
MA
MEM
P
sample
spiked hair
0
10
20
30
40
50
0 2 4 6 8 10 12 14
Time (min)
Flu
ore
scen
ce(A
U)
fortified sample
sample
A
B

Chapter 4. Results and discussion
221
advantage as many of the procedures reported in the literature involve much
longer times for sample preparation (Baciu, T. et al., 2015 and Vogliardi, S. et al.,
2015). In addition, no solvent evaporation or additional clean-up is required, and
the consumption of materials and reagents is lead to a minimum. Therefore, the
proposed methodology is in accordance with the principles of green chemistry. To
our knowledge, this is the first method that combines MSPD and solid phase
derivatization.

Chapter 4. Results and discussion
222
4.1.4 Mesoporous silica as sensing layer for MEMS
4.1.4.1 Screen-printed piezoeletric resonant transducers coated with MCF silica
for gas detection
Optimization of screen-printing fabrication
A) Study of LBCu composition
Two formulas of piezoelectric inks with different LBCu composition were
tested (Table 42) in order to study their effect on the sintering and
electromechanical properties for gas testing.
Table 42. Weight percentages and mass of each component in 40 g of piezoelectric
powder.
A
Debéda, H. et al., 2013. B Medesi, A. et al., 2014.
B) Study of size and shape of sensor
Two types of sensors were fabricated, disks and cantilevers. For both sensors,
the sacrificial layer paste used in previous works (Debéda, H. et al., 2013; Debéda,
H. and Lucat, C., 2014) was a mixture of 60 w% epoxy CV59 and 40w% SrCO3,
which required a dissolution step by ultrasonic bath with H3PO4 1 M. To avoid this
tedious step, the conventional sacrificial layer has been replaced by a commercial
sacrificial paste, which is satisfactory removed during the firing process.
Materials SuppliersParticle size
(µm)
Mass (g) (40 g of total mass) Weight %
Formula A Formula B Formula A Formula B
PZT Ferroperm 11.473 38.8000 38.800 97.0000 97.0000
Li2O3 Alfar Aesar 19.541 0.3000 0.1063 0.7500 0.2657
Bi2O3 Alfar Aesar 3.176 0.4800 0.6703 1.2000 1.6785
CuO Sigma Aldrich 3.662 0.4200 0.4234 1.0500 1.0585

Chapter 4. Results and discussion
223
For disks, smaller sizes than previous disks developed by PRIMS group (IMS
Laboratoire, Bordeaux University) (Debéda, H. and Lucat, C., 2014) were
fabricated to solve cracking problems of PZT layer due to the bottom electrode.
Figure 106 shows the new size and shape of disk sensors. Moreover, the number
of gold bottom layers was increased from 1 to 2.
Figure 106. Design of disk fabricated in this work.
The different fabrication steps for disks are given in Figure 107. Two
sacrificial layers (circular shape of 8 mm of diameter) were first screen-printed on
an aluminum nitride substrate and polymerized 20 and 30 min, for the first and
second layer respectively, at 120 ºC. Secondly, two bottom gold electrode layers
(5 mm diameter) were deposited on the sacrificial layer and dried 15 min each
layer at 120 ºC. Then, PZT layer (6 mm diameter) was printed and dried at 1 ºC
min-1 to 120 ºC before its maintaining 30 min. Finally, top gold electrode layer was
deposited on (5 mm diameter) and dried 15 min at 120 ºC. Once all the layers
were deposited and dried, the samples were isostically pressed to improve
densification, then co-fired to remove sacrificial layer and sintering and finally,
poled (50 KV cm-1, 280 ºC) as before described.
5 m
m
6 m
m
8 m
m
Sacrificial layer
Gold layer
PZT layer

Chapter 4. Results and discussion
224
Figure 107. Fabrication steps of disk A) screen-printing of sacrificial layer, B) screen-
printing of bottom gold electrode, C) Screen-printing of PZT layer, D) Screen-printing of top
gold electrode E) Sacrificial layer elimination after firing, F) Poling of PZT wired disk (cross
view), together with photographies of the top view of the disk step by step.
As microscopic images shown, satisfactory samples without bubbles were
obtained before firing (Figure 108A). After firing, no significant defects were
observed (Figure 108B) although the alignment was then improved to get
symmetric geometry (Figure 108C and D). The cracking of the PZT was avoided
and also the disks were not stuck on the substrate. Similar disks were observed by
light microscope for two LBCu formulas.
Sacrificial layer x2
AlN substrate
Bottom gold electrode x2
PZT layer
Top gold electrode
A)
B)
C)
D)
Scree
n-p
rintin
gste
ps
E)
F)
Firing
Poling
Pt wire + tube
V
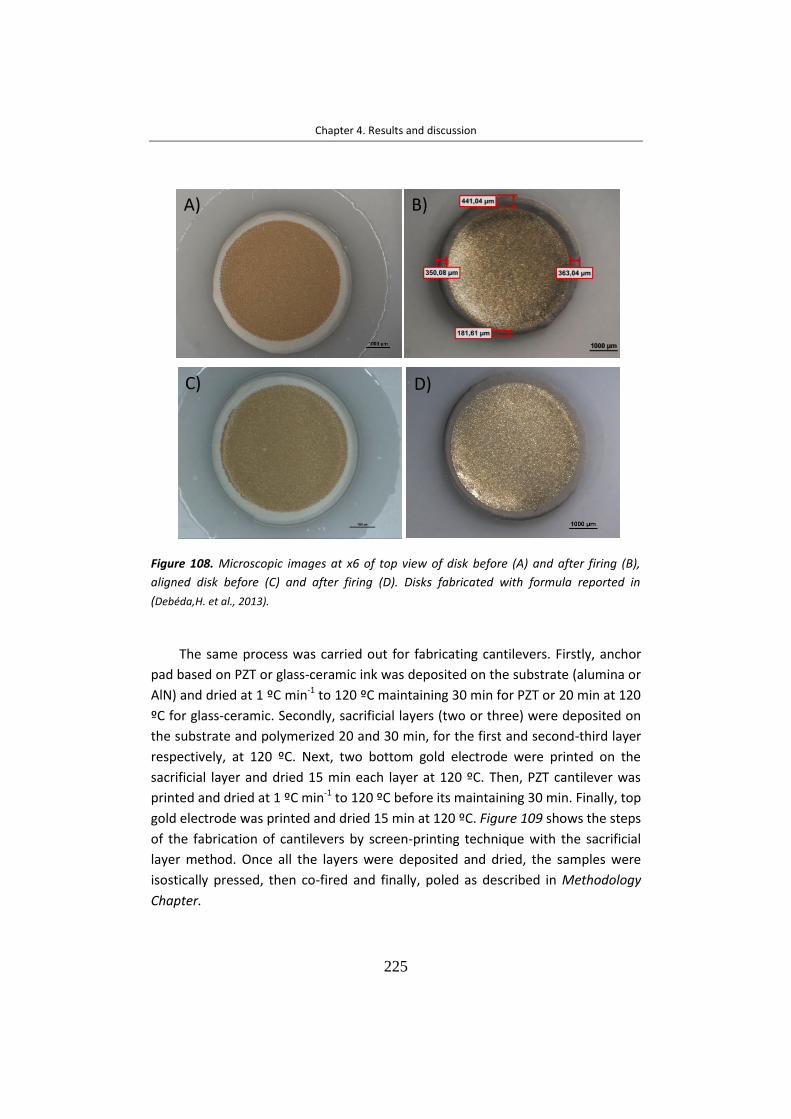
Chapter 4. Results and discussion
225
Figure 108. Microscopic images at x6 of top view of disk before (A) and after firing (B),
aligned disk before (C) and after firing (D). Disks fabricated with formula reported in
(Debéda,H. et al., 2013).
The same process was carried out for fabricating cantilevers. Firstly, anchor
pad based on PZT or glass-ceramic ink was deposited on the substrate (alumina or
AlN) and dried at 1 ºC min-1 to 120 ºC maintaining 30 min for PZT or 20 min at 120
ºC for glass-ceramic. Secondly, sacrificial layers (two or three) were deposited on
the substrate and polymerized 20 and 30 min, for the first and second-third layer
respectively, at 120 ºC. Next, two bottom gold electrode were printed on the
sacrificial layer and dried 15 min each layer at 120 ºC. Then, PZT cantilever was
printed and dried at 1 ºC min-1 to 120 ºC before its maintaining 30 min. Finally, top
gold electrode was printed and dried 15 min at 120 ºC. Figure 109 shows the steps
of the fabrication of cantilevers by screen-printing technique with the sacrificial
layer method. Once all the layers were deposited and dried, the samples were
isostically pressed, then co-fired and finally, poled as described in Methodology
Chapter.
A) B)
C) D)

Chapter 4. Results and discussion
226
Figure 109. Real photographies and scheme of the top view of fabrication steps of the
cantilevers A) Screen-printing of anchor pad B) Screen-printing of the sacrificial layer C)
Screen-printing of the bottom gold electrode D) Screen-printing of the cantilever E) Screen
printing of the top gold electrode, F) Sacrificial layer elimination after firing G) Poling of
wired cantilever with the cross view.
A)
B)
C)
D)
E)
Scree
n-p
rintin
gste
ps
Sacrificial layer
Bottom gold electrode
PZT cantilever
Top gold electrode
Anchor pad
Substrate
F)
G)
Firing
Poling
Substrate
PZT cantileverV
Au electrodes
Anchor pad
E elec

Chapter 4. Results and discussion
227
For the cantilevers, a new design was printed in order to avoid the cracking
problems of the design of previous works (Clément, P. et al., 2016; Debéda, H. and
Lucat, C., 2014). In this new design, the anchor was extended and the width and
length of gold layers were increased in order to achieve the location of top gold
layer on anchor avoiding its cracking at junction between anchor and substrate
(Figure 110A). These cantilevers were printed on Al2O3 due to the good adhesion
of inks on it. Before firing, cracks were not observed (Figure 110B). After firing,
the cracking problem of the top gold layer between anchor and substrate of
previous designs was solved thank to the new design. Nevertheless, sensors (two
LBCu formulas studied) cracked at junction of cantilever and anchor after firing as
can be seen in the microscope picture in Figure 110C.
Figure 110. A) Design of the cantilever, B) Photography of cantilever before firing and C)
Photography of cantilever after firing, fabricated on Al2O3 substrate.
In order to avoid the crack at junction, different substrate types (Al2O3 and
AlN), anchor material (glass-ceramic and PZT) and printing parameters (print gap
and print pressure) were tested. Firstly, cantilevers printed on Al2O3 and AlN were
tested in order to check the sticking of the free-standing PZT on the substrate. For
this purpose, different materials for printing anchor pad were required depending
on the substrate to get good adhesion. Thus, PZT and glass-ceramic material were
required to print anchor on Al2O3 and AlN substrate, respectively. Furthermore,
the anchor layer should be at the same level than sacrificial layer without gap
between them to avoid the cracking at junction. Table 43 summaries the thickness
of layers measured by the profilometer.
8 m
m
3 m
m
2 mm
A) B) C)
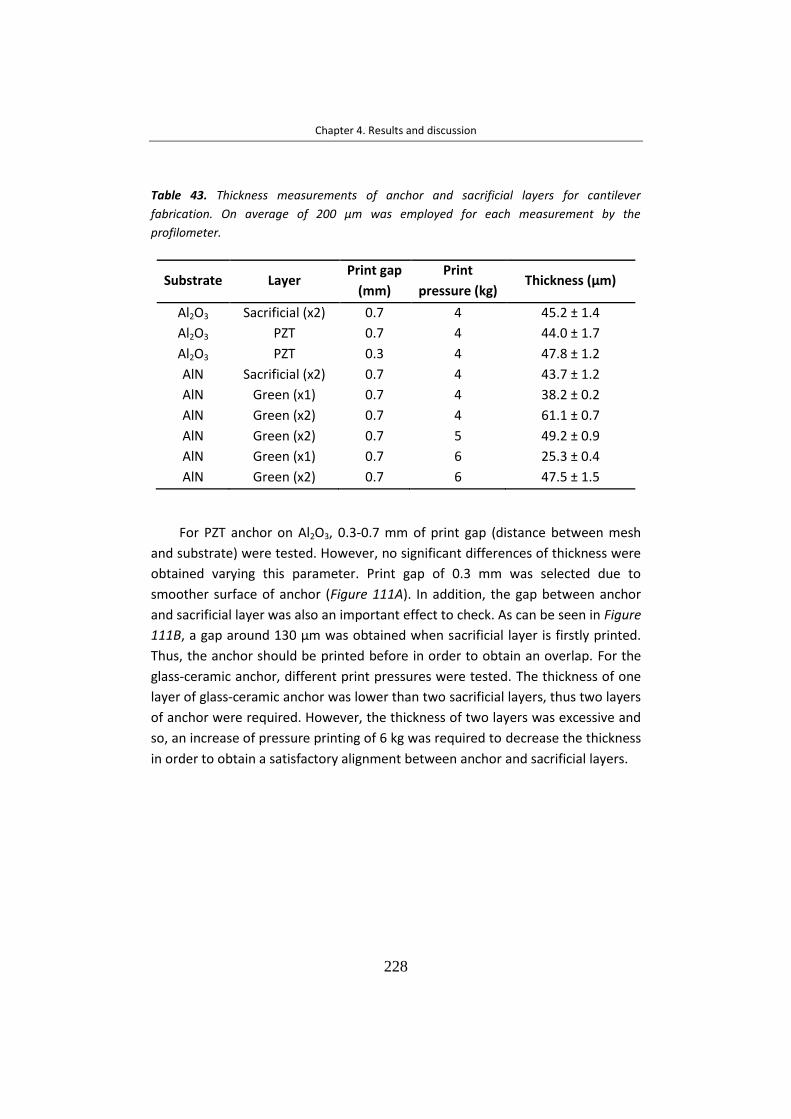
Chapter 4. Results and discussion
228
Table 43. Thickness measurements of anchor and sacrificial layers for cantilever
fabrication. On average of 200 µm was employed for each measurement by the
profilometer.
Substrate Layer Print gap
(mm)
pressure (kg) Thickness (µm)
Al2O3 Sacrificial (x2) 0.7 4 45.2 ± 1.4
Al2O3 PZT 0.7 4 44.0 ± 1.7
Al2O3 PZT 0.3 4 47.8 ± 1.2
AlN Sacrificial (x2) 0.7 4 43.7 ± 1.2
AlN Green (x1) 0.7 4 38.2 ± 0.2
AlN Green (x2) 0.7 4 61.1 ± 0.7
AlN Green (x2) 0.7 5 49.2 ± 0.9
AlN Green (x1) 0.7 6 25.3 ± 0.4
AlN Green (x2) 0.7 6 47.5 ± 1.5
For PZT anchor on Al2O3, 0.3-0.7 mm of print gap (distance between mesh
and substrate) were tested. However, no significant differences of thickness were
obtained varying this parameter. Print gap of 0.3 mm was selected due to
smoother surface of anchor (Figure 111A). In addition, the gap between anchor
and sacrificial layer was also an important effect to check. As can be seen in Figure
111B, a gap around 130 µm was obtained when sacrificial layer is firstly printed.
Thus, the anchor should be printed before in order to obtain an overlap. For the
glass-ceramic anchor, different print pressures were tested. The thickness of one
layer of glass-ceramic anchor was lower than two sacrificial layers, thus two layers
of anchor were required. However, the thickness of two layers was excessive and
so, an increase of pressure printing of 6 kg was required to decrease the thickness
in order to obtain a satisfactory alignment between anchor and sacrificial layers.

Chapter 4. Results and discussion
229
Figure 111. Pictures of thickness profile before firing of A) PZT anchor-Sacrificial layers on
Al2O3 with different print gap of anchor, B) Different print order of anchor and sacrificial
layer.
Once the printing parameters were optimized, cantilevers were printed
under selected conditions and were observed by microscope. Before firing, the
first layer of bottom gold electrode was broken (Figure 112A and B) but the
second was not broken (Figure 112C and D), and so, the sensors were fired.
-5000
5000
15000
25000
35000
45000
55000
65000
75000
0 1000 2000 3000 4000 5000 6000 7000
µm
µm
0 mm
0.7 mm
PZT anchor Sacrificial layer
-5000
5000
15000
25000
35000
45000
55000
65000
75000
0 2000 4000 6000 8000 10000
µm
µm
Anchor-Sacrificial Sacrificial-Anchor
A
B
0.3 mm

Chapter 4. Results and discussion
230
Figure 112. Microscopic images of A,B) first layer of bottom gold electrode, C,D)
cantilevers before firing. Left: glass-ceramic anchor on AlN, Right: PZT anchor on Al2O3.
The crack at junction between anchor and sacrificial was observed after firing
in both cases. For the Al2O3 substrate (Figure 113A), the breakage of the
cantilevers is maybe due to two effects: (i) the PZT anchor pad has a good
adhesion on Al2O3, thus it sinters but slight shrinks after firing and (ii) the free-
standing PZT layer has good adhesion on Al2O3 especially if the sacrificial layer is
thin. From Figure 113B, lower breakage of cantilever was observed maybe due to
the bad adhesion of free-standing PZT on AlN. From these limitations, a possible
solution could be proposed such as the use of milled PZT to change the particle
size, which affects the sintering and, therefore the addition.
A B
C D

Chapter 4. Results and discussion
231
Figure 113. Microscopic pictures of cantilevers after firing on Al2O3 (A) and AlN (B).
Physico-chemical characterization
A 3D profile analysis was carried out with the profilometer Alpha-Step IQ
Surface Profiler before densification step. Figure 114A shows a homogeneous
deposition of each consecutive screen printed layer for two formulas of disks. The
topographic measurements demonstrate that the thicknesses of the disks were
approximately 100 ± 2 and 118 ± 6 µm, for formula A and B respectively. For
cantilevers, the thickness of 114 ± 4 µm remains constant along its length and
width as Figure 114B shown as example. Each sensor was measured at three
different points.
Figure 114. 3D profile analysis of the cross-section axis of A) Disks (two formulas) and B)
Cantilever (first batch) with formula A (Debéda, H. et al., 2013), before firing.
A) B)
-20
0
20
40
60
80
100
120
140
160
180
0 2000 4000 6000
µm
µm
Formula A
Formula B
123
-20
0
20
40
60
80
100
120
140
0 500 1000 1500 2000 2500 3000
µm
µm
23
1
A) B)

Chapter 4. Results and discussion
232
Electro-mechanical characterization
Fired and poled sensors were afterwards characterized by using an
impedance analyser. The analyzer was adjusted in one of the resonant
frequencies of the material to extract different data allowing the evaluation of the
inductive behavior of samples. Two formulas of disks were compared to
commercial disks by the impedance analyser. Figure 115 shows the curves of
conductance (G), susceptance (B), impedance (Z) phase and | | for the disks. As
can be seen, the profile of disks with formula A (Debéda,H. et al., 2013) was
similar to commercial disks.
Figure 115. Graphic of A) Conductance, B) | |, C) Susceptance and D) Impedance phase
measurements of disks fabricated with two formulas A (Debéda,H. et al., 2013) and B
(Medesi, A. et al., 2014) and commercial disk.
0
0.01
0.02
0.03
0.04
0.05
0.06
0.07
0.08
160000 260000 360000 460000
G (
S)
Frequency (Hz)
CommercialFormula AFormula B
-0.04
-0.03
-0.02
-0.01
0
0.01
0.02
0.03
0.04
0.05
160000 260000 360000 460000
B (
S)
Frequency (Hz)
CommercialFormula AFormula B
-100
-80
-60
-40
-20
0
20
40
60
80
100
160000 260000 360000 460000
Ph
ase
Imp
edan
ce (
:)
Frequency (Hz)
CommercialFormula AFormula B
10
100
1000
10000
160000 260000 360000 460000
│Z│
(Ω
)
Frequency (Hz)
CommercialFormula AFormula B
A) B)
C) D)

Chapter 4. Results and discussion
233
From these measurements, figures of merit such as the mechanic quality
factor (Qm) and effective translation of electric to mechanical energy coefficient
(Keff) were calculated by the equations shown in Figure 116.
√
Figure 116. Equations used for the calculation of Keff and Qm, where fm is the frequency at
the minimum impedance (Z), fM is the frequency at the maximum impedance, fr is the
resonance frequency at G maximum, Δf= f2-f1 is the width of peak, where f1 is the
frequency at the maximum B and f2 is the frequency at the minimum B.
Table 44 compares Keff of disks fabricated and commercial disk. The disk with
formula A (Debéda, H. et al., 2013) showed the best piezoelectric properties with
a first resonance peak of in-plane radial mode fr≈ 407 kHz, Keff ≈ 33.5% and Qm ≈
280. The piezoelectric performance of the fabricated disks was lower than those
of commercial disk due to poor sintering. Note that the shift to higher resonance
frequencies of fabricated sensors is due to smaller size than the commercial disk.
Table 44. Comparation of Keff.
Coefficient Formula A disk Formula B disk Commercial disk
% Keff 33.5 23.52 59.6
Gas test
A cantilever with different design was functionalized by MCF silica (See 3.4.4
Section). Uniform functionalization of the MCF silica was carried out to improve
the surface reactivity. Figure 117 shows a photography of the functionalized
cantilever used for gas sensor application. The mesoporous silica deposited mass
is estimated to be around 200 μg.

Chapter 4. Results and discussion
234
Figure 117. Microscopic photography of the functionalized cantilever by MCF mesoporous silica.
Furthermore, to estimate the sensing material loading, the conductance of
the first 31-longitudinal mode of the cantilever is measured before and after
sensing material deposition (Figure 118A). Due to mass change of the coating, a
negative frequency shift (1638 Hz) was measured. This leads to a mass sensitivity
for the cantilever of 8 Hz μg-1. Qm for cantilever before deposition of mesoporous
silica was 222, while Qm for cantilever after functionalization was 102 due to the
mass increment of the coating.

Chapter 4. Results and discussion
235
Figure 118. A) Spectrum of the conductance for the first longitudinal mode before and after deposition of MCF silica layer and B) Relative resonant frequency shifts as a function of humidity.
The functionalized cantilever was tested under humidity. Due to the porosity
of the materials used, the humidity is a key factor to check. The cantilever was
placed in a gas chamber where different concentrations of water were introduced
(See Section 3.5.5). The performance of functionalized cantilever was evaluated
under humidity using the 31-longitudinal vibration mode. Figure 118B shows the
resonant frequency shifts due to mass change as function of the concentration of
humidity. A low sensitivity of 0.1 Hz ppm-1 was measured for the humidity test,
0.0000
0.0001
0.0002
0.0003
0.0004
0.0005
0.0006
0.0007
0.0008
0.0009
0.0010
101000 103000 105000
Co
nd
uct
ance
(S)
Frequency (Hz)
Before
After
Δf= 1638 Hz
fr = 103900 HzQ = 222
fr = 102262 HzQ = 102
y = 0.1043x - 7.4286R² = 0.9876
0
50
100
150
200
250
300
0 500 1000 1500 2000 2500 3000
Fre
qu
en
cysh
ift
(Hz)
Concentration (ppm)
A
B

Chapter 4. Results and discussion
236
indicating its potential application as gas sensor. Based on these preliminary
studies, functionalized screen-printed piezoelectric cantilever with MCF silica is a
promising sensor for the VOCs detection for environmental purposes.
Conclusions
A new design of miniaturized disk has been successfully fabricated by using
an alternative material for sacrificial layer which is removed during the firing step.
The effect of LBCu composition on the electromechanical behaviour has been
studied. The disks with a composition of 0.75% Li2O3, 1.2% Bi2O3 and 1.05% CuO
have achieved similar electro-mechanical properties to commercial disks (Keff ≈
33.5%). The new design of the cantilevers has given rise to fabrication problems
and printing parameters modification has not been solved them. Due to the
specific area of MCF mesoporous silica to detect VOCs, this material has been
drop-coated on the top gold electrode of screen-printed PZT cantilever as
sensitive layer. The funcionalized cantilever has been tested under humidity and
the low sensitivity (0.1 Hz ppm-1) obtained suggests the potential applicability of
this MCF funcionalized cantilever as portable VOCs sensor for environmental
purposes.

Chapter 4. Results and discussion
237
4.2 C-BASED MATERIAL
4.2.1 Application of CNTs modified coatings for the determination of
amphetamines by IT-SPME-CapLC
The potential utility of CNTs as an extractive phase has been evaluated in
order to extend the IT-SPME methodology to drug analysis in oral fluid. Different
PDMS-based extractive capillaries both unmodified and modified with CNTs
(MWCNTs and SWCNTs) have been compared. AMP, MAMP and EP have been
selected as model compounds because they are among the most frequently
detected drugs in oral fluid from drivers. According to the results obtained in
previous studies, in the present section the fluorogenic reagent FMOC has been
selected for derivatization of amphetamines in order to make them more
amenable for chromatography and/or to enhance the sensitivity. The
amphetamine derivatives formed have been processed by in‐valve IT‐SPME
coupled on-line to CapLC-FLD.
Optimization of the IT-SPME and chromatographic conditions
Experiments were carried out in order to optimize conditions for transferring
FMOC derivatives from the extractive capillary of the IT-SPME device to the
analytical column, as well as for the subsequent chromatographic separation. In
these studies, unmodified capillaries were used for IT-SPME. The mobile-phase
was a mixture acetonitrile-water and flow-rate was 20 µL min-1. When in-valve IT-
SPME is coupled on-line to CapLC, a compromise has to be reached between
optimal conditions for the IT-SPME and for the chromatographic separation. In
the present study, conditions were selected to achieve suitable separation of the
three analytes of interest in the minimum time of analysis. Indeed, extending the
proposed methodology to other amphetamine-like compounds would require
different separation conditions (for example, a longer column).
Two mobile-phase compositions were tested, 50:50 and 70:30
acetonitrile:water (v/v). The results obtained demonstrated that both
compositions were adequate to desorb the FMOC derivatives from the extractive
capillary. However, best chromatographic separation was achieved by using a
mixture acetonitrile:water 70:30 (v/v) (See Figure 119), which was the eluent
composition selected for further work. The dead times observed in the

Chapter 4. Results and discussion
238
chromatograms were higher than those expected for a conventional capillary
chromatographic separation due to the inclusion of the extractive device. It has to
be noted that the EP derivative eluted on the tail of the FMOC peak; for this
reason, peak areas for this analyte were calculated throughout the study by the
tangent skimming integration method.
Figure 119. Chromatograms obtained for a standard solution containing AMP, MAMP and
EP (8 µg mL-1
, each) using a percentage of acetonitrile in the mobile phase of: (A) 50 % and
(B) 70 %, using an unmodified PDMS65 extractive capillary (30 cm length) for IT-SPME.
On the other hand, the effect of the capillary length on the analytical
responses (peak areas) was evaluated by processing solutions of the same
0
50000
100000
150000
200000
250000
300000
350000
0 5 10 15 20
Flu
ore
scen
ce (
AU
)
Time (min)
EP AM
P
MA
MP
0
100000
200000
300000
400000
500000
600000
700000
0 1 2 3 4 5 6 7 8
Flu
ore
scen
ce (
AU
)
Time (min)
EP
AM
P
MA
MP
A
B
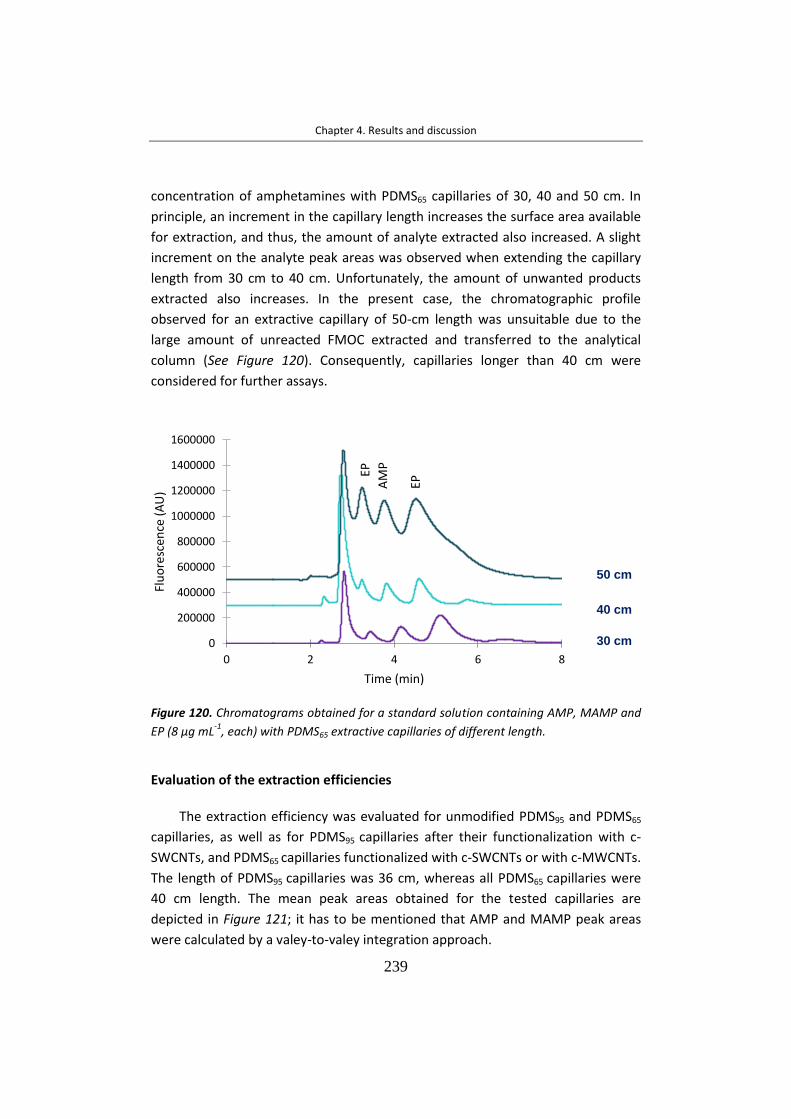
Chapter 4. Results and discussion
239
concentration of amphetamines with PDMS65 capillaries of 30, 40 and 50 cm. In
principle, an increment in the capillary length increases the surface area available
for extraction, and thus, the amount of analyte extracted also increased. A slight
increment on the analyte peak areas was observed when extending the capillary
length from 30 cm to 40 cm. Unfortunately, the amount of unwanted products
extracted also increases. In the present case, the chromatographic profile
observed for an extractive capillary of 50-cm length was unsuitable due to the
large amount of unreacted FMOC extracted and transferred to the analytical
column (See Figure 120). Consequently, capillaries longer than 40 cm were
considered for further assays.
Figure 120. Chromatograms obtained for a standard solution containing AMP, MAMP and
EP (8 µg mL-1
, each) with PDMS65 extractive capillaries of different length.
Evaluation of the extraction efficiencies
The extraction efficiency was evaluated for unmodified PDMS95 and PDMS65
capillaries, as well as for PDMS95 capillaries after their functionalization with c-
SWCNTs, and PDMS65 capillaries functionalized with c-SWCNTs or with c-MWCNTs.
The length of PDMS95 capillaries was 36 cm, whereas all PDMS65 capillaries were
40 cm length. The mean peak areas obtained for the tested capillaries are
depicted in Figure 121; it has to be mentioned that AMP and MAMP peak areas
were calculated by a valey-to-valey integration approach.
0
200000
400000
600000
800000
1000000
1200000
1400000
1600000
0 2 4 6 8
Flu
ore
scen
ce (
AU
)
Time (min)
40 cm
30 cm
50 cm
EP
AM
P
EP
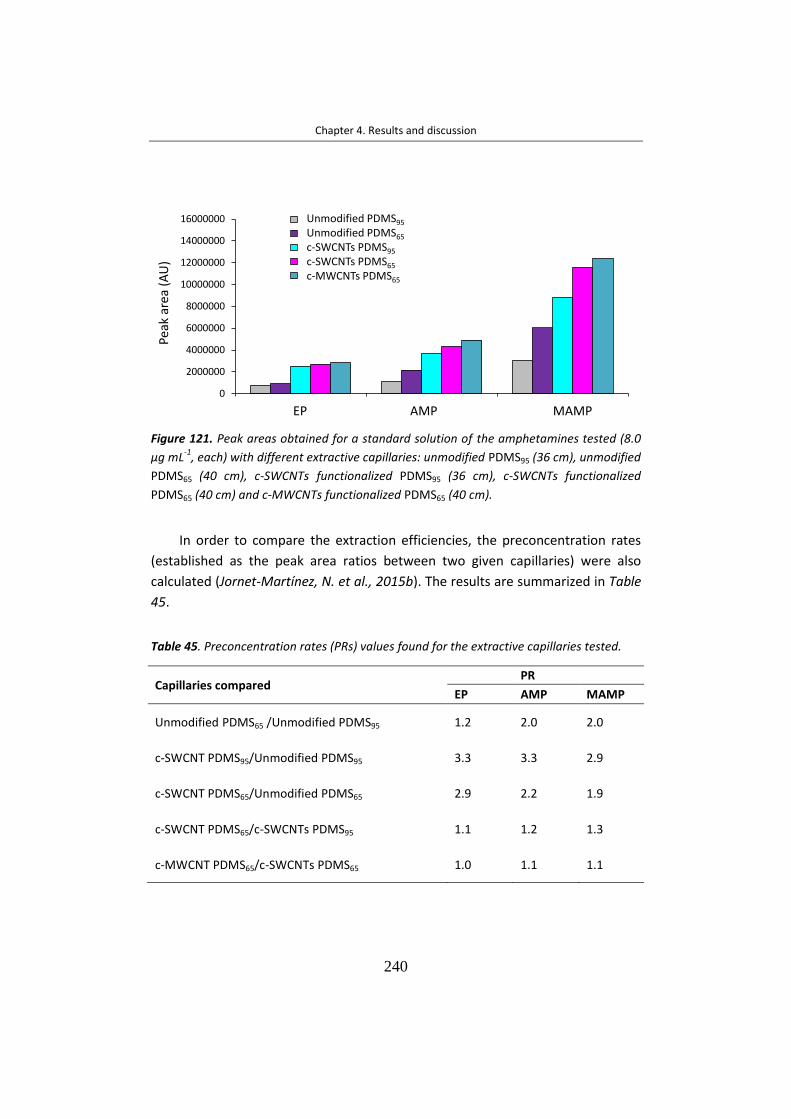
Chapter 4. Results and discussion
240
Figure 121. Peak areas obtained for a standard solution of the amphetamines tested (8.0
μg mL-1
, each) with different extractive capillaries: unmodified PDMS95 (36 cm), unmodified
PDMS65 (40 cm), c‐SWCNTs functionalized PDMS95 (36 cm), c‐SWCNTs functionalized
PDMS65 (40 cm) and c‐MWCNTs functionalized PDMS65 (40 cm).
In order to compare the extraction efficiencies, the preconcentration rates
(established as the peak area ratios between two given capillaries) were also
calculated (Jornet-Martínez, N. et al., 2015b). The results are summarized in Table
45.
Table 45. Preconcentration rates (PRs) values found for the extractive capillaries tested.
Pe
ak
are
a(a
. u
.)
0
2000000
4000000
6000000
8000000
10000000
12000000
14000000
16000000
EPE AMP MET
Unmodified TRB-5
Unmodified TRB-35
c-SWCNTs TRB-5
c-SWCNTs TRB-35
c-MWCNTs TRB-35
EP AMP MAMP
Peak
area
(AU
)
Unmodified PDMS95
Unmodified PDMS65
c-SWCNTs PDMS95
c-SWCNTs PDMS65
c-MWCNTs PDMS65
Capillaries compared PR
EP AMP MAMP
Unmodified PDMS65 /Unmodified PDMS95 1.2 2.0 2.0
c‐SWCNT PDMS95/Unmodified PDMS95 3.3 3.3 2.9
c-SWCNT PDMS65/Unmodified PDMS65 2.9 2.2 1.9
c-SWCNT PDMS65/c-SWCNTs PDMS95 1.1 1.2 1.3
c-MWCNT PDMS65/c-SWCNTs PDMS65 1.0 1.1 1.1
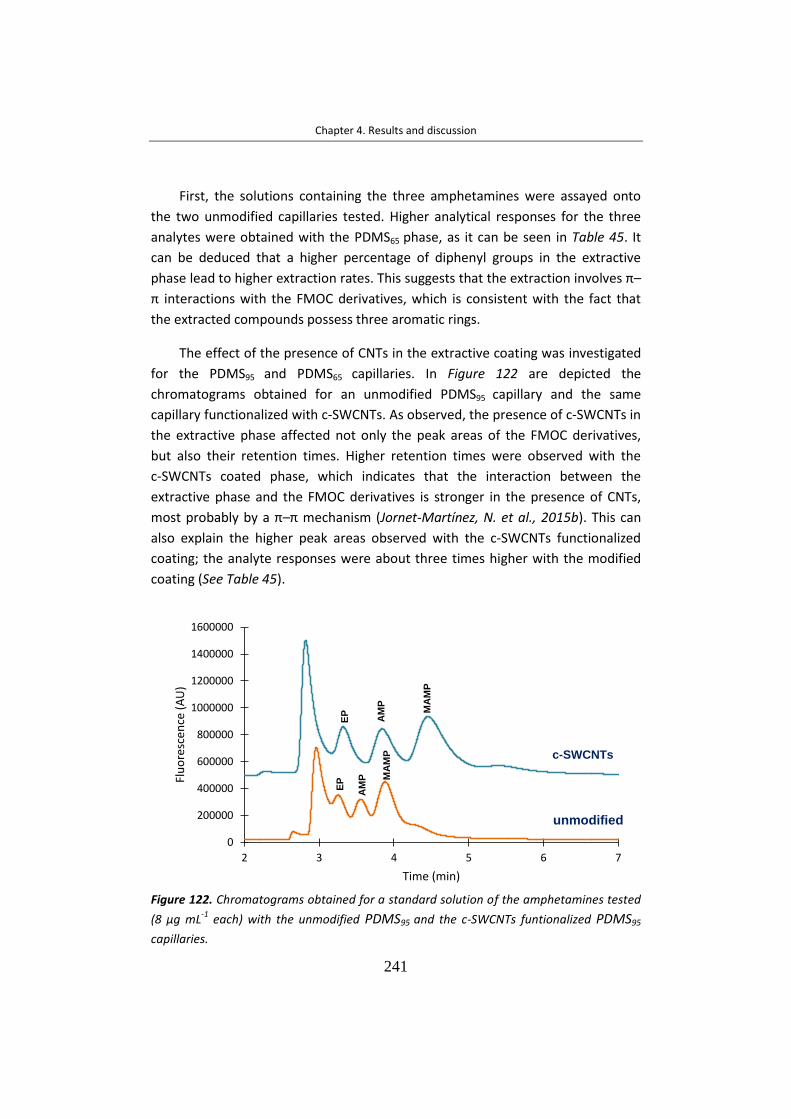
Chapter 4. Results and discussion
241
First, the solutions containing the three amphetamines were assayed onto
the two unmodified capillaries tested. Higher analytical responses for the three
analytes were obtained with the PDMS65 phase, as it can be seen in Table 45. It
can be deduced that a higher percentage of diphenyl groups in the extractive
phase lead to higher extraction rates. This suggests that the extraction involves π–
π interactions with the FMOC derivatives, which is consistent with the fact that
the extracted compounds possess three aromatic rings.
The effect of the presence of CNTs in the extractive coating was investigated
for the PDMS95 and PDMS65 capillaries. In Figure 122 are depicted the
chromatograms obtained for an unmodified PDMS95 capillary and the same
capillary functionalized with c‐SWCNTs. As observed, the presence of c‐SWCNTs in
the extractive phase affected not only the peak areas of the FMOC derivatives,
but also their retention times. Higher retention times were observed with the
c‐SWCNTs coated phase, which indicates that the interaction between the
extractive phase and the FMOC derivatives is stronger in the presence of CNTs,
most probably by a π–π mechanism (Jornet-Martínez, N. et al., 2015b). This can
also explain the higher peak areas observed with the c‐SWCNTs functionalized
coating; the analyte responses were about three times higher with the modified
coating (See Table 45).
Figure 122. Chromatograms obtained for a standard solution of the amphetamines tested
(8 µg mL-1
each) with the unmodified PDMS95 and the c-SWCNTs funtionalized PDMS95
capillaries.
0
200000
400000
600000
800000
1000000
1200000
1400000
1600000
2 3 4 5 6 7
Flu
ore
sce
nce
(A
U)
Time (min)
unmodified
c-SWCNTs
EP
AM
P
MA
MP
EP
AM
P MA
MP

Chapter 4. Results and discussion
242
Similar results were observed for the PDMS65 capillaries. This is illustrated in
Figure 123, which shows the chromatograms obtained for unmodified PDMS65
capillary and the same capillary after the introduction of c-MWCNTs. However,
the increment in the analytical signals was more moderate than with the PDMS95
capillaries, especially increased in the presence of c-MWCNTs, chromatographic
peaks are narrower. As a result, not only the sensitivity but also the resolution
improved with the introduction of CNTs.
Figure 123. Chromatograms obtained for a standard solution of the amphetamines tested
(8 μg mL-1
each) with the unmodified PDMS65 and the c‐MWCNTs functionalized PDMS65
capillaries.
On the other hand, the effect of the type of CNTs on the extractive phase was
evaluated for a PDMS65 capillary. Figure 124 shows that both c-SWCNTs and
c-MWCNTs modified coatings provided similar chromatographic profiles, although
the peak areas were slightly higher for the c-MWCNTs functionalized capillary. The
chromatographic profiles obtained when using the PDMS65 capillaries were better
than those observed with the PDMS95 capillaries (Figures 122–124).
0
200000
400000
600000
800000
1000000
1200000
1400000
2 3 4 5 6 7
Flu
ore
scen
ce (
AU
)
Time (min)
unmodified
c-MW-CNTs
EPE AM
P MA
MP
c-MWCNTs

Chapter 4. Results and discussion
243
Figure 124. Chromatograms obtained for a standard solution of the amphetamines tested
(8 µg mL-1
, each) with the c-SWCNTs and the c-MWCNTs functionalized PDMS65 capillaries.
Finally, the loading capacity was examined by processing solutions of the
tested analytes at concentrations ranging from 2 to 10 µg mL-1 with different
capillaries. The results are depicted in Figure 125. As it can be deduced from this
figure, a linear relation between concentration and peaks areas was observed
within the tested concentration interval with the PDMS65 columns. However, poor
linearity was observed for the PDMS95 columns regardless the presence of CNTs in
the extractive coating. For the PDMS95 capillaries, better correlation was observed
between peak areas and concentration within the 2–8 µg mL-1 range (See Table
46), which indicates that their loading capacity was lower than that of the PDMS65
capillaries.
0
200000
400000
600000
800000
1000000
1200000
1400000
2 3 4 5 6 7
Flu
ore
sce
nce
(A
U)
Time (min)
c-SWCNTs
c-MWCNTs
EP
AM
P MA
MP

Chapter 4. Results and discussion
244
Figure 125. Peak areas obtained for different concentrations of the amphetamines tested
within the 2–10 μg mL-1
concentration range with different extractive capillaries.
Pea
kar
ea(A
U)
Concentration ( µg mL-1)
EPE
AMP
MET
0
2000000
4000000
6000000
8000000
0 2 4 6 8 10
0
1000000
2000000
3000000
4000000
0 2 4 6 8 10
0
4000000
8000000
12000000
16000000
0 2 4 6 8 10
TRB-35 c-MWCNTs L= 40 cm
TRB-5 c-SWCNTs L= 36 cm
TRB-35 L= 30 cm
TRB-5 L= 30 cm
EP
AMP
MAMP
PDMS65 c-MWCNTs L = 40 cmPDMS95 c-SWCNTs L = 36 cmPDMS65 L = 30 cmPDMS95 L = 30 cm

Chapter 4. Results and discussion
245
Table 46. Response vs concentration linearity data.
Taking into account the absolute peak areas and chromatographic profiles, as
well as the linear working interval, a c-MWCNTs coated PDMS65 capillary of 40 cm
length was selected as the best option for further experiments.
Application to the quantification of amphetamines in oral fluid samples
In the analysis of drugs in oral fluid, samples are usually collected by spitting
or by using sweat wipes, sponges or swabs (Lledo-Fernandez, C. and Banks, C.E.,
2011; Samyn, L. et al., 2007). Owing to its high viscosity, the direct loading of oral
fluid into the IT-SPME capillary was unsuitable, even after dilution with the buffer
and FMOC solutions. For this reason, in the present study cotton swabs were used
to collect oral fluid. In order to simplify the analytical procedure and to avoid
excessive dilution of the analytes, the swabs were directly immersed into vials
containing the derivatization solution. In such a way, the analytes were
simultaneously extracted from the swabs and derivatized. Finally, aliquots of the
resulting solutions were removed from the vials and processed by IT-SPME with a
Capillary Concentration
Interval (µg mL--1
)
Linearity (y = ax + b)
EP AMP MAMP
PDMS65 c-MWCNTs L= 40 cm
2.0–10.0 a = (39 ± 3) × 10
4
b = (−5 ± 2) × 106
R2 = 0.980
a = (606 ± 14) × 103
b = (3 ± 9) × 105
R2 = 0.998
a = (159 ± 5) × 104
b = (−8 ± 3) × 106
R2 = 0.997
PDMS95 c-SWCNTs L= 36 cm
2.0–10.0 a = (23 ± 7) × 10
4
b = (2 ± 5) × 106
R2 = 0.764
a = (22 ± 9) × 104
b = (2 ± 6) × 106
R2 = 0.658
a = (64 ± 8) × 104
b = (21 ± 14) × 105
R2 = 0.962
2.0–8.0 a = (35 ± 4) × 10
4
b = (−27 ± 15) × 104
R2 = 0.987
a = (36 ± 8) × 104
b = (9 ± 4) × 105
R2 = 0.910
a = (97 ± 14) × 104
b = (11 ± 8) × 105
R2 = 0.96
PDMS65 L= 30 cm 2.0–10.0 a = (117 ± 4) × 10
3
b = (−3 ± 3) × 105
R2 = 0.997
a = (28 ± 2) × 104
b = (11 ± 13) × 104
R2 = 0.990
a = (70 ± 5) × 104
b = (6 ± 3) × 106
R2 = 0.983
PDMS95 L= 30 cm
2.0–10.0 a = (61 ± 17) × 10
3
b = (17 ± 11) × 105
R2 = 0.810
a = (10 ± 3) × 104
b = (2 ± 2) × 106
R2 = 0.750
a = (33 ± 9) × 104
b = (1 ± 6) × 105
R2 = 0.800
2.0–8.0 a = (8 ± 2) × 10
4
b = (8 ± 1) × 105
R2 = 0.910
a = (15 ± 2) × 104
b = (3 ± 10) × 104
R2 = 0.972
a = (49 ± 2) × 104
b = (−52 ± 10) × 104
R2 = 0.997

Chapter 4. Results and discussion
246
c-MWCNTs coated PDMS65 capillary. The reliability of the proposed approach was
first tested with standard solutions of the analytes.
Preliminary experiments were carried out to estimate the volume of the
sample that could be absorbed with the swabs. Volumes of the working solutions
ranging from 50 to 200 µL were introduced into 2 mL glass vials, and then swabs
were put into contact with these solutions. It was found that the swabs used in
the present study absorbed about 125 µL of the standard solutions containing the
amphetamines in glass vials; then the tips of the swabs were put into contact with
the working solutions until the liquid was totally absorbed. Next, the swabs were
immersed into another vial which contained the derivatization solution (250 µL of
the 0.1 mM FMOC solutions). Finally, aliquots of the resulting solutions were
processed by IT-SPME and chromatographed. The effect of volume of the extracts
loaded into the IT-SPME capillary was tested within the 10–50 µL interval. A
volume of 20 µL was found to be the best option, as higher volumes did not
significantly increase the signal, probably due to the high percentage of
acetonitrile in the extracts, whereas the peak corresponding to the excess of
FMOC interfered with the measurement of the FMOC-EP peak. Under such
conditions, good linearity and reproducibility was found within the tested
concentration intervals (1–10 µg mL-1 for AMP and MAMP and 2–10 µg mL-1 for EP
(See Table 47).
Table 47. Linearity and precision achieved with the proposed extraction-derivatization‐IT-
SPME‐CapLC method for AMP, MAMP and EP within the 1–10 μg mL-1
(2–10 μg mL-1
for EP)
concentration interval (values obtained with the c‐MWCNTs coated PDMS65 capillary of 40
cm length).
Compound Linearity, y = ax + b (n=8)* Precision**,
RSD(%)(n=3) a ± sa b ± sb R2
EP (229 ± 8)x103
(-18 ± 4)x104
0.991 5
AMP (402 ± 15)x103
(-39 ± 8)x104 0.991 3
MAMP (606 ± 22)x103 (-46 ± 11)x10
4 0.991 3
*Established from four concentrations assayed in duplicate
**Established at a concentration of 4 µg mL-1
According to the above results, the conditions finally selected for the analysis
of amphetamines in oral fluid were those indicated in Figure 126.

Chapter 4. Results and discussion
247
Figure 126. Scheme of the extraction/derivatization IT‐SPME-CapLC method used for the
analysis of amphetamines in oral fluid. The extractive capillary was a c‐MWCNT
functionalized PDMS65 capillary (40 cm length).
A small peak was observed at a retention time slightly lower than that of the
EP‐FMOC derivative. This peak was not detected when effecting the derivatization
in solution; thus, this peak was due to a compound present in the cotton.
Nevertheless, it could be differentiated from the peak corresponding to the EP
derivative (See Figure 127).
3) Separation and detection
to the column
2) IT-SPME
from the pump
c-MWCNTs TRB-35
to the column
250 µL of buffer + 250 µL of 0.1 mMFMOC
(5.0 min)
1) Extraction/derivatization
20 µL
sample (≈ 125 µL)
from the pump

Chapter 4. Results and discussion
248
Figure 127. (a) Chromatograms obtained for the reaction mixture (250 µL of buffer and
250 µL of 0.1 mM FMOC), (b) the same reaction mixture after the introduction of a cotton
swab for 5 min, and (c) after the introduction of a cotton swab impregnated with 125 µL of
a standard solution of EP (2 µg mL-1
). For IT-SPME a c-MWCNTs functionalized PDMS65
capillary (40 cm length) was used.
In Figure 128 are shown the chromatograms obtained for a sample of oral
fluid and the same sample spiked with a mixture of the analytes. The
chromatograms obtained for oral fluid were similar to those obtained for standard
solutions subjected to the same extraction/derivatization procedure (Figure 127).
It was then concluded that the selectivity provided by the c-MWCNTs coated
PDMS65 capillary was suitable. In addition, no significant differences were
observed in the chromatograms obtained for samples obtained from different
donors. LODs, established as the concentration of amphetamines that yielded a
signal-to-noise ratio of 3, were 0.8 µg mL-1 for EP, and 0.5 µg mL-1 for AMP and
MAMP. The precision was also satisfactory, being the interday coefficients of
variation 6 % for EP and AMP, and 3 % for MAMP (n = 3). Finally, no additional
cleaning of the extractive capillary with an organic solvent after each run was
necessary as during the transfer and chromatographic separation steps the
0
200000
400000
600000
800000
1000000
1200000
1400000
0 1 2 3 4 5 6 7 8
Flu
ore
scen
ce (
AU
)
Time (min)
a
b
cEP AM
P
MA
MP
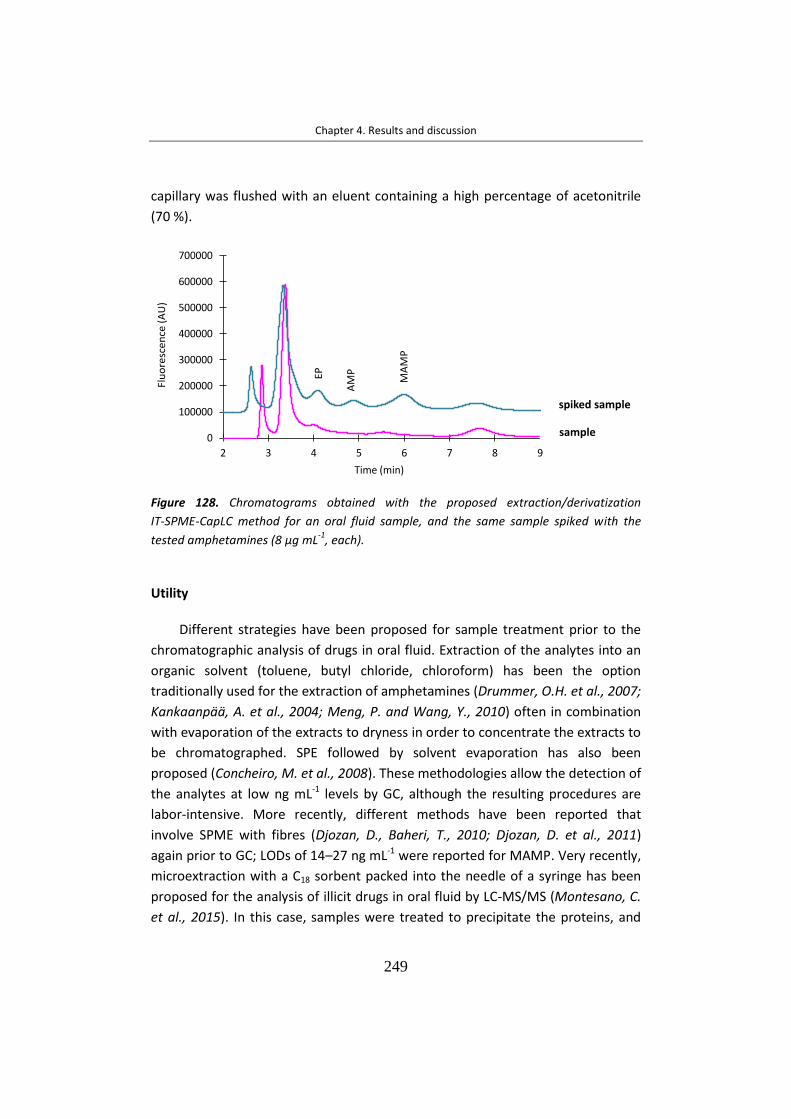
Chapter 4. Results and discussion
249
capillary was flushed with an eluent containing a high percentage of acetonitrile
(70 %).
Figure 128. Chromatograms obtained with the proposed extraction/derivatization
IT-SPME-CapLC method for an oral fluid sample, and the same sample spiked with the
tested amphetamines (8 µg mL-1
, each).
Utility
Different strategies have been proposed for sample treatment prior to the
chromatographic analysis of drugs in oral fluid. Extraction of the analytes into an
organic solvent (toluene, butyl chloride, chloroform) has been the option
traditionally used for the extraction of amphetamines (Drummer, O.H. et al., 2007;
Kankaanpää, A. et al., 2004; Meng, P. and Wang, Y., 2010) often in combination
with evaporation of the extracts to dryness in order to concentrate the extracts to
be chromatographed. SPE followed by solvent evaporation has also been
proposed (Concheiro, M. et al., 2008). These methodologies allow the detection of
the analytes at low ng mL-1 levels by GC, although the resulting procedures are
labor-intensive. More recently, different methods have been reported that
involve SPME with fibres (Djozan, D., Baheri, T., 2010; Djozan, D. et al., 2011)
again prior to GC; LODs of 14–27 ng mL-1 were reported for MAMP. Very recently,
microextraction with a C18 sorbent packed into the needle of a syringe has been
proposed for the analysis of illicit drugs in oral fluid by LC-MS/MS (Montesano, C.
et al., 2015). In this case, samples were treated to precipitate the proteins, and
0
100000
200000
300000
400000
500000
600000
700000
2 3 4 5 6 7 8 9
Flu
ore
sce
nce
(A
U)
Time (min)
blank
spiked sample
EP
AM
P
MA
MP
sample
spiked sample

Chapter 4. Results and discussion
250
the supernatant was passed through the sorbent by repetitive
aspirating/dispensing cycles, being the LOD reported for AMP 1 ng mL-1.
Compared with previously described procedures, the main advantage of the
present methodology is the simplicity. After sample collection, the only
operations required are the immersion of the swabs into the derivatization
solution and, after 5 min, the loading of an aliquot of the resulting solution into
the IT-SPME device. The proposed method is also advantageous in terms of time
of analysis and solvent and reagents consumption. Although the LODs are about
one order of magnitude higher than those reported by other authors, the
proposed method can be considered adequate for the measurement of
amphetamines in oral fluid of abusers. For example, concentrations of
amphetamine found in oral fluid samples during random tests programs were in
the 0.3–8.8 µg mL-1 range (Samyn, N. and van Haeren, C. 2000; Samyn, N. et al.,
2002). Nevertheless, for other types of studies, more sensitive methodologies
may be required.
Conclusions
The present study shows that IT-SPME is a valid option for the on-line
extraction of amphetamines derivatized with FMOC, and for their subsequent
separation by CapLC. The efficiencies of the IT-SPME have been examined for
different PDMS-based extractive capillaries, as well as for the same capillaries
after their functionalization with CNTs. The introduction of CNTs in the extractive
coatings has a positive effect not only on the extraction efficiencies but also on
the chromatographic profiles. In all instances, highest responses were obtained
for PDMS65 capillaries, which can be explained by a π–π interaction mechanism. In
this sense, the use of FMOC (which introduces two aromatic rings in the
compounds to be extracted) may be advantageous over other derivatization
reagents typically used for amphetamines (Herráez-Hernández, R. et al., 1996). On
the other hand, the chromatograms observed for PDMS65 capillaries
functionalized with c-SWCNTs and c-MWCNTs were quite similar, although the
analytical responses obtained with the latter capillary were slightly higher.
According to these results, a new approach has been described for the analysis of
amphetamines derivatives using a PDMS65 capillary functionalized with
c-MWCNTs. The described approach combines the simplicity of in-valve IT-SPME
with enhanced sensitivity, and can be considered an alternative for the analysis of

Chapter 4. Results and discussion
251
amphetamines. As an illustrative example of application, in the present study oral
fluid samples (≈125 µL) collected with cotton swabs have directly been derivatized
and processed by IT-SPME-CapLC. The proposed method is very simple and cost-
effective, and provides suitable selectivity, sensitivity and reproducibility at low µg
mL-1 concentration levels, which are concentrations typically found in oral fluid of
abusers.

Chapter 4. Results and discussion
252
4.3 METALLIC-BASED MATERIALS
4.3.1 MOF
4.3.1.1 Peptide MOF for enantioselective separation of chiral drugs
The discovery of chiral adsorbents that permit rapid separation of individual
enantiomers is relevant in the pharmaceutical industry. In the present section, the
application of a MOF is focused as chiral phase for SPE. The proposed 3D MOF is
based on the tripeptide Gly-L-His-Gly (GHG) to engineer the chiral pockets in their
structure for the separation of chiral polar drugs such as MAMP and EP
enantiomers. Monte Carlo (MC) simulations have been used to reveal how
intermolecular interactions between the drugs and the peptide backbone guide
chiral recognition. Synthesis, theoretical simulations and characterization of the
proposed MOF have been carried out with FuniMat Group (Instituto de Ciencia
Molecular, Universidad de Valencia). Enantioselective separation has been
evaluated by chromatographic analysis. For the first set of preliminary studies, the
enantiomeric recognition of Cu(GHG) has been examined in solution and
subsequently the enantioselective separation has been carried out with SPE by
using Cu(GHG) as chiral phase.
Synthesis of Cu(GHG)
Cu(GHG) was synthesized by slow diffusion of GHG (See Figure 129) and Cu(II)
acetate to produce prismatic, micrometric blue crystals by following a synthetic
procedure recently reported (Martí-Gastaldo, C. et al., 2015). 24.2 mg of the
peptide (90 µmol) were dissolved in 300 µL of an aqueous solution of
Cu(OAc)2∙2H2O 0.3 M (90 µmol) in a 4 mL glass vial to produce a blue solution. The
solution was manually stirred followed by sequential addition of 1.26 mL of
absolute ethanol and 200 µL of water. The mixture was then left to stand in a
temperature controlled chamber at 25ºC for the formation of blue coloured
prismatic crystals. After 48 hours, crystals were filtered, washed with absolute
ethanol and stored at 4ºC (75% yield, calculated for the metal).

Chapter 4. Results and discussion
253
Figure 129. GHG structure.
Characterization of Cu(GHG)
Phase purity was studied by SEM (Figure 130), CHN, FTIR, thermogravimetric
analysis and powder X-ray diffraction (PXRD).
Figure 130. Microscopic (left) and SEM images (right) of as-made crystals of Cu(GHG).
Particle morphologies and dimensions at an accelerating voltage of 20 keV.
Cu(GHG) crystallizes to produce an open 3D framework, built from the
interconnection of 4-fold helicoidal Cu-peptide-Cu chains by μ2-carboxylate
bridges in C-terminal Gly (Figure 131A). Porosity arises from the interconnection
of 1D empty channels that account for a solvent-accessible volume close to 60 %
of the total volume. Use of peptides as metal connectors allows us to decorate
the surface of the empty space with carboxylate, amide, amino, and imidazole
groups pointing into the channels (Figure 131B). This renders chemically versatile
channels featuring a manifold of interaction sites for modulating framework/guest
interactions (Figure 131C).
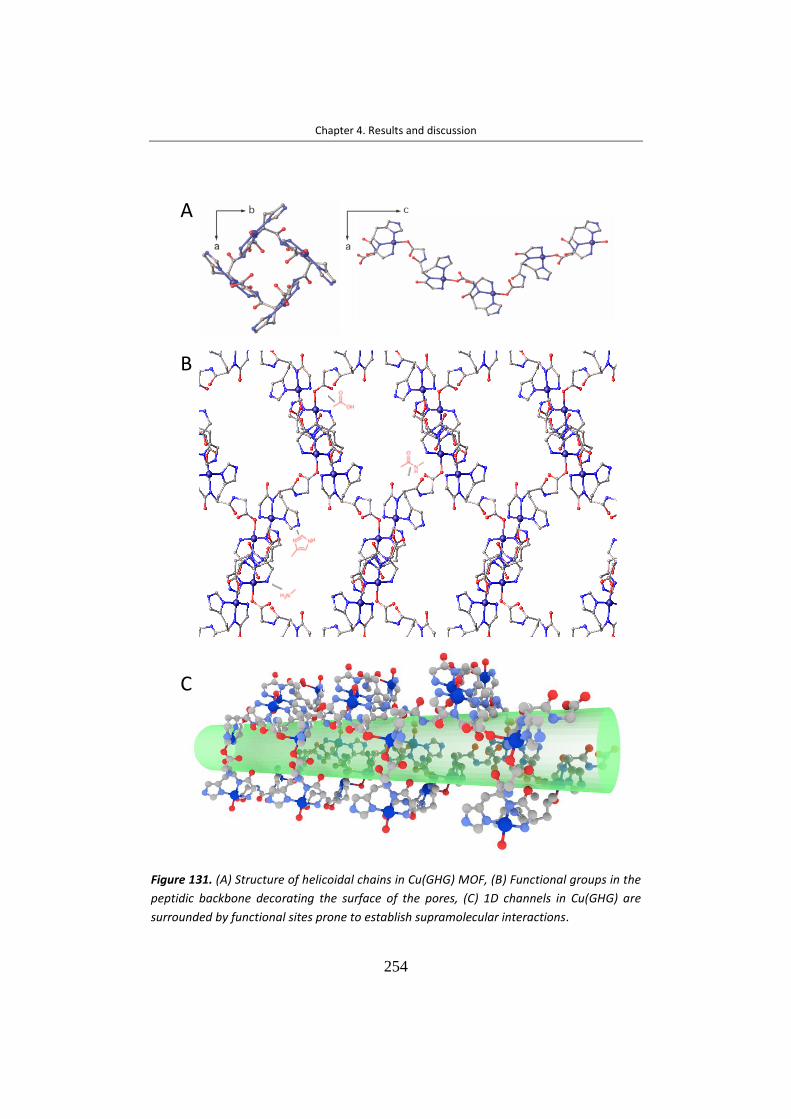
Chapter 4. Results and discussion
254
Figure 131. (A) Structure of helicoidal chains in Cu(GHG) MOF, (B) Functional groups in the
peptidic backbone decorating the surface of the pores, (C) 1D channels in Cu(GHG) are
surrounded by functional sites prone to establish supramolecular interactions.
A
B
C

Chapter 4. Results and discussion
255
Theoretical simulatons
The chiral recognition can potentially be triggered by preferential sorption in
the chiral pockets of the MOF rather than interactions at the surface of the solid.
MC simulations were used to gain a better understanding of the role played by
the functional groups from the peptide in controlling preferential adsorption for
more favorable binding sites. We simulated the adsorption of the two
enantiomers (+,−) of MAMP and EP. The structure of Cu(GHG) (CCDC961607) was
first prepared for the theoretical study by removal of solvent molecules occupying
the pores. Most stable conformations of MAMP and EP enantiomers were
explored by randomly changing the torsion angles.
Figure 132. Representative MC binding geometries of (+,−) MAMP and EP enantiomers
within the structure of Cu(GHG) and corresponding adsorption energies as absolute values
calculated with respect to gas phase. Most relevant H-bonds in directing guest binding are
annotated in each case.
Figure 132 summarizes the adsorption energies and preferential binding sites
for the most representative host−guest adducts calculated. Adsorption of both
MAMP enantiomers is preferentially directed by the formation of H-bonds
between the amine and the imidazole group in His side chain. We have used
discrete models of the MOF and quantumchemistry calculations to confirm that
this interaction is energetically most favorable, at least 4 kcal mol-1 stronger than
those accessible by interaction with other functional groups in the pocket
involving C-terminal and N-terminal Gly (Table 48).

Chapter 4. Results and discussion
256
Table 48. Summary of binding energies and H-bond lengths for MAMP-MOF interactions as
estimated by quantum-chemistry calculations.
H-Bond Binding Energy (kcal.mol
-1)
Bond Length (Å)
(MAMP)-HN…HN-(imidazole; His) 15.0 1.977
(MAMP)-HN…H2N-(amino, Gly; N-term) 10.9 2.054
(MAMP)-NH…O=C-(amide bond, Gly N-term) 6.3 2.149
Regarding enantiomeric recognition, (+)-MAMP is accommodated closer to
the pocket for a stronger interaction via an imidazole H-bond. This elongates from
1.87 Å for (+)-MAMP to 2.03 Å when interacting with (−)-MAMP, due to small
changes in the adsorption configurations of the enantiomers (Figure 132). The
higher binding energy observed for (+)-MAMP mainly arises from stronger van der
Waals interactions due to a better fit to the shape of the pocket. While the
accuracy of the force-field model and the difficulty of replicating experimental
solvation effects do not allow for quantitative prediction of chiral selectivities, our
simulations suggest that more effective enantioselective recognition is expected
for EP as result of cooperative supramolecular interactions.
As shown in Figure 132, adsorption of (−)-EP is solely directed by the
formation of a weak elongated H-bond (2.36 Å) with the amide bond in C-terminal
Gly. In contrast, (+)-EP combines short His-EP H-bonds (1.89 Å), equivalent to that
with (+)-MAMP, with auxiliary bonds with the carboxylate and amino groups (2.09
and 2.40 Å) in the C-terminal and N-terminal Gly aa’s of Cu(GHG) for more
favorable adsorption. It is the strength and number of H-bonds-EP has two H-
bonding groups capable of interacting synergically with the environment of the
peptide MOF that translate into a bigger difference in adsorption energies close to
13 kcal mol-1.
MC simulations suggest that Cu(GHG) might display stereoselectivity, in
particular for EP enantiomers, associated with the control of non-covalent
interactions over their binding geometries. This promising result prompted us to
attempt actual separation experiments from solutions of the racemates. One of
the key limitations of flexible MOFs is their poor mechanical robustness that
results in collapse of the structure upon solvent removal. This is also the case for
Cu(GHG), which displays sponge-like behavior with a crystalline-to-amorphous
transformation after activation that can be reverted to the original state in the

Chapter 4. Results and discussion
257
presence of polar solvents. Though this is a key limitation for gas storage, which
requires the porous material to be activated prior to gas sorption, chiral
recognition is a dynamic process, and prior filling of the pores is not imperative
since the solvent molecules occupying the pores can be progressively exchanged
with the chiral guests in solution. Hence, all separation experiments were carried
out by using non-evacuated, assynthesized materials to preserve their structural
integrity.
Enantioselective recognition in solution
First, the ability of Cu(GHG) to recognize selectively enantiomers from
solution was studied by soaking 10 mg of fresh solid in racemic mixtures of MAMP
and EP (40 μg mL-1 in ethanol:water 75:25). Enantioselective recognition was
evaluated chromatographically as a function of contact time (See Methodology
Chapter for experimental details). As shown in Figure 133, adsorption of (−)-
MAMP and (−)-EP can be considered negligible, whereas 30 ± 3 % of (+)-MAMP
and 37 ± 3 % of (+)-EP are preferentially adsorbed after 4 and 2 h, respectively.
Figure 133. Evolution of the enantioselective recognition of Cu(GHG) for chiral drugs in ethanol:water 75:25 solution with contact time for (A) MAMP and (B) EP. Chiral adsorption was evaluated from chromatographic analysis of the supernatant solution.
A B
Peak
area
(AU
)
Peak
area
(AU
)
Enantiomerssolution
Time (min)
MOF
Chromatographicanalysis
Variable contact time

Chapter 4. Results and discussion
258
For clarity, we have defined the enantioselective recognition of Cu(GHG) for
(+)-MAMP and (+)-EP as the ratio between the difference of the peak areas for
these enantiomers after 240 and 120 min (minimum signal intensity detected
experimentally in each case) and the maximum at 0 min for free enantiomers in
solution in absence of the MOF normalized to the peak area of this last.
Experiments were repeated three times for confirming precision of the reported
behavior, data are summarized in the Table 49.
Table 49. Experimental data used for calculation of enantioselective recognition capability
of Cu(GHG).
Time (min) Peak area (+)-MAMP
Test 1 Test 2 Test 3
0 (no MOF) 2828 2694 2750 240 (with MOF) 2092 1812 1914 Enantioselective recognition (%) 26.0 32.7 30.4 Average (%) 30
3 Standard Deviation (s)
Time (min) Peak area (+)-EP
Test 1 Test 2 Test 3
0 (no MOF) 440 392 410 120 (with MOF) 288 234 267 Enantioselective recognition (%) 34.5 40.3 34.9 Average (%) 37
3 Standard Deviation (s)
We attribute the long recognition times to the highly polar mixture of
solvents used. This will stabilize the chiral drugs in solution, preventing fast
diffusion into the porous chiral medium for a slow recognition process with long
equilibration times. This experiment agrees well with the MC simulations that
support preferential interaction of (+)-enantiomers in the chiral pocket linked to
specific conformations that enable H-bond formation with the histidine side chain.
As described above, theoretical predictions are also consistent with more
favorable separation of EP enantiomers over those of MAMP based on the energy
differences for enantiomer interaction with Cu(GHG), which are higher for the
former.

Chapter 4. Results and discussion
259
Control study
We also performed a control experiment by using a ground mixture of GHG
and Cu(II) acetate in the same proportion present in the MOF. Individual
components do not show measurable chiral recognition (Figure 134), suggesting
that the periodic distribution of chiral channels in the MOF scaffold is key for
enantiomeric separation.
Figure 134. Control experiment to confirm the observed chiral recognition is specific to the
MOF architecture rather than to any of its components. Below chromatograms for a
physical mixture of GHG and Cu(II) acetate in the same proportion present in the MOF.
Evolution of the peak areas for (+) and (-)-MAMP in a solution of the MOF components
rules out measureable enantioselective recognition of any of the enantiomers. Inset in the
right column highlights the signal specific to each enantiomer.
To confirm the stability of the solid in the experimental conditions, we
collected UV/vis spectra of dispersions of Cu(GHG) at variable times. As shown in
Figure 135, spectra remained constant and there is no signature of Cu(II) leaching
that might account for partial dissolution. As for the MOF structure, PXRD of the
solid after the experiment confirms the structure remains intact with only minor
variations in the relative intensities of some Bragg’s reflections ascribed to
preferential orientation of the crystals or changes in the nature of the species
occupying the pores.
Pea
kar
ea(A
U)
Time (min)
(+)-MAMP(-)-MAMP

Chapter 4. Results and discussion
260
Figure 135. Time evolution of the UV-Vis spectra at room temperature of a dispersion of
as-made 50 mg of Cu(GHG) in 500 µL of EtOH:H2O (25:75 v%) from 0 to 240 min. This set of
conditions are equivalent to those used for studying the ability of Cu(GHG) to recognize
selectively enantiomers from solution. The system remains constant and no signature of
Cu(II) leaching –broad absorption band centered at 600 nm– can be observed, confirming
the chemical integrity of the solid in these conditions.
Enantioselective separation with Cu(GHG)/SPE
Recent reports highlight the potential of chiral MOFs for the development of
chiral stationary phases in the form of packed columns for HPLC enantioselective
separation. However, the limited number of tests available suggests that the main
limitations of MOFs as stationary phases are their poor stability and particle
heterogeneity. This limits the range of mobile phases available, in particular for
polar analytes, and makes it difficult to achieve efficient packing of the particles in
the column, which relies on narrow distributions in size and shape for
reproducible sorption/desorption kinetics. Lack of control over these variables can
result in high retention times, low chromatographic performance, and energy-
consuming separations. MOFs might be instead better fitted for SPE separation
technologies. SPE enables isolation of the enantiomers rather than only providing
a measure of the enantiomeric purity of a mixture. SPE can allow for more
efficient chromatographic analysis by removal of interferences, increase of trace
concentration, or sample simplification, but use of chiral MOFs in this context
remains unexplored.

Chapter 4. Results and discussion
261
To illustrate this concept, 50 mg of Cu(GHG) were packed in a polypropylene
SPE cartridge and a racemic mixture of (±)-EP in hexane:ethanol 75:25 at 0.25 mL
min-1 was eluded, followed by HPLC analysis of the resulting extract (Figure 136A).
For the experimental setup see Methodology Chapter (Section 3.3.1.1). We opted
for EP rather than MAMP based on our preliminary results that suggested faster
and more efficient recognition of the former. As shown in Figure 136B,
comparison of the chromatograms of the sample before and after SPE/Cu(GHG)
separation confirms the ability of the MOF to trap preferentially (+)-EP, in line
with our theoretical predictions. While the peak area contribution for (−)-EP
remains constant, there is a significant decrease for the (+)-form.
Figure 136. (A) SPE separation of EP in hexane:EtOH 75:25 by using Cu(GHG) as chiral bed.
(B) HPLC chromatograms of EP racemate before (dashed line) and after (solid line) passing
through the MOF bed.
Quantitatively, the chiral solid permits separating 54 ± 2 % of (+)-EP from
equimolar mixtures of the enantiomers in 4 min with a satisfactory precision
(RSD = 4 %) for the different cartridges tested (Table 50).
MOF bed
HPLC analysis
(+)EP
(-)EPA B

Chapter 4. Results and discussion
262
Table 50. Cartridge to cartridge precision.
Conditions Peak area (+)-EP
Test 1 Test 2 Test 3
no MOF 68103 66451 69391 with MOF 30420 31873 30611 Enantioselective recognition (%) 55.3 52.0 55.9 Average (%) 54
2 4
Standard Deviation (s) RSD (%)
HPLC analysis of the solution desorbed from the MOF by elution with fresh
solvent confirms that only (+)-EP enantiomers are retained in the separation,
confirming enantioselectivity (Figure 137). Compared to SPE, direct soaking of the
crystals in a racemic mixture of (±)-EP in hexane:EtOH 75:25 also leads to
enantioselective separation of 44 % of (+)-EP in the same time (Figure 138). MOF
cartridges can be used at least for two runs without significant loss of
enantioselectivity.
Figure 137. Comparison of HPLC chromatograms of a racemic mixture of (±)-EP in
Hexane:EtOH 75:25 after passing through the MOF SPE cartridge (black line, adsorption)
and after elution with fresh solvent (desorption). The presence of (-)-EP in the desorbed
fraction is negligible whilst only (+)-EP can be detected in the chromatogram in good
agreement with the reported enantioselectivity.
Ab
sorb
ance
(AU
)
Time (min)
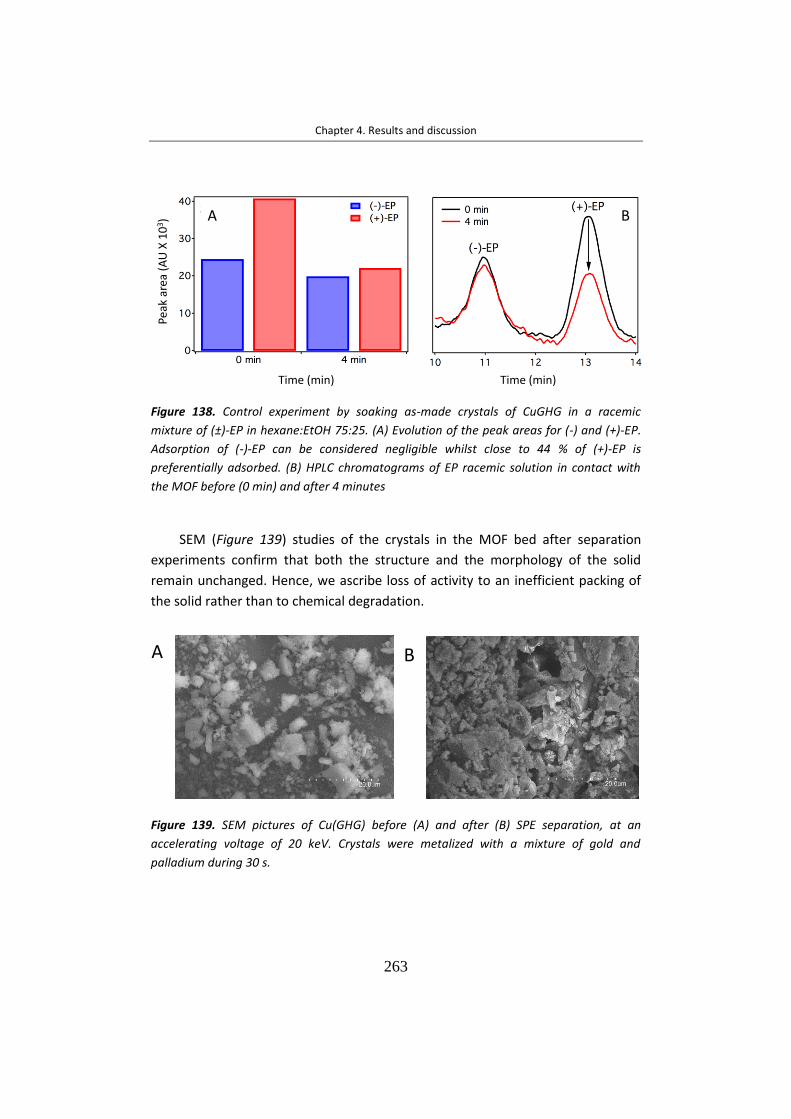
Chapter 4. Results and discussion
263
Figure 138. Control experiment by soaking as-made crystals of CuGHG in a racemic
mixture of (±)-EP in hexane:EtOH 75:25. (A) Evolution of the peak areas for (-) and (+)-EP.
Adsorption of (-)-EP can be considered negligible whilst close to 44 % of (+)-EP is
preferentially adsorbed. (B) HPLC chromatograms of EP racemic solution in contact with
the MOF before (0 min) and after 4 minutes
SEM (Figure 139) studies of the crystals in the MOF bed after separation
experiments confirm that both the structure and the morphology of the solid
remain unchanged. Hence, we ascribe loss of activity to an inefficient packing of
the solid rather than to chemical degradation.
Figure 139. SEM pictures of Cu(GHG) before (A) and after (B) SPE separation, at an
accelerating voltage of 20 keV. Crystals were metalized with a mixture of gold and
palladium during 30 s.
A B
Peak
area
(AU
X 1
03)
Time (min) Time (min)
A B

Chapter 4. Results and discussion
264
Conclusions
Results suggest that Cu(GHG) offers high performance in terms of
stereoselective recognition and time efficiency, for a high-speed chiral separation
medium. Peptide MOFs are particularly well suited for enantioselective
recognition. The chiral pockets in their structure can be manipulated for
maximizing host−guest intermolecular interactions for a specific enantiomer
simply by suitable choice of the peptide sequence. Cu(GHG) is capable of
separating >50 % of (+)-EP from a racemic mixture in only 4 min when used as a
chiral SPE cartridge. This is a promising result, considering the limited availability
of SPE cartridges for chiral separation on the market. According to our theoretical
simulations, stereoselectivity is driven by preferential non-covalent interactions
with specific amino acids, particularly His, in the MOF backbone. This combination
of theory and experiment holds great potential and might help in addressing the
challenge of chiral recognition by producing more complex chemical
environments in which supramolecular interactions can be finely tuned for
maximizing enantiomeric resolution for particular drugs.

Chapter 4. Results and discussion
265
4.3.2 AgNPs and AuNPs
Metallic NPs as AuNPs and AgNPs have exceptional properties that make
them suitable for different analytical applications. As explained in Introduction
Chapter, metallic NP colloids exhibit different and strong colour in the visible
region attributed to the SPR. The presence of some analytes induces UV plasmon
band/visual changes. This strategy has been applied to colorimetric sensors
development. Here, the AgNPs and AuNPs have been evaluated as candidates to
develop a sulphur sensor based on plasmonic/visual changes due to thiol affinity.
The interest in AgNPs is very high due to still outstanding plasmon activity
compared with AuNPs. In addition, AgNPs has a molar extinction coefficient which
is 100x greater, increasing sensitivity when using absorption spectroscopy. Thus, a
rapid and portable sensor based on AgNPs immobilized on nylon has been
designed for the in-situ detection of VSCs (-S-2, -S-) which are the main causes of
halitosis. The interaction between the thiol groups and AgNPs causes a color
change from yellow to brown according to the concentration of sulphure
compound. Quantification has been carried out by DR and DI analysis. Studies
about sensor dependence of AgNPs size, batch-to-batch precision, AgNPs
immobilization and their stability have supported this study. Indeed, the sensors
have been tested in 10 heathy volunteers. From our point of view, the developed
sensor is a potential commercial point-of-care to evaluate sulphure content for
oral malodour due to its high sensitivity and low-cost.
4.3.2.1 Colorimetric sensor based on AgNPs for detecting volatile sulfur
compounds
AgNPs vs AuNPs for sulphure detection
Firstly, AgNPs and AuNPs solutions were tested as candidates to detect
sulphur compounds. As Figure 140 shows, AuNPs remain red with an absorbance
peak wavelength at 520 nm after sulphur addition while AgNPs dispersion change
from yellow to orange/brown and the absorbance peak wavelength blue shift
after the addition of Na2S and CH3SNa (Figure 140).

Chapter 4. Results and discussion
266
Figure 140. Absorption spectra of A, B) AuNP 20 nm in solution and C, D) AgNP 20 nm in
solution registed 20 s by UV spectrophotometer after addition of A, C) Na2S and B, D)
CH3SH in a range between 250 - 10000 µg L-1
.
The sensing mechanism of AgNPs vs AuNPs in presence of sulphur
compounds is represented in Figure 141. The AgNP and AuNPs remain
monodisperse due the presence of negative charge citrate absorbed on their
surface to stabilized them by electrostatic repulsions. The citrate can be replaced
or release by ligands with strong affinity, and then interact with the NPs surface.
That is the situation which take place in presence of sulphur compounds (-S-2 and -
SH). Silver is readily sulphurized to form Ag2S. Sulphidation of AgNPs has been
reported in several studies (Elechiguerra, J.L. et al., 2005) that form Ag2S-AgNP
structure after Na2S exposure, however the sulphidation mechanism and the
structure and morphology of AgNPs still under study. The Ag2S formation produce
the destabilization of the monodisperse AgNP dispersion and their aggregation
which explain the plasmon changes observed. In case of AuNPs, the -S-2 and -S-
acts as a ligand to bound the AuNPs for preserving them. Therefore, the
absorbance peak of AuNPs at 520 nm still unchanged after Na2S addition. Based
0
0,2
0,4
0,6
0,8
1
350 450 550 650 750
Absorb
ance
Wavelength / nm
0
0,2
0,4
0,6
0,8
1
350 450 550 650 750
Absorb
ance
Wavelength / nm
0
0,2
0,4
0,6
0,8
1
350 450 550 650 750
Absorb
ance
Wavelength / nm
0
0,2
0,4
0,6
0,8
1
350 450 550 650 750
Absro
bance
Wavelength / nm
(c)
(a)
(d)
(b)
S2-
S2-
CH3S-
CH3S-
Ab
sorb
ance
(AU
)
Ab
sorb
ance
(AU
)
Ab
sorb
ance
(AU
)
Wavelength (nm)
Ab
sorb
ance
(AU
)
Wavelength (nm)
Wavelength (nm) Wavelength (nm)
A B
C D

Chapter 4. Results and discussion
267
on the results, AgNPs were selected over AuNPs.
Figure 141. Schematic drawing of the A) AgNP aggregation and B) AuNPs
functionalization by sulphur compounds.
Sensor optimization
Sensor is based on the immobilization of monodisperse sodium citrate-
coated AgNPs (0.02 mg mL-1, 10, 20 and 40 nm) on a support. Several
immobilization supports were tested including cellulose, glass fiber and nylon.
Figure 142A-C shows microscopic images of the different membranes before and
after immobilization of AgNPs. Nylon immobilized higher amount of AgNPs
because of the yellow intensity observed (Figure 142D), whereas silver aggregates
were observed on the glass fiber.
-S-S
-S
-S
-S-S
-S
-S
-S
-S-2 , -S-
-S-2 , -S-
= AgNP
= AuNP
= partial negative charge of citratre
= Ag2S
= thiol funtionalization-S
A
B

Chapter 4. Results and discussion
268
The response of several sensors was tested using H2S at 250 and 1000 µL m-3
by DR and visual inspection (Figure 142D-F). Only nylon sensor showed a response
as function of the concentration (Figure 142D). Thus, nylon was selected as
support for developing the AgNPs-based sensor.
Figure 142. Microscopic images of different kinds of support for AgNP immobilization A)
nylon, B) cellulose, C) glass fiber. The scale bar is 100 µm and inset c is 20 µm. Absorbance
by DR of the AgNPs immobilized on D) nylon, E) cellulose, F) glass fiber and their response
in presence of volatile H2S (250 and 1000 µL m-3
). Inset AgNPs immobilized on the
membrane and the reponse at 1000 µL m-3
.
Nylon membrane was analysed by Raman spectroscopy, showing a
characteristic band at 1620 cm of amide (C=O). The increase of the band indicates
the bonding of AgNPs to nylon (Figure 143a-b). The shifted to higher wavenumber
(from 1618 to 1622 cm-1) and band decrease in presence of VSCs at high levels
(Figure 143e-f) compared to the AgNPs nylon (Figure 143b) can be attributed to
H2S interaction on AgNPs surface producing the AgNPs aggregation. The LOD by
Raman for S-2 was found at 1000 µL m-3 in air.

Chapter 4. Results and discussion
269
Figure 143. Raman spectra of a) nylon, b) AgNP-nylon and device responde to sulphur
compounds in c) 250, d) 500, e) 1000, f) 10000 µL m-3
levels.
Once the nylon membrane was selected as optimum support and
characterized, several porous sizes were studied. Similar AgNPs retention and
sensitivity were obtained by using membranes of 0.22 and 0.47 µm, but
preferably 0.47 µm. On the other hand, several citrate-AgNPs sizes were tested:
10, 20 and 40 nm. The size of NPs plays an important role in the aggregation with
the analyte. Thus, the response of the three sizes of AgNP solution was studied as
function of the Na2S concentration (Figure 144). Color change from yellow to
brownish was observed for the three sizes of AgNPs. Similar sensitivity was
observed for 10 and 20 nm (LOD=45 µg L-1), whereas 200 µg L-1 of LOD was
observed for 40 nm of AgNPs. As can be seen in Figure 144, a linear range
between 250-10000 µg L-1 was obtained by using AgNPs of 20 nm, whereas no
satisfactory linear range was obtained by using AgNPs of 10 nm. Therefore,
citrate-AgNPs of 20 nm were selected for fabricating nylon-based sensors.

Chapter 4. Results and discussion
270
Figure 144. Absorption spectra of AgNPs of 20 nm (A), 40 nm (B) and 10 nm (C) in solution
after addition of Na2S concentrations. Inset: plot of corresponding absorbance ratios vs log
[S2-
].
For immobilizing the AgNPs on the membrane, several techniques were
tested including deposition, immersion and filtering. The sensors prepared by
filtering required shorter time of operation and showed higher yellow color
intensity indicating higher retention of NPs. Thus, sensors were fabricated by
0
0,2
0,4
0,6
0,8
1
350 450 550 650 750
Ab
so
rba
nce
Wavelength / nm
0
0,2
0,4
0,6
0,8
2 3 4
A495/ A
415
Log C
(c)
0
0,2
0,4
0,6
0,8
1
350 450 550 650 750
Ab
so
rba
nce
Wavelength / nm
0
0,5
1
2 3 4
A475/A
395
Log C
(e)
0
0,2
0,4
0,6
0,8
1
350 450 550 650 750
Ab
so
rba
nce
Wavelength / nm
(a)
0
0,2
0,4
0,6
0,8
2 3 4 5
A485/A
400
Log C
AgNP 20nm
AgNP 40nm
AgNP 10nm
A)
B)
C)
Wavelength (nm)
Wavelength (nm)
Wavelength (nm)
Ab
sorb
ance
Ab
sorb
ance
Ab
sorb
ance

Chapter 4. Results and discussion
271
filtering AgNPs of 20 nm through nylon membrane (See Methodology Chapter for
more details).
Colorimetric responses of AgNPs-based sensor
The optimized sensors were tested for quantitative determination of H2S,
CH3SH and ((CH3)2S). The plasmon band at 415 nm decreased and a new band at
550 nm increased due to the aggregation as function of the concentration. The
sensor color changed in presence of H2S and CH3SH but no in presence of (CH3)2S.
Figure 145 shows the A550/A415 ratio vs logarithm of H2S concentration in the range
from 150 to 2500 µL m-3. The color of the sensor gradually changed from yellow to
ocher, and finally to brown when increasing H2S concentration. Visual inspection
of the colored sensors allows a semiquantitative estimation of H2S concentration
(See photograph inset the Figure 145). For quantification, absorbance
measurements by DR and color intensity measurements by DI were registered.
The reaction time was also studied up to 60 min. The time of 10 min were
selected as a compromise between the signal and analysis time.
Figure 145. Photography of sensors and calibration curve by plotting A550/A415 ratio vs
logarithm of H2S concentrations of 0 (a), 150 (b), 250 (c), 500 (d), 1000 (e), 1500 (f) and
2500 (g) µL m-3
.
a b c d e f

Chapter 4. Results and discussion
272
Glycerol effect
After sampling, colored sensors were coated by glycerol (50 µL scattered with
a spatula) in order to improve the color intensity and so the sensitivity. The
absorbance measured was 2x greater and the color reminded for weeks. The
coating by glycerol should be done after sampling maybe due to glycerol
preserves AgNPs over aggregation in presence of VSCs.
Analytical permormance
Table 51 shows the calibration equations for sulphur quantification. A linear
behavior of analytical signal (A550/A415) versus H2S concentration was obtained at
concentrations up to 2500 µL m-3. In addition, a linear behavior with lineal
correlation of R2=0.991 by using the other analytical signal from DI was also
obtained with a calibration equation of y= (253 ± 3) + (-0.056 ± 0.018) x, where y is
the red color intensity from RGB mode and x is the H2S concentration. Satisfactory
precision was evaluated for 20 sensors prepared in the same synthesis. No
significative differences were obserbed from different synthesis. Table 51 also
shows the LOD and LOQ calculated as 3 sblank/b and 10 sblank/b, respectively, where
b is the slope of linear calibration curve and sblank is the standard deviation of the
absorbance of ten blanks.
Table 51. Analytical parameters obtained for H2S determination by AgNPs-nylon based
sensor proposed.
Linear range (µL m
-3)
Linearity y=a+bx (m3 µL
-1) RSD (%)
n=20 LOD (µL m
-3)
LOQ (µL m
-3) a ± sa b ± sb R
2
250-2500 -0.58 ± 0.05 0.31 ± 0.02 0.990 10 45 150
Similar slopes were obtained by using AgNPs-based sensor with glycerol and
AgNPs in solution. In spite of the difficulties of NPs synthesis, 3 different bathes of
commercial AgNPs were tested and satisfactory precision was obtained. The
selectivity was tested against volatile organic compounds interferents in human
breath related to different diseases such as ethanol, acetone and ammonia. The
sensors did not show colorimetric response for the interferents assayed.
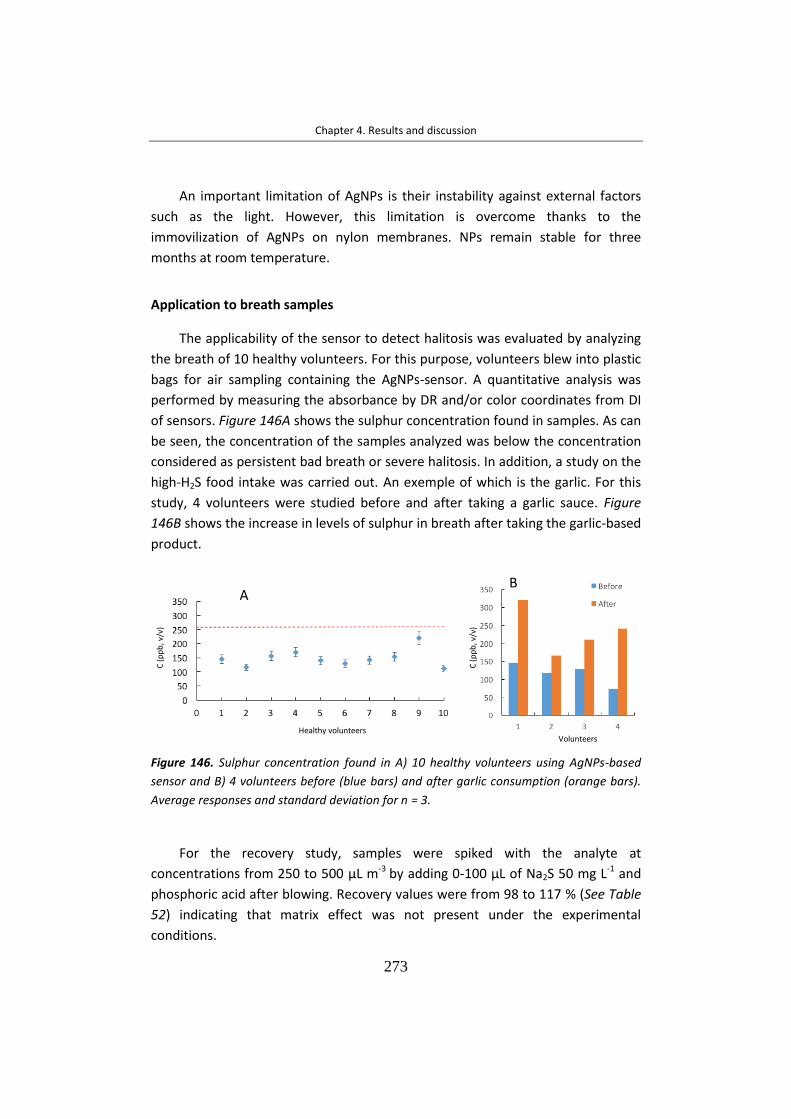
Chapter 4. Results and discussion
273
An important limitation of AgNPs is their instability against external factors
such as the light. However, this limitation is overcome thanks to the
immovilization of AgNPs on nylon membranes. NPs remain stable for three
months at room temperature.
Application to breath samples
The applicability of the sensor to detect halitosis was evaluated by analyzing
the breath of 10 healthy volunteers. For this purpose, volunteers blew into plastic
bags for air sampling containing the AgNPs-sensor. A quantitative analysis was
performed by measuring the absorbance by DR and/or color coordinates from DI
of sensors. Figure 146A shows the sulphur concentration found in samples. As can
be seen, the concentration of the samples analyzed was below the concentration
considered as persistent bad breath or severe halitosis. In addition, a study on the
high-H2S food intake was carried out. An exemple of which is the garlic. For this
study, 4 volunteers were studied before and after taking a garlic sauce. Figure
146B shows the increase in levels of sulphur in breath after taking the garlic-based
product.
Figure 146. Sulphur concentration found in A) 10 healthy volunteers using AgNPs-based
sensor and B) 4 volunteers before (blue bars) and after garlic consumption (orange bars).
Average responses and standard deviation for n = 3.
For the recovery study, samples were spiked with the analyte at
concentrations from 250 to 500 µL m-3 by adding 0-100 µL of Na2S 50 mg L-1 and
phosphoric acid after blowing. Recovery values were from 98 to 117 % (See Table
52) indicating that matrix effect was not present under the experimental
conditions.
AB
Volunteers
C (
pp
b, v
/v)
C (
pp
b, v
/v)
Healthy volunteers

Chapter 4. Results and discussion
274
Table 52. Recoveries of 2 spiked samples of healthy volunteers obtained by using DR and
DI.
Conclusions
A colorimetric sensor for the in-situ determination of VSCs (R-S- y S-2) has
been proposed. The developed sensor is based on the citrate capped-AgNPs
immobilization on nylon membrane. This is a passive sensor which means that it is
zero energy cost. The main advantages of the AgNPs-sensor are the easy and low
cost fabrication by using non toxic reagents, as well as its easy of use and no
trained personnel requirement. Moreover, the sensor is stable for three months
at room temperature. The sensor provides satisfactory LOD of 45 µL m-3 by
measuring the absorbance by DR in a short time (10 min). Furthermore, the
method provided suitable linearity and precision. Therefore, the AgNPs-sensor
can be considered as a viable clinical kit for on-site VSCs detection in human
breath.
Spiked samples (µL m-3)
Volunteer 1 Volunteer 2
DR DI DR DI
Detection (µL m
-3)
Recovery (%)
Detection (µL m
-3)
Recovery (%)
Detection (µL m
-3)
Recovery (%)
Detection (µL m
-3)
Recovery (%)
0 145 - 151 - 116 - 115 -
250 392 99 367 91 429 117 349 96
300 506 113 475 105 464 111 421 101
500 666 103 601 92 672 109 637 103

275
CHAPTER 5. GENERAL CONCLUSIONS

276
Chapter 5. General Conclusions
277
The present Thesis is focused on the study of new (nano)materials for the
development and improvement of sustainable analytical methodologies for
estimating several compounds in fields as diverse as environment, industry,
forensic and medicine. The proposed methodologies have been based on the
miniaturization and automatization following the new trends in Analytical
Chemistry. Thus, the analytical methodologies developed in this Thesis have been
aimed at two research lines:
(i) Miniaturized sample pretreatment techniques and chromatography
(ii) In-situ analytical sensors
Miniaturized sample pretreatment techniques and chromatography
One of the most important point in the sample pretreatment technique is the
use of suitable extractive material. In this Thesis, C18 material has been evaluated
in MSPD for the disruption and clean-up, followed by the derivatization onto the
dispersant blend of amphetamines in hair matrix. This method have allowed the
rapid and simple estimation of AMP, MAMP, EP and MDMA in hair, with LODs of
0.25–0.75 ng mg-1. MSPD is considered a cost-effective alternative to classical
multi-step methods for sample pretreatment due to the analytical process is
simplified and thus, the sample and solvent consumption is reduced. On the other
hand, peptide-based MOF has been proposed as chiral phase in SPE for the
enantioselective separation of (±)-MAMP and (±)-EP. Cu(GHG) MOF has been
capable of separating ˃50 % of (+)-EP from a racemic mixture in only 4 min when
it is used in a chiral SPE cartridge. This is a promising result, considering the
limited availability of SPE cartridges for chiral separation on the market. SPE
allows the isolation of the analytes prior the determination technique although it
is not a miniaturized technique. According to the principles of Green Analytical
Chemistry, a miniaturized and automated technique such as in valve IT-SPME has
been used in this Thesis, where PDMS has been played an important role as
extractive phase.
In-valve IT-SPME modality coupled to CapLC allows to carry out the
preconcentration, clean-up and analysis of the sample in a one-step, which means
an automatization of the analytical process. Thus, IT-SPME is governed by the
minimization of solvents consumption and waste generation, energy-efficiency, as
well as the reduction of sample handling and analysis time. In this sense, in-valve

Chapter 5. General Conclusions
278
IT-SPME-CapLC avoids the contamination of the sample and the loss of the
analyte. In addition, improvements in the reliability of the analytical performance
parameters, such as sensitivity, precision and accuracy can be achieved. The
configuration proposed, in flow-through IT-SPME, is based on a polymeric-coated
capillary column as injection loop of the valve where the analytes are adsorbed in
order to be preconcentrated; and then desorbed and transferred to the
chromatographic system by the mobile phase.
In this Thesis, in-valve IT-SPME-CapLC combined with DAD or FLD has been
proposed to estimate DEHP in sediments and water, BAK in industrial biocide
formulation, DPA deposited on shooter hands and amphetamine-like drugs in oral
fluid.
The estimation of DEHP in sediments and water by combining MSPD using C18
as sorbent phase and IT-SPME-CapLC-DAD using PDMS95–based capillary column
has been successfully carried out in less than 20 min. Satisfactory LODs of 270 and
90 µg kg-1 (for 0.1 and 0.3 g of sediment, respectively) were obtained to control
environmental quality. Moreover, the reduction of sample and solvent
consumption, as well as the extraction steps, can avoid the risk of DEHP
contamination.
The versatility of IT-SPME-CapLC-DAD with PDMS65–based extractive phase
for BAK homologues analysis in mixtures of biocides has been demonstrated. The
proposed method has shown that the evaluation of matrix effect is required for
analyzing BAK in mixtures of biocides. Different effects have been observed
depending on the co-biocide type present (ADP and TMTDAC), ratio co-
biocide/BAK homologue and total surfactant amount, these maybe due to the
formation of mixed micelles. In all cases, C12-homologue response was more
affected than C14-homologue response. Thus, the method proposed is a cost-
effective way to control industrial processes where BAK is considered as
unwanted compound in a formulation.
The estimation of DPA for forensic investigations has been successfully
carried out by selecting the optimum PDMS-based extractive phase for the
capillary column. Satisfactory LOD of 3 ng of DPA has been achieved by using
PDMS65. The utility of the proposed method has been well tested by estimating
the DPA collected by cotton swab from shooter hands and extracted by vortex-
assisted conditions.
Chapter 5. General Conclusions
279
PDMS-based capillary columns have been functionalized with CNTs (MWCNTs
and SWCNTs) in order to enhance the extraction capability. Nanostructured
coatings offer high surface-to-volume ratio, thus increasing the extraction
efficiency to extend the applicability of in-valve IT-SPME to those analytical
problems in which the volume of sample is limited such as oral fluid. The presence
of MWCNTs in the extractive coatings has enhanced the extraction efficiency and
also has improved the chromatographic profiles, thus resulting in a reliable option
for the analysis of amphetamines in saliva. Samples have been easily collected by
a cotton swab and have directly been derivatized and processed by in-valve IT-
SPME-CapLC-FLD. The proposed method is very simple and cost-effective, and
provided suitable selectivity, precision and sensitivity at µg mL-1 concentration
levels (LODs of 0.5–0.8 µg mL-1).
Satisfactory analytical parameters and application to samples have been
obtained by IT-SPME-CapLC in the works described in this Thesis. These results
have demonstrated the suitability of the IT-SPME-CapLC method to detect several
analytes in different kinds of matrices in line with the Green Analytical Chemistry
principles.
In-situ analytical sensors
The second approach of this Thesis has been the development of colorimetric
sensors that allow the on-site analysis via visual inspection, spectroscopic
techniques and/or DI processing. Following the current trends in technology,
image analysis by smartphones is an emerging alternative to spectroscopic
techniques for quantification purposes. The use of mobile phones with color
image processing software allows an easy, rapid and cost-effective analysis
without the requirement of highly trained personnel and expensive
instrumentation.
In this Thesis, the developed sensors has been based on the derivatizing
reagents (NQS and Co(SCN)2) embedding into PDMS-based support and on the
other hand, the immobilization of AgNPs on nylon support. In both cases, analytes
interact with the derivatizing reagents or the NPs in the solid sensor changing the
color of the sensor. Absorbance by DR or color intensity by DI have been
measured for quantitative purposes. Semiquantitative analysis can be performed

Chapter 5. General Conclusions
280
by visual inspection. In addition, electromechanical sensors such as screen-
printing piezoelectric cantilevers have been also tested as sensors.
In this Thesis, in-situ sensors have been developed for estimating casein in
wastewaters generated by the dairy industry, ADP in industrial products,
amphetamine-like drugs and ketamine in illicit street pills/powders, as well as,
VSCs from the breath.
A sensor based on PDMS/TEOS/SiO2NPs/NQS to determine casein with good
sensitivity and precision (LOD = 15 mg L-1; RSD ≤ 12 %) has been also proposed.
This sensor overcomes one of the main limitations of the conventionally used BCA
assay, the degradation of the reagents. Taking into account the advantages of
rapidity, simplicity and stability, the polymeric sensor is expected to have practical
applications for in-situ determination of casein in effluents from dairy industries.
The sensor based on PDMS/TEOS/SiO2NPs/NQS for estimating the biocide
ADP in industrial formulations has achieved satisfactory LOD of 0.018 % (w/w) and
precision (RSD ≤ 12 %). This sensor allows a green, robust, portable, cost-effective
and rapid approach for controlling ADP, suggesting good prospects for its
implementation in several industries.
A colorimetric kit based on PDMS/TEOS/SiO2NPs/NQS sensor for the in-situ
identification and determination of several kinds of amphetamine-type drugs
(MDA, AMP, MAMP, MDMA) in illicit samples has been developed. Satisfactory
LODs (0.002-0.005 g mL-1) and RSD < 10 % have been achieved. In the same way of
illicit drug samples, another kit based on PDMS/Co(SCN)2 for estimating ketamine
with a LOD of 30 µg and good precision (RSD ˂ 10%) has been developed. Both
kits are very useful tools for the instant screening of the most frequently used
illicit drugs in roadside drug testing owing to its simplicity, rapidity, stability and
portability, at a very low-cost. Uncertaintly and delay times could be minimized
through the development of this workplace test.
In respect of AgNPs-nylon based sensor, VSCs (-S-2, -S-) have been satisfactory
estimated with LODs of 45 µL m-3. This passive sensor does not require an external
energy source and so, this energy cost is zero. The advantages such as stability,
simplicity, rapidity (10 min) and low-cost make them a potencial point-of-care
testing for oral malodour as well as in atmospheres or enclosed areas.

Chapter 5. General Conclusions
281
Finally, screen-printing piezoelectric microcantilevers have been tested as gas
sensors. New fabrication procedure, design and sintering aid composition have
been studied. Satisfactory electromechanical properties have been achieved with
0.75% Li2O3, 1.2% Bi2O3 and 1.05% CuO composition. The use of a polymeric
commercial material for the sacrificial layer have been simplified the fabrication
procedure due to it is removed during the firing step. Succesfull functionalization
by MCF dispersion has been carried out (8 Hz µg-1 mass sensitivity). The low
sensitivity (0.1 Hz ppm-1) to humidity suggests a potential applicability as sensor
to estimate VOCs for environmental purposes.
Therefore, the in-situ sensors proposed in this Thesis can be considered a
suitable alternative to conventional instrumental methods. The immobilization of
the reagents in PDMS and nylon has avoided the need to prepare solutions to
carry out the reaction, as well as, expensive equipment has not required.
In conclusion, the (nano)materials studied in this Thesis has been covered
two of the new trends in Analytical Chemistry:
- The development of analytical strategies that reduce the steps of the sample pretreatment and minimize the environmental impact.
- The development of rapid, simple and cost-effective sensors for on-site analysis.
The importance of (nano)materials to develop analytical methodologies have
been demonstrated in this Thesis:
1. PDMS is an excellent extractive material as well as an optimal encapsulant of
derivatizing reagents thanks to its coefficient partition, permeation and
optical transparency.
2. C18 is a widely used sorbent material in MSPD due to its hydrophobicity and
easy packing.
3. MCF silica is a material with a potential applicability as sensing layer for
resonant microcantilevers owing to its high surface area.

Chapter 5. General Conclusions
282
4. CNTs functionalized on commercial capillary columns improve the extraction
efficiencies and chromatographic profiles for analytes that interact through
π-π stacking interaction.
5. The peptide MOF Cu(GHG) is a well-suited material for enantioselective
recognition due to the preferential binding of one of the enantiomers due to
stronger or additional H-bonds with the framework.
6. AgNPs can be used for colorimetric nylon-based sensor to sensitive
detections.
Table 53 summarizes the applications and results obtained in this Thesis for the materials used.

Chapter 5. General Conclusions
283
Tab
le 5
3. S
um
ma
ry o
f th
e a
pp
lica
tio
n a
nd
res
ult
s o
bta
ined
in t
his
Th
esis
fo
r th
e m
ate
ria
ls u
sed
.
Mat
eri
al
PD
MS
as e
xtra
ctiv
e p
has
e P
DM
S as
se
nso
r su
pp
ort
C
18
MC
F m
eso
po
rou
s si
lica
CN
Ts
MO
F A
gNP
s
Form
at
Cap
illar
y co
lum
n
coat
ing
Film
SP
E ca
rtri
dge
D
epo
site
d
laye
r o
n
elec
tro
de
Cap
illar
y co
lum
n c
oat
ing
SPE
cart
rid
ge
Imm
ob
ilize
d
on
nyl
on
Sam
ple
p
rep
arat
ion
IT
-SP
ME
- M
SPD
-
IT-S
PM
E SP
E -
Sep
arat
ion
te
chn
iqu
e C
ap-L
C
- H
PLC
-
Cap
-LC
H
PLC
-
De
tect
ion
te
chn
iqu
e D
AD
A
bso
rban
ce (
DR
m
od
e) a
nd
co
lor
inte
nsi
ty
FL
Imp
edan
ce
FL
FL
Ab
sorb
ance
(D
R
mo
de)
an
d
colo
r in
ten
sity
Mat
rix
Sed
imen
ts/w
ater
a
Ind
ust
rial
pro
du
ctb
Han
dsc
Effl
uen
tsd
Ind
ust
rial
p
rod
uct
e
Illic
it d
rug
sam
ple
f, g
Hai
r A
ir
Ora
l flu
id
- H
um
an
bre
ath
An
alyt
e D
EHP
a
BA
Kb
DP
Ac
Cas
ein
d
AD
Pe
Am
ph
etam
ine-
like
dru
gsf
Ket
amin
eg
AM
P,
MA
MP
, EP
, MD
MA
H
um
idit
y A
MP
, M
AM
P,
EP
(±)-
EP
and
(±
)-M
AM
P
VSC
s
Tim
e 9
min
a
12
min
b
˂11
min
c
10
min
2
0 m
in
15
min
1
0 m
in
4 m
in
10
min
LOD
8
µg
L-1 a
0.0
3-0
.00
6 µ
g m
L-1 b
0
.15
ng
mL-1
c
15
mg
L-1 d
0
.01
8 %
e
0.0
02-
0.0
05 g
mL-1
f
30
µg
g
0.2
5–0
.75
ng
mg-1
-
0.5
–0.8
µg
mL-1
-
45
pp
b (
v/v)
Co
st
+++
+
+++
++
++
+
+++
+
Toxi
city
n
o
no
ye
s n
o
no
n
o
no
Po
rtab
ility
n
o
yes
no
ye
s n
o
no
ye
s
aM
uñ
oz-
Ort
uñ
o,
M.
et a
l., 2
01
4;
bP
riet
o-B
lan
co,
M.C
. et
al.,
20
16
; c A
rgen
te-G
arc
ía.
A.
et a
l.20
18
(dra
ft p
ap
er),
dM
uñ
oz-
Ort
uñ
o,
M.
et a
l., 2
01
5;
e Arg
ente
-Ga
rcía
, A. e
t a
l., 2
01
6a
f Arg
ente
-Ga
rcía
, A. e
t a
l., 2
01
6b
gA
rgen
te-G
arc
ía, A
. et
al.,
20
17

Chapter 5. General Conclusions
284
Future perspectives
IT-SPME-CapLC is an interesting approach thanks to the preconcentration,
clean-up and analysis can be carried out in one step. Thus, waste generation,
solvents consumption and costs are minimized. However, the extraction
efficiencies are not enough quantitative. Thus, the research of MINTOTA group is
directed towards the coating of capillary columns with nanomaterials, thanks to
the project CTQ2014‐53916P. Due to the extension of the use of nanomaterials,
their study by LC is an emerging research field. In this context, MINTOTA group
has studied AuNPs and AgNPs by Cap-LC (González-Fuenzalida, R.A. et al., 2016a).
Following this work, the characterization of AuNPs with different end-capping is
carried out by NanoLC, work in process.
On the other hand, the development of devices that allows an in-situ and
green analysis without the need of trainned personnel and expensive equipment
are one of the goals of the nowadays chemistry. The development of analytical
tools based on color modes is causing a revolution due to the costs are
significantly minimized when a quantitative analysis is required. Thus, this
technology could be implemented in resource-poor settings. Moreover,
biodegradable materials from natural products (e.g. proteins, polysaccharides,
etc.) are studied as supports for sensors developing thanks to PROMETEO
2016/109 project. From the results obtained, a project “Valoritza i Transfereix
2016-2017” of the University of Valencia entitled “Proyecto piloto basado en el
empleo de kits para la evaluación de la contaminación en entornos ambientales de
diferente naturaleza” has been developed. Several companies have collaborated
to validate the in-situ sensors. Taking into account the interdisciplinary and
knowledge transfer requirement, the research carried out in this Thesis has been
applied to solve industrial, environmental, forensic and clinical problems. Some
works of this Thesis has been carried out in collaboration with other research
groups from different fields such as inorganic chemistry (FuniMmat Group,
Instituto de Ciencia Molecular, Universidad de Valencia) and medicine (Project
VLC-BIOMED 2016, B Programme, “Desarrollo de un prototipo sensible para la
detección de gas sulfhídrico que permita la identificación de nuevos fármacos
cardioprotectores”).
The study of more sustainable (nano)materials to improve or develop new
analytical applications has been the key point of the present Thesis as well as one
of the main goals of many future research.

285
REFERENCES

286

References
287
Adarsh, N., Shanmugasundaram, M., Ramaiah, D., 2013. Efficient reaction based
colorimetric probe for sensitive detection, quantification, and on-site
analysis of nitrite ions in natural water resources. Anal. Chem. 85, 10008-
10012.
Aguilar, C., Janssen, H.G., Cramers, C.A., 2000. On-line coupling of equilibrium-
sorptive enrichment to gas chromatography to determine low-molecular-
mass pollutants in environmental water samplesJ. Chromatogr. A 867,
207–218.
Alagirisamy, N., Hardas, S., Jayaraman, S., 2010. Novel colorimetric sensor for oral
malodour. Anal. Chim. Acta 661, 97–102.
Alatriste-Mondragon, F., Iranpour, R., Ahring, K.K., 2003. Toxicity of di-(2-
ethylhexyl) phthalate on the anaerobic digestion of wastewater sludge.
Water Res. 37, 1260-169.
Alkasir, R.S.J., Ornatska, M., Andreescu, S., 2012. Colorimetric Paper Bioassay for
the Detection of Phenolic Compounds. Anal. Chem. 84 (22), 9729–9737.
Alula, M.T., Karamchand, L., Hendricks, N.R., Blackburn, J.M., 2018. Citrate-capped
silver nanoparticles as a probe for sensitive and selective colorimetric and
spectrophotometric sensing of creatinine in human urine. Anal. Chim.
Acta. 1007, 40-49.
Aminian, M., Nabatchian, F., Vaisi-Raygani, A., Torabi, M., 2013. Mechanism of
Coomassie Brilliant Blue G-250 binding to cetyltrimethylammonium
bromide: an interference with the Bradford assay. Anal. Biochem. 434,
287–291.
Amou, T., Hinode, D., Yoshioka, M., Grenier, D., 2014. Relationship between
halitosis and periodontal disease - associated oral bacteria in tongue
coatings. Int. J. Dent. Hyg. 12(2), 145-51.
Anastas, P.T., Warner, J.C., 1998. Green Chemistry: Theory and Practice, Green
Chem. Theory Pract. Oxford Univ. Press, New York.

References
288
Andrade, M.A., Lancas, F.M., 2017. Determination of ochratoxin A in wine by
packed in-tube solid phase microextraction followed by high performance
liquid chromatography coupled to tandem mass spectrometry. J.
Chromatogr. A 1493, 41-48.
Argente-García, A., Muñoz-Ortuño, M., Molins-Legua, C., Moliner-Martínez, M.,
Campíns-Falcó, P., 2016a. A solid Device based on doped hybrid
composites for controlling the dosatge of the biocide N-(3-aminopropyl)-
N-dodecyl-1,3- propanediamine in industrial formulations. Talanta 147,
147–154.
Argente-García, A., Jornet-Martínez, N., Herráez-Hernández, R., Campíns-Falcó, P.,
2016b. A solid colorimetric sensor for the analysis of amphetamine-like
street samples. Anal. Chim. Acta 943, 123-130.
Argente-García, A., Moliner-Martínez, Y., López-García, E., Campíns-Falcó, P.,
Herráez-Hernández, R., 2016c. Application of Carbon Nanotubes Modified
Coatings for the Determination of Amphetamines by In-Tube Solid-Phase
Microextraction and Capillary Liquid Chromatography. Chromatography 3,
7-21.
Argente-García, A., Moliner-Martínez, Y., Campíns-Falcó, P., Verdú-Andrés, J.,
Herráez-Hernández, R., 2016d. Determination of amphetamines in hair by
integrating sample disruption, clean-up and solid phase derivatization. J.
Chromatogr. A, 1447, 47–56.
Argente-García, A., Jornet-Martínez, N., Herráez-Hernández, R., Campíns-Falcó, P.,
2017. A passive solid sensor for in-situ colorimetric estimation of the
presence of ketamine in illicit drug samples. Sens. Actuator B 253, 1137–
1144.
Argente-García, A., L. Hakobyan, Moliner-Martínez, Y., Herráez-Hernández, R.,
Campíns-Falcó, P., 2017. Sensitive on-line miniaturized method for
estimating diphenylamine deposited on shooter hands as a forensic tool.
Submitted.
Arndt, J., Bell, S., Crookshanks, L., Lovejoy, M., Oleska, C., Tulley, T., Wolfe, D.,

References
289
2012. Preliminary evaluation of the persistence of organic gunshot
residue. Forensic Sci. Int. 222(1-3), 137–145.
Arthur, C.L., Pawliszyn, J., 1990. Solid phase microextraction with thermal
desorption using fused silica optical fibers. Anal. Chem. 62, 2145– 2148.
Ash, M., Ash, I., 2004. Handbook of Preservatives, Synapse InfoResources;
Endicott, NY, USA.
Asiabi, H., Yamini, Y., Seidi, S., Shamsayei, M., Safari, M., Rezaei, F., 2016a. On-line
electrochemically controlled in-tube solid phase microextraction of
inorganic selenium followed by hydride generation atomic absorption
spectrometry. Anal Chim Acta. 922, 37-47.
Asiabi, H., Yamini, Y., Seidi, S., 2016b. Preparation and evaluation of a novel
molecularly imprinted polymer coating for selective extraction of
indomethacin from biological samples by electrochemically controlled in-
tube solid phase microextraction. Anal. Chim. Acta 913, 76-85.
Aufartová, J., Torres-Padron, M.E., Sosa-Ferrera, Z., Solich, P., Santana-Rodriguez,
J.J., 2012. Optimization of an in-tube solid-phase microextraction method
coupled with HPLC for determination of some oestrogens in
environmental liquid samples using different capillary columns, Int. J.
Environ. Anal. Chem. 92, 382-396.
Baciu, T., Borrull, F., Aguilar, C., Calull, M., 2015. Recent trends in analytical
methods and separation techniques for drugs of abuse in hair. Anal. Chim.
Acta 856, 1–26.
Bahzadi, M., Noroozian, E., Mirzaei, M., 2013. A novel coating based on carbon
nanotubes/poly-orthophenylenediamine composite for headspace solid-
phase microextraction of polycyclic aromatic hydrocarbons. Talanta 108,
66–73.
Bailey, M. J., Kirkby, K. J., Jeynes, C., 2009. Trace element profiling of gunshot
residues by PIXE and SEM-EDS: a feasibility study. X-Ray Spectrometry.
38(3), 190–194.
References
290
Bala, R., Mittal, S., Sharma, R.K., Wangoo, N., 2018. A
supersensitive silver nanoprobe based aptasensor for low cost detection
of malathion residues in water and food samples. Spectrochim. Acta A
196, 268-273.
Bao, Y.Y., Xy, P.C., Cai, S.R., Yu, H.T., Li, X.X., 2018. Detection of volatile-organic-
compounds (VOCs) in solution using cantilever-based gas sensors. Talanta
182, 148-155.
Barker, S.A., 2007. Matrix solid phase dispersion (MSPD). J. Biochem. Biophys.
Methods. 70, 151-162.
Bassarab, P., Williams, D., Dean, J.R., Ludkin, E., Perry, J.J., 2011. Determination
ofquaternary ammonium compounds in seawater samples by solid-
phaseextraction and liquid chromatography–mass spectrometry. J.
Chromatogr. A 1218, 673–677.
Beck, J. S., Vartuli, J. C., Roth, W. J., Leonowicz, M. E., Kresge, C. T., Schmitt, K. D.,
Sheppard, E. W., 1992. A new family of mesoporous molecular sieves
prepared with liquid crystal templates. J. Am. Chem. Soc. 114, 10834–
10843.
Belay, K., 2016. Advanced analytical microextraction techniques and there
applications: A review, J. Biol. Agric. Healthc. 6, 13–20.
Bernal Morales, E., Revilla Vázquez, A. L., 2004. Simultaneous determination of
inorganic and organic gunshot residues by capillary electrophoresis. J.
Chromatogr. A, 1061(2), 225–233.
Betts, T.A., Tipple, C.A., Sepaniak, M.J., Datskos, P.G., 2000. Selectivity of chemical
sensors based on micro-cantilevers coated with thin polymer
films. Anal. Chim. Acta 422, 89–99.
Biedermann-Brem, S., Biedermann, M., Pfenninger, S., Bauer, M., Altkofer, W.,
Rieger, K., Hauri, U., 2008. Plasticizers in PVC toys and childcare products:

References
291
what succeeds the phthalates? market survey 2007. Chromatographia 68
(3), 227-234.
Bin, L., Zhang, X.-X., Huang, H.-Y., Chen, L.-Q., Cui, J.-H., Liu, Y., Jin, H., Lee, B.-J.,
Cao, Q.-R., 2018. Effective deactivation of A549 tumor cells in vitro and in
vivo by RGD-decorated chitosan-functionalized single-
walled carbon nanotube loading docetaxel. Int. J. Pharm. 543, 8-20.
Biondi, C.A.M., 2011. Applying the precautionary principle to consumer household
cleaning product development. J. Clean. Prod. 19, 429–437.
Bloch, E. D., Queen, W. L., Krishna, R., Zadrozny, J. M., Brown, C. M., Long, J. R.,
2012. Hydrocarbon separations in a metal-organic framework with open
iron(II) coordination sites. Science 335, 1606-1610.
Bodas, D., Khan-Malek, C., 2007. Hydrophilization and hydrophobic recovery of
PDMS by oxygen plasma and chemical treatment—an SEM investigation.
Sens. Actuators B Chem. 123, 368–373.
Boisen, A., Dohn, S., Keller, S., Schmid, S., and Tenje, M., 2011. Cantilever-like
micromechanical sensors. Rep. Prog. Phys. 74(3), 36101-36132.
Bolle, C.M., Beikler, T., 2012. Halitosis: the multidisciplinary approach. Int. J. Oral.
Sci. 4(2), 55-63.
Bouchaala, A., Nayfeh, A. H., Younis. M. I., 2016. Frequency shifts of micro and
nanocantilever beam resonators due to added masses. J. Dyn. Sys., Meas.,
Control. 138, 91002-91011.
Boudjiet, M.-T., Bertrand, J., Mathieu, F. Nicu, L., Mazenq, L., Leïchlé, T., Heinrich,
S., Pellet, C., Dufour, I., 2015. Geometry optimization of uncoated silicon
microcantilever-based gas density sensors. Sens. Actuators, B. 208, 600-
607.
Boyacı, E., Sparham, C., Pawliszyn, J., 2014. Thin-film microextraction coupled to
LC-ESI–MS/MS for determination of quaternary ammonium compounds in
water samples. Anal. Bioanal. Chem. 406, 409–420.

References
292
Brozek-Mucha, Z., 2007. Comparison of cartridge case and airborne GSR-a study
of the elemental composition and morphology by means of SEM-EDX. X-
Ray Spectrom. 36(6), 398-407.
Bu, Y., Feng, J., Sun, M., Zhou, C., Luo, C., 2016. Gold-functionalized stainless-steel
wire and tube for fiber-in-tube solid-phase microextraction coupled to
high-performance liquid chromatography for the determination of
polycyclic aromatic hydrocarbons. J. Sep. Sci. 39, 932-938.
Burleson, G. L., Gonzalez, B., Simons, K., Yu, J. C. C., 2009. Forensic analysis of a
single particle of partially burnt gunpowder by solid phase micro-
extraction-gas chromatography-nitrogen phosphorus detector. J.
Chromatogr. A, 1216(22), 4679–4683.
Cadiau, A., Adil, K., Bhatt, P. M., Belmabkhout, Y., Eddaoudi, M., 2016. A metal-
organic framework-based splitter for separating propylene from propane.
Science 353, 137-140.
Caelen, I., Kalman, A., Wahlström, L., 2004. Biosensor‐Based Determination of
Riboflavin in Milk Samples. Anal. Chem. 76, 137–143.
Camilleri, A.M., Caldicott, D., 2005. Underground pill testing, down under.
Forensic Sci. Int. 151, 53-58.
Campíns-Falcó, P., Verdú-Andrés, J., Sevillano-Cabeza, A., Molins-Legua, C.,
Herráez-Hernández, R., 2008. New micromethod combining miniaturized
matrix solid phase dispersion and in-tube-in-valve solid phase
microextraction for estimating polycyclic aromatic hydrocarbons in
bivalves. J. Chromatogr. A 1211, 13-21.
Campíns-Falcó, P., Herráez-Hernández, R., Verdú-Andrés, J., Cháfer-Pericas, C.,
2009. Online determination of aliphatic amines in water using in-tube
solid-phase microextraction- assisted derivatization in in-valve mode for
processing large sample volumes in LC. Anal. Bioanal. Chem. 394, 557-565.
Campíns-Falco, P., Verdú-Andrés, J., Sevillano-Cabeza, A., Herráez-Hernández, R.,
Molins-Legua, C., Moliner-Martínez, Y., 2010. In-tube solid phase

References
293
microextraction coupled by in-valve mode to capillary LC-DAD: improving
the detectability to multiresidue organic pollutants analysis in several
whole waters. J. Chromatogr. A 1217, 2695-2702.
Campíns-Falcó, P., Moliner-Martínez, Y., Herráez-Hernández, R., Molins-Legua, C.,
Verdú-Andrés, J., Jornet-Martínez, N., 2016. Passive sensor for in situ
detection of amines in chemical industries. Patent 201300436.
Capitán-Vallvey, L.F., López-Ruiz, N., Martínez-Olmos, A., Erenas, M.M., Palma,
A.J., 2015. Recent developments in computer vision-based analytical
chemistry: a tutorial review. Anal. Chim. Acta 899, 23-56.
Capriotti, A. L., Cavaliere, C., Giansanti, P., Gubbiotti, R., Samperi, R., Laganà, A.,
2010. Recent developments in matrix solid-phase dispersion extraction. J.
Chromatogr. A. 1217, 2521-2532.
Cardinetti, B., Ciampini, C., D’Onofrio, C., Orlando, G., Gravina, L., Ferrari, Di Tullio,
D., Torresi, L., 2004. X-ray mapping technique: A preliminary study in
discriminating gunshot residue particles from aggregates of environmental
occupational origin. Forensic Sci. Int. 143(1), 1–19.
Cháfer-Pericas, C., Campíns-Falcó, P., Herráez-Hernández, R., 2004. Application of
solid-phase microextraction combined with derivatization to the
determination of amphetamines by liquid chromatography. Anal.
Biochem. 333, 328-335.
Cháfer-Pericás, C., Herráez-Hernández, R., Campíns-Falcó, P., 2006. On-fibre solid-
phase microextraction coupled to conventional liquid chromatography
versus in-tube solid-phase microextraction coupled to capillary liquid
chromatography for screening analysis of triazines in water samples, J.
Chromatogr. A 1125, 159-171.
Cháfer-Pericás, C., Herráez-Hernández, R., Campíns-Falcó, P., 2007. In-tube solid-
phase microextraction-capillary liquid chromatography as a solution for
the screening analysis of organophosphorus pesticides in untreated
environmental water samples. J. Chromatogr. A 1141,10-21.

References
294
Cháfer-Péricas, C., Campíns-Falcó, P., Prieto-Blanco, M. C., 2008. Automatic in-
tube SPME and fast liquid chromatography: A cost-effective method for
the estimation of dibuthyl and di-2-ethylhexyl phthalates in environmental
water samples. Anal. Chim. Acta 610, 268-273.
Chai, F., Wang, C., Wang, T., Ma, Z., Su, Z., 2010. L-cysteine functionalized gold
nanoparticles for the colorimetric detection of Hg2+ induced by ultraviolet
light. Nanotechnology 21, 25501-25507.
Chaler, R., Cantón, L., Vaquero, M., Grimalt, J.O., 2004. Identification and
quantification of n-octyl esters of alkanoic and hexanedioic acids and
phthalates as urban waste water markers in biota and sediments from
estuarine areas. J. Chromatogr. A 1046, 203-210.
Chang, J., Li, H., Hou, T., Li, F., 2016. Paper‐based fluorescent sensor for rapid
naked eye detection of acetylcholinesterase activity and
organophosphorus pesticides with high sensitivity and selectivity, Biosens.
Bioelectron. 86, 971–977.
Chang, N., Gu, Z-Y., Wang, H-F., Yan, X-P., 2011. Metal-organic-framework-based
tandem molecular sieves as a dual platform for selective microextraction
and high-resolution gas chromatographic separation of n-alkanes in
complex matrixes. Anal. Chem. 83(18), 7094-7101.
Chang, Y.J., Chao, M.-R., Chen, S.-C., Chen, C.-H., Chang, Y.Z., 2014. A high-
throughputmethod based on microwave-assisted extraction and
liquidchromatography-tandem mass spectrometry for simultaneous
analysis of amphetamines ketamine, opiates, and their metabolites in hair.
Anal. Bioanal.Chem. 406, 2445–2455.
Chaplan, C.A., Mitchell, H.T., Martinez, A.W., 2014. Paper‐based standard addition
assays, Anal. Methods. 6, 1296-1301.
Chaudhary, M., Gupta, A., 2009. Microcantilever-based sensors. Def. Sci. J. 59(6),
634-641.

References
295
Chaves, A.R., Silva, B.J., Lanças, F.M., Queiroz, M.E., 2011. Biocompatible in-tube
solid-phase microextraction coupled with liquid chromatography-
fluorescence detection for the determination of interferon a2a in plasma
samples, J. Chromatogr. A 1218, 3376-3381.
Chaves, A.R., Queiroz, M.E.U., 2013a. Immunoaffinity in tube solid phase
microextraction coupled with liquid chromatography with fluorescence
detection for determination of interferon alpha in plasma samples. J.
Chromatogr. B Analyt. Technol. Biomed. Life Sci. 928, 37-43.
Chaves, A.R., Queiroz, M.E.C., 2013b. In-tube solid-phase microextraction with
molecularly imprinted polymer to determine interferon alpha 2a in plasma
sample by high performance liquid chromatography. J. Chromatogr. A.
1318, 43-48.
Chen, G.H, Chen, W.-Y., Yen, Y.-C., Wang, C.-W., Chang, H.-T., Chen, C.-F., 2014.
Detection of Mercury(II) Ions Using Colorimetric Gold Nanoparticles on
Paper-Based Analytical Devices. Anal. Chem. 86 (14), 6843–6849.
Chen, W., Fang, X., Li, H., Cao, H., Kong, J., 2016. A simple paper-based
colorimetric device for rapid mercury (II) assay. Sci. Rep. 6, 31948-31954.
Chen, Y., Drogeb, S.T.J., Hermensa, J.L.M. 2012. Analyzing freely
dissolvedconcentrations of cationic surfactant utilizing ion-exchange
capability ofpolyacrylate coated solid-phase microextraction fibers. J.
Chromatogr. A 1252, 15–22.
Chen, Y.-C., Lee, I. L., Sung, Y.-M., Wu, S.-P., 2013. Colorimetric detection of Al3+
ions using triazole-ether functionalized gold nanoparticles. Talanta 117,
70-74.
Chen, Y., Zilberman, Y., Mostafalu, P., Sonkusale, S.R., 2015. Paper based platform
for colorimetric sensing of dissolved NH3 and CO2. Biosensors &
Bioelectronics. 67, 477-484.
Cheng, W.-C., Ng, K.-M., Chan, K.-K., Mok, V.K.-K., Cheung, B.K.-L., 2007.
Roadsidedetection of impairment under the influence of ketamine—

References
296
evaluation of ketamine impairment symptoms with reference to its
concentration in oralfluid and urine. Forensic Sci. Int. 170, 51–58.
Chin, C.D., Linder, V., Sia, S.K., Daar, A.S., Thorsteinsdottir, H., Martin, D.K., 2007.
Lab on‐a‐chip devices for global health: Past studies and future
opportunities, Lab Chip. 7, 41–57.
Choodum, A., Kanatharana, P., Womgniramaikul, W., 2015. A sol-gel colorimetric
sensor for methamphetamine detection. Sens. Actuat. B 215, 553-560.
Christodouleas, D.C., Nemiroski, A., Kumar, A.A., Whitesides, G.M., 2015. Broadly
available imaging devices enable high‐quality low‐cost photometry, Anal.
Chem. 87, 9170–9178.
Chutipongtanate, S., Watcharatanyatip, K., Homvises, T., Jaturongkakul, K.,
Thongboonkerd, V., 2012. Systematic comparisons of various
spectrophotometric and colorimetric methods to measure concentrations
of protein, peptide and amino acid: detectable limits, linear dynamic
ranges, interferences, practicality and unit costs. Talanta 98, 123–129.
Clément, P., Del Castillo Perez, E., Gonzalez, O., Calavia, R., Lucat, C., Llobet, E.,
Debéda, H., 2016. Gas discrimination using screen-printed piezoelectric
cantilevers coated with carbon nanotubes. Sens. Actuators, B 237, 1056–
1065.
Coffey, C.C., Pearce, T.A., 2010. Direct-reading Methods for Workplace Air
Monitoring. J. Chem. Health. Saf. 17, 10-21.
Commercial Pool Test kits. Walmart Web Portal.
https://www.walmart.com/c/kp/pool-test-kits (accessed 02 May 2018).
Cui, X-Y., Gu, Z-Y., Jiang, D-Q., Li, Y., Wang, H-F., Yan, X-P., 2009. In situ
hydrothermal growth of metal-organic framework 199 films on stainless
steel fibers for solid-phase microextraction of gaseous benzene
homologues. Anal. Chem. 81(23), 9771-9777.

References
297
Dalby, O., Butler, D., Birkett, J. W., 2010. Analysis of gunshot residue and
associated materials - A review. J. Forensic Sci. 55(4), 924–943.
Debéda, H., Lakhmi, R., Lucat, C., Dufour, I., 2013. Use of the longitudinal mode of
screen-printed piezoelectric cantilevers coated with PEUT for toluene
detection: Comparison with silicon cantilevers. Sens. Actuators, B 187,
198– 203.
Debéda, H., Lucat, C., 2014. Feasibility of screen-printed PZT microceramics for
structural health monitoring applications. Int. J. Appl. Ceram. Technol., 11
(3), 413–421.
Debéda, H., Clément, P., Llobet, E., Lucat, C., 2015. One-step firing for electroded
PZT thick films applied to MEMS. Smart Mater. Struct. 24, 25020-25028.
Demoranville, T., Verkouteren, J.R., 2013. Measurement of drug facilitated sexual
assault agents in simulated sweat by ion mobility spectrometry. Talanta
106, 375–380.
Deng, H.-H., Weng, S.-H., Huang, S.-Lu, Zhang, L.-N., Liu, A.-L., Lin, X.-H., Chen, W.,
2014. Colorimetric detection of sulfide based on target-induced shielding
against the peroxidase-like activity of gold nanoparticles. Anal. Chim. Acta.
852, 218-222.
Dev Satyanarayan, S.R., Demirci, A., Graves, R.E., Puri, V.M., 2014. Optimization
and modeling of an electrolyzed oxidizing water based clean-in-place
technique for farm milking systems using a pilot–scale milking system. J.
Food Eng. 135, 1–10.
Devlin, T.M., 1992. The Textbook of Biochemistry. 3rd ed. Wiley-Liss Inc. New
York.
Directive 2008/105/EC of the European Parliament and of the Council of 16
December 2008 on environmental quality standards in the field of water
policy.

References
298
Dittrich, P. S., Manz, A., 2006. Lab-on-a-chip: microfluidics in drug discovery. Nat.
Rev. Drug. Discov. 5, 210–218.
Dong, Y., Gao, W., Zhou, Q., Zheng, Y., You, Z., 2010. Characterization of the gas
sensors based on polymer-coated resonant microcantilevers for the
detection of volatile organic compounds. Anal. Chim. Acta 671(1), 85-91.
Dou, B., Hu, Q., Li, J., Qiao, S., and Hao, Z., 2011. Adsorption performance of VOCs
in ordered mesoporous silicas with different pore structures and surface
chemistry. J. Hazard. Mater. 186 (2), 1615-1624.
Drochioiu, G., Damoc, N.E., Przybylski, M., 2006. Novel UV assay for protein
determination and the characterization of copper–protein complexes by
mass spectrometry. Talanta 69, 556–564.
Duerinck, T., Denayer, J. F. M., 2015. Metal-organic frameworks as stationary
phases for chiral chromatographic and membrane separations. Chem. Eng.
Sci. 124, 179-187.
Eisert, R., Pawliszyn, J., 1997. Automated In‐Tube Solid‐Phase Microextraction
Coupled to High‐Performance Liquid Chromatography, Anal. Chem. 69,
3140–3147.
El-Haj, B.M., Al-Amri, A.M., Hassan, M.H., Ali, H.S., Khadem, R.H.B., 2003. The use
of cyclohexanone as a “derivatizing” reagent for the GC-MS detection of
amphetamines and ephedrines in seizures and the urine. Forensic Sci. Int.
135, 16-26.
Elechiguerra, J.L., Larios-López, L., Liu, C., García-Gutiérrez, D., Camacho-Bragado,
A., Yacaman, M.J, 2005. Corrosion at the Nanoscale: The Case of Silver
Nanowires and Nanoparticles. Chem. Mater., 17 (24), 6042–6052.
Endo, T., Yanagida, Y., Hatsuzawa, T., 2007. Colorimetric detection of volatile
organic compounds using a colloidal crystal-based chemical sensor for
environmental applications. Sens. Actuator B-Chem. 125, 589-595.

References
299
Ercag, E., Uezer, A., Apak, R., 2009. Selective spectro photometric determination
of TNT using a dicyclohexylamine-based colorimetric sensor. Talanta 78,
772-780.
European Drug Report 2017: Trends and Developments, 2017. European
Monitoring Centre for Drugs and Drug Addition, Lisbon.
http://www.emcdda.europa.eu/publications/edr/trends-
developments/2017_en (accessed 8 May 2018).
Fang, Z.-L., Zheng, S.-R., Tan, J.-B., Cai, S.-L., Fan, J., Yan, X., Zhang, W.-G., 2013.
Tubular metal–organic framework-based capillary gas chromatography
column for separation of alkanes and aromatic positional isomers. J.
Chromatogr. A 1285, 132-138.
Farokhcheh, A., Alizadeh, N., 2013. Determination of diphenylamine residue in
fruit samples using spectrofluorimetry and multivariate analysis. LWT -
Food Sci. Technol. 54(1), 6–12.
Feng, J., Tian, Y., Wang, X., Luo, C., Sun, M., 2018. Basalt fibers functionalized with
gold nanoparticles for in-tube solid-phase microextraction. J. Sep. Sci.
41(5), 1149-1155.
Feng, X., Li, Y., Jing, R., Jiang, X., Tian, M., 2014. Detection of organophosphorous
pesticides in soil sample with multiwalled carbon nanotubes coating spme
fiber. B. Environ. Contam. Tox. 93, 769–774.
Fernández-Amado, M., Prieto-Blanco, M.C., López-Mahía, P., Muniategui-
Lorenzo, S., Prada-Rodríguez, D., 2016. A novel and cost-effective method
for the determination of fifteen polycyclic aromatic hydrocarbons in low
volume rain water samples. Talanta 155, 175-184.
Fernández-Amado, M., Prieto-Blanco, M.C., López-Mahia, P., Muniategui-Lorenzo,
S., Prada-Rodriguez, D., 2017. Ion-pair in-tube solid phase microextraction
for the simultaneous determination of phthalates and their degradation
products in atmospheric particulate matter. J. Chromatogr. A 1520, 35-47.
References
300
Frankhauser-Noti, A., Grob, K., 2007. Blank problems in trace analysis of
diethylhexyl and dibutyl phthalate: investigation of the sources, tips and
tricks. Anal. Chim. Acta 582, 353-360.
Freitas, S.S., Serafim, F.A.T., Lancas, F.M., 2018. Determination of target pesticide
residues in tropical fruits employing Matrix Solid-PhaseDispersion (MSPD)
extraction followed by high resolution gas chromatography. J. Braz. Chem.
Soc. 29 (5), 1140-1148.
Freudenmann, R.W., Spitzer, M., 2004. The neuropsychopharmacology and
toxicology of 3,4-methylenedioxy-N-ethyl-amphetamine (MDEA). CNS
Drug Rev. 10, 89-116.
Gabrielson, J., Hart, M., Jarelöv, A., Kühn, I., McKenzie, D., Möllby, R. 2002,
Evaluation of redox indicators and the use of digital scanners and
spectrophotometer for quantification of microbial growth in microplates.
J. Microbiol. Methods 50, 63–73.
Gałuszka, A., Migaszewski, Z., Namieśnik, J., 2013. The 12 principles of green
analytical chemistry and the SIGNIFICANCE mnemonic of green analytical
practices, TrAC‐Trends Anal. Chem. 50, 78–84.
García-López, M., Canosa, P., Rodríguez, I., 2008. Trends and recent applications
of matrix solid-phase dispersion. Anal. Bioanal. Chem. 391, 963-974.
García-Romeo, D., Pellejero, I., Urbiztondo, M.A., Sese, J., Pina, M.P., Martínes,
P.A., Calvo, B., Medrano, N., 2014. Portable low-power electronic interface
for explosive detection using microcantilevers. Sens. Actuator B-Chem.
200, 31-38.
Gary-Bobo, M., Hocine, O., Brevet, D., Maynadier, M., Raehm, L., Richeter, S.,
2012. Cancer therapy improvement with mesoporous silica nanoparticles
combining targeting, drug delivery and PDT. Int. J. Pharm. 423, 509-15.
Ghrera, A.S., Pandey, C.M., Malhotra, B.D., 2018. Multiwalled carbon nanotube
modified microfluidic-based biosensor chip for nucleic acid detection.
Sens. Actuator B-Chem. 266, 329-336.
References
301
Gibson, L. T., 2014. Mesosilica materials and organic pollutant adsorption: part A
removal from air. Chem. Soc. Rev. 43, 5163–5172.
Giorgetti, R., Marcotulli, D., Tagliabracci, A., Schifano, F., 2015. Effects of ketamine
onpsychomotor, sensory and cognitive functions relevant for driving
ability. Forensic Sci. Int. 252, 127–142.
Globig, D., Weickhardt, C., 2005. Fully automated in-tube solid-phase
microextraction for liquid samples coupled to gas chromatographyAnal.
Bioanal. Chem. 381, 656–659.
González-Castro, M. I., Olea-Serrano, M. F., Rivas-Velasco, A.M., Medina-Rivero,
E., Ordonez-Acevedo, L. G., De Leon-Rodriguez, A., 2011. Phthalates and
Bisphenols Migration in Mexican Food Cans and Plastic Food Containers.
Bull Environ Contam Toxicol. 86 (6), 627-631.
González-Fuenzalida, R.A., Moliner-Martínez, Y., Prima-Garcia, H., Ribera, A.,
Campins-Falcó, P., Zaragozá, R.J., 2014. Evaluation of superparamagnetic
silica nanoparticles for extraction of triazines in magnetic in-tube solid
phase microextraction coupled to capillary liquid chromatography.
Nanomaterials 4, 242-255.
González-Fuenzalida, R.A., Moliner-Martínez, Y., Molins-Legua, C., Parada-
Artigues, V., Verdú-Andrés, J., Campins-Falcó, P., 2016a. New tools for
characterizing metallic nanoparticles: AgNPs, a case study. Anal. Chem. 88,
1485-1493.
Gonzalez-Fuenzalida, R.A., Lopez-Garcia, E., Moliner-Martinez, Y., Campins-Falco,
P., 2016b. Adsorbent phases with nanomaterials for in-tube solid-phase
microextraction coupled on-line to liquid nanochromatography. J.
Chromatogr. A 1432, 17-25.
Gopinath, P. G., 2014. MEMS microcantilevers sensor modes of operation and
transduction principles, Int. J. Comput. Eng. Sci. 4 (2), 1–11.

References
302
Gou, Y., Pawliszyn, J., 2000. In-tube solid-phase microextraction coupled to
capillary LC for
carbamate analysis in water samples. Anal. Chem. 72, 2774-2779.
Gjerde, H., Nordfjærn, T., Bretteville-Jensen, A.L., Edland-Gryt, M., Furuhaugen,
H., Karinen, R., Øiestad, E.L., 2016. Comparison of drugs used by nightclub
patrons and criminal offenders in Oslo Norway. Forensic Sci. Int. 265, 1–5.
Green, R., Hauser, R., Calafat, A.M., Weuve, J., Schettler, T., Ringer, S., Huttner,
K., Hu, H., 2005. Use of di(2-ethylhexyl) phthalate–containing medical
products and urinary levels of mono(2-ethylhexyl) phthalate in neonatal
intensive care unit infants. Environ Health Perspect. 113(9), 1222-12225.
Grima, M., Butler, M., Hanson, R., Mohameden, A., 2012. Firework displays as
sources of particles similar to gunshot residue. Sci. Justice, 52(1), 49–57.
Guo, Y., Schutz, S., Vaghi, A., Li, Y.H., Guo, Z.Q., Chang, F.K., Barrettino, D., Wang,
S.X., 2017. Stand-Alone Stretchable Absolute Pressure Sensing System for
Industrial Applications. Trans. Ind. Electron. 64 (11), 8739-8746.
Haddoub, R., Ferry, D., Marsal, P., Siri, O., 2011. Cobalt thiocyanate reagent
revisited for cocaine identification on TLC, New J. Chem. 35, 1351–1354.
Hakobyan, L., Pla-Tolós, J., Moliner-Martínez, Y., Molins-Legua, C., Ramos, J.R.,
Gordon, M., Ramirez-Galleymore, P., Campins-Falcó, P., 2018.
Determination of meropenem in endotracheal tubes by in-tube solid
phase microextraction coupled to capillary liquid chromatography with
diode array detection. J. Pharm. Biomed. Anal. 151, 170-177.
Hamdi, K., Hébrant, M., Martin, P., Galland, B., Etienne, M., 2016. Mesoporous
silica nanoparticle film as sorbent for in situ and real-time monitoring of
volatile BTX (benzene, toluene and xylenes). Sens. Actuator B-Chem. 223,
904-913.
Hatamie, A., Zargar, B., Jalali, A., 2014. Copper nanoparticles: A new colorimetric
probe for quick, naked-eye detection of sulfide ions in water samples.
Talanta, 121, 234-238.

References
303
He, Y., Zhang, X., 2016. Ultrasensitive colorimetric detection of manganese (II)
ions based on anti-aggregation of unmodified silver nanoparticles. Sens.
Actuators B Chem. 222, 320-324.
Herráez-Hernández, R., Campíns-Falcó, P., Sevillano-Cabeza, A., 1996a. On-line
derivatization into precolumns for the analysis of drugs by liquid
chromatography and column switching: determination of amphethamines
in urine. Anal. Chem. 68, 734–739.
Herráez-Hernández, R., Campíns-Falcó, P., Sevillano-Cabeza, A., 1996b.
Determination of amphethamine and related compounds in urine using
on-line derivatization in octadecyl silica columns with 9-
fluorenylmethylchloroformate and liquid chromatography. J. Chromatogr.
B 679, 69–78.
Herráez-Hernández, R., Campíns-Falcó, P., Sevillano-Cabeza, A., Trümpler, I.,
1997. Derivatization of amines in solid-phase extraction supports with 9-
fluorenylmethyl chloroformate for liquid chromatography. Anal. Chim.
Acta 344, 125–136.
Herráez-Hernández, R., Campins-Falcó, P., Verdú-Andrés, J., 2001. Sensitive
determination of methylenedioxylated amphetamines by liquid
chromatography. Analyst 126, 581-586.
Herráez-Hernández, R., Campins-Falcó, P., Verdú-Andrés, J., 2002. Enantiomeric
separation of amphetamine and related compounds by liquid
chromatography using precolumn derivatization with o-phthaldialdehyde.
Chromatographia 56, 559-565.
Hosu, O., Ravalli, A., Lo Piccolo, G.M., Cristea, C., Sandulescu, R., Marrazza, G.,
2017. Smartphone‐based immunosensor for CA125 detection. Talanta.
166, 234–240.
Huang, P.-C., Tien, C.-J., Sun, Y.-M., Hsieh, C.-Y., Lee, C.-C., 2008. Occurrence of
phthalates in sediment and biota: relationship to aquatic factors and the
biota-sediment accumulation factor. Chemosphere 73, 539-544.

References
304
Hui, I., Hecheng, L., Ying, L., Dan, Z., Cheng, W., Heseng, C., Stepan, L., 2010.
Distribution of phthalate esters in alluvial sediment: a case study at
JiangHan Plain, Central China. Chemosphere 78, 382-388.
Hung, C., Bai, H., 2008. Adsorption behaviors of organic vapors using mesoporous
silica particles made by evaporation induced self-assembly method. Chem.
Eng. Sci. 63(7), 1997-2005.
Hunter, C.M., HP Niles, H.P., Vazquez, J., Kloos, C., Subramanyam, R., Williams,
M.I., Cummins, D., Lenton, P.A., Majerus, G.J., 2005. Breath odor
evaluation by detection of volatile sulfur compounds – correlation with
organoleptic odor ratings. Oral Diseases.11, 48–50.
Iijima, S., 1991. Helical microtubules of graphitic carbon. Nature. 354, 56-58.
Illescas, J.F., Mosquera, M.J., 2011. Surfactant-synthesized PDMS/silica
nanomaterials improve robustness stain resistance of carbonate stone.
Phys. Chem. C. 115 (30), 14624–14634.
Janzen, M.C., Ponder, J.B., Bailey, D.P., Ingison, C.K., Suslick, K.S., 2006.
Colorimetric sensor Arrays for volatile organic compounds. Anal. Chem.
78, 3591–3600.
Jia, M.Y., Wu, Q.S., Li, H., Zhang, Y., Guan, Y.F., Feng, L., 2015. The calibration of
cellphone camera‐based colorimetric sensor array and its application in
the determination of glucose in urine, Biosens. Bioelectron. 74, 1029–
1037.
Jornet-Martínez, J., Muñoz-Ortuño, M., Moliner-Martínez, Y., Herráez- Hernández,
R., Campíns-Falcó, P., 2014a. On-line in-tube solid phase microextraction-
capillary liquid chromatography method for monitoring degradation
products of di-(2-ethylhexyl) phthalate in water. J. Chromatogr. A 1347,
157-160.
Jornet-Martínez, N., González-Béjar, M., Moliner- Martínez, Y., Campíns-Falcó, P.,
Pérez-Prieto, J., 2014b. Sensitive and selective plasmonic assay for
spermine as biomarker in human urine. Anal. Chem. 86, 1347-1351.

References
305
Jornet-Martínez, N., Antón-Soriano, C., Campíns-Falcó, P., 2015a. Estimation of
the presence of unmetabolized dialkyl phthalates in untreated human
urine by an on-line miniaturized reliable method, Sci. Total Environ. 532,
239-244.
Jornet-Martínez, N., Serra-Mora, P., Moliner-Martínez, Y., Herráez-Hernández, R.,
Campins-Falcó, P., 2015b. Evaluation of carbon nanotubes functionalized
polydimethylsiloxane based coatings for in-tube solid phase
microextraction coupled to capillary liquid chromatography.
Chromatography 2 (3), 515-528.
Jornet-Martínez, N., Moliner-Martínez, Y., Herráez- Hernández, R., Molins-Legua,
C., Verdú-Andrés, J., Campíns-Falcó, P., 2016a. Designing solid optical
sensor for in situ passive discrimination of volatile amines based on a new
one-step hydrophilic PDMS preparation. Sens. Actuator B Chem., 223, 333-
342.
Jornet-Martínez, N., Campins-Falcó, P., Hall, E.A.H., 2016b. Zein as biodegradable
material for effective delivery of alkaline phosphatase and substrates in
biokits and biosensors. Biosens. Bioelectron. 86, 14-19.
Jornet-Martínez, N., Moliner-Martínez, Y., Molins-Legua, C., Campíns-Falcó, P.,
2017. Trends for the Development of In Situ Analysis Devices.
Encyclopedia of Analytical Chemistry: Applications, Theory and
Instrumentation. JohnWiley & Sons, Ltd. Environment: water and waste
Jose, D.A., Mishra, S., Ghosh, A., Shrivastav, A., Mishra, S.K., Das, A., 2007.
Colorimetric sensor for ATP in aqueous solution. Org. Lett. 9, 1979–1982.
Jothi, L., Jayakumar, N., Jaganathan, S.K., Nageswaran, G., 2018. Ultrasensitive
and selective non-enzymatic electrochemical glucose sensor based on
hybrid material of graphene nanosheets/graphene nanoribbons/nickel
nanoparticle. Mater. Res. Bull. 98, 300-307.
Kacmaz, S., Ertekin, K., Mercan,D., Oter, O., Cetinkaya, E., Celik, E., 2015. An ultra
sensitive fluorescent nanosensor for detection of ionic copper.
Spectrochim. Acta A. 135, 551-559.

References
306
Kamizake, N.K.K., Gonçalves, M.M., Zaia, C.T.B.V., Zaia, D.A.M., 2003.
Determination of total proteins in cow milk powder samples: a
comparative study between the Kjeldahl method and spectrophotometric
methods. J. Food Compos. Anal. 16, 507–516.
Kangas, M.J., Burks, R.M., Atwater, J., Lukowicz, R.M., Williams, P., Holmes, A.E.,
2016. Colorimetric sensor arrays for the detection and identification of
chemical weapons and explosives. Crit. Rev. Anal. Chem. 47, 1–16.
Kataoka, H., 2002. Automated sample preparation using in-tube solid-phase
microextraction and its application – a review. Anal. Bioanal. Chem. 373,
31–45.
Kataoka, H., Itano, M., Ishizaki, A., Saito, K., 2009. Determination of patulin in
fruit juice and dried fruit samples by in-tube solid phase microextraction
coupled with liquid chromatography-mass spectrometry. J. Chromatogr. A
1216, 3746-3750.
Kataoka, H., Mizuno, K., Oda, E., Saito, A., 2016. Determination of the oxidative
stress biomarker urinary 8-hydroxy-2-deoxyguanosine by automated on-
line in-tube solid-phase microextraction coupled with liquid
chromatography-tandem mass spectrometry. J. Chromatogr. B 1019, 140-
146.
Katsoulidis, A. P., Park, K. S., Antypov, D., Martí-Gastaldo, C., Miller, G. J., Warren,
J. E., Robertson, C. M., Blanc, F., Darling, G. R., Berry, N. G., Purton, J. A.,
Adams, D. J., Rosseinsky, M. J., 2014. Guest‐adaptable and water‐stable
peptide‐based porous materials by imidazolate side chain control. Angew.
Chem., Int. Ed. 53, 193-198.
Khalid, N., Kobayashi, I., Nakajima, M., 2017. Recent la-on-chip developments for
novel drug discovery. 9 (4), 1381-1398.
Kilinc, N., Cakmak, O., Kosemen, A., Ermek, E., Ozturk, S., Yerli, Y., Ozturk, Z., Urey,
H., 2014. Fabrication of 1D ZnO nanostructures on MEMS cantilever for
VOC sensor application. Sens. Actuator B-Chem. 202, 357-364.

References
307
Kosuge, K., Kubo, S., Kikukawa, N., Takemori, M., 2007. Effect of pore structure in
mesoporous silicas on VOC dynamic adsorption/desorption performance.
Langmuir 23, 3095-3102.
Kralj, J.G., Munson, M.S., Ross, D., 2014. Total protein quantitation using the
bicinchoninic acid assay and gradient elution moving boundary
electrophoresis. Electrophoresis 35, 1887–1892.
Kruk, M., Jaroniec, M., Ko, C.H., Ryoo, R., 2000. Characterization of the Porous
Structure of SBA-15. Chem. Mater., 2000, 12, 1961–1968.
Kueseng, P., Pawliszyn, J., 2013. Carboxylated multiwalled carbonnanotubes/
polydimethylsiloxane, a new coating for 96-blade solid-phase
microextraction for determination of phenolic compounds in water. J.
Chromatogr. A 1317, 199–202.
Kusunoki, H., Okuma, K., Hamaguchi, I., 2012. Estimation of lactose interference in
vaccines and a proposal of methodological adjustment of total protein
determination by the Lowry method. Jpn. J. Infect. Dis. 65, 489–494.
Kutzscher, C., Müller, P., Raschke, S., Kaskel, S., 2016. Chiral Linker Systems. The
Chemistry of Metal–Organic Frameworks: Synthesis, Characterization, and
Applications, Wiley: Weinheim 387−419.
Lam, T., Devadhasan, J.P., Howse, R., Kim, J., 2017. A Chemically Patterned
Microfluidic Paper-based Analytical Device (C-µPAD) for Point-of-Care
Diagnostics. Sci Rep. 7 (1), 1188-1198.
Laza, D., Nys, B., Kinder, J. De, Kirsch-De Mesmaeker, A., & Moucheron, C., 2007.
Development of a quantitative LC-MS/MS method for the analysis of
common propellant powder stabilizers in gunshot residue. Journal of
Forensic Sciences, 52(4), 842–850.
Lee, B., Park, J.H., Byun, J.Y., Kim, J.H., Kim, M.G., 2018. An optical fiber-based
LSPR aptasensor for simple and rapid in-situ detection of ochratoxin A.
Biosens Bioelectron. 102, 504-509.

References
308
Lee, J.N., Park, C., Whitesides, G.M., 2003. Solvent compatibility of
poly(dimethylsiloxane)-based microfluidic devices. Anal. Chem. 75 (23),
6544-6554.
Leuvering, J.H.W., Thal, P.J.H.M., Van der Waart, M., Schuurs, A.H.W.M., 1980. Sol
Particle Immunoassay. J. Immunoassay 1, 77-91.
Li, C., Lu, A., Wang, J., Li, J., Ping, H., Luan, Y., Chen, J., Ha, X., 2014. Determination
of five sulfonylurea herbicides in environmental waters and soil by ultra
high performance liquid chromatography with tandem mass spectrometry
after extraction using grapheme. J. Sep. Sci. 37 (24), 3714-3721.
Li, D., Xu, F., Liu, Z., Zhu, J., Zhang, Q., Shao, L., 2013. The effect of adding PDMS–
OH and silica nanoparticles on sol–gel properties and effectiveness in
stone protection. Appl. Surf. Sci. 266, 368–374.
Li, Q., Wu, Z., Eng, D. F., Tu, B., Zhao, D. J., 2010. Hydro- thermal stability of
mesostructured cellular silica foams. J. Phys. Chem. C. 114 (11) 2010,
5012-5019.
Li, Q., Qiu, T., Hao, H., Zhou, H., Wang, T., Zhang, Y., Li, X., Huang, G., Cheng, J.,
2012. Rapid and on-site analysis of illegal drugs on the nano-microscale
using a deep ultraviolet-visible reflected optical fiber sensor. Analyst 137,
1596–1603.
Li, T., Xu, J., Wu, J.-H., Feng, Y.-Q., 2009. Liquid-phase deposition of silica
nanoparticles into a capillary for in-tube solid phase microextraction
coupled with high-performance liquid chromatography, J. Chromatogr. A
1216, 2989-2995.
Li, T., Yu, P., Lou, Y., 2015. Polydimethylsiloxane mixed-matrix membranes for dis
solved oxygen removal from water, J. Appl. Polym. Sci. 41350, 1–9.
Li, X., Lee, D.W., 2012. Integrated microcantilevers for high-resolution sensing and
probing. Meas. Sci. Technol. 23, 22001-22042.

References
309
Li, Y., Xu, H., 2015. Development of a novel graphene/polyaniline
electrodeposited coating for on-line in-tube solid phase microextraction of
aldehydes in human exhaled breath condensate, J. Chromatogr. A 1395,
23-31.
Liana, D.D., Raguse, B., Justin Gooding, J., Chow, E., 2012. Recent advances in
paper based sensors, Sensors. 12, 11505–11526.
Liang, X., Liu, S., Wang, S., Guo, Y., Jiang, S., 2014. Carbon-based sorbents: carbon
nanotubes. J. Chromatogr. A 1357, 53–67.
Lim, S.H., Mix, S., Xu, Z., Taba, B., Budvytiene, I., Berliner, A.N., Queralto, N., Churi,
Y.S., Huang, R.S., Eiden, M., Martino, R.A., Rhodes, P., Banaei, N., 2014.
Colorimetric sensor array allows fast detection and simultaneous
identification of sepsis‐causing bacteria in spiked blood culture. J. Clin.
Microbiol. 52, 592–598.
Lin, Z.P., Ikonomou, M.G., Jing, H., Mackintosh, C., Gobas, F.A.P.C., 2003.
Determination of Phthalate Ester Congeners and Mixtures by LC/ESI-MS in
Sediments and Biota of an Urbanized Marine Inlet. Environ. Sci. Technol.
37, 2100-2108.
Lindsey, M.E., Meyer, M., Thurman, E.M., 2001. Analysis of trace levels of
sulfonamide and tetracycline antimicrobials in groundwater and surface
water using solid-phase extraction and liquid chromatography/mass
spectrometry. Anal. Chem. 73 (19), 4640-4646.
Ling, X., Zhang, W., Chen, Z., 2016. Electrochemically modified carbon fiber
bundles as selective sorbent for online solid-phase microextraction of
sulfonamides, Microchim. Acta 183, 813-820.
Liu, C.C., Janmanchi, D., Wen, D.R., Oung, J.N. Mou, C.Y., Yu, S.S.F. Chan, S.I., 2018.
Catalytic oxidation of light alkanes mediated at room temperature by a
tricopper cluster complex immobilized
in mesoporous silica nanoparticles(parallel to). ACS Sustain. Chem. Eng.
6(4), 5431-5440.

References
310
Liu, Q., Shi, J., Sun, J., Wang, T., Zeng, L., Zhu, N., Jiang, G., 2011. Graphene-
assisted matrix solid-phase dispersion for extraction of polybrominated
diphenyl ethers and their methoxylated and hydroxylated analogs from
environmental samples. Anal. Chim. Acta. 708, 61-68.
Liu, S., Tong, Z., Mu, X., Liu, B., Du, B., Liu, Z., Gao, C., 2018. Detection of Abrin by
Electrochemiluminescence Biosensor Based on Screen Printed Electrode.
Sensors 18 (2), 357-379.
Liu, X.-Y., Ji, Y.-S., Zhang, H.-X., Liu, M.-C., 2008. Highly sensitive analysis of
substituted aniline compounds in water samples by using oxidized
multiwalled carbon nanotubes as an in-tube solid phase microextraction
medium, J. Chromatogr. A 1212, 10-15.
Lledo-Fernandez, C., Banks, C.E., 2011. An overview of quantifying and screening
drugs of abuse in biological samples: Past and present. Anal. Methods 3,
1227–1245.
Lopez‐Ruiz, N., Curto, V.F., Erenas, M.M., Benito‐Lopez, F., Diamond, D., Palma,
A.J., Capitan‐Vallvey, L.F., 2014. Smartphone‐based simultaneous pH and
nitrite colorimetric determination for paper microfluidic devices. Anal.
Chem. 86, 9554–9562.
Löttersy, J.C., lthuis, W.O., Veltink, P.H., Bergveld, P., 1997. The mechanical
properties of the rubber elastic polymer polydimethylsiloxane for sensor
applications. J. Micromech. Microeng. 7, 145–147.
Lynch, J.M., Barbano, D.M., Fleming, J.R., 1998. Indirect and direct determination
of the casein content of milk by Kjeldahl nitrogen analysis: collaborative
study, J. AOAC Int. 81, 763–774.
Ma, K., Rivera, J., Hirasaki, G.J., Biswal, S.B., 2011. Wettability control and
patterning of PDMS using UV–ozone and water immersion. J. Colloid
Interface Sci. , 2011, 363, 371.

References
311
Ma, X.-M., Sun, M., Lin, Y., Liu, Y-J., Luo, F., Guo, L.H., Qiu, B., Lin, Z.-Y., Chen, G.-
N., 2018. Progress of visual biosensor based on gold nanoparticles.
Chinese J. Anal. Chem. 46, 1-10.
Ma, Y., Niu, H., Zhang, X., Cai, Y., 2011. One-step synthesis of silver/dopamine
nanoparticles and visual detection of melamine in raw milk. Analyst 136,
4192-4196.
Maddah, B., Alimardani, V., Moradifard, H., 2015. A simple colorimetric kit for
determination of ketamine hydrochloride in water samples. Anal.
Methods 7, 10364–10370.
Manbohi, A., Ahmadi, S.H., 2015. In-tube magnetic solid phase microextraction of
some fluoroquinolones based on the use of sodium dodecyl sulfate coated
Fe3O4 nanoparticles packed tube. Anal. Chim. Acta 885, 114-121.
Mansifield, E., Kar, A., Quinn, T.P., Hooker, S.A., 2010. Quartz crystal
microbalances for microscale thermogravimetric analysis. Anal. Chem. 82
(24), 9977-9982.
Marti-Gastaldo, C., Warren, J. E., Stylianou, K. C., Flack, N. L. O., Rosseinsky, M. J.,
2012. enhanced stability in rigid peptide‐based porous materials. Angew.
Chem. Int. Ed. 51, 11044-11048.
Martí-Gastaldo, C., Antypov, D., Warren, J. E., Briggs, M. E., Chater, P. A., Wiper,
P.V., Miller, G.J., Khimyak, Y. Z., Darling, G.R., Berry, N.G., Rosseinsky,
M.J., 2014. Side-chain control of porosity closure in single- and multiple-
peptide-based porous materials by cooperative folding. Nat. Chem. 6, 343-
351.
Martí-Gastaldo, C., Warren, J. E., Briggs, M. E., Armstrong, J. A., Thomas, K. M.,
Rosseinsky, M. J., 2015. Sponge‐Like behaviour in isoreticular Cu(Gly‐His‐X)
peptide‐based porous materials. Chem. - Eur. J. 2015, 21, 16027-16034.
Martínez-Carballo, E., Sitka, A., Gónzalez-Barreiro, C., Kreuzinger, N., Fürhacker,
M., Scharf, S., Gans, O., 2007. Determination of selected
quaternaryammonium compounds by liquid chromatography with mass

References
312
spectrometry. Part I. Application to surface, waste and indirect discharge
water samples in Austria. Environ. Pollut. 145, 489–496.
Masià, A., Moliner-Martínez, Y., Muñoz-Ortuño, M., Picó, Y., Campíns-Falcó, P.,
2013. Multiresidue analysis of organic pollutants by in-tube solid phase
microextraction coupled to ultra-high performance liquid-
chromatography-electrospray-tandem mass spectrometry, J. Chromatogr.
A 1306, 1-11.
Masson, J.F., 2017. Surface Plasmon Resonance Clinical Biosensors for Medical
Diagnostics. ACS Sens. 2 (1), 16–30.
Mauriz, E., Calle, A., Lechuga, L.M., Quintana, J., Montoya, A., Manclús, J.J., 2006.
Real‐time detection of chlorpyrifos at part per trillion levels in ground,
surface and drinking water samples by a portable surface plasmon
resonance immunosensor. Anal. Chim. Acta. 561, 40–47.
Medesi, A., Greiner, T., Benkler, M., Megnin, C., Henemann, T., 2014. Low
temperature sintering of PZT. J. Phys.: Conf. Ser. 557(1), 122132-122138.
Mei, H., Quan, Y., Wang, W., Zhou, H., Liu, Z., Shi, H., & Wang, P., 2016 .
Determination of diphenylamine in gunshot residue by HPLC-MS/MS. J.
Forensic Sci. Med. 2(1), 18.
Mei, M., Huang, X., Luo, Q., Yuan, D., 2016. Magnetism-enhanced monolith-based
in-tube solid phase microextraction. Anal. Chem. 88, 1900-1907.
Mei, M., Huang, X., 2017. Online analysis of five organic ultraviolet filters in
environmental water samples using magnetism-enhanced monolith-
based in-tube solid phase microextraction coupled with high-
performance liquid chromatography. J. Chromatogr. A 1525, 1-9.
Meng, L., Meng, P., Zhang, Q., Wang, Y., 2013. Fast screening of ketamine in
biological samples based on molecularly imprinted photonic hydrogels.
Anal. Chim. Acta 771, 86–94.

References
313
Meng, P., Wang, Y., 2010. Small volume liquid extraction of amphetamines in saliva. Forensic Sci. Int. 197, 80–84.
Meng, Q., Han, T., Wang, G., Zheng, N., Cao, C., Xie, S., 2014. Preparation of a
natural dye doped Ormosil coating for the detection of formaldehyde in
the optical gas sensor. Sensor Actuat. B-Chem. 196, 238-244.
Míguez-Framil, M., Moreda-Pineiro, A., Bermejo-Barrera, P., Álvarez-Freire, I.,
Tabernero, M.J., Bermejo, A.M., 2010. Matrix solid-phase dispersion on
column clean-up/pre-concentration as a novel approach for fast isolation
of abuse drugs from human hair. J. Chromatogr. A 1217 (41), 6342-6349.
Míguez-Framil, M., Moreda-Piñeiro, A., Bermejo-Barrera, P., Cocho, J.A.,
Tabernero, M.J., Bermejo, A.M., 2011. Electrospray ionization tandem
mass spectrometryfor the simultaneous determination of opiates and
cocaine in human hair. Anal. Chim. Acta 704, 123–132.
Míguez-Framil, M., Cobarcos, P., Tabernero, M.J., Bermejo, A.M., Bermejo-
Barrera, P., Moreda-Piñeiro, A., 2013. Matrix solid phase dispersion
assistedenzymatic hydrolysis as a novel approach for cacaine and opiates
isolation from human hair. J. Chromatogr. A 1316, 15–22.
Mizuno, K., Kataoka, H., 2015. Analysis of urinary 8-isoprostane as an oxidative
stress biomarker by stable isotope dilution using automated online in-tube
solid-phase microextraction coupled with liquid chromatography-tandem
mass spectrometry, J.Pharm. Biomed. Anal. 112 (82015), 36-42.
Moliner-Martínez, Y., Campíns-Falcó, P., Herráez-Hernández, R., 2004. A method
for the determination of dimethylamine in air by collection on solid
support sorbent with subsequent derivatization and spectrophotometric
analysis, J. Chromatogr. A 1059, 17–24.
Moliner-Martínez, Y., Herráez-Hernández, R., Molins-Legua, C., Campíns-Falcó, P.,
2010. Improving analysis of apolar organic compounds by the use of a
capillary titania-based column: application to the direct determination of
faecal sterols, cholesterol and coprostanol in wastewater samples. J.
Chromatogr. A 1217, 4682-4687.

References
314
Moliner-Martínez, Y., Molins-legua, C., Verdú-Andrés, J., Herráez-Hernández, R.,
Campíns-Falcó, P., 2011. Advantages of monolithic over particulate
columns for multiresidue analysis of organic pollutants by in-tube solid
phase microextraction coupled to capillary liquid chromatography. J.
Chromatogr. A 1218, 6256-6262.
Moliner-Martínez, Y., González-Fuenzalida, R.A., Herráez-Hernández, R., Campíns-
Falcó, P., Verdú-Andrés, J., 2012a. Cleaning sorbents used in matrix solid-
phase dispersion with sonication: Application to the estimation of
polycyclic aromatic hydrocarbons at ng/g levels in marine sediments. J
Chromatogr. A 1263, 43– 50.
Moliner-Martínez, Y., Prima-García, H., Ribera, A., Coronado, E., Campíns-Falcó, P.,
2012b. Magnetic in-tube solid phase microextraction. Anal. Chem. 84,
7233-7240.
Moliner-Martínez, Y., Vitta, Y., Prima-Garcia, H., Gonzalez-Fuenzalida, R.A., Ribera,
A., Campíns-Falcó, P., Coronado, E., 2014a. Silica supported Fe3O4
magnetic nanoparticles for magnetic solid-phase extraction and in-tube
solid phase microextraction: application to organophosphorous
compounds. Anal. Bioanal. Chem. 406, 2211-2215.
Moliner-Martínez, Y., Muñoz-Ortuño, M., Herráez-Hernández, R., Campíns- Falcó,
P., 2014b. Rapid analysis of effluents generated by the dairy industry for
fat determination by preconcentration in nylon membranes and
attenuated total reflectance infrared spectroscopy measurement. Talanta
119, 11–16.
Moliner-Martínez, Y., Herráez-Hernández, R., Verdú-Andrés, J., Molins-Legua, C.,
Campíns-Falcó, P., 2015a. Recent advances of in-tube solid-phase
microextraction, Trends Anal. Chem. 71, 205-213.
Moliner-Martínez, Y., Serra-Mora, P., Verdú-Andrés, J., Herráez-Hernández, R.,
Campíns-Falcó, P., 2015b. Analysis of polar triazines and degradation
products in waters by in-tube solid-phase microextraction and capillary
chromatography: an environmentally friendly method, Anal. Bioanal.
Chem. 407, 1485-1497.

References
315
Mondin, A., Bogialli, S., Venzo, A., Favaro, G., Badocco, D., Pastore, P., 2014.
Characterization and quantification of N-(3-aminopropyl)-N-dodecyl-1,3-
propanediamine biocide by NMR, HPLC/MS and titration techniques.
Chemosphere 95, 379–386.
Monoudis, P.N., Tsakalof, A., Karapanagiotis, I., Zubirtikudis, I., Pnayiotuou, C.,
2009. Fabrication of super-hydrophobic surfaces for enhanced stone
protection. Surf. Coat. Technol. 203, 1322–1328.
Morelato, M., Beavis, A., Ogle, A., Doble, P., Kirkbride, P., Roux, C., 2012.
Screening of gunshot residues using desorption electrospray ionisation-
mass spectrometry (DESI-MS). Forensic Sci. Int., 217(1-3), 101–106.
Morris, J.A., 2007. Modified cobalt thiocyanate presumptive color test for
ketamine hydrochloride. J. Forensic Sci. 52, 84–87.
Mullet, W.M., Levsen, K., Borlak, J., Wu, J.C., Pawliszyn, J., 2002. Automated in-
tube solid phase microextraction coupled with HPLC for the determination
of N-nitrosamines in cell cultures. Anal. Chem. 74, 1695-1701.
Muñoz-Ortuño, M., Moliner-Martínez, Y., Cogollos-Costa, S., Herráez-Hernández,
R., Campíns-Falcó, P., 2012. A miniaturized method for estimating di-(2-
ethylhexyl)phthalate in bivalves as bioindicators. J. Chromatogr. A 1260,
169-173.
Muñoz-Ortuño, M., Argente-García, A., Moliner-Martínez, Y., Verdú-Andrés, J.,
Herráez-Hernández, R., Picher, M.T., Campíns-Falcó, P., 2014. A cost-
effective method for estimating di(2-ethylhexyl)phthalate in coastal
sediments. J. Chromatogr. A. 1324, 57– 62.
Muñoz-Ortuño, M., Argente-García, A., Moliner-Martínez, Y., Molins-Legua, C.,
Campíns-Falcó, P., 2015. Polydimethylsiloxane composites containing 1,2-
naphtoquinone-4-sulphonate as unique dispositive for estimation of
casein in effluents from dairy industries. Anal. Chim. Acta 873, 31–37.

References
316
Musile, G., Wang, L., Bottoms, J., Tagliarob, F., McCord, B., 2015. The
development of paper microfluidic devices for presumptive drug
detection. Anal. Methods. 7, 8025–8033.
Navarro-Sáchez, N., Argente-García, A., Moliner-Martínez, Y., Roca-Sanjuán, D.,
Antypov, D., Campíns-Falcó, P., Rosseinsky, M.J., Martí-Gastaldo, C., 2017.
Peptide Metal−Organic Frameworks for enantioselective separation of
chiral drugs J. Am. Chem. Soc. 139, 4294−4297.
Nazari, A.M., Miri, A.K., Shinozaki, D.M., 2016. Mechanical characterization of
nanoclay‐filled PDMS thin films. Polym. Test. 52, 85–88.
Net, S., Delmont, A., Sempéré, R., Paluselli, A., Ouddane, B., 2015. Reliable
quantification of phthalates in environmental matrices (air, water, sludge,
sediment and soil): A review. Sci. Total Environ. 515, 162-180.
Ngom, B., Guo, Y., Wang, X., Bi, D., 2010. Development and application of lateral
flow test strip technology for detection of infectious agents and chemical
contaminants: a review. Anal. Bioanal. Chem., 397, 1113-1135.
Nguyen, T.A.H., Pham, T.N.M., Ta, T.T., Nguyen, X.T., Nguyen, T.L., Le, T.H.H.,
Koenka, I.J., Saiz, J., Hauser, P.C., Mai, T.D., 2015. Screening determination
of four amphetamine-type drugs in street-grade illegal tablets and urine
samples by portable capillary electrophoresis with contactless conductivity
detection. Sci. Justice 55, 481-486.
Nightingale, A.M., Beaton, A.D., Mowlem, M.C., 2015. Trends in microfluidic
systems for in situ chemical analysis of natural waters. Sensors Actuators B
Chem. 221, 1398–1405.
Niu, H., Wang, S., Zhou, Z., Ma, Y., Ma, X., Cai, Y., 2014. Sensitive Colorimetric
Visualization of Perfluorinated Compounds Using Poly(ethylene glycol) and
Perfluorinated Thiols Modified Gold Nanoparticles. Anal. Chem. 86 (9),
4170–4177.
Nonaka, Y., Saito, K., Hanioka, N., Narimatsu, S., Kataoka, H., 2009. Determination
of aflatoxins in food samples by automated on-line in-tube solid-phase

References
317
microextraction coupled with liquid chromatographyemass spectrometry,
J. Chromatogr. A 1216, 4416-4422.
Nowack, N., Krug, H. F., Height, M., 2011. 120 Years of nanosilver history:
implications for policy makers. Environmental Science and Technology 45,
1177–1183.
Nugent, P., Burd, S. D., Forrest, K., Pham, T., Ma, S., Space, B., Wojtas, L.,
Eddaoudi, M., Zaworotko, M.J., 2013. Porous materials with optimal
adsorption thermodynamics and kinetics for CO2 separation. Nature, 495,
80-84.
Oelschlaeger, C., Willenbacher, N., 2012. Mixed wormlike micelles of
cationicsurfactants: effect of the cosurfactant chain length on the bending
elasticityand rheological properties. Colloid Surf. A 406, 31–37.
Oftedal, O.T., Eisert, R., Barrel, G.K., 2014. Comparison of analytical and predictive
methods for water protein, fat, sugar, and gross energy in marine mammal
milk. J. Dairy Sci. 97, 4713–4732.
Ogirala, T., Eapen, A., Salvante, K.G., Rapaport, T., Nepomnaschy, P.A.,
Parameswaran, A.M., 2017. Smartphone‐based colorimetric ELISA
implementation for determination of women’s reproductive steroid
hormone profiles, Med. Biol. Eng. Comput. 55(10), 1735-1741.
On, D. T., Kaliaguine, S., 2003. Zeolite-Coated Mesostructured Cellular Silica
Foams, J. Am. Chem. Soc.. 125 (3), 618-619.
Oncescu, V., O’Dell, D., Erickson, D., 2013. Smartphone based health accessory for
colorimetric detection of biomarkers in sweat and saliva, Lab Chip. 13,
3232–8.
Oommen, Z., Pierce, S. M., 2006. Lead-free primer residues: A qualitative
characterization of Winchester WinCleanTM, Remington/UMC
LeadLessTM, Federal BallistiCleanTM, and Speer Lawman Clean Fire TM
handgun ammunition. J. Forensic Sci. 51(3), 509–519.

References
318
Ornatska, M., Sharpe, E.M., Andreescu, D., Andreescu, S., 2011. Paper bioassay
based on ceria nanoparticles as colorimetric probes. Anal.Chem. 83, 4273–
4280.
Pandey, S.K., Kim, K.H., Tang, K.T., 2012. A review of sensor‐based methods for
monitoring hydrogen sulfide. TrAC ‐ Trends Anal. Chem. 32, 87–99.
Park, I.S., Heo, E., Nam, Y.S., Lee, C.W., Kim, J.M., 2012. Colorimetric detection of
aliphatic primary amines and a molecular logic gate based on a
photochromic phenoxyquinone derivative. J. Photochem. Photobiol.
AChem. 238, 1–6.
Park, Y.W., Juárez, J., Ramos, M., Haenlein, G.F.W., 2007. Physico-chemical
characteristics of goat and sheep milk. Small Ruminant Res. 68, 88–113.
Pena-Pereira, F., Villar-Blanco, L., Lavilla, I., Bendicho, C., 2018. Test for arsenic
speciation in waters based on a paper-based analytical device with
scanometric detection. Anal. Chim. Acta. 1011, 1-10.
Peng, L.Q., Yi, L., Yang, Q.C., Cao, Jun., Du, L.J., Zhang, Q.D., 2017. Graphene
nanoplatelets based matrix solid-phase dispersion microextraction for
phenolic acids by ultrahigh performance liquid chromatography with
electrochemical detection. Sci. Rep. 7, 7496-7508.
Peng, X.-T., Shi, Z.-G., Feng, Y.-Q., 2011. Rapid and high-throughput determination
ofcationic surfactants in environmental water samples by automated on-
linepolymer monolith microextraction coupled to high performance
liquidchromatography–mass spectrometry. J. Chromatogr. A 1218, 3588–
3599
Pérez-López, B., Merkoçi, A., 2011. Magnetic nanoparticles modified with carbon
nanotubes for electrocatalytic magnetoswitchable biosensing applications.
Adv. Funct. Mater. 21, 255-260.
Peters, K.L., Corbin, I., Kaufman, L.M., Zreibe, K., Blanes, L., McCord, B.R., 2015.
Simultaneous colorimetric detection of improvised explosive compounds

References
319
using microfluidic paper-based analytical devices (mu PADs). Analytical
Methods, 7, 63- 70.
Picó, Y., Molto, J.C., Manes, J., Font, G., 1994. Solid-phase techniques in the
extraction of pesticides and related-compounds from foods and soils. J
Microcolumn. 6, 331–59.
Picó, Y., Fernández, M., Ruiz, M.J., Font, G., 2007. Current trends in solid-phase-
based extraction techniques for the determination of pesticides in food
and environment. J. Biochem. Biophys. Methods. 70, 117–131.
Pierri, G., Kotoni, D., Simone, P., Villani, C., Pepe, G., Campiglia, P., Dugo, P.,
Gasparrini, F., 2013. Analysis of bovine milk caseins on organic monolithic
columns: an integrated capillary liquid chromatography–high resolution
mass spectrometry approach for the study of time-dependent casein
degradation. J. Chromatogr. A 1313, 259–269.
Piette, V., Parmentier, F., 2002. Analysis of illicit amphetamine seizures by
capillary zone electrophoresis. J. Chromatogr. A 979, 345-352.
Pla-Tolós, J., Moliner-Martínez, Y., Molins-Legua, C., Herráez-Hernández, R.,
Verdú-Andrés, J., Campíns-Falcó, P., 2015, Selective and sensitive method
based on capillary liquid chromatography with in-tube solid phase
microextraction for determination of monochloramine in water. J.
Chromatogr. A 1388, 17-23.
Pla-Tolós, J., Serra-Mora, P., Hakobyan, L., Molins-Legua, C., Moliner-Martínez, Y.,
Campins-Falcó, P., 2016a. A sustainable on-line CapLC method for
quantifying antifouling agents like irgarol-1051 and diuron in water
samples: estimation of the carbon footprint. Sci. Total Environ. 569-570,
611-618.
Pla-Tolós, J., Moliner-Martinez, Y., Molins-Legua, C., Campins-Falcó, P., 2016b.
Colorimetic biosensing dispositive based on reagentless hybrid
biocomposite: application to hydrogen peroxide determination, Sens.
Actuators B Chem. 231, 837-846.

References
320
Pla-Tolós, J., Moliner-Martinez, Verdú-Andrés, J., Casanova-Cháfer, J., Molins-
Legua, C., Campins-Falcó, P., 2016c. New optical paper sensor for in situ
measurement of hydrogen sulphide in waters and atmospheres. Talanta
156-157, 79-86.
Pla-Tolós, J., Moliner-Martínez, Y., Molins-Legua, C., Campins-Falcó, P., 2018. Solid
glucose biosensor integrated in a multi-well microplate coupled to a
camera-based detector: Application to the multiple analysis of human
serum samples. Sens. Actuators, B. 258, 331-341.
Prieto-Blanco, M.C., López-Mahía, P., Prada-Rodríguez, D., 1999. Analysis of
residualproducts in benzalkonium chloride by high-performance liquid
chromatography. J. Chromatogr. Sci. 37, 295–299.
Prieto-Blanco, M.C., Cháfer-Pericás, C., López-Mahía, P., Campíns-Falcó, P., 2008.
Automated on-line in tube solid-phase microextraction-assisted
derivatization coupled to liquid chromatography for quantifying residual
dimethylamine in cationic polymers. J. Chromatogr. A 1188, 118-123.
Prieto-Blanco, M. C., López-Mahía, P., Campins-Falcó, P., 2009a. In-tube solid-
phase microextraction and liquid chromatography using monolithic
column for the selective determination of residual ethylenediamine in
industrial cationic polymers. Analytical Chemistry 81, 5827–5832.
Prieto-Blanco, M.C., López-Mahía, P., Prada-Rodríguez, D., 2009b. Analysis of
residualproducts in benzyl chloride used for the industrial synthesis of
quaternarycompounds by liquid chromatography with diode-array
detection. J.Chromatogr. Sci. 47, 121–126.
Prieto-Blanco, M.C., López-Mahia, P., Campíns-Falcó, P., 2011. On-line analysis of
carbonyl compounds with derivatization in aqueous extracts of
atmospheric particulate PM10 by in-tube solid phase microextraction
coupled to capillary liquid chromatography. J. Chromatogr. A 1218, 4834-
4839.
Prieto-Blanco, M.C., Moliner-Martinez, Y., Lopez-Mahia, P., Campíns-Falcó, P.,
2012. Ion pair in-tube solid-phase microextraction and capillary liquid

References
321
chromatography using titania-based column: application to the specific
lauralkonium chloride determination in water. J. Chromatogr. A 124, 55-
59.
Prieto-Blanco, M.C., Moliner-Martínez, Y., Campíns-Falcó, P., 2013a. Combining
poly(dimethyldiphenylsiloxane) and nitrile phases for improving the
separation and quantification of benzalkonium chloride homologues: in-
tube solid phase microextraction- capillary liquid chromatography-diode
array detection-mass spectrometry for analyzing industrial samples. J.
Chromatogr. A 1297, 226-230.
Prieto-Blanco, M.C., Moliner-Martínez, Y., López-Mahia, P., Campíns-Falcó, P.,
2013b, Determination of carbonyl compounds in particulate matter PM2.5
by in-tube solid phase microextraction coupled to capillary liquid
chromatography/mass spectrometry. Talanta 115, 876-880.
Prieto-Blanco, M.C., Jornet-Martínez, N., Moliner-Martínez, Y., Molins-Legua, C.,
Herráez-Hernández, R., Verdú Andrés, J., Campíns-Falcó, P., 2015.
Development of a Polydimethylsiloxane-Thymol/Nitroprusside Composite
Based Sensor Involving Thymol Derivatization for Ammonium Monitoring
in Water Samples, Sci. Total Environ. 150, 503–504.
Prieto-Blanco, M.C., Argente-García, A., Campíns-Falcó, P., 2016. A capillary liquid
chromatography method for benzalkonium chloride determination as a
component or contaminant in mixtures of biocides. J. Chromatogr A. 1431,
176–183.
Pyrzynska, K., 2011. Carbon nanotubes as sorbent in the analysis of pesticides.
Chemosphere 83, 1407–1413.
Qin, Y., Wang, Y., Wang, H., Gao, J., Qu, Z., 2013. Effect of morphology and pore
structure of SBA-15 on toluene dynamic adsorption/desorption
performance. Procedia Environ. Sci. 18, 366-371.
Quan-Min, L., Zhan-Jun, Y., 2007. Spectrophotometric determination of
aminomethylbenzoic acid using sodium 1,2-naphthoquinone-4-sulfonate

References
322
as the chemical derivative chromogenic reagent. Spectrochim. Acta Part A
66, 656-661.
Rabone, J., Yue, Y. F., Chong, S., Stylianou, K., Bacsa, J., Bradshaw, D., Darling, G.R.,
Berry, N. G., Khimyak, Y. Z., Ganin, A. Y., Wiper, P., Claridge, J. B.,
Rosseinsky, M. J., 2010. An adaptable peptide-based porous material.
Science 329, 1053-1057.
Ramirez-Palomino, P., Fernandez-Romero, J.M., Gomez-Hens, A., 2014. Rapid
chromatographic determination of caseins in milk with photometric and
fluorimetric detection using a hydrophobic monolithic column. Food
Chem. 142, 249–254.
Ramos, L., 2012. Critical overview of selected contemporary sample preparation
techniques. J. Chromatogr. A 1221, 84-98.
Ravelo-Pérez, L.M., Herrera-Herrera, A.V., Hernández-Borges, J., Rodríguez-
Delgado, M.A., 2010. Carbon nanotubes: Solid-phase extraction. J.
Chromatogr. A 1217(16), 2618-2641.
Ridgway, K., Lalljie, S.P.D., Smith, R.M., 2007. Sample preparation techniques for
the determination of trace residues and contaminants in foods. J.
Chromatogr. A 1153, 36–53.
Roda, A., Michelinia, E., Zangheria, M., Fuscoa, M.D., Calabria, D., Simonic, P.,
2016. Smartphone-based biosensors: a critical review and perspectives.
TrAC Trends Anal.Chem. 79, 317-325.
Rosolina, S. M., Carpenter, T.S., Xue, Z.L., 2016. Bismuth-Based, Disposable Sensor
for the Detection of Hydrogen Sulfide Gas. Anal. Chem. 88 (3), 1553–1558.
Saha, K., Agasti, S.S., Kim, C., Li, X., Rotello, V.M., 2012. Gold nanoparticles in
chemical and biological sensing. Chem. Rev. 112, 2739.
Sachdev, D., Kumar, V., Maheshwari, P.H., Pasricha, R., Deephti, Baghel, N., 2016.
Silver based nanomaterial, as a selective colorimetric sensor for visual
detection of post harvest spoilage in onion. Sensor Actuat. B 228, 471-479.

References
323
Saito, K., Yagi, K., Ishizaki, A., Kataoka, H., 2010. Determination of anabolic
steroids in human urine by automated in-tube solid-phase microextraction
coupled with liquid chromatography-mass spectrometry, J. Pharm.
Biomed. Anal. 52, 727-733.
Saito, K., Ikeuchi, R., Kataoka, H., 2012. Determination of ochratoxins in nuts and
grain samples by in-tube solid-phase microextraction coupled with liquid
chromatography-mass spectrometry, J. Chromatogr. A 1220, 1-6.
Salako, N.O., Philip, L., 2011. Comparison of the use of the Halimeter and the Oral
Chroma™ in the assessment of the ability of common cultivable oral
anaerobic bacteria to produce malodorous volatile sulfur compounds from
cysteine and methionine. Med Princ Pract. 20 (1), 75-79.
Salehnia, F., Hosseini, M., Ganjalia, M.R., 2018. Enhanced
electrochemiluminescence of luminol by an in situ silver nanoparticle-
decorated graphene dot for glucose analysis . Anal. Methods 10, 508-514.
Santos Barreto, A., de Cassia de Silva Andrade, P., Meira Farias, J., Menezes Filho,
A., Fernandes de Sa, G., Alves Junior, S., 2018. Characterization and
application of a lanthanide-based metal-organic framework in the
development and validation of a matrix solid-phase dispersion procedure
for pesticide extraction on peppers (Capsicum annuum L.) with gas
chromatography-mass spectrometry. J Sep Sci. 41 (7), 1593-1599.
Saraz, J.A.O., Tinoco, I.F.F., Gates, R.S., Rocha, K.S.O., Marín, L.Z., 2015. A simple
methodology to measure ammonia flux generated in naturally ventilated
poultry houses, Rev. Colomb. Ciencias Pecu. 28, 3–12.
Saroj, S., Rajput, S.J., 2018. Tailor made pH sentitive polyacrylic acid functionalized
mesoporous silica nanoparticles for efficient and controlled delivery of
anticancer drug Etoposide. Drug Dev. Ind. Pharm. 44 (7), 1198-1211.
Scherperel, G., Reid, G. E., Waddell Smith, R., 2009. Characterization of smokeless
powders using nanoelectrospray ionization mass spectrometry (nESI-MS).
Anal. Bioanal. Chem. 394(8), 2019–2028.

References
324
Schettler, T., 2006. Human exposure to phthalates via consumer products. Int. J.
Androl. 29, 134-139.
Schliemann, S., Zahlten, A., Krautheim, A., Elsner, P., 2010. Occupational allergic
contact dermatitis caused by N-(3-aminopropyl)-N-dodecylpropane-1,3-
diamine in a surface disinfectant. Contact Dermat. 63, 290–291.
Schmidt-Winkel, P., Lukens, W.W., Zhao, D., Yang, P., Chmelka, B.F., Stucky, G.D.,
1999. Mesocellular Siliceous Foams with Uniformly Sized Cells and
Windows. J. Am. Chem. Soc, 21 (1), 254-255.
Schneider, R.C., Kovar, K.A., 2003. Analysis of ecstasy tablets: comparison of
reflectance and transmittance near infrared spectroscopy. Forensic Sci.
Int. 134, 187-197.
Seethapathy, S., Górecki, T., 2012. Applications of polydimethylsiloxane in
analytical chemistry: A review. Anal. Chim. Acta 750, 48-62.
Selvam P., Bhatia, S.K., Sonwane, C.G., 2001. Recent advances in processing and
characterization of periodic mesoporous MCM-41 silicate molecular
sieves. Ind. Eng. Chem. Res. 40, 3237-61.
Serra-Mora, P., Jornet-Martínez, N., Moliner-Martínez, Y., Campins-Falcó, P.,
2017. In tube-solid phase microextraction-nano liquid chromatography:
Application to the determination of intact and degraded polar triazines in
waters and recovered struvite. J. Chromatogr. A 1513, 51-58.
Sharma, S., Tolley, L.T., Tolley, H.D., Plistil, A., Stearns, S.D., Lee, M.L., 2015. Hand-
portable liquid chromatographic instrumentation. J. Chromatogr. A1421,
38–47.
Shamsayei, M., Yamini, Y., Asiabi, H., Safari, M., 2018. On-line packed magnetic in
tube solid phase microextraction of acidic drugs such as naproxen and
indomethacin by using Fe3O4@SiO2@layered double hydroxide
nanoparticles with high anion exchange capacity. Microchim. Acta. 185(3),
192-202.

References
325
Sheikhaleh, A., Abedi, K., Jafari, K., 2017. An Optical MEMS Accelerometer Based
on a Two-Dimensional Photonic Crystal Add-Drop Filter. J. Light. Technol.
35 (14), 3029-3034.
Shih, Y.H., Wang, K.Y., Singco, B., Lin, C.H., Huang, H.Y., 2016. Metal
Organic Framework-Polymer Composite as a Highly Efficient Sorbent for
Sulfonamide Adsorption and Desorption: Effect of Coordinatively
Unsaturated Metal Site and Topology. Langmuir 32 (44), 11465-11473.
Shrivas, K., Nirmalkar, N., Thakur, S.S., Deb, M.K., Shinde, S.S., Shankar, R., 2018.
Sucrose capped gold nanoparticles as a plasmonic chemical sensor based
on non-covalent interactions: Application for selective detection of
vitamins B1 and B6 in brown and white rice food samples. Food Chem.
250, 14-21.
Sicard, C., Glen, C., Aubie, B., Wallace, D., Jahanshahi‐Anbuhi, S., Pennings, K.,
Daigger, G.T., Pelton, R., Brennan, J.D., Filipe, C.D.M., 2015. Tools for
water quality monitoring and mapping using paper‐based sensors and cell
phones. Water Res. 70, 360–369.
Smith, J.E., Griffin, D.K., Leny, J.K., Hagen, J.A., Chávez, J.L., Kelley-Loughnane, N.,
2014. Colorimetric detection with aptamer-gold nanoparticle conjugates
coupled to an android-based color analysis application for use in the field.
Talanta. 121, 247-255.
Smith, J.P., Sutcliffe, O.B., Banks, C.E., 2015. An overview of recent developments
in the analytical detection of new psychoactive substances (NPSs). Analyst
140, 4932–4948.
Smith, P.A., 2012. Person-portable gas chromatography: rapid temperature
program operation through resistive heating of columns with inherently
low thermal mass properties. J. Chromatogr. A 1261, 37–45.
Soga, T., Jimbo, Y., Suzuki, K., Citterio, D., 2013. Inkjet-Printed Paper-Based
Colorimetric Sensor Array for the Discrimination of Volatile Primary
Amines. Anal. Chem. 85 (19), 8973–8978.

References
326
Song, X.Y., Ha, W., Chen, J., Shi, Y.P., 2014. Application of beta-cyclodextrin-
modified, carbon nanotubereinforced hollow fiber to solid-phase
microextraction of plant hormones. J. Chromatogr. A 1374, 23–30.
Souza, I.D., Melo, L.P., Jardim, I.C.S.F., Monteiro, J.C.S., Nakano, A.M.S., Queiroz,
M.E.C., 2016. Selective molecularly imprinted polymer combined with
restricted access material for in-tube SPME/UHPLC-MS/MS of parabens in
breast milk samples. Anal. Chim. Acta 932, 49-59.
Souza Caldas, S., Meira Soares, B., Abreu, F., Braga Castro, I., Fillmann, G.,
Gilberto Primel, E., 2018. Antifouling booster biocide extraction from
marine sediments: a fast and simple method based on vortex-assisted
matrix solid-phase extraction. Environ. Sci. Pollut. Res. Int. 25, 7553-7565.
Srinives, S., Sarkar, T., Mulchandani, A., 2014. Primary amine-functionalized
polyaniline nanothin film sensor for detecting formaldehyde. Sens.
Actuator B-Chem. 194, 255-259.
Stankova, N.E., Atanasov, P.A., Nikov, R.G., Nikov, R.G., Nedyalkov, N.N.,
Stoyanchov, T.R., Fukata, N., Kolev, K.N., Valova, E.I., Georgieva, J.S.,
Armyanov, S.A., 2015. Optical properties of polydimethylsiloxane (PDMS)
during nanosecond laser processing. Appl. Surf. Sci. 374, 96–103.
Stassi, S., Cauda, V., Fiorilli, S., Ricciardi, C., 2015. Surface area enhancement
by mesoporous silica deposition on microcantilever sensors for small
molecule detection. J. Mater. Chem. C. 3, 12507-12513.
Steinhauer, T., Kulozik, U., Gebhardt, R., 2014. Structure of milk protein deposits
formed by casein micelles and β-lactoglobulin during frontal
microfiltration. J. Memb. Sci. 468, 126-132.
Stewart, M.E., Anderton, C.R., Thompson, L.B., Maria, J., Gray, S.K., Rogers, J.A.,
Nuzzo, R.G., 2008. Nanostructured plasmonic sensors, Chem. Rev. 108,
494–521.
Stumr, F., Gabrovska, D., Rvsova, J., Hanak, P., Plicka, J., Tomkova, K., Dvorska, P.,
Cuhra, P., Kubik, M., Barsova, S., Karsulinova, L., Bulawova, H., Brychta, J.,
References
327
Yman, I.M., 2010. ELISA kit for casein determination: interlaboratory
study. J. AOAC Int. 93, 676–682.
Su, K., Zou, Q., Hu, N., Wang, P., 2015. High‐sensitive and high‐efficient
biochemical analysis method using a bionic electronic eye in combination
with a smartphone‐based colorimetric reader system, Sensors Actuators B
Chem. 216, 134–140.
Su, K., Qiu, X., Fang, F., Zou, Q., Wang, P., 2017. An improved efficient biochemical
detection method to marine toxins with a smartphone‐based portable
system‐Bionic e‐Eye, Sensors Actuators, B Chem. 238, 1165–1172.
Suarez, F.L., Furnel, J.K., Springfield, J., Levittl, M.D., 2000. Morning Breath Odor:
Influence of Treatments on Sulfur Gases. J Dent Res 79(10), 1773-1777.
Sun, M., Feng, J., Bu, Y., Luo, C., 2015. Nanostructured-silver-coated
polyetheretherketone tube for online in-tube solid-phase microextraction
coupled with high-performance liquid chromatography. J. Sep. Sci. 38,
3239-3246.
Tabernero, M.J., Felli, M.L., Bermejo, A.M., Chiarotti, M., 2009. Determination of
ketamine and amphetamines in hair by LC/MS/MS. Anal. Bioanal. Chem.
395, 2547–2557.
Tamayo, A., Rubio, J., 2010. Structure modification by solvent addition into TEOS/
PDMS hybrid materials. J. Non-Cryst Solids 356, 1742–1748.
Tan, F., S.H., Nguyen, N.T., Chua, Y.C., Kang, G.T., 2010. Oxygen plasma treatment
for reducing hydrophobicity of a sealed polydimethylsiloxane
microchannel. Biomicrofluidics 4, 32204-32212.
Tan, F., Zhao, C., Li, L., Liu, M., He, X., Gao, J., 2015. Graphene oxide based in-tube
solid-phase microextraction combined with liquid chromatography
tandem mass spectrometry for the determination of triazine herbicides in
water. J. Sep. Sci. 38, 2312-2319.
References
328
Tangerman, A., Winkel, E.G., 2007. Intra- and extra-oral halitosis: finding of a new
form of extra-oral blood-borne halitosis caused by dimethyl sulphide. J
Clin. Periodontol. 34(9), 748-55.
Tangerman, A., Winkel, E.G., 2008. The portable gas chromatograph
OralChroma™: a method of choice to detect oral and extra-oral halitosis. J
Breath Res. 2(1), 17010- 17017.
Tarifa, A., Almirall, J. R., 2015. Fast detection and characterization of organic and
inorganic gunshot residues on the hands of suspects by CMV-GC–MS and
LIBS. Sci. Justice 55(3), 168-175.
Tezel, U., 2009. Fate and effect of quaternary ammonium compounds in biological
systems, PhD Thesis, Georgia Institute of Technology. Atlanta, GA.
Timberlake, K.C., 1992. Chemistry, 5th ed. Haper-Collins Publishers Inc. New York.
Tong, Y., Wu, Z., Yang, C., Yu, J., Zhang, X., Yang, S., Wen, Y., 2001. Determination
of diphenylamine stabilizer and its nitrated derivatives in smokeless
gunpowder using a tandem MS method. The Analyst 126(4), 480–484.
Tomita, M., Nakashima, M.N., Wada, M., Nakashima, K , 2007. Sensitive
determination of MDMA and its metabolite MDA in rat blood and brain
microdialysates by HPLC with fluorescence detection. Biomed.
Chromatogr. 21 (10), 1016-1022.
Tsai, C.H., Xu, M.Z., Kunal, P., Trewyn, B.G., 2018. Aerobic oxidative esterification
of primary alcohols over Pd-Au bimetallic catalysts supported
on mesoporous silica nanoparticles. Catal. Today 306, 81-88.
Tsujikawa, K., Kuwayama, K., Miyaguchi, H., Kanamori, T., Iwata, Y.T., Yoshida, T.,
Inoue, H., 2008. Development of an on-site screening system for
amphetamine-type stimulant tablets with a portable attenuated total
reflection fourier transform infrared spectrometer. Anal. Chim. Acta 608,
95-103.

References
329
Turner, C., 2013. Sustainable analytical chemistry-more than just being green,
Pure Appl. Chem. 85, 2217-2229.
USEPA, 1991. National Primary Drinking Water Regulations: Federal Register, Part
12, 40 CFR Part 141, US Environmental Protection Agency.
Valcarcel, M., Cardenas, S., Simonet, B.M., Moliner-Martínez, Y., Lucena, R., 2008.
Carbon nanoestructures as sorbent materials in analytical processes. TrAC-
Trend. Anal. Chem. 27, 34–43.
Vashist, S.K., Van Oordt, T., Schneider, E.M., Zengerle, R., Von Stetten, F., Luong,
J.H.T., 2014. A smartphone‐based colorimetric reader for bioanalytical
applications using the screen‐based bottom illumination provided by
gadgets. Biosens. Bioelectron. 67, 248–255.
Vashist, S.K., Marion Schneider, E., Zengerle, R., Von Stetten, F., Luong, J.H.T.,
2015. Graphene‐based rapid and highly‐sensitive immunoassay for C‐
reactive protein using a smartphone‐based colorimetric reader, Biosens.
Bioelectron. 66, 169–176.
Verkouteren, J.R., Staymates, J.L., 2010. Reliability of ion mobility spectrometry
for qualitative analysis of complex, multicomponent illicit drug samples.
Forensic Sci. Int. 206, 190-196.
Vidal Giné, C., Ventura Vilamala, M., Fornís Espinosa, I., Gil Lladanosa, C., Calzada
Álvarez, N., Fitó Fruitós, A., Rodríguez Rodríguez, J., Domingo Salvany, A.,
de la Torre Fornell, R., 2016. Crystals and tablets in the Spanish ecstasy
market 2000-2014: are they the same or different in terms of purity and
adulteration? Forensic Sci. Int. 263, 164-168.
Vitta, Y., Moliner-Martinez, Y., Campíns-Falcó, P., Cuervo, A.F., 2010. An in-tube
SPME device for the selective determination of chlorophyll a in aquatic
systems, Talanta 82, 952-956.
Vogliardi, S., Tucci, M., Stocchero, G., Ferrara, S.D., Favretto, D., 2015. Sample
preparation methods for determination of drugs of abuse in hair samples:
a review. Anal. Chim. Acta 857, 1–27.

References
330
Wada, M., Ikeda, R., Kuroda, N., Nakashima, K., 2010. Analytical methods for
abused drugs in hair and their applications. Anal. Bioanal. Chem. 397,
1039–1067.
Wada, M., Sugimoto, Y., Crabtree, B.L., Evans, C., Montgomery, J.H., Ikeda, R.,
Kuroda, N., Nakashima, N., 2013. Simultaneous determination of
amphetamine-typesimulabnts in abusers’ hair: clinical usefulness of hair
analysis in prehospitalization for abusers. Forensic Toxicol. 31, 2–8.
Waddell-Smith, R.J.H., 2007. A review of recent advances in impurity profiling of
Illicit MDMA samples. J. Forensic Sci. 52, 1297–1304.
Wallace, J. S., 2008. Chemical Analysis of Firearms, Ammunition, and Gunshot
Residue. International Forensic Science and Investigation. CRC Press , 320.
Wan, Y., Zhao, D. Y., 2007. On the Controllable Soft-Templating Approach to
Mesoporous Silicates. Chem. Rev. 107 (7), 2821–2860.
Wang, F., Gu, Z., Lei, W., Wang, W., Xia., Hao, Q., 2014. Graphene quantum dots
as a fluorescent sensing platform for highly efficient detection of
copper(II) ions. Sens. Actuator B-Chem. 190, 516-522.
Wang, J-X., Jiang, D-Q., Gu, Z-Y., Yan, X-P., 2006. Multiwalled carbon nanotubes
coated fibers for solid phase microextraction of polybrominated diphenyl
ethers in water and milk samples before gas chromatography with
electron-capture detection. J. Chromatogr. A 1137(1), 8-14.
Wang, L.Y., Huo, M.F., Chen, Y., Shi, J.L., 2018. Iron-
engineered mesoporous silica nanocatalyst with biodegradable and
catalytic framework for tumor-specific therapy. Biomaterials. 163, 1-13.
Wang, R., Li, W., Chen, Z., 2018. Solid phase microextraction with poly(deep
eutectic solvent) monolithic column online coupled to HPLC for
determination of non-steroidal anti-inflammatory drugs. Anal. Chim. Acta
1018, 111-118.

References
331
Wang, S., Hu, S., Xu, H., 2015. Analysis of aldehydes in human exhaled breath
condensates by in- tube SPME-HPLC. Anal. Chim. Acta 900, 67-75.
Wang, T., Tong, J., Sun, M., Chen, L., 2011. Fast and selective extraction of
chloramphenicol from soil by matrix solid-phase dispersion using
molecularly imprinted polymer as dispersant. J. Sep. Sci. 34, 1886-1892.
Wang, T., Chen, Y., Ma, J., Hu, M., Li, U., Fang, J., Gao, H., 2014. A novel ionic
liquid-modified organic-polymer monolith as the adsorbent for in-tube
solid phase microextraction of acidic food additives. Anal. Bioanal. Chem.
406, 4955-4963.
Wang, T., Chen, Y., Ma, J., Qian, Q., Jin, Z., Zhang, L., Zhang, Y., 2016. Attapulgite
nanoparticles-modified monolithic column for hydrophilic in-tube solid-
phase microextraction of cyromazine and melamine. Anal. Chem. 88,
1535-1541.
Wang, T., Chen, Y., Ma, J., Jin, Z., Chai, M., Xiao, X., Zhang, L., Zhang, Y., 2018. A
polyethyleneimine-modified attapulgite as a novel solid support in matrix
solid-phase dispersion for the extraction of cadmium traces in seafood
products. Talanta. 180, 254-259.
Wang, X., Ma, Q., Li, M., Chang, C., Bai, Y., Feng, Y., Liu, H., 2013. Automated and
sensitive analysis of 28-epihomobrassinolide in Arabidopsis thaliana by on-
line polymer monolith microextraction coupled to liquid chromatography-
mass spectrometry. J. Chromatogr. A 1317, 121-128.
Wang, X., Li, X., Li, Ze., Zhang, L., Bai, Y., Liu, H., 2014. Online coupling of in-tube
solid-phase microextraction with direct analysis in real time mass
spectrometry for rapid determination of triazine herbicides in water using
carbon-nanotubes-incorporated polymer monolith. Anal. Chem. 86 (10),
4739-4747.
Wardencki, W., 2000. Sulfur Compounds: Gas Chromatography. Encyclopedia of
Separation Science. Poland, 4285.

References
332
Warren, J. E., Perkins, C. G., Jelfs, K. E., Boldrin, P., Chater, P. A., Miller,
G.J., Manning, T.D., Briggs, M.E., Stylianou, K.C., Claridge, J.B., Rosseinsky,
M.J., 2014. Shape selectivity by guest‐driven restructuring of a porous
material. Angew. Chem. 53, 4592-4596.
Wen, X. L., Jiang, L. C., Jing, H., Xi, L., Shu, T., 2008. Multi-residues of organic
pollutants in surface sediments from littoral areas of the Yellow Sea,
China. Mar. Pollut. Bull. 56, 1091-1103.
Weyerman, C., Mimoune, Y., Anglada, F., Massonet, G., Esseiva, P., Buzzini, P.,
2011. Applications of a transportable Raman spectrometer for the in situ
detection of controlled substances at border controls, Forensic Sci. Int.
209, 21-28.
Wu, F., Wang, J., Zhao, Q., Jiang, N., Lin, X., Xie, Z., Li, J., Zhang, Q., 2016.
Detection of trans-fatty acids by high performance liquid chromatography
coupled with in-tube solid-phase microextraction using hydrophobic
polymeric monolith. J Chromatogr. B Analyt. Technol. Biomed. Life Sci.
1040, 214-221.
Wu, J.C., Pawliszyn, J., 2001. Polypyrrole coated capillary coupled to HPLC for in-
tube solid phase microextraction and analysis of aromatic compounds in
aqueous samples, Anal. Chem. 73, 55-63.
Wu, S., Cai, C., Cheng, J., Cheng, M., Zhou, H., Deng, J., 2016.
Polydopamine/dialdehyde starch/chitosan composite coating for in-tube
solid-phase microextraction and in situ derivation to analysis of two liver
cancer biomarkers in human blood, Anal. Chim. Acta 935, 113-120.
Wu, Z.X., Guo, F., Huang, L., Wang, L., 2018. Electrochemical nonenzymatic sensor
based on cetyltrimethylammonium bromide and chitosan
functionalized carbon nanotube modified glassy carbon electrode for the
determination of hydroxymethanesulfinate in the presence of sulfite in
foods. Food Chem. 259, 213-218.

References
333
Xu, B., Cheng, S., Wang, X., Wang, D., Xu, L., 2015. Novel polystyrene/antibody
nanoparticle-coated capillary for immunoaffinity in-tube solid-phase
microextraction. Anal Bioanal Chem. 407(10), 2771-5.
Xu, H., Wu, J., Chen, C.H., Zhang, L., Yang, K.L., 2010. Detecting hydrogen sulfide
by using transparent polymer with embedded CdSe/CdS quantum dots.
Sens. ActuatorB – Chem. 143, 535–538.
Xu, J., Zheng, J., Tian, J., Zhu, F., Zeng, F., Su, C., Ouyang, G., 2013. New materials
in solid-phase microextraction. Trends Analyt. Chem. 47, 68-83.
Xu, P.C., Guo, S.B., Yu, H.T., Li, X.X., 2014. Mesoporous Silica Nanoparticles (MSNs)
for Detoxification of Hazardous Organophorous Chemicals. Small 10 (12),
2404-2412.
Xu, T., Xu, P., Zheng, D., Yu, H., Li, X., 2016. Metal−organic frameworks for
resonant-gravimetric detection of trace-level xylene molecules. Anal.
Chem. 88, 12234−12240.
Yambem, S.D., Timm, J., Weiss, M., Pandey, A.K., Marschall, R., 2017.
Sulfonated mesoporous silica as proton exchanging layer in solid-state
organic transistor. Adv. Electron. Mater. 3 (12), 1700316.
Yarbakht, M., Nikkhah, M., 2015. Unmodified gold nanoparticles as a colorimetric
probe for visual methamphetamine detection. J. Exp. Nanosci., 11(7), 593-
601.
Ying, L.-L., Ma, Y.-C., Xu, B., Wang, X.-H., Dong, L.-Y., Wang, D.-M., Liu, K., Xu, L.,
2017. Poly(glycidylmethacrylate) nanoparticle-coated capillary
withoriented antibody immobilization for immunoaffinity in-
tube solid phase microextraction: Preparation and characterization. J.
Chromatogr. A 1509, 1-8.
Yuan, S.-Y., Huang, I.-C., Chang, B.-V., 2010. Biodegradation of dibutyl phthalate
and di-(2-ethylhexyl) phthalate and microbial community changes in
mangrove sediment. J. Hazar. Mat. 184, 826-831.

References
334
Zarejousheghani, M., Moeder, M., Borsdorf, H., 2013. A new strategy for synthesis
of an in-tube molecularly imprinted polymer-solid phase microextraction
device: Selective off-line extraction of 4-nitrophenol as an example of
priority pollutants from environmental water samples. Analytica Chimica
Acta 798, 48-55.
Zhang, B.-T., Zheng, X., Li, H.-F., Lin, J.-M. 2013. Application of carbon-based
nanomaterials in sample preparation: a review. Anal. Chim. Acta 784, 1–
17.
Zhang, C., Suslick, K.S., 2007. Colorimetric sensor array for soft drink analysis. J.
Agric. Food Chem. 55, 237–242.
Zhang, H.-Y., Pan, H.-Q., Zhang, B.-L., Tang, J.-L., 2012. Microcantilever sensors for
chemical and biological applications in liquid. Chin. J. Anal. Chem. 40(5),
801–808.
Zhang, J., Zhang, W., Bao, T., Chen, Z., 2015. Polydopamine-based immobilization
of zeolitic imidazolate framework-8 for in-tube solid-phase
microextraction. J. Chromatogr. A 1388, 9-16.
Zhang, S., Jia, K., Wang, S., 2010. Determination of b-Carotene in Corn by in tube
SPME coupled to micro-LC. Chromatographia 72 (11), 1231-1233.
Zhang, W.P., Zhang, J., Bao, T., Zhou, W., Meng, J.W., Zheng, Z.L., 2013. Universal
multilayer assemblies of graphene in chemically resistant microtubes for
extraction. Anal. Chem. 85, 6846-6854.
Zhang, X.F., Liu, Z.G., Shen, W., Gurunathan, S., 2016. Silver Nanoparticles:
Synthesis, Characterization, Properties, Applications, and Therapeutic
Approaches. Int. J. Mol. Sci. 17(9), 1534.
Zhang, Z., Chen, Z., Wang, S., Qu, C.,Chen, L., 2014. On-Site Visual Detection of
Hydrogen Sulfide in Air Based on Enhancing the Stability of Gold
Nanoparticles. ACS Appl. Mater. Interfaces 6 (9), 6300-6307.

References
335
Zhao, W., Ali, M.M., Aguirre, S.D., Brook, M.A., Li, Y., 2008. Paper‐based bioassays
using gold nanoparticle colorimetric probes. Anal. Chem. 80 (22), 8431–
8437.
Zheng, M.-M., Ruan, G.-D., Feng, Y.-Q., 2009. Evaluating polymer monolith in-tube
solid phase microextraction coupled to liquid chromatography/quadrupole
time of flight mass spectrometry for reliable quantification and
confirmation of quinolone antibacterials in edible animal food. J.
Chromatogr. A 1216, 7510-7519.
Zheng, M.-M., Wang, S.T., Hu, W.K., Feng, Y.Q., 2010. In tube solid-phase
microextraction based on hybrid silica monolith coupled to liquid
chromatography-mass spectrometry for automated analysis of ten
antidepressants in human urine and plasma. J. Chromatogr. A 1217, 7493-
7501.
Zhu, K.Y., Leung, K.W., Ting, A.K.L., Wong, Z.C.F., Ng, W.Y.Y., Choi, R.C.Y., Dong,
T.T.X., Wang, T., Lau, D.T.W., Tsim, K.W.K., 2012. Microfluidic chip based
nano liquidchromatography coupled to tandem mass spectrometretry for
thedetermination of abused drugs and metabolites in human hair. Anal.
Bioanal.Chem. 402, 2805–2815.

336

337
ANNEX

338

339
A1. Abbreviations

340

Annex
341
A1. ABBREVIATIONS aa Aminoacid a ± sa Ordidante ± standard deviation of ordinate ACN Acetonitrile ADP N-(3-aminopropyl)-N-dodecyl-1,3-propanediamine AFM Atomic Force Microscopy AgNPs Silver nanoparticles AMP Amphetamine APTS (3-Aminopropyl)triethoxysilane AuNPs Gold nanoparticles b ± sb Slope ± standard deviation of slope BAK Benzalkonium Chloride BCA Bicinchoninic acid CapLC Capillary Liquid Chromatography CIP Cleaning In Place CMC Critical Micellar Concentration CMYK Cyan Magent Yellow Key c-MWCNTs Carboxylated multi-wall carbon nanotubes CNTs Carbon nanotubes CSPs Chiral stationary phases c-SWCNTs Carboxylated single-wall carbon nanotubes DAD Diode Array Detection DART-MS Direct analysis in real time mass spectrometry DCC Dicyclohexylcarbodiimide DEHP Di(2-ethylhexyl)phthalate DEP Diethylphtalate DBP Dibutylphtalate DI Digital image DPA Diphenylamine DR Diffuse reflectance ECHA European Chemical Agency EDTA Ethylenediamine-tetraacetic acid EDX Energy-dispersive X-ray spectroscopy EEUU United States e.g. For example (“exempli gratia”) EMCDDA European Monitoring Centre for Drugs and Drug Addiction EP Ephedrine EQS Environmental Quality Standards ETH
T4001 4-(N,N-dioctylamino)-4´-trifluoroacetylazobenzene
EU European Union FLD Fluorescence Detector FMOC 9-Fluorenylmethyl chloroformate FMOC-L-Pro 9-Fluorenylmethyl chloroformate-L-proline FTIR-ATR Fourier transform infrared-attenuated total reflectance GC Gas Chromatography

Annex
342
GHG Glycine-L-Histidine-Glycine GHS Globally harmonized system of classification and labelling of chemicals GIMP GNU Image Manipulation Program GSRs Gunshot residues HG-AAS Hybrid generation atomic absorption spectrometry HPLC High Performance Liquid Chromatography HRP Horseradish peroxidase enzyme
HS Head space HSV Hue Saturation Value i.d. Internal diameter IMS Ion mobility spectrometry IGSRs Inorganic gunshot residues IT-SPME In-tube solid phase microextraction LC Liquid chromatography LPE Liquid phase extraction LOD Limit of detection LOQ Limit of quantification MAMP Methamphetamine MC Monte Carlo MEHP Mono-ethylhexylphtalate MEMS Microelectromechanical systems MCF Mesoporous cellular foam MCM Mobile composition of matter MDA 3,4-methylenedioxyamphetamine MDEA 3,4-methylenedioxyethylamphetamine MDMA 3,4-methylenedioxymetamphetamine MIPs Molecularly imprinted polymers MOF Metal-organic framework MTEOS methyltriethoxysilane MS Mass spectrometry MSPD Matrix solid phase dispersion MWCNTs Multiwall carbon nnanotubes NanoLC Nano liquid chromatography NPs Nanoparticles NQS 1,2-Naphthoquinone-4-sulphonate NTA Nitrilotriacetic acid PAHs Polycyclic aromatic hydrocarbon PBS Phosphate buffered saline PDMS Polydimethylsiloxane PCB Printed circuit board PEEK Polyether ether ketone PEG Polyethylene glycol PR Preconcentration rates PVC Polyvinylchloride PXRD Powder Xray diffraction PZT Lead Zirconate Titanate

Annex
343
QAC Quaternary Ammonium Compounds RD Real Decreto RGB Red Green Blue RSD Relative standard deviation SBA Santa Barbara Amorphous SEM Scanning Electron Microscopy SiO2NPs Silicon dioxide nanoparticles SPE Solid phase extraction SPME Solid phase microextraction SPR Surface plasmon resonance SWCNTs Single-wall carbon nanotubes TEM Transmission Electron Microscopy TEOS Tetraethylortosilicate TMB 3,3,5,5-tetramethylbencidine TMOS Tetramethylortosilicate TMTDAC Trimethyl-tetradecylammonium chloride UAE Ultrasound-assisted extraction UNODC United Nations Office on Drugs and Crime UV-Vis Ultraviolet Visible USEPA United States Environmental Protection Agency VAE Vortex-assisted extraction VOCs Volatile organic compounds VSCs Volatile sulphure compounds v/v volume/volume w/w weight/weight w/v weight/volume 3D Three-dimensional

Annex
344

Annex
345
A2. Figure List

Annex
346

Annex
347
A2. FIGURE LIST
Figure 1. Scheme of the SPE procedure .................................................................... 7
Figure 2. Evolution of the number of citations on Web of Science for matching the
search items “IT-SPME” OR “In-tube SPME” OR “In-tube solid phase
microextraction” ....................................................................................................... 9
Figure 3. Schematic representation of configurations used for IT-SPME-LC: A)
draw/eject cycle mode, B) flow-through in-valve IT-SPME and C) flow-through with
an additional pumping system ................................................................................ 11
Figure 4. Percentage of studies using several materials as extractive phases for the
last five years. Data from Web of Science matching the search terms “IT-SPME” OR
“In-tube solid phase microextraction” OR “In-tube SPME” ..................................... 14
Figure 5. Schematic representation of in-line, on-line and off-line analytical
methods and their relationship with in situ analysis .............................................. 22
Figure 6. Number of citations on Web of Science for matching the following search
term “in situ analysis” AND “sensors” in the 1998-2017 period ............................. 24
Figure 7. Number of citations on Web of Science for matching the following search
term “smartphone sensor” OR “smartphone reader” OR “smartphone photometr”
in the 2012-2017 period .......................................................................................... 25
Figure 8. Microcantilever-based sensor .................................................................. 30
Figure 9. Principle of micro-cantilever-based sensors for chemical detection: static
and dynamic mode .................................................................................................. 31
Figure 10. Summary of piezoelectric effect a) after polarization, b) output voltage
of same polarity as material due to a compressive stress, c) output voltage of
opposite polarity as material due to a tensile stress, d) applied voltage of same
polarity as material produce a contraction of material and e) applied voltage of
same polarity as material produce a expansion of material .................................. 33
Figure 11. Print cycle of the screen-printing procedure. The screen is located just
above the substrate (1). Then, the mesh of the screen is brought into line contact
with the squeegee and scanned across the screen (2). The mesh should peel away
from the surface immediately behind the squeegee, leaving all the ink that was in
the mesh deposited onto the printing surface (3). .................................................. 34
Figure 12. Chemical structure of PDMS .................................................................. 36
Figure 13. Number of citations on Web of Science for matching the following
search terms: “PDMS” OR “Polydimethylsiloxane” AND “extractive phase”
between 2013 and 2017 (March 2018) ................................................................... 37
Figure 14. Chemical structure of bondesil C18. ........................................................ 40

Annex
348
Figure 15. Schematic representation of MWCNTs coating ..................................... 43
Figure 16. Illustration of the excitation of localized SPR where electrons in the
metallic NP are driven into oscillation due to coupling with incident light; d is the
diameter of sphere and λ is the wavelength of the light ........................................ 44
Figure 17. Surface plasmon band of spherical AgNPs of 15-20 nm ........................ 45
Figure 18. Evolution of number of citations about AgNPs from the year 2008 in the
web of science by searching “AgNPs” OR “Silver nanoparticles” in the field of
“Title”. ..................................................................................................................... 46
Figure 19. Schematic picture of the AgNPs aggregation in presence of sulphure
compounds (See Section 4.3.2.1) ............................................................................ 48
Figure 20. A) Porous structure and B) Crystalline structure of Cu(GHG) MOF ........ 49
Figure 21. Structure of the phthalate analyzed in this thesis, DEHP ...................... 51
Figure 22. Structure of several biocides studied in this Thesis ................................ 54
Figure 23. Structure of casein (data from PubChem) ............................................. 56
Figure 24. Structure of the amphetamine-like drugs studied in this Thesis............ 57
Figure 25. Structures of chiral A) MAMP and B) EP ................................................ 60
Figure 26. Structure of ketamine ............................................................................ 61
Figure 27. Structure of DPA .................................................................................... 63
Figure 28. A) Cary 60 Fiber Optic UV-Vis spectrophotometer and B) Remote fiber
optic DR accessory .................................................................................................. 83
Figure 29. Cary 630 ATR-FTIR spectrophotometer ................................................. 84
Figure 30. Horiba-MTB RAMAN spectrophotometer .............................................. 84
Figure 31. Impedancemeter HP4194A .................................................................... 85
Figure 32. HPLC-FLD System A) Jasco and B) Hewlett-Packar ................................ 87
Figure 33. CapLC-DAD system for isocratic mode ................................................... 88
Figure 34. CapLC system with binary capillary pump ............................................. 88
Figure 35. CapLC-FLD system in isocratic mode ...................................................... 89
Figure 36. Nikon light microscope .......................................................................... 90
Figure 37. SEM A) Hitachi S-4100 and B) Philips XL 30 ESEM ................................. 91
Figure 38. Dektak 150 profilometer ........................................................................ 91
Figure 39. A) Scheme of the experimental setup used for SPE enantioseparation
and B) Picture of the actual polypropylene SPE tube after incorporation of the
chiral MOF bed ........................................................................................................ 92
Figure 40. Scheme of A) Sampling by scrubbing the shooter hand with cotton swab
and B) Standard solution preparation for the VAE ................................................. 93

Annex
349
Figure 41. Scheme of A) MSPD for the determination of DEHP in sediemnts, B)
MSPD/solution derivatization (b.1) and Integrated MSPD/solid support
derivatization (b.2) for the determination of amphetamines in hair ...................... 95
Figure 42. In-valve IT-SPME coupled to LC with six port valve A) In load position
and B) In inject position........................................................................................... 96
Figure 43. Procedure of PDMS/TEOS/SiO2NPs-NQS sensors fabrication ................ 98
Figure 44. Procedure of PDMS-Co(SCN)2 sensors fabrication ................................. 99
Figure 45. Procedure of the AgNPS immobilization on nylon membrane............. 100
Figure 46. A) Turbula mixer and B) three-roll mill (EXAKT 80S) ............................ 101
Figure 47. A) Stencil for PZT printing; B) Screen with emulsion with patterns on
mesh for gold, sacrificial and dielectric printings; C) Mask with pattern of disks and
fiducials for reveling; D) Screen copy unit Variocop S for insolation ..................... 102
Figure 48. Procedure of mesh revelation .............................................................. 103
Figure 49. A) Overal view of DEK Horizon 03iX screen printing platform and B) view
of the print cycle .................................................................................................... 104
Figure 50. A) Furnace and B) Time-temperature profile in the firing process ...... 105
Figure 51. Polarization equipment AET ................................................................ 106
Figure 52. Scheme of the reaction between amphetamines tested and A) FMOC B)
FMOC-L-Pro and DCC ............................................................................................ 109
Figure 53. Procedure to obtain the colorimetric response of polymeric sensors .. 111
Figure 54. Sensor hanged up into static dilution bottle to generate gaseous
standard ................................................................................................................ 112
Figure 55. A) Gas chamber connected to impedancemeter and gas generator
(Inset: top view of cantilever on alumina substrate bonded on PCB support and B)
Vapor generator .................................................................................................... 113
Figure 56. FTIR-ATR spectra obtained for C18 used as solid phase in the MSPD
procedure, sediment, MSPD mixture and MSPD mixture after extraction with
acetonitrile ............................................................................................................ 123
Figure 57. Chromatograms at 230 nm obtained for a sediment sample (A),
sediment sample spiked with 47.62 ppb (B), and 69.77 ppb (C) of DEHP
(concentrations in the extracts). The spikes were realized before MSPD treatment.
Inset corresponds to DEHP spectrum .................................................................... 125
Figure 58. Photographs of the proportions according to particle sizes (A, B, C, D,
and E corresponding to bigger than 0.4, 0.4, 0.3, 0.2, and 0.1 mm, respectively) for
different types of sediments: (1) sediment sample obtained from coast zone, (2)
sediment sample obtained from transition zone, and (3) sediment sample obtained
from a port zone.................................................................................................... 127

Annex
350
Figure 59. Absorbance ratio Si-O/C-O for the sediments assayed (see also Figure
58 and Table 23) ................................................................................................... 128
Figure 60. A) Effect of acetonitrile (ACN) percentage on the retention of C12-BAK
(first peak) and C14-BAK (second peak) homologues at 0.5 µg mL-1 using short C18
column. Flow rate = 10 µL min-1, B) Comparative separation of BAK homologues (at
0.5 µg mL-1) on C18 and nitrile capillary column. Conditions of mobile phase and
flow rate: 85% ACN and 20 µL min-1 for C18 column; 65% ACN and 10 µL min-1 for
nitrile column ........................................................................................................ 131
Figure 61. Effect of BAK concentration on extraction efficiency of each homologue
when water is used as sample solvent. Conditions: nitrile column, ACN:acetate
buffer (65:35), flow rate = 10 µL min−1, 1000 µL for BAK 0.5 and 5 µg mL−1, and 100
µL for BAK 50 µg mL−1 ........................................................................................... 133
Figure 62. Percentage response of each homologue in simultaneous IT-SPME of
BAK and ADP with respect of the response in individual BAK extraction (% s-BAK/i-
BAK), at several relations of concentration of ADP and BAK (a) 1 (BAK 50 µg mL−1
and ADP 50 µg mL−1), (b) 2 (BAK 50 µg mL−1 and ADP 100 µg mL−1), (c) 3 (BAK 50
µg mL−1 and ADP 200 µg mL−1),(d) 40 (BAK 5 µg mL−1 and ADP µg mL−1), (e) 60
(BAK 0.5 µg mL−1 and ADP 30 µg mL−1). Optimized conditions for nitrile column
were employed ...................................................................................................... 135
Figure 63. IT-SPME of 0.5 µg mL−1 of BAK in water and simultaneous IT-SPME of
0.5 µg mL−1 of BAK in presence of 30 µg mL−1 of ADP by using (A) Nitrile column,
acetonitrile:acetate buffer (65:35), Flow rate = 10 µL min-1 (B) Short C18 column,
acetonitrile:acetate buffer (85:25), Flow rate = 20 µL min−1 ................................ 136
Figure 64. Effect of TMTDAC on extraction efficiency of C12-BAK and C14-BAK.
Mixtures of 1.5 µg mL−1 BAK with 1.5 and 30 µg mL−1 TMTDAC. Conditions: Short
C18 column, ACN:acetate buffer (85:25), Flow rate = 20 µL min−1 ........................ 137
Figure 65. Effect of ADP on extraction efficiency of BAK. Mixtures of 1.5 µg mL−1
BAK with 1.5, 15 and 30 µg mL−1 of DPA from biocide product (sample DC1).
Conditions: Short C18 column, acetonitrile:acetate buffer (85:25), Flow rate = 20 µL
min−1 ...................................................................................................................... 139
Figure 66. Comparison of peak areas obtained for standard solution (3 µL of 10 µg
mL-1 in 2 mL of water, 15 ng mL-1) with different (A) sample collectors (B) solvents
to wet cotton swab (at 10 ng mL-1): dry (a), water(b), acetone (c) and ethanol (d),
together with normalized spectra (inset) of DPA (black dashed line) and unkown
compound (black solid line), (C) extraction modalities and (D) extraction time ... 143

Annex
351
Figure 67. Chromatograms of blanks (dashed lines) and standard solution of 5 ng
mL-1 DPA (solid lines) obtained with different extraction solvents: water (a), 90:10
water: ethanol (b) and 90:10 water: acetonitrile (c) ............................................ 144
Figure 68. Effect of (A) acetonitrile percentage and mobile phase flow (800 µL at 7
ng mL-1, PDMS65, 30 cm); (B) nature of the extractive phase (800 µL at 5 ng mL-1,
capillary length 30 cm, optimum mobile phase); (C) capillary length (800 µL, 5 ng
mL-1, PDMS65, optimum mobile phase) and (D) sample volume processed (5 ng mL-
1, PDMS65, capillary length 90 cm, optimum mobile phase) on the DPA retention in
IT-SPME ................................................................................................................. 145
Figure 69. Chromatograms obtained for sample 2A (black solid line) and blank of
non-shooter hand (black dashed line). The inserts correspond to the matching of
the spectra of DPA found (blue line) in reference to the library of the standard (red
line) ....................................................................................................................... 150
Figure 70. Visual and microscopically (10x magnification) inspection of cotton
swab after sampling a non-shooter hand (A) and after sampling a shooter hand,
sample 2A (B) ........................................................................................................ 152
Figure 71. SEM image (a) and EDX spectra of inorganic gunshot residue found on
swab sample (sample 2A) after shooting (b) ........................................................ 153
Figure 72. SEM images (left) and EDX spectra (right) of spherical particles found on
tapes used to collect GSR after shooting a gun: sample 21K.2 (A), sample 22K.7(B),
sample 25N.4(C), sample 21K.4 (D) and sample 24 M.6 (E) ................................. 154
Figure 73. SEM images (left) and EDX spectra (right) of non-spherical particles
found on tapes used to collect GSR after shooting a gun: sample 22K.2 (A), sample
25N.3 (B), sample 21K.1 (C), sample 25N.2 (D)..................................................... 155
Figure 74. (A) SEM image, (B) overlay X-ray map of singles X-ray of Sb (C); Pb (D)
and Ba (E) of particle found on a tape used to collect GSR on hands ................... 157
Figure 75. Optimization of sensor composition and temperature conditions. (A)
TEOS percentage: 50% (a1) 60% (a2), (B) Proportion of SiO2NPs: 0.1% (b1) and 1%
(b2), (C) NQS percentage: 0.05% (c1), 0.1% (c2), 0.2% (c3). (D) Sensor at two
different temperatures: (d1) room temperature, (d2) 100 ºC for 10 min. Blue
columns represent the signals of blanks and red columns show the signals of the
sensor with casein stock solutions ........................................................................ 162
Figure 76. Sensor absorbance obtained for different amino acids at a
concentration level of 0.01 M. Blue line: signal from sensor at room temperature
for 18 h. Red line: sensor heated for 10 min in a water bath ............................... 163
Figure 77. (A) Kinetic study. Red line: blank, Blue line: signal in presence of casein 1
g L-1 and (B) Optimization of the sample amount for determination of casein .... 164

Annex
352
Figure 78. Spectra and images of the NQS–PDMS sensors at different
concentration levels of casein. (A) Blank, (B) 15 mg L-1 (C) 50 mg L-1, (D) 750 mg L-1
and (E) 2000 mg L-1 ............................................................................................... 165
Figure 79. Intraday precision of DR method obtained from the values of the
absorbance at 590 nm for different casein concentration.................................... 166
Figure 80. Images of PDMS-NQS sensors at different concentration levels of casein,
(a) Blank, (b) 15, (c) 50, (d) 750 and (e) 2000 mg L-1 ............................................. 169
Figure 81. Optimization of sensor: (A) photographs of devices without (a1, a2) and
with 0.1% (w/w) NPs (a3, a4), before (left) and after (right) exposition of 1% (w/w)
ADP during 20 min. Sensors prepared with PDMS/TEOS (50/50, w/w) and 0.1%
(w/w) of NQS. (B) Effect of different amounts of PDMS/TEOS and NPs (containing
0.1% (w/w) of NQS). (C) Photographs of sensors with PDMS/TEOS (50/50, w/w),
0.1% (w/w) of NPs and different NQS amounts (c1, c2) 0.2 (c3, c4) 0.1, (c5, c6)
0.05% (w/w), blanks (left) and exposed to 0.5% (w/w) ADP during 5 min. (D) Effect
of the NQS amount on the analytical response .................................................... 172
Figure 82. 5x5 µm AFM topographic maps and corresponding height profiles along
the marked lines: (A) Composite of 50/50 TEOS/PDMS and 0.1 % (w/w) of NPs.
Color scale from 0 to 120 nm. The embedded nanoparticles are visible at the
surface. (B) Composite of 50/50 TEOS/PDMS without NPs. Color scale from 0 to 10
nm; (C) SEM image of composite chosen which contains 50/50 TEOS/PDMS and 0.1
% (w/w) NPs .......................................................................................................... 174
Figure 83. Variation of device response for 0.5% (w/v) of ADP as function of the
reaction time. The analytical signal was obtained in DR mode at 600 nm. Devices
studied had optimum composition ....................................................................... 175
Figure 84. Spectra of the stability of NQS in aqueous solution over time under dark
(blue lines) and light (red lines) storage. Responses are quantified as the
absorbance at 380 nm of NQS 2.4 x 10 -4 mol L-1. Inset: Photography of responses
of NQS solution against light at a) 5 min, b) 7 days, c) 0 min, d) 30 days ............. 176
Figure 85. Microscopic photographs of (A) device of a blank, (B) device after 3 min
and (C) after 6 min of 0.5 % (w/v) ADP contact at 100x magnification. ............... 176
Figure 86. Stability of sensor under two storage conditions over time (sensors in
the dark and exposed to light) without ADP contact. Average responses and
standard deviation for n=3 .................................................................................... 177
Figure 87. (A) Stability of sensor responses under two storage conditions over time
(in the dark and exposed to sunlight). Absorbance measurements of sensors just
synthesized and after 8 days, 1 month and 8 months of being synthesized at 0.1 %
(w/v) of ADP. Average responses and Standard deviation for n=3. (B) Stability of

Annex
353
colored sensor after reaction between NQS-ADP (0.1% (w/v)). Absorbance
measurements correspond to sensors just colored and colored after spending 30
min, 3 hand 4 months for n=8 assays. Inset:photographs of colored composites
after (b1) 30 min (b2) 4 months ............................................................................ 178
Figure 88. (A) Reaction scheme of ADP with NQS, together with a picture of the
derivatization procedure. (B) Left: spectra of ADP response at different
concentrations to get her with the photographs of sensors (b1) Blank, (b2)
0.015%, (b3) 0.05 %, (b4) 0.1%, (b5) 0.2 %, (b6) 0.5% and (b7) 1% (w/v) of ADP.
Right: calibration curve and linear plot (inset) of colored sensors at 600 nm of
absorbance. Stoichiometry 2:1 (NQS:ADP) ........................................................... 179
Figure 89. Optimization of sensor composition. (A) Effect of different weight ratios
of PDMS/TEOS on the analytical response, (B) Photographic images of sensors
containing 50/50 (left) and 40/60 (right) of PDMS/TEOS (w/w) exposed to AMP
(b1, b2) and MAMP (b3, b4) and blanks (b5, b6) and (C) Microscopic photographs
at 10x magnification obtained with for PDMS sensors (c1), PDMS/TEOS 50:50
(w/w) sensors (c2), and PDMS:TEOS 40/60 (w/w) sensors (c3). Conditions: 0.01 g
mL-1 of AMP and MAMP, 10 min of exposure, sensors with 0.1 % NQS and 0.1 %
NPs ........................................................................................................................ 186
Figure 90. Absorbance at 525 for AMP and MDA (primary amines) and 600 nm for
MAMP and MDMA (secondary amines) recorded against a reagent blank at
different reaction times. Conditions: sensor composition of 0.1 % NQS, 0.1 % NPs,
50/50 PDMS/TEOS; analyte concentration of 0.01 g mL-1 ................................... 187
Figure 91. Photographic image of the analysis by the colorimetric kit (composed by
a vial with basic buffer, NQS-polymeric sensors and powder/pill drug) for AMP
(above) and MAMP (down), together with absorbance spectra at different
concentrations a) blank, b) 0.005, c) 0.01, d) 0.03 and f) 0.05 g·mL-1 of AMP (A)
and MAMP (B). Inset: photographic image of sensors containing previous
concentration levels. Optimal conditions .............................................................. 188
Figure 92. Stability of the sensors. Responses are expressed as the absorbance of
sensors after their immersion into a buffer solution containing 0.01 g mL-1 of
MAMP or into the buffer (blanks). Average responses and standard deviation for
n=3 ........................................................................................................................ 191
Figure 93. A) Chromatograms obtained for a blank (water), a standard solution of
MDMA (16.5 mg mL-1), a street samples containing MDMA (S3), and samples
containing mixtures of MDMA and MAMP (S4: (27.4 ± 0.6) % of MDMA and (46 ±
4) % of MAMP; S5: (65 ± 5) % of MDMA and (5.1 ± 0.2) % of MAMP; S6: (17 ± 1) %

Annex
354
of MDMA and (34 ± 1) % of MAMP). B) FTIR-ATR spectra obtained for a street
sample (S1) and for pure MDMA .......................................................................... 192
Figure 94. Microscopic photographs of: (A) a sensor containing 0.6 % of reagent in
PDMS (w, w). (B) Sensors containing 0.3% of reagent in PDMS (w/w) during (down)
reaction and 30 min after reaction (up) exposure to a blank (left) and to a solution
of ketamine 25000 µg mL-1 (right); (C) detail of reagent particle in a sensor
containing 0.3% of reagent in PDMS (w/w) (left), a sensor exposed to a blank
(center) and a sensor exposed to a solution of ketamine 25000 µg mL-1 for 15 min
(right) .................................................................................................................... 197
Figure 95. Effect of the percentage of reagent in PDMS sensors on the
absorbances (625 nm) for a blank and for a solution of ketamine (700 µg mL-1);
time of exposure, 10 min. Inset: Photographic images of sensors containing 0.3%
of reagent exposed to (a) a solution of ketamine, (b) a blank; sensors containing
0.9% of reagent exposed to (c) a solution of ketamine and (d) a blank.
Concentration of ketamine, 1000 µg mL-1; time of exposure, 10 min; time until
measurement, 5 min ............................................................................................. 199
Figure 96. Effect on the absorbances measured for a blank and a solution of
ketamine (500 µg mL-1) of: (A) the time of reaction, and (B) the time elapsed
between reaction and measurement. In (A) the absorbance was measured
immediately after the removal of the sensor from the sample; in (B) the reaction
time was of 10 min. The conditions selected as optima were: reaction time, 10
min; time until absorbance measurement, 5 min ................................................. 201
Figure 97. Results obtained for sample S1: (A) sensor absorbance spectra
registered for a blank, for a standard solution of ketamine (500 µg mL-1) and for
the sample solution; insert: sensor images obtained for a blank and for the sample
solution; (B) FTIR-ATR spectra obtained for the sample, pure ketamine and pure
caffeine; (C) left: chromatograms obtained for a standard solution of ketamine (50
µg mL-1) and for the sample solution; right: normalized spectra of ketamine and
suspected ketamine in the sample. The sample solution in (C) was a dilution 1:10
of the sample in (A) ............................................................................................... 204
Figure 98. Chromatograms obtained for aqueous solutions and for hair samples
treated by the ultrasound-assisted alkaline digestion method: (a) blank (water), (b)
blank hair,(c) an standard solution of the amphetamines (0.5 µg mL-1, each
compound), and (d) a spiked hair sample (25 ng mg-1, each compound) ............. 209
Figure 99. Photographs of: (a) a hair sample (25 mg), (b) the blend obtained after
grinding the sample with 400 mg of the C18 phase, and (c) the blend transferred to
an extraction tube ................................................................................................. 212

Annex
355
Figure 100. Photographs obtained with the optical microscope of: (a) C18 sorbent
ground for 5 min, (b) a hair sample, and (c) the blend obtained after grinding the
sample and the C18 dispersant for 5 min. Ratio sample to dispersant, 1:16 ......... 212
Figure 101. Chromatograms obtained for hair samples spiked with the analytes
(25 ng mg-1) treated by MSPD/solution derivatization method using in the washing
step: (a) 2.0 mL of water, (b) 2.0 mL of carbonate buffer, and (c) 4.0 mL of
carbonate buffer as washing solvents. ................................................................. 213
Figure 102. Effect of the derivatization conditions on the analyte responses
obtained with the integrated MSPD/solid support derivatization method: (a)
reaction time, (b) pH of the buffer, and (c) concentration of the FMOC solution.
Tested for a sample containing 20 ng mg-1 of each analyte ................................. 215
Figure 103. Chromatograms obtained by the three approaches tested: (a) hair
sample spiked with 100 ng mg-1 of each analyte treated by the ultrasound-assisted
alkaline diges-tion/solution derivatization method, (b) hair sample spiked with 25
ng mg-1 of each analyte treated by the MSPD/solution derivatization method, and
(c) hair sample spikedwith 10 ng mg-1 of each analyte treated by the integrated
MSPD/solid phase derivatization method ............................................................. 216
Figure 104. Chromatograms obtained with the integrated MSPD/solid support
derivatization method for: drug-free hair sample (a), and for hair samples spiked
to contain theanalytes at concentrations of (b) 2 ng mg-1, (c) 10 ng mg-1 and (d) 20
ng mg-1 .................................................................................................................. 217
Figure 105. Chromatograms obtained for: (A) a real hair sample positive for
MAMP and for a blank hair sample spiked with 2 ng mg-1 of each analyte, and (B)
the real hair sample andthe same sample fortified with 20 ng mg-1 of each analyte;
the dark zones in (b) indicate the elution windows for the target compounds .... 220
Figure 106. Design of disk fabricated in this work ................................................ 223
Figure 107. Fabrication steps of disk A) screen-printing of sacrificial layer, B)
screen-printing of bottom gold electrode, C) Screen-printing of PZT layer, D)
Screen-printing of top gold electrode E) Sacrificial layer elimination after firing, F)
Poling of PZT wired disk (cross view), together with photographies of the top view
of the disk step by step.......................................................................................... 224
Figure 108. Microscopic images at x6 of top view of disk before (A) and after firing
(B), aligned disk before (C) and after firing (D). Disks fabricated with formula
reported in (Debéda,H. et al., 2013) ..................................................................... 225
Figure 109. Real photographies and scheme of the top view of fabrication steps of
the cantilevers A) Screen-printing of anchor pad B) Screen-printing of the sacrificial
layer C) Screen-printing of the bottom gold electrode D) Screen-printing of the
Annex
356
cantilever E) Screen printing of the top gold electrode, F) Sacrificial layer
elimination after firing G) Poling of wired cantilever with the cross view ............ 226
Figure 110. A) Design of the cantilever, B) Photography of cantilever before firing
and C) Photography of cantilever after firing, fabricated in this work on Al2O3
substrate ............................................................................................................... 227
Figure 111. Pictures of thickness profile before firing of A) PZT anchor-Sacrificial
layers on Al2O3 with different print gap of anchor, B) Different print order of
anchor and sacrificial layer ................................................................................... 229
Figure 112. Microscopic images of A,B) first layer of bottom gold electrode, C,D)
cantilevers before firing. Left: green dielectric anchor on AlN, Right: PZT anchor on
Al2O3 ...................................................................................................................... 230
Figure 113. Optical microscope pictures of cantilevers after firing on Al2O3 (A) and
AlN (B) ................................................................................................................... 231
Figure 114. 3D profile analysis of the cross-section axis of A) Disks (two formulas)
and B) Cantilever (first batch) with formula A (Debéda, H. et al., 2013), before
firing ...................................................................................................................... 231
Figure 115. Graphic of A) Conductance, B) | |, C) Susceptance and D) Impedance
phase measurements of disks fabricated with two formulas A (Debéda,H. et al.,
2013) and B (Medesi, A. et al., 2014) and commercial disk .................................. 232
Figure 116. Equations used for the calculation of Keff and Qm, where fm is the
frequency at the minimum impedance (Z), fM is the frequency at the maximum
impedance, fr is the resonance frequency at G maximum, Δf= f2-f1 is the width of
peak, where f1 is the frequency at the maximum B and f2 is the frequency at the
minimum B ............................................................................................................ 233
Figure 117. Microscopic photography of the functionalized cantilever by MCF
mesoporous silica .................................................................................................. 234
Figure 118. A) Spectrum of the conductance for the first longitudinal mode before
and after deposition of mesoporous silica layer and B) Relative resonant frequency
shifts as a function of humidity ............................................................................. 235
Figure 119. Chromatograms obtained for a standard solution containing AMP,
MAMP and EP (8.0 µg mL-1, each) using a percentage of acetonitrile in the mobile
phase of: (A) 50 % and (B) 70 %, using an unmodified PDMS65 extractive capillary
(30 cm length) for IT-SPME ................................................................................... 248
Figure 120. Chromatograms obtained for a standard solution containing AMP,
MAMP and EP (8 µg mL-1, each) with PDMS65 extractive capillaries of different
length .................................................................................................................... 239

Annex
357
Figure 121. Peak areas obtained for a standard solution of the amphetamines
tested (8 μg mL-1, each) with different extractive capillaries: unmodified PDMS95
(36 cm), unmodified PDMS65 (40 cm), c‐SWCNTs functionalized PDMS95 (36 cm), c‐
SWCNTs functionalized PDMS65 (40 cm) and c‐MWCNTs functionalized PDMS65 (40
cm) ........................................................................................................................ 240
Figure 122. Chromatograms obtained for a standard solution of the
amphetamines tested (8 µg mL-1 each) with the unmodified PDMS95 and the c-
SWCNTs funtionalized PDMS95 capillaries ............................................................. 241
Figure 123. Chromatograms obtained for a standard solution of the
amphetamines tested (8 μg mL-1 each) with the unmodified PDMS65 and the c‐
MWCNTs functionalized PDMS65 capillaries .......................................................... 242
Figure 124. Chromatograms obtained for a standard solution of the
amphetamines tested (8 µg mL-1, each) with the c-SWCNTs and the c-MWCNTs
functionalized PDMS65 capillaries .......................................................................... 243
Figure 125. Peak areas obtained for different concentrations of the amphetamines
tested within the 2–10 μg mL-1 concentration range with different extractive
capillaries .............................................................................................................. 244
Figure 126. Scheme of the extraction/derivatization IT‐SPME CapLC method used
for the analysis of amphetamines in oral fluid. The extractive capillary was a c‐
MWCNT functionalized PDMS65 capillary (40 cm length) ..................................... 257
Figure 127. (a) Chromatograms obtained for the reaction mixture (250 µL of buffer
and 250 µL of 0.1 mM FMOC), (b) the same reaction mixture after the introduction
of a cotton swab for 5 min, and (c) after the introduction of a cotton swab
impregnated with 125 µL of a standard solution of EP (2 µg mL-1). For IT-SPME a c-
MWCNTs functionalized PDMS65 capillary (40 cm length) was used .................... 248
Figure 128. Chromatograms obtained with the proposed extraction/derivatization
IT-SPME CapLC method for an oral fluid sample, and the same sample spiked with
the tested amphetamines (8 µg mL-1, each) ......................................................... 249
Figure 129. Glycil-L-histidylglicine (GHG) .............................................................. 253
Figure 130. Microscope (left) and SEM images (right) of as-made crystals of
Cu(GHG) at an accelerating voltage of 20 keV ..................................................... 253
Figure 131. (A) Structure of helicoidal chains in Cu(GHG) MOF, (B) Functional
groups in the peptidic backbone decorating the surface of the pores, (C) 1D
channels in Cu(GHG) are surrounded by functional sites prone to establish
supramolecular interactions ................................................................................. 254
Figure 132. Representative MC binding geometries of (+,−) MAMP and EP
enantiomers within the structure of Cu(GHG) and corresponding adsorption

Annex
358
energies as absolute values calculated with respect to gas phase. Most relevant H-
bonds in directing guest binding are annotated in each case. ............................. 255
Figure 133. Evolution of the enantioselective recognition of Cu(GHG) for chiral
drugs in ethanol:water 75:25 solution with contact time for (A) MAMP and (B) EP.
Chiral adsorption was evaluated from chromatographic analysis of the
supernatant solution ............................................................................................. 257
Figure 134. Control experiment to confirm the observed chiral recognition is
specific to the MOF architecture rather than to any of its components. Below
chromatograms for a physical mixture of GHG and Cu(II) acetate in the same
proportion present in the MOF. Evolution of the peak areas for (+) and (-)-MAMP
in a solution of the MOF components rules out measureable enantioselective
recognition of any of the enantiomers. Inset in the right column highlights the
signal specific to each enantiomer ........................................................................ 259
Figure 135. Time evolution of the UV-Vis spectra at room temperature of a
dispersion of as-made 50 mg of Cu(GHG) in 500 µL of EtOH:H2O (25:75 v%) from 0
to 240 min. This set of conditions are equivalent to those used for studying the
ability of Cu(GHG) to recognize selectively enantiomers from solution. The system
remains constant and no signature of Cu(II) leaching –broad absorption band
centered at 600 nm- can be observed, confirming the chemical integrity of the
solid in these conditions ........................................................................................ 260
Figure 136. (A) SPE separation of EP in hexane:EtOH 75:25 by using Cu(GHG) as
chiral bed. (B) HPLC chromatograms of EP racemate before (dashed line) and after
(solid line) passing through the MOF bed ............................................................. 261
Figure 137. Comparison of HLPC chromatograms of a racemic mixture of (±)-EP in
Hexane:EtOH 75:25 after passing through the MOF SPE cartridge (black line,
adsorption) and after elution with fresh solvent (desorption). The presence of (-)-
EP in the desorbed fraction is negligible whilst only (+)-EP can be detected in the
chromatogram in good agreement with the reported enantioselectivity ............ 262
Figure 138. Control experiment by soaking as-made crystals of CuGHG in a
racemic mixture of (±)-EP in hexane:EtOH 75:25. (A) Evolution of the peak areas
for (-) and (+)-EP. Adsorption of (-)-EP can be considered negligible whilst close to
44% of (+)-EP is preferentially adsorbed. (B) HPLC chromatograms of EP racemic
solution in contact with the MOF before (0 min) and after 4 minutes ................. 263
Figure 139. SEM pictures of Cu(GHG) before (A) and after (B) SPE separation at an
accelerating voltage of 20 keV. Crystals were metalized with a mixture of gold and
palladium during 30 s............................................................................................ 263

Annex
359
Figure 140. Absorption spectra of A, B) AuNP 20 nm in solution and C, D) AgNP 20
nm in solution after addition of A, C) Na2S and B, D) CH3SH in a range between
250 - 10000 µg L-1.................................................................................................. 269
Figure 141. Schematic drawing of the A) AgNP aggregation and B) AuNPs
functionalization by sulphur compound ................................................................ 270
Figure 142. Microscopic images of different kinds of support for AgNP
immobilization A) nylon, B) cellulose, C) glass fiber. The scale bar is 100 µm and
inset c is 20 µm. Absorbance by DR of the AgNPs immobilized on D) nylon, E)
cellulose, F) glass fiber and their response in presence of volatile H2S (250 and
1000 ppb). Inset AgNPs immobilized on the membrane and the reponse at 1000 µL
m-3 ......................................................................................................................... 268
Figure 143. Raman spectra of a) nylon, b) AgNP-nylon and device responde to
sulphur compounds in c) 250, d) 500, e) 1000, f) 10000 µL m-3 levels. ................. 269
Figure 144. Absorption spectra of AgNPs of 20 nm (A), 40 nm (B) and 10 nm (C)
after addition of Na2S concentrations. Inset: plot of corresponding absorbance
ratios vs log [S2-] .................................................................................................... 270
Figure 145. Photography of sensors and calibration curve by plotting A550/A415
ratio vs logarithm of H2S concentrations of 0 (a), 150 (b), 250 (c), 500 (d), 1000 (e),
1500 (f) and 2500 (g) µL m-3 .................................................................................. 271
Figure 146. A) Sulphur concentration found in A) 10 healthy volunteers using
AgNPs-based sensor and B) 4 volunteers before (blue bars) and after garlic
consumption (orange bars) ................................................................................... 273

Annex
360

Annex
361
A3. Table List

Annex
362

Annex
363
A3. TABLE LIST
Table 1. Operative values for IT-SPME-CapLC and IT-SPME-NanoLC ..................... 15
Table 2. Summary of applications of IT-SPME described in the literature between
2013-2018 .......................................................................................................... 16-17
Table 3. Summary of analytical parameters (precision, LODs and recoveries) for
different applications of IT- SPME ........................................................................... 19
Table 4. Summary of in-situ sensors described in the literature between the years
2013-2018 .......................................................................................................... 20-21
Table 5. Summary of characteristics of some current methods for in situ analysis 23
Table 6. Features of differente type of solid supports ............................................ 28
Table 7. Summary of cantilever resonant modes in terms of the simple harmonic
oscillator model, where L is the length, t is the thickness, E is the Young’s modulus,
w is the width, is the eigenvalue (n is a positive integer) and m is the cantilever
mass ...................................................................................................................... 32
Table 8. Summary of resonant microcantilevers coated with different sensitive
layers reported ........................................................................................................ 35
Table 9. Examples of PDMS-based colorimetric sensors reported in the literature
between 2010-2018 ................................................................................................ 38
Table 10. Characteristics of SBA-15, MCM-41 and MCF-types mesoporous silica.
MCM: Mobile Composition of Matter, SBA: Santa Barbara Amorphous, MCF:
Mesoporous Cellular Foam (Beck, J. S. et al., 1992; Kruk, M. et al., 2000; Selvam, P.
et al., 2001) ............................................................................................................. 41
Table 11. Selected examples of plasmonic assays .................................................. 47
Table 12. Summary of reagents and chemicals used in this Thesis, with their
suppliers and GHS pictograms, where = Flammable (GHS02); = Corrosive
(GHS05); = Toxic (GHS06); =Harmful (GHS07); =Health hazard (GHS08);
= Environmental hazard (GHS09) ................................................................. 79-81
Table 13. Spectrometric techniques and experimental details used in the present
Thesis.................................................................................................................. 85-86
Table 14. Summary of the chromatographic techniques used in this Thesis .......... 90
Table 15. Composition, size and curing time of the developed sensors. Optimum
sensor highlighted in blue ...................................................................................... 97
Table 16. Compositions of the different PDMS- Co(SCN)2 tested sensors ............... 99
Table 17. Summary of materials and screen characteristics used to fabricate disks
and cantilevers ...................................................................................................... 103

Annex
364
Table 18. Main characteristics of the chromatohraphic works described in this
Thesis..................................................................................................................... 107
Table 19. Conditions for derivatization procedures of this Thesis ....................... 110
Table 20. Experimental conditions used in several works of this Thesis based on
polymeric sensors .................................................................................................. 110
Table 21. Samples per analytes studied ............................................................... 118
Table 22. Some figures of merit to detect DEHP in sediments by MSPD and IT-
SPME-CapLC-DAD .................................................................................................. 124
Table 23. Comparison of the composition of the three kind of sediment assayed
according to size of particle after sieving ............................................................. 126
Table 24. Precision and addition curves of BAK in presence of ADP from the raw
material LONZABAC and from DECTOCIDE with the two chromatographic columns
tested .................................................................................................................... 132
Table 25. Mixtures of BAK and ADP or TMTDAC .................................................. 134
Table 26. Characteristics of capillary columns employed in IT-SPME ................... 146
Table 27. Analytical data for DPA determination by IT-SPME-CapLC-DAD; a:
ordinate, b: slope, sa and sb: standard deviation of the ordinate and slope,
respectively, R2: determination coefficient ............................................................ 149
Table 28. Samples and quantification results from hands determined by optimized
extraction procedure followed by in-tube SPME-CapLC-DAD. *tape lift kit samples
quantified by regression equation 14 times lower than regression equation by
cotton swab ........................................................................................................... 151
Table 29. Summary of shape, surface and elemental composition of GRS particles
founded on tape lift kit from shooter hands ......................................................... 156
Table 30. Analytical parameters obtained for casein determination in dairy
sewages by the three methods assayed ............................................................... 167
Table 31. Found concentrations of casein mg L-1 obtained by the three
quantification methods (bicinchoninic acid assay, and the two methods of
measurement for the colorimetric sensor (GIMP and diffuse reflection) in different
samples ................................................................................................................. 169
Table 32. Figures of merits obtained with the different measure approaches for
the ADP determination with the proposed NQS-sensor, and comparison with the
figures of merit obtained with C18-solid-support derivatization ........................... 181
Table 33. Concentration of ADP found in the analysed samples obtained with the
NQS-sensor by DR and DI. Comparison with the results obtained with C18 Solid-
Support derivatization ........................................................................................... 182
Annex
365
Table 34. Comparison of different properties of the procedures assayed. More +:
better option ......................................................................................................... 183
Table 35. Analytical data for the determination of AMP, MAMP, MDA and MDMA
by using diffuse reflectance values. Absorbances measured at 525 nm and 600 nm
for secondary and primary amines, respectively, in DR mode. Concentrations
expresses in g mL-1 ................................................................................................ 189
Table 36. Analytical data for the determination of AMP, MAMP, MDA and MDMA
by using color intensity of the DI. Concentrations expresses in g mL-1 .................. 189
Table 37. Composition of the ecstasy street samples obtained by the sensor-based
approaches and by the LC reference method. (*) Sum of the percentages of MDMA
and MAMP expressed as MDMA .......................................................................... 194
Table 38. Analytical data obtained by using the developed sensors .................... 202
Table 39. Comparison of the results obtained for the drug street samples with the
developed sensors and the LC reference method (n = 3) ...................................... 205
Table 40. Analytical parameters of the methods tested ...................................... 210
Table 41. Accuracy and precision of the proposed integrated MSPD/solid phase
derivatization method ........................................................................................... 218
Table 42. Weight percentages and mass of each component in 40 g of
piezoelectric powder ............................................................................................. 222
Table 43. Thickness measurements of anchor and sacrificial layers for cantilever
fabrication. On average of 200 µm was employed for each measurement by the
profilometer .......................................................................................................... 228
Table 44. Comparation of Keff ............................................................................... 233
Table 45. Preconcentration rates (PRs) values found for the extractive capillaries
tested .................................................................................................................... 240
Table 46. Response vs concentration linearity data ............................................. 245
Table 47. Linearity and reproducibility achieved with the proposed extraction-
derivatization‐IT-SPME‐CapLC method for AMP, MAMP and EP within the 1–10 μg
mL-1 (2–10 μg mL-1 for EP) concentration interval (values obtained with the c‐
MWCNTs coated PDMS65 capillary of 40 cm length) ............................................ 246
Table 48. Summary of binding energies and H-bond lengths for MAMP-MOF
interactions as estimated by quantum-chemistry calculations ............................ 256
Table 49. Experimental data used for calculation of enantioselective recognition
capability of Cu(GHG) ............................................................................................ 258
Table 50. Cartridge to cartridge precision ............................................................ 262
Table 51. Analytical parameters obtained for H2S determination by AgNPs-nylon
based sensor proposed.......................................................................................... 272

Annex
366
Table 52. Recoveries of 2 spiked samples of healthy volunteers obtained by using
DR and DI .............................................................................................................. 274
Tabla 53. Summary of the application and results obtained in this Thesis for the
materials used ....................................................................................................... 283

Annex
367
A4. PhD contributions to publications

Annex
368

Annex
369
1. M. Muñoz-Ortuño, A. Argente-García, Y. Moliner-Martínez, J. Verdú-
Andrés, R. Herráez-Hernández, M.T. Picher, P. Campíns-Falcó, A cost-
effective method for estimating di (2-ethylhexyl) phthalate in sediments,
Journal of Chromatography A. 1324 (2014) 57-62. Impact factor (JCR
2018): 3.981. Contribution 50%
2. M. Muñoz-Ortuño, A. Argente-García, Y. Moliner-Martínez, C. Molins-
Legua, P. Campíns-Falcó, Polydimethylsiloxane composites containing
1,2-naphtoquinone 4-sulphonate as unique dispositive for estimation
of casein in effluents from dairy industries, Analytica Chimica Acta. 873
(2015) 31-37. Impact factor (JCR 2018): 4.950. Contribution 50%.
3. A. Argente-García, M. Muñoz-Ortuño, C. Molins-Legua, Y. Moliner-
Martínez, P. Campíns-Falcó, A solid device based on doped hybrid
composites for controlling the cdosage of the biocide N-(3-aminopropyl)-
N-dodecyl-1,3- propanediamine in industrial formulations, Talanta. 147
(2016) 147-154. Impact factor (JCR 2018): 4.162. Contribution 100%.
4. M.C. Prieto-Blanco, A. Argente-García, P. Campíns-Falcó, A capillary liquid
chromatography method for benzalkonium chloride determination as a
component or contaminant in mixtures of biocides, Journal of
Chromatography A, 1431 (2016) 176-183. Impact factor (JCR 2018): 3.981.
5. Argente-García, Y. Moliner-Martínez, E. López-García, P. Campíns-Falcó,
R. Herráez-Hernández, Application of Carbon Nanotubes Modified
Coatings for the Determination of Amphetamines by In-Tube Solid-Phase
Microextraction and Capillary Liquid Chromatography, Chromatography, 3
(2016) 7-21. Contribution 100%.
6. Argente-García, Y. Moliner-Martínez, P. Campíns-Falcó, J. Verdú-Andrés,
R. Herráez-Hernández, Determination of amphetamines in hair by
integrating sample disruption, clean-up and solid phase derivatization,
Journal of Chromatography A. 1447 (2016) 47-56. Impact factor (JCR
2018): 3.981. Contribution 100%.
7. Argente-García, N. Jornet-Martínez, C. Molins-Legua, Y. Moliner-Martinez,
P. Campíns-Falcó, A solid colorimetric sensor for the analysis of
amphetamine-like street samples, Analytica Chimica Acta. 943 (2016) 123-
130. Impact factor (JCR 2018): 4.950. Contribution 100%.
8. J. Navarro-Sánchez, A. Argente-García, Y. Moliner-Martínez, D. Roca-
Sanjuán, Dmytro Antypov, P. Campíns-Falcó, Matthew J. Rosseinsky, C.
Martí-Gastaldo, Peptide Metal−Organic Framework for Enantioselective

Annex
370
Separation of Chiral Drugs, Journal of the American Chemical Society. 139
(2017) 4292-4297. Impact factor (JCR 2018): 13.858. Contribution 50%.
9. Argente-García, N. Jornet-Martínez, R. Herráez-Hernández, P. Campíns-
Falcó, A passive solid sensor for in-situ colorimetric estimation of the
presence of ketamine in illicit drug samples, Sensors and Actuators B. 253
(2017) 1137-1144. Impact factor (JCR 2018): 5.401. Contribution 100%.
10. Argente-García, L. Hakobyan, C. Guillem, P. Campíns-Falcó, A new method
for estimating diphenylamine in gunshot residues as a new tool for
identifying both, inorganic and organic ones, in the same sample.
Submitted. Contribution 50%.
11. Y. Moliner-Martínez, A. Argente-García, R. Herráez-Hernández, J. Verdú-
Andrés, C. Molins-Legua, P. Campins-Falcó, Environmental Applications of
Instrumental Chemical Analysis, Determination of organic pollutants in
environmental samples, Part II, Chapter 14, Mahmood Barbuooti. Apple
Academic Press. CRCpress, a Taylor & Francis Group, 471-532, 2015, ISBN
9781771880619. Contribution 100%.
12. Argente-García, N. Jornet-Martínez, C. Molins-Legua, Y. Moliner-Martínez,
J. Verdú-Andrés, R. Herráez-Hernández, P.Campins-Falcó, Sensor
colorimétrico basado en nanopartículas de plata para la determinación de
compuestos volátiles de sulfuro, Patent 201600440, Presentation data:
24/05/2016. Contribution 100%.