Enantioselective analysis of methadone in saliva by liquid chromatography–mass spectrometry

Journal of Chromatography A, 1063 (2005) 57–69
Fully automated micro- and nanoscale one- or two-dimensionalhigh-performance liquid chromatography system for liquid
chromatography–mass spectrometry compatible with non-volatilesalts for ion exchange chromatography
Junichi Masudaa,b, Dawn M. Maynarda, Masayuki Nishimurab, Teruhisa Uedac,Jeffrey A. Kowalaka, Sanford P. Markeya,∗
a Laboratory of Neurotoxicology, National Institute of Mental Health, National Institute of Health, Bethesda, MD 20892-1262, USAb Shimadzu Scientific Instruments Inc., Columbia, MD 21046, USA
c Shimadzu Corporation, Kyoto 604-8511, Japan
Received 10 May 2004; received in revised form 17 November 2004; accepted 23 November 2004
A
has beend e of a varietyo nd evaluatedf ingt m is fullya oducibilitya equired foriP
K (MS)
1
irs
pmtMR
sorp-e-
arebead-
pro-table
e. Acapa-phic
/MSse-
0d
bstract
A one- or two-dimensional high performance liquid chromatography system for electrospray ionization mass spectrometerseveloped that is optimized for ion exchange and reversed phase separations. A unique and simple valve configuration permits the usf non-volatile salts; ammonium sulfate was used in an example of strong cation exchange separations. The system was designed a
or both micro- and nanoflow chromatography. The peptide detection limit was∼100 fmol for micro- and 20 fmol for nanoflow, demonstrathe concentration and mass sensitivity improvements expected with nanoelectrospray ionization. The 1D/2D-HPLC MS systeutomated for routine peptide analyses, compatible with direct injection of proteolytic digests, and exhibits chromatographic reprnd sensitivity. Software permits operator selection of either a 1D or 2D configuration with corresponding system parameters as r
ndividual samples. The hardware elements and resulting performance are described in this paper.ublished by Elsevier B.V.
eywords:Proteomics; Two-dimensional high performance liquid chromatography (2D-HPLC); Electrospray ionization (ESI); Mass spectrometry
. Introduction
Proteomic analyses aim to characterize multiple proteinsn diverse samples as comprehensively as possible. Cur-ently, methods combining polyacrylamide gel electrophore-is (1D or 2D PAGE) protein separations with either time of
Abbreviations: 1D, one-dimensional; 2D, two-dimensional; PAGE,olyacrylamide gel electrophoresis; HPLC, high performance liquid chro-atography; MS, mass spectrometry; MS/MS, tandem mass spectrome-
ry; RP, reversed phase; IEX, ion exchange; ESI, electrospray ionization;ALDI-TOF, matrix-assisted laser desorption/ionization time-of-flight;.S.D., relative standard deviation; S/N, signal-to-noise∗ Corresponding author. Tel.: +1 301 496 4022; fax: +1 301 451 5780.E-mail address:[email protected] (S.P. Markey).
flight mass spectrometry using matrix assisted laser detion/ionization (MALDI-TOF) or tandem mass spectromtry (MS/MS) using online electrospray ionization (ESI)widely used[1–4]. Protein level separations in HPLC cancomplicated due to constraints imposed by the diversesorptive and solubility properties of proteins. Completeteolysis of proteins into peptides produces a more tracmixture amenable to HPLC with ESI-MS/MS[5,6], althoughdigestion greatly increases the complexity of the mixturcomplete system for peptide analyses requires an HPLCble of high resolution separation, the use of chromatograsolvents and flow rates compatible with ESI, and MSinstrumentation with comprehensive software tools forquence assignments and database collation.
021-9673/$ – see front matter. Published by Elsevier B.V.oi:10.1016/j.chroma.2004.11.084

58 J. Masuda et al. / J. Chromatogr. A 1063 (2005) 57–69
We have investigated 2D-HPLC for high resolution pep-tide separations. The most important issues for maximizingpeak capacity in 2D-HPLC are the selection of orthogonalchromatographic modes and the design for connecting thefirst and second dimensions. Several separation modes, in-cluding ion exchange (IEX), reversed phase (RP), and size ex-clusion (SEC) have been recommended for 2D-HPLC[7,8].IEX or SEC can be used for the first dimension, becausecolumn loading capacity and sample recovery are more im-portant than resolving power or selectivity. IEX has a largerloading capacity than other chromatographic modes, but IEXmay exhibit optimal performance with salt or pH gradientscontaining concentrated and non-volatile salt buffers that areincompatible with ESI and MS operations. RP is a logicalsecond dimension mode because of its high resolution anduse of aqueous-organic solvents that are ESI compatible.
The design for coupling the first and the second dimen-sion of chromatography is critical for realizing the aggregatepotential of both separations. Multidimensional Protein Iden-tification Technology (MudPIT) uses the simplest approach;a single column packed with both IEX and RP resins as de-scribed by Washburn et al.[6]. Several designs have beenreported using two separate columns for the first dimensionand the second dimension, individually[9–12]. Opiteck et al.[10] described mounting two collection tubes on a switchingv n isl luenti ts int im-ib gef ulti-p mni , withe para-t n thec sys-t withd Xc lutedb ick-l alvea oopo itf
iquev ltingi LCs mi-c n)c ro-br as ar np form of our
system allows automated direct analyses of protein digestswithout sacrificing the high performance of conventionalHPLC for compatibility with ESI. The performance of thissystem is described with the resulting data presented. Addi-tionally, the valve configuration developed for 2D has led to arobust 1D trapping injection technique useful for microscaleor nanoscale HPLC using a commercial autosampler.
2. Experimental
2.1. Chemical reagents
Acetonitrile (HPLC grade) was purchased from Burdick &Jackson (Muskegon, MI, USA). Chemicals purchased fromSigma–Aldrich Corp. (St. Louis, MO, USA) include dithio-threitol (99%), ethylenediaminetetraacetic acid disodium salt(EDTA-Na2), calcium chloride (96% ACS), formic acid(98%), ammonium sulfate (ultra-pure 99.999%), and ammo-nium formate (ultra-pure 99.995%). Water was obtained froma NANOpure ultra water purification system manufactured byBarnstead (Dubuque, IA, USA).
2.2. Sample preparation
pur-c ble;b vine� ytes,l ker’sy pH8 Md toy rem ega,M 5:1s 37o re-p As
2
uiltu , in-c Aot Ht y-ocs ) at1
ix-p nda ap;
alve. Using this mechanism, eluent from the first columoaded into one tube, the tubes interchanged, and the es then loaded onto a RP column. Eluent, including salhe SCX buffer, flows directly into the ESI and MS. Two slar configurations were reported by Opiteck et al.[11] andy Wagner et al.[12]. Both use an SEC or IEX first sta
ollowed by matched dual RP columns mounted on mort switching valves. Sample eluting from the first colu
s trapped and concentrated on alternate RP columnslution programs timed to synchronize the gradient se
ions. Sample concentration improved the separations ohromatogram relative to using a sample loop. Neitherem included desalting. M.T. Davis described a designesalting capability[9]. Analytes in the effluent from the SColumn were collected on a trapping column, and then ey back-flushing in a small volume onto a RP column. L
ider described a vented column design with a multiport vnd T-joint for nanoliter sample loading from the sample lf an autosampler[13]. However, this system did not perm
ully automated 2D operation.We have designed a new configuration using a un
alve combination for online sample trapping and desan order to achieve a fully automated two-dimensional HPystem compatible with ESI-MS. The system has bothroflow (1–10�L/min) and nanoflow (200–400 nL/miapabilities. Microflow retains the high capacity andustness of larger diameter columns (150–300�m i.d.) foroutine analyses; nanoflow increases ESI sensitivityesult of increased concentration[14–16]. There have beerevious publications describing 2D-HPLC systemsass spectrometry, but the operation and performance
Standard proteins for system validation werehased from Sigma–Aldrich in the highest purity availaovine serum albumin (BSA), equine apomyoglobin, bo-casein, carbonic anhydrase from bovine erythroc
ysozyme from chicken egg white and enolase from baeast. Each protein was solubilized in 50 mM Tris–HCl,.0 (Quality Biological Inc., Gaithersburg, MD, USA) 50 mithiothreitol, 5 mM EDTA and 10 mM calcium chlorideield 50 pmol/�L final concentration. Protein solutions weixed and sequencing grade modified trypsin (Promadison, WI, USA) was added into each solution at 2
ubstrate: enzyme ratio. Each solution was incubated at◦Cvernight and stored at−20◦C. Standard samples were pared by dilution of protein digests with mobile phaseolution for liquid chromatography analyses.
.3. Trapping injection for 1D analyses
All major components for the HPLC system were bsing LC-VP series liquid chromatograph componentsluding the LC-10ADVP solvent delivery pump, DGU-14nline degasser, SIL-10ADVP autosampler, SCL-10AVP sys-
em controller, CTO-10ACVP column oven and FCV-12Awo-position switching valve (Shimadzu Corporation, Kto, Japan) with microflow control firmware for the 300�molumn (BetaBasic-18, 0.3 mm× 100 mm, 5�m particleize; Thermo Hypersil-Keystone, Bellefonte, PA, USA0�L/min flow rate without a flow splitting device.
The microflow system employed a two-position sort switching valve, FCV-12AH, as a switching valve a0.5 mm× 2 mm RP trapping column (Peptide CapTr

J. Masuda et al. / J. Chromatogr. A 1063 (2005) 57–69 59
Fig. 1. Schematic flow diagram of 1D trapping injection system. The switching valve is alternated between sample loading (dotted line) or analysis (doubleline) positions.
Michrom BioResources Inc., Auburn, CA, USA) mountedon the FCV-12AH. A schematic diagram of the trappinginjection system is shown inFig. 1. RP mobile phase Aand sample loading buffer contains acetonitrile:water:formicacid = 5:95:0.1 (v/v/v) and RP mobile phase B contains ace-tonitrile:water:formic acid = 80:20:0.1.
Sample solutions were injected using the SIL-10AD au-tosampler. For sample loading, mobile phase A was pumpedat 50�L/min, and after a 3 min loading, trapping, and desalt-ing period, the position of the switching valve was changedto an analysis position to elute the trapped target materialsonto a 0.3 mm× 100 mm C18 RP column, operated at roomtemperature.
The nanoscale system substituted a Cheminert CN2 6-port two-position switching valve (Valco Instrument Co. Inc.,Houston, TX, USA) for the FCV-12AH used on the microsys-tem. The column was a 0.075 mm× 100 mm BetaBasic-18RP column mounted on the PicoView nanospray ESI inter-face (New Objective, Woburn, MA, USA) and was operatedat a flow rate of 400 nL/min, which was achieved using a flow-splitting device consisting of a pressure regulator (UpchurchScientific, Oak Harbor, WA, USA) and a T-joint with thepump flow rate at 15�L/min. Sample loading and trappingwas performed as described for microscale chromatography.
2
LCs dualb nds lting.T inga othF aryv alC ping
onto individual CapTraps, followed by desalting and backflush loading onto a RP column. The process was automatedusing two controllers as shown inFig. 2(a–c) (schematic flowdiagram) andFig. 3(time chart of the control program). Thefirst controller manages the time sequence and synchronizesdata acquisition, injection and SCX gradient elution; thesecond controller directs the RP analysis cycle and issubservient to the first. A CTO-10ACVP column oven wasused to thermostat both the SCX and RP columns at 40◦C.
Sample was loaded onto a 1.0 mm× 50 mm SCX column(PolySulfoethyl A; Poly LC Inc., Columbia, MD, USA) op-erating 80�L/min total flow rate. SCX mobile phase A wasammonium formate buffer which contained 5 mM ammo-nium formate and 5 mM formic acid. SCX mobile phase Bwas the same as mobile phase A plus 100 mM ammoniumsulfate. Samples were eluted using a six-step salt gradient.Each SCX salt step used a 5 min trapping period, longerthan the 3 min used for 1D, in order to allow elution with10 SCX column bed volumes with each of the six selectablesteps of B buffer, 0–100%. Peptides eluted in a given SCXstep were trapped onto individual CapTraps mounted on the14-port rotary valve. After trapping of peptides from all sixstep elution events was completed, the position of one six-port two-position switching valve (valve A) was changed toconnect the flow of the desalting solution through the Cap-T ica ve( am-p lutedo edt mo-b for3 0%o ingt ther d on
.4. Microscale automated 1D/2D system configuration
By expanding the trapping column concept, the HPystem was converted to an automated 2D system withinary gradient elution capabilities for the first (SCX) aecond (RP) dimensions, and a single pump for desahis system has a unique valve configuration utilizcombination of two six-port two-position valves (b
CV-12AH) for solvent switching and one 14-port rotalve (Valco ST six-position valve) on which six individuapTraps were mounted. The configuration enabled trap
rap. Desalting was performed for 3 min with 0.1% formcid at 80�L/min, and then the six-port two-position valvalve B) was rotated to the RP analysis position. The sle trapped on the CapTrap was back-flushed and ento a 0.3 mm× 100 mm C18 RP column directly coupl
o an ESI mass spectrometer. Gradient elution with RPile phases A and B was programmed to flow 10% Bmin, linearly increase to 60% B over 30 min, then to 8ver 5 min, and hold at 80% B for 5 min before returno 10% B to re-equilibrate for 17 min. The duration ofe-equilibration step was determined empirically base

60 J. Masuda et al. / J. Chromatogr. A 1063 (2005) 57–69
Fig. 2. (a–c) Schematic representations of the microscale 2D-HPLC system. There are six individual trapping columns mounted on the 14-port rotary valve(port 1–1′, is shown; not shown are those between 2 and 2′, 3 and 3′, etc.) valve A functions as solvent selector for the RP mobile phase or desalting. Valve Balternates between trapping and RP analyses. Valve positions for trapping function are shown in panel (a), desalting (b), analysis (c).
the time required for the total ion current to stabilize, result-ing in longer re-equilibration time than conventionally usedfor RP.
The cycle of desalting, loading onto RP column, and sep-aration on RP column was repeated for each CapTrap, that
is, for each ion exchange fraction. During the last RP anal-ysis, the SCX column was washed extensively with 100%SCX mobile phase B and then switched to allow 30 min re-equilibration at 0% of SCX B buffer prior to the next sampleinjection.

J. Masuda et al. / J. Chromatogr. A 1063 (2005) 57–69 61
Fig. 3. Sequence event program time chart for the microscale 2D-HPLC system. SCX step gradient elution was performed in the first segment of this timechart indicated as Trap. Each RP analysis proceeds after desalting. During the six RP analyses, the SCX column is washed with a high concentration of saltsolution buffer B and is equilibrated prior to the next sample analysis cycle.
2.5. Nanoscale automated 1D/2D system configuration
A combination of two six-port two-position valves (20 nLinternal volume, port-to-port) was used because the 14-portrotary valve used for the microflow system had too largean internal volume for nanoflow rates. The nanoflow andmicroflow system configurations were very similar; how-ever, the control program was different for the trapping cy-cle. In the nanoflow system, the sample was loaded ontoa SCX column and trapping was performed for 5 min at80�L/min flow rate at room temperature, then the posi-tion of one valve on which the SCX column was mountedwas rotated to allow desalting for 4 min with 0.1% formicacid at 80�L/min. Finally, the position of the low internalvolume six-port two-position valve was rotated into the RPanalysis position and the desalted sample was eluted fromthe CapTrap and loaded onto a 0.075 mm× 100 mm C18RP column at a flow rate of 400 nL/min. The RP columnwas operated at room temperature. The sample was elutedisocratically with 10% RP buffer B for 3 min, followed bya linear gradient programmed first to 60% B over 40 min,and then to 80% B for 5 min. The concentration of RP mo-bile phase B was reduced to 10% over 2 min, and then re-equilibrated over 25 min with 10% B to stabilize both theinitial column conditions and the total ion current in them le ofS d sixt anal-y CXp s, theS mnf ol-u atic
flow diagrams and the timing control program are shown inFigs. 4(a–c) and 5.
2.6. Online ESI-MS analyses
The HPLC system was directly connected to an LCQ iontrap mass spectrometer (Thermo Electron Corporation, SanJose, CA, USA). For either 1D or 2D microscale analyses,the standard ESI source optimized for a 10�L/min flow ratewas used. For nanoflow analyses, a PicoView nanoelectro-spray ESI source (New Objective) optimized for a 400 nL/minflow rate, was used. Data acquisition was performed usingeither of two data dependent scanning sequences with dy-namic exclusion. The ‘triple play’ sequence cycled betweenfull MS scan, zoom scan, and MS/MS acquisitions. A ‘big-5’sequence, cycled between full MS scans and MS/MS scansfor the five most intense ions in the MS spectrum. In the‘big-5’ sequence, no zoom scan is collected in order to in-crease the effective duty cycle of the mass spectrometer. Themass scan range was from 400 to 1800m/z. The voltage forESI was set at 5 kV for microscale LC–MS/MS at 10�L/minflow rate, 2.1 kV for nanoscale LC–MS/MS at 400 nL/minflow rate.
2.7. Database searching and data processing
d in-t Sci-e BLd t re-p ftwareD -t ta set
ass spectrometer. For the nanoflow system, the cycCX elution, desalting and RP analysis was repeate
imes sequentially using the same CapTrap. During RPsis, the SCX column was switched “off-line” and the Sumps stopped. When the last RP step was in progresCX B buffer was set at 100% to wash the SCX colu
or 40 min and then back to 0% B to condition the cmn for 40 min before the next sample cycle. Schem
MS/MS spectral data were processed for automateerpretation using the Mascot search engine (Matrixnce Ltd., London, UK) to search the Swiss-Prot/TrEMatabase. The information contained in individual Mascoorts was parsed into a relational database using the soBParser, as described by Yang et al.[17]. DBParser facili
ated the concatenation of multiple data sets, multiple da

62 J. Masuda et al. / J. Chromatogr. A 1063 (2005) 57–69
Fig. 4. (a–c) Schematic representations of the nanoscale 1D/2D-HPLC system. A single trapping column was used repeatedly in this configuration. Duringeach RP analysis, valve B was set at the dotted position. The SCX column containing retained material was connected as a closed loop to prevent inadvertentelution or leakage. Valve A selects solvents for trapping or desalting. Valve flow paths for trapping are shown in panel (a) desalting (b) analysis (c).When usedfor 1D analysis, the SCX column mounted on valve B was offline (double line pathway on valve B) and the sample was injected onto the trapping column asdescribed for the 1D trapping injection system. The 1D/2D modes are software selectable.

J. Masuda et al. / J. Chromatogr. A 1063 (2005) 57–69 63
Fig. 5. Sequence event program time chart for the nanoscale 2D-HPLC system. The SCX step gradient elution proceeds independently prior to each desalting,injection and RP analysis, with cycles repeating in succession. In the final cycle, the SCX column was washed with a high concentration of salt solutionB andwas equilibrated prior to the next sample analysis cycle.
Fig. 6. Plotted re-constructed ion chromatograms in a stacked format showing increasing concentrations of standards using 1D microscale system, containing100–1000 fmol of tryptic digests of BSA,�-casein and apomyoglobin.The retention times of the five major peaks (A–E) varied by 0.72, 0.33, 0.45, 0.51, 0.46%R.S.D., respectively (n= 5). The S/N calculated for the 100 fmol sample for peaks A and B is 3.8; peak E 2.5; and for peaks C and D, 8.5 (noise level wasaveraged at three points on the chromatogram).

64 J. Masuda et al. / J. Chromatogr. A 1063 (2005) 57–69
Fig. 7. Chromatographic patterns for SCX elution. Sample contained 50 pmol of apomyoglobin and BSA and 100 pmol of�-casein. The step gradient contained0, 10, 20, 50, and 100% of B solution for 5 min intervals. Chromatogram is UV absorbance at 280 nm. The solid line chromatogram was obtained with 100 mMammonium sulfate in B; the dotted line is 200 mM ammonium sulfate. The SCX step gradient profile is indicated by alternate long and short dashed lines.
Fig. 8. Organic modifier in SCX buffer solution decreases trapping of peptides. Increasing concentrations of acetonitrile were used with 50% B concentra-tion, 50 mM ammonium sulfate at 80�L/min flow rate. The reconstructed ion chromatographic pattern changed markedly with greater than 5% acetonitrileconcentrations due to reduced sample trapping recovery.
J. Masuda et al. / J. Chromatogr. A 1063 (2005) 57–69 65
Fig. 9. The effect of ammonium sulfate concentration on trapping efficiency. Re-constructed ion chromatograms indicate minimal salt concentrationeffects onthe trapping recovery.
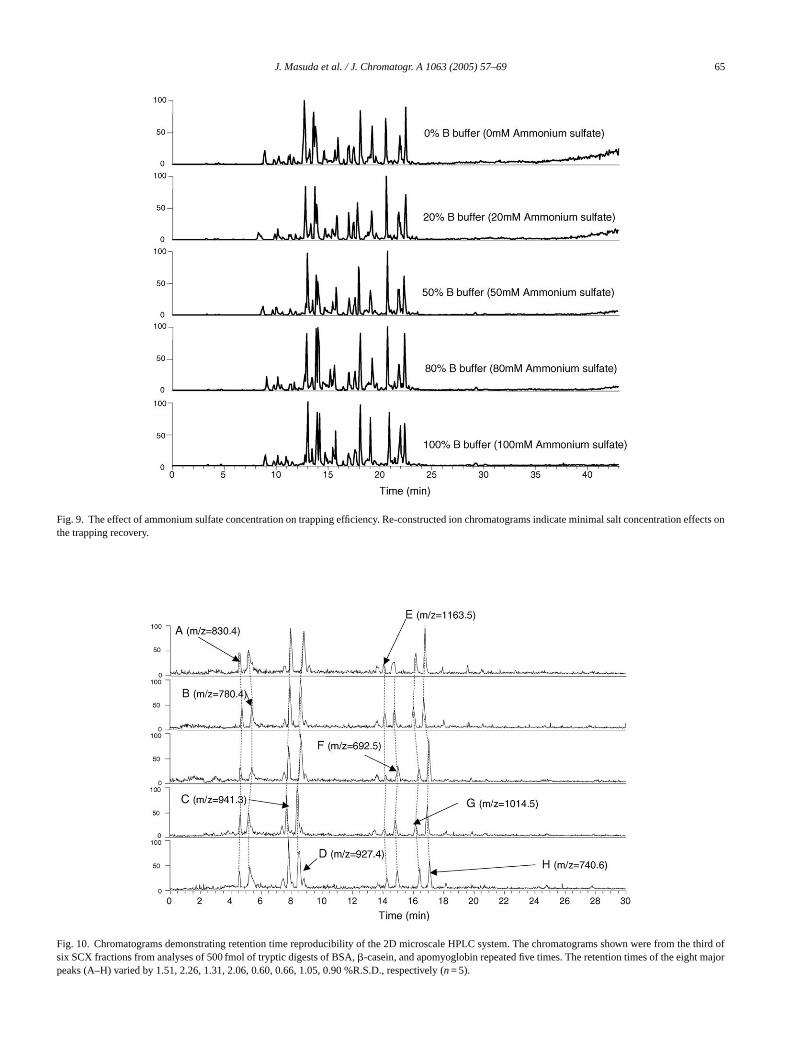
Fig. 10. Chromatograms demonstrating retention time reproducibility of the 2D microscale HPLC system. The chromatograms shown were from the third ofsix SCX fractions from analyses of 500 fmol of tryptic digests of BSA,�-casein, and apomyoglobin repeated five times. The retention times of the eight majorpeaks (A–H) varied by 1.51, 2.26, 1.31, 2.06, 0.60, 0.66, 1.05, 0.90 %R.S.D., respectively (n= 5).

66 J. Masuda et al. / J. Chromatogr. A 1063 (2005) 57–69
comparisons, and the production of context-specific reports,e.g., a list of unique peptide and proteins in each data set.
3. Results and discussion
3.1. Trapping injections
Low column flow rates are required to improve mass sen-sitivity for ESI. However, sample loop injections are prob-lematic at microflow rates (and especially nanoflow rates)because the relatively large sample loop or sample injectionvolume necessitates excessively lengthy loading periods andcan cause peak broadening. Consequently, a trapping columnoffers a mechanism to separate sample injection flow from theanalytical column flow. A trapping column should be matchedto have similar, but slightly weaker retention properties, thanthe subsequent analytical column. Ideally, trapped analyteswill be released by a lower eluotropic strength mobile phase,and will be re-concentrated at the head of the analytical col-umn, a process resulting in sharper peaks. The choice of apolymeric C18 trapping column and a silica based C18 an-alytical column meets these requirements. Secondarily, thetrapping, release and re-concentration cycle produces anotherstage of desalting, a desirable side-benefit for ESI.
n inF stso stocks mol
(10�L of 10 fmol/�L), 200 fmol (10�L of 20 fmol/�L) to1 pmol (10�L of 100 fmol/�L), and were injected sequen-tially into the automated 1D microflow system using an au-tosampler. The reproducibility of retention times of majorpeaks was 0.3–0.8 %R.S.D.; the limit of detection, as deter-mined from reconstructed ion chromatograms, was approx-imately 100 fmol based on the representative signal to noiseratio of each peak (S/N≥ 3) as shown inFig. 6.
3.2. Microscale automated 2D configuration
A microscale automated 2D configuration was built with aunique valve configuration selected to meet the requirementsof first dimension SCX and second dimension RP mode.Desalting was performed using a combination of switchingvalves that allowed the use non-volatile strong salts such asammonium sulfate without resulting in salt deposition on theinlet surfaces of the mass spectrometer. The chromatographicelution pattern from an SCX column (1.0 mm× 50 mm Polysulfoethyl A) is shown inFig. 7 for a mixture of 50 pmoltryptic digests of apomyoglobin and BSA with 100 pmol of�-casein using a UV detector (SPD-10AVP, Shimadzu) withsemi-micro flow cell at 280 nm. Optimal SCX column per-formance would be attained if acetonitrile was added[18],but organic modifiers preclude efficient trapping and reducer tec ated.I ry orR
Fw
The evaluation of trapping column configuration showig. 1was performed using serial dilutions of tryptic digef protein standards. Samples were prepared from theolution of each digest in 100 fmol increments, i.e., 100 f
ig. 11. Reconstructed ion chromatograms of analyses using 1D RP (top panith 0, 10, 20, 30, 50 and 100% of B buffer containing 100 mM of ammonium
ecovery as shown inFig. 8. The effect of ammonium sulfaoncentration on the second dimension RP was evaluncreasing salt concentration did not affect the recoveP performance as shown inFig. 9.
el) and 2D SCX-RP (2D-1 through 2D-6) are displayed. SCX fractions were elutedsulfate, respectively. Relative intensity is not same for each chromatogram.

J. Masuda et al. / J. Chromatogr. A 1063 (2005) 57–69 67
3.3. Reproducibility and comparison ofchromatographic elution patterns between 1D and 2D
Chromatographic reproducibility was evaluated by mea-suring relative standard deviation of retention times foreight major peaks in the third SCX fraction on the RPchromatogram of 500 fmol a mixture of three protein di-gests (BSA,�-casein and apomyoglobin) (n= 5) as shownin Fig. 10. The measured %R.S.D. of each major peakwas 0.5–2%. Chromatographic elution patterns using trap-ping column injection and 1D RP and 2D SCX/RP anal-yses are stack-plotted inFig. 11 for a mixture of trypticdigests of six proteins. Components appearing on the 1D
RP chromatogram are dispersed into each of the 2D SCXfractions.
3.4. Nanoflow 1D/2D configuration
Both microflow and nanoflow configurations used thesame trapping injection concept. However, nanoflow injec-tion requires that volumes be lower than for microflow due tothe reduced capacity of the 0.075 mm× 100 mm RP column.Trapping injection was evaluated for the nanoflow configura-tion at an optimized flow rate of 400 nL/min and substitutinga six-port two-position switching valve with lower internalport-to-port volume. The resulting sensitivity gain over the
Fucc
ig. 12. (a) Plotted re-constructed ion chromatograms in a stacked format fosing the 1D nano- vs. the microscale system. Samples contain from 10 thromatogram from 0 to 10 min from one analysis shown in (a). The base lineolumn, indicating that the void volume displacement is approximately 7 min
r the same protein digest demonstrating approximately 10-fold higher sensitivityo 300 fmol of the three tryptic digests. (b) An expanded portion of the total ionfluctuation from 4 to 7 min reflects elution of desalting solution from the trapping
.

68 J. Masuda et al. / J. Chromatogr. A 1063 (2005) 57–69
Fig. 13. Reconstructed ion chromatogram from injections varying from 20 to 500 fmol of tryptic digests of BSA,�-casein and apomyoglobin demonstratingincreased sensitivity for nanoscale chromatography with ESI MS. These chromatograms were the second SCX fractions of each sample analysis. Peaks with(*) are due to contamination.
Fig. 14. Chromatograms demonstrating reproducibility of the 2D nanoscale HPLC system. The chromatograms shown were the second of six SCX fractionsfrom analyses of 500 fmol of tryptic digests of BSA,�-casein, and apomyoglobin repeated five times. The retention times of the eight major peaks (A–H)varied by 2.35, 2.38, 1.97, 1.40, 1.29, 1.29, 0.91, 0.77 %R.S.D., respectively (n= 5).

J. Masuda et al. / J. Chromatogr. A 1063 (2005) 57–69 69
microflow system (Fig. 6) is seen in the serial dilutions from10 fmol to 1 pmol of protein digest mixtures inFig. 12(a).These data indicate that nanoflow sensitivity was about 10times higher than microflow, consistent with the predictedconcentration increase. The internal volume of the trappingcolumn and the switching valve were acceptable for nanoflowas the void volume retention time associated with the loadingtime from the trapping column to RP column was determinedto be about 7 min shown asFig. 12(b).
For the nanoflow configuration, it was also necessary tosubstitute lower internal volume rotary valves. For mechan-ical reliability and longevity, three two-position valves wereused as shown inFig. 4(a–c). Because the SCX column wasmounted on a two-position valve, it could be switched off-line from the flow path between steps to prevent inadvertentelution. Valve A inFig. 4(a) and (b) serves for SCX solventselection or desalting. We found that 4 min of desalt washwas necessary and sufficient to avoid deposition of any saltresidue on the surface of the mass spectrometer heated capil-lary inlet. The results of injecting a concentration ladder from20 fmol to 1 pmol indicated that 1D and 2D systems exhibitedthe same sensitivity (Fig. 13).
Alternatively, the valve configuration shownFig. 4(a–c)can be used for 1D RP analysis by software selection of valveposition selections. For 1D analyses, sample injection is per-f edi
3
tionw andr o-m fiver ont re-s luatef bin.T esea m exh ems,r en-t
TN atedM nanoH
A
135
A arserp
4. Conclusions and perspectives
Employing a unique valve configuration permits routinemicroflow and nanoflow automated software controlled 1D or2D-HPLC. Software controlled valves achieve efficient on-line desalting, permitting ion exchange chromatography withnon-volatile salts in the first dimension. The automated in-jection trapping and desalting are compatible with repetitive,routine direct injections of peptide digests for high sensitivitynanoflow 1D or 2D-HPLC ESI-MS for proteomics research.
Acknowledgments
This research and system development was based onthe Cooperative Research and Development Agreement(CRADA) between National Institute of Health and Shi-madzu Corporation. The authors thank Dr. X. Yang for herassistance.
References
[1] U. Hellman, C. Wernstedt, J. Gonez, C.H. Heldin, Anal. Biochem.224 (1995) 451.
[2] A.L. McCormack, D.M. Schieltz, B. Goode, S. Yang, G. Barnes, D.
68
or-
001)
igh-New
R.00)
.H.hro-
[ nal.
[ nal.
[ R.
[ . 74
[ 94)
[ ass
[ s, H.dson,
[ Ep-004)
[
ormed with the SCX column in the offline position describn Fig. 4(a).
.5. Performance of 1D/2D nanoflow automated system
The performance of the 1D/2D nanoflow configuraas evaluated with regard to sensitivity, reproducibility,
eliability. To illustrate reproducibility in the 2D mode, chratograms of the second of the six SCX fractions from
epeat runs are plotted inFig. 14. The measured retentiime variation of major peaks was 0.8–2.4 %R.S.D. Theults of automated Mascot database searches were evaor 20–200 fmol concentrations of BSA and apomyogloable 1shows the number of identified peptides from thnalyses and demonstrates that the 2D nanoHPLC systeibits performance attainable with non-automated systequisite for routine high sensitivity peptide and protein idification.
able 1umber of identified peptides from BSA and apomyoglobin using automascot MS/MS ion search for data acquired using the automated 2DPLC system
mount injected (fmol) Number of identified peptides
BSA Apomyoglobin
20 1 150 5 100 3 100 8 400 11 6
ll peptides exhibited ion scores greater than identity scores. The DBProgram extracted the summary peptide lists[17].
d
-
Drubin, J.R. Yates, Anal. Chem. 69 (1997) 767.[3] A. Shevchenko, M. Wilm, O. Vorm, M. Mann, Anal. Chem.
(1996) 850.[4] J.R. Yates, J. Mass Spectrom. 33 (1998) 1.[5] A.J. Link, J. Eng, D.M. Schieltz, E. Carmack, G.J. Mize, D.R. M
ris, B.M. Garvik, J.R. Yates, Nat. Biotechnol. 17 (1999) 676.[6] M.P. Washburn, D. Wolters, J.R. Yates, Nat. Biotechnol. 19 (2
242.[7] J.C. Janson, L. Ryden, Protein Purification: Principles, H
Resolution Methods and Applications, second ed., Wiley-VCH,York, 1998.
[8] K.K. Unger, K. Racaityte, K. Wagner, T. Miliotis, L.E. Edholm,Bischoff, G. Marko-Varga, HRC-J. High Res. Chromatogr. 23 (20259.
[9] M.T. Davis, J. Beierle, E.T. Bures, M.D. McGinley, J. Mort, JRobinson, C.S. Spahr, W. Yu, R. Luethy, S.D. Patterson, J. Cmatogr. B Biomed. Sci. Appl. 752 (2001) 281.
10] G.J. Opiteck, K.C. Lewis, J.W. Jorgenson, R.J. Anderegg, AChem. 69 (1997) 1518.
11] G.J. Opiteck, S.M. Ramirez, J.W. Jorgenson, M.A. Moseley, ABiochem. 258 (1998) 349.
12] K. Wagner, K. Racaityte, K.K. Unger, T. Miliotis, L.E. Edholm,Bischoff, G. Marko-Varga, J. Chromatogr. A. 893 (2000) 293.
13] L.J. Licklider, C.C. Thoreen, J. Peng, S.P. Gygi, Anal. Chem(2002) 3076.
14] M.R. Emmett, R.M. Caprioli, J. Am. Soc. Mass Spectrom. 5 (19605.
15] M. Kinter, Protein Sequencing and Identification using Tandem MSpectrometry, Wiley-Interscience, New York, 2000.
16] K. Vanhoutte, W. Van Dongen, I. Hoes, F. Lemiere, E.L. EsmanVan Onckelen, E. Van den Eeckhout, R.E. van Soest, A.J. HuAnal. Chem. 69 (1997) 3161.
17] X. Yang, V. Dondeti, R. Dezube, D.M. Maynard, L.Y. Geer, J.stein, X. Chen, S.P. Markey, J.A. Kowalak, J. Proteome Res. 3 (21002.
18] A.J. Alpert, P.C. Andrews, J. Chromatogr. 443 (1988) 85.
Copyright © 2022 FDOKUMEN