A Multidimensional Differential Proteomic Platform Using Dual-Phase Ion-Exchange...
10
A Multidimensional Differential Proteomic Platform Using Dual-Phase Ion-Exchange Chromatography-Polyacrylamide Gel Electrophoresis/Reversed-Phase Liquid Chromatography Tandem Mass Spectrometry Andrew K. Ottens,* , ,‡,§,| Firas H. Kobeissy, ,|,⊥ Regina A. Wolper, ,§,| William E. Haskins, ,‡,§,| Ronald L. Hayes, ‡,§,|,⊥ Nancy D. Denslow, ,# and Kevin K. W. Wang ,‡,§,|,⊥ Center for Traumatic Brain Injury Studies, Center for Neuroproteomics and Biomarker Research, Departments of Neuroscience and Psychiatry, Department of Physiological Sciences, and the Evelyn F. and William L. McKnight Brain Institute of the University of Florida, Gainesville, Florida 32610 Differential proteomic analysis has arisen as a large-scale means to discern proteome-wide changes upon treatment, injury, or disease. Tandem protein separation methods are required for large-scale differential proteomic analysis. Here, a novel multidimensional platform for resolving and differentially analyzing complex biological samples is presented. The platform, collectively termed CAX-PAGE/ RPLC-MSMS, combines biphasic ion-exchange chroma- tography with polyacrylamide gel electrophoresis for protein separation, quantification, and differential band targeting, followed by capillary reversed-phase liquid chromatography and data-dependent tandem mass spec- trometry for quantitative and qualitative peptide analysis. CAX-PAGE provides high protein resolving power with a theoretical peak capacity of 3570, extendable to 7600, a wide protein mass range verified from 16 to 273 kDa, and reproducible differential sample comparison without the added expense of fluorescent dyes and imaging equipment. Demonstrated using a neuroproteomic model, CAX-PAGE revealed an increased number of differential proteins, 137, compared with 82 found by 2D difference gel electrophoresis. When combined with RPLC-MSMS for protein identification, an additional quantification step is performed for internal validation, confirming a 2-fold or greater change in 89% of identified differential targets. Proteomic characterization reveals protein dynamics incom- prehensible at the genetic level 1-4 and essential to understanding cellular function under normal or challenged conditions. 5,6 Ap- plication to the nervous system (neuroproteomics) in health and disease has recently begun; 7 however, general difficulties persist, limiting utility. Biological complexity is the principal concern. 8 The sheer number of proteins (50 000 or more) 9 and the wide dynamic concentration range overwhelm today’s technology. Many rely on two-dimensional polyacrylamide gel electrophoresis (2D-PAGE) for high-resolution protein separations. 10,11 Around since the mid 1970s, 2D-PAGE is the staple of proteomic analysis, owing to its high resolving power. However, gel-to-gel reproducibility is a problem when performing differential analysis by 2D-PAGE. 2D difference gel electrophoresis (2D-DIGE) 12-14 was introduced to alleviate this problem. Two samples are differentially labeled using matched cyanine fluorophores (Cy3 and Cy5) and combined for separation on the same gel. Differential quantification is deter- mined by subtracting two images taken at distinct excitation and emission wavelengths for each fluorophore. Associated proteins are identified using 2D-PAGE databases or mass spectrometry, though sample mixing prevents independent mass spectrometry analysis. Another limitation is the expense of the cyanine dyes and fluorescence scanner employed. Further complications have led to the development of normalization protocols using a third cyanine dye (Cy2) for sample multiplexing, 15,16 and engineering * To whom correspondence should be addressed. E-mail: [email protected]. Center for Neuroproteomics and Biomarker Research. ‡ Center for Traumatic Brain Injury Studies. § Department of Neuroscience. | McKnight Brain Institute of the University of Florida. ⊥ Department of Psychiatry. # Department of Physiological Sciences. (1) Denslow, N.; Michel, M. E.; Temple, M. D.; Hsu, C. Y.; Saatman, K.; Hayes, R. L. J. Neurotrauma 2003, 20, 401-407. (2) Freeman, W. M.; Hemby, S. E. Neurochem. Res. 2004, 29, 1065-1081. (3) Anderson, L.; Seilhamer, J. Electrophoresis 1997, 18, 533-537. (4) Gygi, S. P.; Rochon, Y.; Franza, B. R.; Aebersold, R. Mol. Cell. Biol. 1999, 19, 1720-1730. (5) Hanash, S. Nature 2003, 422, 226-232. (6) Figeys, D. Anal. Chem. 2003, 75, 2891-2905. (7) Kim, S. I.; Voshol, J.; Oostrum, J. van; Hastings, T. G.; Cascio, M.; Glucksman, M. J. Neurochem. Res. 2004, 29, 1317-1331. (8) Aebersold, R.; Mann, M. Nature 2003, 422, 198-207. (9) Wells, D. A.; Weil, D. A. LC-GC N. Am. 2003, 21, 522-538. (10) Griffin, T. J.; Aebersold, R. J. Biol. Chem. 2001, 276, 45497-45500. (11) Peng, J.; Gygi, S. P. J. Mass Spectrom. 2001, 36, 1083-1091. (12) Tonge, R.; Shaw, J.; Middleton, B.; Rowlinson, R.; Rayner, S.; Young, J.; Pognan, F.; Hawkins, E.; Currie, I.; Davison, M. Proteomics 2001, 1, 377- 396. (13) Patton, W. F. J. Chromatogr., B 2002, 771,3-31. (14) Gade, D.; Thiermann, J.; Markowsky, D.; Rabus, R. J. Mol. Microbiol. Biotechnol. 2003, 5, 240-251. (15) Unlu, M.; Morgan, E.; Minden, J. S. Electrophoresis 1997, 18, 2071-2077. (16) Freeman, W. M.; Hemby, S. E. Neurochem. Res. 2004, 29, 1065-1081. Anal. Chem. 2005, 77, 4836-4845 4836 Analytical Chemistry, Vol. 77, No. 15, August 1, 2005 10.1021/ac050478r CCC: $30.25 © 2005 American Chemical Society Published on Web 06/22/2005
-
Upload
independent -
Category
Documents
-
view
3 -
download
0
Transcript of A Multidimensional Differential Proteomic Platform Using Dual-Phase Ion-Exchange...

A Multidimensional Differential Proteomic PlatformUsing Dual-Phase Ion-ExchangeChromatography-Polyacrylamide GelElectrophoresis/Reversed-Phase LiquidChromatography Tandem Mass Spectrometry
Andrew K. Ottens,*,†,‡,§,| Firas H. Kobeissy,†,|,⊥ Regina A. Wolper,†,§,| William E. Haskins,†,‡,§,|
Ronald L. Hayes,‡,§,|,⊥ Nancy D. Denslow,†,# and Kevin K. W. Wang†,‡,§,|,⊥
Center for Traumatic Brain Injury Studies, Center for Neuroproteomics and Biomarker Research, Departments ofNeuroscience and Psychiatry, Department of Physiological Sciences, and the Evelyn F. and William L. McKnight BrainInstitute of the University of Florida, Gainesville, Florida 32610
Differential proteomic analysis has arisen as a large-scalemeans to discern proteome-wide changes upon treatment,injury, or disease. Tandem protein separation methodsare required for large-scale differential proteomic analysis.Here, a novel multidimensional platform for resolving anddifferentially analyzing complex biological samples ispresented. The platform, collectively termed CAX-PAGE/RPLC-MSMS, combines biphasic ion-exchange chroma-tography with polyacrylamide gel electrophoresis forprotein separation, quantification, and differential bandtargeting, followed by capillary reversed-phase liquidchromatography and data-dependent tandem mass spec-trometry for quantitative and qualitative peptide analysis.CAX-PAGE provides high protein resolving power with atheoretical peak capacity of 3570, extendable to 7600, awide protein mass range verified from 16 to 273 kDa,and reproducible differential sample comparison withoutthe added expense of fluorescent dyes and imagingequipment. Demonstrated using a neuroproteomic model,CAX-PAGE revealed an increased number of differentialproteins, 137, compared with 82 found by 2D differencegel electrophoresis. When combined with RPLC-MSMSfor protein identification, an additional quantification stepis performed for internal validation, confirming a 2-foldor greater change in 89% of identified differential targets.
Proteomic characterization reveals protein dynamics incom-prehensible at the genetic level1-4 and essential to understanding
cellular function under normal or challenged conditions.5,6 Ap-plication to the nervous system (neuroproteomics) in health anddisease has recently begun;7 however, general difficulties persist,limiting utility. Biological complexity is the principal concern.8 Thesheer number of proteins (50 000 or more)9 and the wide dynamicconcentration range overwhelm today’s technology. Many rely ontwo-dimensional polyacrylamide gel electrophoresis (2D-PAGE)for high-resolution protein separations.10,11 Around since the mid1970s, 2D-PAGE is the staple of proteomic analysis, owing to itshigh resolving power. However, gel-to-gel reproducibility is aproblem when performing differential analysis by 2D-PAGE. 2Ddifference gel electrophoresis (2D-DIGE)12-14 was introduced toalleviate this problem. Two samples are differentially labeled usingmatched cyanine fluorophores (Cy3 and Cy5) and combined forseparation on the same gel. Differential quantification is deter-mined by subtracting two images taken at distinct excitation andemission wavelengths for each fluorophore. Associated proteinsare identified using 2D-PAGE databases or mass spectrometry,though sample mixing prevents independent mass spectrometryanalysis. Another limitation is the expense of the cyanine dyesand fluorescence scanner employed. Further complications haveled to the development of normalization protocols using a thirdcyanine dye (Cy2) for sample multiplexing,15,16 and engineering
* To whom correspondence should be addressed. E-mail: [email protected].† Center for Neuroproteomics and Biomarker Research.‡ Center for Traumatic Brain Injury Studies.§ Department of Neuroscience.| McKnight Brain Institute of the University of Florida.⊥ Department of Psychiatry.# Department of Physiological Sciences.
(1) Denslow, N.; Michel, M. E.; Temple, M. D.; Hsu, C. Y.; Saatman, K.; Hayes,R. L. J. Neurotrauma 2003, 20, 401-407.
(2) Freeman, W. M.; Hemby, S. E. Neurochem. Res. 2004, 29, 1065-1081.(3) Anderson, L.; Seilhamer, J. Electrophoresis 1997, 18, 533-537.
(4) Gygi, S. P.; Rochon, Y.; Franza, B. R.; Aebersold, R. Mol. Cell. Biol. 1999,19, 1720-1730.
(5) Hanash, S. Nature 2003, 422, 226-232.(6) Figeys, D. Anal. Chem. 2003, 75, 2891-2905.(7) Kim, S. I.; Voshol, J.; Oostrum, J. van; Hastings, T. G.; Cascio, M.;
Glucksman, M. J. Neurochem. Res. 2004, 29, 1317-1331.(8) Aebersold, R.; Mann, M. Nature 2003, 422, 198-207.(9) Wells, D. A.; Weil, D. A. LC-GC N. Am. 2003, 21, 522-538.
(10) Griffin, T. J.; Aebersold, R. J. Biol. Chem. 2001, 276, 45497-45500.(11) Peng, J.; Gygi, S. P. J. Mass Spectrom. 2001, 36, 1083-1091.(12) Tonge, R.; Shaw, J.; Middleton, B.; Rowlinson, R.; Rayner, S.; Young, J.;
Pognan, F.; Hawkins, E.; Currie, I.; Davison, M. Proteomics 2001, 1, 377-396.
(13) Patton, W. F. J. Chromatogr., B 2002, 771, 3-31.(14) Gade, D.; Thiermann, J.; Markowsky, D.; Rabus, R. J. Mol. Microbiol.
Biotechnol. 2003, 5, 240-251.(15) Unlu, M.; Morgan, E.; Minden, J. S. Electrophoresis 1997, 18, 2071-2077.(16) Freeman, W. M.; Hemby, S. E. Neurochem. Res. 2004, 29, 1065-1081.
Anal. Chem. 2005, 77, 4836-4845
4836 Analytical Chemistry, Vol. 77, No. 15, August 1, 2005 10.1021/ac050478r CCC: $30.25 © 2005 American Chemical SocietyPublished on Web 06/22/2005

of cysteine labeling saturation versions of Cy3 and Cy5 tags,17,18
adding complexity and cost. Such limitations of 2D-PAGE technol-ogy have prompted some to explore alternative technologies.19-23
Of recent protein separation strategies, free-flow electrophore-sis (FFE) is notable for effective sample fractionation by isoelectricpoint (pI) prior to either 1D-PAGE24 or reversed-phase liquidchromatography (RPLC).25 In the latter case, the large numberof FFE fractions (80), combined with the high resolving power ofRPLC, resulted in the large theoretical peak capacity of 6720,comparable to that of traditional 2D-PAGE (103-104). Otherexamples of mixed-mode liquid chromatography, as reviewedelsewhere,19,26 include chromatofocusing,27-31 liquid-phase iso-electric focusing,30,32-34 size exclusion,27,29 ion exchange,35 and acombined size exclusion-strong cation-exchange medium,36 allas first dimensions prior to RPLC. Still others have tried usingcapillary electrophoresis in a two-dimensional mode37 or incombination with liquid chromatography.38,39 All approachesprovide reasonable resolving power; however, none as yet havemet the needed capacity to resolve an entire proteome (>104).
It is apparent from these efforts that future proteomic studieswill involve varying multidimensional separations.9,10,23 Ion-exchange chromatography has often been employed in 2Dseparations, prior to PAGE40,41 or orthogonal chromatographies.11,42
One drawback to ion exchange is that a significant portion ofprotein from a biological sample will not bind to either a positively
charged anion or a negatively charged cation exchanger due toincongruent protein surface charge. We hypothesized that moreprotein could be retained by combining cationic and anionicexchange media (CAX), either by placing columns in series orby mixing both media together. This principle had been previouslydemonstrated by El Rassi and Horvath with the separation ofsimple protein mixtures.43 Remarkably, this idea received nofurther attention, likely because no pertinent application was thenforeseen.
In translational proteomic applications, researchers are par-ticularly interested in identifying protein expression differencesor changes associated with a particular disease, injury, or treat-ment. This requires, in addition to proteome resolution, a meansto detect and quantify differences between two or more samples(e.g., control and treated). The presented platform is designedspecifically for this purpose. Combined cation-anionic exchangeplaced in series with polyacrylamide gel electrophoresis (CAX-PAGE) provides quantified selection of differential proteins,subsequently identified and further quantified by reversed-phaseliquid chromatography tandem mass spectrometry (RPLC-MSMS).In this study, we evaluate CAX-PAGE/RPLC-MSMS by comparingthe proteomes of cerebellum and cortex tissues, a model systemfor future application to biomarker discovery in brain injuryparadigms. Retention, reproducibility, sample recovery, andresolving power are examined. Differential analysis is comparedbetween CAX-PAGE and the current benchmark 2D-DIGE. Finally,the dual differential quantification strategy is verified usingdifferential and nondifferential gel band pairs.
EXPERIMENTAL SECTIONSample Preparation. Male Sprague-Dawley rats (five)
purchased from Harlan (Indianapolis, IN) were acclimated for 7days prior to sacrificing. The rats were then anesthetized with 4%isoflurane in a carrier gas of 1:1 O2/N2O (4 min) and wereperfused with 0.9% saline transcardially prior to decapitation viaguillotine. Cerebellum and cortex brain regions were dissectedand transferred to microfuge tubes kept on dry ice. Sections weresnap frozen in liquid nitrogen and then ground to a fine powdervia mortar and pestle kept on dry ice. Powder was scraped intochilled microfuge tubes to which 0.1% SDS lysis buffer (300 µL)was added, containing 150 mM sodium chloride, 3 mM ethylene-diaminetetraacetic acid (EDTA), 2 mM ethyleneglycol bis(ami-noethyl ether) tetraacetic acid (EGTA), 1% ethoxylated octylphenol(all from Sigma-Aldrich, St. Louis, MO), one tablet of CompleteMini Protease Inhibitor Cocktail (Roche Diagnostics, Mannheim,Germany), and 1 mM sodium vanadate (Fisher Scientific, FairLawn, NJ), with the sample solution brought to neutral pH usingTris-base (Sigma-Aldrich). Cell lysis was conducted over 3 h at 4°C with hourly vortexing. Lysates were spun down at 14 000 rpmat 4 °C for 10 min to remove DNA, lipids, and particulates.Supernatants were then filtered through 0.1-µm Millipore Ul-trafree-MC filters (Bedford, MA) for further clarification. Proteinconcentrations were determined via Bio-Rad DC Protein Assay
(17) Alban, A.; David, S. O.; Bjorkesten, L.; Andersson, C.; Sloge, E.; Lewis, S.;Currie, I. Proteomics 2003, 3, 36-44.
(18) Rabilloud, T. Anal. Chem. 2000, 72, 48A-55A.(19) Wang, H.; Hanash, S. J. Chromatogr., B 2002, 787, 11-18.(20) Janini, G. M.; Conrads, T. P.; Veenstra, T. D.; Issaq, H. J. J. Chromatogr., B
2003, 43-51.(21) Skold, K.; Svensson, M.; Kaplan, A.; Bjorkesten, L.; A° strom, J.; Andren, P.
E. Proteomics 2002, 2, 447-454.(22) Bergh, G. Van den; Clerens, S.; Vandesande, F.; Arckens, L. Electrophoresis
2003, 24, 1471-1481.(23) Steel, L. F.; Haab, B. B.; Hanash, S. M. J. Chromatogr. B 2005, 815, 275-
284.(24) Hoffmann, P.; Ji, H.; Mortiz, R. L.; Connolly, L. M.; Frecklington, D. F.;
Layton, M. J.; Eddes, J. S.; Simpson, R. J. Proteomics 2001, 1, 807-818.(25) Moritz, R. L.; Ji, H.; Schutz, F.; Connolly, L. M.; Kapp, E. A.; Speed, T. P.;
Simpson, R. J. Anal. Chem. 2004, 76, 4811-4824.(26) Issaq, H. J.; Conrads, T. P.; Janini, G. M.; Veenstra, T. D. Electrophoresis
2002, 23, 3048-3061.(27) Opiteck, G. J.; Ramirez, S. M.; Jorgenson, J. W.; Moseley, M. A., III. Anal.
Biochem. 1998, 258, 349-361.(28) Chong, B. E.; Yan, F.; Lubman, D. M.; Miller, F. R. Rapid Commun. Mass
Spectrom. 2001, 15, 291-296.(29) Zhang, Z. L.; Smith, D. L.; Smith, J. B. Proteomics 2001, 1, 1001-1009.(30) Lubman, D. M.; Kachman, M. T.; Wang, H.; Gong, S.; Yan, F.; Hamler, R.
L.; O’Neil, K. A.; Zhu, K.; Buchanan, N. S.; Barder, T. J. J. Chromatogr., B2002, 183-196.
(31) Zhu, K.; Kachman, M. T.; Miller, F. R.; Lubman, D. M.; Zand, R. J.Chromatogr., A 2004, 1053, 133-142.
(32) Wall, D. B.; Kachman, M. T.; Gong, S. Y.; Hinderer, R.; Parus, S.; Misek, D.E.; Hanash, S. M.; Lubman, D. M. Anal. Chem. 2000, 72, 1099-1111.
(33) Hamler, R. L.; Zhu, K.; Buchanani, N. S.; Kreunin, P.; Kachman, M. T.; Miller,F. R.; Lubman, D. M. Proteomics 2004, 4, 562-577.
(34) Wang, H. X.; Kachman, M. T.; Schwartz, D. R.; Cho, K. R.; Lubman, D. M.Proteomics 2004, 4, 2476-2495.
(35) Feng, B. B.; Patel, A. H.; Keller, P. M.; Slemmon, J. R. Rapid Commun.Mass Spectrom. 2001, 15, 821-826.
(36) Hennessy, T. P.; Quaglia, M.; Kornysova, O.; Grimes, B. A.; Lubda, D.;Unger, K. K. J. Chromatogr., B 2005, 817, 127-137.
(37) Hu, S.; Michels, D. A.; Fazal, M. A.; Ratisoontorn, C.; Cunningham, M. L.;Dovichi, M. J. Anal. Chem. 2004, 76, 4044-4049.
(38) Larmann, J. P., Jr.; Lemmo, A. V.; Moore, A. W.; Jorgenson, J. W.Electrophoreisis 1993, 14, 439-447.
(39) Herr, A. E.; Molho, J. I.; Drouvalakis, K. A.; Mikkelsen, J. C.; Utz, P. J.;Santiago, J. G.; Kenny, T. W. Anal. Chem. 2003, 75, 1180-1187.
(40) Krishnan, S.; Hale, J. E.; Becker, G. W. In Enzyme Technologies forPharmaceutical and Biotechnological Applications; Kirst, H. A., Yeh, W. K.,Zmijewski, M. J., Jr., Eds.; Marcel Dekker: New York, 2001; pp 575-596.
(41) Krapfenbauer, K.; Fountoulakis, M.; Lubec, G. Electrophoresis 2003, 24,1847-1870.
(42) Aebersold, R.; Goodlett, D. Chem. Rev. 2001, 101, 269-295.(43) El Rassi, Z.; Horvath, C. J. Chromatogr., B 1986, 359, 255-264.
Analytical Chemistry, Vol. 77, No. 15, August 1, 2005 4837

(Hercules, CA), after which pooled (n ) 5) 1-mg cortex and 1-mgcerebellum samples were prepared for differential comparison.
Anion/Cation-Exchange Chromatography. A Bio-Rad Bio-logic DuoFlow system with QuadTec UV detector and BioFracfraction collector was used with Uno series SAX (Q1) and SCX(S1) prepacked ion-exchange columns. For CAX chromatography,S1 and Q1 columns were placed in series. Buffers consisted ofice cold 20 mM Tris-HCl (pH 7.5 molecular biology grade, FisherScientific) in HPLC water (Burdick & Jackson, Muskegon, MI)(mobile phase A). A two-step elution gradient was performed with1 M NaCl (Fisher Scientific, crystalline 99.8% certified) (mobilephase B) at a flow rate of 1 mL/min with a linear transition from0 to 15% B in 12.5 mL, followed by 15 to 50% B in 7 mL. Thecomposition was held at 50% B for 2 mL and then reequilibratedto 0% B in 1 mL. An optimized three-step gradient was used fordifferential analysis. At a flow rate of 1 mL/min, the first lineartransition was from 0 to 5% B in 2.5 mL, from 5 to 15% in 9 mL,and followed by 15 to 50% in 10 mL. Again the composition washeld at 50% B for 2 mL and reequilibrated to 0% B in 1 mL. UVchromatograms were collected at a wavelength of 280 nm. Twenty-five 1-mL fractions were autonomously collected via the BioFracfraction collector into 1.5-mL screw-cap microfuge tubes (RPI, Mt.Prospect, IL) kept on ice.
1D-SDS-PAGE. Fractions collected during ion-exchangechromatography were concentrated via Millipore YM-30 centrifu-gal filters, which were demonstrated to retain proteins of >5 kDa.Each fraction was spun through filters prewashed with 500 µL ofHPLC water as two 500-µL sequential portions at 13 500 rpm for20 min. Laemmli sample buffer (Bio-Rad, with 5% BME) was addedto the retentate and incubated for 10 min prior to collection bycentrifugation at 3500 rpm for 3 min. The supernatant for eachfraction was boiled at 85 °C for 2 min and then loaded onto anInvitrogen Novex 10-20% gradient, 1 mm wide, 10-well gels in aTris-glycine buffer system (Carlsbad, CA) alongside a lane ofAmersham Biosciences Rainbow Marker (Piscataway, NJ) forinitial studies. Differential analysis between cerebellum and cortextissues was performed by pairing fractions for loading side by side(i.e., cerebellum fraction 1 next to cortex fraction 1, etc.) on Bio-Rad Criterion 10-20% gradient, 1-mm 18-well gels in a Tris-glycinebuffer system.
Protein Recovery and Retention of CAX. Protein recoverywas evaluated with SAX, SCX, and combined-phase CAX. Aconstant protein amount (750 µg) in a 100-µL injection of thepreviously described cerebellum lysate was loaded. A 1 mL/minisocratic flow was maintained for 9 min to allow unretainedproteins to flow through. The mobile-phase composition was thenincreased in 1 min and held for 9 min at 50% B to elute boundproteins collected in a normal gradient run. This was followed byan additional increase to 100% B in 1 min, which was held foranother 9 min to check for additional protein. Throughout, UVabsorbance was monitored at 280 nm, and 1-mL fractions werecollected, each concentrated using Millipore YM-30 centrifugalfilters and analyzed via Bio-Rad DC protein assay.
CAX-PAGE Coomassie Blue Imaging. Gels were visualizedby regressive staining using concentrated Bio-Rad Coomassie BlueR250 for 20 min and destained in 40% HPLC grade ethanol (EMScience, Gibbstown, NJ)/10% acetic acid (ACS Plus grade, Fisher)for ∼2 h. Images were captured with an Epson 1640 XL flatbed
scanner (Long Beach, CA) and saved as eight-bit TIFF files.Differential analysis of Coomassie Blue-stained gels was performedusing Phoretix 1D (Nonlinear Dynamics, Newcastle, U.K.) gelimage analysis software. Band intensities were automaticallycalculated and manually verified for bands above a presetthreshold. Intensities were output to Excel (Microsoft, Redmond,WA) for differential evaluation. Manual confirmation was aidedby superimposing cerebellum lanes false colored red over adjacentcortex lanes false colored green, creating gradient color lanes foreach fraction. Image contrast was improved by adjusting RGBcolor balance to emphasize mid-tones over shadows.
2D-DIGE. Cerebellum and cortex samples (1 mg each) wereprepared from the same pooled material used for CAX-PAGE.Each was adjusted to 2% SDS, followed by TCA precipitation. Thepellet was air-dried and resuspended in 150 µL of pH 8.8 urealysis buffer. Benzonase Nuclease (Novagen, Madison, WI) and 5mM magnesium chloride (Fisher) were added, incubating themixture for 30 min on ice to degrade nucleic acids. The solutionwas clarified by centrifugation with a Beckman Coulter (Fullerton,CA) Airfuge at 100 000 g for 30 min. The supernatant was dialyzedagainst the urea lysis buffer overnight at room temperature. A50-µg portion of cortex and cerebellum lysate was labeled withCy3 and Cy5 minimal dyes (Amersham Biosciences), respectively,using the manufacturer’s suggested protocol. Cyanine-labeledsamples were combined with 275 µg each of unlabeled cortex andcerebellum lysates. The solution was adjusted to 0.2% IPG pH3-10 buffer (Amersham Biosciences) and 100 mM DTT with atrace of Orange G stain (Fisher). An 18-cm nonlinear pH 3-10IPG strip (Amersham Biosciences) was rehydrated in the mixedsample under oil overnight at room temperature. Proteins werefocused on the strip at 8 kV until migration was complete (65 kVh). Proteins in the strip were reduced with 100 mM DTT in thereaction buffer, 50 mM pH 6.8 Tris-HCl, 6 M urea, 30% glycerol,and 2% SDS. Alkylation was performed with 2.5% iodoacetamidein the same reaction buffer. The strip was mounted atop a Bio-Rad precise 8-16% tris-glycine gel and run for 6 h at 25 mA and24 °C. Separate Cy3 and Cy5 images were collected on anAmersham Typhoon 8600 fluorescence imager and processed withPhoretix 2D software (Nonlinear Dynamics).
In-Gel Digestion. Gels were thoroughly rinsed with HPLCwater. Target differential bands were excised and dissected intofour cubes and placed in 0.5-mL tubes. Each was washed withHPLC water and then 50% 100 mM ammonium bicarbonate(Fisher)/50% acetonitrile (Burdick-Jackson, HPLC grade). Pieceswere dehydrated with 100% acetonitrile and dried by Speedvac(ISS110, Thermo Savant, Milford, MA). Cubes were rehydratedwith 50 µL of 10 mM dithiothreitol (Calbiochem, San Diego, CA)in 50 mM ammonium bicarbonate and incubated for 30 min at 56°C. Dithiothreitol was replaced by 50 µL of 55 mM iodoacetamide(Calbiochem) in 50 mM ammonium bicarbonate and reacted for30 min in the dark at room temperature. Gel pieces were washedwith 50 mM ammonium bicarbonate and dehydrated with 100%acetonitrile followed by Speedvac. Rehydration was performedwith 15 µL of a 12.5 ng/µL trypsin solution (Promega Gold,Madison, WI) for 30 min at 4 °C, and then 20 µL of 50 mMammonium bicarbonate was added and left at 37 °C overnight fordigestion. The supernatant and two 50% acetonitrile/5% acetic acidextractions were placed into a new tube. The peptide extract was
4838 Analytical Chemistry, Vol. 77, No. 15, August 1, 2005
dried by Speedvac and resuspended in 20 µL of 4% acetonitrile/0.4% acetic acid.
Capillary RPLC-MSMS. Capillary RPLC tandem ion trapmass spectrometry44 was employed for protein identification asdescribed previously with some modifications.45 Nanoflow reversed-phase chromatography was performed with a 100 µm i.d. × 5 cmcapillary column packed in-house with Agilent (Palo Alto, CA)3-µm C-18 particles behind an Upchurch 0.5-µm PEEK microfilterassembly. The integrated polymerized frit was replaced with apulled emitter made from 25-µm-i.d. capillary affixed to the otherend of the microfilter assembly. Thirty-minute gradients, 4% HPLCacetonitrile/0.4% acetic acid (Fisher, Optima grade) to 60%acetonitrile/0.4% acetic acid, were used to elute tryptic peptides.Tandem mass spectra were collected on a ThermoElectron (SanJose, CA) LCQ Deca XP-Plus using data-dependent analysis.19
Collected data were searched against the trypsin indexed completeNCBI RefSeq mammalian database filtered for rat taxonomy usingThermoElectron Bioworks Browser (version 3.1). We reportprotein identifications made with two or more peptides matchedwith strict cross-correlation values of Xc g 1.8, 2.5, and 3.5 for+1, +2, and +3 charge states, respectively.46 Data filtering wasperformed with DTASelect, and cerebellum versus cortex MSMSdata were compared using Contrast software.46
RESULTS AND DISCUSSIONCAX Chromatography. The majority of proteins in biological
samples, such as tissue lysates or body fluids, retain regions ofsignificant charge on their external surfaces when at physiologicalpH. Though regions of external charge act independent of netcharge,47 the improvement associated with CAX chromatographycan generally be explained through retention of both positivelyand negatively charged proteins rather than predominantly thoseof one net polarity. Figure 1 illustrates the difference betweenSCX, SAX, and CAX chromatography of a complex rat brain cortex
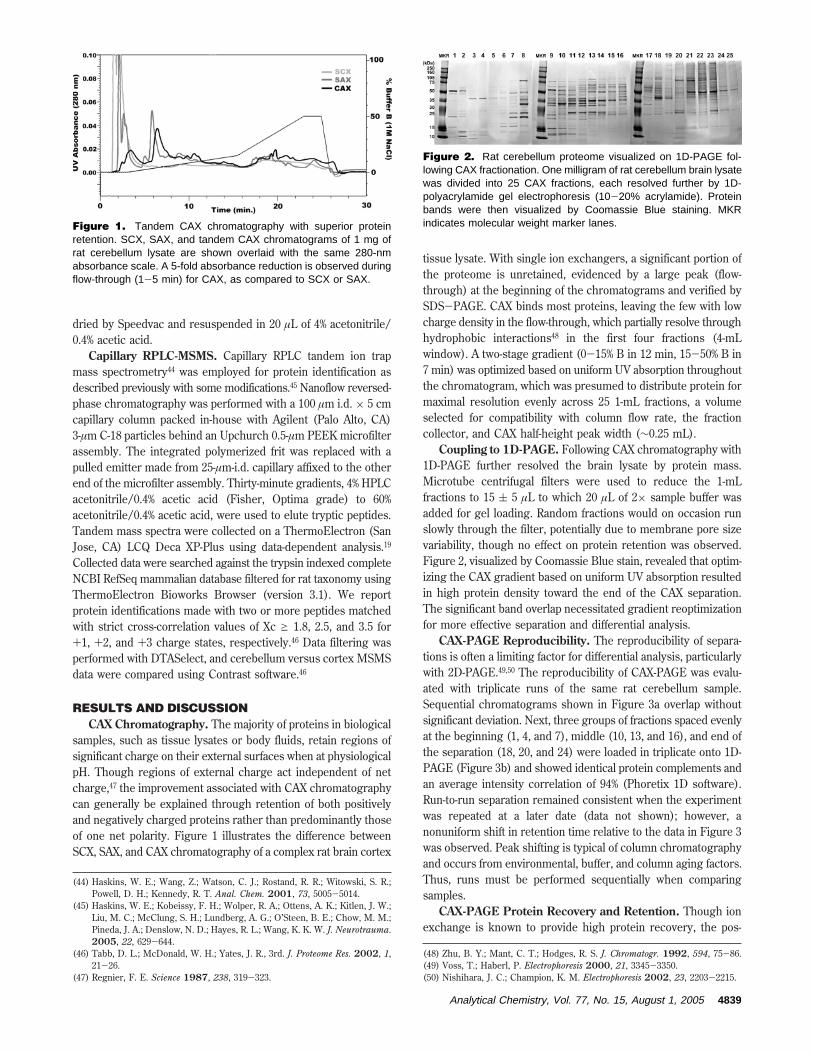
tissue lysate. With single ion exchangers, a significant portion ofthe proteome is unretained, evidenced by a large peak (flow-through) at the beginning of the chromatograms and verified bySDS-PAGE. CAX binds most proteins, leaving the few with lowcharge density in the flow-through, which partially resolve throughhydrophobic interactions48 in the first four fractions (4-mLwindow). A two-stage gradient (0-15% B in 12 min, 15-50% B in7 min) was optimized based on uniform UV absorption throughoutthe chromatogram, which was presumed to distribute protein formaximal resolution evenly across 25 1-mL fractions, a volumeselected for compatibility with column flow rate, the fractioncollector, and CAX half-height peak width (∼0.25 mL).
Coupling to 1D-PAGE. Following CAX chromatography with1D-PAGE further resolved the brain lysate by protein mass.Microtube centrifugal filters were used to reduce the 1-mLfractions to 15 ( 5 µL to which 20 µL of 2× sample buffer wasadded for gel loading. Random fractions would on occasion runslowly through the filter, potentially due to membrane pore sizevariability, though no effect on protein retention was observed.Figure 2, visualized by Coomassie Blue stain, revealed that optim-izing the CAX gradient based on uniform UV absorption resultedin high protein density toward the end of the CAX separation.The significant band overlap necessitated gradient reoptimizationfor more effective separation and differential analysis.
CAX-PAGE Reproducibility. The reproducibility of separa-tions is often a limiting factor for differential analysis, particularlywith 2D-PAGE.49,50 The reproducibility of CAX-PAGE was evalu-ated with triplicate runs of the same rat cerebellum sample.Sequential chromatograms shown in Figure 3a overlap withoutsignificant deviation. Next, three groups of fractions spaced evenlyat the beginning (1, 4, and 7), middle (10, 13, and 16), and end ofthe separation (18, 20, and 24) were loaded in triplicate onto 1D-PAGE (Figure 3b) and showed identical protein complements andan average intensity correlation of 94% (Phoretix 1D software).Run-to-run separation remained consistent when the experimentwas repeated at a later date (data not shown); however, anonuniform shift in retention time relative to the data in Figure 3was observed. Peak shifting is typical of column chromatographyand occurs from environmental, buffer, and column aging factors.Thus, runs must be performed sequentially when comparingsamples.
CAX-PAGE Protein Recovery and Retention. Though ionexchange is known to provide high protein recovery, the pos-
(44) Haskins, W. E.; Wang, Z.; Watson, C. J.; Rostand, R. R.; Witowski, S. R.;Powell, D. H.; Kennedy, R. T. Anal. Chem. 2001, 73, 5005-5014.
(45) Haskins, W. E.; Kobeissy, F. H.; Wolper, R. A.; Ottens, A. K.; Kitlen, J. W.;Liu, M. C.; McClung, S. H.; Lundberg, A. G.; O’Steen, B. E.; Chow, M. M.;Pineda, J. A.; Denslow, N. D.; Hayes, R. L.; Wang, K. K. W. J. Neurotrauma.2005, 22, 629-644.
(46) Tabb, D. L.; McDonald, W. H.; Yates, J. R., 3rd. J. Proteome Res. 2002, 1,21-26.
(47) Regnier, F. E. Science 1987, 238, 319-323.
(48) Zhu, B. Y.; Mant, C. T.; Hodges, R. S. J. Chromatogr. 1992, 594, 75-86.(49) Voss, T.; Haberl, P. Electrophoresis 2000, 21, 3345-3350.(50) Nishihara, J. C.; Champion, K. M. Electrophoresis 2002, 23, 2203-2215.
Figure 1. Tandem CAX chromatography with superior proteinretention. SCX, SAX, and tandem CAX chromatograms of 1 mg ofrat cerebellum lysate are shown overlaid with the same 280-nmabsorbance scale. A 5-fold absorbance reduction is observed duringflow-through (1-5 min) for CAX, as compared to SCX or SAX.
Figure 2. Rat cerebellum proteome visualized on 1D-PAGE fol-lowing CAX fractionation. One milligram of rat cerebellum brain lysatewas divided into 25 CAX fractions, each resolved further by 1D-polyacrylamide gel electrophoresis (10-20% acrylamide). Proteinbands were then visualized by Coomassie Blue staining. MKRindicates molecular weight marker lanes.
Analytical Chemistry, Vol. 77, No. 15, August 1, 2005 4839

sibility of exacerbated protein loss was of concern when SAX andSCX phases were combined. A protein recovery of 88 ( 6% afterCAX was determined by protein assay while accounting for thebuffer change from initial lysate to CAX fractions. Unexpectedly,the sample recovery observed for SAX and SCX was lower thanthat of CAX, suggesting some variability between protein assaymeasurements. Using densitometric analysis after 1D-PAGE,microfiltration alone showed an 11 ( 5% sample reduction, themajor source of protein loss for this method. In general, reported2D separations do not discuss protein recovery, with the exceptionof FFE-IEF shown to have 87.6% protein recovered.22 With 2D-PAGE, significant protein loss is known to occur, particularly forproteins above 100 kDa, with pI values outside of the 3-10 rangeand those too hydrophobic for solubalizition in the urea/chapsIPG buffer.10,11,61
CAX chromatography showed increased protein retention overSAX and SCX. In practice, 88% of recovered protein was retainedby CAX for gradient elution in comparison with 66% for SAX and47% for SCX as determined by protein assay. Peak area calculationsproved similar, with CAX having had the largest retained peakarea of 10 (84% of total area) compared with 5.2 (55%) for SAX and 5.7 (37%) for SCX. Increased retention, the motivation for CAX,
affords the ability to evenly distribute complex protein mixturesacross an expandable number of fractions using gradient optimiza-tion (see Figure 4).
Differential Expression Analysis. The potential of CAX-PAGE is realized during differential expression profiling. Chro-matographic differences are observed in Figure 5a betweencerebellum and cortex lysates sequentially separated by CAX. Fordifferential analysis, fractions from each run are paired and runside by side on 1D-PAGE (Figure 5b), whereby problems of gel-to-gel reproducibility are avoided through comparing matchingfractions on the same gel. Side-by-side fraction pairing also allowsfor direct visualization of differential expression using simple, cost-efficient, visible stains (e.g., Coomassie Blue or silver).40 Fluo-rescent stains such as Sypro Ruby and Deep Purple also workwell, though they require a more expensive fluorescence scanner(three times the cost of the liquid chromatography system). The
(51) Larner S. F.; McKinsey, D. M.; Hayes, R. L.; Wang, K. K. W. J. Neurochem.2005, 94, 97-108.
(52) Pineda, J. A.; Wang, K. W. W.; Hayes, R. L. Brain Pathol. 2004, 14, 202-209.
(53) Pike, B. R.; Flint, J.; Dave, J. R.; Lu, X. C. M.; Wang, K. K. W.; Tortella, F.C.; Hayes, R. L. J. Cer. Blood Flow Metab. 2004, 24, 98-106.
(54) Shaw, J.; Rowlinson, R.; Nickson, J.; Stone, T.; Sweet, A.; Williams, K.; Tonge,R. Proteomics 2003, 3, 1181-1195.
(55) Giddings, J. C. Unified Separation Science; John Wiley & Sons: New York,1991; pp 112-138.
(56) Gorg, A.; Weiss, W.; Dunn, M. J. Proteomics 2004, 4, 3665-3685.(57) Zhang, S.; Schneider, K. A.; Barder, T. J.; Lubman, D. M. Biotechniques
2003, 35, 1202-1212.(58) Morrison, R. S.; Kinoshita, Y.; Johnson, M. D.; Uo, T.; Ho, J. T.; McBee, J.
K.; Conrads, T. P.; Veenstra, T. D. Mol. Cell. Proteomics 2002, 1, 553-560.(59) Sanders, S. L.; Jennings, J.; Canutescu, A.; Link, A. J.; Weil, P. A. Mol. Cell.
Biol. 2002, 22, 4723-4738.(60) Peng, J.; Kim, M. J.; Cheng, D.; Duong, D. M.; Gygi, S. P. J. Biol. Chem.
2004, 279, 21003-21011.(61) Fountoulakis, M. Mass Spectrom. Rev. 2004, 23, 231-258.
Figure 3. Reproducibility of CAX-PAGE protein separations. (a)Chromatogram of rat cerebellum brain tissue lysate (1 mg of protein)run sequentially in triplicate by CAX. (b) Selected fractions (pairedas indicated) from the three replicate CAX runs resolved andvisualized side by side on 1D-PAGE. Protein complement remainedconstant while band intensity varied on average by only 6%.
Figure 4. Recovery and retention of CAX-PAGE separation.Chromatogram of rat cerebellum tissue lysate (750 µg) performedwith SCX, SAX, and CAX with two-step elution processes.
Figure 5. Comparison of rat cerebellum and cortex proteomes viasequential CAX and side-by-side 1D-PAGE. (a) Overlay of cerebellumand cortex CAX chromatograms at 280 nm. (b) Side-by-side (M,cerebellum on left; X, cortex on right) pairing of 25 fractions run on1D-PAGE. Boxed bands were excised for protein identification; noteletter labeling for correlation with Tables 1 and 2.
4840 Analytical Chemistry, Vol. 77, No. 15, August 1, 2005

Phoretix software was able to automatically identify gel laneshaving a clear boundary along the x-axis; however, band heightwas sometimes more difficult to distinguish, requiring manualverification. A threshold of a 2-fold difference in band densitybetween cerebellum and cortex data was used to generate a listof target bands for further analysis, whereby the mass spectrom-etry workload was minimized.
CAX-PAGE Differential Colorization. A false-colorizationscheme can also be used to aide manual inspection of differentialexpression, creating images (Figure 6) similar to those producedwith 2D-DIGE (Figure 7a). The colorized image was generatedby converting adjacent cortex and cerebellum lanes into greenand red, respectively, and superimposing the two. The human eyeis adept at recognizing slight color shifts (away from yellow atequal expression) more so than recognizing slight changes in grayband intensity. The colorization map was useful for confirmingPhoretix 1D output, particularly in cases of band overlap.
Comparing Differential Analysis by CAX-PAGE and 2D-DIGE. Analysis of the same cortex and cerebellum tissue lysateswas performed by 2D-DIGE as a benchmark for evaluating CAX-PAGE. The Cy3 and Cy5 images shown overlaid in Figure 7a werecompared using Phoretix 2D image analysis software with theresult illustrated in Figure 7b. Using 2D-DIGE, 45 spots werediscerned as more than twice as prominent in cerebellum and 37spots were more than twice as prominent in cortex (Figure 7b)for a total of 82 differential protein targets. In comparison, CAX-PAGE revealed 105 band intensities more than twice as prominentin cerebellum and 41 bands more than twice as prominent incortex for a total of 146 targets.
Proteins of high concentration pose a problem by masking lessabundant proteins in both techniques. Those that show up as largespots with 2D-DIGE, separate across multiple fractions with CAX-PAGE (confirmed by RPLC-MSMS analysis), presenting anadditional problem by increasing the number of apparent targets.
Figure 6. Colorized rat cerebellum-cortex differential proteome display after CAX-PAGE. The colorized display was performed by overlayingadjacent lanes from Figure 5b false-colored red for cerebellum and green for cortex. Color aids in manual inspection of the differential separation.
Figure 7. Rat cerebellum-cortex differential proteome display using 2D-DIGE. 2D-DIGE display of the pooled cerebellum and cortex lysatesused with CAX-PAGE. (a) False-color overlay of cortex Cy3 (green) and cerebellum Cy5 (red)-labeled DIGE images. (b) Results of 2D differentialsoftware analysis comparing cortex and cerebellum tissue. Spots with a 2-fold difference between samples are indicated by yellow for greaterin cortex and green for greater in cerebellum, while blue indicates spots found only in one sample.
Analytical Chemistry, Vol. 77, No. 15, August 1, 2005 4841

Nine of the 146 band pairs were redundant, reducing the numberof targets to 137, still 67% more than observed by 2D-DIGE.
CAX-PAGE provided an improved mass range for differentialanalysis when compared with 2D-DIGE. Of the 137 differentialtargets, 13 were at a mass of 100 kDa or greater. In comparison,none of the differential targets uncovered by 2D-DIGE were above100 kDa. The ability to discern differences at high mass isparticularly relevant in brain injury paradigms where cytoskeletalproteins of great mass (e.g., MAPs and spectrins) are particularlyprone to proteolysis associated with neuronal death after braininjury.51-53
In practice, we found numerous difficulties using 2D-DIGE thatwere absent when using CAX-PAGE. Signal intensity differedsomewhat between the two cyanine dyes as noted by others,17
giving a bias toward green or red from one gel to the next. Knownproblems with the stoichiometric ratio of protein to dye have beencited,7 possibly explaining the observation. As well, more back-ground was detected at the emission wavelength for Cy3 overCy5, making fainter spots more difficult to discern. Rapid photo-bleaching made the technique difficult to use,41 as sensitivity wasquickly effected. This potentially is improved with the newsaturation 2D-DIGE dyes.54 Overall, upon comparing the twotechniques, CAX-PAGE showed improved differential determina-tion in this initial study, illustrating that CAX-PAGE can identifydifferential targets in a robust and cost-effective manner, andoutperforms 2D-DIGE for analysis of high-mass proteins.
Resolving Power of CAX-PAGE. The most common meansfor comparing multidimensional separations is the use of theoreti-cal peak capacity (nc).55 For 2D-PAGE, total nc can be determinedfrom the final spot dimensions (x- and y-axis width values) dividedinto the length of separation for each axis. From Figure 7, thex-axis nc was 73.5 and y-axis nc 74.0. This generates a theoreticaltotal nc of 5440 for 2D-DIGE, about the average for 2D-PAGE ascited in the literature (103 -104).22,56
CAX-PAGE has an x-axis nc equal to the fraction number, inthis case 25, about one-third that of IEF, but CAX-PAGE has twicethe peak capacity of 2D-PAGE along the y-axis at 143 due to thenarrower band height achieved as a result of the larger x-axis widthand the 1D-PAGE stacking gel region. Despite a shorter gellength, greater y-axis nc of CAX-PAGE partially compensates forthe small fraction number, producing a total nc of 3570, which is34.4% shy of that calculated for 2D-DIGE. However, calculatingpeak capacity based on working area, a rectangular separationspace beyond which no proteins migrate, brings the values forCAX-PAGE and 2D-DIGE closer at 3120 and 4030, respectively.A recent improvement to CAX-PAGE has been shown using largerformat commercial gels with an increased y-axis nc of 211, and ifcombined with an expansion of CAX separations to 36 fractions(two gels per sample), a theoretical peak capacity of 7600 can beachieved.
CAX-PAGE resolution is comparable with other published 2Dprotein separation techniques,21,22,28,30,31,57 that have first-dimensionnc values between 15 and 80 and second-dimension nc valuesaround 100 for combined values on the order of 103. In practice,all of these techniques can be viewed as complementary ratherthan exclusive, as they use different physical properties forseparation, and none fully resolve an entire proteome. However,in the specific application of biomarker discovery, for which CAX-
PAGE was developed, separation of an entire proteome is notnecessary as only the most prominent proteins that demonstratea clear expression change are of interest. CAX-PAGE in this caseis advantageous as a protein separation and selection techniqueplaced prior to RPLC-MSMS protein identification.
Differential Quantification and Protein Identification byCapillary RPLC-MSMS. A notable advantage of CAX-PAGE over2D-DIGE7,58 is the maintenance of spatial separation betweensamples, such that a second means of protein quantification canbe performed. This is advantageous since 2D protein separations,having theoretical peak capacities of 103, are unlikely to fullyresolve each protein into a single gel spot, band, or chromato-graphic fraction. This leaves doubt as to which identified proteinis actually differentially expressed,10,11 a common problem notgenerally addressed. In our platform, secondary quantification byMSMS verifies the identity of the differentially expressed protein.
To proceed, three logical assumptions were made with regardto the MSMS data. The first, (i), was that a protein producing avisible band would be identified by two or more peptides usingstrict Sequest cross-correlation values,46 since the detection limitof Coomassie stain and dynamic exclusion MSMS are similar. Thesecond assumption, (ii), was that proteins producing a 2-folddifference in band density would have similar or greater expres-sion relative to background proteins. The last, (iii), was that onlya differentially expressed protein (2-fold or greater difference)would exhibit a discernible change in peptide coverage59,60
between the two samples.To evaluate the protocol, two protein groups were selected for
RPLC-MSMS analysis: (1) a random selection of differential bandpairs, as listed in Table 1, the CAX-PAGE differential target list;and (2) a random selection of nondifferential band pairs of similarintensity as listed in Table 2. In total, 85% of MSMS runs fulfilledthe first assumption i, irrespective of whether the band wasdifferential or not. The 15% not conclusively identified weregenerally low-intensity bands. Enhanced mass spectrometers, suchas the new linear ion traps, should improve protein identificationin these cases.
Assessing assumptions ii and iii, we compared how oftenMSMS quantification matched, did not match, or was inconclusive(<2 peptide difference) when compared with band density data.With the differential target group (Table 1), both peptide numberand band density reflected higher expression in the same tissue89% of the time. Inconclusive MSMS quantification occurred 7%of the time, and only one case (4%) showed quantification thatdid not match. The matching rate of 89% demonstrated theeffectiveness of dual quantification for internal verification of adifferential protein’s identity. In contrast, band density and MSMSquantification in the nondifferential target group (Table 2) werejust as likely to match (28%) as mismatch (28%) with most showingan inconclusive determination (44%), demonstrating that thequantification correlation observed for the differential target groupwas not a random occurrence.
Summary of Differential Findings. The differentially identi-fied proteins shown in Table 1 fit into three distinct protein classesknown to be prominent in the brain,58 listed here in order ofprevalence: (1) metabolic enzymes such as R-enolase, pyruvatekinase 3, transketolase, GMP synthase, fatty acid synthase, etc.;(2) neuronal function proteins such as calbindins 1 and 2, translin,
4842 Analytical Chemistry, Vol. 77, No. 15, August 1, 2005

transferrin, etc.; and (3) cytoskeletal proteins such as chlorideintracellular channel 4 and MAP2. Proteins were identified overa wide molecular mass distribution from 16 to 273 kDa. This isnotably better than 2D-PAGE, which underrepresents proteinsabove 120 kDa due to poor diffusion into the IPG strip7,61 and farexceeds the current mass range of top-down mass spectrometryapproaches.62 Another potential CAX-PAGE advantage is thathydrophobic membrane proteins are readily soluble in the loading
buffer used, a known problem with 2D-PAGE.61 However, this wasnot confirmed by this study, likely because membrane proteinsare generally of low abundance and only 53 bands were analyzedby RPLC-MSMS. Future studies employing a membrane proteinsubproteome would be better able to address this point.
Remaining Challenges. Relative to other 2D separations,CAX-PAGE can be difficult to automate, mainly due to the sampleconcentration between CAX and 1D-PAGE. An envisioned solutionis to use smaller i.d. ion-exchange columns to provide increasedcolumn efficiency and reduced fraction size for direct gel loading.
(62) Meng, F.; Du, Y.; Miller, L. M.; Patrie, S. M.; Robinson, D. E.; Kelleher, N.L. Anal. Chem. 2004, 76, 2852-2858.
Table 1. Quantification and Identification Results of Gel Band Pairs Showing Greater Than a Twofold Difference inIntensity between Cerebellum and Cortex-Differential Target List
gel data MSMS data data base search results
excisedband
gelbandMW
% M toX diffa
expressedgreater by
MSMSb
no.peptides
in M
M %proteincovered
no.peptides
in X
X %proteincovered
ID’dprotein
MW
ratprotein
identified accession no.
2 46.3 2094 X 0 0 2 5.3 47.2 R-enolase (enolase 1) NP•036686.13A 53.0 -8256 M 12 22.2 0 0 57.8 pyruvate kinase 3 NP•445749.14A 72.5 -391 X 4 5 0 0 76.7 transferrin NP•058751.15A 148.3 -365 M 6 3.5 3 2 180.1 amylo-1,6-glucosidease XP•342332.16A 61.3 -101 M 10 14.5 5 8.3 71.2 transketolase NP•072114.16C 15.1 -288 M 3 16.2 0 0 15.9 coactosin-like 1 XP•341701.17A 71.7 -178 M 3 4.4 0 0 76.7 transferrin NP•058751.1
M 2 3.6 0 0 70.8 GMP synthase XP•215574.210A 53.8 -143 M 11 17.7 7 13.1 57.8 pyruvate kinase 3 NP•445749.1
M 3 5.9 0 0 58 WD repeat containingprotein 1
XP•341229.1
10B 27.5 -359 M 6 23.3 3 14.4 31.4 calbindin 2 NP•446440.111A 88.7 -168 M 3 3.5 0 0 95.3 trans elongation factor 2 NP•058914.111B 27.4 -443 M 9 22.5 7 29.9 31.4 calbindin 2 NP•446440.112A 61.5 -634 M 6 9.1 0 0 68.7 albumin NP•599153.112C 27.5 -308 M 2 10.3 0 0 28.8 chloride intracellular
channel 4NP•446055.1
M 2 8.3 0 0 25.6 platelet-activating factoracetylhydrolase
NP•446106.1
M/X 5 16.2 5 21.4 31.4 calbindin 2 NP•446440.113D 28.1 -740 X 3 7.7 5 19.2 31.4 calbindin 2 NP•446440.113E 26.1 -1135 M 5 17.2 0 0 30 calbindin 1 NP•114190.113F 24.9 768 M/X 1 7.8 2 13.2 23.2 F-GDP dissociation
inhibitor RXP•340776.1
14A 222.5 -2170 M 6 3 0 0 273 fatty acid synthase NP•059028.114B 100.0 -186 M 3 3.7 0 0 105.6 hexokinase 1 NP•036866.1
M 2 1.8 0 0 118 insulinase (insulusin) NP•037291.114C 89.2 -631 M 8 10.5 1 1.4 96.7 brain glycoprotein
phosphorylaseXP•342543.1
14E 27.5 -910 M 3 12.3 0 0 30 carbonyl reductase NP•062043.114F 25.8 -491 M 7 17.2 3 11.1 30 calbindin 1 NP•114190.115A 235.9 -208 M 5 2.1 0 0 273 fatty acid synthase NP•059028.115C 26.1 -172 M 6 27.6 3 13.4 30 calbindin 1 NP•114190.116A 236.5 -21516B 25.9 -240 M 9 21.5 3 13.4 30 calbindin 1 NP•114190.1
M 2 5.4 0 0 30 cerebellar Ca-bindingprotein
NP•114190.1
M 3 16.2 0 0 26.2 translin NP•068530.117A 119.3 -172 M 2 1.8 0 0 145.9 Ca-dependent activator
secretion proteinNP•037351.1
18B 21.7 -58618C 20.1 -171 M 7 4 27 TYR 2-monooxygenase
(14-3-3) ú,η,θNP•062249.1
M 2 7.3 0 0 30 calbindin 1 NP•114190.119A 116.4 -220 M/X 0 0 3 2.2 198.8 microtubule-associated
protein 2NP•037198.1
- - 150.0 - M/X 3 12.6 0 0 42 brain creatin kinase NP•036661.219B 22.7 22719C 21.6 -581 M 3 12.1 0 0 33 carbonic anhydrates 8 XP•226204.222 93.4 -19923 96.2 -297
a Greater band intensity is indicated as a positive value in cortex and a negative value in cerebellum. b M indicates two or more peptides foundfor cerebellum over cortex; X indicates the opposite; M/X indicates a one- or no-peptide difference between tissues for that protein.
Analytical Chemistry, Vol. 77, No. 15, August 1, 2005 4843

CAX-PAGE automation would then be similar to other 2Dtechniques that use fraction collection between dimensions.Protein immobilization within a gel matrix may also be viewed asa difficulty for automation; however, high-throughput staining,robotic band excision, and robotic digestion have already beendeveloped for 2D-PAGE and would work equally well for CAX-PAGE. After robotic digestion, samples are autonimously placedinto 96-well plates that interface with a capillary RPLC-MSMSautosampler.
Multiplexing large numbers of samples may prove difficult byCAX-PAGE/RPLC-MSMS. The platform works as long as thesame fraction from each sample is grouped on a single gel (i.e.,fraction 1 from each sample on gel 1, etc.). The maximum numberof multiplexed samples is determined by the number of laneswithin a single gel (up to 19 samples with large-format 20-wellgelss1 lane for protein mass makers). In preliminary experiments,we have successfully multiplexed three samples.
CAX-PAGE/RPLC-MSMS in comparison with other separationsstrategies does not provide a direct measure of pI, which wouldbe useful when 2D maps are employed for protein identification,as often done with 2D-PAGE. Preliminary investigation shows anapparent correlation between CAX elution and pI, though theprecision was low. Foreseeably, a CAX fraction could be assigneda pI range as a means to confirm protein identity. On the otherhand, CAX-PAGE provides protein mass, another good parameterto confirm protein identity that is not determined using 2Dproteins separations with RPLC as the second dimension.
Dynamic range is a major complication for differential analysis,irrespective of the platform.63 RPLC-MSMS performed in data-dependent mode has a low dynamic range due to possible signal
saturation and poor ionization that can prevent triggering ofMSMS scans. This negates possible CAX-PAGE improvementsin protein detection using more sensitive stains. If differentialanalysis was performed exclusively by CAX-PAGE, then singlepeptide information could be used to identify proteins; however,the false positive rate would increase as the differential proteincannot clearly be distinguished from background proteins. Useof more sample, possible with the high capacity of CAX, couldalso help in detecting less abundant proteins up to a point. Moresensitive MSMS analysis methods and instrumentation willultimately aide identification of lower abundant proteins.
CONCLUSIONSA novel approach was presented based on combining bipolarity
ion-exchange chromatography in tandem with gel electrophoresisfor protein separations, followed by capillary reversed-phase liquidchromatography online with tandem mass spectrometry fortargeted peptide analysis. The platform is straightforward toperform, utilizing cost-effective traditional visualization stains andtwo quantification steps for internal verification of differentialprotein determinations. The platform was demonstrated fordifferential analysis comparing between cerebellum and cortextissues, a test model for biomarker discovery in brain. Future
(63) Ahmed, N.; Rise, G. E. J. Chromatogr., B 2005, 815, 39-50.
(64) Posmantur, R. M.; Kampfl, A.; Taft, W. C.; Bhattacharjee, M.; Dixon, C. E.;Bao, J.; Hayes, R. L. J. Neurotrauma 1996, 13, 125-137.
(65) Wang, K. K. W. Trends Neurosci. 23, 20-26.(66) Pike, B. R.; Flint, J.; Johnson, E.; Glenn, C. C.; Dutta, S.; Wang, K. K. W.;
Hayes, R. L. J. Neurochem. 2001, 78, 1297-1306.(67) Wang, K. K. W.; Ottens, A. K.; Haskins, W. E.; Liu, M. C.; Kobeissy, F. H.;
Denslow, N. D.; Chen, S.; Hayes, R. L. In Human Brain Proteome; Neuhold,E. L., Ed.; Elsevier: New York, 2004; pp 215-340.
(68) McDonald, W. H.; Yates J. R. Dis. Markers 2002, 18, 99-105.(69) Fountoulakis, M. Amino Acids 2001, 21, 363-381.
Table 2. Quantification and Identification Results of Gel Band Pairs Showing Less Than a Twofold Difference inIntensity between Cerebellum and Cortex-Nondifferential Target List
gel data MSMS data data base search results
excisedband
gelbandMW
% M toX diffa
expressedgreater by
MSMSb
no.peptides
in M
M %proteincovered
no.peptides
in X
X %proteincovered
ID’dprotein
MW
ratprotein
identified accession no.
1A 25.9 64 M 5 20.7 3 10.6 25.9 glutathione S-transferase NP•058710.11B 24.7 81 M/X 4 15.3 5 20.7 25.9 glutathione S-transferase NP•058710.11C 23.2 36 M/X 2 5.6 3 10.6 25.9 glutathione S-transferase NP•058710.11D 16.4 77 X 2 10.5 6 25.6 22.1 peroxiredoxin 5 precursor NP•446062.13B 39.3 90 M/X 7 18.2 6 12.8 46.3 glutamate oxaloacetate transaminase 1 NP•036703.14B 45.6 -53 M 7 11.5 3 7.6 47.2 R-enolase (enolase 1) NP•036686.14C 32.3 -34 M 5 21.5 3 9 34.7 pyridoxal kinase XP•342113.15B 47.1 -17 M/X 5 9.7 4 7.6 47.2 R-enolase (enolase 1) NP•036686.16B 46.3 28 X 3 7.6 5 7.6 47.2 R-enolase (enolase 1) NP•036686.17B 47.8 70 X 3 5.3 10 14.5 47.2 R-enolase (enolase 1) NP•036686.19A 34.5 -85 X 3 11 5 15.2 39.5 aldolase NP•036629.19B 27.4 -32 X 2 8.3 5 24.4 28.9 phosphoglycerate mutase 1 NP•445742.112B 33.4 -513A 60.9 -85 M/X 9 17.9 8 16.3 68.7 albumin NP•599153.113B 33.6 -16 M/X 5 15.6 6 18.3 36.6 lactate dehydrogenase B NP•036727.113C 32.2 51 M 5 16.9 3 9.5 35.6 malate dehydrogenase B NP•112413.214D 33.6 -73 M/X 8 20.1 7 21 36.6 lactate dehydrogenase B NP•036727.115B 27.8 0 M 4 14.4 1 5.9 31.4 calbindin 2 NP•446440.117B 35.5 -12 M/X 7 19.1 8 15.7 42 brain creatine kinase NP•036661.217C 29.5 1018A 34.3 -67
a Greater band intensity is indicated as a positive value in cortex and a negative value in cerebellum. b M indicates two or more peptides foundfor cerebellum over cortex; X indicates the opposite; M/X indicates a one- or no-peptide difference between tissues for that protein.
4844 Analytical Chemistry, Vol. 77, No. 15, August 1, 2005

efforts are focused on improving chromatographic efficiency fordirect coupling with larger format 1D-PAGE and applying theplatform to biomarker discovery for clinical diagnostics of trau-matic brain injury, stroke, and substance abuse.7,36,64-69
ACKNOWLEDGMENTWe offer our special thanks to Prof. W. W. Harrison for
assistance in editing the manuscript. Our appreciation to MarjorieChow and Timothy Chmielewski of the University of Florida
Interdisciplinary Center for Biotechnology Research Protein CoreFacility for performing the 2D-DIGE. This research is supportedby funding from the Department of Defense, Grant DAMD17-03-1-0066.
Received for review March 21, 2005. Accepted May 22,2005.
AC050478R
Analytical Chemistry, Vol. 77, No. 15, August 1, 2005 4845


![[Cool] Gas Chromatography and Lipids](https://static.fdokumen.com/doc/165x107/6325a4b1852a7313b70e98e9/cool-gas-chromatography-and-lipids.jpg)