Screening of volatile composition from Portuguese multifloral honeys using headspace solid-phase...
13
Available online at www.sciencedirect.com Talanta 74 (2007) 91–103 Screening of volatile composition from Portuguese multifloral honeys using headspace solid-phase microextraction-gas chromatography–quadrupole mass spectrometry M. Pontes, J.C. Marques, J.S. Cˆ amara ∗ Centro de Qu´ ımica da Madeira, Departamento de Qu´ ımica da Universidade da Madeira, Campus Universit´ ario da Penteada, 9000-390 Funchal, Portugal Received 15 March 2007; received in revised form 14 May 2007; accepted 18 May 2007 Available online 26 May 2007 Abstract The volatile composition from four types of multifloral Portuguese (produced in Madeira Island) honeys was investigated by a suitable analytical procedure based on dynamic headspace solid-phase microextraction (HS-SPME) followed by thermal desorption gas chromatography–quadrupole mass spectrometry detection (GC–qMS). The performance of five commercially available SPME fibres: 100 m polydimethylsiloxane, PDMS; 85 m polyacrylate, PA; 50/30 m divinylbenzene/carboxen on polydimethylsiloxane, DVB/CAR/PDMS (StableFlex); 75 m car- boxen/polydimethylsiloxane, CAR/PDMS, and 65 m carbowax/divinylbenzene, CW/DVB; were evaluated and compared. The highest amounts of extract, in terms of the maximum signal obtained for the total volatile composition, were obtained with a DVB/CAR/PDMS coating fibre at 60 ◦ C during an extraction time of 40 min with a constant stirring at 750 rpm, after saturating the sample with NaCl (30%). Using this methodology more than one hundred volatile compounds, belonging to different biosynthetic pathways were identified, including monoterpenols, C 13 -norisoprenoids, sesquiterpenes, higher alcohols, ethyl esters and fatty acids. The main components of the HS-SPME samples of honey were in average ethanol, hotrienol, benzeneacetaldehyde, furfural, trans-linalool oxide and 1,3-dihydroxy-2-propanone. © 2007 Elsevier B.V. All rights reserved. Keywords: Honey; Volatile compounds; Solid-phase microextraction; GC–qMS 1. Introduction Honey is a natural product produced by Apis mellifera bees from the nectar of plants and has for long been an excellent nutritional option for many generations due to its health benefits (one of the traditional sources for treatment of flue and com- mon cold in the region) [1], has been reported to be effective in gastrointestinal disorders, in healing of wounds and burns, as an anti-microbial agent [2]. The healing effect of honey is due to the enzyme glucose oxidase, this enzyme is virtually inactive in full-density honey but becomes active in diluted honey pro- ducing hydrogen peroxide and gluconic acid from glucose. In addition, many natural antibacterial compounds have been iden- tified from different types of honey [2]. Honey, as a source of antioxidants has been proven to be effective against deterioative ∗ Corresponding author. Tel.: +351 291705112; fax: +351 291705149. E-mail address: [email protected] (J.S. Cˆ amara). oxidation reaction in food [3]. The antibacterial activity of honey is attributed both to physical factors, acidity and osmolarity and chemical factors, hydrogen peroxide, volatiles, beeswax, nectar, pollen and propolis [2,3]. Honey includes over 400 different chemical compounds, more than 95% mainly formed by sugars and water, whereas pro- teins, vitamins (mainly vitamin B6, thiamin, niacin, riboflavin, and pantothenic acid), essential minerals (including calcium, copper, iron, magnesium, manganese, phosphorus, potassium, sodium, and zinc), pigments, flavours, free amino acids and volatile compounds constitute minor components [4]. The sug- ars present in honey are mainly fructose (about 38.5%) and glucose (about 31.0%). The remaining carbohydrates include maltose, sucrose, and other complex carbohydrates. The chemical composition of honey is highly dependent to the nectar source and the botanical origin of the nectar for- aged by bees [1]. Aroma compounds are present in honey at very low concentrations as complex mixtures of volatile com- ponents of different chemical families belonging, in general, to 0039-9140/$ – see front matter © 2007 Elsevier B.V. All rights reserved. doi:10.1016/j.talanta.2007.05.037
Transcript of Screening of volatile composition from Portuguese multifloral honeys using headspace solid-phase...

A
pmPbodtsh©
K
1
fn(miatidata
0d
Available online at www.sciencedirect.com
Talanta 74 (2007) 91–103
Screening of volatile composition from Portuguese multifloralhoneys using headspace solid-phase microextraction-gas
chromatography–quadrupole mass spectrometry
M. Pontes, J.C. Marques, J.S. Camara ∗Centro de Quımica da Madeira, Departamento de Quımica da Universidade da Madeira,
Campus Universitario da Penteada, 9000-390 Funchal, Portugal
Received 15 March 2007; received in revised form 14 May 2007; accepted 18 May 2007Available online 26 May 2007
bstract
The volatile composition from four types of multifloral Portuguese (produced in Madeira Island) honeys was investigated by a suitable analyticalrocedure based on dynamic headspace solid-phase microextraction (HS-SPME) followed by thermal desorption gas chromatography–quadrupoleass spectrometry detection (GC–qMS). The performance of five commercially available SPME fibres: 100 �m polydimethylsiloxane,DMS; 85 �m polyacrylate, PA; 50/30 �m divinylbenzene/carboxen on polydimethylsiloxane, DVB/CAR/PDMS (StableFlex); 75 �m car-oxen/polydimethylsiloxane, CAR/PDMS, and 65 �m carbowax/divinylbenzene, CW/DVB; were evaluated and compared. The highest amountsf extract, in terms of the maximum signal obtained for the total volatile composition, were obtained with a DVB/CAR/PDMS coating fibre at 60 ◦C
uring an extraction time of 40 min with a constant stirring at 750 rpm, after saturating the sample with NaCl (30%). Using this methodology morehan one hundred volatile compounds, belonging to different biosynthetic pathways were identified, including monoterpenols, C13-norisoprenoids,esquiterpenes, higher alcohols, ethyl esters and fatty acids. The main components of the HS-SPME samples of honey were in average ethanol,otrienol, benzeneacetaldehyde, furfural, trans-linalool oxide and 1,3-dihydroxy-2-propanone.2007 Elsevier B.V. All rights reserved.
oicp
mtacsva
eywords: Honey; Volatile compounds; Solid-phase microextraction; GC–qMS
. Introduction
Honey is a natural product produced by Apis mellifera beesrom the nectar of plants and has for long been an excellentutritional option for many generations due to its health benefitsone of the traditional sources for treatment of flue and com-on cold in the region) [1], has been reported to be effective
n gastrointestinal disorders, in healing of wounds and burns, asn anti-microbial agent [2]. The healing effect of honey is dueo the enzyme glucose oxidase, this enzyme is virtually inactiven full-density honey but becomes active in diluted honey pro-ucing hydrogen peroxide and gluconic acid from glucose. In
ddition, many natural antibacterial compounds have been iden-ified from different types of honey [2]. Honey, as a source ofntioxidants has been proven to be effective against deterioative∗ Corresponding author. Tel.: +351 291705112; fax: +351 291705149.E-mail address: [email protected] (J.S. Camara).
gm
tavp
039-9140/$ – see front matter © 2007 Elsevier B.V. All rights reserved.oi:10.1016/j.talanta.2007.05.037
xidation reaction in food [3]. The antibacterial activity of honeys attributed both to physical factors, acidity and osmolarity andhemical factors, hydrogen peroxide, volatiles, beeswax, nectar,ollen and propolis [2,3].
Honey includes over 400 different chemical compounds,ore than 95% mainly formed by sugars and water, whereas pro-
eins, vitamins (mainly vitamin B6, thiamin, niacin, riboflavin,nd pantothenic acid), essential minerals (including calcium,opper, iron, magnesium, manganese, phosphorus, potassium,odium, and zinc), pigments, flavours, free amino acids andolatile compounds constitute minor components [4]. The sug-rs present in honey are mainly fructose (about 38.5%) andlucose (about 31.0%). The remaining carbohydrates includealtose, sucrose, and other complex carbohydrates.The chemical composition of honey is highly dependent to
he nectar source and the botanical origin of the nectar for-ged by bees [1]. Aroma compounds are present in honey atery low concentrations as complex mixtures of volatile com-onents of different chemical families belonging, in general, to

9 lanta
mdfsbbsmccdtptti
vd(esacpandpcstsdfnpofwhpbaiaoeTepelSd
a
arwo3iic(nomrstla
wtpobTofh
2
2
wamisfiCi(
dntbo((6oa
2 M. Pontes et al. / Ta
onoterpenes, C13-norisoprenoids, sesquiterpenoids, benzeneerivatives [5] and in lowest content, higher alcohols, esters,atty acids, ketones, terpenes and aldehydes. Some of theseubstances are present in honey collected by bees, and haveeen described as characteristics of the floral source (coulde related to plant characteristics), and other compounds, likeome alcohols, branched aldehydes, and furfural derivatives,ay be related to the microbial purity of processing and storage
onditions of honey [6]. The quantitative analysis of volatileompounds present in such samples is extremely demandingue: (1) to complex chemical composition of the volatile frac-ion and (2) the fact of individual volatile compounds can beresent in a wide range of concentration. Honey volatile frac-ions have been used as quality markers for the authenticity ofhe floral origin [7,8]. It also prevents overpayment and helps todentify frauds [7].
Traditional analytical methods employing organic sol-ents such as liquid–liquid extraction [9], simultaneousistillation–extraction (SDE) [10], supercritical fluid extractionSFE) [11], solid-phase extraction (SPE) [12] and ultrasoundxtraction [13] were commonly used. These are hazardousince requires large amounts of toxic and expensive solvents,re labour-intensive and time-consuming and requires the pre-oncentration of the extract. Each procedure of the samplereparation is subject to inconveniences, but offers specificdvantages under determined circumstances. Nowadays, alter-ative to these classical methods that may overcome theirisadvantages, more easier and selective, are used such as solid-hase microextraction (SPME), developed by Pawliszyn andoworker [14,15] in the early 1990s and more recently stir barorptive extraction (SBSE) developed in the late 1990s by Bal-ussen et al. [16]. This technique uses a TwisterTM, a glasstir bar onto which is bonded a sorptive phase, often poly-imethylsiloxane (PDMS), in quantities far in excess of thoseound on SPME fibres [17]. SPME is an equilibrium tech-ique that requires a previous optimisation of the extractionarameters that can affect extraction efficiencies, in order tobtain high recoveries of volatiles. SPME sampling can be per-ormed in three basic modes: direct extraction (the analytesere transported directly from matrix to the extracting phase),eadspace extraction (the analytes are extracted from the gashase equilibrated with the sample) and extraction with mem-rane protection (the fibre is separated from the sample withselective membrane). The selection of the sampling mode
s dependent of the nature of the compounds to be analysednd the sample type. Bearing in mind that one of the goalsf this study was to screen volatile compounds from hon-ys, the headspace sampling mode was the most appropriate.he headspace SPME process protects the fibre from adverseffects caused by non-volatile compounds present in the sam-le matrix namely sugars, and allows modifications, as forxample: pH, with no effect in the fibre. Moreover, the equi-ibration times for volatile compounds are shorter for headspace
PME extraction than for direct extraction under the same con-itions.Since the first SPME fibres becomes commercially avail-ble, it has been more and more used and the fields of
utfit
74 (2007) 91–103
pplication have been continuously growing, including a wideange of food analysis, namely the volatile composition ofines [18–22], beers [23], whiskeys [24–26], several kindsf fruits [27–31] and honeys [32–36], with nowadays about000 research papers published. The technique gained grow-ng acceptance and increasing use in routine laboratories andndustrial applications. This method shows clear advantagesompared with traditional techniques, eliminates the use oftoxic) organic solvents, allows the quantification of a largeumber of molecules, no or little manipulation/preparationf samples, substantially shortness the time of analysis andoreover are simple and faster techniques, and covers a wide
ange of sampling techniques, including field, in situ and airampling. Generally accepted disadvantages are relatively lot-o-lot variations, sensitivity against organic solvents and theimited range of stationary phases which are commerciallyvailable.
In this study, headspace SPME combined with GC–qMS,as developed and applied to evaluating the volatile composi-
ion profile of different multifloral honey samples (H1–H4). Areliminary screening of fibre of various polarities was carriedut in order to select the best coating for the matrix. Comparisonetween the performance of the five sorbent materials is given.o confirm the applicability of the SPME, comparative studyn the characteristic GC–qMS volatile honey profiles were per-ormed. The possibility of differentiation from the investigatedoneys was evaluated.
. Experimental
.1. Chemicals and materials
All reagents used were analytical quality and all solventsere HPLC grade. Sodium chloride (99.5%) used to obtain the
dequate ionic strength (decrease the solubility of the aromaolecules which then partition more readily into the headspace
mproving the adsorption of analytes in SPME analysis), wasupplied by Merck (Darmstadt, Germany). Water was puri-ed through a Milli-Q purification system (Millipore). The8–C20 n-alkanes series, and the chemical standard used as
nternal standard, 3-octanol, were supplied by Sigma–AldrichSpain).
The SPME fibres tested and compared in this work, poly-imethylsiloxane layer (PDMS, 100 �m), recommended foronpolar volatiles; polyacrylate (PA, 85 �m) with high selec-ivity for polar semivolatile compounds; divinylbenzene–car-oxen–polydimethylsiloxane (DVB/CAR/PDMS, 50/30 �m)n a 1 cm StableFlex fibre, recommended for flavoursvolatiles and semivolatiles); carboxen–polydimethylsiloxaneCAR/PDMS, 75 �m); carbowax–divinylbenzene (CW/DVB,5 �m) and the SPME holder for manual sampling, werebtained from Supelco (Bellefonte, PA, USA). The coating ofll fibres was 1 cm long. The fibres were conditioned prior to
se according to the manufacturer’s instructions by insertinghem into the GC injector port. Before the first daily analysis thebres were conditioned for 20 min. A blank test was performedo check possible carry-over.
lanta
2
(Mefcc
u
2
finbmTitc(f
dtot(a2isawuSaedou
d(aa
2d
Sat
dfitNr0aihaacfafmTm1
tolsdTaa
2
mPn(td
3
wtiwfoianhp
M. Pontes et al. / Ta
.2. Honey samples
This study was carried out on 16 multifloral honeys, H1–H4four samples from each honey) from four different regions of
adeira Island (Portugal) where predominates the wild flora,ucalyptus, hissed and rosemary. All samples were obtainedrom local stores and were processed using the traditional pro-edures. None of these samples underwent any treatment thatould alter their composition.
All samples were contained in glass bottles and stored at 4 ◦Cntil analysis. All analysis, were carried out four times.
.3. SPME methodology
In order to select the best fibre for honey volatile composition,ve SPME coatings of different polarity and extraction mecha-isms were tested. The methodology developed and optimisedy Camara et al. [37] for the volatile compounds extraction usinganual SPME was used in this study with minor modifications.he H1 honey sample was selected as the matrix for compar-
son of the performance of the fibres. The fibre that presentedhe most complete profile of H1 honey volatile compounds washosen for the study. The extraction was carried out at 60 ◦Ccontrolled temperature) and each measurement was repeatedour times.
For each extraction 15 g of sample was diluted 1:1 witheionised water (Milli-Q). The dilution decrease the density ofhe matrix making easy the evaporation of analytes of the interesttherwise retained for sugars. For headspace sampling, 30 mL ofhe sample was immediately placed in a 60 mL ambar glass vialvolume ratio headspace/solution was 1:1) hermetically sealednd spiked with 3-octanol (250 �L at 422 mg L−1) and 4-methyl--pentanol (125 �L at 422 mg L−1) (Sigma–Aldrich) used asnternal standards, and equilibrated during 40 min in a thermo-tatic bath on a stirrer. The extractions were carried out withoutdjust of pH. The ionic strength was increased using NaCl (30%,/v) to improve the extraction efficiency by decreasing the sol-bility of hydrophilic compounds in the aqueous phase. ThePME fibre was then exposed to the headspace of the samplend kept for 40 min at 60 ◦C. As stirring usually improves thextraction, because the static layer resistant to mass transfer isestroyed (facilitate mass transport between the bulk of the aque-us sample and the fibre), all the experiments were performednder constant stirring velocity (750 rpm).
After sampling, the SPME fibre was withdrawn into the nee-le, removed from the vial and inserted into the hot injector port260 ◦C) of the GC–qMS system for 6 min where the extractednalytes were thermally desorbed and transferred directly to thenalytical column.
.4. Gas chromatography–quadrupole mass spectrometryetection (GC–qMS)
The volatile compounds extracted by dynamic headspacePME procedure from honey, were tentatively identified usingn Agilent 6890N (Palo Alto, CA, USA) gas chromatograph sys-em coupled to an Agilent 5975 quadrupole inert mass selective
o“
p
74 (2007) 91–103 93
etector equipped with a 30 m × 0.25 mm i.d., with a 0.25 �mlm thickness, BP-20 fused silica capillary column, according
o the method described by Camara et al. [37]. Helium (Helium60, Air Liquid, Portugal) was used as the carrier gas at a flow
ate ≈ 1 mL min−1 (column-head pressure: 13 psi). An insert of.75 mm i.d. was used and the injector temperature was fixedt 260 ◦C. Splitless injections were used. The temperature usedncluded the following settings: initial temperature of 50 ◦C waseld for 1 min and then increased in three steps: 50–100 ◦C,t 2.5 ◦C min−1; 100–180 ◦C, at 2 ◦C min−1 and 180–220 ◦C,t 15 ◦C min−1. Each step was preceded by a small period atonstant temperature for 2, 1 and 10 min, respectively. The mani-old, GC–qMS interface and quadrupole temperatures were heldt 180, 220 and 180 ◦C, respectively. The detection was per-ormed by a 5975 mass spectrometer in the electronic impact (EI)ode (ionization energy, 70 eV; source temperature, 180 ◦C).he electron multiplier was set to the auto tune procedure. Theass acquisition range, made in full scan mode, was 30–300 m/z;
.9 spectra/s.Compounds were identified by comparing the MS fragmenta-
ion pattern with those of the pure standards and mass spectrumf the unknown peaks with those stored in the NIST GC/MSibrary, retention time of the pure standards obtained under theame conditions, and Kovats retention indices (RI). For theetermination of the RI a C8–C20 n-alkanes series was used.he relative amounts of individual components are expresseds percent peak areas (RPA, %) relative to the total peakrea.
.5. Statistical analysis
Significant differences among the honey samples were deter-ined by one-way analysis of variance (ANOVA) using a SPSSrogram, Version 14.0 (SPSS Inc., 2006). Principal compo-ent analysis (PCA) and stepwise linear discriminant analysisSLDA) were performed using the same SPSS program. Theseechniques were applied to the normalized total peak areas fromifferent chemical classes.
. Results and discussion
Sixteen honey samples from different multifloral originsere analysed with the objective to identify and compare
heir volatile compounds profiles. Differences in the totalon current (TIC) chromatographic profiles were observedhen comparing the studied honeys. TIC chromatograms
rom H1–H4 samples were compared in terms of total areasf the volatile compounds and number of compounds. Thedentified compounds were organized in different groupsccording to their chemical structure. This was done for C13-orisoprenoids/monoterpenes, sesquiterpenoids, higher alco-ols, fatty acids, ethyl esters, furanic compounds, carbonyl com-ounds, aliphatic and aromatic hydrocarbons, while compounds
f different structures were considered together as the classmiscellaneous”.From these identification we found that carbonyl com-ounds, furanic compounds, higher alcohols and C13-
9 lanta
nsfloo2eaezn
aSwp
3
ttoauCumnrCtatrotaFcetdiauwiPpaptbehp
7tiwctc
TpDfne
tf24
3
vthdeitcCacvsfpcarcpt(
ielldhb
4 M. Pontes et al. / Ta
orisoprenoids/monoterpenes, constitute a main part of flavourtudied honeys, and they probably play a significant role in theirowery notes. These founds are in good agreement with previ-us reports [34,35]. As predominant compounds trans-linaloolxide, furfural, hotrienol and in minor extent, 1,3-dihydroxy--propanone, 5-hydroxymethylfurfural, benzeneacetaldehyde,thyl decanoate, ethyl dodecanoate, o-methoxyacetophenonend 2-ethyl hexanoic acid were found. The two fatty acid ethylsters may contribute with sweety and fruity notes while ben-eneacetaldehyde may contribute with flowery, rose and honeyotes.
Furanic compounds such as furfural, 1-(2-furanyl)-ethanonend 5-hydroxymethylfurfural were presented in all samples.everal aliphatic and aromatic hydrocarbons arise from bee waxhich has not been completely separated during harvest androcessing, were identified.
.1. Selection of SPME fibre coating
The fibre coating used influences the chemical nature ofhe extracted analyte that is established by their characteris-ic polarity and volatility. To evaluate the extraction yieldsf the honey volatile components by HS-SPME, and takingccount of the physico/chemical characteristics of the targetsnder consideration, we tested five types of fibre (CAR/DVB,W/PDMS, PDMS, PA, and DVB/CAR/PDMS) among thosesed most routinely for assaying volatiles. A few key experi-ental factors which influence the HS-SPME extraction yield,
amely time required for the target analytes to reach equilib-ium and extraction temperature, were previously evaluated byamara et al. [37], and applied in this work. Bearing in mind
he obtained results, each fibre was exposed to the headspacet the same temperature (60 ◦C) during the same extractionime (40 min). For reasons of comparability all tests were car-ied out with the same honey sample (H1). The comparisonf the SPME fibre performance was made in terms of extrac-ion efficiency, number of identifiable compounds in the extractnd reproducibility. The chromatographic profiles presented inig. 1, obtained for a H1 honey sample by using differentoatings in same experimental conditions, shows the differentxtraction efficiency of the fibres. The results obtained usinghe five fibres on the same H1 sample, in rigorously repro-uced temperature and exposure time conditions, are reportedn Table 1 . The qualitative composition of honey volatilesnd the number of identified compounds using the five fibresnder study is very different. As can be seen in Table 1ith DVB/CAR/PDMS fibre a total of 46 compounds were
dentified whilst with the PA, CW/DVB, CAR/PDMS andDMS coatings, were detected only, 32, 30, 35 and 17 com-ounds, respectively. The semi-polar DVB/CAR/PDMS fibrellowed the best efficiency of extraction for volatile com-ounds while under the same conditions PDMS fibre hadhe lowest sorption capacity. The former fibre provided the
est sensitivity in terms of total compound peak areas, high-st number of detected compounds and high reproducibility,ence this fibre was chosen for evaluation of volatile com-ounds in honeys (Table 2 ). PA fibre coating extractedethh
74 (2007) 91–103
1.8% of DVB/CAR/PDMS while PDMS coating extractedhe lowest amount (about 32.0% of DVB/CAR/PDMS). Sim-lar amounts of volatiles (57.4–60.2% of DVB/CAR/PDMS)ere extracted when using either, CW/DVB or CAR/PDMS
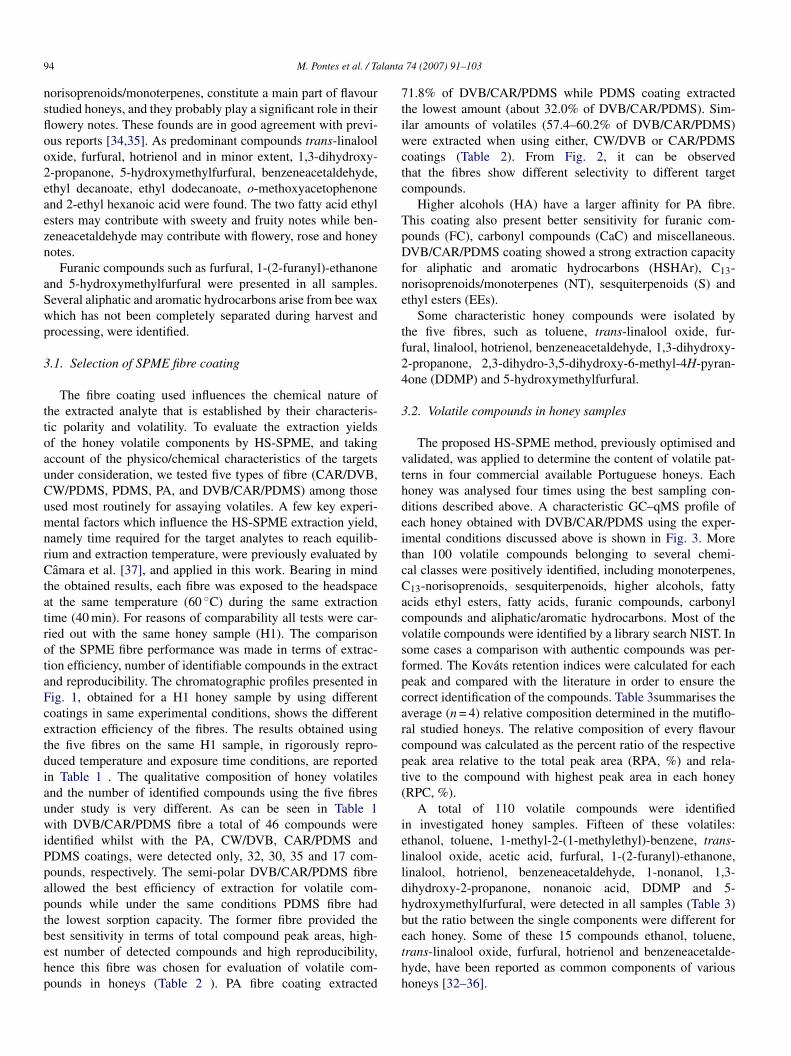
oatings (Table 2). From Fig. 2, it can be observedhat the fibres show different selectivity to different targetompounds.
Higher alcohols (HA) have a larger affinity for PA fibre.his coating also present better sensitivity for furanic com-ounds (FC), carbonyl compounds (CaC) and miscellaneous.VB/CAR/PDMS coating showed a strong extraction capacity
or aliphatic and aromatic hydrocarbons (HSHAr), C13-orisoprenoids/monoterpenes (NT), sesquiterpenoids (S) andthyl esters (EEs).
Some characteristic honey compounds were isolated byhe five fibres, such as toluene, trans-linalool oxide, fur-ural, linalool, hotrienol, benzeneacetaldehyde, 1,3-dihydroxy--propanone, 2,3-dihydro-3,5-dihydroxy-6-methyl-4H-pyran-one (DDMP) and 5-hydroxymethylfurfural.
.2. Volatile compounds in honey samples
The proposed HS-SPME method, previously optimised andalidated, was applied to determine the content of volatile pat-erns in four commercial available Portuguese honeys. Eachoney was analysed four times using the best sampling con-itions described above. A characteristic GC–qMS profile ofach honey obtained with DVB/CAR/PDMS using the exper-mental conditions discussed above is shown in Fig. 3. Morehan 100 volatile compounds belonging to several chemi-al classes were positively identified, including monoterpenes,13-norisoprenoids, sesquiterpenoids, higher alcohols, fattycids ethyl esters, fatty acids, furanic compounds, carbonylompounds and aliphatic/aromatic hydrocarbons. Most of theolatile compounds were identified by a library search NIST. Inome cases a comparison with authentic compounds was per-ormed. The Kovats retention indices were calculated for eacheak and compared with the literature in order to ensure theorrect identification of the compounds. Table 3summarises theverage (n = 4) relative composition determined in the mutiflo-al studied honeys. The relative composition of every flavourompound was calculated as the percent ratio of the respectiveeak area relative to the total peak area (RPA, %) and rela-ive to the compound with highest peak area in each honeyRPC, %).
A total of 110 volatile compounds were identifiedn investigated honey samples. Fifteen of these volatiles:thanol, toluene, 1-methyl-2-(1-methylethyl)-benzene, trans-inalool oxide, acetic acid, furfural, 1-(2-furanyl)-ethanone,inalool, hotrienol, benzeneacetaldehyde, 1-nonanol, 1,3-ihydroxy-2-propanone, nonanoic acid, DDMP and 5-ydroxymethylfurfural, were detected in all samples (Table 3)ut the ratio between the single components were different for
ach honey. Some of these 15 compounds ethanol, toluene,rans-linalool oxide, furfural, hotrienol and benzeneacetalde-yde, have been reported as common components of variousoneys [32–36].
M. Pontes et al. / Talanta 74 (2007) 91–103 95
Fig. 1. Chromatograms obtained by SPME analysis of H1 honey with different fibres using in the headspace sampling mode with 30% NaCl and at 60 ◦C during40 min. Peak identification: (1) ethanol; (2) toluene; (3) 4-methyl-2-pentanol (IS); (4) 1,3-butanediol; (5) 1-hydroxy-2-propanone; (6) nonanal; (7) 3-octanol (IS);(8) trans-linalool oxide; (9) furfural; (10) benzaldehyde; (11) linalool; (12) hotrienol; (13) benzeneacetaldehyde; (14) acetophenone; (15) 1-nonanol; (16) eicosane;(17) naphthalene; (18) 3-ethyl-2-pentene; (19) 2-methyl-2-phenylethyl ester propanoic acid; (20) E-6,10-dimethyl-5,9-undecadien-2-one; (21) �-2-propenyl-benzenemethanol; (22) heptadecane; (23) 2-ethyl-hexanoic acid; (24) 1-ethyl-2-hepthyl-cyclopropane; (25) 1,3-dihydroxy-2-propanone; (26) nonanoic acid; (27)N-(4-hydroxyphenyl)acetamide; (28) 2,3-dihydro-3,5-dihydroxy-6-methyl-4H-pyran-4one; (29) 5-hydroxymethylfurfural; (30) �-methyl benzenemethanol; (31) �-ionol; (32) acid acetic; (33) furanmethanol; (34) 2-hydroxy-2-cyclopenten-1-one; (35) tridecane; (36) acetoxymethyl-2-furaldehyde; (37) ethyl ester benzenepropanoicacid; (38) nonadecane; (39) hexadecane; (40) furyl hydroxymethyl ketone; (41) 5-acetoxymethylfurfural; (42) 4-(2-hydroxyethyl)phenol.

96 M. Pontes et al. / Talanta 74 (2007) 91–103
Table 1Volatile compounds identified in H1 honey after dynamic headspace solid-phase microextraction using different coatings (extraction temperature: 60 ◦C; extractiontime: 40 min)
RT (min) KIa Compound Identityb SPME coating
PA CW/DVB CAR/PDMS PDMS DVB/CAR/PDMS
2.575 929 Ethanol A, B x x x x x3.614 1023 Toluene A, B x x4.186 1064 Hexanal A, B x6.295 1178 Heptanal A, B x x8.259 1254 1,3-Butanediol A x8.481 1261 1-Methyl-3-(1-methylethyl)-benzene A, B x x x9.233 1285 2,4,6,8-Tetramethyl-1-undecane B x x9.942 1307 1-Hydroxy-2-propane B x x x x10.864 1337 Linalool B x x12.668 1389 Nonanal A, B x x x x12.796 1392 (E)-2-Nonen-1-ol A, B x x14.130 1432 Heptanoic acid ethyl ester B x x x14.274 1436 1,4-Diclorobenzene A, B x x x x14.401 1439 Trans-linalool oxide B x x x x x15.025 1457 Acetic acid B x x x15.368 1466 Cis-linalool oxide B x15.368 1466 Furfural A, B x x x x15.767 1477 �-Cubebeno A, B x16.149 1486 Methyl ester nonanoic acid A, B x x16.578 1497 Hexadecane B x x16.764 1502 1-(2-Furanyl)-ethanone A, B x x x17.009 1508 TBHc B x x17.009 1508 (E,E,E)-2,4,6-Octatriene A, B x x17.300 1515 Benzaldehyde A, B x x x18.849 1549 (S)-Linalool B x x18.849 1549 5-Methyl-1,3,6-heptatriene A, B x x19.248 1558 3-Methyl-1,5-pentenediol B x19.248 1558 1-Hexene A, B x x19.801 1569 5-Methylfurfural B x20.052 1574 �-Elemene B x21.343 1600 �-4-Dimethyl-3-cyclohexene-1-acetaldehyde B x21.840 1611 Hotrienol B x x x x x22.144 1617 Dihydro-cis-�-copaene-8-ol B x22.589 1626 Pulegone B x22.893 1633 Phenylacetaldehyde B x x x x23.122 1637 Acetophenone B x x x x23.475 1644 3-Carene A, B x23.981 1654 1-Nonanol A, B x x x x24.252 1660 2-Furanmethanol A, B x x x x x25.472 1683 d-Germacrene B x26.312 1698 Heptadecane B x x x x x27.090 1714 Naphthalene A, B x x x x28.038 1733 �-Cubebene A, B x29.198 1756 Methyl ester 2-hidroxy-benzoic acid A,B x29.368 1759 Cis-�-bisabolene A, B x29.368 1759 �-Ocimene B x29.734 1766 (Z)-Heptene A, B x31.591 1801 DPEPAd B x31.591 1801 �-Damascenone A, B x31.591 1801 TMCHBe B x x31.819 1805 �-Methyl-benzenemethanol A, B x x x x33.474 1839 Ethyl ester dodecanoic acid B x x33.774 1845 (E)-6,10-Dimethyl-5,9-undecadien-2-one B x x x x x35.010 1869 �-2-Propenyl-benzenemethanol B x x x36.628 1898 Nonadecane B x x x x x36.918 1904 �-Ionol A, B x36.918 1904 DDMMPf A, B x40.004 1967 2-Ethyl-hexanoic acid A, B x42.142 2008 2-Methyl-pentanal B x45.000 2068 1,3-Dihydroxy-2-propanone A, B x x x x46.548 2098 10-Methyl eicosane B x x

M. Pontes et al. / Talanta 74 (2007) 91–103 97
Table 1 (Continued )
RT (min) KIa Compound Identityb SPME coating
PA CW/DVB CAR/PDMS PDMS DVB/CAR/PDMS
49.500 2162 Nonanoic acid B x x x x53.494 2225 DDMPg A, B x x x x55.814 2251 2,3,4-Trimethyl-hexane A, B x x58.057 2275 2-Acetylbenzoic acid B x61.825 2345 4-Hydroxy-benzenmethanol B x63.381 2395 5-Hydroxymethylfurfural B x x x x64.113 2418 2,6-Dimethoxy-4-(2-propenyl)-phenol B x65.352 2457 Dihydro-4-hydroxy-2(3H)-furanone A, B x
Total compoundsidentified byfibre
32 30 35 17 50
a Experimentally determined Kovats indices on the BP-20 column, relative to C8–C20 hydrocarbons.b (A) Components identified on the basis of the retention time and EI mass spectra of pure standard; (B) components identified on the basis of their EI mass spectra
only.c 1,7,7-Trimethyl-bicyclo[2.2.1]hepten-2-ene.d 2,2-Dimethyl-2-phenylethyl ester propanoic acid.e
HotST(twaf
Taes
Hmp
Aofafs5l
TSw
C
HFENSFCHMS%
1-(2,6,6-Trimethyl-1,3-cyclohexadien-1-yl)-2-buten-1-one.f 4,6-Di(1,1-dimethylethyl)-2-methylphenol.g 2,3-Dihydro-3,5-dihydroxy-6-methyl-4H-pyran-4one.
Each type of honey showed a typical composition.1 honey (Fig. 3) is characterized by a high amountf ethanol, furfural, nonanal, 1,3-dihydroxy-2-propanone,rans-linalool oxide, benzaldehyde, hotrienol, and nonanol.ome identified compounds are specific of this sample.herefore, heptanal, ethyl heptanoate, �- and �-cububene,
Z)-heptene, �-propenyl-2-benzenemethanol, pulegone, ace-ophenone, 3-carene, d-germacrene and 2,3,4-trimethylhexane,ere identified only in this honey sample. This sample is
lso characterized by the lowest level of 5-hydroxymethyl-urfural.
H2 (Fig. 3) is characterized by a high amount of hotrienol.
his compound was identified in each honey analysed butt lower levels. Also 5-hydroxymethylfurfural, benzeneac-taldehyde, furfural and trans-linalool oxide, are present inignificantly high amounts, when compared with the H1,teth
able 2orption capacity of different fibres for extraction of H1 honey volatile compounds dith salt saturation)
lass of compounds SPME fibre
PA CW/DVB
igher alcohols 1.10 × 10⁸ 1.12 × 10⁸
atty acids 7.78 × 10⁶ 3.53 × 10⁶
thyl esters – –Ta 2.16 × 10⁶ 6.08 × 10⁶
esquiterpenoids – 5.21 × 10⁵
uranic compounds 1.04 × 10⁸ 1.43 × 10⁷
arbonyl compounds 4.71 × 10⁷ 3.05 × 10⁶
SHArb 2.98 × 10⁶ 7.57 × 10⁶
iscellaneous 1.95 × 10⁶ –um 2.04 × 10⁸ 1.63 × 10⁸
R.S.D. (n = 4) on sum 4.66 4.89
a C13-norisoprenoids and monoterpenes.b Aliphatic and aromatic hydrocarbons.
3 and H4 honey samples. 1,3,8-p-menthatriene, 1-ethyl-2-ethylcyclopropane, cycloheptane, and �-phenylethanol, are
resent only in H2 honey type.In H3 honey were identified 60 volatile compounds.
s shows Fig. 3, the most intense peaks correspond to-methoxyacetophenone, benzeneacetaldehyde, hotrienol, fur-ural, ethyl dodecanoate and 2-ethyl hexanoic acid. o-methoxy-cetophenone and 2-ethyl hexanoic acid can be used to dif-erentiate these honey type from H1, H2 and H4 samples,ince were detected, at high levels, only in this sample.-Hydroxymethylfurfural, 1,3-dihydroxy-2-propanone, trans-inalool oxide, furfural, hotrienol and benzeneacetaldehyde, are
he dominating components found in the H4 sample. Forty-ight compounds were positively identified in this honey withhe experimental conditions used. 3-Methyl-1-butanol, (E)-2-exen-1-ol, 3-methyl-1-pentanol, 5-acetoxymethylfurfural anduring dynamic HS-SPME extraction, expressed as peak area (40 min at 60 ◦C
DVB/CAR/PMS PDMS CAR/PDMS
8.07 × 10⁷ 5.34 × 10⁷ 1.00 × 10⁸
1.23 × 10⁶ 8.04 × 10⁵ 5.71 × 10⁵
2.85 × 10⁶ – 6.70 × 10⁵
8.95 × 10⁶ 1.99 × 10⁶ 8.34 × 10⁶
1.63 × 10⁶ – –7.16 × 10⁶ 1.33 × 10⁷ 3.60 × 10⁷
1.19 × 10⁷ 5.75 × 10⁵ 1.91 × 10⁷
1.38 × 10⁷ 5.06 × 10⁶ 5.67 × 10⁶
5.64 × 10⁵ – 3.10 × 10⁵
2.84 × 10⁸ 9.09 × 10⁷ 1.71 × 10⁸
2.81 1.67 11.63

98 M. Pontes et al. / Talanta 74 (2007) 91–103
Table 3Volatile compounds identified in different types of Portuguese honeys after dynamic headspace solid-phase microextraction using DVB/CAR/PDMS coating(extraction temperature: 60 ◦C; extraction time: 40 min)
RT (min) KIa Compound RPA (%) RPC (%)
H1 H2 H3 H4 H1 H2 H3 H4
2.575 929 Ethanol 56.16 41.86 44.27 29.30 51 69 100 983.228 992 Tricloromethane – – 1.25 – – – 100 –3.614 1023 Toluene 3.99 2.95 2.32 1.61 48 72 80 1005.941 1162 2,6-Dimethyl-4-heptanone – – – 0.09 – – – 1006.295 1178 Heptanal 0.60 – – – 100 – – –7.105 1212 3-Methyl-1-butanol – – – 0.16 – – – 1008.187 1252 3-Octanone – 0.35 – 0.10 – 100 – 808.252 1254 Styrene – – 0.16 – – – 100 –8.259 1254 1,3-Butanediol 0.25 – – – 100 – – –8.481 1261 1-Methyl-2-(1-methylethyl)-benzene 0.19 0.14 0.13 0.12 35 41 58 1009.377 1289 1-Methoxy-2-methyl-propane – – – 0.26 – – – 1009.942 1307 1-Hydroxy-2-propane 0.95 0.54 – 0.22 100 55 – 9610.387 1322 2-Heptanol – – – 0.14 – – – 10012.524 1385 Methyl ester octanoic acid – – 0.49 0.15 – – 100 5712.668 1389 Nonanal 6.94 – – – 100 – – –12.629 1388 (E)-2-Hexen-1-ol – – – 0.36 – – – 10012.796 1392 (E)-2-Nonen-1-ol 0.93 1.25 1.55 – 17 53 100 –14.100 1431 1-Methyl-4-(1-methylethenyl)-benzene – 0.67 1.05 0.36 – 43 100 6414.13 1432 Heptanoic acid ethyl ester 0.20 – – – 100 – – –14.267 1436 1,4-Dichloro-benzene 1.05 – – – 100 – – –14.401 1439 Trans-linalool oxide 4.99 7.83 4.92 3.90 30 73 69 10014.469 1441 1,3,8-p-Menthatriene – 0.39 – – – 100 – –15.025 1457 Acetic acid 1.12 2.11 0.90 0.78 35 99 66 10015.368 1466 Furfural 8.09 11.31 6.10 3.62 32 100 82 8815.767 1477 �-Cubebene 1.67 – – – 100 – – –16.13 1486 Methyl ester nonanoic acid – – 0.55 0.13 – – 100 4316.241 1489 2-Ethyl-1-hexanol – – 0.29 – – – 100 –16.358 1492 Decanal – 0.86 0.31 0.14 – 100 53 4516.535 1496 Benzofuran – – 0.85 – – – 100 –16.578 1497 Hexadecane 0.34 – – 0.19 29 – – 10016.764 1502 1-(2-Furanyl)-ethanone 0.20 0.92 0.60 0.27 14 100 98 8016.917 1505 1-(1,4-Dimethyl-3-cyclohexen-1-yl)-ethanone – – 0.41 0.18 – – 100 7917.009 1508 1,7,7-Trimethyl-bicyclo[2.2.1]hepten-2-ene 0.35 – – – 100 – – –17.3 1515 Benzaldehyde 4.60 2.80 0.80 – 73 100 44 –17.47 1518 2-Nonanol – – 0.76 – – – 100 –18.009 1531 Ethyl ester octanoic acid – – 0.34 – – – 100 –18.849 1549 (S)-Linalool 1.46 0.78 1.16 0.56 51 44 100 8819.189 1557 Cis-1-ethyl-2-methyl-cyclopropane – 0.37 – – – 100 – –19.192 1557 (S)-(+)-3-Methyl-1-pentanol – – – 0.17 – – – 10019.801 1569 5-Methylfurfural 0.32 0.5 0.32 – 28 99 100 –20.774 1589 2-Methyl benzofuran – – 0.86 – – – 100 –21.343 1600 �-4-Dimethyl-3-cyclohexene-1-acetaldehyde 0.10 0.84 – 0.17 21 100 – 5521.840 1611 Hotrienol 3.79 30.33 7.20 4.98 8 100 36 4522.144 1617 Dihydro-cis-�-copaene-8-ol 0.02 – – – 100 – – –22.562 1626 1-Ethenyl-4-methoxybenzene – – 0.72 – – – 100 –22.589 1626 Pulegone 0.14 – – – 100 – – –22.893 1633 Phenylacetaldehyde 0.50 12.44 7.92 3.69 2 100 89 8223.122 1637 Acetophenone 1.24 – – – 100 – – –23.475 1644 3-Carene 0.29 – – – 100 – – –23.661 1648 2-Hydroxy-3,5,5-trimethyl-cyclohex-2-enone – 0.87 – 0.50 – 68 – 10024.252 1660 1-Nonanol 4.04 1.18 1.00 0.66 100 60 83 9924.436 1663 2-Furanmethanol 1.52 1.51 – 1.32 27 36 – 10025.105 1676 2,6,6-Trimethyl-2-cyclohexene-1,4-dione – 0.38 0.55 0.27 – 60 100 8925.472 1683 d-Germacrene 0.60 – – – 100 – – –25.681 1687 1-Methyl-4-(1-methylethylidene)-cyclohexene – – 0.20 – – – 100 –25.703 1687 2,6-Dimethyl-5,7-octadien-2-ol – 0.14 – 0.11 – 10 100 1626.272 1697 Eicosane – 1.22 1.26 – – 100 95 –26.312 1698 Heptadecane 2.40 – – 0.64 84 – – 10027.011 1712 8-Heptadecane – – 0.29 – – – 100 –27.090 1714 Naphthalene 4.45 – 0.14 – 100 – 11 –27.318 1719 2-Heptadecanol – – 0.78 – – – 100 –

M. Pontes et al. / Talanta 74 (2007) 91–103 99
Table 3 (Continued )
RT (min) KIa Compound RPA (%) RPC (%)
H1 H2 H3 H4 H1 H2 H3 H4
27.328 1719 2-Tetradecanol – 0.26 – – – 100 – –27.357 1720 1,2-Dihydro-3,6,8-trimethyl-naphthalene – 0.46 – – – 100 – –28.038 1733 �-Cubebene 0.35 – – – 100 – – –29.172 1756 2-Hydroxy methyl ester benzoic acid – 2.02 – 0.36 – 100 – 4829.198 1756 Methyl ester 2-hidroxy-benzoic acid 0.52 – – – 100 – – –29.368 1759 Cis-�-bisabolene 0.25 – – – 100 – – –29.446 1761 Cycloheptane – 0.56 – – – 100 – –29.453 1761 2-Methyl-cyclopentanone – – – 0.33 – – – 10029.734 1766 (Z)-Heptene 0.96 – – – 100 – – –30.400 1779 4-Hydroxy-acetophenone – – 0.25 – – – 100 –31.182 1793 Methyl ester dodecanoic acid – – 0.81 – – – 100 –31.587 1800 2-Phenylethyl ester propanoic acid – – 0.33 0.30 – – 61 10031.591 1801 2,2-Dimethyl-2-phenylethyl ester propanoic acid 4.99 – – – 100 – – –31.819 1805 (S)-�-Methyl-benzenemethanol 0.57 – 0.42 – 55 – 100 –33.395 1837 Ethyl ester dodecanoic acid – 1.38 6.80 – – 15 100 –33.424 1838 Ethyl ester decanoic acid – – – 0.22 – – – 10033.594 1841 �-4-Trimethyl-benzenemethanol – – – 0.11 – – – 10033.774 1845 (E)-6,10-Dimethyl-5,9-undecadien-2-one 2.15 – 0.96 – 91 – 100 –34.336 1856 3-Methylbuthyl ester pentadecanoic acid – – 0.24 – – – 100 –34.901 1866 Phenol – – 0.64 – – – 100 –35.010 1869 �-2-Propenyl-benzenmethanol 0.78 – – – 100 – – –36.565 1897 �-Phenylethanol – 1.84 – – – 100 – –36.628 1898 Nonadecane 2.53 – 1.90 0.89 54 – 100 8536.830 1902 �-Ionol – – 0.56 – – – 100 –36.918 1904 4,6-Di-(1,1-dimethylethyl)-2-methyl phenol 1.80 – – – 100 – – –37.052 1907 Benzyl nitrile – – 0.26 0.16 – – 91 10038.602 1939 2,3,4,5-Tetramethyl-1,4-hexadiene – – – 0.97 – – – 10038.951 1946 2-Ethyl hexanoic acid – – 6.08 – – – 100 –40.203 1971 o-Methoxyacetophenone – – 19.25 – – – 100 –40.664 1979 MFPOEb – – – 0.29 – – – 10040.906 1984 Furyl hydroxymethyl ketone – – – 0.41 – – – 10041.71 1999 Methyl tetradecanoate – – 0.48 – – – 100 –43.727 2042 Ethyl ester tetradecanoic acid – – 0.55 – – – 100 –44.358 2055 Octanoic acid – 0.81 1.61 0.68 – 46 100 7845.355 2075 1,3-Dihydroxy-2-propanone 6.20 6.97 5.61 6.90 18 53 45 10046.548 2098 10-Methyleicosane 0.75 – – – 100 – – –49.862 2170 Cyclododecane – – 0.42 – – – 100 –50.189 2176 5-Acetoxymethylfurfural – – – 0.29 – – – 10050.679 2186 Nonanoic acid 0.70 0.75 1.01 0.34 26 57 100 6351.673 2204 15-Methyl ester hexadecanoic acid – – 0.40 – – – 100 –53.461 2225 Ethyl ester hexadecanoic acid – – 0.72 – – – 100 –53.824 2229 DDMPc 1.61 2.23 0.70 1.61 24 57 25 10054.464 2236 Ethyl ester E-11 hexadecanoic acid – – 1.02 – – – 100 –54.732 2239 2,3-Dimethoxy-naphthalene – – 1.67 – – – 100 –55.814 2251 2,3,4-Trimethyl-hexane 6.06 – – – 100 – – –59.217 2287 3,5-Dimethoxy methyl ester benzoic acid – – 0.82 – – – 100 –63.074 2345 Dodecanoic acid – – 1.12 – – – 100 –63.381 2395 5-Hydroxymethylfurfural 0.31 14.71 4.86 10.93 1 59 29 10065.352 2457 Dihydro-4-hydroxy-2-(3H)-furanone 0.33 – – 0.37 21 – – 100
Total compoundsidentified byhoney
50 37 60 48
Sum of total area 2.8 × 10⁸ 4.3 × 10⁸ 5.2 × 10⁸ 5.12 × 10⁸
% R.S.D. (n = 4) 2.81 1.95 7.35 7.30
a Experimentally determined Kovats indices on the BP-20 column, relative to C8–C20 hydrocarbons.b 1-[3-[2-Methyl-2-[5-methyl-2-furanyl]propyl]oxiranyl]-ethanone.c 2,3-Dihydro-3,5-dihydroxy-6-methyl-4H-pyran-4-one.
100 M. Pontes et al. / Talanta 74 (2007) 91–103
Fig. 2. Comparison of the performance of different SPME coatings on the carbonyl compounds, monoterpenoids, furanic compounds and sesquiterpenoids extraction( ; diproC (2-fum 3-care
2sh
hEahv
3
aftcze
tti((avmte(b(tp
TP
C
123
E
hex: hexane; hep: heptane; benz: benzaldehyde; benzacet: benzeneacetaldehydeLin: cis-linalool oxide; Lin: linalool; OHT: hotrienol; fur: furfural; furet: 1-ethyl-4H-pyran-4-one; HMF: 5-hydroxymethylfurfural; ele: �-elemene; car:
-methylcyclopentanone, has been detected only in this honeyample. Fig. 4 presents the distribution of compounds classes byoney sample.
The presence of several honey constituents found in this studyave been previously reported. The presence of hotrienol in theucryphia lucida honey [38]. We have also found, for instanceromatic aldehydes such as benzaldehyde and benzeneacetalde-yde, which have been reported as common components ofarious unifloral honey [39].
.3. Multivariate analysis
The proposed headspace SPMEDVB/CAR/PDMS method waspplied to four different commercial honeys. Evidently, the dif-erent concentrations of the volatile constituents determined in
hese samples allow their differentiation. Although the volatileompounds studied showed important data for the characteri-ation of honey samples, the differentiation is quite difficult tostablish from the direct observation of Table 3. Multivariate(msp
able 4ercentage of variance and percentage of cumulative variance explained by the three
omponent Total variance explained
Extraction sums of squared loadings
Total % of variance Cumulative %
3.771 53.877 53.8772.449 34.988 88.8640.664 9.491 98.355
xtraction method: principal component analysis.
p: 1,3-hydroxy-2-propanone; Lin O: linalool oxide; T Lin: trans-linalool oxide;ranyl)-ethanone; furan: furanmethanol; DDMP: 2,3-dihydro-3,5-dihydroxy-6-ne; cub: �-cubebene; bis: �-bisabolene; ger: d-germacrene).
echniques of data analysis represent a powerful statistical toolo explain this differentiation. The total peak area of each chem-cal group, higher alcohols (HA), fatty acids (FAc), ethyl estersEEs), C13-norisoprenoids/monoterpenols/sesquiterpenoidsNTS1), furanic compounds (FC), carbonyl compounds (CaC)nd aliphatic/aromatic hydrocarbons (HSHAr), were used asariable vectors for multivariate analysis in order to obtainore detailed information. When PCA was applied to the
otal peak area different chemical classes, three factors werextracted and 98.3% of the total variance was explainedTable 4). As can be seen in Fig. 5a, a clear separation cane observed. Considering the factor loadings of the variablesTable 5), the most influential variables (chemical groups)o the first component (PC1, 50.1%), are carbonyl com-ounds, ethyl esters and fatty acids, while NTS1, HSHAr
25.9%) and furan derivatives (22.3%), are the variables thatost contribute to the PC2 and PC3, respectively. Fig. 5ahows the scores scatter plot of the first two principal com-onents (50.1% of the total variability) that represents the
first principal components
Rotation sums of squared loadings
Total % of variance Cumulative %
3.509 50.124 50.1241.814 25.917 76.0411.562 22.314 98.355
M. Pontes et al. / Talanta 74 (2007) 91–103 101
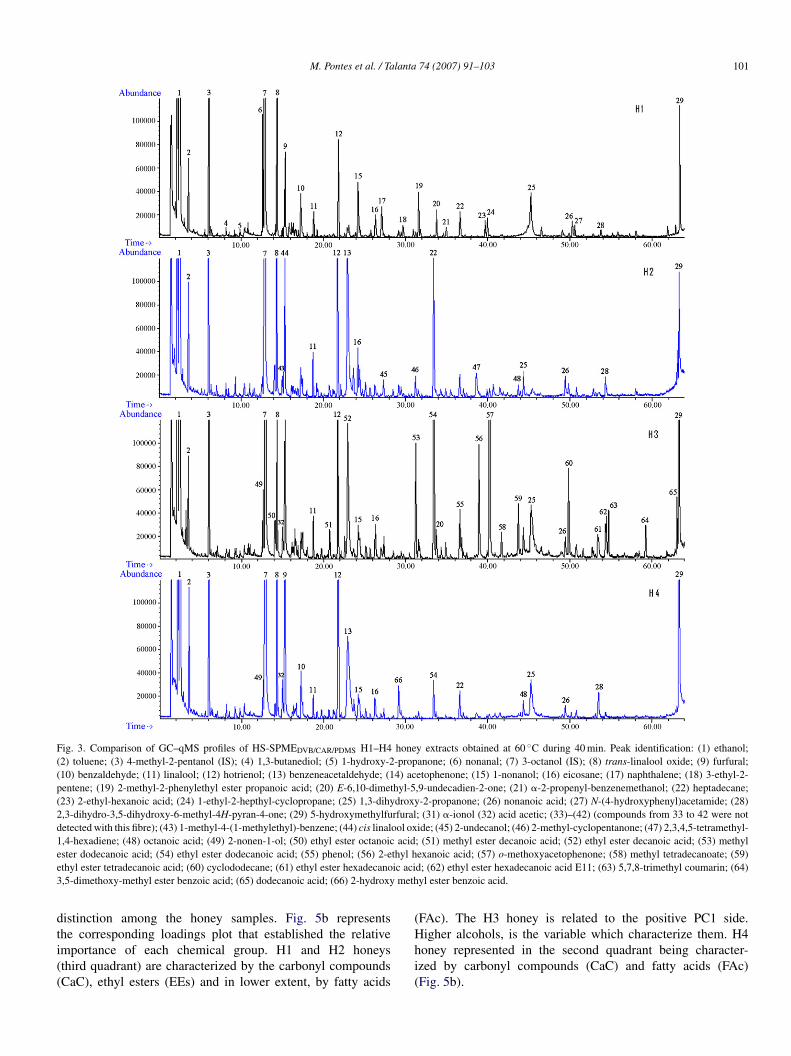
Fig. 3. Comparison of GC–qMS profiles of HS-SPMEDVB/CAR/PDMS H1–H4 honey extracts obtained at 60 ◦C during 40 min. Peak identification: (1) ethanol;(2) toluene; (3) 4-methyl-2-pentanol (IS); (4) 1,3-butanediol; (5) 1-hydroxy-2-propanone; (6) nonanal; (7) 3-octanol (IS); (8) trans-linalool oxide; (9) furfural;(10) benzaldehyde; (11) linalool; (12) hotrienol; (13) benzeneacetaldehyde; (14) acetophenone; (15) 1-nonanol; (16) eicosane; (17) naphthalene; (18) 3-ethyl-2-pentene; (19) 2-methyl-2-phenylethyl ester propanoic acid; (20) E-6,10-dimethyl-5,9-undecadien-2-one; (21) �-2-propenyl-benzenemethanol; (22) heptadecane;(23) 2-ethyl-hexanoic acid; (24) 1-ethyl-2-hepthyl-cyclopropane; (25) 1,3-dihydroxy-2-propanone; (26) nonanoic acid; (27) N-(4-hydroxyphenyl)acetamide; (28)2,3-dihydro-3,5-dihydroxy-6-methyl-4H-pyran-4-one; (29) 5-hydroxymethylfurfural; (31) �-ionol (32) acid acetic; (33)–(42) (compounds from 33 to 42 were notdetected with this fibre); (43) 1-methyl-4-(1-methylethyl)-benzene; (44) cis linalool oxide; (45) 2-undecanol; (46) 2-methyl-cyclopentanone; (47) 2,3,4,5-tetramethyl-1,4-hexadiene; (48) octanoic acid; (49) 2-nonen-1-ol; (50) ethyl ester octanoic acid; (51) methyl ester decanoic acid; (52) ethyl ester decanoic acid; (53) methyle thyl he ic aci3 meth
dti((
(
ster dodecanoic acid; (54) ethyl ester dodecanoic acid; (55) phenol; (56) 2-ethyl ester tetradecanoic acid; (60) cyclododecane; (61) ethyl ester hexadecano,5-dimethoxy-methyl ester benzoic acid; (65) dodecanoic acid; (66) 2-hydroxy
istinction among the honey samples. Fig. 5b represents
he corresponding loadings plot that established the relativemportance of each chemical group. H1 and H2 honeysthird quadrant) are characterized by the carbonyl compoundsCaC), ethyl esters (EEs) and in lower extent, by fatty acidsHhi(
exanoic acid; (57) o-methoxyacetophenone; (58) methyl tetradecanoate; (59)d; (62) ethyl ester hexadecanoic acid E11; (63) 5,7,8-trimethyl coumarin; (64)yl ester benzoic acid.
FAc). The H3 honey is related to the positive PC1 side.
igher alcohols, is the variable which characterize them. H4oney represented in the second quadrant being character-zed by carbonyl compounds (CaC) and fatty acids (FAc)Fig. 5b).
102 M. Pontes et al. / Talanta 74 (2007) 91–103
Fig. 4. Distribution of compounds classes by honey samples (NT: C13-norisoprenoids and monoterpenoids; S: sesquiterpenoids; HA: higher alcohols;CaC: carbonyl compounds; EEs: ethyl esters; FAc: fatty acids; HSHAr: aliphaticand aromatic hydrocarbons; FC: furanic compounds; Mis: miscellaneous).
Table 5Loadings of volatiles in the first three principal components
Rotated component matrixa
Component 1 Component 2 Component 3
CC 0.994 0.081 −0.019EE 0.960 −0.220 −0.060FA 0.783 0.208 0.579Alc 0.781 −0.169 0.556NTS 0.186 0.938 0.284HSHA 0.579 −0.802 −0.124F −0.057 0.403 0.904
(1) PC1; (2) PC2 and (3) PC3; rotation method: Varimax with Kaiser nor-malization; CC: carbonyl compounds; EE: ethyl esters; FA: fatty acids; Alc:higher alcohols; NTS: C13-norisoprenoids, monoterpenoids and sesquiter-penoids; HSHA: aliphatic and aromatic hydrocarbons; F: furanic compounds.Extraction method: principal component analysis. Rotation method: Varimaxw
uct
Table 6Prediction abilities for the different honeys, using stepwise discriminant analysis
HM Classification resultsa,b
Predicted group membership Total
H1 H2 H3 H4
Original
Count H1 4 0 0 0 4H2 0 4 0 0 4H3 0 0 4 0 4H4 0 0 0 4 4
% H1 100.0 0 0 0 100.0H2 0 100.0 0 0 100.0H3 0 0 100.0 0 100.0H4 0 0 0 100.0 100.0
Cross-validatedc
Count H1 4 0 0 0 4H2 0 4 0 0 4H3 0 0 4 0 4H4 0 0 0 4 4
% H1 100.0 0 0 0 100.0H2 0 100.0 0 0 100.0H3 0 0 100.0 0 100.0H4 0 0 0 100.0 100.0
a 1000% of original grouped cases correctly classified.b 1000% of cross-validated grouped cases correctly classified.c Cross-validation is done only for those cases in the analysis. In cross-
validation, each case is classified by the functions derived from all cases othert
frgcup
FbC
ith Kaiser normalization.a Rotation converged in five iterations.
After PCA, a linear discriminant analysis (LDA) was run,sing the above-mentioned variables, in order to obtain suitablelassification rules. Fig. 6 shows a projection of the honeys inwo-dimensional space, generated by the two first discriminate
cse
ig. 5. PC1 and PC2 scatter plot of the main sources of variability between honeyetween the chemical classes (loadings); Variables identification: CaC: carbonyl c
13-norisoprenoids/monoterpenes/sesquiterpenoids; HSHAr: aliphatic and aromatic
han that case.
unctions that explain 97.9% of the total variance. Four groupsepresenting each honey, H1–H4, were clearly observed. Theood agreement achieved indicates that very acceptable classifi-ation functions can be deduced. The leave one out method wassed as cross-validation procedure to evaluate the classificationerformance (Table 6).
From the results it can be concluded that headspace SPMEoupled to GC–qMS and chemometrics is a very appropriate
ampling technique to distinguish the different Portuguese hon-ys studied based on their volatile profile.samples (H1–H4). (a) Distinction between the samples (scores); (b) relationompounds; EEs: ethyl esters; FAc: fatty acids; HA: higher alcohols; NTS1:hydrocarbons; FC: furanic compounds.

M. Pontes et al. / Talanta
4
btccspwcSsawcsteat“Uct
R
[[[
[[[[
[[
[
[
[
[
[[
[
[
[[[[
[
[
[
[[[
Fig. 6. Differentiation between H1–H4 honeys by applying LDA.
. Conclusions
Headspace solid-phase microextraction sampling followedy GC–qMS analysis provides an appropriate and selective wayo characterize the volatile compounds in honey. Is a simple pro-edure of extraction with a great capacity of concentration andombines extraction to a rapid, sensitive and solvent-free methoduitable for determination of volatile and semivolatile com-ounds. The chromatographic profiles obtained after extractionith PDMS, PA, CAR/PDMS, CW/DVB and DVB/CAR/PDMS
oatings suggest that the later was the most suitable for thePME analysis of honey volatiles. The more polar fibre, PA,hows no more effective extraction for polar such as higherlcohols, fatty acids, furan derivatives and carbonyl compounds,hile DVB/CAR/PDMS favours the extraction of less polar
ompounds like ethyl esters, C13-norisoprenoids/monoterpenes,esquiterpenoids and aliphatic and aromatic hydrocarbons. Morehan 100 volatile compounds, including higher alcohols, ethylsters and fatty acids, were identified. The higher alcohols, fattycids and C13-norisoprenoids/monoterpenes constitute impor-ant aroma groups compounds which contributes with “fruity”,cheese/fatty” and “flowery” notes to honey sensory properties.sing a chemometric approach (PCA and LDA), the volatile
omposition in terms of average peak areas, provides a suitableool to differentiate between the analysed honeys.
eferences
[1] L. Cuevas-Glory, J. Pino, L. Santiago, E. Sauri-Duch, Food Chem. 103(2007) 1032.
[2] M. Al-Mamary, A. Al-Meeri, M. Al-Habori, Nutr. Res. 22 (2002) 1041.
[
[
[
74 (2007) 91–103 103
[3] S. Buratti, S. Benedetti, M. Cosio, Talanta 71 (2007) 1387.[4] E. Alissandrakis, P. Tarantilis, P. Harizanis, M. Moschos, J. Sci. Food Agric.
85 (2005) 91.[5] B. D’Arcy, G. Rintoul, C. Rowland, A. Blackman, J. Agric. Food Chem.
45 (1997) 1834.[6] R. Perez, C. Sanchez-Brunete, R. Calvo, J. Tadeo, J. Agric. Food Chem.
50 (2002) 2633.[7] F. Bianchi, M. Carreri, M. Musci, Food Chem. 89 (2005) 527.[8] C. Guyot, V. Scheirman, S. Collin, Food Chem. 64 (1999) 3.[9] V. Ferreira, N. Ortin, A. Escudero, R. Lopez, J. Cacho, J. Agric. Food
Chem. 50 (2002) 4048.10] J. Nunez, H. Bemelmans, Chromatogr. A 294 (1984) 361.11] G. Blanch, G. Reglero, M. Herraiz, J. Agric. Food Chem. 43 (1995) 1251.12] R. Lopez, M. Aznar, J. Cacho, V. Ferreira, J. Chromatogr. A 966 (2002)
166.13] C. Cocito, G. Gaetano, C. Delfini, Food Chem. 52 (1995) 311.14] H. Lord, J. Pawliszyn, J. Chromatogr. A 885 (2000) 153.15] Z. Zhang, J. Pawliszyn, Anal. Chem. 65 (1993) 1843.16] E. Baltussen, P. Sandra, F. David, C. Cramers, J. Microcolumn Sep. 11
(1999) 737.17] R. Alves, A. Nascimento, J. Nogueira, Anal. Chim. Acta 546 (2005) 11.18] E. Coelho, S.M. Rocha, I. Delgadillo, M.A. Coimbra, Anal. Chim. Acta
563 (2006) 204.19] S.M. Rocha, P. Coutinho, A. Barros, I. Delgadillo, M.A. Coimbra, J. Chro-
matogr. A 1114 (2006) 188.20] J. Demyttenaere, C. Dagherb, P. Sandra, S. Kallithraka, R. Verhe, N. Kimpe,
J. Chromatogr. A 985 (2003) 233.21] M. Begala, L. Corda, G. Podda, M. Fedrido, P. Traldi, Rapid Commun.
Mass Spectrom. 16 (2002) 1086.22] M. Burmeister, C. Drumond, E. Pfiesterer, D. Hysert, J. Am. Soc. Brew.
Chem. 50 (1992) 53.23] O. Pinho, I. Ferreira, L. Santos, J. Chromatogr. A 1121 (2006) 145.24] J. Camara, J. Marques, R. Perestrelo, F. Rodrigues, L. Oliveira, P. Andrade,
M. Caldeira, J. Chromatogr. A 1150 (2007) 198.25] J. Demyttenaere, C. Dagherb, P. Sandra, S. Kallithraka, R. Verhe, N. Kimpe,
J. Chromatogr. A 985 (2003) 221.26] J. Pino, M. Martı, M. Mestres, J. Perez, O. Busto, J. Guasch, J. Chromatogr.
A 954 (2002) 51.27] J. Pino, R. Marbot, C. Vazquez, J. Agric. Food Chem. 49 (2001) 5883.28] J. Pino, R. Marbot, C. Vazquez, J. Agric. Food Chem. 50 (2002) 6023.29] M. Lopez, G. Guzman, A. Dorantes, J. Chromatogr. A 1036 (2004) 87.30] A. Gioacchini, M. Menotta, L. Bertini, I. Rossi, S. Zeppa, A. Zambonelli,
G. Piccoli, V. Stocchi, Rapid Commun. Mass Spectrom. 19 (2005) 2365.31] F. Augusto, A. Valente, E. Tada, S. Rivellino, J. Chromatogr. A 873 (2000)
117.32] E. Alissandrakis, P. Tarantilis, P. Harizanis, M. Polissiou, Food Chem. 100
(2007) 396.33] M. Baroni, M. Nores, M. Dıaz, G. Chiabrando, J. Fassano, C. Costa, D.
Wunderlin, J. Agric. Food Chem. 54 (2006) 7235.34] A. Soria, I. Martınez-Castro, J. Sanz, J. Sep. Sci. 26 (2003) 793.35] I. Jerkovic, J. Mastelic, Z. Marijanovic, Chem. Biodivers. 3 (2006) 1307.36] R. Pena, J. Barciela, C. Herrero, S. Garcia-Martın, J. Sep. Sci. 27 (2004)
1540.
37] J.S. Camara, M.A. Alves, J.C. Marques, Anal. Chim. Acta 555 (2006)191.38] C.Y. Rowland, A.J. Blackman, B.R. D’Arcy, G.B. Rintoul, J. Agric. Food
Chem. 43 (1995) 753.39] L. Piasenzotto, L. Gracco, L. Conte, J. Sci. Food Agric. 83 (2003) 1037.


![Palynological survey in honeys of Bahia (Brazil) [Original title: Prospecção palinológica em méis da Bahia]](https://static.fdokumen.com/doc/165x107/6341f6b0e8d6d6284d07e1db/palynological-survey-in-honeys-of-bahia-brazil-original-title-prospeccao-palinologica.jpg)