A liquid chromatography-quadrupole time-of-flight (LC-QTOF)-based metabolomic approach reveals new...
14
Subscriber access provided by INRA Institut National de la Recherche Agronomique Journal of Proteome Research is published by the American Chemical Society. 1155 Sixteenth Street N.W., Washington, DC 20036 Article A Liquid Chromatography#Quadrupole Time-of-Flight (LC#QTOF)-based Metabolomic Approach Reveals New Metabolic Effects of Catechin in Rats Fed High-Fat Diets Anthony Fardet, Rafael Llorach, Jean-Franc#ois Martin, Catherine Besson, Bernard Lyan, Estelle Pujos-Guillot, and Augustin Scalbert J. Proteome Res., 2008, 7 (6), 2388-2398 • DOI: 10.1021/pr800034h • Publication Date (Web): 17 May 2008 Downloaded from http://pubs.acs.org on December 8, 2008 More About This Article Additional resources and features associated with this article are available within the HTML version: • Supporting Information • Access to high resolution figures • Links to articles and content related to this article • Copyright permission to reproduce figures and/or text from this article
Transcript of A liquid chromatography-quadrupole time-of-flight (LC-QTOF)-based metabolomic approach reveals new...
Subscriber access provided by INRA Institut National de la Recherche Agronomique
Journal of Proteome Research is published by the American Chemical Society.1155 Sixteenth Street N.W., Washington, DC 20036
Article
A Liquid Chromatography#Quadrupole Time-of-Flight(LC#QTOF)-based Metabolomic Approach Reveals NewMetabolic Effects of Catechin in Rats Fed High-Fat Diets
Anthony Fardet, Rafael Llorach, Jean-Franc#ois Martin, CatherineBesson, Bernard Lyan, Estelle Pujos-Guillot, and Augustin Scalbert
J. Proteome Res., 2008, 7 (6), 2388-2398 • DOI: 10.1021/pr800034h • Publication Date (Web): 17 May 2008
Downloaded from http://pubs.acs.org on December 8, 2008
More About This Article
Additional resources and features associated with this article are available within the HTML version:
• Supporting Information• Access to high resolution figures• Links to articles and content related to this article• Copyright permission to reproduce figures and/or text from this article
Subscriber access provided by INRA Institut National de la Recherche Agronomique
Journal of Proteome Research is published by the American Chemical Society.1155 Sixteenth Street N.W., Washington, DC 20036
A Liquid Chromatography-Quadrupole Time-of-Flight
(LC-QTOF)-based Metabolomic Approach Reveals New Metabolic
Effects of Catechin in Rats Fed High-Fat Diets
Anthony Fardet,† Rafael Llorach,‡ Jean-Francois Martin,† Catherine Besson,† Bernard Lyan,†
Estelle Pujos-Guillot,† and Augustin Scalbert*,†
UMR 1019, Unite de Nutrition Humaine, INRA, Centre de Recherche de Clermont-Ferrand/Theix,F-63122 St-Genes-Champanelle, France, and Nutrition and Food Science Department, XarTA,
Pharmacy School, University of Barcelona, 08028 Barcelona, Spain
Received January 15, 2008
Unbalanced diets generate oxidative stress commonly associated with the development of diabetes,atherosclerosis, obesity and cancer. Dietary flavonoids have antioxidant properties and may limit thisstress and reduce the risk of these diseases. We used a metabolomic approach to study the influenceof catechin, a common flavonoid naturally occurring in various fruits, wine or chocolate, on the metabolicchanges induced by hyperlipidemic diets. Male Wistar rats (n ) 8/group) were fed during 6 weeksnormolipidemic (5% w/w) or hyperlipidemic (15 and 25%) diets with or without catechin supplementation(0.2% w/w). Urines were collected at days 17 and 38 and analyzed by reverse-phase liquidchromatography-mass spectrometry (LC-QTOF). Hyperlipidic diets led to a significant increase ofoxidative stress in liver and aorta, upon which catechin had no effect. Multivariate analyses (PCA andPLS-DA) of the urine fingerprints allowed discrimination of the different diets. Variables were thenclassified according to their dependence on lipid and catechin intake (ANOVA). Nine variables wereidentified as catechin metabolites of tissular or microbial origin. Around 1000 variables were significantlyaffected by the lipid content of the diet, and 76 were fully reversed by catechin supplementation. Fourvariables showing an increase in urinary excretion in rats fed the high-fat diets were identified asdeoxycytidine, nicotinic acid, dihydroxyquinoline and pipecolinic acid. After catechin supplementation,the excretion of nicotinic acid was fully restored to the level found in the rats fed the low-fat diet. Thephysiological significance of these metabolic changes is discussed.
Keywords: Catechin • antioxidants • high-fat diets • metabolomics • urine • rats
Introduction
Major diet-related diseases or metabolic disorders such asatherosclerosis, cancers, diabetes and obesity are associatedwith increased oxidative stress.1–9 Unbalanced diets (hyper-lipidemic, hyperglycemic or hypercaloric) are known riskfactors for such diseases. They increase oxidative stress in ratsand humans, both in postprandial10–12 and chronic states.13,14
The levels of oxidized lipids (thiobarbituric acid reactivesubstances, TBARS) and of several antioxidant enzymes (su-peroxide dismutase, SOD, and glutathione (GSH)-reductase/transferase) were, respectively, increased and reduced invarious tissues upon the intake of high-sucrose and high-fatdiets.10,11,15,16 GSH depletion was observed in the aorta of apoE-deficient mice spontaneously developing atherosclerosis.17
Antioxidant polyphenols are able to counteract oxidativestress generated by such unbalanced diets.18,19 Flavonoids suchas quercetin or catechins were shown to reduce pro-oxidant
effects of high-fat or high-sucrose diets in the rat.20,21 Theseeffects might be explained by their free-radical scavengingproperties, but more recent studies also suggest that they maycontrol the activation/repression of transcription factors andmodulate the expression of key genes involved in the controlof the cell redox status, such as NADPH-quinone oxidoreduc-tase, glutathione S-transferase or ferritin.22–24 Thus, metaboliceffects of polyphenols cannot be reduced to their sole free-radical scavenging capacity and antioxidant effects. Morediverse metabolic effects were associated with a reduction ofthe risk for various chronic diseases.25,26 Metabolic responsesto unbalanced diets and to protective phytochemicals such aspolyphenols are therefore complex and not all related to thecontrol of the cell redox state.
The complexity of these effects can be explored by metabo-lomics, which has been defined as the quantitative measure-ment of the multivariate metabolic responses of multicellularsystems to pathophysiological stimuli or genetic modification.27
Itinferstheidentificationandquantificationofallmetabolitessthemetabolomesin the considered biological system, most oftenby NMR and MS techniques. In particular, the higher sensitivity
* To whom correspondence should be addressed. Tel: +33(0)473624787.Fax: +33(0)473624638. E-mail: [email protected].
† Unite de Nutrition Humaine.‡ University of Barcelona.
2388 Journal of Proteome Research 2008, 7, 2388–2398 10.1021/pr800034h CCC: $40.75 2008 American Chemical SocietyPublished on Web 05/17/2008
of the latter led to their rapid development in metabolomicsapplications, with the routine quantification of hundreds orthousands of different metabolites present in the micromolarrange or below.28
Subtle metabolic changes characterizing the early stages ofchronic diseases and their interaction with the diet or variousdietary factors have thus been described using metabolomicsapproaches.29–31 These approaches have been used to charac-terize the metabolic effects associated with caloric restriction,32,33
vitamin deficiency34 or intake of PUFA-rich oils and of anti-oxidant-rich foods such as soy, chamomile, and tea.35–39 Thewealth of information collected in metabolomics has revealedsubtle differences in metabolic profiles resulting from theconsumption of closely related foods: whole-grain and refined-grain cereals,40 different PUFA-containing oils36 or green andblack tea.35 Finally, metabolomics was also applied to explorethe metabolic effects of pure dietary antioxidants such asepicatechin.41 In the present work, the ability of catechin, amajor flavonoid found in many fruits, wine, tea or cocoa, tocounteract metabolic changes induced by high-fat diets isstudied in the rat. Urinary metabolic profiles measured by high-resolution mass spectrometry were compared. Evidence of thereversion of some of the metabolic effects of high-fat diets bycatechin is provided.
Materials and Methods
Animals and Diets. Six groups of male Wistar rats (n )8/group) weighing 324 g (range 284-379 g) were fed during 6weeks (day 0-42) normo-(5%) or hyperlipidemic (15 and 25%)diets equilibrated for vitamin E, and supplemented or not with0.2% (+)-catechin. The 0.2% supplementation correspond tothe 1 g of polyphenol consumed daily (on a dry matter basis)
by human and adapted to rats. Compositions of the diets aregiven in Table 1. Lipids were 70% lards, 15% peanut oil and15% colza oil which corresponded to a ratio polyunsaturated/monounsaturated/saturated lipids of 17/50/33. Vitamin mixwas AIN-93VX (UPAE, INRA, Jouy-en-Josas, France) and min-eral mix was AIN-93G (MP Biomedicals).42 Animals wereallowed free access to 30 g of fresh food per day, and to tapwater ad libitum. Rats were first housed 2 per cage during thefirst 2 weeks, and then transferred to metabolic cages (1 percage) during the 4 last weeks, and maintained in a temperature-controlled room (22 °C), with a dark period from 2000 to 0800 h.They were handled according to the recommendations of theInstitutional Ethics Committee (Clermont-Ferrand University).The body weight of rats was recorded each week, and foodintake twice a week. Urine samples were collected twice a day(1600-0900 h and 0900-1600 h) at days 17 and 38, and storedat -20 °C.
Sampling Procedure. Rats were anesthetized at day 42, atthe end of the dark period with sodium pentobarbital (40 mg/kg) and maintained at 37 °C during sample collection. Anabdominal incision was made, and blood was withdrawn fromthe abdominal aorta in heparinized tubes and centrifuged at1400g for 10 min. The supernatant (plasma) was collected andstored at -80 °C. Heart, liver and aorta were also collected.Heart and liver were flushed free of blood by injection ofphosphate buffer saline. Tissues were weighted and freezed-clamped into liquid nitrogen and stored at -80 °C.
Lipemia and Antioxidant Status Measurements. Plasmatriglycerides and total cholesterol were determined enzymati-cally (Triglycerides PAP 150 & Cholesterol RTU, BioMerieux,Marcy-l’Etoile, France). Ferric reducing ability of plasma (FRAP)was determined as described previously.43 TBARS in urine,heart and liver samples were estimated according to Lee et al.44
Thiobarbituric acid reactive substances (TBARS) were measuredin urine collected between 1600 and 0900 h at day 38, andexpressed as nanomole equivalents of MDA. For total GSHconcentration measurement, frozen heart and liver were finelygrounded, homogenized and sonicated during 30 s in 2%perchloric acid solution containing 5 mM EDTA. Aorta wereground with an Ultraturax during 30-60 s in 2% perchloric acidsolution containing 5 mM EDTA. After centrifugation (14 000gfor 15 min), and filtration through 0.22 µm-filter (Millex,Millipore Corporation, Bedford, MA) for aorta supernatants,total GSH concentration was measured using a standardenzymatic recycling procedure as described previously byRobinson et al.45 The activities of liver enzymes related toglutathione metabolism were measured in an aliquot of liverpowder homogenized in 75 mM phosphate buffer, 2 mMdithiothreitol, and 0.3 M sucrose, sonicated for 30 s, centrifuged(14 000g for 15 min), and filtered through 0.22 µm-filter (Millex,Millipore Corporation, Bedford, MA). Glutathione reductase (EC1.6.4.2) was measured in the presence of GSSG by followingthe oxidation of NADPH.46 Glutathione peroxidase (EC 1.11.1.9)was measured in the presence of GSH and H2O2 by following
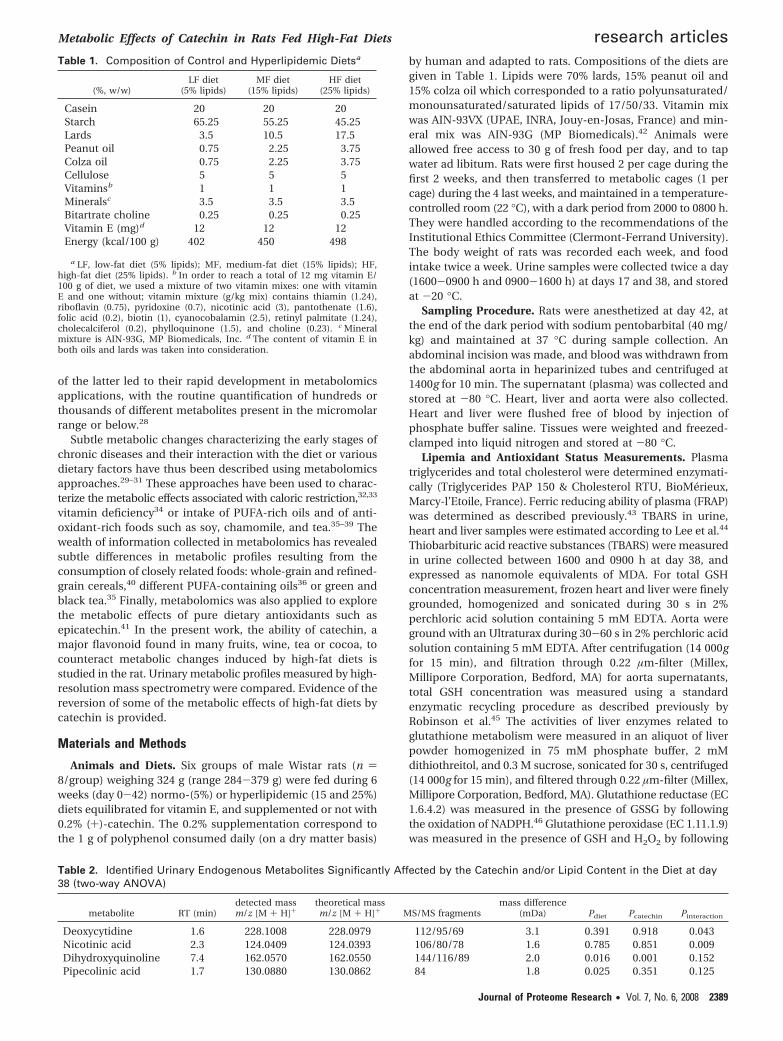
Table 1. Composition of Control and Hyperlipidemic Dietsa
(%, w/w)LF diet
(5% lipids)MF diet
(15% lipids)HF diet
(25% lipids)
Casein 20 20 20Starch 65.25 55.25 45.25Lards 3.5 10.5 17.5Peanut oil 0.75 2.25 3.75Colza oil 0.75 2.25 3.75Cellulose 5 5 5Vitaminsb 1 1 1Mineralsc 3.5 3.5 3.5Bitartrate choline 0.25 0.25 0.25Vitamin E (mg)d 12 12 12Energy (kcal/100 g) 402 450 498
a LF, low-fat diet (5% lipids); MF, medium-fat diet (15% lipids); HF,high-fat diet (25% lipids). b In order to reach a total of 12 mg vitamin E/100 g of diet, we used a mixture of two vitamin mixes: one with vitaminE and one without; vitamin mixture (g/kg mix) contains thiamin (1.24),riboflavin (0.75), pyridoxine (0.7), nicotinic acid (3), pantothenate (1.6),folic acid (0.2), biotin (1), cyanocobalamin (2.5), retinyl palmitate (1.24),cholecalciferol (0.2), phylloquinone (1.5), and choline (0.23). c Mineralmixture is AIN-93G, MP Biomedicals, Inc. d The content of vitamin E inboth oils and lards was taken into consideration.
Table 2. Identified Urinary Endogenous Metabolites Significantly Affected by the Catechin and/or Lipid Content in the Diet at day38 (two-way ANOVA)
metabolite RT (min)detected massm/z [M + H]+
theoretical massm/z [M + H]+ MS/MS fragments
mass difference(mDa) Pdiet Pcatechin Pinteraction
Deoxycytidine 1.6 228.1008 228.0979 112/95/69 3.1 0.391 0.918 0.043Nicotinic acid 2.3 124.0409 124.0393 106/80/78 1.6 0.785 0.851 0.009Dihydroxyquinoline 7.4 162.0570 162.0550 144/116/89 2.0 0.016 0.001 0.152Pipecolinic acid 1.7 130.0880 130.0862 84 1.8 0.025 0.351 0.125
Metabolic Effects of Catechin in Rats Fed High-Fat Diets research articles
Journal of Proteome Research • Vol. 7, No. 6, 2008 2389

the disappearance of NADPH.47 Glutathione S-transferase (EC2.5.1.18) was measured in the presence of GSH and 1-chloro-2,4-dinitrobenzene (CDNB) by following the formation of GSH-CDNB.48
Metabolite Standards. 2′-Deoxycytidine, pipecolinic acid,nicotinic acid, 2,4-dihydroxyquinoline, 2,8-dihydroxyquinoline,catechin and hippuric acid were obtained from Sigma-Aldrich(St. Louis, MO). p-Hydroxyhippuric acid was provided by theInstitut National Agronomique Paris-Grignon (INA P-G, France,Paris). Standards were dissolved in a Milli-Q water/acetonitrilesolution (50/50 v/v) and 0.1% formic acid to obtain solutionsfrom 1 to 10 µg · mL-1 before LC-MS analysis. The chemicalsused were of analytical or reagent grade.
Urine Analysis by LC-QTOF Mass Spectrometry. The chro-matography was performed on a HPLC Alliance 2695 (WatersCorporation, St-Quentin-en-Yvelines, France) using a WatersSymmetryShield RP18 column. The HPLC system was coupledwith a Micromass Qtof-Micro (Waters Corporation, St-Quentin-en-Yvelines, France) equipped with an electrospray sourceoperating in positive ion and full scan (m/z 100-1000) modes.The source temperature was set at 120 °C with a cone gas flowof 50 L · h-1; a desolvation gas temperature of 300 °C and anebulization gas flow of 400 L · h-1. The capillary voltage wasset at 3.0 kV, the cone voltage at 30 V, and the scan time at0.4 s with an interscan delay of 0.1 s. A lock-mass of leucineenkephalin at a concentration of 0.25 ng · µL-1 in 50:50methanol/water and 0.2% formic acid was employed with aninfusion flow of 10 µL · min-1 via a lock spray interface. TheQTOF was calibrated with a 0.1% orthophosphoric acid inwater/acetonitrile (50/50 v/v) solution.
Urine samples were diluted with deionized water (1:3) and10 µL of the sample was injected onto a 2.1 × 150 mmSymmetry Shield RP18 5 µm column. Elution was realized witha flow rate of 300 µL · min-1 during the whole analysis. A lineargradient of 0-20% B (acetonitrile and 1% formic acid) was
applied over 0-4 min; then B was increased from 20 to 95%over 4 min and maintained at this concentration during 1 min;at 9 min, mobile phase was set to 100% of A (water and 1%formic acid) and column was re-equilibrated until 14 min.
Data Analyses. Values of lipid and oxidative stress biomar-kers are all given as means ( SEM. The significance of theeffects of diet, catechin, and their interaction on these biom-arkers was analyzed by two-way ANOVA. When effect (P < 0.05)existed between LF, MF and HF diets, the significance ofdifference was further analyzed by Student-Newman-Keuls’test. Difference between rat weight for the 6 diets at each timepoint (days 0, 7, 14, 21, 28, 35 and 42) was determined byANOVA with repeated measures. These analyses were per-formed using STATVIEW software (version 5.0; SAS Institute,Inc., Cary, NC).
The LC-QTOF data were analyzed using Micromass Mark-erLynx 4.0 Application Manager (v 4.0 SP4 integrated to theMassLynx 4.0 software, Warters Corporation). The LC-MScontinuum data were transformed to centroid data (calledAFAMM data) using the tool “accurate mass calculator” pro-vided by MassLynx 4.0 software. Among the 7020 ions detected,we filtered those present in at least three samples out of the72 samples (i.e., 6 rats × 6 groups × 2 sampling days), whichcorresponded to 5587 variables. For the ions selected, intensityvalues were centered and log-transformed for normality cor-rection. Variables were then classified according to theirdependence on lipid and catechin intakes, and on samplingday through three-way ANOVA. More specifically, mixed modelanalysis was used to assess the effect of catechin and lipid levelat days 17 and 38 (two-way ANOVA). Means comparison wascarried out using “proc mixed lsmeans method” (proc mixedSAS, v8.01, Institute, Cary, NC). This procedure was used todetermine (1) the number of variables affected by the increasedlipid content of the diets at both day 17 and 38 in presence orabsence of catechin, and (2) the number of reversed variables
Table 3. Effect of Lipid and Catechin Content in the Diet on Oxidative Stress and Lipid Biomarkers in Ratsa
LF diet MF diet HF diet Two-way ANOVA
NP PP NP PP NP PP Pdiet Pcatechin Pinteraction
Liver GSH(µmol/g liver)
8.2 ( 0.3 7.6 ( 0.2 a 7.1 ( 0.4 6.5 ( 0.4 b 6.8 ( 0.2 6.6 ( 0.2 b 0.0004 0.0700 0.7615
Aorta GSH(µmol/g aorta)
0.73 ( 0.04 0.71 ( 0.02 a 0.56 ( 0.04 0.57 ( 0.06 b 0.50 ( 0.03 0.53 ( 0.02 b <0.0001 0.8936 0.9053
Liver GSH-peroxidase(U/g liver)
289 ( 13 308 ( 17 a 313 ( 14 264 ( 13 ab 264 ( 15 255 ( 13 b 0.0269 0.2654 0.0726
Liver GSH-reductase(U/g liver)
15.1 ( 0.7 14.5 ( 0.8 14.6 ( 0.6 13.9 ( 0.5 15.1 ( 0.5 14.4 ( 0.5 0.5967 0.1708 0.9946
Liver GSH-transferase(U/g liver)
105 ( 5 103 ( 6 a 115 ( 5 112 ( 4 b 117 ( 3 117 ( 3 b 0.0180 0.5712 0.9309
Urine MDA(nmol/17 h)
17.1 ( 3.5 9.1 ( 3.9 15.3 ( 3.5 11.0 ( 2.3 21.3 ( 2.9 16.1 ( 3.4 0.1478 0.0351 0.8490
Liver MDA(nmol/g liver)
183 ( 12 212 ( 25 a 236 ( 17 247 ( 15 b 328 ( 14 319 ( 26 c <0.0001 0.4875 0.5874
Heart MDA(nmol/g heart)
353 ( 26 331 ( 22 a 411 ( 29 433 ( 42 ab 410 ( 20 423 ( 43 b 0.0375 0.8566 0.7823
Plasma FRAP(µmol Fe/L)
260 ( 21 259 ( 15 281 ( 24 277 ( 15 256 ( 22 310 ( 22 0.5009 0.3490 0.2863
Plasma cholesterol(mM)
2.16 ( 0.14 1.93 ( 0.13 2.31 ( 0.13 2.13 ( 0.15 2.23 ( 0.16 2.00 ( 0.12 0.4475 0.0681 0.9772
Plasma triglycerides(mM)
2.15 ( 0.25 1.80 ( 0.23 a 2.24 ( 0.27 1.52 ( 0.20 a 1.09 ( 0.11 1.27 ( 0.17 b 0.0016 0.1080 0.1318
a Values are means ( SEM; n ) 8 rats/group except for LF diet without catechin (n ) 9) and LF diet supplemented with catechin (n ) 6) groups.Means for the LF, MF and HF diets not sharing a common letter differ, P < 0.05. LF, low-fat diet (5% lipid); MF, medium-fat diet (15% lipid); HF, high-fatdiet (25% lipid); NP, no catechin added; PP, supplemented with 0.2% catechin.
research articles Fardet et al.
2390 Journal of Proteome Research • Vol. 7, No. 6, 2008
following catechin supplementation. Concerning variables af-fected by the increased lipid content of the diets, we selectedvariables corresponding to a significant lipid effect and/or “lipid× catechin” interaction at either day 17 or 38, and for whichLF versus MF and/or LF versus HF were significantly differentin presence or absence of catechin. Concerning reversedvariables, we first selected variables corresponding to a sig-nificant “lipid × catechin” interaction at either day 17 or 38;among them, reversed variables corresponded to variableswhich were first affected by the increased lipid content of thediet (i.e., P < 0.05 for MF/HF vs LF), and then reversed by thecatechin supplementation (i.e., P < 0.05 for MF/HF pluscatechin vs MF/HF and P > 0.05 for MF/HF plus catechin vsLF) at a given lipid content and at a given sampling day.
The relation between the lipid content of the diets andvariable spectral intensity at each sampling time in presenceor absence of catechin was performed using Pearson correla-tion coefficient. The processed data were also analyzed by PCAand PLS-DA using SIMCA-P (version 11, Umetrics, Inc., Umeåa,Sweden).
Marker Identification. Markers contributing to the discrimi-nation of the different groups of rats were identified on thebasis of their exact mass which was compared to thoseregistered in the Human Metabolome Database (HMDB; www.hmdb.ca),49 and to those of expected metabolites of catechinas described in the literature50–53 (mass difference lower than5 mDa). Identification was confirmed using appropriate stan-dards when available, and mass fragmentation (MS-MS analy-
ses). Mass fragmentation experiments were conducted on boththe standards and urine samples using the Micromass LC-QTOF Micro with the same chromatographic conditions asdescribed above. The QTOF mass spectrometer was operatedover a mass range of m/z 18-600 using 15 or 30 eV collisionenergy levels. The following metabolites could be identified(Table 2): deoxycytidine, m/z 228.0979 [M + H]+, MS-MS (30eV) m/z 112/95/69. The MS-MS spectrum in urine was identicalto that of the 2′-deoxycytidine standard. However, the exactnature of the deoxypentose could not be identified due to thelack of appropriate commercial standards. Nicotinic acid, m/z124.0393 [M + H]+, MS-MS (15 eV) m/z 124/106/80/78. 2,4-Dihydroxyquinoline, m/z 162.0550 [M + H]+, MS-MS (15 eV)m/z 162/144/116/89. 2,4- and 2,8-Dihydroxyquinoline hadidentical MS-MS spectra but could be differentiated on thebasis of their retention times (respectively, 7.7 and 8.6 min).Pipecolinic acid, m/z 130.0862 [M + H]+, MS-MS (15 eV) m/z130/84.
Clustering analysis using the PermutMatrix software54 al-lowed the identification of clusters of ions originating from asame metabolite.55 All ions in a cluster were characterized bya same retention time and included fragments (e.g., loss ofwater or a glucuronide moiety) and/or adducts (e.g., Na/Kadducts) formed in the electrospray source. This analysis wasused to identify catechin metabolites for which standards werenot available.
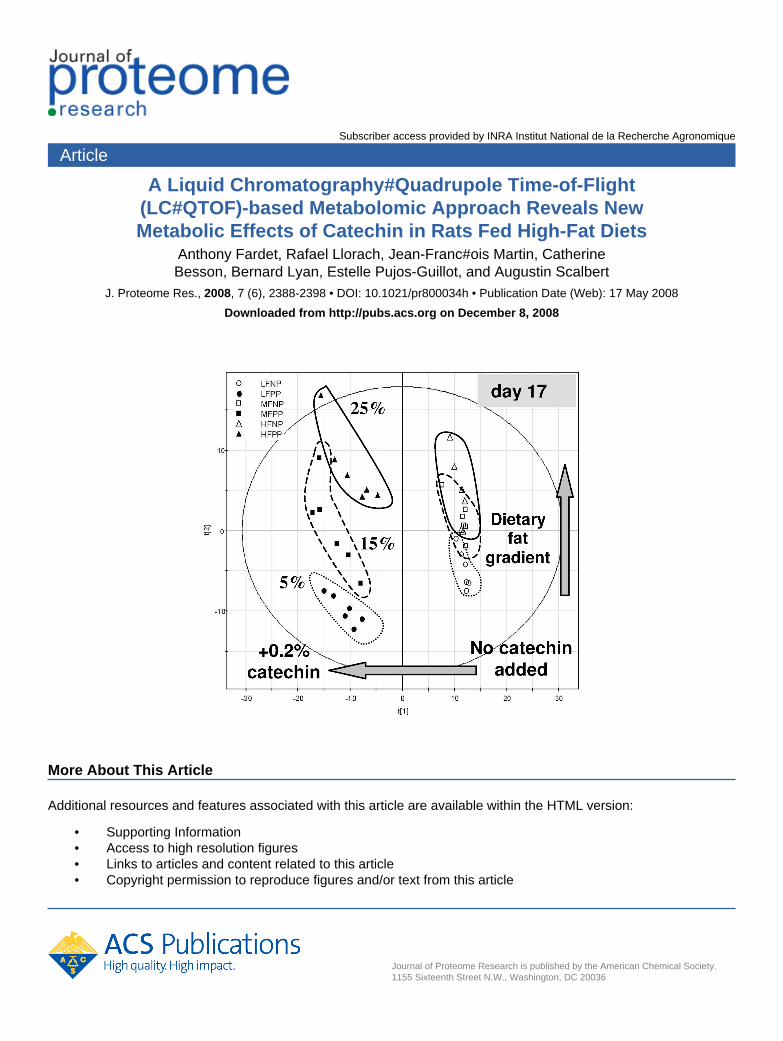
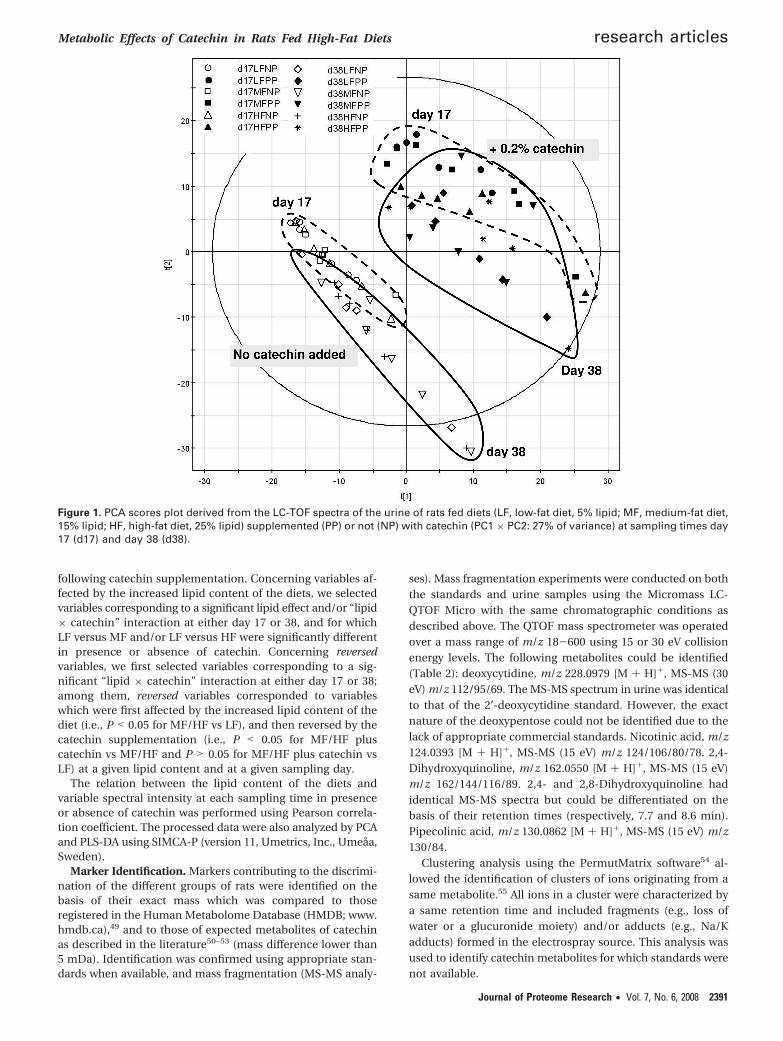
Figure 1. PCA scores plot derived from the LC-TOF spectra of the urine of rats fed diets (LF, low-fat diet, 5% lipid; MF, medium-fat diet,15% lipid; HF, high-fat diet, 25% lipid) supplemented (PP) or not (NP) with catechin (PC1 × PC2: 27% of variance) at sampling times day17 (d17) and day 38 (d38).
Metabolic Effects of Catechin in Rats Fed High-Fat Diets research articles
Journal of Proteome Research • Vol. 7, No. 6, 2008 2391
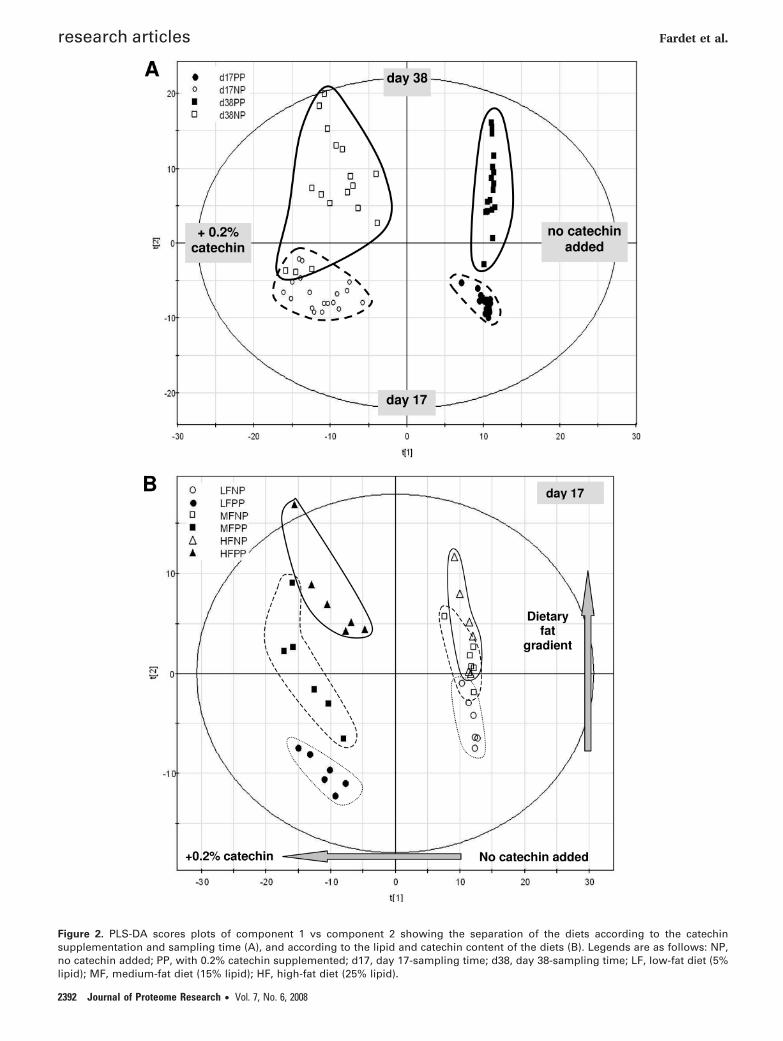
Figure 2. PLS-DA scores plots of component 1 vs component 2 showing the separation of the diets according to the catechinsupplementation and sampling time (A), and according to the lipid and catechin content of the diets (B). Legends are as follows: NP,no catechin added; PP, with 0.2% catechin supplemented; d17, day 17-sampling time; d38, day 38-sampling time; LF, low-fat diet (5%lipid); MF, medium-fat diet (15% lipid); HF, high-fat diet (25% lipid).
research articles Fardet et al.
2392 Journal of Proteome Research • Vol. 7, No. 6, 2008
Results
Food Consumption and Weight Gain. Rats of the MF andHF groups consumed, respectively, 1.7- and 3.0-fold higher lipidquantities than the rats of the LF group. Energy intake did notdiffer significantly between the different groups of rats (89.7 (1.3 kcal/day). Catechin had no significant effect on food, energyand lipid intake (results not shown). Weight gain during the 6weeks of regimen was not significantly different between the 6groups of rats (161 ( 5 g).
Influence of Lipids and Catechin on Antioxidant Statusand Lipemia. Hyperlipidemic diets (MF and HF) induced asignificant decrease of the GSH content in the liver (respec-tively, 13 and 17%) as compared to the control LF diet (Table3). The effect is even more pronounced in the aorta: GSHcontent decreased by 23% following the MF diet, and by 32%following the HF diet, as compared to the LF diet. In bothtissues, catechin did not counteract this GSH decrease. HF dietlead to a significant decrease of liver GSH-peroxidase and to asignificant increase of liver GSH-transferase compared tocontrol LF diet, with no effect of catechin. No significant effectof the fat and catechin concentration in the diet on the levelof liver GSH reductase could be observed. No significantdifferences were observed for urinary MDA, even if valuestended to be higher with the HF diet as compared to the MFand LF diets, and values were significantly lower upon catechinsupplementation (Table 3). In liver, MDA concentrationssignificantly increased following both MF (+29%) and HF(+79%) diets, but catechin supplementation had no effect onthis increase. The same tendency was observed with the levelof MDA in heart, with higher levels in MF and HF dietscompared to LF diet, effect being significant with HF diet. Theantioxidant capacity of plasma (FRAP) was not modified byeither lipid or catechin. The level of plasma cholesterolremained unchanged following the hyperlipidemic diets withor without catechin added (Table 3). The plasma TG concen-trations significantly decreased with the HF diet compared toLF and MF diets. Adding catechin had no effect apart from areduction of TG level with the MF diet.
Metabolomic Analyses of Urine Samples. To further explorethe metabolic effects of catechin, we applied a metabolomicapproach to the rat urine samples. Metabolic fingerprints wereobtained with a LC-QTOF mass spectrometer using a massdetection range of 100-1000 amu. PCA analysis showed a cleardistinction between catechin and noncatechin groups, and a
less pronounced distinction according to the sampling day(days 17 and 38 after initiation of the diets) (Figure 1). Nodistinction between the lipid groups were observed. The groupsof rats were more easily discriminated by PLS-DA, accordingto catechin supplementation and sampling day (Figure 2A). Alarger intragroup variability was observed at day 38 as com-pared to day 17. PLS-DA also allowed discriminating the groupsaccording to the fat content in the diet for samples collectedafter either 17 (Figure 2B) or 38 days (results not shown).
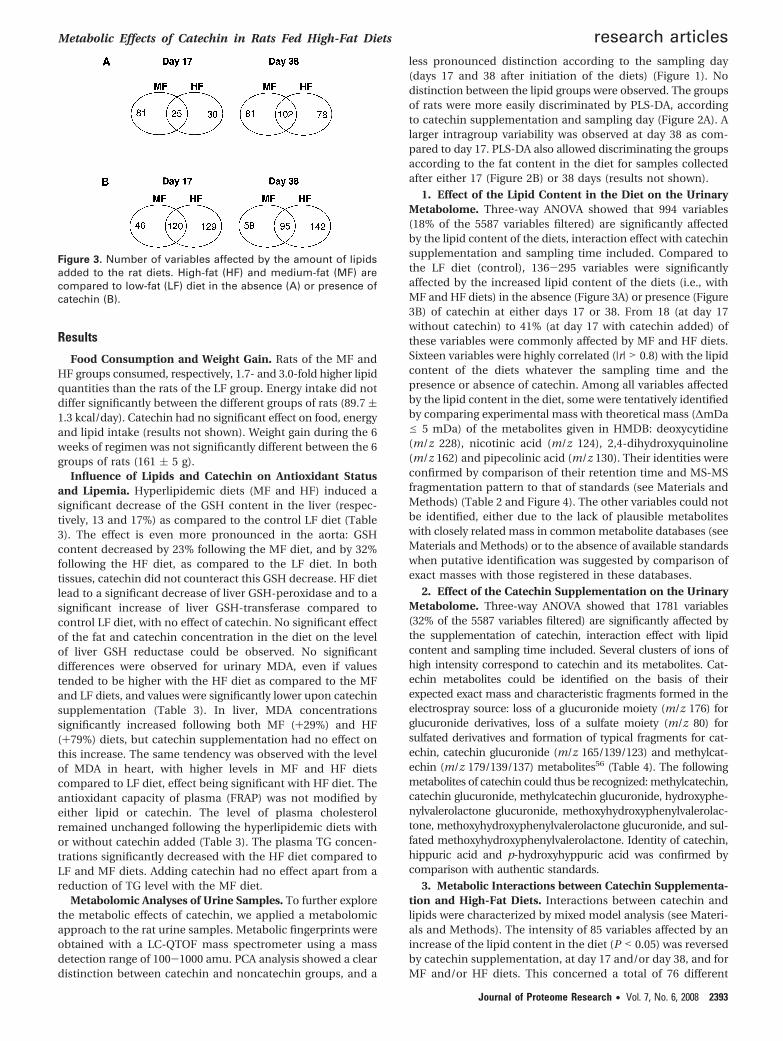
1. Effect of the Lipid Content in the Diet on the UrinaryMetabolome. Three-way ANOVA showed that 994 variables(18% of the 5587 variables filtered) are significantly affectedby the lipid content of the diets, interaction effect with catechinsupplementation and sampling time included. Compared tothe LF diet (control), 136-295 variables were significantlyaffected by the increased lipid content of the diets (i.e., withMF and HF diets) in the absence (Figure 3A) or presence (Figure3B) of catechin at either days 17 or 38. From 18 (at day 17without catechin) to 41% (at day 17 with catechin added) ofthese variables were commonly affected by MF and HF diets.Sixteen variables were highly correlated (|r| > 0.8) with the lipidcontent of the diets whatever the sampling time and thepresence or absence of catechin. Among all variables affectedby the lipid content in the diet, some were tentatively identifiedby comparing experimental mass with theoretical mass (∆mDae 5 mDa) of the metabolites given in HMDB: deoxycytidine(m/z 228), nicotinic acid (m/z 124), 2,4-dihydroxyquinoline(m/z 162) and pipecolinic acid (m/z 130). Their identities wereconfirmed by comparison of their retention time and MS-MSfragmentation pattern to that of standards (see Materials andMethods) (Table 2 and Figure 4). The other variables could notbe identified, either due to the lack of plausible metaboliteswith closely related mass in common metabolite databases (seeMaterials and Methods) or to the absence of available standardswhen putative identification was suggested by comparison ofexact masses with those registered in these databases.
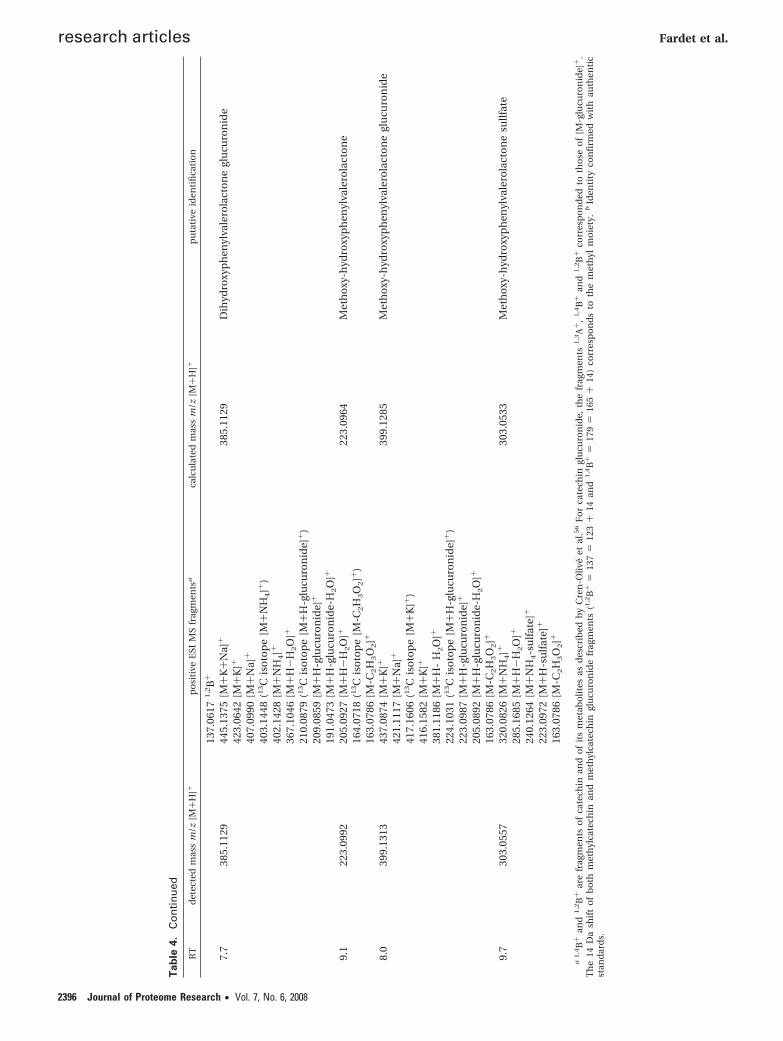
2. Effect of the Catechin Supplementation on the UrinaryMetabolome. Three-way ANOVA showed that 1781 variables(32% of the 5587 variables filtered) are significantly affected bythe supplementation of catechin, interaction effect with lipidcontent and sampling time included. Several clusters of ions ofhigh intensity correspond to catechin and its metabolites. Cat-echin metabolites could be identified on the basis of theirexpected exact mass and characteristic fragments formed in theelectrospray source: loss of a glucuronide moiety (m/z 176) forglucuronide derivatives, loss of a sulfate moiety (m/z 80) forsulfated derivatives and formation of typical fragments for cat-echin, catechin glucuronide (m/z 165/139/123) and methylcat-echin (m/z 179/139/137) metabolites56 (Table 4). The followingmetabolites of catechin could thus be recognized: methylcatechin,catechin glucuronide, methylcatechin glucuronide, hydroxyphe-nylvalerolactone glucuronide, methoxyhydroxyphenylvalerolac-tone, methoxyhydroxyphenylvalerolactone glucuronide, and sul-fated methoxyhydroxyphenylvalerolactone. Identity of catechin,hippuric acid and p-hydroxyhyppuric acid was confirmed bycomparison with authentic standards.
3. Metabolic Interactions between Catechin Supplementa-tion and High-Fat Diets. Interactions between catechin andlipids were characterized by mixed model analysis (see Materi-als and Methods). The intensity of 85 variables affected by anincrease of the lipid content in the diet (P < 0.05) was reversedby catechin supplementation, at day 17 and/or day 38, and forMF and/or HF diets. This concerned a total of 76 different
Figure 3. Number of variables affected by the amount of lipidsadded to the rat diets. High-fat (HF) and medium-fat (MF) arecompared to low-fat (LF) diet in the absence (A) or presence ofcatechin (B).
Metabolic Effects of Catechin in Rats Fed High-Fat Diets research articles
Journal of Proteome Research • Vol. 7, No. 6, 2008 2393

markers. Twenty-eight markers were reversed at day 17 and50 at day 38. One of these markers was identified as nicotinicacid (P < 0.05 for “lipid × catechin” interaction at day 38 forMF diet) (Figure 5, Table 2). Although the variable identifiedas deoxycytidine exhibited a significant “diet × catechin”interaction, it did not have a reversion profile as described inMaterials and Methods.
Discussion
The metabolic effects of polyphenols and other antioxidantsare commonly assessed in clinical trials by measuring plasmaticconcentrations of lipids, glucose or of some markers of oxida-tive stress.57 However, results are often inconsistent and do notreflect the diversity of polyphenol metabolic effects. In par-ticular polyphenols like catechins are thought today to be morethan antioxidants acting as free radical scavengers.25 Recentinvestigations have shown that flavonoids can modulate severalcell signaling pathways involved in the control of the expressionof genes coding for antioxidant or detoxifying enzymes.58,59
Several flavonoids can trigger Nrf2 (transcription factor)-ARE(Antioxidant Responsive Element) and MAP Kinase signalingpathway.24,60–62 Such modulation of gene expression by fla-vonoids have various consequences, for example, on inflam-mation, oxidative or cell proliferation.63 Metabolomics, com-bining high-throughput analytical methods and multivariatestatistical analyses, allows the characterization of the effectsof diets or nutrients on the metabolism under a holistic aspect.Such an approach is expected to provide new insights onmechanisms of action and to identify new markers of effects.29,64
In the present work, rats were fed high-fat diets known toinduce oxidative stress, supplemented or not with catechin. Theeffects of catechin were measured using both common bio-chemical markers and a metabolomic approach applied tourine.
Hyperlipidemic diets led to a significant increase of oxidativestress as shown by GSH depletion in aorta and liver, and anincreased MDA level in liver and heart in agreement withprevious studies.16,20,65,66 Metabolomics analysis also revealedother metabolic changes induced by the high-fat diet and inparticular an increase in the urinary excretion of deoxycytidine,nicotinic acid, 2,4-dihydroxyquinoline and pipecolinic acid(Figure 4).
A high urine excretion of deoxycytidine nucleosides has beenassociated to a higher risk of cancer and immune deficiencysyndrome.67,68 An increase of deoxycytidine excretion in urinewith high-fat diets has not been reported before. It might bedue to an increase in DNA breakdown or to a higher productionof deoxycytidine by enteric bacteria.68 2,4-Dihydroxyquinolinehas been recently shown to be produced by the bacteriaPseudomonas aeruginosa, a human pathogen, from anthranilicacid, a tryptophan metabolite.69 The origin of the variations inthe urinary excretion of dihydroxyquinoline observed in thepresent study following high-fat diets remains unclear. Con-cerning pipecolinic acid, its high urinary content generallyresults from either chronic liver dysfunction70 or peroxisomaldisorders.71,72 Indeed, peroxisome abnormalities lead to im-paired pipecolinic acid oxidation and to its accumulation inbiofluids such as urine and plasma.71,72 Increased pipecolinicacid excretion following high-fat diets has never been reportedbefore. One may only speculate that hyperlipidic diets lead tosome liver dysfunction associated to peroxisomal disorders.
Catechin supplementation had no effect on the oxidativestress induced by the high-fat diet except on urine MDA.Previous results showed contrasted effects of catechin onantioxidant status: for example, catechin-rich food (tea, wineand cocoa) consumption was shown in humans to increaseplasma antioxidant capacity and decrease urinary F2-isopros-tanes, while other studies showed no effect.57 Plasma choles-
Figure 4. Evolution of the spectral intensity of 2′-deoxycytidine (A), nicotinic acid (B), dihydroxyquinoline (C) and pipecolinic acid (D)in urine of rats after feeding low-fat (LF), medium-fat (MF) and high-fat (HF) diets without catechin at day 38. Values are means ( SEM(n ) 6 rats/group); different letters indicate significant difference (P < 0.05).
research articles Fardet et al.
2394 Journal of Proteome Research • Vol. 7, No. 6, 2008

Tab
le4.
Cat
ech
inM
etab
olit
es(d
eriv
ativ
esan
dm
icro
bia
l)an
dT
hei
rFr
agm
ents
and
Ad
du
cts
Form
edin
the
Ele
ctro
spra
yIo
niz
atio
nS
ou
rce
RT
det
ecte
dm
ass
m/z
[M+
H]+
po
siti
veE
SIM
Sfr
agm
ents
aca
lcu
late
dm
ass
m/z
[M+
H]+
pu
tati
veid
enti
fica
tio
n
7.0
180.
0680
134.
0613
[M+
H-c
arb
oxy
l]+
180.
0655
Hip
pu
ric
acid
b
106.
0402
(13C
iso
top
e[M
+H
-gly
cin
e]+
)10
5.03
48[M
+H
-gly
cin
e]+
6.3
196.
0630
218.
0470
[M+
Na]
+19
6.06
04H
ydro
xyh
ipp
uri
cac
idb
122.
0336
(13C
iso
top
e[M
+H
-gly
cin
e]+
)12
1.03
05[M
+H
-gly
cin
e]+
7.8
291.
0883
292.
0930
(13C
iso
top
e[M
+H
]+)
291.
0863
Cat
ech
inb
273.
0782
[M+
H-
H2O
]+
165.
0593
1,4
B+
139.
0404
1,3
A+
123.
0458
1,2
B+
7.4
467.
1195
468.
1230
(13C
iso
top
e[M
+H
]+)
467.
1183
Cat
ech
ingl
ucu
ron
ide
449.
1082
[M+
H-
H2O
]+
431.
1003
[M+
H-
2H2O
]+
291.
0883
[M+
H-g
lucu
ron
ide]
+
292.
0921
(13C
iso
top
e[M
+H
]+)
273.
0820
[M+
H-
H2O
]+
165.
0588
1,4
B+
139.
0405
1,3
A+
123.
0469
1,2
B+
6.9
467.
1194
505.
0788
[M+
K]+
467.
1183
Cat
ech
ingl
ucu
ron
ide
484.
1455
[M+
NH
4]+
468.
1223
(13C
iso
top
e[M
+H
]+)
431.
1013
[M+
H-2
H2O
]+
291.
0875
[M+
H-g
lucu
ron
ide]
+
292.
0932
(13C
iso
top
e[M
+H
]+)
273.
0795
[M+
H-
H2O
]+
165.
0600
1,4
B+
139.
0406
1,3
A+
8.6
305.
1032
179.
0742
1,4
B+
305.
1019
Met
hyl
cate
chin
147.
0468
[1,4
B+
-H2O
]13
9.04
011
,3A+
137.
0638
1,2
B+
8.3
481.
1358
961.
2650
[2M
-H]+
481.
1340
Met
hyl
cate
chin
glu
curo
nid
e49
8.16
29[M
+N
H4]+
482.
1400
(13C
iso
top
e[M
+H
]+)
463.
1238
[M+
H-
H2O
]+
445.
1149
[M+
H-2
H2O
]+
306.
1073
(13C
iso
top
e[M
+H
-glu
curo
nid
e]+
)30
5.10
33[M
+H
-glu
curo
nid
e]+
288.
0974
(13C
iso
top
e[M
+H
-glu
curo
nid
e-H
2O
]+)
287.
0939
[M+
H-g
lucu
ron
ide-
H2O
]+
179.
0734
1,4
B+
139.
0411
1,3
A+
137.
0619
1,2
B+
7.7
481.
1351
482.
1367
(13C
iso
top
e[M
+H
]+)
481.
1340
Met
hyl
cate
chin
glu
curo
nid
e30
5.10
26[M
+H
-glu
curo
nid
e]+
287.
0940
[M+
H-g
lucu
ron
ide-
H2O
]+
Metabolic Effects of Catechin in Rats Fed High-Fat Diets research articles
Journal of Proteome Research • Vol. 7, No. 6, 2008 2395
Tab
le4.
Co
nti
nu
ed
RT
det
ecte
dm
ass
m/z
[M+
H]+
po
siti
veE
SIM
Sfr
agm
ents
aca
lcu
late
dm
ass
m/z
[M+
H]+
pu
tati
veid
enti
fica
tio
n
137.
0617
1,2
B+
7.7
385.
1129
445.
1375
[M+
K+
Na]
+38
5.11
29D
ihyd
roxy
ph
enyl
vale
rola
cto
ne
glu
curo
nid
e42
3.06
42[M
+K
]+
407.
0990
[M+
Na]
+
403.
1448
(13C
iso
top
e[M
+N
H4]+
)40
2.14
28[M
+N
H4]+
367.
1046
[M+
H-
H2O
]+
210.
0879
(13C
iso
top
e[M
+H
-glu
curo
nid
e]+
)20
9.08
59[M
+H
-glu
curo
nid
e]+
191.
0473
[M+
H-g
lucu
ron
ide-
H2O
]+
9.1
223.
0992
205.
0927
[M+
H-
H2O
]+22
3.09
64M
eth
oxy
-hyd
roxy
ph
enyl
vale
rola
cto
ne
164.
0718
(13C
iso
top
e[M
-C2H
3O
2]+
)16
3.07
86[M
-C2H
3O
2]+
8.0
399.
1313
437.
0874
[M+
K]+
399.
1285
Met
ho
xy-h
ydro
xyp
hen
ylva
lero
lact
on
egl
ucu
ron
ide
421.
1117
[M+
Na]
+
417.
1606
(13C
iso
top
e[M
+K
]+)
416.
1582
[M+
K]+
381.
1186
[M+
H-
H2O
]+
224.
1031
(13C
iso
top
e[M
+H
-glu
curo
nid
e]+
)22
3.09
87[M
+H
-glu
curo
nid
e]+
205.
0892
[M+
H-g
lucu
ron
ide-
H2O
]+
163.
0786
[M-C
2H
3O
2]+
9.7
303.
0557
320.
0826
[M+
NH
4]+
303.
0533
Met
ho
xy-h
ydro
xyp
hen
ylva
lero
lact
on
esu
llfat
e28
5.16
85[M
+H-
H2O
]+
240.
1264
[M+
NH
4-s
ulf
ate]
+
223.
0972
[M+
H-s
ulf
ate]
+
163.
0786
[M-C
2H
3O
2]+
a1
,4B+
and
1,2
B+
are
frag
men
tso
fca
tech
inan
do
fit
sm
etab
olit
esas
des
crib
edb
yC
ren
-Oliv
eet
al.5
6F
or
cate
chin
glu
curo
nid
e,th
efr
agm
ents
1,3
A+
,1
,4B+
and
1,2
B+
corr
esp
on
ded
toth
ose
of
[M-g
lucu
ron
ide]
+.
Th
e14
Da
shif
to
fb
oth
met
hyl
cate
chin
and
met
hyl
cate
chin
glu
curo
nid
efr
agm
ents
(1,2
B+
)13
7)
123+
14an
d1
,4B+
)17
9)
165+
14)
corr
esp
on
ds
toth
em
eth
ylm
oie
ty.
bId
enti
tyco
nfi
rmed
wit
hau
then
tic
stan
dar
ds.
research articles Fardet et al.
2396 Journal of Proteome Research • Vol. 7, No. 6, 2008

terol and TG levels were not modified upon catechin supple-mentation. As for the antioxidant status, contradictory resultshave been published; some authors reported hypocholester-olemic effects of catechin in rats or rabbits, but at a dose ofcatechin 10 times higher than the one used here.73,74 On theother hand, catechin supplementation had a pronounced effecton the urinary metabolome as revealed by the fingerprintingapproach used in the present study. These changes are partlyexplained by the excretion of catechin and catechin metabo-lites. Several of these metabolites could be identified. Most wereknown metabolites of catechin such as O-methyl catechin,catechin glucuronides, methylcatechin glucuronide, hydrox-yphenylvalerolactone metabolites, hippuric acid and hydroxy-hippuric acid formed in the tissues or by the microbiota in thecolon.50,51,75–79 The presence of methoxyhydroxyphenylvale-rolactone glucuronide, not previously described as a catechinmetabolite, was also suggested based on its MS spectrum.
Other urinary metabolites affected by catechin supplementa-tion were endogenous metabolites reflecting the impact of thecatechin on the rat metabolism. Catechin was shown inparticular to reverse some of the metabolic changes inducedby the high-fat diets. These effects appear substantial as shownby the large number of reversed variables. One of thesevariables is nicotinic acid which increased with the content offat in the diet and decreased upon catechin supplementation(Figure 5). Nicotinic acid is a water-soluble vitamin which playsan essential role in energy metabolism and DNA repair. Theincreased urinary excretion of nicotinic acid with the high-fatdiets may reflect an increased conversion rate of tryptophaninto nicotinic acid. A high-fat intake is known to increase theconversion rate of tryptophan to nicotinamide, a precursor ofnicotinic acid.80–82 These effects have been explained by adown-regulation of R-amino-�-carboxymuconate-ε-semialde-hyde decarboxylase (ACMSD), a key enzyme diverting theconversion of tryptophan toward R-aminomuconate-ε-semi-aldehyde and glycolysis.81,82 Peroxisome proliferator-activatedreceptor R (PPARR) might be involved in these effects as itsactivation is known to inhibit ACMSD and to play a criticalrole in the control of the tryptophan-nicotinic acid pathway.83
Catechin might also influence the regulation of this pathwaythrough some interactions with PPARR. Some polyphenols suchas isoflavones and resveratrol showed some agonist activitiesrather than antagonist effects of PPARR, but antagonist effectswere also observed depending on time factors.84,85 These effects
merit to be further explored. Nicotinic acid is also known tobe synthesized by bacteria.86 The decrease in excretion ofnicotinic acid in urine by catechin might also indirectly resultfrom some modification of the microbiota profile induced bycatechin supplementation.87
These metabolic effects of catechin revealed by metabolo-mics still need to be confirmed in future studies. They mayhelp to understand the hypolipemic and antiobesity effects oftea catechins previously described.62,88 The full elucidation ofthe metabolic effects of catechin will require a more completeidentification of the markers of effects detected in the presentexperiment. More efficient softwares or more comprehensivedatabases will be needed to identify these markers and developa full biological pathway interpretation. We may hope that itwill allow to identify the key metabolic pathways affected bythe intake of polyphenols or other antioxidants, beyond theirsole antioxidant effects.
Abbreviations: ACMSD, R-aminomuconate-ε-semialdehyde;FRAP, ferring reducing ability of plasma; GSH, reduced glu-tathione; GSSG, oxidized glutathione; HF, high fat; LC-QTOF,liquid chromatography-quadrupole time-of-flight; LF, lowfat; MDA, malondialdehyde; MF, medium fat; MS, mass spec-trometry; PCA, principal component analysis; PLS-DA, partialleast-square discriminant analysis; PPAR, peroxisome prolif-erator-activated receptor; SOD, superoxide dismutase; TBARS,thiobarbituric acid reactive substances.
Acknowledgment. Rafael Llorach was supported bythe Spanish Health Ministry (F.I.S., CD06/00161) and he isgrateful to Spanish CICYT 2006-14228-C03-02 as well as toFUN-C-FOOD project (CSD2007-063). Jean-Francois Martinis gratefully acknowledged for its precious assistance instatistical analyses.
References(1) Alexander, R. W. Trans. Am. Clin. Climatol. Assoc. 1998, 109, 129–
145, discussion 145-126.(2) Lapenna, D.; de Gioia, S.; Ciofani, G.; Mezzetti, A.; Ucchino, S.;
Calafiore, A. M.; Napolitano, A. M.; Di Ilio, C.; Cuccurullo, F.Circulation 1998, 97, 1930–1934.
(3) Olinski, R.; Gackowski, D.; Foksinski, M.; Rozalski, R.; Roszkowski,K.; Jaruga, P. Free Radical Biol. Med. 2002, 33, 192–200.
(4) Tachi, Y.; Okuda, Y.; Bannai, C.; Bannai, S.; Shinohara, M.;Shimpuku, H.; Yamashita, K.; Ohura, K. Life Sci. 2001, 69, 1039–1047.
(5) Yue, K. K.; Chung, W. S.; Leung, A. W.; Cheng, C. H. Life Sci. 2003,73, 2557–2570.
(6) Dobrian, A. D.; Davies, M. J.; Schriver, S. D.; Lauterio, T. J.; Prewitt,R. L. Hypertension 2001, 37, 554–560.
(7) Higdon, J. V.; Frei, B. Arterioscler. Thromb. Vasc. Biol. 2003, 23,365–367.
(8) Keaney, J. F.; Larson, M. G.; Vasan, R. S.; Wilson, P. W. F.; Lipinska,I.; Corey, D.; Massaro, J. M.; Sutherland, P.; Vita, J. A.; Benjamin,E. J. Circulation 2002, 106, 467–467.
(9) Willcox, J. K.; Ash, S. L.; Catignani, G. L. Crit. Rev. Food Sci. Nutr.2004, 44, 275–295.
(10) Busserolles, J.; Rock, E.; Gueux, E.; Mazur, A.; Grolier, P.; Rays-siguier, Y. Br. J. Nutr. 2002, 87, 337–342.
(11) Folmer, V.; Soares, J. C. M.; Rocha, J. B. T. Int. J. Biochem. CellBiol. 2002, 34, 1279–1285.
(12) Tsai, W. C.; Li, Y. H.; Lin, C. C.; Chao, T. H.; Chen, J. H. Clin. Sci.2004, 106, 315–319.
(13) Diniz, Y. S.; Fernandes, A. A. H.; Campos, K. E.; Mani, F.; Ribas,B. O.; Novelli, E. L. B. Food Chem. Toxicol. 2004, 42, 313–319.
(14) Jenkinson, A.; Franklin, M. F.; Wahle, K.; Duthie, G. G. Eur. J. Clin.Nutr. 1999, 53, 523–528.
(15) Serkova, N. J.; Jackman, M.; Brown, J. L.; Liu, T.; Hirose, R.; Roberts,J. P.; Maher, J. J.; Niemann, C. U. J. Hepatol. 2005, 44, 956–962.
(16) Akbay, E.; Ulusu, N. N.; Toruner, F.; Ayvaz, G.; Taneri, F.; Akturk,M.; Arslan, M.; Karasu, C. Curr. Ther. Res. Clin. Exp. 2004, 65, 79–89.
Figure 5. Evolution of the spectral intensity of nicotinic acid (m/z124.041) in urine of rats after feeding low-fat (LF) and medium-fat (MF) supplemented or not with catechin (PP), at day 38. NS,not significant. Values are means ( SEM (n ) 6 rats/group).
Metabolic Effects of Catechin in Rats Fed High-Fat Diets research articles
Journal of Proteome Research • Vol. 7, No. 6, 2008 2397

(17) Biswas, S. K.; Newby, D. E.; Rahman, I.; Megson, I. L. Biochem.Biophys. Res. Commun. 2005, 338, 1368–1373.
(18) Skottova, N.; Kazdova, L.; Oliyarnyk, O.; Vecera, R.; Sobolova, L.;Ulrichova, J. Pharmacol. Res. 2004, 50, 123–130.
(19) Yu, Y. M.; Chang, W. C.; Wu, C. H.; Chiang, S. Y. J. Nutr. Biochem.2005, 16, 675–681.
(20) Yamamoto, Y.; Oue, E. Biosci. Biotechnol. Biochem. 2006, 70, 933–939.
(21) Fremont, L.; Gozzelino, M. T.; Franchi, M. P.; Linard, A. J. Nutr.1998, 128, 1495–1502.
(22) Biswas, S.; Chida, A. S.; Rahman, I. Biochem. Pharmacol. 2006,71, 551–564.
(23) Lee, J. M.; Calkins, M. J.; Chan, K. M.; Kan, Y. W.; Johnson, J. A.J. Biol. Chem. 2003, 278, 12029–12038.
(24) Williams, R. J.; Spencer, J. P. E.; Rice-Evans, C. Free Radical Biol.Med. 2004, 36, 838–849.
(25) Scalbert, A.; Johnson, I. T.; Saltmarsh, M. Am. J. Clin. Nutr. 2005,81, 215S–217S.
(26) Scalbert, A.; Manach, C.; Morand, C.; Remesy, C.; Jimenez, L. Crit.Rev. Food Sci. Nutr. 2005, 45, 287–306.
(27) Nicholson, J. K.; Wilson, I. D. Nat. Rev. Drug Discovery 2003, 2,668–676.
(28) Dettmer, K.; Aronov, P. A.; Hammock, B. D. Mass Spectrom. Rev.2007, 26, 51–78.
(29) Scalbert, A.; Milenkovic, D.; Llorach, R.; Manach, C.; Leroux, C.ISEP, Vichy, France Wageningen Academic Publishers: Wagenin-gen, The Netherlands; 2007, pp 259-276.
(30) Gibney, M. J.; Walsh, M.; Brennan, L.; Roche, H. M.; German, B.;van Ommen, B. Am. J. Clin. Nutr. 2005, 82, 497–503.
(31) German, J. B.; Roberts, M. A.; Watkins, S. M. J. Nutr. 2003, 133,4260–4266.
(32) Selman, C.; Kerrison, N. D.; Cooray, A.; Piper, M. D. W.; Lingard,S. J.; Barton, R. H.; Schuster, E. F.; Blanc, E.; Gems, D.; Nicholson,J. K.; Thornton, J. M.; Partridge, L.; Withers, D. J. Physiol. Genomics2006, 27, 187–200.
(33) Wang, Y. L.; Lawler, D.; Larson, B.; Ramadan, Z.; Kochhar, S.;Holmes, E.; Nicholson, J. K. J. Proteome Res. 2007, 6, 1846–1854.
(34) Griffin, J. L.; Muller, D.; Woograsingh, R.; Jowatt, V.; Hindmarsh,A.; Nicholson, J. K.; Martin, J. E. Physiol. Genomics 2002, 11, 195–203.
(35) Van Dorsten, F. A.; Daykin, C. A.; Mulder, T. P. J.; Van Duynhoven,J. P. M. J. Agric. Food Chem. 2006, 54, 6929–6938.
(36) Mutch, D. M.; Grigorov, M.; Berger, A.; Fay, L. B.; Roberts, M. A.;Watkins, S. M.; Williamson, G.; German, J. B. FASEB J. 2005, 19,599–601.
(37) Solanky, K. S.; Bailey, N. J. C.; Beckwith-Hall, B. M.; Davis, A.;Bingham, S.; Holmes, E.; Nicholson, J. K.; Cassidy, A. Anal.Biochem. 2003, 323, 197–204.
(38) Wang, Y.; Tang, H.; Nicholson, J. K.; Hylands, P. J.; Sampson, J.;Holmes, E. J. Agric. Food Chem. 2005, 53, 191–196.
(39) Wang, Y. L.; Holmes, E.; Tang, H. R.; Lindon, J. C.; Sprenger, N.;Turini, M. E.; Bergonzelli, G.; Fay, L. B.; Kochhar, S.; Nicholson,J. K. J. Proteome Res. 2006, 5, 1535–1542.
(40) Fardet, A.; Canlet, C.; Gottardi, G.; Lyan, B.; Remesy, C.; Mazur,A.; Paris, A.; A., S. J. Nutr. 2007, 4, 923–929.
(41) Solanky, K. S.; Bailey, N. J. C.; Holmes, E.; Lindon, J. C.; Davis,A. L.; Mulder, T. P. J.; Van Duynhoven, J. P. M.; Nicholson, J. K. J.Agric. Food Chem. 2003, 51, 4139–4145.
(42) Reeves, P. G.; Nielsen, F. H.; Fahey, G. C., Jr. J. Nutr. 1993, 123,1939–1951.
(43) Benzie, I. F.; Strain, J. J. Anal. Biochem. 1996, 239, 70–76.(44) Lee, H. S.; Shoeman, D. W.; Csallany, A. S. Lipids 1992, 27, 124–
128.(45) Robinson, M. K.; Rounds, J. D.; Hong, R. W.; Jacobs, D. O.; Wilmore,
D. W. Surgery 1992, 112, 140-147, discussion 148-149.(46) Carlberg, I.; Mannervik, B. J. Biol. Chem. 1975, 250, 5475–5480.(47) Zhang, L. P.; Maiorino, M.; Roveri, A.; Ursini, F. Biochim. Biophys.
Acta 1989, 1006, 140–143.(48) Habig, W. H.; Pabst, M. J.; Jakoby, W. B. J. Biol. Chem. 1974, 249,
7130–7139.(49) Wishart, D. S.; Tzur, D.; Knox, C.; Eisner, R.; Guo, A. C.; Young,
N.; Cheng, D.; Jewell, K.; Arndt, D.; Sawhney, S.; Fung, C.; Nikolai,L.; Lewis, M.; Coutouly, M. A.; Forsythe, I.; Tang, P.; Shrivastava,S.; Jeroncic, K.; Stothard, P.; Amegbey, G.; Block, D.; Hau, D. D.;Wagner, J.; Miniaci, J.; Clements, M.; Gebremedhin, M.; Guo, N.;Zhang, Y.; Duggan, G. E.; MacInnis, G. D.; Weljie, A. M.; Dowla-
tabadi, R.; Bamforth, F.; Clive, D.; Greiner, R.; Li, L.; Marrie, T.;Sykes, B. D.; Vogel, H. J.; Querengesser, L. Nucleic Acids Res. 2007,35, D521–D526.
(50) Griffiths, L. A. Biochem. J. 1964, 92, 173–179.(51) Das, N. P.; Griffiths, L. A. Biochem. J. 1969, 115, 831–836.(52) Harada, M.; Kan, Y.; Naoki, H.; Fukui, Y.; Kageyama, N.; Nakai,
M.; Miki, W.; Kiso, Y. Biosci. Biotechnol. Biochem. 1999, 63, 973–977.
(53) Baba, S.; Osakabe, N.; Natsume, M.; Muto, Y.; Takizawa, T.; Terao,J. J. Nutr. 2001, 131, 2885–2891.
(54) Caraux, G.; Pinloche, S. Bioinformatics 2005, 21, 1280–1281.(55) Tikunov, Y.; Lommen, A.; de Vos, C. H. R.; Verhoeven, H. A.; Bino,
R. J.; Hall, R. D.; Bovy, A. G. Plant Physiol. 2005, 139, 1125–1137.(56) Cren-Olive, C.; Deprez, S.; Lebrun, S.; Coddeville, B.; Rolando, C.
Rapid Commun. Mass Spectrom. 2000, 14, 2312–2319.(57) Manach, C.; Mazur, A.; Scalbert, A. Curr. Opin. Lipidol. 2005, 16,
77–84.(58) Scalbert, A.; Knasmuller, S. Br. J. Nutr. 2008, 99 (E-Suppl. 1), ES1–
ES2.(59) Steiner, C.; Arnould, S.; Scalbert, A.; Manach, C. Br. J. Nutr. 2008,
99 (E-Suppl. 1), ES80–ES110.(60) Na, H. K.; Surh, Y. J. Mol. Nutr. Food Res. 2006, 50, 152–159.(61) Myhrstad, M. C. W.; Carlsen, H.; Nordstrom, O.; Blomhoff, R.;
Moskaug, J. O. Free Radical Biol. Med. 2002, 32, 386–393.(62) Hsu, C.-L.; Yen, G.-C. Mol. Nutr. Food Res. 2008, 52, 53–61.(63) Galati, G.; O’Brien, P. J. Free Radical Biol. Med. 2004, 37, 287–303.(64) Rezzi, S.; Ramadan, Z.; Fay, L. B.; Kochhar, S. J. Proteome Res. 2007,
6, 513–525.(65) Kempaiah, R. K.; Srinivasan, K. Ann. Nutr. Metab. 2004, 48, 314–
320.(66) Beltowski, J.; Wojcicka, G.; Gorny, D.; Marciniak, A. J. Physiol.
Pharmacol. 2000, 51, 883–896.(67) Dudley, E.; Lemiere, F.; Van Dongen, W.; Langridge, J. I.; El-
Sharkawi, S.; Games, D. E.; Esmans, E. L.; Newton, R. P. RapidCommun. Mass Spectrom. 2003, 17, 1132–1136.
(68) Schram, K. H. Mass Spectrom. Rev. 1998, 17, 131–251.(69) Lepine, F.; Dekimpe, V.; Lesic, B.; Milot, S.; Lesimple, A.; Mamer,
O. A.; Rahme, L. G.; Deziel, E. Biol. Chem. 2007, 388, 839–845.(70) Kawasaki, H.; Hori, T.; Nakajima, M.; Takeshita, K. Hepatology
1988, 8, 286–289.(71) Peduto, A.; Baumgartner, M. R.; Verhoeven, N. M.; Rabier, D.;
Spada, M.; Nassogne, M. C.; Poll-The, B. T.; Bonetti, G.; Jakobs,C.; Saudubray, J. M. Mol. Genet. Metab. 2004, 82, 224–230.
(72) Armstrong, D. W.; Zukowski, J.; Ercal, N.; Gasper, M. J. Pharm.Biomed. Anal. 1993, 11, 881–886.
(73) Muramatsu, K.; Fukuyo, M.; Hara, Y. J. Nutr. Sci. Vitaminol. 1986,32, 613–622.
(74) Bursill, C. A.; Abbey, M.; Roach, P. D. Atherosclerosis 2007, 193,86–93.
(75) Kohri, T.; Matsumoto, N.; Yamakawa, M.; Suzuki, M.; Nanjo, F.;Hara, Y.; Oku, N. J. Agric. Food Chem. 2001, 49, 4102–4112.
(76) Das, N. P.; Sothy, S. P. Biochem. J. 1971, 125, 417–423.(77) Li, C.; Lee, M. J.; Sheng, S.; Meng, X.; Prabhu, S.; Winnik, B.; Huang,
B.; Chung, J. Y.; Yan, S.; Ho, C. T.; Yang, C. S. Chem. Res. Toxicol.2000, 13, 177–184.
(78) Li, C.; Meng, X.; Winnik, B.; Lee, M. J.; Lu, H.; Sheng, S.; Buckley,B.; Yang, C. S. Chem. Res. Toxicol. 2001, 14, 702–707.
(79) Kuhnle, G.; Spencer, J. P.; Schroeter, H.; Shenoy, B.; Debnam, E. S.;Srai, S. K.; Rice-Evans, C.; Hahn, U. Biochem. Biophys. Res.Commun. 2000, 277, 507–512.
(80) Shibata, K.; Onodera, M. Biosci. Biotechnol. Biochem. 1992, 56,1104–1108.
(81) Sanada, H. J. Nutr. Sci. Vitaminol. 1985, 31, 327–337.(82) Sanada, H.; Takahashi, T.; Miyazaki, M. J. Nutr. Sci. Vitaminol.
1991, 37, 39–51.(83) Zhen, Y.; Krausz, K. W.; Chen, C.; Idle, J. R.; Gonzalez, F. J. Mol.
Endocrinol. 2007, 21, 2136–2151.(84) Kim, S.; Sohn, I.; Lee, Y. S. J. Nutr. 2005, 135, 33–41.(85) Iannelli, P.; Zarrilli, V.; Varricchio, E.; Tramontano, D.; Mancini,
F. P. Nutr. Metab. Cardiovasc. Dis. 2007, 17, 247–256.(86) Ortega, M. V.; Brown, G. M. J. Biol. Chem. 1960, 235, 2939–2945.(87) Lee, H. C.; Jenner, A. M.; Low, C. S.; Lee, Y. K. Res. Microbiol. 2006,
157, 876–884.(88) Lin, J. K.; Lin-Shiau, S. Y. Mol. Nutr. Food Res. 2006, 50, 211–217.
PR800034H
research articles Fardet et al.
2398 Journal of Proteome Research • Vol. 7, No. 6, 2008

Table of Contents Synopsis (69 words)
A metabolomic approach was used to study the influence of catechin on metabolic changes
induced by hyperlipidemic diets in rats. Urines were analysed by LC-MS. Multivariate
analyses of urine fingerprints allowed discriminating the different diets and identifying
characteristic metabolites. The level of several metabolites affected by high fat intake was
restored to levels found with low-fat diet, some of these changes being related to tryptophan
and nicotinic acid metabolism.
Dietary fat
gradient
day 17
+0.2% catechin
No catechin added
25%
15%
5%