Biological activity of triazole fungicides towards Botrytis cinerea

Stf
Aa
Pb
Uc
a
ARRAA
KFWELT
1
ivmdumaatc
0d
Journal of Chromatography A, 1218 (2011) 2165–2175
Contents lists available at ScienceDirect
Journal of Chromatography A
journa l homepage: www.e lsev ier .com/ locate /chroma
olid-phase extraction followed by liquid chromatography quadrupoleime-of-flight tandem mass spectrometry for the selective determination ofungicides in wine samples
.R. Fontanaa, I. Rodríguezb,∗, M. Ramilb, J.C. Altamiranoa,c, R. Celab
Grupo de Investigación y Desarrollo en Química Analítica (QUIANID) (LISAMEN, CCT CONICET – Mendoza), Av. Ruiz Leal S/N,arque General San Martín, 5500 Mendoza, ArgentinaDepartamento de Química Analítica, Nutrición y Bromatología, Instituto de Investigación y Análisis Alimentario (IIAA),niversidad de Santiago de Compostela, Santiago de Compostela 15782, SpainInstituto de Ciencias Básicas, Universidad Nacional de Cuyo, Mendoza, Argentina
r t i c l e i n f o
rticle history:eceived 24 December 2010eceived in revised form 9 February 2011ccepted 10 February 2011vailable online 17 February 2011
eywords:ungicidesine
xtractioniquid chromatographyime-of-flight mass spectrometry
a b s t r a c t
In this work, a reliable and selective procedure for the determination of thirteen fungicides in red andwhite wine samples is proposed. Solid-phase extraction (SPE) and liquid chromatography (LC) tandemmass spectrometry (MS/MS), based on a hybrid quadrupole time-of-flight (QTOF) system, were usedas sample preparation and determination techniques, respectively. Extraction and purification of targetanalytes was carried out simultaneously by using a reversed-phase Oasis HLB (200 mg) SPE cartridgecombined with acetonitrile as elution solvent. Fungicides were determined operating the electrospraysource in the positive ionization mode, with MS/MS conditions adjusted to obtain at least two intenseproduct ions per compound, or registering two transitions per species when a single product was noticed.High selective MS/MS chromatograms were extracted using a mass window of 20 ppms for each production. Considering external calibration as quantification technique, the overall recoveries (accuracy) of theprocedure ranged between 81% and 114% for red and white wine samples (10–20 mL), spiked at different
−1
concentrations between 5 and 100 ng mL . Relative standard deviations of the above data stayed below12% and the limits of quantification (LOQs) of the method, calculated for 10 mL of wine, varied between0.1 ng mL−1 for cyprodinil (CYP) and 0.7 ng mL−1 for myclobutanil (MYC). The optimized method wasapplied to seventeen commercial wines produced in Spain and obtained from local supermarkets. Ninefungicides were determined, at levels above the LOQs of the method, in the above samples. The maximumconcentrations and the highest occurrence frequencies corresponded to metalaxyl (MET) and iprovalicarb (IPR).. Introduction
The incidence of diseases in vineyards, particularly fungalnfections, is responsible for important economical losses in theiticulture sector. The most common fungal infections are grey-old (Botrytis cinerea), powdery mildew (Uncinula necator) and
owny mildew (Plasmopara viticola) [1]. Fungicides are extensivelysed to prevent and control fungal attacks [2], representing theain group of pesticides applied on vineyards. The use of these
grochemicals has a special relevance in regions with high humiditynd warm temperatures. Several factors, such as type and concen-rations of fungicides applied to vines, time period and climaticonditions from the last spraying until vintage, determine the
∗ Corresponding author. Tel.: +34 981 563100x14387; fax: +34 981 595012.E-mail address: [email protected] (I. Rodríguez).
021-9673/$ – see front matter © 2011 Elsevier B.V. All rights reserved.oi:10.1016/j.chroma.2011.02.025
© 2011 Elsevier B.V. All rights reserved.
occurrence and the concentration of fungicide residues in grapes.Thereafter, the characteristics of each pesticide and the wine-making operations affect the transfer of fungicides from grapes towine [3–7]. The European Union (EU) has established the maximumpermissible concentrations of several fungicides in vinificationgrapes, expressed as the Maximum Residue Limits (MRLs) [8]. Nev-ertheless, with a few exceptions [9], the presence of fungicides inwine is not regulated being an issue of concern for consumers andproducers. In this sense, the determination of fungicide residuesin wine is necessary for food safety monitoring and future reg-ulatory purposes. Moreover, it can be also useful to select thoseagrochemicals showing the lowest transfer factors from grapes to
wine.Sample preparation plays an important role in the deter-mination of fungicides due to the complexity of wine matrixand the low expected concentration of target analytes (ng mL−1
range). The most common approaches are liquid–liquid extrac-

2 atogr
t[ptrs
o(hdicaomflttfwvmapa[
ofSwoeptTtcaw
2
2
Mfab(((mtwwmtpmism
166 A.R. Fontana et al. / J. Chrom
ion using organic solvents [10–12] solid-phase extraction (SPE)13,14], solid-phase microextraction [15,16], hollow-fiber liquid-hase microextraction [17] and QuECheRS [18]. Among the aboveechniques, SPE offers a good compromise among robustness,apidity, clean-up efficiency, scope for automation and solvent con-umption.
As regards the determination step, most procedures are basedn gas chromatography (GC) [10,19,20] or liquid chromatographyLC) [2,11,21] coupled with different detection systems, with aigh percentage of studies dealing with mass spectrometry (MS)etection. Particularly, LC–tandem mass spectrometry (MS/MS)
s being increasingly used in food applications related to fungi-ide compounds [21–24]. Triple quadrupole (QqQ) mass analyzersre the most resorted instruments, providing sensitive detectionf target analytes in the multiple reaction monitoring (MRM)ode. Hybrid mass spectrometers, such as quadrupole time-of-
ight (QTOF) systems, are emerging as an appealing alternativeo QqQ instruments providing accurate mass measurements andhe possibility to record full scan MS/MS spectra [25–27]. Thiseature avoids the loss of structural information of QqQ systemshen operated in the MRM mode [28]. Also, TOF instruments offer
aluable information of non-target or unknown analytes, whichight be of interest to investigate the presence of new fungicides
nd/or their transformation by-products in complex food sam-les [29]. Moreover, last generation LC–QTOF instruments shown improved sensitivity as well as wider linear response ranges30].
The objective of this work was the development and validationf a method for the identification and quantification of thirteenungicides, belonging to different chemical classes, in wines usingPE followed by LC–QTOF–MS/MS. Sample preparation conditionsere optimized in order to maximize the yield and the selectivity
f the extraction process, avoiding changes in the efficiency of thelectrospray ionization (ESI) between standard solutions and sam-le extracts. LC–QTOF–MS/MS parameters were adjusted to allowhe sensitive and unequivocal determination of selected fungicides.he performance of the proposed methodology was evaluated inerms of limits of quantification (LOQs), absolute recoveries, pre-ision and linear working range. Moreover, the procedure waspplied to the determination of target fungicides in commercialine samples from different regions of Spain.
. Experimental
.1. Standards, solvents and sorbents
HPLC-grade acetonitrile and methanol were acquired fromerck (Darmstadt, Germany). Ultrapure water was obtained
rom a Milli-Q system (Millipore, Billerica, MA, USA). Formiccid, acetic acid and sodium hydroxide were also providedy Merck and ammonium acetate was from Riedel de HaënSeelze, Germany). Standards of azoxystrobin (99.9%), benalaxyl99.9%), cyprodinil (99.8%), diniconazole (99.1%), difenoconazole97%), flusilazole (99.8%), iprovalicarb (98.5%), metalaxyl (99%),
yclobutanil (99.4%), penconazole (99.1%), propiconazole (98.6%),ebuconazole (99.6%) and triadimenol (100 �g mL−1 in acetonitrile)ere purchased from Riedel de Haën and Sigma–Aldrich (Mil-aukee, WI, USA). Table 1 summarizes the abbreviated names,olecular formulas, exact masses and other relevant properties of
arget analytes. Stock solutions of the above fungicides were pre-
ared in acetonitrile. Further dilutions and mixtures of them wereade in the same solvent. Standards in acetonitrile were storedn the dark, at 4 ◦C, for a maximum of two months. Calibrationtandards were dissolved in acetonitrile:water (1:1) and used for aaximum of one week after preparation.
. A 1218 (2011) 2165–2175
OASIS HLB (200 mg) and OASIS MAX (150 mg) solid-phaseextraction (SPE) cartridges were provided by Waters (Milford, MA,USA).
2.2. Samples and sample preparation
Wine samples were purchased in local supermarkets. Samplepreparation conditions were optimized with pooled samples of red(Tempranillo, Mencía and Cabernet Sauvignon) and white (Albarinoand Palomino) wines, spiked with target analytes at different con-centrations in the range from 5 to 100 ng mL−1. Spiked sampleswere maintained at 4 ◦C and used for a maximum of 48 h. Syntheticwine, considered as procedural blank, was prepared by addition oftartaric acid (3.5 g L−1) to a 12% ethanol solution in ultrapure water,followed by pH adjustment to 3.6 with NaOH (1 M).
Wine samples were diluted with ultrapure water (1:2) andpassed through the considered SPE cartridge (ca. 5 mL min−1),which was previously conditioned with the elution solvent fol-lowed by ultrapure water adjusted at pH 3.6 with acetic acid (5 mLof each). After the concentration step, cartridges were rinsed with10 mL of ultrapure water, dried for 20 min using a gentle stream ofnitrogen and eluted with a reversed-phase LC compatible organicsolvent. This extract was diluted with ultrapure water (1:1) beforeinjection in the chromatographic system. Breakthrough studieswere performed by passing the spiked samples through two car-tridges connected in series. The elution volume was establishedby collecting consecutive 1 mL fractions of solvent from the SPEcartridge.
Under final working conditions, wine samples (10–20 mL) wereconcentrated using Oasis HLB cartridges (200 mg). Analytes werefurther recovered with 2 mL of acetonitrile.
2.3. LC–MS/MS analysis
Target fungicides were determined using a LC–ESI–QTOF systemacquired from Agilent (Wilmington, DE, USA). The LC instrumentwas an Agilent 1200 Series, consisting of vacuum degasser unit,autosampler, two isocratic high pressure mixing pumps and a chro-matographic oven. The QTOF mass spectrometer was an Agilent6520 model, furnished with a Dual-Spray ESI source.
Compounds were separated in a reversed-phase Zorbax EclipseXDB-C18 column (100 mm × 2.1 mm, 3.5 �m) acquired from Agi-lent and connected to a C18 (4 mm × 2 mm) guard cartridgesupplied by Phenomenex (Torrance, CA, USA). Ultrapure water (A)and acetonitrile (B), both containing ammonium acetate 1 mM,were used as mobile phases. Under final working conditions, com-pounds were separated using the following gradient: 0–2 min, 30%B; 2–7 min, 50% B; 7–15 min, 50% B; 15–20 min, 65% B; 20–23 min,75% B; 23–24 min, 100% B; 24–27 min, 100% B; 27–28 min, 30% B;28–34 min, 30% B. The mobile phase flow was 0.2 mL min−1, andthe temperature of the column 35 ◦C. The injection volume for stan-dards and sample extracts was 15 �L.
Nitrogen (99.999%), used as nebulising (40 PSI) and drying gas(300 ◦C, 9 L min−1) in the dual ESI source, was provided by a highpurity generator (ErreDue srl, Livorno, Italy). The QTOF instrumentwas operated in the 2 GHz Extended Dynamic Range resolutionmode and compounds were ionized in positive ESI, applying a cap-illary voltage of 4000 V. A reference calibration solution (Agilentcalibration solution A) was continuously sprayed in the source ofthe QTOF system, employing the ions with m/z 121.0509 (purine)
and 922.0098 (HP-921) for recalibrating the mass axis ensuringthe accuracy of mass assignations throughout the chromatographicrun. The Mass Hunter Workstation software was used to control allthe acquisition parameters of the LC–ESI–QTOF system and also toprocess the obtained data.
A.R. Fontana et al. / J. Chromatogr. A 1218 (2011) 2165–2175 2167
Table 1Abbreviated names, CAS numbers, molecular formulas, exact masses and relevant properties of target species.
Analyte Abbreviation CAS number Chemical class Molecular formula Exact mass apKa alog Kow
Metalaxyl-M MET 70630-17-0 Phenylamide C15H21NO4 279.147059 1.41 1.76Benalaxyl-M BEN 71626-11-4 Phenylamide C20H23NO3 325.167794 1.52 3.88Penconazole PEN 66246-88-6 Triazole C13H15Cl2N3 283.064301 2.83 4.64Diniconazole DIN 83657-24-3 Triazole C15H17Cl2N3O 325.074866 2.19 4.34Propiconazole PRO 60207-90-1 Triazole C15H17Cl2N3O2 341.069781 2.94 3.65Difenoconazole DIF 119446-68-3 Triazole C19H17Cl2N3O3 405.064696 3.06 4.9Tebuconazole TEB 107534-96-3 Triazole C16H22ClN3O 307.145139 3.39, 13.7 3.58Flusilazole FLU 85509-19-9 Triazole C16H15F2N3Si 315.397506 2.91 3.70Triadimenol TRI 55219-65-3 Triazole C14H18ClN3O2 295.108754 2.16, 13.29 2.97Myclobutanil MYC 88671-89-0 Triazole C15H17ClN4 288.114173 2.30 3.07Azoxystrobin AZO 131860-33-8 Strobilurin C22H17N3O5 403.116822 −0.67 5.13
ine
uaatwtg1tap
2s
a(eatepbi%aosmtaaCfdsfmf
3
3
v1
Cyprodinil CYP 121552-61-2 AnilinopyrimidIprovalicarb IPR 140923-17-7 Carbamate
a Values obtained from the SciFinder Scholar Database.
The precursor [M+H]+ ions for all compounds were obtainedsing a common fragmentor (in source CID) voltage of 160 V. There-fter, collision energy was optimized with the aim of obtainingminimum of two product ions for each precursor. In addition
o the MS/MS spectra of target analytes (recorded within a timeindow of 2–3 min), the system provided full scan MS spectra, in
he range from 50 to 1250 m/z units, during the whole chromato-raphic run. Acquisition rates for MS and MS/MS modes were set at.4 spectra s−1, with each spectrum being the combination of 9600ransients. The most intense fragment in the MS/MS spectra of eachnalyte was used for quantification purposes, whereas the rest ofroduct ions were used for confirmation.
.4. Matrix effects, SPE efficiencies, absolute recoveries andample quantification
Potential matrix effects (ME, %) occurring during ESI were evalu-ted as ME = [(Ase − Ane)/As] × 100, being Ase and Ane the responsespeak areas) measured for spiked (addition was done after the SPExtraction step) and non-spiked extracts of the same wine sample,nd As the response obtained for a standard with the same concen-ration. Thus, ME values around 100% indicate no changes in thefficiency of the ESI ionization for wine extracts versus standardsrepared in acetonitrile:water (1:1). On the other hand, valueselow or above 100% point to suppression or enhancement effects
n the ionization step. The extraction efficiency of the SPE step (EE,) was calculated as EE = [(Ass − Ans)/(Ase − Ane)] × 100, being Ass
nd Ans the responses obtained for spiked (addition was carriedut over wine samples, before SPE) and non-spiked aliquots of theame sample. Finally, the absolute recoveries (R, %) of the proposedethod were calculated as the difference between the concen-
rations measured for extracts from spiked (Cs) and non-spikedliquots (Cb) of wine divided by the theoretical concentration (Ct)dded to the sample, and multiplied by 100, R = [(Cs − Cb)/Ct] × 100.s and Cb were established against calibration curves obtainedor standards in acetonitrile:water (1:1). Under final working con-itions, the absolute recoveries (accuracy) of the global methodtayed between 81 and 114%. Thus, the concentrations of targetungicides in commercial wine samples were accurately deter-
ined by external calibration, without applying any correctionactor.
. Results and discussion
.1. LC–QTOF method development
Optimization of ESI-QTOF parameters was carried out with indi-idual and mixture standard solutions of target analytes at the000 ng mL−1 level. Departure separation conditions were taken
C14H15N3 225.126597 3.1 4.0C18H28N2O3 320.209993 −0.9, 11.4 3.56
from previous articles dealing with the LC determination of fungi-cide compounds [17,31,32]. As regards the ionization mode, mostcompounds were not detected, or produced very weak signals, innegative ESI; thus, positive ionization was selected. In the next step,the effect of the fragmentor voltage in the signal of the [M+H]+ ionswas investigated. For all compounds, the highest responses wereobtained for 160 V.
LC conditions were optimized using binary mixtures ofmethanol:water and acetonitrile:water. In both cases, MET andTRI showed the shortest retention times, which is in agreementwith their relatively low Kow values (Table 1). The elution orderfor the rest of species varied depending on the organic phase (ace-tonitrile or methanol), with the best overall separation efficiencycorresponding to acetonitrile. Thereafter, the effect of ammoniumacetate and formic acid in the efficiency of the ionization and theLC separation step was assessed. The above modifiers were addedto water and acetonitrile phases at increasing concentrations: upto 0.1% in the case of formic acid, and up to 5 mM for ammo-nium acetate. Fig. 1 shows the average responses (peak areas, n = 2replicates) obtained under different experimental conditions. Theaddition of formic acid to the mobile phase led to a moderate reduc-tion in the responses obtained for MET, IPR, AZO and BEN, whereasit played a non-significant effect in the peak areas measured forthe rest of species (Fig. 1A). As regards the LC separation process,the retention of CYP was strongly affected by the concentration ofacid in the mobile phase, shifting to lower retention times with theincrease in the percentage of formic acid. Likely, the above trend is aconsequence of the protonation of the amino moiety existing in thestructure of CYP. On the other hand, ammonium acetate produceda slight reduction in the responses measured for most compounds(Fig. 1B), and a negligible influence on their chromatographic reten-tion. Despite the above reported sensitivity reduction, ammoniumacetate (1 mM) was added as modifier to the mobile phase in orderto control its ionic strength and pH.
Once chromatographic and ESI (ionization mode and fragmen-tor voltage) conditions were established, the collision energy wasoptimized in order to obtain at least two intense fragments, main-taining also a fraction (10–20%) of the precursor ion, in the MS/MSspectrum of each fungicide. However, TRI, TEB and DIN rendered asingle intense signal in their MS/MS spectra corresponding to theprotonated azole moiety with a theoretical m/z of 70.0400. Con-sidering the existence of chlorine atoms in the structure of theseanalytes, a second transition using the [M+2+H]+ precursor ionwas registered for qualification purposes. For AZO, two intense
fragment ions could be obtained only at the expense of losingthe information corresponding to the precursor ion in the MS/MSspectrum. Table 2 compiles the experimental m/z ratios measuredfor precursor ([M+H]+) and fragment ions of target compounds,the collision energy as well as the retention times and the chro-
2168 A.R. Fontana et al. / J. Chromatogr. A 1218 (2011) 2165–2175
r in th
mmuqatuabatf
TL
Cn
Fig. 1. Effects of type and amount of modifie
atographic acquisition window for each species. In general, theost intense fragment ions compiled in Table 2 have been also
sed for quantitative purposes in LC–MS/MS applications of tripleuadrupole mass spectrometers, and their structures have beenlready described in the literature [21,31,33]. Fragmentation pat-erns of BEN and IPR are illustrated in Fig. 2. As observed, workingnder conditions summarized in Table 2, the relative errors in the
ssignment of m/z ratios of precursor and fragment ions remainedelow 4 ppms (absolute value) for a 1000 ng mL−1 standard. Thevailability of accurate m/z data for fragment ions greatly simplifieshe identification of their chemical structures and thus, the MS/MSragmentation pattern of analytes.able 2C-QTOF database including retention times (RT) and masses for precursor and fragment
Analyte RT (min) Acquisitionwindow (min)
aPrecusor ion (m/z) CE
MET 10.31 3 280.1539 10
TRI 13.16 3 296.1159, 298.1138 3IPR 14.97 2 321.2173 8
MYC 15.08 2 289.1218 18AZO 15.53 2 404.1242 20TEB 16.52 3 308.1517, 310.1503 18FLU 17.22 2 316.1079 20PEN 17.42 2 284.0719 15DIN 18.78 3 326.0826, 328.0797 22PRO 19.04 3 342.0776 20CYP 19.72 3 226.1337 35
BEN 21.91 3 326.1746 10
DIF 22.59 3 406.0725 20
E, collision energy, eV..a., not available.a Experimental m/z values obtained for a 1000 ng mL−1 standard.
e responses (peak areas) of target analytes.
The number of MS/MS spectra acquired through a chromato-graphic peak depended on (1) the number of precursor ions withoverlapped chromatographic windows and (2) the acquisition rateof the TOF mass analyzer. Under the most un-favorable situation(5 precursors in the same window), 12 spectra were recorded perpeak using an acquisition rate of 1.4 spectra s−1. Higher acquisitionfrequencies led to more spectra per peak, at the expense of reducing
the number of transients per spectra. In order to assess the effectof this variable in the performance of the LC–QTOF instrument,some additional experiments were carried out using an acquisi-tion rate of 6 spectra s−1, (ca. 2240 transients per spectra). Underthese conditions, no differences were noticed in the accuracy of
ions of target fungicides.
aQuantificationtransition (m/z)
aConfirmationtransition (m/z)
aOther fragments(m/z)
280.1539 > 220.1328 280.1539 > 192.1379 248.1277,160.1114
296.1159 > 70.0405 298.1138 > 70.0405 n.a.321.2173 > 119.0853 321.2173 > 203.1386 186.1127,
144.0651289.1218 > 70.0405 289.1218 > 125.0147 n.a.404.1242 > 372.0968 404.1242 > 344.1023 n.a.308.1517 > 70.0405 310.1503 > 70.0405 n.a.316.1079 > 247.0745 316.1079 > 165.0694 219.0428, 80.9971284.0719 > 70.0406 284.0719 > 158.9758 n.a.326.0826 > 70.0406 328.0797 > 70.0405 n.a.342.0776 > 69.0705 342.0776 > 158.9756 n.a.226.1337 > 93.0574 226.1337 > 108.0794 210.1022,
118.0551, 77.0390326.1746 > 148.1116 326.1746 > 208.1329 294.1485,
266.1535, 91.0544406.0725 > 251.0020 406.0725 > 337.0381 n.a.

A.R. Fontana et al. / J. Chromatogr. A 1218 (2011) 2165–2175 2169
tion p
mtstrMca
3
LTrTw12(dsnCTf[itcscvr
Fig. 2. MS/MS fragmenta
ass assignation to MS/MS fragments; however, the sensitivity ofhe LC–QTOF instrument underwent a four-fold reduction (data nothown). Obviously, in this study, the acquisition rate was main-ained at 1.4 spectra s−1. However, the above finding arises as aelevant limitation of the LC–QTOF instrument, operated in theS/MS mode, for the sensitive multi-residue quantification of more
omplex samples, containing many chromatographic overlappednalytes.
.2. LC–QTOF–MS/MS instrumental performance
Table 3 summarizes the data related to the performance of theC–QTOF system, without considering the sample preparation step.he mass window used to extract the MS/MS chromatograms, cor-esponding to quantification ions reported in Table 2, was 20 ppms.he plots of peak area versus concentration followed a linear trend,ithin the range of concentrations comprised between LOQs and
000 ng mL−1 for MET, IPR, AZO, FLU, PEN and BEN and up to000 ng mL−1 for the rest of species. The determination coefficientsR2) of the obtained graphs ranged from 0.991 to 0.999. Fig. 3epicts the MS/MS chromatogram corresponding to a standardolution (25 ng mL−1) of target species. LOQs calculated for a sig-al to noise ratio of 10 (S/N = 10) varied between 0.2 ng mL−1 forYP and 1.7 ng mL−1 for MYC. Globally, the LOQs summarized inable 2 are similar to those reported for these and other similarungicides using LC–QqQ systems, operated in the MS/MS mode31,33], and LC–TOF in the single MS mode [30]. The variabilityn the response of the system was investigated with standards atwo concentration levels (10 and 100 ng mL−1) for intra-day pre-
ision and at 25 ng mL−1 for inter-day precision studies. Relativetandard deviations (RSDs, %) for consecutive injections (n = 5 repli-ates) made in the same day ranged between 0.6 and 9.5%, whereasalues between 4.2 and 10.1% were obtained for injections (n = 12eplicates) carried out in three consecutive days, Table 3.atterns for BEN and IPR.
3.3. SPE optimization
SPE conditions were optimized with a pooled matrix ofred wines, considered as the most complex sample, spiked atthe 100 ng mL−1 level. Initially, methanol and acetonitrile wereselected as elution solvents to recover target analytes from OasisMAX and HLB cartridges. The former solvent rendered reddishextracts, particularly when used in combination with the reversed-phase HLB sorbent, with a high level of co-extracted pigments.On the other hand, independently of the SPE sorbent, transparentand colorless extracts were achieved with acetonitrile, which wasselected as elution solvent. In a further step, it was verified that tar-get species were recovered just in the first two fractions (1 mL, each)of acetonitrile collected from both SPE cartridges. Breakthroughproblems were not detected with any of both sorbents for 10 mLof red wine; however, a breakthrough percentage around 5% wasnoticed for MET using the mixed-mode MAX sorbent for 20 mL ofwine. The above result may be related to (1) the lower mass of sor-bent included in the MAX cartridge (150 mg versus 200 mg for theHLB one) and/or to (2) saturation of the mixed-mode sorbent due toretention of acidic compounds, contained in wine samples, throughelectrostatic interactions with the positively charged amino groupsexisting in this sorbent [31]. On the basis of its higher breakthroughvolume, the 200 mg Oasis HLB cartridges were selected for furtherextractions.
The extraction efficiency and the selectivity of the above SPEprotocol was evaluated for pooled samples of red and white wines(10 mL), both fortified at 100 ng mL−1. The achieved extraction effi-ciencies ranged from 77% to 95%, with standard deviations valuesbelow 7%, Fig. 4. Matrix effects (MEs), evaluated as described in
Section 2, stayed between 94% and 104% with standard deviationslower than 7%. The only exception was the value obtained for CYP(117 ± 4%) in the red wine matrix, Fig. 5. Overall, the above MEvalues indicate negligible, or low (case of CYP), variations amongthe efficiency of the ionization process for sample (10 mL of red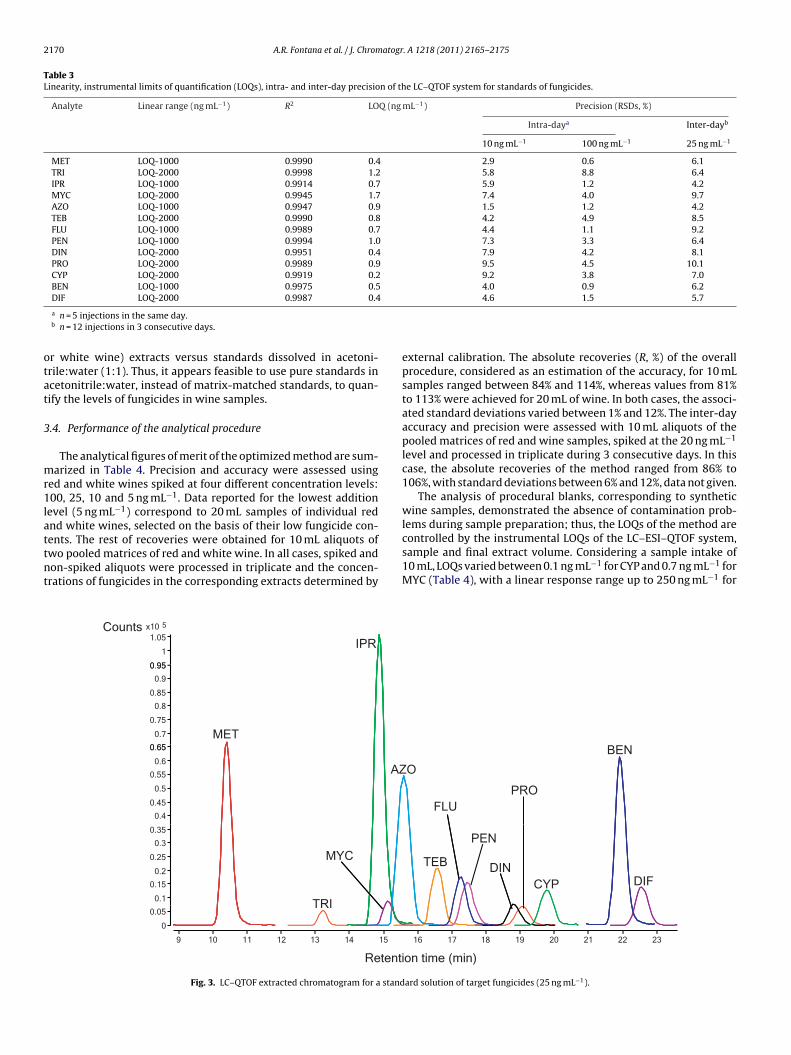
2170 A.R. Fontana et al. / J. Chromatogr. A 1218 (2011) 2165–2175
Table 3Linearity, instrumental limits of quantification (LOQs), intra- and inter-day precision of the LC–QTOF system for standards of fungicides.
Analyte Linear range (ng mL−1) R2 LOQ (ng mL−1) Precision (RSDs, %)
Intra-daya Inter-dayb
10 ng mL−1 100 ng mL−1 25 ng mL−1
MET LOQ-1000 0.9990 0.4 2.9 0.6 6.1TRI LOQ-2000 0.9998 1.2 5.8 8.8 6.4IPR LOQ-1000 0.9914 0.7 5.9 1.2 4.2MYC LOQ-2000 0.9945 1.7 7.4 4.0 9.7AZO LOQ-1000 0.9947 0.9 1.5 1.2 4.2TEB LOQ-2000 0.9990 0.8 4.2 4.9 8.5FLU LOQ-1000 0.9989 0.7 4.4 1.1 9.2PEN LOQ-1000 0.9994 1.0 7.3 3.3 6.4DIN LOQ-2000 0.9951 0.4 7.9 4.2 8.1PRO LOQ-2000 0.9989 0.9 9.5 4.5 10.1CYP LOQ-2000 0.9919 0.2 9.2 3.8 7.0BEN LOQ-1000 0.9975 0.5 4.0 0.9 6.2
otat
3
mr1lattnt
DIF LOQ-2000 0.9987 0.4
a n = 5 injections in the same day.b n = 12 injections in 3 consecutive days.
r white wine) extracts versus standards dissolved in acetoni-rile:water (1:1). Thus, it appears feasible to use pure standards incetonitrile:water, instead of matrix-matched standards, to quan-ify the levels of fungicides in wine samples.
.4. Performance of the analytical procedure
The analytical figures of merit of the optimized method are sum-arized in Table 4. Precision and accuracy were assessed using
ed and white wines spiked at four different concentration levels:00, 25, 10 and 5 ng mL−1. Data reported for the lowest addition
evel (5 ng mL−1) correspond to 20 mL samples of individual red
nd white wines, selected on the basis of their low fungicide con-ents. The rest of recoveries were obtained for 10 mL aliquots ofwo pooled matrices of red and white wine. In all cases, spiked andon-spiked aliquots were processed in triplicate and the concen-rations of fungicides in the corresponding extracts determined by5x10
0 95
1
1.05Counts
IPR
0 65
0.7
0.75
0.8
0.85
0.9
0.95
MET
0.4
0.45
0.5
0.55
0.6
0.65
AZ
0.1
0.15
0.2
0.25
0.3
0.35
TRI
MYC
0
0.05
Retenti
9 10 11 12 13 14 15
TRI
Fig. 3. LC–QTOF extracted chromatogram for a stand
4.6 1.5 5.7
external calibration. The absolute recoveries (R, %) of the overallprocedure, considered as an estimation of the accuracy, for 10 mLsamples ranged between 84% and 114%, whereas values from 81%to 113% were achieved for 20 mL of wine. In both cases, the associ-ated standard deviations varied between 1% and 12%. The inter-dayaccuracy and precision were assessed with 10 mL aliquots of thepooled matrices of red and wine samples, spiked at the 20 ng mL−1
level and processed in triplicate during 3 consecutive days. In thiscase, the absolute recoveries of the method ranged from 86% to106%, with standard deviations between 6% and 12%, data not given.
The analysis of procedural blanks, corresponding to syntheticwine samples, demonstrated the absence of contamination prob-
lems during sample preparation; thus, the LOQs of the method arecontrolled by the instrumental LOQs of the LC–ESI–QTOF system,sample and final extract volume. Considering a sample intake of10 mL, LOQs varied between 0.1 ng mL−1 for CYP and 0.7 ng mL−1 forMYC (Table 4), with a linear response range up to 250 ng mL−1 forO
FLUPRO
BEN
TEB
PEN
DINCYP DIF
on time (min)
16 17 18 19 20 21 22 23
ard solution of target fungicides (25 ng mL−1).

A.R. Fontana et al. / J. Chromatogr. A 1218 (2011) 2165–2175 2171
Fig. 4. Extraction efficiency (EE, %) of SPE for 10 mL wine samples spiked at 100 ng mL−1, n = 3 replicates.
g ESI
Moe(
TAc
Fig. 5. Assessment of matrix effects (ME, %) durin
ET, IPR, AZO, FLU, PEN and BEN, and up to 500 ng mL−1 for the restf analytes. LOQs compiled in Table 4 remain far below the MRLsstablished by the EU for these fungicides in vinification grapesfrom 0.05 to 2 �g g−1) and those defined for FLU and TEB in wine
able 4ccuracy, expressed as absolute recoveries (%), and precision, given as standard deviationoncentration levels and LOQs (S/N = 10) calculated for 10 mL volume samples.
Analyte Recovery (%) ± SD, n = 3
a100 ng mL−1 a25 ng mL−1
White wine Red wine White wine Red wine White
MET 86.8 ± 2.7 90.9 ± 0.7 90.4 ± 0.4 95.1 ± 1.4 107.2TRI 89.2 ± 11.8 93.6 ± 3.4 100.9 ± 0.8 107.9 ± 9.0 98.5IPR 89.2 ± 2.6 90.6 ± 1.2 93.4 ± 0.2 97.2 ± 1.5 111.6MYC 92.2 ± 5.2 95.6 ± 1.3 92.0 ± 4.0 105.5 ± 3.2 100.5AZO 91.7 ± 1.6 90.5 ± 1.1 96.0 ± 4.7 100.9 ± 1.9 110.4TEB 91.2 ± 3.4 89.1 ± 2.6 97.0 ± 7.5 103.0 ± 3.7 97.8FLU 86.6 ± 3.1 83.3 ± 2.3 93.6 ± 1.4 99.7 ± 5.6 97.2PEN 88.1 ± 2.5 90.6 ± 0.4 97.9 ± 4.3 103.1 ± 1.6 100.2DIN 92.7 ± 4.1 87.6 ± 3.7 98.9 ± 6.7 102.5 ± 3.5 91.8PRO 91.5 ± 4.6 90.0 ± 3.9 88.1 ± 5.9 97.0 ± 6.2 104.0CYP 90.1 ± 3.3 89.5 ± 3.2 91.9 ± 1.4 83.6 ± 3.2 95.2BEN 89.2 ± 3.8 91.4 ± 1.8 94.5 ± 3.4 98.5 ± 3.4 108.6DIF 83.7 ± 2.9 83.6 ± 0.9 92.9 ± 1.2 89.6 ± 5.5 99.5
a Recoveries for 10 mL aliquots of two pooled samples of red and white wines.b Recoveries for 20 mL aliquots of two individual samples of red (Mencía) and white (Pa
for red and white wine extracts, n = 3 replicates.
(0.2 and 2 �g g−1, respectively) [8,9]. They also fulfil the recommen-dation of the Organisation Internationale de la Vigne (OIV), whichsuggests taking for wine 1/10 of the MRLs established for grapes.Additionally, it is worth noting that the LOQs provided by the pro-
(SD), of the proposed method for red and white wine samples spiked at different
replicates LOQs (ng mL−1)
a10 ng mL−1 b5 ng mL−1
wine Red wine White wine Red wine
± 2.7 100.3 ± 6.8 104.7 ± 5.6 107.0 ± 3.3 0.2± 8.0 80.8 ± 6.7 112.8 ± 10.3 112.4 ± 9.2 0.5± 4.8 103.8 ± 5.0 105.9 ± 5.3 108.1 ± 3.9 0.3± 7.6 98.1 ± 3.2 108.2 ± 10.3 106.2 ± 2.6 0.7± 1.3 107.6 ± 2.4 103.9 ± 5.7 106.1 ± 2.1 0.4± 7.1 113.5 ± 4.4 112.3 ± 2.4 103.2 ± 7.4 0.3± 7.4 89.7 ± 10.2 101.8 ± 5.0 95.5 ± 7.2 0.3± 2.1 105.7 ± 8.4 101.3 ± 1.9 101.3 ± 5.4 0.4± 6.9 88.0 ± 8.0 105.9 ± 1.2 103.5 ± 1.9 0.2± 8.9 100.5 ± 9.8 102.1 ± 3.3 89.9 ± 7.7 0.4± 6.6 86.1 ± 6.3 97.3 ± 8.1 81.0 ± 9.4 0.1± 2.1 105.5 ± 2.7 102.2 ± 2.4 101.5 ± 5.5 0.3± 2.3 92.4 ± 3.5 109.0 ± 3.6 108.5 ± 3.9 0.2
lomino) wine.

2172 A.R. Fontana et al. / J. Chromatogr. A 1218 (2011) 2165–2175
Fig. 6. Extracted chromatograms for a white wine sample (code W7, Table 5) and MS/MS spectra for fungicide species in the wine extract (A) and in a 25 ng mL−1 standard(B).

A.R. Fontana et al. / J. Chromatogr. A 1218 (2011) 2165–2175 2173
Fig. 6. (Continued)

2174 A.R. Fontana et al. / J. Chromatogr. A 1218 (2011) 2165–2175
(Cont
piita
3
pd(irpifao
TL
n<C
Fig. 6.
osed methodology are similar to, or lower than, those reportedn previous applications of LC–MS/MS based on triple quadrupolenstruments [21,31,33]. They are also in the same range of valueshan those achieved for pesticide residues in fruit juices by LC–TOFfter a 10-fold concentration step [34].
.5. Real sample analysis
The proposed method was applied to a total of seventeen sam-les of white (9 specimens) and red (8 specimens) wines fromifferent geographic regions in Spain. Four triazol type fungicidesFLU, PEN, DIN and PRO) remained below the LOQs of the methodn all the processed samples. Concentrations measured for theest of analytes are summarized in Table 5. Six fungicides were
resent in more than 20% of the analyzed samples, with max-mum individual concentrations comprised between 23 ng mL−1
or TEB and 125 ng mL−1 for MET. It is also worth noting thatll the processed samples contained measurable levels of at leastne fungicide, nine of them showed total concentrations above
able 5evels of target fungicides in non-spiked wine samples. Average concentrations (ng mL−1
Code Geographicregion
MET TRI IPR MYC
W1 Galicia 30.6 ± 0.7 <LOQ 3.9 ± 0.2 <LOQW2 Galicia 3.9 ± 0.1 2.8 ± 0.2 3.6 ± 0.3 n.d.W3 Galicia 46 ± 2 12 ± 2 110 ± 7 <LOQW4 Galicia 10.4 ± 0.7 <LOQ <LOQ <LOQW5 Galicia 48.7 ± 0.7 15.5 ± 0.7 50.9 ± 0.3 <LOQW6 Galicia 10.7 ± 0.2 8.31 ± 0.08 22.9 ± 0.2 n.d.W7 Galicia 125 ± 2 57.5 ± 0.4 85.7 ± 0.6 n.d.W8 Castilla-La
Mancha0.98 ± 0.01 <LOQ <LOQ n.d.
W9 Castilla-LaMancha
n.d. n.d. n.d. n.d.
R1 Castilla-León n.d. n.d. n.d. <LOQR2 Castilla-León 1.97 ± 0.08 3.9 ± 0.2 <LOQ <LOQR3 Galicia 3.49 ± 0.03 n.d. 12.1 ± 0.5 n.d.R4 Galicia 0.55 ± 0.02 n.d. n.d. n.d.R5 Galicia 2.4 ± 0.4 n.d. 50 ± 9 4.4 ± 0.3R6 Rioja 1.75 ± 0.03 2.4 ± 0.1 <LOQ <LOQR7 Rioja 5.9 ± 0.3 3.66 ± 0.07 4.4 ± 0.1 <LOQR8 Rioja 15.7 ± 0.4 <LOQ <LOQ <LOQ
Occurrence frequency (%) 88% 47% 53% 6%Maximum concentration (ng mL−1) 125 58 109 4
.d., not detected.LOQ, below the limit of quantification of the method.odes W and R correspond to white and red wines, respectively.
inued).
10 ng mL−1 and three stayed above 100 ng mL−1. Globally, datacompiled in Table 5 are similar to those found in the literature.As example, Trösken et al. [21] have reported a maximum con-centration of 33 ng mL−1 and an occurrence frequency of 55% forTEB in wines from different European countries. Also, CYP andMET have been detected at levels up to 30 ng mL−1 in white winesproduced in Galicia [19,31,35]. The presence of fungicide residuesin wines is related to several variables, such as doses sprayed onvineyards, wine making technology, persistence of each particu-lar compound during wine elaboration and their trend to remainassociated with solid wastes (peels and seeds) or staying dissolvedin wine [36]. In this sense, transfer factors from grapes to winehigher than 0.2 have been reported for IPR [4], MET [5], AZO andCYP [3], which are the compounds showing the highest levels in
the analyzed samples, Table 5. Fig. 6 shows the extracted ion chro-matograms and the MS/MS spectra for a non-spiked wine sample(code W7, Table 5), together with the MS/MS spectra for a stan-dard (25 ng mL−1). The accurate measurement of the m/z ratios forprecursor and fragment ions guaranteed the unambiguous identi-) with their standard deviations, n = 3 replicates.
AZO TEB CYP BEN DIF Total conc.(ng mL−1)
27 ± 2 1.14 ± 0.05 <LOQ <LOQ <LOQ 63n.d. n.d. n.d. n.d. n.d. 103.3 ± 0.1 <LOQ 36.7 ± 0.4 <LOQ n.d. 208<LOQ <LOQ n.d. <LOQ n.d. 101.76 ± 0.02 4.8 ± 0.5 n.d. 12.9 ± 0.6 0.51 ± 0.02 135<LOQ 6.7 ± 0.6 5.0 ± 0.3 <LOQ n.d. 542.2 ± 0.1 6.4 ± 0.5 42 ± 2 2.2 ± 0.1 n.d. 321n.d. n.d. 0.7 ± 0.2 n.d. n.d. 2
<LOQ <LOQ <LOQ n.d. 1.6 ± 0.3 2
<LOQ <LOQ 2.3 ± 0.2 n.d. n.d. 2<LOQ n.d. n.d. <LOQ <LOQ 6n.d. n.d. <LOQ <LOQ n.d. 16n.d. n.d. n.d. n.d. n.d. 1<LOQ 23 ± 3 0.38 ± 0.12 n.d. n.d. 80<LOQ 1.2 ± 0.3 n.d. n.d. n.d. 5n.d. <LOQ <LOQ n.d. n.d. 14<LOQ n.d. 0.8 ± 0.3 <LOQ n.d. 17
24% 35% 41% 12% 12%27 23 42 13 1.6

atogr
fioLcis
4
tsgTwistitApfeioM
A
fsa(f
R
[
[
[
[
[
[
[
[
[
[
[
[[
[
[[
[[[
[[[[
[
A.R. Fontana et al. / J. Chrom
cation of target fungicides. As shown in Fig. 6, two peaks werebtained for TRI in the extracts from all processed wine samples.ikely, they correspond to diastereoisomers of this fungicide. TRIoncentrations reported in Table 5 correspond to the first elut-ng isomer, showing the same retention time as the quantificationtandard.
. Conclusions
The SPE LC–QTOF developed methodology allows the selec-ive determination of selected fungicides in red and white wineamples, showing LOQs far below the current MRLs reported forrapes and wine, suitable precision and linear response ranges.he sample preparation method provides quantitative recoveries,hich remain unaffected by the type of sample; moreover, the
onization efficiency is similar for sample extracts and standardolutions, allowing the use of external calibration as quantifica-ion technique. The QTOF MS/MS spectra permit the unequivocaldentification and quantification of target compounds based onhe accurate mass determination of precursor and fragment ions.ltogether, the above features guarantee the ruggedness of theroposed methodology for the routine determination of targetungicides in commercial wine samples, with the aim of evaluatingxposure of wine consumers to these compounds. Data obtainedn this study, for a limited number of samples, confirmed the oftenccurrence of significant levels of several fungicides, particularlyET and IPR, in commercial wines.
cknowledgements
Financial support from the Spanish Government and E.U. FEDERunds (project CTQ2009-08377) is acknowledged. A.R.F. thanks ahort term formation fellowship to Fundación Carolina, Spain. M.R.cknowledges her contract to the Isidro Parga Pondal programXunta de Galicia). We are also in debt with Dr. J.B.Q. and Dr. R.R.or technical assistance with the LC–QTOF system.
eferences
[1] R.M. González-Rodríguez, B. Cancho-Grande, A. Torrado-Agrasar, J. Simal-Gándara, J. Mazaira-Pérez, Food Chem. 117 (2009) 529.
[2] F. Cus, H. Basa Cesnik, S. Velikonja Bolta, A. Gregorcic, Food Control 21 (2010)1512.
[3] P. Cabras, A. Angioni, J. Agric. Food Chem. 48 (2000) 967.
[
[
[
. A 1218 (2011) 2165–2175 2175
[4] R.M. González-Rodríguez, B. Cancho-Grande, J. Simal-Gándara, J. Sci. Food Agric.89 (2009) 2625.
[5] S. Navarro, J. Oliva, A. Barba, G. Navarro, M.A. García, M. Zamorano, J. Agric. FoodChem. 48 (2000) 3537.
[6] E. Pose-Juan, B. Cancho-Grande, R. Rial-Otero, J. Simal-Gándara, Food Control17 (2006) 1012.
[7] R.M. González-Rodríguez, B. Cancho-Grande, J. Simal-Gándara, Food Chem. 125(2011) 549.
[8] Off. J. Eur. Union L70 (2005) 1.[9] http://www.awri.com.au/industry support/viticulture/agrochemicals/mrls.10] S. Navarro, A. Barba, G. Navarro, N. Vela, J. Oliva, J. Chromatogr. A 882 (2000)
221.11] S. de Melo Abreu, M. Correia, P. Herbert, L. Santos, A. Alves, Food Addit. Contam.
22 (2005) 549.12] R.M. González-Rodríguez, R. Noguerol-Pato, C. González-Barreiro, B. Cancho-
Grande, J. Simal-Gándara, Food Res. Int. 44 (2011) 397.13] J.W. Wong, M.G. Webster, C.A. Halverson, M.J. Hengel, K.K. Ngim, S.E. Ebeler, J.
Agric. Food Chem. 51 (2003) 1148.14] J.J. Jiménez, J.L. Bernal, Ma .J. Del Nozal, L. Toribio, E. Arias, J. Chromatogr. A 919
(2001) 147.15] L.M. Ravelo-Pérez, J. Hernández-Borges, T.M. Borges-Miquel, M.A. Rodríguez-
Delgado, Food Chem. 111 (2008) 764.16] S. Millán, M.C. Sampedro, N. Unceta, M.A. Goicolea, E. Rodríguez, R.J. Barrio, J.
Chromatogr. A 995 (2003) 135.17] P.P. Bolanos, R. Romero-González, A.G. Frenich, J.L.M. Vidal, J. Chromatogr. A
1208 (2008) 16.18] P. Payá, M. Anastassiades, D. Mack, I. Sigalova, B. Tasdelen, J. Oliva, A. Barba,
Anal. Bioanal. Chem. 389 (2007) 1697.19] R. Montes, I. Rodríguez, M. Ramil, E. Rubí, R. Cela, J. Chromatogr. A 1216 (2009)
5459.20] R.M. González-Rodríguez, B. Cancho-Grande, J. Simal-Gándara, J. Chromatogr.
A 1216 (2009) 6033.21] E.R. Trösken, N. Bittner, W. Völkel, J. Chromatogr. A 1083 (2005) 113.22] B. Kmellár, P. Fodor, L. Pareja, C. Ferrer, M.A. Martínez-Uroz, A. Valverde, A.R.
Fernandez-Alba, J. Chromatogr. A 1215 (2008) 37.23] B. Gilbert-López, J.F. García-Reyes, A. Lozano, A.R. Fernández-Alba, A. Molina-
Díaz, J. Chromatogr. A 1217 (2010) 6022.24] S.A. Rodrigues, S.S. Caldas, E.G. Primel, Anal. Chim. Acta 678 (2010) 82.25] M. Lavén, T. Alsberg, Y. Yu, M. Adolfsson-Erici, H. Sun, J. Chromatogr. A 1216
(2009) 49.26] M.M. Zheng, G.D. Ruan, Y.Q. Feng, J. Chromatogr. A 1216 (2009) 7510.27] M. Petrovic, M. Gros, D. Barcelo, J. Chromatogr. A 1124 (2006) 68.28] I. Bobeldijk, J.P.C. Vissers, G. Kearney, H. Major, J.A. van Leerdam, J. Chromatogr.
A 929 (2001) 63.29] F. Hernández, S. Grimalt, O.J. Pozo, J.V. Sancho, J. Sep. Sci. 32 (2009) 2245.30] I. Ferrer, E.M. Thurman, J. Chromatogr. A 1175 (2007) 24.31] I. Carpinteiro, M. Ramil, I. Rodríguez, R. Cela, J. Chromatogr. A 1217 (2010) 7484.32] M.J. Nozal, J.L. Bernal, J.J. Jiménez, M.T. Martín, J. Bernal, J. Chromatogr. A 1076
(2005) 90.33] A. Economou, H. Botitsi, S. Antoniou, D. Tsipi, J. Chromatogr. A 1216 (2009)
5856.34] B. Gilbert-López, J.F. García-Reyes, M. Mézcua, A. Molina-Díaz, A.R. Fernández-
Alba, J. Agric. Food Chem. 55 (2007) 10548.35] R. Rial Otero, C. Yagüe Ruiz, B. Cancho Grande, J. Simal Gándara, J. Chromatogr.
A 942 (2002) 41.36] G. Rose, S. Lane, R. Jordan, Food Chem. 117 (2009) 634.
Copyright © 2022 FDOKUMEN