Investigation of the initial fragmentation of oligodeoxynucleotides in a quadrupole ion trap: Charge...
13
Investigation of the Initial Fragmentation of Oligodeoxynucleotides in a Quadrupole Ion Trap: Charge Level-Related Base Loss Su Pan, Kathryn Verhoeven, and Jeehiun K. Lee Department of Chemistry and Chemical Biology, Rutgers, The State University of New Jersey, Piscataway, New Jersey, USA The charge state distribution and CID fragmentation of two series of deprotonated oligode- oxynucleotide (ODN) 9-mers (5=-GGTTXTTGG-3= and 5=-CCAAYAACC-3=, X/Y G, C, A, or T) have been studied in detail in an ion trap in an effort to understand the intrinsic properties of DNA in vacuo. The distribution of charge states (2 to 6) is similar for both the X- and Y-series, with the most abundant being the 4 charge state. The T-rich X-series prefers higher charge states (6 and 5) than does the Y-series. Calculations show that phosphate groups located nearest a thymine are more acidic than those near an adenine, cytosine, or guanine, thus explaining why the X-series prefers higher charge states. We use the term “charge level” to define the ratio of the charge state to the total number of phosphate groups present in the ODN. We find, consistent with previous studies, that the initial step of fragmentation is loss of nucleobase either as an anion or as a neutral. We observe the former for ODNs with charge levels greater than 50% and the latter for ODNs with charge levels below 50%. The overall anionic base loss follows the trend A G T C ; electrostatic potential calculations indicate that this trend follows delocalization of electron density for each anion, with A being the most stabilized through delocalization. For neutral base loss, thymine (TH) is rarely cleaved, while the preferences for AH, GH, and CH loss vary. Proton affinity (PA) calculations show that a nearby negatively charged phosphate enhances the PA of proximally located nucleobases; this PA enhancement probably plays a role in promoting neutral base loss. The trends differ by charge level. At a charge level of 37.5% (3 charge state), AH loss is preferred over CH and GH loss, regardless of sequence. However, at a charge level of 25% (2 charge state), the terminal bases are preferentially lost over the internal bases, regardless of identity. By reconstructing the ODN sequences from structurally informative (a-BH) and w ions, we are able to identify the charge locations for the 3 and 2 charge states. For the 3 charge state, one charge resides on each “most terminal” phosphate, with the third being in the middle. For the 2 charge state, each charge resides on the penultimate phosphate groups. We compare our data to earlier experiments in an effort to generalize trends. (J Am Soc Mass Spectrom 2005, 16, 1853–1865) © 2005 American Society for Mass Spectrometry T he examination of the fragmentation of DNA in the gas phase has importance in both a funda- mental sense—to understand the intrinsic prop- erties of oligodeoxynucleotides (ODNs)—and also in an applied sense, to aid in the development of mass spectrometric-based methods for nucleotide sequencing and identification. The dissociation of deprotonated ODNs has been extensively investigated by mass spectrometry (MS) coupled with soft ionization methods such as electros- pray (ESI) and matrix-assisted laser desorption ioniza- tion (MALDI) [1–14]. It is known that the first step in the dissociation of deprotonated ODNs is loss of a nucleobase, either in a neutral (BH) or deprotonated (B ) form [1, 2, 15]. Loss of BH or B is followed by cleavage of the phosphodiester bond at the 3= C–O position of the deoxyribose from which the initial base was lost. We will refer to the ions thus produced by the well-accepted McLuckey nomenclature: (a-base) and w type ions (Figure 1)[1]. The loss of a nucleobase as a deprotonated anion or as a neutral is dependent on the identity of the base and the charge state of the parent ODN ion [2, 4, 8, 16]. The higher charge states favor B loss while lower charge states favor BH loss. There have not been many studies on anionic base cleavage; but for strands greater than two mers, the order of preference in terms of loss appears to be A T G ,C (where A adenine, T thymine, G guanine, and C cytosine, Figure 1) [1, 16]. There have been comparatively more studies focus- Published online September 28, 2005 Address reprint requests to Dr. J. K. Lee, Department of Chemistry and Chemical Biology, Rutgers, The State University of New Jersey, 610 Taylor Road, Piscataway, NJ 08854, USA. E-mail: [email protected]. © 2005 American Society for Mass Spectrometry. Published by Elsevier Inc. Received April 21, 2005 1044-0305/05/$30.00 Revised July 8, 2005 doi:10.1016/j.jasms.2005.07.009 Accepted July 8, 2005
Transcript of Investigation of the initial fragmentation of oligodeoxynucleotides in a quadrupole ion trap: Charge...

Investigation of the Initial Fragmentationof Oligodeoxynucleotides in a QuadrupoleIon Trap: Charge Level-Related Base Loss
Su Pan, Kathryn Verhoeven, and Jeehiun K. LeeDepartment of Chemistry and Chemical Biology, Rutgers, The State University of New Jersey, Piscataway,New Jersey, USA
The charge state distribution and CID fragmentation of two series of deprotonated oligode-oxynucleotide (ODN) 9-mers (5=-GGTTXTTGG-3= and 5=-CCAAYAACC-3=, X/Y � G, C, A, orT) have been studied in detail in an ion trap in an effort to understand the intrinsic propertiesof DNA in vacuo. The distribution of charge states (�2 to �6) is similar for both the X- andY-series, with the most abundant being the �4 charge state. The T-rich X-series prefers highercharge states (�6 and �5) than does the Y-series. Calculations show that phosphate groupslocated nearest a thymine are more acidic than those near an adenine, cytosine, or guanine,thus explaining why the X-series prefers higher charge states. We use the term “charge level”to define the ratio of the charge state to the total number of phosphate groups present in theODN. We find, consistent with previous studies, that the initial step of fragmentation is lossof nucleobase either as an anion or as a neutral. We observe the former for ODNs with chargelevels greater than 50% and the latter for ODNs with charge levels below 50%. The overallanionic base loss follows the trend A� �� G� � T� � C�; electrostatic potential calculationsindicate that this trend follows delocalization of electron density for each anion, with A� beingthe most stabilized through delocalization. For neutral base loss, thymine (TH) is rarelycleaved, while the preferences for AH, GH, and CH loss vary. Proton affinity (PA) calculationsshow that a nearby negatively charged phosphate enhances the PA of proximally locatednucleobases; this PA enhancement probably plays a role in promoting neutral base loss. Thetrends differ by charge level. At a charge level of 37.5% (�3 charge state), AH loss is preferredover CH and GH loss, regardless of sequence. However, at a charge level of 25% (�2 chargestate), the terminal bases are preferentially lost over the internal bases, regardless of identity.By reconstructing the ODN sequences from structurally informative (a-BH) and w ions, we areable to identify the charge locations for the �3 and �2 charge states. For the �3 charge state,one charge resides on each “most terminal” phosphate, with the third being in the middle. Forthe �2 charge state, each charge resides on the penultimate phosphate groups. We compareour data to earlier experiments in an effort to generalize trends. (J Am Soc Mass Spectrom2005, 16, 1853–1865) © 2005 American Society for Mass Spectrometry
The examination of the fragmentation of DNA inthe gas phase has importance in both a funda-mental sense—to understand the intrinsic prop-
erties of oligodeoxynucleotides (ODNs)—and also in anapplied sense, to aid in the development of massspectrometric-based methods for nucleotide sequencingand identification.
The dissociation of deprotonated ODNs has beenextensively investigated by mass spectrometry (MS)coupled with soft ionization methods such as electros-pray (ESI) and matrix-assisted laser desorption ioniza-tion (MALDI) [1–14]. It is known that the first step inthe dissociation of deprotonated ODNs is loss of a
Published online September 28, 2005Address reprint requests to Dr. J. K. Lee, Department of Chemistry and
Chemical Biology, Rutgers, The State University of New Jersey, 610 TaylorRoad, Piscataway, NJ 08854, USA. E-mail: [email protected].© 2005 American Society for Mass Spectrometry. Published by Elsevie1044-0305/05/$30.00doi:10.1016/j.jasms.2005.07.009
nucleobase, either in a neutral (BH) or deprotonated(B�) form [1, 2, 15]. Loss of BH or B� is followed bycleavage of the phosphodiester bond at the 3= C–Oposition of the deoxyribose from which the initial basewas lost. We will refer to the ions thus produced by thewell-accepted McLuckey nomenclature: (a-base) and wtype ions (Figure 1) [1].
The loss of a nucleobase as a deprotonated anion oras a neutral is dependent on the identity of the base andthe charge state of the parent ODN ion [2, 4, 8, 16]. Thehigher charge states favor B� loss while lower chargestates favor BH loss. There have not been many studieson anionic base cleavage; but for strands greater thantwo mers, the order of preference in terms of lossappears to be A� � T� � G�, C� (where A � adenine,T � thymine, G � guanine, and C � cytosine, Figure 1)[1, 16].
There have been comparatively more studies focus-
r Inc. Received April 21, 2005Revised July 8, 2005
Accepted July 8, 2005

1854 PAN ET AL. J Am Soc Mass Spectrom 2005, 16, 1853–1865
ing on neutral base loss, with the preference of base lossappearing to be highly variable, depending on se-quence, charge state, and even the instrumentationmethod [9, 13, 16 –18]. Many mechanisms have beenproposed to explain the typically observed BH loss,which is normally followed by backbone fragmentation[13]. The proposals can be divided into two generalmechanisms, which differ by when proton transferoccurs. One possibility is loss of the deprotonatednucleobase followed by proton abstraction from theODN so that the nucleobase is ultimately lost as aneutral. The second possibility is loss of the neutralnucleobase involving proton transfer before, or con-comitant with, the nucleobase cleavage.
The apparent lack of agreement among the reportedtrends is not fully understood. For example, Wan andGross reported the propensity to form (a-BH) ionsfollows the order of GH � CH � AH �� TH in doublycharged T-rich 8-mers (5=-TTTXYTTT-3=, X/Y � G, C,A, or T) [13]. Smith and coworkers examined the neutralbase loss from a series of multiply charged 12-mers (�3,�4, and �5 charge states) [17]. The same trend (GH �CH � AH �� TH) as that reported by Gross wasobserved for the �3 charge state, but different trendswere noted at the �4 (AH � CH � GH �� TH) and atthe �5 (AH �� CH � GH �� TH) charge states. Forneutral base loss from large multiply charged oligonu-cleotide ions (up to 100-mers), McLafferty and cowork-ers reported a general trend of AH � CH � GH �� TH[18]. Recently, Daneshfar and Klassen measured Arrhe-nius activation parameters (Ea and A) for the loss ofneutral nucleobases (AH, GH, and CH) from a series ofdoubly deprotonated ODN 10-mers of the type XT9,T9X, and T5XT4, where X � A, G, and C, using theblackbody infrared radiative dissociation (BIRD) tech-nique [9]. The kinetics for loss in the temperature rangethey investigated (120–190 °C) indicate that AH andGH are lost at comparable rates while CH is lost about100 times more slowly. These authors suggest that thelack of agreement among the reported trends in base
Figure 1. Oligodeoxynucleotide fragmentation pathways,adapted from McLuckey et al.; B � base � A, G, C, T.
reactivity may be attributed to the structural complexity
and varying internal energy distributions of the differ-ent ODNs.
Consequently, the main issue with ODN fragmentationis the lack of understanding of the factors controlling thepreferences for base loss, both from highly chargedand less highly charged ODNs. To try to lend insightinto these outstanding issues, we chose a set of nonself-complementary nonadeoxyribonucleoside octaphosphates,5=-d(GGTTXTTGG)-3= and 5=-d(CCAAYAACC)-3=, whereX and Y are G, C, A, and T, to study the fragmentationpatterns in detail. These series were chosen because theyare nonself-complementary, have repeating sequences (tosimplify interpretation of fragmentation patterns), andpossess the ability to introduce diversity via the centralbase.
Experimental
ESI-Quadrupole Ion Trap Mass Spectrometer
All ODNs were purchased from Sigma Genosys (TheWoodlands, Texas) and used without further purifica-tion. A final concentration of 12.5 �M each ODN inwater with 20% methanol was directly infused into themass spectrometer. Negative ion ESI-MS spectra wereobtained with the Finnigan LCQ mass spectrometer(San Jose, CA). The spray voltage was �4.0 kV, andcapillary temperature was 175 °C. Collision induceddissociation (CID) was performed in the mass analyzerby varying the resonance excitation amplitude (REA)with a default activation time of 30 ms and a q value of0.25. The REA is defined as a percentage of 5 Vp-p. REAvalues from 6 to 20% in increasing increments of 2%were applied to the parent ion to monitor the fragmen-tation under these low-energy collision conditions.Note that throughout the paper, [M � nH]n� ions arelabeled as “[M]n–” ions to simplify notation. Therefore,an [M � 2H]2� ion is simply noted as an [M]2� ion. Thereason for this is that the ions formed via electrospray,when fragmented, cleave a nucleobase as the initialstep, and the notation “[M � 2H � BH]2�” is cumber-some [8].
Computational Methods
Acidities of the phosphate moiety of the deoxy mono-nucleotides were calculated at the AM1 [19] andB3LYP/3-21 � G* [20] levels using Gaussian 98 andGaussian 03; reported values are deprotonation enthal-pies at 0 K [21]. Proton affinities (PA) of the nucleobasemoiety of the charged and uncharged deoxy mono-nucleotides were calculated at AM1 using Gaussian 98and Gaussian 03; reported values are at 0 K. To mini-mize the possibility of a strong gas-phase internalhydrogen bond forming from a nearby heteroatom toeither the terminal �OH or the phosphate �OHgroups, a methoxy (�OCH3) group was placed at eachof these sites (Figure 2). For the AM1 calculations, an
experimental �Hf° (H�) of 367.2 kcal mol�1 was used to
1855J Am Soc Mass Spectrom 2005, 16, 1853–1865 INITIAL FRAGMENTATION OF OLIGODEOXYNUCLEOTIDES
calculate the acidity and proton affinity at each sitesince AM1 gives a very poor estimate of the heat offormation of H� [22]. Electrostatic potential maps of thedeprotonated nucleobases were calculated at B3LYP/6-31 � G* using Gaussian 03 [21]. Figures were gener-ated with GaussView 3.0 (isodensity setting 0.0004,electrostatic potential range �0.192 a.u.).
Results and Discussion
Full-Scan Mass Spectra
Charge state distribution: overall trends. The first charac-teristic that we explored for the ODN 9-mers 5=-GGT-TXTTGG-3= and 5=-CCAAYAACC-3= (X and Y � A, G,C, or T) was the charge state distribution (Figure 3). Forthe X-series, the �6 charge state comprises, on average,4.3% of the total ion abundance. The �5 charge state ison average much more prevalent than the �6 chargestate, with an average abundance of 27.5%. The �4charge state is present at 37.5%, the �3 at 24.9%, and the�2 at 5.8%. For the Y-series, the corresponding averageabundances are 3.3% (�6), 19.3% (�5), 46.9% (�4),24.0% (�3), and 8.1% (�2). The distribution of chargestates is similar for both the X- and Y-series in a generalsense, in that about 90% of the total ion abundance foreach single strand resides at the �5, �4, and �3 chargestates. The most abundant ions for both the X- and theY-series are at the �4 charge state. In the X-series, the�6 and �5 ions constitute 4.3 and 27.5% of the totalabundance, while in the Y-series, these two states arepresent at only 3.3 and 19.3%. Therefore, apparently theX-series favors, on average, higher charge states thandoes the Y-series.
Charge distribution. Why does the X-series prefer highercharge states? The X-series is rich in guanine andthymine, and prefers higher charge states than does the
Figure 2. Structures of calculated methylate(guanine), C (cytosine), T (thymine).
d mononucleotides; B � base � A (adenine), G
cytosine- and adenine-rich Y-series. Previous experi-
Figure 3. Charge distribution of 9-mer oligonucleotides in fullscan mode; (a) 5=- d(GGTTXTTGG) -3= and (b) 5=- d(C-
CAAYAACC) -3=, where X and Y are G, C, A, and T.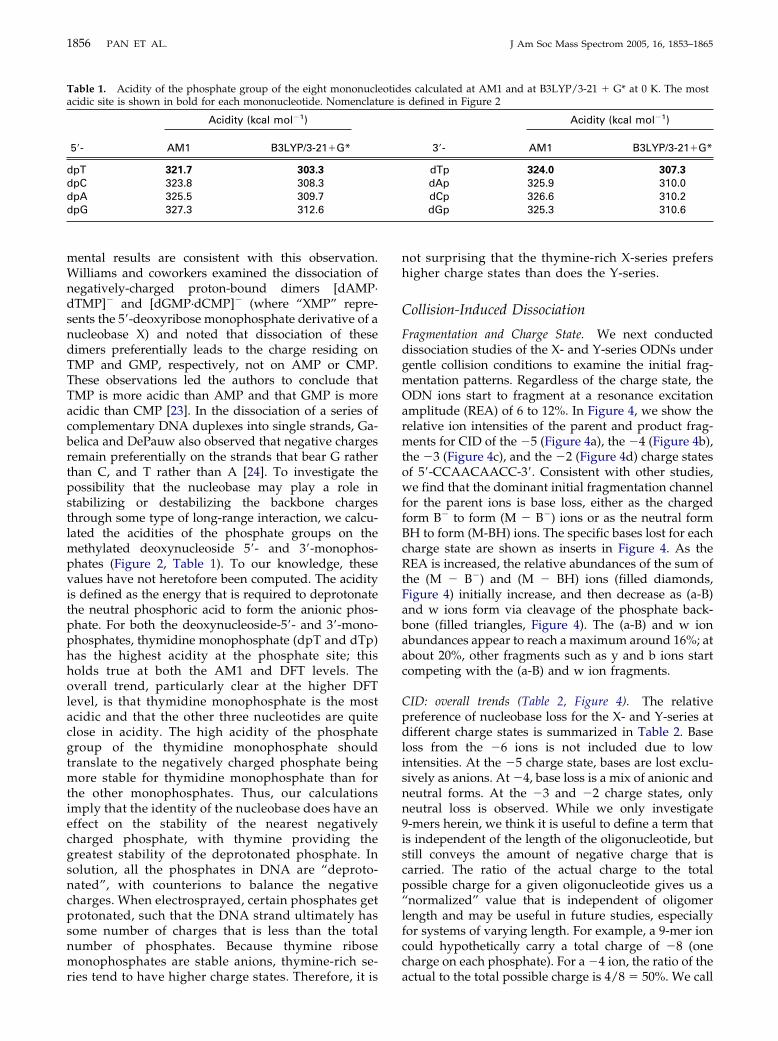
1856 PAN ET AL. J Am Soc Mass Spectrom 2005, 16, 1853–1865
mental results are consistent with this observation.Williams and coworkers examined the dissociation ofnegatively-charged proton-bound dimers [dAMP·dTMP]� and [dGMP·dCMP]� (where “XMP” repre-sents the 5=-deoxyribose monophosphate derivative of anucleobase X) and noted that dissociation of thesedimers preferentially leads to the charge residing onTMP and GMP, respectively, not on AMP or CMP.These observations led the authors to conclude thatTMP is more acidic than AMP and that GMP is moreacidic than CMP [23]. In the dissociation of a series ofcomplementary DNA duplexes into single strands, Ga-belica and DePauw also observed that negative chargesremain preferentially on the strands that bear G ratherthan C, and T rather than A [24]. To investigate thepossibility that the nucleobase may play a role instabilizing or destabilizing the backbone chargesthrough some type of long-range interaction, we calcu-lated the acidities of the phosphate groups on themethylated deoxynucleoside 5=- and 3=-monophos-phates (Figure 2, Table 1). To our knowledge, thesevalues have not heretofore been computed. The acidityis defined as the energy that is required to deprotonatethe neutral phosphoric acid to form the anionic phos-phate. For both the deoxynucleoside-5=- and 3=-mono-phosphates, thymidine monophosphate (dpT and dTp)has the highest acidity at the phosphate site; thisholds true at both the AM1 and DFT levels. Theoverall trend, particularly clear at the higher DFTlevel, is that thymidine monophosphate is the mostacidic and that the other three nucleotides are quiteclose in acidity. The high acidity of the phosphategroup of the thymidine monophosphate shouldtranslate to the negatively charged phosphate beingmore stable for thymidine monophosphate than forthe other monophosphates. Thus, our calculationsimply that the identity of the nucleobase does have aneffect on the stability of the nearest negativelycharged phosphate, with thymine providing thegreatest stability of the deprotonated phosphate. Insolution, all the phosphates in DNA are “deproto-nated”, with counterions to balance the negativecharges. When electrosprayed, certain phosphates getprotonated, such that the DNA strand ultimately hassome number of charges that is less than the totalnumber of phosphates. Because thymine ribosemonophosphates are stable anions, thymine-rich se-
Table 1. Acidity of the phosphate group of the eight mononuclacidic site is shown in bold for each mononucleotide. Nomenclat
Acidity (kcal mol�1)
5=- AM1 B3LYP/3-21�G*
dpT 321.7 303.3
dpC 323.8 308.3dpA 325.5 309.7dpG 327.3 312.6
ries tend to have higher charge states. Therefore, it is
not surprising that the thymine-rich X-series prefershigher charge states than does the Y-series.
Collision-Induced Dissociation
Fragmentation and Charge State. We next conducteddissociation studies of the X- and Y-series ODNs undergentle collision conditions to examine the initial frag-mentation patterns. Regardless of the charge state, theODN ions start to fragment at a resonance excitationamplitude (REA) of 6 to 12%. In Figure 4, we show therelative ion intensities of the parent and product frag-ments for CID of the �5 (Figure 4a), the �4 (Figure 4b),the �3 (Figure 4c), and the �2 (Figure 4d) charge statesof 5=-CCAACAACC-3=. Consistent with other studies,we find that the dominant initial fragmentation channelfor the parent ions is base loss, either as the chargedform B� to form (M � B�) ions or as the neutral formBH to form (M-BH) ions. The specific bases lost for eachcharge state are shown as inserts in Figure 4. As theREA is increased, the relative abundances of the sum ofthe (M � B�) and (M � BH) ions (filled diamonds,Figure 4) initially increase, and then decrease as (a-B)and w ions form via cleavage of the phosphate back-bone (filled triangles, Figure 4). The (a-B) and w ionabundances appear to reach a maximum around 16%; atabout 20%, other fragments such as y and b ions startcompeting with the (a-B) and w ion fragments.
CID: overall trends (Table 2, Figure 4). The relativepreference of nucleobase loss for the X- and Y-series atdifferent charge states is summarized in Table 2. Baseloss from the �6 ions is not included due to lowintensities. At the �5 charge state, bases are lost exclu-sively as anions. At �4, base loss is a mix of anionic andneutral forms. At the �3 and �2 charge states, onlyneutral loss is observed. While we only investigate9-mers herein, we think it is useful to define a term thatis independent of the length of the oligonucleotide, butstill conveys the amount of negative charge that iscarried. The ratio of the actual charge to the totalpossible charge for a given oligonucleotide gives us a“normalized” value that is independent of oligomerlength and may be useful in future studies, especiallyfor systems of varying length. For example, a 9-mer ioncould hypothetically carry a total charge of �8 (onecharge on each phosphate). For a �4 ion, the ratio of the
es calculated at AM1 and at B3LYP/3-21 � G* at 0 K. The mostdefined in Figure 2
Acidity (kcal mol�1)
3=- AM1 B3LYP/3-21�G*
dTp 324.0 307.3
dAp 325.9 310.0dCp 326.6 310.2dGp 325.3 310.6
eotidure is
actual to the total possible charge is 4/8 � 50%. We call
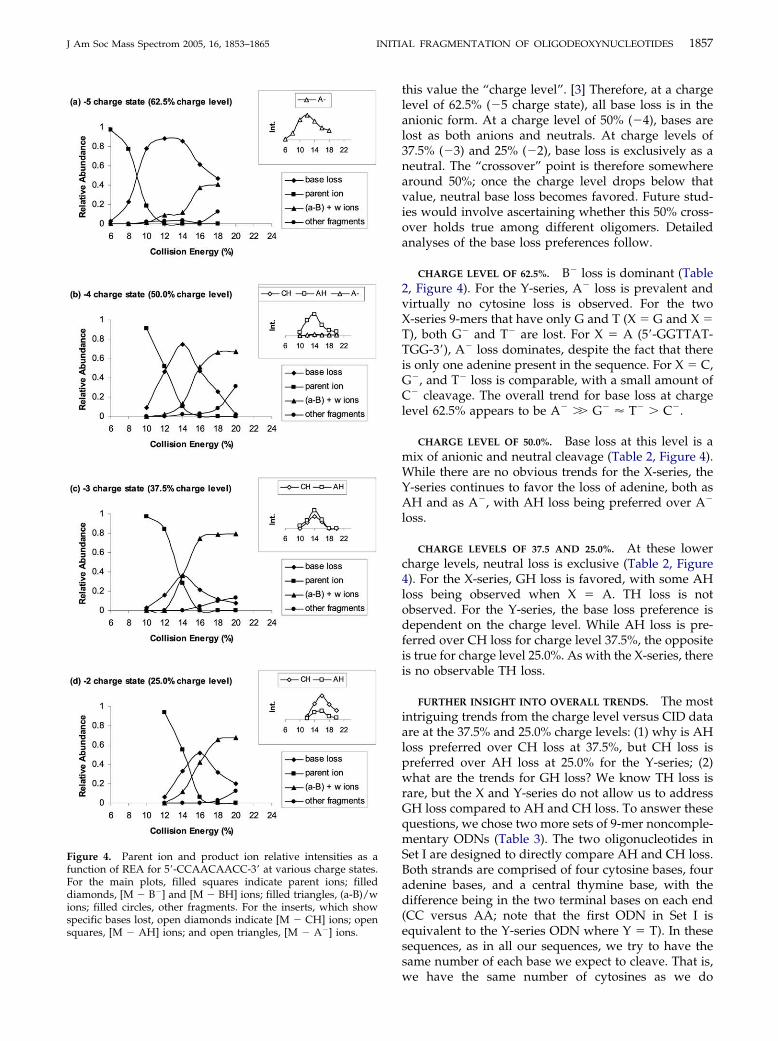
squares, [M � AH] ions; and open triangles, [M � A�] ions.
1857J Am Soc Mass Spectrom 2005, 16, 1853–1865 INITIAL FRAGMENTATION OF OLIGODEOXYNUCLEOTIDES
this value the “charge level”. [3] Therefore, at a chargelevel of 62.5% (�5 charge state), all base loss is in theanionic form. At a charge level of 50% (�4), bases arelost as both anions and neutrals. At charge levels of37.5% (�3) and 25% (�2), base loss is exclusively as aneutral. The “crossover” point is therefore somewherearound 50%; once the charge level drops below thatvalue, neutral base loss becomes favored. Future stud-ies would involve ascertaining whether this 50% cross-over holds true among different oligomers. Detailedanalyses of the base loss preferences follow.
CHARGE LEVEL OF 62.5%. B� loss is dominant (Table2, Figure 4). For the Y-series, A� loss is prevalent andvirtually no cytosine loss is observed. For the twoX-series 9-mers that have only G and T (X � G and X �T), both G� and T� are lost. For X � A (5=-GGTTAT-TGG-3=), A� loss dominates, despite the fact that thereis only one adenine present in the sequence. For X � C,G�, and T� loss is comparable, with a small amount ofC� cleavage. The overall trend for base loss at chargelevel 62.5% appears to be A� �� G� � T� � C�.
CHARGE LEVEL OF 50.0%. Base loss at this level is amix of anionic and neutral cleavage (Table 2, Figure 4).While there are no obvious trends for the X-series, theY-series continues to favor the loss of adenine, both asAH and as A�, with AH loss being preferred over A�
loss.
CHARGE LEVELS OF 37.5 AND 25.0%. At these lowercharge levels, neutral loss is exclusive (Table 2, Figure4). For the X-series, GH loss is favored, with some AHloss being observed when X � A. TH loss is notobserved. For the Y-series, the base loss preference isdependent on the charge level. While AH loss is pre-ferred over CH loss for charge level 37.5%, the oppositeis true for charge level 25.0%. As with the X-series, thereis no observable TH loss.
FURTHER INSIGHT INTO OVERALL TRENDS. The mostintriguing trends from the charge level versus CID dataare at the 37.5% and 25.0% charge levels: (1) why is AHloss preferred over CH loss at 37.5%, but CH loss ispreferred over AH loss at 25.0% for the Y-series; (2)what are the trends for GH loss? We know TH loss israre, but the X and Y-series do not allow us to addressGH loss compared to AH and CH loss. To answer thesequestions, we chose two more sets of 9-mer noncomple-mentary ODNs (Table 3). The two oligonucleotides inSet I are designed to directly compare AH and CH loss.Both strands are comprised of four cytosine bases, fouradenine bases, and a central thymine base, with thedifference being in the two terminal bases on each end(CC versus AA; note that the first ODN in Set I isequivalent to the Y-series ODN where Y � T). In thesesequences, as in all our sequences, we try to have thesame number of each base we expect to cleave. That is,
Figure 4. Parent ion and product ion relative intensities as afunction of REA for 5=-CCAACAACC-3= at various charge states.For the main plots, filled squares indicate parent ions; filleddiamonds, [M � B�] and [M � BH] ions; filled triangles, (a-B)/wions; filled circles, other fragments. For the inserts, which showspecific bases lost, open diamonds indicate [M � CH] ions; open
we have the same number of cytosines as we do

H
1858 PAN ET AL. J Am Soc Mass Spectrom 2005, 16, 1853–1865
adenines, so as not to favor loss of one over the other byhaving more of one present in a given sequence. Thetwo sequences in Set II are for the comparison of AHand GH loss. Both have a T as the central base, with theterminal bases being GG or AA, for a total of fourguanines and four adenines in both sequences. At acharge level of 37.5%, the neutral base loss trend is AH� CH and AH � GH. However, at 25.0%, terminalbases are cleaved preferentially over interior bases,regardless of identity. Thus for Set I, the sequence5=-CCAATAACC-3= shows a CH loss preference, while5=-AACCTCCAA-3= shows an AH loss preference. Set IIfollows the same trend of favoring terminal base cleav-age at charge level 25%.
A direct comparison of the relative reactivity of Cand G was complicated by the fact that C/G-richsequences such as GGCCTCCGG tend to form dimersand interpretation of the CID spectrum is not straight-forward, since a dimer with �4 charge is indistinguish-able from a single strand with �2 charge.
Anionic base loss
ACIDITY ARGUMENTS. It has been proposed that theloss of a nucleobase in its deprotonated form, B�,should be related to the acidity of BH [15]. Presumably,the higher the acidity of BH, the better a leaving groupB� will be, leading to preferential B� loss duringfragmentation. In this study, B� loss follows the trend:A� �� G� � T� � C�, where A� loss is most prevalent.Earlier studies by McLuckey and Beauchamp on differ-ent systems showed a preference of A� � T� � G�, C�,which is roughly in agreement with our results in thatA� is most easily cleaved, and C� is least easily cleaved[1, 15, 16]. Calculations of the acidity of BH at B3LYP/
Table 2. Initial nucleobase loss preferences for the X- and Y-ser
X � G, C, A, and T �5 (62.5%) �4
5=-GGTTGTTGG-3= G� � T� GH �5=-GGTTCTTGG-3= G� � T� � C� CH �
5=-GGTTATTGG-3= A� AH �5=-GGTTTTTGG-3= T� � G� GH �
Y � G, C, A and T �5 (62.5%) �4 (
5=-CCAAGAACC-3= A� A5=-CCAACAACC-3= A� A5=-CCAAAAACC-3= A� A5=-CCAATAACC-3= A� A
Table 3. Initial nucleobase loss preferences for three sets of9-mer single stranded oligonucleotides. Charge level is inparentheses
Sequence �3 (37.5%) �2 (25%)
Set I 5=-CCAATAACC-3= AH�CH CH � AH5=-AACCTCCAA-3= AH�CH AH � CH
Set II 5=-GGAATAAGG-3= AH�GH GH � AH
5=-AAGGTGGAA-3= AH�GH AH � GH6-31 � G** by Zeegers-Huyskens and coworkers indi-cate that TH is the most acidic, with an overall (decreas-ing) acidity order of: TH � GH � AH � CH [25]. Thesecomputational acidity results are not consistent with theobserved B� loss; one would expect the most acidic THto correlate to a highly stable T�, and hence, a strongpreference for T� loss during fragmentation. Instead,A� is preferentially cleaved. The only consistency be-tween the acidity calculations and the experimentallyobserved anionic base loss trends is with cytosine: CH isleast acidic, and C� appears to be cleaved leastfrequently.
The lack of correlation between acidity and cleavabil-ity may arise from the acidity being a thermodynamicproperty, while the ease of base loss is dependent on thebarrier associated with bond cleavage, which is relatedto kinetics. Acidity can therefore give a “feeling” forhow easily an anionic base might cleave, but is not theonly factor. Furthermore, the calculated acidity differ-ence between TH and GH is only 2.3 kcal mol�1; GHand AH differ by only 0.3 kcal mol�1. CH, in contrast, iscalculated to be less acidic than TH by nearly 10 kcalmol�1 [25]. Perhaps the acidities of TH, AH, and GH aretoo close to translate to differences in anionic base loss.
CHARGE DELOCALIZATION ARGUMENTS. Another in-teresting feature is the charge delocalization in the B�
formed via cleavage from the ODN. Greater delocaliza-tion in an anion should translate to greater stability, andtherefore, a preference for cleavage. One way to assessdelocalization in an anion is to “count” the number ofpossible resonance structures (Figure 5). A� has fourpossible resonance structures, while G� and T� haveonly three possible resonance structures, and C� hasonly two possible resonance structures. More resonancestructures would roughly imply greater stability andmay help explain why A� loss is most prevalent (mostresonance structures and most charge delocalization)while C� loss is least favorable (fewest resonance struc-tures and least charge delocalization). To lend furtherinsight into this argument, we calculated the electro-static potentials for the deprotonated nucleobases (Fig-ure 5). The color at each point on these surfaces reflects
DNs. Charge level is in parentheses
.0%) �3 (37.5%) �2 (25.0%)
GH GH� G� GH GH
GH � AH GH � AHGH GH
) �3 (37.5%) �2 (25.0%)
A� AH � CH � GH CH � AH � GHA� AH � CH CH � AH
AH � CH CH � AHAH � CH CH � AH
ies O
(50
G�
GHGHG�
50.0%
H �H �H
the interaction energy between the molecule and a

poten
1859J Am Soc Mass Spectrom 2005, 16, 1853–1865 INITIAL FRAGMENTATION OF OLIGODEOXYNUCLEOTIDES
positive test charge at that point. A red color indicatesattractive potential while blue represents repulsive po-tential. These anions have an attractive potential to apositive test charge, so the overall surface is quite red.The areas of pale red indicate a less “negative” region;yellow/green indicates a more neutral or “positive”region, depending on how bluish the color. For A�, theelectrostatic potential is as we would expect for adelocalized anion; there are areas of pale red aroundN1, N3, N5, and N7, but no one site is particularlybright red, indicating that the negative charge is“spread” throughout the molecule. In contrast, the C�
ion shows a very bright red color in the C2 � O region,indicating that most of the negative charge resides inthat location; that is, the charge is not very delocalized.The T� and G� electrostatic potentials appear “inbetween” those of A� and C�: not as delocalized as A�,but more delocalized than C�. Thus, the electrostaticpotentials indicate, as do the resonance structures, thatA� ion is most delocalized, most stable, and most likelyto be cleaved, while the C� ion is least delocalized, andtherefore least stable and least likely to be cleaved, withT� and G� being in between; these computationalresults are consistent with the anionic base loss trendA� �� G� � T� � C�.
We should also note that the calculated acidities donot track with the stability of the anions as expressed byresonance structures; that is, the anion stability bycharge delocalization arguments is A� � G� � T� � C�
while the acidity trend is, from most to least acidic, TH� GH � AH � CH. One might expect TH, which is
Figure 5. Black and white stick drawings showformed via cleavage from an ODN. The colorsurfaces for each anion. Red indicates negative
most acidic, to translate to T� being most stable, but the
issue here is the reference state. Although TH is moreacidic than GH, comparison of T� to G� may becomplicated by the fact that TH and GH are differentmolecules.
Neutral base loss. For the X-series, since TH is rarelylost, we observe mostly GH loss. The Y-series and theadditional Sets I and II (Table 2, Table 3) are moreintriguing. At a charge level of 37.5% (�3 charge state),BH is lost with the preference order of AH � CH andAH � GH. At a charge level of 25.0% (�2 charge state),the terminal bases are preferentially lost over internalbases. Consequently, our goals are: (1) to rationalize thepreference differences that we see at charge level 37.5versus 25.0%; (2) to examine how the charge affectsfragmentation patterns.
PROTON AFFINITY ARGUMENTS. Just as acidity hasbeen proposed to correlate with B� loss, proton affinity(PA) has been proposed to correlate with neutral base(BH) loss [7, 10, 13, 14, 16]. The more basic B is (that is,the higher its proton affinity), the more likely it is to beprotonated, which should in turn promote BH loss.Examination of the theoretical PA values for the nucleo-bases and their respective nucleosides in the literatureyields an overall trend of C � G � A �� T, where T isleast basic [25–28]. Using the kinetic method with fastatom bombardment mass spectrometry, Sindona andcoworkers determined the PAs for the free nucleobases(G 227.4 � C 225.9 � A 224.2 �� T 209.0 kcal mol�1) andthe corresponding deoxyribose nucleosides (dG 234.4 �
esonance structures for A�, T�, G�, and C� ionsderings show calculated electrostatic potentialtial while blue indicates positive potential.
the rren
dA 233.6 � dC 233.2 �� dT 224.9 kcal mol�1 [29].

1860 PAN ET AL. J Am Soc Mass Spectrom 2005, 16, 1853–1865
Green-Church and Limbach reported PAs for thenucleobase component of the neutral (deoxy)nucleoside5=- and 3=-monophosphates (dpA 237.4 � dpG 237.0 �dpC 236.0 �� dpT 224.1, and dAp 236.4 � dGp 235.5 �dCp 234.8 �� dTp 225.6 kcal mol�1) using the kineticmethod [30]. Roughly speaking, the theoretical andexperimental PA values of thymine are much lowerthan those of the other nucleobases, in agreement withthe fact that the loss of thymine is rarely observed inODN fragmentation under gentle collision conditions[5, 9, 13, 17]. However, the closeness of the PAs of AH,GH, and CH precludes a correlation between the PAvalues and the order of preference for AH, GH, and CHloss.
We next speculated as to whether a nearby nega-tively charged phosphate might change the relative PAordering. While the PAs of the free nucleobases, thecorresponding deoxyribose nucleosides, and the mono-nucleotides where the phosphate moiety is neutral havebeen calculated, to our knowledge there has been nosystematic study of the proton affinity of nucleobasesattached to deprotonated, anionic ribose monophos-phates [29, 30]. In an effort to ascertain whether theproton affinity of a given nucleobase may be influencedby the proximity of a negatively charged phosphate, wecalculated the proton affinity of the nucleobase portionof mononucleotides where the phosphate group is bothprotonated (neutral) and deprotonated (anionic, Table4). To minimize the possibility of a strong gas-phaseinternal hydrogen bond forming from a nearby heteroa-tom to either the terminal �OH or the phosphate �OHgroups, the methoxy (�OCH3) group was placed atthese sites (Figure 2). Each nucleobase has severalpossible protonation sites; we focus on those that havebeen calculated to have the highest proton affinity [25].
Overall, the calculated proton affinities for the mono-nucleotide anions are higher than their neutral counter-parts; that is, PA(dBp�, dpB�) �� PA(dBp, dpB). Anegative charge on a phosphate therefore appears,perhaps not surprisingly, to enhance the proton affinityof the proximally attached nucleobase. In terms of thePA trends, thymine is the least basic, supporting theidea that TH should be cleaved least frequently becauseof its low PA, which we observe experimentally. The
Table 4. Proton affinities of the nucleobase portion of 5=- and3=-neutral and anionic mononucleotides calculated at the AMIlevel. Nomenclature is defined in Figure 2
AM1 calculation (kcal mol�1)
dBp� dpB� dBp dpB
A N1 269.5 278.1 228.0 226.7N3 274.2 301.1 229.3 233.4
G N7 281.2 300.3 234.9 233.2C O2 278.9 289.2 231.0 229.9
N3 282.0 293.6 235.3 233.8T O4 262.1 274.6 215.3 212.8
PAs of G, C, and A are all fairly close in value and do
not correlate with observed preferences for base cleav-age. It would seem that additional factors other than PAcontribute to the ease of nucleobase cleavage [9]. Ourcalculations are still of interest, however, in that wehave found that nearby deprotonated anionic phos-phates enhance the PA of the attached nucleobase. Itmay therefore be possible that proximal negativelycharged phosphates enhance the ease of cleavage of theclosest attached nucleobase [30].
CONSTRUCTING CHARGE LOCATION. In an effort togain insight into the relationship between neutral baseloss and charge level, we conducted further MS/MSstudies of selected ODNs at both the �2 and �3 chargestates [8]. Our goal is to identify initial charge locationson the parent ion by examining all the observed (a-B)and w ions, and their respective charge states. For theY-series, where Y � C, G, or A, the observed (a-B) andw ions are almost identical. Two representative massspectra resulting from low-energy CID of 5=-CCAAAAACC-3= (Y-series, where Y � A) at the �2 and�3 charge states are shown in Figure 6 and Figure 7,with ion assignments and sequence reconstructions.Because (a-B) ions are increasingly sequentially num-bered from the 5= to the 3= end, while the w ions arenumbered from the 3= to 5= end, (an-Bn) and w(9�n) area pair of fragments that result from one cleavage thatwas preceded by Bn loss. Assuming that the negativecharges are not mobile during the CID process andalways reside on the phosphodiester linkages [15], onecan assign the location of each charge on the parent ionif adequate (a-B) and w ions are observed; we did so for[5=-CCAAAAACC’-3=]2� (gray circles on listed se-quence, Figure 6). The process for this assignation isfairly straightforward. For the CID of [5=-CCAAAAACC-3=]2�, the (a8-C8)2�, w8
2�, w72�, and the
complementary (an-Bn)�/w(9�n)� (n � 3 to 7) ions are
observed in the spectra. The appearance of the doublycharged (a8-C8) ion at m/z 1119.8 and the singly charged(a7-A7) ion at m/z 1927.1 would imply that beforefragmentation, there were two charges on the (a8-C8)portion of the parent ion, but only one charge on the(a7-A7) portion. The “missing” charge on the (a7-A7)fragment has only one possible position in the originalparent ion, on the phosphate group between A7 and C8.The presence of the w2
� ion (m/z 595.0) is also consistentwith the charge residing between A7 and C8. Thepresence of the w7
2� ion (m/z 1079.8) and the w6� ion (m/z
1847.0) imply that the second charge resided betweenC2 and A3 on the original parent ion. In addition, thecomplementary (an-Bn)/w(9�n) (n � 3 to 7) pairs are allsingly charged ions, and no other charge states areobserved for these fragments. This also indicates thatthere should be one charge on each end. The CIDspectrum for the [5=-CCAAAAACC-3=]3� ion (chargelevel 37.5%) can be analyzed in the same way to resolvethe original charge locations (insert, Figure 7). Theappearance of w8
3� (m/z 816.2), w72� (m/z 1080.1), and
(a2-C2)� (m/z 386.0) imply that there is one charge

1861J Am Soc Mass Spectrom 2005, 16, 1853–1865 INITIAL FRAGMENTATION OF OLIGODEOXYNUCLEOTIDES
Figure 6. Low-energy CID mass spectrum of the [M]2� ion of d(CCAAAAACC) at 16% REA (0.8 V).
Gray circles indicate reconstructed charge locations.Figure 7. Low-energy CID mass spectrum of the [M]3� ion of d(CCAAAAACC) at 14% REA (0.7 V).
Gray circles indicate reconstructed charge locations.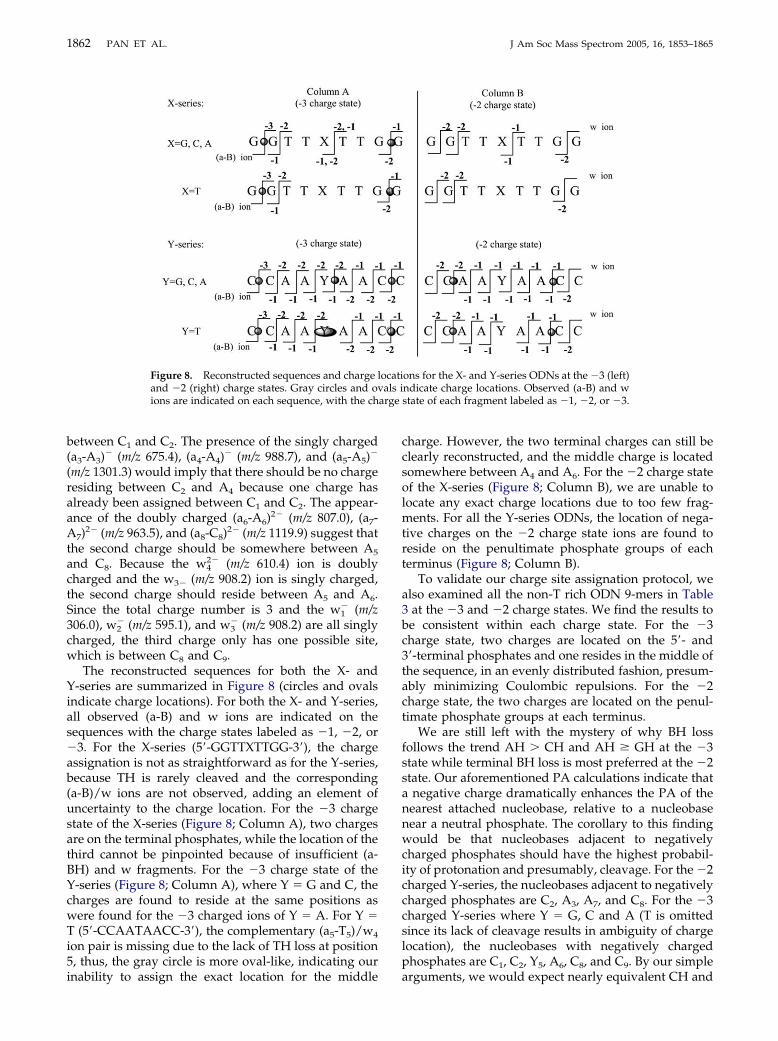
arge
1862 PAN ET AL. J Am Soc Mass Spectrom 2005, 16, 1853–1865
between C1 and C2. The presence of the singly charged(a3-A3)� (m/z 675.4), (a4-A4)� (m/z 988.7), and (a5-A5)�
(m/z 1301.3) would imply that there should be no chargeresiding between C2 and A4 because one charge hasalready been assigned between C1 and C2. The appear-ance of the doubly charged (a6-A6)2� (m/z 807.0), (a7-A7)2� (m/z 963.5), and (a8-C8)2� (m/z 1119.9) suggest thatthe second charge should be somewhere between A5
and C8. Because the w42� (m/z 610.4) ion is doubly
charged and the w3� (m/z 908.2) ion is singly charged,the second charge should reside between A5 and A6.Since the total charge number is 3 and the w1
� (m/z306.0), w2
� (m/z 595.1), and w3� (m/z 908.2) are all singly
charged, the third charge only has one possible site,which is between C8 and C9.
The reconstructed sequences for both the X- andY-series are summarized in Figure 8 (circles and ovalsindicate charge locations). For both the X- and Y-series,all observed (a-B) and w ions are indicated on thesequences with the charge states labeled as �1, �2, or�3. For the X-series (5=-GGTTXTTGG-3=), the chargeassignation is not as straightforward as for the Y-series,because TH is rarely cleaved and the corresponding(a-B)/w ions are not observed, adding an element ofuncertainty to the charge location. For the �3 chargestate of the X-series (Figure 8; Column A), two chargesare on the terminal phosphates, while the location of thethird cannot be pinpointed because of insufficient (a-BH) and w fragments. For the �3 charge state of theY-series (Figure 8; Column A), where Y � G and C, thecharges are found to reside at the same positions aswere found for the �3 charged ions of Y � A. For Y �T (5=-CCAATAACC-3=), the complementary (a5-T5)/w4
ion pair is missing due to the lack of TH loss at position5, thus, the gray circle is more oval-like, indicating our
Figure 8. Reconstructed sequences and charge land �2 (right) charge states. Gray circles and ovions are indicated on each sequence, with the ch
inability to assign the exact location for the middle
charge. However, the two terminal charges can still beclearly reconstructed, and the middle charge is locatedsomewhere between A4 and A6. For the �2 charge stateof the X-series (Figure 8; Column B), we are unable tolocate any exact charge locations due to too few frag-ments. For all the Y-series ODNs, the location of nega-tive charges on the �2 charge state ions are found toreside on the penultimate phosphate groups of eachterminus (Figure 8; Column B).
To validate our charge site assignation protocol, wealso examined all the non-T rich ODN 9-mers in Table3 at the �3 and �2 charge states. We find the results tobe consistent within each charge state. For the �3charge state, two charges are located on the 5=- and3=-terminal phosphates and one resides in the middle ofthe sequence, in an evenly distributed fashion, presum-ably minimizing Coulombic repulsions. For the �2charge state, the two charges are located on the penul-timate phosphate groups at each terminus.
We are still left with the mystery of why BH lossfollows the trend AH � CH and AH � GH at the �3state while terminal BH loss is most preferred at the �2state. Our aforementioned PA calculations indicate thata negative charge dramatically enhances the PA of thenearest attached nucleobase, relative to a nucleobasenear a neutral phosphate. The corollary to this findingwould be that nucleobases adjacent to negativelycharged phosphates should have the highest probabil-ity of protonation and presumably, cleavage. For the �2charged Y-series, the nucleobases adjacent to negativelycharged phosphates are C2, A3, A7, and C8. For the �3charged Y-series where Y � G, C and A (T is omittedsince its lack of cleavage results in ambiguity of chargelocation), the nucleobases with negatively chargedphosphates are C1, C2, Y5, A6, C8, and C9. By our simple
ons for the X- and Y-series ODNs at the �3 (left)ndicate charge locations. Observed (a-B) and wstate of each fragment labeled as �1, �2, or �3.
ocatials i
arguments, we would expect nearly equivalent CH and
1863J Am Soc Mass Spectrom 2005, 16, 1853–1865 INITIAL FRAGMENTATION OF OLIGODEOXYNUCLEOTIDES
AH loss for the �2 state (since an equivalent number ofC’s and A’s are adjacent to a negatively charged phos-phate) and CH-preferred loss for the �3 state (sincemore C’s than A’s are adjacent to a negatively chargedphosphate), yet this is not what we observe. We are leftwith the argument that other factors are at play, mostprobably related to the secondary and tertiary structureof the oligonucleotide ions, as first proposed by Dane-shfar and Klassen [9]. More highly charged ODN anionsare more extended [31], and these conformationalchanges result in different electrostatic and hydrogenbonding interactions between groups along the chain,causing base loss patterns to change. Empirically speak-ing, at the 37.5% charge level (�3 charge state), thetrends are AH � CH and AH � GH. At the 25% chargelevel (�2 charge state), terminal bases are preferentiallycleaved over internal bases.
How do these trends compare with those found inprevious studies? McLafferty and coworkers reported atrend of AH � GH � CH, with no TH loss, from a[5=-AAGTCGGTGCTTG]5� ion (charge level 38.5%)[18]. These results are consistent with our preferences atthe 37.5% charge level: AH�CH and AH � GH. Differ-ent trends for AH, GH, and CH loss were observed bySmith and coworkers from two ODN 12-mers (5=-CAGTTCGAACTG-3= and 5=-GTCAAGCTTGAC-3=) atthe �5, �4, and �3 charge states (charge levels of 45, 36,and 27%, respectively) [17]. At charge level of 45%, AHis the major base lost, consistent with what we see at37.5% charge level. At a charge level of 36%, the trendis AH � CH � GH �� TH, again consistent with ourdata at 37.5%. At charge level of 27%, GH loss is themajor dissociation channel; this is consistent with ourdata at the 25% charge level insofar as G is a terminalbase in Smith’s sequences. Williams and coworkersexamined a series of doubly deprotonated 7-mers (5=-(A)7-3=, 5=-AATTAAT-3=, 5=-TTAATTA-3=, and 5=-CCG-GCCG-3=; charge level 33%) and found that at effectivetemperatures less than 475 K, AH loss dominates overGH and CH loss, which is consistent with our results atthe 37.5% charge level [5].
Our studies focus on oligonucleotides with multiplereactive bases. Two previous experiments focused onsystems with a limited number of reactive bases; that is,by using a thymine-rich sequence, these researchers canstudy specific base loss (since thymine is rarelycleaved). Wan and Gross concluded the propensity forbase loss follows the order GH � CH � AH �� TH byexamining the ease of formation of the (a-BH) ion froma set of doubly deprotonated T-rich 8-mers (5=-TT-TXYTTT-3=, X/Y � G, C, A, or T, charge level 29%) [13].Daneshfar and Klassen also examined a series of thym-ine-rich strands, focusing on the fragmentation of dou-bly charged 10-mers of the sequences XT9, T9X, andT5XT4 (X � G, C, or A, charge level 22%), using BIRD[9]. Over the temperature range Klassen investigated(120 to 190 °C), the kinetics for the loss of AH, GH, andCH follow the trend AH � GH � CH. Comparison of
these two sets of data to ours and earlier results atcomparable charge levels do not show agreement, butwe believe that comparison is complicated by the thy-mine-rich sequences.
In general, we find that for nonthymine-rich se-quences studied both previously and herein, when thecharge level of the parent ODN ion is greater than 33%,AH loss is preferred over GH and CH loss. For chargelevels below 30%, there are not enough data to makegeneralizations; we observe that terminal bases arepreferentially cleaved.
Conclusions
The overall charge state distribution of two series ofdeprotonated ODN 9-mers (5=-GGTTXTTGG-3= and 5=-CCAAYAACC-3=, X/Y � G, C, A, or T) was studied indetail. The distribution of charge states (�2 to �6) issimilar for both the X- and Y-series, with the mostabundant charge state being �4. Apparently, the X-se-ries prefers higher charge states (�6 and �5) than doesthe Y-series. Our calculated acidities of deoxynucleo-side 5=- and 3=-monophosphates indicate that thymidinemonophosphate is the most acidic of the mononucleoti-des, which may account for why the T-rich X-seriestends to bear more charges than does the non T-richY-series.
The fragmentation of these ODN 9-mers at eachcharge state under gentle collision conditions is alsoreported. The “charge level” of the ODN seems to playa significant role in determining the most dominantfragmentation channels. When the charge level of aparent ODN ion is greater than 50%, loss of the nucleo-base as an anion (B�) dominates, with the base losstrend being A� �� G� � T� � C� for all the ODNsequences studied, which is consistent with previousstudies. These preferences in anionic base loss do notcorrelate strictly with the acidity of the correspondingconjugate acid BH; another possible factor dictating thepreferences may be the stability of the nucleobaseanions. This latter hypothesis is supported by resonancestructure arguments as well as electrostatic potentialcalculations.
At charge levels of 37.5 and 25.0%, the bases are lostexclusively as neutrals (BH), with no detectable thy-mine loss. At a charge level of 37.5%, the loss of AH ispreferred over the loss of GH and CH, consistent withearlier data. However, at a charge level of 25.0%,terminal base loss is preferred over that of internalbases. Reconstruction of the ODN sequences from (a-BH) and w ions allows the assignation of charge loca-tions on the parent ODN ions. For the �3 charge state,two charges reside on the terminal bases while the thirdis in the middle. For the �2 charge state, one chargeeach resides on the base penultimate to the terminalsite. We hypothesize that a negatively charged phos-phate enhances loss of a proximal nucleobase by in-creasing the nucleobase’s proton affinity, which is fur-ther supported by our PA calculations. This effect alone,
however, as modeled by a mononucleotide, does not
1864 PAN ET AL. J Am Soc Mass Spectrom 2005, 16, 1853–1865
explain the trends we see: that is, the bases located insequence next to a negatively charged phosphate are notnecessarily preferentially cleaved. However, in longeroligonucleotides, folding could result in negativelycharged phosphates being proximal to nucleobases thatare not nearby in sequence; we therefore conclude thattertiary structure must play a role in influencing baseloss trends. Comparison of our data to previous workshows a consistent trend of AH-preferred loss forcharge levels greater than 33%, given that the sequencesare not thymine-rich. For charge levels less than 30%,there are not enough data to make generalizations; weobserve that terminal bases are preferentially cleaved,regardless of sequence. Future studies will further honethese trends by systematically examining base lossversus charge level. Also, molecular dynamics calcula-tions that will allow us to examine the tertiary structureof these ODNs, to ascertain which nucleobases areproximal to negatively charged phosphates, will aid inthe understanding of the influence of conformation onbase loss.
AcknowledgmentsThe authors thank the National Science Foundation (CHE-0092215), the Alfred P. Sloan Foundation, and the Rutgers BuschGrant Program for support, and the National Center for Super-computing Applications for computational resources. They aregrateful to John Kerrigan and F. Sedinam Amegayibor for helpfuldiscussions.
References1. McLuckey, S. A.; Habibi-Goudarzi, S. Decompositions of
Multiply Charged Oligonucleotide Anions. J. Am. Chem. Soc.1993, 115, 12085–12095.
2. McLuckey, S. A.; Vaidyanathan, G.; Habibi-Goudarzi, S.Charged versus Neutral Nucleobase Loss from MultiplyCharged Oligonucleotide Anions. J. Mass Spectrom. 1995, 30,1222–1229.
3. Bartlett, M. G.; McCloskey, J. A.; Manalili, S.; Griffey, R. H. TheEffect of Backbone Charge on the Collision-Induced Dissoci-ation of Oligonucleotides. J. Mass Spectrom. 1996, 31, 1277–1283.
4. McLuckey, S. A.; Vaidyanathan, G. Charge State Effects in theDecompositions of Single-Nucleobase Oligonucleotide Polya-nions. Int. J. Mass Spectrom. 1997, 162, 1–16.
5. Klassen, J. S.; Schnier, P. D.; Williams, E. R. Blackbody InfraredRadiative Dissociation of Oligonucleotide Anions. J. Am. Soc.Mass Spectrom. 1998, 9, 1117–1124.
6. Nordhoff, E.; Karas, M.; Cramer, R.; Hahner, S.; Hillenkamp,F.; Kirpekar, F.; Lezius, A.; Muth, J.; Meier, C.; Engels, J. W.Direct Mass Spectrometric Sequencing of Low-PicomoleAmounts of Oligodeoxynucleotides with up to 21 Bases byMatrix-Assisted Laser Desorption/Ionization Mass Spectrom-etry. J. Mass Spectrom. 1995, 30, 99–112.
7. Wang, Z.; Wan, K. X.; Ramanathan, R.; Taylor, J. S.; Gross,M. L. Structure and Fragmentation Mechanisms of IsomericT-Rich Oligodeoxynucleotides: A Comparison of Four Tan-dem Mass Spectrometric Methods. J. Am. Soc. Mass Spectrom.1998, 9, 683–691.
8. Favre, A.; Gonnet, F.; Tabet, J.-C.Location of the Negative
Charge(s) on the Backbone of Single-Stranded Deoxyribonu-cleic Acid in the Gas Phase. Eur. J. Mass Spectrom. 2000, 6,389–396.
9. Daneshfar, R.; Klassen, J. S. Arrhenius Activation Parametersfor the Loss of Neutral Nucleobases from Deprotonated Oli-gonucleotide Anions in the Gas Phase. J. Am. Soc. MassSpectrom. 2004, 15, 55–64.
10. Zhu, L.; Parr, G. R.; Fitzgerald, M. C.; Nelson, C. M.; Smith,L. M. Oligodeoxynucleotide Fragmentation in MALDI/TOFMass Spectrometry Using 355-nm Radiation. J. Am. Chem. Soc.1995, 117, 6048–6056.
11. Krause, J.; Scalf, M.; Smith, L. M. High Resolution Character-ization of DNA Fragment Ions Produced by Ultraviolet Ma-trix-Assisted Laser Desorption/Ionization Using Linear andReflecting Time-of-Flight Mass Spectrometry. J. Am. Soc. MassSpectrom. 1999, 10, 423–429.
12. Christian, N. P.; Reilly, J. P.; Mokler, V. R.; Wincott, F. E.;Ellington, A. D. Elucidation of the Initial Step of Oligonucle-otide Fragmentation in Matrix-Assisted Laser Desorption/Ionization Using Modified Nucleic Acids. J. Am. Soc. MassSpectrom. 2001, 12, 744–753.
13. Wan, K. X.; Gross, M. L. Fragmentation Mechanisms ofOligodeoxynucleotides: Effects of Replacing Phosphates withMethylphosphonates and Thymines with Other Bases in T-Rich Sequences. J. Am. Soc. Mass Spectrom. 2001, 12, 580–589.
14. Gross, J.; Hillenkamp, F.; Wan, K. X.; Gross, M. L. MetastableDecay of Negatively Charged Oligodeoxynucleotides Ana-lyzed with Ultraviolet Matrix-Assisted Laser Desorption/Ionization Post-Source Decay and Deuterium Exchange. J. Am.Soc. Mass Spectrom. 2001, 12, 180–192.
15. Rodgers, M. T.; Campbell, S.; Marzluff, E. M.; Beauchamp, J. L.Low-Energy Collision-Induced Dissociation of DeprotonatedDinucleotides: Determination of the Energetically FavoredDissociation Pathways and the Relative Acidities of the Nu-cleic Acid Bases. Int. J. Mass Spectrom. Ion Processes 1994, 137,121–149.
16. Wu, J.; McLuckey, S. A. Gas-Phase Fragmentation of Oligonu-cleotide Ions. Int. J. Mass Spectrom. 2004, 237, 197–241.
17. Luo, H.; Lipton, M. S.; Smith, R. D. Charge Effects forDifferentiation of Oligodeoxynucleotide Isomers Containing8-oxo-dG Residues. J. Am. Soc. Mass Spectrom. 2002, 13, 195–199.
18. Little, D. P.; Aaserud, D. J.; Valaskovic, G. A.; McLafferty,F. W. Sequence Information from 42-108-mer DNAs (Com-plete for a 50-mer) by Tandem Mass Spectrometry. J. Am.Chem. Soc. 1996, 118, 9352–9359.
19. Dewar, M. J.-S.; Zoebisch, E. G.; Healy, E. F.; Stewart, J. J.-P.AM1: A New General Purpose Quantum Mechanical Molec-ular Model. J. Am. Chem. Soc. 1985, 107, 3902–3909.
20. Binkley, J. S.; Pople, J. A.; Hehre, W. J. Self-Consistent Molec-ular Orbital Methods. 21. Small Split-Valence Basis Sets forFirst-Row Elements. J. Am. Chem. Soc. 1980, 102, 939–947.
21. (a) Frisch, M. J.; Trucks, G. W.; Schlegel, H. B.; Scuseria, G. E.;Robb, M. A.; Cheeseman, J. R.; Zakrzewski, V. G.; Montgom-ery, J. A.; Stratmann, R. E.; Burant, J. C.; Dapprich, S.; Millam,J. M.; Daniels, A. D.; Kudin, K. N.; Strain, M. C.; Farkas, O.;Tomasi, J.; Barone, V.; Cossi, M.; Cammi, R.; Mennucci, B.;Pomelli, C.; Adamo, C.; Clifford, S.; Ochterski, J.; Petersson,G. A.; Ayala, P. Y.; Cui, Q.; Morokuma, K.; Malick, D. K.;Rabuck, A. D.; Raghavachari, K.; Foresman, J. B.; Cioslowski,J.; Oritz, J. V.; Stefanov, B. B.; Liu, G.; Lisashenko, A.; Piskorz,O.; Komaromi, I.; Gomperts, R.; Martin, R. L.; Fox, D. J.; Keith,T.; Al-Laham, M. A.; Peng, C. Y.; Nanayakkara, A.; Gonzalez,C.; Challacombe, M.; Grill, P. M. W.; Johnson, B. G.; Chen, W.;Wong, M. W.; Andres, J. L.; Gonzales, C.; Head-Gordon, M.;Replogle, E. S.; Pople, J. A.; Gaussian 98; Gaussian, Inc.:Pittsburgh, PA, 1998. (b) Frisch, M. J.; Trucks, G. W.; Schlegel,
H. B.; Scuseria, G. E.; Robb, M. A.; Cheeseman, J. R.; Mont-
1865J Am Soc Mass Spectrom 2005, 16, 1853–1865 INITIAL FRAGMENTATION OF OLIGODEOXYNUCLEOTIDES
gomery, J. A., Jr.; Vreven, T.; Kudin, K. N.; Burant, J. C.;Millam, J. M.; Iyengar, S. S.; Tomasi, J.; Barone, V.; Mennucci,B.; Cossi, M.; Scalmani, G.; Rega, N.; Petersson, G. A.;Nakatsuji, H.; Hada, M.; Ehara, M.; Toyota, K.; Fukuda, R.;Hasegawa, J.; Ishida, M.; Nakajima, T.; Honda, Y.; Kitao. O.;Nakai, H.; Klene, M.; Li, X.; Knox, J. E.; Hratchian, H. P.; Cross,J. B.; Bakken, V.; Adamo, C.; Jaramillo, J.; Gomperts, R.;Stratmann, R. E.; Yazyev, O.; Austin, A. J.; Cammi, R.; Pomelli,C.; Ochterski, J. W.; Ayala, P. Y.; Morokuma, K.; Voth, G. A.;Salvador, P.; Dannenberg, J. J.; Zakrzewski, V. G.; Dapprich,S.; Daniels, A. D.; Strain, M. C.; Farkas, O.; Malick, D. K.;Rabuck, A. D.; Raghavachari, K.; Foresman, J. B.; Ortiz, J. V.;Cui, Q.; Baboul, A. G.; Clifford, S.; Cioslowski, J.; Stefanov,B. B.; Liu, G.; Liashenko, A.; Piskorz, P.; Komaromi, I.; Martin,R. L.; Fox, D. J.; Keith, T.; Al-Laham, M. A.; Peng, C. Y.;Nanayakkara, A.; Challacombe, M.; Gill, P. M. W.; Johnson, B.;Chen, W.; Wong, M. W.; Gonzalez, C.; Pople, J. A. Gaussian 03;Gaussian, Inc.: Wallingford, CT, 2004; (c) Breneman, C. M.;Wiberg, K. B. Determining Atom-Centered Monopoles fromMolecular Electrostatic Potentials. The Need for HighSampling Density in Formamide Conformational Analysis.J. Comput. Chem. 1990, 11, 361–373.
22. (a) Dewar, M. J.-S.; Dieter, K. M. Evaluation of AM1 Calcu-lated Proton Affinities and Deprotonation Enthalpies. J. Am.Chem. Soc. 1986, 108, 8075–8086; (b) NIST Chemistry WebBook,NIST Standard Reference Database Number 69, March 2003;Mallard, W. G.; Linstrom, P. J., Eds.; National Institute ofStandards and Technology: Gaithersburg, MD 20899, 2003;Vol. http://webbook.nist.gov
23. (a) Strittmatter, E. F.; Schnier, P. D.; Klassen, J. S.; Williams,E. R. Dissociation Energies of Deoxyribose Nucleotide DimerAnions Measured Using Blackbody Infrared Radiative Disso-ciation. J. Am. Soc. Mass Spectrom. 1999, 10, 1095–1104; (b)Schnier, P. D.; Klassen, J. S.; Strittmatter, E. F.; Williams, E. R.Activation Energies for Dissociation of Double Strand Oligo-nucleotide Anions: Evidence for Watson-Crick Base Pairing in
Vacuo. J. Am. Chem. Soc. 1998, 120, 9605–9613.24. Gabelica, V.; DePauw, E. Collision-Induced Dissociation of16-mer DNA Duplexes with Various Sequences: Evidence forConservation of the Double Helix Conformation in the GasPhase. Int. J. Mass Spectrom. 2002, 219, 151–159.
25. Chandra, A. K.; Nguyen, M. T.; Uchimaru, T.; Zeegers-Huyskens, T. Protonation and Deprotonation Enthalpies of Gua-nine and Adenine and Implications for the Structure and Energyof Their Complexes with Water: Comparison with Uracil, Thy-mine, and Cytosine. J. Phys. Chem. A 1999, 103, 8853–8860.
26. Del Bene, J. E. Molecular Orbital Study of the Protonation ofDNA Bases. J. Phys. Chem. 1983, 87, 367–371.
27. Russo, N.; Toscano, M.; Grand, A.; Jolibois, F. Protonationof Thymine, Cytosine, Adenine, and Guanine DNA NucleicAcid Bases: Theoretical Investigation into the Frameworkof Density Functional Theory. J. Comput. Chem. 1998, 19,989 –1000.
28. Podolyan, Y.; Gorb, L.; Leszczynski, J. Protonation of NucleicAcid Bases. A Comprehensive Post-Hartree-Fock Study of theEnergetics and Proton Affinities. J. Phys. Chem. A 2000, 104,7346–7352.
29. Greco, F.; Liguori, A.; Sindona, G.; Uccella, N. Gas-PhaseProton Affinity of Deoxyribonucleosides and Related Nucleo-bases by Fast Atom Bombardment Tandem Mass Spectrome-try. J. Am. Chem. Soc. 1990, 112, 9092–9096.
30. (a) Green-Church, K. B.; Limbach, P. A. MononucleotideGas-Phase Proton Affinities as Determined by the KineticMethod. J. Am. Soc. Mass Spectrom. 2000, 11, 24–32; (b) Habibi-Goudarzi, S.; McLuckey, S. A. Ion Trap Collisional Activationof the Deprotonated Deoxymononucleoside and Deoxy-dinucleoside Monophosphates. J. Am. Soc. Mass Spectrom.1995, 6, 102–113.
31. (a) Hoaglund, C. S.; Liu, Y.; Ellington, A. D.; Pagel, M.;Clemmer, D. E. Gas-Phase DNA: Oligothymidine Ion Con-formers. J. Am. Chem. Soc. 1997, 119, 9051–9052; (b) Moradian,A.; Scalf, M.; Westphall, M. S.; Smith, L. M.; Douglas, D. J.Collision Cross Sections of Gas Phase DNA Ions. Int. J. Mass
Spectrom. 2002, 219, 161–170.