SIMULTANEOUS DETECTION OF TYPE A AND TYPE B TRICHOTHECENES IN CEREALS BY LIQUID CHROMATOGRAPHY...
7
Journal of Chromatography A, 1054 (2004) 389–395 Simultaneous detection of type A and type B trichothecenes in cereals by liquid chromatography–electrospray ionization mass spectrometry using NaCl as cationization agent C. Dall’Asta, S. Sforza, G. Galaverna, A. Dossena, R. Marchelli ∗ Department of Organic and Industrial Chemistry, University of Parma, Parco Area delle Scienze 17/A, I-43100 Parma, Italy Available online 11 September 2004 Abstract A LC/MS method for the simultaneous determination of both type A and type B trichothecenes by using an electrospray ionization (ESI) interface in the positive ionization mode with a single quadrupole analyzer is described. In order to enhance the ionization of both groups of trichothecenes, the sodium ion was used as cationization agent by adding sodium chloride to the eluent. All LC/MS parameters were optimized. The newly developed LC/ESI-MS method was applied to the analysis of a wheat reference material and cereal-based foods and feeds. © 2004 Elsevier B.V. All rights reserved. Keywords: Trichothecenes; Cationization 1. Introduction Trichothecenes constitute the largest group of Fusarium mycotoxins. Although the number of trichothecenes identi- fied is large (over 170), only few of them have been detected so far in naturally contaminated cereals and commodities, mainly belonging to type A or type B trichothecenes [1]. Both are tetracyclic sesquiterpenes and both are character- ized by the presence of a double bond at C-9,10, a vari- able number of hydroxy and acetoxy groups and an epoxy- ring at C-12,13: consequently, they are classified as 12,13- epoxy-trichothecenes. Type A trichothecenes have a satu- rated carbon at C-8, eventually functionalized with an O- alkanoyl group and include T-2 and HT-2 toxins, neosolaniol (NEO) and diacetoxyscirpenol (DAS). Type B trichothecenes are characterised by a carbonyl group at C-8 and include, among others, deoxynivalenol (DON), nivalenol (NIV) and their derivatives. The general structures of trichothecenes A and B are reported in Fig. 1. ∗ Corresponding author. Tel.: +39 0521 905410; fax: +39 0521 905472. E-mail address: [email protected] (R. Marchelli). Type A and type B trichothecenes exhibit acute toxic- ity, causing vomiting and feed refusal; moreover type B tri- chothecenes are implicated in more chronic toxicoses, re- sulting in extensive haemorrhage, a general inflammatory re- sponse and haematological toxicities. They also inhibit both the protein synthesis and the mitochondrial function in vitro and in vivo and show immunosuppressing effects at low con- centrations. In particular, DAS exposure caused suppression in the macrophage phagocytic function [2–4]. In European agricultural commodities type A tri- chothecenes usually occur less frequently and at lower con- centrations than DON, the most diffuse contaminant. The simultaneous occurrence of DON with other Fusarium my- cotoxins, mainly type B trichothecenes and zearalenone, has been reported for a variety of agricultural commodities [5]. A world-wide survey of DON, NIV and zearalenone, on 500 agricultural samples from 19 countries, reported that 40–50% of the samples were positive to these mycotoxins with an av- erage concentrations of 292 ng/g DON, 267 ng/g NIV and 45 ng/g zearalenone. In particular, DON was found in maize (69%), followed by mixed feed (65%) and wheat (60%) [6]. Despite the high toxicity and the great diffusion of tri- chothecenes, few countries have established legal regulations 0021-9673/$ – see front matter © 2004 Elsevier B.V. All rights reserved. doi:10.1016/j.chroma.2004.07.081
Transcript of SIMULTANEOUS DETECTION OF TYPE A AND TYPE B TRICHOTHECENES IN CEREALS BY LIQUID CHROMATOGRAPHY...
Journal of Chromatography A, 1054 (2004) 389–395
Simultaneous detection of type A and type B trichothecenes in cereals byliquid chromatography–electrospray ionization mass spectrometry
using NaCl as cationization agent
C. Dall’Asta, S. Sforza, G. Galaverna, A. Dossena, R. Marchelli∗
Department of Organic and Industrial Chemistry, University of Parma, Parco Area delle Scienze 17/A, I-43100 Parma, Italy
Available online 11 September 2004
Abstract
A LC/MS method for the simultaneous determination of both type A and type B trichothecenes by using an electrospray ionization (ESI)interface in the positive ionization mode with a single quadrupole analyzer is described. In order to enhance the ionization of both groupsof trichothecenes, the sodium ion was used as cationization agent by adding sodium chloride to the eluent. All LC/MS parameters wereoptimized. The newly developed LC/ESI-MS method was applied to the analysis of a wheat reference material and cereal-based foods andf©
K
1
mfismBiarera(aata
xic-tri-, re-
ry re-bothitrocon-ssion
tri-con-The
, has
0050%n av-andaize
0d
eeds.2004 Elsevier B.V. All rights reserved.
eywords: Trichothecenes; Cationization
. Introduction
Trichothecenes constitute the largest group ofFusariumycotoxins. Although the number of trichothecenes identi-
ed is large (over 170), only few of them have been detectedo far in naturally contaminated cereals and commodities,ainly belonging to type A or type B trichothecenes[1].oth are tetracyclic sesquiterpenes and both are character-
zed by the presence of a double bond at C-9,10, a vari-ble number of hydroxy and acetoxy groups and an epoxy-ing at C-12,13: consequently, they are classified as 12,13-poxy-trichothecenes. Type A trichothecenes have a satu-ated carbon at C-8, eventually functionalized with anO-lkanoyl group and include T-2 and HT-2 toxins, neosolaniolNEO) and diacetoxyscirpenol (DAS). Type B trichothecenesre characterised by a carbonyl group at C-8 and include,mong others, deoxynivalenol (DON), nivalenol (NIV) and
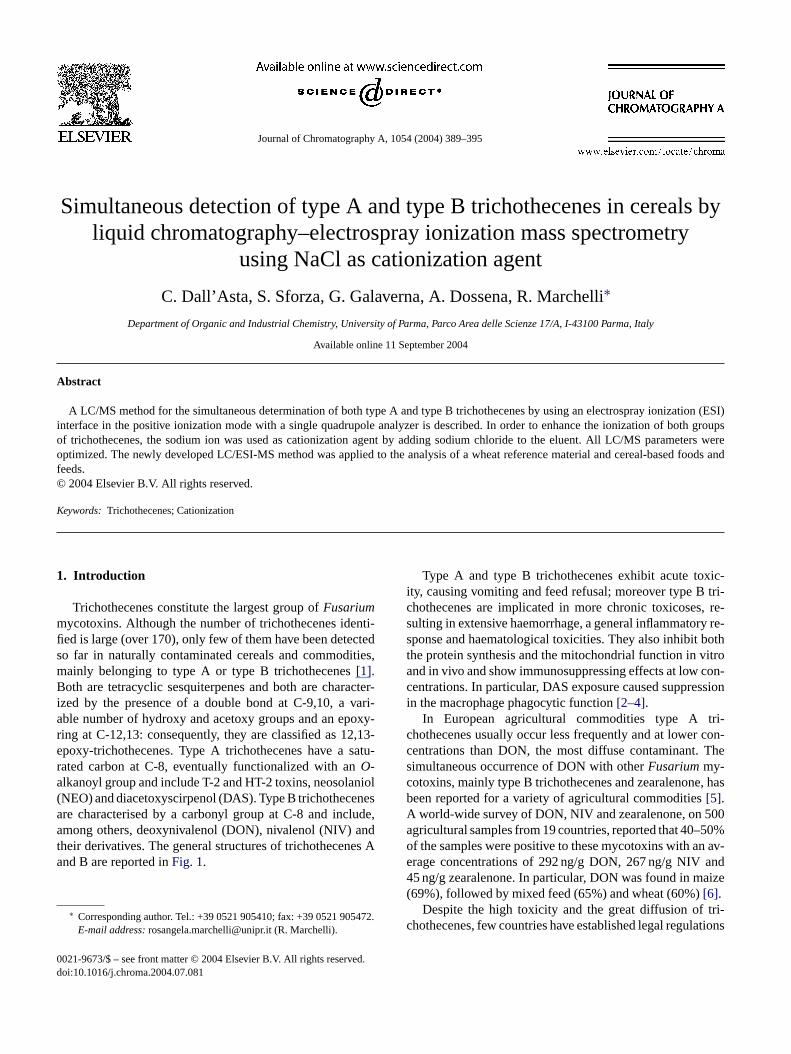
heir derivatives. The general structures of trichothecenes And B are reported inFig. 1.
Type A and type B trichothecenes exhibit acute toity, causing vomiting and feed refusal; moreover type Bchothecenes are implicated in more chronic toxicosessulting in extensive haemorrhage, a general inflammatosponse and haematological toxicities. They also inhibitthe protein synthesis and the mitochondrial function in vand in vivo and show immunosuppressing effects at lowcentrations. In particular, DAS exposure caused supprein the macrophage phagocytic function[2–4].
In European agricultural commodities type Achothecenes usually occur less frequently and at lowercentrations than DON, the most diffuse contaminant.simultaneous occurrence of DON with otherFusariummy-cotoxins, mainly type B trichothecenes and zearalenonebeen reported for a variety of agricultural commodities[5].A world-wide survey of DON, NIV and zearalenone, on 5agricultural samples from 19 countries, reported that 40–of the samples were positive to these mycotoxins with aerage concentrations of 292 ng/g DON, 267 ng/g NIV45 ng/g zearalenone. In particular, DON was found in m(69%), followed by mixed feed (65%) and wheat (60%)[6].
∗ Corresponding author. Tel.: +39 0521 905410; fax: +39 0521 905472.E-mail address:[email protected] (R. Marchelli).
Despite the high toxicity and the great diffusion of tri-chothecenes, few countries have established legal regulations
021-9673/$ – see front matter © 2004 Elsevier B.V. All rights reserved.
oi:10.1016/j.chroma.2004.07.081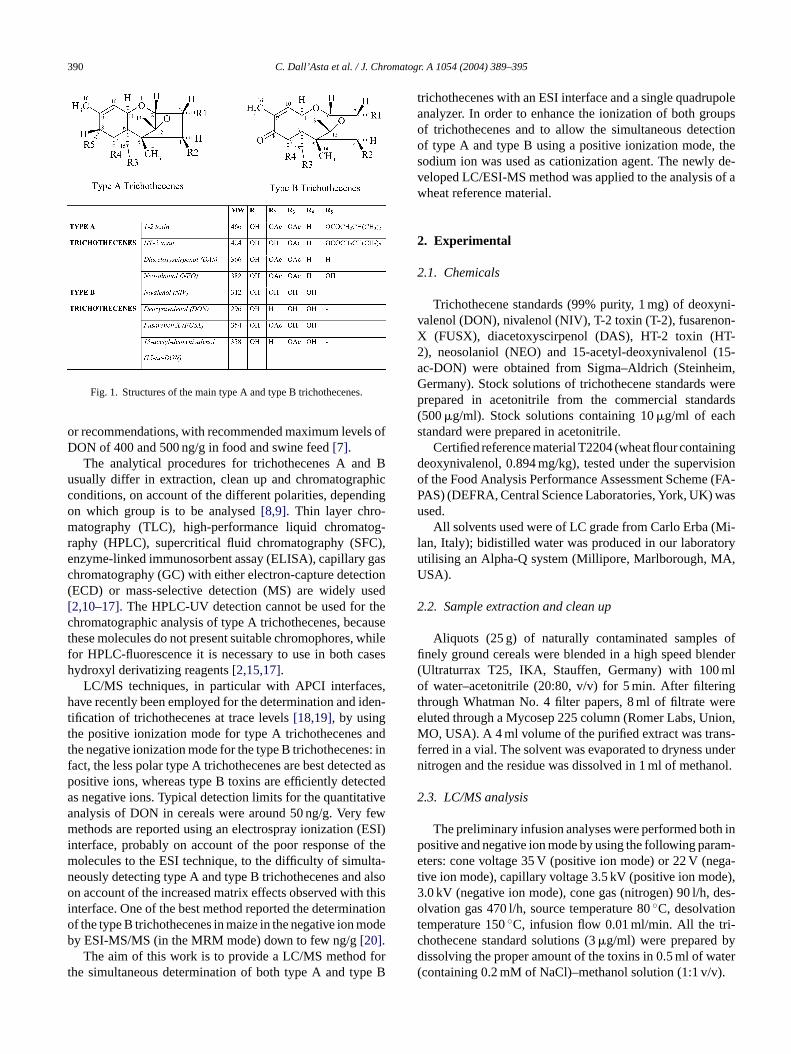
390 C. Dall’Asta et al. / J. Chromatogr. A 1054 (2004) 389–395
Fig. 1. Structures of the main type A and type B trichothecenes.
or recommendations, with recommended maximum levels ofDON of 400 and 500 ng/g in food and swine feed[7].
The analytical procedures for trichothecenes A and Busually differ in extraction, clean up and chromatographicconditions, on account of the different polarities, dependingon which group is to be analysed[8,9]. Thin layer chro-matography (TLC), high-performance liquid chromatog-raphy (HPLC), supercritical fluid chromatography (SFC),enzyme-linked immunosorbent assay (ELISA), capillary gaschromatography (GC) with either electron-capture detection(ECD) or mass-selective detection (MS) are widely used[2,10–17]. The HPLC-UV detection cannot be used for thechromatographic analysis of type A trichothecenes, becausethese molecules do not present suitable chromophores, whilefor HPLC-fluorescence it is necessary to use in both caseshydroxyl derivatizing reagents[2,15,17].
LC/MS techniques, in particular with APCI interfaces,have recently been employed for the determination and iden-tification of trichothecenes at trace levels[18,19], by usingthe positive ionization mode for type A trichothecenes andthe negative ionization mode for the type B trichothecenes: infact, the less polar type A trichothecenes are best detected aspositive ions, whereas type B toxins are efficiently detectedas negative ions. Typical detection limits for the quantitativeanalysis of DON in cereals were around 50 ng/g. Very fewm (ESI)i f them lta-n alsoo thisi ationo odeb
fort e B
trichothecenes with an ESI interface and a single quadrupoleanalyzer. In order to enhance the ionization of both groupsof trichothecenes and to allow the simultaneous detectionof type A and type B using a positive ionization mode, thesodium ion was used as cationization agent. The newly de-veloped LC/ESI-MS method was applied to the analysis of awheat reference material.
2. Experimental
2.1. Chemicals
Trichothecene standards (99% purity, 1 mg) of deoxyni-valenol (DON), nivalenol (NIV), T-2 toxin (T-2), fusarenon-X (FUSX), diacetoxyscirpenol (DAS), HT-2 toxin (HT-2), neosolaniol (NEO) and 15-acetyl-deoxynivalenol (15-ac-DON) were obtained from Sigma–Aldrich (Steinheim,Germany). Stock solutions of trichothecene standards wereprepared in acetonitrile from the commercial standards(500�g/ml). Stock solutions containing 10�g/ml of eachstandard were prepared in acetonitrile.
Certified reference material T2204 (wheat flour containingdeoxynivalenol, 0.894 mg/kg), tested under the supervisionof the Food Analysis Performance Assessment Scheme (FA-P asu
Mi-l oryu A,U
2
offi nder( mlo gt eree ion,M ns-f ndern nol.
2
th inp am-e ga-t e),3 des-ot -c yd ater( ).
ethods are reported using an electrospray ionizationnterface, probably on account of the poor response o
olecules to the ESI technique, to the difficulty of simueously detecting type A and type B trichothecenes andn account of the increased matrix effects observed with
nterface. One of the best method reported the determinf the type B trichothecenes in maize in the negative ion my ESI-MS/MS (in the MRM mode) down to few ng/g[20].
The aim of this work is to provide a LC/MS methodhe simultaneous determination of both type A and typ
AS) (DEFRA, Central Science Laboratories, York, UK) wsed.
All solvents used were of LC grade from Carlo Erba (an, Italy); bidistilled water was produced in our laborattilising an Alpha-Q system (Millipore, Marlborough, MSA).
.2. Sample extraction and clean up
Aliquots (25 g) of naturally contaminated samplesnely ground cereals were blended in a high speed bleUltraturrax T25, IKA, Stauffen, Germany) with 100f water–acetonitrile (20:80, v/v) for 5 min. After filterin
hrough Whatman No. 4 filter papers, 8 ml of filtrate wluted through a Mycosep 225 column (Romer Labs, UnO, USA). A 4 ml volume of the purified extract was tra
erred in a vial. The solvent was evaporated to dryness uitrogen and the residue was dissolved in 1 ml of metha
.3. LC/MS analysis
The preliminary infusion analyses were performed boositive and negative ion mode by using the following parters: cone voltage 35 V (positive ion mode) or 22 V (ne
ive ion mode), capillary voltage 3.5 kV (positive ion mod.0 kV (negative ion mode), cone gas (nitrogen) 90 l/h,lvation gas 470 l/h, source temperature 80◦C, desolvation
emperature 150◦C, infusion flow 0.01 ml/min. All the trihothecene standard solutions (3�g/ml) were prepared bissolving the proper amount of the toxins in 0.5 ml of wcontaining 0.2 mM of NaCl)–methanol solution (1:1 v/v

C. Dall’Asta et al. / J. Chromatogr. A 1054 (2004) 389–395 391
The LC/MS system consisted of a 2695 Alliance (Wa-ters co., Milford, MA, USA) equipped with a ZMD singlequadrupole mass spectrometer with an electrospray source(Micromass, Manchester, UK).
The mobile phase consisted of a binary eluent(H2O:CH3OH 35:65, v/v) added with NaCl 0.1 mM. The col-umn was a narrowbore C18 Spherisorb S3 ODS-2 (250 mm×2.1 mm, 3�m) and the flow rate was 0.2 ml/min. Ninety-fivepercent of the column flow was splitted by a T-tube beforethe ESI probe: this value was fixed by using peek tubes ofdifferent length inserted in the waste side of the T-tube con-nected to the ESI probe and measuring in the different casesthe splitted volume, until a constant split ratio of 95:5 wasreached. The column temperature was set at 35◦C and theinjection volume was 5�l.
The electrospray probe was used in the positive ion mode.The voltage settings used for the LC/MS analyses were thefollowing: cone voltage 30 V, capillary voltage 3.5 kV, conegas (nitrogen) 100 l/h, desolvation gas 450 l/h, source temper-ature 100◦C, desolvation temperature 150◦C. The sodiatedmolecular ions were monitored in the single ion recording(SIR) mode.
The linearity range was tested in the range100–5000 ng/ml by injection of standards at nine con-centration levels (three determinations at each concentrationl n thea t six
F(
concentration levels (three determination at each level wereperformed).
The detection limits (LOD) were calculated at a signal-to-noise ratio of 3:1 and were determined by spiking blankwheat samples with proper amounts of each analyte.
3. Results and discussion
3.1. Preliminary infusion ESI-MS experiments
According to the literature data, the best detection of typeA trichothecenes was usually obtained using a positive ion-ization mode[19], whereas the determination of the type Btrichothecenes was usually performed in a negative ion mode[18]. The difference is probably due to the ability of the lat-ter toxins to efficiently delocalize a negative charge due toenolate formation.
Preliminary infusion experiments were done on four typeA (NEO, DAS, T-2 and HT-2) and four type B trichothecenes(DON, 15-ac-DON, FUSX, NIV) both in positive andnegative ionization mode, by dissolving the molecules inwater–methanol mixtures. It was actually observed that typeA trichothecenes and the type B 15-acetyl-DON showed ahigh tendency to cationization when observed in the positivei + +m
evel were performed). Calibration curves were based onalysis of spiked trichothecene-free wheat samples a
ig. 2. Mass spectra of DON obtained in the presence (1b and 2b) and in the2a and 2b) ionization modes. In the high right corner of each chromatogram
on mode, forming adducts with Naand K ions. In theass spectra of these trichothecenes, the [MNa]+ and the
absence (1a and 2a) of 0.1 mM NaCl, using both positive (1a and 1b) and negativethe intensity of the highest peak is reported.
392 C. Dall’Asta et al. / J. Chromatogr. A 1054 (2004) 389–395
Fig. 3. Chromatogram of a standard mixture of trichothecenes with the molecular mass of the sodiated molecular ions monitored (concentration of eachtrichothecene: 3�g/ml) (column: Spherisorb S3 ODS 2 narrowbore, 250 mm× 2.1 mm; eluent: H2O–CH3OH 35:65 + 0.1 mM NaCl; flow: 0.2 ml/min).
[MK] + ions were usually more abundant than the molecularions [MH]+. The other type B trichothecenes, on the otherside, showed indeed poor response in positive polarity andwere best detected as negative ions. Therefore, on account ofthe differences observed, the simultaneous detection of bothtype A and type B trichothecenes in the positive ion modewas not feasible. Moreover, also for type A trichothecenes,the intensity of [MNa]+ and [MK]+ adducts was not veryreproducible, so the LC/MS analysis based on these ions waslacking of precision.
In order to allow a simultaneous detection of type A andtype B trichothecenes using the most sensitive positive ion-ization mode and to control the formation of the adducts,we decided to use NaCl as additive to the solvent in or-der to assist the positive ionization. The mass spectra ofthe four type A (NEO, DAS, T-2 and HT-2) and of thefour type B trichothecenes (DON, 15-ac-DON, FUSX, NIV)were recorded in the absence and in the presence of NaCl0.1 mM.
After the addition of NaCl, the spectra of type A tri-chothecenes showed a gain in sensitivity and the disappear-ance of any peak other than the [MNa]+ adduct. More-over, also with type B trichothecenes, the addition of NaClwas very effective: the presence of the [MNa]+ adduct re-ally improved the ESI+ detection, whereas the simultane-
ous presence of a very high [MCl]− adduct in ESI− spec-tra could be used as a qualitative control for the identifica-tion of the compounds. The ESI+ and ESI− mass spectraobtained for DON (the most diffuse type B trichothecene)in the presence or in the absence of NaCl are reported inFig. 2.
Also LiCl was assayed as cationization agent, but it wasfound to be slightly less effective than NaCl. In order to al-low the quantitative determination of the analytes using NaClas additive, it was necessary to found the optimal ioniza-tion parameters ensuring the stability of the observed sodiumadducts. Preliminary infusion experiments were performedusing a solution of each toxin in CH3OH:H2O 1:1 added ofan equal volume of a water solution of NaCl 0.2 mM. Threeparameters (desolvation temperature, capillary and cone volt-ages) were investigated and every parameter was optimisedfor the analysis. The desolvation temperature was changedfrom 80 to 300◦C; the capillary voltage range was inves-tigated from 2.2 to 5 kV, whereas for the cone voltage therange of investigation was 20–180 V. All sodium adductswere shown to be very stable in nearly all conditions, asit was expected, being sodiated adducts less susceptible tofragmentation than the protonated counterparts. In the caseof DON, as example, the sodiated molecular ion was alwaysthe only peak observed in the spectrum at increasing cone
C. Dall’Asta et al. / J. Chromatogr. A 1054 (2004) 389–395 393
Table 1Linear calibration parameters obtained for each toxin (Concentration levels:100, 250, 400, 800, 1000, 2000 ng/g added to a toxin-free wheat sample)
Retention time (min) Slope Intercept r2
NIV 4.5 2.1× 10³ 3.7× 10³ 0.98DON 5.6 1.4× 10³ 2.7× 10³ 0.98FUSX 6.3 1.3× 10³ 2.4× 10³ 0.97NEO 6.5 2.8× 10³ 5.3× 10³ 0.9915-ac-DON 7.9 2.9× 10³ 3.3× 10³ 0.99DAS 8.9 5.9× 10³ 6.5× 10³ 0.99HT-2 10.4 3.9× 10³ 2.2× 10³ 0.99T-2 11.9 3.0× 10³ 4.1× 10³ 0.99
Chromatographic conditions: C18 Spherisorb S3 ODS-2 narrowbore column(250 mm× 2.1 mm, 3�m); H2O:CH3OH 35:65 + NaCl 0.1 mM mobilephase, flow: 0.2 ml/min.
voltages from 30 to 100 V, although with different intensity.The optimised conditions for the ionization are reported inSection 2.
3.2. LC/ESI-MS analysis
The ability of NaCl to assist the positive ionization of theanalytes was used to develop a LC/ESI-MS method for thesimultaneous detection of type A and type B trichothecenes.A Spherisorb S3 ODS2 (2.1 mm× 250 mm, 3�m) narrow-bore column and a water–methanol (35:65, v/v) mobile phasewere used in the isocratic mode. The eluent was modified byaddition of 0.1 mM NaCl with the ionization parameters pre-viously established.
Under the conditions applied, a good separation of the fourtype A trichothecenes (NEO, DAS, T2, HT2) and of the fourtype B trichothecenes (DON, NIV, FUSX and 15-ac-DON)was obtained as shown inFig. 3.
F terial (F he sodim
Table 2Limits of detection of type A and type B trichothecenes (calculated as S/N= 3 in spiked wheat samples)
LOD (ng/g)
Type A NEO 20DAS 20T-2 50HT-2 20
Type B DON 45NIV 5015-ac-DON 20FUSX 40
The linearity was tested in the concentration rangebetween 100 and 5000 ng/ml, using a standard solu-tion of the eight trichothecenes: all the analytes showedgood regressions (r2 > 0.98) and the standard calibra-tion was reproducible. Calibration curves were obtainedby addition of the proper amount of each toxin to ablank wheat sample (six concentration levels: 100 ng/g–250 ng/g–400 ng/g–800 ng/g–1000 ng/g–2000 ng/g). Thecalibration parameters obtained for every trichothecene arereported inTable 1.
The detection limits (LOD, S/N = 3/1) obtained for all theanalytes are reported inTable 2.
The limits are, in all cases, similar to those obtained byLC/APCI-MS analysis[2,17,18]. The repeatability of themethod was obtained by injection of a standard mixture atthree concentration levels (each injection was performed intriplicate): the method showed a good precision with a vari-ation coefficient of 5%.
It should be underlined that, by applying this method,a qualitative confirmation was also possible for type B
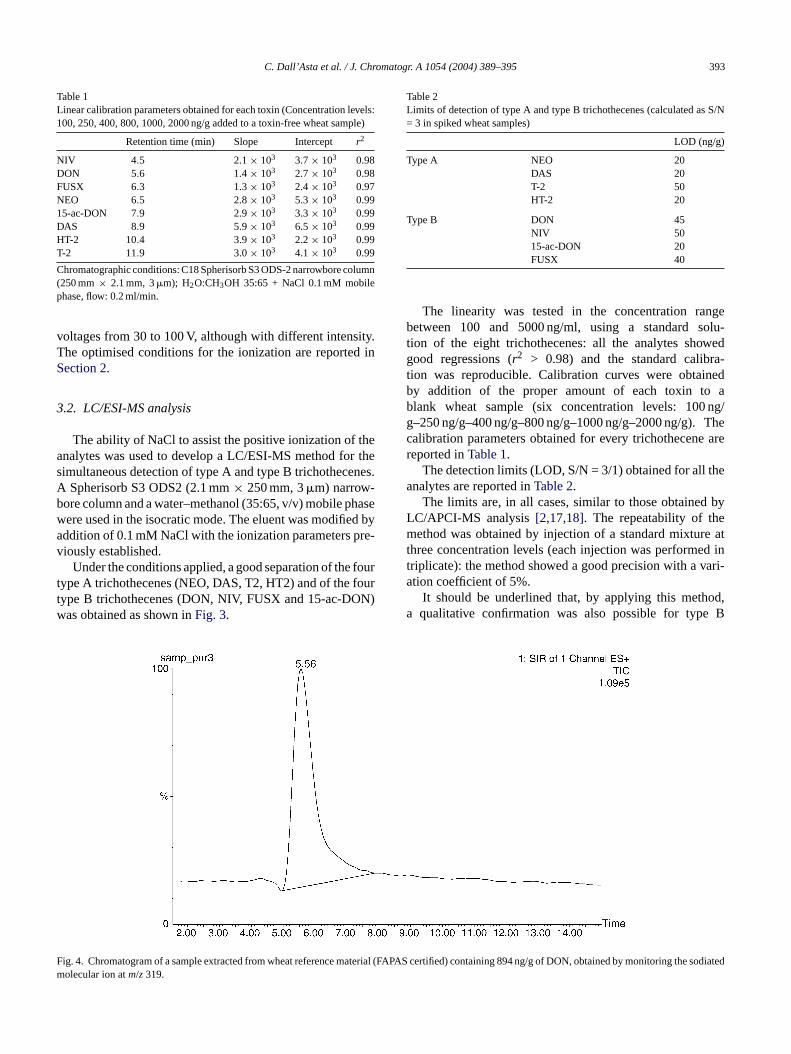
ig. 4. Chromatogram of a sample extracted from wheat reference maolecular ion atm/z 319.
APAS certified) containing 894 ng/g of DON, obtained by monitoring tated
394C
.Da
ll’Asta
eta
l./J.Ch
rom
atog
r.A1
05
4(2
00
4)
3
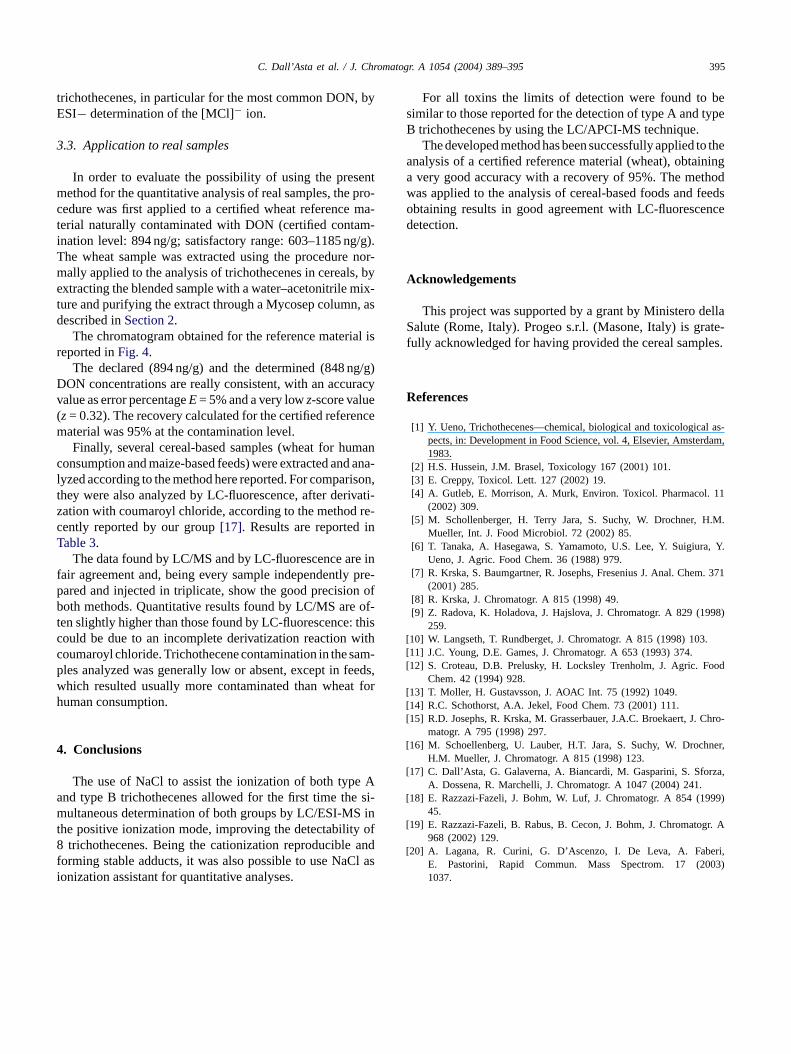
Table 3Quantitative data on trichothecenes (given in ng/g) obtained by LC/MS (and LC-fluorescence)
DON 15-ac-DONb NIV FUSX DAS T-2 HT-2 NEO
Wheat A <100a (40± 1) n.d. n.d. n.d. n.d. n.d. n.d. n.d.Wheat B n.d. n.d. <100a (70± 3) n.d. <100a (75± 3) n.d. n.d. n.d.Wheat C n.d. n.d. 189± 1 (150± 4) n.d. n.d. n.d. n.d. n.d.Wheat D 125± 2 (100± 3) n.d. n.d. n.d. <100a (95± 2) <100a (30± 4) n.d. n.d.Wheat E <100a (50± 2) n.d. n.d. n.d. n.d. 233± 1 (200± 5) n.d. n.d.Wheat F <100a(80± 3) n.d. n.d. <100a (75± 5) n.d. n.d. n.d. n.d.Wheat G n.d. n.d. n.d. n.d. n.d. n.d. n.d. n.d.Wheat H n.d. n.d. n.d. n.d. 180± 4 (130± 4) n.d. n.d. n.d.Wheat I n.d. n.d. n.d. n.d. n.d. n.d. n.d. n.d.Wheat J 355± 2 (320± 8) n.d. n.d. n.d. n.d. n.d. n.d. n.d.Wheat K n.d. <100ab (n.d.)b 110± 1 (150± 6) n.d. n.d. n.d. n.d. n.d.Wheat L <100a (20± 4) n.d. n.d. n.d. n.d. n.d. n.d. n.d.Wheat M n.d. n.d. n.d. n.d. n.d. n.d. n.d. n.d.Wheat N n.d. n.d. n.d. 210± 1 (210± 6) n.d. n.d. n.d. n.d.
Maize feed A n.d. n.d. n.d. n.d. 847± 5 (830± 5) n.d. n.d. n.d.Maize feed B 314± 2 (300± 6) 184± 6b (85± 3)b 251± 2 (250± 4) 229± 1 (250± 2) n.d. 160± 2 (150± 6) n.d. n.d.Maize feed C 568± 1 (560± 6) n.d. 320± 2 (300± 2) 311± 1 (300± 7) n.d. n.d. 178± 2 (150± 4) n.d.Maize feed D n.d. n.d. n.d. n.d. 376± 1 (380± 6) 389± 1 (360± 6) 200± 2 (230± 4) n.d.Maize feed E <100a (55± 3) n.d. n.d.Maize feed F 289± 2 (250± 6) 231± 4b (98± 4)b n.d.Maize feed G n.d. n.d. n.d.
For comparison, the quantitative results by LC-fluorescence (obtained acca Calibration curves were calculated starting from 100 ng/g.b The discrepancies are due to the fact that the LC/MS method did not al
allows to separately quantify the two acetylated derivatives.
89
–3
95
n.d. n.d. 256± 1 (240± 9) n.d. n.d.n.d. n.d. n.d. n.d. n.d.
n.d. n.d. 234± 2 (259± 2) 319± 2 (310± 8) n.d.
ording to ref.[17]) are also reported among parentheses (in ng/g). Every sample was prepared in triplicate (n.d. = not detected).
low the separation of 15-ac-DON from 3-ac-DON, which were then detected and quantified together, while the LC-fluorescence method
C. Dall’Asta et al. / J. Chromatogr. A 1054 (2004) 389–395 395
trichothecenes, in particular for the most common DON, byESI− determination of the [MCl]− ion.
3.3. Application to real samples
In order to evaluate the possibility of using the presentmethod for the quantitative analysis of real samples, the pro-cedure was first applied to a certified wheat reference ma-terial naturally contaminated with DON (certified contam-ination level: 894 ng/g; satisfactory range: 603–1185 ng/g).The wheat sample was extracted using the procedure nor-mally applied to the analysis of trichothecenes in cereals, byextracting the blended sample with a water–acetonitrile mix-ture and purifying the extract through a Mycosep column, asdescribed inSection 2.
The chromatogram obtained for the reference material isreported inFig. 4.
The declared (894 ng/g) and the determined (848 ng/g)DON concentrations are really consistent, with an accuracyvalue as error percentageE= 5% and a very lowz-score value(z= 0.32). The recovery calculated for the certified referencematerial was 95% at the contamination level.
Finally, several cereal-based samples (wheat for humanconsumption and maize-based feeds) were extracted and ana-lyzed according to the method here reported. For comparison,t ivati-z re-c inT
e inf pre-p n ofb of-t thisc withc am-p eds,w t forh
4
e Aa si-m S int of8 andf Cl asi
For all toxins the limits of detection were found to besimilar to those reported for the detection of type A and typeB trichothecenes by using the LC/APCI-MS technique.
The developed method has been successfully applied to theanalysis of a certified reference material (wheat), obtaininga very good accuracy with a recovery of 95%. The methodwas applied to the analysis of cereal-based foods and feedsobtaining results in good agreement with LC-fluorescencedetection.
Acknowledgements
This project was supported by a grant by Ministero dellaSalute (Rome, Italy). Progeo s.r.l. (Masone, Italy) is grate-fully acknowledged for having provided the cereal samples.
References
[1] Y. Ueno, Trichothecenes—chemical, biological and toxicological as-pects, in: Development in Food Science, vol. 4, Elsevier, Amsterdam,1983.
[2] H.S. Hussein, J.M. Brasel, Toxicology 167 (2001) 101.[3] E. Creppy, Toxicol. Lett. 127 (2002) 19.[4] A. Gutleb, E. Morrison, A. Murk, Environ. Toxicol. Pharmacol. 11
.M.
a, Y.
. 371
998)
[ .[[ ood
[[[ Chro-
[ ner,
[ rza,
[ 99)
[ gr. A
[ eri,003)
hey were also analyzed by LC-fluorescence, after deration with coumaroyl chloride, according to the methodently reported by our group[17]. Results are reportedable 3.
The data found by LC/MS and by LC-fluorescence arair agreement and, being every sample independentlyared and injected in triplicate, show the good precisiooth methods. Quantitative results found by LC/MS are
en slightly higher than those found by LC-fluorescence:ould be due to an incomplete derivatization reactionoumaroyl chloride. Trichothecene contamination in the sles analyzed was generally low or absent, except in fehich resulted usually more contaminated than wheauman consumption.
. Conclusions
The use of NaCl to assist the ionization of both typnd type B trichothecenes allowed for the first time theultaneous determination of both groups by LC/ESI-M
he positive ionization mode, improving the detectabilitytrichothecenes. Being the cationization reproducible
orming stable adducts, it was also possible to use Naonization assistant for quantitative analyses.
(2002) 309.[5] M. Schollenberger, H. Terry Jara, S. Suchy, W. Drochner, H
Mueller, Int. J. Food Microbiol. 72 (2002) 85.[6] T. Tanaka, A. Hasegawa, S. Yamamoto, U.S. Lee, Y. Suigiur
Ueno, J. Agric. Food Chem. 36 (1988) 979.[7] R. Krska, S. Baumgartner, R. Josephs, Fresenius J. Anal. Chem
(2001) 285.[8] R. Krska, J. Chromatogr. A 815 (1998) 49.[9] Z. Radova, K. Holadova, J. Hajslova, J. Chromatogr. A 829 (1
259.10] W. Langseth, T. Rundberget, J. Chromatogr. A 815 (1998) 10311] J.C. Young, D.E. Games, J. Chromatogr. A 653 (1993) 374.12] S. Croteau, D.B. Prelusky, H. Locksley Trenholm, J. Agric. F
Chem. 42 (1994) 928.13] T. Moller, H. Gustavsson, J. AOAC Int. 75 (1992) 1049.14] R.C. Schothorst, A.A. Jekel, Food Chem. 73 (2001) 111.15] R.D. Josephs, R. Krska, M. Grasserbauer, J.A.C. Broekaert, J.
matogr. A 795 (1998) 297.16] M. Schoellenberg, U. Lauber, H.T. Jara, S. Suchy, W. Droch
H.M. Mueller, J. Chromatogr. A 815 (1998) 123.17] C. Dall’Asta, G. Galaverna, A. Biancardi, M. Gasparini, S. Sfo
A. Dossena, R. Marchelli, J. Chromatogr. A 1047 (2004) 241.18] E. Razzazi-Fazeli, J. Bohm, W. Luf, J. Chromatogr. A 854 (19
45.19] E. Razzazi-Fazeli, B. Rabus, B. Cecon, J. Bohm, J. Chromato
968 (2002) 129.20] A. Lagana, R. Curini, G. D’Ascenzo, I. De Leva, A. Fab
E. Pastorini, Rapid Commun. Mass Spectrom. 17 (21037.