New simple efficient algorithms computing powers and runs in strings
Upload
arborresearchCategory
view
0download
0
Technical Notes
Enhanced Characterization of Complex ProteomicSamples Using LC-MALDI MS/MS: Exclusion ofRedundant Peptides from MS/MS Analysis inReplicate Runs
Hsuan-shen Chen, Tomas Rejtar, Victor Andreev, Eugene Moskovets, and Barry L. Karger*
Barnett Institute and Department of Chemistry and Chemical Biology, Northeastern University, 341 Mugar,360 Huntington Avenue, Boston, Massachusetts 02115
Due to the complexity of proteome samples, only a portionof peptides and thus proteins can be identified in a singleLC-MS/MS analysis in current shotgun proteomics meth-odologies. It has been shown that replicate runs can beused to improve the comprehensiveness of the proteomeanalysis; however, high-intensity peptides tend to beanalyzed repeatedly in different runs, thus reducing thechance of identifying low-intensity peptides. In contrastto commonly used online ESI-MS, offline MALDI de-couples the separation from MS acquisition, thus allowingin-depth selection for specific precursor ions. Accordingly,we extended a strategy for offline LC-MALDI MS/MSanalysis using a precursor ion exclusion list consisting ofall identified peptides in preceding runs. The exclusionlist eliminated redundant MS/MS acquisitions in subse-quent runs, thus reducing MALDI sample depletion andallowing identification of a larger number of peptideidentifications in the cumulative dataset. In the analysisof the digest of an Escherichia coli lysate, the exclusionlist strategy resulted in a 25% increase in the number ofunique peptide identifications in the second run, incontrast to simply pooling MS/MS data from two replicateruns. To reduce the increased LC analysis time for repeatruns, a four-column multiplexed LC system was devel-oped to carry out separation simultaneously. The multi-plexed LC-MALDI MS provides a high-throughput plat-form to utilize the exclusion list strategy in proteomeanalysis.
High performance liquid chromatography (HPLC) coupledwith tandem mass spectrometry (MS/MS) has been widely usedin shotgun proteomics to identify and quantitate peptides and,thus, proteins.1 Such analyses can be employed in profilingbiological states of cells and organelles as well as in applications
in biomarker discovery.2,3 However, due to the great complexityof the proteome, comprehensive analysis to characterize allcomponents is still not possible with present methodologies.
Currently, electrospray ionization (ESI) is generally used tocouple LC separation to mass spectrometry in proteomics applica-tions due to the high sensitivity and complete automation of ESI-MS instruments available.4,5 In LC-ESI MS analysis, MS/MSacquisitions are triggered by “data-dependent analysis” of the mostintense peaks in the MS spectrum. As a result, only a few MS/MS spectra can be acquired in one data-dependent analysis cycle;however, due to the complexity of proteomic samples, coeleutionof peptides is prevalent with LC separation. If the number ofcoeluting peptides exceeds the number of MS/MS spectra thatcan be acquired in one data-dependent analysis cycle, low-intensitypeptides will not undergo MS/MS analysis. Dynamic exclusionis generally applied in LC-ESI MS/MS analysis to mitigate thisproblem.
New advances in MS instrumentation, such as the linear iontrap, have shown the ability to acquire more MS/MS spectra inone data-dependent analysis cycle, thus improving the capabilityto analyze coeluting peptides; however, even with dynamicexclusion and new instrumentation, LC-ESI MS still has intrinsiclimitations when analyzing very complex samples, due to the finitetime that eluting peaks are available for online MS/MS acquisi-tions. In addition, MS/MS acquisitions can be triggered atpositions off the apex of the peak, resulting in a loss in sensitivityand, thus, peptide identifications. Redundant MS/MS acquisitionsalso occur due to multiple charged states of peptides. Theseintrinsic limitations result in a significantly less than completenumber of peptide identifications in a single ESI LC-MS/MSanalysis of a complex sample.
* Corresponding author. Phone: (617) 373-2867. Fax: (617) 373-2855.E-mail: [email protected].(1) McCormack, A. L.; Schieltz, D. M.; Goode, B.; Yang, S.; Barnes, G.; Drubin,
D.; Yates, J. R., 3rd. Anal. Chem. 1997, 69, 767-776.
(2) McDonald, W. H.; Yates, J. R., 3rd. Dis Markers 2002, 18, 99-105.(3) Pan, S.; Zhang, H.; Rush, J.; Eng, J.; Zhang, N.; Patterson, D.; Comb, M. J.;
Aebersold, R. Mol. Cell. Proteomics 2005, 4, 182-190.(4) Wolters, D. A.; Washburn, M. P.; Yates, J. R., 3rd. Anal. Chem. 2001, 73,
5683-5690.(5) Link, A. J.; Eng, J.; Schieltz, D. M.; Carmack, E.; Mize, G. J.; Morris, D. R.;
Garvik, B. M.; Yates, J. R., 3rd. Nat. Biotechnol. 1999, 17, 676-682.
Anal. Chem. 2005, 77, 7816-7825
7816 Analytical Chemistry, Vol. 77, No. 23, December 1, 2005 10.1021/ac050956y CCC: $30.25 © 2005 American Chemical SocietyPublished on Web 10/22/2005

To improve the comprehensiveness of proteome analysis,several groups have used replicate LC-MS runs.6,7 In one study,it was demonstrated that the total number of protein identificationsincreased by 70% when accumulating data from nine repeated LC/LC/MS/MS experiments using an LCQ Deca XP ion trapinstrument.8 However, the redundancy of protein identificationsfrom run to run was found to be high, reflecting the fact that thesampling process in LC-ESI MS analysis favors the identificationsof high abundance proteins. Recently, it has been demonstratedthat this protein redundancy can be reduced using a precursorexclusion list strategy (extended dynamic exclusion) in therepeated runs, resulting in an increase in the number of identifiedproteins.9
One obvious drawback of replicate experiments is the pro-longed analysis time. Using a multicolumn separation system toperform multiple LC-ESI MS analyses in parallel could greatlyincrease the throughput. The commercially available MUX systemcouples four separation columns to MS by switching the ESIinterface between columns and sharing MS instrumental time;10
however, the column switching in the MUX system discards aportion of the separations, which can result in a loss in peptideidentifications. To perform MS/MS analysis, coupling of multipleESI interfaces requires multiple mass analyzers (such as microion-trap array11,12) in a multiplexed LC-ESI MS system, which isstill under development.
MALDI provides an alternative approach to coupling LCseparations to mass spectrometry. Various interfaces have beendeveloped for both online and off-line coupling of LC to MALDIMS.13-22 The off-line MALDI interfaces allow eluents from the LCcolumn to be deposited and archived on the MALDI target prior
to MS and MS/MS analysis. The decoupling of separation andMS analysis removes time constraints on MS/MS acquisition,permitting a more detailed strategy for selecting precursor ionsfor MS/MS analysis.3,23,24 Moreover, peptide ions in MALDI arepredominately singly charged ions, thus resulting in less complexMS spectra than that in ESI MS. MS/MS spectra can be acquiredwith optimum sensitivity at the maximum of the chromatographicpeak, and redundant acquisitions can be minimized. In addition,off-line coupling also allows parallel separations to be carried outsimultaneously and subsequently analyzed using a single massspectrometer.25
In this paper, we have adopted and extended the precursorexclusion list strategy used for LC-ESI MS9 and applied it to LC-MALDI MS. Our strategy utilizes a precursor exclusion list frompeptides identified with high confidence in repeat LC-MS/MSruns, thus minimizing redundant MS/MS acquisitions and, as willbe shown, thus facilitating analysis of low-intensity peptides.Importantly, only precursors of positively identified peptides wereexcluded from subsequent MS/MS acquisitions, allowing reanaly-sis of peptides with marginal scores. Furthermore, additional MS/MS spectra of precursors that could not be analyzed in the firstrun due to sample depletion could occur. In this strategy,multiplexed LC-MALDI MS provides a high-throughput platformto analyze complex proteomes. A tryptic digest of an Escherichiacoli cell lysate was used as a model sample to illustrate theadvantages of this new strategy. The results demonstrate that theapproach offers the potential to increase the number of proteinidentifications in LC-MALDI MS analysis by 25% compared tosimply pooling the results from repeat runs.
EXPERIMENTAL SECTIONChemicals. Acetonitrile, acetone, trifluoroacetic acid (TFA),
ammonium citrate, ammonium bicarbonate, dithiothreitol (DTT),iodoacetamide, and R-cyano-4-hydroxycinnamic acid (CHCA) werepurchased from Sigma (St. Louis, MO). The CHCA matrix wasrecrystallized before use. Sequencing-grade trypsin was obtainedfrom Promega (Madison, WI).
Sample Preparation. E. coli strain HM22 was grown in richmedium [Luria-Bertani (LB) broth supplemented with diami-nopimelic acid (75 µg/mL)]. The overnight culture was diluted1000-fold in 200 mL of fresh media, and the bacteria wereincubated with aeration at 37 °C for 3 h to a density of ∼108 cfu/mL. After 3 h of growth, the bacteria were harvested by coolingon ice for 5 min and centrifugation at 5000g, 4 °C, for 10 min.After removal of the supernatant, cells from 25 mL of culture werequickly resuspended in 1 mL of lysis buffer (50 mM Tris HCl,1.6% (w/v) SDS, 4% (v/v) mercaptoethanol, pH 7.4) and heatedfor 4 min at 90 °C. The lysate was centrifuged in a tabletopcentrifuge at room temperature and 10000g, for 10 min. Thesupernatant was carefully removed to a clean tube, and the proteinconcentration was measured by the Bradford assay. It should be
(6) Lipton, M. S.; Pasa-Tolic, L.; Anderson, G. A.; Anderson, D. J.; Auberry, D.L.; Battista, J. R.; Daly, M. J.; Fredrickson, J.; Hixson, K. K.; Kostandarithes,H.; Masselon, C.; Markillie, L. M.; Moore, R. J.; Romine, M. F.; Shen, Y.;Stritmatter, E.; Tolic, N.; Udseth, H. R.; Venkateswaran, A.; Wong, K. K.;Zhao, R.; Smith, R. D. Proc. Natl. Acad. Sci. U.S.A. 2002, 99, 11049-11054.
(7) Wu, C. C.; MacCoss, M. J.; Howell, K. E.; Yates, J. R., 3rd. Nat. Biotechnol.2003, 21, 532-538.
(8) Liu, H.; Sadygov, R. G.; Yates, J. R., 3rd. Anal. Chem. 2004, 76, 4193-4201.
(9) Hui, J. P. M.; Tessier, S.; Butler, H.; Badger, J.; Kearney, P.; Carrier, A.;Thibault, P. Proceedings of the 51st ASMS Conference on Mass Spectrometryand Allied Topics, Montreal, Canada, June 8-12 2003.
(10) Morrison, D.; Davies, A. E.; Watt, A. P. Anal. Chem. 2002, 74, 1896-1902.
(11) Misharin, A. S.; Laughlin, B. C.; Vilkov, A.; Takats, Z.; Ouyang, Z.; Cooks,R. G. Anal. Chem. 2005, 77, 459-470.
(12) Tabert, A. M.; Griep-Raming, J.; Guymon, A. J.; Cooks, R. G. Anal. Chem.2003, 75, 5656-5664.
(13) Miliotis, T.; Kjellstrom, S.; Nilsson, J.; Laurell, T.; Edholm, L. E.; Marko-Varga, G. J. Mass Spectrom. 2000, 35, 369-377.
(14) Preisler, J.; Hu, P.; Rejtar, T.; Karger, B. L. Anal. Chem. 2000, 72, 4785-4795.
(15) Rejtar, T.; Hu, P.; Juhasz, P.; Campbell, J. M.; Vestal, M. L.; Preisler, J.;Karger, B. L. J. Proteome Res. 2002, 1, 171-179.
(16) Wall, D. B.; Berger, S. J.; Finch, J. W.; Cohen, S. A.; Richardson, K.;Chapman, R.; Drabble, D.; Brown, J.; Gostick, D. Electrophoresis 2002,23, 3193-3204.
(17) Preisler, J.; Hu, P.; Rejtar, T.; Moskovets, E.; Karger, B. L. Anal. Chem.2002, 74, 17-25.
(18) Ericson, C.; Phung, Q. T.; Horn, D. M.; Peters, E. C.; Fitchett, J. R.; Ficarro,S. B.; Salomon, A. R.; Brill, L. M.; Brock, A. Anal. Chem. 2003, 75, 2309-2315.
(19) Tegeler, T. J.; Mechref, Y.; Boraas, K.; Reilly, J. P.; Novotny, M. V. Anal.Chem. 2004, 76, 6698-6706.
(20) Zhang, B.; McDonald, C.; Li, L. Anal. Chem. 2004, 76, 992-1001.(21) Chen, H. S.; Rejtar, T.; Andreev, V.; Moskovets, E.; Karger, B. L. Anal.
Chem. 2005, 77, 2323-2331.
(22) Chen, V. C.; Cheng, K.; Ens, W.; Standing, K. G.; Nagy, J. I.; Perreault, H.Anal. Chem. 2004, 76, 1189-1196.
(23) Andreev, V. P.; Rejtar, T.; Chen, H. S.; Moskovets, E. V.; Ivanov, A. R.;Karger, B. L. Anal. Chem. 2003, 75, 6314-6326.
(24) Andreev, V.; Chen, H.-S.; Rejtar, T.; Moskovets, E.; Karger, B. L. Proceedingsof the 52nd ASMS Conference on Mass Spectrometry and Allied Topics,Nashville, TN, May 23-27 2004.
(25) Lee, H.; Griffin, T. J.; Gygi, S. P.; Rist, B.; Aebersold, R. Anal. Chem. 2002,74, 4353-4360.
Analytical Chemistry, Vol. 77, No. 23, December 1, 2005 7817

noted that the sample was originally prepared for protein frac-tionation by gel electrophoresis; hence, the high concentrationof SDS and mercaptoethanol in the lysis buffer.26 To mimic ahighly complex mixture, no such gel electrophoretic prefraction-ation was utilized in our study; however, the excess mercaptoet-hanol in the lysis buffer had to be removed.
The lysate was purified by SDS-PAGE separation, carried outon a NuPAGE electrophoresis system (Invitrogen, Carlsbad, CA),using a NuPAGE Novex 4-12% Bis-Tris gel and NuPAGE MOPSSDS running buffer. Approximately 40 µg of the lysate was loadedonto the gel, followed by electrophoresis at 200 V for 5 min toseparate proteins from excess mercaptoethanol. It should be notedthat all proteins in the lysate were focused in a small band on thetop of the gel without discernible resolution. The gel was thenstained, and the entire band containing proteins was excised,destained, and in-gel-digested with trypsin, as described previ-ously.21 Briefly, the gel was incubated with 200 µL of 25 mMammonium bicarbonate and 10 mM DTT solution and heated at56 °C for 1 h. The supernatant was removed from the vial andreplaced with the addition of 200 µL of 55 mM iodoacetamide,then incubated in the dark for 30 min at room temperature. Afteralkylation, the gel was washed sequentially with 200 µL of 50 mMammonium bicarbonate solution, 50% ACN/water (v/v) solution,and pure ACN, then dried using a CentriVap concentrator(Labconco, Kansas City, MO). The dried gel was incubated in200 µL of 5 ng/µL of trypsin overnight at 37 °C. To extract thepeptides from the gel, 100 µL of extraction buffer (1% TFA, 50%ACN/water (v/v)) was added to the vial and the mixture wassonicated for 10 min. The supernatant was collected and dried inthe CentriVap concentrator to remove ACN in the extractionbuffer. The extraction was resuspended in 100 µL of 0.1% TFA/H2O (v/v) and stored at -20 °C until the LC-MS analysis.
MALDI MS Direct Deposition. Cytochrome c digest(Michrom BioResources, Auburn, CA) was mixed with matrixsolution (7 mg/mL CHCA, 50% ACN/water) and then depositeddirectly on a MALDI plate as an array of spots. It should be notedthat no LC separation was performed prior to the deposition. Eachspot contained roughly 200 nL of solution (equivalent to 5 s ofspotting in LC-MALDI at a deposition flow rate of 2.4 µL/min)and 5 fmol of digested cytochrome c.
LC-MALDI MS Analysis. The separation in LC-MALDI MSwas carried out on a 15 cm × 100 µm i.d. analytical column packedwith 5-µm Magic C18 particles (Michrom BioResources). Thesamples were directly injected into the analytical column using amanual injection valve (Valco, Houston, TX) equipped with a 2-µLsample loop. The mobile phases were delivered using an UltiMateHPLC system (Dionex, Sunnyvale, CA). The composition ofsolvent A was 2% (v/v) ACN and 0.1% (v/v) TFA, and that of Bwas 85% (v/v) ACN, 5% (v/v) 2-propanol, and 0.1% (v/v) TFA.The separation was carried out at a flow rate of 1 µL/min usinga 45-min gradient (0-30% solvent B in 40 min, 30-95% solvent Bin 1 min, then constant at 95% B for 4 min). The eluent from theLC column was mixed with matrix solution (7 mg/mL CHCA,0.1% (v/v) TFA in 50% (v/v) ACN/water) at a ratio of 2:3, resultingin a total flow of 2.5 µL/min, and the mixture was then depositedonto a stainless steel MALDI plate as an array of discrete spots
at the rate of 5 s/spot, using a lab-built deposition interfacedescribed previously.21 To obtain high mass accuracy in the MSmode, 50 nM of Glu-1-fibrinopeptide B (m/z 1570.667) was addedin matrix solution as an internal standard. After the separationwas completed, the MALDI plate was stored at 4 °C until MSanalysis.
All MS and MS/MS spectra were acquired on an AB 4700Proteomic Analyzer (Applied Biosystems, Framingham, MA).Individual MS spectra for each spot were acquired using 50 lasershots at each of 20 random positions within the spot, resulting ina total of 1000 laser shots across the entire spot. Then, the spectrawere calibrated using a single internal standard with the 4700Explorer software (Applied Biosystems), resulting in roughly (30ppm mass accuracy across the entire MALDI plate. All MS spectrawere combined into a single binary file containing both MS andchromatographic information, and then denoised and processed,using lab-developed algorithms, MEND23 and PRESEL,24 togenerate a list of deisotoped candidate precursors for the MS/MS analysis. Up to a maximum of 15 MS/MS spectra wereacquired from each spot (equivalent to 3 MS/MS spectra perchromatographic second). Each MS/MS spectrum was acquiredusing 1000 laser shots in the same fashion as for the MSacquisition. The resulting MS/MS spectra were processed byPeakToMascot tool (Applied Biosystems) using S/N cutoff of 10and sequentially submitted to MASCOT database searchingsoftware (ver. 2.0, Matrix Science, Boston, MA) for peptide andprotein identification using the SwissProt database (release 45)with E.coli taxonomy. Each identified protein was required to haveat least one unique positive peptide identification that is not sharedwith any other protein. To estimate the level of false positivematches, the same dataset was searched against the SwissProtdatabase with protein sequences reversed using a lab-developedPerl script.
Multiplexed LC-MALDI MS Analysis. The multiplexed4-channel HPLC system was off-line-coupled to MALDI-MS usinga lab-built deposition interface based on a previous design.21 Eachseparation channel consisted of an individual manual injectionvalve (Valco) with a 2-µL sample loop and a 15 cm × 100 µm i.d.analytical column packed with 5-µm Magic C18 particles, allowingsimultaneous separation of multiple samples using an identicalgradient. The mobile phase was delivered by a single LC pumpat the rate of 4 µL/min, then split equally into four separationchannels, i.e., 1 µL/min for each channel. Capillary tubes with20-µm i.d. were used to transfer the flow and compensate for thevariation in back pressure from the hand-packed columns. Theeluents from four individual LC columns were mixed in separatemicro-Tees with MALDI matrix solution in a ratio of 2:3 (totalflow rate of 2.5 µL/min) and simultaneously transferred onto astandard 2-in. × 2-in. MALDI plate via four identical, fused-silicacapillaries (10-cm length, 280-µm o.d., 20-µm i.d.). The MALDIplate was moved onto an X-Y stage controlled by a LabVIEWprogram (National Instruments, Austin, TX). The depositioncapillaries were held perpendicular to the MALDI plate andaligned with a 12-mm gap between adjacent capillaries. Duringthe deposition, the probe was moved up and down by a steppermotor, thus allowing simultaneous deposition of eluents from thefour separation channels as discrete spots at the rate of 5 s/spot.A standard 2-in. × 2-in. MALDI plate could accommodate four
(26) SDS PAGE Gel Electrophroesis; http://www.ciwemb.edu/labs/koshland/Protocols/Protein/sdspage.html; last accessed on 08/22/05.
7818 Analytical Chemistry, Vol. 77, No. 23, December 1, 2005

spot arrays, each containing a total of 196 spots (7 × 28) thatrepresented approximately 16 min of separations for 5 s/spot. Thefour complete separations could be spotted onto three plates. Thisdesign of the multiplexed LC system can be easily expanded toeight or even more columns to increase the throughput ofseparation. The MALDI samples were then analyzed using an AB4700 Proteomic Analyzer, as described above.
RESULTS AND DISCUSSIONOur goal in this study was to develop a strategy of obtaining
as much information as possible in multiple LC-MALDI MS/MS analysis of a complex proteome sample; that is, identifyinglow-intensity peptides in the presence of high-intensity peptidesto maximize the number of identifications. The strategy of aprecursor exclusion list will be demonstrated using both a singlechannel and a multiplexed LC-MALDI MS platform in theanalysis of an E. coli cell lysate.
The Effect of Variation of MALDI MS/MS Spectra onMascot Search Results. Due to the limited instrument time andsample amount, the MS/MS spectrum of each precursor ion isusually acquired only once in a single LC-MS/MS run, tomaximize the number of peptides that can be analyzed. However,numerous sources of variation can occur during the data acquisi-tion, such as fluctuations in the ionization process itself, ioncounting statistics, and fragmentation statistics, and these errorscan propagate in the MS/MS spectrum and affect peptideidentification. In ESI, it has been shown that these variations canresult in significant differences (up to 25% RSD) in Sequest Xcorr
scores of MS/MS spectra acquired using direct infusion.27
However, no such study has yet been reported in MALDI MS/MS analysis.
It is well-known that the reproducibility of measured intensitiesis relatively low in MALDI MS and MS/MS analysis, largely dueto the heterogeneous crystal morphology of the deposited samplesand fluctuation of laser intensity. In addition, the change in solventcomposition during gradient elution can affect crystal morphology.The coefficient of variance of the peak intensities in MALDI MShas been reported to be as high as 42%.28 To examine the variationin MALDI MS/MS analysis, a tryptic digest of cytochrome c waschosen as a model sample and directly deposited at multiple spotson the MALDI plate without separation to represent a complexmixture. Two peptides, TGQAPGFTYTDANK (peptide A, m/z1470.66) and MIFAGIKK (peptide B, m/z 907.52), were selectedfor MS/MS acquisition. The S/N ratios of these two peptides inthe MS spectrum were 50 and 15, respectively (data not shown).For peptide A, a total of 100 sample spots was used for MS/MSacquisitions. On each spot, 25 MS/MS spectra were sequentiallyacquired using 1000 laser shots for each spectrum. The data werethen submitted to a Mascot search using the SwissProt databasewith the mass tolerance of (50 ppm. Peptide B was also analyzedwith the same procedure (i.e., 1000 laser shots/spectrum, 25spectra/spot) using an additional 100 spots.
Figure 1 shows the distribution of Mascot scores for 100replicate MS/MS spectra for the two peptides, obtained from thefirst acquisition of the particular sample spot; i.e., each spectrumwas acquired on a fresh sample. The averages of Mascot scoresfor peptides A and B were 60.4 (RSD 25.4%) and 23.9 (RSD 25.1%),respectively. The sizable variation in the Mascot scores showsthat the fluctuation in MALDI MS/MS analysis can greatly affectthe database search result, similar to ESI MS/MS, as reported.27
Interestingly, the RSDs of the Mascot scores in MALDI MS/MS
(27) Venable, J. D.; Yates, J. R., 3rd. Anal. Chem. 2004, 76, 2928-2937.(28) Dekker, L. J.; Dalebout, J. C.; Siccama, I.; Jenster, G.; Sillevis Smitt, P. A.;
Luider, T. M. Rapid Commun. Mass Spectrom. 2005, 19, 865-870.
Figure 1. The effect of variation of MALDI MS/MS spectra on Mascot ion scores. A tryptic digest of cytochrome c was mixed with matrixsolution and directly deposited on the MALDI target to mimic coeluted peptides in LC separations, and two relatively low intensity peptides werechosen for MS/MS acquisitions and Mascot database search. Distribution of the Mascot score for 100 replicate MS/MS measurements of peptideA (TGQAPGFTYTDANK, m/z 1470.66, black bars) and peptide B (MIFAGIKK, m/z 907.52, gray bars) is shown as histograms. All MS/MSspectra were acquired using fresh spots; i.e., all spectra were obtained from the first acquisition on individual spots. The significant thresholdof the Mascot score was 28 at 95% confidence level.
Analytical Chemistry, Vol. 77, No. 23, December 1, 2005 7819
were similar to the RSDs of SEQUEST Xcorr score in ESI MS/MSanalysis (25%).27
Although the variations in Mascot scores of these two peptideswere comparable, the number of identifications were quitedifferent. The average Mascot score of peptide A (60.4) was twotimes higher than the significant threshold (28 at 95% confidencelevel), and almost all spectra of peptide A were identified; thus,the likelihood of identifying this peptide in a single MALDI MS/MS acquisition would be high. On the other hand, the averageMascot score of the low S/N peptide B (23.9) was less than thesignificant threshold, and only 25 spectra of peptide B resulted inpositive identifications (Figure 1). The likelihood of identifyingpeptide B in a single MALDI MS/MS acquisition was thereforeonly 25%. This example illustrates that for a low-intensity precursorion, such as peptide B, multiple MS/MS acquisitions can increasethe likelihood of identification and, thus, increase the number ofpeptide/protein identifications from multiple replicate LC-MSruns.6,7
Among the sources contributing to the variation of MS/MSspectra, sample consumption is a distinct difference between ESIMS and MALDI MS. In ESI, the sample is completely sprayedduring the data acquisition; in MALDI, only a portion of thespotted sample is consumed in a single MS (or MS/MS)acquisition. On the other hand, MALDI sample spots are depletedduring the spectral acquisition, resulting in signal decay. Thisfactor is especially pronounced in the MS/MS acquisition, mainlydue to the high laser fluence used in the process. In a previousreport, it was found that the intensity of the base peak in the MS/MS spectrum decreased by a factor of 2 after roughly 15acquisitions.24 Sample depletion thus introduces an additionalfactor in MALDI-MS/MS acquisition that can influence thespectral quality and, thus, the results of database searching.
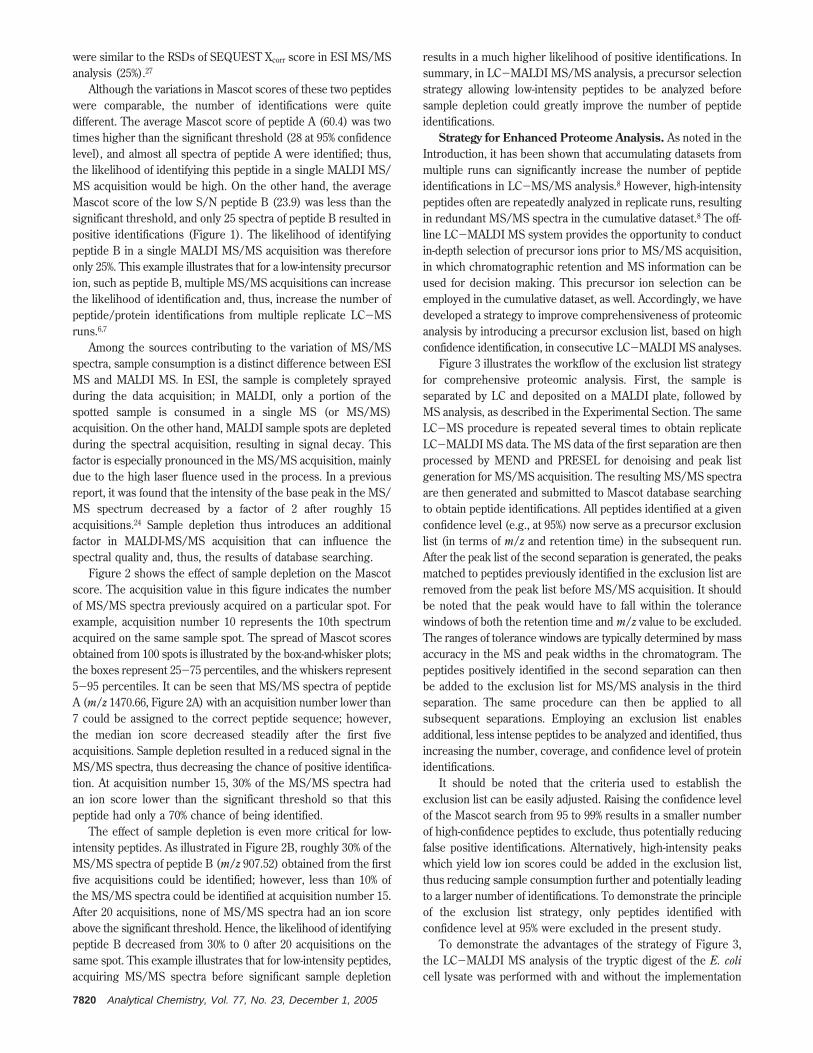
Figure 2 shows the effect of sample depletion on the Mascotscore. The acquisition value in this figure indicates the numberof MS/MS spectra previously acquired on a particular spot. Forexample, acquisition number 10 represents the 10th spectrumacquired on the same sample spot. The spread of Mascot scoresobtained from 100 spots is illustrated by the box-and-whisker plots;the boxes represent 25-75 percentiles, and the whiskers represent5-95 percentiles. It can be seen that MS/MS spectra of peptideA (m/z 1470.66, Figure 2A) with an acquisition number lower than7 could be assigned to the correct peptide sequence; however,the median ion score decreased steadily after the first fiveacquisitions. Sample depletion resulted in a reduced signal in theMS/MS spectra, thus decreasing the chance of positive identifica-tion. At acquisition number 15, 30% of the MS/MS spectra hadan ion score lower than the significant threshold so that thispeptide had only a 70% chance of being identified.
The effect of sample depletion is even more critical for low-intensity peptides. As illustrated in Figure 2B, roughly 30% of theMS/MS spectra of peptide B (m/z 907.52) obtained from the firstfive acquisitions could be identified; however, less than 10% ofthe MS/MS spectra could be identified at acquisition number 15.After 20 acquisitions, none of MS/MS spectra had an ion scoreabove the significant threshold. Hence, the likelihood of identifyingpeptide B decreased from 30% to 0 after 20 acquisitions on thesame spot. This example illustrates that for low-intensity peptides,acquiring MS/MS spectra before significant sample depletion
results in a much higher likelihood of positive identifications. Insummary, in LC-MALDI MS/MS analysis, a precursor selectionstrategy allowing low-intensity peptides to be analyzed beforesample depletion could greatly improve the number of peptideidentifications.
Strategy for Enhanced Proteome Analysis. As noted in theIntroduction, it has been shown that accumulating datasets frommultiple runs can significantly increase the number of peptideidentifications in LC-MS/MS analysis.8 However, high-intensitypeptides often are repeatedly analyzed in replicate runs, resultingin redundant MS/MS spectra in the cumulative dataset.8 The off-line LC-MALDI MS system provides the opportunity to conductin-depth selection of precursor ions prior to MS/MS acquisition,in which chromatographic retention and MS information can beused for decision making. This precursor ion selection can beemployed in the cumulative dataset, as well. Accordingly, we havedeveloped a strategy to improve comprehensiveness of proteomicanalysis by introducing a precursor exclusion list, based on highconfidence identification, in consecutive LC-MALDI MS analyses.
Figure 3 illustrates the workflow of the exclusion list strategyfor comprehensive proteomic analysis. First, the sample isseparated by LC and deposited on a MALDI plate, followed byMS analysis, as described in the Experimental Section. The sameLC-MS procedure is repeated several times to obtain replicateLC-MALDI MS data. The MS data of the first separation are thenprocessed by MEND and PRESEL for denoising and peak listgeneration for MS/MS acquisition. The resulting MS/MS spectraare then generated and submitted to Mascot database searchingto obtain peptide identifications. All peptides identified at a givenconfidence level (e.g., at 95%) now serve as a precursor exclusionlist (in terms of m/z and retention time) in the subsequent run.After the peak list of the second separation is generated, the peaksmatched to peptides previously identified in the exclusion list areremoved from the peak list before MS/MS acquisition. It shouldbe noted that the peak would have to fall within the tolerancewindows of both the retention time and m/z value to be excluded.The ranges of tolerance windows are typically determined by massaccuracy in the MS and peak widths in the chromatogram. Thepeptides positively identified in the second separation can thenbe added to the exclusion list for MS/MS analysis in the thirdseparation. The same procedure can then be applied to allsubsequent separations. Employing an exclusion list enablesadditional, less intense peptides to be analyzed and identified, thusincreasing the number, coverage, and confidence level of proteinidentifications.
It should be noted that the criteria used to establish theexclusion list can be easily adjusted. Raising the confidence levelof the Mascot search from 95 to 99% results in a smaller numberof high-confidence peptides to exclude, thus potentially reducingfalse positive identifications. Alternatively, high-intensity peakswhich yield low ion scores could be added in the exclusion list,thus reducing sample consumption further and potentially leadingto a larger number of identifications. To demonstrate the principleof the exclusion list strategy, only peptides identified withconfidence level at 95% were excluded in the present study.
To demonstrate the advantages of the strategy of Figure 3,the LC-MALDI MS analysis of the tryptic digest of the E. colicell lysate was performed with and without the implementation
7820 Analytical Chemistry, Vol. 77, No. 23, December 1, 2005

of the exclusion list using the same LC column. Four and fivereplicate LC-MALDI MS analyses were performed with andwithout the exclusion list, respectively. A mass tolerance of (50ppm and an elution time tolerance of (0.5 min (roughly 2σ of ananoLC peakwidth) were used in matching peaks to the exclusionlist. It should be noted that the difference in retention time amongruns on the same column was <1% (data not shown); thus, peakscould be easily matched to those on the exclusion list. Importantly,compared to the on-line LC-ESI MS, the reproducibility of thechromatography is not critical, since the MS information for allrepeated runs is available prior to the MS/MS analysis; thus, the
retention times can be readily aligned as demonstrated below formulticolumn separation.
Table 1 presents the results of five replicate LC-MALDI MSanalyses with no exclusion list strategy and four replicate LC-MALDI MS analyses using the exclusion list strategy. In Table1A (no exclusion list), 1055 unique peptides, that is, nonredundant,were identified in the first run. After the second run, an additional208 peptides were found. When conducting the study with theexclusion list, as shown in Table 1B, 1085 peptides were identifiedin the first separation and an additional 592 peptides in the secondrun, for a total of 1633 unique peptides. When simply repeating
Figure 2. The decay of the Mascot score caused by sample depletion. The MS/MS spectra of peptide A (panel A, TGQAPGFTYTDANK, m/z1470.66, white box) and peptide B (panel B, MIFAGIKK, m/z 907.52, gray box) were sequentially acquired 25 times on the same spot. Thedashed line represents the significant threshold of the ion score in the Mascot database search. The distributions of Mascot scores from 100spots were illustrated by box-and-whisker plots, in which whisker and the box represent the 5-95 and 25-75 percentile, respectively. Thecentral line of the box is the median of the ion scores.
Analytical Chemistry, Vol. 77, No. 23, December 1, 2005 7821

the analysis a second time, however, as shown in Table 1A, thenumber of unique peptide identifications in the accumulateddataset was significantly lower, that is, 1263. Using the exclusionlist strategy, the number of unique peptide identifications thusincreased by 25%. As seen in Table 1A, without the exclusion list,the same analysis would have to be repeated five times toaccumulate a comparable number of peptide identifications.
As a consequence of the exclusion strategy, the total numberof protein identifications for the second run also increased from272 to 334, or roughly 20% greater, with all protein identificationsin the accumulated dataset being unique. In addition, as seen inTable 1B, the third and fourth runs added only 18 and 14 more
protein identifications for the cumulative dataset, respectively. Thelow number of additional protein identifications in these runssuggests that two repeat LC-MALDI MS/MS runs with anexclusion list are a good compromise between analysis time andthe number of protein identifications for this sample and othersof similar complexity.
An example of a new identification of a low-intensity peptidein LC-MS/MS analysis made possible by the exclusion strategyis presented in Figure 4. In the first run, m/z ) 1340.68 was theninth precursor ion analyzed on the spot. Before the MS/MSspectrum of m/z ) 1340.68 was acquired, the sample spot hadbeen depleted by previous acquisitions, thus resulting in a lowersignal MS/MS spectrum (Figure 4A) and a Mascot ion scorebelow the significant threshold. In the second run, m/z 1340.68was the first precursor ion analyzed on the given spot; thus, nosample was consumed prior to the specific MS/MS acquisition.Compared to the original MS/MS spectrum in the first run, thenew spectrum (Figure 4B) showed more fragment ions and ahigher signal, resulting in a significant increase in Mascot ionscore and a positive identification, KQIDEYGNFVK.
Figure 5 shows a histogram of MS intensities expressed inarbitrary units (a.u.) of peptides identified in the replicate runs.Out of 718 additional peptide identifications obtained using theexclusion strategy, after the first run (Table 1B), 443 (58%) hadan intensity below 500 au. On the other hand, only 212 of 471additional peptide identifications (45%) without exclusion, againafter the first run (Table 1A), had an intensity below 500 au.Interestingly, the number of identified precursors with intensityabove 1000 au was similar in both cases. This result indicates thatthe exclusion strategy increases the number of peptide identifica-tions from low-intensity precursors.
Since some of the additional identifications from employingan exclusion list were obtained from low-intensity peptides, thefalse positive rate of these identifications could potentially behigher than those obtained from high-intensity peptides. Toevaluate the false positive rate, the MALDI MS/MS data weresearched against an artificial SwissProt database in which theamino acid sequences of all proteins were reversed.29 Table 2summarizes the result of this search. The false positive rate wasestimated by the ratio of the number of unique identificationsfound in the reversed database and in the normal database. Inreplicate LC-MALDI MS/MS analyses without the exclusion list,no major differences were observed in the false positive rates ofindividual runs. However, the false positive rate of the summeddata gradually increased from one run to the next. After a total of5 runs, the number of unique hits in the reversed database was157, and the false positive rate was 10.2%, twice as high as that ina single run. In contrast, no significant change in the false positiverate was observed in the accumulated dataset of replicate LC-MALDI MS/MS with the exclusion list, indicating that all theadditional peptides were identified with the same confidence levelas that in a single run. Indeed, repeating the same analysis willlikely result in identification of the same peptides in different runs.On the other hand, random matches (estimated searching againstthe revered database) tend to be unique in repeat runs. Hence,in the accumulated dataset without excluding already identified
(29) Peng, J.; Elias, J. E.; Thoreen, C. C.; Licklider, L. J.; Gygi, S. P. J. ProteomeRes. 2003, 2, 43-50.
Figure 3. Workflow of the exclusion list strategy. After LC-MSscanning of the first run, the MS/MS acquisitions of this run followedstandard protocol, as described in the Experimental Section. The MS/MS data were submitted to the Mascot database search for peptideidentifications. The list of positively identified peptides in the first runthen served as the exclusion list. In the second run, the candidatelist of MS/MS acquisition was compared with the exclusion list, andall duplicate peaks matched in both the m/z and retention timeexclusion windows were removed from the MS/MS candidate list. Thenew peak list was then used in the second MS/MS analysis, and thenew peptide identifications were added to the exclusion list for thefollowing LC-MS/MS runs.
Table 1. Comparison of Peptide and ProteinIdentifications in Replicate LC-MALDI TOF/TOF MSAnalyses of an E. coli Lysate Digest with and withoutImplementation of the Exclusion List
run 1 2 3 4 5
A) LC-MALDI TOF/TOF MS Analysis without Exclusion Listno. of peptide IDsa 1072 912 902 911 1014accumulated unique peptides 1055 1263 1366 1435 1526no. of protein IDs 228 188 192 193 202accumulated protein IDs 228 272 292 308 321
B) LC-MALDI TOF/TOF MS Analysis with Exclusion Listno. of peptide IDsa 1085 592 97 70accumulated unique peptides 1059 1633 1718 1777no. of protein IDs 219 255 87 64accumulated protein IDs 219 334 352 365
a The significant threshold of Mascot score at 95% confidence levelwas 20.
7822 Analytical Chemistry, Vol. 77, No. 23, December 1, 2005

precursors, the false positive rate, that is, the ratio of uniquerandom matches over total matches, will increase as shown inTable 2.
Multiplexed LC-MALDI MS. We have demonstrated theadvantages of the strategy of Figure 3 in replicate LC-MALDIMS/MS analyses using a single column (analogy to ESI MS);
however, repeating runs prolongs the total time required foranalysis. One approach to improve the system throughput is touse a multicolumn LC system and run separations in parallel.MALDI provides a simple approach in that multiplexed separationscan be simultaneously deposited on a single sample plate priorto further MS and MS/MS analysis.25
Figure 4. MS/MS analysis of the low-intensity peptide KQIDEYGNFVK in duplicate LC-MALDI MS/MS analyses employing the exclusion list.(A) In the first run, the peptide was the ninth precursor ion analyzed on the given sample spot. (B) In the second run, the peptide was the firstprecursor ion analyzed on the given sample spot. The significant threshold of the Mascot score was 28 (95% confidence level).
Figure 5. Distribution of the MS signal intensity of identified peptides in replicate LC-MALDI MS/MS analyses with and without the precursorexclusion list strategy. The results represent the additional peptides identified from the replicate LC/MS runs after the first run. The histogramshows that the number of peptide identifications of precursors with signal intensity lower than 500 au was 2 times higher in replicate runs withthe exclusion relative to no exclusion.
Analytical Chemistry, Vol. 77, No. 23, December 1, 2005 7823

The combination of multiplexed LC-MALDI MS and theexclusion list strategy provided an effective platform for high-throughput comprehensive proteomics analysis. However, thereproducibility of separations with multiple columns were foundto be lower than those shown previously with multiple injectionson the same column; i.e., a larger variation in retention times ofpeptides in each separation channel was observed. It should benoted that the separation columns used in the multiplexed LCsystem were separately hand-packed in our laboratory; thus, thecolumn reproducibility would be expected to be lower than thatof commercially available columns, especially when using fourseparate columns then reinjection into a single column.
To recognize the same precursor ion in the LC-MS dataobtained from different channels and to employ the exclusion liststrategy, alignment of peaks in the chromatographic time domainwas necessary. We developed a MATLAB (MathWorks, Natick,MA)-based program to match and align LC-MALDI MS data fromdifferent runs. Specifically, the initial LC-MS run was chosen asthe standard chromatogram, and the remaining separations (targetchromatograms) were aligned to this standard. Both the standardand the target chromatograms were divided into nonequivalenttime intervals (up to 20 intervals) separated by the high-intensitypeaks that were common to all chromatograms. The individualtime intervals in the target chromatogram were then shifted andlinearly compressed/expanded to match the corresponding timeintervals in the standard chromatogram. Since the shifts of peptideretention times in the different columns resulted from thechromatographic properties of the columns, which could not bedescribed in a simple linear equation, multiple intervals werenecessary to align chromatograms. It should be noted that thealignment program can also be used for LC-ESI MS data and isavailable upon request.
As a demonstration of the advantages of this platform, thetryptic digest of the E. coli lysate was analyzed using themultiplexed LC-MALDI MS system. The sample was simulta-neously injected into all four columns then separated usingidentical gradients of 45 min. The LC separations were depositedand archived in three standard MALDI plates for MS and MS/MS analyses. Channel A was chosen as the standard chromato-gram, and the other three separations were aligned to this channel.A total of 20 peaks with the highest intensity in the extracted ionchromatogram (all above 10 000 au) were selected as the fixedpoints for time intervals used in the alignment process. Table 3presents the adjusted retention times of several selected peaksafter alignment. It should be noted that the peaks listed in Table
3 were not used in the alignment process. For verificationpurposes, all peaks were analyzed in the MS/MS mode to confirmthat the peptide identifications in the different channels were thesame. Before alignment, the standard deviations of retention timeswere roughly between 0.3 and 0.5 min (data not shown); afteralignment, the deviations in retention time of most peaks wereroughly 0.1 min or lower. The results show that alignment processreduces variation of retention time, thus allowing peaks to bematched correctly in the exclusion strategy.
After the alignment in the chromatographic domain, thereplicate LC-MS data were then processed for further MS/MSanalysis. Table 4 shows the result of multiplexed LC-MALDI MS/MS analysis with the exclusion list. In the initial LC-MS/MSanalysis (channel A), a total of 1042 unique peptides wereidentified. After employing the strategy of the exclusion list inthe other three LC-MS runs, a total of 1735 unique peptides werefound, a number similar to that obtained in the single columnexperiment repeated four times (1777, Table 1A). The result showsthat alignment overcame retention time differences from columnto column and that a multiplexed LC MALDI MS system provideda simple approach to employ the strategy of exclusion list withoutprolonging the separation time while providing the same gain inprotein identifications.
CONCLUSIONSIn this study, we have shown that employing an exclusion list
of redundant peptides in replicate off-line LC-MALDI MS/MSanalyses can substantially increase the numbers of peptide andprotein identifications in complex proteome analysis. On the basisof elution time and m/z value, the peptides confidently identifiedin the first LC-MS/MS run were excluded from the next run,thus preventing redundant MS/MS acquisitions and, hence,increasing the chance of low-intensity peptides to be identified.
Table 2. Comparison of the Number of False Positivesfor LC-MALDI TOF/TOF MS Analysis with and withoutthe Exclusion List Strategy
run 1 2 3 4 5
LC-MALDI MS/MS without Exclusion Listno. of false positives 55 47 58 42 45accumulated false positives 55 95 122 139 157total false positive rate 5.2% 7.5% 8.9% 9.7% 10.2%
LC-MALDI MS/MS with Exclusion ListRun 1 2 3 4no. of false positives 71 32 8 5accumulated false positives 71 97 102 107total false positive 6.7% 5.9% 5.9% 6.0%
Table 3. Retention Times after the Alignment ofSeparations in Multiplexed LC-MS Analysis of an E.coli Lysate Digest
retention time (min)
m/z A B C D σ (min)
1423.656 8.42 8.44 8.44 8.55 0.061262.600 13.83 13.90 13.90 13.91 0.041795.950 18.92 18.83 18.90 18.81 0.051282.595 22.58 22.50 22.50 22.42 0.071027.599 27.50 27.50 27.41 27.50 0.041889.925 31.42 31.33 31.67 31.50 0.141325.634 35.33 35.00 35.19 35.27 0.141526.716 41.50 41.66 41.50 41.67 0.091915.909 47.58 47.52 47.58 47.64 0.052117.160 49.83 49.83 49.75 49.75 0.05
Table 4. Multiplexed LC-MALDI MS/MS Analysis of anE. coli Lysate Digest Using the Exclusion List Strategy
channel
A B C D
no. of peptide IDs 1081 387 231 196accumulated unique peptide 1042 1418 1593 1735no. of protein IDs 232 192 164 123accumulated protein IDs 232 297 333 362
7824 Analytical Chemistry, Vol. 77, No. 23, December 1, 2005

In the analysis of an E. coli lysate digest, employing an exclusionlist increases the number of peptide identifications by 25%, incontrast to simply repeating the same analysis twice. In addition,the exclusion list strategy also maintained the false positive rateconstant. Two replicate LC-MALDI MS/MS runs with an exclu-sion list for the second run were found to be a good compromisebetween analysis time and the number of peptide/protein iden-tifications.
In contrast to on-line LC-ESI MS, employing a precursorexclusion strategy in off-line LC-MALDI MS runs provides moreflexibility in MS/MS acquisition, allowing different exclusioncriteria for specific purposes. For example, the criteria forexclusion can easily be adjusted to obtain higher confidencepeptide identifications (with less identifications) or the maximumnumber of peptide identifications (with lower confidence level).The exclusion list strategy can also be integrated with otheracquisition methods, for example, optimizing the number of laser
shots for each MS/MS spectrum, to enhance the analysis further.Moreover, replicate runs provide the potential for more accuratequantitation since intensity of the MS signal can be obtained frommultiple runs. The multiplexed column LC-MALDI MS systemallows replicate separations to be carried out simultaneously, thusreducing prolonged LC analysis time and providing a high-throughput platform to employ the exclusion strategy in proteomeanalysis. Integration of a new axial MALDI TOF instrument usinga 2-kHz repetition rate laser will further improve the throughputfor the multiplexed LC-MALDI MS system.30
ACKNOWLEDGMENTThe authors gratefully acknowledge the support of NIH
(HG0023). This is contribution number 863 from the BarnettInstitute.
Received for review May 31, 2005. Accepted September21, 2005.
AC050956Y(30) Moskovets, E.; Preisler, J.; Chen, H. S.; Rejtar, T.; Andreev, V.; Karger, B.
L. Submitted to Anal. Chem.
Analytical Chemistry, Vol. 77, No. 23, December 1, 2005 7825
Copyright © 2022 FDOKUMEN