VOCs analysis by SPME-GC/MS and PTR-ToF-MS - MDPI
14
molecules Article Unveiling the Molecular Basis of Mascarpone Cheese Aroma: VOCs analysis by SPME-GC/MS and PTR-ToF-MS Vittorio Capozzi 1 , Valentina Lonzarich 2 , Iuliia Khomenko 3 , Luca Cappellin 4 , Luciano Navarini 2, * and Franco Biasioli 3 1 Institute of Sciences of Food Production, National Research Council (CNR), URT c/o CS-DAT, Via Michele Protano, 71121 Foggia, Italy; [email protected] 2 Aromalab, illycaffè s.p.a., Area di Ricerca, Padriciano 99, 34149 Trieste, Italy; [email protected] 3 Department of Food Quality and Nutrition, Research and Innovation Centre, Fondazione Edmund Mach (FEM), via E. Mach 1, 38010 San Michele all’Adige, Italy; [email protected] (I.K.); [email protected] (F.B.) 4 Department of Chemical Sciences, University of Padua, Via F. Marzolo 1, 35131 Padova, Italy; [email protected] * Correspondence: [email protected] Academic Editor: Eugenio Aprea Received: 31 January 2020; Accepted: 2 March 2020; Published: 10 March 2020 Abstract: Mascarpone, a soft-spread cheese, is an unripened dairy product manufactured by the thermal-acidic coagulation of milk cream. Due to the mild flavor and creamy consistency, it is a base ingredient in industrial, culinary, and homemade preparations (e.g., it is a key constituent of a widely appreciated Italian dessert ‘Tiramisù’). Probably due to this relevance as an ingredient rather than as directly consumed foodstuff, mascarpone has not been often the subject of detailed studies. To the best of our knowledge, no investigation has been carried out on the volatile compounds contributing to the mascarpone cheese aroma profile. In this study, we analyzed the Volatile Organic Compounds (VOCs) in the headspace of different commercial mascarpone cheeses by two different techniques: Headspace-Solid Phase Microextraction-Gas Chromatography-Mass Spectrometry (HS-SPME GC-MS) and Proton-Transfer Reaction-Mass Spectrometry coupled to a Time of Flight mass analyzer (PTR-ToF-MS). We coupled these two approaches due to the complementarity of the analytical potential—efficient separation and identification of the analytes on the one side (HS-SPME GC-MS), and effective, fast quantitative analysis without any sample preparation on the other (PTR-ToF-MS). A total of 27 VOCs belonging to different chemical classes (9 ketones, 5 alcohols, 4 organic acids, 3 hydrocarbons, 2 furans, 1 ester, 1 lactone, 1 aldehyde, and 1 oxime) have been identified by HS-SPME GC-MS, while PTR-ToF-MS allowed a rapid snapshot of volatile diversity confirming the aptitude to rapid noninvasive quality control and the potential in commercial sample differentiation. Ketones (2-heptanone and 2-pentanone, in particular) are the most abundant compounds in mascarpone headspace, followed by 2-propanone, 2-nonanone, 2-butanone, 1-pentanol, 2-ethyl-1-hexanol, furfural and 2-furanmethanol. The study also provides preliminary information on the differentiation of the aroma of different brands and product types. Keywords: mascarpone cheese; dairy product; VOCs; PTR-ToF-MS; HS-SPME GC-MS; aroma; ketones; alcohols; Tiramisù; milk cream 1. Introduction Mascarpone cheese is a soft-spread dairy unripened product manufactured by the thermal-acidic coagulation of milk cream [1]. Mascarpone represents an interesting cheese processing method, in Molecules 2020, 25, 1242; doi:10.3390/molecules25051242 www.mdpi.com/journal/molecules
-
Upload
khangminh22 -
Category
Documents
-
view
0 -
download
0
Transcript of VOCs analysis by SPME-GC/MS and PTR-ToF-MS - MDPI
molecules
Article
Unveiling the Molecular Basis of Mascarpone CheeseAroma: VOCs analysis by SPME-GC/MSand PTR-ToF-MS
Vittorio Capozzi 1 , Valentina Lonzarich 2, Iuliia Khomenko 3, Luca Cappellin 4,Luciano Navarini 2,* and Franco Biasioli 3
1 Institute of Sciences of Food Production, National Research Council (CNR), URT c/o CS-DAT, Via MicheleProtano, 71121 Foggia, Italy; [email protected]
2 Aromalab, illycaffè s.p.a., Area di Ricerca, Padriciano 99, 34149 Trieste, Italy; [email protected] Department of Food Quality and Nutrition, Research and Innovation Centre, Fondazione Edmund
Mach (FEM), via E. Mach 1, 38010 San Michele all’Adige, Italy; [email protected] (I.K.);[email protected] (F.B.)
4 Department of Chemical Sciences, University of Padua, Via F. Marzolo 1, 35131 Padova, Italy;[email protected]
* Correspondence: [email protected]
Academic Editor: Eugenio ApreaReceived: 31 January 2020; Accepted: 2 March 2020; Published: 10 March 2020
�����������������
Abstract: Mascarpone, a soft-spread cheese, is an unripened dairy product manufactured by thethermal-acidic coagulation of milk cream. Due to the mild flavor and creamy consistency, it is abase ingredient in industrial, culinary, and homemade preparations (e.g., it is a key constituent ofa widely appreciated Italian dessert ‘Tiramisù’). Probably due to this relevance as an ingredientrather than as directly consumed foodstuff, mascarpone has not been often the subject of detailedstudies. To the best of our knowledge, no investigation has been carried out on the volatilecompounds contributing to the mascarpone cheese aroma profile. In this study, we analyzed theVolatile Organic Compounds (VOCs) in the headspace of different commercial mascarpone cheesesby two different techniques: Headspace-Solid Phase Microextraction-Gas Chromatography-MassSpectrometry (HS-SPME GC-MS) and Proton-Transfer Reaction-Mass Spectrometry coupled to a Timeof Flight mass analyzer (PTR-ToF-MS). We coupled these two approaches due to the complementarityof the analytical potential—efficient separation and identification of the analytes on the one side(HS-SPME GC-MS), and effective, fast quantitative analysis without any sample preparation onthe other (PTR-ToF-MS). A total of 27 VOCs belonging to different chemical classes (9 ketones,5 alcohols, 4 organic acids, 3 hydrocarbons, 2 furans, 1 ester, 1 lactone, 1 aldehyde, and 1 oxime)have been identified by HS-SPME GC-MS, while PTR-ToF-MS allowed a rapid snapshot of volatilediversity confirming the aptitude to rapid noninvasive quality control and the potential in commercialsample differentiation. Ketones (2-heptanone and 2-pentanone, in particular) are the most abundantcompounds in mascarpone headspace, followed by 2-propanone, 2-nonanone, 2-butanone, 1-pentanol,2-ethyl-1-hexanol, furfural and 2-furanmethanol. The study also provides preliminary informationon the differentiation of the aroma of different brands and product types.
Keywords: mascarpone cheese; dairy product; VOCs; PTR-ToF-MS; HS-SPME GC-MS; aroma;ketones; alcohols; Tiramisù; milk cream
1. Introduction
Mascarpone cheese is a soft-spread dairy unripened product manufactured by the thermal-acidiccoagulation of milk cream [1]. Mascarpone represents an interesting cheese processing method, in
Molecules 2020, 25, 1242; doi:10.3390/molecules25051242 www.mdpi.com/journal/molecules

Molecules 2020, 25, 1242 2 of 14
which direct acidification is applied. The raw materials for its production are milk cream (containing80% dry weight lipids, 2.8% to 6% protein) and acidifying substances (single or mixed), such as acetic,citric, tartaric, or lactic acids, vinegar or lemon juice, with a final pH ranging from 5.7 to 6.6 [2]. Thecream is heated up to 85–95 ◦C and, while stirring, acid is added in order to force matrix coagulation [3,4].During the intensive heating, the whey protein denatures and aggregates or sticks to the casein micellesand the fat globule membrane [3]. As a result of this reaction, whey proteins partly remain in the cheesematrix during the draining step (about 20 h), obtaining the typical texture and flavor of mascarponecheese [3]. This typical Italian cheese was once produced domestically by the farmers of some northernregions and consumed immediately after production. Due to its traditional importance, mascarpone isincluded in the list of traditional agro-food products (Prodotto Agroalimentare Tradizionale) [5], a list ofItalian traditional regional food products. More recently, it has been industrially produced to satisfythe increasing demand driven by two main sensory characteristics—the mild flavor and the creamyconsistency. In fact, due to these attributes, mascarpone cheese is a base ingredient in industrial,culinary, and homemade preparations. The best example is its use in the preparation of one of themost widely appreciated Italian desserts—the Tiramisù. In spite of its popularity and its increasingeconomic relevance, the scientific literature does not report a characterization of Volatile OrganicCompounds (VOCs) released by this peculiar dairy matrix. In order to characterize for the first timethe VOCs associated with the headspace of mascarpone cheese, among various analytical techniques,we exploit the complementarity of Gas Chromatography-Mass Spectrometry (GC-MS) and ProtonTransfer Reaction-Mass Spectrometry coupled to a Time of Flight mass analyzer (PTR-ToF-MS) [6].Gas Chromatography-Mass Spectrometry (GC-MS) is the reference method in the analysis of VOCs inthe field of environmental, food, flavour and fragrance, medical and forensic sciences [7]. Solid-PhaseMicroextraction (SPME) combined with static headspaces (HS-SPME), in particular, offers relativelyhigh-throughput performance and does not require extended sample preparation [8]. Moreover, it isreproducible, simple, and effective, and eliminates interference compounds from the sample matrixwith improvement in the selectivity of the analysis. PTR-ToF-MS uses proton transfer to inducechemical ionization of the sample headspace directly introduced into a drift tube, where volatileorganic compounds can react with H3O+ ions formed in a hollow cathode ion source. The protonatedparticles are analyzed according to their mass/charge ratio (m/z) using a quadrupole or Time-of-Flight(ToF) mass analyzer and eventually detected as ion counts/second (cps) by a secondary electronmultiplier or multichannel plates [9]. The outcome is a rapid (< 1 s) mass resolved fingerprint of thetotal volatile profile of the sample, measuring most VOCs at ultralow concentrations (a few pptv) andhigh mass resolution [10]. These analytical approaches are complementary. In fact, PTR-MS providesanalytical information that is mostly limited to concentration and m/z ratios, i.e., sum formula, whileisobar separation and compound identification needs usually the support of GC analysis [6]. PTR-MS,however, guarantees rapid and direct analysis and high sensitivity [11].
Using this integrated approach, the present study represents a first step towards the comprehensionof the molecular basis of sensory perceptions associated with the consumption of mascarpone cheeseand, more relevantly, of products that use mascarpone as raw material. Furthermore, within the panelof tested samples, we preliminary explored variables such as different manufacturers and delactosedmascarpone productions.
2. Results and Discussion
2.1. HS-SPME GC-MS Results
Solid-phase microextraction (SPME) is a very popular analytical extraction technique used beforeGC-MS headspace (HS) analysis thanks to its ease-to-use, the possibility of automation, and goodsensitivity. SPME utilizes a short, thin, solid rod of fused silica coated with an absorbent/adsorbentpolymer. The coated fused silica (the SPME fiber) is attached to a metal rod, and both are protected bya metal sheath that covers the fiber when not in use. SPME is particularly well suited to the analysis

Molecules 2020, 25, 1242 3 of 14
of dairy products being capable of extracting a broader range of analytes than most other samplepreparation methods [12]. Moreover, thanks to the relatively low temperatures and short times atwhich headspace SPME extraction is performed, the risks to induce thermal artifacts are extremely lowif compared with other techniques such as simultaneous distillation-extraction (SDE) [13].
Methods developed for the analysis of organic compounds from aqueous samplesby SPME coupled to GC have been used to analyze VOCs in fresh and ripened dairyproductions [8,14]. A wide range of fibers with varying affinities for specific classes of volatileorganic compounds is available. After a preliminary screening of seven different types ofSPME fibers (100 µm PDMS (polydimethylsiloxane), 60 µm PEG (Carbowax-Polyethylene Glycol),85 µm PA (Polyacrylate), 75 µm CAR/PDMS (Carboxen/Polydimethylsiloxane), 85 µm CAR/PDMS,50/30 µm DVB/CAR/PDMS (Divinylbenzene/Carboxen/Polydimethylsiloxane), and 65 µm PDMS/DVB(Polydimethylsiloxane/Divinylbenzene)) 75 µm CAR/PDMS was chosen, because it provides thehigher number of extracted volatiles. This fiber has been suggested to work particularly well forthe analysis of volatiles in dairy products [12]. Extraction conditions have also been preliminarilyexplored by checking the effect of different times (10 min up to 4 h) and temperature (40 and 60 ◦C). Agood compromise between the multiplicity of extracted volatiles and peak intensity was found byheadspace exposing the fiber for 60 min at 60 ◦C and this experimental condition was selected for thepresent characterization.
A total of 27 compounds belonging to different chemical classes (nine ketones, five alcohols,four acids, three hydrocarbons, two furans, one ester, one lactone, one aldehyde, and one oxime)have been identified. Ketones, which might induce fruity and floral sensory notes, are commonconstituents of most dairy products [15–17] and by far the most important class of compoundscontributing to the mascarpone cheese aroma. In particular, 5 different ketones (2-heptanone >
2-pentanone > 2-propanone > 2-nonanone ≈ 2-butanone) represent almost 75–80% of the sampleheadspace. The compounds 2-heptanone and 2-pentanone characterized by odor descriptors includingsweet, fruity, orange peel, and herbaceous [15] are the dominating volatile organic compounds inall samples. Several alcohols have been detected, but differently from ketones, are not present inall samples—1-pentanol and 2-ethyl-1-hexanol, both common primary alcohols detected in dairyproducts [15], are ubiquitous, and ethanol and 1,2 propandiol have been detected only in one sample(Manufacturer B), suggesting a possible technological origin. Other minor compounds, includingshort- and moderate-chain even-numbered fatty acids (C4–C12), ethyl acetate, δ-hexalactone, toluene,benzaldehyde and methoxyphenyl oxime have been already found in cheese products [16,18,19]. Thetwo hydrocarbons 2,4-dimethylheptene and 2,2,4,6,6-pentamethylheptane have been detected only inone sample (Manufacturer A) and the latter has been detected in the volatile fraction of butter [20].Furfural and 2-furanmethanol, identified in all mascarpone cheese samples, have been found tocontribute to the nutty and roasted aroma of Parmigiano-Reggiano cheese [21].
In order to provide a general overview of volatile composition of three different samples (M1-M3)of Mascarpone cheese analyzed by HS-SPME GC-MS, we performed multivariate data analysis usingPrincipal Component Analysis (PCA), reporting the graphical result in Figure 1.

Molecules 2020, 25, 1242 4 of 14Molecules 2019, 24, x FOR PEER REVIEW 4 of 14
Figure 1. Principal Component Analysis (PCA) biplot of the 3 different commercial samples of mascarpone (M1, M2, and M3). For each sample, the mean (n = 4) is represented by the sample name. Score plot was given by the Volatile Organic Compound (VOC) content for each sample and loading plot of the single volatile organic compounds. The codes correspond to the samples indicated in Table 1.
In the figure, it is possible to observe the samples (scores) and variables (loadings) plots related to the first two principal components, which (cumulated) explain the 77% of the total variance (PC1, 50.0%; PC2, 27.0%) associated with the data set. A clear separation of mascarpone cheese M1 from the other samples is observable along the PC1. PC2 explains the parting between M2 and M3 mascarpone samples. The replicates belong to the same commercial mascarpone batch that is well-clustered together, while is possible to highlight a clear separation of the three samples on the biplot. Observing the loadings (i.e., the involvement of the single volatiles), it is possible to have an idea of the different influence of the diverse volatiles in justifying variance observed trends.
Table 1. List of commercial ‘Mascarpone’ samples analyzed in the present study. All samples (M1–M12) were investigated by PTR-ToF-MS analysis. Underlined samples (M1–M3) were evaluated also by HS-SPME GC-MS.
Sample Claimed characteristics Manufacturer M1 Mascarpone A M2 Mascarpone B M3 Mascarpone C M4 Mascarpone B M5 Mascarpone C M6 Mascarpone C M7 Mascarpone M M8 Mascarpone M M9 Mascarpone without lactose M M10 Mascarpone without lactose M M11 Mascarpone without lactose C M12 Mascarpone without lactose C
2.2. PTR-ToF-MS Results and Comparison with HS-SPME GC-MS Findings
Figure 1. Principal Component Analysis (PCA) biplot of the 3 different commercial samples ofmascarpone (M1, M2, and M3). For each sample, the mean (n = 4) is represented by the sample name.Score plot was given by the Volatile Organic Compound (VOC) content for each sample and loadingplot of the single volatile organic compounds. The codes correspond to the samples indicated in Table 1.
In the figure, it is possible to observe the samples (scores) and variables (loadings) plots relatedto the first two principal components, which (cumulated) explain the 77% of the total variance (PC1,50.0%; PC2, 27.0%) associated with the data set. A clear separation of mascarpone cheese M1 from theother samples is observable along the PC1. PC2 explains the parting between M2 and M3 mascarponesamples. The replicates belong to the same commercial mascarpone batch that is well-clusteredtogether, while is possible to highlight a clear separation of the three samples on the biplot. Observingthe loadings (i.e., the involvement of the single volatiles), it is possible to have an idea of the differentinfluence of the diverse volatiles in justifying variance observed trends.
Table 1. List of commercial ‘Mascarpone’ samples analyzed in the present study. All samples (M1–M12)were investigated by PTR-ToF-MS analysis. Underlined samples (M1–M3) were evaluated also byHS-SPME GC-MS.
Sample Claimed Characteristics Manufacturer
M1 Mascarpone AM2 Mascarpone BM3 Mascarpone CM4 Mascarpone BM5 Mascarpone CM6 Mascarpone CM7 Mascarpone MM8 Mascarpone MM9 Mascarpone without lactose M
M10 Mascarpone without lactose MM11 Mascarpone without lactose CM12 Mascarpone without lactose C
2.2. PTR-ToF-MS Results and Comparison with HS-SPME GC-MS Findings
As other Direct-Injection Mass Spectrometric (DIMS) technologies, PTR-MS finds application inmany sectors, from environmental sciences to food chemistry, and from biological studies to medicalapplications. With this regard, we recently described a tailored system, that found application in this

Molecules 2020, 25, 1242 5 of 14
study, achieved connecting PTR-ToF-MS with an automated sampler, and associated custom-madedata analysis applications that improve the versatility of the analytical approach in the determinationof VOCs in association with i) huge numbers of samples, ii) bioprocesses monitoring, and iii) highnumbers of variables to be considered [11].
PTR-MS has been already exploited to study VOCs associated to dairy products such as mozzarellacheese [22], Grana Padano, Parmigiano Reggiano, and Grana Trentino cheeses [23], liquid whey [24],butter and butter oils (by means of quadrupole-based PTR-MS analyses, sensory analyses and classicalchemical analyses) [25], milk and whey powders [26], anhydrous milk fat [26], and fermentedmilk-based beverages (yogurt and kefir) [27,28].
All samples included in this study have been analyzed by PTR-ToF-MS. A total of 411 masspeaks were detected and extracted. Upon comparison with the blanks, 92 peaks were kept thatare significantly different between various manufacturers (p < 0.01 with Bonferroni correction) andtentatively identified on the basis of exact mass, isotopic ration, and literature [29]. PTR-MS allowedthe detection and characterization of a larger number of VOCs/VOC fragments, which was larger thanthe number of volatiles identified by GC. For the PTR analysis, all vials were incubated alternativelyat 40 ◦C or at 60 ◦C (data not shown) for 30 min before PTR-MS analysis. The last one was thetemperature at which good results were obtained by HS-SPME GC-MS. However, with PTR, even at40 ◦C, the analysis was successfully performed and results were reliable. For this reason, we reportthe data performed at 40 ◦C, a temperature closer to the real mascarpone cheese testing conditions.One-way ANOVA followed by Tukey HSD test was carried out to compare and underline significantdifferences among the assessed mascarpone samples. For each peak, we obtained the concentration ofthe corresponding VOC ion in the headspace of all explored samples. Boxplots reported in Figure 2illustrate the observed trends for 6 ions among the tested samples, as illustrative cases. In detail,the figure proposes the behaviors corresponding to the peaks at m/z 73.065 (tentatively identified as2-butanone), m/z 75.044 (tentatively identified as propionic acid), m/z 83.086 (tentatively identified ashexanol fragment), m/z 87.080 (tentatively identified as 2-pentanone/isoprenol), m/z 98.105, and m/z101.096 (tentatively identified as 2-hexanone). The intensity corresponding to the mass peak m/z 73.065reaches the highest values in the delactosed samples produced by Manufacturer C, while the standardproductions belonging to the same manufacturer registered the lowest values (as all mascarponebatches of Producer M) (Figure 2a). Samples from Manufacturers A and B present intermediateintensities for this peak (Figure 2a). In accordance with these results, 2-butanone was found to bevariable in different types of whey [30]. In only the M2 batch did we detected a relevant intensity forthe mass peak m/z 75.044 (Figure 2b), tentatively identified as propionic acid, a compound that can beresponsible for a dairy taste/odor with a pronounced fruity lift [31].

Molecules 2020, 25, 1242 6 of 14Molecules 2019, 24, x FOR PEER REVIEW 6 of 14
Figure 2. The boxplots indicated by letters (a)–(f) represent selected volatiles found in association
with the different commercial mascarpone samples such as m/z 73.0649—C4H9O+—t.i. 2-Butanone,
75.0437—C3H7O2+—t.i. Methyl acetate, 83.0860—C6H11+—t.i. fragment of Hexanal/Hexenol,
87.0809—C5H11O+—t.i. 2-Pentanone/3-Buten-1-ol, 3-methyl-, 98.1048—isotope of C7H13+—t.i.
Heptanal, 101.0968—C6H13O+—t.i. 2-Hexanone.. Different letters indicate a significant difference
between different samples (p < 0.05, one-way ANOVA, Tukey HSD).
The mass peak m/z 83.086 has been found with pronounced intensities in the samples produced
by the Manufacturers A and B (Figure 2c). Hexanal was included among the high-content
compounds identified in samples belonging to dairy products [32] and described as having a fatty,
green, grassy, powerful, penetrating characteristic fruity odor and taste [31]. A similar trend can be
underlined for the intensities of mass peak m/z 101.096 (Figure 2f). Finally, a considerable variability
can be highlighted for the intensities corresponding to the mass peaks m/z 87.080 and 98.105 (Figure
2d and 2e).
Other than this kind of punctual analysis, PTR analysis offers also the opportunity to depict a
global analysis of molecular fingerprinting associated with the headspaces of the different samples.
Considering that the present work deals with an integrated analytical approach, we propose a PTR
data set selected in light of the comparison with GC data. In fact, we defined a new subset of the
PTR-ToF-MS data including only the mass peaks that were found also using the HS-SPME GC-MS
technique. As a result, we have a new matrix (Table 2) of twenty peaks corresponding to the masses
of protonated molecular ions of compounds such as acetic acid (sour pungent, cider vinegar, slightly
malty with a brown nuance; naturally occurring in various dairy products, it has a role in butter and
Figure 2. The boxplots indicated by letters (a–f) represent selected volatiles found in associationwith the different commercial mascarpone samples such as m/z 73.0649—C4H9O+—t.i. 2-Butanone,75.0437—C3H7O2
+—t.i. Methyl acetate, 83.0860—C6H11+—t.i. fragment of Hexanal/Hexenol,
87.0809—C5H11O+—t.i. 2-Pentanone/3-Buten-1-ol, 3-methyl-, 98.1048—isotope of C7H13+—t.i.
Heptanal, 101.0968—C6H13O+—t.i. 2-Hexanone. Different letters indicate a significant differencebetween different samples (p < 0.05, one-way ANOVA, Tukey HSD).
The mass peak m/z 83.086 has been found with pronounced intensities in the samples producedby the Manufacturers A and B (Figure 2c). Hexanal was included among the high-content compoundsidentified in samples belonging to dairy products [32] and described as having a fatty, green, grassy,powerful, penetrating characteristic fruity odor and taste [31]. A similar trend can be underlined for theintensities of mass peak m/z 101.096 (Figure 2f). Finally, a considerable variability can be highlightedfor the intensities corresponding to the mass peaks m/z 87.080 and 98.105 (Figure 2d,e).
Other than this kind of punctual analysis, PTR analysis offers also the opportunity to depict aglobal analysis of molecular fingerprinting associated with the headspaces of the different samples.Considering that the present work deals with an integrated analytical approach, we propose a PTRdata set selected in light of the comparison with GC data. In fact, we defined a new subset of thePTR-ToF-MS data including only the mass peaks that were found also using the HS-SPME GC-MStechnique. As a result, we have a new matrix (Table 2) of twenty peaks corresponding to the masses ofprotonated molecular ions of compounds such as acetic acid (sour pungent, cider vinegar, slightlymalty with a brown nuance; naturally occurring in various dairy products, it has a role in butter andcheese flavors), acetoin (acidic, sour, cheesy, dairy, creamy with a fruity nuance; normally occurs

Molecules 2020, 25, 1242 7 of 14
in butter, milk, and cheeses), acetone (characteristic aromatic odor, pungent, somewhat sweet taste;naturally occurring in fermented dairy products), ethanol (slight, characteristic odor and a burning taste;naturally occurring in blue cheese, cheddar cheese, Swiss cheese), furfural (characteristic penetratingodor typical of cyclic aldehydes; naturally occurring in cheeses), hexanoic acid (sickening, sweaty,rancid, sour, sharp, pungent, cheesy, fatty, unpleasant odor reminiscent of copra oil; naturally occurringin cheeses, butter, milk), and octanoic acid (mildly unpleasant odor and a burning, rancid taste, alsoreported as having a faint, fruity-acid odor and slightly sour taste; natural component of butter fat,occurring in cheeses) [31,33].
Table 2. Volatile compounds detected by both Proton Transfer Reaction-Mass Spectrometry coupled to aTime of Flight mass analyzer (PTR-ToF-MS) and SPME/GC-MS in association with mascarpone samples.
Compound Chemical ClassProtonated Ion
m/z Sum Formula
Ethanol Alcohols 47.049 C2H7O+
2-Propanone Ketones 59.049 C3H7O+
Acetic acid Organic acids 61.028 C2H5O2+
2-Butanone Ketones 73.065 C4H9O+
1,2-Propanediol = Propylene glycol Alcohols 77.060 C3H9O2+
2-Pentanone/3-Buten-1-ol, 3-methyl- Ketones/Alcohols 87.080 C5H11O+
2-Butanone, 3-hydroxy- (B) / Butanoicacid/Acetic acid ethyl ester Ketones/Organic acids/Esters 89.060 C4H9O2
+
Toluene Hydrocarbons 93.070 C7H9+
Furfural Furans 97.028 C5H5O2+
2-Hexanone Ketones 101.096 C6H13O+
Benzaldehyde Aldehyde 107.049 C7H7O+
5-Methyl-delta-valerolactone Lactones 115.075 C6H11O2+
2-Heptanone Ketones 115.112 C7H15O+
Hexanoic acid Organic acids 117.091 C6H13O2+
2,4-Dimethyl-1-heptene Hydrocarbons 127.148 C9H19+
2-Octanone Ketones 129.127 C8H17O+
1-Hexanol, 2-ethyl- Alcohols 131.143 C8H19O+
2-Nonanone Ketones 143.143 C9H19O+
Octanoic acid Organic acids 145.122 C8H17O2+
Oxime-, methoxy-phenyl- Oxime 152.071 C8H10NO2+
2-Undecanone Ketones 171.174 C11H23O+
Heptane, 2,2,4,6,6-pentamethyl Hydrocarbons 171.211 C12H27+
Statistical tests were performed on the new matrix in an attempt at understanding the impactof these VOCs on the characterization of the different mascarpone cheese samples. The resultsobtained for the twelve experimental modes were visualized by means of principal component analysis(PCA), with each point representing a distinct sample (Figure 3), maximizing explained variability intwo dimensions.
Molecules 2020, 25, 1242 8 of 14Molecules 2019, 24, x FOR PEER REVIEW 8 of 14
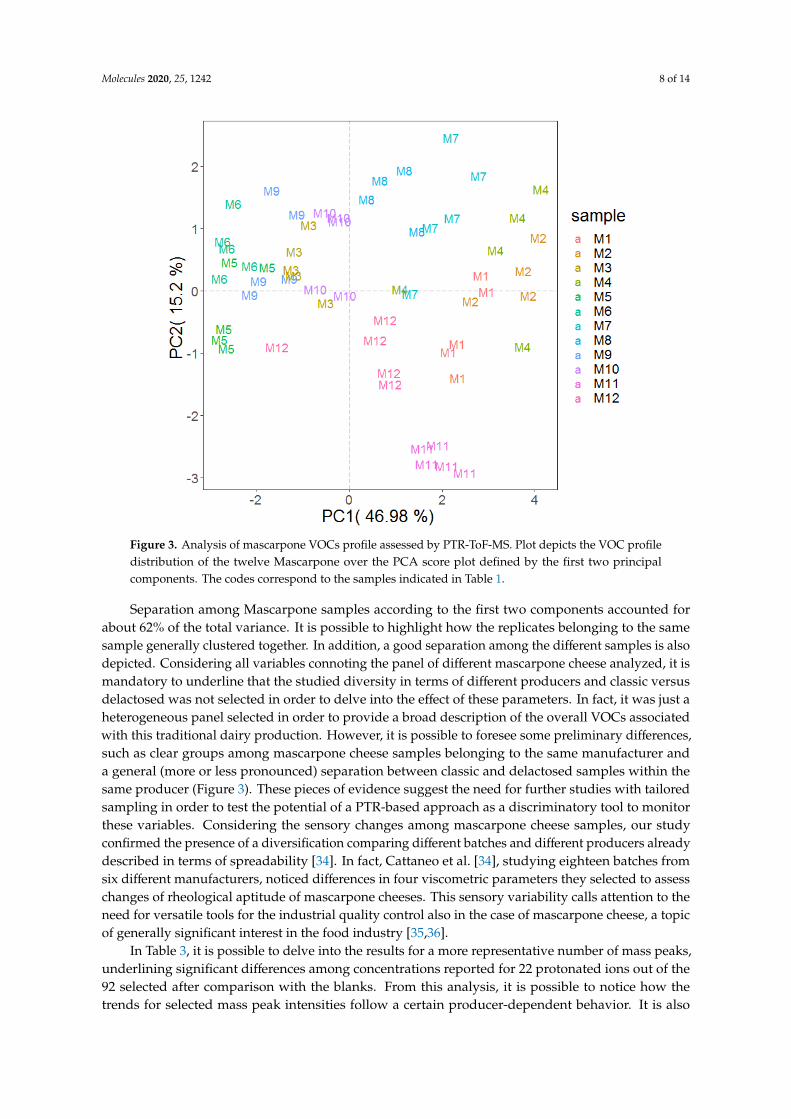
Figure 3. Analysis of mascarpone VOCs profile assessed by PTR-ToF-MS. Plot depicts the VOC
profile distribution of the twelve Mascarpone over the PCA score plot defined by the first two
principal components. The codes correspond to the samples indicated in Table 1.
Separation among Mascarpone samples according to the first two components accounted for
about 62% of the total variance. It is possible to highlight how the replicates belonging to the same
sample generally clustered together. In addition, a good separation among the different samples is
also depicted. Considering all variables connoting the panel of different mascarpone cheese
analyzed, it is mandatory to underline that the studied diversity in terms of different producers and
classic versus delactosed was not selected in order to delve into the effect of these parameters. In
fact, it was just a heterogeneous panel selected in order to provide a broad description of the overall
VOCs associated with this traditional dairy production. However, it is possible to foresee some
preliminary differences, such as clear groups among mascarpone cheese samples belonging to the
same manufacturer and a general (more or less pronounced) separation between classic and
delactosed samples within the same producer (Figure 3). These pieces of evidence suggest the need
for further studies with tailored sampling in order to test the potential of a PTR-based approach as a
discriminatory tool to monitor these variables. Considering the sensory changes among mascarpone
cheese samples, our study confirmed the presence of a diversification comparing different batches
and different producers already described in terms of spreadability [34]. In fact, Cattaneo et al. [34],
studying eighteen batches from six different manufacturers, noticed differences in four viscometric
parameters they selected to assess changes of rheological aptitude of mascarpone cheeses. This
sensory variability calls attention to the need for versatile tools for the industrial quality control also
in the case of mascarpone cheese, a topic of generally significant interest in the food industry [35,36].
In Table 3, it is possible to delve into the results for a more representative number of mass
peaks, underlining significant differences among concentrations reported for 22 protonated ions out
of the 92 selected after comparison with the blanks. From this analysis, it is possible to notice how
the trends for selected mass peak intensities follow a certain producer-dependent behavior. It is also
clear how the probabilities to find selected mass peaks associated to given experimental variables
Figure 3. Analysis of mascarpone VOCs profile assessed by PTR-ToF-MS. Plot depicts the VOC profiledistribution of the twelve Mascarpone over the PCA score plot defined by the first two principalcomponents. The codes correspond to the samples indicated in Table 1.
Separation among Mascarpone samples according to the first two components accounted forabout 62% of the total variance. It is possible to highlight how the replicates belonging to the samesample generally clustered together. In addition, a good separation among the different samples is alsodepicted. Considering all variables connoting the panel of different mascarpone cheese analyzed, it ismandatory to underline that the studied diversity in terms of different producers and classic versusdelactosed was not selected in order to delve into the effect of these parameters. In fact, it was just aheterogeneous panel selected in order to provide a broad description of the overall VOCs associatedwith this traditional dairy production. However, it is possible to foresee some preliminary differences,such as clear groups among mascarpone cheese samples belonging to the same manufacturer anda general (more or less pronounced) separation between classic and delactosed samples within thesame producer (Figure 3). These pieces of evidence suggest the need for further studies with tailoredsampling in order to test the potential of a PTR-based approach as a discriminatory tool to monitorthese variables. Considering the sensory changes among mascarpone cheese samples, our studyconfirmed the presence of a diversification comparing different batches and different producers alreadydescribed in terms of spreadability [34]. In fact, Cattaneo et al. [34], studying eighteen batches fromsix different manufacturers, noticed differences in four viscometric parameters they selected to assesschanges of rheological aptitude of mascarpone cheeses. This sensory variability calls attention to theneed for versatile tools for the industrial quality control also in the case of mascarpone cheese, a topicof generally significant interest in the food industry [35,36].
In Table 3, it is possible to delve into the results for a more representative number of mass peaks,underlining significant differences among concentrations reported for 22 protonated ions out of the92 selected after comparison with the blanks. From this analysis, it is possible to notice how thetrends for selected mass peak intensities follow a certain producer-dependent behavior. It is also

Molecules 2020, 25, 1242 9 of 14
clear how the probabilities to find selected mass peaks associated to given experimental variablesconsiderably increase using the PTR-based technique, due to the potential of an untargeted approach.The opportunity to have a wide (untargeted analysis) and fast (rapid time of analysis without anysample preparation/extraction/destruction) view of the VOCs associated with mascarpone headspacesconfirmed the aptitude of this analytical approach to allow rapid noninvasive quality control for thefood industry (e.g., [37,38]), already explored in the dairy industry but on other matrices (e.g., [25,26]).An approach that can i) simplify the selection of mascarpone as an ingredient in the food industry andii) boost the quality improvements in the production of this fresh cheese.
Table 3. Organic compounds associated to mascarpone headspace detected by PTR-ToF-MS. Black colorindicates compounds identified also by SPME/GC-MS. For each compound, different letters indicate asignificant difference between different samples according to ANOVA and Tukey HSD (p < 0.05). Thecodes correspond to the samples indicated in Table 1. In the parenthesis, the different producers.
MM TM SF M1 (A) M2 (B) M3 (C) M4 (B) M5 (C) p-Value
41.039 41.039 C3H5+ 21.2 ± 0.9 b 27 ± 3 c 11.4 ± 0.6 a 21 ± 1 b 10 ± 1 a 1 × 10⁻¹³
43.018 43.018 C2H3O+ 30.0 ± 0.7 b 44 ± 3 c 24 ± 2 a 33 ± 2 b 24 ± 5 a 3 × 10⁻⁹
43.054 43.054 C3H7+ 11.5 ± 0.6 c 16 ± 1 d 3.5 ± 0.5 a 6.7 ± 0.4 b 3.1 ± 0.4 a 4 × 10⁻¹⁷
45.033 45.033 C2H5O+ 113 ± 6 b 175 ± 12 c 81 ± 3 a 114 ± 10 b 88 ± 23 a 2 × 10⁻⁹
47.049 47.049 C2H7O+ 8 ± 3 a 52 ± 39 c 10 ± 8 a 16 ± 1 ab 44 ± 5 bc 2 × 10⁻³
55.054 55.054 C4H7+ 13.3 ± 0.4 c 14.9 ± 0.8 d 8.1 ± 0.3 b 15 ± 1 d 6.0 ± 0.4 a 7 × 10⁻¹⁶
57.070 57.070 C4H9+ 6.0 ± 0.1 c 5.6 ± 0.6 c 3.9 ± 0.2 b 12 ± 1 d 2.7 ± 0.1 a 7 × 10⁻¹⁷
59.049 59.049 C3H7O+ 1062 ± 35 c 976 ± 72 c 563 ± 29 b 1230 ± 116 d 355 ± 26 a 9 × 10⁻¹⁵
61.029 61.028 C2H5O2+ 10 ± 3 a 26 ± 6 b 18 ± 5 ab 11 ± 2 a 24 ± 10 b 4 × 10⁻⁴
63.026 63.026 C2H7S+ 15.1 ± 0.3 c 16 ± 1 c 7.2 ± 0.4 b 20 ± 2 d 3.3 ± 0.5 a 4 × 10⁻¹⁶
69.070 69.07 C5H9+ 6.4 ± 0.2 a 8.3 ± 0.6 b 6.0 ± 0.4 a 9.0 ± 0.8 b 6.2 ± 0.6 a 2 × 10⁻⁸
71.086 71.086 C5H11+ 1.2 ± 0.1 ab 1.7 ± 0.8 b 0.7 ± 0.1 a 1.3 ± 0.1 ab 0.72 ± 0.05 a 1 × 10⁻³
73.065 73.065 C4H9O+ 77 ± 2 b 82 ± 7 b 24 ± 1 a 76 ± 7 b 17.2 ± 0.9 a 1 × 10⁻¹⁶
75.044 75.044 C3H7O2+ 1.4 ± 0.2 a 20 ± 1 b 1.2 ± 0.2 a 1.4 ± 0.3 a 1.4 ± 0.2 a 1 × 10⁻²¹
83.086 83.086 C6H11+ 1.6 ± 0.1 b 1.7 ± 0.1 b 0.7 ± 0.0 a 1.8 ± 0.2 b 0.71 ± 0.04 a 4 × 10⁻¹⁴
87.044 87.044 C4H7O2+ 3.7 ± 0.5 bc 3.8 ± 0.9 bc 3.0 ± 0.4 ab 4.3 ± 0.4 c 2.0 ± 0.3 a 2 × 10⁻⁵
87.081 87.08 C5H11O+ 61 ± 2 c 66 ± 5 c 43 ± 2 b 61±6c 23 ± 2 a 6 × 10⁻¹³
89.060 89.06 C4H9O2+ 2.2 ± 0.6 a 5.2 ± 0.6 c 2.9 ± 0.3 ab 2±1ab 3.5 ± 0.3 b 2 × 10⁻⁶
97.102 97.101 C7H13+ 2.3 ± 0.1 c 2.7 ± 0.2 d 1.8 ± 0.0 b 2.6±0.1d 1.1 ± 0.1 a 4 × 10⁻¹⁴
101.097 101.096 C7H7O+ 1.7 ± 0.1 c 2.0 ± 0.1 d 1.0 ± 0.0 b 2.0±0.2d 0.6 ± 0.1 a 5 × 10⁻¹⁴
115.113 115.112 C7H15O+ 28 ± 1 c 30 ± 2 c 20.5 ± 0.6 b 30±2c 12 ± 1 a 7 × 10⁻¹⁴
143.145 143.143 C9H19O+ 2.1 ± 0.1 c 2.5 ± 0.2 d 1.7 ± 0.1 b 2.4±0.2d 1.1 ± 0.1 a 2 × 10⁻¹²
This panel of 22 peaks includes only 9 masses detected also by the GC analysis, thus providing abroader overview of the diversity among samples associated with VOCs content. Comparing thesefindings with a recent PTR headspace analysis of other dairy product of industrial interest (milk powder,whey powder and anhydrous milk fat), the mass peaks 47.049, 63.026, 73.065, 87.081, 89.060, 101.097,115.113, 143.145 seem to be peculiar of mascarpone headspace [26], indicating a potential role of thecorresponding volatiles in shaping perceptions associated to Mascarpone consumption. Additionally,on the other hand, we found variable trends in mass peaks already detected in association with theheadspaces of skim milk powder (43.018, 61.029, 87.044, 97.102), whole milk powder (41.039, 43.018,45.033, 55.054, 61.029, 71.086, 75.044, 83.086, 87.044), whey powder (43.018, 59.049, 61.029, 75.044), andanhydrous milk fat (43.018, 43.054, 57.070, 69.070) [26]. This partial and specific overlapping, in termsof volatiles content, with the headspaces of other dairy ingredients/products, can be probably of helpin the understanding of the unique sensory properties of mascarpone matrix.
Finally, in order to provide more complete information about the preliminary potential that arisesfrom the PTR data in terms of separation of delactosed products, we propose two PCA representations,analyzing samples with or without lactose for the Manufacturers C and M, respectively (Figure 4).

Molecules 2020, 25, 1242 10 of 14Molecules 2019, 24, x FOR PEER REVIEW 10 of 14
(a) (b)
Figure 4. Analysis of mascarpone VOCs profile assessed by PTR-ToF-MS for the Manufacturers C (a)
and M (b) plotted by the first and the third principal components. The labels and the selected areas
indicate the separation between samples with or without lactose.
Figure 4a (Manufacturer C) and 4b (Manufacturer M) show that mascarpone samples classic
and delactosed in this subset (different producers) are separated along the first and third PC
(explaining 47.6% and 57.9% of the total variance, respectively). Even if preliminary, these results
confirm the potential of PTR-TOF-MS analysis for the quality evaluation of lactose-free dairy
products. In fact, recently, this analytical approach found application to monitor VOC variability in
ultrahigh temperature lactose-free milk samples (assessing the impact of storage time and the of the
use of different lactase preparations) [39]
3. Materials and Methods
3.1. Sample Selection and Preparation
A total of 12 different mascarpone batches were studied in this project that are listed in Table 1.
The corresponding chemicophysical characteristics are reported in Table S1.
We obtained the samples from different local markets and stored them at 4 °C. The samples
represent different manufacturers, all analyzed within the expiration date, and both plain and
delactosed Mascarpone.
3.2. HS-SPME GC-MS Measurements
Aliquots of 8 mL of sample were placed in a 20 mL vials that were immediately sealed with a
silicone rubber Teflon cap and crimped with aluminium seal. Then samples were heated at 60 °C
and kept at the same temperature for 30 min while a polydimethylsiloxane/divinylbenzene SPME
fibre (Supelco, Bellefonte, PA, USA) was exposed to the headspace over the surface of each sample in
order to collect the compounds in the vapour phase. The exposure time was optimized in
preliminary experimental trials. The SPME coating containing the headspace volatile compounds
was inserted into the GC injection port and then thermally desorbed at 250 °C for 10 min in a 6890
GC (Agilent Technologies, Santa Clara, CA, United States). Compounds were eluted by a He gas
flow of 1,4 mL/min in split mode (split 1:4) and separated using a 60 m Varian FactorFour WAXms
capillary column (film thickness 0.25 mm, 0.25 mm internal diameter) (Varian, Middelburg, The
Netherlands). The oven temperature, initially set to 35 °C, was increased to 210 °C at 4 °C/min, then
to 240 °C at a rate of 20 °C/min, and then this final temperature was held for 5 min. The mass
Figure 4. Analysis of mascarpone VOCs profile assessed by PTR-ToF-MS for the Manufacturers C (a)and M (b) plotted by the first and the third principal components. The labels and the selected areasindicate the separation between samples with or without lactose.
Figure 4a (Manufacturer C) and 4b (Manufacturer M) show that mascarpone samples classic anddelactosed in this subset (different producers) are separated along the first and third PC (explaining47.6% and 57.9% of the total variance, respectively). Even if preliminary, these results confirm thepotential of PTR-TOF-MS analysis for the quality evaluation of lactose-free dairy products. In fact,recently, this analytical approach found application to monitor VOC variability in ultrahigh temperaturelactose-free milk samples (assessing the impact of storage time and the of the use of different lactasepreparations) [39]
3. Materials and Methods
3.1. Sample Selection and Preparation
A total of 12 different mascarpone batches were studied in this project that are listed in Table 1.The corresponding chemicophysical characteristics are reported in Table S1.
We obtained the samples from different local markets and stored them at 4 ◦C. The samplesrepresent different manufacturers, all analyzed within the expiration date, and both plain anddelactosed Mascarpone.
3.2. HS-SPME GC-MS Measurements
Aliquots of 8 mL of sample were placed in a 20 mL vials that were immediately sealed with asilicone rubber Teflon cap and crimped with aluminium seal. Then samples were heated at 60 ◦Cand kept at the same temperature for 30 min while a polydimethylsiloxane/divinylbenzene SPMEfibre (Supelco, Bellefonte, PA, USA) was exposed to the headspace over the surface of each sample inorder to collect the compounds in the vapour phase. The exposure time was optimized in preliminaryexperimental trials. The SPME coating containing the headspace volatile compounds was insertedinto the GC injection port and then thermally desorbed at 250 ◦C for 10 min in a 6890 GC (AgilentTechnologies, Santa Clara, CA, United States). Compounds were eluted by a He gas flow of 1,4 mL/minin split mode (split 1:4) and separated using a 60 m Varian FactorFour WAXms capillary column (filmthickness 0.25 mm, 0.25 mm internal diameter) (Varian, Middelburg, The Netherlands). The oven
Molecules 2020, 25, 1242 11 of 14
temperature, initially set to 35 ◦C, was increased to 210 ◦C at 4 ◦C/min, then to 240 ◦C at a rate of20 ◦C/min, and then this final temperature was held for 5 min. The mass spectrometer was set toelectron ionization mode (MS-EI) generated at 70 eV, and mass spectra were collected in full scan mode,collecting ions from 39 to 250 m/z. The volatile compounds studied were identified by comparing theirmass spectra and their retention times to those of reference standards analyzed at the same conditionsand by comparison with spectra recorded in the Wiley 6 N mass spectral library (Wiley, Hoboken, NJ,USA) and, when needed, to literature references. Due to the lengthy HS-SPME GC/MS analysis, onlyfour samples have been analysed by this method. For each sample, four replicates were analyzed.
3.3. PTR-ToF-MS Measurements
A commercial PTR-ToF-MS 8000 instrument (Ionicon Analytik GmbH, Innsbruck, Austria)was used for the headspace measurements. The instrumental conditions in the drift tube were asfollowing—drift voltage 550 V, drift temperature 110 ◦C, drift pressure 2.30 mbar affording an E/Nvalue of 140 Townsend (1 Td = 10−17 V.cm2). Sampling was performed with a flow rate of 40 sccm.The mass resolution (m/∆m) was at least 3800. Measurements were performed in an automated wayby using a multipurpose GC automatic sampler (Gerstel GmbH, Mulheim am Ruhr, Germany) aspreviously described [11]. The measurement order, both samples and replicates, was randomizedto avoid memory effects. All vials were incubated at 40 ◦C for 30 min before PTR-MS analysis.Each sample was measured for 30 s, at an acquisition rate of 1 spectrum per second with an overallthroughput of one sample every 5 min. The experiment was repeated at 60 ◦C, the temperature atwhich HS-SPME GC-MS provided better results. The entire experiment was repeated three timesand empty vials, containing lab air, were measured together with the sample set and considered as“blanks”. Data processing of PTR-ToF-MS spectra included dead time correction, external calibrationand peak extraction steps performed according to a procedure described elsewhere [40]. The baselineof the mass spectra was removed after averaging the whole measurement and peak detection andpeak area extraction was performed by using modified Gaussian to fit the data [41]. To determine theconcentrations of volatile compounds in ppbv (part per billion by volume) the formulas described byLindinger et al. were used by assuming a constant reaction rate coefficient (kR=2 × 10⁻⁹ cm3/s) forH3O+ as primary ion [42].
3.4. Statistical Analyses
Data exploration was based on Principal Component Analysis (PCA) of centered and scaleddata. Analysis of variance (ANOVA) with Bonferroni correction was performed for selection of masspeaks in the sample headspace which are significantly higher than blanks. After this step, one-wayANOVA followed by Tukey’s HSD (p < 0.05) was applied to evaluate the significant differences amongmascarpone samples. All analyses were performed with core functions of R programming language(R Development Core Team, R Foundation for Statistical Computing, Vienna, Austria, 2014) and itsexternal packages (ChemometricsWithR, DiscriMiner, prospectr). In some cases, in order to interpretthe results of the experiment, the entire dataset was divided into smaller subsets based on differentcriteria (e.g., producer, lactose content).
4. Conclusions
Using two complementary analytical approaches, Headspace-Solid Phase Microextraction-GasChromatography-Mass Spectrometry (HS-SPME GC-MS) and Proton-Transfer Reaction-MassSpectrometry coupled to a Time of Flight mass analyzer (PTR-ToF-MS), the present work provides afirst description of Volatile Organic Compounds (VOCs). In addition, we underline the differences inVOC content susceptible to characterize the aroma of different brands and product types (classic andlactose-free). On the whole, the dominance of volatiles generally associated to floral, fruity, sweet, andnutty notes might contribute to explain the delicate sensory impression perceived by smelling thisfresh dairy product. Unfortunately, the aroma profile of the present investigation cannot be discussed
Molecules 2020, 25, 1242 12 of 14
in light of previous literature that is, as mentioned, very scarce. Considering the wide number ofproducts that use mascarpone as raw material, such as the popular Tiramisù and coffee mascarponecream, this study provides information to design future studies conceived to assess the contribution ofthis unripened cheese to the sensory characteristics of final products.
Supplementary Materials: The following are available online, Table S1: Monitored chemico-physicalcharacteristics for the list of ‘Mascarpone’ samples analyzed in the present study.
Author Contributions: Conceptualization, F.B., and L.N.; methodology, V.L., I.K., L.C., F.B., and L.N.; software,L.C.; validation, L.C., F.B., and L.N.; formal analysis, V.L., and I.K.; investigation, V.C., V.L., and I.K.; resources, F.B.and L.N.; data curation, V.C., V.L., and I.K.; writing—original draft preparation, V.C., V.L., and I.K.; writing—reviewand editing, L.C., F.B., and L.N.; visualization, V.C., V.L., I.K., F.B. and L.N.; supervision, F.B., and L.N.; projectadministration, F.B., and L.N.; funding acquisition, F.B., and L.N. All authors have read and agreed to the publishedversion of the manuscript.
Funding: The work has been partially supported by the Autonomous Province of Trento (ADP 2020).
Acknowledgments: We would like to thank the editor and the three anonymous reviewers for their suggestionsand comments. Vittorio Capozzi acknowledges Francesco De Marzo of the Institute of Sciences of FoodProduction—CNR for the skilled technical support provided during the realization of this work.
Conflicts of Interest: The authors declare no conflict of interest.
References
1. Carminati, D.; Perrone, A.; Neviani, E. Inhibition of Clostridium sporogenes growth in mascarpone cheese byco-inoculation with Streptococcus thermophilus under conditions of temperature abuse. Food Microbiol. 2001,18, 571–579.
2. Franciosa, G.; Pourshaban, M.; Gianfranceschi, M.; Gattuso, A.; Fenicia, L.; Ferrini, A.M.; Mannoni, V.; DeLuca, G.; Aureli, P. Clostridium botulinum spores and toxin in mascarpone cheese and other milk products.J. Food Prot. 1999, 62, 867–871. [PubMed]
3. Hinrichs, J. Mediterranean milk and milk products. Eur. J. Nutr. 2004, 43, i12–i17.4. Del Prato, O.S. Trattato di Tecnologia Casearia; Edagricole: Bologna, Italy, 1998.5. Donelly, C. The Oxford Companion to Cheese; Oxford University Press: New York, NY, USA, 2017; ISBN
978-0-19-933088-1.6. Majchrzak, T.; Wojnowski, W.; Lubinska-Szczygeł, M.; Rózanska, A.; Namiesnik, J.; Dymerski, T. PTR-MS
and GC-MS as complementary techniques for analysis of volatiles: A tutorial review. Anal. Chim. Acta 2018,1035, 1–13. [PubMed]
7. Dewulf, J.; Van Langenhove, H.; Wittmann, G. Analysis of volatile organic compounds using gaschromatography. TrAC Trends Anal. Chem. 2002, 21, 637–646.
8. Panseri, S.; Soncin, S.; Chiesa, L.M.; Biondi, P.A. A headspace solid-phase microextractiongas-chromatographic mass-spectrometric method (HS-SPME–GC/MS) to quantify hexanal in butter duringstorage as marker of lipid oxidation. Food Chem. 2011, 127, 886–889.
9. Biasioli, F.; Gasperi, F.; Yeretzian, C.; Märk, T.D. PTR-MS monitoring of VOCs and BVOCs in food scienceand technology. TrAC Trends Anal. Chem. 2011, 30, 968–977.
10. Jordan, A.; Haidacher, S.; Hanel, G.; Hartungen, E.; Märk, L.; Seehauser, H.; Schottkowsky, R.; Sulzer, P.;Märk, T.D. A high resolution and high sensitivity proton-transfer-reaction time-of-flight mass spectrometer(PTR-TOF-MS). Int. J. Mass Spectrom. 2009, 286, 122–128.
11. Capozzi, V.; Yener, S.; Khomenko, I.; Farneti, B.; Cappellin, L.; Gasperi, F.; Scampicchio, M.; Biasioli, F.PTR-ToF-MS Coupled with an Automated Sampling System and Tailored Data Analysis for Food Studies:Bioprocess Monitoring, Screening and Nose-space Analysis. J. Vis. Exp. 2017, 123, e54075.
12. Marsili, R. Flavors and off-flavors in dairy foods. In Encyclopedia of Dairy Sciences, 2nd ed.; Fuquay, J.W., Ed.;Academic Press: San Diego, CA, USA, 2011; pp. 533–551. ISBN 978-0-12-374407-4.
13. Mutarutwa, D.; Navarini, L.; Lonzarich, V.; Compagnone, D.; Pittia, P. GC-MS aroma characterization ofvegetable matrices: Focus on 3-alkyl-2-methoxypyrazines. J. Mass Spectrom. 2018, 53, 871–881.
14. Delgado, F.J.; González-Crespo, J.; Cava, R.; Ramírez, R. Formation of the aroma of a raw goat milk cheeseduring maturation analysed by SPME–GC–MS. Food Chem. 2011, 129, 1156–1163. [PubMed]
Molecules 2020, 25, 1242 13 of 14
15. Curioni, P.M.G.; Bosset, J.O. Key odorants in various cheese types as determined by gaschromatography-olfactometry. Int. Dairy J. 2002, 12, 959–984.
16. Jung, H.J.; Ganesan, P.; Lee, S.J.; Kwak, H.S. Comparative study of flavor in cholesterol-removed Goudacheese and Gouda cheese during ripening. J. Dairy Sci. 2013, 96, 1972–1983. [PubMed]
17. Mallia, S.; Escher, F.; Rehberger, B.; Schlichtherle-Cerny, H. Aroma-active secondary oxidation products ofbutter. In Proceedings of the 3rd QLIF Congress: Improving Sustainability in Organic and Low Input FoodProduction Systems, Stuttgart, Germany, 20–23 March 2007.
18. Peterson, D.G.; Reineccius, G.A. Characterization of the volatile compounds that constitute fresh sweetcream butter aroma. Flavour Fragr. J. 2003, 18, 215–220.
19. Wang, W.; Zhang, L.; Li, Y. Production of Volatile Compounds in Reconstituted Milk Reduced-Fat Cheeseand the Physicochemical Properties as Affected by Exopolysaccharide-Producing Strain. Molecules 2012, 17,14393–14408. [PubMed]
20. Povolo, M.; Contarini, G. Comparison of solid-phase microextraction and purge-and-trap methods for theanalysis of the volatile fraction of butter. J. Chromatogr. A 2003, 985, 117–125.
21. Qian, M.; Reineccius, G. Identification of aroma compounds in Parmigiano-Reggiano cheese by gaschromatography/olfactometry. J. Dairy Sci. 2002, 85, 1362–1369.
22. Gasperi, F.; Gallerani, G.; Boschetti, A.; Biasioli, F.; Monetti, A.; Boscaini, E.; Jordan, A.; Lindinger, W.;Iannotta, S. The mozzarella cheese flavour profile: A comparison between judge panel analysis and protontransfer reaction mass spectrometry. J. Sci. Food Agric. 2001, 81, 357–363.
23. Boscaini, E.; van Ruth, S.; Biasioli, F.; Gasperi, F.; Märk, T.D. Gas Chromatography−Olfactometry (GC-O)and Proton Transfer Reaction−Mass Spectrometry (PTR-MS) Analysis of the Flavor Profile of Grana Padano,Parmigiano Reggiano, and Grana Trentino Cheeses. J. Agric. Food Chem. 2003, 51, 1782–1790.
24. Gallardo-Escamilla, F.J.; Kelly, A.L.; Delahunty, C.M. Influence of Starter Culture on Flavor and HeadspaceVolatile Profiles of Fermented Whey and Whey Produced from Fermented Milk. J. Dairy Sci. 2005, 88,3745–3753.
25. van Ruth, S.M.; Koot, A.; Akkermans, W.; Araghipour, N.; Rozijn, M.; Baltussen, M.; Wisthaler, A.; Märk, T.D.;Frankhuizen, R. Butter and butter oil classification by PTR-MS. Eur. Food Res. Technol. 2008, 227, 307–317.
26. Makhoul, S.; Yener, S.; Khomenko, I.; Capozzi, V.; Cappellin, L.; Aprea, E.; Scampicchio, M.; Gasperi, F.;Biasioli, F. Rapid non-invasive quality control of semi-finished products for the food industry by directinjection mass spectrometry headspace analysis: The case of milk powder, whey powder and anhydrousmilk fat. J. Mass Spectrom. 2016, 51, 782–791. [PubMed]
27. Benozzi, E.; Romano, A.; Capozzi, V.; Makhoul, S.; Cappellin, L.; Khomenko, I.; Aprea, E.; Scampicchio, M.;Spano, G.; Märk, T.D.; et al. Monitoring of lactic fermentation driven by different starter cultures via directinjection mass spectrometric analysis of flavour-related volatile compounds. Food Res. Int. 2015, 76, 682–688.[PubMed]
28. Yépez, A.; Russo, P.; Spano, G.; Khomenko, I.; Biasioli, F.; Capozzi, V.; Aznar, R. In situ riboflavin fortificationof different kefir-like cereal-based beverages using selected Andean LAB strains. Food Microbiol. 2019, 77,61–68. [PubMed]
29. Romano, A.; Capozzi, V.; Spano, G.; Biasioli, F. Proton transfer reaction-mass spectrometry: Online andrapid determination of volatile organic compounds of microbial origin. Appl. Microbiol. Biotechnol. 2015, 99,3787–3795.
30. Gallardo-Escamilla, F.J.; Kelly, A.L.; Delahunty, C.M. Sensory Characteristics and Related Volatile FlavorCompound Profiles of Different Types of Whey. J. Dairy Sci. 2005, 88, 2689–2699.
31. Burdock, G.A. Fenaroli’s Handbook of Flavor Ingredients; CRC Press: Boca Raton, FL, USA, 2019; ISBN978-1-00-069466-6.
32. Jia, W.; Wang, H.; Shi, L.; Zhang, F.; Fan, C.; Chen, X.; Chang, J.; Chu, X. High-throughput foodomics strategyfor screening flavor components in dairy products using multiple mass spectrometry. Food Chem. 2019, 279,1–11.
33. Puniya, A.K. Fermented Milk and Dairy Products; CRC Press: Boca Raton, FL, USA, 2015; ISBN978-1-4665-7800-5.
34. Cattaneo, T.M.P.; Summa, C.; Bertolo, G.; Giangiacomo, R. Spreadability of Mascarpone cheese: Sensory andobjective measurements. Milchwissenschaft 2005, 60, 399–402.

Molecules 2020, 25, 1242 14 of 14
35. Su, W.-H.; He, H.-J.; Sun, D.-W. Non-Destructive and rapid evaluation of staple foods quality by usingspectroscopic techniques: A review. Crit. Rev. Food Sci. Nutr. 2017, 57, 1039–1051.
36. van den Berg, F.; Lyndgaard, C.B.; Sørensen, K.M.; Engelsen, S.B. Process Analytical Technology in the foodindustry. Trends Food Sci. Technol. 2013, 31, 27–35.
37. Capozzi, V.; Makhoul, S.; Aprea, E.; Romano, A.; Cappellin, L.; Sanchez Jimena, A.; Spano, G.; Gasperi, F.;Scampicchio, M.; Biasioli, F. PTR-MS Characterization of VOCs Associated with Commercial AromaticBakery Yeasts of Wine and Beer Origin. Molecules 2016, 21, 483. [PubMed]
38. Campbell-Sills, H.; Capozzi, V.; Romano, A.; Cappellin, L.; Spano, G.; Breniaux, M.; Lucas, P.; Biasioli, F.Advances in wine analysis by PTR-ToF-MS: Optimization of the method and discrimination of wines fromdifferent geographical origins and fermented with different malolactic starters. Int. J. Mass Spectrom. 2016,397–398, 42–51.
39. Bottiroli, R.; Pedrotti, M.; Aprea, E.; Biasioli, F.; Fogliano, V.; Gasperi, F. Application of PTR-TOF-MS forthe quality assessment of lactose-free milk: Effect of storage time and employment of different lactasepreparations. J. Mass Spectrom. 2020. [CrossRef]
40. Cappellin, L.; Biasioli, F.; Fabris, A.; Schuhfried, E.; Soukoulis, C.; Märk, T.D.; Gasperi, F. Improvedmass accuracy in PTR-TOF-MS: Another step towards better compound identification in PTR-MS. Int. J.Mass Spectrom. 2010, 290, 60–63.
41. Cappellin, L.; Biasioli, F.; Granitto, P.M.; Schuhfried, E.; Soukoulis, C.; Costa, F.; Märk, T.D.; Gasperi, F. Ondata analysis in PTR-TOF-MS: From raw spectra to data mining. Sens. Actuators B Chem. 2011, 155, 183–190.
42. Lindinger, W.; Hansel, A.; Jordan, A. On-line monitoring of volatile organic compounds at pptv levels bymeans of proton-transfer-reaction mass spectrometry (PTR-MS) medical applications, food control andenvironmental research. Int. J. Mass Spectrom. Ion Process. 1998, 173, 191–241.
Sample Availability: Samples of the compounds are not available from the authors.
© 2020 by the authors. Licensee MDPI, Basel, Switzerland. This article is an open accessarticle distributed under the terms and conditions of the Creative Commons Attribution(CC BY) license (http://creativecommons.org/licenses/by/4.0/).