The analysis of antipsychotic drugs in human matrices using LC-MS(/MS)
19
The analysis of antipsychotic drugs in human matrices using LC-MS(/MS) Eva Saar, a * Jochen Beyer, a,b Dimitri Gerostamoulos a,b and Olaf H. Drummer a,b Antipsychotic drugs (APs) are prescribed for a wide range of psychotic illnesses. With more than 35 APs currently available world- wide, this drug class has rapidly gained importance in both clinical and forensic settings. On account of their chemical properties, many APs are present in human specimens at very low concentrations, which complicate their detection using standard gas chro- matography–mass spectrometry (GC-MS) procedures that often cannot provide the required sensitivity. Recent advances in liquid chromatography-(tandem) mass spectrometry LC-MS(/MS) technology have enabled accurate detection and quantification of these compounds in various human specimens, indicated by the increasing number of published methods. Method validation has been a particular focus of analytical chemistry in recent times. Recommendations set by several guidance documents are now widely accepted by the toxicology community, as reflected by the guidelines drafted by leading toxicological societies. This review provides a critical review of single-stage and tandem LC-MS procedures for the detection and quantification of APs, with a particular emphasis on appropriate method validation. The quality of published methods is inconsistent throughout the literature. While the majority of authors incorporate some validation experiments in their respective method development, a large number of published methods lack essential compo- nents of method validation, which are considered mandatory according to the guidelines. If adapting a method for the detection of APs for use in a laboratory, analysts should ensure successful validation experi- ments for appropriateness and completeness have been conducted, and perform additional experiments when indicated. Copyright © 2012 John Wiley & Sons, Ltd. Keywords: antipsychotic drugs; LC-MS(/MS); method validation Introduction In the 1950s, the phenothiazine derivative chlorpromazine was the first drug introduced for the treatment of psychotic illnesses, largely replacing electroconvulsive therapy and psychosurgery. Subsequent to the success of chlorpromazine, a large number of compounds were introduced for the treatment of patients suffering from mental illnesses. The main category of neurolep- tic drugs is the phenothiazine derivatives, butyrophenones, and thioxanthenes, known as ‘typical’ antipsychotics (APs). While these drugs show significant improvement in the symp- toms of psychotic illness, they are also associated with unwanted extrapyramidal side-effects resulting from their activ- ity at dopamine receptors. A new generation of APs introduced around 1995 largely overcame these side-effects via decreased activity at dopamine receptors compared with their traditional counterparts. These ‘second generation’ or ‘atypical’ APs now account for the vast majority of AP prescriptions. Reports in the USA indicate a steady increase from 1.0 M prescriptions in 1995 to 13.3 M in 2008, while typical agents decreased signifi- cantly over the same timeframe. [1] However, studies in recent years have shown that atypical APs are not free from side- effects. An increased risk of mortality in addition to cardiovascu- lar complications have been reported in patients suffering from dementia when treated with atypical APs. [2] Furthermore, second-generation APs do not only increase the risk of diabe- tes [3] compared with typical agents, but also show a similar risk of sudden cardiac death to their typical counterparts. [4] With more than 35 APs currently available worldwide, this drug class has rapidly gained importance in both a clinical and forensic setting, which makes the ability to reliably detect APs in human biological specimens a necessity. In a clinical environment, the analysis of APs in blood is neces- sary in order to monitor patient compliance and to maintain drug concentrations within the recommended therapeutic range of the respective drug. The absence of prescribed APs in a clinical case may also indicate non-compliance, a common issue among patients suffering from mental illness. In a forensic setting, the detection of APs is crucial in determining whether these drugs played a role in the cause of death. A sub-therapeutic concentra- tion of an AP in forensic cases may be particularly relevant in cases where mental disturbances have contributed to the death of a person by another, for example, homicides. Analytically, APs have been traditionally measured using gas chromatography (GC) with mass spectrometry (MS). Zhang et al. [5] presented an overview of bioanalytical methods for the determination of APs up until 2007. The authors focused primarily on GC and liquid-chromatography (LC) methods with * Correspondence to: Ms Eva Saar, Victorian Institute of Forensic Medicine, Department of Forensic Medicine, Monash University, 57–83 Kavanagh St, Southbank, Australia. E-mail: [email protected] a Department of Forensic Medicine, Monash University, Southbank, Victoria, Australia b Victorian Institute of Forensic Medicine, Southbank, Victoria, Australia Drug Test. Analysis (2012) Copyright © 2012 John Wiley & Sons, Ltd. Review Drug Testing and Analysis Received: 24 January 2012 Revised: 17 February 2012 Accepted: 17 February 2012 Published online in Wiley Online Library (wileyonlinelibrary.com) DOI 10.1002/dta.1337
-
Upload
independent -
Category
Documents
-
view
2 -
download
0
Transcript of The analysis of antipsychotic drugs in human matrices using LC-MS(/MS)

ReviewDrug Testing
and Analysis
Received: 24 January 2012 Revised: 17 February 2012 Accepted: 17 February 2012 Published online in Wiley Online Library
(wileyonlinelibrary.com) DOI 10.1002/dta.1337
The analysis of antipsychotic drugs in humanmatrices using LC-MS(/MS)Eva Saar,a* Jochen Beyer,a,b Dimitri Gerostamoulosa,b andOlaf H. Drummera,b
Antipsychotic drugs (APs) are prescribed for a wide range of psychotic illnesses. With more than 35 APs currently available world-wide, this drug class has rapidly gained importance in both clinical and forensic settings. On account of their chemical properties,many APs are present in human specimens at very low concentrations, which complicate their detection using standard gas chro-matography–mass spectrometry (GC-MS) procedures that often cannot provide the required sensitivity. Recent advances in liquidchromatography-(tandem) mass spectrometry LC-MS(/MS) technology have enabled accurate detection and quantification ofthese compounds in various human specimens, indicated by the increasing number of published methods. Method validationhas been a particular focus of analytical chemistry in recent times. Recommendations set by several guidance documents arenow widely accepted by the toxicology community, as reflected by the guidelines drafted by leading toxicological societies. Thisreview provides a critical review of single-stage and tandem LC-MS procedures for the detection and quantification of APs, with aparticular emphasis on appropriate method validation.
The quality of published methods is inconsistent throughout the literature. While the majority of authors incorporate somevalidation experiments in their respective method development, a large number of published methods lack essential compo-nents of method validation, which are considered mandatory according to the guidelines.
If adapting a method for the detection of APs for use in a laboratory, analysts should ensure successful validation experi-ments for appropriateness and completeness have been conducted, and perform additional experiments when indicated.Copyright © 2012 John Wiley & Sons, Ltd.
Keywords: antipsychotic drugs; LC-MS(/MS); method validation
* Correspondence to: Ms Eva Saar, Victorian Institute of Forensic Medicine,Department of Forensic Medicine, Monash University, 57–83 Kavanagh St,Southbank, Australia. E-mail: [email protected]
a Department of Forensic Medicine, Monash University, Southbank, Victoria,Australia
b Victorian Institute of Forensic Medicine, Southbank, Victoria, Australia
Introduction
In the 1950s, the phenothiazine derivative chlorpromazine wasthe first drug introduced for the treatment of psychotic illnesses,largely replacing electroconvulsive therapy and psychosurgery.Subsequent to the success of chlorpromazine, a large numberof compounds were introduced for the treatment of patientssuffering from mental illnesses. The main category of neurolep-tic drugs is the phenothiazine derivatives, butyrophenones,and thioxanthenes, known as ‘typical’ antipsychotics (APs).While these drugs show significant improvement in the symp-toms of psychotic illness, they are also associated withunwanted extrapyramidal side-effects resulting from their activ-ity at dopamine receptors. A new generation of APs introducedaround 1995 largely overcame these side-effects via decreasedactivity at dopamine receptors compared with their traditionalcounterparts. These ‘second generation’ or ‘atypical’ APs nowaccount for the vast majority of AP prescriptions. Reports inthe USA indicate a steady increase from 1.0 M prescriptions in1995 to 13.3 M in 2008, while typical agents decreased signifi-cantly over the same timeframe.[1] However, studies in recentyears have shown that atypical APs are not free from side-effects. An increased risk of mortality in addition to cardiovascu-lar complications have been reported in patients suffering fromdementia when treated with atypical APs.[2] Furthermore,second-generation APs do not only increase the risk of diabe-tes[3] compared with typical agents, but also show a similar riskof sudden cardiac death to their typical counterparts.[4] Withmore than 35 APs currently available worldwide, this drug class
Drug Test. Analysis (2012)
has rapidly gained importance in both a clinical and forensicsetting, which makes the ability to reliably detect APs in humanbiological specimens a necessity.
In a clinical environment, the analysis of APs in blood is neces-sary in order to monitor patient compliance and to maintain drugconcentrations within the recommended therapeutic range ofthe respective drug. The absence of prescribed APs in a clinicalcase may also indicate non-compliance, a common issue amongpatients suffering from mental illness. In a forensic setting, thedetection of APs is crucial in determining whether these drugsplayed a role in the cause of death. A sub-therapeutic concentra-tion of an AP in forensic cases may be particularly relevant incases where mental disturbances have contributed to the deathof a person by another, for example, homicides. Analytically,APs have been traditionally measured using gas chromatography(GC) with mass spectrometry (MS).
Zhang et al.[5] presented an overview of bioanalytical methodsfor the determination of APs up until 2007. The authors focusedprimarily on GC and liquid-chromatography (LC) methods with
Copyright © 2012 John Wiley & Sons, Ltd.
E. Saar et al.
Drug Testing
and Analysis
various detectors such as ultraviolet (UV), nitrogen phosphorus,fluorescence, and electrochemical detection (EC), concluding thatLC was the most suitable separation technique for these mostlyinvolatile compounds. MS/MS in combination with LC now domi-nates the analytical field, providing a particularly convenient tool inthe analysis of APs. The high sensitivity of LC-MS/MS methods oftenallows analysis times to be substantially reduced compared withtraditional UV and ECmethods, which is particularly useful for a largesample throughput or when fast turn-around times are required.Method validation has been a particular focus in recent times, in
order to ensure true performance of methods and provide anobjective tool to establish whether a method works as intended.The reproducibility of an analytical method is mandatory inpreventing serious legal consequences that can result from discre-pancies in forensic investigations. Specific guidelines for methodvalidation were published two decades ago[6,7] and have since beenrevisited by the authors[8,9] to produce contemporary guidelines spec-ifying theminimum requirements formethod validation. These guide-lines are nowwidely accepted in the toxicology community, reflectedin guidelines drafted by leading toxicology societies such as The In-ternational Association of Forensic Toxicologists (TIAFT), the Societyof Forensic Toxicologists (SOFT) and the Society of Toxicologicaland Forensic Chemistry (GTFCh). However, a large number ofmeth-ods still exist that either lack crucial parts of validation, or that havenot adequately performed the obligatory validation experiments.This paper provides a critical review of single-stage and tandem
LC-MS procedures for the detection and quantification of APs witha particular emphasis on appropriate method validation.
Methods
Papers for this review were selected following a comprehensivePubMed search for English articles using LC-MS or LC-MS/MSmethods for the detection of one or more APs in various humanspecimens (blood, plasma, serum, urine, hair, saliva, and cerebro-spinal fluid). Selected papers were reviewed for analytical detailsand assessed with regard to the extent of validation studiesagainst current guidelines.[6–9]
Choice of biosamples
Blood is the preferred specimen for AP analysis as it provides themost accurate representation of the relevant pharmacologicaleffects. In a clinical setting, plasma and serum arematrices of choicefor drug analysis, as they are the most common specimens used indiagnosticmedicine. Therapeutic drugsmonitoring (TDM)methodsare common and are more likely to focus on one or very fewanalytes. Whole blood is the most common specimen used inforensic cases since lysis is common in death investigations, andcentrifugation shortly after collection is not always possible.[10]
Urine is a useful specimen for general unknown screening(GUS) procedures, particularly when overdose is suspected andqualitative results are required. APs are included in most pub-lished non-targeted screening procedures as part of big libraries.However, since these methods lack the ability to produce quanti-tative results, they are less relevant for the detection of APs andwill not be discussed in this review.[11–13] Targeted publishedmethods for detection of APs in urine using LC-MS(/MS) are rareand usually include an additional matrix.[14–17]
wileyonlinelibrary.com/journal/dta Copyright © 20
Hair has become an increasingly popular alternative specimento blood, as drugs and their metabolites are likely to remain inhair samples long after the compounds have been eliminatedfrom the body. Segmental hair analysis in particular can providean indication of the long-term history of drug use in an individ-ual. While hair analysis is frequently used as a tool in the analysisof drugs of abuse, only a limited number of methods targetingAPs in hair using LC-(MS/)MS technology have been publishedto date.[16,18–22]
Oral fluid is used as an alternative to blood, which has increas-ingly gained importance due to the relatively short drug detectionwindows in addition to non-invasive collection of specimens. Thesefactors make oral fluid a useful specimen in circumstances wheretrained medical staff is not available, such as roadside and work-place drug testing. APs are known to reduce salivary flow rate[23]
and may therefore not be ideal for detection in oral fluid. This isreflected in the limited number of published methods for APs[24]
to date using this specimen.Cerebrospinal fluid (CSF) is commonly analyzed in order to
help diagnose various diseases and conditions affecting the cen-tral nervous system (CNS), such as meningitis and encephalitis. Itis also useful in diagnosing bleeding of the brain or tumourswithin the CNS. CSF is most commonly obtained by lumbar punc-ture, a complex and invasive procedure that requires specializedmedical staff. While it is likely that drug concentrations in CSF aremore closely related to pharmacological effects than blood con-centrations, the complicated process of sample collection makesit a less favourable specimen in drug analysis, with only one pub-lished method for the detection of APs.[25]
General considerations
Sample volume and LLOQ
In published analytical methods, sample volumes below 0.1 mlare rare,[24,26–28] whereas volumes closer to 1 ml are frequentlyused. When selecting a sample volume for an analytical methodtargeting APs, several factors must be considered. Using a smallsample volume in an analytical method provides several advan-tages, including easier handling during sample extraction andthe ability to conduct analysis in cases where only limited speci-mens are available – for example, post-mortem cases. However,APs are mostly lipid-soluble weak bases, which are quicklyabsorbed into body fat and organs following administration,signifying a large volume of distribution (VD). Despite their highVD, most common APs also significantly bind to plasma proteins(Fb). Both the large VD and high Fb significantly reduce theamount of unbound drug available in the blood for detection.Analytical requirements dictate that the lowest therapeuticblood concentration of a drug must be quantified. This equatesto determining the lower limit of quantification (LLOQ), usuallyinvolving two different approaches: a signal-to-noise ratio (S/N)of 10 is considered satisfactory[29] and so is a precision and accu-racy of <20% at the desired LLOQ.[6,8] Huang et al. [30] reportedan S/N of 3 at the LLOQ, which is generally acceptable for a limitof detection (LOD), but not for the LLOQ. However, theyconducted validation experiments which confirmed the preci-sion and accuracy at the LLOQ to be within 20%, and thereforemeet acceptance criteria. It needs to be guaranteed that amethod is sufficiently sensitive to fulfill at least one of thesetwo criteria when selecting the sample volume. Table 1 showspharmacokinetic parameters of common APs.
12 John Wiley & Sons, Ltd. Drug Test. Analysis (2012)

Table 1. Pharmacokinetic parameters of common APs.
Drug Common daily oral doserange in adults (mg)1
Blood concentrationsexpected following therapeutic
use (ng/ml)2
t1/2 (h)3 VD (L/Kg)4
9OH-Risperidone* 3–12 10–100 23 N/A
Amisulpride 400–1200 50–400 11–27 13–16
Aripiprazole 10–30 50–350 60–90 4.9
Bromperidol 1–15 1–20 15–35 N/A
Buspirone 20–30 1–10 3–12 5–6
Chlorpromazine 200–600 30–300 7–119 10–35
Chlorprothixene 40–80 20–200 8–12 11–23
Clozapine 300–450 200–800 6–17 2–7
Flupentixol 3–6 1–15 19–39 14.1
Fluphenazine 1–5 2–20 13–58 220
Fluspirilene¥ 2–5 (i.m) N/A 21 days (decanoate) N/A
Haloperidol 1–15 5–50 18 18–30
Levomepromazine 25–50 15–60 15–30 30
Loxapine 20–100 10–100 3–4 N/A
Melperone 100–400 5–40 2–4 7–10
Mesoridazine 100–400 15–100 2–9 3–6
Molindone 50–100 ~500 1.2–2.8 3–6
Olanzapine 5–20 10–100 21–54 10–20
Penfluridol 20–60 (once per week) 4–25 70 N/A
Perazine 50–600 100–230 8–15 N/A
Pericyazine 15–60 5–60 N/A N/A
Perphenazine 12–24 0.6–2.4 8–12 10–35
Pimozide 7–10 15–20 28–214 11–62
Pipamperone 80–120 100–400 12–30 N/A
Prochlorperazine 15–40 10–500 14–27 13–32
Promazine 200–800 10–400 7–17 27–42
Quetiapine 300–450 70–170 6–7 8–12
Risperidone 2–6 10–100 3–20 0.7–2.1
Sertindole 12–20 50–500 N/A 20–40
Sulpiride 400–600 50–400 4–11 2.7
Thioridazine 150–300 200–2000 26–36 18
Thiothixene 6–30 N/A 12–36 N/A
Trifluoperazine 15–20 1–50 7–18 N/A
Triflupromazine 165–375 30–100 N/A N/A
Ziprasidone 40–160 50–120 2–8 1.5–2.3
Zotepine 75–300 5–300 12–30 50–168
Zuclopenthixol 20–50 5–100 12–28 15–20
1: Common daily oral dose data for the treatment of schizophrenia, psychoses or bipolar disorder from DrugdexW Evaluations in the MicromedexW
Internet database.[96] Where the drug is indicated for other disorders (e.g. depressive disorders obtained), dosages may vary.2: Blood concentrations expected following therapeutic use obtained from TIAFT guidelines. [97]
3: Terminal elimination half–life and; 4: Volume of distribution obtained from Baselt. [98]
* : Also referred to as ‘Paliperidone’.¥ : Only available as i.m. injection
Review: The analysis of antipsychotic drugs in human matrices
Drug Testing
and Analysis
Single-analyte methods vs multi-analyte methods
Single-analyte methods are mostly used in a TDM-setting, whereonly specific compounds are the target of drug monitoring. Meth-ods targeting the atypical AP risperidone (RIS) should always in-clude its major metabolite 9OH-risperidone (9OH RIS), also referredto as paliperidone. 9OH RIS is formed by cytochrome (CYP) P450enzymes, specifically CYP2D6, and is likely to contribute to thein vivo effects of RIS.[31] Whilst plasma concentrations of RIS and9OH RIS show a large variation between individuals,[32–34] RIS levelsare generally lower than 9OH RIS levels. In fact, a study measuringplasma concentration of RIS and 9OH RIS after oral administration
Drug Test. Analysis (2012) Copyright © 2012 John Wiley
of RIS in steady-state found RIS was not detectable at a LLOQ of0.1 ng/ml in ~18% of all tested individuals, whereas 9OH RIS wasdetected in all cases.[32] Measuring only the parent compound,especially in TDMmethods, can therefore lead to inaccurate conclu-sions regarding patient compliance.
While the same risk of interferences exists for single-analyte andmulti-analyte procedures, chances are higher that they will beidentified during method development when a greater numberof analytes are included in the method. Generally, multi-analyteprocedures are preferred over single-analyte approaches, as theinclusion of a number of analytes in one method saves timeand resources.
& Sons, Ltd. wileyonlinelibrary.com/journal/dta
E. Saar et al.
Drug Testing
and Analysis
Sample preparation
Extraction of APs from blood, plasma, and serum
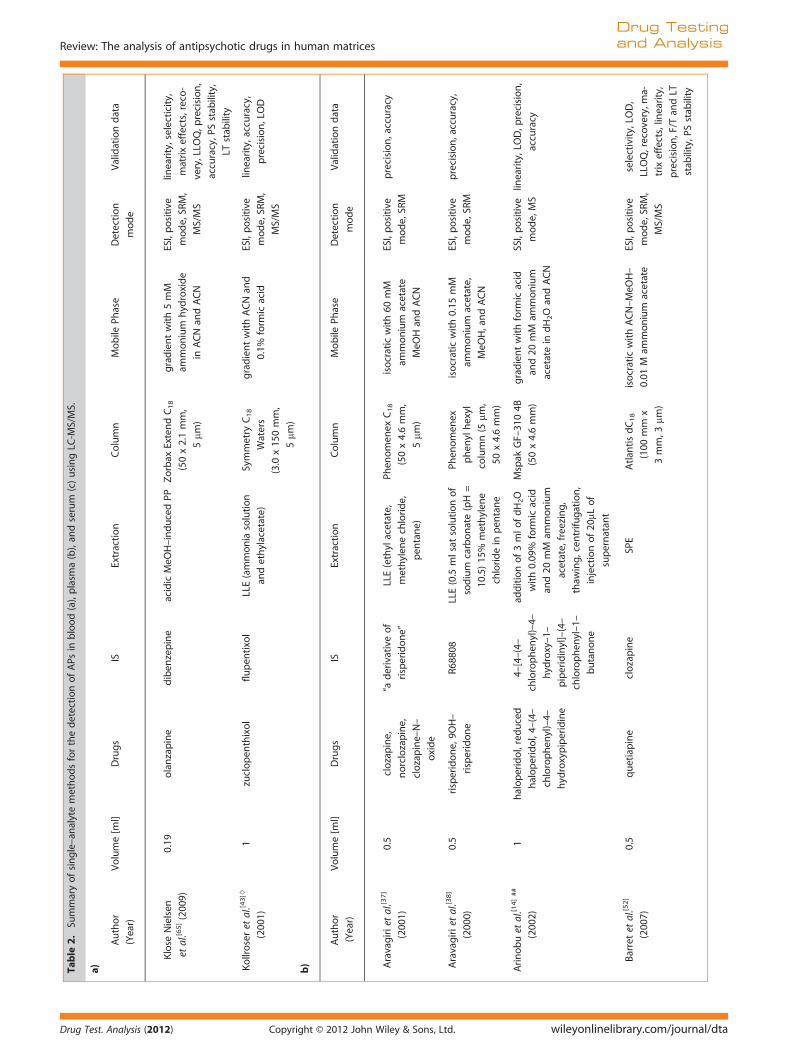
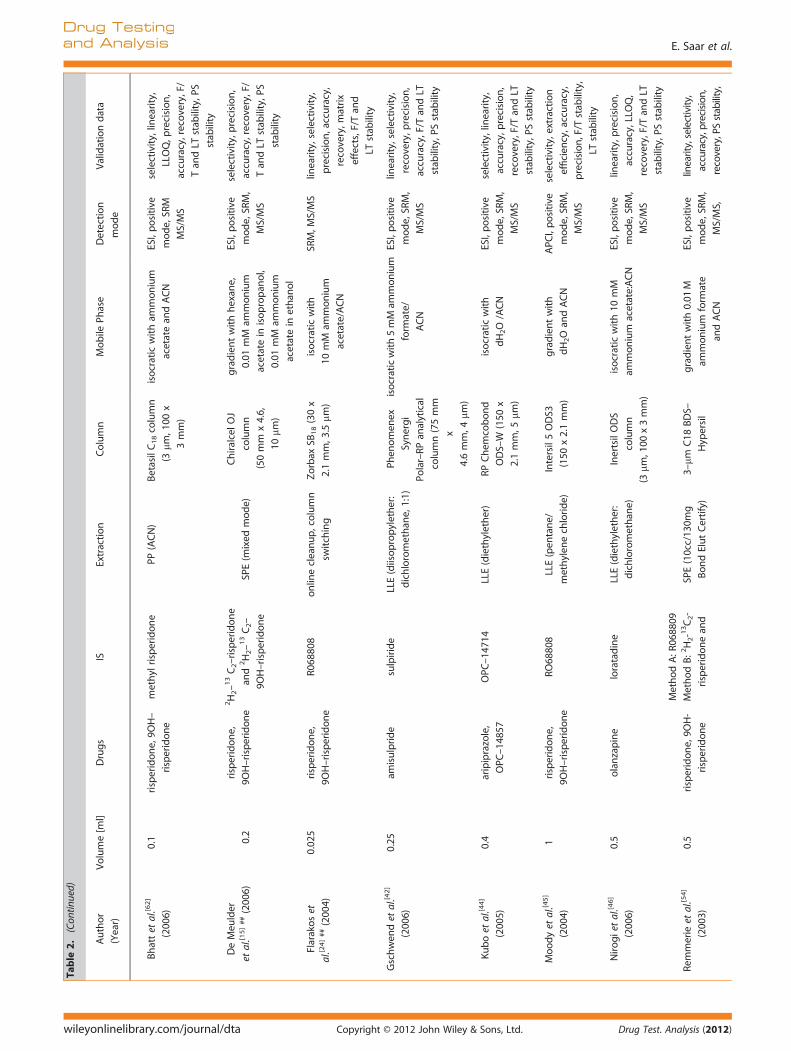
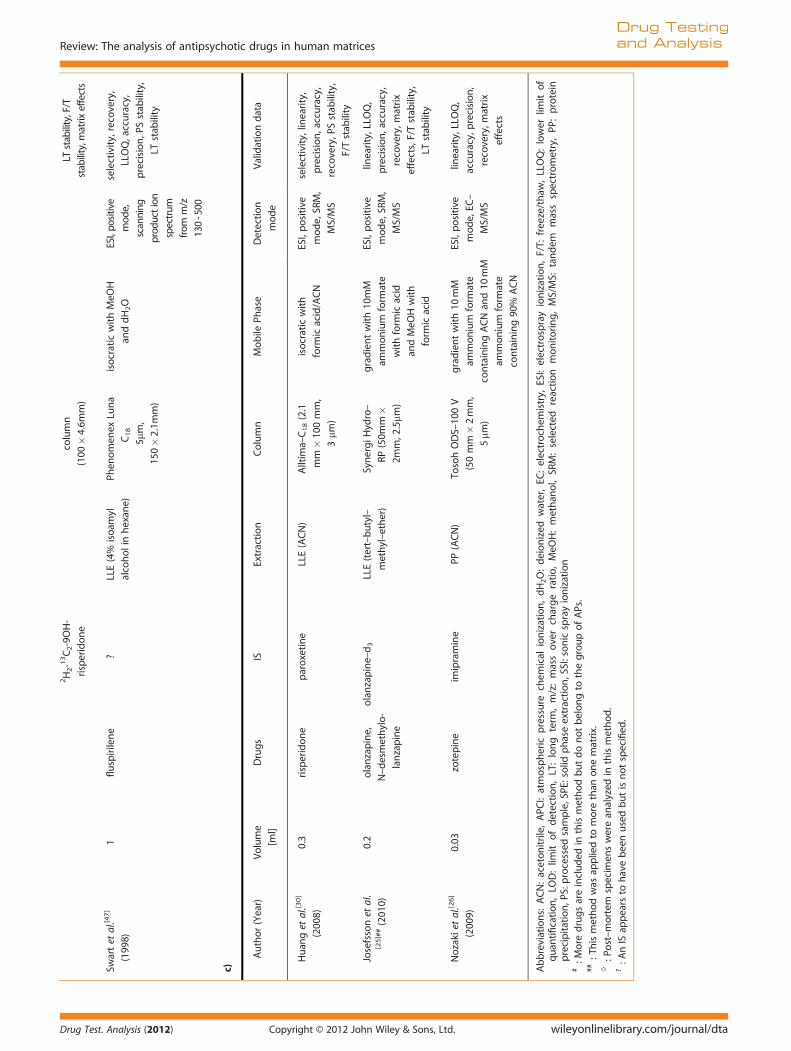
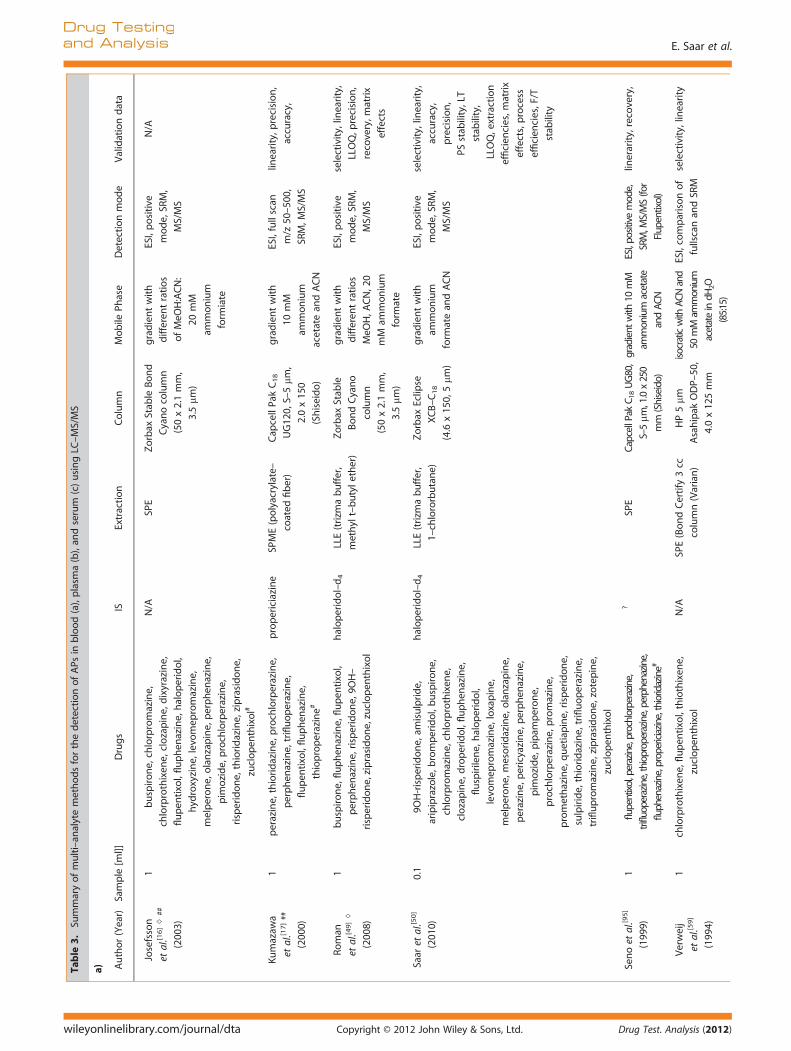
Table 2 shows an overview of currently published single-analyteLC-MS(/MS) methods using blood, plasma, or serum. Table 3 con-tains all published multi-analyte studies.Due to the high specificity of LC-MS methods, it was initially
thought that the sample preparation step may not be as crucialas with other analytical methods, particularly for MS/MS methodssince transitions greatly reduce the risk of interference from otherdrugs. However, this view was soon revised. While endogenouscomponents might no longer be detected using LC-MS methods,they can still significantly interfere with the quantification of adrug.[35,36]
Therefore, liquid-liquid extraction (LLE)[25,30,37–51] and solid-phase extraction (SPE)[15,16,52–59] are still most commonly usedas a sample treatment prior to injection into the LC-MS system,as they provide the most thorough sample clean-up. Saaret al.[60] systematically evaluated nine different combinations ofextraction solvents and buffers in order to find the most suitableLLE method for the extraction of 19 APs.[60] The method showingthe best results overall for extraction recoveries and matrixeffects used trizma buffer and 1-chlorobutane (BuCl) and wassubsequently compared with a standard SPE method. Whileextraction efficiencies were comparable between LLE and SPEmethods, blockages of SPE cartridges were a common problem,especially when dealing with post-mortem samples. Nirogiet al.[46] applied a similar approach when comparing six organicsolvents and their combinations in order to optimize extractionrecovery for their method targeting olanzapine (OLZ) in plasma.A mixture of diethylether and dichloromethane (7:3, v/v) yieldedthe highest recovery of OLZ and was therefore used in theirdetection method. Gutteck et al.[48] stated that due to the differ-ent ‘extraction coefficients. . . and different concentration rangesin human serum’, four different extraction procedures had to beapplied for determination of thirteen antidepressants and fiveAPs. Minor variations in organic solvents used for the LLE, differ-ences in the volumes of the mobiles phases and varying internalstandards mark the differences between the four methods. Amore practical approach would have been to have one extractionmethod and chromatographic conditions that allowed the analy-sis of all drugs in a single cost-effective method, especially since itis not clear which factors resulted in the development of the fourdifferent methods.Simple protein-precipitation (PP) may be used for ‘cleaner’
matrices such as serum or plasma. [26,27,61,62] It needs to be noted,however, that matrix effects must be investigated closely as PPmight fail to remove phospholipids from plasma or serum whichmight cause interferences.[63,64] Interestingly, Klose Nielsen et al. [65]
compared LLE methods with different combinations of organicsolvents and SPE techniques prior to the development of theirmethod for the determination of OLZ in whole blood, and foundnone of them to be functional. However, a simple PP appeared toproduce sound results. Fewmethods employed direct-injection,[14,28]
while one published method used direct injection in combinationwith column switching [24] in order to decrease matrix influences.One published approach uses solid-phase micro-extraction (SPME)as a solvent-free and concentrating extraction technique.[17] Whiletraditionally combined with GC, employing heat assisted desorp-tion from the fibre, a simple interface coupling SPME with LCmakes it functional for non-volatile substances. Online-SPEhas been applied in order to reduce human error and increase
wileyonlinelibrary.com/journal/dta Copyright © 20
time-efficiency.[57] Upscaling of the extraction is achieved bywork-up in the 96-well format.[27,53]
Extraction of APs from hair
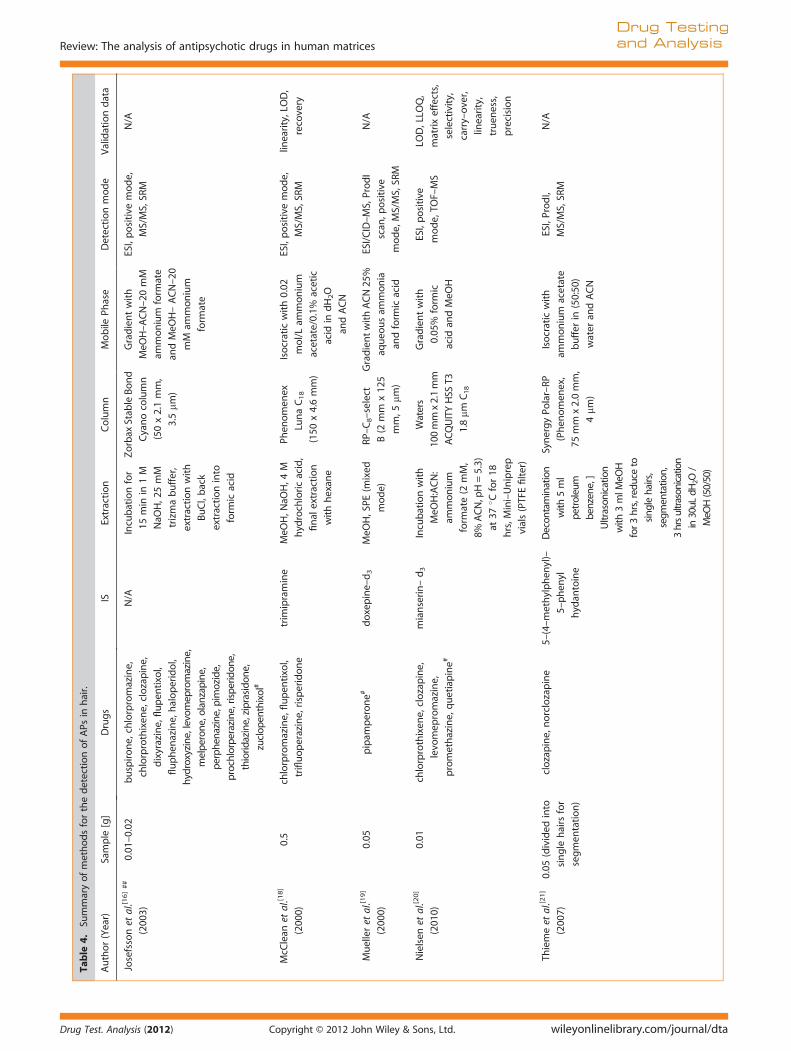
Table 4 shows an overview of methods published for the detec-tion of APs in hair, using LC-MS(/MS).
The Society of Hair Testing recommends that hair be washedprior to analysis (e.g. in methanol (MeOH)) and the wash solutionbe subsequently analyzed for drug content.[66] A high concentra-tion of the drug of interest in the wash solution may indicateexternal contamination of the hair sample. To date, however, aconclusion has not been reached concerning the best deconta-mination strategy.[67–73]
Among the most commonly used extraction procedures forhair analysis are alkaline hydrolysis using NaOH followed bySPE, or extraction with MeOH and aqueous buffer using anultrasonicator.[74] Whilst both techniques are used for analysisof APs in hair, methods using NaOH appear to be preferable foralkaline-stable drugs such as APs. Josefsson et al. [16] did notattempt a full validation of their LC-MS/MS method for the iden-tification of 19 APs and their major metabolites in hair. Incubationwith NaOH was performed prior to extraction with BuCl and backextraction into formic acid. Two SRM transitions were chosen perAP (and where possible per metabolite) for identification of thedrugs of interest. The authors highlighted the importance ofincluding metabolites of drugs of interest in hair methods. In hairanalysis, the issue of incorporation of a drug into the hair fromexternal sources rather than ingestion is a frequent point of dis-cussion, especially in court cases where an accused person deniesthe use of a drug. For some drugs, the presence of metabolites ina certain ratio to the parent drug can be an additional indicationthat ingestion of the drug has occurred and facilitate interpreta-tion of results of hair analyses.[75]
Nielsen et al. [20] tested different combinations and ratios oforganic and aqueous solvents prior to the development of theirdetection and quantification method. This involved 52 commonpharmaceuticals and drugs of abuse in hair, including five APs.This ‘mixed’ approach was fully validated in accordance withinternational guidelines.[9] When extracting basic compoundssuch as APs from hair, the use of a neutral or slightly acidic aque-ous buffer is recommended in order to facilitate ionization of thecompounds prior to transition into the aqueous phase.[74] Muelleret al.[19] and Weinmann et al.[22] performed ultrasonication withMeOH prior to mixed-mode SPE. Thieme et al.[21] divided theinitial 50 mg segment of hair into individual hairs prior to analy-sis; 30 fg on column was sufficient to detect clozapine in singlehairs. The authors, however, acknowledge the uncertainty associ-ated with hair analysis, mainly resulting from the unknown recov-ery of drug from hair combined with the uncertainty of the exactlength of single hair segments.
Extraction of APs from cerebrospinal fluid, oral fluid, and urine
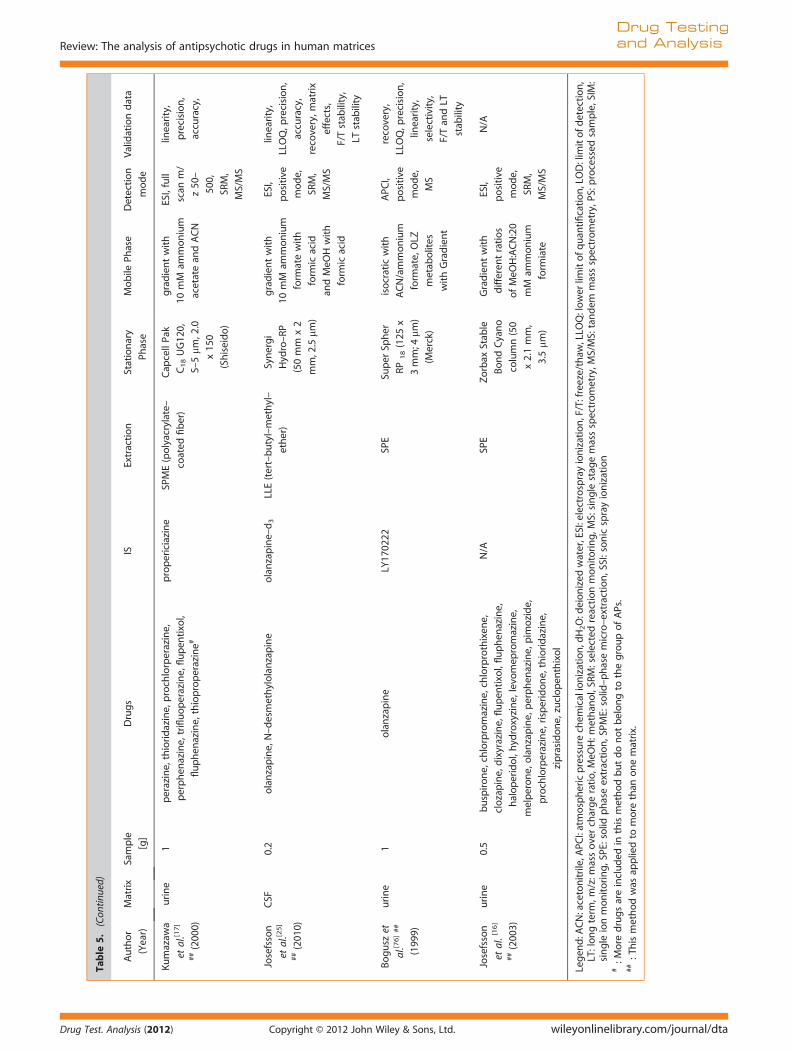
Table 5 shows an overview of published methods for the detec-tion of APs in CSF, oral fluid, and urine using LC-MS(/MS).
Several authors have attempted to validate previously devel-oped methods for the detection of APs in plasma or blood forurine[14,15,17]. Bogusz et al.[76] applied full-scan mode to urinesamples of patients treated with OLZ in order to find proposedmetabolites. A large number of OLZ metabolites in urine havebeen confirmed by Kassahun et al. in their comprehensive study
12 John Wiley & Sons, Ltd. Drug Test. Analysis (2012)
Table
2.Su
mmaryofsingle–an
alytemethodsforthedetectionofAPs
inblood(a),plasm
a(b),an
dserum
(c)usingLC
-MS/MS.
a)
Author
(Year)
Volume[m
l]Drugs
ISExtraction
Column
Mobile
Phase
Detection
mod
e
Validationdata
Klose
Nielsen
etal.[6
5](200
9)
0.19
olanzapine
diben
zepine
acidicMeO
H–induced
PPZorbax
ExtendC18
(50x2.1mm,
5mm
)
gradientwith5mM
ammon
ium
hyd
roxide
inACNan
dACN
ESI,positive
mod
e,SR
M,
MS/MS
linearity,selecticity,
matrixeffects,reco-
very,LLO
Q,p
recision,
accuracy,P
Sstab
ility,
LTstab
ility
Kollroseret
al.[4
3]◊
(200
1)
1zuclopen
thixol
flupen
tixol
LLE(ammonia
solution
andethylacetate)
Symmetry
C18
Waters
(3.0
x15
0mm,
5mm
)
gradientwithACNan
d
0.1%
form
icacid
ESI,positive
mod
e,SR
M,
MS/MS
linearity,accuracy,
precision,LOD
b)
Author
(Year)
Volume[m
l]Drugs
ISExtraction
Column
Mobile
Phase
Detection
mode
Validationdata
Aravagirietal.[3
7]
(200
1)
0.5
clozapine,
norclozapine,
clozapine–N–
oxide
“aderivativeof
risperidone”
LLE(ethylacetate,
methylen
echloride,
pen
tane)
Phen
omen
exC18
(50x4.6mm,
5mm
)
isocraticwith60
mM
ammonium
acetate
MeO
Han
dACN
ESI,positive
mod
e,SR
M
precision,accuracy
Aravagirietal.[3
8]
(200
0)
0.5
risperidone,9O
H–
risperidon
e
R688
08LLE(0.5
mlsat
solution
of
sodium
carbonate(pH=
10.5)15
%methylen
e
chloridein
pen
tane
Phen
omen
ex
phen
ylhexyl
column(5
mm,
50x4.6mm)
isocraticwith0.15
mM
ammonium
acetate,
MeO
H,andACN
ESI,positive
mod
e,SR
M
precision,accuracy,
Arinobuet
al.[1
4]##
(200
2)
1halop
eridol,reduced
haloperidol,4–
(4–
chlorophen
yl)–4–
hyd
roxypiperidine
4–[4–(4–
chlorophen
yl)–4–
hyd
roxy–1–
piperidinyl]–(4–
chlorophen
yl–1–
butanon
e
additionof3mlo
fdH2O
with0.09
%form
icacid
and20
mM
ammonium
acetate,freezing,
thaw
ing,cen
trifu
gation,
injectionof20
mLof
supernatan
t
Mspak
GF–31
04B
(50x4.6mm)
gradientwithform
icacid
and20
mM
ammonium
acetatein
dH2Oan
dACN
SSI,positive
mode,MS
linearity,LOD,p
recision,
accuracy
Barretet
al.[5
2]
(200
7)
0.5
quetiapine
clozapine
SPE
Atlan
tisdC18
(100
mm
x
3mm,3
mm)
isocraticwithACN–MeO
H–
0.01
Mam
mon
ium
acetate
ESI,positive
mod
e,SR
M,
MS/MS
selectivity,LO
D,
LLOQ,recovery,m
a-
trixeffects,lin
earity,
precision,F/T
andLT
stab
ility,P
Sstab
ility
Review: The analysis of antipsychotic drugs in human matrices
Drug Testing
and Analysis
Drug Test. Analysis (2012) Copyright © 2012 John Wiley & Sons, Ltd. wileyonlinelibrary.com/journal/dta
Author
(Year)
Volume[m
l]Drugs
ISExtraction
Column
Mobile
Phase
Detection
mod
e
Validationdata
Bhattet
al.[6
2]
(200
6)
0.1
risperidon
e,9O
H–
risperidone
methylrisperidon
ePP
(ACN)
BetasilC18column
(3mm
,100
x
3mm)
isocraticwitham
mon
ium
acetatean
dACN
ESI,positive
mod
e,SR
M
MS/MS
selectivity,lin
earity,
LLOQ,p
recision,
accuracy,recovery,F/
Tan
dLT
stab
ility,P
S
stab
ility
DeMeu
lder
etal.[1
5]##(200
6)0.2
risperidon
e,
9OH–risperidon
e
2H2–13C2–risperidone
and
2H2–13C2–
9OH–risperidon
e
SPE(m
ixed
mode)
ChiralcelO
J
column
(50mm
x4.6,
10mm
)
gradientwithhexan
e,
0.01
mM
ammon
ium
acetatein
isopropan
ol,
0.01
mM
ammon
ium
acetatein
ethan
ol
ESI,positive
mod
e,SR
M,
MS/MS
selectivity,precision,
accuracy,recovery,F/
Tan
dLT
stab
ility,P
S
stab
ility
Flarakoset
al.[2
4]##(200
4)
0.02
5risperidon
e,
9OH–risperidon
e
R068
808
onlin
ecleanup
,column
switching
Zorbax
SB18(30x
2.1mm,3
.5mm
)
isocraticwith
10mM
ammon
ium
acetate/ACN
SRM,M
S/MS
linearity,selectivity,
precision,accuracy,
recovery,m
atrix
effects,F/Tan
d
LTstab
ility
Gschwen
det
al.[4
2]
(200
6)
0.25
amisulpride
sulpiride
LLE(diisopropylether:
dichloromethan
e,1:1)
Phen
omen
ex
Synergi
Polar–RP
analytical
column(75mm
x
4.6mm,4
mm)
isocraticwith5mM
ammon
ium
form
ate/
ACN
ESI,positive
mod
e,SR
M,
MS/MS
linearity,selectivity,
recovery,p
recision,
accuracy,F/T
andLT
stab
ility,P
Sstab
ility
Kuboet
al.[4
4]
(200
5)
0.4
aripiprazole,
OPC
–14
857
OPC
–14
714
LLE(diethylether)
RPChem
cobond
ODS–W
(150
x
2.1mm,5
mm)
isocraticwith
dH2O/ACN
ESI,positive
mod
e,SR
M,
MS/MS
selectivity,lin
earity,
accuracy,p
recision,
recovery,F/T
andLT
stab
ility,P
Sstab
ility
Moodyet
al.[4
5]
(200
4)
1risperidon
e,
9OH–risperidon
e
RO68
808
LLE(pen
tane/
methylen
echloride)
Intersil5ODS3
(150
x2.1mm)
gradientwith
dH2Oan
dACN
APC
I,positive
mod
e,SR
M,
MS/MS
selectivity,extraction
efficien
cy,accuracy,
precision,F/T
stab
ility,
LTstab
ility
Nirogietal.[4
6]
(200
6)
0.5
olanzapine
loratadine
LLE(diethylether:
dichloromethan
e)
InertsilODS
column
(3mm
,100
x3mm)
isocraticwith10
mM
ammon
ium
acetate:ACN
ESI,positive
mod
e,SR
M,
MS/MS
linearity,p
recision,
accuracy,LLO
Q,
recovery,F/T
andLT
stab
ility,P
Sstab
ility
MethodA:R
0688
09
Remmerie
etal.[5
4]
(200
3)
0.5
risperidon
e,9O
H-
risperidone
MethodB:2H2-13C2-
risperidon
ean
d
SPE(10cc/13
0mg
BondElutCertify)
3–mm
C18
BDS–
Hyp
ersil
gradientwith0.01
M
ammon
ium
form
ate
andACN
ESI,positive
mod
e,SR
M,
MS/MS,
linearity,selectivity,
accuracy,precision
,
recovery,PSstability,
Table
2.(Con
tinued)
E. Saar et al.
Drug Testing
and Analysis
wileyonlinelibrary.com/journal/dta Copyright © 2012 John Wiley & Sons, Ltd. Drug Test. Analysis (2012)
2H2-13C2-9OH-
risperidone
column
(100
�4.6m
m)
LTstability,F/T
stability,m
atrix
effects
Swartet
al.[4
7]
(199
8)
1fluspirilene
?LLE(4%
isoam
yl
alcoholinhexan
e)
Phen
omen
exLu
na
C18
5mm,
150�2.1m
m)
isocraticwithMeO
H
anddH2O
ESI,po
sitive
mod
e,
scanning
prod
uction
spectrum
from
m/z
130-500
selectivity,recovery,
LLOQ,accuracy,
precision,P
Sstab
ility,
LTstab
ility
c)
Author(Year)
Volume
[ml]
Drugs
ISExtraction
Column
Mobile
Phase
Detection
mod
e
Validationdata
Huan
get
al.[3
0]
(200
8)
0.3
risperidon
eparoxetine
LLE(ACN)
Alltim
a–C18(2.1
mm�10
0mm,
3mm
)
isocraticwith
form
icacid/ACN
ESI,positive
mod
e,SR
M,
MS/MS
selectivity,lin
earity,
precision,accuracy,
recovery,P
Sstab
ility,
F/Tstab
ility
Josefssonet
al.
[25]##(201
0)
0.2
olanzapine,
N–desmethylo-
lanzapine
olanzapine–d3
LLE(tert–butyl–
methyl–ether)
SynergiH
ydro–
RP(50m
m�
2mm,2
.5mm
)
gradientwith10
mM
ammon
ium
form
ate
withform
icacid
andMeO
Hwith
form
icacid
ESI,positive
mod
e,SR
M,
MS/MS
linearity,LLO
Q,
precision,accuracy,
recovery,m
atrix
effects,F/Tstab
ility,
LTstab
ility
Nozakietal.[2
6]
(200
9)
0.03
zotepine
imipramine
PP(ACN)
TosohODS–10
0V
(50mm�2mm,
5mm
)
gradientwith10
mM
ammon
ium
form
ate
containingACNan
d10
mM
ammon
ium
form
ate
containing90
%ACN
ESI,positive
mod
e,EC
–
MS/MS
linearity,LLO
Q,
accuracy,p
recision,
recovery,m
atrix
effects
Abbreviations:
ACN:aceton
itrile,APC
I:atmospheric
pressure
chem
ical
ionization,dH2O:deionized
water,EC
:electrochem
istry,
ESI:electrosprayionization,F/T:
freeze/thaw
,LLOQ:lower
limit
of
quan
tification,LO
D:lim
itofdetection,LT:long
term
,m/z:massovercharge
ratio,MeO
H:methan
ol,SR
M:selected
reaction
mon
itoring,MS/MS:
tandem
massspectrometry,PP
:protein
precipitation,P
S:processed
sample,SPE
:solid
phaseextraction,SSI:sonicsprayionization
#:M
ore
drugsareinclud
edin
thismethodbutdonot
belongto
thegroupofAPs.
##:Thismethod
was
appliedto
more
than
onematrix.
◊:P
ost–mortem
specim
enswerean
alyzed
inthismethod
.?:A
nIS
appears
tohavebeenusedbutisnotspecified
.
Review: The analysis of antipsychotic drugs in human matrices
Drug Testing
and Analysis
Drug Test. Analysis (2012) Copyright © 2012 John Wiley & Sons, Ltd. wileyonlinelibrary.com/journal/dta
Table
3.Su
mmaryofmulti–an
alytemethod
sforthedetectionofAPs
inblood(a),plasm
a(b),an
dserum
(c)usingLC
–MS/MS
a) Author(Year)
Sample
[ml]]
Drugs
ISExtraction
Column
Mobile
Phase
Detectionmode
Validationdata
Josefsson
etal.[1
6]◊
##
(200
3)
1buspirone,chlorpromazine,
chlorprothixen
e,clozapine,dixyrazine,
flupen
tixol,fluphen
azine,haloperidol,
hyd
roxyzine,levo
mep
romazine,
melperone,olanzapine,perphen
azine,
pim
ozide,prochlorperazine,
risperidone,thioridazine,ziprasidone,
zuclopen
thixol#
N/A
SPE
Zorbax
Stab
leBond
Cyanocolumn
(50x2.1mm,
3.5mm
)
gradientwith
differen
tratios
ofMeO
H:ACN:
20mM
ammon
ium
form
iate
ESI,positive
mod
e,SR
M,
MS/MS
N/A
Kumazaw
a
etal.[1
7]##
(200
0)
1perazine,thioridazine,prochlorperazine,
perphen
azine,trifluoperazine,
flupen
tixol,fluphen
azine,
thioproperazine#
propericiazine
SPME(polyacrylate–
coated
fiber)
Cap
cellPa
kC18
UG12
0,S–5mm
,
2.0x15
0
(Shiseido)
gradientwith
10mM
ammon
ium
acetatean
dACN
ESI,fullscan
m/z
50–50
0,
SRM,M
S/MS
linearity,p
recision,
accuracy,
Roman
etal.[4
9]◊
(200
8)
1buspirone,fluphen
azine,flupen
tixol,
perphen
azine,risperidon
e,9O
H–
risperidon
e,ziprasidone,zuclopen
thixol
halop
eridol–d4
LLE(trizm
abuffer,
methylt–butyle
ther)
Zorbax
Stab
le
BondCyano
column
(50x2.1mm,
3.5mm
)
gradientwith
differen
tratios
MeO
H,A
CN,2
0
mM
ammon
ium
form
ate
ESI,positive
mod
e,SR
M,
MS/MS
selectivity,lin
earity,
LLOQ,p
recision,
recovery,m
atrix
effects
Saar
etal.[5
0]
(201
0)
0.1
9OH-risperidone,am
isulpride,
aripiprazole,b
romperidol,b
uspirone,
chlorpromazine,chlorprothixen
e,
clozapine,droperidol,fluphen
azine,
fluspirilene,halop
eridol,
levo
mep
romazine,loxapine,
melperone,mesoridazine,olanzapine,
perazine,pericyazine,perphen
azine,
pim
ozide,pipam
perone,
prochlorperazine,promazine,
promethazine,quetiapine,risperidon
e,
sulpiride,thioridazine,trifluoperazine,
triflupromazine,ziprasidone,zotepine,
zuclopen
thixol
halop
eridol–d4
LLE(trizm
abuffer,
1–chlororbutane)
Zorbax
Eclip
se
XCB–C18
(4.6
x15
0,5mm
)
gradientwith
ammon
ium
form
atean
dACN
ESI,positive
mod
e,SR
M,
MS/MS
selectivity,lin
earity,
accuracy,
precision,
PSstab
ility,LT
stab
ility,
LLOQ,extraction
efficien
cies,m
atrix
effects,process
efficien
cies,F/T
stab
ility
Senoet
al.[9
5]
(199
9)
1flupentixol,perazine,prochlorperazine,
trifluoperazine,thioproperazine,perphenazine,
fluphenazine,propericiazine,thioridazine#
?SP
ECapcellPak
C 18UG80,
S–5mm
,1.0x250
mm
(Shiseido)
gradient
with
10mM
ammonium
acetate
andACN
ESI,po
sitivemode,
SRM,M
S/MS(for
Flup
entixol)
linerarity,recovery,
Verweij
etal.[5
9]
(199
4)
1chlorprothixen
e,flupen
tixol,thiothixen
e,
zuclopen
thixol
N/A
SPE(BondCertify
3cc
column(Varian)
HP5mm
Asahipak
ODP–
50,
4.0x12
5mm
isocraticwith
ACN
and
50mM
ammonium
acetateindH
2O
(85:15)
ESI,comparisonof
fullscanan
dSR
M
selectivity,lin
earity
E. Saar et al.
Drug Testing
and Analysis
wileyonlinelibrary.com/journal/dta Copyright © 2012 John Wiley & Sons, Ltd. Drug Test. Analysis (2012)

b) Author(Year)
Sample
[ml]]
Drugs
ISExtraction
Column
Mobile
Phase
Detectionmode
Validationdata
Choong
etal.[5
5]
(200
9)
0.5
aripiprazole,clozapine,olanzapine,
sertindole,d
ehyd
roaripiprazole,
norclozapine,deh
ydrosertindole#
remoxipride
SPE(m
ixed
modesupport)
XbridgeC18column
(2.1
mm
x10
0,
3.5mm
)
gradientwith
ammon
ium
acetate20
mM
andACN
ESI,positive
mode,
MS,SIM
selectivity,
repeatability,
precision
,truen
ess,
accuracy,m
atrix
effects,F/TandLT
stab
ility,PSstab
ility
Kollroser
etal.[2
8]
(200
2)
0.05
clozapine,desmethylclozapine,
olanzapine
diben
zepine
directinjection
procedure,H
PLC–
integratedsample
clean–upwithOasisW
HLB
extractio
ncolumn
(50mm
x1.3,5mm
)
Symmetry
C18
Waters(3.0
x
150mm,5
mm)
isocraticwithACN/
form
icacid
ESI,positive
mod
e,SR
M,
MS/MS
selectivity,lin
earity,
recovery,LLO
Q,
accuracy,
precision,
Kratzsch
etal.[5
6]
(200
3)
0.5
amisulpride,bromperidol,clozapine,
droperidol,flupen
tixol,fluphen
azine,
halop
eridol,melperone,olanzapine,
perazine,pim
ozide,risperidon
e,sulpiride,
zotepine,zuclop
enthixol,norclozap
ine,
clozap
ine–N–oxide,9O
H-risperidon
e
trim
ipramine–d3
SPE
Merck
LiChroCART
column
(125
x2mm)
gradientwith
5mM
aque
ous
ammon
ium
form
atean
dACN
APC
I,positive
mod
e,MS/MS,
SRM
selectivity,lin
earity,
accuracy,precision
,
F/Tstability,LT
stab
ility,PS
stab
ility,recovery
Reman
eet
al.
[82](201
1)
0.5
9OH-risperidone,am
isulpride,
aripiprazole,b
enperidol,bromperidol,
chlorpromazine,clozapine,clozapine–
N–oxide,droperidol,flupen
tixol,
fluphen
azine,fluspirilene,halop
eridol,
levo
mep
romazine,melperone,
norclozapine,perazine,perphen
azine,
pim
ozide,pipam
perone,promazine,
prothipen
dyl,q
uetiapine,risperidone,
sulpiride,thioridazine,ziprasidone,
zotepine#
citalopram–d6,
norclozapine–d8,
nordazep
am–d5,
trim
ipramine–d3,
zolpidem
–d6
LLE(butyla
cetate/
ethylacetate)
TFHyp
ersilG
OLD
Phen
ylcolumn
(100
x2.1mm,
1.9mm
)
Gradientwith
10mM
aqueo
us
ammon
ium
form
ateplus0.1%
form
icacid
(pH=
3.4)
andACNplus
0.1%
form
icacid
APC
I,positive
mod
e,MS/
MS,SR
M
selectivity,lin
earity,
accuracy,
precision,ion
suppression/
enhan
cemen
tof
co–elutinganalytes,
PSstab
ility,LT
stab
ility,LLO
Q,
extraction
efficien
cies,m
atrix
effects,process
efficien
cies,
“crosstalk”,F/T
stab
ility
Zhouet
al.[5
1]
(200
4)
0.5
clozapine,olanzapine,risperidon
e,
quetiapine
diazepam
LLE(ether)
Macherey–Nag
el
C18
(2mm
x
125mm,3
mm)
isocraticwithdH20
(formicacid:2
.7
mmol/l,
ammon
ium
acetate:10
mmol
ESI,SR
M,
accuracy,p
recision,
LTstab
ility,F/T
stab
ility
Review: The analysis of antipsychotic drugs in human matrices
Drug Testing
and Analysis
Drug Test. Analysis (2012) Copyright © 2012 John Wiley & Sons, Ltd. wileyonlinelibrary.com/journal/dta

Table
3.(Con
tinued)
c)
Author(Year)
Sample
[ml]]
Drugs
ISExtraction
Column
Mobile
Phase
Detectionmode
Validationdata
Guttecket
al.[4
8]
(200
3)
1flupen
tixol,fluphen
azine,
pipam
perone,thioridazine,
zuclopen
thixol
imipramine–d3,
doxepine–d3,
chlorohaloperidol
LLE(n–hexan
e/
dichloromethan
e4:1)
ordichloromethan
e
SiliceUptisphere
columnRP
C18
(12.5cm
x2mm,
5mm
)
isocraticwithfour
differen
t
combinationsof
50mM
acetate
buffer
andACN
ESI,positive
mod
e,
MS,SIM
linearity,
selectivity,
precision,
accuracy,
recovery,LLO
Q
Hasselstrom
et
al.[2
7](201
1)
0.06
clozapine,quetiapine,
ziprasidone
clozapine–d3,
quetiapine–d8,
ziprasidone–d8
Zincsulphate,MeO
H,
96–wellp
late
Zorbax
SB–C8
(2.0
x50
mm,
1.8mm
)
gradientwith
form
icacid
indH2Oan
dform
ic
acid
inMeO
H
ESI,positive
mod
e,
SRM
MS/MS,
selectivity,
recovery,m
atrix
effects,LLOQ,
precision,
truen
ess,LT
stab
ility
Kirchherret
al.[6
1](200
6)
0.1
amisulpride,aripiprazole,
ben
peridol,chlorpromazine,
chlorprothixen
e,olanzapine,
flupen
tixol,fluphen
azine,
halop
eridol,9O
H-risperidone,
levo
mep
romazine,olanzapine,
perazine,perphen
azine,
pim
ozide,pipam
perone,
quetiapine,risperidone,
sulpiride,thioridazine,
ziprasidone,zotepine,
zuclopen
thixol
clonidine,
methylrisperidon
e,
MBHZ
PP(ACN:MeO
H)
ChromolithSp
eedRO
D
C18(50mm
x4.6mm,
5mm
)
gradientwith
MeO
Han
d
aceticacid
ESI,positive
mod
e,SR
M,
MS/MS
linearity,accuracy,
precision,LLO
Q,
recovery,m
atrix
effects
Niederlaen
der
etal.[5
7]
(200
6)
N/A
clozapine,desmethylclozapine,
clozapine–N–oxide
mirtazapine
SPE(onlin
e)Zorbax
Eclip
seXDB–
C18
(4.6
x15
0mm,5
mm)
isocraticwith
MeO
H–aq
ueo
us
ammon
ium
acetate
buffer
(25mM)
ESI,positive
mod
e,MS,SIM
linearity,
recovery,
accuracy,
precision.LLO
Q
Rittner
etal.[5
8]
(200
1)
1clozapine,haloperidol,
levo
mep
romazine,perazine,
pim
ozide,sulpiride#
flunitrazepam
–d3
SPE
Symmetry
WATC18
(1.0x150mm,3.5mm
)
gradientwith
ACN,d
H2O,
MeO
H
ESI,positive
mode,MS
fullscanmode
(m/z=100–650)
N/A
Abbreviations:ACN:acetonitrile,A
PCI:atmosphericpressure
chem
ical
ionization,d
H2O:d
eionized
water,E
SI:e
lectrosprayionization,F/T:freeze/thaw
,LLO
Q:lower
limitofquan
tification
,LOD:lim
itof
detection,LT:longterm
,m/z:massoverchargeratio,MeO
H:methan
ol,SR
M:selected
reactionmonitoring,MS:
single
stag
emassspectrometry,MS/MS:
tandem
massspectrometry,PP
:protein
precipitation,P
S:processed
sample,SIM
:single
ionmon
itoring,SPE
:solid
phaseectraction,SPM
E:solid
–phasemicro–extraction
#:M
ore
drugsareinclud
edin
thismethod
butdonotbelongto
thegroupofAPs.
##:Thismethod
was
appliedto
more
than
onematrix.
◊:P
ost–mortem
specim
enswerean
alyzed
inthismethod
.?:A
nIS
appears
tohavebeenusedbutisnotspecified
.
E. Saar et al.
Drug Testing
and Analysis
wileyonlinelibrary.com/journal/dta Copyright © 2012 John Wiley & Sons, Ltd. Drug Test. Analysis (2012
)
Table
4.Su
mmaryofmethod
sforthedetectionofAPs
inhair.
Author(Year)
Sample
[g]
Drugs
ISExtraction
Column
Mobile
Phase
Detectionmod
eValidationdata
Josefssonet
al.[1
6]##
(200
3)
0.01
–0.02
buspirone,chlorpromazine,
chlorprothixen
e,clozapine,
dixyrazine,flupen
tixol,
fluphen
azine,haloperidol,
hydroxyzine
,levom
epromazine,
melperon
e,olanzapine,
perphe
nazine
,pim
ozide,
prochlorperazine,risperidon
e,
thiorid
azine,ziprasidon
e,
zuclop
enthixol#
N/A
Incubationfor
15min
in1M
NaO
H,2
5mM
trizmabuffer,
extractionwith
BuCl,back
extractioninto
form
icacid
Zorbax
Stab
leBond
Cyanocolumn
(50x2.1mm,
3.5mm
)
Gradientwith
MeO
H–ACN–20
mM
ammonium
form
ate
andMeO
H–ACN–20
mM
ammon
ium
form
ate
ESI,positive
mod
e,
MS/MS,SR
M
N/A
McC
lean
etal.[1
8]
(200
0)
0.5
chlorpromazine,flupen
tixol,
trifluoperazine,risperidone
trim
ipramine
MeO
H,N
aOH,4
M
hyd
rochloricacid,
finalextraction
withhexan
e
Phen
omen
ex
LunaC18
(150
x4.6mm)
Isocraticwith0.02
mol/L
ammonium
acetate/0.1%
acetic
acid
indH2O
andACN
ESI,positive
mod
e,
MS/MS,SR
M
linearity,LOD,
recovery
Muelleret
al.[1
9]
(200
0)
0.05
pipam
perone#
doxepine–d3
MeO
H,SPE
(mixed
mode)
RP–C8–select
B(2
mm
x12
5
mm,5
mm)
GradientwithACN25
%
aqueo
usam
mon
ia
andform
icacid
ESI/CID–MS,ProdI
scan
,positive
mode,MS/MS,SR
M
N/A
Nielsen
etal.[2
0]
(201
0)
0.01
chlorprothixen
e,clozapine,
levo
mep
romazine,
promethazine,quetiapine#
mianserin–d3
Incubationwith
MeO
H:ACN:
ammon
ium
form
ate(2
mM,
8%ACN,pH=5.3)
at37
� Cfor18
hrs,M
ini–Uniprep
vials(PTFEfilter)
Waters
100mm
x2.1mm
ACQUITYHSS
T3
1.8mm
C18
Gradientwith
0.05
%form
ic
acid
andMeO
H
ESI,positive
mode,TO
F–MS
LOD,LLO
Q,
matrixeffects,
selectivity,
carry–over,
linearity,
truen
ess,
precision
Thiemeet
al.[2
1]
(200
7)
0.05
(divided
into
single
hairs
for
segmen
tation)
clozapine,norclozapine
5–(4–methylphen
yl)–
5–phen
yl
hyd
antoine
Decon
tamination
with
5ml
petroleum
benzene,]
Ultrason
ication
with
3mlM
eOH
for3hrs,reduceto
sing
lehairs,
segm
entatio
n,
3hrsultrasonication
in30uL
dH2O
/
MeO
H(50/50)
SynergyPo
lar–RP
(Phen
omen
ex,
75mm
x2.0mm,
4mm
)
Isocraticwith
ammon
ium
acetate
buffer
in(50:50
)
water
andACN
ESI,ProdI,
MS/MS,SR
M
N/A
Review: The analysis of antipsychotic drugs in human matrices
Drug Testing
and Analysis
Drug Test. Analysis (2012) Copyright © 2012 John Wiley & Sons, Ltd. wileyonlinelibrary.com/journal/dta

Table
4.(Con
tinued)
Author(Year)
Sample
[g]
Drugs
ISExtraction
Column
Mobile
Phase
Detectionmod
eValidationdata
Weinman
net
al.[2
2]
(200
2)
0.02
–0.05
clozapine,norclozapine,
halop
eridol,pen
fluridol,
thioridazine,northioridazine,
flupen
tixol,zuclopen
thixol,
de–(hyd
roxyethyl)–
zuclopen
thixol
doxepine–d3
Ultrasonicationwith
4mlM
eOHfor
2hrs,SPE
(mixed
mod
e)
RP–C8–select
B(2
mm
x
125mm,5
mm)
Gradientwith1mM
ammonium
form
ate/
0.1%
form
icacid,
andACN/0.1%
form
icacid
ESI,ProdI,
MS/MS,SR
M
linearity,LOD,
LLOQ,recovery,
precision
Abbreviations:ACN:acetonitrile,B
uCL:1–
chlorobutane,dH2O:d
eionized
water,C
ID:collision
induced
dissociationESI:electrosprayionization,LLO
Q:lower
limitofquan
tification,LOD:lim
itofdetection,
MeO
H:methan
ol,SR
M:selected
reaction
monitoring,MS:
single
stag
emassspectrometry,MS/MS:
tandem
massspectrometry,NaO
H:sodium
hyd
roxide,
ProdI:Product
IonScan
,SP
E:solid
phase
extraction,TOF:timeofflight
#:M
ore
drugsareinclud
edin
thismethodbutdonotbelongto
thegroup
ofAPs.
##:Thismethodwas
appliedto
morethan
onematrix.
Table
5.Su
mmaryofmethodsforthedetectionofAPs
inCSF,saliva,an
durineusingLC
–MS/MS.
Author
(Year)
Matrix
Sample
[g]
Drugs
ISExtraction
Stationary
Phase
Mobile
Phase
Detection
mod
eValidationdata
Arinobuet
al.[1
4]##
(200
2)
urine
1halop
eridol,reducedhaloperidol,
4–(4–chlorophen
yl)–4–
hyd
roxypiperidine
4–[4–(4–
chlorophen
yl)–4–
hyd
roxy–1–
piperidinyl]–(4–
chlorophen
yl–1–
butanon
e
additionof3mlo
f
dH2Owith0.09
%form
ic
acid
and20
mM
ammon
ium
acetate,
freezing,thaw
ing,
centrifu
gation,injection
of20
mLofsupernatan
t
Mspak
GF–
3104B
(50x
4.6mm)
gradientwith
form
icacid
and
20mM
ammon
ium
acetatein
dH2O(A)an
dACN(B)
SSI,
positive
mode,
MS
LOD,p
recision,
accuracy
De
Meu
lder
etal.[1
5]
##(200
8)
urine
0.2
risperidon
e,9O
H-risperidone
2H2–13C2–
risperidonean
d2H2–13C2–9O
H–
risperidone
SPE(m
ixed
mod
e)Chiralcel
OJcolumn
(50mm
x
4.6,
10mm
)
gradient
with
hexane,
0.01
mM
ammon
ium
acetateinisop
ropano
l,
0.01
mM
ammon
ium
acetateinethano
l
ESI,po
sitive
mod
e,
SRM,
MS/MS
selectivity,
precision,
accuracy,recovery,
F/TandLT
stability,
PSstability
Flarakos
et
al.[2
4]##
(200
4)
saliva
0.02
5risperidon
e,9O
H-risperidone
R068
808
onlin
ecleanup
,
columnsw
itching
Zorbax
SB18(30x2.1
mm,3.5mm
)
isocraticwith
10mM
ammon
ium
acetate/ACN
N/A
linearity,selectivity,
precision,
accuracy,recovery,
matrix
effects,F/T
andLT
stability
E. Saar et al.
Drug Testing
and Analysis
wileyonlinelibrary.com/journal/dta Copyright © 2012 John Wiley & Sons, Ltd. Drug Test. Analysis (2012)
Table
5.(Con
tinued)
Author
(Year)
Matrix
Sample
[g]
Drugs
ISExtraction
Stationary
Phase
Mobile
Phase
Detection
mode
Validationdata
Kumazaw
a
etal.[1
7]
##(200
0)
urine
1perazine,thioridazine,prochlorperazine,
perphen
azine,trifluoperazine,flupen
tixol,
fluphen
azine,thioproperazine#
propericiazine
SPME(polyacrylate–
coated
fiber)
Cap
cellPa
k
C18UG12
0,
S–5mm
,2.0
x15
0
(Shiseido)
gradientwith
10mM
ammonium
acetatean
dACN
ESI,full
scan
m/
z50
–
500,
SRM,
MS/MS
linearity,
precision,
accuracy,
Josefsson
etal.[2
5]
##(201
0)
CSF
0.2
olanzapine,N–desmethylolanzapine
olanzapine–d3
LLE(tert–butyl–methyl–
ether)
Synergi
Hyd
ro–RP
(50mm
x2
mm,2.5mm
)
gradientwith
10mM
ammonium
form
atewith
form
icacid
andMeO
Hwith
form
icacid
ESI,
positive
mode,
SRM,
MS/MS
linearity,
LLOQ,p
recision,
accuracy,
recovery,m
atrix
effects,
F/Tstab
ility,
LTstab
ility
Boguszet
al.[7
6]##
(199
9)
urine
1olanzapine
LY17
0222
SPE
Super
Spher
RP18(125
x
3mm;4
mm)
(Merck)
isocraticwith
ACN/ammonium
form
ate,OLZ
metab
olites
withGradient
APC
I,
positive
mode,
MS
recovery,
LLOQ,p
recision,
linearity,
selectivity,
F/Tan
dLT
stab
ility
Josefsson
etal.[16]
##(200
3)
urine
0.5
buspirone,chlorpromazine,chlorprothixen
e,
clozapine,dixyrazine,flupen
tixol,fluphen
azine,
halop
eridol,hyd
roxyzine,levo
mep
romazine,
melperon
e,olanzapine,perphen
azine,pim
ozide,
prochlorperazine,risperidon
e,thioridazine,
ziprasidone,zuclopen
thixol
N/A
SPE
Zorbax
Stab
le
BondCyano
column(50
x2.1mm,
3.5mm
)
Gradientwith
differen
tratios
ofMeO
H:ACN:20
mM
ammonium
form
iate
ESI,
positive
mode,
SRM,
MS/MS
N/A
Legen
d:A
CN:acetonitrile,A
PCI:atmosphericpressure
chem
icalionization,d
H2O:d
eionized
water,ESI:electrosprayionization,F/T:freeze/thaw
,LLO
Q:lower
limitofq
uan
tification,LOD:lim
itofdetection,
LT:longterm
,m/z:m
assoverchargeratio,M
eOH:m
ethan
ol,SR
M:selectedreactionmon
itoring,M
S:single
stag
emassspectrometry,M
S/MS:tandem
massspectrometry,P
S:processed
sample,SIM
:single
ionmon
itoring,SPE
:solid
phaseextraction,SPM
E:solid
–phasemicro–extraction,SSI:sonicsprayionization
#:M
ore
drugsareinclud
edin
thismethodbutdonotbelongto
thegroupofAPs.
##:Thismethod
was
appliedto
more
than
onematrix.
Review: The analysis of antipsychotic drugs in human matrices
Drug Testing
and Analysis
Drug Test. Analysis (2012) Copyright © 2012 John Wiley & Sons, Ltd. wileyonlinelibrary.com/journal/dta

E. Saar et al.
Drug Testing
and Analysis
of the metabolism of OLZ in humans. [77] It was hypothesized thatOLZ-10-N-glucuronide and N-desmethyl-OLZ would be presentin urine samples following OLZ ingestion. However, the com-pounds were not unequivocally identified as a valid referencestandard was not available.To the authors’ knowledge, the only method for the detection
of APs in oral fluid was published by Flarakos et al. in 2004.[24]
Their fully validated method applied online clean-up with columnswitching for the detection of RIS and 9OH RIS in 25 ml saliva andplasma, aiming to establish a salivary/plasma (S/P) ratio. A widerange of S/P ratios obtained from 13 plasma and saliva samples(seven adults and six children) confirmed that saliva analysis onlyprovided a qualitative tool for the presence of RIS and 9OH RISbut did not allow a conclusion regarding plasma concentrationsat the time of sampling.Josefsson et al. applied their detection method for OLZ and N-
desmethyl OLZ not only to serum but also to CSF.[25] The authorspostulated that the pharmacological effects of OLZ are likely tobe more closely related to its concentration in the CFS than inserum. With a LLOQ of 0.2 ng/ml in plasma, the method showedsufficient sensitivity for the expected low concentrations in CSF.The authors postulated a linear correlation between serum andCSF OLZ concentrations (r² = 0.77). While there were only sixindividuals included in this study, the developed method wassuccessfully applied to a cohort of 37 individuals. The authorsalso considered the influence of gender, age, smoking, andpharmacogenetics, when investigating the ratio between OLZand metabolite concentrations in serum and CSF.[78]
LC separation
All APs possess hydrophobic properties and as such, all currentlypublished methods for the detection and quantification of APs inbiological matrices have employed reversed phase (RP) station-ary phases, with mostly silica-based packings containing C8 andC18 chains. Cabovska et al.
[40] and de Meulder et al.[15] used chiralcolumns in order to separate the (+) and (�) enantiomers of 9OHRIS. 9OH RIS is the main metabolite of the atypical AP RIS and hasshown to be almost equipotent to risperidone in animal stud-ies.[79] Due to its efficacy, racemic 9OH RIS (paliperidone) is alsomarketed as a drug in its own right.[80] The separation of thetwo enantiomers is useful for kinetic studies, as the formationof the (+)-form appears to be catalyzed by CYP2D6, whereasCYP3A4 and CYP3A5 are essential for the formation of the (�)-form.[81] The separation of these enantiomers is usually not es-sential in routine drug analysis.Columns packed with <2 mm particles are referred to as ultra
high pressure LC (UHPLC) columns and are said to reduce analyt-ical run times due to improved compound separation. This is de-sirable in a TDM environment where a large number of samplesare tested for very few compounds. To the authors’ knowledge,there are only two methods using UHPLC published to date. Has-selstrom et al.[27] used a Zorbax SB-C8 column with a particle sizeof 1.8 mm, resulting in the detection and quantification of 13 anti-depressants and APs, in addition to 13 deuterated IS over a totalanalytical run time of 4 min. Remane et al.[82] covered a total of 62compounds including 31 APs over a total run time of 26 min,employing a TF Hypersil GOLD Phenyl column with a particle sizeof 1.9 mm. A recent review, however, compared the separationpower of columns with particle sizes of 1.8 mm and 5 mm at a ‘fast’(1 ml/l) and a ‘slow’ (0.3 ml/l) flow rate, and concluded that the
wileyonlinelibrary.com/journal/dta Copyright © 20
particle size was less significant than initially proposed. The col-umn particle size appeared to make only a modest difference inthe peak height, peak width, or resolution, with the differencefor each parameter being less than a factor of 2. Higher flow ratesdistinctively increased peak height by 6–7-fold and the peakwidth decreased by about 3-fold when using the faster flowrate.[64] In a post-mortem environment, larger particle sizes (3–5mm) have proven to be favourable due to the higher robustnesswhich is required for more complex matrices such as wholeblood.[50] The presented methods show a wide range of isocraticand gradient elutions, including various aqueous and organic elu-tion solvents. Details are shown in the column ‘Mobile Phase’ inTables 3 and 4.
MS detection
Ionization of compounds in LC-MS technology is usually achievedwith either electrospray ionization (ESI) or atmospheric-pressurechemical ionization (APCI). The reason ESI is used in the majorityof presented methods for the detection of APs is likely to be as-sociated with the higher sensitivity achieved by ESI. Bhatt et al.compared ESI with APCI, prior to development of their methodfor the detection of RIS and 9OH RIS in plasma. They found APCIto be less favourable when compared with ESI.[62] In a compre-hensive study investigating the influence of anticoagulant andlipemia on matrix effects when analyzing OLZ, Chin et al.reported that the analyte response with APCI was five times lessthan with ESI.[83] Therefore, the required LLOQ of 0.05 ng/ml forOLZ was not achieved in APCI mode. The higher sensitivityachieved by ESI, however, was at the expense of lower selectivity.Many authors have found matrix effects to be more prominentwhen applying ESI.[84,85] Ionization efficient neutral compoundsincluding matrix particles, co-eluting compounds, or additivessuch as salts in biological samples, can compete with analytesduring the evaporation process. This is likely to lower the ioniza-tion rate of the compounds of interest. It is further suggested thatduring the evaporation process, the analyte of interest may pre-cipitate from solution by itself or as a co-precipitate with non-vol-atile sample components.[84] This highlights the need for thor-ough sample clean-up prior to MS analysis and the assessmentof matrix-effects as a crucial part of method validation. This is dis-cussed later in this paper.
Due to the predominantly basic properties of APs, ionizationtakes place in the positive mode. The vast majority of publishedmethods apply selected reaction monitoring (SRM) as an easyway for the detection and quantification of APs. Internationalguidelines[86–88] require a minimum of two SRM transitions for re-liable identification of an analyte – unfortunately a large compo-nent of SRM methods do not comply with this rule. The best ex-ample of possible misidentification of a compound due tomonitoring a single SRM transition is the structurally similar O-desmethyl metabolite of the antidepressant venlafaxine and thesynthetic opioid tramadol. Due to their almost identical chemicalstructure, they do not only elute at the same time but also sharethe most abundant transition (m/z 264.2 ! 58.2).[89] Less com-mon examples in the field of APs include the structural isomerspromazine and promethazine (Figures 1a and 1b). These drugsshare the most abundant transition (m/z 285! 86), representingthe cleavage of the side chain[50] and also elute at the same time.
The isobaric compounds pipamperone and haloperidol(Figures 2a and 2b) share the two most abundant transitions
12 John Wiley & Sons, Ltd. Drug Test. Analysis (2012)
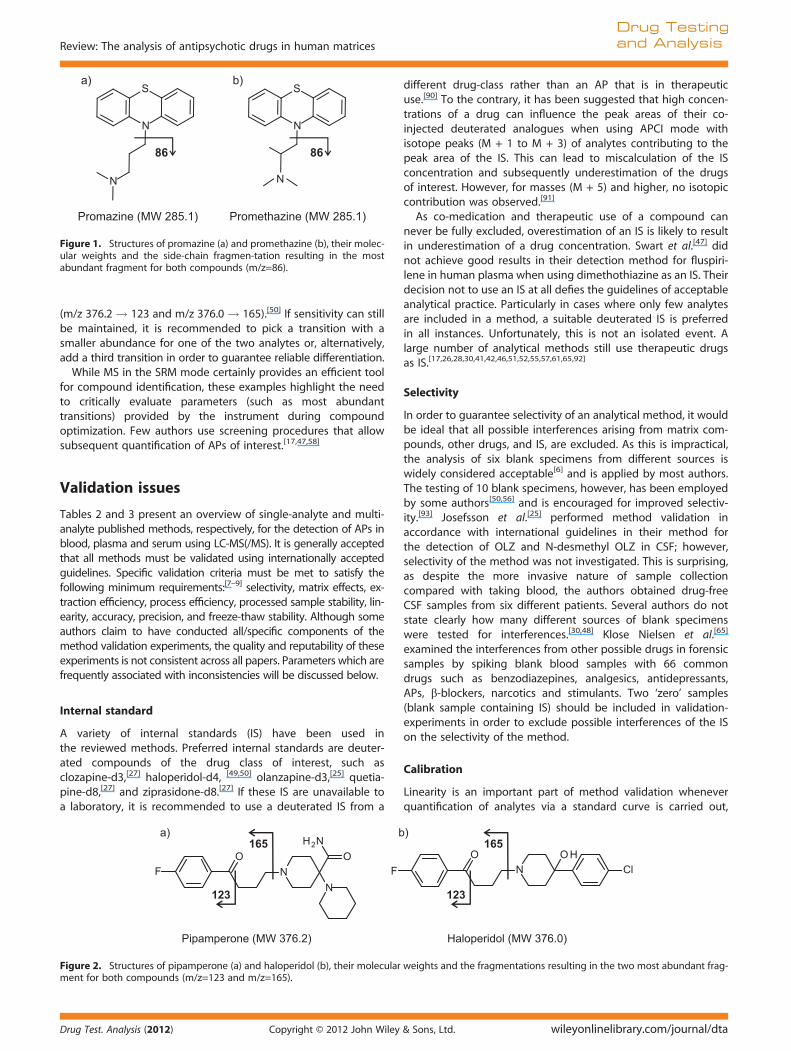
Figure 1. Structures of promazine (a) and promethazine (b), their molec-ular weights and the side-chain fragmen-tation resulting in the mostabundant fragment for both compounds (m/z=86).
Review: The analysis of antipsychotic drugs in human matrices
Drug Testing
and Analysis
(m/z 376.2 ! 123 and m/z 376.0 ! 165).[50] If sensitivity can stillbe maintained, it is recommended to pick a transition with asmaller abundance for one of the two analytes or, alternatively,add a third transition in order to guarantee reliable differentiation.
While MS in the SRM mode certainly provides an efficient toolfor compound identification, these examples highlight the needto critically evaluate parameters (such as most abundanttransitions) provided by the instrument during compoundoptimization. Few authors use screening procedures that allowsubsequent quantification of APs of interest.[17,47,58]
Validation issues
Tables 2 and 3 present an overview of single-analyte and multi-analyte published methods, respectively, for the detection of APs inblood, plasma and serum using LC-MS(/MS). It is generally acceptedthat all methods must be validated using internationally acceptedguidelines. Specific validation criteria must be met to satisfy thefollowing minimum requirements:[7–9] selectivity, matrix effects, ex-traction efficiency, process efficiency, processed sample stability, lin-earity, accuracy, precision, and freeze-thaw stability. Although someauthors claim to have conducted all/specific components of themethod validation experiments, the quality and reputability of theseexperiments is not consistent across all papers. Parameters which arefrequently associated with inconsistencies will be discussed below.
Internal standard
A variety of internal standards (IS) have been used inthe reviewed methods. Preferred internal standards are deuter-ated compounds of the drug class of interest, such asclozapine-d3,[27] haloperidol-d4, [49,50] olanzapine-d3,[25] quetia-pine-d8,[27] and ziprasidone-d8.[27] If these IS are unavailable toa laboratory, it is recommended to use a deuterated IS from a
Figure 2. Structures of pipamperone (a) and haloperidol (b), their molecularment for both compounds (m/z=123 and m/z=165).
Drug Test. Analysis (2012) Copyright © 2012 John Wiley
different drug-class rather than an AP that is in therapeuticuse.[90] To the contrary, it has been suggested that high concen-trations of a drug can influence the peak areas of their co-injected deuterated analogues when using APCI mode withisotope peaks (M + 1 to M + 3) of analytes contributing to thepeak area of the IS. This can lead to miscalculation of the ISconcentration and subsequently underestimation of the drugsof interest. However, for masses (M + 5) and higher, no isotopiccontribution was observed.[91]
As co-medication and therapeutic use of a compound cannever be fully excluded, overestimation of an IS is likely to resultin underestimation of a drug concentration. Swart et al.[47] didnot achieve good results in their detection method for fluspiri-lene in human plasma when using dimethothiazine as an IS. Theirdecision not to use an IS at all defies the guidelines of acceptableanalytical practice. Particularly in cases where only few analytesare included in a method, a suitable deuterated IS is preferredin all instances. Unfortunately, this is not an isolated event. Alarge number of analytical methods still use therapeutic drugsas IS.[17,26,28,30,41,42,46,51,52,55,57,61,65,92]
Selectivity
In order to guarantee selectivity of an analytical method, it wouldbe ideal that all possible interferences arising from matrix com-pounds, other drugs, and IS, are excluded. As this is impractical,the analysis of six blank specimens from different sources iswidely considered acceptable[6] and is applied by most authors.The testing of 10 blank specimens, however, has been employedby some authors[50,56] and is encouraged for improved selectiv-ity.[93] Josefsson et al.[25] performed method validation inaccordance with international guidelines in their method forthe detection of OLZ and N-desmethyl OLZ in CSF; however,selectivity of the method was not investigated. This is surprising,as despite the more invasive nature of sample collectioncompared with taking blood, the authors obtained drug-freeCSF samples from six different patients. Several authors do notstate clearly how many different sources of blank specimenswere tested for interferences.[30,48] Klose Nielsen et al.[65]
examined the interferences from other possible drugs in forensicsamples by spiking blank blood samples with 66 commondrugs such as benzodiazepines, analgesics, antidepressants,APs, b-blockers, narcotics and stimulants. Two ‘zero’ samples(blank sample containing IS) should be included in validation-experiments in order to exclude possible interferences of the ISon the selectivity of the method.
Calibration
Linearity is an important part of method validation wheneverquantification of analytes via a standard curve is carried out,
weights and the fragmentations resulting in the two most abundant frag-
& Sons, Ltd. wileyonlinelibrary.com/journal/dta
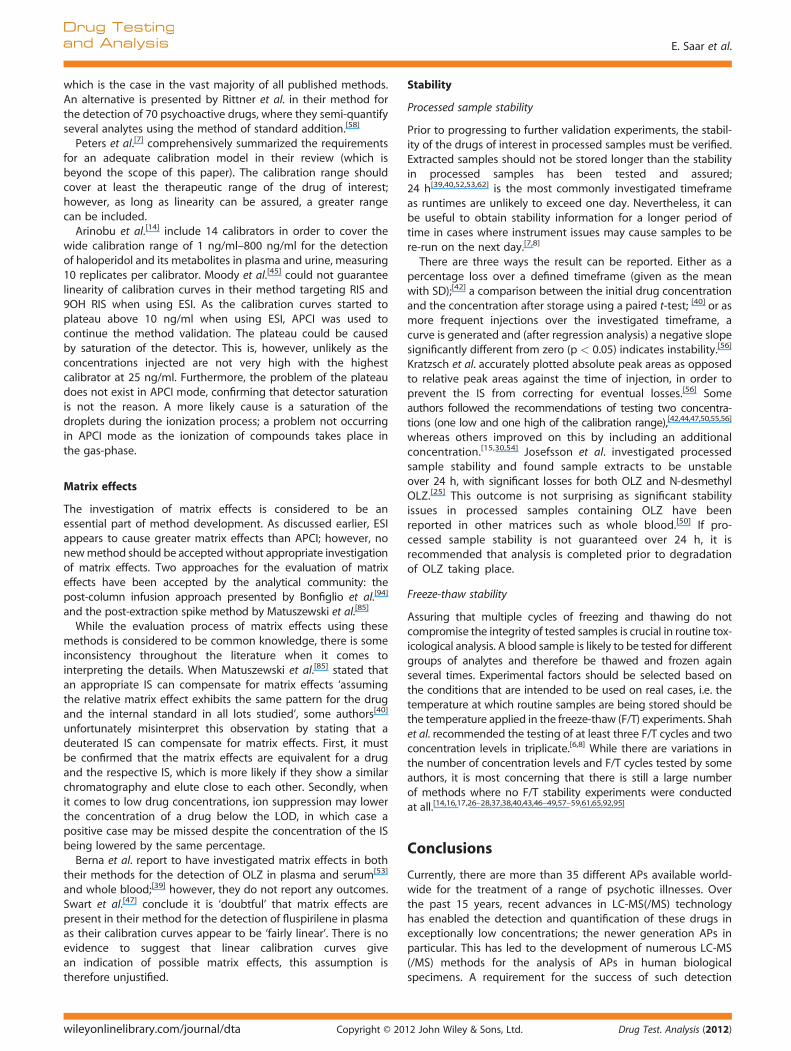
E. Saar et al.
Drug Testing
and Analysis
which is the case in the vast majority of all published methods.An alternative is presented by Rittner et al. in their method forthe detection of 70 psychoactive drugs, where they semi-quantifyseveral analytes using the method of standard addition.[58]
Peters et al.[7] comprehensively summarized the requirementsfor an adequate calibration model in their review (which isbeyond the scope of this paper). The calibration range shouldcover at least the therapeutic range of the drug of interest;however, as long as linearity can be assured, a greater rangecan be included.Arinobu et al.[14] include 14 calibrators in order to cover the
wide calibration range of 1 ng/ml–800 ng/ml for the detectionof haloperidol and its metabolites in plasma and urine, measuring10 replicates per calibrator. Moody et al.[45] could not guaranteelinearity of calibration curves in their method targeting RIS and9OH RIS when using ESI. As the calibration curves started toplateau above 10 ng/ml when using ESI, APCI was used tocontinue the method validation. The plateau could be causedby saturation of the detector. This is, however, unlikely as theconcentrations injected are not very high with the highestcalibrator at 25 ng/ml. Furthermore, the problem of the plateaudoes not exist in APCI mode, confirming that detector saturationis not the reason. A more likely cause is a saturation of thedroplets during the ionization process; a problem not occurringin APCI mode as the ionization of compounds takes place inthe gas-phase.
Matrix effects
The investigation of matrix effects is considered to be anessential part of method development. As discussed earlier, ESIappears to cause greater matrix effects than APCI; however, nonewmethod should be acceptedwithout appropriate investigationof matrix effects. Two approaches for the evaluation of matrixeffects have been accepted by the analytical community: thepost-column infusion approach presented by Bonfiglio et al.[94]
and the post-extraction spike method by Matuszewski et al.[85]
While the evaluation process of matrix effects using thesemethods is considered to be common knowledge, there is someinconsistency throughout the literature when it comes tointerpreting the details. When Matuszewski et al.[85] stated thatan appropriate IS can compensate for matrix effects ‘assumingthe relative matrix effect exhibits the same pattern for the drugand the internal standard in all lots studied’, some authors[40]
unfortunately misinterpret this observation by stating that adeuterated IS can compensate for matrix effects. First, it mustbe confirmed that the matrix effects are equivalent for a drugand the respective IS, which is more likely if they show a similarchromatography and elute close to each other. Secondly, whenit comes to low drug concentrations, ion suppression may lowerthe concentration of a drug below the LOD, in which case apositive case may be missed despite the concentration of the ISbeing lowered by the same percentage.Berna et al. report to have investigated matrix effects in both
their methods for the detection of OLZ in plasma and serum[53]
and whole blood;[39] however, they do not report any outcomes.Swart et al.[47] conclude it is ‘doubtful’ that matrix effects arepresent in their method for the detection of fluspirilene in plasmaas their calibration curves appear to be ‘fairly linear’. There is noevidence to suggest that linear calibration curves givean indication of possible matrix effects, this assumption istherefore unjustified.
wileyonlinelibrary.com/journal/dta Copyright © 20
Stability
Processed sample stability
Prior to progressing to further validation experiments, the stabil-ity of the drugs of interest in processed samples must be verified.Extracted samples should not be stored longer than the stabilityin processed samples has been tested and assured;24 h[39,40,52,53,62] is the most commonly investigated timeframeas runtimes are unlikely to exceed one day. Nevertheless, it canbe useful to obtain stability information for a longer period oftime in cases where instrument issues may cause samples to bere-run on the next day.[7,8]
There are three ways the result can be reported. Either as apercentage loss over a defined timeframe (given as the meanwith SD);[42] a comparison between the initial drug concentrationand the concentration after storage using a paired t-test; [40] or asmore frequent injections over the investigated timeframe, acurve is generated and (after regression analysis) a negative slopesignificantly different from zero (p < 0.05) indicates instability.[56]
Kratzsch et al. accurately plotted absolute peak areas as opposedto relative peak areas against the time of injection, in order toprevent the IS from correcting for eventual losses.[56] Someauthors followed the recommendations of testing two concentra-tions (one low and one high of the calibration range),[42,44,47,50,55,56]
whereas others improved on this by including an additionalconcentration.[15,30,54] Josefsson et al. investigated processedsample stability and found sample extracts to be unstableover 24 h, with significant losses for both OLZ and N-desmethylOLZ.[25] This outcome is not surprising as significant stabilityissues in processed samples containing OLZ have beenreported in other matrices such as whole blood.[50] If pro-cessed sample stability is not guaranteed over 24 h, it isrecommended that analysis is completed prior to degradationof OLZ taking place.
Freeze-thaw stability
Assuring that multiple cycles of freezing and thawing do notcompromise the integrity of tested samples is crucial in routine tox-icological analysis. A blood sample is likely to be tested for differentgroups of analytes and therefore be thawed and frozen againseveral times. Experimental factors should be selected based onthe conditions that are intended to be used on real cases, i.e. thetemperature at which routine samples are being stored should bethe temperature applied in the freeze-thaw (F/T) experiments. Shahet al. recommended the testing of at least three F/T cycles and twoconcentration levels in triplicate.[6,8] While there are variations inthe number of concentration levels and F/T cycles tested by someauthors, it is most concerning that there is still a large numberof methods where no F/T stability experiments were conductedat all.[14,16,17,26–28,37,38,40,43,46–49,57–59,61,65,92,95]
Conclusions
Currently, there are more than 35 different APs available world-wide for the treatment of a range of psychotic illnesses. Overthe past 15 years, recent advances in LC-MS(/MS) technologyhas enabled the detection and quantification of these drugs inexceptionally low concentrations; the newer generation APs inparticular. This has led to the development of numerous LC-MS(/MS) methods for the analysis of APs in human biologicalspecimens. A requirement for the success of such detection
12 John Wiley & Sons, Ltd. Drug Test. Analysis (2012)
Review: The analysis of antipsychotic drugs in human matrices
Drug Testing
and Analysis
methods is that they are suitably sensitive to cover the low ther-apeutic range in which APs are usually present. Proficiency withLC-MS(/MS) technology has increase dramatically over the pastdecade. Aspects of method development that require particularattention in order to guarantee reproducible results are identifiedand summarized in various method validation guidelines.[7–9]
However, the quality of published methods with regard to valida-tion criteria is not always consistent. The most significant issuesrelate to the evaluation of selectivity, linearity, matrix effectsand stability. Addressing these issues in future analytical studiesis mandatory to accurately detect APs in biological specimensand, consequently, to better understand this increasingly preva-lent class of drugs.
References[1] G. C. Alexander, S. A. Gallagher, A. Mascola, R. M. Moloney, R. S. Stafford.
Increasing off-label use of antipsychotic medications in the UnitedStates, 1995–2008. Pharmacoepidemiol. Drug Saf. 2011, 20(2), 177.
[2] S. S. Gill, S. E. Bronskill, S. L. Normand, et al. Antipsychotic drug useand mortality in older adults with dementia. Ann. Intern. Med.2007, 146(11), 775.
[3] M. Smith, D. Hopkins, R. C. Peveler, R. I. Holt, M. Woodward, K. Ismail.First- v. second-generation antipsychotics and risk for diabetes inschizophrenia: systematic review and meta-analysis. Brit. J. Psychiat.2008, 192(6), 406.
[4] W. A. Ray, C. P. Chung, K. T. Murray, K. Hall, C. M. Stein. Atypicalantipsychotic drugs and the risk of sudden cardiac death. New Engl.J. Med. 2009, 360(3), 225.
[5] G. Zhang, A. V. Terry Jr, M. G. Bartlett. Bioanalytical methods for the deter-mination of antipsychotic drugs. Biomed. Chromatogr. 2008, 22(7), 671.
[6] V. P. Shah, K. K. Midha, S. Dighe, et al. Analytical methods validation:Bioavailability, bioequivalence and pharmacokinetic studies.Conference report. Eur. J. Drug Metab. Pharmacokinet. 1991, 16(4), 249.
[7] F. T. Peters, H. H. Maurer. Bioanalytical method validation and itsimplications for forensic and clinical toxicology - A review. Accred.Qual. Assur. 2002, 7(11), 441.
[8] V. P. Shah, K. K. Midha, J. W. Findlay, et al. Bioanalytical methodvalidation – A revisit with a decade of progress. Pharm. Res. 2000,17(12), 1551.
[9] F. T. Peters, O. H. Drummer, F. Musshoff. Validation of new methods.Forensic Sci. Int. 2007, 165(2/3), 216.
[10] G. Skopp. Postmortem Toxicology: Artifacts, in Wiley Encyclopedia ofForensic Science. John Wiley & Sons: Hoboken, New Jersey, USA,2009.
[11] A. Pelander, I. Ojanpera, S. Laks, I. Rasanen, E. Vuori. Toxicologicalscreening with formula-based metabolite identification by liquidchromatography/time-of-flight mass spectrometry. Anal. Chem.2003, 75(21), 5710.
[12] S. Ojanpera, A. Pelander, M. Pelzing, I. Krebs, E. Vuori, I. Ojanpera.Isotopic pattern and accurate mass determination in urine drugscreening by liquid chromatography/time-of-flight mass spectrome-try. Rapid Commun. Mass Spectrom. 2006, 20(7), 1161.
[13] M. Gergov, B. Boucher, I. Ojanpera, E. Vuori. Toxicological screeningof urine for drugs by liquid chromatography/time-of-flight massspectrometry with automated target library search based on ele-mental formulas. Rapid Commun. Mass Spectrom. 2001, 15(8), 521.
[14] T. Arinobu, H. Hattori, M. Iwai, A. Ishii, T. Kumazawa, O. Suzuki,H. Seno. Liquid chromatographic-mass spectrometric determinationof haloperidol and its metabolites in human plasma and urine.J. Chromatogr. B Analyt. Technol. Biomed. Life Sci. 2002, 776(1), 107.
[15] M. De Meulder, B. M. Remmerie, R. de Vries, L. L. Sips, S. Boom,E. W. Hooijschuur, N. C. van de Merbel, P. M. Timmerman. ValidatedLC-MS/MS methods for the determination of risperidone and theenantiomers of 9-hydroxyrisperidone in human plasma and urine.J. Chromatogr. B Analyt. Technol. Biomed. Life Sci. 2008, 870(1), 8.
[16] M. Josefsson, R. Kronstrand, J. Andersson, M. Roman. Evaluation ofelectrospray ionisation liquid chromatography-tandem mass spec-trometry for rational determination of a number of neurolepticsand their major metabolites in human body fluids and tissues.J. Chromatogr. B Analyt. Technol. Biomed. Life Sci. 2003, 789(1), 151.
Drug Test. Analysis (2012) Copyright © 2012 John Wiley
[17] T. Kumazawa, H. Seno, K. Watanabe-Suzuki, H. Hattori, A. Ishii,K. Sato, O. Suzuki. Determination of phenothiazines in human bodyfluids by solid-phase microextraction and liquid chromatography/tandem mass spectrometry. J. Mass Spectrom. 2000, 35(9), 1091.
[18] S. McClean, E. J. O’Kane, W. F. Smyth. Electrospray ionisation-massspectrometric characterisation of selected anti-psychotic drugsand their detection and determination in human hair samples byliquid chromatography-tandem mass spectrometry. J. Chromatogr.B Biomed. Sci. Appl. 2000, 740(2), 141.
[19] C. Muller, S. Vogt, R. Goerke, A. Kordon, W. Weinmann. Identificationof selected psychopharmaceuticals and their metabolites in hair byLC/ESI-CID/MS and LC/MS/MS. Forensic Sci. Int. 2000, 113(1–3), 415.
[20] M. K. Nielsen, S. S. Johansen, P. W. Dalsgaard, K. Linnet. Simultaneousscreening and quantification of 52 common pharmaceuticals and drugsof abuse in hair using UPLC-TOF-MS. Forensic Sci. Int. 2010, 196(1/3), 85.
[21] D. Thieme, H. Sachs. Examination of a long-term clozapine adminis-tration by high resolution segmental hair analysis. Forensic Sci. Int.2007, 166(2/3), 110.
[22] W. Weinmann, C. Muller, S. Vogt, A. Frei. LC-MS-MS analysis of theneuroleptics clozapine, flupentixol, haloperidol, penfluridol, thiorida-zine, and zuclopenthixol in hair obtained from psychiatric patients. J.Anal. Toxicol. 2002, 26(5), 303.
[23] J. K. Aps, L. C. Martens. Review: The physiology of saliva and transferof drugs into saliva. Forensic Sci. Int. 2005, 150(2–3), 119.
[24] J. Flarakos, W. Luo, M. Aman, D. Svinarov, N. Gerber, P. Vouros. Quan-tification of risperidone and 9-hydroxyrisperidone in plasma andsaliva from adult and pediatric patients by liquid chromatography-mass spectrometry. J. Chromatogr. A 2004, 1026(1/2), 175.
[25] M. Josefsson, M. Roman, E. Skogh, M. L. Dahl. Liquid chromatography/tandem mass spectrometry method for determination of olanzapineand N-desmethylolanzapine in human serum and cerebrospinal fluid.J. Pharm. Biomed. Anal. 2010, 53(3), 576.
[26] K. Nozaki, I. Osaka, H. Kawasaki, R. Arakawa. Application of on-lineelectrochemistry/electrospray/tandem mass spectrometry to aquantification method for the antipsychotic drug zotepine in humanserum. Anal. Sci. 2009, 25(10), 1197.
[27] J. Hasselstrom. Quantification of antidepressants and antipsychoticsin human serum by precipitation and ultra high pressure liquidchromatography-tandem mass spectrometry. J. Chromatogr. BAnalyt. Technol. Biomed. Life Sci. 2011, 879(1), 123.
[28] M. Kollroser, C. Schober. Direct-injection high performance liquidchromatography ion trap mass spectrometry for the quantitativedetermination of olanzapine, clozapine and N-desmethylclozapinein human plasma. Rapid Commun. Mass Spectrom. 2002, 16(13), 1266.
[29] W. Lindner, I. W. Wainer. Requirements for initial assay validationand publication in J. Chromatography B. J. Chromatogr. B Biomed.Sci. Appl. 1998, 707(1/2), 1.
[30] M. Z. Huang, J. Z. Shentu, J. C. Chen, J. Liu, H. L. Zhou. Determinationof risperidone in human plasma by HPLC-MS/MS and its applicationto a pharmacokinetic study in Chinese volunteers. J. Zhejiang Univ.Sci. B 2008, 9(2), 114.
[31] S. Nyberg, M. L. Dahl, C. Halldin. A PET study of D2 and 5-HT2receptor occupancy induced by risperidone in poor metabolizersof debrisoquin and risperidone. Psychopharmacology (Berl) 1995,119(3), 345.
[32] M. Aravagiri, S. R. Marder, K. H. Nuechterlein, M. J. Gitlin. Intra- andinterindividual variations in steady-state plasma concentrations ofrisperidone and 9-hydroxyrisperidone in schizophrenic patientstreated chronically with various doses of risperidone. Ther. DrugMonit. 2003, 25(6), 657.
[33] J. K. Darby, D. J. Pasta, L. Elfand, L. Dabiri, L. Clark, J. Herbert. Risperidonedose and blood level variability: Accumulation effects and interindivid-ual and intraindividual variability in the nonresponder patient in theclinical practice setting. J. Clin. Psychopharmacol. 1997, 17(6), 478.
[34] E. Spina, A. Avenoso, G. Facciola, M. Salemi, M. G. Scordo, M. Ancione,A. G. Madia, E. Perucca. Relationship between plasma risperidoneand 9-hydroxyrisperidone concentrations and clinical responsein patients with schizophrenia. Psychopharmacology (Berl) 2001,153(2), 238.
[35] T. M. Annesley. Ion suppression in mass spectrometry. Clin. Chem.2003, 49(7), 1041.
[36] R. Dams, M. A. Huestis, W. E. Lambert, C. M. Murphy. Matrix effect inbio-analysis of illicit drugs with LC-MS/MS: influence of ionizationtype, sample preparation, and biofluid. J. Am. Soc. Mass Spectrom.2003, 14(11), 1290.
& Sons, Ltd. wileyonlinelibrary.com/journal/dta

E. Saar et al.
Drug Testing
and Analysis
[37] M. Aravagiri, S. R. Marder. Simultaneous determination of clozapineand its N-desmethyl and N-oxide metabolites in plasma by liquidchromatography/electrospray tandem mass spectrometry and itsapplication to plasma level monitoring in schizophrenic patients.J. Pharm. Biomed. Anal. 2001, 26(2), 301.
[38] M. Aravagiri, S. R. Marder. Simultaneous determination of risperidoneand 9-hydroxyrisperidone in plasma by liquid chromatography/electrospray tandem mass spectrometry. J. Mass Spectrom. 2000,35(6), 718.
[39] M. Berna, B. Ackermann, K. Ruterbories, S. Glass. Determination ofolanzapine in human blood by liquid chromatography-tandemmassspectrometry. J. Chromatogr. B Analyt. Technol. Biomed. Life Sci. 2002,767(1), 163.
[40] B. Cabovska, S. L. Cox, A. A. Vinks. Determination of risperidone andenantiomers of 9-hydroxyrisperidone in plasma by LC-MS/MS.J. Chromatogr. B Analyt. Technol. Biomed. Life Sci. 2007, 852(1/2), 497.
[41] S. H. Cho, H. W. Lee, H. T. Im, W. S. Park, Y. W. Choi, J. H. Rew, K. T. Lee.Rapid and highly sensitive liquid chromatography/electrospray ioni-zation tandem mass spectrometry method for the quantitation ofbuspirone in human plasma: Application to a pharmacokineticstudy. Rapid Commun. Mass Spectrom. 2006, 20(8), 1293.
[42] M. H. Gschwend, P. Arnold, J. Ring, W. Martin. Selective and sensitivedetermination of amisulpride in human plasma by liquidchromatography-tandem mass spectrometry with positive electro-spray ionisation and multiple reaction monitoring. J. Chromatogr. BAnalyt. Technol. Biomed. Life Sci. 2006, 831(1/2), 132.
[43] M. Kollroser, G. Henning, R. Gatternig, C. Schober. HPLC-ESI-MS/MSdetermination of zuclopenthixol in a fatal intoxication during psychi-atric therapy. Forensic Sci. Int. 2001, 123(2/3), 243.
[44] M. Kubo, Y. Mizooku, Y. Hirao, T. Osumi. Development and validationof an LC-MS/MS method for the quantitative determination of aripi-prazole and its main metabolite, OPC-14857, in human plasma.J. Chromatogr. B Analyt. Technol. Biomed. Life Sci. 2005, 822(1/2), 294.
[45] D. E. Moody, J. D. Laycock, W. Huang, R. L. Foltz. A high-performanceliquid chromatographic-atmospheric pressure chemical ionization-tandem mass spectrometric method for determination of risperi-done and 9-hydroxyrisperidone in human plasma. J. Anal. Toxicol.2004, 28(6), 494.
[46] R. V. Nirogi, V. N. Kandikere, M. Shukla, K. Mudigonda, S. Maurya,R. Boosi, A. Yerramilli. Development and validation of a sensitiveliquid chromatography/electrospray tandem mass spectrometryassay for the quantification of olanzapine in human plasma. J. Pharm.Biomed. Anal. 2006, 41(3), 935.
[47] K. J. Swart, F. C. Sutherland, G. H. van Essen, H. K. Hundt, A.F. Hundt.Determination of fluspirilene in human plasma by liquid chromatog-raphy-tandem mass spectrometry with electrospray ionisation.J. Chromatogr. A 1998, 828(1/2), 219.
[48] U. Gutteck, K. K. Rentsch. Therapeutic drug monitoring of 13antidepressant and five neuroleptic drugs in serum with liquidchromatography-electrospray ionization mass spectrometry. Clin.Chem. Lab. Med. 2003, 41(12), 1571.
[49] M. Roman, R. Kronstrand, D. Lindstedt, M. Josefsson. Quantitation ofseven low-dosage antipsychotic drugs in human postmortem bloodusing LC-MS-MS. J. Anal. Toxicol. 2008, 32(2), 147.
[50] E. Saar, D. Gerostamoulos, O. H. Drummer, J. Beyer. Identification andquantification of 30 antipsychotics in blood using LC-MS/MS. J. MassSpectrom. 2010, 45(8), 915.
[51] Z. Zhou, X. Li, K. Li, Z. Xie, Z. Cheng, W. Peng, F. Wang, R. Zhu, H. Li.Simultaneous determination of clozapine, olanzapine, risperidoneand quetiapine in plasma by high-performance liquid chromatogra-phy-electrospray ionization mass spectrometry. J. Chromatogr. BAnalyt. Technol. Biomed. Life Sci. 2004, 802(2), 257.
[52] B. Barrett, M. Holcapek, J. Huclova, V. Borek-Dohalsky, P. Fejt, B. Nemec,I. Jelinek. Validated HPLC-MS/MS method for determination ofquetiapine in human plasma. J. Pharm. Biomed. Anal. 2007, 44(2), 498.
[53] M. Berna, R. Shugert, J. Mullen. Determination of olanzapine inhuman plasma and serum by liquid chromatography/tandem massspectrometry. J. Mass Spectrom. 1998, 33(10), 1003.
[54] B. M. Remmerie, L. L. Sips, R. de Vries, J. de Jong, A. M. Schothuis,E. W. Hooijschuur, N. C. van de Merbel. Validated method for thedetermination of risperidone and 9-hydroxyrisperidone in humanplasma by liquid chromatography-tandem mass spectrometry.J. Chromatogr. B Analyt. Technol. Biomed. Life Sci. 2003, 783(2), 461.
[55] E. Choong, S. Rudaz, A. Kottelat, D. Guillarme, J. L. Veuthey, C. B. Eap.Therapeutic drug monitoring of seven psychotropic drugs and four
wileyonlinelibrary.com/journal/dta Copyright © 20
metabolites in human plasma by HPLC-MS. J. Pharm. Biomed. Anal.2009, 50(5), 1000.
[56] C. Kratzsch, F. T. Peters, T. Kraemer, A. A. Weber, H. H. Maurer. Screen-ing, library-assisted identification and validated quantification offifteen neuroleptics and three of their metabolites in plasma byliquid chromatography/mass spectrometry with atmosphericpressure chemical ionization. J. Mass Spectrom. 2003, 38(3), 283.
[57] H. A. Niederlander, E. H. Koster, M. J. Hilhorst, H. J. Metting, M. Eilders,B. Ooms, G. J. de Jong. High throughput therapeutic drug monitoringof clozapine and metabolites in serum by on-line coupling of solidphase extraction with liquid chromatography-mass spectrometry.J. Chromatogr. B Analyt. Technol. Biomed. Life Sci. 2006, 834(1/2), 98.
[58] M. Rittner, F. Pragst, W. R. Bork, J. Neumann. Screening method forseventy psychoactive drugs or drug metabolites in serum basedon high-performance liquid chromatography--electrospray ioniza-tion mass spectrometry. J. Anal. Toxicol. 2001, 25(2), 115.
[59] A. M. Verweij. Quantitative liquid chromatography, thermospray/tandem mass spectrometry (LC/TSP/MS/MS) analysis of sometranquilizers of the thixanthene group in whole-blood. J. Liq.Chromatogr. R. T. 1994, 17(19), 4099.
[60] E. Saar, D. Gerostamoulos, O. H. Drummer, J. Beyer. Comparison ofextraction efficiencies and LC-MS-MS matrix effects using LLE andSPE methods for 19 antipsychotics in human blood. Anal. Bioanal.Chem. 2009, 393(2), 727.
[61] H. Kirchherr, W. N. Kuhn-Velten. Quantitative determination of forty-eight antidepressants and antipsychotics in human serum by HPLCtandem mass spectrometry: a multi-level, single-sample approach.J. Chromatogr. B Analyt. Technol. Biomed. Life Sci. 2006, 843(1), 100.
[62] J. Bhatt, G. Subbaiah, S. Singh. Liquid chromatography/tandem massspectrometry method for simultaneous determination of risperi-done and its active metabolite 9-hydroxyrisperidone in humanplasma. Rapid Commun. Mass Spectrom. 2006, 20(14), 2109.
[63] E. Chambers, D. M. Wagrowski-Diehl, Z. Lu, J. R. Mazzeo. Systematicand comprehensive strategy for reducing matrix effects in LC/MS/MS analyses. J. Chromatogr. B Analyt. Technol. Biomed. Life Sci.2007, 852(1/2), 22.
[64] M. Jemal, Z. Ouyang, Y. Q. Xia. Systematic LC-MS/MS bioanalyticalmethod development that incorporates plasma phospholipidsrisk avoidance, usage of incurred sample and well thought-outchromatography. Biomed. Chromatogr. 2010, 24(1), 2.
[65] M. K. Nielsen, S. S. Johansen. Determination of olanzapine in wholeblood using simple protein precipitation and liquid chromatography-tandem mass spectrometry. J. Anal. Toxicol. 2009, 33(4), 212.
[66] H. Sachs, P. Kintz. Recommendations for hair testing in forensiccases. Forensic Sci. Int. 2004, 145(2/3), 83.
[67] T. Cairns, V. Hill, M. Schaffer, W. Thistle. Levels of cocaine and itsmetabolites in washed hair of demonstrated cocaine users andworkplace subjects. Forensic Sci. Int. 2004, 145(2/3), 175.
[68] T. Cairns, V. Hill, M. Schaffer, W. Thistle. Amphetamines in washedhair of demonstrated users and workplace subjects. Forensic Sci.Int. 2004, 145(2/3), 137.
[69] T. Cairns, V. Hill, M. Schaffer, W. Thistle. Removing and identifyingdrug contamination in the analysis of human hair. Forensic Sci. Int.2004, 145(2/3), 97.
[70] M. Schaffer, V. Hill, T. Cairns. Morphine and 6-monoacetylmorphinein hair of heroin users: use of invalid extraction procedures gener-ates erroneous conclusions. J. Anal. Toxicol. 2005, 29(1), 76.
[71] M. I. Schaffer, W. L. Wang, J. Irving. An evaluation of two washprocedures for the differentiation of external contamination versusingestion in the analysis of human hair samples for cocaine. J. Anal.Toxicol. 2002, 26(7), 485.
[72] W. L. Wang, E. J. Cone. Testing human hair for drugs of abuse. IV.Environmental cocaine contamination and washing effects. ForensicSci. Int. 1995, 70(1/3), 39.
[73] R. B. Paulsen, D. G. Wilkins, M. H. Slawson, K. Shaw, D. E. Rollins. Effectof four laboratory decontamination procedures on the quantitativedetermination of cocaine and metabolites in hair by HPLC-MS.J. Anal. Toxicol. 2001, 25(7), 490.
[74] F. Musshoff, B. Madea. New trends in hair analysis and scientificdemands on validation and technical notes. Forensic Sci. Int. 2007,165(2/3), 204.
[75] C. Hoelzle, F. Scheufler, M. Uhl, H. Sachs, D. Thieme. Application ofdiscriminant analysis to differentiate between incorporation ofcocaine and its congeners into hair and contamination. ForensicSci. Int. 2008, 176(1), 13.
12 John Wiley & Sons, Ltd. Drug Test. Analysis (2012)

Review: The analysis of antipsychotic drugs in human matrices
Drug Testing
and Analysis
[76] M. J. Bogusz, K. D. Kruger, R. D. Maier, R. Erkwoh, F. Tuchtenhagen.Monitoring of olanzapine in serum by liquid chromatography-atmospheric pressure chemical ionization mass spectrometry.J. Chromatogr. B Biomed. Sci. Appl. 1999, 732(2), 257.
[77] K. Kassahun, E. Mattiuz, E. Nyhart Jr., B. Obermeyer, T. Gillespie,A. Murphy, R. M. Goodwin, D. Tupper, J. T. Callaghan, L. Lemberger.Disposition and biotransformation of the antipsychotic agentolanzapine in humans. Drug Metab. Dispos. 1997, 25(1), 81.
[78] E. Skogh, I. Sjodin, M. Josefsson, M. L. Dahl. High correlation betweenserum and cerebrospinal fluid olanzapine concentrations in patientswith schizophrenia or schizoaffective disorder medicating with oralolanzapine as the only antipsychotic drug. J. Clin. Psychopharm.2011, 31(1), 4.
[79] L. E. van Beijsterveldt, R. J. Geerts, J. E. Leysen, A. A. Megens,H. M. Van den Eynde, W. E. Meuldermans, J. J. Heykants. Regionalbrain distribution of risperidone and its active metabolite9-hydroxy-risperidone in the rat. Psychopharmacol. (Berl.) 1994,114(1), 53.
[80] J. Kane, F. Canas, M. Kramer, L. Ford, C. Gassmann-Mayer, P. Lim,M. Eerdekens. Treatment of schizophrenia with paliperidoneextended-release tablets: a 6-week placebo-controlled trial. Schizophr.Res. 2007, 90(1/3), 147.
[81] N. Yasui-Furukori, M. Hidestrand, E. Spina, G. Facciola, M. G. Scordo,G. Tybring. Different enantioselective 9-hydroxylation of risperidoneby the two human CYP2D6 and CYP3A4 enzymes. Drug Metab.Dispos. 2001, 29(10), 1263.
[82] D. Remane, M. R. Meyer, D. K. Wissenbach, H. H. Maurer. Ultra highperformance liquid chromatographic-tandem mass spectrometricmulti-analyte procedure for target screening and quantification inhuman blood plasma: Validation and application for 31 neuroleptics,28 benzodiazepines, and Z-drugs. Anal. Bioanal. Chem. 2011,401(4), 1341.
[83] C. Chin, Z. P. Zhang, H. T. Karnes. A study of matrix effects on an LC/MS/MS assay for olanzapine and desmethyl olanzapine. J. Pharm.Biomed. Anal. 2004, 35(5), 1149.
[84] R. King, R. Bonfiglio, C. Fernandez-Metzler, C. Miller-Stein, T. Olah.Mechanistic investigation of ionization suppression in electrosprayionization. J. Am. Soc. Mass Spectrom. 2000, 11(11), 942.
[85] B. K. Matuszewski, M. L. Constanzer, C. M. Chavez-Eng. Strategiesfor the assessment of matrix effect in quantitative bioanalyticalmethods based on HPLC-MS/MS. Anal. Chem. 2003, 75(13), 3019.
[86] The World Anti-Doping Agency. Identification Criteria for QualitativeAssays, Document TD2003IDCR; 2010 [15 January 2012].
Drug Test. Analysis (2012) Copyright © 2012 John Wiley
[87] U.S. Department of Health and Human Services. Guidance for Indus-try: Mass Spectrometry for Confirmation of the Identity of AnimalDrug Residues, Final Guidance. Available at: http://www.fda.gov/AnimalVeterinary/GuidanceComplianceEnforcement/GuidanceforIndustry/default.htm [15 January 2012].
[88] US Department of Health and Human Services Food and DrugAdministration, Center for Drug Evaluation and Research (CDER),Center for Veterinary Medicine (CVM). Validation concepts forpesticide residues in food of animal origin 2002/657/EC. 2002 [15January 2012].
[89] K. R. Allen. Interference by venlafaxine ingestion in the detection oftramadol by liquid chromatography linked to tandem mass spec-trometry for the screening of illicit drugs in human urine. Clin.Toxicol. (Phila.) 2006, 44(2), 147.
[90] H. H. Maurer. Advances in analytical toxicology: the current role ofliquid chromatography-mass spectrometry in drug quantificationin blood and oral fluid. Anal. Bioanal. Chem. 2005, 381(1), 110.
[91] M. J. Bogusz. Large amounts of drugs may considerably influencethe peak areas of their coinjected deuterated analogues measuredwith APCI-LC-MS. J. Anal. Toxicol. 1997, 21(3), 246.
[92] W. M. Chew, M. J. Xu, C. A. Cordova, H. H. Chow. Quantification of acytochrome P450 3A4 substrate, buspirone, in human plasma byliquid chromatography-tandem mass spectrometry. J. Chromatogr.B Analyt. Technol. Biomed. Life Sci. 2006, 844(2), 235.
[93] D. Dadgar, P. E. Burnett. Issues in evaluation of bioanalyticalmethod selectivity and drug stability. J. Pharm. Biomed. Anal.1995, 14(1/2), 23.
[94] R. Bonfiglio, R. C. King, T. V. Olah, K. Merkle. The effects of samplepreparation methods on the variability of the electrospray ionizationresponse for model drug compounds. Rapid Commun. MassSpectrom. 1999, 13(12), 1175.
[95] H. Seno, H. Hattori, A. Ishii, T. Kumazawa, K. Watanabe-Suzuki,O. Suzuki. High performance liquid chromatography/electrospraytandem mass spectrometry for phenothiazines with heavy sidechains in whole blood. Rapid Commun. Mass Spectrom. 1999, 13(23),2394.
[96] Thomson Reuters (Healthcare) Inc. MicrodemexW Healthcare Series,1974–2010 Greenwood Village, Colorado, USA.
[97] The International Association of Forensic Toxicologists. Referenceblood level list of therapeutic and toxic substances, 2004.
[98] R. C. Baselt. Disposition of Toxic Drugs and Chemicals in Man, 8 edition,2008 http://www.tiaft.org/ Biomedical Publications: Foster City,California.
& Sons, Ltd. wileyonlinelibrary.com/journal/dta