Identification of oxidized phospholipids by electrospray ionization mass spectrometry and LC-MS...
17
Methods in Free Radical Biology and Medicine Identification of oxidized phospholipids by electrospray ionization mass spectrometry and LC–MS using a QQLIT instrument Corinne M. Spickett ⁎, Ana Reis, Andrew R. Pitt School of Life and Health Sciences, Aston University, Birmingham B4 7ET, UK abstract article info Article history: Received 18 June 2011 Revised 1 September 2011 Accepted 2 September 2011 Available online 16 September 2011 Keywords: Phospholipid oxidation Chlorinated phospholipids Liquid chromatography Precursor ion scanning Neutral loss scanning Lipidomics Free radicals Phospholipids are complex and varied biomolecules that are susceptible to lipid peroxidation after attack by free radicals or electrophilic oxidants and can yield a large number of different oxidation products. There are many available methods for detecting phospholipid oxidation products, but also various limitations and problems. Electrospray ionization mass spectrometry allows the simultaneous but specific analysis of multi- ple species with good sensitivity and has a further advantage that it can be coupled to liquid chromatography for separation of oxidation products. Here, we explain the principles of oxidized phospholipid analysis by electrospray mass spectrometry and describe fragmentation routines for surveying the structural properties of the analytes, in particular precursor ion and neutral loss scanning. These allow targeted detection of phos- pholipid headgroups and identification of phospholipids containing hydroperoxides and chlorine, as well as the detection of some individual oxidation products by their specific fragmentation patterns. We describe in- strument protocols for carrying out these survey routines on a QTrap5500 mass spectrometer and also for in- terfacing with reverse-phase liquid chromatography. The article highlights critical aspects of the analysis as well as some limitations of the methodology. © 2011 Elsevier Inc. All rights reserved. Introduction Oxidation of phospholipids occurs in a variety of physiological and pathological situations and has multitudinous effects on biological sys- tems: the number of known biological and signaling effects of oxidized phospholipids is steadily increasing along with our understanding of their importance in mammalian cell function [1]. The early products of phospholipid peroxidation are hydroperoxides, which can rearrange to compounds containing epoxides, hydroxides, or ketones and isopros- tane-like structures. Further oxidation and destabilization can result in cleavage of the oxidized fatty acyl chain to yield chain-shortened phos- pholipids and a corresponding nonesterified molecule. Methods for an- alyzing lipid peroxidation and phospholipid oxidation products have been available for nearly a century and vary from simple colorimetric assays to complex antibody- or technology-dependent procedures [2,3]. As a generalization, the quality and quantity of information is pro- portional to the complexity of the assay, although simple assays that measure a generic set of oxidation products also have their uses, for ex- ample, in rapid screening or when it is not necessary to discriminate be- tween different oxidation products (occasionally a global measure of lipid damage is useful). If more specific analysis of individual products is desired, prior separation by chromatography is the best approach, of which HPLC offers the most flexibility for interfacing with various de- tection systems such as UV, fluorescence, electrochemical, chemilumi- nescence, or mass spectrometry. Many assays depend on the reaction of the lipid oxidation product of interest with a chemical reagent to enable detection, for example, by the formation of a chromophore or fluorophore or by light emission. How- ever, the assay reagents are not necessarily as specific as desired and may give misleading results. For example, there are a number of re- agents that react with carbonyl groups, which as mentioned above are common end products of lipid peroxidation; examples include 2,4-dini- trophenylhydrazine, cysteamine, and cyclohexanedione. These will react with any carbonyl-containing products of lipid peroxidation, but also with other aldehydes and ketones that are not lipid-derived, in- cluding some carbohydrates. Thus specific identification of lipid perox- idation products depends on separation of the assay products before detection and use of standards prepared by reaction with known com- pounds, but even so it is sometimes not possible to resolve lipid perox- idation products from interfering compounds and identify them definitively. The thiobarbituric acid-reactive substances assay, which is commonly used for malondialdehyde, suffers from such limitations [4]. Chemiluminescence methods involving the reaction of hydroperox- ides (from fatty acids, cholesterol, or phospholipids) postcolumn with luminol or isoluminol in the presence of microperoxidase are also fre- quently used, but equally depend on resolution quality and standards for identification of the exact species. Ultimately, any method that de- pends on a specific chemical modification is only as good as the Free Radical Biology & Medicine 51 (2011) 2133–2149 ⁎ Corresponding author. Fax: + 44 121 2044175. E-mail address: [email protected] (C.M. Spickett). 0891-5849/$ – see front matter © 2011 Elsevier Inc. All rights reserved. doi:10.1016/j.freeradbiomed.2011.09.003 Contents lists available at SciVerse ScienceDirect Free Radical Biology & Medicine journal homepage: www.elsevier.com/locate/freeradbiomed
-
Upload
independent -
Category
Documents
-
view
0 -
download
0
Transcript of Identification of oxidized phospholipids by electrospray ionization mass spectrometry and LC-MS...

Free Radical Biology & Medicine 51 (2011) 2133–2149
Contents lists available at SciVerse ScienceDirect
Free Radical Biology & Medicine
j ourna l homepage: www.e lsev ie r .com/ locate / f reeradb iomed
Methods in Free Radical Biology and Medicine
Identification of oxidized phospholipids by electrospray ionization massspectrometry and LC–MS using a QQLIT instrument
Corinne M. Spickett ⁎, Ana Reis, Andrew R. PittSchool of Life and Health Sciences, Aston University, Birmingham B4 7ET, UK
⁎ Corresponding author. Fax: +44 121 2044175.E-mail address: [email protected] (C.M. Spick
0891-5849/$ – see front matter © 2011 Elsevier Inc. Alldoi:10.1016/j.freeradbiomed.2011.09.003
a b s t r a c t
a r t i c l e i n f oArticle history:Received 18 June 2011Revised 1 September 2011Accepted 2 September 2011Available online 16 September 2011
Keywords:Phospholipid oxidationChlorinated phospholipidsLiquid chromatographyPrecursor ion scanningNeutral loss scanningLipidomicsFree radicals
Phospholipids are complex and varied biomolecules that are susceptible to lipid peroxidation after attack byfree radicals or electrophilic oxidants and can yield a large number of different oxidation products. There aremany available methods for detecting phospholipid oxidation products, but also various limitations andproblems. Electrospray ionization mass spectrometry allows the simultaneous but specific analysis of multi-ple species with good sensitivity and has a further advantage that it can be coupled to liquid chromatographyfor separation of oxidation products. Here, we explain the principles of oxidized phospholipid analysis byelectrospray mass spectrometry and describe fragmentation routines for surveying the structural propertiesof the analytes, in particular precursor ion and neutral loss scanning. These allow targeted detection of phos-pholipid headgroups and identification of phospholipids containing hydroperoxides and chlorine, as well asthe detection of some individual oxidation products by their specific fragmentation patterns. We describe in-strument protocols for carrying out these survey routines on a QTrap5500 mass spectrometer and also for in-terfacing with reverse-phase liquid chromatography. The article highlights critical aspects of the analysis aswell as some limitations of the methodology.
ett).
rights reserved.
© 2011 Elsevier Inc. All rights reserved.
Introduction
Oxidation of phospholipids occurs in a variety of physiological andpathological situations and has multitudinous effects on biological sys-tems: the number of known biological and signaling effects of oxidizedphospholipids is steadily increasing along with our understanding oftheir importance in mammalian cell function [1]. The early products ofphospholipid peroxidation are hydroperoxides, which can rearrangeto compounds containing epoxides, hydroxides, or ketones and isopros-tane-like structures. Further oxidation and destabilization can result incleavage of the oxidized fatty acyl chain to yield chain-shortened phos-pholipids and a corresponding nonesterified molecule. Methods for an-alyzing lipid peroxidation and phospholipid oxidation products havebeen available for nearly a century and vary from simple colorimetricassays to complex antibody- or technology-dependent procedures[2,3]. As a generalization, the quality and quantity of information is pro-portional to the complexity of the assay, although simple assays thatmeasure a generic set of oxidation products also have their uses, for ex-ample, in rapid screening orwhen it is not necessary to discriminate be-tween different oxidation products (occasionally a global measure oflipid damage is useful). If more specific analysis of individual productsis desired, prior separation by chromatography is the best approach,
of whichHPLC offers themost flexibility for interfacingwith various de-tection systems such as UV, fluorescence, electrochemical, chemilumi-nescence, or mass spectrometry.
Many assays depend on the reaction of the lipid oxidation product ofinterestwith a chemical reagent to enable detection, for example, by theformation of a chromophore or fluorophore or by light emission. How-ever, the assay reagents are not necessarily as specific as desired andmay give misleading results. For example, there are a number of re-agents that react with carbonyl groups, which as mentioned above arecommon end products of lipid peroxidation; examples include 2,4-dini-trophenylhydrazine, cysteamine, and cyclohexanedione. These willreact with any carbonyl-containing products of lipid peroxidation, butalso with other aldehydes and ketones that are not lipid-derived, in-cluding some carbohydrates. Thus specific identification of lipid perox-idation products depends on separation of the assay products beforedetection and use of standards prepared by reaction with known com-pounds, but even so it is sometimes not possible to resolve lipid perox-idation products from interfering compounds and identify themdefinitively. The thiobarbituric acid-reactive substances assay, whichis commonly used for malondialdehyde, suffers from such limitations[4]. Chemiluminescencemethods involving the reaction of hydroperox-ides (from fatty acids, cholesterol, or phospholipids) postcolumn withluminol or isoluminol in the presence of microperoxidase are also fre-quently used, but equally depend on resolution quality and standardsfor identification of the exact species. Ultimately, any method that de-pends on a specific chemical modification is only as good as the

2134 C.M. Spickett et al. / Free Radical Biology & Medicine 51 (2011) 2133–2149
specificity of the assay reagent. The same limitation theoretically ap-plies to methods based on antibodies, such as the use of EO3 and EO6antibodies that recognize 1-palmitoyl-2-(5′-oxovaleroyl)-sn-glycero-3-phosphocholine (POVPC)1 adducts on LDL [5].
An advantage of mass-spectrometry-based methods is that theymeasure the mass-to charge ratio (m/z) of compounds, which repre-sents a more selective although not unique characteristic compared tothose described above. Thismeans that several species that coelute dur-ing chromatography can nevertheless be identified. Gas chromatogra-phy–mass spectrometry has been the method of choice for analysis offatty acids and isoprostanes [6], but is compatible only with volatilecompounds, thus requiring chemical modification to hydrolyze phos-pholipids to fatty acids and derivatize these first to pentafluorobenzylesters followed by formation of volatile trimethylsilyl ethers. This is alabor-intensive procedure with the corresponding danger of artifact in-troduction during the chemical reactions. In contrast, soft ionizationmass spectrometry techniques such as electrospray ionization–massspectrometry (ESI–MS) can be used for many ionizable species and in-terface ideally with liquid chromatography, so phospholipid extractscan be analyzed without further manipulation [3]. In analysis of
Sample + solvent
Nebulizing gas
Electrospray capillary 2-3 kV relative to skimme
evaporation of solvent
explosive fragmentatio
++
++++
+
++
++++ +
+
Orifice plate
Skimmer
Q0 (ion focusing)
Q1 (ion selection)
+ + + + +
+ +
+ + + + + + + + + + + + + + + + + + + + + + + +
A
B
C
Fig. 1. Schematic diagram of an electrospray source showing formation of pseudo-molecularment. (B) The sample (in aqueous-organic solvent) is sprayed through a charged capillary aform by explosive fragmentation as the droplet dries.
phospholipid oxidation, mass spectrometry has the advantage that itis not dependent on functional group or reactivity, but a wide varietyof oxidative modifications can be detected. Thus in addition to productsof radical-induced peroxidation, it can also identify products of electro-philic oxidation, such as the formation of chlorinated lipids after attackwith hypochlorous acid (HOCl) or nitrated products resulting from re-actions with peroxynitrite or other reactive nitrogen species [3].
There is a wide variety of strategies for the application of ESI–MS tothe analysis of phospholipid oxidation, as detailed in the next section,and the application of MS technology to studies of lipid oxidation in bi-ological and biomedical science is rapidly expanding as researchers be-come aware of the potential of the approach and MS instrumentsbecome more accessible. The methodology is continually being devel-oped and new applications are constantly emerging [7–9]. There aremany reports on the application of ESI–MS or LC–MS to biological andclinical samples. The presence of fatty acid hydroperoxides derivedfrom phospholipids has been observed in oxidatively stressed redblood cells [10] and phospholipid chlorohydrins were detected in LDL[11] using LC–MS. Several novel oxidation products of 1-palmitoyl-2-arachidonoyl-sn-glycero-3-phosphocholine (PAPC) were identified in
++++++++++
r
ion beam
n
++
++
++
++
++
+
++ +
++
+
Pseudo molecular ion
Q2 (ion fragmentation)
Q3/LIT (m/z measurement)
+ + + + + + + + + + + + + + + + + + + + + + + + + + + + + + + + + + + + +
Detector (Multiplier)
ions. (A) The geometry of a tandem or quadrupole–quadrupole–linear ion trap instru-nd the solvent is evaporated by the sheath of nebulizing gas. (C) Pseudo-molecular ions
2135C.M. Spickett et al. / Free Radical Biology & Medicine 51 (2011) 2133–2149
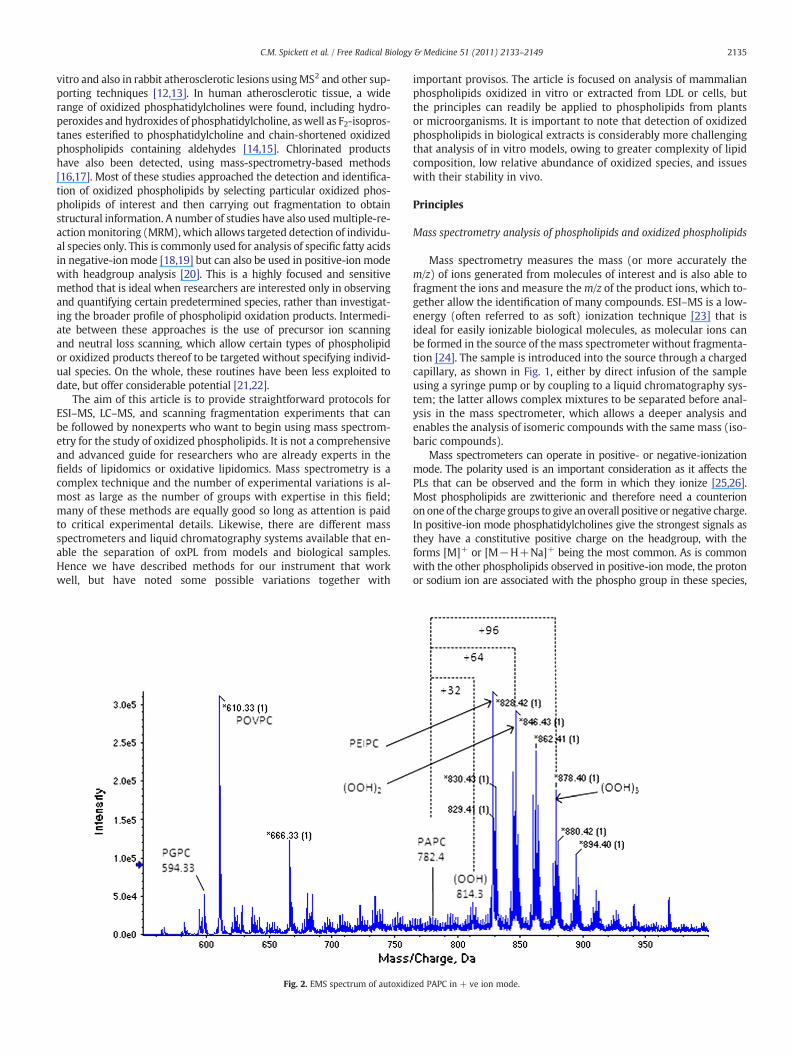
vitro and also in rabbit atherosclerotic lesions usingMS2 and other sup-porting techniques [12,13]. In human atherosclerotic tissue, a widerange of oxidized phosphatidylcholines were found, including hydro-peroxides and hydroxides of phosphatidylcholine, aswell as F2-isopros-tanes esterified to phosphatidylcholine and chain-shortened oxidizedphospholipids containing aldehydes [14,15]. Chlorinated productshave also been detected, using mass-spectrometry-based methods[16,17]. Most of these studies approached the detection and identifica-tion of oxidized phospholipids by selecting particular oxidized phos-pholipids of interest and then carrying out fragmentation to obtainstructural information. A number of studies have also usedmultiple-re-actionmonitoring (MRM), which allows targeted detection of individu-al species only. This is commonly used for analysis of specific fatty acidsin negative-ionmode [18,19] but can also be used in positive-ion modewith headgroup analysis [20]. This is a highly focused and sensitivemethod that is ideal when researchers are interested only in observingand quantifying certain predetermined species, rather than investigat-ing the broader profile of phospholipid oxidation products. Intermedi-ate between these approaches is the use of precursor ion scanningand neutral loss scanning, which allow certain types of phospholipidor oxidized products thereof to be targeted without specifying individ-ual species. On the whole, these routines have been less exploited todate, but offer considerable potential [21,22].
The aim of this article is to provide straightforward protocols forESI–MS, LC–MS, and scanning fragmentation experiments that canbe followed by nonexperts who want to begin using mass spectrom-etry for the study of oxidized phospholipids. It is not a comprehensiveand advanced guide for researchers who are already experts in thefields of lipidomics or oxidative lipidomics. Mass spectrometry is acomplex technique and the number of experimental variations is al-most as large as the number of groups with expertise in this field;many of these methods are equally good so long as attention is paidto critical experimental details. Likewise, there are different massspectrometers and liquid chromatography systems available that en-able the separation of oxPL from models and biological samples.Hence we have described methods for our instrument that workwell, but have noted some possible variations together with
Fig. 2. EMS spectrum of autoxidi
important provisos. The article is focused on analysis of mammalianphospholipids oxidized in vitro or extracted from LDL or cells, butthe principles can readily be applied to phospholipids from plantsor microorganisms. It is important to note that detection of oxidizedphospholipids in biological extracts is considerably more challengingthat analysis of in vitro models, owing to greater complexity of lipidcomposition, low relative abundance of oxidized species, and issueswith their stability in vivo.
Principles
Mass spectrometry analysis of phospholipids and oxidized phospholipids
Mass spectrometry measures the mass (or more accurately them/z) of ions generated from molecules of interest and is also able tofragment the ions and measure them/z of the product ions, which to-gether allow the identification of many compounds. ESI–MS is a low-energy (often referred to as soft) ionization technique [23] that isideal for easily ionizable biological molecules, as molecular ions canbe formed in the source of the mass spectrometer without fragmenta-tion [24]. The sample is introduced into the source through a chargedcapillary, as shown in Fig. 1, either by direct infusion of the sampleusing a syringe pump or by coupling to a liquid chromatography sys-tem; the latter allows complex mixtures to be separated before anal-ysis in the mass spectrometer, which allows a deeper analysis andenables the analysis of isomeric compounds with the same mass (iso-baric compounds).
Mass spectrometers can operate in positive- or negative-ionizationmode. The polarity used is an important consideration as it affects thePLs that can be observed and the form in which they ionize [25,26].Most phospholipids are zwitterionic and therefore need a counterionon one of the charge groups to give an overall positive or negative charge.In positive-ion mode phosphatidylcholines give the strongest signals asthey have a constitutive positive charge on the headgroup, with theforms [M]+ or [M−H+Na]+ being the most common. As is commonwith the other phospholipids observed in positive-ion mode, the protonor sodium ion are associated with the phospho group in these species,
zed PAPC in + ve ion mode.
2136 C.M. Spickett et al. / Free Radical Biology & Medicine 51 (2011) 2133–2149
and other ions can also take their place, especially the alkali metals (Liand K) and ammonia. Phosphatidylethanolamines (PEs) can readily ac-quire a positive charge on the amine group to form [M+H]+. OtherPLs, including cardiolipin (diphosphatidylglycerol), phosphatidylserine
Q1 QQuadrupole
OxPLsample
Liquid Chromatography
Phospholipids separated
Time (mins)
Scan through mass range
m/z
Time (4 s)
OPO-
OO
O
O
O
O
NMe
Me
Me
OH
RO
PGPC at 610.4 m/z
Q1 QQuadrupole
Liquid Chromatography
Phospholipids separated
Scan through mass range
m/z
Time (4 s)
OP
O-
O
O
O
O
O
O
NMe
Me
Me HO Cl HO Cl
Time (mins)
Bis-chlorohydrinof SAPC at 886.5 m/z
OxPL sample
A (EPI)
B (PIS)
C (NL)
Q1 Q2Quadrupole
Sample introduced by direct infusion
or LC
Hfragcol
Fixed to detect the desired parent ion
610.5 m/z
PAPC-(OOH)at 814.8 m/z
OPO-
OO
O
O
O
O
NMe
Me
Me
O
OH
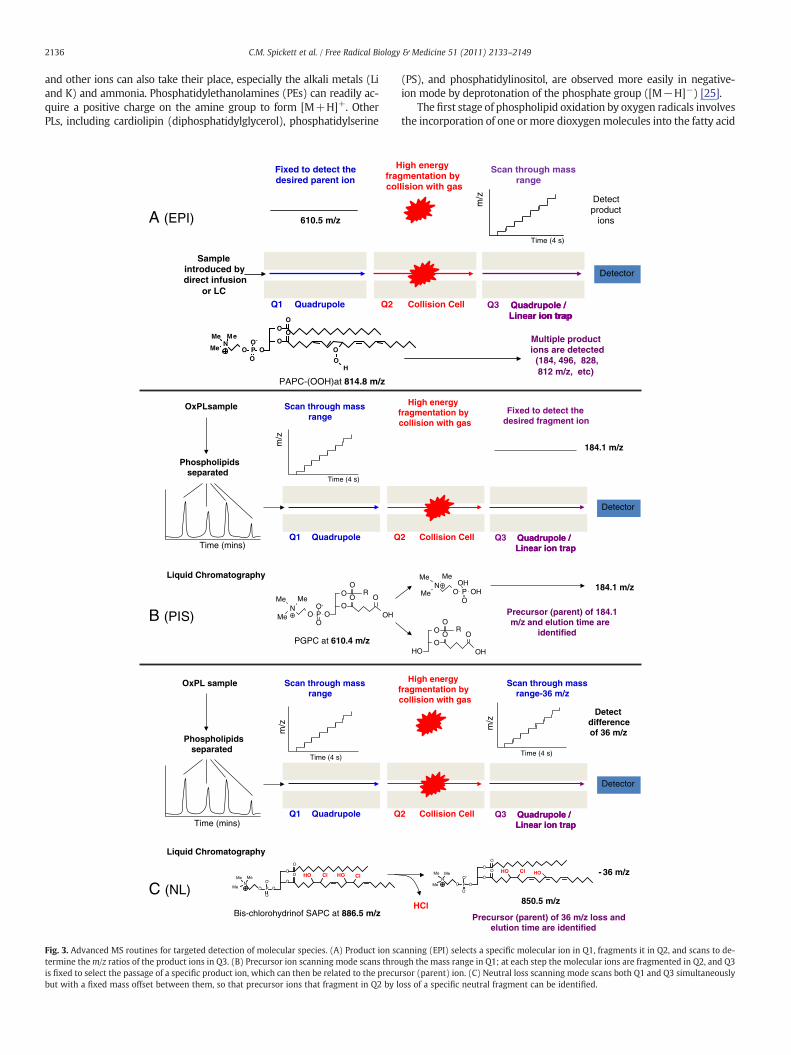
Fig. 3. Advanced MS routines for targeted detection of molecular species. (A) Product ion sctermine them/z ratios of the product ions in Q3. (B) Precursor ion scanning mode scans throis fixed to select the passage of a specific product ion, which can then be related to the precubut with a fixed mass offset between them, so that precursor ions that fragment in Q2 by l
(PS), and phosphatidylinositol, are observed more easily in negative-ion mode by deprotonation of the phosphate group ([M−H]−) [25].
The first stage of phospholipid oxidation by oxygen radicals involvesthe incorporation of one ormore dioxygenmolecules into the fatty acid
Detector
Collision Cell2 Quadrupole / Linear ion trap
Q3
High energy fragmentation by collision with gas
Fixed to detect the desired fragment ion
Quadrupole / Linear ion trap
184.1 m/z
184.1 m/zOHPOH
OO
NMe
Me
Me
HO
O
O
O
O
OH
RO
Precursor (parent) of 184.1 m/z and elution time are
identified
Detector
Collision Cell2 Quadrupole / Linear ion trap
Q3
High energy fragmentation by collision with gas
Quadrupole / Linear ion trap
Detect difference of 36 m/z
- 36 m/z
Precursor (parent) of 36 m/z loss and elution time are identified
Scan through mass range-36 m/z
m/z
Time (4 s)
HCl 850.5 m/z
OP
O-
O
O
O
O
O
O
NMe
Me
Me HO Cl HO
Detector
Collision Cell Quadrupole / Linear ion trap
Q3
Scan through mass range
igh energy mentation by
lision with gas
Quadrupole / Linear ion trap
Detect product
ions
m/z
Time (4 s)
Multiple product ions are detected
(184, 496, 828, 812 m/z, etc)
anning (EPI) selects a specific molecular ion in Q1, fragments it in Q2, and scans to de-ugh the mass range in Q1; at each step the molecular ions are fragmented in Q2, and Q3rsor (parent) ion. (C) Neutral loss scanning mode scans both Q1 and Q3 simultaneouslyoss of a specific neutral fragment can be identified.

Table 1Specific ions and losses for oxidized phospholipids (only major diagnostic ions andlosses shown).
Positive ion Negative ion
HeadgroupPhosphatidylcholine Precursor ion m/z 184 —
Phosphatidylserine Neutral loss 185 Da Neutral loss 87 DaPhosphatidylethanolamine Neutral loss 141 Da —
Phosphatidylinositol — Precursor ion m/z 241Sphingomyelin Precursor ion m/z 184
Oxidative modificationHydroperoxide (−OOH) Neutral loss 34 Da Neutral loss 34 DaChlorohydrin Neutral loss
18/36/38 DaNeutral loss18/36/38 Da
Specific ox PLPOVPC Neutral loss 98 Da Neutral loss 98 DaPGPC Neutral loss 114 Da Neutral loss 114 DaPONPC Neutral loss 154 Da Neutral loss 154 DaPAzPC Neutral loss 170 Da Neutral loss 170 Da
Cardiolipin cannot be analyzed readily in a QTrap5500 because in the monovalent formits m/z is above the range of the instrument.
2137C.M. Spickett et al. / Free Radical Biology & Medicine 51 (2011) 2133–2149
side chains to form hydroperoxides, which results in an increase inm/zby multiples of 32 Da [27]. Subsequent rearrangement, additional oxi-dation, and cleavage of the oxidized fatty acyl chain lead to furtherchanges in the m/z. One of the great strengths of mass spectrometry isthat a significant number of these oxidation products can be observedsimultaneously in the mass spectrum (Fig. 2). Nonradical oxidation,for example, by HOCl or peroxynitrite (ONOO−), results in the forma-tion of other distinctive products, including chlorohydrins and nitratedlipids, and likewise alters their m/z[28,29]. If all the components in amixture have different m/z's, they will give distinct signals in the spec-trum. However, isobaric ions (with the same m/z) do occur, such asthe oxidation product of a shorter chain fatty acid (monohydroperoxideof PLPC,m/z 790) and a native longer chain fatty acid (distearoyl-PC,m/z790), and these are indistinguishable using theirm/z alone byMSwhenusing direct infusion; separation by chromatography orMS2 fragmenta-tion is required to distinguish the phospholipids in this case.
Separation of oxidized PLs by HPLC
Liquid chromatography interfaces ideally with ESI–MS, as thesample needs to be introduced in a liquid flow, and the mixture ofaqueous and polar organic solvents is well suited to the generationof a good spray. Either normal-phase or reverse-phase columns canbe used for separation of phospholipids: normal phase involves a sil-ica stationary phase with nonpolar mobile phase and is most effectivefor separating phospholipid classes, but the solvents are less wellsuited to generating a good electrospray, whereas reverse phase in-volves a nonpolar capped silica stationary phase and a polar mobilephase, which separates phospholipids based on fatty acyl chainlength and saturation and is better suited to integration with electro-spray. A recently introducedmethod, hydrophilic interaction chroma-tography, is seeing increasing use in lipid analysis and is effectively amore robust form of normal-phase separation that uses solventsmore compatible with mass spectrometry [30]. Reverse phase withC8 or C18 columns works best for identification of oxidized phospho-lipids, as these are more polar than native PLs and elute earlier fromthe column. Either isocratic or gradient elution can be used; typicalmobile phases are a mixture of aqueous buffer with methanol or ace-tonitrile, although other solvents such as hexane or isopropanol aresometimes used as cosolvents. The solvent system usually containsan ion-pairing reagent for the chromatography, such as ammoniumacetate, ammonium formate, or acetic or formic acid, to reduce theformation of mixed species with other counterions and to facilitateionization. The choice depends on polarity of the ionization andwhich PL species are of interest. In this method, we use ammoniumacetate, which we have found to be an effective ion-pairing reagentand is compatible with both positive- and negative-ion modes.
Fragmentation methods to identify oxidized PLs
An important strength of tandem mass spectrometry is the abilityto select an ion, fragment it in the collision cell, and measure the m/zof the fragments. This can be used in a number of different ways to aidphospholipid analysis. Although the m/z and elution time are oftensufficient to identify a phospholipid and its general structure withreasonable confidence, information on the distribution of fatty acylchains and oxidation sites is desirable. This can be obtained by frag-menting the molecular ion in the collision cell of the mass spectrom-eter and recording a mass spectrum of the product ions.
There are severalmass spectrometry routines that can be used to se-lectively identify ions containing specific motifs, based on varying thescans done in the two mass analyzers and how they are correlated, asillustrated in Fig. 3. A common approach (product ion analysis) involvesselecting amolecular ion of interest in thefirstmass analyzer, fragment-ing it by collision with gas in the collision cell, and scanning the frag-ments (product ions) in the second mass analyzer to obtain their m/z
and information about the composition of the parent molecular ion,for example, the position of (un)modified acyl chain in the glycerolmoi-ety, nature of the modification (functional group), and location of func-tional group within the carbon acyl chain [31]. This routine is useful forstructural identification but it is time consuming to do this individuallyfor all components of a complex mixture. Two powerful selectivemethods for identifying lipids containing specific structural compo-nents are precursor ion scanning and neutral loss scanning. Precursorion scanning involves the identification of molecular species that giverise to a particular product ion after fragmentation. An example is thatphosphatidylcholines fragment to give a phosphocholine moiety,which has a mass atm/z 184.1. If the second analyzer is set up to detectthis ion and the first analyzer is scanned through the mass range, them/z's of all the species that fragment to give ions at m/z 184 can be de-termined. Thisworkswell formolecular ions that fragment to yield a di-agnostic or informative ion of the same polarity as the parent ion, butcannot easily be used, for example, to determine which phosphatidyl-cholines contain a particular fatty acid, as the latter is usually detectedmost effectively as a negatively charged ion. Neutral loss scanningworks by scanning through the m/z range in both mass analyzers, butwith a predetermined offset between them, so that ions that lose a cer-tain mass on fragmentation can be detected. For example, phosphati-dylethanolamines can fragment by loss of the phosphoethanolamineheadgroup (141.1 Da) leaving a positive charge on the diacylglycerol.Both these MS routines allow the composition of phospholipids to besurveyed and together offer a powerful approach to targeted detectionof oxidized phospholipids. Themain fragmentations of value in targetedsurveying of oxidized phospholipids are given in Table 1, although innegative-ion mode specific fragmentations for a number of individualfatty acid oxidation products can be used, as described previously[9,32,33].
These fragmentation routines can be carried out on any tandemmass spectrometer. However, it is important to note that several ana-lyzer geometries exist, and some are limited in terms of the experi-ments that can be performed. Specifically, tandem instruments cannotperform additional fragmentations, denoted MS3 or MSn fragmenta-tions (useful for enhanced structural identification of individual ions);this requires an ion trap instrument. On the other hand, ion traps cannotrun precursor ion scanning, neutral loss scanning, or multiple reactionmonitoring, as these all require linked scans in two separate analyzers,although more sophisticated instruments are capable of pseudo-rou-tines that extract the necessary information from a full product ionmass spectrum. However, these routines may have significantly lowersensitivity as a result of the untargeted data collection.
2138 C.M. Spickett et al. / Free Radical Biology & Medicine 51 (2011) 2133–2149
Materials
Materials
• Sep-Pak cartridges plus Ct18 (Product No. WAT 036810; Waters,Milford, MA, USA)
• Glass vials with screw cap (3.0 ml; Product No. 986297; Wheaton,Millville, NJ, USA)
• Crystal clear M/C Eppendorf tubes (0.6 and 1.5 ml; Product No.E1405; StarLabs, UK)
• Autosampler glass vials (0.3 ml) with screw top, fixed insert, clearwith write-on patch (Product No. 500X03-FISV, C632; Chromacol,Spec & Burke Analytical)
• HPLC C8 Luna column (150×1.0 mm, 5 μm, 100 Å particle size;Product No. 00 F-4249-A0; Phenomenex, UK).
• Hamilton gastight syringes (50, 250, 500 μl; Fisher Scientific, UK)• Glass measuring cylinders (carefully rinsed; see below)• Amber glass vials (2.0 ml; Product No. 27083-U, Supelco, Bellefonte,PA, USA)
• Solid screw capwith PTFE liner for 2.0-ml vials (Product No. 27091-U;Supelco)
• Glass Pasteur pipettes
Chemicals
• Nitrogen (oxygen free), BOC (CAS 7727-37-9; Worsley, Manchester,UK)
• Argon (high purity), BOC (CAS 07440-37-1; Worsley)• Sodium hypochlorite solution (Product No. 42,504-4; Sigma AldrichChemical Co., UK)
• Methanol (HPLC grade, Product No. M/4056/17; Fisher Scientific)• Acetonitrile (HPLC grade, Product No. A/0627/17; Fisher Chemicals)• Chloroform (HPLC grade, Product No. 650471; Sigma Aldrich Chem-ical Co.)
• Water (HPLC grade, Product No. 23595.328; VWR, UK)• Formic acid (Optima, LC-MS grade, Product No. A117-50; FisherScientific)
• PAPC (Product No. 850459; Avanti Polar Lipids, USA)• 1-Stearoyl-2-oleoyl-sn-glycero-3-phosphocholine (SOPC; ProductNo. 850467; Avanti Polar Lipids)
• 1-Stearoyl-2-arachidonoyl-sn-glycero-3-phosphocholine (SAPC;Product No. 850469; Avanti Polar Lipids)
• POVPC (Product No. 870606; Avanti Polar Lipids)• 1-Palmitoyl-2-glutaryl-sn-glycero-3-phosphocholine (PGPC; ProductNo. 870602; Avanti Polar Lipids)
• Phosphatidylethanolamines from sheep brain (Product No. P4264;Sigma Aldrich Chemical Co.)
• Dipalmitoylphosphatidylserine (DPPS; Product No. P1185; SigmaAldrich Chemical Co.)
• Ammonium acetate (HPLC grade, Product No. A/3446/50; FisherScientific)
• Butylated hydroxytoluene (2,6-di-tert-butyl-p-cresol; Product No.34750; Fluka, UK)
• tert-Butylhydroperoxide (Product No. B2633; Sigma Aldrich ChemicalCo.)
• Ferrous sulfate heptahydrate (FeSO4·7H2O; Product No. F7002;Sigma Aldrich Chemical Co.)
• Hanks’ balanced salt solution (HBSS; Product No. H6136; SigmaAldrich Chemical Co.)
• Carboxymethylimino-bis(ethylenenitrilo)tetraacetic acid (DPTA;Product No. D6518; Sigma Aldrich Chemical Co.)
• Ethylene glycol-bis(2-aminoethyl ether)-N,N,N′,N′-tetraacetic acid(EGTA; Product No. E4378; Sigma Aldrich Chemical Co,)
Solvents and solutions
• HBSS: 1 HBSS tablet dissolved in 1 L of ultrahigh purity (UHP) water• 100 mM NaOCl, pH adjusted to 6.0 by addition of small aliquots ofHCl (do not allow the pH to fall below 5.8, otherwise chlorinegas will be released)
• Methanol/1% aq formic acid (90/10, v/v)• Methanol/5 mM ammonium acetate (90/10, v/v)• HPLC Solvent A: acetonitrile/5 mM ammonium acetate (10/90, v/v)• HPLC Solvent B: acetonitrile/5 mM ammonium acetate (90/10, v/v)• LC sample solvent: acetonitrile/5 mM ammonium acetate (50/50,v/v)
• Butylated hydroxytoluene: 0.05 mg/ml in methanol or chloroform
Equipment/instrumentation
• Vortex mixer• Sonicating water bath• Water bath• Drying oven• Microcentrifuge• pH meter (Mettler Delta 320)• QTrap 5500 (ABSciex, Warrington, UK) running Analyst softwareversion 1.5.1
• Ultimate 3000 HPLC with autosampler (Dionex LC Packings, DionexUK Ltd.) running Chromeleon XPress with DCMSLink
Protocol
Caution: handling of phospholipids in organic solvents
PLs dissolve readily in chloroform, but this solvent is also very ef-ficient at extracting compounds, especially plasticizers and mold re-lease agents from plasticware (microcentrifuge tubes, tips, etc.).Plasticizers such as polyethylene glycol give a strong set of repeatingsignals in the mass spectrum, easily spotted as these are separated by44 Da (corresponding to one of the monomer units that make up thepolymer) and tend to have a Gaussian distribution. Polypropyleneglycol (repeating unit 68) is also a common contaminant, and manydetergents contain these compounds. Therefore chloroform solutionsshould be used only in glass vials and dispensed using glass syringeswith stainless steel needles. Wherever feasible, avoid the use of plas-tic tubes and pipette tips, especially cheap ones, and the use of deter-gents in washing glassware. The use of glassware for storage ofsolvents and samples comes also with a price, as often phospholipidsodium adducts ([MNa]+) are observed in the MS spectrum even ifno sodium salts were used during preparation of the HPLC buffer.The contribution of proton ([MH]+) and sodium adducts should beconsidered when interpreting phospholipid mass spectra. Chloroformis also very volatile and evaporates rapidly. Sample vials containingphospholipids dissolved in chloroform should be left uncapped as lit-tle as possible, and care needs to be exercised in assuming concentra-tions remain constant after repeated handling. We aliquot (0.1–0.5 mg) all phospholipids that are supplied as chloroform solutionsimmediately on opening and store them dried under inert gas at−80 °C.
Caution: solvent hazards
All organic solvents are hazardous, and volumes over 10 ml shouldbe handled in a fume cupboard and with appropriate safety measures.Chloroform is a suspected carcinogen and methanol is toxic.
2139C.M. Spickett et al. / Free Radical Biology & Medicine 51 (2011) 2133–2149
Preparation of oxidized phospholipids in vitro
The following method is for preparation of autoxidized PAPC orany other unsaturated phospholipid.
(1) Place 100 μl of 1 mg/ml PL solution in methanol in a clean glassvial (no cap). Dry the PL solution onto the sides of the vial as afine layer under a stream of oxygen-free nitrogen.
(2) Wrap the tube in foil (to limit photolytic reactions) and leavethe vial open at room temperature for 5 days to autoxidize.
(3) Add 100 μl of methanol and vortex.(4) Remove 1 μl and dilute with 999 μl of methanol–formic acid in
a glass vial (avoid rubber caps and polyethylene-basedplastics).
(5) Check the autoxidation status by direct infusion as describedbelow.
Preparation of phospholipid chlorohydrins in vitro
First prepare phospholipid vesicles in an aqueous environmentand oxidize them with NaOCl, as follows.
(1) Place a 40-μl aliquot of 10 mg/ml phospholipid solution inmethanol into a 1.5-ml Eppendorf tube.
(2) Dry under nitrogen.(3) Add 40 μl of HBSS.(4) Vortex for 1 min.(5) Sonicate in a water bath at 37 °C for 15 min.(6) Vortex again to give a milky, homogeneous suspension (this
can be stored at −20 °C or used immediately).(7) Add 50 μl of 50 mM NaOCl solution, pH ~6.0.(8) Add 110 μl of HBSS and vortex.(9) Incubate for 30 min at 37 °C.
The reaction is terminated and excess HOCl is removed using areverse-phase Sep-Pak cartridge.
(1) Prime the Sep-Pak cartridge by passing through 2 ml of meth-anol (apply using a syringe).
(2) Equilibrate the cartridge with at least 2 ml of UHP water.(3) Load the chlorohydrin preparation, wash the tube with 0.3 ml
of water, and load this, too, discarding the eluent from thecartridge.
(4) Wash with a further 1 ml of UHP water to remove excess salts.(5) Apply 0.5 ml of methanol, discarding the first 0.1 ml of eluent
(still aqueous), but then collecting all subsequent eluent in aclean glass vial.
(6) Apply 1 ml of methanol:chloroform (1:1, v/v) to elute all thephospholipids.
(7) Dry the 1.4 ml of eluent in organic solvent under nitrogen gas.The phospholipid chlorohydrin preparation can be stored fro-zen atb−20 °C for 1–2 weeks.
Extraction of phospholipids from cells, plasma, or LDL
Phospholipids can be extracted from awide variety of biologicalma-terials using similar protocols. Extraction of tissue samples usually in-volves freeze-clamping and grinding in liquid nitrogen beforeextraction with organic solvents [9], whereas cell samples can beextracted directly afterwashing to remove culture or preparationmedi-um [34]. Liquid samples such as plasma or serum can likewise beextracted without freezing. However, in all cases it is essential to mini-mize oxidation during sample processing: an antioxidant (e.g., butylat-ed hydroxytoluene) and ametal chelator (e.g., DPTA or EGTA) should beadded to give a final concentration of approximately 100 μM. Reducingagents such as SnCl2 or borohydride can also be included [9]; these sta-bilize hydroperoxides by converting them to hydroxides, but thismeans that the hydroperoxides themselves cannot be measured. We
have found themethod of Folch et al. [35] to be best for extracting phos-pholipids from LDL, and this method is given below.
(1) Place 40 μl of desalted LDL (corresponding to ~25 μg of pro-tein) in a 1.5-ml Eppendorf tube (MS grade).
(2) Add 160 μl of ice-cold methanol and vortex for 30 s; then add100 μl of ice-cold chloroform containing 50 μg/ml BHT and vor-tex again. Add a further 240 μl of chloroform, vortex for 1 min,and allow the mixture to equilibrate for 20 min on ice with oc-casional vortex mixing.
(3) Add 150 μl of UHP water to the mixture, vortex for 1 min, andkeep on ice for an additional 10 min with occasional vortexmixing. After addition of the water, two immiscible layersshould be clearly visible.
(4) Centrifuge the mixture for 5 min at 5000 g in a microcentrifugeto separate the aqueous and organic phases.
(5) Remove upper layer (aqueous) using a clean glass Pasteur pi-pette into a new Eppendorf tube, taking care not to leave anyaqueous phase. It does not matter if a small volume of organicphase is also removed. Retain the (lower) organic layer.
(6) Perform a second extraction step of the aqueous phase by theaddition of 250 μl of ice-cold chloroform:methanol (2:1, v/v)to increase recovery of lipids from samples, and leave on icewith occasional vortex mixing for 10 min.
(7) Centrifuge for 5 min at 5000 rpm; remove all the upper (aque-ous) phase and discard.
(8) Combine both organic phases in a single microcentrifuge tube,and wash with 200 μl of UHPwater, and vortex. Centrifuge, andcarefully remove and discard upper (aqueous) phase.
(9) Dry the chloroform phase containing the lipids under a streamof nitrogen (oxygen free) and store at −80 °C.
Note. For longer term storage (more than 1 week) it is better tostore samples under argon as an inert gas, as it is heavier and dis-perses less easily.
Preparation of samples for MS analysis
Individual commercial lipid standards should be run at 10–100 ng/ml for phosphocholine-containing lipids and 0.1–1 μg/ml forother phospholipids. Phospholipid mixtures can be used at approxi-mately 0.1–1 μg/ml. For cells or tissue, extract 10–50 mg of tissue,and after drying reconstitute in 100 μl of methanol:chloroform (4:1;v/v), and make 1/10 and 1/100 dilutions for testing (test the lowerconcentration first).
Caution: solvent preparation
Many detergents contain polyethylene or polypropylene glycols,which give strong MS signals. Glassware for preparation of the HPLCand MS solvents must not be washed in detergent. Before the firstuse, rinse as follows: under running tap water for 5 min, five timeswith UHP water, three times with small volumes of methanol. Dryin a drying oven. Keep glassware for solvents separate and cappedwith tin foil, and subsequently rinse only with methanol or UHPwater.
MS analysis—general considerations
The instrument should have been recently calibrated using thecalibrant solutions (polyethylene glycol, polypropylene glycol, peptide/-protein, or other standard solutions according to the manufacturer'sguidelines) provided by ABSciex and according to the manufac-turer's guidelines. Use a separate syringe and tubing for infusingcalibrant solutions as these compounds are persistent and givestrong signals even at low concentrations. The source tuning parame-ters should always be checked using infusion of solutions of the
2140 C.M. Spickett et al. / Free Radical Biology & Medicine 51 (2011) 2133–2149
respective phospholipids in positive or negative mode, as appropriate(0.1–1 μg/ml for phosphatidylcholines (PCs) and 10-fold higher con-centrations for other phospholipids).
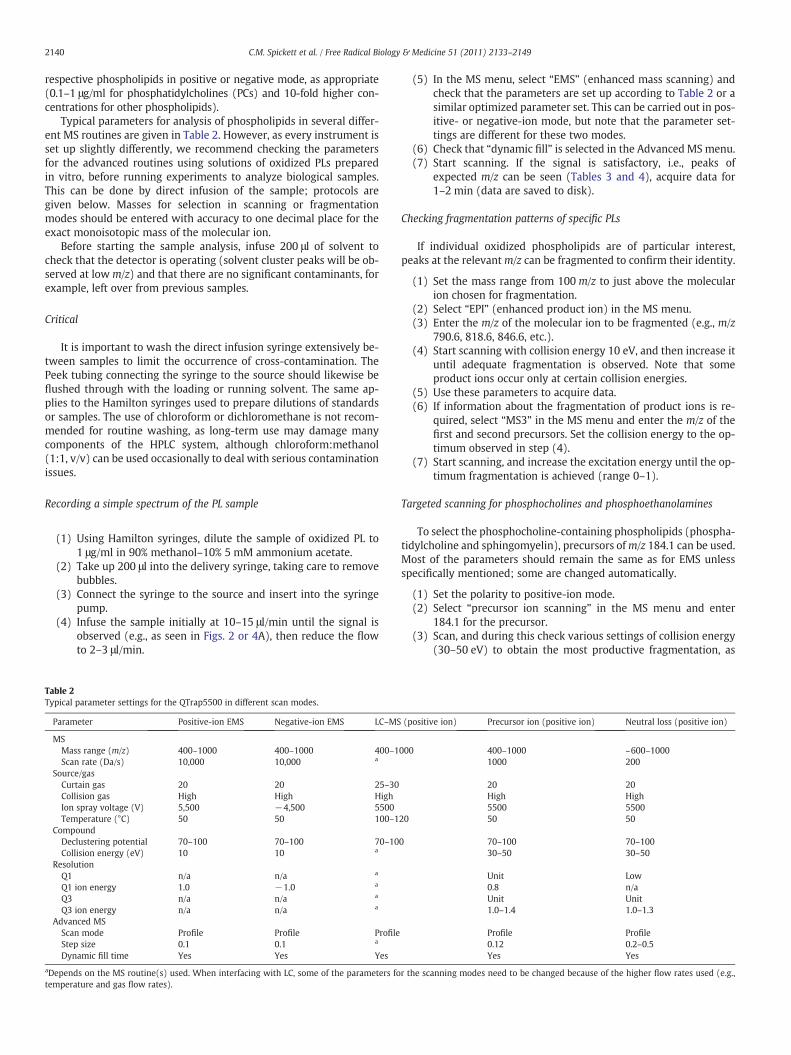
Typical parameters for analysis of phospholipids in several differ-ent MS routines are given in Table 2. However, as every instrument isset up slightly differently, we recommend checking the parametersfor the advanced routines using solutions of oxidized PLs preparedin vitro, before running experiments to analyze biological samples.This can be done by direct infusion of the sample; protocols aregiven below. Masses for selection in scanning or fragmentationmodes should be entered with accuracy to one decimal place for theexact monoisotopic mass of the molecular ion.
Before starting the sample analysis, infuse 200 μl of solvent tocheck that the detector is operating (solvent cluster peaks will be ob-served at low m/z) and that there are no significant contaminants, forexample, left over from previous samples.
Critical
It is important to wash the direct infusion syringe extensively be-tween samples to limit the occurrence of cross-contamination. ThePeek tubing connecting the syringe to the source should likewise beflushed through with the loading or running solvent. The same ap-plies to the Hamilton syringes used to prepare dilutions of standardsor samples. The use of chloroform or dichloromethane is not recom-mended for routine washing, as long-term use may damage manycomponents of the HPLC system, although chloroform:methanol(1:1, v/v) can be used occasionally to deal with serious contaminationissues.
Recording a simple spectrum of the PL sample
(1) Using Hamilton syringes, dilute the sample of oxidized PL to1 μg/ml in 90% methanol–10% 5 mM ammonium acetate.
(2) Take up 200 μl into the delivery syringe, taking care to removebubbles.
(3) Connect the syringe to the source and insert into the syringepump.
(4) Infuse the sample initially at 10–15 μl/min until the signal isobserved (e.g., as seen in Figs. 2 or 4A), then reduce the flowto 2–3 μl/min.
Table 2Typical parameter settings for the QTrap5500 in different scan modes.
Parameter Positive-ion EMS Negative-ion EMS LC–MS
MSMass range (m/z) 400–1000 400–1000 400–1Scan rate (Da/s) 10,000 10,000 a
Source/gasCurtain gas 20 20 25–30Collision gas High High HighIon spray voltage (V) 5,500 −4,500 5500Temperature (°C) 50 50 100–1
CompoundDeclustering potential 70–100 70–100 70–10Collision energy (eV) 10 10 a
ResolutionQ1 n/a n/a a
Q1 ion energy 1.0 −1.0 a
Q3 n/a n/a a
Q3 ion energy n/a n/a a
Advanced MSScan mode Profile Profile ProfileStep size 0.1 0.1 a
Dynamic fill time Yes Yes Yes
aDepends on the MS routine(s) used. When interfacing with LC, some of the parameters fotemperature and gas flow rates).
(5) In the MS menu, select “EMS” (enhanced mass scanning) andcheck that the parameters are set up according to Table 2 or asimilar optimized parameter set. This can be carried out in pos-itive- or negative-ion mode, but note that the parameter set-tings are different for these two modes.
(6) Check that “dynamic fill” is selected in the Advanced MSmenu.(7) Start scanning. If the signal is satisfactory, i.e., peaks of
expected m/z can be seen (Tables 3 and 4), acquire data for1–2 min (data are saved to disk).
Checking fragmentation patterns of specific PLs
If individual oxidized phospholipids are of particular interest,peaks at the relevantm/z can be fragmented to confirm their identity.
(1) Set the mass range from 100m/z to just above the molecularion chosen for fragmentation.
(2) Select “EPI” (enhanced product ion) in the MS menu.(3) Enter the m/z of the molecular ion to be fragmented (e.g., m/z
790.6, 818.6, 846.6, etc.).(4) Start scanning with collision energy 10 eV, and then increase it
until adequate fragmentation is observed. Note that someproduct ions occur only at certain collision energies.
(5) Use these parameters to acquire data.(6) If information about the fragmentation of product ions is re-
quired, select “MS3” in the MS menu and enter the m/z of thefirst and second precursors. Set the collision energy to the op-timum observed in step (4).
(7) Start scanning, and increase the excitation energy until the op-timum fragmentation is achieved (range 0–1).
Targeted scanning for phosphocholines and phosphoethanolamines
To select the phosphocholine-containing phospholipids (phospha-tidylcholine and sphingomyelin), precursors ofm/z 184.1 can be used.Most of the parameters should remain the same as for EMS unlessspecifically mentioned; some are changed automatically.
(1) Set the polarity to positive-ion mode.(2) Select “precursor ion scanning” in the MS menu and enter
184.1 for the precursor.(3) Scan, and during this check various settings of collision energy
(30–50 eV) to obtain the most productive fragmentation, as
(positive ion) Precursor ion (positive ion) Neutral loss (positive ion)
000 400–1000 ~600–10001000 200
20 20High High5500 5500
20 50 50
0 70–100 70–10030–50 30–50
Unit Low0.8 n/aUnit Unit1.0–1.4 1.0–1.3
Profile Profile0.12 0.2–0.5Yes Yes
r the scanning modes need to be changed because of the higher flow rates used (e.g.,
ATIC +ve ion
BPrecursor184
DTIC –ve ion
CNL 141
ENL 87
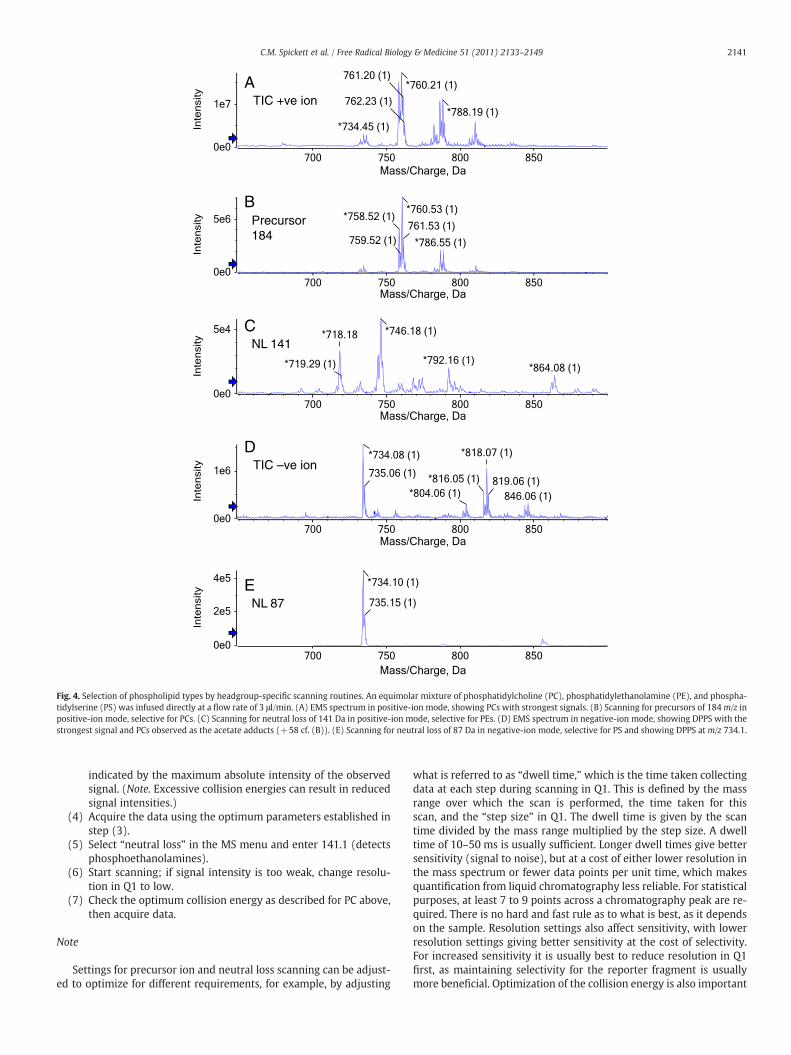
Fig. 4. Selection of phospholipid types by headgroup-specific scanning routines. An equimolar mixture of phosphatidylcholine (PC), phosphatidylethanolamine (PE), and phospha-tidylserine (PS) was infused directly at a flow rate of 3 μl/min. (A) EMS spectrum in positive-ion mode, showing PCs with strongest signals. (B) Scanning for precursors of 184m/z inpositive-ion mode, selective for PCs. (C) Scanning for neutral loss of 141 Da in positive-ion mode, selective for PEs. (D) EMS spectrum in negative-ion mode, showing DPPS with thestrongest signal and PCs observed as the acetate adducts (+58 cf. (B)). (E) Scanning for neutral loss of 87 Da in negative-ion mode, selective for PS and showing DPPS atm/z 734.1.
2141C.M. Spickett et al. / Free Radical Biology & Medicine 51 (2011) 2133–2149
indicated by the maximum absolute intensity of the observedsignal. (Note. Excessive collision energies can result in reducedsignal intensities.)
(4) Acquire the data using the optimum parameters established instep (3).
(5) Select “neutral loss” in the MS menu and enter 141.1 (detectsphosphoethanolamines).
(6) Start scanning; if signal intensity is too weak, change resolu-tion in Q1 to low.
(7) Check the optimum collision energy as described for PC above,then acquire data.
Note
Settings for precursor ion and neutral loss scanning can be adjust-ed to optimize for different requirements, for example, by adjusting
what is referred to as “dwell time,” which is the time taken collectingdata at each step during scanning in Q1. This is defined by the massrange over which the scan is performed, the time taken for thisscan, and the “step size” in Q1. The dwell time is given by the scantime divided by the mass range multiplied by the step size. A dwelltime of 10–50 ms is usually sufficient. Longer dwell times give bettersensitivity (signal to noise), but at a cost of either lower resolution inthe mass spectrum or fewer data points per unit time, which makesquantification from liquid chromatography less reliable. For statisticalpurposes, at least 7 to 9 points across a chromatography peak are re-quired. There is no hard and fast rule as to what is best, as it dependson the sample. Resolution settings also affect sensitivity, with lowerresolution settings giving better sensitivity at the cost of selectivity.For increased sensitivity it is usually best to reduce resolution in Q1first, as maintaining selectivity for the reporter fragment is usuallymore beneficial. Optimization of the collision energy is also important
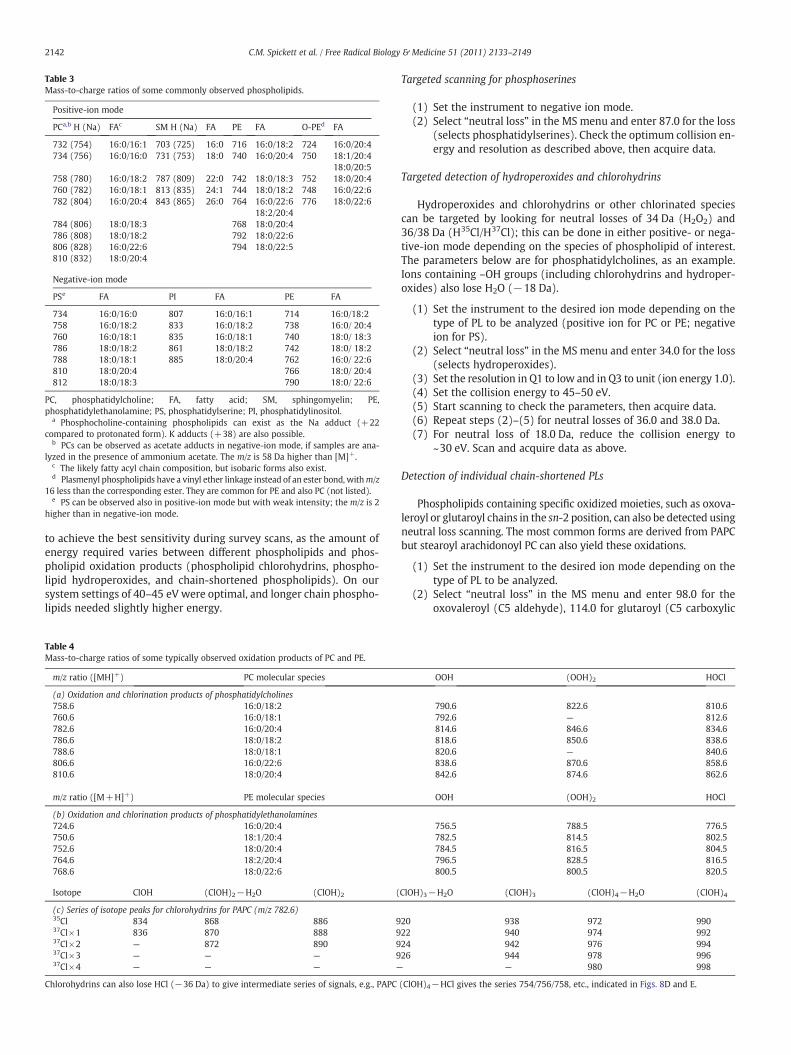
Table 3Mass-to-charge ratios of some commonly observed phospholipids.
Positive-ion mode
PCa,b H (Na) FAc SM H (Na) FA PE FA O-PEd FA
732 (754) 16:0/16:1 703 (725) 16:0 716 16:0/18:2 724 16:0/20:4734 (756) 16:0/16:0 731 (753) 18:0 740 16:0/20:4 750 18:1/20:4
18:0/20:5758 (780) 16:0/18:2 787 (809) 22:0 742 18:0/18:3 752 18:0/20:4760 (782) 16:0/18:1 813 (835) 24:1 744 18:0/18:2 748 16:0/22:6782 (804) 16:0/20:4 843 (865) 26:0 764 16:0/22:6 776 18:0/22:6
18:2/20:4784 (806) 18:0/18:3 768 18:0/20:4786 (808) 18:0/18:2 792 18:0/22:6806 (828) 16:0/22:6 794 18:0/22:5810 (832) 18:0/20:4
Negative-ion mode
PSe FA PI FA PE FA
734 16:0/16:0 807 16:0/16:1 714 16:0/18:2758 16:0/18:2 833 16:0/18:2 738 16:0/ 20:4760 16:0/18:1 835 16:0/18:1 740 18:0/ 18:3786 18:0/18:2 861 18:0/18:2 742 18:0/ 18:2788 18:0/18:1 885 18:0/20:4 762 16:0/ 22:6810 18:0/20:4 766 18:0/ 20:4812 18:0/18:3 790 18:0/ 22:6
PC, phosphatidylcholine; FA, fatty acid; SM, sphingomyelin; PE,phosphatidylethanolamine; PS, phosphatidylserine; PI, phosphatidylinositol.
a Phosphocholine-containing phospholipids can exist as the Na adduct (+22compared to protonated form). K adducts (+38) are also possible.
b PCs can be observed as acetate adducts in negative-ion mode, if samples are ana-lyzed in the presence of ammonium acetate. The m/z is 58 Da higher than [M]+.
c The likely fatty acyl chain composition, but isobaric forms also exist.d Plasmenyl phospholipids have a vinyl ether linkage instead of an ester bond, withm/z
16 less than the corresponding ester. They are common for PE and also PC (not listed).e PS can be observed also in positive-ion mode but with weak intensity; the m/z is 2
higher than in negative-ion mode.
2142 C.M. Spickett et al. / Free Radical Biology & Medicine 51 (2011) 2133–2149
to achieve the best sensitivity during survey scans, as the amount ofenergy required varies between different phospholipids and phos-pholipid oxidation products (phospholipid chlorohydrins, phospho-lipid hydroperoxides, and chain-shortened phospholipids). On oursystem settings of 40–45 eV were optimal, and longer chain phospho-lipids needed slightly higher energy.
Table 4Mass-to-charge ratios of some typically observed oxidation products of PC and PE.
m/z ratio ([MH]+) PC molecular species
(a) Oxidation and chlorination products of phosphatidylcholines758.6 16:0/18:2760.6 16:0/18:1782.6 16:0/20:4786.6 18:0/18:2788.6 18:0/18:1806.6 16:0/22:6810.6 18:0/20:4
m/z ratio ([M+H]+) PE molecular species
(b) Oxidation and chlorination products of phosphatidylethanolamines724.6 16:0/20:4750.6 18:1/20:4752.6 18:0/20:4764.6 18:2/20:4768.6 18:0/22:6
Isotope ClOH (ClOH)2−H2O (ClOH)2 (
(c) Series of isotope peaks for chlorohydrins for PAPC (m/z 782.6)35Cl 834 868 886 937Cl×1 836 870 888 937Cl×2 — 872 890 937Cl×3 — — — 937Cl×4 — — — —
Chlorohydrins can also lose HCl (−36 Da) to give intermediate series of signals, e.g., PAPC
Targeted scanning for phosphoserines
(1) Set the instrument to negative ion mode.(2) Select “neutral loss” in the MS menu and enter 87.0 for the loss
(selects phosphatidylserines). Check the optimum collision en-ergy and resolution as described above, then acquire data.
Targeted detection of hydroperoxides and chlorohydrins
Hydroperoxides and chlorohydrins or other chlorinated speciescan be targeted by looking for neutral losses of 34 Da (H2O2) and36/38 Da (H35Cl/H37Cl); this can be done in either positive- or nega-tive-ion mode depending on the species of phospholipid of interest.The parameters below are for phosphatidylcholines, as an example.Ions containing –OH groups (including chlorohydrins and hydroper-oxides) also lose H2O (−18 Da).
(1) Set the instrument to the desired ion mode depending on thetype of PL to be analyzed (positive ion for PC or PE; negativeion for PS).
(2) Select “neutral loss” in the MS menu and enter 34.0 for the loss(selects hydroperoxides).
(3) Set the resolution in Q1 to low and in Q3 to unit (ion energy 1.0).(4) Set the collision energy to 45–50 eV.(5) Start scanning to check the parameters, then acquire data.(6) Repeat steps (2)–(5) for neutral losses of 36.0 and 38.0 Da.(7) For neutral loss of 18.0 Da, reduce the collision energy to
~30 eV. Scan and acquire data as above.
Detection of individual chain-shortened PLs
Phospholipids containing specific oxidized moieties, such as oxova-leroyl or glutaroyl chains in the sn-2 position, can also be detected usingneutral loss scanning. The most common forms are derived from PAPCbut stearoyl arachidonoyl PC can also yield these oxidations.
(1) Set the instrument to the desired ion mode depending on thetype of PL to be analyzed.
(2) Select “neutral loss” in the MS menu and enter 98.0 for theoxovaleroyl (C5 aldehyde), 114.0 for glutaroyl (C5 carboxylic
OOH (OOH)2 HOCl
790.6 822.6 810.6792.6 — 812.6814.6 846.6 834.6818.6 850.6 838.6820.6 — 840.6838.6 870.6 858.6842.6 874.6 862.6
OOH (OOH)2 HOCl
756.5 788.5 776.5782.5 814.5 802.5784.5 816.5 804.5796.5 828.5 816.5800.5 800.5 820.5
ClOH)3−H2O (ClOH)3 (ClOH)4−H2O (ClOH)4
20 938 972 99022 940 974 99224 942 976 99426 944 978 996
— 980 998
(ClOH)4−HCl gives the series 754/756/758, etc., indicated in Figs. 8D and E.
2143C.M. Spickett et al. / Free Radical Biology & Medicine 51 (2011) 2133–2149
acid), 154.1 for 9-oxononanoyl (C9 carboxylic acid), or 170 forazelaoyl (C9 carboxylic acid) moiety.
(3) Set the resolution in Q1 to low and in Q3 to unit (ion energy 1.0).(4) Set the collision energy to 45–50 eV.(5) Start scanning to check the parameters; then acquire data.
Once the optimal parameters for known oxidized phospholipidshave been determined for the available mass spectrometer, the pro-cedures can be extended to liquid chromatography and analysis of bi-ological or clinical samples.
LC–MS analysis of oxPL
Liquid chromatography of phospholipids and oxidized phospho-lipids has been reported using a wide variety of columns and station-ary phases. Whereas normal-phase chromatography is often used forseparating different classes of phospholipid, reverse phase works bet-ter for separating oxidized from native phospholipids. Phospholipidswith long fatty acyl chains are quite nonpolar, so highly organic sol-vent systems are needed to remove them from C18 columns, whereaswith C4 columns the more polar oxidized and chain-shortened formselute at the solvent front unless solvents with high aqueous contentare used (in which other phospholipids may not be soluble). Hencea C8 stationary phase offers the best flexibility for overall separation.
(1) Connect the column inline between the LC system and thesource, ensuring no leaks.
(2) Set the flow rate to 100 μl/min and equilibrate with Solvent Afor at least 15 min.
(3) Scan briefly to ensure that the instrument is responding.(4) In Chromeleon (or the software for an alternative LC system),
set up the chromatography gradient program as follows:(a) 0 to 3 min, 50% Solvent B;(b) 3 to 10 min, gradient to 100% Solvent B;(c) 10 to 33 min, 100% Solvent B;(d) 33 to 35 min, gradient to 50% Solvent B;(e) 35 to 40 min, 50% Solvent B.(5) In Analyst (or the software for an alternative MS system), set up
the methods for scanning during the chromatography run. En-sure that the length of the scanning programmatches the lengthof the chromatography program. Different methods can be setup, depending on the phospholipid type and oxidation productof interest. For example, for phosphatidylcholines:
(a) EMS, precursor of 184.1, neutral loss of 34 (detection of PChydroperoxides);
(b) EMS, neutral loss of 36, neutral loss of 38 (detection of PCchlorohydrins).
Note that there is a limit to the number of MS routines that can be in-corporated into one chromatography run. The scan rates for precursorions and neutral losses are necessarily slower than for simple mass scan-ning (200–1000 as opposed to 10,000 Da/s), as including several scanningexperiments in the same routine lengthens the duty cycle of theMS. If theduty cycle is too long, the chromatographic data will appear quantized;therefore the duty cycle should not be longer than approximately 5 s(for good quality quantification using the area under the chromatograph-ic peak, as 9–15data points are needed across the chromatographic peak).To scan for a wide range of oxidized or chlorinated phospholipids, it maybe necessary to carry out more than one chromatographic run.
Sample batch preparation for LC–MS
Samples are prepared in acetonitrile:5 mM ammonium acetate(50:50, v/v). In the batch, include a sample of oxidized phospholipidsprepared in vitro and characterized. It is also essential to includeblank runs to assess background signal and carryover between runs;these involve injection of acetonitrile:5 mM ammonium acetate
(50:50, v/v) and are usually done at the beginning and end of thebatch. However, for batches of more than about 10 samples, addition-al blank runs should be incorporated between samples.
(1) Set up the queue for the samples to be run, specifying the MSand LC programs to be run for each sample. Critical: checkthat the run durations of both programs are the same.
(2) The injection volume should be 10 or 20 μl. Load the samplesinto glass autosampler vials with inserts. The amount to beloaded will depend on the nature of the autosampler needleand the settings employed, but usually a small excess overthe injected volume is required.
(3) Ensure that there is sufficient solvent in the reservoirs to lastfor the duration of the run.
(4) Start the batch; check that the LC and MS are communicatingcorrectly and data are being acquired.
Critical
To prevent carryover and cross-contamination of samples, exten-sive washing of the injection system is required between samples.The needle should be washed with methanol (rather than the run-ning solvent) for best solubilization and removal of lipids, and atotal wash program of at least 1 ml is recommended.
Sensitivity and limits of detection
On the QTrap5500, the limit of detection for a single phosphocho-line species is approximately 0.125 pmol (100 pg) using EMS andneutral loss scanning, with a further gain in sensitivity of at least10-fold using precursor ion scanning, owing to the improvement insignal-to-noise ratio. This is based on an injection volume of 10 μl.The limit of detection for other phospholipids is lower, as the ioniza-tion efficiency is not as good. However, the sensitivity of different MSinstruments varies, so the limit of detection should be checked. Usingthe targeted survey experiments, oxidized species can be identified atlevels of ~0.1% of the unmodified lipids.
Data analysis
Data files (.wiff) can be analyzed either using the Explorer functionof Analyst or in Peakview. For direct infusion data, the ion intensitycan be used as an approximate indicator of concentration when refer-enced to an internal standard. For chromatographic data, the peakscan be integrated and compared to the standard. To identify the pres-ence of hydroperoxides, precursor ion scanning for the phospholipidtype should be correlated with the neutral loss of 34 Da. When lookingfor chlorinated species, there should be neutral losses of both 36 and38 Da, as loss of 36 Da alone may also arise from loss of two water mol-ecules. Experiments using precursor ion and neutral loss scanning are inpracticality less quantitatively accurate than multiple-reaction moni-toring, and the best application of this approach is for comparative an-alyses between controlled samples, rather than absolute quantitation.
At the simplest level, the m/z value can be used to predict the totalnumber of carbons and degree of unsaturation of the fatty acid chainsand therefore narrow down the identity of phospholipids. For the com-prehensive analysis of lipids at the cellular and physiological level, amore accurate knowledge of the phospholipid structure is required.Currently, a number of Web services and software programs designedto assist scientists undertaking research in the field of lipidomics areavailable. These include public lipid databases with associated searchengines (Cyberlipids, LipidMaps, LipidNavigator, and others) containingstructures of phospholipids, including sphingolipids, and algorithm-based programs (such as LIMSA, LipidProfiler, LipidView, LipidQA, Lipi-dInspector, LipID, Lipid Data Analyzer) for the automated processing ofMS data. The database search engines usually allow the researcher to
2144 C.M. Spickett et al. / Free Radical Biology & Medicine 51 (2011) 2133–2149
input the molecular weight of the lipid and to retrieve potential molec-ular formulae and in some cases structures. The searches can be furthermodified and refined based on prior knowledge using predeterminedsettings (such as lipid class, mass error, etc.). Each database interfacehas critical issues to bear in mind; for example, with the LipidMaps da-tabase, PC identification needs them/z value for the zwitterionic form tobe entered, whereas others require the protonatedm/z. The algorithm-based software programs either have internal databases or can be inter-faced with the public databases available on theWeb. They usually takemass spectrometry data (generally in a portable format such asmzXML,although somewill take rawdata files) andmatch the data to databases,outputting a list of identified formulae and, in a few cases, identificationbased on MS2 data. Some are specific and limited to the processing ofhigh-resolution, high-mass-accuracy data obtained with FT or Orbitrapinstruments (e.g., LipID), and others do not support data-dependent ac-quisition methods (e.g., LIMSA) or do not offer correction for overlap-ping peaks due to the isotopic distribution. An advantage of some ofthe available software packages is that they allow 2D chromatographicvisualization that can be used to screen the elution profiles of samplesand identify outlier runs when analyzing a large set of samples beforeautomated processing. It is worth noting that most of these tools wereinitially developed for the field of metabolomics and have been adaptedto lipidomics with new databases. Most of the databases include nativelipids only and are not set up for the analysis of oxidativemodifications,although in theory oxidized lipids could be added to the databases. Evenso they can be useful for identifying which peaks may correspond toknown, unmodified lipids, allowingmore focused analysis of potentiallymodified ones. Choosing the best tool will depend on the instrumentand application. For a more comprehensive account of the challengesof translating raw data into meaningful lipid changes at the physiolog-ical level, some recently published reviews are recommended [36–39].
Calculations and expected results
Standard mass spectrometry allows the observation of a variety ofoxidized phospholipids within a mixture; polyunsaturated phospho-lipids such as PAPC can yield an extensive family of oxidation prod-ucts, as shown in Fig. 2. The peroxidation process involves theaddition of multiples of molecular oxygen (O2; +32 Da), but hydro-peroxides can undergo rearrangement and loss of water (−18 Da),as well as fragmentation to chain-shortened or lysolipids. The m/z ra-tios of some common phospholipids and their oxidation products aregiven in Table 3. In positive-ion mode, by far the strongest signals arefrom PCs, as these have a constitutive positive charge; PEs and PSsgive minor contributions to the spectrum, even if present in equimo-lar amounts, as illustrated in Fig. 4. Scanning for precursors of184.1m/z identifies the PCs (Fig. 4B), and neutral loss of 141.1 Daidentifies the PEs (Fig. 4C); the ion current for the latter is approxi-mately 100-fold lower than for the PCs. On the other hand, this dem-onstrates the potential of survey scanning routines to identify minorcomponents of the spectrum with high signal to noise. In negative-ion mode, PS species can be observed, together with signal from theacetate adducts of PCs (+58 compared to the m/z in positive mode)and weak contributions from PEs (Fig. 4D). PS species can be identi-fied by neutral loss of 87 Da in negative-ion mode; Fig. 4E showshow specific this method is, with the only signal coming from dipal-mitoyl PS at 734m/z. In general, these methods enhance the signal-to-noise ratio and offer great improvements in specificity for complexsamples or ones containing contaminants.
Neutral loss of 34 Da is a targeted approach for identifying hydro-peroxides of phospholipids and has been described previously [22].The levels of oxidized phospholipids are often very low in biologicalsamples and, in a normalMS spectrum,may bemasked by the presenceof native PLs, as in Fig. 5A, but the neutral loss scanning (Fig. 5B) allowstheir detection often even at low levels. Figs. 5C and D show that theneutral loss of 34 Da is quite specific; neutral loss of 36 and 38 Da
gives very little signal (the small peaks visible at different masses arefrom potassium adducts). This is important, as neutral loss of 36 and38 Da can be used for identification of chlorine-containing phospho-lipids (Figs. 5E–H). In this example, SOPC monochlorohydrin at840m/z shows loss of 36 (H35Cl) and 38 (H37Cl) Da, but no loss of34 Da. The signals at 822m/z correspond to a dehydrated form; chloro-hydrins also show loss of−18 Da. The combination of headgroup iden-tification and scans of oxidative modifications provides confidence indetecting oxidized phospholipids.
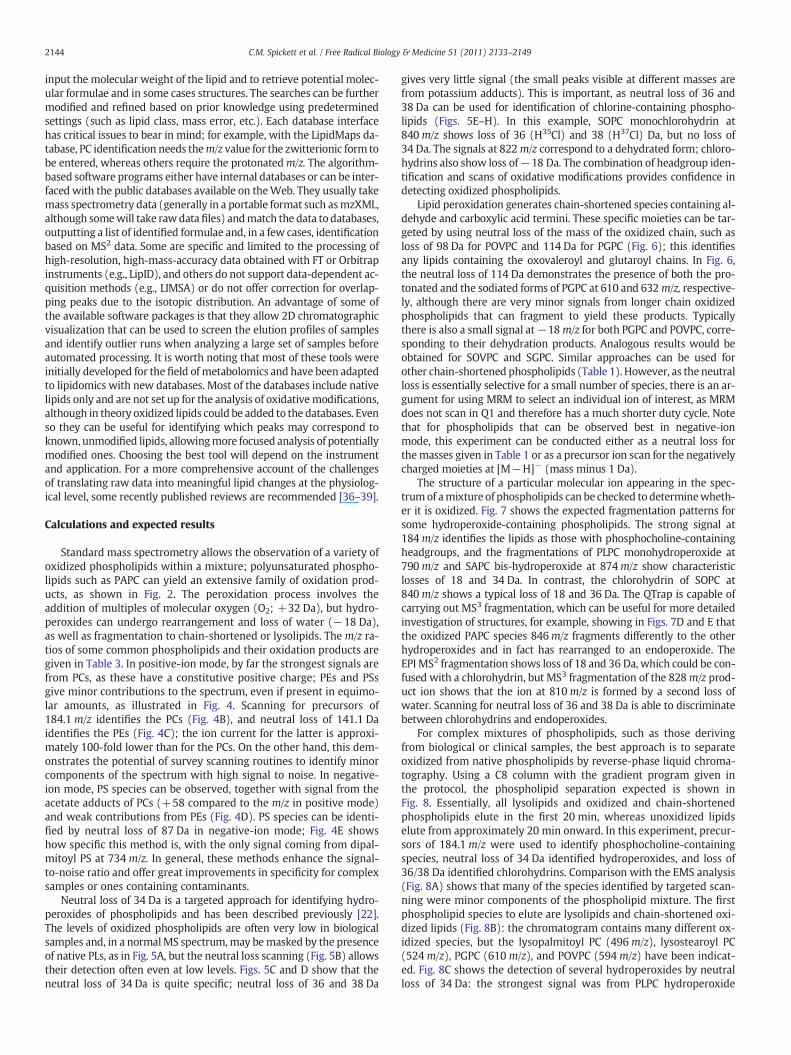
Lipid peroxidation generates chain-shortened species containing al-dehyde and carboxylic acid termini. These specific moieties can be tar-geted by using neutral loss of the mass of the oxidized chain, such asloss of 98 Da for POVPC and 114 Da for PGPC (Fig. 6); this identifiesany lipids containing the oxovaleroyl and glutaroyl chains. In Fig. 6,the neutral loss of 114 Da demonstrates the presence of both the pro-tonated and the sodiated forms of PGPC at 610 and 632m/z, respective-ly, although there are very minor signals from longer chain oxidizedphospholipids that can fragment to yield these products. Typicallythere is also a small signal at−18m/z for both PGPC and POVPC, corre-sponding to their dehydration products. Analogous results would beobtained for SOVPC and SGPC. Similar approaches can be used forother chain-shortened phospholipids (Table 1). However, as the neutralloss is essentially selective for a small number of species, there is an ar-gument for using MRM to select an individual ion of interest, as MRMdoes not scan in Q1 and therefore has a much shorter duty cycle. Notethat for phospholipids that can be observed best in negative-ionmode, this experiment can be conducted either as a neutral loss forthemasses given in Table 1 or as a precursor ion scan for the negativelycharged moieties at [M−H]− (mass minus 1 Da).
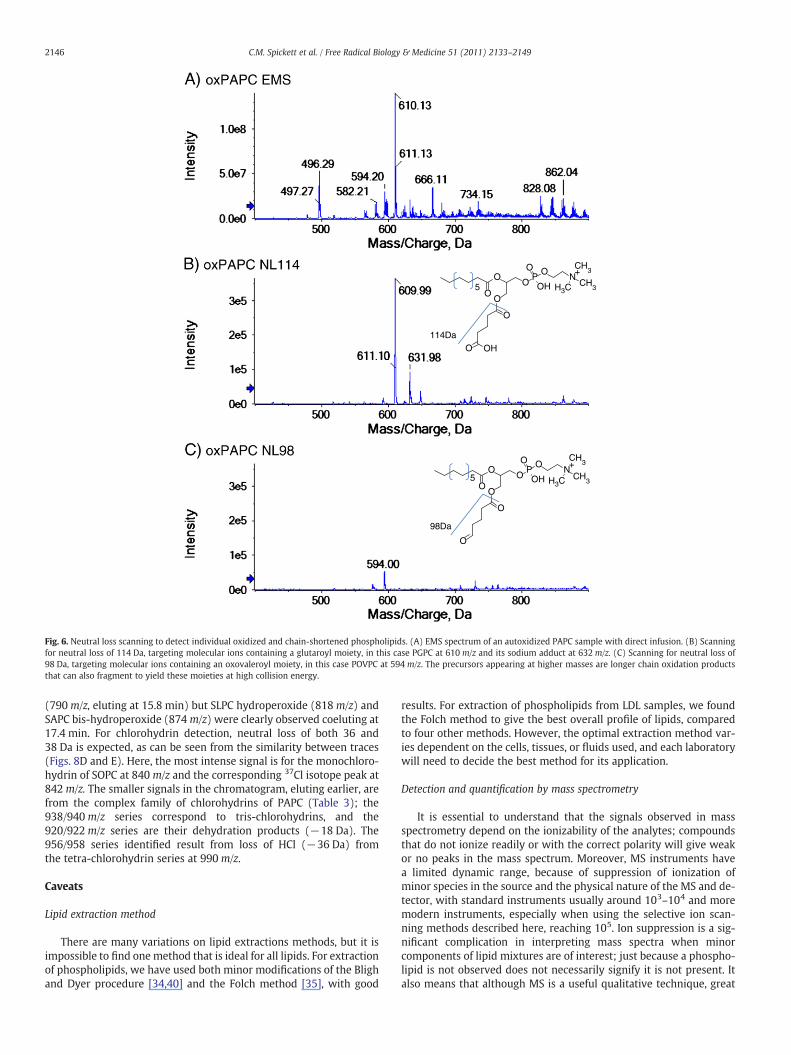
The structure of a particular molecular ion appearing in the spec-trumof amixture of phospholipids can be checked to determinewheth-er it is oxidized. Fig. 7 shows the expected fragmentation patterns forsome hydroperoxide-containing phospholipids. The strong signal at184m/z identifies the lipids as those with phosphocholine-containingheadgroups, and the fragmentations of PLPC monohydroperoxide at790m/z and SAPC bis-hydroperoxide at 874m/z show characteristiclosses of 18 and 34 Da. In contrast, the chlorohydrin of SOPC at840m/z shows a typical loss of 18 and 36 Da. The QTrap is capable ofcarrying out MS3 fragmentation, which can be useful for more detailedinvestigation of structures, for example, showing in Figs. 7D and E thatthe oxidized PAPC species 846m/z fragments differently to the otherhydroperoxides and in fact has rearranged to an endoperoxide. TheEPI MS2 fragmentation shows loss of 18 and 36 Da, which could be con-fused with a chlorohydrin, but MS3 fragmentation of the 828m/z prod-uct ion shows that the ion at 810m/z is formed by a second loss ofwater. Scanning for neutral loss of 36 and 38 Da is able to discriminatebetween chlorohydrins and endoperoxides.
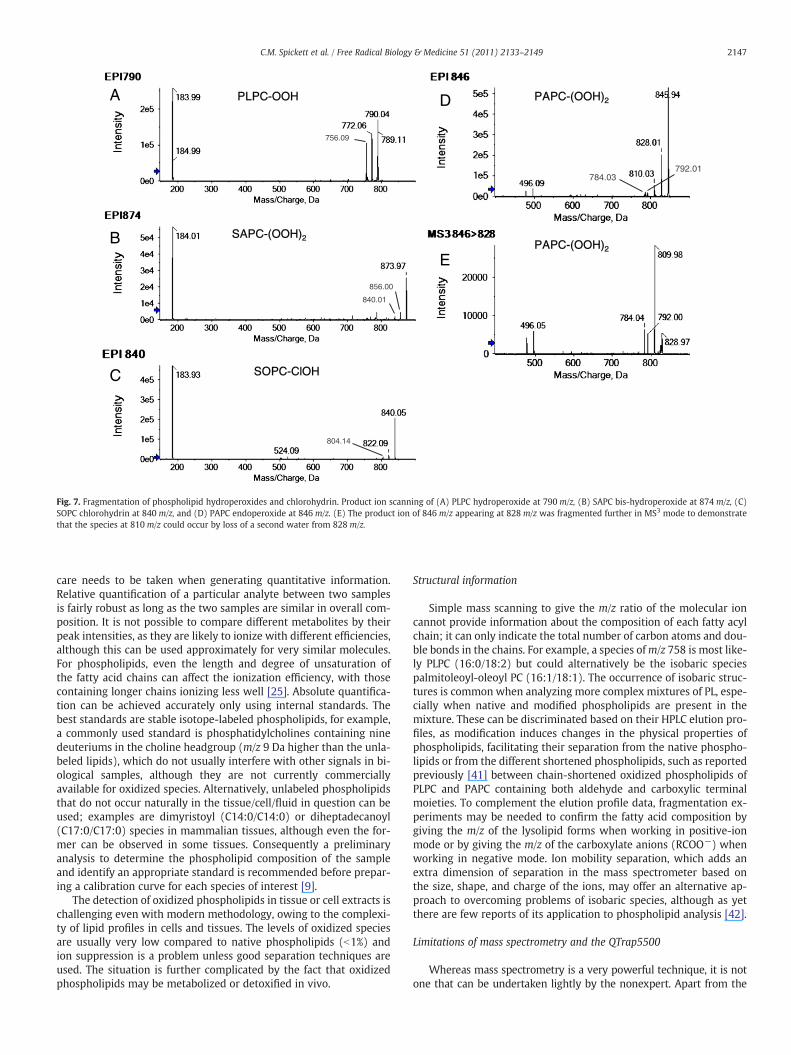
For complex mixtures of phospholipids, such as those derivingfrom biological or clinical samples, the best approach is to separateoxidized from native phospholipids by reverse-phase liquid chroma-tography. Using a C8 column with the gradient program given inthe protocol, the phospholipid separation expected is shown inFig. 8. Essentially, all lysolipids and oxidized and chain-shortenedphospholipids elute in the first 20 min, whereas unoxidized lipidselute from approximately 20 min onward. In this experiment, precur-sors of 184.1m/z were used to identify phosphocholine-containingspecies, neutral loss of 34 Da identified hydroperoxides, and loss of36/38 Da identified chlorohydrins. Comparison with the EMS analysis(Fig. 8A) shows that many of the species identified by targeted scan-ning were minor components of the phospholipid mixture. The firstphospholipid species to elute are lysolipids and chain-shortened oxi-dized lipids (Fig. 8B): the chromatogram contains many different ox-idized species, but the lysopalmitoyl PC (496m/z), lysostearoyl PC(524m/z), PGPC (610m/z), and POVPC (594m/z) have been indicat-ed. Fig. 8C shows the detection of several hydroperoxides by neutralloss of 34 Da: the strongest signal was from PLPC hydroperoxide

PC hydroperoxides PC chlorohydrins
OOH
H
HOOH (34 Da)
OH
Cl35
HOH
HCl35 (36 Da)
OH
Cl37
H OH
HCl37 (38 Da)
Fig. 5. Detection of (A–D) hydroperoxides and (E–H) chlorohydrins. A mixture of phosphatidylcholines was oxidized in vitro with HOCl or tert-butylhydroperoxide+Fe(II). All spectra were acquired in positive-ion mode at a flow rate of3 μl/min. (A and E) EMS spectra. (B and F) Scanning for neutral loss of 34 Da, corresponding to loss of H2O2 and selective for hydroperoxides. (C and G) Scanning for neutral loss of 36 Da, corresponding to loss of H35Cl and targeting chlo-rinated species, although a small percentage of signal may occur from double loss of water. (D and H) Scanning for neutral loss of 38 Da, corresponding to loss of H37Cl and selecting chlorinated species, although a small percentage of signalmay occur from loss of potassium adducts.
2145C.M
.Spickettet
al./Free
RadicalBiology&
Medicine
51(2011)
2133–2149
OP
O
OHOO
O
O
N+
O
O
98Da
5
OP
O
OHOO
O
O
N+
CH3
CH3
CH3
CH3
H3C
H3C
O
O OH
114Da
5
Fig. 6. Neutral loss scanning to detect individual oxidized and chain-shortened phospholipids. (A) EMS spectrum of an autoxidized PAPC sample with direct infusion. (B) Scanningfor neutral loss of 114 Da, targeting molecular ions containing a glutaroyl moiety, in this case PGPC at 610 m/z and its sodium adduct at 632m/z. (C) Scanning for neutral loss of98 Da, targeting molecular ions containing an oxovaleroyl moiety, in this case POVPC at 594 m/z. The precursors appearing at higher masses are longer chain oxidation productsthat can also fragment to yield these moieties at high collision energy.
2146 C.M. Spickett et al. / Free Radical Biology & Medicine 51 (2011) 2133–2149
(790m/z, eluting at 15.8 min) but SLPC hydroperoxide (818m/z) andSAPC bis-hydroperoxide (874m/z) were clearly observed coeluting at17.4 min. For chlorohydrin detection, neutral loss of both 36 and38 Da is expected, as can be seen from the similarity between traces(Figs. 8D and E). Here, the most intense signal is for the monochloro-hydrin of SOPC at 840 m/z and the corresponding 37Cl isotope peak at842m/z. The smaller signals in the chromatogram, eluting earlier, arefrom the complex family of chlorohydrins of PAPC (Table 3); the938/940m/z series correspond to tris-chlorohydrins, and the920/922m/z series are their dehydration products (−18 Da). The956/958 series identified result from loss of HCl (−36 Da) fromthe tetra-chlorohydrin series at 990m/z.
Caveats
Lipid extraction method
There are many variations on lipid extractions methods, but it isimpossible to find onemethod that is ideal for all lipids. For extractionof phospholipids, we have used both minor modifications of the Blighand Dyer procedure [34,40] and the Folch method [35], with good
results. For extraction of phospholipids from LDL samples, we foundthe Folch method to give the best overall profile of lipids, comparedto four other methods. However, the optimal extraction method var-ies dependent on the cells, tissues, or fluids used, and each laboratorywill need to decide the best method for its application.
Detection and quantification by mass spectrometry
It is essential to understand that the signals observed in massspectrometry depend on the ionizability of the analytes; compoundsthat do not ionize readily or with the correct polarity will give weakor no peaks in the mass spectrum. Moreover, MS instruments havea limited dynamic range, because of suppression of ionization ofminor species in the source and the physical nature of the MS and de-tector, with standard instruments usually around 103–104 and moremodern instruments, especially when using the selective ion scan-ning methods described here, reaching 105. Ion suppression is a sig-nificant complication in interpreting mass spectra when minorcomponents of lipid mixtures are of interest; just because a phospho-lipid is not observed does not necessarily signify it is not present. Italso means that although MS is a useful qualitative technique, great
856.00
840.01
756.09
804.14
792.01784.03
PLPC-OOH PAPC-(OOH)2
PAPC-(OOH)2
SOPC-ClOH
SAPC-(OOH)2
A
B
C
D
E
Fig. 7. Fragmentation of phospholipid hydroperoxides and chlorohydrin. Product ion scanning of (A) PLPC hydroperoxide at 790m/z, (B) SAPC bis-hydroperoxide at 874 m/z, (C)SOPC chlorohydrin at 840 m/z, and (D) PAPC endoperoxide at 846m/z. (E) The product ion of 846 m/z appearing at 828m/z was fragmented further in MS3 mode to demonstratethat the species at 810m/z could occur by loss of a second water from 828 m/z.
2147C.M. Spickett et al. / Free Radical Biology & Medicine 51 (2011) 2133–2149
care needs to be taken when generating quantitative information.Relative quantification of a particular analyte between two samplesis fairly robust as long as the two samples are similar in overall com-position. It is not possible to compare different metabolites by theirpeak intensities, as they are likely to ionize with different efficiencies,although this can be used approximately for very similar molecules.For phospholipids, even the length and degree of unsaturation ofthe fatty acid chains can affect the ionization efficiency, with thosecontaining longer chains ionizing less well [25]. Absolute quantifica-tion can be achieved accurately only using internal standards. Thebest standards are stable isotope-labeled phospholipids, for example,a commonly used standard is phosphatidylcholines containing ninedeuteriums in the choline headgroup (m/z 9 Da higher than the unla-beled lipids), which do not usually interfere with other signals in bi-ological samples, although they are not currently commerciallyavailable for oxidized species. Alternatively, unlabeled phospholipidsthat do not occur naturally in the tissue/cell/fluid in question can beused; examples are dimyristoyl (C14:0/C14:0) or diheptadecanoyl(C17:0/C17:0) species in mammalian tissues, although even the for-mer can be observed in some tissues. Consequently a preliminaryanalysis to determine the phospholipid composition of the sampleand identify an appropriate standard is recommended before prepar-ing a calibration curve for each species of interest [9].
The detection of oxidized phospholipids in tissue or cell extracts ischallenging even with modern methodology, owing to the complexi-ty of lipid profiles in cells and tissues. The levels of oxidized speciesare usually very low compared to native phospholipids (b1%) andion suppression is a problem unless good separation techniques areused. The situation is further complicated by the fact that oxidizedphospholipids may be metabolized or detoxified in vivo.
Structural information
Simple mass scanning to give the m/z ratio of the molecular ioncannot provide information about the composition of each fatty acylchain; it can only indicate the total number of carbon atoms and dou-ble bonds in the chains. For example, a species ofm/z 758 is most like-ly PLPC (16:0/18:2) but could alternatively be the isobaric speciespalmitoleoyl-oleoyl PC (16:1/18:1). The occurrence of isobaric struc-tures is common when analyzing more complex mixtures of PL, espe-cially when native and modified phospholipids are present in themixture. These can be discriminated based on their HPLC elution pro-files, as modification induces changes in the physical properties ofphospholipids, facilitating their separation from the native phospho-lipids or from the different shortened phospholipids, such as reportedpreviously [41] between chain-shortened oxidized phospholipids ofPLPC and PAPC containing both aldehyde and carboxylic terminalmoieties. To complement the elution profile data, fragmentation ex-periments may be needed to confirm the fatty acid composition bygiving the m/z of the lysolipid forms when working in positive-ionmode or by giving the m/z of the carboxylate anions (RCOO−) whenworking in negative mode. Ion mobility separation, which adds anextra dimension of separation in the mass spectrometer based onthe size, shape, and charge of the ions, may offer an alternative ap-proach to overcoming problems of isobaric species, although as yetthere are few reports of its application to phospholipid analysis [42].
Limitations of mass spectrometry and the QTrap5500
Whereas mass spectrometry is a very powerful technique, it is notone that can be undertaken lightly by the nonexpert. Apart from the
19.5
760.7
840
842
610.8
15.8
790.6 818.6874.8
21.2 24.1
758.6788.7
496.5
2.6
524.5
594.5
10.6
940series
922 & 958series
938series
920 & 956series
Fig. 8. Chromatographic separation and targeted detection of oxidized phospholipids with precursor ion and neutral loss scanning. The volume of sample loaded was 10 μl and theflow rate was 100 μl/min. (A) EMS chromatogram with the retention times of major peaks indicated. (B) Scanning of precursors of 184.1 m/z to identify the PCs. (C) Scanning forneutral loss of 34 Da to identify hydroperoxides. (D and E) Scanning for neutral loss of 36 and 38 Da, respectively; together, these identify the chlorinated species present.
2148 C.M. Spickett et al. / Free Radical Biology & Medicine 51 (2011) 2133–2149
fact that the instrumentation is very expensive to purchase and main-tain, access to technical expertise is important owing to the complex na-ture of the instruments and software. Incorrect operation, includingtuning and calibration, can lead to misinterpretation. As with all scien-tific experimentation, validation by additional methods (for example,product ion analysis or MRM protocols) is always recommended.There are a variety of geometries of mass spectrometers, which allhave advantages and disadvantage as mentioned under Principles. TheQTrap5500 is a very flexible and sensitive instrument, but its limitationis themass scan range of the trap, which has an upper limit of 1000m/z,and of the collision cell (1250m/z). This means that some larger phos-pholipids, notably cardiolipin, cannot be detected in their singlycharged forms. Cardiolipin can be doubly charged, as it contains twophosphate groups, but this adds a layer of complexity to the analysis.Some highly oxidized forms of phospholipids containing docosahexae-noic acid or eicosapentaenoic acid also have m/z ratios greater than1000 and cannot be observed. Thus the QTrap5500would not be the in-strument of choice for these particular lipids.
Acknowledgments
We gratefully acknowledge funding from a Marie-Curie Intra-European Fellowship (FP7-PEOPLE-2009-IEF Project ID 255076“Athero_Mass”). C.M.S. acknowledges the COST Action B35 and 08-EuroMEMBRANES-FP-021 for intellectual support.
References
[1] Bochkov, V. N.; Oskolkova, O. V.; Birukov, K. G.; Levonen, A. L.; Binder, C. J.; Stockl,J. Generation and biological activities of oxidized phospholipids. Antioxid. RedoxSignaling 12:1009–1059; 2010.
[2] Moore, K.; Roberts II, L. J. Measurement of lipid peroxidation. Free Radic. Res. 28:659–671; 1998.
[3] Spickett, C. M.; Wiswedel, I.; Siems, W.; Zarkovic, K.; Zarkovic, N. Advances inmethods for the determination of biologically relevant lipid peroxidation prod-ucts. Free Radic. Res. 44:1172–1202; 2010.
[4] Halliwell, B. Free radicals and antioxidants—quo vadis? Trends Pharmacol. Sci. 32:125–130; 2011.
[5] Chang, M. K.; Bergmark, C.; Laurila, A.; Horkko, S.; Han, K. H.; Friedman, P.;Dennis, E. A.; Witztum, J. L. Monoclonal antibodies against oxidized low-density
2149C.M. Spickett et al. / Free Radical Biology & Medicine 51 (2011) 2133–2149
lipoprotein bind to apoptotic cells and inhibit their phagocytosis by elicitedmacrophages: evidence that oxidation-specific epitopes mediate macrophagerecognition. Proc. Natl. Acad. Sci. U. S. A. 96:6353–6358; 1999.
[6] Morrow, J.; Roberts, L. Mass spectrometric quantification of F2-isoprostanes in bi-ological fluids and tissues as a measure of oxidant stress. Methods Enzymol. 300:3–12; 1999.
[7] Yin, H. Y.; Cox, B. E.; Liu, W.; Porter, N. A.; Morrow, J. D.; Milne, G. L. Identificationof intact oxidation products of glycerophospholipids in vitro and in vivo usingnegative ion electrospray iontrap mass spectrometry. J. Mass Spectrom. 44:672–680; 2009.
[8] Tyurin, V. A.; Tyurina, Y. Y.; Ritov, V. B.; Lysytsya, A.; Amoscato, A. A.; Kochanek, P.M.;Hamilton, R.; Dekosky, S. T.; Greenberger, J. S.; Bayir, H.; Kagan, V. E. Oxidative lipi-domics of apoptosis: quantitative assessment of phospholipid hydroperoxides incells and tissues. Methods Mol. Biol. 610:353–374; 2010.
[9] Morgan, A. H.; Hammond, V. J.; Morgan, L.; Thomas, C. P.; Tallman, K. A.; Garcia-Diaz, Y. R.; McGuigan, C.; Serpi, M.; Porter, N. A.; Murphy, R. C.; O'Donnell, V. B.Quantitative assays for esterified oxylipins generated by immune cells.Nat. Protoc.5:1919–1931; 2010.
[10] Hall, L. M.;Murphy, R. C. Analysis of stable oxidizedmolecular species of glyceropho-spholipids following treatment of red blood cell ghosts with t-butylhydroperoxide.Anal. Biochem. 258:184–194; 1998.
[11] Jerlich, A.; Pitt, A. R.; Schaur, R. J.; Spickett, C. M. Pathways of phospholipid oxida-tion by HOCl in human LDL detected by LC–MS. Free Radic. Biol. Med. 28:673–682;2000.
[12] Watson, A. D.; Leitinger, N.; Navab, M.; Faull, K. F.; Horkko, S.; Witztum, J. L.;Palinski, W.; Schwenke, D.; Salomon, R. G.; Sha, W.; Subbanagounder, G.;Fogelman, A. M.; Berliner, J. A. Structural identification by mass spectrometry ofoxidized phospholipids in minimally oxidized low density lipoprotein that inducemonocyte/endothelial interactions and evidence for their presence in vivo. J. Biol.Chem. 272:13597–13607; 1997.
[13] Watson, A. D.; Subbanagounder, G.; Welsbie, D. S.; Faull, K. F.; Navab, M.; Jung, M. E.;Fogelman, A. M.; Berliner, J. A. Structural identification of a novel pro-inflammatoryepoxyisoprostane phospholipid in mildly oxidized low density lipoprotein. J. Biol.Chem. 274:24787–24798; 1999.
[14] Ravandi, A.; Babaei, S.; Leung, R.; Monge, J. C.; Hoppe, G.; Hoff, H.; Kamido, H.;Kuksis, A. Phospholipids and oxophospholipids in atherosclerotic plaques at dif-ferent stages of plaque development. Lipids 39:97–109; 2004.
[15] Hoff, H. F.; O'Neil, J.; Wu, Z. P.; Hoppe, G.; Salomon, R. L. Phospholipid hydroxyalk-enals—biological and chemical properties of specific oxidized lipids present inatherosclerotic lesions. Arterioscler. Thromb. Vasc. Biol. 23:275–282; 2003.
[16] Messner, M. C.; Albert, C. J.; McHowat, J.; Ford, D. A. Identification of lysophospha-tidylcholine–chlorohydrin in human atherosclerotic lesions. Lipids 43:243–249;2008.
[17] Albert, C. J.; Anbukumar, D. S.; Messner, M. C.; Ford, D. A. Chromatographicmethods for the analyses of 2-halofatty aldehydes and chlorohydrin molecularspecies of lysophosphatidylcholine. J. Chromatogr. B Anal. Technol. Biomed. LifeSci. 877:2768–2777; 2009.
[18] Nakamura, T.; Bratton, D. L.; Murphy, R. C. Analysis of epoxyeicosatrienoic andmonohydroxyeicosatetraenoic acids esterified to phospholipids in human redblood cells by electrospray tandem mass spectrometry. J. Mass Spectrom. 32:888–896; 1997.
[19] Nakanishi, H.; Iida, Y.; Shimizu, T.; Taguchi, R. Analysis of oxidized phosphatidyl-cholines as markers for oxidative stress, using multiple reaction monitoring withtheoretically expanded data sets with reversed-phase liquid chromatography/tandem mass spectrometry. J. Chromatogr. B Anal. Technol. Biomed. Life Sci. 877:1366–1374; 2009.
[20] Cruz, D.; Watson, A. D.; Miller, C. S.; Montoya, D.; Ochoa, M. T.; Sieling, P. A.; Gu-tierrez, M. A.; Navab, M.; Reddy, S. T.; Witztum, J. L.; Fogelman, A. M.; Rea, T. H.;Eisenberg, D.; Berliner, J.; Modlin, R. L. Host-derived oxidized phospholipids andHDL regulate innate immunity in human leprosy. J. Clin. Invest. 118:2917–2928;2008.
[21] Pitt, A. R.; Spickett, C. M. Mass spectrometric analysis of HOCl- and free-radical-induced damage to lipids and proteins. Biochem. Soc. Trans. 36:1077–1082; 2008.
[22] Schneider, C.; Schreier, P.; Herderich, M. Analysis of lipoxygenase-derived fattyacid hydroperoxides by electrospray ionization tandemmass spectrometry. Lipids32:331–336; 1997.
[23] Yamashita, M.; Fenn, J. B. Electrospray ion-source—another variation on the free-jet theme. J. Phys. Chem. 88:4451–4459; 1984.
[24] Fenn, J. B.; Mann, M.; Meng, C. K.; Wong, S. F.; Whitehouse, C. M. Electrospray ion-ization—principles and practice. Mass Spectrom. Rev. 9:37–70; 1990.
[25] Brugger, B.; Erben, G.; Sandhoff, R.;Wieland, F. T.; Lehmann,W. D. Quantitative anal-ysis of biological membrane lipids at the low picomole level by nano-electrosprayionization tandem mass spectrometry. Proc. Natl. Acad. Sci. U. S. A. 94:2339–2344;1997.
[26] Domingues, M. R. M.; Reis, A.; Domingues, P. Mass spectrometry analysis of oxi-dized phospholipids. Chem. Phys. Lipids 156:1–12; 2008.
[27] Spickett, C. M.; Pitt, A. R.; Brown, A. J. Direct observation of lipid hydroperoxidesin phospholipid vesicles by electrospray mass spectrometry. Free Radic. Biol. Med.25:613–620; 1998.
[28] Baker, P. R.; Schopfer, F. J.; Sweeney, S.; Freeman, B. A. Red cell membrane andplasma linoleic acid nitration products: synthesis, clinical identification, andquantitation. Proc. Natl. Acad. Sci. U. S. A. 101:11577–11582; 2004.
[29] Arnhold, J.; Osipov, A. N.; Spalteholz, H.; Panasenko, O. M.; Schiller, J. Effects ofhypochlorous acid on unsaturated phosphatidylcholines. Free Radic. Biol. Med.31:1111–1119; 2001.
[30] Schwalbe-Herrmann, M.; Willmann, J.; Leibfritz, D. Separation of phospholipidclasses by hydrophilic interaction chromatography detected by electrospray ion-ization mass spectrometry. J. Chromatogr. A 1217:5179–5183; 2010.
[31] Reis, A.; Domingues, M. R. M.; Amado, F. M. L.; Ferrer-Correia, A. J.; Domingues, P.Radical peroxidation of palmitoyl-lineloyl-glycerophosphocholine liposomes: iden-tification of long-chain oxidised products by liquid chromatography–tandem massspectrometry. J. Chromatogr. B Anal. Technol. Biomed. Life Sci. 855:186–199; 2007.
[32] Yang, J.; Schmelzer, K.; Georgi, K.; Hammock, B. D. Quantitative profiling methodfor oxylipin metabolome by liquid chromatography electrospray ionization tan-dem mass spectrometry. Anal. Chem. 81:8085–8093; 2009.
[33] Yoshida, Y.; Kodai, S.; Takemura, S.; Minaiyama, Y.; Niki, E. Simultaneous mea-surement of F2-isoprostane, hydroxyoctadecadienoic acid, hydroxyeicosatetrae-noic acid, and hydroxycholesterols from physiological samples. Anal. Biochem.379:105–115; 2008.
[34] Spickett, C. M.; Rennie, N.; Winter, H.; Zambonin, L.; Landi, L.; Jerlich, A.; Schaur,R. J.; Pitt, A. R. Detection of phospholipid oxidation in oxidatively stressed cells byreversed-phase HPLC coupled with positive-ionization electrospray [correction ofelectroscopy] MS. Biochem. J. 355:449–457; 2001.
[35] Folch, J.; Lees, M.; Sloane Stanley, G. H. A simple method for the isolation and pu-rification of total lipids from animal tissues. J. Biol. Chem. 226:497–509; 1957.
[36] Haimi, P.; Chaithanya, K.; Kainu, V.; Hermansson, M.; Somerharju, P. Instrument-independent software tools for the analysis of MS–MS and LC–MS lipidomicsdata. Methods Mol. Biol. 580:285–294; 2009.
[37] Hein, E. M.; Bodeker, B.; Nolte, J.; Hayen, H. Software tool for mining liquid chro-matography/multi-stage mass spectrometry data for comprehensive glyceropho-spholipid profiling. Rapid Commun. Mass Spectrom. 24:2083–2092; 2010.
[38] Hartler, J.; Trotzmuller, M.; Chitraju, C.; Spener, F.; Kofeler, H. C.; Thallinger, G. G.Lipid Data Analyzer: unattended identification and quantitation of lipids in LC–MS data. Bioinformatics 27:572–577; 2011.
[39] Oresic, M. Informatics and computational strategies for the study of lipids. Bio-chim. Biophys. Acta 1811:991–999; 2011.
[40] Retra, K.; Bleijerveld, O. B.; van Gestel, R. A.; Tielens, A. G.; van Hellemond, J. J.;Brouwers, J. F. A simple and universal method for the separation and identifica-tion of phospholipid molecular species. Rapid Commun. Mass Spectrom. 22:1853–1862; 2008.
[41] Reis, A.; Domingues, M. R.; Amado, F. M.; Ferrer-Correia, A. J.; Domingues, P. Separa-tion of peroxidation products of diacyl-phosphatidylcholines by reversed-phase liq-uid chromatography–mass spectrometry. Biomed. Chromatogr. 19:129–137; 2005.
[42] Kliman, M.; May, J. C.; McLean, J. A. Lipid analysis and lipidomics by structurallyselective ion mobility–mass spectrometry. Biochim. Biophys. Acta; 1811:935–945; 2011.