Optimum phospholipids and antioxidant levels to develop ...
277
Optimum phospholipids and antioxidant levels to develop novel microdiets for gilthead seabream larvae Reda Saleh Mohamed Ibrahim Las Palmas of Gran Canaria, Spain 2013 PhD Thesis University of Las Palmas of Gran Canaria
-
Upload
khangminh22 -
Category
Documents
-
view
1 -
download
0
Transcript of Optimum phospholipids and antioxidant levels to develop ...

!
!
Optimum phospholipids and
antioxidant levels to develop !
novel microdiets for gilthead !
seabream larvae "
Reda Saleh Mohamed Ibrahim"
Las Palmas of Gran Canaria, "
Spain 2013"
PhD Thesis"
University of Las Palmas of Gran Canaria

!
! !

ªAD DE LAS PALMAS DE GRAN CANARIA
Anexo 1
Dª. MARÍA SORAYA DÉNIZ SUÁREZ, SECRETARIA DEL INSTITUTO UNIVERSITARIO DE SANIDAD ANIMAL Y SEGURIDAD ALIMENTARIA DE LA UNIVERSIDAD DE LAS PALMAS DE GRAN CANARIA.
CERTIFICA
Que el Consejo de Doctores del Departamento en su sesión de fecha 12 de diciembre de 2012 tomó el acuerdo de dar el consentimiento para su tramitación, a la tesis doctoral titulada: "NIVELES ÓPTIMOS DE FOSFOLÍPIDOS Y ANTIOXIDANTES EN EL DESARROLLO DE MICRODIETAS PARA LARVAS DE DORADA" presentada por el doctorando D. Reda Saleh y dirigida por los Ores. María Soledad Izquierdo López y Francisco Javier Moyana López.
Y para que así conste, y a efectos de lo previsto en el Artº 73.2 del reglamento de Estudios de Doctorado de esta Universidad, firmo la presente en Las Palmas de Gran Canaria, a trece de diciembre de dos mil doce.

!!!!!!!!!!!!!!!!!!!!!!!!!!!!!!!!!!!!!!!!!!!!!!!!!!!!!!!!!!!!!!!!!!!!!!!!!!!!!!!!
Anexo II
UNIVERSIDAD DE LAS PALMAS DE GRAN CANARIA
Departamento: Instituto Universitario de Sanidad Animal y Seguridad Alimentaria !
Programa de Doctorado: Acuicultura: Producción Controlada de Animales
Acuáticos
Título de la Tesis !
Optimum phospholipids and antioxidant
levels to develop novel microdiets for
gilthead seabream larvae!
!
Tesis Doctoral presentada por D. Reda Saleh Mohamed Ibrahim !
Dirigida por La Doctora María Soledad Izquierdo López y El Doctor Francisco Javier Moyano López
La Directora El Director El Doctorando
!"#$%#!&'()*#*!!!!!!!!!!!!!!!!!!! Francisco Javier Reda Saleh
+,-./)$*'!012),!!!!!!!!!!!!!!!!!!!!!!!!!!!!!!!!!!!!!!!Moyano López Mohamed Ibrahim
Las Palmas de Gran Canaria, a 01 de Febrero de 2013
!

!
!
!
Optimum phospholipids and antioxidant
levels to develop novel microdiets for
gilthead seabream larvae
Reda Saleh Mohamed Ibrahim
Doctorado en Acuicultura: Producción Controlada de Animales Acuáticos
Grupo de Investigación en Acuicultura (GIA)
Instituto Universitario de Sanidad Animal y Seguridad Alimentaria (IUSA)
Thesis for the degree of Doctor of Phylosophy
University of Las Palmas de Gran Canaria
2013
Directors:
Prof. María Soledad Izquierdo and Prof. Francisco Javier Moyano

!
!
!
!
!
!
!
!
!

List of Contents
-------------------------------------------------------------------------------!Page Nº
Summary ………………………………….……………………………………... I
List of Abbreviations. …………………………………………………………... III
List of Tables ……………………………………………………………………. V
List of Figures ………………………………….……………………………….. VIII
Acknowledgements …………………………..…………………………………. XVIII
Chapter 1: Introduction ………………………………………….…………….. 1
1.1 Aquaculture ………………………………….…………………………... 1
1.2 Marine fish larvae and microdiets utilization .………………………… 3
1.3 Importance of phospholipids in marine fish larvae nutrition ………… 6
1.3.1 Phospholipids as source of essential fatty acids………………… 7
1.3.2 Phospholipid requirements ……………………………………… 8
1.3.3 Phospholipid digestion, absorption and transport …………….. 10
1.3.3.1 Phospholipid digestion…………………………………. 10
1.3.3.2 Phospholipid absorption and transport ………………. 13
1.3.4 Phospholipid classes………………………………….…………… 18
1.3.5 Effect of phospholipids on skeletal development ………………. 20
1.4 Oxidative stress: Antioxidant defense mechanism ………………………. 24
1.4.1 Enzymatic defenses ………………………………….…………… 24
1.4.2 Non enzymatic defenses ……………………………….…………. 26
1.4.2.1 Vitamin E (!-tocopherol) ……………………………… 27
1.4.2.2 Selenium ………………………………….…………….. 29
1.5 Objectives ……………….……………..……………….…………………… 30
Chapter 2: Materials and Methods ……………………………………………. 32
2.1 Larvae ……………………………………………………………………... 32
2.1.1 Gilthead sea bream larvae .…………………………………. …….. 32
2.2 Experimental conditions ………………………………………….………. 32
2.3 Diets and feeding ……………………………………………….………... 32
2.3.1 Rotifers ……………………………………………………….…….. 32
2.3.2 Microdiets ………………………………………….………………. 33
2.3.2.1 Microdiets formulation.………………………………….. 33
2.3.2.2 Microdiets preparation…………………………………... 33
2.3.3 Feeding………………………………….…………………………... 35
2.4 Sampling.…………………………………. ……………………………... 35
2.4.1 Biological parameters………………………………….…………... 35
2.4.2 Proximate analysis………………………………….……………… 35
2.4.3 Digestive enzymes………………………………….……………… 35

2.4.4 Histological studies………………………………….……………… 35
2.4.5 Molecular biology………………………………….………………. 36
2.4.6 Activity test and survival………………………………….……….. 36
2.4.7 Growth ……………………………………………………………... 36
2.5 Biochemical analysis…………………………………………………….. 36
2.5.1 Proximate analysis ………………………………………………… 36
2.5.1.1 Moisture ………………………………….………………. 36
2.5.1.2 Ash ………………………………….…………………….. 37
2.5.1.3 Proteins ………………………………….……………….. 37
2.5.1.4 Total lipids ………………………………….……………. 37
2.5.1.4.1 Lipid Classes …………………………………… 38
2.5.1.4.2 Fatty acid methyl esters preparation and
quantification ……………………………………………….. 38
2.5.2 Digestive enzymes activity…………………………………………. 39
2.6 Measurement of thiobarbituric reactive substances (TBARS) ………. 40
2.7 Selenium determination ………………………………….……………... 40
2.8 Whole mount staining for skeleton studies…………………………….. 41
2.9 Molecular biology ………………………………….…………………….. 42
2.10 Statistical analysis ………………………………….…………………... 44
Chapter 3: Optimum krill phospholipids content in microdiets for gilthead
seabream (Sparus aurata) larvae………………………………….……………. 45
Chapter 4: Optimum soybean lecithin content in microdiets for gilthead
seabream (Sparus aurata) larvae………………………………….……………. 68
Chapter 5: Effect of krill phospholipids vs soybean lecithin in microdiets for
gilthead seabream (Sparus aurata) larvae on molecular markers of
antioxidative metabolism and bone development……………………………... 91
Chapter 6: Biomarkers of bone development and oxidative stress in gilthead
seabream larvae fed microdiets with several levels of polar lipids and !–
tocopherol ………………………………….…………………………………..... 123
Chapter 7: Selenium levels in early weaning diets for gilthead sea bream
larvae. ………………………………………………….………………………… 150
Chapter 8: Conclusions ………………………………………………………… 174
Chapter 9: Resumen en español………………………………….…………….. 175
References …………………………………………….…………………………. 228
!

! "!
Summary
-----------------------------------------------------------------------------
Phospholipids (PL) are particularly important in fish larvae production for their
essential function as necessary components for cellular bio-membranes and organelles
formation, as well as for being an endogenous energy source during early
development. Besides, during early development, PL seems to induce digestive
system maturation, may promote digestive enzymes activities, and consequently play
an important role on larval digestive physiology and the metabolic pathways of the
assimilated nutrients. However, despite the many studies available denoting the
importance of dietary PL, few of them have intended to determine quantitative PL
requirements testing diets with at least five different levels of this nutrient. Thus, the
aim of the present thesis was to determine the optimum requirements of krill PL
(KPL) and soybean lecithin (SBL) for gilthead seabream (Sparus aurata) larvae, and
its influence on larval production performance and digestive enzymes activity
(Chapter 3 & 4). Another aim was to compare the effectiveness of dietary KPL and
soybean lecithin on the seabream larval rearing performance, oxidative status,
vertebral mineralization, skeletal anomalies and bone formation related genes
expression (Chapter 5). However, dietary PL have high levels of polyunsaturated
fatty acids which are molecules with a great susceptibility to peroxidation resulting in
production of harmful peroxides that affect their biological and physiological
functions, so it was important that investigate the combined effect of graded levels of
antioxidant nutrients such as !-tocopherol with dietary KPL and SBL, and the effect
of graded levels of Se derived yeast, on the seabream larval rearing performance,
oxidative status, vertebral mineralization, skeletal anomalies and bone formation
related genes expression (Chapter 6 & 7). In the light of these experiments, the results
have shown that dietary KPL are an excellent source of lipids and the optimum
inclusion levels of this ingredient in microdiets to completely substitute live preys at
larval age of 16 dph were found to be 12% KPL, providing about 10% total PL, and
8% SBL, providing about 8.8% total PL. These levels significantly improved
digestive enzymes activities, utilization and deposition of dietary essential fatty acids
and larval growth, as a consequence of a better digestion, absorption, transport and
deposition of dietary nutrients. However, despite increased on dietary SBL up to 9%
total PL improved larval survival, stress resistance, growth and skeletal development,

! ""!
dietary KPL was more effective in promoting all these parameters where their higher
content in phosphatidylcholine and n-3 HUFA, particularly, DHA, not only promotes
digestion, transport and deposition of dietary lipids, but also contributes to reduce
skeleton anomalies by up-regulating of bone formation related genes, inducing early
mineralization and resistance of vertebral bodies to reduce anomalies such as lordosis
and kyphosis. Also, inclusion of SBL markedly increased the proxidation risk as
denoted by the high larval malondialdehyde (MDA) content, as well as a high
expression of catalase (CAT), superoxide dismutase, (SOD) and glutathione
peroxidase (GPX) genes.
The inclusion of 3000 mg !-tocopherol kg-1
diet promoted the expression of genes
related to bone formation and mineralization and improved larval survival and
growth, what could be related to the better utilization of dietary lipids and to the
reduction of toxic free radicals as indicated by the low larval MDA content and the
low antioxidant enzyme genes expression (AOE). These results denoted the high
efficiency of -tocopherol as an antioxidant factor, and its positive effect on genes
expression of bone formation and mineralization.
Finally, the inclusion of Se derived yeast at 11.65 µg Se/mg diet improved larval
survival and stress resistance what could be related in one hand to the reduction of
toxic free radicals as indicated by the low levels of MDA and AOE content, which
demonstrate an adaptive response in attempting to neutralize the generated reactive
oxygen species (ROS) suggesting better oxidative status, and in another hand to the
improved utilization of dietary lipids. Moreover, the Bone Morphogenetic Protein-4,
alkaline phosphatase, osteocalcin, osteonectin, osteopontin, and matrix gla protein
genes expression in larval tissues were positively correlated to the dietary selenium
increased or larval Se tissue content increased, in relation to an adequate skeletal
development.

! """!
List of Abbreviations
-----------------------------------------------------------------------------
AA Arachidonic acid
ANOVA Analysis of variance
AOE Antioxidant enzymes
APROMAR Asociación Empresarial de Productores de Cultivos Marinos
BHT Butylated hydroxytoluene
CAT Catalase
cDNA Complementary desoxiribonucleic acid
DEPC Diethyl pyrocarbonate
DHA Docosahexaenoic acid (22:6n-3)
dph Days post hatching
DW Dry weight
EFA Essential fatty acid
EPA Eicosapentaenoic acid (20:5n-3)
FAME Fatty acid methyl esters
FAO Food and Agriculture Organization
HPLC High performance liquid chromatography
ICCM Instituto Canario de Ciencias Marinas
IGF-I Insulin-like growth factor I
IGF-II Insulin-like growth factor II
IGFBP Insulin-like growth factor binding protein
GPX Glutathione peroxidase
GR Glutathione reductase
GSSG Oxidized glutathione

! "#!
GSH Reduced glutathione
HUFA Highly unsaturated fatty acid
KPL Krill phospholipids
LC-PUFA Long chain polyunsaturated fatty acid
LA Linoleic acid
MDA Malonaldehyde
mRNA Messenger ribonucleic acid
n-3 LC-PUFA Long chain polyunsaturated fatty acids of n-3 series (20 or more
carbon atoms)
NL Neutral lipids
PC Phosphatidylcholine
PCR Polymerase chain reaction
PE Phosphatidylethanolamine
PI Phosphatidylinositol
PL Phospholipids
PLA2 Phospholipase A2
PS Phosphatidylserine
RNA Ribonucleic acid
ROO- Peroxyl radical
ROS Reactive oxygen species
SBL Soybean lecithin
SD Standard deviation
SE Selenium
SOD Superoxide dismutase
TBARS Thiobarbituric reactive substances

! "!
List of Tables
-----------------------------------------------------------------------------
Page Nº
Table 1.1 Quantitative and qualitative phospholipid requirements of
teleost fish (Adapted from Tocher et al., 2008)………………..
8
Table 2.1 Mix of attractants, minerals and vitamins of the experimental
microdiets………………………………………………………
34
Table 2.2 Staining protocol according to Vandewalle et al.
(1998)…………………………………………………………..
41
Table 2.3 Sequences of forward and reverse primers (5´-3´) for real-time
quantitative-PCR of seabream genes…………………………..
43
Table 3.1 Formulation and proximate composition of the experimental
microdiets containing several levels of KPL..............................
49
Table 3.2 Fatty acids (% dry weight) composition in total lipids of diets
containing five KPL levels……………………………………..
56
Table 3.3 Fatty acids (% dry weight) composition in neutral lipids of
diets containing five KPL levels……………………………….
58
Table 3.4 Fatty acids (% dry weight) composition in polar lipids of diets
containing five KPL levels……………………………………..
59
Table 3.5 Fatty acids (% total identified fatty acids) composition in
neutral lipids of larvae fed diets containing five KPL levels.
Values (mean ± standard deviation) with the same letters in the
same row are not significantly different (P>0.05)……………..
61
Table 3.6 Fatty acids (% total identified fatty acids) composition in polar
lipids of larvae fed diets containing five KPL levels. Values
(mean ± standard deviation) with the same letters in the same
row are not significantly different (P>0.05)……………………
62
Table 4.1 Formulation and proximate composition of the experimental
microdiets containing several levels of SBL…………………...
72
Table 4.2 Fatty acids (% dry weight) composition in total lipids of five
dietary SBL……………………………………………………..
79

! "#!
Table 4.3
Fatty acids (% dry weight) composition in neutral lipids of five
dietary SBL…………………………………………………….
80
Table 4.4 Fatty acids (% dry weight) composition in polar lipids of five
dietary SBL .……………………………………………………
81
Table 4.5 Fatty acids (% total area) composition in neutral lipids of
larvae fed increased levels of SBL for 15 days. Values (mean ±
standard deviation) with the same letters in the same row are
not significantly different (P>0.05).............................................
83
Table 4.6 Fatty acids (% total area) composition in polar lipids of larvae
fed increased levels of SBL for 15 days. Values (mean ±
standard deviation) with the same letters in the same row are
not significantly different (P>0.05)…………………………….
84
Table 5.1 Formulation and proximate composition of the experimental
microdiets containing several levels of either krill
phospholipids or soybean lecithin……………………………...
96
Table 5.2
Sequences of forward and reverse primers (5’-3’) for real-time
quantitative-PCR of seabream genes…………………………...
99
Table 5.3 Average numbers of mineralized vertebrae of larvae (44 dah)
fed three dietary PL levels using two different PL sources…….
105
Table 5.4 Fatty acids (% dry weight) composition in total lipids of diets
three dietary PL levels using two different PL sources………...
106
Table 5.5 Fatty acids (% dry weight) composition in lipid classes of diets
containing three dietary PL levels using two different PL
sources………………………………………………………….
107
Table 5.6 Fatty acids (% total identified fatty acids) composition of
neutral lipids from larvae fed diets containing five
phospholipids levels. Values (mean ± standard deviation) with
the same letters in the same row are not significantly different
(P>0.05)………………………………………………………...
109
Table 5.7 Fatty acids (% total identified fatty acids) composition of
neutral lipids from larvae fed diets containing five
phospholipids levels. Values (mean ± standard deviation) with
the same letters in the same row are not significantly different
(P>0.05)………………………………………………………...
110
Table 6.1 Ingredients and proximate composition of the experimental
microdiets………………………………………………………
.
127

! "##!
!
!
Table 6.2 Sequences of forward and reverse primers (5’-3’) for real-time
quantitative-PCR of seabream……………………………….....
130
Table 6.3 Fatty acids (% dry weight) composition of seven diets
containing two different phospholipid sources combined with
two !-tocopherol levels………………………………………...
136
Table 6.4 Fatty acids (% total identified fatty acids) composition of
gilthead seabream larvae (44 dph) fed different dietary
contents of two phospholipid sources combined with two !-
tocopherol levels. Values (mean ± standard error) with the
same letters in the same row are not significantly different
(P>0.05)………………………………………………………...
137
Table 7.1 Formulation and proximate composition of the experimental
microdiets containing five selenium levels…………………….
154
Table 7.2 Sequences of forward and reverse primers (5’-3’) for real-time
quantitative-PCR of seabream genes…………………………...
157
Table 7.3 Growth in total length and body dry weight of larvae (44 dph)
fed diets containing five selenium levels. Values (mean ±
standard deviation) with the same letters are not significantly
different (P>0.05)………………………………………………
159
Table 7.4 Fatty acids (% dry weight) composition in total lipids of diets
containing five selenium levels ………………………………..
160
Table 7.5 Fatty acids (% total identified fatty acids) composition in total
lipids of larvae (44 dph) fed diets containing five selenium
levels. Values (mean ± standard deviation) with the same
letters in the same row are not significantly different (P>0.05)..
162
Tabla 9.1 Exigencias cuantitativas y cualitativas de fosfolípidos de peces
teleósteos (Adaptado de Tocher et al., 2008)…………………..
184
Tabla 9.2 Protocolo de tincíon según Vandewalle et al. (1998)…………..
216
Tabla 9.3 Genes estudiados en la presente Tesis………………………….
219
! "###!
List of Figures
-----------------------------------------------------------------------------
Page Nº
Figure 1.1 Factors affecting food particle utilization (Adapted from
Kolkovski et al., 2009)………………………………….
5
Figure 1.2 Absorption and metabolism of triacylglycerides
(Adapted from Smith et al., 1983)……………………...
13
Figure 1.3
Schematic diagram of triacylglycerol biosynthetic
pathway………………………...…………………….....
15
Figure 1.4 Schematic lipoprotein structure………………………… 16
Figure 1.5 Schematic lipoproteins metabolism…………………….
17
Figure 1.6 Figure 8 Biosynthetic pathways for the major
phospholipid classes (Tocher et al., 2008). CDP-Cho,
CDP-choline; CDP–DAG, CDP-diacylglycerol; CDP-
Etn, CDP-ethanolamine; DAG, diacylglycerol; PA,
phosphatidic acid: PC, phosphatidylcholine; PE,
phosphatidylethanolamine; PI, phosphatidylinositol; PS,
phosphatidylserine; SM, sphingomyelin. The enzymes
are; 1, CDP– DAG synthases; 2, PA-phosphatases; 3, PI
synthase; 4, PS synthase; 5, CDP-choline:DAG
phosphotransferase; 6, CDP-ethanolamine:DAG
phosphotransferase; 7, PE methyltransferase; 8, PS
decarboxylase; 9, SM synthase; 10 and 11, PS synthases
via base exchange ………………………………………
19
Figure 1.7 A simplified diagram of the differentiation of (A)
osteoclast precursors into osteoclasts and (B) osteoblast
precursors into osteoblasts. PU.1, Transcription factor
PU.1; M-CSF, macrophage-colony stimulating factor;
c-fms, c-fms genes; MITF, microphthalmia-associated
transcription factor; c-fos, c-fos gene; NF!", nuclear
factor !"; NFATc1, nuclear factor of activated T cells
1; TRAF6, tumor necrosis factor receptor-associated
factor-6; c-src, cellular-sarcoma gene; !v"3, !v"3-
integrin; RANKL, receptor activator of nuclear factor
!" ligand; OPG, osteoprotegerin; Osx, osterix;
PPAR#2, peroxisome proliferator activated receptor #2
(Adapted from Kruger et al., 2010)……………….........
21
Figure 1.8 Antioxidants mechanisms within the cell. Adapted from
Machlin and Bendich (1987). Catalase (CAT);
Superoxide dismutase (SOD); Glutathione peroxidase;
(GPX); Reduced glutathione (GSH)……………………
26

! "#!
Figure 1.9 Proposed mechanism for the reaction of a-tocopherol
with oxidising lipids. The peroxyl radical group formed
during lipid oxidation is polar and floats to the surface
of the membrane where it can react with a- tocopherol,
rendering a lipid hydroperoxyde and the tocopheroxyl
radical (Buettner, 1993)……………………………...….
28
Figure 3.1 Survival rate (% of population) of larvae reared from 16
to 31 dph on five dietary KPL levels. Values (mean ±
standard deviation) with the same letters are not
significantly different (P>0.05)…………………………
52
Figure 3.2 Survival 24 h after activity test of larvae (31 dph) fed
five dietary KPL levels. Values (mean ± standard
deviation) with the same letters are not significantly
different (P>0.05)……………………………………….
52
Figure 3.3
Total length of larvae (31 dph) fed five dietary KPL
levels. Values (mean ± standard deviation) with the
same letters are not significantly different
(P>0.05)…………………………………………………
53
Figure 3.4 Dry weight of larvae (31 dph) fed five dietary KPL
levels. Values (mean ± standard deviation) with the
same letters are not significantly different
(P>0.05)…………………………………………………
53
Figure 3.5 Alkaline phosphatase activity in seabream larvae (31
dph) fed five dietary KPL. Values (mean ± standard
deviation) with the same letters are not significantly
different (P>0.05)……………………………………….
54
Figure 3.6
Trypsin activity in seabream larvae (31 dph) fed five
dietary KPL. Values (mean ± standard deviation) with
the same letters are not significantly different
(P>0.05)…………………………………………………
55
Figure 3.7 Lipase activity in seabream larvae (31 dph) fed five
dietary KPL. Values (mean ± standard deviation) with
the same letters are not significantly different (P>0.05)..
55
Figure 3.8 Phospholipase A2 activity in seabream larvae (31 dph)
fed five dietary KPL. Values (mean ± standard
deviation) with the same letters are not significantly
different (P>0.05)……………………………………….
56
Figure 4.1 Survival rate (% of population) of larvae reared from 16

! "!
to 31 dph on five levels of SBL. Values (mean ±
standard deviation) with the same letters are not
significantly different (P>0.05)…………………………
75
Figure 4.2 Survival 24 h after activity test of larvae (30 dph) fed
increased levels of SBL for 15 days. Values (mean ±
standard deviation) with the same letters are not
significantly different (P>0.05)…………………………
75
Figure 4.3 Total length of larvae (30 dph) fed increased levels of
SBL for 15 days. Values (mean ± standard deviation)
with the same letters are not significantly different
(P>0.05)…………………………………………………
.
76
Figure 4.4 Dry body weight of larvae (30 dph) fed increased levels
of SBL for 15 days. Values (mean ± standard deviation)
with the same letters are not significantly different
(P>0.05)…………………………………………………
76
Figure 4.5
Alkaline phosphatase activity in seabream larvae (30
dph) fed increased levels of SBL for 15 days. Values
(mean ± standard deviation) with the same letters are
not significantly different (P>0.05).…………………….
77
Figure 4.6 Trypsin activity in seabream larvae (30 dph) fed
increased levels of SBL for 15 days. (mean ± standard
deviation) with the same letters are not significantly
different (P>0.05) .……………………………………...
77
Figure 4.7 Lipase activity in seabream larvae (30 dph) fed
increased levels of SBL for 15 days. (mean ± standard
deviation) with the same letters are not significantly
different (P>0.05).……………………...……………….
78
Figure 4.8 Phospholipase A2 activity in seabream larvae (30 dph)
fed increased levels of SBL for 15 days. Values (mean
± standard deviation) with the same letters are not
significantly different (P>0.05) ………………………...
78
Figure 5.1 Survival rate of larvae (44 dph) fed three dietary PL
levels using two different PL sources. Values (mean ±
standard deviation) with the same letters were not
significantly different (P>0.05).………………………..
101
Figure 5.2 Survival rate (24 hours after activity test) of larvae (44
dph) fed three dietary PL levels using two different PL
sources. Values (mean ± standard deviation) with the
same letters were not significantly different (P>0.05).…
101
Figure 5.3 Total length of larvae (44 dph) fed three dietary PL

! "#!
levels using two different PL sources. Values (mean ±
standard deviation) with the same letters were not
significantly different (P>0.05).………………………...
102
Figure 5.4 Correlation between total length of larvae (44 dph) fed
three dietary PL levels using two different PL sources
and dietary n-3 HUFA. Values (mean ± standard
deviation) with the same letters were not significantly
different (P>0.05).………………………………………
102
Figure 5.5 Dry whole body weight of larvae (44 dph) fed three
dietary PL levels using two different PL sources. Values
(mean ± standard deviation) with the same letters were
not significantly different (P>0.05).…………………….
103
Figure 5.6 Representative pictures of mineralized vertebrae of
larvae (44 dah) fed three dietary PL levels using two
different PL sources, (A: Control; B: 7MPL; C: 9MPL;
D: 7SBL; E: 9SBL.……………………………………...
104
Figure 5.7 Graphical representation of the average number of
mineralized vertebrae for each size class of larvae (44
dah) fed three dietary PL levels using two different PL
sources.………………………………………………….
105
Figure 5.8 Incidence of skeleton anomalies of larvae (44 dah) fed
three dietary PL levels using two different PL sources.
(P>0.05). Values (mean ± standard deviation) with the
same letters were not significantly different (P>0.05)….
106
Figure 5.9 The malondialdehyde (MDA) content in larvae (44 dph)
fed five dietary phospholipid levels. Values (mean ±
standard deviation) with the same letters were not
significantly different (P>0.05).………………………..
113
Figure 5.10 The correlation between the malondialdehyde (MDA)
content and the dietary phospholipid levels in larvae (44
dph) fed five dietary phospholipid levels.………………
113
Figure 5.11 Catalase (CAT) gene expression level measured by real-
time PCR in seabream larvae fed five dietary
phospholipid levels. Values (mean ± standard deviation)
with the same letters were not significantly different
(P>0.05).………………………………………………..
114
Figure 5.12 Superoxide dismutase (SOD) gene expression level
measured by real-time PCR in seabream larvae fed five
dietary phospholipid levels. Values (mean ± standard
deviation) with the same letters were not significantly
different (P>0.05).………………………………………
114

! "##!
Figure 5.13 Glutathione peroxidase (GPX) gene expression level
measured by real-time PCR in seabream larvae fed five
dietary phospholipid levels. Values (mean ± standard
deviation) with the same letters were not significantly
different (P>0.05).………………………………………
115
Figure 5.14 BMP4 (Bone Morphogenetic Proteins 2) gene
expression level measured by real-time PCR in
seabream larvae fed five dietary phospholipid levels.
Values (mean ± standard deviation) with the same
letters were not significantly different (P>0.05)………..
115
Figure 5.15 Runx2 (Runt-related transcription factor 2) gene
expression level measured by real-time PCR in
seabream larvae fed five dietary phospholipid levels.
Values (mean ± standard deviation) with the same
letters were not significantly different (P>0.05)………..
116
Figure 5.16
Alkaline Phosphatase gene expression level measured
by real-time PCR in seabream larvae fed five dietary
phospholipid levels. Values (mean ± standard deviation)
with the same letters were not significantly different
(P>0.05).………………………………………………..
116
Figure 5.17
Osteocalcin gene expression level measured by real-
time PCR in seabream larvae fed five dietary
phospholipid levels. Values (mean ± standard deviation)
with the same letters were not significantly different
(P>0.05).………………………………………………..
117
Figure 5.18
Osteopontin gene expression level measured by real-
time PCR in seabream larvae fed five dietary
phospholipid levels. Values (mean ± standard deviation)
with the same letters were not significantly different
(P>0.05).………………………………………………...
117
Figure 5.19
Osteonectin gene expression level measured by real-
time PCR in seabream larvae fed five dietary
phospholipid levels. Values (mean ± standard deviation)
with the same letters were not significantly different
(P>0.05).………………………………………………..
118
Figure 5.20 Matrix Gla Protein gene expression level measured by
real-time PCR in seabream larvae fed five dietary
phospholipid levels. Values (mean ± standard deviation)
with the same letters were not significantly different
(P>0.05).………………………………………………..
118
Figure 6.1 Survival rate of gilthead seabream larvae (44 dph) fed
different dietary contents of two phospholipid sources

! "###!
combined with two !-tocopherol levels. Values (mean ±
standard deviation) with the same letters are not
significantly different (P>0.05).………………………...
132
Figure 6.2 Survival rate (24 hours after activity test) of gilthead
seabream larvae (44 dph) fed different dietary contents
of two phospholipid sources combined with two !-
tocopherol levels. Values (mean ± standard deviation)
with the same letters are not significantly different
(P>0.05).………………………………………………..
132
Figure 6.3 Total length of gilthead seabream larvae (44 dph) fed
different dietary contents of two phospholipid sources
combined with two !-tocopherol levels. Values (mean ±
standard deviation) with the same letters are not
significantly different (P>0.05).………………………..
133
Figure 6.4
Dry weight of gilthead seabream larvae (44 dph) fed
different dietary contents of two phospholipid sources
combined with two !-tocopherol levels. Values (mean ±
standard deviation) with the same letters are not
significantly different (P>0.05).………………………..
133
Figure 6.5 Bone mineralization percent for each size class
(centimeter) of gilthead seabream larvae (44 dph) fed
different dietary contents of two phospholipid sources
combined with two !-tocopherol levels. Values (mean ±
standard deviation) with the same letters for a given fish
size are not significantly different (P>0.05).……………
134
Figure 6.6
Anomalies (craneal deformities; alteration of cephalic,
pre-hemal, hemal and caudal vertebral bodies; dorsal,
anal and caudal fins and vertebral arch and spines) of
gilthead seabream larvae (44 dph) fed different dietary
contents of two phospholipid sources combined with
two !-tocopherol levels. Values (mean ± standard
deviation) without letters are not significantly different
(P>0.05).………………………………………………..
135
Figure 6.7
The malondialdehyde (MDA) content in gilthead
seabream larvae (44 dph) fed different dietary contents
of two phospholipid sources combined with two !-
tocopherol levels.. Values (mean ± standard deviation)
with the same letters are not significantly different
(P>0.05).……………………………………………….
139
Figure 6.8
Catalase (CAT) gene expression level measured by real-
time PCR in gilthead seabream larvae (44 dph) fed
different dietary contents of two phospholipid sources

! "#$!
combined with two !-tocopherol levels.. Values (mean
± standard deviation) with the same letters are not
significantly different (P>0.05).………………………..
140
Figure 6.9
Superoxide dismutase (SOD) gene expression level
measured by real-time PCR in gilthead seabream larvae
(44 dph) fed different dietary contents of two
phospholipid sources combined with two !-tocopherol
levels.. Values (mean ± standard deviation) with the
same letters are not significantly different (P>0.05)……
140
Figure 6.10
Glutathione peroxidase (GPX) gene expression level
measured by real-time PCR in gilthead seabream larvae
(44 dph) fed different dietary contents of two
phospholipid sources combined with two !-tocopherol
levels.. Values (mean ± standard deviation) with the
same letters are not significantly different (P>0.05)……
141
Figure 6.11
BMP4 (Bone morphogenetic protein 4) gene level
expression measured by real-time PCR in gilthead
seabream larvae (44 dph) fed different dietary contents
of two phospholipid sources combined with two !-
tocopherol levels.. Values (mean ± standard deviation)
with the same letters are not significantly different
(P>0.05).………………………………………………..
142
Figure 6.12
RUNX2 (Runt-related transcription factor 2) gene
expression level measured by real-time PCR in gilthead
seabreamm larvae (44 dph) fed different dietary
contents of two phospholipid sources combined with
two !-tocopherol levels.. Values (mean ± standard
deviation) with the same letters are not significantly
different (P>0.05).………………………………………
142
Figure 6.13
Alkaline phosphatase gene level expression measured
by real-time PCR in gilthead seabream larvae (44 dph)
fed different dietary contents of two phospholipid
sources combined with two !-tocopherol levels.. Values
(mean ± standard deviation) with the same letters are
not significantly different (P>0.05).…………………..
143
Figure 6.14
Osteocalcin gene expression level measured by real-
time PCR in gilthead seabream larvae (44 dph) fed
different dietary contents of two phospholipid sources
combined with two !-tocopherol levels. Values (mean ±
standard deviation) with the same letters are not
significantly different (P>0.05).………………………...
143
Figure 6.15
Osteopontin gene level expression measured by real-
time PCR in gilthead seabream larvae (44 dph) fed

! "#!
different dietary contents of two phospholipid sources
combined with two !-tocopherol levels. Values (mean ±
standard deviation) with the same letters are not
significantly different (P>0.05).………………………..
144
Figure 6.16
Osteonectin gene expression level measured by real-
time PCR in gilthead seabream larvae (44 dph) fed
different dietary contents of two phospholipid sources
combined with two !-tocopherol levels.. Values (mean
± standard deviation) with the same letters are not
significantly different (P>0.05).………………………..
144
Figure 6.17
Matrix Gla protein gene level expression measured by
real-time PCR in gilthead seabream larvae (44 dph) fed
different dietary contents of two phospholipid sources
combined with two !-tocopherol levels. Values (mean ±
standard deviation) with the same letters are not
significantly different (P>0.05).………………………..
145
Figure 7.1 Survival rate of larvae (44 dph) fed five dietary
selenium levels. Values (mean ± standard deviation)
with the same letters are not significantly different
(P>0.05).………………………………………………..
158
Figure 7.2
Survival rate 24 h after thermal shock of 24ºC of larvae
(44 dph) fed five dietary selenium levels. Values (mean
± standard deviation) with the same letters are not
significantly different (P>0.05).………………………...
159
Figure 7.3
The selenium content in larvae (44 dph) fed diets
containing five selenium levels. Values (mean ±
standard deviation) with the same letters are not
significantly different (P>0.05).………………………..
160
Figure 7.4 The malondialdehyde (MDA) content in larvae (44 dph)
fed diets containing five selenium levels. Values (mean
± standard deviation) with the same letters are not
significantly different (P>0.05).………………………..
163
Figure 7.5 Catalase (CAT) gene expression level measured by real-
time PCR in seabream larvae fed diets containing five
selenium levels. Values (mean ± standard deviation)
with the same letters are not significantly different
(P>0.05).………………………………………………..
164
Figure 7.6 Superoxide dismutase (SOD) gene expression level
measured by real-time PCR in seabream larvae fed diets
containing five selenium levels. Values (mean ±
standard deviation) with the same letters are not
significantly different (P>0.05).………………………...
165

! "#$!
Figure 7.7 Glutathione peroxidase (GPX) gene expression level
measured by real-time PCR in seabream larvae fed diets
containing five selenium levels. Values (mean ±
standard deviation) with the same letters are not
significantly different (P>0.05).………………………..
165
Figure 7.8 BMP4 (Bone morphogenetic protein 4) gene expression
level measured by real-time PCR in seabream larvae fed
diets containing five selenium levels. Values (mean ±
standard deviation) with the same letters are not
significantly different (P>0.05).………………………..
166
Figure 7.9 Runx2 (Runt-related transcription factor 2) gene
expression level measured by real-time PCR in
seabream larvae fed diets containing five selenium
levels. Values (mean ± standard deviation) with the
same letters are not significantly different (P>0.05).…...
167
Figure 7.10 Alkaline phosphatase gene expression level measured
by real-time PCR in seabream larvae fed diets
containing five selenium levels. Values (mean ±
standard deviation) with the same letters are not
significantly different (P>0.05).………………………...
167
Figure 7.11 Osteocalcin gene expression level measured by real-
time PCR in seabream larvae fed diets containing five
selenium levels. Values (mean ± standard deviation)
with the same letters are not significantly different
(P>0.05).……………………………………………….
168
Figure 7.12 Osteopontin gene expression level measured by real-
time PCR in seabream larvae fed diets containing five
selenium levels. Values (mean ± standard deviation)
with the same letters are not significantly different
(P>0.05).………………………………………………..
168
Figure 7.13 Osteonectin gene expression level measured by real-
time PCR in seabream larvae fed diets containing five
selenium levels. Values (mean ± standard deviation)
with the same letters are not significantly different
(P>0.05).……………………………………………….
169
Figure 7.14 Matrix Gla gene expression level measured by real-time
PCR in seabream larvae fed diets containing five
selenium levels. Values (mean ± standard deviation)
with the same letters are not significantly different
(P>0.05).………………………………………………..
169
Figura 9.1 Factores que afectan la utilización de las partículas de
alimento (Adaptado de Kolkovski et al., 2009)………..
180

! "#$$!
Figura 9.2 Absorción y metabolismo de triglicéridos (Adaptado de
Smith et al., 1983).……………………………………...
189
Figura 9.3 Representación esquemática de la estructura de una
lipoproteína……………………………………………...
191
Figura 9.4
Representación esquemática de la estructura de una
lipoproteína……………………………………………...
192
Figura 9.5 Vías de biosíntesis de las clases principales de
fosfolípidos (Tocher et al., 2008). CDP-Cho, CDP-
colina, CDP-DAG, CDP-diacilglicerol, CDP-Etn, CDP-
etanolamina; DAG, diacilglicerol, PA, ácido
fosfatídico: PC, fosfatidilcolina, PE,
fosfatidiletanolamina, PI, fosfatidilinositol, PS,
fosfatidilserina, SM , esfingomielina. Las enzimas son;
1, CDP-DAG sintasa; 2, PA-fosfatasa; 3, PI-sintasa; 4,
PS-sintasa; 5, CDP-colina:DAG fosfotransferasa; 6,
CDP-etanolamina:DAG fosfotransferasa; 7, PE
metiltransferasa; 8, PS- descarboxilasa; 9, SM-sintasa;
10 y 11, PS-sintasa a través de intercambio de base……
194
Figura 9.6 Diagrama simplificado de la diferenciación de
precursores de osteoclastos (A) en los osteoclastos y los
precursores de osteoblastos (B) en osteoblastos. PU.1,
factor de transcripción PU.1; M-CSF, factor estimulante
de colonias de macrófago, c-fms, genes c-fms; MITF,
factor de transcripción asociado a microftalmia; c-fos,
gen c-fos; NF!", factor nuclear !"; NFATc1,factor
nuclear de células T1 activadas; TRAF6, factor de
necrosis tumoral asociado al receptor factor-6; c-src,
gen del sarcoma celular-; ! v ß 3, ! v ß 3-integrina;
RANKL, activador del receptor del factor nuclear de !
v "; OPG , osteoprotegerina, OSX, osterix; PPAR#2,
receptores activados por proliferador de peroxisoma,
(Adaptado de Kruger et al., 2010).…………………….
196
Figura 9.7 Mecanismos antioxidantes dentro de la célula.
Adaptado de Machlin y Bendich (1987). Catalasa
(CAT), Superóxido dismutasa (SOD), Glutatión
peroxidasa, (GPX), Glutatión reducido (GSH).………..
201
Figura 9.8 Mecanismo propuesto para la reacción del !-tocoferol con
lípidos oxidantes. El grupo de radicales peroxilo formado
durante la oxidación de lípidos es polar y flota a la superficie
de la membrana donde puede reaccionar con el ! -tocoferol,
resultando en un hidroperóxido lipídico y el radical
tocoferoxilo (Buettner, 1993)………………………………...
204

! "#$$$!
! ! ! Acknowledgements ----------------------------------------------------------------------------- First of all I am greatly thankful to Allah who grant me the opportunity to
achieve my dream.
I would like to acknowledge many persons, without them I would not
have finished my thesis.
I would like to start by thanking the most important persons for me who
have supported me during these five years. Thank you My Mother and My
lovely Wife.
I would like to give my great gratitude to my supervisors, Dr. Marisol
Izquierdo and Dr. Francisco Javier Moyano, for their steady guidance
during all these years. I hope that I could be enthusiastic, and energetic
like Marisol. Also, I hope to be able to command a great group of
investigation like her. Dr. Marisol Izquierdo, thank you also for
encouraging me to work in several laboratories, and giving me the
opportunity to present my work in different conferences that have
enriched my scientific experience.
I am grateful to the Spanish agency of International Co-operation and
Development (AECID) for financing my research, to the University of Las
Palmas de Gran Canaria (ULPGC), and to the Canary Institute of Marine
science (ICCM) where all the experiments of the present thesis were
carried out.
I would also like to thank the University of Alexandria, Egypt for giving
me the permission to study in Spain.
I will forever be thankful to my colleague, Monica Betancor for her great
help during the experiments, and for her scientific advices and
suggestions.
I am grateful to all the GIA members for your help during all these years.
I would like to thank Dr. Javier Roo, Dr. Carmen Mª Hernández-Cruz and
Dr. Daniel Montero for helping me during larval culture.
I am grateful to genetics group, especially Dr. María Jesus Zamorano for
giving me the opportunity to know the world of molecular biology and for

! "#"!
allowing me to use their facilities. Also, I am grateful to Dr. Juanma
Afonso for helping me with the statistical analysis.
I would like to thank my great GIA colleagues for their kind behaviour
and help during these years. Thanks to Antonio, Vanesa, Sara, Juan, Ivon,
Maria, Silvia, Alex, Fran, Mohamed, Ana, Davinia, Carmen, Eslam, and
Mert.
I would also like to thank the “mesocosms team”. Thanks Ruben, Desi
and Ada for helping me during my experiments.
I am grateful to my colleagues from the Department of Applied Biology of
Almeria University for their kind help and for allowing me to use their
facilities. Thanks Dr. Francisco Javier Moyano, Gabriel and Mariam.
I am grateful to my colleagues of Oceanography Department of
Alexandria University for supporting me during these years. Especial
thanks to Dr. Abd El Fattah El Sayed and Dr. Tamer Aly El Sayed. Thanks
also to Rasha, Ahmed El Shazly, Nashwa, Fathy, Esraa, Mohamed and
Salma. Thanks to Mohamed Ayoub and Amir Hegazy.
I would like to deeply thank my father in law Sir. Mohamed Saleh,
although I had my ups and downs, you were always there for supporting
and encouraging me. I would also like to thank Sir. Ahmed Ezzat for kind
invitations to drink coffee. Thanks to Mosaab Saleh and Mahmoud Saleh
for helping me during the wedding days.
I am grateful to my friends Mohamed, Amr, Wael, Ali, Sherif, Ayman,
Hassan, El Sayed, and Ahmed.
Thank you my family, Mother in law, sisters, cousins, nieces and
nephews.
Finally, I would like to deeply thank my princess Rahaf Reda for her
beautiful smile that was daylight to the discouraged, sunshine to the sad,
and nature's best antidote for trouble.

Introduction
…………………………………………………………………………………………
1
Chapter 1: Introduction
1.1 Aquaculture
Aquaculture has been the fastest growing food production system and the most rapid
developing animal production sector worldwide. In the last decade it has been
growing at a rate higher than 5% per year (Izquierdo, 2005), with a global production
that increased from 0.6 millions mT in 1950 to 7.3 millions mT in 1980 and 55.1
millions mT in 2009 (APROMAR, 2009; FAO, 2011).
This rapid increase in production was promoted by the improved control of fish
reproduction, rearing conditions, diet formulations and other technological
innovations that allowed the fast development of land and sea based aquaculture
facilities (UNEP/MAP/MED POL, 2004). The future success of the aquaculture
sector is closely related to the increasing demand of food from marine origin that
make this activity very attractive for investors, as well as an alternative to other labor
activities such as wild captures. However, the production success of marine fish
species is limited by the quantity and quality of mass production of fry (Izquierdo and
Fernandez-Palacios, 1997; Watanabe et al., 1983; Yúfera and Pascual, 1984; Sargent
et al., 1997; Izquierdo et al., 2000).
While the Mediterranean production of marine fish species has been increasing in
several species, gilthead seabream (Sparus aurata) and European sea bass
(Dicentrarchus labrax) are still the most cultivated marine fish species, characterizing
the development of European marine aquaculture over the last three decades (FAO,
1999; Izquierdo, 2005). Demand for good quality fry has been increasing at a rate of
10% annually and the European annual fry production of seabream and of sea bass
respectively reached 497.7 and 457.7 millions in 2008 (FEAP, 2008). The improved
development of fry production is essentially affected by the effectiveness of first
feeding regimes and the high nutritional quality of early weaning diets (Kolkovski et
al., 1993; Sargent et al., 1997; Izquierdo et al., 2000). Rearing of marine fish larvae
implies the administration of external nutrients by feeding firstly alive preys for some
days followed by early weaning diets. Nevertheless, both live preys and microdiets
should meet the nutritional requirements of each species to ensure the best growth and
survival rates (Kolkovski et al., 1993; Sargent et al., 1997).
Several strains of the rotifer Brachionus plicatilis constitute the first prey fed to

Introduction
…………………………………………………………………………………………
2
gilthead seabream due to its adequate size (90-130 µm). They are followed by
Artemia and co-feeding with early weaning diets to fit larval mouth size. However,
the extra effort in terms of manpower, infrastructure, time and energy to produce
rotifers and Artemia species represents a significant cost (Kolkovski, 2009).
Moreover, the nutritional value of live preys varies notably according to its feed and
environmental conditions such as light intensity and regimes, temperature, salinity,
etc., risking the optimal nutrition of the larvae (Jones et al., 1993; Kolkovski et al.,
1993; Barnabé and Guissi, 1994; Rosenlund et al., 1997). Besides, from an
experimental point of view, effective live prey enrichment is limited to few nutrients
such as phospholipids (PL) or proteins (Rosenlund et al., 1997; Koven et al., 2001).
For all these reasons, substitution of live prey by compound microdiets is crucial for
sustaining cost effective production of high and constant quality juveniles.
During the past three decades, extensive efforts have been made to develop microdiets
as a complete or partial substitution for both rotifers and Artemia. The majority of the
studies have focused on the larvae’s nutritional requirements. Despite substantial
achievements, complete replacement of live feeds at first feeding is not yet feasible
for most marine species. A lower performance is commonly reported when inert diets
are fed to larvae from the onset of exogenous feeding. This may be due to the
composition, palatability or physical characteristics of dry feed (Person Le Ruyet et
al., 1993). In addition to diet nutritional quality, important physical characteristics of
diet particles within the water column such as sinking rates, nutritional stability,
leaching rates and leachate profiles all contribute to the microdiets attractiveness that
influence ingestion and digestion rates and can greatly affect larvae growth.
Surprisingly, these factors have received very little attention. The production of
microdiets could be a convenient and economic alternative to live feed, in spite of the
problems of nutrient leaching and water stability normally encountered when
producing microparticles (Baskerville-Bridges and Kling, 2000; Önald and Landgon,
2000; Poussao-Ferreira et al., 2003). Therefore, it is important taking into account the
physiology and ontogeny of the larval digestive system, feed regime and technology
as well as each species nutritional requirements in the process of microdiets
preparation for marine fish larvae.
In the last years, various studies have been conducted to determine the optimum lipid
composition in early weaning diets for marine fish larvae, where more attention has
been paid to study the long chain polyunsaturated fatty acids (LCPUFA) and

Introduction
…………………………………………………………………………………………
3
phospholipids requirements and its role in marine fish larvae development (Watanabe
1982; Takeuchi, 1997; Sargent et al., 1999a; Izquierdo et al., 2003).
1.2 Marine fish larvae and microdiets utilization
Nowadays, the dependence on the availability of seeds is one of the critical factors for
the commercial success of the industrial fish marine production (FAO, 1998). Certain
phases are recognized as critical points during the first stages of larval development:
a) The change from the endogenous to the exogenous feeding which starts with
supplying of rotifers between day 3 and 4 post hatching.
b) The moment of weaning or the transition from the ingestion of the live food to
the early weaning inert food.
The larval culture development of marine fish has been possible thanks to the use of
live preys, mainly rotifers and nauplii and metanauplii of Artemia. Since the rotifer
cultivation was settled down (Ito, 1960), this organism has been widely used for the
cultivation of larvae of several species of marine fish. According to Verreth (1994),
the bottlenecks in the development of techniques for larval rearing are:
I. The lack of knowledge about the optimal environmental conditions and feeding
requirements during the early life stages.
II. The unknown of the optimal nutritional requirements, which are difficult to assess
in the absence of a suitable rearing technology.
III. The changes in specific husbandry and feeding practices from one species to
another due to ontogenic changes and growth.
IV. The small size of the larvae and the need for small particle sizes, which imposes
specific problems on feed technology.
Marine fish larvae are very vulnerable during the first stages of development and have
strict requirements for biotic and abiotic conditions to survive, develop and
grow. Most research on larval nutrition have contributed to the knowledge necessary
to estimate the nutrient requirements of larval fish. However, it is not easy to quantify
the nutritional requirements of larval fish. Obviously, a good knowledge of the larval
nutritional requirements throughout the larval development would contribute to
optimize diets and feeding protocols.
As marine fish species undergo dramatic morphological and physiological changes,
including metamorphosis, during ontogenesis, their nutritional requirements may

Introduction
…………………………………………………………………………………………
4
differ qualitatively and quantitatively from larvae to juvenile or adult stages.
Moreover, fish larvae grow extremely rapidly, feed continuously and therefore, total
ingestion of nutrients must be high. The larval nutritional requirement for a particular
nutrient can be defined from a physiological point of view as the nutrient intake
needed to fulfil a physiological role, but is frequently defined as the “requirement for
maximal growth and/or survival” where the relation fish-diet-feeding has an
important effect in the determination of the quantitative needs (Izquierdo and Lall,
2004). Enormous efforts have been made to improve microdiets efficiency to replace
live feed, both rotifers and Artemia, as complete or partial replacements for marine
fish larvae (Koven et al., 2001; Kolkovski, 2004; Kolkovski et al., 2009). There have
been substantial achievements in the earlier weaning of larvae onto microdiets and
partial replacement of live feeds, but microdiets still cannot completely replace live
feeds for most species. The partial substitution of live food has proven to be
successful. The formulated microdiets supply with the live food (co-feeding) to
enable early weaning, for instance, up to 90% substitution of rotifers with artificial
diets has been achieved for red seabream (Pagrus major) and Japanese flounder
(Paralichthys olivaceus) (Kanazawa et al., 1989), and gilthead seabream larvae (Liu
et al., 2002). Although weaning the larvae from Artemia onto a microdiet can be
achieved at metamorphosis in many species (Foscarini, 1988; Hardy, 1989; Koven et
al., 2001; Curnow et al., 2006a, b), the early introduction of formulated diets for
completely replacement of live food has limited success (Kanazawa et al., 1989;
Walford et al., 1991; Fernández-Díaz and Yúfera, 1997; Rosenlund et al., 1997;
Kolkovski et al., 2009). The addition of Artemia nauplii combined with a microdiet,
enhances the peristaltic movement of the larval digestive tract enhancing microdiet
ingestion and production of digestive enzymes (Kolkovski et al., 1995). The design
and formulation of these early weaning diets requires meeting the optimal nutritional
requirements to fulfil the larval physiological needs (Kolkovski et al., 2009). The
efficiency of utilization of feed particles by marine fish larvae is affected by many
external and internal factors (Figure 1.1) (Kolkovski, 2001, 2004; Koven et al., 2001).
However, the studies of nutritional requirement measurements that use direct methods
are scarce due to the difficulty of designing experimental diets with full control of
nutritional composition and environmental factors in all the experimental
tanks. Formulated diets have variable leakage and stability problems resulting in an
unknown difference in nutrient composition between the formulated and ingested diet.

Introduction
…………………………………………………………………………………………
5
Figure 1.1 Factors affecting food particle utilization (Adapted from Kolkovski et
al., 2009).
According to (Kolkovski et al.,2009), microparticulated diets can be classified in
three general types:
I. Microbound type is the simplest microdiet, where the powdered ingredients
are microbound with a water stable matrix such as agar or carrageenan (López-
Alvarado et al., 1994).
II. Microcoated type, its manufacturing process relied on coating the powdered
ingredients with a glucidic (carraggeenan, alginate), proteic (gelatin, zein) or
lipid binder to reduce leaching (Önal and Langdon, 2004).
III. Microencapsulated diets are made by encapsulating a solution, colloid or
suspension of diet ingredients within a membrane, and it is produced with a
cross linking agent (Yúfera et al., 1999; Kolkovski, 2009).
!!!!
"#$%&'#()!
"#$#%&!'()*+#,&!
-,.(+%#+,*&!/)#&*0(+!
!
*++#,#-.)#&/!0!.1+&%2)#&/!
!"#$%&'(")*"$&
+,-"(.,/,,&
0"12$3("4*"$&/,3(3"(4*,2$&
3#4(+)#&/!
1#.+&*#2+!+,345+&!
'+(#&*67*#8!5)2+5+,*&!
1#.+&*#2+!*(68*!%+2+7)$5+,*!
98#%!&+8(+*#),:!;#7+!&67*&!
5/4(+)#&/!
6#7(!!
8.+)(!
69.2(!
+(.*5*24$&
:9(,#$.-!;.$)&%+!!
6**)&144"1-4124$&6"**&15,2(&1-,)$&
155(2,#5&&$1/4$7&8*4-9&!
!
<#+=.-!;.$)&%+!!
:&-&%!69.2(!6#7(!
"&>(,(/)!

Introduction
…………………………………………………………………………………………
6
1.3 Importance of phospholipids in marine fish larvae nutrition
In fish, as in other vertebrates, phosphoglycerides are particularly important in fish
larvae production for their essential function as necessary components for cellular
bio-membranes and organelles formation (Izquierdo and Koven, 2010). Besides,
phosphoglycerides can also serve as an energy source during egg development and
endogenous feeding in the pre-larval stages of marine fish (Izquierdo and Koven,
2010). Moreover, phosphoglycerides can act as emulsifiers in the formation of mixed
micelles in the digestive tract (Olsen and Ringø, 1997). Indeed, young fish contain
abundant phospholipids received during embryo and larval development either from
endogenous yolk sac or exogenous live preys lipids (Rainuzzo et al., 1997; van der
Meeren et al., 2008). Studies on dietary phospholipids were initiated by Kanazawa et
al., (1981, 1983a, b), who showed that despite their significant roles in fish
metabolism, developing fish possess a limited ability for phospholipids synthesis
(Kanazawa et al., 1985) and, consequently, they must be included in young fish diets.
Moreover, lipid digestion, absorption and transport are very limited in the first
feeding larvae with a poorly developed digestive system, and phospholipids playing
different important roles in all these processes. However, fish larvae may be unable to
efficiently synthesize phospholipids in an enough quantity to cover this high demand
and therefore need to be included in the diet (Izquierdo and Koven, 2010). Indeed, in
the first feeding larvae, enterocytes are poorly developed and phospholipid synthesis
is scarce (Deplano et al., 1991). In gilthead seabream, isolating microsomes from
enterocytes demonstrated that phospholipid synthesis occurs mainly through the
glycerol-3-phosphate pathway, whose activity is modulated by dietary lipids
(Caballero et al., 2003). Moreover, restrictions in the rate of phospholipid synthesis
may constrain lipoprotein synthesis (Liu et al., 2002) that is crucial for lipid transport
(Salhi et al., 1999; Caballero et al., 2006a). Thus, addition of 20 g kg-1
dry weight diet
of soybean lecithin in microdiets for 15 dph gilthead seabream containing 220 g kg-1
dw lipids, significantly increased the occurrence of lipoprotein particles in the lamina
propria, promoting transport and utilization of dietary lipids as well as growth (Liu et
al., 2002). Dietary PL not only increases synthesis and release of lipoproteins in the
lamina propria by enterocytes, but also significantly reduces lipoprotein size by
promoting very low density lipoprotein (VLDL; higher in PL) synthesis, rather than

Introduction
…………………………………………………………………………………………
7
chylomicron production (higher in NL) (Liu et al., 2002; Caballero et al., 2003,
2006b). Thus, phospholipids inclusion in young fish diets has been found to improve
culture performance of various fresh water and marine fish species (Izquierdo and
Koven 2011), enhancing growth and survival (Kanazawa 1993; Salhi et al., 1999;
Izquierdo et al., 2001; Kjørsvik. 2009). Besides their importance for growth and
dietary lipid utilization, dietary phospholipids have been also found to be necessary to
improve stress resistance, skeleton development and flatfish metamorphosis and
pigmentation (Kanazawa et al., 1981; Kanazawa, 1993; Fontagné et al., 2000; Koven,
2003; Zambonino- Infante and Cahu, 2007; Hamza et al., 2008).
1.3.1 Phospholipids as source of essential fatty acids
Phospholipids can be an important source of energy (fatty acids) in fish, particularly
during embryonic and early larval development in species that produce phospholipid-
rich eggs (Tocher, 1995). Larval fish at first feeding may be predisposed to digestion
and metabolism of phospholipids and the use of fatty acids from phospholipids for
energy (Sargent et al., 1997). The main roles of fatty acids in fish larvae are
consistent with those in juveniles and adults. Thus, they function as a source of
metabolic energy, structural components in the phospholipids of cellular membranes
and precursors of bioactive molecules (Sargent et al., 1999; Izquierdo et al., 2000;
Tocher, 2003). Dietary phospholipids tend to be a richer source of essential fatty acid
(EFA) than neutral lipids such as triacylglycerols (Tocher, 1995). In addition,
phospholipids may be superior to neutral lipids as a source of EFA in larval fish due
to improved digestibility (Sargent et al., 1997, 1999). Recently it was shown that
phospholipids were the more efficient mode of supply dietary EPA and DHA to sea
bass larvae than triglycerides (Gisbert et al., 2005; Tocher et al., 2008). In any case,
most of the studies to determine phospholipid requirements have been performed with
soybean or egg lecithin that are rich in 18:2n-6 but also deficient in n-3 HUFA, EPA
and DHA, essential fatty acids for marine fish (Watanabe et al., 1984; Coutteau et al.,
1997; Sargent et al., 2002; Tocher et al., 2008).
Introduction
…………………………………………………………………………………………
8
1.3.2 Phospholipid requirements
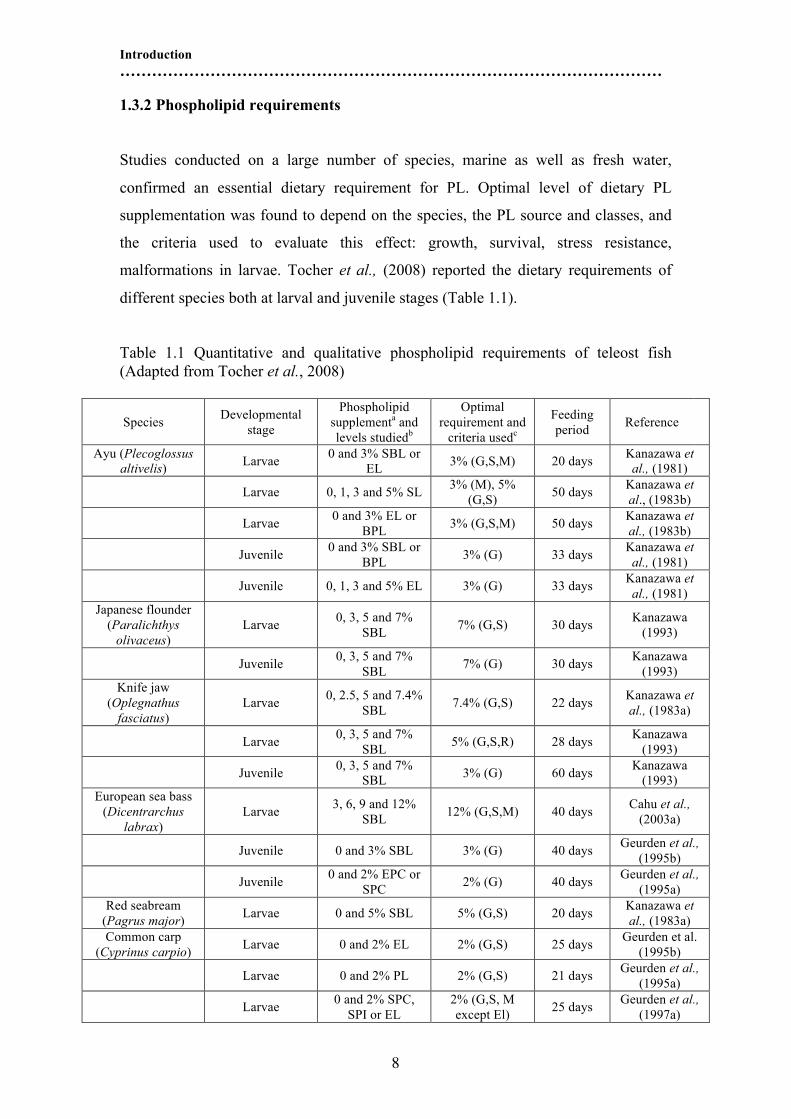
Studies conducted on a large number of species, marine as well as fresh water,
confirmed an essential dietary requirement for PL. Optimal level of dietary PL
supplementation was found to depend on the species, the PL source and classes, and
the criteria used to evaluate this effect: growth, survival, stress resistance,
malformations in larvae. Tocher et al., (2008) reported the dietary requirements of
different species both at larval and juvenile stages (Table 1.1).
Table 1.1 Quantitative and qualitative phospholipid requirements of teleost fish
(Adapted from Tocher et al., 2008)
Species
Developmental
stage
Phospholipid
supplementa and
levels studiedb
Optimal
requirement and
criteria usedc
Feeding
period Reference
Ayu (Plecoglossus
altivelis) Larvae
0 and 3% SBL or
EL 3% (G,S,M) 20 days
Kanazawa et
al., (1981)
Larvae 0, 1, 3 and 5% SL
3% (M), 5%
(G,S) 50 days
Kanazawa et
al., (1983b)
Larvae
0 and 3% EL or
BPL 3% (G,S,M) 50 days
Kanazawa et
al., (1983b)
Juvenile 0 and 3% SBL or
BPL 3% (G) 33 days
Kanazawa et
al., (1981)
Juvenile 0, 1, 3 and 5% EL 3% (G) 33 days
Kanazawa et
al., (1981)
Japanese flounder
(Paralichthys
olivaceus)
Larvae 0, 3, 5 and 7%
SBL 7% (G,S) 30 days
Kanazawa
(1993)
Juvenile
0, 3, 5 and 7%
SBL 7% (G) 30 days
Kanazawa
(1993)
Knife jaw
(Oplegnathus
fasciatus)
Larvae 0, 2.5, 5 and 7.4%
SBL 7.4% (G,S) 22 days
Kanazawa et
al., (1983a)
Larvae
0, 3, 5 and 7%
SBL 5% (G,S,R) 28 days
Kanazawa
(1993)
Juvenile
0, 3, 5 and 7%
SBL 3% (G) 60 days
Kanazawa
(1993)
European sea bass
(Dicentrarchus
labrax)
Larvae 3, 6, 9 and 12%
SBL 12% (G,S,M) 40 days
Cahu et al.,
(2003a)
Juvenile 0 and 3% SBL 3% (G) 40 days
Geurden et al.,
(1995b)
Juvenile
0 and 2% EPC or
SPC 2% (G) 40 days
Geurden et al.,
(1995a)
Red seabream
(Pagrus major) Larvae 0 and 5% SBL 5% (G,S) 20 days
Kanazawa et
al., (1983a)
Common carp
(Cyprinus carpio) Larvae 0 and 2% EL 2% (G,S) 25 days
Geurden et al.
(1995b)
Larvae 0 and 2% PL 2% (G,S) 21 days
Geurden et al.,
(1995a)
Larvae
0 and 2% SPC,
SPI or EL
2% (G,S, M
except El) 25 days
Geurden et al.,
(1997a)

Introduction
…………………………………………………………………………………………
9
Pikeperch (Sander
lucioperca) Larvae 1, 5 and 9% SBL 9% (G) 24 days
Hamza et al.,
(2008)
Gilthead seabream
(Sparus aurata) Larvae 9, 11 and 15% SL >9% (G,S) 23 days
Seiliez et al.,
(2006)
Larvae 6, 7, 9, 10 and 11
KPL 10% (G,S,R) 30 days
Saleh et al.,
(2012a)
Larvae 5, 6, 7, 9 and 10
SBL 9% (G,S,R) 30 days
Saleh et al.,
(2012b)
Striped Jack
(Pseudocaranx
dentex)
Juvenile 0, 0.5, 1, 1.5 and
2% SPC 1.5% (G,S,R) 6 weeks
Takeuchi et al.,
(1992)
Juvenile 0 and 1.5% SPE 1.5% (G) 6 weeks
Takeuchi et al.,
(1992)
Rainbow trout
(Oncorhynchus
mykiss)
Juvenile 0, 2, 4 and 8% SL 4% (G) 20 weeks Poston (1990a)
Juvenile 0 and 14% 14% (G) 8 weeks
Rinchard et al.,
(2007)
Turbot (Psetta
maximus) Juvenile 0 and 2% EL 2% (G)
Geurden et al.,
(1997b)
Atlantic salmon
(Salmo salar) Juvenile (180 mg)
0, 2, 4, 6 and 8%
SBL/CPL 6% (G) 14 weeks Poston (1991)
Juvenile (180 mg) 0 and 4% SBL 4% (G) 16 weeks Poston (1990b)
Juvenile (1.0 g) 0 and 4% SBL 4% (G) 12 weeks Poston (1990b)
Juvenile (1.7 g) 0 and 4% SBL 4% (G) 12 weeks Poston (1990b)
Juvenile (7.5 g) 0 and 4% SBL
0% (no
requirement) 12 weeks Poston (1990b)
White sturgeon
(Acipenser
transmontanus)
Juvenile (5-10 g) 0 and 8% SBL 0% (no
requirement) 6 weeks
Hung and
Lutes (1988)
aBPL, bonito egg polar lipid; CPL, corn polar lipid; EL, chicken egg lecithin; EPC,
purified egg phosphatidylcholine; KPL, Krill phospholipid; PL, various phospholipid
sources supplemented to supply 2% dietary phospholipids including EL, SL,
sunflower, rapeseed and marine phospholipids: SBL, soybean lecithin; SPC, purified
soybean phosphatidylcholine; SPE, purified soybean phosphatidylethanolamine; SPI,
purified soybean phosphatidylinositol; bPercentage of diet weight;
cG, growth; S,
survival; M, malformations; R, stress resistance.
These authors evidenced a trend suggesting that quantitative PL requirements
decrease from larval stages to small juveniles. No requirements were observed in fish
greater than 5 g. Phospholipids requirements have been found to be related to the
larval age and the degree of digestive system development (Kanazawa, 1993;
Izquierdo and Koven, 2010). However, both optimal PL level and composition, as
well as the role of dietary PL remain unclear for most species. Sargent et al., (1999)
considered that the egg lipid composition give a valuable approximation of the
optimal lipid composition of a larval diet. The quantitative requirements of
phospholipids for larval fish range from 2 to 12% of diet, being lower in the larvae of
common carp (Cyprinus carpio) (2% chicken egg) (Geurden et al., 1995a), followed

Introduction
…………………………………………………………………………………………
10
by red seabream (Pagrus major) (5% SBL) and knife jaw (Oplegnathus fasciatus)
(7.4 % SBL) (Kanazawa et al., 1983a) and Japanese flounder (Paralichthys olivaceus)
larvae (7 % SBL) (Kanazawa, 1993), with the highest reported value being for
gilthead seabream (Sparus aurata) (15 % SBL) (Seiliez et al., 2006). However, for
the later species, our recent studies (Chapter 3) have found an optimum inclusion of
about 10% using krill oil as phospholipids source (Saleh et al., 2012a).
1.3.3 Phospholipid digestion, absorption and transport
1.3.3.1 Phospholipid digestion
The digestion and assimilation efficiency in marine fish larvae may be lower than in
adult fish because the marine fish larvae have digestive features different from that of
juveniles (Cahu and Zambonino-Infante, 1995a, b). It has been hypothesized that
marine fish larvae have insufficient digestive capacity to thrive on a compound diet
(Lauff and Hofer, 1984). The change from a primary to an adult mode of digestion
characterizes developing animals and has been extensively described in upper
vertebrates (Henning, 1987). The activities of digestive enzymes in fish larvae are low
at first feeding and increase along with development (Govoni et al., 1986). The
digestion of ingested food occurs in the larval intestine, where the pH remains
alkaline and trypsin-like enzyme activity accounts for the proteolytic activity
(Walford and Lam 1993). At first feeding, the pancreatic and intestinal enzyme
activities are generally low (Cousin et al., 1987). Digestive enzymes activity increase
during the first 10 dph in Solea senegalensis (Ribeiro et al., 1999), whereas an
increase in alkaline phosphatase activity has been found to reflect the development of
the brush border membranes of enterocytes in Atlantic cod (Gadus morhua) (Wold et
al., 2007). Moreover, the addition of dietary PL enhanced gut maturation index in this
species, based on the relation between brush border alkaline phosphatase and
cytosolic leucine-alanine aminopeptidase. Enhancement of gut maturation by dietary
PL could be related with a higher intracellular availability of PL for cell membrane
and cell organelles formation, since dietary PL promotes re-acylation of digested
lipids, increasing intracellular PL availability for lipoprotein synthesis in gilthead
seabream (Caballero et al., 2003; Liu et al., 2002).
It is known that lipids are generally well digested by fish (Olsen and Ringo, 1997). In
general, the digestibility of dietary lipids in fish is high, about 95%,

Introduction
…………………………………………………………………………………………
11
although the digestibility of different fatty acids is different depending on the degree
of unsaturation and chain length. Thus, saturated and monounsaturated are less
digestible than polyunsaturated fatty acids (Lied and Lambertsen, 1982, Olsen and
Ringo, 1997). Therefore, it has been suggested that the absorption of some fatty acids
is more efficient than that of others (Olsen et al., 1998).
Dietary lipids are hydrolyzed in the digestive tract lumen by lipolytic enzymes
producing mainly free fatty acids, monoacylglycerols and diacylglycerols. While in
higher vertebrates the hydrolysis of dietary lipids is mainly catalyzed by a specific
pancreatic lipase, which hydrolyzes the fatty acids sn-1 and sn-3 releasing 2-
monoacylglycerols, in fish, the main enzyme responsible for digestion of neutral lipid
is a neutral non specific lipase dependent bile salts (bile salt activated lipase, BAL)
(Iijima et al., 1998; Izquierdo and Henderson, 1998), which hydrolyzes the ester
bonds of various fatty acids with glycerol molecule. Despite this enzyme is
characterized by acting on a wide range of substrates, it also appears to have a greater
specificity for polyunsaturated fatty acids (Lied and Lambrtsen, 1982; Iijima et al.,
1998; Izquierdo et al., 2000).
Several types of lipases have been found in the digestive tract of juvenile or adult fish.
Among them, the non-specific neutral lipase activated by bile salts (BAL) appears to
play a major role in digestion of neutral lipids in most fish species such as seabass,
anchovy, rainbow trout, red seabream, turbot or gilthead seabream (Patton, et al.,
1975; Ijima et al., 1990, Iijima et al., 1998; Izquierdo and Henderson, 1998; Caballero
et al., 2002). This enzyme catalyzes the hydrolysis not only of acylglycerides, but also
of other dietary lipids including cholesterol esters and esters of vitamins. There is also
evidence of the presence of specific pancreatic lipase (MPL) in several species, it is
activated in the presence of bile salts and is specific for triacylglycerols (lijima et al.,
1998). Lipids containing polyunsaturated fatty acids of the n-3 series, which are
essential for marine fish, are more resistant to hydrolysis by the MPL. On the
contrary, it has been demonstrated that the BAL is specific for these fatty. Thus,
although the MPL preferentially hydrolyzes esters of 18:1n-9 than 18:2 n-6 or 18:3n-
3, the BAL shows a preference for 20:5 n-3 and 20:4 n-6 than 18:2 n-6 and 18:1n-9
(lijima et al., 1998).
The distribution patterns of lipase activity along the digestive tract of juvenile and
adult fish appear to differ between species (Izquierdo and Henderson, 1998). This
difference in lipolytic activity distribution in adult fish, almost disappears in juveniles

Introduction
…………………………………………………………………………………………
12
and larvae, suggesting less functional differentiation in the digestive tract in the early
stages of development.
Digestion of dietary phospholipids is relatively unstudied in fish, but it is presumed
that the mechanisms are generally similar to those in mammals, whereby
phospholipids are digested by intestinal phospholipase A2, secreted by the pancreas,
in the intestine and specifically recognizes the sn-2 acyl bond of phospholipids and
catalytically hydrolyzes the bond resulting in the formation of 1-acyl lyso-
phospholipids and free fatty acids (Figure 1.2) that are absorbed by the intestinal
mucosal cells (Henderson and Tocher, 1987; Sargent et al., 1989; Izquierdo and
Henderson, 1998). There are two isoforms of phospholipase A2 that have been
purified in red seabream hepatopancreas (Ono and Iijima, 1998). The activity of
phospholipase A2 was detected in marine fish larvae several days after first feeding
(Izquierdo et al., 2000).
Lipolytic enzymes of pancreas, lipase and phospholipase A2, increase with
development of marine fish larvae (Izquierdo et al., 2000) and are stimulated by the
increase of their respective substrates, triglycerides and phospholipids in the diet.
Phospholipase A2 activity increases with the level of its corresponding mRNA in sea
bass larvae (Zambonino-Infante and Cahu, 1999) suggesting a transcriptional
regulation of this enzyme that has been elevated when diets incorporated more than
4.5% phospholipids.
1.3.3.2 Phospholipid absorption and transport
The dietary lipid absorption in fish is simillar to that of mammals (Sire et al., 1981;
Tocher et al., 2008). After intraluminal hydrolysis, dietary lipid is incorporated into
intestinal epithelial cells by diffusion in a form of micelles of monoglycerides and
free fatty acids (Izquierdo et al., 2000; Tocher et al., 2008). Products of hydrolysis of
dietary lipids, free fatty acids, monoacylglycerols, diacylglycerols and
lysophospholipids, are grouped with bile salts to form small micelles that are
transported into the enterocyte (Figure 1.2), and the content of these micelles, which
also includes other lipids such as cholesterol and liposoluble vitamins, crosses the cell
membrane by diffusion and is poured inside the enterocyte (Smith et al., 1983).
Reacylation occurs in the endoplasmic reticulum and its products are released into the
submucosal as lipoproteins of very low density (chylomicrons). The activity of the

Introduction
…………………………………………………………………………………………
13
enterocytes during the absorption of lipids is the packaging of lipids together with
proteins to constitute stable molecules to transport them through the blood to sites of
metabolism and storage (Gurr and Harwood, 1991).
Inside the intestinal cells, as the short chain fatty acids (less than 12 atoms carbon) are
sufficiently soluble in the plasma, they are released directly from the enterocyte to the
portal circulation and metabolized in the liver (Green and Selivonchick, 1987). The
absorbed long-chain fatty acids and monoacylglycerols migrate to the endoplasmic
reticulum vesicles, where they are resynthesized into triglycerides or other lipids by a
multienzyme complex (Gurr and Harwood, 1991). These fatty acids diffuse to the
endoplasmic reticulum associated with the binding protein FABP (Fatty Acid Binding
Protein), which plays an important role in intracellular transport of the absorbed fatty
acids. In fish, this protein has a preference for unsaturated fatty acids in the same
manner as it occurs in mammals (Gangl et al., 1980). Sire and Vernier (1981),
reported that this protein is more abundant in fish fed high dietary lipids, which could
indirectly affect the activation and reacylation of fatty acids.
Figure 1.2 Absorption and metabolism of triacylglycerides (Adapted from Smith et
al., 1983).

Introduction
…………………………………………………………………………………………
14
The two main pathways of reacylation of fatty acids in the enterocytes are the
monoacylglycerol and glycerol-3-phosphate pathway, both routes finally producing
triacylglycerol and phospholipids (Iijima et al.,1983; Caballero et al., 2006a) (Figure
3). Most enzymes involved in these pathways have been identified and studied in rats,
but there are very few studies in fish that refer to them (Sire et al.,1981; Iijima et
al.,1983; Caballero et al., 2006a). Thus, Iijima et al., (1983) showed that the intestine
of carp (Cyprinus carpio) is able to esterify the palmitic acid in triglycerides and
phospholipids. On the other hand, Sire et al., (1981) found that linoleic acid is
esterified more rapidly to triacylglycerols than palmitic acid in enterocytes of rainbow
trout. Furthermore, these authors propose that while monoacylglycerol pathway in
mammals is predominant due to the luminal hydrolysis products are the 2-
monoacylglycerols, but in fish, the pathway glycerol-3-phosphate is the main due to
free fatty acids and glycerol are the main products of hydrolysis intraluminal, so that
the synthesis of glycerophospholipids in fish is more important than in mammals.
Caballero et al., (2006 a) isolating enterocytes microsomes demonstrated that in
gilthead seabream phospholipid synthesis occurs mainly through the glycerol-3-
phosphate pathway, whose activity is modulated through dietary lipids.
In the case of phospholipids, the mechanisms of absorption of their digestion products
have not been studied deeply in fish, but are assumed to be generally similar to those
in mammals. Thus, the hydrolysis products, 1-acyl-lysosome phospholipids and fatty
acids free are associated with all other products of lipid digestion with bile salts in
mixed micelles, which uptake in the intestinal mucosa, whose penetration occurs in
the enterocytes by passive diffusion. Lyso-phospholipids concentration is very low in
the intestinal mucosa, most of the 1-acyl lyso-phospholipids are reesterified with free
fatty acids activated in microsomes prior to export from enterocytes to the circulatory
system (Sargent et al., 1989).

Introduction
…………………………………………………………………………………………
15
Figure 1.3 Schematic diagram of triacylglycerol biosynthetic pathway.
Transport of lipids and other lipid soluble components from the intestine to the tissues
is predominantly by lipoproteins (Babin and Vernier, 1989; Izquierdo et al., 2001; Liu
et al., 2002; Caballero et al., 2003, 2006b). The lipoproteins are particles that differ
in their proportion of lipids (triglycerides, cholesterol, esters of cholesterol and
phospholipids) and proteins (Figure 1.4).

Introduction
…………………………………………………………………………………………
16
Figure 1.4 Schematic lipoprotein structure.
Lipoproteins are generally classified according to their density in six major classes:
chylomicrons (CM), very low density lipoproteins (VLDL), intermediate density
lipoprotein (IDL), low density lipoprotein (LDL), high lipoprotein density lipoprotein
(HDL) and very high density lipoprotein (VHDL) (Liu et al., 2002; Caballero et al.,
2003, 2006b). These lipoproteins have apolipoproteins as structural and functional
components, which are cofactors for enzymes and ligands for cell-surface receptores.
In particular, apoA1 is the major protein component of high-density lipoproteins;
apoA4 is thought to act primarily in intestinal lipid absorption; and apoE is a blood
plasma protein that mediates the transport and uptake of cholesterol and lipid by way
of its high affinity interaction with different cellular receptors, including the low-
density lipoprotein (LDL) receptor (Saito et al., 2004).
VLDL carries mainly lipids and preferably contains endogenous triacylglycerol,
similar to chylomicrons. Its main site of synthesis is the liver and its catabolism is
basically the same as chylomicrons, acting upon them lipoprotein lipase, which
hydrolyzes triacylglycerols (Figure 1.5). VLDL-lipase interaction is less efficient than
the interaction chylomicron lipase, thus VLDL persist more time in the circulation
(Sheridan, 1988). HDL is the principal store of cholesterol and this lipoprotein
accepts the cholesterol from peripheral tissues and transports it to the liver for
degradation and reutilization.

Introduction
…………………………………………………………………………………………
17
Figure 1.5 Schematic lipoproteins metabolism.
There is evidence that the transport of lipids from the enterocytes to the hepatocytes
appears to be increased by supplementation dietary phospholipids (Kanazawa et al.,
1993). Feeding of seabream larvae on microdiets without supplementation of lecithin
produced accumulation of lipid vacuoles in the enterocytes and steatosis in liver
tissue, which is indicative of dietary-induced problems in lipid transport from the
intestinal mucosa into the body circulation (Kanzawa et al., 1993). Both effects are
reduced by the addition of 2% lecithin to the diet which shows the increase of lipid
transport in the intestine and liver (Kanzawa et al., 1993). In agreement, insufficient
levels of dietary PL (PL 23.7 g kg-1
dw, dietary lipids 178.5 g kg-1
dw), increase
accumulation of lipid droplets in the enterocytes of marine larvae fed a PL deficient
diet (Salhi et al., 1999; Morais et al., 2005), depending on the type and amount of
dietary PL and its relation to the dietary NL content. The dietary phospholipid
deficiency has been associated with the accumulation of fat droplets in the enterocytes
of the foregut in larval carp, suggesting that this type of fat tend to have a specific role
in the synthesis of VLDL as in mammals (Fontagné, 1996). This accumulation has led
to the suggestion that intestinal lipid inclusions are a temporary storage form re-
esterified fatty acids when the rate of lipid absorption exceeds the rate of lipoprotein
synthesis or because of an inability to metabolize lipids (Kjørsvik, et al., 1991).

Introduction
…………………………………………………………………………………………
18
The liver is an essential organ involved in the metabolism of substances absorbed by
the intestine, also involved in processing these subsatnces to be used by other tissues,
and it is the main lipid regulating place where involved in the synthesis and
degradation of fatty acids (Cross, 1993). The liver is a metabolically sensitive organ
that may be examined to determine potential side effects of lipidic metabolism
because the hepatic energy storage responds sensitively and rapidly to nutritional
changes in fish larvae (Hoehne-Reitan and Kjørsvik, 2004).
1.3.4 Phospholipid classes
The existing biochemical evidence suggests that pathways of phospholipids synthesis
are essentially the same as in mammals (Tocher, 1995), where phospholipids can be
synthesized de novo by two main mechanisms (Lykidis, 2007). One utilizes a cytidine
diphosphate (CDP) activated polar head group for attachment to 1,2- diacylglycerol
(DAG), and the other utilizes CDP-activated DAG and an inactivated polar head
group (Figure 1.6) (Tocher et al., 2008). They both initially proceed by esterification
of glycerol-3-phosphate with two activated fatty acids (acyl-CoA) to form
phosphatidic acid (PA). Action of PA phosphatase on PA, results in the production of
DAG, which can then react with CDP-choline or CDP-ethanolamine to produce PC
and PE, respectively (Tocher et al., 2008). Alternatively, CTP reacts with PA to form
CDP–DAG, which can then combine with serine and inositol to form PS and PI,
respectively (Figure 1.6).
Based on the few studies where single pure phosphoglycerides species have been
used, the rank order for efficacy appears to be phosphatidylcholine (PC),
phosphatidylinositol (PI), phosphatidylethanolamine (PE) and phosphatidylserine
(PS) (Izquierdo and Koven, 2010).

Introduction
…………………………………………………………………………………………
19
Figure 1.6 Biosynthetic pathways for the major phospholipid classes (Tocher et al.,
2008). CDP-Cho, CDP-choline; CDP–DAG, CDP-diacylglycerol; CDP-Etn, CDP-
ethanolamine; DAG, diacylglycerol; PA, phosphatidic acid: PC, phosphatidylcholine;
PE, phosphatidylethanolamine; PI, phosphatidylinositol; PS, phosphatidylserine; SM,
sphingomyelin. The enzymes are; 1, CDP– DAG synthases; 2, PA-phosphatases; 3, PI
synthase; 4, PS synthase; 5, CDP-choline:DAG phosphotransferase; 6, CDP-
ethanolamine:DAG phosphotransferase; 7, PE methyltransferase; 8, PS
decarboxylase; 9, SM synthase; 10 and 11, PS synthases via base exchange.
Among the different phosphoglycerides , PC seems to be particularly important, being
the main product of PL synthesis in fish enterocyte (Caballero et al., 2006a) and
comprising up to 95% of the PL found in VLDL (Lie et al., 1993). Besides, PC
induces the synthesis of apolipoprotein B in a higher extend than other
phosphoglycerides (Field et al., 1994; Field and Mathur, 1995). Enhanced lipoprotein
synthesis can be responsible for the growth promotion effect by increasing energy
flux from the intestinal mucosa into the blood (Seiliez et al., 2006). Thus, PC has
been found to promote growth better than other PL classes in several species
(Takeuchi et al., 1992; Kanazawa, 1993; Hadas, 1998; Geurden et al., 1997a) and
enhances feeding activity (Koven et al., 1998). Phosphatidylinositol (PI) has a rich
diversity of forms and functions within the cell besides being a structural component
of biomembranes (Sargent et al., 1989). Thus, PI acts as a precursor of second
messengers (inositol 3 phosphate, IP3) regulating calcium ions' entry into the cell
from the endoplasmatic reticulum (Cahu et al., 2003a; Tocher et al., 2008), as well as
a membrane anchor for a great variety of cell surface proteins. Therefore, PI is
Introduction
…………………………………………………………………………………………
20
involved in a signalling system controlling biological processes in early development
in vertebrates (Berridge and Irvine, 1989).
1.3.5 Effect of phospholipids on skeletal development
The skeletal system supports the body structural integrity during the development and
provides sites for muscle attachment, protects vital organs (Lall and Lewis-McCrea,
2007). Teleost fish show a skeletal tissue that is described as a continuous spectrum
ranging from connective tissue to cartilage and bone (Hall and Witten, 2007). The
mature skeleton is a metabolically active organ that undergoes continuous remodeling
by a process that replaces old bone with new bone (Figure 1.7). In healthy adults,
bone resorption and formation are balanced and a constant level of bone mass is
maintained (Kruger et al., 2010). Osteoclasts responsible for bone resorption originate
from haematopoetic stem cells know as monocytes, while osteoblasts responsible for
bone formation originate from bone marrow stromal cells (Kruger et al., 2010).

Introduction
…………………………………………………………………………………………
21
Figure 1.7 A simplified diagram of the differentiation of (A) osteoclast precursors into
osteoclasts and (B) osteoblast precursors into osteoblasts. PU.1, Transcription factor
PU.1; M-CSF, macrophage-colony stimulating factor; c-fms, c-fms genes; MITF,
microphthalmia-associated transcription factor; c-fos, c-fos gene; NF!", nuclear
factor !"; NFATc1, nuclear factor of activated T cells 1; TRAF6, tumor necrosis
factor receptor-associated factor-6; c-src, cellular-sarcoma gene; !v"3, !v"3-integrin;
RANKL, receptor activator of nuclear factor !" ligand; OPG, osteoprotegerin; Osx,
osterix; PPAR#2, peroxisome proliferator activated receptor #2 (Adapted from Kruger
et al., 2010).
Bone is a specialized vascularized connective tissue consisting of cells and a
mineralized extracellular collagen matrix that then mineralizes by deposition of
hydroxyapatite (Hall and Witten, 2007; Nordvick, 2007). During first feeding several
dietary nutrients play a central role in bone development and the posterior appearance
of skeletal malformations (Izquierdo et al., 2010, 2012). Several studies dealing with
the impact of first feeding on fish development showed that the dietary incorporation
of total phospholipid reduced malformation, especially twist of jaw and scoliosis, in

Introduction
…………………………………………………………………………………………
22
ayu larvae, (Plecoglossus altivelis) (Kanazawa et al., 1981). Geurden et al., (1998a)
suggested that in carp larvae dietary PL, specially PI, reduces skeletal deformity.
These findings were reinforced by Cahu et al., (2003a) who found that dietary PC/PI
ratio of 2.18 prevented deformities during larval development in European sea bass.
Moreover, ossification of the vertebral column in cod larvae, first observed at 21dph
in neural arches, occurred significantly earlier in groups fed diets containing PL than
in those fed neutral lipids (NL), when measured both by larval size and larval age
(Kjørsvik et al., 2009). The PL has a role as a precursor of second messenger
regulating calcium entry into the cells, and it is involved in a signaling system
controlling biological processes in the early development of vertebrates (Berridge and
Irvine, 1989). Sandel et al., (2010) found a very high correlation between
developmental age of gilthead seabream fed high PI and gene expression for
osteocalcin, a protein used as a marker for bone and cartilage growth, and has been
correlated with bone mineralization (Simes et al., 2008). PI, as the second messenger
inositol-3-phosphate (IP3), mobilizes calcium by regulating the entry of this ion into
the cell from the endoplasmic reticulum (Cahu et al., 2003a; Tocher et al., 2008).
These authors argued that dietary PI may be increasing the availability of calcium for
bone mineralization, which stimulates osteocalcin production and normal bone
development. In support of this, Nishimoto et al., (2003) found in carp that bone
hydroxyapatite binding of bone Gla protein (BGP) is enhanced in the presence of
calcium ions.
Changes in dietary PUFAs are reflected in the composition of various tissues,
including bone cells such as the osteoblasts (Atkinson et al., 1997; Moyad, 2005).
Several of the long chain poly-unsturated fatty acids (LCPUFAs) have been shown to
affect bone cells, i.e. osteoclasts and osteoblasts, via various cellular signaling
pathways or growth factors, thereby affecting bone formation, resorption and bone
density in animals or humans (Salari et al., 2008). Changing the balance of PUFAs
present in the membranes towards the n-3 fatty acids rather than n-6 fatty acids, shifts
the ratio of n-6/n-3 in the membranes and affects production of several cytokines,
which could affect bone resorption and formation. LCPUFAs have been shown to
affect cellular proteins and the receptor activator of nuclear factor k! (RANK), a
receptor found on the osteoclast, which controls osteoclastogenesis (Sun et al., 2003;
Coetzee et al., 2007).
A large number of studies have been done on animals that show that in growing

Introduction
…………………………………………………………………………………………
23
animals PUFAs affect bone mineral content, bone mass, femoral thickness and bone
area, seemingly affecting bone formation and growth. n-3 PUFAs also increase
alkaline phosphatase (ALP) activity in growing male rats as well as insulin-like
growth factor I (IGF-1) and insulin-like growth factor binding protein (IGFBP) levels
(Coetzee et al., 2007; Li et al., 1999).
Insulin-like growth factors (IGFs), especially IGF-I, are major bone-derived growth
factors and are believed to function as both systemic and local growth factors for bone
tissue. Once secreted and deposited in bone matrix, IGFs are released during
osteoclastic bone resorptive activity, acting in an autocrine or paracrine fashion to
stimulate new bone cell formation and matrix production (Watkins and Seifert, 2000).
IGF-I acts as a regulator of bone cell function as it stimulates the proliferation of pre-
osteoblasts, thereby increasing the number of cells capable of producing bone matrix.
In addition, IGF-I increases collagen expression while decreasing collagen
degradation, causing an anabolic effect in bone tissue (Schmid et al., 1992; Delany et
al., 1994).
Dietary PUFAs may up-regulate or down-regulate IGF-I production in bone via their
ability to modulate local concentrations of the arachidonic acid (AA) metabolite
prostaglandin E2 (PGE2) (Li et al., 1999; McCarthy et al., 1991; Delany et al., 1994).
PGE2 is derived from the AA and is the major prostaglandin in bone. It has been
shown to be a potent modulator of bone remodeling, affecting both bone resorption
(Collins and Chambers, 1991) and formation (Jee and Ma, et al., 1997; McCarthy et
al., 1991). PGE2 also promotes the expression of various IGF-binding proteins
(Schmid et al., 1992; McCarthy et al., 1994; DiBattista et al. 1996) suggesting that
PGE2 could keep IGF-1 available for stimulation of osteoblasts at a later phase of
bone remodeling (Schmid et al., 1992). McCarthy et al. (1991) suggested that the
ability of PGE2 to enhance osteoblastic IGF-I synthesis could explain its anabolic
potential, and furthermore suggests a role for PGE2 in coupled bone remodeling. The
anabolic effects of PGE2 may occur through stimulation of endogenous IGF-I
production by osteoblasts (Raisz et al., 1993) or by increased bone cell
responsiveness to IGF-I (Hakeda et al., 1993)
In conclusion, enriching diets with n-3 LCPUFA-rich may elevate or preserve bone
mass through increasing mesenchymal stem cell (MSC) number, through enhancing

Introduction
…………………………………………………………………………………………
24
expression of key transcription of factors required for bone formation such as core
binding factor !-1 (Cbf!1) and osterix (Watkins et al., 2003; Zhang et al., 2002) that
enhance differentiation of pre-osteoblasts into mature osteoblasts. Expression of both
Cbf!1 and osterix is enhanced by IGF-1, transforming growth factor-"1 (TGF- " 1),
bone morphogenic protein (BMP) and moderate amounts of PGE2 (Zhang et al.,
2002), all of which result from diets rich in n-3 LCPUFA.
1.4 Oxidative stress: Antioxidant defense mechanism
Lipid peroxidation products such as hydroxyperoxides, fatty acid hydroxides,
aldehydes and hydrocarbons which are implicated in several pathological conditions
damage cellular bio-membranes (Kanazawa, 1991, 1993) and subcellular membranes,
such as those of mitochondria, causing several pathological conditions in fish
(Kawatsu, 1969; Watanabe et al., 1970; Murai and Andrews, 1974; Sakai et al.,
1989). Fish have an endogenous antioxidant defense system (Filho et al., 1993) with a
wide range of antioxidant mechanisms to maintain an adequate oxidative balance.
When this balance tilts in favor of the oxidant agents, oxidative stress arises with
detrimental effects in molecules of great biological importance. Reactive oxygen
species (ROS) are free radicals and/or oxygen derivatives produced during all aerobic
biological systems and in normal cellular functions (Mates, 2000). The biological
handicap associated with oxidative stress could be estimated by a physicochemical
condition in which an increase in the steady-state levels of oxidative species e.g.
H2O2, HO-, O
-2, ONNO
-, R
- y ROO
- (Ansaldo et al., 2000)
increase in ROS leads to random cellular damages on the different cellular
components. If continued along time will cause disease or even cell death.
1.4.1 Enzymatic defenses
The antioxidant defense system mostly formed by radical scavenging enzymes, play
an important role in physiological antioxidant protection (Blazer, 1982). These
antioxidants defense mechanisms to detoxify reactive oxygen species have evolved to
counteract the potentially deleterious effects of activated oxygen (Yu, 1994). Among
antioxidant enzymes, superoxide dismutase (SOD) catalyzes the superoxide anion
dismutation to molecular oxygen and hydrogen peroxide; catalase (CAT) breaks

Introduction
…………………………………………………………………………………………
25
down hydrogen peroxide to molecular oxygen and water; glutathione peroxidase
(GPX) detoxifies hydrogen peroxide into water, or organic peroxides into their
corresponding stable alcohols, by oxidizing the reduced glutathione (GSH) into its
oxidized form (GSSG); finally, glutathione reductase (GR) catalyzes the reduction of
GSSG into GSH (Halliwell and Gutteridge, 2007). The SOD plays a crucial role since
it is the first enzyme to respond to oxygen radicals, preventing initialization of the
radical chain reaction that the superoxide anion produces (McCord and Fridovich,
1969; Winston and Di Giulio, 1991). All these enzymes, which are very important in
antioxidant defense mechanisms, have been detected in most fish species (Rudneva,
1997). The activities of antioxidant defense enzymes showed variations in different
organs of fish (Wdzieczak et al., 1982; Lemaire et al., 1993), depending upon feeding
behavior (Radi and Markovics, 1988), feeding period (Mourente et al., 2002),
ecological conditions (Winston and Di Giulio, 1991) and dietary antioxidant content.
All these antioxidant mechanisms are responsible for maintaining an adequate
“oxidative balance”. When this balance tilts in favor of the oxidant agents, due to
excessive generation of these compounds, or a weakening of antioxidant defenses, or
both occurring simultaneously, “oxidative stress” arises (Sies, 1985; Tocher et al.,
2002).
Antioxidants may be found in the cell plasma, mitochondria or cell membranes
(Figure 1.8) and can act at different stages in the oxidation process and some may
have more than one mechanism of action. They can exert their action by different
mechanisms such as breaking the chain of an initiated sequence, scavenging singlet
oxygen or decreasing local O2 concentrations.

Introduction
…………………………………………………………………………………………
26
Figure 1.8 Antioxidants mechanisms within the cell. Adapted from Machlin and
Bendich (1987). Catalase (CAT); Superoxide dismutase (SOD); Glutathione
peroxidase; (GPX); Reduced glutathione (GSH).
1.4.2 Non enzymatic defenses
An antioxidant is a substance that, when present at low concentrations compared to
those of a prone to oxidation substrate, is able to interact with free radicals to
terminate the reaction (Halliwell and Gutteridge, 1990). Adequate levels of
antioxidant compounds can be provided by nutritional supplements, including
vitamins such as vitamin E and C or minerals such as selenium, that establish a
second line of defense (Sen, 1995). These supplements will promote maximum
benefits from these nutrients and avoid lipid oxidation problems that can cause
pathologies (Sakai et al. 1989) including cellular damages (Halliwell and Gutteridge,
1996), muscles injuries (Betancor et al., 2011; 2012a), negative growth, bad feed
intake and poor development, increased incidence of deformities (Lewis-McCrea and
Lall, 2007), and, in general, oxidative damage to molecules of great biological
importance such as lipids, proteins, carbohydrates and DNA causing alterations that
can lead to cell death (Winston and Di Giulio, 1991; Halliwell and Gutteridge, 2007).

Introduction
…………………………………………………………………………………………
27
1.4.2.1 Vitamin E (!-tocopherol)
The vitamin E has a great importance as exogenous component in the diet of
aquaculture fish acting as an antioxidant defense in reduction of lipid peroxidation
products and free radicals scavengers (Machlin, 1984; Betancor et al., 2011).
Mourente et al. (2002) showed a reduction of peroxidation products in liver of
gilthead seabream fed oxidized oil fed diets supplement with vitamin E in comparison
with those fed diets lacking this vitamin.
Vitamin E is a lipid soluble vitamin that is absorbed from the digestive tract in
association with fat molecules. Putnam and Comben (1987) showed that vitamin E is
a structural component of cell membranes, where it acts as an antioxidant factor for
phospholipids by chain-breaking antioxidant process (Sargent et al., 1997). Also, it
has role in maintaining flesh quality in rainbow trout (Frigg et al., 1990;
Chaiyapechara et al., 2003; Yildiz, 2004), Atlantic salmon (Salmo salar) (Hamre et
al., 1998; Scaife et al., 2000), turbot (Psetta maxima) (Ruff et al., 2003, 2004) and sea
bass (Gatta et al., 2000; Pirini et al., 2000), improving immunity, increasing the
resistance of red blood corpuscles to haemolysis, and permeability of capillaries and
heart muscle (Halver, 2002). Besides, it has been proposed to be the most important
factor in maintaining the post-mortem membrane stability of fish fillet (Baker, 1997).
Dietary requirement of vitamin E has been studied in different fish species (NRC,
1993) and recommendations include 120 mg kg-1
diet (Hamre and Lie, 1995) for
Atlantic salmon, 30 to 50 mg kg-1
diet for channel catfish (Ictalurus punctatus)
(Murai and Andrews, 1974; Wilson et al., 1984), 200 to 300 mg kg-1
diet for common
carp (Cyprinus carpio) (Watanabe et al., 1977), 1200 mg kg-1
for gilthead seabream
juveniles (Ortuño et al., 2000) and 99 mg kg-1
for mrigal fry (Cirrhinus mrigala)
(Paul et al., 2004). The level of 250 mg !-tocopherol kg-1
diet is sufficient to meet the
requirements for successful reproduction in gilthead seabream (Fernández-Palacios et
al., 1998).
Little is known about the precise vitamin E requirements in marine fish larvae, but
Atalah et al. (2008) used 1.5 and 3.0 g kg-1
dry diet of vitamin E for gilthead
seabream and sea bass larvae, and suggested an optimal level of 3 g kg-1
because this
high level reduced mortality after stress. In the same study, the high vitamin E level
also alleviated muscular lesions caused by excessive dietary DHA (Betancor et al.,
2011). The results of these studies are therefore in line with the general opinion that

Introduction
…………………………………………………………………………………………
28
vitamin E in larval diets should be above 1 g kg-1
, while the requirement given by
NRC (1993) for juvenile fish is 50 mg kg-1
. However, when stress and immune
responses are used to measure requirements of these vitamins, higher estimations of
dietary optima are most often found, also in juvenile and adult fish (Hamre, 2011).
Figure 1.9 Proposed mechanism for the reaction of a-tocopherol with oxidizing lipids.
The peroxyl radical group formed during lipid oxidation is polar and floats to the
surface of the membrane where it can react with a- tocopherol, rendering a lipid
hydroperoxyde and the tocopheroxyl radical (Buettner, 1993).
The effect of !-tocopherol in skeletal development has been studied extensively in
terrestrial mammals but not in fish. Vitamin E is important for proper skeletal
development (Xu et al., 1995; Jilka et al., 1996) where it associates with the lipid
bilayer of bone cells allowing it to be the first line of defense against free radicals
(Arjmandi et al., 2002). The studies on the effect of ROS on fish bone development

Introduction
…………………………………………………………………………………………
29
are scarce. Lewis-McCrea and Lall (2007) found an increase in the incidence of
scoliosis in Atlantic halibut juveniles feed increasing levels of oxidized oils. This may
be a result of lipid peroxidation products effect, which stimulate osteoclastic
differentiation and inhibit osteoblastic activity that may cause bone resorption and
lead to improper bone formation/abnormalities (Tintut et al., 2002; Parhami, 2003;
Kruger et al., 2010). The antioxidant mechanism of !-tocopherol intercepts the
peroxyl radical (ROO-) more rapidly than PUFA by donating its phenolic hydrogen
atom to the radical and converting it to a hydroperoxide product (Figure 1.9), thereby
breaking the chain of reactions involved in lipid auto-oxidation. Result of this reaction
is the tocopheroxyl radical that is sufficiently stable to be unable to continue the
oxidation chain and, instead, is removed from the cycle by reaction with another
peroxyl radical to form inactive non-radical products.
1.4.2.2 Selenium
Research on mineral requirements in fish larvae only started after 2005 and the
number of publications is quite small. Selenium (Se) is a trace mineral and an
essential micronutrient for vertebrates (Johansson et al., 2005). In fish, Se is also
involved in thyroid hormone and insulin function, maintenance of fertility as well as
regulation of cell growth (Lall, 2002; Kohlmeier, 2003). One of the major Se function
is as a component of the selenoproteins GPX, isoenzymes that protect lipid
components and membranes at both the cellular and subcellular level from oxidative
damage (Arteel and Sies, 2001). Se deficiency can lead to oxidative stress in organs
(Gatlin et al., 1986; Bell et al., 1986, 1987), reduced growth (Wang and Lovell, 1997)
and increased mortality (Gatlin et al., 1986; Bell et al., 1987) in several fish species
Penglase et al., (2010) fed rotifers enriched with up to 3 mg selenium kg-1
dry weight
diet to cod larvae. They found only minor effects on growth and survival, but gene
expression and activity of the glutathione peroxidases were enhanced by the
enrichment, indicating a requirement of selenium above the control level.
The importance of Se to oxidative stress is due to its role in active sites of the
antioxidant enzymes glutathione peroxidase and phospholipid hydroperoxide
glutathione peroxidase (Felton et al., 1996), which catalyze the reduction of
hydroperoxides and peroxides to less reactive alcohols and water (Felton et al., 1996).
It must be taken into account that Se requirements of fish vary with the form of

Introduction
…………………………………………………………………………………………
30
selenium ingested, PUFA and vitamin E content of the diet (Lall, 2002).
As illustrated above, direct measurements of vitamin and mineral requirements in fish
larvae are fragmented and scarce, as each nutrient is measured only in a few species
or not at all. More work is therefore needed to conclude on whether micronutrient
requirements in fish larvae are different from those in juvenile and adult fish
1.8 Objectives
Since good quality fry is essential for the further development of marine fish culture
and the success of fry high production is greatly affected by the nutritional quality of
the initial larval diets (Kolkovski et al., 2009; Izquierdo et al., 2000), a main objective
in fish larval nutrition is to formulate an effective compound diet able to substitute
live preys (Watanabe and Kiron, 1994). Dietary phospholipids are fundamental
components of these weaning diets (Koven et al., 1995; Izquierdo, 1996; Fontagné et
al., 2000; Izquierdo and Koven, 2010) due to their essential roles in larval
development (Izquierdo and Koven, 2010). However, despite there are many studies
denoting the importance of dietary PL, few of them have aimed to specifically
determine the quantitative PL requirements testing at least 5 different levels.
Moreover, the type of phospholipid used is determinant of its nutritional value, but
few studies have been able to compare different sources at several levels. Finally,
although increase of n-3 HUFA rich PL may increase the oxidative risk, these aspects
have not been yet studied and no information is neither published about the potential
interaction of PL with antioxidant nutrients. Therefore, the main objective of this
thesis was to define the phospholipid requirements of gilthead seabream larvae and to
improve the current knowledge on the effects of this nutrients on growth, survival,
stress resistance, digestive enzymes activity, skeleton formation and mineralization
and oxidative metabolism. To achieve this goal the following objectives were
formulated:
1- To determine the optimum dietary levels of krill phospholipids (KPL) for
seabream (Sparus aurata) larvae, and its influence on larval development and
digestive enzymes activity.
2- To define the optimum dietary levels of soybean lecithin (SBL) for seabream
(Sparus aurata) larvae, and its influence on larval development and digestive
enzymes activity.

Introduction
…………………………………………………………………………………………
31
3- To compare the effectiveness of KPL vs SBL lecithin in early weaning
microdiets for seabream (Sparus aurata) larvae on culture performance,
skeleton malformation, bone mineralization, and molecular markers of
oxidative status and bone development.
4- To evaluate the combined effect of graded levels of !-tocopherol with KPL or
SBL in early weaning microdiets for seabream (Sparus aurata) larvae on
culture performance, skeleton malformation, bone mineralization, and
molecular markers of oxidative status and bone development.
5- To assess the effect of graded levels of Se derived yeast with dietary KPL in
early weaning microdiets for seabream (Sparus aurata) larvae on culture
performance and biomarkers of oxidative status and bone development.

Materials and methods
…………………………………………………………………………………………..
32
Chapter 2: Materials and methods
2.1 Larvae
2.1.1 Gilthead seabream larvae
Gilthead seabream larvae were obtained from natural spawnings from Instituto
Canario de Ciencias Marinas (Grupo de Investigación en Acuicultura (GIA), Las
Palmas de Gran Canaria, Spain). Larvae previously fed rotifers (Brachinous
plicatilis) enriched with DHA Protein Selco®
(INVE, Dendermond, Belgium) until 16
dph, were randomly distributed in experimental tanks at a density of 2100 larvae tank-
1 and fed one of the diets tested in triplicate for 15 days (Chapters 3 and 4) or 30 days
(Chapters 5, 6 and 7).
2.2 Experimental conditions
The experimental tanks used had a volume of 200 L and a cylinder shape with a
conical bottom and were made of light grey colour painted fibreglass. Tanks were
supplied with filtered seawater (37 ppm salinity) at an increasing rate of 0.4 - 1.0 L
min-1
to assure good water quality during the entire trial. Water entered from the tank
bottom and exited from the top to ensure water renewal and maintain high water
quality. Temperature, pH and water quality were daily tested. Seawater was
continuously aerated (125 ml min-1
). Photoperiod was kept at 12h light: 12h dark, by
fluorescent daylights that provided a light intensity of 1700 lux (digital Lux Tester
YF-1065, Powertech Rentals, Western Australia, Australia).
2.3 Diets and feeding
2.3.1 Rotifers
Rotifers (Brachionus plicatilis) were produced in 1700 L cylindrical containers
provided with a central aeration through a porous stone. The culture medium included
80% seawater and 20% freshwater. Rotifers from the Brachionus plicatilis strain S-1
(150-250 µm lorica length) were inoculated at an initial density of 100 ind ml-1
. They
were fed daily with 0.4 g fresh yeast extract for 106 ind divided in two doses. Every

Materials and methods
…………………………………………………………………………………………..
33
four days rotifers were carefully filtered through a 64 µm mesh, rinsed in water, the
container washed and the culture re-suspended in clean water at culture densities of
100-250 ind ml-1
. The rotifers fed to seabream larvae when green water was used in
the larval rearing were previously enriched for 6 h at densities of 300 rotifers ml-1
with emulsified DHA Protein Selco®
(INVE, Dendermond, Belgium) at a ration of
0.125 g l-1
ind divided in two daily doses. Rotifers were used to feed seabream larvae
during green water culture and during the first two days of trial as co-feeding with the
experimental microdiets.
2.3.2 Microdiets
2.3.2.1 Microdiets formulation
The experimental microdiets (pellet size 250-500 !m) included krill oil (Qrill, high
PL, Aker BioMarine, Fjordalléen, Norway) or soybean lecithin (Acrofarma,
Barcelona, Spain) as sources of PL. Vitamin E, in the "-tocopheryl acetate form, was
obtained from Sigma-Aldrich (Madrid, Spain). An organic form of selenium extracted
from yeast (Sel-Plex, Alltech Inc, Lexington, KY) was employed. The desired lipid
content was completed with a non-essential fatty acid source, oleic acid (Merck,
Darmstadt, Germany). The protein source used was squid meal (Riber & Son, Bergen,
Norway), which in some experimental diets was defatted (3 consecutive times with a
chloroform:meal ratio of 3:1) to allow a better control of the microdiet lipid content.
2.3.2.2 Microdiets preparation
The microdiets were prepared by mixing squid powder, attractants mixture which
prepared according to Kanazawa et al. (1989), and the hydro and lipo-soluble
vitamins mixture and minerals mixture which prepared according to Teshima et al.
(1982) (Table 2.1). The squid powder and water-soluble components of attractants
and hydro-soluble vitamins were mixed well in a mortar, and then the lipids and fat-
soluble vitamins were combined to obtain a homogeneous mix, which was afterwards
merged with the powder mix. Finally, gelatine dissolved in warm water was added to
the previously mixed ingredients to form a paste that was compressed pelleted
(Severin, Suderm, Germany) and dried in an oven at 38 ºC for 24 h (Ako, Barcelona,
Spain). Pellets were ground (Braun, Kronberg, Germany) and sieved (Filtra,

Materials and methods
…………………………………………………………………………………………..
34
Barcelona, Spain) to obtain several particle sizes between 250 and 500 !m. Diets
were prepared and analyzed for proximate and fatty acid composition at GIA
laboratories.
Table 2.1 Mix of attractants, minerals and vitamins of the experimental microdiets
Vitamins mg 100g-1
DW Attractants mg 100g-1
DW
Hydro-soluble vitamins Inosine 5-monophosphate 500
Cyanocobalamin 0.030 Betaine 660
Astaxanthin 5.000 L-Serine 170
Folic Acid 5.440 L-Tyrosine 170
Pyridoxine-HCl 17.280 L-Phenilalanine 250
Thiamine-HCl 21.770 DL-Alanine 500
Riboflavin 72.530 L-Sodium aspartate 330
Calcium Pantothenate 101.590 L-Valine 250
p-aminobenzoic acid 145.000 Glycine 170
Ascorbic polyphosphate 180.000 Total 3000
Nicotinic acid 290.160 Minerals mg 100g-1
DW
myo-Inositol 1450.900 NaCl 215.133
Subtotal 2289.700 MgSO4.7H2O 677.545
NaH2PO4.H2O 381.453
Lipo-soluble vitamins K2HPO4 758.949
Retinol acetate 0.180 Ca(H2PO4).2H2O 671.610
Ergocalciferol 3.650 FeC6H5O 146.884
Menadione 17.280 C3H5O3.1/2Ca 1617.210
"-Tocopherol acetate 150.000 Al2(SO4)3.6H2O 0.693
Subtotal 171.110 ZNSO4.7H2O 14.837
CuSO4.5H2O 1.247
Choline chloride 2965.800 MnSO4.H20 2.998
Total 5426.610 KI 0.742
CoSO4.7H2O 10.706
Total 4500.007

Materials and methods
…………………………………………………………………………………………..
35
2.3.3 Feeding
Diets were manually supplied every 45 min from 8:00 to 19:00. Larvae were fed with
rotifers twice a day during the first two days of experimental feeding at a density of 1
individual ml-1
. To guarantee feed availability, daily dry supply was initially 2.5 g and
increased 0.5 g each week. Larvae were observed under the binocular microscope to
determine feed acceptance. If apparent feed intake differences were observed along
different experimental diets, diet acceptance was determined calculating the
percentage of gut occupation of the microdiet by image analysis in pictures of 30
larvae/tank. For such study, pictures of the, abdominal cavity of 30 larvae per tank
were taken (Leica Wild M3Z, Optotek, California, USA).
2.4 Sampling
2.4.1 Biological parameters
At the beginning, middle and end of each experiment, samples of 30 live seabream
larvae unfed for 12 h were taken to determine total length and whole body dry weight.
2.4.2 Proximate analysis
To analyze biochemical composition, all the remaining larvae in each tank, after a
starving period of 12 h, were collected, washed with distilled water and kept at -80ºC
in air free labelled plastic sampling bags until analysis. Prior to the beginning of the
dietary experiments, seabream larvae samples were taken to analyze initial
biochemical composition.
2.4.3 Digestive enzymes
To analyze digestive enzymes activity, 15 fresh larvae tank-1
were collected, washed
with distilled water and kept at -80ºC in 2ml eppendorf tubes until analysis.
2.4.4 Histological studies
At the beginning, intermediate and final sampling points, 30 seabream larvae from
each tank were collected and fixed in 10% buffered formalin.
Materials and methods
…………………………………………………………………………………………..
36
2.4.5 Molecular biology
At the beginning and final sampling points, around 100 mg of unfed seabream larvae
were collected, washed in Diethyl pyrocarbonate (DEPC) water and conserved in 500
µl of RNA Later (Sigma-Aldrich, Madrid, Spain) overnight at 4ºC, then RNA Later
was removed and samples kept at -80ºC until RNA extraction.
2.4.6 Activity test and survival
At the end of the experiments an activity test was conducted by handling 20 larvae
tank-1
out of the water in a scoop net for 1-1.5 min and, subsequently, allocating them
in another tank supplied with clean seawater and aeration, to determine survival after
24 h. Final survival was calculated by individually counting all the alive larvae tank-1
at the end of the experimental trials.
2.4.7 Growth
Growth was determined by measuring total length and dry body weight. Total length
of 30 anesthetised larvae from each tank was measured in a Profile Projector (V-12A
Nikon, Nikon Co., Tokyo, Japan) at each sampling point. Whole body weight was
determined by 3 replicates of 10 starved larvae washed with distilled water and dried
in a glass slide at an oven at 110ºC, for approximately 24 h, followed by 1 h periods
until constant weight was reached.
2.5 Biochemical analysis
2.5.1 Proximate analysis
2.5.1.1 Moisture
Moisture content was determined by oven drying until constant weight at
110ºC, with a first 24 h drying period, followed by 1 h periods until weight was not
reduced any further. Sample weight (approximately 100 mg) was recorded before
drying and after each drying period, following the cooling until room temperature in a
desiccator. Moisture was expressed as a percentage of the weight according to

Materials and methods
…………………………………………………………………………………………..
37
Official Methods of Analysis (A.O.A.C., 1995), using the following equation:
Where:
A = Weight of empty flask
B = Weight of wet sample + flask
C = Weight of dry sample + flask
2.5.1.2 Ash
Ash content was determined in 200 mg samples by complete combustion in an oven
at a temperature of 450ºC (A.O.A.C., 1995).
2.5.1.3. Proteins
Proteins were estimated from the total nitrogen present in the sample, using the
Kjeldhal method (A.O.A.C, 1995). After digestion of the sample (!250 mg) with
concentrated sulphuric acid at a temperature of 420ºC, nitrogen was distillate and
determined by colorimetric methods. Then total nitrogen content was converted to
total crude protein value by multiplying by the empirical factor 6.25.
2.5.1.4 Total lipids
Lipids were extracted following the method of Folch et al. (1957). The method starts
taking a sample amount between 50-200 mg and homogenising it in an Ultra Turrax
(IKA-Werke, T25 BASIC, Staufen Germany,) during 5 min in a solution of 5 ml of
chloroform: methanol (2:1) with 0.01% of butylated hydroxytoluene (BHT). The
resulting solution was filtered by gravimetric pressure through glass wool and 0.88%
KCl added to increase the water phase polarity. After decantation and centrifugation
at 2000 rpm during 5 min the watery and organic phases were separated. Once the
watery phase was eliminated, the solvent was dried under nitrogen atmosphere and
subsequently total lipids weighed.
AB
ACABMoisture
!
!!!!=
)()(100(%)

Materials and methods
…………………………………………………………………………………………..
38
2.5.1.4.1 Lipid classes
Separation of lipid classes was performed by double development high-performance
thin layer chromatography (HPTLC) using the method described elsewhere (Olsen
and Henderson, 1989). The lipid classes were visualized by charring at 160oC for 15
min after spraying with 3% (w/v) aqueous cupric acetate containing 8% (v/v)
phosphoric acid and quantified by densitometry using a CAMAG-3 TLC scanner
(Version Firmware 1.14.16; CAMAG, Muttenz, Switzerland) with winCATS Planar
Chromatography Manager. The identities of individual lipid classes were confirmed
by comparison with reference to the Rf values of authentic standards run alongside
samples on HPTLC plates and developed in the same conditions. Total
glycerophospholipids, including lysophosphatidylcholine (LPC), phosphatidylcholine
(PC), phosphatidylethanolamine (PE), phosphatidylinositol (PI) and
phosphatidylserine (PS), were collectively isolated from HPTLC plates and subjected
to acid-catalysed transesterification according to the method of Christie (1982).
Extraction and purification was performed as described by Tocher and Harvie (1988).
2.5.1.4.2 Fatty acid methyl esters preparation and quantification
Fatty acid methyl esters (FAME) were obtained by acid transmethylation of total lipid
with 1% sulphuric acid in methanol following the method of Christie (1982). The
reaction was conducted in dark conditions under nitrogen atmosphere for 16 h at
50ºC. Afterwards, fatty acid methyl esters were extracted with hexane:diethyl ether
(1:1, v/v) and purified by adsorption chromatography on NH2 Sep-pack cartridges
(Waters S.A., Massachussets, USA) as described by Christie (1982). Fatty acid
methyl esters were separated by GLC (GC-14A, Shimadzu, Tokyo, Japan) in a
Supercolvax-10-fused silica capillary column (length:30 mm, internal diameter: 0.32
mm; Supelco, Bellefonte, USA) using helium as a carrier gas. Column temperature
was 180ºC for the first 10 min, increasing to 215ºC at a rate of 2.5ºC min-1 and then
held at 215ºC for 10 min, following the conditions described in Izquierdo et al.
(1992). Fatty acid methyl esters were quantified by FIED and identified by
comparison with external standards and well-characterized fish oils (EPA 28, Nippai,
Ltd. Tokyo, Japan).

Materials and methods
…………………………………………………………………………………………..
39
2.5.2 Digestive enzymes activity
Enzymes activity was determined at the department of Applied Biology (Escuela
Politécnica Superior, Universidad de Almería, España). The alkaline phosphatase,
trypsine and lipase activities were expressed as relative fluorescence units (RFU) and
PLA2 was expressed as units (U); one unit will hydrolyze 1.0 µmole of soybean L-!-
phosphatidylcholine to L-!-lysophosphatidylcholine and a fatty acid per minute. The
larvae were homogenized by a sonicator ultrasound (Misonix Microson XL2007
Ultrasonic Homogenizer) on ice in 110"l of high-purified water, centrifuged and the
supernatant used as the sample stock solution. Alkaline phosphatase activities were
quantified by fluorometric assay using a spectrofluorometer (Thermolab Systems;
Helsinki, Finland) at excitation wavelengths of 358 nm and emission wavelengths of
455nm. After preparation of 140 "l of reaction buffer at pH 10.4 (100 mM Glycine, 1
mM MgCl2, 1mM ZnCl2), and 50 "l of substrate stock solution (200 "M of 6,8
Difluoro-4 methyllumbelliferyl phosphate (DiFMUP) solution in DMSO, the reaction
was started by adding 10 "l of the sample stock solution and the kinetic curves were
recorded for 20 min (Gee et al., 1999).
Trypsine activities were quantified by a fluorometric assay using spectrofluorometer
at excitation wavelengths of 380 nm and emission wavelengths of 440nm. After
preparation of 195 "l of reaction buffer pH 8.0 (50mM Tris-HCl, 10 mM CaCl2), and
5 "l of of substrate stock solution (20 "M of Boc-Gln-Ala-Arg-7 amido-4
methylcoumarin hydrochloride in DMSO), the reaction was initiated by adding 10 "l
of the sample stock solution and the kinetic curves were recorded for 5 min (Rotllant
et al., 2008).
Neutral lipase activities were quantified by a fluorometric assay using
spectrofluorometer at excitation wavelengths of 355 nm and emission wavelengths of
460nm. Firstly, 247.4 "l of 0.1 M phosphate reaction buffer pH 7.0 (19.5 ml of 0.2M
phosphate monobasic (NaH2PO4 1 H2O) solution and 30.5ml of 0.2M phosphate
dibasic (NaH2PO4 7 H2O) solution were mixed and completed up to 100 ml by adding
50 ml high-purified water), then 2.6"l of substrate stock solution (40 mM of
4Methylumbelliferol butyrate (MUB) in N,N Dimethyl formamide (DMSO) was
added and then reaction was started by adding10 "l of the sample stock solution.
Kinetics curves were recorded for 5 min (Rotllant et al., 2008).

Materials and methods
…………………………………………………………………………………………..
40
The PLA2 activities were quantified by fluorometric assay using spectrofluorometer
at excitation wavelengths of 377 nm and emission wavelengths of 450nm. First 160 !l
of reaction buffer pH 8 (50mM Tris-HCl,100 mM NaCl, 2mM NaN3, 5!g/ml bovine
serum albumin, and 10 !m 1-anilinonaphthalene-8-sulfonate, and 20 !l of substrate
stock solution (50 !l of 1,2-dimyristoyl-sn-glycero-3-phosphocholine solution in 40
mM, methanol mixed with 15 !l deoxycholic acid solution in 40 mM, methanol and
quickly injected into 1ml high purified water, stirred for 1 min and sonicated for 2
min) and 10 !l of 100 mM CaCl2 solution were incubated at 25 °C for 10 min. The
reaction was started by adding 20 !l of the sample stock solution and the kinetic
curves were recorded for 40 min (Huang et al., 2006).
2.6 Measurement of thiobarbituric reactive substances (TBARS):
The thiobarbituric reactive substances (TBARS) were determined in triplicated
samples using a method adapted from Burk et al. (1980). Approximately 20-30 mg of
larval tissue per sample was homogenized in 1.5 ml of 20% trichloroacetic acid (w/v)
containing 0.05 ml of 1% BHT in methanol using a rotating probe homogeniser
(Ultra-Turrax; IKA-Werke, T25 BASIC, Staufen, Germany). To this homogenate
2.95 ml of freshly prepared 50mM thiobarbituric acid solution were added before
mixing and heating for 10 min at 100ºC. After cooling and removing protein
precipitates by centrifugation (Sigma 4K15, Osterode and Harmz, Germany) at 2000
X g, the supernatant was read in a spectrophotometer (Evolution 300, Thermo
Scientific, Cheshire, UK) at 532 nm. The absorbance was recorded against a blank at
the same wavelength. The concentration of TBA-malondialdehyde (MDA) expressed
as nmol MDA per g of tissue was calculated using the extinction coefficient 0.156
µM-1
cm-1
applying the following formula:
nmol MDA g tissue-1
= A
0.156!
50
Sample weight
2.7 Selenium determination
Total selenium concentration was measured in total larvae and feeds. Samples were
acidified in a microwave digestor (MarsXpress, CEM, Kamp-Lintfort, Germany) with
5 ml of 69% pure nitric acid. The resultant solution was poured after digestion into a

Materials and methods
…………………………………………………………………………………………..
41
10 ml volumetric flask and made up to volume with distilled water. A total of 0.4 ml
of this solution was then added to a 10 ml sample tube, 10 µl of the internal standard
(Ga and Sc, 10 ppm) included and 0.3 ml of methanol added. The tubes were made up
to volume with distilled water and total selenium measured in a collision/reaction cell
ICP-MS (Thermo Scientific, Cheshire, UK) using argon and hydrogen as carrier gas.
Collision/reaction cell ICP-MS is a technique that uses ion-molecule chemistry to
eliminate polyatomic interferences from the mass spectrum of an ICP-MS. In this
way, this technique has enabled ICP-MS to become virtually free of polyatomic
interferences. Selenium determination was performed in the Institute of Aquaculture,
University of Stirling (Scotland, UK).
2.8 Whole mount staining for skeleton studies
Staining procedures with alizarin red (Table 2.2) were conducted to evaluate the
skeletal anomalies and vertebral mineralization (Vandewalle et al.1998).
Table 2.2 Staining protocol according to Vandewalle et al. (1998)
STEP DURATION
Significance of
the step Solutions
Alcian Blue
(8GX) 2 hours
Proteoglycan
(cartilage)
Staining
For 100 mL:
80 mL alchol 95%
20 mL glacial acetic acid
10 mg Alcian blue
Ethanol 95% 1 hour
Hydra
tati
on
For 100 mL:
95 mL absolute ethanol
5 mL distilled water
Ethanol 95% 1 hour
Ethanol 95% 1 hour
Ethanol 75% 1 hour
For 100 mL:
75 mL absolute ethanol
15 mL distilled water
Ethanol 40% 1 hour
For 100 mL:
40 mL absolute ethanol
60 mL distilled water
Ethanol 15% 1 hour
For 100 mL:
15 mL absolute ethanol
75 mL distilled water
Distilled water 1 hour or all night
Trypsine solution 1 hour
Tis
sue
dig
esti
on 90 mg pancreas porcine
trypsine;
70 mL distilled water
30 mL saturated solution of
Na2B4O7
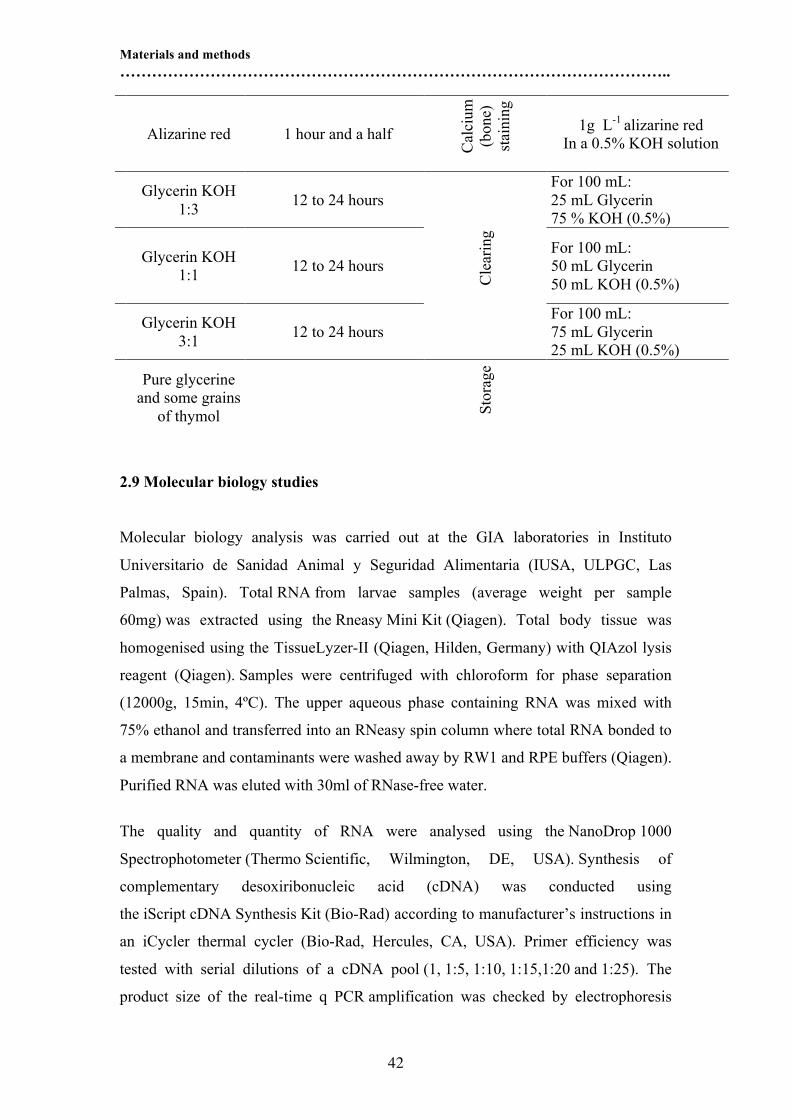
Materials and methods
…………………………………………………………………………………………..
42
2.9 Molecular biology studies
Molecular biology analysis was carried out at the GIA laboratories in Instituto
Universitario de Sanidad Animal y Seguridad Alimentaria (IUSA, ULPGC, Las
Palmas, Spain). Total RNA from larvae samples (average weight per sample
60mg) was extracted using the Rneasy Mini Kit (Qiagen). Total body tissue was
homogenised using the TissueLyzer-II (Qiagen, Hilden, Germany) with QIAzol lysis
reagent (Qiagen). Samples were centrifuged with chloroform for phase separation
(12000g, 15min, 4ºC). The upper aqueous phase containing RNA was mixed with
75% ethanol and transferred into an RNeasy spin column where total RNA bonded to
a membrane and contaminants were washed away by RW1 and RPE buffers (Qiagen).
Purified RNA was eluted with 30ml of RNase-free water.
The quality and quantity of RNA were analysed using the NanoDrop 1000
Spectrophotometer (Thermo Scientific, Wilmington, DE, USA). Synthesis of
complementary desoxiribonucleic acid (cDNA) was conducted using
the iScript cDNA Synthesis Kit (Bio-Rad) according to manufacturer’s instructions in
an iCycler thermal cycler (Bio-Rad, Hercules, CA, USA). Primer efficiency was
tested with serial dilutions of a cDNA pool (1, 1:5, 1:10, 1:15,1:20 and 1:25). The
product size of the real-time q PCR amplification was checked by electrophoresis
Alizarine red 1 hour and a half
Cal
cium
(bone)
stai
nin
g
1g L-1
alizarine red
In a 0.5% KOH solution
Glycerin KOH
1:3 12 to 24 hours
For 100 mL:
25 mL Glycerin
75 % KOH (0.5%)
Glycerin KOH
1:1 12 to 24 hours
Cle
arin
g
For 100 mL:
50 mL Glycerin
50 mL KOH (0.5%)
Glycerin KOH
3:1 12 to 24 hours
For 100 mL:
75 mL Glycerin
25 mL KOH (0.5%)
Pure glycerine
and some grains
of thymol
Sto
rage

Materials and methods
…………………………………………………………………………………………..
43
analyses using PB322 cut with HAEIII as a standard. Real-time quantitative PCR
was performed in an iQ5 Multicolor Real-Time PCR detection system (Bio-Rad,
Hercules, CA, USA) using !-actin as the house-keeping gene in a final volume of
20ml per reaction well, and 100ng of total RNA reverse transcribed to complementary
cDNA. Each gene sample was analysed once per gene. The PCR conditions were the
following: 95ºC for 3min 30sec followed by 40 cycles of 95ºC for 15sec, 61ºC for
30sec, and 72ºC for 30sec; 95ºC for 1min, and a final denaturing step from 61ºC to
95ºC for 10sec. Data obtained were normalised and the Livak method (2–""Ct
) used to
determine relative mRNA expression levels. Gilthead seabream specific gene primers
were designed after searching the NCBI nucleotide database and using the
Oligo 7 Primer Analysis software (Molecular Biology Insights, Cascade, CO, USA).
Detailed information on primer sequences and accession numbers is presented in table
2.3.
Table 2.3 Sequences of forward and reverse primers (5´-3´) for real-time quantitative-
PCR of seabream genes
Gene Primers Accession n
o
Catalase(CAT) Forward primer: 5´-ATGGTGTGGGACTTCTGGAG-3´
Reverse primer: 3´-AGTGGAACTTGCAGTAGAAAC-5´
FJ860003
Superoxide
dismutase (SOD)
Forward primer: 5´- AAGAATCATGGCGGTCCTACTGA-3´
Reverse primer: 3´- TGAGCATCTTGTCCGTGATGTCT -5´
AJ937872
Glutathione
peroxidase (GPX)
Forward primer: 5´- TCCATTCCCCAGCGATGATGCC-3´
Reverse primer: 3´- TCGCCATCAGGACCAACAAGGA-5´
DQ524992
Osteocalcin Forward primer: 5´-AGCCCAAAGCACGTAAGCAAGCTA-3´
Reverse primer: 3´- TTTCATCACGCTACTCTACGGGTT-5´
AF048703
Osteopontin Forward primer: 5´- AAGATGGCCTACGACATGACAGAC- 3´
Reverse primer: 3´- CCTGAAGAGCCTTGTACACCTGC-5´
AY651247
Osteonectin Forward primer: 5´- AAAATGATCGAGCCCTGCATGGAC-3´
Reverse primer: 3´- TACAGAGTCACCAGGACGTT-5´
AY239014
aRUNX2 Forward primer: 5´- GCCTGTCGCCTTTAAGGTGGTTGC-3´
Reverse primer: 3´- TCGTCGTTGCCCGCCATAGCTG-5´ AJ619023
Alkaline
phosphatase
Forward primer: 5´- AGAACGCCCTGACGCTGCAA-3´
Reverse primer: 3´- TTCAGTATACGAGCAGCCGTCAC-5´
AY266359
Matrix Gla protein Forward primer: 5´- GTGCCCTCCTTCATTCCAC-3´
Reverse primer: 3´- TATGACCACGTTGGATGCCT-5´
AY065652
bBMP4 Forward primer: 5´- CCACCAGGGCAGACACGTCC-3´
Reverse primer: 3´- GCGTAGCTGCTCCCAGTCCTC-5´
FJ436409
!-actin Forward primer: 5´- TCTGTCTGG ATC GGAGGCTC-3´
Reverse primer: 3´- AAGCATTTG CGGTGGACG -5´
X89920
a RUNX2 (Runt-related transcription factor 2).
b BMP4 (Bone morphogenetic protein 4).

Materials and methods
…………………………………………………………………………………………..
44
2.10 Statistical analysis
All data were tested for normality and homogeneity of variances with Levene´s test,
not requiring any transformation and were treated using one-way ANOVA. Means
compared by Duncan’s test (P < 0.05) using a SPSS software (SPSS for Windows
11.5; SPSS Inc., Chicago, IL, USA).

Optimum krill phospholipids for seabream larvae
………………………………………………………………………………………......
45
Chapter 3
-----------------------------------------------------------------------------
Optimum krill phospholipids content in microdiets for
gilthead seabream (Sparus aurata) larvae
This work was published in Saleh et al. (2012a) Aquaculture Nutrition, Doi:
10.1111/j.1365-2095.2012.00976.x
Abstract
The aim of the present study was to determine the optimum dietary levels of krill
phospholipids (KPL) for seabream (Sparus aurata) larvae, and its influence on larval
development and digestive enzymes activity. Larvae were fed five formulated
microdiets with five different levels of KPL. Complete replacement of live preys with
the experimental microdiets for seabream larvae produced high survival and growth
rates, particularly in larvae fed the highest levels of KPL. In the present study,
increase in dietary KPL up to 12% (10% total PL) significantly improved larval
survival and growth, whereas further increase did not improved those parameters. An
increase in alkaline phosphatase, trypsin and lipase activity with the elevation of KPL
up to 12% was also found denoting a better functioning of digestive system. Besides,
there was a linear substrate stimulatory effect of dietary KPL on phospholipase A2
activity. Finally, increasing dietary KPL lead to better assimilation of n-3 HUFA
especially EPA, reflected in the higher content of these fatty acids in both neutral and
polar lipids of the larvae. In summary, KPL were found to be an excellent source of
lipids for seabream larvae. Optimum inclusion levels of this ingredient in microdiets
to completely substitute live preys at this larval age were found to be 12% KPL.

Optimum krill phospholipids for seabream larvae
………………………………………………………………………………………......
46
Introduction
Dietary phospholipids (PL) improve culture performance of various freshwater and
marine fish species (Izquierdo and Koven, 2011), enhancing growth and survival,
reducing morphological alterations in larvae (Kanazawa 1993; Salhi et al., 1999;
Izquierdo et al., 2001; Kjørsvik, 2009) and early juveniles (Coutteau et al., 1997), and
increasing fish resistance to stress (Takeuchi et al., 1992; Kanazawa, 1993). Despite
PL metabolic pathways, including those of de novo PL biosynthesis, are essentially
the same in fish as in mammals (Caballero et al., 2006b), the fish larvae and early
juvenile have a limited capacity to synthesise de novo (Salhi et al., 1999; Coutteau et
al., 1997). Thus, addition of PL to diets for fish larvae contributes to assimilation of
dietary lipid by increasing the enteric lipoprotein synthesis (Liu et al., 2002; Hadas et
al., 2003) and release in lamina propria, significantly reducing lipoprotein size by
promoting VLDL synthesis (higher in PL), rather than chylomicron production
(higher in NL) (Liu et al., 2002; Caballero et al., 2003, 2006b). Indeed, young fish
receive abundant of PL during embryo and larval development either from yolk sac
lipids or from wild preys (Rainuzzo et al., 1997; van der Meeren et al., 2008).
Therefore, PL seems to be essential for the adequate growth and development of fish
larvae. Described phospholipid requirements are around 2–4% DW of diet for
juvenile fish and they may be higher in larval fish. Frequently those requirements
have used plant PL such as soybean lecithin, or egg yolk lecithin, whereas marine PL,
rich in docosahexaenoic acid (DHA) and eicosapentaenoic acid (EPA), have been
more scarcely studied (Salhi et al., 1999; Cahu et al., 2003a). DHA and EPA present
in the PL fraction of larval diets seem to be more beneficial than in the nuetral lipid
(NL) fraction (Salhi et al., 1999; Cahu et al., 2003a; Gisbert et al., 2005; Wold et al.,
2007). Cahu et al. (2003a) ran a dose response study with sea bass larvae, using five
levels of phospholipids at a constant dietary lipid level (PL, 27-116 g kg-1
dw). They
found that the diet with the highest dietary PL gave the best larval performance and
lower skeletal malformation rates. A similar result was found by Hamza et al. (2008)
for pikeperch larvae, which also showed best growth with the diet highest in PL (9%
of dry matter ).
The digestive system of larvae is not fully developed at first feeding. The digestion of
ingested food occurs in the larval intestine, where the pH remains alkaline and
trypsin-like enzyme activity accounts for the proteolytic activity (Walford and Lam,

Optimum krill phospholipids for seabream larvae
………………………………………………………………………………………......
47
1993). At first feeding, the pancreatic and intestinal enzyme activities are generally
low (Cousin et al., 1987). Digestive enzyme activity increase during the first 10 dph
in Solea senegalensis (Ribeiro et al. 1999), whereas an increase in alkaline
phosphatase activity has been found to reflect the development of the brush border
membranes of enterocytes in Atlantic cod (Gadus morhua) (Wold et al., 2007).
Moreover, the addition of dietary PL enhanced gut maturation index in this species,
based on the relation between brush border alkaline phosphatase and cytosolic
leucine-alanine aminopeptidase. Enhancement of gut maturation by dietary PL could
be related with a higher intracellular availability of PL for cell membrane and cell
organelles formation, since dietary PL promotes re-acylation of digested lipids,
increasing intracellular PL availability for lipoprotein synthesis in gilthead seabream
(Caballero et al. 2003; Liu et al. 2002).
In sea bass larvae, the response of phospholipase A2 to dietary phospholipid content
was gradual and showed a great modulation range in expression. Also, amylase and
alkaline phosphatase activities revealed a proper maturation of the digestive tract in
the the larvae fed the highest dietary phospholipid levels ( Cahu et al., 2003a).
Based on the few studies where single pure phospholipid species have been used, the
rank order for efficacy appears to be phosphatidylcholine, phosphatidylinositol,
phosphatidylethanolamine and phosphatidylserine (Izquierdo and Koven, 2011).
Several studies also suggested that the phospholipid effect was not due to a general
enhanced emulsification and digestion of lipids. The evidence rather led to the
hypothesis that early developing stages of fish had impaired ability to transport
dietary lipids away from the intestine possibly through limitations in lipoprotein
synthesis. Thus, dietary PL increase the efficiency of transport of dietary fatty acids
and lipids from the gut to the rest of the body (Coutteau et al., 1997; Fontagne et al.,
1998; Salhi et al., 1999; Izquierdo et al., 2001).
However, despite the many studies available denoting the importance of dietary PL,
few of them have intended to determine quantitative PL requirements testing diets
with at least five different levels of this nutrient. Recently, krill PL have been found to
constitute a suitable phospholipid source in diets for larval gilthead seabream
(Betancor et al., 2012b). Thus, the aim of the present study was to determine the
optimum requirements of krill PL for gilthead seabream (Sparus aurata) larvae, and
its influence on larval production performance and digestive enzymes activity.

Optimum krill phospholipids for seabream larvae
………………………………………………………………………………………......
48
Materials and methods
Gilthead seabream larvae were obtained from natural spawnings from Instituto
Canario de Ciencias Marinas (Grupo de Investigación en Acuicultura (GIA), Las
Palmas de Gran Canaria, Spain). Larvae (5.4 mm total length, 120 !g dry body
weight) previously fed rotifers (Brachinous plicatilis) enriched with DHA Protein
Selco®
(INVE, Dendermond, Belgium) until 16 dph, were randomly distributed in 15
experimental tanks at a density of 2100 larvae tank-1
and fed one of the diets tested in
triplicate. All tanks (200 L fibreglass cylinder tanks with conical bottom and painted a
light grey colour) were supplied with filtered seawater (37 ppm salinity) at an
increasing rate of 0.4 - 1.0 L min-1
to assure good water quality during the entire trial.
Water entered from the tank bottom and exited from the top to ensure water renewal
and maintain high water quality, which was tested daily and no deterioration was
observed. Water was continuously aerated (125 ml min-1
) attaining 6.1±1 ppm
dissolved O2. Average water temperature and pH along the trial were 19.1±1°C and
7.85, respectively. Photoperiod was kept at 12h light: 12h dark, by fluorescent
daylights and the light intensity was kept at 1700 lux (digital Lux Tester YF-1065,
Powertech Rentals, Western Australia, Australia).
Five experimental microdiets (pellet size < 250 !m) with increasing phospholipid
contents were formulated using sardine oil (Agramar S.A., Spain) and krill oil (Qrill,
high PL, Aker BioMarine, Fjordalléen, Norway) as sources of triglycerides and PL,
respectively. Their formulation and proximate analysis are shown in Table 1. The
fatty acid content is shown in Tables 2, 3 and 4. The desired lipid content (about 21%
DW) was completed if necessary with a non-essential fatty acid source, oleic acid
(Oleic acid, Merck, Darmstadt, Germany). The microdiets were prepared by mixing
squid powder and water-soluble components, and then the lipids and fat-soluble
vitamins and, finally, gelatine dissolved in warm water. The paste was compressed
pelleted (Severin, Suderm, Germany) and dried in an oven at 38 ºC for 24 h (Ako,
Barcelona, Spain). Pellets were ground (Braun, Kronberg, Germany) and sieved
(Filtra, Barcelona, Spain) to obtain a particle size below 250 !m. Diets were prepared
and analyzed for proximate and fatty acid composition (Tables 3.1, 3.2, 3.3 and 3.4)
at GIA laboratories (Las Palmas de Gran Canaria, Spain).

Optimum krill phospholipids for seabream larvae
………………………………………………………………………………………......
49
Table 3.1 Formulation and proximate composition of the experimental microdiets
containing several levels of KPL
Ingredients (g/100 g diet) 0 KPL 3 KPL 6 KPL 12 KPL 17.5 KPL
Squid Powdera 75.6 75.5 75.5 71.5 66
Krill PLb 0 3 6 12 17.5
Sardine oilc 7.9 3 0 0 0
Oleic acidd 0 2 2 0 0
Basal premix 16.5 16.5 16.5 16.5 16.5
Proximate analysis % dry weight
Total Lipids 21.33 20.82 20.97 22.01 24.33
Polar Lipids 6.00 7.00 9.00 10.00 11.00
Polar Lipid/Total lipid 0.28 0.34 0.43 0.45 0.45
Protein 71.26 72.36 72.26 70.68 66.12
Ash 6.9 6.84 7.04 7.06 7.26
Moisture 7.1 8.1 8.6 8 8.6
a Rieber and Son, Bergen, Norway.
b Qrill, high PL, Aker BioMarine, Fjordalléen, Norway.
c Agramar S.A., Spain.
d Merck KGaA, Darmstadi, Germany.
Diets were manually supplied fourteen times per day each 45 min from 9:00 to 19:00
for 16 days. Non-enriched rotifers were co-fed during days 16th
and 17th
(1 rotifer ml-
1). To assure feed availability, daily feed supplied was maintained at 1.5 and 2.5 g
tank-1 during the first and second weeks of feeding, respectively. Larvae were
observed under the binocular microscope to determine feed acceptance. Before the
end of the experiment an activity test was conducted by handling 20 larvae tank-1
out
of the water in a scoop net for 1 min and subsequently allocating them in another tank
supplied with clean seawater and aeration, to determine survival after 24 hours. Final
survival was calculated by individually counting all the living larvae at the beginning
and at the end of the experiment. Growth was determined by measuring dry body
weight (105ºC 24 h) and total length (Profile Projector V-12A Nikon, Tokyo, Japan)
of 30 fish tank-1
at the beginning, in the middle and at the end of the trial. In addition,
at the end of the trial and after 12 h of starvation, the all larvae in each tank were
washed with distilled water, sampled and kept at -80 ºC for biochemical composition.
Moisture (A.O.A.C. 1995), protein (Kjeldhal) and crude lipid (Folch 1957) contents
of larvae and diets were analyzed. Fatty acid methyl esters were obtained by
transmethylation of crude lipids as described by Christie (1982). Fatty acid methyl
esters were separated by GLC (GC -14A, Shimadzu, Tokyo, Japan) in a Supercolvax-

Optimum krill phospholipids for seabream larvae
………………………………………………………………………………………......
50
10-fused silica capillary column (length: 30 m; internal diameter: 0.32 mm; Supelco,
Bellefonte, USA) using helium as a carrier gas. Column temperature was 180 ºC for
the first 10 min, increasing to 215 ºC at a rate of 2.5 ºC/min and then held at 215 ºC
for 10 min. Fatty acid methyl esters were quantified by FID (GC -14A, Shimadzu,
Tokyo, Japan) following the conditions described in Izquierdo et al. (1990) and
identified by comparison to previously characterized standards and GLC-MS.
For enzymes activity determination, the alkaline phosphatase, trypsine and lipase
activities are expressed as relative fluorescence units (RFU) and PLA2 is expressed as
units (U). The larvae were homogenized by a sonicator ultrasound (Misonix Microson
XL2007 Ultrasonic Homogenizer) on ice in 110!l of high-purified water, centrifuged
and the supernatant used as the sample stock solution.
The alkaline phosphatase activities were quantified by fluorometric assay using a
spectrofluorometer (Thermolab Systems; Helsinki, Finland) at excitation wavelengths
of 358 nm and emission wavelengths of 455nm. After preparation of 140 !l of
reaction buffer at pH 10.4 (100 mM Glycine, 1 mM MgCl2, 1mM ZnCl2), and 50 !l
of substrate stock solution (200 !M of 6,8 Difluoro-4 methyllumbelliferyl phosphate
(DiFMUP) solution in DMSO, the reaction was started by adding 10 !l of the sample
stock solution and the kinetic curves were recorded for 20 min (Gee et al.,1999).
Trypsine activities were quantified by fluorometric assay using spectrofluorometer at
excitation wavelengths of 380 nm and emission wavelengths of 440nm. After
preparation of 195 !l of reaction buffer pH 8.0 (50mM Tris-HCl, 10 mM CaCl2), and
5 !l of of substrate stock solution (20 !M of Boc-Gln-Ala-Arg-7 amido-4
methylcoumarin hydrochloride in DMSO), the reaction was started by adding 10 !l of
the sample stock solution and the kinetic curves were recorded for 5 min (Rotllant et
al., 2008).
Neutral lipase activities were quantified by fluorometric assay using
spectrofluorometer at excitation wavelengths of 355 nm and emission wavelengths of
460nm. Firstly, 247.4 !l of 0.1 M phosphate reaction buffer pH 7.0 (19.5 ml of 0.2M
phosphate monobasic (NaH2PO4 1 H2O) solution and 30.5ml of 0.2M Phosphate
dibasic (NaH2PO4 7 H2O) solution were mixed and completed up to 100 ml by adding
50 ml high-purified water), then 2.6!l of substrate stock solution (40 mM of

Optimum krill phospholipids for seabream larvae
………………………………………………………………………………………......
51
4Methylumbelliferol butyrate (MUB) in N,N Dimethyl formamide (DMSO) was
added and then reaction was started by adding10 !l of the sample stock solution.
Kinetics curves were recorded for 5 min (Rotllant et al., 2008).
The PLA2 activities were quantified by fluorometric assay using spectrofluorometer
at excitation wavelengths of 377 nm and emission wavelengths of 450nm. First 160 !l
of reaction buffer pH 8 (50mM Tris-HCl,100mM NaCl, 2mM NaN3, 5!g/ml bovine
serum albumin, and 10 !m 1-anilinonaphthalene-8-sulfonate, and 20 !l of substrate
stock solution ( 50 !l of 1,2-dimyristoyl-sn-glycero-3-phosphocholine solution in 40
mM, methanol mixed with 15 !l deoxycholic acid solution in 40 mM, methanol and
quickly injected into 1ml high purified water, stirred for 1 min and sonicated for 2
min) and 10 !l of 100 mM CaCl2 solution were incubated at 25 °C for 10 min. The
reaction was started by adding 20 !l of the sample stock solution and the kinetic
curves were recorded for 40 min (Huang et al., 2006).
All data were tested for normality and homogeneity of variances with Levene´s test,
not requiring any transformation and were treated using one-way ANOVA. Means
compared by Duncan’s test (P < 0.05) using a SPSS software (SPSS for Windows
11.5; SPSS Inc., Chicago, IL, USA).
Results
All the experimental diets were well accepted by gilthead seabream larvae according
to the microscopic observations. Generally, survival was very high for this type of
studies and it was significantly correlated to the increase in dietary marine PL. Thus,
average survivals of larvae fed diet 12 KPL (10% dietary PL content) and diet 17.5
KPL (11% dietary PL content) were significantly higher than the other treatments
(Figure 3.1). The resistance to stress also increased by dietary PL levels, larvae fed
the17.5 KPL diet showing higher survival after the activity test, although not
significantly different from that of larvae fed diets 12 KPL and 6 KPL (9% dietary PL
content) (Figure 3.2). On the contrary, larvae fed diet 0 KPL (6% dietary PL content)
had a marked drop in survival after stress.

Optimum krill phospholipids for seabream larvae
………………………………………………………………………………………......
52
Figure 3.1 Survival rate (% of population) of larvae reared from 16 to 31 dph on five
dietary KPL levels. Values (mean ± standard deviation) with the same letters are not
significantly different (P>0.05).
Figure 3.2 Survival 24 h after activity test of larvae (31 dph) fed five dietary KPL
levels. Values (mean ± standard deviation) with the same letters are not significantly
different (P>0.05).
y = 4.1683x + 25.737
R2 = 0.9085
10
15
20
25
30
35
40
45
50
55
6 7 8 9 10 11 12
Su
rviv
al
%
Polar Lipids (% of dry diet)
b
b
b
a a
y = 3.1609x + 82.448
R2 = 0.767
70
75
80
85
90
95
100
105
6 7 8 9 10 11 12
Su
rviv
al %
Polar Lipids (% of dry diet)
c
bc
ab
ab a

Optimum krill phospholipids for seabream larvae
………………………………………………………………………………………......
53
Larval growth was also improved by dietary PL and after 15 days of feeding, growth
of larvae fed 17.5 KPL(11% dietary PL content) diet had significantly higher total
length than those fed 0 KPL, 3 KPL, and 6 KPL, but did not differed from those fed
12 KPL(10% dietary PL content) (Figure 3.3). In terms of body weight, larvae fed
17.5 KPL were bigger than larvae fed 0 KPL and 3 KPL but did not differed
significantly from larvae fed 6 KPL or 12 KPL diets (Figure 3.4).
Figure 3.3 Total length of larvae (31 dph) fed five dietary KPL levels. Values (mean ±
standard deviation) with the same letters are not significantly different (P>0.05).
Figure 3.4 Dry weight of larvae (31 dph) fed five dietary KPL levels. Values (mean ±
standard deviation) with the same letters are not significantly different (P>0.05).
y = 0.217x + 7.4878 R2 = 0.9253
6
7
8
9
10
6 7 8 9 10 11 12
To
tal Len
gth
(m
m)
Polar Lipids (% of dry diet)
c
c b
ab
a
c
y = 48.304x + 403.08 R2 = 0.8738
200
300
400
500
600
700
800
6 7 8 9 10 11 12
Dry W
eig
ht
(!
g)
Polar Lipids (% of dry diet)
c
bc ab
ab
a

Optimum krill phospholipids for seabream larvae
………………………………………………………………………………………......
54
In general digestive enzyme activity was increased by the elevation of dietary marine
PL. Thus, alkaline phosphatase was lowest in 0 KPL larvae and significantly
increased with the elevation of dietary PL up to 9 % (diet 6 KPL), whereas trypsine
activity was significantly lowest in both 0 KPL and 3 KPL larvae (Figure 3.5 and
3.6). Neutral lipase activity was lowest in 0 KPL and 3 KPL larvae and significantly
higher in 12 KPL and 17.5 KPL larvae (Figure 3.7). PLA2 activity was significantly
higher in larvae fed 17.5 KPL than in larvae fed 0 KPL, 3 KPL or 6 KPL, but did not
differed from that of 12 KPL larvae (Figure 3.8).
Figure 3.5 Alkaline phosphatase activity in seabream larvae (31 dph) fed five dietary
KPL. Values (mean ± standard deviation) with the same letters are not significantly
different (P>0.05).
y = -3.0666x! + 67.183x - 67026
R2 = 0.9982
150
200
250
300
350
6 7 8 9 10 11 12
Alk
ali
ne P
ho
sp
hata
se
(R
FU
/Larvae)
Polar Lipids (% of dry diet)
"#"$#"
%$#" %$"%"

Optimum krill phospholipids for seabream larvae
………………………………………………………………………………………......
55
Figure 3.6 Trypsin activity in seabream larvae (31 dph) fed five dietary KPL. Values
(mean ± standard deviation) with the same letters are not significantly different
(P>0.05).
Figure 3.7 Lipase activity in seabream larvae (31 dph) fed five dietary KPL. Values
(mean ± standard deviation) with the same letters are not significantly different
(P>0.05).
y = -3.8295x2 + 87.92x - 338.91 R2 = 09227
0
50
100
150
200
250
300
6 7 8 9 10 11 12
Tryp
sin
(R
FU
/Larvae)
Polar Lipids (% of dry diet)
!"
!"
!"
#"
#"
y = 0.1445x$ + 16.894x + 79.325
R2 = 0.9249
140
160
180
200
220
240
260
280
300
320
340
6 7 8 9 10 11 12
Lip
ase (
RFU
/Larvae)
Polar Lipids (% of dry diet)
""%"
"%"
"#%"
"!#""!"

Optimum krill phospholipids for seabream larvae
………………………………………………………………………………………......
56
Figure 3.8 Phospholipase A2 activity in seabream larvae (31 dph) fed five dietary
KPL. Values (mean ± standard deviation) with the same letters are not significantly
different (P>0.05).
Fatty acid composition of total lipids of the microdiets showed that gradual inclusion
of PL lead to an increase in n-3 fatty acids, particularly due to the increase in EPA
and DHA, together with 14:0. On the contrary, oleic acid and n-6 fatty acids,
particularly 18:2n-6, were reduced by the inclusion of dietary PL (Table 3.2).
However, fatty acid composition of PL from microdiets was much more stable and
only showed a slight reduction in 20:1n-9+n-7 and increase in EPA (Tables 3.3 and
3.4).
Table 3.2 Fatty acids (% dry weight) composition in total lipids of diets containing
five KPL levels
0 KPL 3 KPL 6 KPL 12 KPL 17.5 KPL
14:0 0.54 0.77 0.86 1.45 2.00
14:1n-7 0.01 0.01 0.01 0.03 0.07
14:1n-5 0.01 0.01 0.01 0.04 0.11
15:0 0.09 0.09 0.08 0.10 0.19
15:1n-5 0.00 0.00 0.00 0.01 0.06
16:0ISO 0.01 0.01 0.01 0.02 0.07
16:0 4.78 4.72 4.16 4.98 5.73
16:1n-7 0.52 0.58 0.58 1.05 1.38
Me 16:0 0.03 0.04 0.04 0.07 0.11
16:1n-5 0.04 0.05 0.05 0.07 0.12
16:2n-6 0.06 0.04 0.04 0.07 0.13
16:2n-4 0.12 0.12 0.11 0.14 0.19
17:0 0.06 0.04 0.03 0.05 0.08
y = 0.7022x2 - 6.2453x + 60.837 R2 = 0.8976
30
40
50
60
70
80
90
100
6 7 8 9 10 11 12
Ph
osp
ho
lip
ase A
2
(U
*1
00
/ L
arvae)
Polar Lipids (% of dry diet)
!!!"!
!#"! !#"!
!$#!!$!

Optimum krill phospholipids for seabream larvae
………………………………………………………………………………………......
57
16:3n-4 0.01 0.00 0.01 0.01 0.03
16:3n-3 0.03 0.04 0.04 0.06 0.10
16:3n-1 0.07 0.07 0.06 0.06 0.07
16:4n-3 0.02 0.02 0.04 0.08 0.12
16:4n-1 0.00 0.00 0.01 0.01 0.02
18:0 0.99 0.80 0.55 0.50 0.53
18:1n-9 4.12 5.83 3.93 1.59 2.01
18:1n-7 0.46 0.47 0.55 1.01 1.31
18:1n-5 0.05 0.05 0.04 0.05 0.06
18:2n-9 0.00 0.00 0.01 0.01 0.02
18:2n-6 4.07 2.23 0.70 0.31 0.41
18:2n-4 0.02 0.01 0.00 0.01 0.01
18:3n-6 0.01 0.01 0.01 0.04 0.05
18:3n-4 0.03 0.01 0.01 0.01 0.01
18:3n-3 0.52 0.24 0.08 0.13 0.16
18:4n-3 0.05 0.06 0.13 0.27 0.36
18:4n-1 0.01 0.00 0.00 0.01 0.02
20:0 0.04 0.03 0.01 0.01 0.01
20:1n-9 1.06 0.77 0.50 0.53 0.52
20:1n-5 0.04 0.04 0.03 0.05 0.06
20:2n-9 0.01 0.00 0.00 0.00 0.00
20:2n-6 0.09 0.06 0.04 0.04 0.04
20:3n-6 0.02 0.01 0.01 0.01 0.02
20:4n-6 0.13 0.14 0.18 0.21 0.22
20:3n-3 0.09 0.08 0.08 0.08 0.07
20:4n-3 0.06 0.04 0.04 0.08 0.10
20:5n-3 0.83 1.12 2.52 3.72 4.53
22:1n-11 0.45 0.17 0.08 0.14 0.19
22:1n-9 0.06 0.06 0.00 0.02 0.03
22:4n-6 0.02 0.02 0.05 0.08 0.10
22:5n-6 0.02 0.02 0.03 0.03 0.03
22:5n-3 0.11 0.07 0.08 0.11 0.13
22:6n-3 1.56 1.82 4.25 4.66 4.76
Total Saturated 6.51 6.45 5.70 7.08 8.54
Total Monounsaturated 14.08 14.57 5.82 4.62 5.79
Total n-3 3.28 3.50 7.27 9.19 10.34
Total n-6 4.42 2.54 1.05 0.79 1.00
Total n-9 4.15 5.85 3.98 1.67 2.11
Total n-3HUFA 2.57 3.06 6.90 8.57 9.52
EPA/ARA 6.35 8.09 14.1 18.08 20.87
DHA/EPA 1.87 1.64 1.69 1.25 1.05
DHA/ARA 11.88 13.23 23.78 22.62 21.94
n-3/n-6 0.74 1.38 6.91 11.55 10.39

Optimum krill phospholipids for seabream larvae
………………………………………………………………………………………......
58
Table 3.3 Fatty acids (% dry weight) composition in neutral lipids of diets containing
five KPL levels
0 KPL 3 KPL 6 KPL 12 KPL 17.5 KPL
14:0 0.46 0.83 1.48 2.81 3.66
14:1n-7 0.01 0.02 0.03 0.06 0.08
14:1n-5 0.01 0.01 0.01 0.03 0.04
15:0 0.06 0.07 0.10 0.15 0.12
15:1n-5 0.00 0.00 0.01 0.02 0.02
16:0ISO 0.01 0.01 0.01 0.02 0.02
16:0 2.49 2.51 2.92 4.02 4.74
16:1n-7 0.59 0.70 1.05 2.22 2.72
Me 16:0 0.03 0.04 0.05 0.10 0.14
16:1n-5 0.02 0.02 0.04 0.07 0.08
16:2n-6 0.07 0.06 0.07 0.15 0.20
16:2n-4 0.06 0.10 0.18 0.33 0.38
17:0 0.07 0.05 0.04 0.08 0.09
16:3n-4 0.01 0.00 0.01 0.01 0.02
16:3n-3 0.01 0.01 0.03 0.06 0.06
16:4n3 0.03 0.04 0.07 0.16 0.23
18:0 0.69 0.54 0.51 0.48 0.41
18:1n-9 4.93 7.57 7.46 2.93 3.54
18:1n-7 0.36 0.34 0.47 1.13 1.53
18:1n-5 0.04 0.03 0.04 0.05 0.06
18:2n-6 5.73 3.49 1.38 0.73 0.47
18:2n-4 0.02 0.01 0.00 0.01 0.01
18:3n-6 0.01 0.01 0.02 0.02 0.06
18:3n-4 0.03 0.02 0.01 0.01 0.01
18:3n-3 0.87 0.43 0.09 0.16 0.18
18:4n-3 0.11 0.13 0.17 0.41 0.57
18:4n-1 0.03 0.02 0.00 0.01 0.01
20:0 0.07 0.05 0.04 0.04 0.03
20:1n9+n7 0.75 0.50 0.35 0.38 0.40
20:1n-5 0.03 0.03 0.03 0.06 0.08
20:2n-9 0.01 0.00 0.02 0.01 0.00
20:2n-6 0.08 0.05 0.02 0.03 0.03
20:3n-6 0.02 0.01 0.01 0.02 0.02
20:4n-6 0.07 0.06 0.06 0.09 0.11
20:3n-3 0.05 0.04 0.04 0.05 0.04
20:4n-3 0.13 0.07 0.04 0.06 0.09
20:5n-3 0.84 0.91 1.24 2.33 3.03
22:1n-11 0.54 0.28 0.09 0.16 0.14
22:1n-9 0.09 0.07 0.08 0.02 0.02
22:4n-6 0.04 0.03 0.03 0.05 0.07
22:5n-6 0.02 0.01 0.01 0.02 0.02
22:5n-3 0.29 0.15 0.04 0.06 0.08
22:6n-3 1.58 1.49 1.72 2.37 2.70
Total Saturated 3.82 4.05 5.10 7.57 9.04

Optimum krill phospholipids for seabream larvae
………………………………………………………………………………………......
59
Total Monounsaturated 7.36 9.57 9.63 7.12 8.69
Total n-3 3.90 3.28 3.43 5.66 6.96
Total n-6 6.04 3.72 1.60 1.12 0.98
Total n-9 5.03 7.65 7.57 2.97 3.57
Total n-3HUFA 2.88 2.66 3.07 4.87 5.94
EPA/ARA 12.19 15.84 20.95 24.52 26.66
DHA/EPA 1.88 1.63 1.39 1.02 0.89
DHA/ARA 22.91 25.89 29.18 24.89 23.75
n-3/n-6 0.65 0.88 2.14 5.04 7.11
Table 3.4 Fatty acids (% dry weight) composition in polar lipids of diets containing
five KPL levels
0 KPL 3 KPL 6 KPL 12 KPL 17.5 KPL
14:0 0.33 0.34 0.35 0.43 0.51
14:1n-7 0.01 0.01 0.01 0.01 0.01
14:1n-5 0.01 0.01 0.01 0.00 0.00
15:0 0.14 0.13 0.12 0.12 0.12
15:1n-5 0.00 0.00 0.00 0.00 0.00
16:0ISO 0.01 0.01 0.01 0.01 0.02
16:0 5.78 5.61 5.23 5.86 6.52
16:1n-7 0.10 0.20 0.23 0.32 0.41
Me 16:0 0.04 0.04 0.04 0.05 0.06
16:1n-5 0.05 0.05 0.05 0.07 0.08
16:2n-6 0.01 0.01 0.01 0.02 0.02
16:2n-4 0.16 0.14 0.12 0.11 0.10
17:0 0.03 0.03 0.03 0.03 0.03
16:3n-4 0.00 0.00 0.00 0.00 0.01
16:3n-3 0.05 0.05 0.05 0.06 0.07
16:3n-1 0.11 0.10 0.08 0.07 0.06
16:4n-3 0.02 0.02 0.01 0.01 0.02
16:4n-1 0.03 0.02 0.00 0.00 0.01
18:0 0.94 0.81 0.67 0.61 0.57
18:1n-9 0.63 0.65 0.66 0.82 1.02
18:1n-7 0.27 0.43 0.51 0.77 1.04
18:1n-5 0.05 0.05 0.04 0.05 0.06
18:2n-9 0.00 0.01 0.00 0.01 0.01
18:2n-6 0.47 0.33 0.29 0.33 0.35
18:2n-4 0.01 0.01 0.01 0.01 0.01
18:3n-6 0.01 0.01 0.01 0.01 0.03
18:3n-4 0.01 0.01 0.01 0.01 0.01
18:3n-3 0.05 0.06 0.08 0.12 0.17
18:4n-3 0.02 0.06 0.10 0.16 0.26
18:4n-1 0.03 0.02 0.02 0.01 0.01
20:0 0.04 0.03 0.02 0.02 0.01
20:1n-9+n7 0.86 0.75 0.63 0.58 0.55
20:1n-5 0.03 0.03 0.03 0.05 0.05

Optimum krill phospholipids for seabream larvae
………………………………………………………………………………………......
60
20:2n-9 0.01 0.01 0.01 0.01 0.00
20:2n-6 0.07 0.06 0.05 0.05 0.04
20:3n-6 0.00 0.00 0.01 0.01 0.02
20:4n-6 0.30 0.28 0.25 0.25 0.28
20:3n-3 0.13 0.12 0.10 0.09 0.09
20:4n-3 0.02 0.04 0.05 0.08 0.11
20:5n-3 2.54 3.06 3.42 4.31 5.99
22:1n-11 0.07 0.14 0.17 0.23 0.31
22:1n-9 0.02 0.00 0.00 0.04 0.05
22:4n-6 0.03 0.05 0.07 0.09 0.14
22:5n-6 0.07 0.06 0.05 0.05 0.05
22:5n-3 0.10 0.10 0.11 0.13 0.17
22:6n-3 7.68 6.89 6.35 5.96 6.88
Total Saturated 7.26 6.95 6.41 7.06 7.76
Total Monounsaturated 2.09 2.31 2.35 2.94 3.59
Total n-3 10.60 10.39 10.27 10.91 13.76
Total n-6 0.96 0.80 0.73 0.80 0.91
Total n-9 0.66 0.67 0.68 0.87 1.08
Total n-3HUFA 10.47 10.21 10.03 10.56 13.24
EPA/ARA 8.6 11.1 13.5 17.0 21.5
DHA/EPA 3.0 2.3 1.9 1.4 1.1
DHA/ARA 26.0 25.0 25.0 23.5 24.7
n-3/n-6 11.0 12.9 13.9 13.4 14.8
Analysis of fatty acids composition of larvae showed significant differences between
the five dietary PL treatments in both neutral and polar lipids (Tables 3.5 and 3.6).
Neutral lipids were more markedly affected by dietary lipids and showed increased
myrisitc acid (14:0), 18:1n-7, 18:4n-3, n-3 fatty acids, particularly EPA, and reduced
stearic (18:0), oleic (18:1n-9), 20:1n-9 and linoleic (18:2n-6) acids with increased
dietary PL. Thus, 17.5 KPL larvae were significantly highest in EPA while the 0 KPL
has the lowest. Larvae fed diets 12 KPL and 17.5 KPL diets showed higher n-3/n-6
and EPA/ARA ratios than 0 KPL, 3 KPL and 6 KPL larvae. Larval polar lipids were
more conservative than the neutral lipids and only showed a marked increased in n-3
fatty acids and EPA, together with a reduction in n-6 fatty acids due to the lower
linoleic acid contents. On the contrary, regardless dietary levels, ARA and DHA
contents were not significantly different among larvae fed different levels of dietary
PL. Larvae fed 12 KPL and 17.5 KPL diets showed the highest total n-3, n-3HUFA,
and EPA content of polar lipids.

Optimum krill phospholipids for seabream larvae
………………………………………………………………………………………......
61
Table 3.5 Fatty acids (% total identified fatty acids) composition in neutral lipids of
larvae fed diets containing five KPL levels. Values (mean ± standard deviation) with
the same letters in the same row are not significantly different (P>0.05)
0 KPL 3 KPL 6 KPL 12 KPL 17.5 KPL
14:0 1.42 1.62 2.84 5.62 5.21
14:1n-5 0.02 0.02 0.02 0.03 0.03
14:1n-7 0.13 0.13 0.12 0.15 0.14
15:0 0.35 0.31 0.39 0.62 0.41
15:1n-5 0.02 0.02 0.03 0.03 0.05
16:0iso 0.07 0.06 0.07 0.09 0.08
16:0 14.81 15.12 17.73 29.54 18.44
16:1n-7 2.28 2.16 3.11 4.31 5.19
Met 16:0 0.17 0.18 0.22 0.30 0.31
16:1n-5 0.29 0.31 0.33 0.39 0.37
16:2n-6 0.70 0.63 0.69 0.69 0.63
16:2n-4 0.71 0.97 1.51 2.17 2.08
17:0 0.31 0.30 0.28 0.24 0.25
16:3n-4 0.03 0.03 0.04 0.04 0.04
16:3n-3 0.12 0.13 0.21 0.29 0.27
16:3n-1 0.10 0.12 0.08 0.05 0.04
16:4n-3 0.09 0.09 0.13 0.16 0.20
16:4 n-1 0.00 0.00 0.00 0.00 0.00
18:0 7.26 7.22 6.28 6.37 4.78
18:1n-9 14.55 17.25 16.88 8.06 9.07
18:1n-7 2.77 2.74 3.47 4.61 5.43
18:1n-5 0.37 0.40 0.37 0.41 0.34
18:2n-9 0.08 0.17 0.10 0.08 0.10
18:2n-6 13.41 7.17 2.65 1.33 1.52
18:2n-4 0.06 0.06 0.06 0.07 0.07
18: 3n-6 0.18 0.23 0.19 0.22 0.29
18:3n-4 0.12 0.12 0.19 0.10 0.08
18:3n-3 1.54 0.71 0.30 0.40 0.52
18:4n-3 0.24 0.24 0.44 0.85 1.13
18:4n-1 0.04 0.02 0.01 0.02 0.01
20:0 0.47 0.32 0.25 0.34 0.19
20:1n-9 3.46 2.53 2.58 2.42 1.96
20: 1n-5 0.32 0.30 0.34 0.36 0.36
20: 2n-9 0.06 0.08 0.03 0.03 0.02
20:2n-6 0.72 0.50 0.31 0.21 0.20
20:3n-9+n- 0.02 0.02 0.00 0.00 0.00
20:3n-6 0.08 0.09 0.06 0.06 0.09
20:4n-6 1.79 2.13 1.48 1.06 1.10
20: 3n-3 0.38 0.33 0.37 0.33 0.29
20:4n-3 0.32 0.24 0.25 0.35 0.44
20:5n-3 5.7 6.84 8.63 10.32 12.8
22:1n-11 1.33 0.95 1.42 1.47 1.34
22:1n-9 0.80 0.63 0.21 0.23 0.23
22:4n-6 0.12 0.13 0.20 0.30 0.37

Optimum krill phospholipids for seabream larvae
………………………………………………………………………………………......
62
22:5n-6 0.26 0.29 0.22 0.17 0.17
22:5n-3 1.59 1.47 1.33 1.48 1.71
22:6n-3 20.35 24.64 23.61 20.16 21.69
Total Saturated 24.62±0.85bc
24.9±0.17bc
27.77±0.51bc
32.73±4.83a 29.28±0.28
b
Total Monounsaturated 32.06+3.05a 32.38+2.05
a 34.1+2.65
a 27.93+2.05
b 29.21+2.01
b
Total n-3 30.34±1.76c 34.7±2.15
b 35.27±1.82
b 34.34±3.08
b 39.05±0.82
a
Total n-6 17.26±0.07a 11.17±0.16
b 5.8±0.05
c 4.03±0.56
d 4.36±0.02
d
Total n-9 18.98±1.13a 20.68±0.82
a 19.81±1.13
a 11.31±0.9
b 11.38±0.27
b
Total n-3HUFA 28.35±1.84b 33.52±2.19
a 34.18±1.84
a 34.64±2.87
a 36.93±1.04
a
ARA 1.79±0.06b 2.13±0.31
a 1.48±0.15
b 1.06±0.14
c 1.1±0.12
c
EPA 5.71±0.26 e 6.84±0.21
d 8.63±0.54
c 10.32±0.94
b 12.8±0.16
a
DHA 20.35±1.44c 24.64±1.97
a 23.61±1.32
ab 20.16±1.78
c 21.69±0.97
bc
EPA/ARA 3.2±0.03d 3.26±0.37
d 5.85±0.24
c 9.78±0.41
b 11.79±1.37
a
DHA/EPA 3.56±0.09a 3.6±0.18
a 2.74±0.02
b 1.95±0.07
c 1.69±0.08
d
DHA/ARA 11.38±0.42c 11.65±0.75
c 15.94±0.76
b 19.11±1.01
a 19.91±1.4
a
n-3/n-6 1.76±0.11d 3.11±0.24
c 6.08±0.37
b 8.57±0.46
a 8.96±0.15
a
Table 3.6 Fatty acids (% total identified fatty acids) composition in polar lipids of
larvae fed diets containing five KPL levels. Values (mean ± standard deviation) with
the same letters in the same row are not significantly different (P>0.05)
0 KPL 3 KPL 6 KPL 12 KPL 17.5 KPL
14:0 0.57 0.69 0.86 1.05 1.15
14:1n-5 0.01 0.01 0.01 0.01 0.00
14:1n-7 0.05 0.06 0.04 0.04 0.04
15:0 0.32 0.33 0.35 0.31 0.30
15:1n-5 0.01 0.02 0.01 0.00 0.00
16:0iso 0.05 0.05 0.04 0.05 0.05
16:0 23.76 24.82 27.00 26.45 28.13
16:1n-7 1.19 1.32 1.38 2.10 2.16
Met 16:0 0.13 0.15 0.17 0.22 0.25
16:1n-5 0.26 0.29 0.26 0.25 0.28
16:2n-6 0.55 0.52 0.53 0.47 0.34
16:2n-4 0.64 0.70 0.74 0.70 0.72
17:0 0.29 0.32 0.27 0.24 0.22
16:3n-4 0.06 0.01 0.01 0.01 0.02
16:3n-3 0.36 0.11 0.13 0.16 0.19
16:3n-1 0.45 0.67 0.62 0.55 0.49
16:4n-3 0.21 0.38 0.36 0.19 0.19
16:4n-1 0.13 0.12 0.11 0.13 0.13
18:0 9.30 7.09 7.49 6.32 5.52
18:1n-9 6.80 13.22 11.65 7.69 7.66
18:1n-7 1.19 2.29 2.34 3.08 3.58

Optimum krill phospholipids for seabream larvae
………………………………………………………………………………………......
63
18:1n-5 0.16 0.20 0.20 0.20 0.20
18:2n-9 0.13 0.14 0.12 0.06 0.08
18:2n-6 7.19 4.27 1.75 0.88 0.96
18:2n-4 0.04 0.03 0.03 0.03 0.03
18: 3n-6 0.05 0.10 0.07 0.06 0.06
18:3n-4 0.10 0.07 0.08 0.07 0.03
18:3n-3 0.40 0.20 0.08 0.12 0.13
18:4n-3 0.05 0.04 0.04 0.08 0.09
18:4n-1 0.01 0.01 0.00 0.01 0.02
20:0 0.17 0.15 0.15 0.10 0.08
20:1n-9 1.15 0.94 0.82 0.73 0.70
20: 1n-5 0.13 0.13 0.13 0.15 0.16
20: 2n-9 0.03 0.03 0.03 0.02 0.02
20:2n-6 0.55 0.38 0.22 0.16 0.14
20:3n-6 0.10 0.09 0.07 0.08 0.09
20:4n-6 1.63 1.52 1.60 1.67 1.51
20: 3n-3 0.19 0.15 0.14 0.13 0.11
20:4n-3 0.16 0.12 0.12 0.17 0.19
20:5n-3 5.87 6.87 8.99 12.52 14.85
22:1n-11 0.10 0.07 0.06 0.06 0.14
22: 1n-9 0.05 0.06 0.03 0.03 0.04
22:4n-6 0.08 0.08 0.11 0.16 0.19
22:5n-6 0.38 0.33 0.29 0.30 0.21
22:5n-3 1.41 1.18 1.03 1.19 1.11
22:6n-3 29.50 29.71 29.47 30.98±0.52 28.43
Total saturated 57.86±1.48b 57.87±1.35
b 62.77±4.00
a 60.62±1.15
ab 63.23±1.73
a
Total Monounsaturated 11.0+1.12 c 19.0+1.09
a 17.09+1.98
ab 14.19+1.09
b 15.1+1.08
b
Total n-3 38.15±0.44c 38.7±1.12
c 40.36±0.57
b 45.55±0.53
a 44.28±1.12
a
Total n-6 10.53±0.04a 7.28±0.22
b 4.65±0.33
c 3.78±0.07
d 3.51±0.14
d
Total n-9 7.03±0.88c 13.45±0.21
a 11.84±1.23
ab 7.81±0.25
bc 7.81±0.41
bc
Total n-3HUFA 37.13±0.31c 38.04±1.14
c 39.75±0.55
b 45±0.54
a 43.69±1.13
a
ARA 1.63±0.07a 1.52±0.07
a 1.6±0.11
a 1.67±0.11
a 1.51±0.14
a
EPA 5.87±0.21e 6.87±0.49
d 8.99±0.29
c 12.52±0.32
b 14.85±0.38
a
DHA 29.5±0.52a 29.71±1.61
a 29.47±0.25
a 30.98±0.52
a 28.43±1.23
a
EPA/ARA 3.62±0.29d 4.56±0.53
cd 5.64±0.33
c 7.54±0.65
b 9.89±0.98
a
DHA/EPA 5.04±0.26a 4.36±0.54
b 3.28±0.08
c 2.48±0.09
d 1.85±0.12
e
DHA/ARA 18.13±0.51a 19.58±0.15
a 18.49±1.21
a 18.64±0.93
a 18.2±0.78
a
n-3/n-6 3.62±0.03e 5.33±0.31
d 8.71±0.51
c 12.05±0.25
b 12.64±0.24
a

Optimum krill phospholipids for seabream larvae
………………………………………………………………………………………......
64
Discussion
Complete replacement of both rotifers and Artemia with the experimental microdiets
for gilthead seabream larvae produced high survival and growth rates, particularly in
fish fed the two highest levels of krill PL. High survival and fast growth rates are
required to be able to determine optimum ingredient contents and nutrient
requirements in fish diets. In the present study, final average survival (48%) and total
length (8.6 mm) in seabream fed diets containing 12% and 17.5% krill PL was higher
than the best obtained by other authors (30-38% survival) feeding only microdiets for
a similar period in this (Seiliez et al., 2006) or other species (Cahu et al., 1998;
Zambonino-Infante and Cahu 1999). Moreover, it was even higher than that obtained
feeding live preys under similar experimental conditions (41%) (Salhi et al., 1997) or
in commercial hatcheries (about 20 %) (Roo et al. 2005). However, a much higher
survival (73%) was obtained by Cahu and coworkers (2003a) feeding high PL
microdiets to European seabass larvae (Dicentrarchus labrax), a species with a faster
development of the digestive system than gilthead seabream.
Fatty acid composition in larvae reflected that of corresponding diet, where the
supplimentation of dietary PL led to an increase in larval n-3 HUFA fatty acids. Best
results of growth and survival in 12 KPL and 17.5 KPL larvae could hence be due to
higher levels of PUFA which are essential for marine fish larvae, particularly EPA
and DHA, which are increased with Krill PL inclusion in the diets. An increase in
both dietary DHA and EPA improves larval performance, in terms of survival, stress
resistance and growth (Liu et al., 2002; Izquierdo et al., 2005). Moreover, a higher n-
3/n-6 fatty acid ratio was observed in the 12 KPL and 17.5 KPL diets, which resulted
in the best growth and survival in those groups. This was also observed by (Izquierdo
et al., 2000, 2001; Caballero et al., 2002; Caballero et al., 2006a) who showed that a
well-balanced n-3/n-6 fatty acid ratio in the diet improved lipid metabolism such as
digestion, absorption and transport.
Despite the large amount of bibliography regarding the effect of dietary PL, few
studies have been conducted to determine optimum dietary levels with a wide range
(! 5) of dietary PL contents. In the present study, increase in dietary krill PL up to
12% (about 10% total PL in diet) significantly improved larval survival and promoted
growth, leading to high final total length and body weight, whereas further increase

Optimum krill phospholipids for seabream larvae
………………………………………………………………………………………......
65
did not affected those parameters. These levels are lower than those reccommended
for European seabass (12% total PL) (Cahu et al., 2003a) for maximum survival and
growth when soybean lecithin was used as a source of PL. These results can be
related to a higher effectiveness of marine PL in the present study in comparison to
soybean lecithin (Salhi et al., 1999; Izquierdo et al., 2001; Wold et al., 2007), or to
different requirements among species, since they are higher than those recommended
for larval rock bream (Oplegnathus fasciatus) (5% total PL) (Kanazawa et al., 1983a).
Larval growth and survival have been found to be increased by dietary PL in several
fish species (Kanazawa et al., 1983a; Izquierdo et al., 2001; Cahu et al., 2003a;
Gisbert et al., 2005). On the contrary, survival was not improved by elevation of
dietary PL in other species such as pikeperch (Sander lucioperca) larvae (Hamza et
al., 2008). The promoting effect of PL on larval growth is probably related to their
importance as components of biomembranes (Tocher, 2003) and it has been mainly
associated with their content in PC (Takeuchi et al., 1992; Kanazawa, 1993), the main
PL class in cell membrane. In relation to improved growth, other authors also found
an increase in feed intake that has been associated to the stimulation of gustatory
response by the trimethyl group of the choline base of PC (Izquierdo and Koven,
2010). However, in the present study no differences were found in feed intake and all
diets were supplemented with the same amount of choline in the vitamin mixture.
The growth improvement obtained with increased dietary PL contents could be at
least partly related to the higher maturation of the gut suggested by the significant
increase in alkaline phosphatase activity. This enzyme, an important component of
brush-border membrane enzymes, increases during development of marine fish larvae
in association to enterocyte development and denoting intestine maturation In the
present study, increased dietary krill PL up to 12% (about 10% total PL) significantly
increased alkaline phosphatase activity, whereas higher PL levels did not further
enhanced it. Similar PL values (9%) were required to increase alkaline phosphatase
activity in European seabass when soybean lecithin was used as the PL source (Cahu
et al., 2003) and cod larvae (Wold et al., 2007). Enhanced enterocyte maturation by
PL could be related with to a higher intracellular availability of PL for cell membrane
and cell organules formation, since dietary PL promotes re-acylation of digested
lipids increasing intracellular PL availability for lipoprotein synthesis in gilthead
seabream (Caballero et al., 2003; Liu et al., 2002). In fact, membrane cell organelles

Optimum krill phospholipids for seabream larvae
………………………………………………………………………………………......
66
such as mitochondria have been found to be affected by dietary PL (Macqueen
Leifson et al., 2003).
On the contrary to the saturation effect of dietary PL levels on alkaline phosphatase
activity, there was a linear substrate stimulatory effect of dietary PL on PLA2 activity.
PLA2 activity has been found in larvae of several species such as striped bass
(Morone saxatilis) (Ozkizilcik et al., 1996) or European seabass (Dicentrarchus
labrax) (Cahu and Zambonino-Infante, 2001). The steady increase in PLA2 activity
by dietary PL is in agreement with the transcriptional regulation of PLA2 by dietary
PL found in European seabass (Zambonino-Infante and Cahu, 1999). These authors
also suggested a post-transcriptional regulation of endocrine origin. In concordance
with this hypothesis, in the present study, the increase trypsine and lipase activity by
elevation of krill dietary contents up to 6%, regardless dietary protein and lipid
content, denotes a general effect of dietary PL on pancreatic enzymes. Endocrine
modulation of the pancreatic digestive function in fish is regulated by
cholecystokinine (CCK) whose secretion in turn is stimulated by the presence of
several nutrients such as free amino acids (Rojas-García and Rønnestad, 2002).
However, free fatty acids, and particularly n-3 polyunsaturated fatty acids, are also
potent stimulators of CCK secretion (Little et al., 2007) by mediation of the G-
protein-coupled receptor GPR40 (Liou et al. in press). In the present study, increased
PLA2 activity (as well as lipase activity) by elevation of dietary PL would be
responsible for a more effective digestion of dietary lipids and, therefore, higher
concentrations of free polyunsaturated fatty acids in intestine lumen that could
stimulate CCK secretion as it occurs in mammals. Moreover, increase in dietary PL
increased the polyunsaturated fatty acid content in biomembranes of larval tissues, as
denoted by the fatty acid composition of larval PL, could modulate CCK function
responsible for the higher pancreatic enzymes activity. In mammals, fatty acid
composition of cell membranes has been found to be determinant for specific
recognition of CCK receptor (Romano et al., 2003) and modulation of CCK function
in pancreatic tissue (Chang et al., 1984). In the present study, increasing dietary PL
lead to better assimilation of n-3HUFA especially EPA, reflected in the higher content
of these fatty acids in both neutral and polar lipids of the larvae. This could be partly
due to a better digestion efficiency of dietary lipids by enhanced PLA2 and lipase
activity, but also to an improvement in lipid transport. Izquierdo et al. (2001) found a

Optimum krill phospholipids for seabream larvae
………………………………………………………………………………………......
67
better incorporation of fatty acids from dietary polar lipids in larval seabream fed
dietary PL in comparison to larvae fed triglycerides.
In summary, the results of the present study have shown that dietary krill PL are an
excellent source of lipids for gilthead seabream larvae. Optimum inclusion levels of
this ingredient in microdiets to completely substitute live preys at this larval age were
found to be 12% krill PL, providing about 10% total PL. Lower levels of this
ingredient markedly reduced culture performance, gut development, digestive
enzymes acitivity, dietary lipid utilization, growth, survival and stress resistance in
seabream larvae.Further studies are required to determine the optimum content of
other phospholipid sources such as soyben lecithin in early weanning diets for
gilthead seabream.
Acknowledgements
This study was partially supported by a grant from the Spanish Agency of
International Cooperation and Development (AECID) to Reda Saleh Mohamed
Ibrahim. The present study was partly funded by the Spanish Ministry of Sciences and
Education (AGL2009-14661). This work has been partly funded under the EU
seventh Framework Program by the ARRAINA project No
288925: Advanced
Research Initiatives for Nutrition and Aquaculture.

Optimum soybean lecithin for seabream larvae
…………………………………………………………………………………………..
68
Chapter 4
-----------------------------------------------------------------------------
Optimum soybean lecithin contents in microdiets for
gilthead seabream (Sparus aurata) larvae
This work was published in Saleh et al. (2012b) Aquaculture Nutrition, Doi:
10.1111/anu.12009
Abstract
The aim of the present study was to determine the optimum dietary levels of soybean
lecithin (SBL) for seabream (Sparus aurata) larvae, and its influence on production
performance and digestive enzymes activity. Larvae were fed five formulated
microdiets with five levels of SBL. Complete replacement of live preys with the
experimental microdiets for seabream larvae at 16 dph produced over 55% survival
rates, particularly in fish fed the highest levels of SBL. Moreover, increase in dietary
SBL up to 80 g kg-1
significantly improved larval growth, leading to high final total
length and body weight. An increase in alkaline phosphatase activity with the
elevation up to 80 g kg-1
SBL was also found denoting a better maturation of the
digestive system. Besides, there was a stimulatory effect of dietary SBL on PLA2
activity. Finally, increasing dietary SBL lead to better utilization of dietary HUFA, as
it was reflected in their higher content in both neutral and polar lipid of the larvae. In
summary, elevation of dietary SBL up to 80 g kg-1
in microdiets for seabream
significantly improved digestive enzymes activities, enterocyte maturation, utilization
and deposition of dietary essential fatty acids and larval growth, as a consequence of a
better digestion, absorption, transport and deposition of dietary nutrients.

Optimum soybean lecithin for seabream larvae
…………………………………………………………………………………………..
69
Introduction
Phospholipids (PL) are particularly important in fish larvae production for their
essential function as necessary components for cellular bio-membranes and organelles
formation, as well as for being an endogenous energy source during early
development (Izquierdo and Koven, 2011). Indeed, young fish contain abundant PL
received during embryo and larval development either from endogenous yolk sac or
exogenous live preys lipids (Rainuzzo et al., 1997; van der Meeren et al., 2008).
Studies on dietary PL were initiated by Kanazawa et al. (1981, 1983a, b), who
showed that despite their significant roles in fish metabolism, developing fish possess
a limited ability for phospholipids synthesis (Kanazawa, 1985) and, consequently,
they must be included in young fish diets.
Thus, PL inclusion in young fish diets has been found to enhance growth, survival
and stress resistance, and reduce the incidence of morphological alterations in fish
larvae (Takeuchi et al., 1992; Kanazawa, 1993; Salhi et al., 1999; Izquierdo et al.,
2001; Cahu et al., 2003a; Kjørsvik et al., 2009). PL are necessary as emulsifiers in the
formation of mixed micelles in the digestive tract (Olsen and Ringø, 1997) and appear
to be crucial for lipid transport (Fontagné et al., 1998; Salhi et al., 1999; Caballero et
al., 2006a).
At hatching, the larval digestive system is not completely developed, lacks a
functional stomach and main digestion of ingested food occurs in the intestine, where
the pH remains alkaline and trypsin-like enzyme activity accounts for the proteolytic
activity (Walford and Lam, 1993; Morais et al., 2005). Lipolytic activity in fish larvae
is leaded by a nonspecific neutral lipase dependent on the presence of bile salts (bile
salt activated lipase, BAL) (Iijima et al., 1998; Izquierdo and Henderson, 1998),
whereas PL are specifically digested by the intestinal phospholipase A2 (PLA2)
secreted by the pancreas (Sargent et al., 1989). The activity of all these luminal
enzymes tends to increase with gut development (Moyano et al., 1996; Izquierdo et
al., 2000; Zambonino-Infante and Cahu, 2001; Lazo et al., 2007). Intestinal brush
border membrane enzymes such as alkaline phosphatases are lowest at first feeding
and subsequently increase with gut development (Cahu and Zambonino-Infante,
1995b; Lazo et al., 2007). Nevertheless, during early development certain dietary
ingredients, such as PL may promote digestive enzymes activities and induce

Optimum soybean lecithin for seabream larvae
…………………………………………………………………………………………..
70
digestive system maturation (Zambonino-Infante and Cahu, 2001), playing an
important role on larval digestive physiology and the metabolic pathways of the
assimilated nutrients (Kolkovski et al., 2009; Morais et al., 2006). PL have been also
found to be required for the formation of very low-density lipoproteins during the
intestinal absorption of lipids (Salhi et al., 1999; Liu et al., 2002; Caballero et al.,
2006b). Feeding high lipid diets low in PL causes the accumulation of lipidic
vacuoles in the basal zone of the enterocyte and esteatosis in the hepatic tissue, both
of them being markedly reduced by a 2 % addition of soybean lecithin, denoting an
enhancement in the lipid transport activity in gut and liver (Liu et al., 2002) and
emphasizing the limited ability of fish larvae to synthesize PL. Moreover, this fact
may reduce the absorption of different ingested nutrients from the lumen (Morais et
al., 2006).
Therefore, dietary PL are required for the appropriate development and biological
performance of young fish (Kanazawa, 1993). The quantitative requirements of PL
for larval fish range from about 2–12% of diet, being lower in the larvae of common
carp (Cyprinus carpio) (2% chicken egg) (Geurden et al., 1995a) and in red seabream
(Pagrus major) larvae was 5% SBL and knife jaw (Oplegnathus fasciatus) larvae (7.4
% SBL) (Kanazawa et al. 1983a) and Japanese flounder (Paralichthys olivaceus)
larvae (7 % SBL) (Kanazawa 1993), with the highest reported value being for
Gilthead seabream (Sparus aurata) (15 % SBL) (Seiliez et al., 2006). However, for
the later species, our recent studies have found an optimum inclusion of about 4%
using krill PL as a PL source (Saleh et al., 2012a).
Being gilthead seabream one of the most important species for Mediterranean
aquaculture, it is necessary to quantify its optimum dietary PL requirements to
optimize weaning diets, particularly since this species does not develop a functional
stomach until 35-40 dah (Moyano et al., 1996).
As soybean lecithin is a readily available and cost effective PL source in fish diets,
the objective of the present study was to determine the optimum quantity of soybean
lecithin required in weaning diets to support better growth, survival and development
of gilthead seabream larvae.

Optimum soybean lecithin for seabream larvae
…………………………………………………………………………………………..
71
Materials and methods
Gilthead seabream larvae were obtained from natural spawnings from Instituto
Canario de Ciencias Marinas (Grupo de Investigación en Acuicultura (GIA), Las
Palmas de Gran Canaria, Spain). Larvae (initial total length 5.4±0.6 mm, mean±SD;
dry body weight 120±37 !g) previously fed rotifers (Brachinous plicatilis) enriched
with DHA Protein Selco®
(INVE, Dendermond, Belgium) until they reached 15 day
old, were randomly distributed in 15 experimental tanks at a density of 2100 larvae
tank-1
and fed one of the experimental diets tested in triplicate for 15 days. All tanks
(200 L fibreglass cylinder tanks with conical bottom and painted a light grey colour)
were supplied with filtered seawater (37 mg L-1
salinity) at an increasing rate of 0.4-
1.0 L min-1
to assure good water quality during the entire trial. Water entered from the
tank bottom and exited from the top to ensure water renewal and maintain high water
quality, which was tested daily and no deterioration was observed. Water was
continuously aerated (125 ml min-1
) attaining 6.0±1 ppm dissolved O2. Average water
temperature and pH along the trial were 21.0±1°C and 7.85±0.1, respectively.
Photoperiod was kept at 12h light: 12h dark, by fluorescent daylights and the light
intensity was 1700 lux (digital Lux Tester YF-1065, Powertech Rentals, Osborne Park
City, Australia) at the water surface.
Five experimental microdiets (pellet size < 250 !m) with increasing phospholipid
contents were formulated using sardine oil (Agramar S.A., Spain) and soybean
lecithin oil (Acofarma, Barcelona, Spain) as sources of triglycerides and PL,
respectively. Their formulation and proximate analysis are showed in Table 1. The
fatty acids profiles are shown in Tables 2, 3 and 4. The desired lipid content (about
180 g kg-1
) was completed if necessary with a non-essential fatty acid source, oleic
acid (Oleic acid vegeTable, Merck, Darmstadt, Germany). The microdiets were
prepared by mixing squid meal and water-soluble components, and then the lipids and
fat-soluble vitamins and, finally, gelatine dissolved in warm water. The paste was
compressed pelleted (Severin, Suderm, Germany) and dried in an oven at 38 ºC for 24
h (Ako, Barcelona, Spain). Pellets were ground (Braun, Kronberg, Germany) and
sieved (Filtra, Barcelona, Spain) to obtain a particle size below 250 !m. Diets were
prepared and analyzed for proximate and fatty acid composition (Tables 4.1, 4.2, 4.3
and 4.4) at GIA laboratories.

Optimum soybean lecithin for seabream larvae
…………………………………………………………………………………………..
72
Table 4.1 Formulation and proximate composition of the experimental microdiets
containing several levels of SBL
Ingredients (g kg-1
diet) 0 SBL 2 SBL 4 SBL 8 SBL 12 SBL
Squid meala 756 755 755 755 715
Soybean lecithinb 0.0 20 40 80 120
Sardine oilc 79 40 20 0.0 0.0
Oleic acidd 0.0 20 20 0.0 0.0
Basal premix 165 165 165 165 165
Proximate analysis (g kg-1
diet)
Lipid 180.2 175 179.2 183.4 200.2
Polar Lipids 49.4 56.5 65.4 88.1 95.9
Protein 712.2 710.3 714.3 720.4 671.3
Ash 68.2 68.8 68.7 70.3 70.5
Moisture 81.0 80.0 78.8 80.3 78.7 a Rieber and Son, Bergen, Norway.
b Acofarma, Barcelona, Spain.
c Agramar S.A., Las Palmas, Spain.
d Merck KGaA, Darmstadi, Germany.
Diets were manually supplied fourteen times per day each 45 min from 9:00 to 19:00
for 16 days. Non-enriched rotifers were co-fed only during days 16th
and 17th
(1
rotifer ml-1
). To assure feed availability, daily feed supplied was maintained at 1.5 and
2.5 g L-1
tank-1
during the first and second week of feeding, respectively. Larvae were
observed under the binocular microscope to determine feed acceptance.
Before the end of the experiment an activity test was conducted by handling 20 larvae
tank-1
out of the water in a blotted scoop net for 1 min and subsequently allocating
them in another tank supplied with clean seawater and aeration, to determine survival
after 24 hours. Final survival was calculated by individually counting all the living
larvae at the beginning and at the end of the experiment. Growth was determined by
measuring dry body weight (105ºC 24 h) and total length (Profile Projector V-12A
Nikon, Tokyo, Japan) of 30 fish tank-1
at the beginning, in the middle and at the end
of the trial. In addition, at the end of the trial and after 12 h of starvation, the all larvae
in each tank were washed with distilled water, sampled and kept at -80 ºC for
biochemical composition.
Moisture (A.O.A.C., 1995), protein (A.O.A.C., 1995) and crude lipid (Folch, 1957)
contents of larvae and diets were analyzed. Fatty acid methyl esters were obtained by
transmethylation of crude lipids as described by Christie (1982). Fatty acid methyl
esters were separated by GLC (GC -14A, Shimadzu, Tokyo, Japan) in a Supercolvax-
10-fused silica capillary column (length: 30 m; internal diameter: 0.32 mm; Supelco,
Bellefonte, USA) using helium as a carrier gas. Column temperature was 180 ºC for

Optimum soybean lecithin for seabream larvae
…………………………………………………………………………………………..
73
the first 10 min, increasing to 215 ºC at a rate of 2.5 ºC min-1
and then held at 215 ºC
for 10 min. Fatty acid methyl esters were quantified by FID (GC -14A, Shimadzu,
Tokyo, Japan) following the conditions described in Izquierdo et al. (1990) and
identified by comparison to previously characterized standards and GLC-MS.
For enzymes activity determination, the alkaline phosphatase, trypsine and lipase
activities are expressed as relative fluorescence units (RFU) and PLA2 is expressed as
units (U). The larvae were homogenized by a sonicator ultrasound (Misonix Microson
XL2007 Ultrasonic Homogenizer) on ice in 110!l of high-purified water, centrifuged
and the supernatant used as the sample stock solution.
The alkaline phosphatase activities were quantified by fluorometric assay using a
spectrofluorometer (Thermolab Systems; Helsinki, Finland) at excitation wavelengths
of 358 nm and emission wavelengths of 455nm. After preparation of 140 !l of
reaction buffer at pH 10.4 (100 mM Glycine, 1 mM MgCl2, 1mM ZnCl2), and 50 !l
of substrate stock solution (200 !M of 6,8 Difluoro-4 methyllumbelliferyl phosphate
(DiFMUP) solution in DMSO., the reaction was started by adding 10 !l of the
sample stock solution and the kinetic curves were recorded for 20 min (Gee et
al.,1999).
Trypsine activities were quantified by fluorometric assay using spectrofluorometer at
excitation wavelengths of 380 nm and emission wavelengths of 440nm. After
preparation of 195 !l of reaction buffer pH 8.0 (50mM Tris-HCl, 10 mM CaCl2), and
5 !l of of substrate stock solution (20 !M of Boc-Gln-Ala-Arg-7 amido-4
methylcoumarin hydrochloride in DMSO), the reaction was started by adding 10 !l of
the sample stock solution and the kinetic curves were recorded for 5 min (Rotllant et
al., 2008).
Neutral lipase activities were quantified by fluorometric assay using
spectrofluorometer at excitation wavelengths of 355 nm and emission wavelengths of
460nm. Firstly, 247.4 !l of 0,1 M phosphate reaction buffer pH 7.0 (19.5 ml of 0.2M
phosphate monobasic (NaH2PO4 1 H2O) solution and 30.5ml of 0.2M Phosphate
dibasic (NaH2PO4 7 H2O) solution were mixed and completed up to 100 ml by adding
50 ml high-purified water), then 2.6!l of substrate stock solution (40 mM of
4Methylumbelliferol butyrate (MUB) in N,N Dimethyl formamide (DMSO) was
added and then reaction was started by adding 10 !l of the sample stock solution. .
Kinetics curves were recorded for 5 min (Rotllant et al., 2008).

Optimum soybean lecithin for seabream larvae
…………………………………………………………………………………………..
74
The PLA2 activities were quantified by fluorometric assay using spectrofluorometer
at excitation wavelengths of 377 nm and emission wavelengths of 450nm. First 160 !l
of reaction buffer pH 8 (50mM Tris-HCl,100mM NaCl, 2mM NaN3, 5!g ml-1
bovine
serum albumin, and 10 !m 1-anilinonaphthalene-8-sulfonate, and 20 !l of substrate
stock solution (50 !l of 1,2-dimyristoyl-sn-glycero-3-phosphocholine solution in 40
mM, methanol mixed with 15 !l deoxycholic acid solution in 40 mM, methanol and
quickly injected into 1ml high purified water, stirred for 1 min and sonicated for 2
min) and 10 !l of 100 mM CaCl2 solution were incubated at 25 °C for 10 min. The
reaction was started by adding 20 !l of the sample stock solution and the kinetic
curves were recorded for 40 min (Huang et al., 2006).
All data were tested for normality and homogeneity of variances with Levene´s test,
not requiring any transformation and were treated using one-way ANOVA. Means
compared by Duncan’s test (P < 0.05) using a SPSS software (SPSS for Windows
11.5; SPSS Inc., Chicago, IL, USA).
Results
All the experimental diets were well accepted by the larvae as early as 16 days post
hatching (dph) as observed in the microphotography. Regardless the diet fed survival
was high 52-58 % (Figure 4.1) and did not significantly differed (P>0.05) among
larvae fed different diets. Dietary treatments did neither affected survival 24 h after
the handling test, being always over 88 % (Figure 4.2). Larval growth in terms of total
length significantly (P>0.05) increased by the elevation of dietary SBL up to 80 g kg-
1, whereas further elevation of SBL dietary levels to 120 g kg
-1 did not further
improved larval growth (Figure 4.3). Similarly, elevation of SBL dietary contents up
to 40-80 g kg-1
significantly (P>0.05) raised dry body weight, whereas elevation to
120 g kg-1
did not further increased weight (Figure 4.4).
In general digestive enzymes activity was increased by the elevation of dietary marine
phospholipids. Thus, alkaline phosphatase was lowest in 0 SBL larvae and
significantly increased with the elevation of dietary SBL up to 8 SBL and 12 SBL
larvae, whereas trypsine activity was significantly lowest in both 0 SBL and 2 SBL
larvae (Figure 4.5 and 4.6). Neutral lipase activity was lowest in 0 SBL 2 SBL larvae
and significantly increased in 8 SBL and 12 SBL larvae (Figure 4.7). PLA2 activity

Optimum soybean lecithin for seabream larvae
…………………………………………………………………………………………..
75
was significantly higher in larvae fed 12 SBL than in larvae fed 0 SBL, 2 SBL or 4
SBL, but did not differed from that of 8 SBL larvae (Figure 4.8).
Figure 4.1. Survival rate (% of population) of larvae reared from 16 to 31 dph on five
levels of SBL. Values (mean ± standard deviation) with the same letters are not
significantly different (P>0.05).
Figure 4.2 Survival 24 h after activity test of larvae (30 dph) fed increased levels of
SBL for 15 days. Values (mean ± standard deviation) with the same letters are not
significantly different (P>0.05).
y = -0.2888x2 + 4.452x + 39.029 R! = 0.15736
45
49
53
57
61
65
5 6 7 8 9 10 11
Su
rviv
al
%
Diet (% Polar Lipids)
a
a
a a
a
y = -0.0961x2 + 1.6898x + 87.063 R2 = 0.8473
80
85
90
95
100
105
5 6 7 8 9 10 11
Su
rviv
al
%
Diet (% Polar Lipids)
a
a
a
a
a

Optimum soybean lecithin for seabream larvae
…………………………………………………………………………………………..
76
Figure 4.3 Total length of larvae (30 dph) fed increased levels of SBL for 15 days.
Values (mean ± standard deviation) with the same letters are not significantly
different (P>0.05).
Figure 4.4 Dry body weight of larvae (30 dph) fed increased levels of SBL for 15
days. Values (mean ± standard deviation) with the same letters are not significantly
different (P>0.05).
y = -0.0026x2 + 0.1545x + 7.9085 R2 = 0.7883
7
8
9
10
5 6 7 8 9 10 11
To
tal
Len
gth
(m
m)
Diet (% Polar Lipids)
b
b
b
a
a
y = -0.0664x2 + 33.989x + 538.62 R2 = 0.8343
300
400
500
600
700
800
900
1000
1100
5 6 7 8 9 10 11
Dry W
eig
ht
(!
g)
Diet (% Polar Lipids)
b b
ab
a a

Optimum soybean lecithin for seabream larvae
…………………………………………………………………………………………..
77
Figure 4.5 Alkaline phosphatase activity in seabream larvae (30 dph) fed increased
levels of SBL for 15 days. Values (mean ± standard deviation) with the same letters
are not significantly different (P>0.05).
Figure 4.6 Trypsin activity in seabream larvae (30 dph) fed increased levels of SBL
for 15 days. (mean ± standard deviation) with the same letters are not significantly
different (P>0.05).
y = -4.6463x!"#"$%&'()*"+",-!&$)".!"/"-&$-%0"
150
180
210
240
270
300
330
360
390
5 6 7 8 9 10 11
Alk
ali
ne P
ho
sp
hata
se
(R
FU
/Larvae)
Diet (% Polar Lipids)
b
ab
ab
a
a
y = -0.6293x! + 22.829x - 36.133 R! = 0.6821
0
20
40
60
80
100
120
140
160
180
200
5 6 7 8 9 10 11
Tryp
sin
(R
FU
/Larvae)
Diet (% Polar Lipids)
bc
c
bc
a
ab

Optimum soybean lecithin for seabream larvae
…………………………………………………………………………………………..
78
Figure 4.7 Lipase activity in seabream larvae (30 dph) fed increased levels of SBL for
15 days. (mean ± standard deviation) with the same letters are not significantly
different (P>0.05).
Figure 4.8 Phospholipase A2 activity in seabream larvae (30 dph) fed increased levels
of SBL for 15 days. Values (mean ± standard deviation) with the same letters are not
significantly different (P>0.05).
Fatty acid composition of total lipids, neutral lipids and polar lipids from the
experimental microdiets showed that gradual inclusion of SBL lead to an increase in
n-6 fatty acids, particularly 18:2n-6 fatty acid (Tables 4.2 and 4.3). The 12 SBL diet
has the highest content of saturated fatty acids of total lipids and neutral lipids
particularly 16:0 and 18:0 fatty acids, and has the lowest monounsaturated fatty acids
particularly 18:1n-9 fatty acid. The diets 0 SBL, 2 SBL and 4 SBL have higher n-9
fatty acids of total lipids and neutral lipids compared to 8 SBL and 12 SBL. Fatty acid
y = -1.1067x2 + 31.765x + 148.31 R2 = 0.5741
180
220
260
300
340
380
420
5 6 7 8 9 10 11
Lip
ase (
RFU
/Larvae)
Diet (% Polar Lipids)
b b
ab ab
a
y = 9.7508x2 - 73.783x + 880.18 R2 = 0.9525
500
600
700
800
900
1000
1100
1200
1300
1400
5 6 7 8 9 10 11
Ph
osp
ho
lip
ase A
2
(U
*1
00
/Larvae)
Diet (% Polar Lipids)
b b
b
ab a

Optimum soybean lecithin for seabream larvae
…………………………………………………………………………………………..
79
composition of polar lipids from the microdiets showed a reduction of n-3 fatty acids,
particularly DHA and EPA, by the elevation of SBL (Table 4.4).
Table 4.2 Fatty acids (% dry weight) composition in total lipids of five dietary SBL
0 SBL 2 SBL 4 SBL 8 SBL 12 SBL
14:0 0.39 0.27 0.26 0.14 0.16
14:1n-5 0.00 0.00 0.00 0.00 0.00
14:1n-7 0.01 0.01 0.00 0.00 0.00
15:0 0.07 0.06 0.07 0.06 0.07
15:1n-5 0.00 0.00 0.00 0.00 0.00
16:0ISO 0.01 0.01 0.01 0.00 0.00
16:0 3.51 3.17 3.72 3.62 6.36
16:1n-7 0.39 0.24 0.18 0.09 0.03
Me 16:0 0.02 0.02 0.02 0.02 0.01
16:1n-5 0.03 0.02 0.02 0.02 0.02
16:2n-6 0.04 0.03 0.02 0.01 0.00
16:2n-4 0.08 0.07 0.08 0.07 0.12
17:0 0.04 0.03 0.03 0.02 0.01
16:3n-4 0.00 0.00 0.00 0.00 0.00
16:3n-3 0.03 0.02 0.02 0.02 0.02
16:3n-1 0.05 0.05 0.00 0.06 0.07
16:4n-3 0.02 0.01 0.06 0.01 0.00
18:0 0.70 0.63 0.89 0.71 1.36
18:1n-9 3.18 4.93 5.17 1.92 1.81
18:1n-7 0.34 0.00 0.00 0.24 0.22
18:1n-5 0.04 0.02 0.03 0.03 0.03
18:2n-6 3.37 3.16 3.75 5.21 6.80
18:2n-4 0.02 0.01 0.01 0.00 0.01
18:3n-6 0.01 0.01 0.00 0.00 0.01
18:3n-4 0.01 0.01 0.01 0.01 0.01
18:3n-3 0.48 0.34 0.33 0.53 0.54
18:4n-3 0.05 0.03 0.02 0.01 0.01
18:4n-1 0.01 0.01 0.00 0.00 0.00
20:0 0.03 0.03 0.03 0.03 0.06
20:1n9+n7 0.81 0.58 0.56 0.43 0.28
20:1n-5 0.03 0.02 0.02 0.01 0.01
20:2n-9 0.01 0.00 0.00 0.00 0.00
20:2n-6 0.07 0.05 0.04 0.03 0.02
20:3n-6 0.01 0.01 0.01 0.00 0.00
20:4n-6 0.12 0.11 0.10 0.13 0.09
20:4n-6 0.12 0.11 0.10 0.13 0.09
20:3n-3 0.08 0.06 0.06 0.07 0.05
20:4n-3 0.07 0.04 0.02 0.01 0.01
20:5n-3 1.00 0.88 0.66 0.78 0.81
22:1n-11 0.40 0.20 0.11 1.21 0.10
22:1n-9 0.00 0.01 0.02 0.01 0.00
22:4n-6 0.03 0.02 0.01 0.01 0.01

Optimum soybean lecithin for seabream larvae
…………………………………………………………………………………………..
80
22:5n-6 0.03 0.02 0.02 0.02 0.02
22:5n-3 0.15 0.09 0.05 0.03 0.03
22:6n-3 2.26 2.22 1.49 1.94 2.37
Total Saturated 8.20 7.29 8.65 8.21 14.31
Total Monounsaturated 5.23 6.02 6.11 2.77 2.50
Total n-3 4.13 3.70 2.72 3.42 3.83
Total n-6 3.68 3.41 3.94 5.43 7.01
Total n-9 3.19 4.93 5.19 1.93 1.81
Total n-3HUFA 3.56 3.30 2.29 2.85 3.26
EPA/ARA 8.28 8.07 6.87 5.90 9.24
ARA/EPA 0.12 0.12 0.15 0.17 0.11
DHA/EPA 2.26 2.51 2.26 2.50 2.93
DHA/ARA 18.68 20.23 15.54 14.75 27.11
n3/n6 1.12 1.09 0.69 0.63 0.55
Table 4.3 Fatty acids (% dry weight) composition in neutral lipids of five dietary SBL
0SBL 2 SBL 4 SBL 8 SBL 12 SBL
14:0 4.7 3.2 2.4 1.5 1.3
14:1n-7 0.1 0.1 0 0 0
15:0 0.6 0.6 0.6 0.9 0.6
15:1n-5 0 0.1 0.1 0.1 0.1
16:0iso 0.1 0.1 0.1 0.1 0.1
16:0 26.9 22.9 22.3 32.1 31.6
16:1n-7 5.4 3.2 2.4 0.9 1.1
Met 16:0 0.2 0.2 0.2 0.2 0.2
16:1n-5 0.1 0.2 0.2 0.2 0.2
16:2n-6 0.6 0.3 0.1 0.1 0.1
16:2n-4 0.6 0.7 0.6 0.8 1
17:0 0.5 0.4 0.3 0.3 0.3
16:3n-3 0.1 0.1 0.1 0.1 0.1
16:4n-3 0.1 0.1 0 0.1 0.2
18:0 8 3.3 7 10 5
18:1n-9 48.3 73.9 77.7 38.4 43.5
18:1n-7 3.6 0 0 2.5 0
18:1n-5 0.4 0.1 0.1 0.3 0.1
18:2n-6 47.3 40.6 44.1 71.6 85.8
18:2n-4 0.2 0.2 0.1 0.3 0.8
18: 3n-6 0 0.4 0.2 0.2 0.2
18:3n-4 0.1 0.1 0.1 0.1 0.1
18:3n-3 5.4 4.2 4 6.4 8.7
18:4n-3 0.4 0.4 0.3 0.1 0.2
18:4n-1 0.1 0.1 0.1 1 0.9
20:0 0.7 0.6 0.7 3 2.4
20:1n-9 7.6 4.7 3.9 0.1 0.1
20:1n-5 0.3 0.2 0.2 0 0

Optimum soybean lecithin for seabream larvae
…………………………………………………………………………………………..
81
20:2n-6 0.7 0.4 0.3 0.3 0.3
20:3n-6 0.2 0.4 0.4 0.5 0.6
20:4 n-6 0.4 0.3 0.3 0.3 0.3
20:3n-3 0.4 0.3 0.3 0.4 0.3
20:4 n-3 0.6 0.4 0.3 0 0.1
20:5n-3 2.8 2.8 2.4 2.5 3.1
22:1n-11 6.5 3.4 1.8 0.3 0.2
22:1n-9 0.1 0.1 0.5 0.5 0.4
22:4n-6 0.1 0.1 0.2 0.3 0.4
22:5n-6 0.1 0.1 0 0 0
22:5n-3 0.9 0.6 0.4 0.1 0.1
22:6n-3 4.8 5.1 4.6 6.5 9.7
Total Saturated 67.8 53.2 55 78.9 72.1
Total Monounsaturated 72.5 85.9 86.4 42.9 45.2
Total n-3 15.5 14 12.4 16.2 22.5
Total n-6 49.3 42.6 45.6 73.5 87.8
Total n-9 48.5 74 78.2 38.9 43.9
Total n-3HUFA 9.4 9.2 8 9.5 13.4
EPA/ARA 7.29 9.03 9.16 7.43 8.91
ARA/EPA 0.14 0.11 0.11 0.13 0.11
DHA/EPA 1.70 1.84 1.91 2.58 3.13
DHA/ARA 12.36 16.65 17.52 19.16 27.86
n3/n6 0.31 0.33 0.27 0.22 0.26
Table 4.4 Fatty acids (% dry weight) composition in polar lipids of five dietary SBL
0SBL 2 SBL 4 SBL 8 SBL 12 SBL
14:0 0.46 0.71 0.33 0.27 0.23
14:1n-5 0.01 0.01 0.01 0.00 0.00
14:1n-7 0.01 0.03 0.01 0.00 0.00
15:0 0.18 0.31 0.14 0.12 0.11
15:1n-5 0.00 0.00 0.00 0.00 0.01
16:0iso 0.02 0.03 0.01 0.01 0.01
16:0 7.56 6.48 6.76 6.22 6.40
16:1n-7 0.15 0.16 0.11 0.14 0.13
Met 16:0 0.04 0.02 0.03 0.03 0.03
16:1n-5 0.06 0.08 0.05 0.04 0.04
16:2n-6 0.01 0.06 0.04 0.03 0.02
16:2n-4 0.21 0.42 0.19 0.14 0.13
17:0 0.04 0.05 0.03 0.03 0.03
16:3n-4 0.00 0.00 0.00 0.00 0.00
16:3n-3 0.06 0.09 0.04 0.04 0.03
16:3n-1 0.00 0.00 0.00 0.00 0.08
16:4n-3 0.13 0.22 0.11 0.09 0.01
16:4n-1 0.00 0.03 0.02 0.00 0.00
18:0 1.10 2.15 1.08 1.01 1.01
18:1n-9 0.68 1.54 0.99 1.27 1.56
18:1n-7 0.31 0.50 0.27 0.29 0.32

Optimum soybean lecithin for seabream larvae
…………………………………………………………………………………………..
82
18:1n-5 0.06 0.09 0.04 0.04 0.04
18:2n-9 0.01 0.01 0.00 0.00 0.00
18:2n-6 0.24 2.22 2.28 3.82 5.27
18:2n-4 0.01 0.01 0.00 0.01 0.02
18:3n-6 0.02 0.10 0.01 0.00 0.01
18:3n-4 0.02 0.04 0.02 0.02 0.02
18:3n-3 0.03 0.17 0.18 0.28 0.39
18:4n-3 0.01 0.01 0.01 0.01 0.01
18:4n-1 0.03 0.01 0.00 0.00 0.02
20:0 0.02 0.15 0.07 0.03 0.03
20:1n-9 1.02 1.55 0.75 0.65 0.57
20:1n-5 0.03 0.04 0.02 0.02 0.02
20:2n-9 0.01 0.01 0.00 0.00 0.00
20:2n-6 0.07 0.10 0.05 0.05 0.04
20:3n-6 0.00 0.07 0.03 0.01 0.01
20:4n-6 0.22 0.29 0.18 0.15 0.13
20:3n-3 0.12 0.17 0.09 0.08 0.07
20:4n-3 0.02 0.02 0.01 0.01 0.01
20:5n-3 1.36 1.68 1.12 0.93 0.85
22:1n-11 0.12 0.18 0.01 0.03 0.07
22:1n-9 0.03 0.05 0.09 0.08 0.01
22:4n-6 0.01 0.02 0.01 0.01 0.01
22:5n-6 0.05 0.05 0.04 0.03 0.03
22:5n-3 0.05 0.06 0.04 0.03 0.03
22:6n-3 3.49 3.95 2.64 2.30 2.23
Total Saturated 16.73 15.93 15.04 13.78 14.10
Total Monounsaturated 2.44 4.19 2.26 2.49 2.76
Total n-3 5.25 6.38 4.25 3.77 3.62
Total n-6 0.61 2.93 2.64 4.11 5.52
Total n-9 0.72 1.61 1.09 1.34 1.58
Total n-3HUFA 5.03 5.88 3.91 3.35 3.18
EPA/ARA 6.20 5.79 6.29 6.36 6.60
ARA/EPA 0.16 0.17 0.16 0.16 0.15
DHA/EPA 2.57 2.34 2.36 2.46 2.64
DHA/ARA 15.96 13.57 14.85 15.67 17.41
n3/n6 8.58 2.17 1.61 0.92 0.66
Analysis of fatty acids composition of the larvae reflected the fatty acids composition
of the diets. It had shown significant difference between the five dietary SBL
treatments in both neutral and polar lipids (Tables 4.5 and 4.6). There are significant
difference (P<0.05) between the 12 SBL and 0 SBL treatments in total n-3, n-6 and n-
3 HUFA particularly DHA content in both neutral and polar lipids where the larvae
fed 0 SBL treatment has the highest total n-3 and n-3 HUFA particularly DHA, while
the larvae fed diet 12 SBL has the highest total n-6, particularly 18:2n-6. Also the

Optimum soybean lecithin for seabream larvae
…………………………………………………………………………………………..
83
larvae fed 2, 4 and 8 SBL diets have higher total n-3 and n-3HUFA, DHA and EPA
content of neutral and polar lipid than larvae fed 12 SBL, but the last one has the
highest total n-6 fatty acids particularly linoleic acid content in both neutral and polar
lipids. It was not found significant difference (P>0.05) in EPA content between all of
them in both neutral and polar lipids.
Table 4.5 Fatty acids (% total area) composition in neutral lipids of larvae fed
increased levels of SBL for 15 days. Values (mean ± standard deviation) with the
same letters in the same row are not significantly different (P>0.05)
0SBL 2 SBL 4 SBL 8 SBL 12 SBL
14:0 1.71 1.29 1.20 1.10 0.97
14:01 0.00 0.00 0.00 0.00 0.00
14:1n-5 0.02 0.02 0.02 0.01 0.02
14:1n-7 0.11 0.12 0.09 0.08 0.10
15:0 0.39 0.38 0.33 0.39 0.39
15:1n-5 0.02 0.04 0.04 0.04 0.07
16:0iso 0.06 0.05 0.05 0.04 0.03
16:0 14.57 14.54 14.26 15.85 16.16
16:1n-9 0.00 0.00 0.00 0.00 0.00
16:1n-7 2.32 1.69 1.55 1.39 1.03
Met 16:0 0.13 0.11 0.11 0.10 0.09
16:1n-5 0.26 0.26 0.22 0.23 0.18
16:2n-6 0.62 0.56 0.54 0.54 0.43
16:2n-4 0.69 0.70 0.65 0.72 0.63
16:2n-3 0.00 0.00 0.00 0.00 0.00
17:0 0.28 0.26 0.21 0.20 0.14
16:3n-4 0.02 0.01 0.00 0.01 0.00
16:3n-3 0.14 0.12 0.11 0.11 0.09
16:3n-1 0.05 0.03 0.03 0.03 0.04
16:4n-3 0.06 0.01 0.00 0.00 0.00
16:4n-1 0.00 0.00 0.00 0.00 0.00
18:0 6.42 6.46 6.23 7.14 7.13
18:1n-9 16.58 21.13 23.25 14.90 13.57
18:1n-7 2.33 1.99 1.62 1.83 1.64
18:1n-5 0.34 0.34 0.33 0.32 0.28
18:2n-9 0.08 0.07 0.05 0.00 0.00
18:2n-6 15.63 18.36 17.49 23.43 31.09
18:2n-4 0.09 0.06 0.05 0.04 0.02
18:3n-9 0.00 0.00 0.00 0.00 0.00
18:3n-6 0.22 0.20 0.20 0.17 0.12
18:4n-6 0.00 0.00 0.00 0.00 0.00
18:3n-4 0.11 0.00 0.05 0.08 0.07
18:3n-3 1.95 1.78 1.65 2.14 2.80
18:3n-1 0.00 0.05 0.00 0.00 0.03

Optimum soybean lecithin for seabream larvae
…………………………………………………………………………………………..
84
18:3n-1 0.00 0.05 0.00 0.00 0.03
18:4n-3 0.27 0.15 0.13 0.09 0.02
18:4n-1 0.05 0.02 0.02 0.01 0.00
20:0 0.39 0.34 0.33 0.33 0.32
20:1n-9 4.24 3.28 3.01 2.74 2.13
20:1n-7 0.00 0.00 0.00 0.00 0.00
20:1n-5 0.33 0.27 0.24 0.23 0.18
20:2n-9 0.05 0.06 0.04 0.04 0.02
20:2n-6 0.74 0.75 0.65 0.91 0.92
20:3n-9+n- 0.00 0.00 0.00 0.00 0.00
20:3n-6 0.06 0.04 0.03 0.03 0.02
20:4n-6 1.09 0.90 0.88 0.83 0.65
20:3n-3 0.44 0.43 0.41 0.47 0.41
20:4n-3 0.35 0.19 0.15 0.11 0.06
20:5n-3 4.95 4.16 4.01 4.14 3.29
22:1n-11 1.84 0.77 0.57 0.25 0.29
22:1n-9 1.34 1.07 0.96 0.89 0.30
22:4n-6 0.16 0.10 0.10 0.09 0.06
22:5n-6 0.19 0.16 0.14 0.16 0.12
22:5n-3 1.50 1.02 0.90 0.86 0.55
22:6n-3 16.87 16.64 15.55 14.92 13.53
Total Saturated 24.13±1.98a 23.27±1.72
ab 22.57±0.38
b 25.01±0.96
a 25.10±0.67
a
Total Monounsaturated 29.02±1.67b 27.50±1.99
b 33.26±2.01
a 29.10±1.92
b 19.72±1.58
c
Total n-3 26.95±1.3a 24.64±0.58
b 22.92±0.49
c 22.83±0.28
c 20.76±0.20
d
Total n-6 18.29±1.13c 21.08±3.15
cb 20.03±0.73
c 26.16±3.02
b 33.40±0.47
a
Total n-9 21.98±0.24bc
25.61±5.21ab
27.31±0.45a 18.56±3.86
bc 16.02±0.01
c
Total n-3HUFA 24.58±1.18a 22.44±0.67
ab 21.03±0.46
b 22.50±0.11
b 17.84±0.19
c
ARA 1.09±0.02a 0.90±0.06
b 0.88±0.01
b 0.83±0.10
b 0.65±0.00
c
EPA 4.95±0.22a 4.16±0.03
b 4.01±0.07
b 4.14±0.07
b 3.29±0.02
c
DHA 16.87±0.82a 16.64±0.86
a 15.55±0.36
b 14.92±0.31
b 13.53±0.18
c
EPA/ARA 4.54±0.32a 4.59±0.31
a 4.56±0.05
a 4.99±0.53
a 5.06±0.01
a
DHA/EPA 3.49±0.01b 3.75±0.24
ab 3.87±0.02
a 4.08±0.15
a 4.10±0.03
a
DHA/ARA 15.92±1.18b 17.28±2.27
ab 17.65±0.30
ab 20.43±2.95
ab 20.78±0.21
a
n-3/n-6 1.47±0.01a 1.04±0.12
b 1.14±0.01
b 0.95±0.1
b 0.62±0.01
c
Table 4.6 Fatty acids (% total area) composition in polar lipids of larvae fed increased
levels of SBL for 15 days. Values (mean ± standard deviation) with the same letters in
the same row are not significantly different (P>0.05)
0SBL 2 SBL 4 SBL 8 SBL 12 SBL
14:0 0.47 0.40 0.39 0.33 0.27
14:01 0.00 0.00 0.00 0.00 0.00
14:1n-5 0.01 0.01 0.01 0.02 0.00
14:1n-7 0.04 0.04 0.04 0.03 0.02
15:0 0.29 0.28 0.29 0.27 0.24
15:1n-5 0.01 0.02 0.01 0.00 0.01

Optimum soybean lecithin for seabream larvae
…………………………………………………………………………………………..
85
16:0 22.87 23.09 22.70 23.13 23.63
16:1n-9 0.00 0.00 0.00 0.00 0.00
16:1n-7 0.90 0.79 0.73 0.70 0.55
Met 16:0 0.11 0.10 0.09 0.08 0.08
16:1n-5 0.23 0.23 0.22 0.20 0.17
16:2n-6 0.57 0.52 0.54 0.48 0.37
16:2n-4 0.61 0.62 0.61 0.60 0.54
16:2n-3 0.00 0.00 0.00 0.00 0.00
17:0 0.27 0.27 0.25 0.25 0.19
16:3n-4 0.01 0.00 0.00 0.00 0.00
16:3n-3 0.09 0.09 0.09 0.09 0.08
16:3n-1 0.67 0.63 0.66 0.66 0.58
16:4n-3 0.39 0.40 0.46 0.30 0.24
16:4n-1 0.10 0.09 0.09 0.09 0.06
18:0 7.82 7.74 7.87 7.79 7.88
18:1n-9 11.79 11.97 12.93 9.82 8.61
18:1n-7 1.77 1.74 1.59 1.65 1.53
18:1n-5 0.18 0.16 0.16 0.15 0.12
18:2n-9 0.10 0.08 0.08 0.07 0.02
18:2 n-6 8.22 9.15 9.28 11.80 16.65
18:2n-4 0.03 0.02 0.02 0.01 0.00
18:3n-9 0.00 0.00 0.00 0.00 0.00
18:3n-6 0.08 0.10 0.10 0.10 0.10
18:4 n-6 0.00 0.00 0.00 0.00 0.00
18:3n-4 0.08 0.06 0.08 0.10 0.06
18:3n-3 0.42 0.38 0.33 0.46 0.60
18:3n-1 0.00 0.00 0.00 0.00 0.00
18:4n-3 0.02 0.01 0.01 0.01 0.00
18:4n-1 0.01 0.01 0.00 0.00 0.00
20:0 0.15 0.14 0.15 0.13 0.12
20:1n-9 1.10 0.94 0.95 0.84 0.69
20:1n-7 0.00 0.00 0.00 0.00 0.00
20:1n-5 0.12 0.10 0.10 0.09 0.08
20:2n-9 0.02 0.04 0.01 0.04 0.03
20:2n-6 0.52 0.54 0.53 0.63 0.68
20:3n-9+n- 0.01 0.01 0.00 0.00 0.00
20:3n-6 0.08 0.07 0.07 0.06 0.05
20:4n-6 1.82 1.79 1.76 1.65 1.48
20:3n-3 0.20 0.19 0.19 0.21 0.19
20:4n-3 0.14 0.10 0.09 0.06 0.04
20:5n-3 5.72 5.96 5.57 6.03 5.62
22:1n-11 0.13 0.06 0.05 0.03 0.03
22:1n-9 0.08 0.03 0.07 0.03 0.02
22:4n-6 0.07 0.06 0.06 0.05 0.04
22:5n-6 0.36 0.35 0.34 0.33 0.29
22:5n-3 1.34 1.16 1.09 0.98 0.79

Optimum soybean lecithin for seabream larvae
…………………………………………………………………………………………..
86
22:5n-6 0.36 0.35 0.34 0.33 0.29
22:5n-3 1.34 1.16 1.09 0.98 0.79
22:6n-3 29.47 29.41 29.32 29.62 27.18
Total Saturated 32.24±0.12a 31.90±1.22
a 31.64±0.04
a 31.88±0.49
a 32.32±0.07
a
Total Monounsaturated 16.35±1.10a 16.09±1.17
a 16.85±1.19
a 13.57±1.04
b 11.84±1.02
c
Total n-3 37.65±1.47a 37.71±1.43
a 37.14±0.36
a 37.77±0.54
a 34.76±0.40
b
Total n-6 11.86±0.83c 12.60±1.50
bc 12.67±0.02
bc 15.09±1.57
b 19.66±0.07
a
Total n-9 13.40±1.12ab
13.06±1.11ab
14.04±0.26a 10.79±1.54
bc 9.37±0.19
c
Total n-3HUFA 36.76±1.45a 36.84±1.34
a 36.25±0.37
a 36.91±0.51
a 33.83±0.39
b
ARA 1.82±0.11a 1.79±0.20
a 1.76±0.02
ab 1.65±0.05
ab 1.48±0.054
b
EPA 5.72±0.49a 5.96±0.01
a 5.57±0.24
a 6.03±0.11
a 5.62±0.01
a
DHA 29.47±0.62a 29.41±1.15
a 29.32±0.12
a 29.62±0.50
a 27.18±0.38
b
EPA/ARA 3.12±0.06b 3.35±0.38
ab 3.15±0.09
b 3.65±0.20
ab 3.80±0.14
a
DHA/EPA 5.16±0.33a 4.93±0.19
a 5.26±0.20
a 4.91±0.01
a 4.83±0.08
a
DHA/ARA 16.16±0.72b 16.50±1.22
ab 16.60±0.14
ab 17.95±0.95
ab 18.38±0.42
a
n-3/n-6 3.18±0.34a 3.02±0.47
a 2.93±0.03
a 2.51±0.22
a 1.767±0.02
b
Discussion
Regardless the dietary PL levels tested in the present study, the larvae were early
weand at 16 dph on the experimental microdiets without rotifers or Artemia and
produced very strong larvae (over 90% survival rate after a handling test) and high
survival rates (52-57 %). Indeed, survival rates were higher than those previously
obtained for marine fish larvae of this or other species fed only microdiets
(Zambonino-Infante and Cahu, 1999; Roo et al., 2005; Seiliez et al., 2006). Under
this conditions, increase of PL (49.4-95.9 g kg-1
in dry weight of diet) by the inclusion
of SBL from 0 to 120 g kg-1
did not affected larval survival or stress resistance,
suggesting that about 50 g kg-1
PL in the form of SBL is enough to maintain good
larval survival. In agreement, the increase from 100 to 120 g kg-1
PL in the form of
marine PL did neither improved larval survival in Atlantic cod (Gadus morhua)
(Wold et al., 2007) or pikerperch (Sander lucioperca) (Hamza et al., 2008) fed ranged
levels of SBL (up to 12%). Nevertheless, increased dietary PL up to 88.1 g kg-1
PL
(80 g SBL kg-1
diet) significantly improved gilthead seabream larvae growth both in
terms of total length and dry body weight.
Dietary polar lipids have been found to improve microdiet ingestion (Izquierdo and
Koven, 2010), that resulted in significant enhancement of digestive enzymes
activities, particularly, PLA2 and alkaline phosphatase, was found by the elevation of

Optimum soybean lecithin for seabream larvae
…………………………………………………………………………………………..
87
dietary PL up to 88.1 g kg-1
. Although marine fish larvae may have a wide range of
digestive enzymes for an efficient digestion (Kolkovski et al., 2009), the presence of
certain nutrients such as protein hydrolysates or short peptides can markedly
contribute to enhance digestive enzymes activity as well as intestine maturation
(Zambonino-Infante et al., 1999). Indeed, nutritional changes in the intestinal lumen
are well known to affect directly or indirectly (via hormones, growth factors and
cytokines) the epithelial cell function and differentiation in other vertebrates
(Sanderson and Naik, 2000).
Intestinal PLA2 activity has been determined in several fish species and catalyses the
hydrolysis of dietary PL, producing free fatty acids and lysoPL (Izquierdo and
Henderson, 1998). Despite dietary PL can be also hydrolysed by other lipolytic
enzymes such as bile salt activated non specific lipase, PLA2 has been found to be
more effective hydrolysing these type of lipids (Izquierdo and Henderson, 1998).
Indeed, in the present study, increase in dietary PL only slightly increased lipase
activity, whereas a linear substrate stimulatory effect of dietary SBL was found on
PLA2 activity. These results are in agreement with those obtained in larval seabass,
where PLA2 rather than lipase activity was increased in larvae fed increased PL
levels, regulation occurring mainly at the transcriptional level (Cahu et al., 2003a).
Lipase activity was markedly increased by dietary PL of marine origin in our previous
studies (Saleh et al., 2012a), denoting the high affinity of this enzyme for n-3 HUFA
esterified lipids (Izquierdo et al., 2000). Increased PLA2 activity in the present study
would imply a better digestion of dietary PL, both from SBL and from the marine
ingredients (squid meal and sardine oil), suggesting a better digestive utilization of
ARA, EPA and DHA, high in the later lipid sources. Trypsin activity was only
slightly affected by dietary SBL, being significantly higher only in larvae fed 88.1 g
PL kg-1
diet, in agreement with previous studies feeding marine PL in this (Saleh et al.
2012a) or other species (Wold et al., 2007). This moderated effect on trypsin activity
could be expected in these diets with similar protein contents, since this enzyme is the
most important proteolytic enzyme in the early life stage of marine fish larvae
(Ueberschär, 1993). Thus, the increase in trypsin could be more related to a general
improvement in gut maturation or the stimulation of nervous or hormonal control of
pancreatic secretion.
The intestinal alkaline phosphatase is an intestinal specific isozyme, localized in the

Optimum soybean lecithin for seabream larvae
…………………………………………………………………………………………..
88
apical brush border of the enterocyte and enriched in surfactant-like particles, which
is involved in nutrition processes, intestinal transport and intestinal inflammation in
vertebrates, including fish (Bates et al., 2007). Since, this enzyme is intimately
associated with the hydrophobic core of the intestinal microvillus membrane, its
functioning is directly dependant on the development of this structure and it shows a
sharp increase in activity during the post-embryonic development of mammals and
fish (Bates et al. 2007). Consequently, the intestinal alkaline phosphatase has been
used as a marker for enterocyte maturation in vertebrates (Zambonino-Infante and
Cahu, 2001; Cahu et al., 2003; Bates et al., 2007; Saleh et al., 2012a). Nutritional
factors, such as dietary lipids, have been found to affect alkaline phosphatase activity
in mammals, as a result of the increase in the number of enterocytes that can express
these enzymes (Sanderson and Naik, 2000). Indeed, increase in dietary PL improved
the activity of this enzyme and enterocyte maturation in larvae fed increased PL
(MacQueen Leifson et al., 2003; Wold et al., 2007; Saleh et al., 2012a). However, the
phospholipid source used in these three studies was of marine origin, rich in n-
3HUFA, known to markedly affect cell differentiation and proliferation in several
tissues (Izquierdo and Koven, 2010) and particularly in intestine (Sanderson and
Naik, 2000). The present study shows that n-3 HUFA free source of PL, the SBL rich
in linoleic acid (LA), also increases alkaline phosphatase activity in gilthead seabream
larvae reflecting an improvement in enterocyte maturation.
Dietary PL are hydrolysed mainly to free fatty acids and 1-acyl lyso-glyceroPL that
are absorbed by the intestinal mucosal cells (Izquierdo and Henderson, 1998), where
they are re-acylated to form PL mainly by the glycerol-3-phosphate pathway as
demonstrated by Caballero et al. (2006a). In gilthead seabream, phospholipid
synthesis is mainly regulated by two enzymes of this pathway diacylglycerol choline
phosphotransferase and diacylglycerol ethanolamine phosphotransferase, whose
activity can be modulated through dietary lipids (Caballero et al., 2006a). Thus,
elevation of dietary soybean oil, rich in linoleic acid, increases PL synthesis,
particularly PC, in gilthead seabream enterocytes (Caballero et al., 2006a). In
agreement, in the present study, elevation of dietary SBL and, consequently, in PLA2
activity, would have increased the presence of substrates for these reacilation
enzymes promoting PL synthesis in the enterocyte, which in turn would have
stimulated membrane formation for both cell organelles and cell membrane

Optimum soybean lecithin for seabream larvae
…………………………………………………………………………………………..
89
promoting enterocyte and brush border maturation. Indeed, larvae of this study (15-30
dph) were in the most critical phase of digestive tract development (phase IV) in
gilthead seabream, when connective tissue starts to develop and the first mucosal
folds appear (Elbal et al., 2004).
The improved gut maturation caused by the increased dietary SBL contents would
improve digestive and absorptive utilization of dietary nutrients from the
experimental microdiets, what could contribute to the improved growth rates. Besides,
nutrient transport could have been also improved contributing to dietary nutrients
utilization. For instance, dietary linoleic acid, high in SBL, has been found to increase
lipoprotein, particularly VLDL, synthesis and composition, (Caballero et al., 2003,
2006b) in gilthead seabream juveniles. Moreover, in gilthead seabream larvae dietary
SBL markedly increases lipoproteins synthesis in larval gut (Liu et al., 2002),
promoting dietary lipids and proteins transport. In agreement, addition of SBL in
microdiets for gilthead seabream improves enterocytes morphology and reduces lipid
droplets accumulation (Salhi et al., 1999; Izquierdo et al., 2000). Indeed, lipid
transport may be a more important limiting factor for utilization of dietary lipids in
marine fish larvae than lipid digestion according to the results of Morais et al. (2006).
Improved lipid digestion, absorption and transport can be also responsible for the high
incorporation of ARA, EPA and DHA into polar lipids of larvae fed increased levels
of SBL in the present study. Thus, despite the levels of this fatty acids were lower in
both total and polar lipids of the experimental diets containing increased levels of
SBL, the contents of these fatty acids in the larvae fed up to 88.1 g PL kg-1
diet
remained unchanged in larval PL, and almost constant in larval NL. However, further
increase in dietary PL up to 95.9 g kg-1
diet (120 g SBL kg-1
diet) markedly reduced
the contents of these three essential fatty acids in both larval NL and PL. This
reduction can be related to the high content in linoleic acid in SBL, since this fatty
acid not only promotes PL synthesis, particularly PC (Caballero et al., 2006a), but is
also specifically incorporated into gilthead seabream PL (Izquierdo et al., 2003;
Ganga et al., 2005) and it is highly retained in this fraction even after months of being
removed from the diet (Izquierdo et al., 2005). Therefore, the high linoleic acid
content (52.1 g kg-1
in dry weight basis) of diets containing 95.9 g PL kg-1
diet (120 g
SBL kg-1
) could have compete for incorporation of ARA, EPA and DHA into larval
lipids, in turn reducing the increase in larval growth caused by dietary SBL addition.

Optimum soybean lecithin for seabream larvae
…………………………………………………………………………………………..
90
From these results, an 80 g kg-1
SBL inclusion in microdiets for gilthead seabream
larvae could be recommended, since further increase does not improve larval growth
and survival and could reduce the DHA incorporation into the different larval tissues.
Thus, a 50 % increase in final dry weight was obtained by the increase in SBL from 0
to 80 g kg-1
SBL, as it occurs in pikerperch larvae when SBL is increased from 15 to
95 g kg-1
(Hamza et al., 2008), being the requirements similar for both fish species.
However, higher SBL levels (120 g kg-1
) are required in microdiets for European sea
bass (Cahu et al., 2003a). Our former studies in larval gilthead seabream fed
microdiets with a similar formulation to those used in the present study, showed a
higher requirement for PL (100 g kg-1
) when a marine PL source was used (Saleh et
al., 2012a). Finally, Further studies are being conducted to compare the effectiveness
of the different sources of dietary PL.
Acknowledgements
This study was partially supported by a grant from the Spanish Agency of
International Cooperation and Development (AECID) to Reda Saleh Mohamed
Ibrahim. The present study was partly funded by the Spanish Ministry of Sciences and
Education (AGL2009-14661). Also, this work has been partly funded under the EU
seventh Framework Program by the ARRAINA project No
288925: Advanced
Research Initiatives for Nutrition and Aquaculture.

Krill phospholipids vs soybean lecithin for seabream larvae
…………………………………………………………………………………………..
91
Chapter 5
-----------------------------------------------------------------------------
Effect of krill phospholipids vs soybean lecithin in
microdiets for gilthead seabream (Sparus aurata) larvae on
molecular markers of antioxidative metabolism and bone
development
This work has been submitted to Aquaculture Nutrition
Abstract
The objective of the present study was to compare the effectiveness of dietary marine
phospholipids (MPL) obtained from krill and soybean lecithin (SBL) on the rearing
performance and development of seabream (Sparus aurata) larvae. Larvae were fed
from 16 to 44 day post hatching (dph) five formulated microdiets with three different
levels (5, 7 or 9 %) of phospholipids (PL) obtained either from a MPL or a SBL
source. Larvae fed MPL showest a higher survival, stress resistance and growth than
those fed SBL, regardless the dietary PL level. Overall, the increase in MPL up to 7%
total PL in diet was enough to improve larval gilthead seabream performance,
whereas even the highest SBL inclusion level (9% PL) was not able to provide a
similar success in larval growth or survival. Inclusion of SBL markedly increased the
proxidation risk as denoted by the higher TBARs in larvae, as well as a higher
expression of CAT, GPX and SOD genes. Moreover, SBL tend to produce larvae
with a lower number of mineralized vertebrae and a lower expression of OC, OP and
BMP4 genes.Finally, increasing dietary MPL or SBL lead to a better assimilation of
polyunsaturated fatty acids in the larvae, n-3HUFA (especially 20:5n-3) or n-6 fatty
acids (especially 18:2n-6), respectively. In conclusion, MPL had a higher
effectiveness in promoting survival, growth and skeletal mineralization of gilthead
seabream larvae in comparison to SBL.

Krill phospholipids vs soybean lecithin for seabream larvae
…………………………………………………………………………………………..
92
Introduction
A main objective in fish larval nutrition is to formulate an effective compound diet
able to substitute live preys as early as possible during larval development (Watanabe
and Kiron, 1994). Such inert diet must be attractive, adequated to fit larval mouth size
and should be able to fulfil the nutritional requirements of the larvae (Kolkovski et
al., 2009). Among the different nutrients, phospholipids (PL) have been found to play
essential roles in larval development (Izquierdo and Koven, 2010), their contents in
larval inert diets markedly affecting larval performance (Kanazawa et al., 1981,
1983a, b; Sargent et al., 2002).Thus, various studies have demonstrated that the
inclusion of dietary phospholipids leads to better growth and survival rates, a higher
fish resistance to stress, and a reduced incidence of skeletal deformities in larvae
(Kanazawa, 1993; Takeuchi et al., 1992; Salhi et al., 1999; Izquierdo et al., 2001;
Kjørsvik et al., 2009; Izquierdo and Koven, 2010; Saleh et al., 2012a, b) and early
juveniles (Coutteau et al., 1997). Marine fish larvae have a high capacity to utilize
phospholipids (Geurden et al., 1998b; Salhi et al., 1999; Izquierdo et al., 2001) and
inert diets containing marine phospholipids rather than marine triacylglycerides
(TAG) resulted in better larval growth (Izquierdo et al., 2001; Cahu et al., 2003a;
Gisbert et al., 2005). PL are the main structural components of cell membranes
bilayers (Kagan et al., 1984), but also play an important structural role in digestion,
promoting the utilization of dietary neutral lipids (Olsen and Ringø, 1997). For
instance, elevation of dietary PL levels significantly increases both neutral lipase and
phospholipase A2 activity in gilthead seabream larvae (Saleh et al., 2012a, b). Several
authors had also suggested a significant role of PL in the intestinal absorption of
lipids in marine fish larvae and early juveniles (Coutteau et al., 1997; Fontagne et al.,
1998; Salhi et al., 1999). More recently, it has been demonstrated that dietary PL
contribute to the assimilation of dietary lipids by enhancing the enteric lipoprotein
synthesis required for the extra-cellular transport of lipids (Liu et al., 2002; Hadas et.
al., 2003). Moreover, inclusion of PL in early weaning diets markedly increases
alkaline phosphatase activity denoting a better development of fish digestive system
(Saleh et al., 2012a,b). Besides, they seem to affect inert diets palatability and could
contribute to supply essential components such as choline and inositol (Tocher et al.,
2008).

Krill phospholipids vs soybean lecithin for seabream larvae
…………………………………………………………………………………………..
93
Early studies also showed a positive effect of dietary PL inclusion on skeletal
development of fish larvae, chicken egg lecithin reducing the incidence of certain
bone malformations such as twisted jaw and scoliosis (Kanazawa et al., 1981).
Inclusion of PL rich in n-3 polyunsaturated fatty acids in early weanning diets for cod
induced a faster ossification and a higher number of fin rays in comparison to the
control group (Kjørsvik et al., 2009). However, little is known on the phisiological
mechanisms implied in this effect. Transcription factors, growth factors, cell surface
receptors, cell adhesion molecules and extracellular matrix molecules are all involved
in the four basic processes of skeletal cell and tissue differentiation, which include:
migration of skeletogenic cells to the site of future skeletogenesis, epithelial-
mesenchymal interactions, cell condensation and cell differentiation. For instance, a
very high correlation between developmental age and gene expression for osteocalcin,
a matrix mineralization protein and a marker for late bone cell differentiation, was
found in fish fed high PI dietary levels (Sandel et al., 2010). Therefore, these effects
could be also related to the different PL classes composition of each PL source
(Geurden et al., 1998a, b). Indeed certain membrane PL, such as phosphatidyl
inositols (PI), are precursors of second messengers regulating calcium entry into the
cells and are involved in a signaling system controlling biological processes in the
early development of vertebrates (Berridge and Irvine, 1989).
Thus, PL include a large group of compounds and their function in larval
development could be related to their specific composition, both in type of lipid
classes and fatty acids contents. For instance, inclusion of PL from marine origin
(bonito eggs), rich in n-3 highly unsaturated fatty acids, improve growth and survival
of larval ayu (Plecoglossus altivelis) more effectively than PL from a vegetal source
(Kanazawa et al., 1981). Similarly, higher length and weight are obtained in gilthead
seabream larvae fed marine PL (squid) than soybean lecithin (Salhi et al., 1999).
Recently, seabream growth, hepatic utilization of dietary lipids and gut health were all
improved when 2.5% dietary soybean lecithin was substituted by krill PL (Betancor et
al., 2012b). However, there are no studies comparing both PL sources at several
dietary contents, which are close to the optimum levels for each PL source as
determined in previous studies (Saleh et al., 2012a, b).
Different fatty acid profiles in the dietary PL could differently affect the susceptibility
of larval tissue lipids to peroxidative damage. Lipid peroxidation is recognized as
being highly deleterious, resulting in damage to cellular biomembranes (Kanazawa,

Krill phospholipids vs soybean lecithin for seabream larvae
…………………………………………………………………………………………..
94
1993) and subcellular membranes, such as those of mitochondria, causing several
pathological conditions in fish (Sakai et al., 1989). The detrimental effects of
peroxidative risk include the oxidative damage to molecules of high biological
importance – lipids, proteins, carbohydrates and/or DNA causing alterations that can
lead to cell death (Halliwell and Gutteridge, 2007). To be protected from this
peroxidation risk, fish have an endogenous antioxidant defence system, including
radical scavenging enzymes such as catalase (CAT), superoxide dismutase, (SOD)
and glutathione peroxidase (GPX) (Halliwell and Gutteridge, 1996). Peroxidative risk
seems to be even higher in marine fish larvae than in juveniles, due to the large
surface area to volume ratio of microdiets, the very high larval tissue content in
polyunsaturated fatty acids and the higher water contents, and, hence, a functional
defence against oxidised fat is more important than at later stages of fish life cycle
(Betancor, 2012). However, few studies have been aimed to determine the effect of
dietary nutrients, and particularly PL on the oxidative status of marine fish larvae. PL
requirements for marine fish larvae range between 5 and 10% in microdiets. For
instance, the optimum PL dietary levels determined for red seabream (Pagrus major)
larvae are 5% SBL (Kanazawa et al., 1983a), 7% SBL for Japanese flounder
(Paralichthys olivaceus) (Kanazawa, 1993) and 12% SBL for European sea bass
(Dicentrarchus labrax) (Cahu et al., 2003a). For gilthead seabream (Sparus aurata)
our previous studies feeding 5 different dietary levels have shown an optimum dietary
level of 8 % PL when SBL (Saleh et al., 2012b) was used as a dietary PL source and a
10% PL when krill PL were used (Saleh et al., 2012a). Although a lower amount of
SBL seems to be sufficient to fulfil the PL requirements of gilthead seabream larvae,
the value of SBL in promoting fish larvae growth and survival could be lower.
Thus, the aim of the present study was to compare the effectiveness of both PL
sources, krill phospholipids and SBL, to promote gilthead seabream (Sparus aurata)
larvae development, when they are included at optimum levels in early weanning
diets. For that porpuse, PL from either SBL or krill PL were included at three
different dietary levels that were either deficient or optimum, and their effects on
survival, stress resistance, growth, skeleton malformation, bone mineralization,
biochemical composition, oxidative status and selected genes expression in gilthead
seabream larvae were studied.

Krill phospholipids vs soybean lecithin for seabream larvae
…………………………………………………………………………………………..
95
Materials and methods
Gilthead seabream larvae were obtained from natural spawnings of GIA (Grupo de
Investigación en Acuicultura (GIA), Las Palmas de Gran Canaria University
(ULPGC), Spain) broodstock. Larvae (initial total length 5.5 mm, dry body weight
125 !g) previously fed rotifers (Brachinous plicatilis) enriched with DHA Protein
Selco®
(INVE, Dendermond, Belgium) until they reached 16 days old, were randomly
distributed in 15 experimental tanks at a density of 2100 larvae tank-1
and fed one of
the experimental early weanning diets tested in triplicates for 29 days. All tanks (200
L fibreglass cylinder tanks with conical bottom and painted a light grey colour) were
supplied with filtered seawater (37 ppm salinity) at an increasing flow rate of 0.4 - 1.0
L/min to assure the good water quality during the entire trial. Water entered from the
tank bottom and exited from the top to ensure water renewal and maintain high water
quality, which was tested daily and no deterioration was observed. Water was
continuously aerated (125 ml min-1) attaining 6.5±1 ppm dissolved O2. Average
water temperature and pH along the trial were 19.3±2°C and 7.85, respectively.
Photoperiod was kept at 12h light: 12h dark, by fluorescent daylights and the light
intensity was kept at 1700 lux (digital Lux Tester YF-1065, Powertech Rentals,
Western Australia, Australia).
Five experimental microdiets (pellet size 250-500 !m) with increasing phospholipid
contents of krill phospholipids (Qrill, high phospholipids, Aker BioMarine,
Fjordalléen, Norway) and soybean lecithin (Agramar S.A., Spain) were formulated
containing 20 % total lipids, 60% crude proteins and over 3% n-3 HUFA, which
covered the essential fatty acid requirements of gilthead seabream larvae (Izquierdo
and Koven, 2010; Hemre et al., in press). Their formulation and proximate analysis
are shown in Table 5.1. The fatty acids composition of total and polar lipids of the
experimental diets are shown in Tables 5.4 and 5.5. The desired lipid content (about
21% DW) was completed if necessary with a non-essential fatty acid source, oleic
acid (Oleic acid vegetable, Merck, Darmstadt, Germany). The microdiets were
prepared by mixing squid powder and water-soluble components, then the lipids and
fat-soluble vitamins and, finally, gelatine dissolved in warm water. The paste was
compressed pelleted (Severin, Suderm, Germany), dried in an oven at 38 ºC for 24 h
(Ako, Barcelona, Spain). Pellets were ground (Braun, Kronberg, Germany) and sieved

Krill phospholipids vs soybean lecithin for seabream larvae
…………………………………………………………………………………………..
96
(Filtra, Barcelona, Spain) to obtain a particle size between 250 to 500 !m. Diets were
prepared and analyzed for proximate and fatty acid composition at GIA laboratories.
Diets were manually supplied fourteen times per day each 45 min from 9:00 to 19:00
for 29 days. Non-enriched rotifers were co-fed during days 16th
and 17th
(1 rotifer/ml).
To assure feed availability, daily feed (pellet size < 250 !m) supplied was maintained
at 1.5 and 2.5 g per tank during the first and second week of feeding. The amount of
feed added daily was gradually increased to 4-5 g per tank with increasing in pellet
size to 250–500!m, where an overlap using a mixture of both pellets sizes was
conducted during the third and forth week of feeding. Larvae were observed under the
binocular microscope to determine feed acceptance.
Table 5.1 Formulation and proximate composition of the experimental microdiets
containing several levels of either krill phospholipids or soybean lecithin
Ingredients (g/100 g diet) Control 7 MPL 9 MPL 7 SBL 9 SBL
Squid powdera 69 69 59.50 69.5 69.5
Krill PLb 0 13 21 0 0
Soybean lecithinc 0 0 0 4.5 8.5
Sardine oild 5.5 0 3 0 0
Oleic acide 9 1.5 0 9.5 5.5
Basal premix 16.5 16.5 16.5 16.5 16.5
Proximate analysis % dry weight
Lipid 19.34 20.13 22.10 21.21 22.23
Protein 61.23 58.89 61.00 60.74 61.48
Ash 7.20 7.5 7.43 7.30 7.39
Moisture 8.7 8.1 9.9 7.8 8.4
Lipid classes composition
Wax/Sterol esters 0.86 0.90 0.37 0.41 0.39
Triacylglycerols 5.38 7.13 4.42 3.00 4.10
Free fatty acids 5.47 2.53 3.60 6.89 4.90
Cholesterol/Sterols 2.58 2.05 4.28 3.12 2.70
Total neutral lipids 14.30 12.61 12.67 13.42 12.08
Glycolipid 0 0.28 0.55 0.22 0.52
Phosphatidylethanolamine 1.68 1.68 2.57 2.32 2.59
Phosphatidylglycerol/cardiolipin 0.00 0.00 0.00 1.42
Phosphatidylinositol 0.56 0.40 0.81 1.17 1.43
Phosphatidylserine 0.39 0.15 0.60 0.47 0.55
Phosphatidylcholine 1.82 3.98 4.04 2.6 2.46
Sphingomyelin 0.1 0 0.23 0.13
Lysophosphatidylcholine 0.17 0.89 0.76 0.24 0.13
Total polar lipid 4.71 7.38 9.33 7.27 9.40
PC/PI 3.25 9.95 4.99 2.22 1.72 a Rieber and Son, Bergen, Norway.
b Qrill, high phospholipids, Aker BioMarine, Fjordalléen, Norway.
c Agramar S.A., Spain.
d Agramar S.A., Spain.
e Merck KGaA, Darmstadi, Germany.

Krill phospholipids vs soybean lecithin for seabream larvae
…………………………………………………………………………………………..
97
Before the end of the experiment an activity test was conducted by handling 25
larvae/tank out of the water in a scoop net for 1.5 min and subsequently allocating
them in another tank supplied with clean seawater and aeration, to determine survival
after 24 hours. Final survival was calculated by individually counting all the living
larvae at the beginning and at the end of the experiment. Growth was determined by
measuring dry body weight (105ºC 24 h) and total length (Profile Projector V-12A
Nikon, Tokyo, Japan) of 30 fish tank-1
at the beginning, in the middle and at the end
of the trial. In addition, at the end of the trial and after 12 h of starvation, the all larvae
in each tank were washed with distilled water, sampled and kept at -80 ºC for
biochemical composition. Fresh larvae samples (100 mg tank-1
) for molecular biology
analysis were well washed and conserved into 500 ml RNA Later (SIGMA), a
product that rapidly allows tissue to stabilize, protects cellular RNA in situ in
unfrozen samples and permits to posterior RNA isolation. The larvae were stored in
RNA Later overnight at 4 ºC and after that RNA Later was removed before being
stored at – 80 ºC to prevent the formation of salt crystals.
Sixty larvae of 44 dph were randomly chosen per diet and kept in formaldehyde for
posterior whole mount staining. Staining procedures with alizarin red were conducted
to evaluate the skeletal anomalies and vertebral mineralization (Izquierdo et al.,
2012).
Moisture (A.O.A.C., 1995), protein (A.O.A.C., 1995) and lipid (Folch, 1957) contents
of larvae and diets were analyzed. Fatty acid methyl esters were obtained by
transmethylation of crude lipids as described by Christie (1982). Fatty acid methyl
esters were separated by GLC (GC -14A, Shimadzu, Tokyo, Japan) in a Supercolvax-
10-fused silica capillary column (length: 30 m; internal diameter: 0.32 mm; Supelco,
Bellefonte, USA) using helium as a carrier gas. Column temperature was 180 ºC for
the first 10 min, increasing to 215 ºC at a rate of 2.5 ºC/min and then held at 215 ºC
for 10 min. Fatty acid methyl esters were quantified by FID (GC -14A, Shimadzu,
Tokyo, Japan) following the conditions described in Izquierdo et al. (1990) and
identified by comparison to previously characterized standards and GLC-MS.

Krill phospholipids vs soybean lecithin for seabream larvae
…………………………………………………………………………………………..
98
The measurement of TBARS in triplicate samples was performed using a method
adapted from that used by Burk et al. (1980). Approximately 20-30 mg of larval tissue
per sample were homogenized in 1.5 ml of 20% trichloroacetic acid (w/v) containing
0.05 ml of 1% BHT in methanol. Then, 2.95 ml of freshly prepared 50mM
thiobarbituric acid solution were added to the sample before mixing and heating for
10 minutes at 100ºC. After cooling protein precipitates were removed by
centrifugation (Sigma 4K15, Osterode am Harz, Germany) at 2000 x g, the
supernatant was read in a spectrophotometer (Evolution 300, Thermo Scientific,
Cheshire, UK) at 532 nm. The absorbance was recorded against a blank at the same
wavelength. The concentration of TBA-malondialdehyde (MDA) expressed as !mol
MDA per g of tissue was calculated using the extinction coefficient 0.156 !M-1
cm1.
Molecular biology analysis were carried out at IUSA (Instituto Universitario de
Sanidad Animal, ULPGC, Spain). Total RNA from larvae samples (average weight
per sample 60mg) was extracted using the Rneasy Mini Kit (Qiagen). Total body
tissue was homogenised using the TissueLyzer-II (Qiagen, Hilden, Germany) with
QIAzol lysis reagent (Qiagen). Samples were centrifuged with chloroform for phase
separation (12000g, 15min, 4ºC). The upper aqueous phase containing RNA was
mixed with 75% ethanol and transferred into an RNeasy spin column where total
RNA bonded to a membrane and contaminants were washed away by RW1 and RPE
buffers (Qiagen). Purified RNA was eluted with 30ml of RNase-free water. The
quality and quantity of RNA were analysed using the NanoDrop 1000
Spectrophotometer (Thermo Scientific, Wilmington, DE, USA). Synthesis of cDNA
was conducted using the iScript cDNA Synthesis Kit (Bio-Rad) according to
manufacturer’s instructions in an iCycler thermal cycler (Bio-Rad, Hercules, CA,
USA). Primer efficiency was tested with serial dilutions of a cDNA
pool (1, 1:5, 1:10, 1:15,1:20 and 1:25). The product size of the real-time q
PCR amplification was checked by electrophoresis analyses using
PB322 cut with HAEIII as a standard. Real-time quantitative PCR was performed in
an iQ5 Multicolor Real-Time PCR detection system (Bio-Rad, Hercules, CA, USA)
using "-actin as the house-keeping gene in a final volume of 20ml per reaction well,
and 100ng of total RNA reverse transcribed to complementary cDNA. Each gene
sample was analysed once per gene. The PCR conditions were the following: 95ºC
for 3min 30sec followed by 40 cycles of 95ºC for 15sec, 61ºC for 30sec, and 72ºC

Krill phospholipids vs soybean lecithin for seabream larvae
…………………………………………………………………………………………..
99
for 30sec; 95ºC for 1min, and a final denaturing step from 61ºC to 95ºC for 10sec.
Data obtained were normalised and the Livak method (2–!!Ct
) used to determine
relative mRNA expression levels. Gilthead seabream specific gene primers were
designed after searching the NCBI nucleotide database and using the Oligo 7 Primer
Analysis software (Molecular Biology Insights, Cascade, CO, USA). Detailed
information on primer sequences and accession numbers is presented in Table 5.2.
All data were tested for normality and homogeneity of variances with Levene´s test,
not requiring any transformation and were treated using one-way ANOVA. Means
compared by Duncan’s test (P < 0.05) using a SPSS software (SPSS for Windows
11.5; SPSS Inc., Chicago, IL, USA).
Table 5.2 Sequences of forward and reverse primers (5’-3’) for real-time quantitative-
PCR of seabream genes Gene Primers Accession n
o
Catalase(CAT) Forward primer: 5´-ATGGTGTGGGACTTCTGGAG-3´
Reverse primer: 3´-AGTGGAACTTGCAGTAGAAAC-5´
FJ860003
Superoxide
dismutase (SOD)
Forward primer: 5´- AAGAATCATGGCGGTCCTACTGA-3´
Reverse primer: 3´- TGAGCATCTTGTCCGTGATGTCT -5´
AJ937872
Glutathione
peroxidase (GPX)
Forward primer: 5´- TCCATTCCCCAGCGATGATGCC-3´
Reverse primer: 3´- TCGCCATCAGGACCAACAAGGA-5´
DQ524992
Osteocalcin Forward primer: 5´-AGCCCAAAGCACGTAAGCAAGCTA-3´
Reverse primer: 3´- TTTCATCACGCTACTCTACGGGTT-5´
AF048703
Osteopontin Forward primer: 5´- AAGATGGCCTACGACATGACAGAC- 3´
Reverse primer: 3´- CCTGAAGAGCCTTGTACACCTGC-5´
AY651247
Osteonectin Forward primer: 5´- AAAATGATCGAGCCCTGCATGGAC-3´
Reverse primer: 3´- TACAGAGTCACCAGGACGTT-5´
AY239014
aRUNX2 Forward primer: 5´- GCCTGTCGCCTTTAAGGTGGTTGC-3´
Reverse primer: 3´- TCGTCGTTGCCCGCCATAGCTG-5´
AJ619023
Alkaline
phosphatase
Forward primer: 5´- AGAACGCCCTGACGCTGCAA-3´
Reverse primer: 3´- TTCAGTATACGAGCAGCCGTCAC-5´
AY266359
Matrix Gla protein Forward primer: 5´- GTGCCCTCCTTCATTCCAC-3´
Reverse primer: 3´- TATGACCACGTTGGATGCCT-5´
AY065652
bBMP4 Forward primer: 5´- CCACCAGGGCAGACACGTCC-3´
Reverse primer: 3´- GCGTAGCTGCTCCCAGTCCTC-5´
FJ436409
"-actin Forward primer: 5´- TCTGTCTGG ATC GGAGGCTC-3´
Reverse primer: 3´- AAGCATTTG CGGTGGACG -5´
X89920
a Runx2 (Runt-related transcription factor 2).
b BMP-4 (Bone morphogenetic protein 4).

Krill phospholipids vs soybean lecithin for seabream larvae
…………………………………………………………………………………………..
100
Results
All the experimental diets were well accepted by gilthead seabream larvae according
to the microscopic observations. Larvae fed diets without PL supplementation
(Control diet) showed a very low survival rate at the end of the trial (Figure 5.1).
Inclusion of SBL, increasing dietary PL up to 9%, significantly (P>0.05) increased
larval survival, but inclusion of MPL even at only 7% dietary PL increased larval
survival even further than SBL. Thus, larvae fed 9 MPL and 7 MPL diets significantly
showed the highest survival. Larval resistance to stress, determined as the survival
rate after handling, increased with increasing of dietary PL levels, being highest for
larvae fed any of the MPL diets (P>0.05). On the contrary, larvae fed 0 PL and 4 PLS
had a marked drop in survival after stress (Figure 5.2).
The larval growth after thirty days of feeding was significantly lowest in larvae fed
the Control diet without PL supplementation and, although the diet 7 SBL was not
able to significantly (P>0.05) increase final total length, further elevation of SBL in
diet 9 SBL significantly (P>0.05) improved this parameter (Figure 5.3). Besides,
inclusion of MPL proportionally increased final total length, being for larvae fed both
7 MPL and 9 MPL significantly (P>0.05) higher than Control or SBL larvae. Final
larval total length was also correlated to the dietary n-3 HUFA levels (Figure 5.4),
regardless the PL source used (y = 0.5096x + 7.0074, R! = 0.92768). In terms of body
weight, larvae fed 9 MPL were significantly (P>0.05) the biggest, followed by 7
MPL, then 9 SBL and, finally, Control and 7 SBL larvae, which were not
significantly different between them (Figure 5.5).

Krill phospholipids vs soybean lecithin for seabream larvae
…………………………………………………………………………………………..
101
Figure 5.1 Survival rate of larvae (44 dph) fed three dietary PL levels using two
different PL sources. Values (mean ± standard deviation) with the same letters were
not significantly different (P>0.05).
Figure 5.2 Survival rate (24 hours after activity test) of larvae (44 dph) fed three
dietary PL levels using two different PL sources. Values (mean ± standard deviation)
with the same letters were not significantly different (P>0.05).
y = -0.8125x2!"!#$%&&'(!"!%)$&&'!
*+!,!%!
y = 0.0069x2 + 1.5556x + 16 R2 = 1
10
15
20
25
30
35
40
45
5 6 7 8 9 10
Su
rviv
al
%
Polar Lipids (% of dry diet)
MPL
SBL
d
b
c
a
a
d
y = -0.8646x2 + 9.9583x + 74
R2 = 1
y = 0.2188x2 + 1.125x + 74
R2!,!%!
70
75
80
85
90
95
100
105
5 6 7 8 9 10
Su
rviv
al %
Polar Lipids (% of dry diet)
MPL
SBL
c
b
a a
d

Krill phospholipids vs soybean lecithin for seabream larvae
…………………………………………………………………………………………..
102
Figure 5.3 Total length of larvae (44 dph) fed three dietary PL levels using two
different PL sources. Values (mean ± standard deviation) with the same letters were
not significantly different (P>0.05).
Figure 5.4 Correlation between total length of larvae (44 dph) fed three dietary PL
levels using two different PL sources and dietary n-3 HUFA. Values (mean ±
standard deviation) with the same letters were not significantly different (P>0.05).
y = -0.1791x! + 1.6962x + 8.6 R2 = 1
y = 0.0059x2 + 0.0737x + 8.6 R2 = 1
7
8
9
10
11
12
13
14
5 6 7 8 9 10
To
tal Len
gth
(m
m)
Polar Lipids (% dry diet)
MPL
SBL
d
cd
c
b
a
y = 0.5096x + 7.0074 R! = 0.92768
7
8
9
10
11
12
13
14
0 2 4 6 8 10 12
To
tal Len
gth
(m
m)
Dietary n-3 HUFA (% dry diet)
Control SBL
MPL
d cd
c
b
a

Krill phospholipids vs soybean lecithin for seabream larvae
…………………………………………………………………………………………..
103
Figure 5.5 Dry whole body weight of larvae (44 dph) fed three dietary PL levels using
two different PL sources. Values (mean ± standard deviation) with the same letters
were not significantly different (P>0.05).
The effects the different dietary PL levels on skeletal mineralization were analyzed
considering the average number of mineralized vertebrae for a given larval size. In
general, there was a promoting effect of dietary MPL on the skeletal mineralization.
For instance, in the size group 12.40-13.40 mm, when most of the larvae started
mineralization of vertebrae, the average number of mineralized vertebrae was 10, 16,
18, 12 and 14 for fish fed diets Control, 7 MPL, 9MPL, 7 SBL and 9 SBL,
respectively (Figures 5.6 and 5.7, Table 5.3).
The skeletal anomalies study showed that larvae fed 9 MPL had the lowest percentage
of total skeletal anomalies incidence en comparison with the other treatments, the
larvae fed Control, 7SBL and 9SBL diet had the highest incidence of lordosis (10 %),
and larvae fed 9 SBL had higher incidence of kyphosis (13 %). The larva fed 7MPL
diets had lowest mandibula and maxilla anomalies (Figure 5.8).
y = -72.531x2 + 649.87x + 876 R2 = 1
y = 8.8646x2 - 25.292x + 876 R2 = 1
500
1000
1500
2000
2500
3000
5 6 7 8 9 10
Dry W
eig
ht
(u
g)/
Larvae
Polar Lipids (% dry diet)
MPL
SBL
d
c
b
d
a

Krill phospholipids vs soybean lecithin for seabream larvae
…………………………………………………………………………………………..
104
! "
C D
E
Figure 5.6 Representative pictures of mineralized vertebrae of larvae (44 dah) fed
three dietary PL levels using two different PL sources, (A: Control; B: 7 MPL;
C: 9 MPL; D: 7 SBL; E: 9 SBL.

Krill phospholipids vs soybean lecithin for seabream larvae
…………………………………………………………………………………………..
105
Table 5.3 Average numbers of mineralized vertebrae of larvae (44 dah) fed three
dietary PL levels using two different PL sources
Average number of mineralized vertebrae
Size class Length (mm) Control 7 MPL 9 MPL 7 SBL 9 SBL
1 8.409-8.909 0 n.a. n.a. n.a. n.a.
2 8.909-9.409 0 n.a. n.a. n.a. n.a.
3 9.409-9.909 0 n.a. n.a. n.a. n.a.
4 9.909-10.409 1 0 n.a. 0 2
5 10.409-10.909 2 2 n.a. 2 0
6 10.909-11.409 3 2 n.a. 1 4
7 11.409-11.909 6 3 n.a. 2 2
8 11.909-12.409 0 5 n.a. 5 10
9 12.409-12.909 8 12 15 9 12
10 12.909-13.409 13 20 21 15 17
11 13.409-13.909 n.a. n.a. 20 n.a. n.a.
12 13.909-14.409 n.a. n.a. 22 n.a. n.a.
13 14.409-14.909 n.a. n.a. 23 n.a. n.a.
% Normal larvae 8.409-14.909 71 84 80 73 71
*n.a. : not available.
Figure 5.7 Graphical representation of the average number of mineralized vertebrae
for each size class of larvae (44 dah) fed three dietary PL levels using two different
PL sources.
!"
#"
$!"
$#"
%!"
%#"
!" $" %" &" '" #" (" )" *" +" $!" $$" $%" $&" $'"
!"#$%&'()'#*+%&,-*.%/'0%&1%$&,%'
2*.%'3-,44'5##6'
,-./0-1"
)234"
+234"
)564"
+564"

Krill phospholipids vs soybean lecithin for seabream larvae
…………………………………………………………………………………………..
106
Figure 5.8 Incidence of skeleton anomalies of larvae (44 dah) fed three dietary PL
levels using two different PL sources. (P>0.05). Values (mean ± standard deviation)
with the same letters were not significantly different (P>0.05).
Table 5.4 Fatty acids (% dry weight) composition in total lipids of diets three dietary
PL levels using two different PL sources
Control 7 MPL 9 MPL 7 SBL 9 SBL
14:0 0.86 1.69 0.58 0.86 2.29
14:1n-5 0.31 0.05 0.03 0.01 0.04
14:1n-7 0.23 0.04 0.06 0.01 0.03
15:0 0.31 0.09 0.08 0.10 0.09
15:1n-5 0.12 0.01 0.01 0.01 0.02
16:0iso 0.06 0.07 0.07 0.01 0.01
16:0 4.90 4.85 5.39 4.65 4.11
16:1n-7 0.47 1.04 0.92 0.75 0.27
16:1n-5 0.14 0.05 0.04 0.04 0.05
16:2n-6 0.04 0.09 0.04 0.02 0.15
16:2n-4 0.04 0.01 0.01 0.12 0.01
17:0 0.02 0.04 0.04 0.04 0.08
16:3n-4 0.09 0.08 0.21 0.02 0.06
16:3n-3 0.10 0.06 0.03 0.03 0.06
16:3n-1 0.04 0.07 0.06 0.00 0.01
16:4n-3 0.68 0.16 0.05 0.00 0.22
18:0 2.90 0.59 0.73 1.13 0.20
18:1n-9 2.04 3.26 3.57 6.66 2.91
18:1n-7 0.50 1.22 0.76 0.00 0.07
18:1n-5 0.05 0.09 0.10 0.04 0.06
18:2n-9 0.00 0.03 0.07 0.24 0.02
18:2n-6 0.97 0.38 0.68 4.76 6.82
18:2n-4 0.02 0.02 0.07 0.00 0.02
18:3n-6 0.07 0.01 0.01 0.01 0.01
!"
#"
$"
%"
&"
'!"
'#"
'$"
'%"
()*+,)-" ."/01" 2"/01" ."341" 2"341"
!"#$%&'()*+*
,'(-)**
1),5)676"
89:;)676"
/<*57=>-<?
/<@7--<"
b
b
c
a
c
a
d
b
c
b b
b
c
a
c
a
a
a
d
b
a a

Krill phospholipids vs soybean lecithin for seabream larvae
…………………………………………………………………………………………..
107
18:3n-4 0.05 0.02 0.05 0.03 0.01
18:3n-3 0.12 0.15 0.24 0.20 0.42
18:4n-3 0.13 0.40 0.39 0.03 0.04
18:4n-1 0.45 0.01 0.04 0.04 0.03
20:0 0.13 0.02 0.03 0.05 0.02
20:1n-9 0.06 0.04 0.06 0.07 0.03
20:1n-7 0.66 0.47 0.48 0.00 0.07
20:1n-5 0.00 0.06 0.03 0.00 0.07
20:2n-6 0.35 0.03 0.09 0.06 0.07
20:3n-6 0.01 0.01 0.02 0.01 0.02
20:4n-6 0.38 0.16 0.14 0.18 0.11
20:3n-3 0.20 0.07 0.06 0.09 0.03
20:4n-3 0.07 0.06 0.07 0.03 0.10
20:5n-3 1.72 3.67 3.63 0.99 2.55
22:1n-11 0.11 0.01 0.04 0.13 0.02
22:1n-9 0.60 0.15 0.05 0.02 0.15
22:4n-6 0.01 0.09 0.05 0.04 0.10
22:5n-6 0.03 0.03 0.03 0.03 0.01
22:5n-3 0.26 0.10 0.26 0.07 0.18
22:6n-3 1.99 4.42 6.33 1.99 2.74
Total Saturated 9.12 7.27 6.85 6.83 6.78
Total n-3 5.28 9.14 11.03 3.42 6.33
Total n-6 1.86 0.81 1.07 5.12 7.29
Total n-9 2.71 3.47 3.77 7.00 3.11
n-3HUFA 4.24 8.33 10.34 3.16 5.60
ARA 0.38 0.16 0.14 0.18 0.11
EPA 1.72 3.67 3.63 0.99 2.55
DHA 1.99 4.42 6.33 1.99 2.74
EPA/ARA 4.57 22.41 26.63 5.41 22.32
DHA/EPA 1.16 1.20 1.74 2.01 1.08
DHA/ARA 5.30 26.98 45.21 10.89 24.05
n-3/n-6 2.84 11.30 10.23 0.64 0.88
Table 5.5 Fatty acids (% dry weight) composition in lipid classes of diets containing
three dietary PL levels using two different PL sources
Control 7 MPL 9 MPL 7 SBL 9 SBL
Phosphatidylcholine
Saturated 37.07 36.96 32.14 36.14 35.5
Monounsaturated 6.10 11.78 15.95 7.20 11.35
Total n-3 55.58 48.97 48.12 47.77 62.53
ARA 0.38 0.53 0.78 0.35 0.42
EPA 6.76 18.30 29.50 6.08 7.51
DHA 47.86 27.92 14.11 40.14 52.29
Phosphatidylinositol
Saturated 36.23 45.85 44.78 35.71 47.06
Monounsaturated 19.69 16.24 18.09 19.91 8.85

Krill phospholipids vs soybean lecithin for seabream larvae
…………………………………………………………………………………………..
108
Total n-3 20.95 34.20 33.50 21.08 11.27
ARA 0.69 1.42 1.77 0.70 0.32
EPA 8.69 17.03 17.61 8.79 3.48
DHA 7.81 15.81 14.46 7.87 3.84
Phosphatidylserine
Saturated 30.22 34.34 31.01 42.00 34.20
Monounsaturated 18.40 20.72 21.70 17.52 18.53
Total n-3 42.13 41.72 42.69 31.57 32.71
ARA 1.33 1.44 2.21 1.23 1.21
EPA 9.42 12.75 19.61 7.96 7.55
DHA 27.12 26.51 20.73 20.99 22.61
Phosphatidylethanolamine
Saturated 25.34 23.42 22.23 28.61 24.73
Monounsaturated 13.93 12.89 17.26 11.77 13.84
Total n-3 37.35 56.59 54.71 45.58 38.21
ARA 2.27 3.41 2.28 2.86 2.25
EPA 20.01 30.09 26.08 25.18 19.45
DHA 16.42 24.74 26.99 18.36 15.96
The fatty acid profile of neutral lipids of the larvae (Table 5.6) showed significantly
higher contents of saturated and n-3 fatty acids, particularly n-3 HUFA and EPA in
fish fed MPL diets in comparison with the control or SBL fed larvae. On the contrary,
total n-6 and n-9 fatty acids were higher in larvae fed SBL and control diets than
those fed MPL diets. Fatty acid composition of neutral lipids from larvae fed 7 SBL
diet was very similar to the Control, being only significantly higher in saturated fatty
acids and DHA and lower in ARA. Larvae fed diet 9 SBL were also significantly
higher than the control in DHA, n-6 and n-9 fatty acids. Regarding the larval polar
lipids, the fatty acids profiles were more similar among larvae fed the different diets
than their respective neutral lipids (Table 5.7). In general, the main n-3
polyunsaturated fatty acids EPA and DHA presented a higher concentration in the PL
fraction than in the NL, whereas 18:2n-6 content was higher in the NL than in the PL
fraction. PL fractions of larvae fed MPL diets were 15% higher in saturated and n-3
fatty acids than fish fed Control or SBL diets. Besides, they were 50% higher in EPA,
whereas DHA levels in polar lipids were more similar among the different larvae,
being highest in larvae fed 9MPL followed by SBL and, then, 7 MPL and Control
larvae. Thus, increasing dietary MPL and SBL lead to better assimilation of n-
3HUFA (especially EPA) and n-6 fatty acids (especially 18:2n-6) respectively,
denoted by the higher content of these fatty acids in both neutral and polar lipids of

Krill phospholipids vs soybean lecithin for seabream larvae
…………………………………………………………………………………………..
109
the larvae in comparison to Control fish, regardless their respective dietary fatty acid
profiles.
Table 5.6 Fatty acids (% total identified fatty acids) composition of neutral lipids
from larvae fed diets containing five phospholipids levels. Values (mean ± standard
deviation) with the same letters in the same row are not significantly different
(P>0.05)
Control 7 MPL 9 MPL 7 SBL 9 SBL
14:0 0.81 4.20 5.08 1.91 1.43
14:1n-5 0.10 0.05 0.03 0.21 0.06
14:1n-7 0.12 0.12 0.12 0.21 0.08
15:0 0.32 0.33 0.41 0.38 0.32
15:1n-5 0.04 0.05 0.04 0.06 0.04
16:0iso 0.10 0.08 0.08 0.10 0.08
16:0 11.10 18.42 20.69 12.53 14.40
16:1n-7 3.89 5.48 4.86 3.28 2.42
16:1n-5 0.19 0.31 0.37 0.26 0.21
16:2n-6 0.38 0.31 0.68 0.37 0.36
16:2n-4 0.48 3.15 2.26 0.58 0.54
17:0 0.97 0.32 0.27 1.04 0.71
16:3n-4 0.03 0.02 0.03 0.00 0.00
16:3n-3 0.09 0.15 0.27 0.09 0.08
16:3n-1 0.00 0.02 0.03 0.00 0.00
16:4n-3 0.09 0.14 0.15 0.06 0.05
16:4n-1 0.04 0.00 0.00 0.00 0.00
18:0 4.48 5.93 6.03 4.82 5.33
18:1n-9 40.19 15.21 11.02 41.20 33.30
18:1n-7 3.47 6.44 5.43 2.31 1.87
18:1n-5 0.81 0.45 0.55 0.65 0.50
18:2n-9 0.15 0.10 0.12 0.09 0.00
18:2n-6 9.87 7.54 2.62 10.29 18.31
18:2n-4 0.16 0.21 0.25 0.15 0.13
18:3n-6 0.24 0.11 0.09 0.09 0.12
18:3n-4 0.10 0.01 0.06 0.06 0.10
18:3n-3 0.99 0.98 0.56 0.91 1.69
18:4n-3 0.19 1.02 0.89 0.19 0.15
18:4n-1 0.02 0.03 0.00 0.00 0.00
20:0 0.19 0.22 0.18 0.15 0.15
20:1n-9 2.88 1.63 2.52 2.06 1.99
20:1n-5 0.18 0.30 0.38 0.14 0.13
20:2n-9 0.00 0.01 0.01 0.01 0.01

Krill phospholipids vs soybean lecithin for seabream larvae
…………………………………………………………………………………………..
110
20:2n-6 0.28 0.22 0.19 0.21 0.27
20:3n-6 0.05 0.14 0.07 0.03 0.02
20:4n-6 0.90 1.19 0.86 0.73 0.61
20:3n-3 0.19 0.13 0.32 0.18 0.21
20:4n-3 0.17 0.41 0.33 0.05 0.04
20:5n-3 3.20 10.57 10.68 3.00 2.82
22:1n-11 0.75 0.90 0.73 0.50 0.49
22:1n-9 0.43 0.69 0.84 0.03 0.03
22:4n-6 0.04 0.06 0.05 0.03 0.01
22:5n-6 0.12 0.09 0.15 0.10 0.09
22:5n-3 0.63 1.34 1.06 0.31 0.28
22:6n-3 10.55 10.92 18.63 10.64 10.56
Total Saturated 17.86±1.11d 29.41±2.28
a 32.66±1.79
a 20.83±1.56
c 22.33±1.84
c
Total n-3 16.12±1.45c 25.66±1.73
b 32.89±1.98
a 15.43±1.33
c 15.88±1.26
c
Total n-6 11.87±0.78b 9.67±067
c 4.72±0.46
d 11.84±0.71
b 19.80±0.91
a
Total n-9 43.66±1.98a 17.64±1.34
c 14.51±1.05
d 43.38±2.01
a 35.33±1.94
b
Total n-3HUFA 14.75±0.67c 23.37±1.34
b 31.03±1.58
a 14.18±0.78
c 13.91±0.87
c
ARA 0.90±0.05b 1.19±0.08
a 0.86±0.03
b 0.73±0.08
c 0.61±0.03
d
EPA 3.20±0.17b 10.57±0.51
a 10.68±0.44
a 3.00±0.28
b 2.82±0.14
b
DHA 10.55±0.79b 10.92±0.95
b 18.63±0.96
a 10.64±0.88
b 10.56±0.79
b
EPA/ARA 3.55±0.11d 9.13±0.69
b 12.47±0.76
a 4.13±0.28
d 4.65±0.19
c
DHA/EPA 3.25±0.13b 1.03±0. 07
d 1.74±0.08
c 3.54±0.16
a 3.73±0.21
a
DHA/ARA 11.65±0.88d 9.43±0.79
e 21.76±1.02
a 14.62±0.91
c 17.36±1.00
b
n-3/n-6 1.38±0.04c 2.65±0.09
b 7.25±0.54
a 1.30±0.03
c 0.80±0.01
d
Table 5.7 Fatty acids (% total identified fatty acids) composition in polar lipids of
larvae fed diets containing five phospholipids levels. Values (mean ± standard
deviation) with the same letters in the same row are not significantly different
(P>0.05)
Control 7 MPL 9 MPL 7 SBL 9 SBL
14:0 0.62 1.12 1.07 1.11 0.38
14:1n-5 0.03 0.02 0.02 0.35 0.02
14:1n-7 0.05 0.04 0.03 0.29 0.03
15:0 0.30 0.23 0.27 0.62 0.23
15:1n-5 0.01 0.01 0.01 0.42 0.00
16:0ISO 0.06 0.04 0.04 0.24 0.04
16:0 22.88 25.63 28.03 22.11 23.12
16:1n-7 0.88 2.25 2.07 1.00 0.72
16:1n-5 0.21 0.24 0.26 0.35 0.17
16:2n-6 0.39 0.15 0.43 0.52 0.36
16:2n-4 0.55 0.97 0.70 0.66 0.48

Krill phospholipids vs soybean lecithin for seabream larvae
…………………………………………………………………………………………..
111
17:0 0.52 0.21 0.19 0.62 0.34
16:3n-4 0.02 0.00 0.00 0.03 0.00
16:3n-3 0.08 0.18 0.17 0.10 0.07
16:3n-1 0.00 0.80 0.00 0.51 0.54
16:4n-3 0.54 0.00 0.71 0.00 0.00
16:4n-1 0.66 0.36 0.21 0.69 0.59
18:0 7.85 8.72 8.06 6.96 7.42
18:1n-9 19.79 11.33 8.71 17.25 14.05
18:1n-7 2.77 3.95 3.26 2.36 2.06
18:1n-5 0.50 0.26 0.29 0.37 0.38
18:2n-9 0.22 0.14 0.06 0.16 0.20
18:2n-6 7.00 3.63 0.96 7.71 12.84
18:2n-4 0.04 0.06 0.05 0.05 0.06
18:3n-6 0.15 0.09 0.09 0.11 0.08
18:3n-4 0.08 0.00 0.02 0.07 0.08
18:3n-3 0.29 0.20 0.09 0.25 0.45
18:4n-3 0.05 0.11 0.08 0.03 0.03
18:4n-1 0.01 0.02 0.00 0.00 0.01
20:0 0.19 0.16 0.14 0.14 0.13
20:1n-9 1.08 0.47 0.78 0.78 0.69
20:1n-5 0.10 0.14 0.14 0.07 0.03
20:2n-9 0.03 0.01 0.01 0.03 0.01
20:2n-6 0.35 0.16 0.10 0.26 0.34
20:3n-6 0.08 0.13 0.07 0.06 0.04
20:4n-6 1.48 1.42 1.56 1.29 1.19
20:3n-3 0.13 0.06 0.11 0.11 0.12
20:4n-3 0.09 0.21 0.13 0.03 0.02
20:5n-3 4.74 11.18 11.92 5.14 5.23
22:1n-11 0.08 0.11 0.06 0.05 0.04
22:1n-9 0.05 0.09 0.09 0.02 0.02
22:4n-6 0.06 0.06 0.04 0.05 0.04
22:5n-6 0.33 0.14 0.20 0.20 0.27
22:5n-3 0.68 1.46 0.73 0.38 0.36
22:6n-3 23.99 23.42 28.04 26.44 26.73
Total Saturated 32.36±2.3b 36.07±1.38
a 37.76±1.4
a 31.54±1.6
b 31.63±1.2
b
Total n-3 30.58±1.41c 36.83±1.36
b 41.98±1.89
a 32.49±1.09
c 33.01±1.13
c
Total n-6 9.84±0.78b 5.78±0.20
c 3.46±0.81
d 10.19±0.45
b 15.16±0.84
a
Total n-9 21.17±1.63a 12.04±1.10
bc 9.65±1.96
c 18.25±2.87
a 14.97±1.42
b
Total n-3HUFA 29.62±2.25c 36.33±2.13
b 40.94±2.49
a 32.10±1.91
c 32.47±1.86
c
ARA 1.48±0.10a 1.42±.09
ab 1.56±0.12
a 1.29±0.08
b 1.19±0.11
b
EPA 4.74±0.47b 11.18±.76
a 11.92±0.83
a 5.14±0.51
b 5.23±0.44
b

Krill phospholipids vs soybean lecithin for seabream larvae
…………………………………………………………………………………………..
112
DHA 23.99±1.12c 23.42±1.06
c 28.04±1.03
a 26.44±1.01
b 26.73±1.09
b
EPA/ARA 3.20±0.12c 7.85±0.43
a 7.62±0.52
a 3.98±0.18
b 4.40±0.37
b
DHA/EPA 5.04±0.33a 2.09±0.09
b 2.35±0.11
b 5.15±0.19
a 5.11±0.30
a
DHA/ARA 16.18±1.12c 16.46±1.10
c 17.91±1.09
c 20.50±1.01
b 22.49±1.07
a
n-3/n-6 3.13±0.32c 6.37±0.61
b 12.15±0.82
a 3.19±0.12
c 2.18±0.09
d
The level of larval lipid peroxides (Figure 5.9), as indicated by the MDA content
(nmol/g larval tissues), was significantly higher in the larvae fed 9 MPL, 7 SBL and 9
SBL diets than in control and 7 MPL larvae. Besides, this increase was positively
correlated to the sum of dietary n-3, n-6 and n-9 fatty acids (y = 0.032x + 4.9457, R!
= 0.78), and also was positively correlated to the dietary PL content for each PL
source (Figure 5.10).
The general pattern of antioxidant enzyme genes expression of seabream larvae was
characterized by a higher expression in larvae fed SBL diets than larvae fed control
and MPL diets (Figures 5.11, 5.12 and 5.13). Thus, the highest CAT and SOD
expression was found in larvae fed SBL, followed by that of 9 MPL larvae. There
were no significant differences between larvae fed 7 SBL and Control diets. GPX
expression level was also significantly highest in the larvae fed SBL, followed by that
of 9MPL and then 7MPL, which was significantly higher than the control.
The highest expression of the Bone Morphogenetic Protein 4 (BMP-4) gene, an early
marker of osteoblast differentiation, was found in larvae fed MPL, regardless the
dietary level tested (Figure 5.14), however this transforming growth factor was not
affected by the dietary inclusion of SBL. Runx2, a key regulator of both chondrocyte
and osteoblast differentiation, was significantly up-regulated in larvae fed MPL in
comparison to the control, whereas in fish fed SBL there were no significant
differences with the control or MPL larvae (Figure 5.15). ALP, an early marker of cell
mineralization, was significantly up-regulated in larvae fed MPL diets, whereas no
significant differences were found for the expression of these gene between SBL fed
larvae and any of the other larvae (Figure 5.16). In comparison with the control
larvae, the inclusion of dietary PL increased up to 7 times the gene expression of
osteocalcin (OC), a skeletal extracellular matrix protein considered an specific marker
of late osteoblast differentiation (Figure 5.17). The highest up-regulation was
obtained in larvae fed MPL, followed by those fed 9 SBL and, finally, 7 SBL. Similar
trends were obtained for other skeletal extracellular matrix proteins such as

Krill phospholipids vs soybean lecithin for seabream larvae
…………………………………………………………………………………………..
113
osteopontin (OP) and osteonectine (ON), which are indicative of osteogenesis,
although not considered specific markers. Thus, expression of both OP and ON was
up-regulated up to double the expression of the control by the dietary MPL and up to
1.5 times by SBL (Figures 5.18 and 5.19). Finally, the expression of matrix GLA
protein (MGP), a physiological inhibitor of endochondral ossification, was not
significantly affected by dietary PL, except in larvae fed diets 7MPL and 9 SBL,
where it was slighlty up-regulated (Figure 5.20).
Figure 5.9 The malondialdehyde (MDA) content in larvae (44 dph) fed five dietary
phospholipid levels. Values (mean ± standard deviation) with the same letters were
not significantly different (P>0.05).
Figure 5.10 The correlation between the malondialdehyde (MDA) content and the
dietary phospholipid levels in larvae (44 dph) fed five dietary phospholipid levels.
!"
#!"
$!!"
$#!"
%!!"
%#!"
&!!"
&#!"
'!!"
'#!"
#!!"
()*+,)-" ."/01" 2"/01" ."341" 2"341"
!"#"$%&'#()*+),#
%-,.#
b b
a a a
5"6"$$7#8%"9"$&'7#8":"#2'";<"6"$"
5"6"927.#8%":"$=!8"9"''.7%#";<"6"$"
!"
$!!"
%!!"
&!!"
'!!"
#!!"
!" #" $" %" &" '("
!"#"%$&'#()*+),#
%-,.#/0(#12#
/01"
341"

Krill phospholipids vs soybean lecithin for seabream larvae
…………………………………………………………………………………………..
114
Figure 5.11 Catalase (CAT) gene expression level measured by real-time PCR in
seabream larvae fed five dietary phospholipid levels. Values (mean ± standard
deviation) with the same letters were not significantly different (P>0.05).
Figure 5.12 Superoxide dismutase (SOD) gene expression level measured by real-
time PCR in seabream larvae fed five dietary phospholipid levels. Values (mean ±
standard deviation) with the same letters were not significantly different (P>0.05).
!"
#"
$"
%"
&"
'"
("
)*+,-*." /"012" 3"012" /"452" 3"452"
!"#$%&'&$(&)&($&*+,&--./'$
$
0.&1$
c c
b
a a
!"
#"
$"
%"
&"
'"
("
/"
6"
3"
)*+,-*." /"012" 3"012" /"452" 3"452"
230$%&'&$(&)&($&*+,&--./'$
$
0.&1$
c
c
b
a
a

Krill phospholipids vs soybean lecithin for seabream larvae
…………………………………………………………………………………………..
115
Figure 5.13 Glutathione peroxidase (GPX) gene expression level measured by real-
time PCR in seabream larvae fed five dietary phospholipid levels. Values (mean ±
standard deviation) with the same letters were not significantly different (P>0.05).
Figure 5.14 BMP4 (Bone Morphogenetic Proteins 2) gene expression level measured
by real-time PCR in seabream larvae fed five dietary phospholipid levels. Values
(mean ± standard deviation) with the same letters were not significantly different
(P>0.05).
!"
#"
$"
%"
&"
'"
("
)"
*"
+"
,-./0-1" )"234" +"234" )"564" +"564"
!"#$%&'&$(&)&($&#*+&,,-.'$
$
/-&0$
d
c
bc
ab
a
!"
#"
$"
%"
,-./0-1" )"234" +"234" )"564" +"564"
12"3$!&'&$4&)&($5#*+&,,-.'$
/-&0$
b
a
a
b b

Krill phospholipids vs soybean lecithin for seabream larvae
…………………………………………………………………………………………..
116
Figure 5.15 Runx2 (Runt-related transcription factor 2) gene expression level
measured by real-time PCR in seabream larvae fed five dietary phospholipid levels.
Values (mean ± standard deviation) with the same letters were not significantly
different (P>0.05).
Figure 5.16 Alkaline Phosphatase gene expression level measured by real-time PCR
in seabream larvae fed five dietary phospholipid levels. Values (mean ± standard
deviation) with the same letters were not significantly different (P>0.05).
!"
#"
$"
%"
&"
'()*+(," -"./0" 1"./0" -"230" 1"230"
!"#$%&'()(&*(+(,&-./0(1123)&
42(5&
b
a
a
ab
ab
4"
-"
1"
##"
#%"
#4"
#-"
'()*+(," -"./0" 1"./0" -"230" 1"230"
6,78,2)(&/931/98581(&'()(&&
*(+(,&-./0(1123)&:&;<&
42(5&
b
a a ab
ab

Krill phospholipids vs soybean lecithin for seabream larvae
…………………………………………………………………………………………..
117
Figure 5.17 Osteocalcin gene expression level measured by real-time PCR in
seabream larvae fed five dietary phospholipid levels. Values (mean ± standard
deviation) with the same letters were not significantly different (P>0.05).
Figure 5.18 Osteopontin gene expression level measured by real-time PCR in
seabream larvae fed five dietary phospholipid levels. Values (mean ± standard
deviation) with the same letters were not significantly different (P>0.05).
!"
#"
$"
%"
&"
'"
("
)"
*"
+"
#!"
##"
,-./0-1" )"234" +"234" )"564" +"564"
!"#$%&'(&)*+,$*$++
-$.$(+/012$"")%*+
3)$#+
a
a
c b
d
!"
#"
$"
%"
&"
,-./0-1" )"234" +"234" )"564" +"564"
!"#$%1%*#)*+,$*$+++
-$.$(+/"12$"")%*+
3)$#+
bc
d
c
b
a

Krill phospholipids vs soybean lecithin for seabream larvae
…………………………………………………………………………………………..
118
Figure 5.19 Osteonectin gene expression level measured by real-time PCR in
seabream larvae fed five dietary phospholipid levels. Values (mean ± standard
deviation) with the same letters were not significantly different (P>0.05).
Figure 5.20 Matrix Gla Protein gene expression level measured by real-time PCR in
seabream larvae fed five dietary phospholipid levels. Values (mean ± standard
deviation) with the same letters were not significantly different (P>0.05).
!"
#"
$"
%"
&'()*'+" ,"-./" 0"-./" ,"12/" 0"12/"
!"#$%&$'#(&)*$&$)+$,$-))./01$"(%&)
2($#)
c
a a
b
b
!"
#"
$"
%"
3"
&'()*'+" ,"-./" 0"-./" ,"12/" 0"12/"
345678)*+4)*$&$))
+$,$-)./01$""(%&)
2($#)
c
a a
bc ab

Krill phospholipids vs soybean lecithin for seabream larvae
…………………………………………………………………………………………..
119
Discussion
Addition of SBL to the early weanning diets for gilthead seabream raised the dietary
contents of PL, particularly PI, PC and PE, and improved seabream survival and
stress resistance, promoting the incorporation of dietary DHA into larval polar lipids.
These results could be due to the enhancement of digestive enzymes activities,
particularly, PLA2 and alkaline phosphatase (Saleh et al., 2012b) and gut and liver
lipid transport activity (Liu et al., 2002) obtained by the inclusion of SBL in previous
studies,which would improve the absorption of several nutrients from the lumen
(Morais et al., 2006). Thus, improved lipid digestion, absorption and transport would
be responsible for the high incorporation of n-3 HUFA, particularly DHA into polar
lipids of larvae fed increased levels of SBL. Cahu, et al. (2003a) found that soybean
lecithin incorporation (12% PL dietary dry weight), supported high survival to
European sea bass Dicentrarchus labrax. However, only the elevation of dietary SBL
up to 9% PL improved larval growth. This is in agreement with previous studies,
where elevation of dietary PL over 9% with SBL did not further improved seabream
larval growth (Saleh et al., 2012b).
However, improvement in either larval growth or survival was significantly lower
than that obtained by MPL in the present study. Dietary inclusion of SBL, rich in
linoleic acid and PI, markedly increased the oxidative risk of gilthead seabream larvae
as denoted not only by the higher MAD values obtained, but also by the increase in
the gene expression of enzymes involved in the oxidative metabolism such as SOD,
CAT and GPX. Despite inclusion of the highest MPL level (9% PL) also raised the
MAD values, the expression of CAT, SOD or GPX genes was significantly lower
than for SBL fed larvae, and only slightly higher than in the control larvae, suggesting
the presence of antioxidant factors in the MPL source used, such as carotenoids. The
krill oil is rich in antioxidants factors such as carotenoids (astaxanthin) (Tou et al.,
2007).
In agreement with the improved growth obtained by increased levels of marine
phospholipids in other species such as Atlantic cod (Gadus morhua) and European
sea bass (Dicentrarchus labrax), in the present study, the MPL seemed to be superior
to enhance larval growth and development when incorporated into microdiets than
SBL. Thus, even the inclusion of only 7 % PL as MPL improved survival, stress

Krill phospholipids vs soybean lecithin for seabream larvae
…………………………………………………………………………………………..
120
resistance and growth of gilthead seabream in a larger extend than SBL, what could
be related to their higher content in PC and LPC rich in DHA and EPA, in comparison
to SBL diets. Indeed growth improvement obtained by dietary PL increase has been
previously associated to an enhancement in feed intake associated to the estimulation
of gustatory response by the trimethyl group of the choline base of PC (Izquierdo and
Koven, 2010). Despite it is well known the potent effect of these fatty acids in
promoting larval growth and survival, the higher performance of fish fed MPL seems
to be due not only to a higher dietary content on these fatty acids. For instance,
feeding seabream larvae with two weaning diets containing the same PL (2.5%) and
n-3 HUFA (1.6%) levels, the diet containing these fatty acids in the PL fraction
caused a significantly higher growth than those fed these fatty acids in the NL (Salhi
et al., 1999; Izquierdo et al., 2001). Moreover, a better utilization of dietary n-3
HUFA is obtained as denoted by the higher incorporation of these fatty acids in the
larval PL (Izquierdo et al., 2001). These authors found that dietary n-3 HUFA rich PL
markedly improves the incorporation of free EPA, but not of free oleic acid, into
larval polar lipids (Izquierdo et al., 2001), in relation to improved lipid transport,
mobilization and deposition in the peripheral tissues by n-3 HUFA rich dietary PL.
More specifically, the higher LPC rich in DHA, could specifically promote the higher
incorporation of HUFA into larval polar lipids, as it has been found in mammal
models. For instance, DHA incorporation into PC of rat brain cells was higher when
LPC-DHA was used instead of unesterified DHA and LPC-16:0 (Bernoud et al.,
1999), suggesting an intact and specific uptake of DHA-PC that was directly re-
acilated into PC. The improvement in larval growth could be also related to a faster
maturation of the gut suggested by the significant increase in alkaline phosphatase
activity in previous studies (Wold et al., 2007; Saleh et al., 2012a, b) and a better
digestive efficiency due to the stimulatory effect of dietary MPL on PLA2 and neutral
lipase activity (Saleh et al., 2012a). Thus, marine PL rich in HUFA may increase the
microdiet intake, promote gut development and nutrient digestion, facilitate direct
incorporation of HUFA into polar lipids, and thus, enhance growth, survival and
stress resistance in marine fish larvae.
Inclusion of PL in the seabream weaning diets significantly reduced the lordosis
incidence, regardless the type of PL or the dietary PI level, despite in carp this PL
class was proposed to reduce skeletal deformities (Guerden et al., 1998a). In the
present study, the elevation of PI in SBL diets in comparison to control or MPL diets

Krill phospholipids vs soybean lecithin for seabream larvae
…………………………………………………………………………………………..
121
did not reduced the incidence of deformities. On the contrary, lordosis incidence
seemed to be lower in larvae fed higher PE, rich in DHA, and with high DHA
incorporation into larval PL.
Lordosis incidence was neither related to the dietary PC/PI ratios, which were either
larger in control and MPL diets than the 2.18 reccommended by Cahu et al. (2003b)
for European sea bass, or lower in diet with 9% SBL in the present study. Regarding
kyphosis the lowest incidence was found in larvae fed 9% PL as MPL, the diet with
the highest DHA content, and also showed the highest ARA contents in the larval PL
fraction. In addition there was not any incidence of cranial deformities in this fish.
The lowest incidence of skeleton deformities found in fish fed 9% PL as MPL could
be related to a higher resistance to vertebral deformities by a stronger mineralization
as suggested by the highest expression in this fish of the skeletal extracellular matrix
proteins, significantly osteopontine, in relation to the higher dietary DHA content.
Indeed, larvae fed MPL showed higher expression of BMP-4 gene, a member of the
transforming growth factor b superfamily considered as important regulators of the
differentiation of uncommitted mesenchymal cells into osteoblasts during both
embryonic development and bone repair. These genes are up-regulated by dietary n-3
HUFA being beneficial for other vertebrates (Kruger et al., 2010). In agreement in the
present study no maxilar or mandibular deformities were registered in fish fed 9% PL
as MPL. Similarly, Runx2, the earliest and most specific marker of osteogenesis, is
regulated by dietary DHA and possibly also other n-3 HUFA (Kruger et al., 2010). In
turn, Runx2 regulates the expression of ALP and OC, both being up-regulated in
larvae fed MPL. Thus, n-3 HUFA increase ALP activity in growing male rats as well
as insulin-like growth factor I (IGF-1) (Kruger et al., 2010). In gilthead seabream,
increased in dietary DHA up-regulated IGF-1, enhanced bone mineralization and
significantly reduced the incidence of vertebral anomalies such as lordosis and
kyphosis (Izquierdo et al., 2012).
The n-3 HUFA has a role in promoting bone formation in mammals as well as in fish
(Lall and Lewis-McCrea, 2007), but these mechanisms are poorly studied in fish.
Feeding dietary n-3 HUFA to growing male rats increased rates of bone formation
(Watkins et al., 2000). Increasing dietary DHA also increased the ratio of n-3/n-6 in
bone compartments, which favored bone formation in rats (Watkins et al., 2003,
2006). Larvae fed 9 MPL and 7 MPL diets contained relatively more n-3 HUFA than
Krill phospholipids vs soybean lecithin for seabream larvae
…………………………………………………………………………………………..
122
the 7 SBL and 9 SBL larvae, thus increasing the ratio of n-3/n-6 to 8.19% and 11.3%
respectively.
In summary, despite increased on dietary SBL up to 9% improve larval survival,
stress resistance, growth and skeletal development, dietary MPL was more effective
in promoting all these parameters. Their higher content in PC, LPC, ARA, EPA and,
particularly, DHA, not only promotes digestion, transport and deposition of dietary
lipids, but also contributes to reduce skeleton anomalies by up-regulating BMP-4,
Runx2, ALP and the skeletal extracellular matrix proteins, inducing early
mineralization and resistance of vertebral bodies to reduce anomalies such as lordosis
and kyphosis. Inclusion of SBL markedly increased the proxidation risk as denoted by
the higher TBARs in larvae, as well as a higher expression of CAT, GPX and SOD
genes.
Acknowledgement
This study was partially supported by a grant from the Spanish Agency of
International Cooperation and Development (AECID) to Reda Saleh Mohamed
Ibrahim. The present study was partly funded by the Spanish Ministry of Sciences and
Education (AGL2009-14661). This work has been partly funded under the EU
seventh Framework Program by the ARRAINA project No
288925: Advanced
Research Initiatives for Nutrition and Aquaculture.

Biomarkers of bone development and oxidative stress in seabream larvae
…………………………………………………………………………………………..
123
Chapter 6
-----------------------------------------------------------------------------
Biomarkers of bone development and oxidative stress in
gilthead seabream larvae fed microdiets with several levels
of polar lipids and !–tocopherol
Abstract
Although dietary marine phospholipids are able to improve culture performance of
marine fish larvae in a further extend than soybean lecithin, both types of
phospholipids (PL) markedly increase oxidative risk. The inclusion of a fat-soluble
antioxidant such as the vitamin E !-tocopherol could allow a better control of
oxidative stress. The objective of the present study was to determine the combined
effect of graded levels of !-tocopherol with different levels and sources of krill
phospholipids (KPL) and soybean lecithin (SBL) on growth, survival, resistance to
stress, oxidative status, bone metabolism related genes expresion and biochemical
composition of seabream larvae. Seabream larvae were completely weanned at 16 dph
and fed for 30 days seven microdiets with three different levels of PL (0, 4 and 8%)
and two of !-tocopherol 1500 and 3000 mg kg-1
diet. Seabream larvae fed diets
without PL supplementation showed the lowest survival, growth and stress resistance,
whereas increase in PL, particularly KPL, markedly promoted larval survival and
growth. However, feeding SBL markedly increased TBARs and GPX gene expression
increasing the peroxidation risk in the larvae. Besides, KPL inclusion improved
incorporation of n-3 HUFA and, particularly, EPA into larval tissues, these fatty acids
being positively correlated to the expression of BMP-4, RUNX 2, ALP, OC and OP
genes and to bone mineralization for a given larval size class. The increase in dietary
!-tocopherol tend to improve growth in relation to the n-3 HUFA levels in the diet,
denoting the protective role of this vitamin against oxidation. Indeed, dietary !-
tocopherol decreased the oxidative stress in the larvae as denoted by the reduction in

Biomarkers of bone development and oxidative stress in seabream larvae
…………………………………………………………………………………………..
124
larval TBARs contents and gene expression of SOD and CAT, but not GPX. Thus,
increase in dietary !-tocopherol effectively prevented the formation of free radicals
from HUFA, particularly EPA, but did not affected the incidence of bone anomalies
or the expression of genes related to osteogenetic processes.
Introduction
Good quality fry is essential for the further development of marine fish culture, but
the success of fry high production is greatly affected by the nutritional quality of the
initial larval diets (Kolkovski et al., 2009; Izquierdo et al., 2000). Dietary
phospholipids are fundamental components of early weaning diets (Izquierdo, 1996;
Fontagné et al., 2000; Izquierdo and Koven, 2010). Not only they are and essential
constituents for cell membranes and tissues and organ development but also play an
important role as energy sources (Kanazawa, 1993; Izquierdo et al., 2001). Thus,
phospholipid addition to larval diets promote growth and survival and increase fish
resistance to stress (Kanazawa 1993; Salhi et al., 1999; Izquierdo et al., 2001;
Kjørsvik et al., 2009). In gilthead seabream (Sparus aurata), the increase in dietary
soybean lecithin up to 8 % improves larval growth, promotes gut development as
suggested by higher alkaline phosphatase activity, and improves dietary lipid
utilization enhancing lipase and phospholipase activities (Saleh et al., 2012b).
However, in their natural preys, phospholipids are rich in n-3 highly unsaturated fatty
acids (n-3 HUFA) (Sargent et al., 1997) and accordingly, inclusion of phospholipids
of marine origin, rich in these essential fatty acids, further improves larval
performance in comparison to soybean lecithin (Betancor et al., 2012b; Saleh et al.,
submitted). Therefore, the dietary inclusion of 7% marine phospholipids improves
seabream performance further than soybean lecithin (Saleh et al., submitted).
Moreover, soybean lecithin increases the peroxidation risk causing higher larval
TBARs and expression of antioxidant enzymes genes (Saleh et al., submitted).
Nevertheless, increase in dietary marine phospholipids up to 9% also increased larval
TBARs (Saleh et al., submitted).
Lipid peroxidation, is recognized as being highly deleterious, producing toxic
compounds such as fatty acid hydroxyperoxides, fatty acid hydroxides, aldehydes and
hydrocarbons, resulting in damage to cellular biomembranes (Kanazawa, 1991, 1993)

Biomarkers of bone development and oxidative stress in seabream larvae
…………………………………………………………………………………………..
125
and subcellular membranes, such as those of mitochondria, causing several
pathological conditions (Watanabe et al., 1970; Murai and Andrews, 1974; Sakai et
al., 1989). To counteract this oxidative risk, fish have an endogenous antioxidant
defence system (Filho et al., 1993), namely radical scavenging enzymes that play an
important role in physiological antioxidant protection (Blazer, 1982) such as catalase
(CAT) and superoxide dismutase (SOD), acting on hydrogen peroxide and
superoxide, respectively, and glutathione peroxidase (GPX), which scavenges lipid
hydroperoxides (Winston and Di Giulio, 1991; Halliwell and Gutteridge, 1996).
Besides, !-tocopherol acts as well as an antioxidant defence factor, reducing lipid
peroxidation products and free radicals (Machlin, 1984). !-tocopherol is one of the
lipid soluble vitamins that are absorbed from the digestive tract in association with fat
molecules and can be stored in body fat reserves. !-tocopherol is a structural
component of cell membranes (Putnam and Comben, 1987), and improves the
stability of tissue lipids to oxidation (Stéphan et al., 1995). Several studies have
demonstrated that !-tocopherol is an essential nutrient for different fish species
(Watanabe et al., 1970; Murai and Andrews, 1974; González et al., 1995). Dietary !-
tocopherol and n-3 HUFA had a synergistic effect on the non-specific immune
responses and disease resistance (Wang et al., 2006, Hamre et al., 1994). In marine
fish larvae, feeding a high level of docosahexaenoic acid (DHA), an essential
polyunsaturated fatty acid that are very susceptible to oxidation, together with a low
level of !-tocopherol led to muscular lesions in sea bass larvae (Betancor et al.,
20111). However, an increase in !-tocopherol or decrease in DHA level reduced the
rate of muscular damage (Betancor et al., 2011). Dietary vitamin requirements of fish
decrease as the age and weight of the animal increases and as the growth rate
decreases (Amezaga and Knox 1990). A dietary requirement of !-tocopherol has been
demonstrated as 120 mg/kg diet for Atlantic salmon (Hamre and Lie, 1995), 200 to
300 mg/kg diet for common carp (Cyprinus carpio) (Watanabe et al., 1977), 1200
mg/kg diet for gilthead seabream and 3000 mg/kg diet for gilthead seabream larvae
(Ortuño et al., 2000, Atalah et al., 2011).
Therefore, high levels of dietary HUFA, specially when the antioxidants compounds
are not well balanced, may lead to several changes in fish, including increased
intracellular reactive oxygen species (ROS) production that may ultimately damage
DNA, proteins and lipids (Halliwell and Gutteridge, 1999). Also, ROS can affect the

Biomarkers of bone development and oxidative stress in seabream larvae
…………………………………………………………………………………………..
126
transcription of many genes, either acting via various transcription factors or directly
as a result of oxidative damage (Di Giulio and Meyer, 2008). For instance, an
excessive amount of PUFA accelerated osteoblasts differentiation when dietary
vitamin A levels were low, causing supranumerary vertebrae in sea bass larvae
(Villeneuve et al., 2006). Also, dietary HUFA affect the expression of numerous
genes involved in cellular growth and differentiation such as Insulin Growth Factor-I
(IGF-I), and some genes involved in early development of vertebrates and in
osteoblast differentiation such as Bone Morphogenetic Protein (BMP4) (Cahu et al.,
2009). Thus, to avoid adverse effects and improve high dietary HUFA performance,
supplementation of antioxidants, such as !-tocopherol are necessary to larval diets
(Betancor et al., 2011). For instance, beluga larvae fed with high LC-PUFA enriched
Artemia showed a better performance in terms of growth and tolerance to salinity
stress when a 20% of !-tocopherol was included in the enrichment media (Jalali et al.,
2008). Similarly, Stéphan et al. (1995) reported that in vivo and in vitro oxidation of
lipids in turbot larvae is reduced when dietary !-tocopherol was supplemented in the
diet.
The aim of the present study was to investigate the combined effect of graded levels
of !-tocopherol with marine phospholipids derived from krill (KPL) or soybean
lecithin (SBL) in early weaning microdiets on culture performance, resistance to
stress, oxidative status and bone formation and mineralization of gilthead seabream
larvae.
Materials and methods
Gilthead seabream larvae were obtained from natural spawnings from Instituto
Canario de Ciencias Marinas (Grupo de Investigación en Acuicultura (GIA), Las
Palmas de Gran Canaria, Spain). Larvae, previously fed rotifers (Brachinous
plicatilis) enriched with DHA Protein Selco®
(INVE, Dendermond, Belgium) until 16
dph (5.46±0.31 mm total length, 113±7 "g dry body weight), were randomly
distributed in 21 experimental tanks at a density of 2100 larvae tank-1
and fed one of
the diets tested in triplicate. All tanks (200 L fibreglass cylinder tanks with conical
bottom and painted a light grey colour) were supplied with filtered seawater (37 ppm
salinity) at an increasing rate of 0.4 - 1.0 L min-1
to assure good water quality during
the entire trial. Water entered from the tank bottom and exited from the top to ensure

Biomarkers of bone development and oxidative stress in seabream larvae
…………………………………………………………………………………………..
127
water renewal and maintain high water quality, which was tested daily and no
deterioration was observed. Water was continuously aerated (125 ml min-1) attaining
6.4±1 ppm dissolved O2. Average water temperature and pH along the trial were
19.8±1.3°C and 7.89, respectively. Photoperiod was kept at 12h light: 12h dark, by
fluorescent daylights and the light intensity was kept at 1700 lux (digital Lux Tester
YF-1065, Powertech Rentals, Western Australia, Australia).
Seven experimental microdiets (pellet size 250-500 !m) using krill oil (Qrill, high PL,
Aker BioMarine, Fjordalléen, Norway) and soybean lecithin (Acofarma, Barcelona,
Spain) as sources of PL, and "-tocopherol (Sigma-Aldrich, Madrid, Spain) as an
antioxidant vitamin. Their formulation and proximate analysis are shown in Table 6.1,
wheras the fatty acids profile is showed in Table 6.3. All diets were formulated to
sufficiently cover the gilthead seabream requierements for essential fatty acids
(Izquierdo and Koven, 2010).
Table 6.1 Ingredients and proximate composition of the experimental microdiets
Ingredients (g kg-1
Diet)
0KPL/
1500
0KPL/
3000
4KPL/
1500
4KPL/
3000
8KPL/
1500
8KPL/
3000
8SBL/
3000
Squid Powdera 69 69 69 69 59.5* 59.5* 69.5
PLOb 0 0 13 13 21 21 0
Soybean Lecithinc 0 0 0 0 0 0 8.5
Sardine oild 5.5 5.5 0 0 3 3 0
Oleic acide 9 9 1.5 1.5 0 0 5.5
"-tocopherolf
(mg/100g Diet) 150 300 150 300 150 300 300
Gelatin 3 3 3 3 3 3 3
Mineral mix 4.5 4.5 4.5 4.5 4.5 4.5 4.5
Vitamin mix 6 6 6 6 6 6 6
Attractants 3 3 3 3 3 3 3
Proximate analysis
% dry weight
Total lipids 22.81 23.29 23.94 24.22 25.55 25.42 25.58
Polar lipids 5.91 6.44 8.92 9.51 10.37 10.81 11.13
Protein 61.06 61.31 60.50 60 58.80 58.92 60.31
Ash 7.04 6.93 7.10 6.98 7.26 6.94 6.80
Humidity 7.93 8.10 8.10 7.93 8.03 7.93 8.13
a Rieber and Son, Bergen, Norway. *Defatted. b Qrill, high phospholipids, Aker BioMarine, Fjordalléen, Norway.
c Acofarma, Barcelona, Spain.
d Agramar S.A., Spain.
e Merck KGaA, Darmstadi, Germany.
f "-tocopherol acetate, Sigma-Aldrich, Madrid, Spain.

Biomarkers of bone development and oxidative stress in seabream larvae
…………………………………………………………………………………………..
128
The microdiets were prepared by mixing squid powder and water-soluble
components, then the lipids and fat-soluble vitamins and, finally, gelatine dissolved in
warm water. The paste was compressed pelleted (Severin, Suderm, Germany) and
dried in an oven at 38 ºC for 24 h (Ako, Barcelona, Spain). Pellets were ground
(Braun, Kronberg, Germany) and sieved (Filtra, Barcelona, Spain) to obtain a particle
size between 250 to 500 !m. Diets were prepared and analyzed for proximate and
fatty acid composition at GIA laboratories.
Diets were manually supplied fourteen times per day each 45 min from 9:00 to 19:00
for 29 days. Non-enriched rotifers were co-fed during days 16th
and 17th
(1 rotifer/ml).
To assure feed availability, daily feed (pellet size < 250 !m) supplied was maintained
at 1.5 and 2.5 g per tank during the first and second week of feeding. The amount of
feed added daily was gradually increased to 4-5 g per tank with increasing in pellet
size to 250–500!m, with an overlap of both pellets sizes during the third and forth
weeks of feeding. Larvae were observed under the binocular microscope to determine
feed acceptance. Before the end of the experiment an activity test of air exposure was
conducted by handling 25 larvae tank-1 out of the water in a scoop net for 1 min and
subsequently allocating them in another tank supplied with clean seawater and
aeration to determine survival after 24 hours. Final survival was calculated by
individually counting all the living larvae at the end of the experiment. Growth was
determined by measuring dry body weight (105ºC 24 h) and total length (Profile
Projector V-12A Nikon, Tokyo, Japan) of 30 fish tank-1
at the beginning, in the
middle and at the end of the trial. In addition, at the end of the trial and after 12 h of
starvation, the all larvae in each tank were washed with distilled water, sampled and
kept at -80 ºC for biochemical composition.
Fresh larvae samples (100 mg per tank) for molecular biology analysis were well
washed and conserved into 500 ml RNA Later (SIGMA), a product that rapidly
allows tissue to stabilize and protect cellular RNA in situ in unfrozen samples and
permits to posterior RNA isolation. The larvae were stored in RNA later overnight at
4 ºC and after that RNA Later was removed before storing samples at - 80 ºC to
prevent the formation of salt crystals.

Biomarkers of bone development and oxidative stress in seabream larvae
…………………………………………………………………………………………..
129
Moisture (A.O.A.C. 1995), protein (Kjeldhal) and crude lipid (Folch 1957) contents
of larvae and diets were analyzed. Fatty acid methyl esters were obtained by
transmethylation of crude lipids as described by Christie (1982). Fatty acid methyl
esters were separated by GLC (GC -14A, Shimadzu, Tokyo, Japan) in a Supercolvax-
10-fused silica capillary column (length: 30 m; internal diameter: 0.32 mm; Supelco,
Bellefonte, USA) using helium as a carrier gas. Column temperature was 180 ºC for
the first 10 min, increasing to 215 ºC at a rate of 2.5 ºC/min and then held at 215 ºC
for 10 min. Fatty acid methyl esters were quantified by FID (GC -14A, Shimadzu,
Tokyo, Japan) following the conditions described in Izquierdo et al. (1990) and
identified by comparison to previously characterized standards and GLC-MS.
The measurement of TBARS in triplicate samples was performed using a method
adapted from that used by Burk et al. (1980). Approximately 20-30 mg of larval tissue
per sample were homogenized in 1.5 ml of 20% trichloroacetic acid (w/v) containing
0.05 ml of 1% BHT in methanol. To this 2.95 ml of freshly prepared 50mM
thiobarbituric acid solution were added before mixing and heating for 10 minutes at
100ºC. After cooling protein precipitates were removed by centrifugation (Sigma
4K15, Osterode am Harz, Germany) at 2000 x g, the supernatant was read in a
spectrophotometer (Evolution 300, Thermo Scientific, Cheshire, UK) at 532 nm. The
absorbance was recorded against a blank at the same wavelength. The concentration
of TBA-malondialdehyde (MDA) expressed as !mol MDA per g of tissue was
calculated using the extinction coefficient 0.156 !M-1
cm-1
.
Molecular biology analysis was carried out at GIA laboratories. Total RNA from
larvae samples (average weight per sample 60mg) was extracted using
the Rneasy Mini Kit (Qiagen). Total body tissue was homogenised using the
TissueLyzer-II (Qiagen, Hilden, Germany) with QIAzol lysis reagent
(Qiagen). Samples were centrifuged with chloroform for phase separation (12000g,
15min, 4ºC). The upper aqueous phase containing RNA was mixed with 75% ethanol
and transferred into an RNeasy spin column where total RNA bonded to a membrane
and contaminants were washed away by RW1 and RPE buffers (Qiagen). Purified
RNA was eluted with 30ml of RNase-free water. The quality and quantity of RNA
were analysed using the NanoDrop 1000 Spectrophotometer (Thermo Scientific,
Wilmington, DE, USA). Synthesis of cDNA was conducted using

Biomarkers of bone development and oxidative stress in seabream larvae
…………………………………………………………………………………………..
130
the iScript cDNA Synthesis Kit (Bio-Rad) according to manufacturer’s instructions in
an iCycler thermal cycler (Bio-Rad, Hercules, CA, USA). Primer efficiency was
tested with serial dilutions of a cDNA pool (1, 1:5, 1:10, 1:15,1:20 and 1:25). The
product size of the real-time q PCR amplification was checked by electrophoresis
analyses using PB322 cut with HAEIII as a standard. Real-time quantitative PCR
was performed in an iQ5 Multicolor Real-Time PCR detection system (Bio-Rad,
Hercules, CA, USA) using !-actin as the house-keeping gene in a final volume of
20ml per reaction well, and 100ng of total RNA reverse transcribed to complementary
cDNA. Each gene sample was analysed once per gene.
Table 6.2 Sequences of forward and reverse primers (5’-3’) for real-time quantitative-
PCR of seabream Gene Primers Accession n
o
Catalase(CAT) Forward primer: 5´-ATGGTGTGGGACTTCTGGAG-3´
Reverse primer: 3´-AGTGGAACTTGCAGTAGAAAC-5´
FJ860003
Superoxide
dismutase (SOD)
Forward primer: 5´- AAGAATCATGGCGGTCCTACTGA-3´
Reverse primer: 3´- TGAGCATCTTGTCCGTGATGTCT -5´
AJ937872
Glutathione
peroxidase (GPX)
Forward primer: 5´- TCCATTCCCCAGCGATGATGCC-3´
Reverse primer: 3´- TCGCCATCAGGACCAACAAGGA-5´
DQ524992
Osteocalcin Forward primer: 5´-AGCCCAAAGCACGTAAGCAAGCTA-3´
Reverse primer: 3´- TTTCATCACGCTACTCTACGGGTT-5´
AF048703
Osteopontin Forward primer: 5´- AAGATGGCCTACGACATGACAGAC- 3´
Reverse primer: 3´- CCTGAAGAGCCTTGTACACCTGC-5´
AY651247
Osteonectin Forward primer: 5´- AAAATGATCGAGCCCTGCATGGAC-3´
Reverse primer: 3´- TACAGAGTCACCAGGACGTT-5´
AY239014
aRUNX2 Forward primer: 5´- GCCTGTCGCCTTTAAGGTGGTTGC-3´
Reverse primer: 3´- TCGTCGTTGCCCGCCATAGCTG-5´
AJ619023
Alkaline
phosphatase
Forward primer: 5´- AGAACGCCCTGACGCTGCAA-3´
Reverse primer: 3´- TTCAGTATACGAGCAGCCGTCAC-5´
AY266359
Matrix Gla protein Forward primer: 5´- GTGCCCTCCTTCATTCCAC-3´
Reverse primer: 3´- TATGACCACGTTGGATGCCT-5´
AY065652
bBMP4 Forward primer: 5´- CCACCAGGGCAGACACGTCC-3´
Reverse primer: 3´- GCGTAGCTGCTCCCAGTCCTC-5´
FJ436409
!-actin Forward primer: 5´- TCTGTCTGG ATC GGAGGCTC-3´
Reverse primer: 3´- AAGCATTTG CGGTGGACG -5´
X89920
a RUNX2 (Runt-related transcription factor 2).
b BMP-4 (Bone morphogenetic protein 4).
The PCR conditions were the following: 95ºC for 3min 30sec followed by 40 cycles
of 95ºC for 15sec, 61ºC for 30sec, and 72ºC for 30sec; 95ºC for 1min, and a final
denaturing step from 61ºC to 95ºC for 10sec. Data obtained were normalised and
the Livak method (2–""Ct
) used to determine relative mRNA expression levels.
Gilthead seabream specific gene primers were designed after searching the NCBI
nucleotide database and using the Oligo 7 Primer Analysis software (Molecular

Biomarkers of bone development and oxidative stress in seabream larvae
…………………………………………………………………………………………..
131
Biology Insights, Cascade, CO, USA). Detailed information on primer sequences and
accession numbers is presented in Table 6.2.
All data were tested for normality and homogeneity of variances with Levene´s test,
not requiring any transformation and were treated using one-way ANOVA. Means
compared by Duncan’s test (P < 0.05) using a SPSS software (SPSS for Windows
11.5; SPSS Inc., Chicago, IL, USA).
Results
All the experimental diets were well accepted by gilthead seabream larvae according
to the microscopic observations. Generally, survival was very high for this type of
studies and it was significantly correlated to the dietary phospholipids (Figure 6.1).
Thus, average survival of larvae fed 4KPL and 8KPL diets (59-65% survival rate)
was significantly higher than 8SBL, which in turn had a significantly higher survival
than 0KPL larvae. The resistance to stress was significantly higher in larvae fed KPL
and SBL diets than in larvae fed 0KPL diets (Figure 6.2).
The larval growth after thirty days of feeding showed a good effectiveness of all
experimental dietary PL in terms of total length and body weight (Figures 6.3 and
6.4). Addition of KPL significantly improved total length and body weight in a further
extend than SBL. The increase of !-tocopherol from 150 to 300 mg/kg diet did not
affected larval growth tended to promote larval growth in fish fed 0KPL diets,
whereas it markedly improved growth in 4KPL and 8KPL larvae. Thus, the larvae fed
4KPL/3000 or 8KPL/3000 diets showed a significantly higher body weight than
4KPL/1500 or 8KPL/1500 larvae, respectively.

Biomarkers of bone development and oxidative stress in seabream larvae
…………………………………………………………………………………………..
132
Figure 6.1 Survival rate of gilthead seabream larvae (44 dph) fed different dietary
contents of two phospholipid sources combined with two !-tocopherol levels. Values
(mean ± standard deviation) with the same letters are not significantly different
(P>0.05).
Figure 6.2 Survival rate (24 hours after activity test) of gilthead seabream larvae (44
dph) fed different dietary contents of two phospholipid sources combined with two !-
tocopherol levels. Values (mean ± standard deviation) with the same letters are not
significantly different (P>0.05).
!"
#!"
$!"
%!"
&!"
'!"
(!"
)!"
*!"
!+,-.#'!!" !+,-.%!!!" &+,-.#'!!" &+,-.%!!!" *+,-.#'!!" *+,-.%!!!" */0-.%!!!"
!"#$%$&'()(
( (
*%+,-(
c c
b
a a a a
!"#!"$!"%!"&!"'!"(!")!"*!"1!"#!!"
!+,-.#'!!" !+,-.%!!!" &+,-.#'!!" &+,-.%!!!" *+,-.#'!!" *+,-.%!!!" */0-.%!!!"
!"#$%$&'()(
*%+,-(
b b
a a
a a a

Biomarkers of bone development and oxidative stress in seabream larvae
…………………………………………………………………………………………..
133
Figure 6.3 Total length of gilthead seabream larvae (44 dph) fed different dietary
contents of two phospholipid sources combined with two !-tocopherol levels. Values
(mean ± standard deviation) with the same letters are not significantly different
(P>0.05).
Figure 6.4 Dry weight of gilthead seabream larvae (44 dph) fed different dietary
contents of two phospholipid sources combined with two !-tocopherol levels. Values
(mean ± standard deviation) with the same letters are not significantly different
(P>0.05).
!"
#"
$"
%"
&"
'!"
'#"
'$"
'%"
!()*+',!!" !()*+-!!!" $()*+',!!" $()*+-!!!" &()*+',!!" &()*+-!!!" &./*+-!!!"
!"#$%&'()*#+&&,--.&
/0(#1&&
b
a
a a
a
c c
!"
,!!"
'!!!"
',!!"
#!!!"
#,!!"
-!!!"
!()*+',!!" !()*+-!!!" $()*+',!!" $()*+-!!!" &()*+',!!" &()*+-!!!" &./*+-!!!"
/23&4(0*+#&,5*.6'$27$(&
/0(#1&&
d d
c
ab
b b
a

Biomarkers of bone development and oxidative stress in seabream larvae
…………………………………………………………………………………………..
134
Determination of bone mineralization percentages for the different fish size classes
showed that in larvae between 0.8 and 1 cm of total length, those fed 0KPL showed
the lowest ossification, whereas increase in either KPL or !-tocopherol markedly
enhanced mineralization (Figure 6.5). The highest mineralization percentage was
found in larvae fed 4KPL/3000, being significantly higher than in 4KPL/1500 and
0KPL larvae, but not differing from 8KPL larvae. Similarly, in >1 cm larval size,
increase in !-tocopherol significantly improved mineralization. Skeleton anomalies
could be only determined on mineralized bones, and the results showed in larvae fed
0KPL/1500 a significantly higher incidence of anomalies in caudal fin bones, which
were completely mineralized already in all larvae (Figure 6.6). On the contrary, these
larvae also showed the lowest incidence of anomalies in vertebral arcs and spines,
since in these larvae these bones have not completed mineralization. The increase in
KPL or !-tocopherol did not significantly affected vertebral anomalies in the pre-
hemal region. Moreover, increase in dietary !-tocopherol tended to reduce the
occurrence of chondroid bones anomalies (such as arch/spines), whereas increase in
KPL tended to reduce the axial skeletal deformities (such as pre-haemal vertebral
bodies anomalies).
Figure 6.5 Bone mineralization percent for each size class (cm) of gilthead seabream
larvae (44 dph) fed different dietary contents of two phospholipid sources combined
with two !-tocopherol levels. Values (mean ± standard deviation) with the same
letters for a given fish size are not significantly different (P>0.05).
!"
#"
$!"
$#"
%!"
%#"
!&'()$#!!" !&'()*!!!" +&'()$#!!" +&'()*!!!" ,&'()$#!!" ,&'()*!!!"
!"#$%&'#$()*'+),'"#%-%
.'$,/%
-!./"
!.,0$"
1$"
""23""""""""""""
""""""""
"""""""""23""""
2"
""""""""2"
""23""""""""""""""
"
"
"""""""23"
""""""""34""""""""""""""
2""""""""4""""""""""""""""""""""
2"""""""
""""""23"
"
"""""""""""""""3"

Biomarkers of bone development and oxidative stress in seabream larvae
…………………………………………………………………………………………..
135
Figure 6.6 Anomalies (craneal deformities; alteration of cephalic, pre-hemal, hemal
and caudal vertebral bodies; dorsal, anal and caudal fins and vertebral arch and
spines) of gilthead seabream larvae (44 dph) fed different dietary contents of two
phospholipid sources combined with two !-tocopherol levels. Values (mean ±
standard deviation) without letters are not significantly different (P>0.05).
Analysis of the experimental diets showed that all 0KPL diets were higher in
saturated fatty acids, slightly lower in monoens and markedly lower in n-3 and n-3
HUFA fatty acids than the other diets (Table 6.3). Besides, this diet also showed
higher arachidonic acid (20:4n-6, ARA) than diets 4KPL and 8KPL. Diets 4KPL and
8KPL were very similar in their fatty acid profiles, whereas diet 8SBL was higher in
linoleic acid (18:2n-6, LA) and lower in docosahexaenoic acid (22:6n-3, DHA),
whereas ARA and eicosapentaenoic acid (EPA) were similar to KPL diets. In general,
the fatty acid composition of the larvae (Table 6.4) reflected the dietary fatty acids
profiles, although with some clear differences. Thus, larvae fed 0KPL showed
significantly lower essential fatty acids such as n-3, n-3 HUFA, EPA and DHA,
although the later was closer to the other larvae. Besides, these larvae were higher in
LA in concordance with dietary profiles. However, opposite to dietary composition,
0KPL larvae were lower in saturated and higher in monoenoic fatty acids than the
other larvae. 4KPL and 8KPL larvae were not significantly different in their fatty acid
profiles, except for slightly lower n-6 fatty acids content in 4KPL larvae. These larvae
!"
#!"
$!"
%!"
&!"
'!"
(!"
)!"
*!"
+!"!"#$%&'()*+*
!,-./#'!!" !,-./%!!!" &,-./#'!!" &,-./%!!!" *,-./#'!!" *,-./%!!!"
0"
"""""
0"

Biomarkers of bone development and oxidative stress in seabream larvae
…………………………………………………………………………………………..
136
had significantly higher n-3 and n-3HUFA especially EPA than the other larvae.
Finally, in agreement with the dietary profiles, 8SBL larvae had significantly higher
n-6 fatty acids, especially 18:2n-6 and lower n-3 HUFA and DHA. However, despite
the little differences in the EPA content in the dietary profiles, larvae fed 8SBL
showed a markedly lower content in this fatty acid in comparison to larvae fed KPL
diets.
Table 6.3 Fatty acids (% dry weight) composition of seven diets containing two
different phospholipid sources combined with two !-tocopherol levels
0KPL/
1500
0KPL/
3000
4KPL/
1500
4KPL
/3000
8KPL/
1500
8KPL/
3000
8SBL/
3000
14:0 0.88 0.57 0.59 1.69 1.80 1.83 2.15
14:1n-5 0.31 0.03 0.04 0.05 0.05 0.06 0.05
14:1n-7 0.23 0.06 0.07 0.04 0.04 0.04 0.04
15:0 0.31 0.08 0.08 0.09 0.10 0.11 0.09
15:1n-5 0.12 0.00 0.01 0.01 0.01 0.02 0.01
16:0iso 0.07 0.07 0.07 0.08 0.08 0.02 0.02
16:0 5.02 6.39 5.52 4.94 5.16 5.26 4.58
16:1n-7 0.48 0.92 0.94 1.05 1.10 1.23 1.30
16:1n-5 0.14 0.05 0.04 0.06 0.06 0.06 0.05
16:2n-6 0.04 0.04 0.04 0.09 0.09 0.15 0.13
16:2n-4 0.04 0.01 0.01 0.01 0.01 0.01 0.01
17:0 0.02 0.03 0.04 0.04 0.04 0.07 0.06
16:3n-4 0.09 0.21 0.22 0.08 0.08 0.06 0.05
16:3n-3 0.11 0.03 0.03 0.06 0.06 0.08 0.07
16:3n-1 0.04 0.06 0.06 0.07 0.07 0.02 0.02
16:4n-3 0.70 0.05 0.05 0.16 0.17 0.26 0.23
16:4n-1 0.00 0.01 0.01 0.01 0.01 0.00 0.00
18:0 2.97 2.92 0.75 0.60 0.63 0.51 0.44
18:1n-9 2.08 3.38 3.65 3.29 3.47 3.50 3.04
18:1n-7 0.51 0.79 0.78 1.22 1.30 1.35 1.37
18:1n-5 0.05 0.10 0.10 0.09 0.09 0.08 0.07
18:2n-9 0.00 0.07 0.07 0.03 0.03 0.02 0.02
18:2n-6 0.99 1.71 0.69 0.39 0.41 0.37 3.04
18:2n-4 0.02 0.07 0.07 0.02 0.02 0.02 0.02
18:3n-6 0.07 0.01 0.01 0.01 0.01 0.01 0.01
18:3n-4 0.05 0.05 0.05 0.01 0.02 0.02 0.01
18:3n-3 0.13 0.23 0.24 0.15 0.16 0.11 0.29
18:4n-3 0.14 0.08 0.38 0.44 0.46 0.41 0.56
18:4n-1 0.46 0.04 0.04 0.01 0.01 0.04 0.03
20:0 0.13 0.03 0.03 0.01 0.02 0.02 0.02
20:1n-9 0.06 0.06 0.06 0.04 0.04 0.03 0.03
20:1n-7 0.68 0.47 0.49 0.47 0.50 0.33 0.28
20:1n-5 0.00 0.03 0.03 0.06 0.06 0.09 0.07
20:2n-9 0.01 0.00 0.01 0.00 0.00 0.00 0.00
20:2n-6 0.36 0.09 0.10 0.03 0.03 0.05 0.05
20:3n-9 0.00 0.00 0.00 0.01 0.00 0.01 0.01
20:3n-6 0.01 0.02 0.03 0.01 0.01 0.03 0.02

Biomarkers of bone development and oxidative stress in seabream larvae
…………………………………………………………………………………………..
137
20:4n-6 0.38 0.14 0.14 0.16 0.17 0.14 0.12
20:3n-3 0.20 0.07 0.06 0.07 0.08 0.04 0.03
20:4n-3 0.07 0.07 0.07 0.06 0.07 0.11 0.10
20:5n-3 1.76 1.45 3.71 3.70 3.91 4.26 3.71
22:1n-11 0.11 0.04 0.04 0.01 0.01 0.03 0.02
22:1n-9 0.62 0.05 0.05 0.15 0.16 0.18 0.16
22:4n-6 0.01 0.05 0.05 0.09 0.10 0.12 0.11
22:5n-6 0.03 0.03 0.03 0.03 0.03 0.02 0.02
22:5n-3 0.27 0.25 0.26 0.10 0.11 0.22 0.19
22:6n-3 2.04 2.37 4.43 4.44 4.71 4.42 2.89
! saturated 9.33 10.03 7.00 7.38 7.74 7.80 7.35
!monoenoics 5.40 5.99 6.31 6.52 6.90 6.99 6.48
! n-3 5.40 4.59 8.93 9.19 9.73 9.52 8.07
! n-6 1.91 2.09 1.09 0.81 0.86 0.88 3.49
! n-9 2.77 3.57 3.85 3.51 3.70 3.75 3.25
! n-3HUFA 4.34 4.21 8.53 8.38 8.87 9.06 6.92
ARA 0.38 0.14 0.14 0.16 0.17 0.14 0.12
EPA 1.76 1.45 3.71 3.70 3.91 4.26 3.71
DHA 2.04 2.37 4.43 4.44 4.71 4.42 2.89
EPA/ARA 4.57 10.72 26.63 22.49 22.41 30.86 30.90
DHA/EPA 1.16 1.64 1.19 1.20 1.20 1.04 0.78
DHA/ARA 5.30 17.56 31.73 27.00 26.98 32.03 24.10
n-3/n-6 2.84 2.19 8.19 11.31 11.30 10.80 2.31
Table 6.4 Fatty acids (% total identified fatty acids) composition of gilthead seabream
larvae (44 dph) fed different dietary contents of two phospholipid sources combined
with two "-tocopherol levels. Values (mean ± standard error) with the same letters in
the same row are not significantly different (P>0.05).
Diet 0KPL/
1500
0KPL/
3000
4KPL/
1500
4KPL
/3000
8KPL/
1500
8KPL/
3000
8SBL/
3000
14:0 1.05 1.05 2.66 2.73 2.54 2.48 0.9
14:1n-5 0.11 0.13 0.1 0.1 0.1 0.11 0.06
14:1n-7 0.03 0.03 0.04 0.04 0.03 0.02 0.02
15:0 0.29 0.3 0.31 0.31 0.28 0.26 0.23
15:1n-5 0.03 0.03 0.02 0.01 0.02 0.02 0.02
16:0iso 0.33 0.35 0.44 0.45 0.48 0.51 0.31
16:0 16.3 16.98 21.41 21.52 20.79 21.07 22.29
16:1n-7 1.96 1.98 2.49 2.52 2.5 2.58 1.15
16:1n-5 0.19 0.23 0.19 0.21 0.2 0.2 0.15
16:2n-6 0.08 0.09 0.16 0.16 0.14 0.14 0.03
16:2n-4 0.44 0.44 0.38 0.37 0.26 0.14 0.33
17:0 0.04 0.09 0.08 0.07 0.08 0.1 0.04
16:3n-4 0.6 0.59 0.29 0.29 0.23 0.2 0.34
16:3n-3 0.08 0.09 0.2 0.2 0.22 0.24 0.08
16:3n-1 0.39 0.43 0.38 0.39 0.47 0.54 0.35
16:4n-3 0.48 0.52 0.24 0.24 0.26 0.29 0.32
16:4n-1 0.1 0.12 0.1 0.1 0.13 0.16 0.07
18:0 5.76 6.38 5.87 5.8 5.93 6.17 5.69

Biomarkers of bone development and oxidative stress in seabream larvae
…………………………………………………………………………………………..
138
18:1n-9 23.67 24.5 12.81 12.44 11.23 10.86 16.97
18:1n-7 3.1 3.32 4.22 4.22 4.35 4.63 2.6
18:1n-5 0.31 0.29 0.34 0.34 0.29 0.25 0.25
18:2n-9 0.1 0.06 0.08 0.08 0.07 0.06 0.07
18:2n-6 4.95 5.03 1.45 1.36 1.97 2.81 13.09
18:2n-4 0.19 0.24 0.11 0.11 0.09 0.08 0.09
18:3n-6 0.1 0.11 0.08 0.08 0.07 0.07 0.06
18:3n-4 0.22 0.23 0?? 0.15 0.04 0.02 0.06
18:3n-3 0.38 0.39 0.32 0.32 0.36 0.46 0.74
18:4n-3 0.11 0.12 0.76 0.81 0.82 0.82 0.13
18:4n-1 0.05 0.06 0.04 0.02 0.03 0.05 0
20:0 0.18 0.2 0.15 0.15 0.15 0.16 0.15
20:1n-9 0.12 0.15 0.1 0.09 0.07 0.05 0.09
20:1n-7 1.25 1.33 1.32 1.31 0.97 0.69 1.02
20:1n-5 0.14 0.17 0.23 0.23 0.24 0.25 0.09
20:2n-9 0.01 0.02 0.01 0.01 0.01 0.01 0
20:2n-6 0.35 0.39 0.13 0.12 0.15 0.16 0.27
20:3n-9 0 0.07 0.01 0.01 0.02 0.02 0
20:3n-6 0.11 0.06 0.07 0.06 0.09 0.11 0
20:4n-6 1.4 1.47 1.17 1.16 1.17 1.15 0.89
20:3n-3 0.17 0.18 0.23 0.22 0.14 0.09 0.15
20:4n-3 0.29 0.3 0.3 0.31 0.38 0.44 0.15
20:5n-3 5.53 5.7 12.44 12.69 13.15 13.41 5.11
22:1n-11 0.09 0.08 0.04 0.02 0.03 0.03 0.01
22:1n-9 0.35 0.34 0.58 0.58 0.49 0.43 0.28
22:4n-6 0.13 0.1 0.27 0.28 0.29 0.31 0.08
22:5n-6 0.25 0.29 0.19 0.19 0.17 0.14 0.16
22:5n-3 0.43 1.29 0.94 0.92 1.15 1.44 0.27
22:6n-3 22.75 23.7 26.24 26.24 27.34 25.78 24.83
!Saturated 23.62±2.34b 25.00±2.06
b 30.48±2.14
a 30.58±2.88
a 29.78±2.56
a 30.23±2.76
a 29.30±2.63
a
!monoenoics 31.34±2.87a 32.58±2.55
a 22.48±1.89
b 22.10±2.01
b 20.51±1.94
b 20.11±2.03
b 22.70±1.97
b
!n-3 30.22±2.64b 32.28±1.99
bc 41.90±2.85
a 41.94±2.92
a 43.84±2.69
a 42.97±2.73
a 31.78±2.14
c
! n-6 7.39±1.06b 7.54±1.01
b 3.52±0.24
d 3.41±0.59
d 4.05±0.83
c 4.89±0.79
c 14.59±1.56
a
!n-9 24.24±1.66a 25.14±1.71
a 13.91±1.63
c 13.20±1.45
c 11.88±1.58
c 11.43±1.64
c 17.41±1.31
b
! n-3HUFA 29.17±2.26b 31.16±2.70
b 40.15±2.91
a 40.37±2.88
a 42.17±2.69
a 41.16±2.72
a 30.51±2.24
b
ARA 1.40±0.42a 1.47±0.37
a 1.17±0.31
a 1.16±0.29
a 1.17±0.28
a 1.15±0.30
a 0.89±0.19
b
EPA 5.53±1.01b 5.70±1.12
b 12.44±1.36
a 12.69±1.26
a 13.15±1.29
a 13.41±1.30
a 5.11±1.02
b
DHA 22.75±1.10c 23.70±1.33
bc 26.24±1.56
a 26.24±1.67
a 27.34±1.74
a 25.78±1.97
ab 24.83±1.02
b
EPA/ARA 3.95±0.97c 3.88±0.88
c 10.59±1.03
a 10.95±1.10
a 11.25±1.14
a 11.65±1.19
a 5.71±1.07
b
DHA/EPA 4.11±0.92a 4.16±0.83
a 2.11±0.24
b 2.07±0.27
b 2.09±0.30
b 1.93±0.22
b 4.88±0.91
a
DHA/ARA 16.23±1.56c 16.13±1.62
c 22.34±1.78
b 22.64±1.85
b 23.40±1.91
b 22.47±1.85
b 27.83±1.95
a
n-3/n-6 4.09±0.84c 4.29±0.90
c 11.90±1.06
ab 12.33±1.16
a 10.83±0.90
b 8.78±1.04
c 2.18±0.23
d

Biomarkers of bone development and oxidative stress in seabream larvae
…………………………………………………………………………………………..
139
The degree of larval lipid oxidation, as indicated by larval malondialdehyde (MDA)
content was significantly higher in those larvae fed 8SBL/3000 than in any of the
other larvae, except those larvae fed 8KPL/1500 diets. The increased in dietary -
tocopherol, decreased significantly MDA content in larvae fed free 0KPL diets, and
tended to reduce MDA content in larvae fed 4KPL and 8KPL diets (Figure 6.7).
The general pattern of antioxidant enzyme (AOE) genes expression of seabream
larvae was characterized by significant up-regulation by the increase in dietary PL
contents and a significantly lower expression by the increase in !-tocopherol levels
(Figs. 8-10). Thus, there were no significant differences between larvae fed
0KPL/1500 and 0KPL/3000 diets in CAT gene expression, whereas supplementation
of 3000 mg -tocopherol kg-1
diet in KPL and SBL diets significantly lowered CAT
and SOD genes expression in the (Figures 6.8 and 6.9). On the contrary, despite a
higher GPX gene expression was found with increased dietary PL, the expression of
this enzyme was not affected by increasing !-tocopherol level (Figure 6.10).
Figure 6.7 The malondialdehyde (MDA) content in gilthead seabream larvae (44 dph)
fed different dietary contents of two phospholipid sources combined with two !-
tocopherol levels.. Values (mean ± standard deviation) with the same letters are not
significantly different (P>0.05).
!"
#!"
$!!"
$#!"
%!!"
%#!"
&!!"
&#!"
'!!"
!()*+$#!!"!()*+&!!!"'()*+$#!!"'()*+&!!!",()*+$#!!",()*+&!!!" ,-.*+&!!!"
!"#"$%&'#()*+),#
%-,.#
b
c
bc
ab
bc
a
c

Biomarkers of bone development and oxidative stress in seabream larvae
…………………………………………………………………………………………..
140
Figure 6.8 Catalase (CAT) gene expression level measured by real-time PCR in
gilthead seabream larvae (44 dph) fed different dietary contents of two phospholipid
sources combined with two !-tocopherol levels.Values (mean ± standard deviation)
with the same letters are not significantly different (P>0.05).
Figure 6.9 Superoxide dismutase (SOD) gene expression level measured by real-time
PCR in gilthead seabream larvae (44 dph) fed different dietary contents of two
phospholipid sources combined with two !-tocopherol levels. Values (mean ±
standard deviation) with the same letters are not significantly different (P>0.05).
!"
#"
$"
%"
&"
'"
"""!()*+
#'!!"
!()*+%!!!" "&()*+#'!!""&()*+%!!!"",()*+#'!!"",()*+%!!!" ",-.*+%!!!"
!"#$%&'&$(&)&*$+,-.&//01'$
$
20&3$
a
b
a
b b b
a
!"
#"
$"
%"
&"
'"
/"
0"
,"
1"
#!"
"""!()*+#'!!"!()*+%!!!" "&()*+#'!!" "&()*+%!!!" ",()*+#'!!" ",()*+%!!!" ",-.*+%!!!"
452$%&'&$(&)&*$+,-.&//01'$
$
20&3$
a
b cb b
a
a
c

Biomarkers of bone development and oxidative stress in seabream larvae
…………………………………………………………………………………………..
141
Figure 6.10 Glutathione peroxidase (GPX) gene expression level measured by real-
time PCR in gilthead seabream larvae (44 dph) fed different dietary contents of two
phospholipid sources combined with two !-tocopherol levels. Values (mean ±
standard deviation) with the same letters are not significantly different (P>0.05).
The gene of BMP4, an early marker of osteoblast differentiation was significantly up-
regulated in larvae fed 4KPL and 8KPL in comparison to those fed SBL and free KPL
diets (Figure 6.11). Similarly, the expression of RUNX2 was significantly higher in
4KPL and 8KPL larvae than in those fed 0KPL/1500 or 8SBL/3000 (Figure 6.12).
Besides, the lowest expression of ALP, an early marker of cell mineralization, was
found in larvae fed 0KPL/1500. The genes of osteocalcin (OC), osteopontin (OP) and
osteonectine (ON), skeletal extracellular matrix proteins that are markers of
osteogenesis, were significantly up-regulated in larvae fed 4KPL and 8KPL in
comparison to those fed SBL and free KPL diets (Figures 6.13, 6.14 and 6.15).
Finally, the expression of matrix GLA protein (MGP), a physiological marker of
endochondral ossification, was significantly up-regulated in larvae fed KPL and SBL
diets in comparison to larvae fed free KPL diets (Figure 6.17). However, the
expression of these osteogenetic markers was not affected by increasing !-tocopherol
levels.
!"
#"
$"
%"
&"
'"
("
)"
*"
+"
"""!,-./#'!!"!,-./%!!!" "&,-./#'!!" "&,-./%!!!" "*,-./#'!!" "*,-./%!!!" "*01./%!!!"
!"#$!%&%$'%(%)$*+,-%../0&$
$
1/%2$
d
c
a
cd
cd
a
a

Biomarkers of bone development and oxidative stress in seabream larvae
…………………………………………………………………………………………..
142
Figure 6.11 BMP4 (Bone morphogenetic protein 4) gene level expression measured
by real-time PCR in gilthead seabream larvae (44 dph) fed different dietary contents
of two phospholipid sources combined with two !-tocopherol levels. Values (mean ±
standard deviation) with the same letters are not significantly different (P>0.05).
Figure 6.12 RUNX2 (Runt-related transcription factor 2) gene expression level
measured by real-time PCR in gilthead seabream larvae (44 dph) fed different dietary
contents of two phospholipid sources combined with two !-tocopherol levels. Values
(mean ± standard deviation) with the same letters are not significantly different
(P>0.05).
!"
#"
$"
%"
&"
'!"
'#"
'$"
'%"
'&"
#!"
!()*+',!!"!()*+-!!!"$()*+',!!"$()*+-!!!"&()*+',!!"&()*+-!!!" &./*+-!!!"
!"#$%&'('%)'*'+%%
,-./'0012(%3%45%
61'7%
b
b b
a
a a
a
!"
'"
#"
-"
$"
,"
%"
!()*+',!!" !()*+-!!!" $()*+',!!" $()*+-!!!" &()*+',!!" &()*+-!!!" &./*+-!!!"
89:;<%&'('%)'*'+%,-./'0012(%
61'7%
c
ab
ab
a
a
a
b

Biomarkers of bone development and oxidative stress in seabream larvae
…………………………………………………………………………………………..
143
Figure 6.13 Alkaline phosphatase gene level expression measured by real-time PCR
in gilthead seabream larvae (44 dph) fed different dietary contents of two
phospholipid sources combined with two !-tocopherol levels. Values (mean ±
standard deviation) with the same letters are not significantly different (P>0.05).
Figure 6.14 Osteocalcin gene expression level measured by real-time PCR in gilthead
seabream larvae (44 dph) fed different dietary contents of two phospholipid sources
combined with two !-tocopherol levels. Values (mean ± standard deviation) with the
same letters are not significantly different (P>0.05).
!"
#"
$"
%"
!&'()#*!!" !&'()%!!!" +&'()#*!!" +&'()%!!!" ,&'()#*!!" ,&'()%!!!" ,-.()%!!!"
!"#$%&'&$"&(&)$*+,-../0'$
1/&2$
b
ab a
a
a
a a
!"
#"
$"
%"
+"
*"
/"
0"
,"
1"
!&'()#*!!" !&'()%!!!" +&'()#*!!" +&'()%!!!" ,&'()#*!!" ,&'()%!!!" ,-.()%!!!"
3.2&045)4/'$%&'&$$
"&(&)$*+,-&./0'$
1/&2.$
2"2"2"
2"
3"
4"
3"

Biomarkers of bone development and oxidative stress in seabream larvae
…………………………………………………………………………………………..
144
Figure 6.15 Osteopontin gene level expression measured by real-time PCR in gilthead
seabream larvae (44 dph) fed different dietary contents of two phospholipid sources
combined with two !-tocopherol levels. Values (mean ± standard deviation) with the
same letters are not significantly different (P>0.05).
Figure 6.16 Osteonectin gene expression level measured by real-time PCR in gilthead
seabream larvae (44 dph) fed different dietary contents of two phospholipid sources
combined with two !-tocopherol levels. Values (mean ± standard deviation) with the
same letters are not significantly different (P>0.05).
!"
#"
$"
%"
&"
'"
!()*+#'!!" !()*+%!!!" &()*+#'!!" &()*+%!!!" ,()*+#'!!" ,()*+%!!!" ,-.*+%!!!"
!"#$%&%'#(')*$'$))
+$,$-)./&0$"(%')
1($#)
c
c
b
a
a ab a
!"
#"
$"
%"
&"
!()*+#'!!" !()*+%!!!" &()*+#'!!" &()*+%!!!" ,()*+#'!!" ,()*+%!!!" ,-.*+%!!!"
!"#$%'$2#(')*$'$))
+$,$-)./&0$""(%')
1($#)
c
bc
ab
a a
a
ab

Biomarkers of bone development and oxidative stress in seabream larvae
…………………………………………………………………………………………..
145
Figure 6.17 Matrix Gla protein gene level expression measured by real-time PCR in
gilthead seabream larvae (44 dph) fed different dietary contents of two phospholipid
sources combined with two !-tocopherol levels. Values (mean ± standard deviation)
with the same letters are not significantly different (P>0.05).
Discussion
Gilthead seabream larvae fed diets without PL supplementation showed the lowest
survival, growth and stress resistance. The increase in dietary PL contents markedly
improved stress resistance determined as survival after handling, regardless the type
of PL, marine or soybean derived. Moreover, increase in PL markedly promoted
larval survival (y = 7.8688x - 24.206, R" = 0.6284) and growth what could be related
to a faster larval tissues maturation as suggested by the significant increase in alkaline
phosphatase activity in previous studies (Wold et al., 2007; Saleh et al., 2012a, b) and
a better dietary nutrients utilization (Saleh et al., 2012a, b). Nevertheless, the increase
in dietary PL over 9% did not further improved larval survival and growth, in
agreement with previous studies that reccomended a 10% marine PL inclusion in
early weaning diets for gilthead seabream (Saleh et al., 2012a).
The growth promoting efffect of dietary PL was particularly effective when diets
included krill derived PL, which contained higher n-3 HUFA and DHA levels than
soybean lecithin. Indeed, a significant correlation was found between total length and
dietary N-3 HUFA (y = 0.2819x + 0.2648 R" = 0.8297) or DHA (y =0.9577x -
13.677, R" = 0.7382), as well as between final body weight and dietary n-3 HUFA (y
= 94.224x - 1779.9 R" = 0.81463) or DHA (y = 311.98x – 6235 R" = 0.6886). Similar
!"
#"
$"
%"
&"
'"
("
)"
!*+,-#'!!" !*+,-%!!!" &*+,-#'!!" &*+,-%!!!" .*+,-#'!!" .*+,-%!!!" ./0,-%!!!"
!"#$%&'()"'(*+*''
)*,*-'./01*2234+'
53*6'
c
c
a ab ab
b
b

Biomarkers of bone development and oxidative stress in seabream larvae
…………………………………………………………………………………………..
146
results were also obtained in previous studies (Saleh et al., submitted), where gilthead
seabream larvae were fed several levels of marine PL versus soybean PL.
Nevertheless, the higher performance of fish fed marine PL seems to be not only due
to a higher total content on these fatty acids. For instance, feeding soybean PL
markedly increased the peroxidation risk in the larvae as denoted by the higher
TBARs and GPX gene expression, as it was also found in other studies (Saleh et al.,
submitted). Besides, comparison of two weaning diets containing the same PL (2.5%)
and n-3 HUFA (1.6%) levels for gilthead seabream showed that the diet containing
these fatty acids in the PL fraction leads to higher growth rates than those containing
n-3 HUFA in the NL (Salhi et al., 1999; Izquierdo et al., 2001). Indeed, when larvae
are fed marine PL there is a higher incorporation of these fatty acids in the larval PL
(Izquierdo et al., 2001). In agreement, in the present study, larvae fed krill PL showed
a higher n-3 HUFA content than larvae fed soybean PL. Particularly, EPA contents in
marine PL fed larvae were more than double than in soybean PL fed ones, despite the
diets had similar EPA levels. In turn, larval n-3 HUFA contents were highly
correlated with the expression of BMP-4 gene (y = 0.4298x-2.9237, R! = 0.95).
Accordingly, this gene, included in the transforming growth factor b superfamily that
regulates mesenchymal cells differentiation into osteoblasts along development, is up-
regulated by n-3 HUFA in fish (Lall and Lewis-McCrea, 2007; Saleh et al.,
submitted) and other vertebrates (Kruger et al., 2010). For instance, feeding dietary n-
3 HUFA to growing male rats markedly increases bone formation (Watkins et al.,
2000). The other osteogenetic biomarkers studied such as RUNX 2, ALP, OC, OP
were not so strongly correlated to the larval n-3 HUFA (R! = 0.21869, R! =
0.27996, R! = 0.42656, R! = 0.10688, respectively), what could be suggesting that
their up-regulation by n-3 HUFA rather than directly is mediated by BMP-4.
Nevertheless, larval EPA contents were highly correlated not only with the expression
of RUNX 2, ALP, OC and OP (y = 0.1959x + 0.8592 R! = 0.70753, y = 0.0643x +
1.012 R! = 0.64505, y = 0.5572x - 0.7555 R! = 0.73037, y = 0.2846x - 0.1597 R! =
0.8814, respectively), but also with bone mineralization in larvae from the same larval
size (0.8-1.0 cm total length) (y = 0.7339x + 3.4274 R! = 0.73408) denoting the
importance of this fatty acid for bone formation, as it also occurs with DHA
(Izquierdo et al., 2012). Indeed, EPA is a good substrate for both cycloxigenases and
lipoxigenases and, in marine fish, it can be an important source of certain eicosanoids.

Biomarkers of bone development and oxidative stress in seabream larvae
…………………………………………………………………………………………..
147
Actually, PGE3 derived from EPA is the main prostaglandin found in plasma of
juvenile gilthead seabream (Ganga et al., 2005), prostaglandines being found to
regulate mineralization in other vertebrates (Kruger et al., 2010).
The increase in !-tocopherol dietary levels did not affected larval survival in
agreement with previous studies in this species (Montero et al., 1996; Atalah et al.,
2012). It neither affected survival after the handling stress, despite the importance of
this vitamin for stress resistance and immune system regulation (Montero et al.,
1998), what could suggest that even the lower !-tocopherol levels tested in these diets
were enough to cover the basic larval requirements. Nonetheless, increase in dietary
!-tocopherol tend to improve growth, particularly in terms of body weight, in relation
to the n-3 HUFA levels in the diet denoting the protective role against oxidation of
this vitamin. Thus, at lower n-3 HUFA dietary levels there was no effect of !-
tocopherol on growth, whereas when dietary n-3 HUFA increase this vitamin
significantly increased larval body weight in agreement with previous studies (Atalah
et al., 2011). Growth may be also improved by increased dietary !-tocopherol in diets
for marine fish juveniles (Tocher et al., 2002). In the present study, increase in !-
tocopherol decreased the oxidative stress in the larvae as denoted by the reduction in
larval TBARs contents. These results point out the importance of this vitamin for
protection of polyunsaturated fatty acids from peroxidation, being !-tocopherol a
structural component of cell membranes (Putnam and Comben, 1987). Several types
of compounds are derived from oxidation of polyunsaturated fatty acids, such as fatty
acid hydroxyperoxides, fatty acid hydroxides, aldehydes and hydrocarbons, several of
them being toxic, binding to proteins amino groups, nucleic acid and phospholipid
bases and damaging membrane lipids, proteins and DNA (Frankel, 1998). Thus, lipid
peroxidation results in damage to cellular and sub-cellular membranes (Puangkaew et
al., 2005), structural proteins and different fish tissues and organs (Watanabe et al.,
1970; Sakai et al., 1989; Bai and Lee, 1998). Increase in !-tocopherol reduced the
gene expression of SOD and CAT, but not GPX. Similarly, increase in !-tocopherol
contents in rotifers reduces SOD and CAT gene expression in gilthead seabream
larvae but does not affect GPX (Izquierdo et al., 2012). SOD prevents the
initialization of the radical chain reaction that the superoxide anion produces, by the
conversion of superoxide into hydrogen peroxide (Winston and Di Giulio, 1991). In
turn, hydrogen peroxide is broken down to molecular oxygen and water by either

Biomarkers of bone development and oxidative stress in seabream larvae
…………………………………………………………………………………………..
148
CAT or GPX, respectively acting in the peroxisomes or mitochondria principally. N-
3HUFA, particularly EPA that indeed was higher in diets containing PL, are mainly
catabolized in peroxisomes (Henderson, 1996) and would be responsible for the
higher peroxidation risk in these organelles as denoted by the higher CAT gene
expression. !-tocopherol intercept peroxyl radicals (ROO-) more rapidly than HUFA
and converts it to a hydroperoxide product breaking the chain of reactions involved in
lipid auto-oxidation. In the present study, increase in dietary !-tocopherol seems to
effectively prevent the fromation of free radicals from HUFA, particularly EPA, in
the peroxisomes as denoted by the reduction in CAT gene expression. However, in
fish, mitochondrial !-oxidation preferred saturated and monounsaturated fatty acids
over HUFA with EPA usually oxidised to a lesser extent (Sargent et al. 1989; Tocher
2003), and therefore, protection of EPA by increased !-tocopherol did not affected the
oxidative risk in mitochondria as denoted by the lack of effect on GPX. Besides, the
positive effect of !-tocopherol in fish growth may be also related to its role in cellular
metabolism, signal transduction (Traber and Parker, 1995) or modulation of
eicosanoid synthesis (Cornwell and Parganamala, 1993).
The effect of !-tocopherol in skeletal development has been studied extensively in
terrestrial mammals but not in fish. !-tocopherol is important for proper skeletal
development (Xu et al., 1995; Jilka et al., 1996) where it associates with the lipid
bilayer of bone cells allowing it to be the first line of defense against free radicals
(Arjmandi et al., 2002). In gilthead seabream larvae, feeding very high DHA rotifers
(> 5% in dry basis) without an adequate balance of antioxidant nutrients increases the
production of free radicals that damage the cartilaginous anlagen of bones such as
skull or vertebral archs and spines and favours the development of skeletal
deformities (Izquierdo et al., 2012). However, increase in !-tocopherol markedly
reduced anomalies incidence in these bones. In the present study, the incidence of
cranium anomalies was very low suggesting that the dietary DHA levels used (< 5%
in dry basis) were not negatively affecting bone formation. In consecuence, the
increased in !-tocopherol from 1500 to 3000 mg kg-1
diet did neither affected the
incidence of bone anomalies or the genes implicated in the osteogenesis processes.
In summary, feeding soybean PL improved larval seabream growth and survival, but
increased TBARs and GPX gene expression increasing peroxidation risks. Krill
derived PL improved larval growth and survival more effectively than soybean PL,

Biomarkers of bone development and oxidative stress in seabream larvae
…………………………………………………………………………………………..
149
enhancing n-3 HUFA and particularly EPA incorporation into larval tissues and up-
regulating the gene expression of bone development biomarkers as well as bone
mineralization. The increase in dietary !-tocopherol further improved growth in
relation to the dietary n-3 HUFA levels denoting its protective role against oxidation
and reducing larval TBARs and gene expression of SOD and CAT. Further studies
are being conducted to determine the !-tocopherol requirements in gilthead seabream
larvae in relation to the dietary contents of other antioxidants.
Acknowledgements
This study was partially supported by a grant from the Spanish Agency of
International Cooperation and Development (AECID) to Reda Saleh Mohamed
Ibrahim. The present study was partly funded by the Spanish Ministry of Sciences and
Education (AGL2009-14661). This work has been partly funded under the EU
seventh Framework Program by the ARRAINA project No
288925: Advanced
Research Initiatives for Nutrition and Aquaculture.

Selenium levels in early weaning diets for seabream larvae
………………………………………………………………………………………......
150
Chapter 7
-----------------------------------------------------------------------------
Selenium levels in early weaning diets for gilthead seabream
larvae
Abstract
The inclusion of complementary antioxidative factors, such as selenium (Se), could
counteract the high oxidation risk in early weanning diets high in polyunsaturated
fatty acids (PUFA). The objective of the present study was to investigate the effect of
graded levels of Se derived yeast with krill PL (KPL), on skeletal development,
survival, resistance to stress, oxidative status and biochemical composition of
seabream larvae. Seabream larvae were completely weanned at 16 dph and fed for 30
days five isoenergetic and isoproteic microdiets with different levels of Se: 2SE, 4SE,
6SE, 8SE and 12SE (1.73, 3.91, 6.41, 8.47, 11.65 mg kg-1
dietary dry weight,
respectively). Increase in Se up to 11.65 mg kg-1
dietary dry weight, significantly
improved larval survival (54% survival rate) and resistence to stress, whereas did not
affected larval growth. Seabream larvae fed diets supplemented with 12SE (11.65 mg
kg-1
) showed a gradual increase in this mineral according to the dietary Se levels and
denoting the progressive absorption of this nutrient. The degree of larval lipid
oxidation, as indicated by malondialdehyde (MDA) content and AOE genes
expression was significantly lower in those larvae fed diets 8SE and 12SE compared
with those of 2SE and 4SE diets. Also, a reactive response as a result of Se inclusion
was observed by the increase in osteocalcin, osteonectin osteopontin, alkaline
phosphatase and matrix gla protein genes expression in larval tissues, suggesting a
well skeletal development. These results denoted the high efficiency of Se as an
antioxidant factor and the importance of the inclusion of adequated levels (11.65 mg
Se kg-1
diet) in early weaning diets.

Selenium levels in early weaning diets for seabream larvae
………………………………………………………………………………………......
151
Introduction
The oxidation of important nutrients like lipids, essential fatty acids and proteins that
have critical biological and physiological functions, leads to harmful alterations in
fish causing several pathological conditions (Sakai et al. 1989) including cellular
damages (Halliwell and Gutteridge, 1996), muscles injuries (Betancor et al., 2011),
negative growth, low feed intake and delayed development in several fish species
(Tacon, 1991). Moreover, the oxidation of dietary lipids may also lead to an increased
incidence of deformities in marine fish larvae (Lewis-McCr and Lall, 2007). It is well
known that dietary lipids constitute a major source of energy and essential fatty acids
for fish and play a main role in larval development (Rainuzzo et al., 1997; Izquierdo
and Koven, 2010). Among them, dietary phospholipids (PL) levels have been found
to positively affect survival, growth and resistance to stress and reduce the occurrence
of morphological anomalies in several fish and crustaceans (Kanazawa, 1985;
Geurden et al., 1998a, b; Cahu et al., 2003a; Liu et al., 2002; Izquierdo and Koven,
2010; Saleh et al., 2012a, b). They constitute important sources of essential fatty acids
that have a crucial role in maintaining the structure and function of cellular
membranes (Tocher, 2003). Besides, they may act as emulsifiers in the gut and
improve intestinal absorption of long chain fatty acids (Fontagné et al., 2000).
Moreover, they stimulate lipoprotein synthesis in intestinal enterocytes (Fontagné et
al., 1998; Geurden et al., 1998b; Liu et al., 2002) and play an important role in the
transport and assimilation of dietary lipids (Izquierdo et al., 2001). However, dietary
PL may have high levels of polyunsaturated fatty acids that are very sensitive to
peroxidation resulting in production of harmful peroxides and, consecuently, affect
their biological and physiological functions. In previous studies, thiobarbituric acid
reactive substances (TBARS) contents and antioxidant enzmes genes expression were
rised in seabream larvae fed increasing levels of dietary PL rich in n-3 highly
unsaturated fatty acids (HUFA) or linoleic acid (Saleh et al., submitted).
Polyunsaturated fatty acids including those with five and six ethylenic bonds, such as
eicosapentaenoic acid (EPA) and docosahexaenoic acid (DHA), are very susceptible
to oxidation due to their long chain lengths and the greater number of unsaturated
carbon-carbon bonds (Betancor et al., 2012c). The mechanism of lipid oxidation
begins with auto-oxidation involving the direct reaction of lipids with molecular

Selenium levels in early weaning diets for seabream larvae
………………………………………………………………………………………......
152
oxygen to form hydroperoxides, followed by secondary oxidation reactions yielding
diperoxides, which are detrimental toxic compounds. Besides, dietary lipid oxidation
is increased by factors such as the presence of lipoxidase, hematin, peroxides, light
(involving in the photolysis of peroxides), high temperature, trace metal notably iron,
copper, cobalt, and zinc (Dabrowski and Guderly, 2002; Sutton et al., 2006). Dietary
lipid oxidation is even more exposed in formulated diets for marine fish larvae, which
are formed by micro-particles high in polyunsaturated fatty acid contents, with a large
surface area to volume ratio and that remain in contact with seawater for long periods
until they are reach by the larvae. This type of diets may yield products of secondary
oxidation of lipids that contribute to off flavor and include toxic compounds
frequently associated with rancidity reducing their nutritional value (Halliwell and
Chirico, 1993). Besides, the larval phase is one of the most critical stages in fish life
cycle, among other reasons, for the high requirement of n-3 HUFA, as essential fatty
acids for normal growth and development, what leads to a high oxidative stress risk in
relation to the elevated larval metabolic rate (Evjemo et al., 2003). The lipid oxidation
in marine fish larvae could be at least partly responsible for the higher disease
incidence and subsequent larval mortalities (Tocher et al., 2002).
The oxidative stress in fish is an aspect of aerobic life that results of an imbalance
between the production of reactive oxygen species (ROS) and antioxidant defences
factors in living organisms (Nishida, 2011). ROS at low concentrations may be
beneficial or even indispensable in processes such as defence against microorganisms,
contributing to phagocitic bactericidal activity. However, the elevated levels of free
radicals that are produced by endogenous cellular sources during normal cell
metabolism and endogenous ROS that are produced by mitochondrial respiration can
cause oxidation of proteins and lipids, alterations in gene expression, and changes in
cell redox status giving rise to oxidative stress (Rando, 2002; Livingstone, 2003). In
fish there are different effective antioxidant enzymes (AOE) capable of inhibiting the
lipid-peroxidation catalytic cycle by catalyzing the decomposition of hydrogen
peroxide into less reactive gaseous oxygen and water molecules, including catalase
(CAT), superoxide dismutase (SOD) and glutathione peroxidase (GPX). Dietary
nutrients also constitute antioxidant factors that must be added in feed diets such as
selenium, vitamin E and C or carotenoids (Montero et al., 2001; Díaz et al., 2010;
Hamre, 2010; Betancor et al., 2011; Betancor et al., 2012a, c, d). Selenium is an
antioxidant essential trace mineral in nutrition of marine organisms partly obtained

Selenium levels in early weaning diets for seabream larvae
………………………………………………………………………………………......
153
from the surrounding water (Lall and Bishop, 1977), but mostly from the diet (Halver,
2002b). Selenium, as an essential micronutrient, plays an important role in antioxidant
defences being a cofactor for antioxidant enzyme GPX (Felton et al., 1996), which
reduces hydroperoxides by catalyzing the oxidation reaction of glutathione (Arteel
and Sies, 2001). Selenium has been shown to prevent dietary hepatic necrosis and
exudative diathesis (Schwarz et al., 1957), its deficiency being characterized by
cardiomyopathy and muscular weakness (Chen et al., 1980). Despite the fact of being
a required micronutrient, Se may be toxic at concentrations only slightly greater than
the nutritional requirements (Hilton et al., 1980).
There are very few studies denoting the importance of Se supplementation in fish
diets and, despite its particular importance in microdiets for marine fish larvae, none
of them has aimed to determine the larval requirements for this micronutrient by
feeding at least 5 different dietary levels. Thus, the objective of the present study was
to investigate the effect of graded levels of yeast derived Se in early weaning
microdiets rich in KPL on gilthead seabream (Sparus aurata) larvae performance,
resistance to stress, biochemical composition and expression of genes related to
oxidative stress and bone metabolism.
Material and methods
Gilthead seabream larvae were obtained from natural spawnings from Instituto
Canario de Ciencias Marinas (Grupo de Investigación en Acuicultura (GIA), Las
Palmas de Gran Canaria, Spain). Larvae (5.1 mm total length, 100 !g dry body
weight) previously fed rotifers (Brachinous plicatilis) enriched with DHA Protein
Selco®
(INVE, Dendermond, Belgium) until 16 dph, were randomly distributed in 15
experimental tanks at a density of 2100 larvae tank-1
and fed one of the diets tested in
triplicate. All tanks (200 L fibreglass cylinder tanks with conical bottom and painted a
light grey colour) were supplied with filtered seawater (37 ppm salinity) at an
increasing rate of 0.4 - 1.0 L min-1
to assure good water quality during the entire trial.
Water entered from the tank bottom and exited from the top to ensure water renewal
and to maintain high water quality, which was tested daily and no deterioration was
observed. Water was continuously aerated (125 ml min-1) attaining 6.3±1 ppm
dissolved O2. Average water temperature and pH along the trial were 19.8±1.5°C and
7.89, respectively. Photoperiod was kept at 12h light: 12h dark, by fluorescent

Selenium levels in early weaning diets for seabream larvae
………………………………………………………………………………………......
154
daylights and the light intensity was kept at 1700 lux (digital Lux Tester YF-1065,
Powertech Rentals, Western Australia, Australia).
Five experimental microdiets (pellet size 250-500 !m) were formulated containing a
PL rich krill oil (Qrill, high PL, Aker BioMarine, Fjordalléen, Norway) and five
levels of yeast derived Se (Sel-Plex®
2000, 2000 mg Se kg-1
, Alltech, Lexington, KY)
as source of organic Se. Thus, analysed Se content of the diets was 1.73, 3.91, 6.41,
8.47 and 11.65 mg/kg for diets 2SE, 4SE, 6SE, 8SE and 12 SE, respectively. Diet
formulation and proximate analysis are showed in Table 7.1 and their fatty acids
profiles in Table 7.4. The microdiets were prepared by mixing squid powder and
water-soluble components, then the lipids and fat-soluble vitamins and, finally, the
gelatine dissolved in warm water. The paste was compressed pelleted (Severin,
Suderm, Germany) and dried in an oven at 38 ºC for 24 h (Ako, Barcelona, Spain).
Pellets were ground (Braun, Kronberg, Germany) and sieved (Filtra, Barcelona,
Spain) to obtain a particle size between 250 to 500 !m. Diets were prepared and
analyzed for proximate and fatty acid composition at GIA laboratories.
Table 7.1 Formulation and proximate composition of the experimental microdiets
containing five selenium levels
Ingredients (g/100 g Diet) 2SE 4SE 6SE 8SE 12SE
Sel-Plex®
2000a 0 0.1 0.2 0.3 0.5
Squid powderb 69 68.9 68.8 68.7 68.5
KPLc 13 13 13 13 13
Oleic acidd 1.5 1.5 1.5 1.5 1.5
Gelatin 3 3 3 3 3
Min Px 4.5 4.5 4.5 4.5 4.5
Vitamin Px 6 6 6 6 6
Attractant 3 3 3 3 3
Proximate analysis
% dry weight
Total lipids 25.54 25.62 25.35 25.42 25.28
Protein 61.5 61.9 60.7 59.5 59.2
Ash 7.11 7.35 7.39 7.41 7.49
Humidity 8.00 7.90 8.10 7.93 8.23
Se mg/kg 1.73 3.91 6.41 8.47 11.65
a Alltech, Lexington, KY.
b Rieber and Son, Bergen, Norway.
c Qrill, high phospholipids, Aker BioMarine, Fjordalléen, Norway.
d Merck KGaA, Darmstadi, Germany.
Diets were manually supplied fourteen times per day each 45 min from 9:00 to 19:00

Selenium levels in early weaning diets for seabream larvae
………………………………………………………………………………………......
155
for 29 days. Non-enriched rotifers were co-fed during days 16th
and 17th
(1 rotifer/ml).
To assure feed availability, daily feed (pellet size < 250 !m) supplied was maintained
at 1.5 and 2.5 g per tank during the first and second week of feeding. The amount of
feed added daily was gradually increased to 4-5 g per tank with increasing in pellet
size to 250–500!m, where an overlap using a mixture of both pellets sizes was
conducted during the third and forth week of feeding. Larvae were observed under the
binocular microscope to determine feed acceptance. Before the end of the experiment
an activity test by thermal shock was conducted allocating 25 larvae tank-1 in another
tank supplied with seawater at a temperature of 24ºC and aeration and determining
their survival after 24 hours. Final survival was calculated by individually counting all
the living larvae at the end of the experiment. Growth was determined by measuring
dry body weight (105ºC 24 h) and total length (Profile Projector V-12A Nikon,
Tokyo, Japan) of 30 fish tank-1
at the beginning, in the middle and at the end of the
trial. In addition, at the end of the trial and after 12 h of starvation, the all larvae in
each tank were washed with distilled water, sampled and kept at -80 ºC for
biochemical composition.
Fresh larvae samples (100 mg per tank) for molecular biology analysis were well
washed and conserved into 500 ml RNA Later (SIGMA), a product that rapidly
allows tissue to stabilize and protects cellular RNA in situ in unfrozen samples and
permits posterior RNA isolation. The larvae were stored in RNA later overnight at 4
ºC and after that RNA Later was removed before being stored at - 80 ºC to prevent the
formation of salt crystals.
Moisture (A.O.A.C. 1995), protein (A.O.A.C. 1995) and crude lipid (Folch 1957)
contents of larvae and diets were analyzed. Fatty acid methyl esters were obtained by
transmethylation of crude lipids as described by Christie (1982). Fatty acid methyl
esters were separated by GLC (GC -14A, Shimadzu, Tokyo, Japan) in a Supercolvax-
10-fused silica capillary column (length: 30 m; internal diameter: 0.32 mm; Supelco,
Bellefonte, USA) using helium as a carrier gas. Column temperature was 180 ºC for
the first 10 min, increasing to 215 ºC at a rate of 2.5 ºC/min and then held at 215 ºC
for 10 min. Fatty acid methyl esters were quantified by FID (GC -14A, Shimadzu,
Tokyo, Japan) following the conditions described in Izquierdo et al. (1990) and
identified by comparison to previously characterized standards and GLC-MS.

Selenium levels in early weaning diets for seabream larvae
………………………………………………………………………………………......
156
Total selenium concentration was measured in total larvae and diets. Samples were
acidified in a microwave digestor (MarsXpress, CEM, Kamp-Lintfort, Germany) with
5 ml of 69% pure nitric acid, then poured after digestion into a 10 ml volumetric flask
and made up to volume with distilled water. A total of 0.4 ml of this solution was then
added to a 10 ml sample tube, 10 !l of the internal standard (Ga and Sc, 10 ppm)
included and 0.3 ml of methanol added. The tubes were made up to volume with
distilled water and total selenium measured by collision/reaction ICP-MS (Thermo
Scientific, Cheshire, UK) using argon and hydrogen as carrier gas.
The measurement of TBARS in triplicate samples was performed using a method
adapted from that used by Burk et al. (1980). Approximately 20-30 mg of larval
tissue per sample were homogenized in 1.5 ml of 20% trichloroacetic acid (w/v)
containing 0.05 ml of 1% BHT in methanol. To this 2.95 ml of freshly prepared
50mM thiobarbituric acid solution were added before mixing and heating for 10
minutes at 100ºC. After cooling protein precipitates were removed by centrifugation
(Sigma 4K15, Osterode am Harz, Germany) at 2000 x g, the supernatant was read in a
spectrophotometer (Evolution 300, Thermo Scientific, Cheshire, UK) at 532 nm. The
absorbance was recorded against a blank at the same wavelength. The concentration
of TBA-malondialdehyde (MDA) expressed as !mol MDA per g of tissue was
calculated using the extinction coefficient 0.156 !M-1
cm-1
.
Molecular biology analysis was carried out at GIA laboratories. Total RNA from
larvae samples (average weight per sample 60mg) was extracted using
the Rneasy Mini Kit (Qiagen). Total body tissue was homogenised using the
TissueLyzer-II (Qiagen, Hilden, Germany) with QIAzol lysis reagent
(Qiagen). Samples were centrifuged with chloroform for phase separation (12000g,
15min, 4ºC). The upper aqueous phase containing RNA was mixed with 75% ethanol
and transferred into an RNeasy spin column where total RNA bonded to a membrane
and contaminants were washed away by RW1 and RPE buffers (Qiagen). Purified
RNA was eluted with 30ml of RNase-free water. The quality and quantity of RNA
were analysed using the NanoDrop 1000 Spectrophotometer (Thermo Scientific,
Wilmington, DE, USA). Synthesis of cDNA was conducted using
the iScript cDNA Synthesis Kit (Bio-Rad) according to manufacturer’s instructions in

Selenium levels in early weaning diets for seabream larvae
………………………………………………………………………………………......
157
an iCycler thermal cycler (Bio-Rad, Hercules, CA, USA). Primer efficiency was
tested with serial dilutions of a cDNA pool (1, 1:5, 1:10, 1:15,1:20 and 1:25). The
product size of the real-time q PCR amplification was checked by electrophoresis
analyses using PB322 cut with HAEIII as a standard. Real-time quantitative PCR
was performed in an iQ5 Multicolor Real-Time PCR detection system (Bio-Rad,
Hercules, CA, USA) using !-actin as the house-keeping gene in a final volume of
20ml per reaction well, and 100ng of total RNA reverse transcribed to complementary
cDNA. Each gene sample was analysed once per gene.
Table 7.2 Sequences of forward and reverse primers (5’-3’) for real-time
quantitative-PCR of seabream genes Gene Primers Accession n
o
Catalase(CAT) Forward primer: 5´-ATGGTGTGGGACTTCTGGAG-3´
Reverse primer: 3´-AGTGGAACTTGCAGTAGAAAC-5´
FJ860003
Superoxide
dismutase (SOD)
Forward primer: 5´- AAGAATCATGGCGGTCCTACTGA-3´
Reverse primer: 3´- TGAGCATCTTGTCCGTGATGTCT -5´
AJ937872
Glutathione
peroxidase (GPX)
Forward primer: 5´- TCCATTCCCCAGCGATGATGCC-3´
Reverse primer: 3´- TCGCCATCAGGACCAACAAGGA-5´
DQ524992
Osteocalcin Forward primer: 5´-AGCCCAAAGCACGTAAGCAAGCTA-3´
Reverse primer: 3´- TTTCATCACGCTACTCTACGGGTT-5´
AF048703
Osteopontin Forward primer: 5´- AAGATGGCCTACGACATGACAGAC- 3´
Reverse primer: 3´- CCTGAAGAGCCTTGTACACCTGC-5´
AY651247
Osteonectin Forward primer: 5´- AAAATGATCGAGCCCTGCATGGAC-3´
Reverse primer: 3´- TACAGAGTCACCAGGACGTT-5´
AY239014
aRUNX2 Forward primer: 5´- GCCTGTCGCCTTTAAGGTGGTTGC-3´
Reverse primer: 3´- TCGTCGTTGCCCGCCATAGCTG-5´
AJ619023
Alkaline
phosphatase
Forward primer: 5´- AGAACGCCCTGACGCTGCAA-3´
Reverse primer: 3´- TTCAGTATACGAGCAGCCGTCAC-5´
AY266359
Matrix Gla protein Forward primer: 5´- GTGCCCTCCTTCATTCCAC-3´
Reverse primer: 3´- TATGACCACGTTGGATGCCT-5´
AY065652
bBMP4 Forward primer: 5´- CCACCAGGGCAGACACGTCC-3´
Reverse primer: 3´- GCGTAGCTGCTCCCAGTCCTC-5´
FJ436409
!-actin Forward primer: 5´- TCTGTCTGG ATC GGAGGCTC-3´
Reverse primer: 3´- AAGCATTTG CGGTGGACG -5´
X89920
a RUNX2 (Runt-related transcription factor 2).
b BMP4 (Bone morphogenetic protein 4).
The PCR conditions were the following: 95ºC for 3min 30sec followed by 40 cycles
of 95ºC for 15sec, 61ºC for 30sec, and 72ºC for 30sec; 95ºC for 1min, and a final
denaturing step from 61ºC to 95ºC for 10sec. Data obtained were normalised and
the Livak method (2–""Ct
) used to determine relative mRNA expression levels.
Gilthead seabream specific gene primers were designed after searching the NCBI
nucleotide database and using the Oligo 7 Primer Analysis software (Molecular
Biology Insights, Cascade, CO, USA). Gilthead seabream specific gene primers were
designed after searching the NCBI nucleotide database and using the Oligo 7 Primer

Selenium levels in early weaning diets for seabream larvae
………………………………………………………………………………………......
158
Analysis software (Molecular Biology Insights, Cascade, CO, USA). Detailed
information on primer sequences and accession numbers is presented in Table 7.2.
Results
All the experimental diets were well accepted by gilthead seabream larvae according
to the microscopic observations. Generally, survival was very high for this type of
studies and it was significantly correlated to the dietary Se contents (Figure 7.1).
Thus, average survival of larvae fed 12SE diet (54% survival rate) was significantly
higher to 2SE, 4SE and 6SE treatments, but was not significantly different to 8SE
treatment. Generally, there was a very good survival of the termal stress and only
survival in larvae fed 12SE diet was significantly different than that of the other
larvae. The resistance to thermal shock stress was correlated to the dietary Se contents
(Figure 7.2).
The larval growth after thirty days of feeding in terms of total length and body weight
was very good regardless the experimental diets used. There was no significant
difference in the larval growth, expressed either in total length or body weight,
among the larvae fed the five experimental diets (Table 7.3).
Figure 7.1 Survival rate of larvae (44 dph) fed five dietary selenium levels. Values
(mean ± standard deviation) with the same letters are not significantly different
(P>0.05).
!"#"$%&'(&)*"+"$%*,&')"-"'&%./0"12"#"$%/,*'("
,$"
,3"
'$"
'3"
3$"
33"
.$"
.3"
*" '" ." (" &$" &*" &'"
!"#$"%&'(#$)$"%&*&
+,&-./&0,&1).2&
b b b
ab
a

Selenium levels in early weaning diets for seabream larvae
………………………………………………………………………………………......
159
Figure 7.2 Survival rate 24 h after thermal shock of 24ºC of larvae (44 dph) fed five
dietary selenium levels. Values (mean ± standard deviation) with the same letters are
not significantly different (P>0.05).
Tale 7.3 Growth in total length and body dry weight of larvae (44 dph) fed diets
containing five selenium levels. Values (mean ± standard deviation) with the same
letters are not significantly different (P>0.05)
2SE 4SE 6SE 8SE 12SE
Total length (mm) 10.68±1.22a 10.75±1.11
a 10.44±1.29
a 10.72±1.22
a 10.95±1.00
a
Dry weight (ug) 1900±119a 1920±112
a 1926±120
a 1896±130
a 2015±110
a
Biochemical composition of the larvae reflected the dietary content. Se content in
seabream larvae was correlated to the dietary Se levels. Thus larvae fed diet of 12SE
showed the significantly highest content of this mineral, being 6, 3 and 2 times higher
than in the larvae fed 2SE, 4SE and 6SE respectively, denoting the progressive
absorption of this nutrient (Figure 7.3).
!"#"$%&%%'()"*"+&+,-'("*"./&,.0"12"#"%&0/3,"
.%"
.)"
./"
.,"
.."
0%"
0)"
0/"
0,"
0."
)" /" ," ." +%" +)" +/"
!"#$%&'()#"(('(*#+,+%&'-'
'
$.'/"0'1.'2,")3'
'
b
b
b b
a

Selenium levels in early weaning diets for seabream larvae
………………………………………………………………………………………......
160
Figure 7.3 The selenium content in larvae (44 dph) fed diets containing five selenium
levels. Values (mean ± standard deviation) with the same letters are not significantly
different (P>0.05).
The fatty acid composition of the experimental diets was very similar and was not
affected by the inclusion of different Se levels (Table 7.4). However, the fatty acid
composition of the larvae was significantly affected by the dietary Se inclusion (Table
7.5). Thus, the larvae fed 8SE, and particularly, 12SE diets, were higher in n-3 and n-
3 HUFA, mainly due to higher DHA, than 2SE, 4SE and 6SE larvae. Moreover, the
larval DHA contents were correlated to the Se contents in larval tissues (y = 0.0053x
+ 24.248, R! = 0.86269). No significant difference was found in n-6, n-9, EPA and
ARA contents among the different larvae.
Table 7.4 Fatty acids (% dry weight) composition in total lipids of diets containing
five selenium levels
0 SE 2 SE 4 SE 6 SE 10 SE
14:0 1.97 1.69 1.83 1.66 1.68
14:1n-5 0.01 0.05 0.05 0.05 0.05
14:1n-7 0.01 0.04 0.04 0.04 0.04
15:0 0.06 0.09 0.09 0.09 0.09
15:1n-5 0.01 0.01 0.01 0.01 0.01
16:0iso 0.08 0.07 0.08 0.07 0.07
16:0 4.55 4.83 4.95 4.61 4.68
16:1n-7 1.09 1.02 1.09 1.03 1.03
16:1n-5 0.04 0.05 0.05 0.05 0.05
16:2n-6 0.01 0.08 0.09 0.09 0.09
16:2n-4 0.09 0.21 0.24 0.23 0.22
!"#"$%&'()*+,"-".(&/,(+"-"/&0''"
12"#"%&33.)'"
!"
#!!"
$!!"
%!!"
&!!"
'!!"
(!!"
)!!"
*!!"
!" $" &" (" *" #!" #$" #&"
!"#$%&"#'()*(%#+#,---#
."#$%&/"#01%2#
a
b
c
d
e

Selenium levels in early weaning diets for seabream larvae
………………………………………………………………………………………......
161
17:0 0.01 0.03 0.04 0.04 0.04
16:3n-4 0.09 0.07 0.07 0.07 0.07
16:3n-3 0.02 0.06 0.06 0.06 0.06
16:3n-1 0.09 0.06 0.06 0.01 0.03
16:4n-3 0.09 0.15 0.16 0.16 0.16
16:4n-1 0.02 0.01 0.00 0.01 0.01
18:0 1.51 0.58 0.56 0.56 0.56
18:1n-9 3.56 3.13 3.06 3.10 3.08
18:1n-7 0.65 1.16 1.18 1.18 1.17
18:1n-5 0.07 0.08 0.07 0.08 0.08
18:2n-9 0.02 0.00 0.01 0.03 0.02
18:2n-6 0.37 0.39 0.35 0.39 0.38
18:2n-4 0.03 0.02 0.01 0.02 0.02
18:3n-6 0.01 0.03 0.02 0.03 0.03
18:3n-4 0.02 0.01 0.01 0.01 0.01
18:3n-3 0.20 0.14 0.14 0.15 0.14
18:4n-3 0.03 0.40 0.42 0.43 0.42
18:4n-1 0.00 0.01 0.00 0.01 0.01
20:0 0.04 0.01 0.01 0.01 0.01
20:1n-9 0.02 0.04 0.03 0.04 0.04
20:1n-7 0.26 0.43 0.42 0.44 0.43
20:1n-5 0.03 0.05 0.05 0.06 0.06
20: 2n-9 0.00 0.00 0.00 0.00 0.00
20:2n-6 0.07 0.03 0.03 0.03 0.03
20:3n-9 0.00 0.00 0.00 0.01 0.01
20:3n-6 0.00 0.01 0.01 0.01 0.01
20:4n-6 0.23 0.15 0.14 0.16 0.15
20:3n-3 0.04 0.06 0.05 0.07 0.06
20:4n-3 0.04 0.06 0.06 0.06 0.06
20:5n-3 3.64 3.30 3.43 3.61 3.47
22:1n-11 0.00 0.01 0.01 0.01 0.01
22:1n-9 0.07 0.13 0.12 0.14 0.13
22:4n-6 0.02 0.08 0.08 0.09 0.09
22:5n-6 0.04 0.03 0.00 0.01 0.01
22:5n-3 0.08 0.08 0.07 0.23 0.17
22:6n-3 4.24 4.69 4.09 4.14 4.26
Total Saturated 8.15 7.23 7.49 6.98 7.06
Total Monoenoics 5.82 6.19 6.18 6.23 6.17
Total n-3 8.38 8.94 8.47 8.93 8.80
Total n-6 0.75 0.79 0.73 0.81 0.79
Total n-9 3.68 3.30 3.22 3.31 3.27
Total n-3HUFA 8.04 8.20 7.69 8.11 8.02
ARA 0.23 0.15 0.14 0.16 0.15
EPA 3.64 3.30 3.43 3.61 3.47
DHA 4.24 4.69 4.09 4.14 4.26
EPA/ARA 15.70 22.11 23.94 23.12 22.93
DHA/EPA 1.17 1.42 1.19 1.15 1.23
DHA/ARA 18.30 31.44 28.56 26.54 28.13
n-3/n-6 11.10 11.35 11.67 10.99 11.17

Selenium levels in early weaning diets for seabream larvae
………………………………………………………………………………………......
162
Table 7.5 Fatty acids (% total identified fatty acids) composition in total lipids of
larvae (44 dph) fed diets containing five selenium levels. Values (mean ± standard
deviation) with the same letters in the same row are not significantly different
(P>0.05)
2SE 4SE 6SE 8SE 12SE
14:0 3.16 2.77 3.27 3.25 2.16
14:1n-5 0.11 0.12 0.10 0.12 0.12
14:1n-7 0.05 0.04 0.04 0.05 0.05
15:0 0.32 0.29 0.32 0.34 0.35
15:1n-5 0.03 0.03 0.02 0.02 0.03
16:0iso 0.41 0.47 0.49 0.42 0.45
16:0 21.80 21.78 22.08 17.76 16.32
16:1n-7 2.76 2.59 2.69 2.97 2.94
16:1n-5 0.21 0.22 0.20 0.23 0.24
16:2n-6 0.18 0.17 0.18 0.20 0.20
16:2n-4 0.39 0.86 0.40 0.37 0.42
17:0 0.08 0.08 0.09 0.09 0.09
16:3n-4 0.28 0.27 0.27 0.28 0.29
16:3n-3 0.24 0.23 0.23 0.25 0.26
16:3n-1 0.37 0.43 0.46 0.37 0.41
16:4n-3 0.19 0.20 0.19 0.21 0.21
16:4n-1 0.09 0.12 0.11 0.09 0.10
18:0 5.79 6.30 6.11 5.92 5.97
18:1n-9 12.23 11.76 12.07 12.66 12.74
18:1n-7 4.47 4.29 4.40 4.66 4.75
18:1n-5 0.36 0.34 0.34 0.37 0.38
18:2n-9 0.07 0.08 0.07 0.09 0.09
18:2n-6 1.24 1.19 1.18 1.29 1.29
18:2n-4 0.10 0.08 0.08 0.09 0.10
18:3n-6 0.12 0.10 0.07 0.07 0.12
18:3n-4 0.09 0.09 0.05 0.10 0.12
18:3n-3 0.35 0.32 0.33 0.37 0.37
18:4n-3 0.94 0.83 0.88 1.01 1.02
18:4n-1 0.04 0.03 0.03 0.03 0.03
20:0 0.14 0.15 0.16 0.14 0.15
20:1n-9 0.10 0.08 0.09 0.10 0.10
20:1n-7 1.34 1.19 1.28 1.42 1.41
20:1n-5 0.25 0.24 0.25 0.26 0.27
20: 2n-9 0.01 0.01 0.01 0.01 0.01
20:2n-6 0.11 0.11 0.11 0.12 0.13
20:3n-9 0.01 0.01 0.00 0.00 0.01
20:3n-6 0.06 0.06 0.06 0.06 0.07
20:4n-6 1.14 1.19 1.19 1.17 1.24
20:3n-3 0.22 0.20 0.19 0.23 0.23
20:4n-3 0.23 0.22 0.22 0.24 0.25
20:5n-3 13.14 12.29 12.36 13.87 14.41
22:1n-11 0.03 0.03 0.02 0.03 0.02
22:1n-9 0.59 0.53 0.56 0.62 0.63
22:4n-6 0.29 0.27 0.27 0.31 0.32

Selenium levels in early weaning diets for seabream larvae
………………………………………………………………………………………......
163
22:5n-6 0.19 0.20 0.19 0.16 0.17
22:5n-3 0.84 0.94 1.08 0.92 0.93
22:6n-3 24.85 26.19 25.70 26.63 28.04
Total Saturated 30.97±2.45a
31.08±2.03a 31.71±2.37
a 27.17±3.1
b 24.69±2.91
b
Total
Monoenoics 22.51±1.89a 21.48±1.57
a 22.08±1.65
a 23.51±1.78
a 23.67±2.1
a
Total n-3 41.00±2.91b 41.41±2.12
b 40.68±3.21
b 43.72±2.96
ab 45.73±2.25
a
Total n-6 3.33±0.61a 3.29±0.57
a 3.24±0.49
a 3.39±0.63
a 3.54±0.71
a
Total n-9 13.01±1.13a 12.48±1.09
a 12.80±1.10
a 13.48±1.21
a 13.58±1.18
a
Total n-3HUFA 39.28±2.87b 39.84±2.59
b 39.05±2.64
b 41.88±3.41
ab 43.86±2.71
a
ARA 1.14±0.11a 1.19±0.09
a 1.19±0.12
a 1.17±0.10
a 1.24±0.13
a
EPA 13.14±1.07a 12.29±1.10
a 12.36±1.2
a 13.87±1.16
a 14.41±1.4
a
DHA 24.85±1.62b 26.19±1.44
ab 25.70±1.95
ab 26.63±1.81
ab 28.04±1.76
a
EPA/ARA 11.58±1.18a 10.31±1.34
a 10.38±1.29
a 11.85±1.19
a 11.58±1.21
a
DHA/EPA 1.89±0.21 a 2.13±0.19
a 2.04±0.18
a 1.92±0.17
a 1.95±0.20
a
DHA/ARA 21.88±1.98a 21.98±1.67
a 21.16±1.72
a 22.76±1.95
a 22.53±1.93
a
n-3/n-6 12.32±1.2a 12.59±1.14
a 12.54±1.35
a 12.92±1.62
a 12.93±1.27
a
Figure 7.4 The malondialdehyde (MDA) content in larvae (44 dph) fed diets
containing five selenium levels. Values (mean ± standard deviation) with the same
letters are not significantly different (P>0.05).
The degree of larval lipid oxidation (Figure 7.4), as indicated by larval
malondialdehyde (MDA) content, was significantly lower in larvae fed 8SE and 12SE
diets (152 and 119 nmol g-1
larvae respectively) compared with those of 2SE and 4SE
diets (216 and 220 nmol g-1
larvae respectively) and were negatively correlated with
the dietary Se contents. Besides, the MDA contents in the larvae were also negatively
correlated to the larval Se contents (y = -0.2041x + 257.94, R! = 0.94804).
!"#"$%&'%%()*"$"+&+*'*)","*'-&.*"/0"#"%&1'-1"
(%"
.%%"
.(%"
*%%"
*(%"
'%%"
%" *" 2" +" -" .%" .*" .2"
!"#"$%&'#()*+),#
#
$-,.#/0'#1,&2'#$-,.3#
b
b
ab a a

Selenium levels in early weaning diets for seabream larvae
………………………………………………………………………………………......
164
The general pattern of antioxidant enzyme genes expression of seabream larvae was a
decreased expression with increasing dietary Se levels (Figures 7.5, 7.6 and 7.7).
Thus, larvae fed 12SE diets showed significantly lower CAT gene expression than
larvae fed 2SE, 4SE and 6SE diets, being CAT gene expression in larvae negatively
correlated to the Se content in the larvae (y = -0.0136x + 10.83, R! = 0.90955). Larvae
fed 12SE diet also showed significantly lower GPX gene expression than larvae fed
2SE and lower SOD gene expression than 2SE and 4SE treatments. There was no
significant difference between larvae fed 4SE, 6SE and 8SE diets in all antioxidant
enzyme gene expression.
Figure 7.5 Catalase (CAT) gene expression level measured by real-time PCR in
seabream larvae fed diets containing five selenium levels. Values (mean ± standard
deviation) with the same letters are not significantly different (P>0.05).
!"
#"
$"
%"
&"
'!"
#()" $()" %()" &()" '#()"
!"#$%&'&$(&)&*$$
+,-.&/01'$2$34$
$
50&6$
c
bc b
b a

Selenium levels in early weaning diets for seabream larvae
………………………………………………………………………………………......
165
Figure 7.6 Superoxide dismutase (SOD) gene expression level measured by real-time
PCR in seabream larvae fed diets containing five selenium levels. Values (mean ±
standard deviation) with the same letters are not significantly different (P>0.05).
Figure 7.7 Glutathione peroxidase (GPX) gene expression level measured by real-
time PCR in seabream larvae fed diets containing five selenium levels. Values (mean
± standard deviation) with the same letters are not significantly different (P>0.05).
!"
#"
$"
%"
&"
'!"
'#"
#()" $()" %()" &()" '#()"
!"#$$%&'&$(&)&*$$
+,-.&/01'$2$34$
#0&5$
a
b
bc bc
c
!"
#"
$"
%"
&"
'!"
'#"
'$"
'%"
#()" $()" %()" &()" '#()"
%6,$%&'&$(&)&*$$
+,-.&/01'$2$34$
#0&5$
b
b
ab
a
b

Selenium levels in early weaning diets for seabream larvae
………………………………………………………………………………………......
166
The osteological genes that have role in bone-building, formation of cartilage and
bone remodeling and mineralization were expressed in slightly higher levels in larvae
fed higher dietary SE contents (8SE and 12SE). The osteocalcin, osteonectin
osteopontin, alkaline phosphatase and matrix gla protein genes showed a significantly
higher expression in larvae fed 8SE and 12SE diets than larvae fed 2SE, 4SE and 6SE
diets, while there were no significant differences among the last treatments (Figures
7.8, 7.9, 7.10, 7.12 and 7.13). A significant correlation was found between ALP gene
expression and larval Se contents (y = 0.0179x + 6.7818, R! = 0.97113) or larval n-3
HUFA contents (y = 1.7433x - 57.472, R! = 0.9068). There were no significant
differences among all treatments in Runx2 (Runt-related transcription factor 2) gene
expression (Figure 7.11). The larvae fed 8SE diet have higher BMP4 gene expression
than the all treatments, while there was no significant difference between the 4SE,
6SE and 12SE treatments (Figure 7.14).
Figure 7.8 BMP4 (Bone morphogenetic protein 4) gene expression level measured by
real-time PCR in seabream larvae fed diets containing five selenium levels. Values
(mean ± standard deviation) with the same letters are not significantly different
(P>0.05).
!"
#"
$"
%"
&"
'!"
'#"
'$"
#()" $()" %()" &()" '#()"
!"#$%&'('%)'*'+%%
,-./'0012(%3%45%
61'7%
c bc
bc
a
ab

Selenium levels in early weaning diets for seabream larvae
………………………………………………………………………………………......
167
Figure 7.9 Runx2 (Runt-related transcription factor 2) gene expression level measured
by real-time PCR in seabream larvae fed diets containing five selenium levels. Values
(mean ± standard deviation) with the same letters are not significantly different
(P>0.05).
Figure 7.10 Alkaline phosphatase gene expression level measured by real-time PCR
in seabream larvae fed diets containing five selenium levels. Values (mean ± standard
deviation) with the same letters are not significantly different (P>0.05).
!"
#"
$"
%"
&'"
&("
&)"
'&"
'*+" ,*+" $*+" )*+" &'*+"
!"#$%&'()(&*(+(,&&
-./0(1123)&4&56&
72(8&
a a
a
a
a
!"
#"
$"
%"
&'"
&("
&)"
'&"
',"
'*+" ,*+" $*+" )*+" &'*+"
9*:&'()(&*(+(,&&
-./0(1123)&&4&56&
72(8&
a
ab
ab
b
b

Selenium levels in early weaning diets for seabream larvae
………………………………………………………………………………………......
168
Figure 7.11 Osteocalcin gene expression level measured by real-time PCR in
seabream larvae fed diets containing five selenium levels. Values (mean ± standard
deviation) with the same letters are not significantly different (P>0.05).
Figure 7.12 Osteopontin gene expression level measured by real-time PCR in
seabream larvae fed diets containing five selenium levels. Values (mean ± standard
deviation) with the same letters are not significantly different (P>0.05).
!"
#"
$"
%"
&"
$'(" &'(" )'(" *'(" #$'("
!"#$%&'(&)*+,$*$++
-$.$(+/012$"")%*+
3)$#+
b b
ab
a a
#"
%"
+"
,"
-"
##"
#%"
#+"
#,"
#-"
$'(" &'(" )'(" *'(" #$'("
!"#$%1%*#)*+,$*$+++
-$.$(+/012$"")%*+456+
3)$#+
a
a
b b
b

Selenium levels in early weaning diets for seabream larvae
………………………………………………………………………………………......
169
Figure 7.13 Osteonectin gene expression level measured by real-time PCR in
seabream larvae fed diets containing five selenium levels. Values (mean ± standard
deviation) with the same letters are not significantly different (P>0.05).
Figure 7.14 Matrix Gla gene expression level measured by real-time PCR in seabream
larvae fed diets containing five selenium levels. Values (mean ± standard deviation)
with the same letters are not significantly different (P>0.05).
!"
#"
$"
%"
&"
$'(" &'(" )'(" *'(" #$'("
!"#$%&$'#(&)*$&$))
+$,$-)./01$""(%&)
2($#)
c
b bc
a
a
!"
%"
)"
+"
#$"
#,"
#*"
$#"
$&"
$-"
%!"
$'(" &'(" )'(" *'(" #$'("
34#1(/)*-4)*$&$)+$,$-))
./01$""(%&)567)67)
2($#)
b b
b
a
a

Selenium levels in early weaning diets for seabream larvae
………………………………………………………………………………………......
170
Discussion
The aim of the present study was to evaluate the effect of graded levels of Se derived
yeast in diets containing KPL rich in n-3HUFA on larval production performance,
osteological genes expression, oxidative status and biochemical composition of
seabream larvae. Although the increased Se levels did not affected larval growth, the
larvae highest dietary Se content (11.65 mg/kg diet) promoted larval survival rate and
resistance to stress. This possitive effect in larval survival or stress resistance could be
related in one hand to the n-3 HUFA increase on larval tissues caused by a higher
protection of these fatty acids against oxidation by the increased Se content in the
larvae. Indeed, n-3 HUFA are known to play a crucial role in larval survival
(Izquierdo and Koven, 2010). On the other hand, the higher survival and stress
resistance could be also related to the reduction in the presence of oxidation products,
which can be severely harmful for fish fish causing several pathological damages and
larval mortalities (Halliwell and Gutteridge, 1996; Betancor et al., 2011). For
instance, the inclusion of Se in diets for European seabass proved to be efficient in
controlling the damage caused by the reactive oxigen species, reducing the incidence
of muscle injury to almost half as compared with the diet without Se supplementation
(Betancor et al., 2012c).
Indeed, in the present study, increased dietary Se levels resulted in higher Se contents
in larval tissues and an improved protection against peroxidation denoted by the
decreasing MDA concentrations and showing the essential role of Se as an anti-
oxidant factor that reduces hydroperoxides (Arteel and Sies, 2001; Betancor et al.,
2012c). Moreover, the increase in Se tissue contents was negatively correlated to the
CAT gene expression and were also related to lower SOD and GPX, suggesting as
well a reduced peroxidation risk and a better oxidative stress status in larvae fed the
higher dietary Se levels. These results are in agreement with those found in
Manchurian trout (Brachymystax lenok) and sea bass (Dicentrarchus labrax) larvae,
where feeding high dietary lipid levels increased MDA production and induced an
antioxidant response noticeable by an increase in the activity of antioxidant enzimes
genes (Zhang et al., 2009; Betancor et al., 2012a, c, d). These results agree well with
other studies that demonstrated that Se supplementation has a protective effect against
oxidative stress caused by high dietary DHA in sea bass or methyl parathion in
Brycon cephalus, as denoted by the decrease in CAT and SOD activity (Monteiro et

Selenium levels in early weaning diets for seabream larvae
………………………………………………………………………………………......
171
al., 2009) or gene expression (Betancor et al., 2012a). Thus, the inclusion of
antioxidative factors, such as Se, could counteract the high oxidation risk in early
weanning diets high in PUFA that are more susceptible to oxidation not only in the
inert diets but also in larval tissues.
The impact of the inclusion of Se on microdiets with high dietary PL on the
expression of genes considered as biomarkers of bone development and
mineralization is still limited. Antioxidants may interact with cellular receptors and
transcriptional factors that may further lead to changes in mRNA and protein levels or
directly interact with enzymes through protein–protein-binding properties (Olsvik et
al., 2011). Elevated intracellular ROS production may ultimately damage DNA,
proteins and lipids (Halliwell and Gutteridge, 1999). Also, ROS can affect the
transcription of many genes, either acting via various transcription factors or directly
as a result of oxidative damage (Di Giulio and Meyer, 2008). As observed in our
study the higher dietary Se levels led to promoted expression of bone formation and
mineralization genes, where the BMP4, alkaline phosphatase, osteocalcin, osteonectin
osteopontin, and matrix gla protein genes, all important for skeletal development,
bone formation and mineralization, were up-regulated by the dietary inclusion at 8.47
and 11.65 µg Se/mg diet. This up-regulation of several bone metabolism related genes
could be due to the higher larval tissue content in n-3 HUFA, and particularly DHA,
in agreement with the higher expression of these genes when DHA raised in gilthead
seabream larval tissues (Saleh et al., submitted). In other vertebrates, these genes,
particularly BMP-4, are up-regulated by dietary n-3 HUFA exerting a beneficial
effect (Kruger et al., 2010). Amongst the important mechanisms of PUFA action are
their effects on gene transcription that can be mediated by fatty acid binding to the
peroxisome proliferator activator receptor (PPAR) transcription factors that have
important effects on bone physiology (Kruger et al. 2010). The present study
demonstrated improved osteological genes expression with higher larval DHA
content, where DHA enhance expression of key transcription factors such as specific
transcription factors such as Runx2 (also known as core binding factor-1, Cbf1) and
osterix that enhance differentiation of pre-osteoblasts into mature osteoblasts that
elevate bone mass (Kruger et al., 2010). The present study had shown a coincidence
between the lower larval MDA content and lower AOE genes expression and the
higher larval n-3 HUFA content in the larvae fed higher dietary Se levels that resulted
in improving the regulation of the genes involved in skeletal development and

Selenium levels in early weaning diets for seabream larvae
………………………………………………………………………………………......
172
mineralization as BMP4 osteocalcin, osteonectin osteopontin, alkaline phosphatase
and matrix gla protein genes.
Betancor et al., (2012c) found increased in CAT, SOD and GPX expression in sea
bass larvae fed a high-DHA and Se-free diet but similarly, exposure to high-DHA
diets caused a significant increase in CAT and GPX in the larvae fed the Se-
supplemented diets, that can interpreted by the higher requirements of sea bass larvae
of Se (more than 6.27 µg/mg) to be more effective. This is similar to the present
study, where the increased of se levels up to 6.41 µg/mg did not affect significantly
larval performance, MDA content and AOE genes expression, but the increased up to
8.47 µg/mg and 11.65 µg/mg resulted in better larval survival and resistance to stress,
and also resulted in lower MDA content and AOE expression levels. It can be
concluded that, supranutritional levels of Se (more than 8.47 µg/mg) are required for
marine fish larvae to reduce significantly the larval MDA content and consequently
AOE genes expression. Also, another study showed that supranutritional levels of Se
are required to reduce the incidence of human and animal diseases (Brown et al.,
2001).
Finally, the Se levels used did not seem to be excessive, as the larvae fed the highest
Se dietary contents did not show reduced growth or any other detrimental effects.
Excessive levels of dietary Se have been associated with growth reduced. Chronic Se
toxicity for rainbow trout juveniles (1.3 g) occurred at feed levels of around 13 mg Se
kg!1 supplied as sodium selenite that resulted in growth reducing (Hilton et al.,
1980), but Rider et al. (2010) demonstrated that there was no toxic effects at 8 mg Se
kg!1 supplied mainly as Se via selenoyeast for rainbow trout juveniles. The lower
lengthwise growth of cod larvae occurred at 7-17 dph, may indicate excessive dietary
Se in the early larval period when fed rotifers with 3 mg Se kg!1 DW (Penglase et
al., 2010). In agreement with our previous results (Betancor et al., 2012c), the Se
organic source used derived from yeast, could had a lower toxicity than inorganic Se
(Hilton et al., 1980; Rider et al., 2010), since Se toxicity is highly dependent on its
speciation (Tinggi, 2003).
Hamre et al. (2008) found that Se content in rotifers is considerably low (0.08-0.09
mg kg-1 DW) than both fish requirements (0.5-0.3 mg kg-1 DW; NRC, 1993),
Atlantic cod and Epinephelus malabaricus Juveniles (0.25 and 0.7 mg Se kg!1 DW,
respectively; NRC, 1993; Lin and Shiau, 2005) and copepod levels (3-5 mg kg-1 DW)

Selenium levels in early weaning diets for seabream larvae
………………………………………………………………………………………......
173
and may contain insufficient Se to meet larvae requirements. Enrichment of rotifers
with sodium selenite and sodium iodide promoted survival in Atlantic cod larvae, but
no differences were observed in growth compared to the control group (Hamre et al.,
2008). Increase in the level of Se in rotifers enhanced the mRNA expression and
activity of GPX in cod larvae (Penglase et al., 2010), suggesting that extra
supplementation is needed to protect larvae against lipid oxidation and the oxidative
derivatives, which can be abundant in feeds enriched with n-3 LC-PUFA.
In the present study, the improved larval survival and stress resistance by increased
organic Se dietary levels could be related in one hand to the reduction of toxic free
radicals and in another hand to the improved utilization of dietary lipids. The low
levels of MDA and AOE content observed in the larvae fed 11.65 µg Se/mg diet,
demonstrate an adaptive response in attempting to neutralize the generated ROS.
Moreover, a reactive response was observed by the increase in BMP4, alkaline
phosphatase, osteocalcin, osteonectin osteopontin, and matrix gla protein genes
expression in larval tissues, suggesting a well skeletal development. Inclusion of
11.65 mg Se kg-1
diet in microdiets is recommended to enhance the larval antioxidant
capacity and regulation of the genes involved in skeletal development.
Acknowledgments
This study was partially supported by a grant from the Spanish Agency of
International Cooperation and Development (AECID) to Reda Saleh Mohamed
Ibrahim. The present study was partly funded by the Spanish Ministry of Sciences and
Education (AGL2009-14661). This work has been partly funded under the EU
seventh Framework Program by the ARRAINA project No
288925: Advanced
Research Initiatives for Nutrition and Aquaculture.

General Conclusions
………………………………………………………………………………………......
174
Chapter 8: General Conclusions
-----------------------------------------------------------------------------
!" PL deficiency reduced fish larvae performance, delayed gut development and
bone mineralization, inhibited digestive enzymes activity and lowered dietary
lipid utilization in seabream larvae.
#" Optimum inclusion levels of krill PL in microdiets that completely substitute
live preys from 16 dph are around 12% krill PL, providing about 10% total
PL.
$" Optimum inclusion levels of SBL in microdiets that completely substitute live
preys from 16 dph are around 8% krill PL, providing about 9% total PL.
However, inclusion of SBL markedly increased the proxidation risk as
denoted by the higher TBARs in larvae, as well as a higher expression of
CAT, GPX and SOD genes.
%" Dietary krill PL were an excellent source of lipids for gilthead seabream
larvae, being markedly better than SBL.
&" The dietary PL requirements of gilthead seabream from 16-45 dph are about
9-10% dietary in diets to completely substitute live preys during this period.
These values seem to promote digestion, transport and deposition of dietary
lipids and contribute to reduce skeleton anomalies by up-regulating BMP-4,
Runx2, ALP and the skeletal extracellular matrix proteins, inducing early
mineralization and resistance of vertebral bodies to reduce anomalies such as
lordosis and kyphosis.
'" The increase in dietary !-tocopherol further promoted the beneficial effects of
dietary PL, promoting growth, denoting its protective role against oxidation
and reducing larval TBARs and gene expression of SOD and CAT.
(" Inclusion of 11.65 mg Se kg-1
diet in microdiets enhanced the larval
antioxidant capacity and regulation of the genes involved in skeletal
development. The improved larval survival and stress resistance by increased
organic Se dietary levels seems related in one hand to the reduction of toxic
free radicals as indicated by low levels of MDA and AOE content, and in
another hand to the improved utilization of dietary lipids.

Resumen en español
………………………………………………………………………………………......
175
Chapter 9: Resumen en español
-----------------------------------------------------------------------------
9.1 Introducción
La acuicultura ha sido el sistema de producción de alimentos que más ha crecido y el
sector de producción animal con el mayor desarrollo a nivel mundial. En la última
década ha crecido a una tasa superior al 5% anual (Izquierdo, 2005), con una
producción mundial que ha crecido desde 0,6 millones Tm en 1950 a 7,3 millones en
1980 y 55,1 millones Tm en 2009 (APROMAR, 2009; FAO, 2011).
Este rápido incremento en producción fue promovido por la mejora en el control de la
reproducción, condiciones de cultivo, formulación de alimentos y otras innovaciones
tecnológicas en el cultivo de peces, permitiendo con esto un rápido desarrollo de la
acuicultura en tierra y mar (UNEP/MAP/MED POL, 2004). El futuro éxito del sector
acuícola está íntimamente relacionado con el incremento de la demanda de alimentos
de origen marino, lo que ha permitido que esta actividad sea muy atractiva para los
inversionistas, así como una alternativa a otras actividades como la pesca de
ejemplares silvestres. Sin embargo, su éxito en peces marinos está limitado por la
cantidad y calidad de la producción de alevines (Izquierdo and Fernández-Palacios,
1997; Watanabe et al., 1983; Yúfera and Pascual, 1984; Sargent et al., 1997;
Izquierdo et al., 2000).
A pesar de que se ha incrementado la producción de varias especies de peces marinos
en el Mediterraneo, aún la dorada (Sparus aurata) y la lubina (Dicentrarchus labrax)
son los peces marinos más cultivados y los que han caracterizado el desarrollo de la
acuicultura marina europea en las últimas tres décadas (FAO, 1999; Izquierdo, 2005).
La demanda de alevines de buena calidad se ha incrementado a una tasa de 10%
anual, alcanzando en 2008 una producción de alevines de dorada y lubina de 497,7 y
457,7 millones, respectivamente (FEAP, 2008).
La mejora en el desarrollo de la producción de alevines depende esencialmente de la
efectividad de los protocolos de alimentación en sus primeras fases del cultivo y por
la calidad de las raciones de destete utilizadas (Kolkovski et al., 1993; Sargent et al.,
1997; Izquierdo et al., 2000). El cultivo de larvas de peces marinos conlleva la
administración de nutrientes externos a través de la alimentación usando presas vivas
por algunos días, seguida por microdietas para un destete precoz. Sin embargo, ambos
alimentos, presas vivas y microdietas, deben satisfacer los requerimientos

Resumen en español
………………………………………………………………………………………......
176
nutricionales de cada especie, asegurando un mayor crecimiento y una alta tasa de
sobrevivencia (Kolkovski et al., 1993; Sargent et al., 1997).
Debido a su adecuado tamaño (90-130 µm) algunas cepas del rotifero Brachionus
plicatilis constituyen la primera presa que consumen las larvas de dorada.
Posteriormente, es utilizada Artemia y un alimento complementario, utilizando
raciones de destete de acuerdo al tamaño de la boca de la larva. Sin embargo, los
costes extras en términos de mano de obra, estructura, tiempo y energía necesarias
para la producción de rotíferos y Artemia son significativos (Kolkovski, 2009).
Adicionalmente, el valor nutricional de la presas vivas varía notablemente de acuerdo
a su alimentación y condiciones ambientales tales como régimen e intensidad de luz,
temperatura y salinidad del agua, etc., poniendo en riesgo la calidad nutricional de las
larvas (Jones et al., 1993; Kolkovski et al., 1993; Barnabé and Guissi, 1994;
Rosenlund et al., 1997). Además, desde un punto de vista experimental, el
enriquecimiento efectivo de las larvas vivas está limitado por algunos nutrientes como
fosfolípidos (PL) y proteínas (Rosenlund et al., 1997; Koven et al., 2001). Por todas
estas razones, la sustitución de las presas vivas por microdietas es crucial para una
producción eficiente y sostenible en términos de costes, además de una alta y
constante producción de juveniles de buena calidad.
Durante las últimas tres decadas se ha hecho grandes esfuerzos para desarrollar
microdietas que permitan una sustitución parcial o total de rotíferos y/o Artemia. La
mayoría de los trabajos han sido enfocados a los requerimientos nutricionales de las
larvas.
A pesar de que se han conseguido grandes logros, aún no es posible la sustitución
completa del alimento vivo como primer alimento en la mayoría de las especies
marinas. Hay estudios que muestran un pobre rendimiento en el cultivo larvario
cuando se utilizan dietas inertes como primer alimento exógeno. Esto puede ser
debido a la composición, palatabilidad y/o a las características físicas del alimento
seco (Person Le Ruyet et al., 1993). Hay que considerar que, además de la calidad
nutricional del alimento, también hay características físicas de la dieta que pueden
afectar su desempeño, tales como su tasa de sedimentación, estabilidad nutricional y
perfil de lixiviación, siendo factores que pueden contribuir a que la microdieta sea
atractiva y afectando así su tasa de ingestión, digestión y el crecimiento larvario.
Sorprendentemente, estos factores han recibido muy poca atención. La producción de
microdietas es una alternativa conveniente y económica en lugar del alimento vivo, a

Resumen en español
………………………………………………………………………………………......
177
pesar de los problemas de estabilidad en el agua y lixiviación de nutrientes que se
encuentran normalmente en la producción de micropartículas (Baskerville-Bridges
and Kling, 2000; Onald and Landgon, 2000; Poussão-Ferreira et al., 2003). Por todo
esto es importante considerar la fisiología y la ontogenia del sistema digestivo de las
larvas alimentadas, el protocolo y técnicas de alimentación a utilizar, así como los
requerimientos nutricionales de cada especie, en el proceso de preparación de
microdietas destinadas a larvas de peces marinos.
En los últimos años, se han realizado varios estudios para determinar la composición
lipídica óptima en las dietas utilizadas para el destete de larvas de peces marinos,
estudiándose con especial atención los ácidos grasos poliinsaturados de cadena larga
(LCPUFA), así como los requerimientos de fosfolípidos y su papel en el desarrollo
larvario (Watanabe, 1982; Takeuchi, 1997; Sargent et al., 1999a; Izquierdo et al.,
2003).
9.1.1 Larvas de peces marinos y la utilización de microdietas
Actualmente, la dependencia de la disponibilidad de alevines es uno de los factores
críticos para el éxito comercial de la producción industrial de peces marinos (FAO
1998). Existen ciertas fases que son señaladas como puntos críticos durante las
primeras etapas del desarrollo larvario:
a) El cambio de la alimentación endógena a la exógena, que comienza con el
suministro de rotíferos entre los días 3 y 4 post-eclosión.
b) El momento del destete o la transición de la ingestión de alimento vivo a un
alimento inerte utilizado para realizar un destete precoz.
El desarrollo del cultivo de larvas de peces marinos ha sido posible gracias al uso de
presas vivas, principalmente rotíferos y nauplios y metanauplios de Artemia. Puesto
que el cultivo de rotíferos fue desarrollado tempranamente (Ito, 1960), este organismo
ha sido ampliamente utilizado en el cultivo larvario de varias especies de peces
marinos. Según Verreth (1994), los cuellos de botella en el desarrollo de técnicas para
el cultivo larvario son:

Resumen en español
………………………………………………………………………………………......
178
I. La falta de conocimiento sobre las condiciones ambientales adecuadas
y los requerimientos alimentarios de las especies durante los primeros
estadíos de vida.
II. El desconocimiento de los requerimientos nutricionales óptimos,
difíciles de evaluar en ausencia de una tecnología de cultivo adecuada.
III. Los cambios en el cultivo y de las prácticas de alimentación
específicas de una especie a otra debido a los cambios ontogenéticos y
sus fases de crecimiento.
IV. El pequeño tamaño de las larvas y la necesidad de partículas de
alimento pequeñas, lo que impone problemas específicos en la
tecnología de alimentación desarrollada.
Las larvas de peces marinos son muy vulnerables durante las primeras etapas de
desarrollo y tienen estrictos requerimientos bióticos y abióticos para sobrevivir,
desarrollarse y crecer. La mayoría de las investigaciones sobre la nutrición de larvas
ha contribuido con los conocimientos necesarios para estimar los requerimientos
nutricionales de las larvas de peces. Sin embargo, no es fácil cuantificar este tipo de
requerimientos. Obviamente, un buen conocimiento de los requerimientos
nutricionales de las larvas durante todo el desarrollo larvario contribuiría a optimizar
dietas y protocolos de alimentación.
Debido a que las especies de peces marinos experimentan grandes cambios
morfológicos y fisiológicos durante la ontogenia, sus requerimientos nutricionales
pueden diferir cualitativamente y cuantitativamente en su fase larvaria, estadios
juveniles y fase adulta. Por otra parte, las larvas de peces crecen muy rápidamente,
por lo que su frecuencia alimenticía y por lo tanto, la ingestión total de nutrientes
debe ser alta. El requerimiento nutricional de un nutriente en particular puede ser
definido desde el punto de vista fisiológico como la ingesta de nutrientes necesarios
para cumplir un papel fisiológico, pero con frecuencia se define como el "
requerimiento para el máximo crecimiento y/o supervivencia", donde la relación
alimentación-dieta-pez tiene un efecto importante en la determinación de sus
necesidades cuantitativas (Izquierdo y Lall, 2004). Se han realizado grandes esfuerzos
para mejorar la eficiencia de microdietas con el objetivo de sustituir total o
parcialmente el alimento vivo (rotíferos y Artemia) en el cultivo larvario de peces

Resumen en español
………………………………………………………………………………………......
179
marinos (Koven et al., 2001; Kolkovski, 2004; Kolkovski et al., 2009.).
Ha habido logros sustanciales en el destete temprano de larvas usando microdietas y
una sustitución parcial del alimento vivo, sin embargo, en la mayoría de las especies,
tales microdietas todavía no pueden reemplazar por completo el alimento vivo. La
sustitución parcial del alimento vivo ha demostrado ser exitosa. Las microdietas
formuladas dadas en conjunto con el alimento vivo (“co-feeding”) ha permitido
obtener destetes precoces, por ejemplo, se ha logrado una sustitución de hasta un 90%
de rotíferos por dietas artificiales en la larvicultura de besugo (Pagrus major), platija
japonesa (Paralichthys olivaceus) (Kanazawa et al., 1989) y dorada (Liu et al., 2001).
Aunque el destete de larvas sustituyendo Artemia por una microdieta se ha logrado
durante la metamorfosis de muchas especies (Foscarini, 1988; Hardy, 1989; Koven et
al., 2001; Curnow et al., 2006a, b), la introducción temprana de dietas formuladas
para una total sustitución del alimento vivo ha tenido un éxito limitado (Kanazawa et
al., 1989; Walford et al., 1991; Fernández Díaz-y Yúfera, 1997; Rosenlund et al.,
1997; Kolkovski et al., 2009).
La adición de nauplios de Artemia combinada con un microdieta aumenta el
movimiento peristáltico del tracto digestivo de las larvas, mejorando su ingestión y la
producción de enzimas digestivas (Kolkovski et al., 1995). El diseño y la formulación
de estas dietas de destete precoz requiere conocer los requerimientos nutricionales
ideales para satisfacer las necesidades fisiológicas de las larvas (Kolkovski et al.,
2009). La eficiencia en la utilización de partículas en la alimentación de larvas de
peces marinos se ve afectada por muchos factores externos e internos (Figura 9.1)
(Kolkovski, 2001, 2004; Koven et al., 2001). Sin embargo, son escasos los estudios
de requerimientos nutricionales que usen métodos directos debido principalmente a lo
difícil que es diseñar dietas experimentales controlando totalmente su composición
nutricional y los factores ambientales en todas las unidades experimentales (tanques)
utilizadas. Las dietas formuladas tienen problemas de estabilidad y lixiviación
variable lo que impide conocer con exactitud la composición nutricional entre la dieta
formulada y la que realmente es ingerida.

Resumen en español
………………………………………………………………………………………......
180
Figura 9.1 Factores que afectan la utilización de las partículas de alimento
(Adaptado de Kolkovski et al., 2009).
De acuerdo a Kolkovski (2009), las dietas microparticuladas pueden ser clasificadas
en tres tipos generales:
I. Dietas aglomeradas: es la microdieta más simple. Los ingredientes en polvo
se microenlazan con una matriz estable en agua tal como agar o carragenina
(López -Alvarado et al., 1994).
II. Dietas microcubiertas: su proceso de fabricación está basado en recubrir los
ingredientes en polvo con una capa de glúcidos (carragenina, alginato),
proteínica (gelatina, caseína) o un aglutinante lípidico para reducir la lixiviación
(Onal y Langdon, 2004).
III. Dietas microencapsuladas: son hechas encapsulando una solución, coloide o
suspension de los ingredients de la dieta con una membrane, usando un agente
aglutinante (Yúfera et al., 1999; Kolkovski, 2009).

Resumen en español
………………………………………………………………………………………......
181
9.1.2 Importancia de los fosfolípidos en la nutrición larvaria de peces marinos
Así como en todos los vertebrados, en peces los fosfoglicéridos son muy importantes,
particularmente en la producción de larvas debido a su función esencial como
componentes celulares indispensables en la formación de biomembranas y orgánelos
(Izquierdo y Koven, 2010). Adicionalmente, los fosfoglicéridos también pueden
servir como fuente de energía durante el desarrollo de los huevos y la alimentación
endógena en las etapas pre-larvarias de peces marinos (Izquierdo y Koven, 2010).
Además pueden actuar como emulsionantes en la formación de micelas mixtas en el
tracto digestivo (Olsen y Ringø, 1997). De hecho, los juveniles de peces contienen
abundantes fosfolípidos durante su desarrollo embrionario y larvario, que pueden
provenir de fuentes endógenas (saco vitelino) o exógenas (lípidos del alimento vivo)
(Rainuzzo et al., 1997; Van der Meeren et al., 2008). Los estudios sobre fosfolípidos
en la dieta de peces fueron iniciados por Kanazawa et al. (1981, 1983), quienes
demostraron que a pesar de que juegan un papel importante en su metabolismo, los
peces poseen una capacidad limitada para sintetizarlos durante su desarrollo
(Kanazawa et al., 1985) y, en consecuencia, deben ser incluidos en dietas para
juveniles. Por otra parte, digestión, absorción y transporte de los lípidos son muy
limitados en las larvas que inician la alimentación con un sistema digestivo poco
desarrollado. Los fosfolípidos tienen diferentes funciones muy importantes en todos
estos procesos. Sin embargo, las larvas de peces pueden ser incapaces de sintetizar
eficientemente los fosfolípidos en una cantidad suficiente para cubrir esta alta
demanda y, por lo tanto, deben ser incluidos en la dieta (Izquierdo y Koven, 2010).
De hecho, las larvas presentan enterocitos poco desarrollados y una escasa síntesis de
fosfolípidos (Deplano et al., 1991). Caballero et al., (2003), aislando microsomas a
partir de enterocitos, demostraron que en dorada la síntesis de fosfolípidos se produce
principalmente a través de la vía del glicerol-3-fosfato, cuya actividad es modulada
por los lípidos de la dieta. Adicionalmente, las restricciones en la tasa de síntesis de
fosfolípidos puede limitar la síntesis de lipoproteínas (Liu et al., 2002), lo que es
crucial para el transporte de lípidos (Salhi et al., 1999; Caballero et al., 2006). Se ha
observado que la adición de 20 g de lecitina de soja kg-1
de peso seco de la dieta (dw)
en microdietas de dorada utilizadas el día 15 post-eclosión contenía 220 g lípidos kg-1
dw, lo que aumentaba significativamente la aparición de partículas de lipoproteínas en

Resumen en español
………………………………………………………………………………………......
182
la lámina propia y promovía el transporte y la utilización de los lípidos de la dieta así
como el crecimiento larvario (Liu et al., 2002). Los fosfolípidos de la dieta no sólo
aumentan la síntesis y liberación de lipoproteínas en la lámina propia por los
enterocitos, sino que también reducen significativamente el tamaño de las
lipoproteínas mediante la promoción de la síntesis de lipoproteínas de muy baja
densidad (VLDL, con más fosfolípidos) en lugar de la producción de quilomicrones
(con más lípidos neutros) (Liu et al., 2002; Caballero et al., 2003, 2006b). La
inclusión de fosfolípidos en las dietas de juveniles ha mostrado que mejora el
rendimiento de cultivo de varias especies de peces marinos y dulceacuícolas
(Izquierdo y Koven 2011), aumentando también el crecimiento y la supervivencia
(Kanazawa, 1993; Salhi et al., 1999; Izquierdo et al., 2001; Kjørsvik, 2009). Además
de su importancia en el crecimiento larvario y su función en la utilización de lípidos
de la dieta, se ha observado que los fosfolípidos también son necesarios para mejorar
la resistencia al estrés, el desarrollo esquelético e, incluso, la metamorfosis y
pigmentación de peces planos (Kanazawa et al., 1981; Kanazawa, 1993; Fontagné et
al., 2000; Koven, 2003; Zambonino Infante and Cahu, 2007; Hamza et al., 2008).
9.1.2.1 Los fosfolípidos como fuente de ácidos grasos esenciales
Los fosfolípidos pueden ser una fuente importante de energía (ácidos grasos) en los
peces, en particular durante el desarrollo embrionario y el larvario inicial en especies
que producen huevos ricos en fosfolípidos (Tocher, 1995). En su primera
alimentación, las larvas de peces pueden estar predispuestas a la digestión y
metabolismo de los fosfolípidos y al uso como fuente de energía de los ácidos grasos
de tales fosfolípidos (Sargent et al., 1997). Las principales funciones de los ácidos
grasos en las larvas de peces concuerdan con las que se presentan en juveniles y
adultos. Funcionan como una fuente de energía metabólica, como componentes
estructurales en los fosfolípidos de las membranas celulares y como precursores de
moléculas bioactivas (Sargent et al., 1999, Izquierdo et al., 2000; Tocher 2003). Los
fosfolípidos de la dieta tienden a ser una fuente más rica de ácidos grasos esenciales
(EFA) que los lípidos neutros como son los triglicéridos (Tocher, 1995). Además,
debido a su mejor digestibilidad, los fosfolípidos pueden ser muy superiores a los
lípidos neutros como fuente de EFA en las larvas de peces (Sargent et al., 1997,
1999). Recientemente, se ha demostrado que los fosfolípidos son el modo más

Resumen en español
………………………………………………………………………………………......
183
eficiente de suministrar EPA y DHA en la dieta de larvas de lubina que si se utilizan
triglicéridos (Gisbert et al., 2005, Tocher et al., 2008). En cualquier caso, la mayoría
de los estudios para determinar los requisitos de fosfolípidos se han realizado
utilizando lecitina de soja o de huevo, que son ricos en 18:2 n-6, pero también
deficientes en los ácidos esenciales de peces marinos: n-3 HUFA, EPA y DHA
(Watanabe et al., 1984; Coutteau et al., 1997; Sargent et al., 2002; Tocher et al.,
2008).
9.1.3 Requerimientos de fosfolípidos
Estudios realizados con un gran número de especies marinas y de agua dulce, han
confirmado que los PL son un requerimiento esencial en la dieta de los peces. Se ha
observado que el nivel ideal de suplementación de PL en la dieta depende de la
especie, la fuente y clase de PL, así como de los criterios utilizados para evaluar tal
efecto: crecimiento, supervivencia, resistencia al estrés, malformaciones en las larvas,
etc. Tocher et al. (2008) han registrado los requerimientos alimentarias de diferentes
especies en sus etapas larvarias y juvenil (Tabla 9.1). Estos autores observaron una
tendencia que sugiere que los requerimientos cuantitativas de PL disminuyen desde
los estadios larvarios a los primeros juveniles. No fueron observados requerimientos
en peces de más de 5 g. Se ha visto que el requerimiento de PL está relacionada con la
edad de las larvas y el grado de desarrollo de su sistema digestivo (Kanazawa, 1993;
Izquierdo y Koven, 2010). Sin embargo, tanto el nivel ideal y composición de PL, así
como su rol en la dieta siguen sin estar claros en la mayoría de las especies. Sargent et
al. (1999) consideraron que la composición de lípidos del huevo es una aproximación
de la composición lipídica ideal en una dieta larvaria. Los requerimientos
cuantitativos de fosfolípidos para larvas de peces varia de 2 al 12% de la dieta, siendo
menor en las larvas de carpa común (Cyprinus carpio) (2% de huevo de gallina)
(Geurden et al., 1995), seguida por el besugo (Pagrus major) (5% SBL: lecitina de
soja), la dorada japonesa (Oplegnathus fasciatus) (7,4% SBL) (Kanazawa et al.,
1983) y las larvas de platija japonesa (Paralichthys olivaceus) (7% SBL) (Kanazawa,
1993), y los mayores valores observados en dorada (Sparus aurata) (15% SBL)
(Seiliez et al., 2006). Sin embargo, en estudios más recientes con otras especies
(Capítulo 3) se ha encontrado una inclusión óptima de aproximadamente 10% usando
el aceite de krill como fuente de fosfolípidos (Saleh et al., 2012a).

Resumen en español
………………………………………………………………………………………......
184
Tabla 9.1 Requerimientos cuantitativos y cualitativos de fosfolípidos de peces
teleósteos (Adaptado de Tocher et al., 2008)
Especie
Estadío de
desarrollo
Suplemento de
fosfolípidosa y
niveles
estudiadosb
Requerimiento
ideal y criterios
utilizadosc
Periodo de
alimentación Referencia
Ayu
(Plecoglossus
altivelis)
Larva 0 y 3% SBL o EL 3% (G,S,M) 20 días Kanazawa et
al. (1981)
Larva 0, 1, 3 y 5% SL
3% (M), 5%
(G,S) 50 días
Kanazawa et
al. (1983a)
Larva
0 y 3% EL or
BPL 3% (G,S,M) 50 días
Kanazawa et
al. (1983a)
Juvenil 0 y 3% SBL o
BPL 3% (G) 33 días
Kanazawa et
al. (1981)
Juvenil 0, 1, 3 y 5% EL 3% (G) 33 días
Kanazawa et
al. (1981)
Platija japonesa
(Paralichthys
olivaceus)
Larva 0, 3, 5 y 7% SBL 7% (G,S) 30 días Kanazawa
(1993)
Juvenil 0, 3, 5 y 7% SBL 7% (G) 30 días
Kanazawa
(1993)
Dorada japonesa
(Oplegnathus
fasciatus)
Larva 0, 2.5, 5 y 7.4%
SBL 7.4% (G,S) 22 días
Kanazawa et
al. (1983b)
Larva 0, 3, 5 y 7% SBL 5% (G,S,R) 28 días
Kanazawa
(1993)
Juvenil 0, 3, 5 y 7% SBL 3% (G) 60 días
Kanazawa
(1993)
Lubina
(Dicentrarchus
labrax)
Larva 3, 6, 9 y 12% SBL 12% (G,S,M) 40 días Cahu et al.
(2003b)
Juvenil 0 y 3% SBL 3% (G) 40 días
Geurden et al.
(1995a)
Juvenil
0 y 2% EPC or
SPC 2% (G) 40 días
Geurden et al.
(1995a)
Besugo
(Pagrus major) Larva 0 y 5% SBL 5% (G,S) 20 días
Kanazawa et
al. (1983b)
Carpa común
(Cyprinus
carpio)
Larva 0 y 2% EL 2% (G,S) 25 días Geurden et al.
(1995b)
Larva 0 y 2% PL 2% (G,S) 21 días
Geurden et al.
(1995b)
Larva
0 y 2% SPC, SPI
or EL
2% (G,S, M
except El) 25 días
Geurden et al.
(1997a)
Lucioperca
(Sander
lucioperca)
Larva 1, 5 y 9% SBL 9% (G) 24 días Hamza et al.
(2008)
Dorada
(Sparus aurata) Larva 9, 11 y 15% SL >9% (G,S) 23 días
Seiliez et al.
(2006)
Larva 6, 7, 9, 10 y 11
KPL 10% (G,S,R) 30 días
Saleh et al.
(2012a)
Larva 5, 6, 7, 9 y 10
SBL 9% (G,S,R) 30 días
Saleh et al.
(2012b)
Palometa
(Pseudocaranx
dentex)
Juvenil 0, 0,5, 1, 1,5 y 2%
SPC 1.5% (G,S,R) 6 semanas
Takeuchi et al.
(1992)

Resumen en español
………………………………………………………………………………………......
185
Juvenil 0 y 1,5% SPE 1.5% (G) 6 semanas
Takeuchi et al.
(1992)
Trucha arco iris
(Oncorhynchus
mykiss)
Juvenil 0, 2, 4 y 8% SL 4% (G) 20 semanas Poston
(1990a)
Juvenil 0 y 14% 14% (G) 8 semanas
Rinchard et al.
(2007)
Rodaballo
(Psetta
maximus)
Juvenil 0 y 2% EL 2% (G)
Geurden et al.
(1997b)
Salmón
Atlántico
(Salmo salar)
Juvenil (180
mg)
0, 2, 4, 6 y 8%
SBL/CPL 6% (G) 14 semanas Poston (1991)
Juvenil (180
mg) 0 y 4% SBL 4% (G) 16 semanas
Poston
(1990b)
Juvenil (1,0 g) 0 y 4% SBL 4% (G) 12 semanas
Poston
(1990b)
Juvenil (1,7 g) 0 y 4% SBL 4% (G) 12 semanas
Poston
(1990b)
Juvenil (7,5 g) 0 y 4% SBL
0% (no tiene
requerimientos) 12 semanas
Poston
(1990b)
Esturión blanco
(Acipenser
transmontanus)
Juvenil (5-10
g) 0 y 8% SBL
0% (no tiene
requerimientos) 6 semanas
Hung y Lutes
(1988)
aBPL, lípidos polares de huevos de bonito; CPL, lípidos polares de maíz; EL, lecitina
de huevo de gallina; EPC, fosfatidilcolina de huevo purificada; KPL, fosfolípidos de
krill; PL, varias fuentes de suplementación de fosfolípidos representando el 2% de
fosfolípidos en la dieta, incluyendo EL, SL, girasol, colza y fosfolípidos marinos:
SBL, lecitina de soja; SPC, fosfatidilcolina de soja purificada; SPE,
fosfatidiletanolamina purificada de soja; SPI, fosfatidilinositol purificado de soja; bPorcentaje de peso de la dieta;
cG, Crecimiento; S, Supervivencia; M,
Malformaciones; R, Resistencia al estrés.
9.1.4 Digestión, absorción y transporte de fosfolípidos
9.1.4.1 Digestión de fosfolípidos
La digestión y la eficiencia de asimilación puede ser inferior en larvas de peces
marinos que en ejemplares adultos debido a que las larvas tienen características
digestivas diferentes a la de los juveniles (Cahu y Zambonino Infante, 1995). Se ha
planteado la hipótesis de que las larvas de peces marinos tienen una capacidad
digestiva insuficiente para aprovechar una dieta inerte (Lauff y Hofer, 1984). El
cambio que se produce de un modo primario de digestión a uno adulto es
característico en animales en desarrollo y ha sido descrito extensamente en
vertebrados superiores (Henning, 1987). La actividad de las enzimas digestivas en

Resumen en español
………………………………………………………………………………………......
186
larvas de peces es baja en la primera alimentación y aumenta junto con el desarrollo
(Govoni et al., 1986). La digestión de los alimentos ingeridos se produce en el
intestino larvario, donde el pH se mantiene alcalino y la actividad proteolítica es
ejercida por enzimas “tipo-tripsina” (Walford y Lam, 1993). En la primera
alimentación, la actividad de las enzimas pancreáticas e intestinales es generalmente
baja (Cousin et al., 1987). La actividad de las enzimas digestivas aumenta durante los
primeros 10 días post-eclosión en Solea senegalensis (Ribeiro et al., 1999), mientras
se ha observado que un aumento en la actividad de la fosfatasa alcalina refleja el
desarrollo de las membranas “brush border” de los enterocitos en el bacalao del
Atlántico (Gadus morhua) (Wold et al., 2007). Además, la adición PL en la dieta
mejora el índice de maduración intestinal en esta especie, en base a la relación entre la
fosfatasa alcalina del “brush border” y la aminopeptidasa citosólica leucina-alanina.
La mejora de la maduración intestinal por PL de la dieta podría estar relacionada con
una mayor disponibilidad intracelular de PL para la formación de membranas
celulares y organelos, ya que los PL de la dieta promueven la re-acilación de los
lípidos digeridos, aumentando así la disponibilidad intracelular de PL para la síntesis
de lipoproteínas como ha sido observado en dorada (Caballero et al., 2003; Liu et al.,
2002).
Es sabido que, generalmente los lípidos son bien digeridos por los peces (Olsen y
Ringo, 1997). Normalmente en peces la digestibilidad de los lípidos de la dieta es alta,
alrededor del 95%, sin embargo, la digestibilidad de los diferentes ácidos grasos varía
de acuerdo al grado de insaturación y longitud de cadena. Así, saturados y
monoinsaturados son menos digeribles que los ácidos grasos poliinsaturados (Lied y
Lambertsen, 1982, Olsen y Ringo, 1997). Por lo tanto, se ha sugerido que la absorción
de algunos ácidos grasos es más eficiente que la de otros (Olsen et al., 1998).
Los lípidos de la dieta son hidrolizados en el lumen del tracto digestivo por enzimas
lipolíticas que producen principalmente ácidos grasos libres, monoacilgliceroles y
diacilgliceroles. Mientras que en los vertebrados superiores la hidrólisis de lípidos de
la dieta es principalmente catalizada por una lipasa pancreática específica, que
hidroliza los ácidos grasos sn-1 y sn-3 liberando 2-monoacilgliceroles, la principal
enzima responsable de la digestión de lípidos neutros en peces es una lipasa no
específica neutra dependiente de sales biliares (“bile salt activated lipase”, BAL)
(Iijima et al., 1998; Izquierdo y Henderson, 1998), que hidroliza los enlaces éster de
diferentes ácidos grasos que tienen una molécula de glicerol. A pesar de que esta

Resumen en español
………………………………………………………………………………………......
187
enzima se caracteriza por actuar en una amplia gama de sustratos, también parece
tener una mayor especificidad por los ácidos grasos poliinsaturados (Lied y
Lambrtsen, 1982; Iijima et al., 1998, Izquierdo et al., 2000.).
Han sido encontrados varios tipos de lipasas en el tracto digestivo de peces juveniles
y adultos. Entre ellas, la BAL parece desempeñar un papel importante en la digestión
de los lípidos neutros en la mayoría como en lubina, anchoa, trucha arco iris, besugo,
rodaballo y dorada (Patton et al., 1975; Ijima et al., 1990; Iijima et al., 1998;
Izquierdo y Henderson, 1998; Caballero et al., 2002). Esta enzima cataliza la
hidrólisis no sólo de acilglicéridos, sino también la de otros lípidos de la dieta,
incluyendo ésteres de colesterol y vitaminas. También hay pruebas de la presencia de
una lipasa pancreática específica (MPL) en varias especies, que es activada en
presencia de sales biliares y es específica para triacilgliceroles (Iijima et al., 1998).
Los lípidos que contienen ácidos grasos poliinsaturados de la serie n-3, esenciales
para los peces marinos, son más resistentes a la hidrólisis de la MPL. Por el contrario,
se ha demostrado que la BAL es específica para este tipo de ácidos grasos. Así,
aunque la MPL hidroliza preferentemente los ésteres de 18:1 n-9 que los de 18:2 n-6 ó
18:3 n-3, la BAL muestra una preferencia por 20:5 n-3 y 20:4 n-6 más que por 18: 2
n-6 y 18:1 n-9 (Iijima et al., 1998).
Los patrones de distribución de la actividad de la lipasa a lo largo del tracto digestivo
de peces juveniles y adultos parecen diferir entre especies (Izquierdo y Henderson,
1998). Esta diferencia en la distribución de la actividad lipolítica en peces adultos casi
desaparece en juveniles y larvas, lo que sugiere una menor diferenciación funcional
en el tracto digestivo en las primeras etapas de desarrollo.
La digestión de los fosfolípidos de la dieta casi no ha sido estudiada en peces, pero se
presume que los mecanismos en general son similares a los de los mamíferos, en los
que los fosfolípidos son digeridos por la fosfolipasa intestinal A2, secretada por el
páncreas al intestino, reconociendo específicamente el enlace fosfolipídico acilo sn-2
e hidrolizando el enlace resultante de la formación de 1-acil liso-fosfolípidos y ácidos
grasos libres que son absorbidos por las células intestinales mucosas (Fig. 2)
(Henderson y Tocher, 1987; Sargent et al., 1989; Izquierdo y Henderson, 1998).
Existen dos isoformas de la fosfolipasa A2 que han sido purificadas del
hepatopáncreas de besugo (Ono y Iijima, 1998). La actividad de la fosfolipasa A2 ha
sido detectada en larvas de peces marinos varios días después de la primera
alimentación (Izquierdo et al., 2000).

Resumen en español
………………………………………………………………………………………......
188
Ambas enzimas lipolíticas pancreáticas, lipasa y fosfolipasa A2, aumentan con el
desarrollo en larvas de peces marinos (Izquierdo et al., 2000) y son estimuladas por el
aumento de sus respectivos sustratos: triglicéridos y fosfolípidos de la dieta. La
actividad de la fosfolipasa A2 aumenta con el nivel de su correspondiente ARNm en
lubina (Zambonino Infante y Cahu, 1999) lo que sugiere una regulación de la
transcripción de esta enzima que se eleva cuando las dietas incorporan más de 4,5%
de fosfolípidos.
9.1.4.2 Transporte y absorción de fosfolípidos
En peces la absorción de lípidos de la dieta es similar a la de los mamíferos (Sire et
al., 1981, Tocher et al., 2008). Después de la hidrólisis en el lúmen, los lípidos de la
dieta se incorporan en las células epiteliales intestinales por difusión, en forma de
micelas de monoglicéridos y ácidos grasos libres (Izquierdo et al., 2000; Tocher et al.,
2008). Los productos de la hidrólisis lipídica, ácidos grasos libres,
monoacilgliceroles, diacilgliceroles y lisofosfolípidos se mezclan con las sales biliares
para formar pequeñas micelas que son transportadas al interior de los enterocitos
(Figura 9.2) y su contenido, que también incluye otros lípidos como vitaminas
liposolubles y colesterol, atraviesa la membrana celular por difusión y se vierte en el
interior del enterocito (Smith et al., 1983). La reacilación se produce en el retículo
endoplasmático y sus productos son liberados en la submucosa en forma de
lipoproteínas de muy baja densidad (quilomicrones). La actividad de los enterocitos
durante la absorción es el empaquetado de lípidos junto con proteínas para constituir
moléculas estables y transportarlos a través de la sangre a los sitios de metabolismo y
almacenamiento (Gurr y Harwood, 1991).
Como los ácidos grasos de cadena corta (menos de 12 átomos de carbono) son
suficientemente solubles en el plasma, son liberados directamente desde el enterocito
a la circulación portal y se metabolizan en el hígado (Green y Selivonchick, 1987).
Los ácidos grasos de cadena larga y monoacilgliceroles absorbidos migran a las
vesículas del retículo endoplasmático, donde son resintetizados a triglicéridos u otros
lípidos por medio de un complejo multienzimático (Gurr y Harwood, 1991). Estos
ácidos grasos difunden hacia el retículo endoplasmático asociados con proteínas de
transporte FABP (proteína de transporte de ácidos grasos), que desempeñan un papel
importante en el transporte intracelular de los ácidos grasos absorbidos. En los peces,

Resumen en español
………………………………………………………………………………………......
189
estas proteínas tienen una preferencia por los ácidos grasos insaturados de la misma
forma que se produce en mamíferos (Gangl et al., 1980). Sire y Vernier (1981) relatan
que estas proteínas son más abundantes en peces alimentados con dieta altas en
lípidos, lo que indirectamente puede afectar a la activación y reacilación de ácidos
grasos.
Figura 9.2 Absorción y metabolismo de triglicéridos (Adaptado de Smith et al.,
1983).
Las dos principales vías de reacilación de los ácidos grasos en los enterocitos son la
vía del monoacilglicerol y la del glicerol-3-fosfato. Ambas rutas producen
triglicéridos y fosfolípidos (Iijima et al.,1983; Caballero et al., 2006a). La mayoría de
las enzimas que participan en estas vías han sido identificadas y estudiadas en ratas,
pero hay muy pocos estudios realizados en peces (Sire et al., 1981; Iijima et al., 1983;
Caballero et al., 2006a). Iijima et al. (1983) mostraron que el intestino de la carpa
(Cyprinus carpio) es capaz de esterificar el ácido palmítico en triglicéridos y
fosfolípidos. Por otro lado, Sire et al. (1981) observaron que en los enterocitos de
trucha arco iris el ácido linoleico es esterificado con mayor rapidez a triacilgliceroles

Resumen en español
………………………………………………………………………………………......
190
que a ácido palmítico. Además, estos autores proponen que mientras la vía del
monoacilglicerol es predominante en los mamíferos, debido a los productos de
hidrólisis en el lumen son los 2-monoacilgliceroles, en peces la vía principal es la del
glicerol-3-fosfato debido a que los principales productos de la hidrólisis son ácidos
grasos libres y glicerol, reflejándose así que la síntesis de glicerofosfolípidos es más
importante en peces que en mamíferos. Caballero et al. (2006) aislaron los
microsomas de los enterocitos de dorada demostrando que la síntesis de fosfolípidos
en esta especie se produce principalmente a través de la vía del glicerol-3-fosfato,
cuya actividad es modulada a través de los lípidos de la dieta.
Hasta ahora no se han estudiado profundamente los mecanismos de absorción de los
productos de la digestión de fosfolípidos en peces, pero se supone que serían similares
a los de los mamíferos. Los productos de la hidrólisis, fosfolípidos 1-acil-lisosoma y
los ácidos grasos libres, se asocian en micelas mixtas junto con todos los otros
productos de la digestión de lípidos de las sales biliares, dichas miselas son
absorvidas en la mucosa intestinal y penetran por difusión pasiva en los enterocitos.
La concentración de lisofosfolípidos es muy baja en la mucosa intestinal, ya que la
mayor parte de los 1-acil lisofosfolípidos son reesterificados con ácidos grasos libres
activados en los microsomas antes del transporte desde los enterocitos al sistema
circulatorio (Sargent et al., 1989).
El transporte de lípidos y de otros componentes liposolubles desde el intestino a los
tejidos es realizado principalmente a través de lipoproteínas (Babin y Vernier, 1989;
Izquierdo et al., 2001; Liu et al., 2002; Caballero et al., 2003, 2006b). Las
lipoproteínas son partículas que difieren en su proporción de lípidos (triglicéridos,
colesterol, ésteres de colesterol y fosfolípidos) y proteínas (Figura 9.3).

Resumen en español
………………………………………………………………………………………......
191
Figura 9.3 Representación esquemática de la estructura de una lipoproteína.
Las lipoproteínas se clasifican generalmente de acuerdo a su densidad en seis clases
principales: los quilomicrones (CM), lipoproteínas de muy baja densidad (VLDL), de
densidad intermedia (IDL), de baja densidad (LDL), de alta densidad (HDL) y de muy
alta densidad (VHDL) (Liu et al., 2002; Caballero et al., 2003, 2006b). Estas
lipoproteínas tienen apolipoproteínas como componentes estructurales y funcionales,
que son cofactores enzimáticos y ligandos para los receptores de la superficie celular.
En particular, la apoA1 es el principal componente proteico de las lipoproteínas de
alta densidad; apoA4 se cree que actúa principalmente en la absorción intestinal de
lípidos y la apoE es una proteína del plasma sanguíneo que media el transporte y la
absorción de colesterol y lípidos por medio de su alta afinidad de interacción con
diferentes receptores celulares, incluyendo un receptor de lipoproteínas de baja
densidad (LDL) (Saito et al., 2004).
Las VLDL transportan principalmente lípidos y contienen preferentemente
triacilglicerol endógeno, similar a los quilomicrones. Su principal lugar de síntesis es
el hígado y su catabolismo es básicamente el mismo, en forma de quilomicrones,
sobre los cuales actua una lipasa de lipoproteínas que hidroliza los triglicéridos
(Figura 9.4). La interacción lipasa-VLDL es menos eficiente que la interacción entre
lipasa- quilomicrones, por lo que la VLDL persiste más tiempo en la circulación
(Sheridan, 1988). La HDL es la principal forma de almacenamiento de colesterol y

Resumen en español
………………………………………………………………………………………......
192
acepta el colesterol de los tejidos periféricos y los transporta al hígado para su
degradación y reutilización.
Figura 9.4 Representación esquemática de la estructura de una lipoproteína.
Hay pruebas que hacen suponer que el transporte de lípidos desde los enterocitos a los
hepatocitos aumenta debido a los fosfolípidos suplementados en la dieta (Kanzawa et
al., 1993). La alimentación de las larvas de dorada con microdietas sin
suplementación de lecitina produce acumulación de vacuolas lipídicas en los
enterocitos y esteatosis en el tejido hepático, indicativos de que la dieta induce
problemas en el transporte de lípidos de la mucosa intestinal a la circulación corporal
(Kanzawa et al., 1993). Ambos efectos se reducen mediante la adición de 2% de
lecitina a la dieta, observándose el aumento de transporte de lípidos en el intestino y
en el hígado (Kanzawa et al., 1993). Es sabido que niveles insuficientes de PL en la
dieta (PL 23,7 g kg-1 peso seco, lípidos dietéticos 178,5 g kg-1 peso seco), aumentan
la acumulación de gotas de lípidos en los enterocitos de larvas de peces marinos
(Salhi et al., 1999; Morais et al., 2005), dependiendo del tipo y cantidad de PL en la
dieta y su relación con el contenido de NL. En larvas de carpa la deficiencia de
fosfolípidos se ha asociado con la acumulación de gotas de grasa en los enterocitos
del intestino anterior, lo que sugiere que este tipo de grasa tiende a tener un papel
específico en la síntesis de VLDL al igual que en los mamíferos (Fontagné, 1996).

Resumen en español
………………………………………………………………………………………......
193
Esta acumulación ha llevado a sugerir que las inclusiones de lípidos intestinales son
una nueva forma de almacenamiento temporal de ácidos grasos re-esterificados
cuando la tasa de absorción de lípidos es superior a la tasa de síntesis de lipoproteínas
o incluso a una incapacidad para metabolizar los lípidos (Kjørsvik et al., 1991). El
hígado es un órgano esencial que interviene en el metabolismo de las sustancias
absorbidas por el intestino, involucrado también en el procesamiento de estas
substancias a ser utilizadas por otros tejidos, y que es el lugar principal de regulación
de lípidos, participando en la síntesis y degradación de ácidos grasos (Cross, 1993). El
hígado es un órgano metabólicamente sensible que puede ser analizado para
determinar los posibles efectos secundarios del metabolismo lipídico, debido a que en
larvas de peces el almacenamiento de energía hepática responde sensible y
rápidamente a los cambios nutricionales (Hoehne-Reitan y Kjørsvik, 2004).
9.1.5 Clases fosfolipídicas
Existen evidencias bioquímicas que sugieren que las vías de síntesis de los
fosfolípidos son esencialmente las mismas que en mamíferos (Tocher, 1995), en los
que los fosfolípidos pueden ser sintetizados de novo por dos mecanismos principales
(Lykidis, 2007). Uno utiliza un difosfato de citidina (CDP) y un grupo de cabeza
polar activado para su fijación al 1,2-diacilglicerol (DAG), y el otro utiliza CDP-DAG
activado y un grupo de cabeza polar inactivada (Fig. 8) (Tocher et al., 2008). Ambos
grupos proceden inicialmente de la esterificación del glicerol-3-fosfato con dos ácidos
grasos activados (acil-CoA) para formar ácido fosfatídico (PA). La acción de la PA-
fosfatasa en PA, resulta en la producción de DAG, el cual puede reaccionar entonces
con CDP-colina o CDP-etanolamina para producir fosfatidilcolina (PC) y
fosfatidiletanolamina (PE), respectivamente (Tocher et al., 2008). Alternativamente,
el CTP reacciona con PA para formar CDP-DAG, que luego se puede combinar con
serina e inositol para formar fosfatidilserina (PS) y fosfatidilinositol (PI),
respectivamente (Figura 9.5).
De acuerdo a los pocos estudios en los que se han utilizado especies puras de
fosfoglicéridos, el orden de importancia según su eficacia parece ser fosfatidilcolina,
fosfatidilinositol, fosfatidiletanolamina y fosfatidilserina (Izquierdo y Koven, 2010).

Resumen en español
………………………………………………………………………………………......
194
Figura 9.5 Vías de biosíntesis de las clases principales de fosfolípidos (Tocher et al.,
2008). CDP-Cho, CDP-colina, CDP-DAG, CDP-diacilglicerol, CDP-Etn, CDP-
etanolamina; DAG, diacilglicerol, PA, ácido fosfatídico: PC, fosfatidilcolina, PE,
fosfatidiletanolamina, PI, fosfatidilinositol, PS, fosfatidilserina, SM , esfingomielina.
Las enzimas son; 1, CDP-DAG sintasa; 2, PA-fosfatasa; 3, PI-sintasa; 4, PS-sintasa;
5, CDP-colina:DAG fosfotransferasa; 6, CDP-etanolamina:DAG fosfotransferasa; 7,
PE metiltransferasa; 8, PS- descarboxilasa; 9, SM-sintasa; 10 y 11, PS-sintasa a través
de intercambio de base.
Entre los diferentes fosfoglicéridos, PC parece ser particularmente importante, siendo
el principal producto de la síntesis de PL en los enterocitos de peces (Caballero et al.,
2006a) y que comprende hasta 95% de PL encontrado en VLDL (Lie et al., 1993).
Además, PC induce la síntesis de la apolipoproteína B en mayor medida que otros
fosfoglicéridos (Field et al., 1994; Campo y Mathur, 1995). El aumento de la síntesis
de lipoproteínas puede ser el responsable de promover el crecimiento mediante el
aumento de flujo de energía a partir de la mucosa intestinal a la sangre (Seiliez et al.,
2006). De esta forma, se ha encontrado que PC promueve mejor el crecimiento que
otras clases de PL en varias especies (Takeuchi et al., 1992; Kanazawa, 1993; Hadas,
1998; Geurden et al., 1997, 1998) y aumenta la actividad de alimentación (Koven et
al., 1998).
El fosfatidilinositol (PI) tiene una rica diversidad de formas y funciones dentro de la
célula, además de ser un componente estructural de biomembranas (Sargent et al.,
1989). Actúa como un precursor de segundos mensajeros (inositol-3-fosfato, IP3)
regulando la entrada de iones de calcio en la célula desde el retículo endoplasmático
(Cahu et al., 2003a; Tocher et al., 2008), así como un ancla que se puede fijar sobre

Resumen en español
………………………………………………………………………………………......
195
una gran variedad de proteínas de la superficie celular. Por lo tanto, PI está
involucrado en un sistema de señalización que controla los procesos biológicos en el
desarrollo temprano de vertebrados (Berridge e Irvine, 1989).
9.1.6 Efecto de los fosfolípidos sobre el desarrollo esquelético
El sistema esquelético soporta la integridad estructural del cuerpo durante el
desarrollo, proporciona sitios para inserción muscular y protege órganos vitales (Lall
y McCrea-Lewis, 2007). Los peces teleósteos muestran un tejido esquelético descrito
como un espectro continuo que va desde el tejido conectivo al cartílago y hueso (Hall
y Witten, 2007). El esqueleto maduro es un órgano metabólicamente activo que sufre
una remodelación continua por un proceso en que se sustituye el hueso viejo con
nuevo (Figura 9.6). En ejemplares adultos sanos, la resorción y formación de hueso
están en equilibrio y se mantiene un nivel constante de masa ósea (Kruger et al.,
2010). Los osteoclastos responsables de la resorción ósea se originan a partir de
células-madre hematopoyéticas conocidas como monocitos, mientras que los
osteoblastos responsables de la formación de hueso se originan a partir de células
estromales de la médula ósea (Kruger et al., 2010).

Resumen en español
………………………………………………………………………………………......
196
Figura 9.6 Diagrama simplificado de la diferenciación de precursores de osteoclastos
(A) en los osteoclastos y los precursores de osteoblastos (B) en osteoblastos. PU.1,
factor de transcripción PU.1; M-CSF, factor estimulante de colonias de macrófago, c-
fms, genes c-fms; MITF, factor de transcripción asociado a microftalmia; c-fos, gen c-
fos; NF!", factor nuclear !"; NFATc1,factor nuclear de células T1 activadas;
TRAF6, factor de necrosis tumoral asociado al receptor factor-6; c-src, gen del
sarcoma celular-; ! v ß 3, ! v ß 3-integrina; RANKL, activador del receptor del factor
nuclear de ! v "; OPG , osteoprotegerina, OSX, osterix; PPAR#2, receptores
activados por proliferador de peroxisoma, (Adaptado de Kruger et al., 2010).
El hueso es un tejido conectivo vascularizado especializado que consiste en células y
una matriz extracelular mineralizada de colágeno que se mineraliza mediante la
deposición de hidroxiapatita (Hall y Witten, 2007; Nordvick, 2007). Durante la
primera alimentación varios nutrientes de la dieta desempeñan un papel central en el
desarrollo óseo y la posterior aparición de malformaciones esqueléticas (Izquierdo et
al., 2010; 2012). Varios estudios relacionados con el impacto de la primera
alimentación en el desarrollo de peces mostraron que la incorporación en la dieta de

Resumen en español
………………………………………………………………………………………......
197
fosfolípidos totales reducen malformaciones, especialmente la torsión de la mandíbula
y la escoliosis en larvas de ayu (Plecoglossus altivelis) (Kanazawa et al., 1981).
Geurden et al., (1998) sugieren que la dieta suplemententada con PL, especialmente
PI, reduce la deformidad esquelética en larvas de carpa. Estos hallazgos fueron
reforzados por Cahu et al., (2003) quienes encontraron que la dieta PC/PI en la
proporción de 2,18 impidió la aparición de deformidades durante el desarrollo
larvario de lubina. Por otra parte, la osificación de la columna vertebral en larvas de
bacalao, observada a los 21 días post-eclosión en los arcos neurales, se produjo
significativamente más temprano en los grupos alimentados con dietas que contenían
PL que en aquellos alimentados con NL, cuando se comparaba el tamaño y la edad de
las larvas (Kjørsvik et al., 2009). Los PL tienen un papel como precursores de
segundos mensajeros que regulan la entrada de calcio en las células y está implicado
en un sistema de señalización que controla los procesos biológicos en el desarrollo
temprano de los vertebrados (Berridge y Irvine, 1989). Sandel et al. (2010)
encontraron una correlación muy alta entre la edad de desarrollo de dorada alimentada
con PI y la expresión génica de osteocalcina, una proteína que se utiliza como un
marcador para ver el crecimiento del hueso y cartílago y se ha correlacionado con la
mineralización ósea (Simes et al., 2008). PI, al igual que el segundo mensajero
inositol-3-fosfato (IP3), moviliza el calcio mediante la regulación de la entrada de este
ión en la célula desde el retículo endoplásmico (Cahu et al., 2003; Tocher et al.,
2008). Estos autores argumentaron que PI de la dieta puede aumentar la
disponibilidad de calcio para la mineralización ósea, lo que estimula la producción de
osteocalcina y el normal desarrollo del hueso. Concordando con esto, Nishimoto et al.
(2003) trabajando con carpa encontraron que la unión de hidroxiapatita ósea de
proteína Gla ósea (BGP) es mayor en la presencia de iones de calcio. Por otra parte,
los cambios en PUFA en la dieta se reflejan en la composición de diversos tejidos,
incluyendo células óseas, tales como los osteoblastos (Atkinson et al., 1997; Moyad,
2005). Se ha observado que varios de los LCPUFA afectan a las células óseas
(osteoclastos y osteoblastos) por medio de diversas vías de señalización celular o
factores de crecimiento, afectando la formación de hueso y la reabsorción y densidad
ósea en animales y seres humanos (Salari et al., 2008). Cambiar el equilibrio de los
PUFAs presentes en las membranas con ácidos grasos n-3 en lugar de ácidos grasos
n-6 cambia la relación de n-6/n-3 en las membranas y afecta a la producción de varias
citocinas, lo que podría afectar la resorción y formación ósea. Se ha demostrado que

Resumen en español
………………………………………………………………………………………......
198
LCPUFAs afectan a las proteínas celulares y al receptor activador del factor nuclear
k! (RANK), un receptor que se encuentra en el osteoclasto y que controla la
osteoclastogénesis (Sun et al., 2003; Coetzee et al., 2007). Se han realizado un gran
número de estudios que muestran que en animales en crecimiento los PUFAs afectan
el contenido mineral, masa, espesor y área femoral de los huesos, y también,
aparentemente, la formación y el crecimiento óseo. En ratas macho en crecimiento los
PUFAs n-3 también aumentan la actividad de la fosfatasa alcalina (ALP), así como el
factor de crecimiento insulínico I (IGF-1) y los niveles de proteínas transportadoras
del factor de crecimiento insulínico (IGFBP) (Coetzee et al., 2007; Li et al., 1999).
Los factores de crecimiento insulínico (IGF), especialmente IGF-I, son importantes
factores de crecimiento derivados de hueso y se cree que funcionan como factores de
crecimiento sistémicos y locales del tejido óseo. Una vez secretados y depositados en
la matriz ósea, IGFs son liberados durante la resorción ósea osteoclástica, actuando de
forma autocrina o paracrina para estimular la formación de nuevas células y
producción de la matriz ósea (Watkins & Seifert 2000). IGF-I actúa como un
regulador de la función de las células óseas, ya que estimula la proliferación de pre-
osteoblastos, aumentando así el número de células capaces de producir la matriz ósea.
Además, IGF-I aumenta la expresión de colágeno y con esto la disminución de su
degradación, causando un efecto anabólico en el tejido óseo (Schmid et al., 1992;
Delany et al., 1994).
Los PUFAs de la dieta pueden aumentar o disminuir la producción de IGF-I en el
hueso a través de su capacidad para modular las concentraciones locales de las
prostaglandinas E2 (PGE2) que son metabolitos del ácido araquidónico (AA) ((Li et
al., 1999; McCarthy et al., 1991; Delany et al., 1994). La PGE2 proviene del AA
PUFA n-6 y es la principal prostaglandina en el hueso. Se ha demostrado que es un
potente modulador de la remodelación ósea, afectando tanto a la resorción (Collins
and Chambers, 1991) como a la formación ósea (Jee y Ma et al., 1997; McCarth y et
al., 1991). PGE2 también promueve la expresión de diversas proteínas de unión de
IGF (Schmid et al., 1992; McCarthy et al., 1994; DiBattista et al., 1996) sugiriendo
que PGE2 podría mantener disponible IGF-1 para la estimulación de los osteoblastos
en una fase posterior de la remodelación ósea (Schmid et al., 1992). McCarthy et al.
(1991) sugirieron que la capacidad de PGE2 para mejorar la síntesis osteoblástica de
IGF-I podría explicar su potencial anabólico, y, además, sugeriría un papel para la
PGE2 en la remodelación ósea acoplada. Los efectos anabólicos de PGE2 pueden

Resumen en español
………………………………………………………………………………………......
199
ocurrir a través de la estimulación de la producción de IGF-I endógeno por los
osteoblastos (Raisz et al., 1993) o por una mayor receptividad de células óseas a IGF-
I (Hakeda et al., 1993)
En conclusión, enriqueciendo dietas con LCPUFA n-3 puede elevarse o conservarse
la masa ósea a través del incremento del número de células madre mesenquimales
(MSC), potenciando la expresión de factores de transcripción clave requeridos para la
formación de hueso, tales como el factor !-1 de unión al núcleo (Cbf!1) y osterix
(Watkins et al., 2003; Zhang et al., 2002) que aumentan la diferenciación de pre-
osteoblastos en osteoblastos maduros. La expresión de ambos, Cbf!1 y osterix, se ve
reforzada por IGF-1, el factor de crecimiento transformante "1 (TGF-" 1), la proteína
morfogenética ósea (BMP) y por cantidades moderadas de PGE2 (Zhang et al., 2002),
todos lo cual resulta de dietas ricas en LCPUFA n-3.
9.1.7 Estrés oxidativo: mecanismo de defensa antioxidante
Los productos de peroxidación de lípidos tales como hidroxiperóxidos, hidróxidos de
ácidos grasos, aldehídos e hidrocarburos están implicados en varias condiciones
patológicas que dañan las biomembranas celulares (Kanazawa, 1991, 1993) y las
membranas subcelulares, tales como las de mitocondrias, causando varias patologías
en peces (Kawatsu, 1969; Watanabe et al., 1970; Murai y Andrews, 1974; Sakai et
al., 1989). Los peces tienen un sistema de defensa antioxidante endógeno (Filho et al.,
1993) con una amplia gama de mecanismos antioxidantes para mantener un equilibrio
oxidativo adecuado. Cuando este equilibrio se inclina a favor de los agentes oxidantes
el estrés oxidativo produce efectos perjudiciales en moléculas que tienen gran
importancia biológica. Las especies reactivas del oxígeno (ROS) son radicales libres
y/o derivados de oxígeno producidos en todos los sistemas biológicos aeróbicos y en
las funciones celulares normales (Mate´s, 2000). La desventaja biológica asociada con
el estrés oxidativo puede ser considerada como la condición físico-química en la que
hay un aumento en los niveles normales de especies oxidantes, por ejemplo, H2O2,
HO-, O
-2, ONNO
-, R
- y ROO
- (Ansaldo et al., 2000), lo que produce un aumento
aleatorio de ROS, conduciendo a daños en diferentes componentes celulares. Si este
proceso es continuo producirá enfermedades o incluso la muerte celular.

Resumen en español
………………………………………………………………………………………......
200
9.1.7.1 Defensas enzimaticas
El sistema de defensa antioxidante está en su mayoría formado por enzimas
eliminadoras de radicales que desempeñan un importante papel fisiológico en la
protección antioxidante (Blazer, 1982). Estos mecanismos de defensa antioxidante
para desintoxicar especies reactivas de oxígeno se han desarrollado para contrarrestar
los efectos potencialmente nocivos del oxígeno activado (Yu, 1994). Entre las
enzimas antioxidantes se encuentran la superóxido dismutasa (SOD) que cataliza la
dismutación de superóxido en oxígeno y peróxido de hidrógeno; la catalasa (CAT)
que descompone el peróxido de hidrógeno a oxígeno molecular y agua; la glutatión
peroxidasa (GPX) que desintoxica peróxido de hidrógeno en agua o peróxidos
orgánicos en sus correspondientes alcoholes estables mediante la oxidación del
glutatión reducido (GSH) en su forma oxidada (GSSG) y, por último, la glutatión
reductasa (GR) que cataliza la reducción de GSSG en GSH (Halliwell y Gutteridge,
2007). La SOD desempeña un papel crucial ya que es la primera enzima que
responde a los radicales de oxígeno, previniendo el inicio de la reacción en cadena de
radicales que produce el anión superóxido (McCord y Fridovich, 1969; Winston y Di
Giulio, 1991). Todas estas enzimas tan importantes en los mecanismos de defensa
antioxidantes han sido detectadas en la mayoría de las especies de peces (Rudneva,
1997). Las actividades de las enzimas de defensa antioxidante mostraron variaciones
en los diferentes órganos de peces (Wdzieczak et al., 1982; Lemaire et al., 1993),
dependiendo de la conducta de alimentación (Radi y Markovics, 1988), período de
alimentación (Mourente et al., 2002), condiciones ecológicas (Winston y Di Giulio,
1991) y el contenido antioxidante de la dieta. Todos estos mecanismos antioxidantes
son responsables de mantener un adecuado "equilibrio oxidativo". Cuando este
equilibrio se inclina a favor de los agentes oxidantes, debido a la excesiva generación
de estos compuestos o por un debilitamiento de las defensas antioxidantes, o por
ambos simultáneamente, surge el "estrés oxidativo" (Sies, 1985; Tocher et al., 2002).
Los antioxidantes pueden ser encontrados en el plasma celular, mitocondrias y
membranas celulares (Figura 9.7) y pueden actuar en diferentes etapas del proceso de
oxidación, siendo que algunos pueden tener más de un mecanismo de acción. Pueden
ejercer su acción mediante diferentes mecanismos tales como la ruptura de la cadena
de una secuencia inicial, eliminando oxígeno libre o disminuyendo las
concentraciones locales de O2.

Resumen en español
………………………………………………………………………………………......
201
Figura 9.7 Mecanismos antioxidantes dentro de la célula. Adaptado de Machlin y
Bendich (1987). Catalasa (CAT), Superóxido dismutasa (SOD), Glutatión peroxidasa,
(GPX), Glutatión reducido (GSH).
9.1.7.2 Defensas no enzimaticas
Un antioxidante es una sustancia que cuando está presente en bajas concentraciones
en comparación con la de un sustrato propenso a la oxidación, es capaz de interactuar
con los radicales libres para acabar con la reacción (Halliwell y Gutteridge, 1990).
Los niveles adecuados de compuestos antioxidantes pueden ser proporcionados por
medio de suplementos nutricionales, incluyendo vitaminas E y C o minerales como el
selenio, que establecen una segunda línea de defensa (Sen, 1995). Estos suplementos
promoverían el máximo aprovechamiento de los nutrientes y evitarían problemas de
oxidación de lípidos que podrían causar patologías (Sakai et al., 1989) como daño
celular (Halliwell y Gutteridge, 1996), lesiones músculares (Betancor et al., 2011),
crecimiento negativo, bajo consumo de alimento, pobre desarrollo y el aumento de la
incidencia de deformidades (Lewis-McCr y Lall, 2007). En general, el daño oxidativo
a moléculas de gran importancia biológica tales como lípidos, proteínas,
carbohidratos y ADN causan alteraciones que pueden conducir a la muerte celular
(Winston y Di Giulio, 1991; Halliwell y Gutteridge, 2007).

Resumen en español
………………………………………………………………………………………......
202
9.1.7.2.1 Vitamina E (!-tocoferol)
La vitamina E tiene una gran importancia como componente exógeno en la dieta de
peces de acuicultura, actuando como una defensa antioxidante en la reducción de los
productos de la peroxidación de lípidos y como eliminadora de radicales libres
(Machlin, 1984, Betancor et al., 2011). Mourente et al. (2002) mostró una reducción
de los productos de peroxidación en el hígado de doradas alimentadas con dietas que
contenían aceite oxidado con un suplemento de vitamina E en comparación con los
alimentados con dietas que carecían de esta vitamina.
La vitamina E es liposoluble y es absorbida en el tracto digestivo en asociación con
moléculas de grasa. Putnam y Comben (1987) demostraron que la vitamina E es un
componente estructural de las membranas celulares, donde actúa como un factor
antioxidante de fosfolípidos por procesos antioxidantes de quiebre de cadena (“chain-
breaking”) (Sargent et al., 1997). Además, juega un papel en el mantenimiento de la
calidad de carne en trucha arco iris (Frigg et al., 1990; Chaiyapechara et al., 2003;
Yildiz, 2004), salmón del Atlántico (Salmo salar) (Hamre et al., 1998; Scaife et al.,
2000), rodaballo (Psetta maxima) (Ruff et al., 2003; 2004) y lubina (Gatta et al.,
2000; Pirini et al., 2000), mejorando la inmunidad al aumentar la resistencia de los
glóbulos rojos a la hemólisis, y también la permeabilidad de los capilares y del
músculo cardíaco (Halver, 2002). Además, se ha propuesto como el factor más
importante en el mantenimiento de la estabilidad post-mortem de la membrana en
filetes de pescado (Baker, 1997). Se ha estudiado el requerimiento diaria de vitamina
E en diferentes especies de peces (NRC, 1993) y las recomendaciones de inclusión
son de: 120 mg / kg de dieta (Hamre y Lie, 1995a) para el salmón del Atlántico; entre
30 y 50 mg / kg de dieta para bagre de canal (Ictalurus punctatus) (Murai y Andrews,
1974; Wilson et al., 1984); 200 a 300 mg / kg de dieta para la carpa común (Cyprinus
carpio) (Watanabe et al., 1977); 1200 mg / kg para juveniles de dorada (Ortuño et al.,
2000) y 99 mg / kg para alevines de mrigal (Cirrhinus mrigala) (Paul et al., 2004). En
dorada incluir 250 mg !-tocopherol/kg de dieta es suficiente para satisfacer el
requerimiento y obtener una reproducción exitosa (Fernández-Palacios et al., 1998).
Poco se sabe acerca de las necesidades exactas de de vitamina E en larvas de peces
marinos, pero Atalah et al. (2008) utilizaron 1,5 y 3,0 g kg-1 de dieta seca de vitamina

Resumen en español
………………………………………………………………………………………......
203
E en larvas de dorada y lubina, y sugirieron que el nivel ideal era de 3 g kg-1 debido a
que este alto nivel de vitamina redujo la mortalidad después del estrés. En el mismo
estudio, el alto nivel de vitamina E alivió las lesiones musculares provocadas por el
exceso de DHA en la dieta (Betancor et al., 2011). Los resultados de ambos estudios
concuerdan con la opinión general de que la inclusión de vitamina E debe ser superior
a 1 g kg-1 en dietas de larvas, mientras que el requisito dado por el NRC (1993) para
los juveniles es de 50 mg kg-1. Sin embargo, cuando se utilizan las respuestas
inmunológica y al estrés para medir las necesidades de esta vitamina, se encuentran
frecuentemente cantidades mayores necesarias en la dieta de juveniles y adultos
(Hamre, 2011).
El efecto del !-tocoferol en el desarrollo esquelético ha sido ampliamente estudiado
en mamíferos terrestres, pero no en peces. La vitamina E es importante para un
apropiado desarrollo del esqueleto (Xu et al., 1995; Jilka et al., 1996), ya que se
asocia con la bicapa lipídica de las células óseas, permitiendo que sea la primera línea
de defensa contra los radicales libres (Arjmandi et al., 2002). Son escasos los estudios
sobre el efecto de ROS en el desarrollo óseo de peces. Lewis-McCrea y Lall (2007)
encontraron un aumento en la incidencia de escoliosis en juveniles de fletán
(Hippoglossus hipoglossus) alimentados con niveles crecientes de aceites oxidados.
Esto puede ser el resultado del efecto de los productos de peroxidación lipídica, que
estimulan la diferenciación osteoclástica e inhiben la actividad osteoblástica lo que
puede causar la resorción ósea y conducir a la formación de malformaciones o
anomalías óseas (Tintut et al., 2002; Parhami, 2003; Kruger et al., 2010). El
mecanismo antioxidante del !-tocoferol intercepta el radical peroxilo (ROO-) más
rápidamente que los PUFA, mediante la donación de su átomo de hidrógeno fenólico
al radical, convirtiéndolo así en un producto hidroperóxido (Figura 9.8), rompiendo
de esta manera con la cadena de reacciones implicadas en la autooxidación lipídica.
El resultado de esta reacción es el radical tocoferoxilo que es suficientemente estable
e incapaz de continuar la cadena de oxidación y que se retira del ciclo por reacción
con otro radical peroxilo para formar productos inactivos no radicales.

Resumen en español
………………………………………………………………………………………......
204
Figura 9.8 Mecanismo propuesto para la reacción del !-tocoferol con lípidos
oxidantes. El grupo de radicales peroxilo formado durante la oxidación de lípidos es
polar y flota a la superficie de la membrana donde puede reaccionar con el ! -
tocoferol, resultando en un hidroperóxido lipídico y el radical tocoferoxilo (Buettner,
1993).
9.1.7.2.2 Selenio
La investigación sobre los requerimientos de minerales en larvas de peces sólo se
inició después de 2005 y el número de publicaciones es muy pequeño. El selenio (Se)
es un oligoelemento y un micronutriente esencial para vertebrados (Johansson et al.,
2005). En peces, el SE está relacionado también con hormonas de la glandula tiroides,
la función de la insulina, el mantenimiento de la fertilidad así como con la regulación
del crecimiento celular (Tabla 1,5; Lall, 2002; Kohlmeier, 2003). Una de las
principales funciones de Se es ser un componente de las selenoproteínas GPX,
isoenzimas que protegen los componentes lipídicos y membranas, a nivel celular y

Resumen en español
………………………………………………………………………………………......
205
subcelular, del daño oxidativo (Arteel y Sies, 2001). La deficiencia de Se puede
conducir a un estrés oxidativo en los órganos (Gatlin et al., 1986; Bell et al., 1986,
1987), un crecimiento reducido (Wang y Lovell, 1997) y un aumento de la mortalidad
(Gatlin et al., 1986; Bell et al., 1987) en varias especies de peces. Penglase et al.
(2010) alimentaron larvas de bacalao incluyendo en su dieta seca rotíferos
enriquecidos con hasta 3 mg de selenio kg-1
. Estos autores encontraron sólo efectos
menores sobre el crecimiento y la supervivencia; en cambio, observaron que la
expresión de genes y la actividad de la glutatión peroxidasa mejoraba, indicando un
requerimiento de Se por encima del nivel usado como control.
La importancia del Se en el estrés oxidativo se debe al papel que juega en los sitios
activos de las enzimas antioxidantes glutatión peroxidasa y glutatión peroxidasa
fosfolípido hidroperóxido (Felton et al., 1996), que catalizan la reducción de
hidroperóxidos y peróxidos de alcoholes menos reactivos y agua (Felton et al., 1996).
Hay que tener en cuenta que el requerimiento de Se variará en peces de acuerdo con
la forma de selenio ingerida y el contenido de PUFA y vitamina E de la dieta (Lall,
2002).
Como se ilustró anteriormente, las mediciones directas del requerimiento de vitaminas
y minerales en larvas de peces están fragmentadas y son escasas, debido a que cada
nutriente se mide sólo en unas pocas especies y no en todas. Son necesarios más
estudios para determinar si el requerimiento de micronutrientes en larvas de peces es
diferente al de juveniles y adultos.

Resumen en español
………………………………………………………………………………………......
206
9.2 Objetivos
Obtener alevines de buena calidad es esencial para el futuro desarrollo de la
piscicultura marina. Su éxito y la consecuente obtención de una alta productividad se
ve especialmente afectada por la calidad nutricional de las dietas utilizadas en los
estadios larvarios iniciales (Kolkovski et al., 2009; Izquierdo et al., 2000). Uno de los
principales objetivos en el área de la alimentación de larvas de peces es la
formulación de una dieta eficaz y capaz de sustituir las presas vivas (Watanabe y
Kiron, 1994). Los fosfolípidos de la dieta son componentes fundamentales de tales
dietas de destete (Koven et al., 1995; Izquierdo, 1996; Fontagné et al., 2000;
Izquierdo y Koven, 2010) debido a que tienen funciones esenciales en el desarrollo
larvario (Izquierdo y Koven, 2010). Sin embargo, y a pesar de los muchos estudios
que señalan la importancia de PL en la dieta, pocos de ellos han sido dirigidos a
determinar específicamente sus requerimientos cuantitativos probando por lo menos
cinco niveles de inclusión diferentes en la dieta. Adicionalmente, hay que considerar
que el tipo de fosfolípido utilizado es un factor determinante de su valor nutritivo,
pero pocos estudios han comparado diferentes fuentes y varios niveles de inclusión. A
pesar de que el aumento de HUFA n-3 ricos en PL puede aumentar el riesgo
oxidativo, estos aspectos no han sido todavía estudiados y no se encuentra
información ni publicaciones que traten sobre la posible interacción de PL con
nutrientes antioxidantes. Basados en todo lo anterior, el principal objetivo de esta tesis
es definir los requerimientos de fosfolípidos de larvas de dorada y aportar
conocimiento sobre los efectos de este nutriente en el crecimiento, supervivencia,
resistencia al estrés, actividad enzimática digestiva, formación y mineralización del
esqueleto así como del metabolismo oxidativo en esta fase de cultivo. Para lograr este
objetivo principal se formularon los siguientes objetivos:
1. Determinar los niveles óptimos de fosfolípidos de krill (KPL) en la dieta de
larvas de dorada (Sparus aurata) y su influencia en su desarrollo y en la
actividad de sus enzimas digestivas.
2. Definir los niveles óptimos de lecitina de soja (SBL) en la dieta de larvas de
dorada (Sparus aurata) y la influencia en su desarrollo y en la actividad de sus
enzimas digestivas.
3. Comparar la efectividad de KPL vs lecitina SBL en microdietas usadas para el
Resumen en español
………………………………………………………………………………………......
207
destete temprano de larvas de dorada (Sparus aurata) en términos de
rendimiento en el cultivo larvario, malformaciones esqueléticas,
mineralización y desarrollo óseo, asi como en marcadores moleculares del
estado oxidativo.
4. Evaluar el efecto combinado de niveles graduales de !-tocoferol con KPL o
SBL en microdietas utilizadas para el destete temprano de larvas de dorada
(Sparus aurata) en términos de rendimiento en el cultivo larvario,
malformaciones esqueléticas, mineralización y desarrollo óseo y en
marcadores moleculares del estado oxidativo.
5. Evaluar el efecto de niveles variables de Se, derivado de levaduras, en
conjunto con KPL en microdietas usadas para el destete temprano de larvas de
dorada (Sparus aurata) en términos de rendimiento en el cultivo larvario y en
marcadores moleculares del estado oxidativo y el desarrollo esquelético.

Resumen en español
………………………………………………………………………………………......
208
9.3 Materiales y Métodos
9.3.1 Larvas
Se obtuvieron las larvas de dorada (Sparus aurata) de puestas naturales de
reproductores existentes en las instalaciones del GIA (Grupo de Investigación en
Acuicultura, Las Palmas de Gran Canaria, España) en donde se llevaron a cabo los
experimentos presentados en esta Tesis. Las larvas fueron alimentadas previamente
con rotíferos (Brachionus plicatilis) enriquecidos con Selco (DHA Protein Selco®
,
INVE, Dendermonde, Bélgica) hasta que llegaron a 16 días de edad. Al día 16 las
larvas fueron distribuidas al azar en los tanques experimentales y fueron alimentadas
con una de las dietas experimentales ensayadas por triplicado.
9.3.2 Cultivo en tanques experimentales
Los tanques experimentales son cilíndricos de fibra de vidrio y color gris de 200 L,
fueron abastecidos por agua de mar filtrada (salinidad de alrededor de 37 ppm) a
través de una malla de 50!m y entró del fondo del tanque a una tasa creciente de 0.4 -
1.0 L min-1
en un sistema abierto. El agua estaba continuamente aireada (125 ml min-
1), manteniendo niveles de oxígeno adecuados. La temperatura, el pH y el oxígeno se
midieron diariamente. La intensidad de la luz se mantuvo a 1700 lux (digital Lux
Tester YF-1065, Powertech Rentals, Western Australia, Australia). Se utilizó un
fotoperiodo artificial de 12 h luz: 12 h oscuridad mediante luces fluorescentes. Los
tanques se limpiaron diariamente de manera manual mediante un sifón.
9.3.4 Dietas y alimentación
9.3.4.1 Rotíferos
Los rotíferos (Brachionus plicatilis) se cultivaron en tanques cilíndricos de 1700 L de
capacidad. Estos tanques poseían un sistema central de aireación. El agua del cultivo
se hizo con una mezcla de agua salada (80%) y dulce (20%), siendo inoculados los
rotíferos (línea S-1; 150-250 !m de longitud) a una densidad inicial de 264 ind ml-1
.
La alimentación de los rotíferos se basó en levadura de panificación (0,4 g 106 ind
-1 d
-
1), repartida en dos tomas diarias.

Resumen en español
………………………………………………………………………………………......
209
Los rotíferos usados en el agua verde estaban enriquecidos (24 h) con DHA Selco®
(INVE, Bélgica; 0,125 g Selco l-1
en dos dosis). Durante los dos primeros días de
ensayo con microdietas, se administraron rotíferos alimentados con levadura en un
régimen de co-alimentación, por lo que no existió aporte de LC-PUFA diferente del
aportado por la dieta.
9.3.4.2 Microdietas
Para la realización de los experimentos de la Tesis se formularon dietas con distintos
niveles y orígenes de PL, combinadas con vitamina E o Se.
9.3.4.2.1 Formulación de las microdietas
Las microdietas experimentales (250-500 !m) fueron suplementadas con aceite de
krill (Qrill, high PL, Aker BioMarine, Fjordalléen, Noruega) y lecitina de soja
(Acrofarma, Barcelona, España) como fuentes de PL, mientras que el "-tocoferol
acetato (Sigma-Aldrich, Madrid, España) se usó como fuente de vitamina E. Además,
se usó selenio orgánico extraído de levaduras (Sel-Plex, Alltech Inc, Lexington, KY,
EEUU). Para igualar el contenido lipídico, se empleó un aceite que no es fuente de
ácidos grasos esenciales, como es el ácido oléico (Merck, Darmstadt, Alemania).
Como fuente de proteína, se empleó la harina de calamar, la cual fue desengrasada en
algunas dietas para poder controlar el contenido de lípidos de las dietas.
9.3.4.2.2 Preparación de las microdietas
Las microdietas se prepararon siguiendo el protocolo establecido por Liu et al.
(1992). Primero, se mezcló la harina con los componentes hidrosolubles en un
mortero hasta conseguir una mezcla lo más fina posible. Por separado se preparó la
mezcla de vitaminas liposolubles y aceites, que se añadió a los componentes
hidrosolubles. Se preparó gelatina, disolviéndola en agua caliente y se añadió a la
mezcla. La pasta resultante fue comprimida, moldeada en trozos pequeños (Severin,
Suderm, Alemania) y secada en una estufa a 38ºC durante 24 horas. A continuación se
molió (Braun, Kronberg, Alemania) y tamizó (Filtra, Barcelona, España) la dieta
hasta obtener el tamaño de partícula deseado (alrededor de 250-500 µm). Las dietas

Resumen en español
………………………………………………………………………………………......
210
fueron analizadas para conocer su contenido proximal y de ácidos grasos, testando
cada dieta en triplicado.
9.3.5 Alimentación
Las dietas se administraron cada 45 min desde las 8:00 hasta 19:00. Se alimentó a las
larvas durante los dos primeros días de vida con rotíferos alimentados con levadura (a
una densidad de 1 rotífero ml-1
), para así evitar cualquier aporte de LC-PUFA. Para
garantizar la disponibilidad de alimento, la administración de las dietas
experimentales fue al inicio 2.5 g y se fue incrementando 0.5-1 g cada semana.
9.3.6 Muestreos
9.3.6.1 Evaluación del crecimiento
Se determinó el crecimiento de las larvas valorando su peso corporal y longitud total.
El peso total se calculó en tres réplicas de 10 larvas en inanición, lavadas con agua
destilada y secadas en un portaobjetos en un horno a 110ºC hasta alcanzar un peso
constante, aproximadamente tras 24 h. Para los estudios de longitud total, se midieron
30 larvas por tanque en el proyector de perfiles (V-12A Nikon, Nikon Co., Tokio,
Japón).
9.3.6.2 Composición Bioquímica
9.3.6.2.1 Análisis proximal
Para analizar la composición bioquímica se tomaron todas las larvas que restaron en
los tanques experimentales, tras un periodo de inanición de 12 h, se lavaron con agua
destilada y se mantuvieron a -80ºC hasta su posterior análisis.
9.3.6.2.2 Histología
En cada punto de muestreo se fijaron 30 larvas por tanque en formol tamponado al
10%.

Resumen en español
………………………………………………………………………………………......
211
9.3.6.2.3 Biología molecular
Se tomaron aproximadamente 200 mg de larvas no alimentadas durante 12 h en cada
punto de muestreo. Estas larvas fueron lavadas con agua DEPC (dietil pirocarbonato)
y conservadas en 1000 !l de RNA later (Sigma-Aldrich, Madrid, España) durante
toda una noche a 4ºC. A continuación se retiró el RNAlater y las larvas se
conservaron a -80ºC hasta la extracción del ARN.
9.3.6.3 Test de actividad y supervivencia final
Antes del final de los experimentos se llevó a cabo un test de actividad, manteniendo
25 larvas en una red fuera del agua durante 1-1,5 min para después ponerlas de nuevo
en el agua y observar la supervivencia a las 24 h, o poner 25 larvas en agua a 24ºC y
observar la supervivencia a las 24 h. La supervivencia final se calculó tras contar
todas las larvas remanentes en los tanques experimentales.
9.3.7 Análisis bioquímicos
9.3.7.1 Análisis proximales
9.3.7.1.1 Humedad
Se determinó el contenido de humedad secando en la estufa las muestras a 110ºC
hasta alcanzar peso constante. Se anotó el peso de la muestra (aproximadamente 100
mg) antes y después de secarlas, después de dejarlas enfriar en un desecador. La
humedad se expresó como un porcentaje del peso siguiendo el Método Oficial de la
Asociación Química Analítica de los EEUU (A.O.A.C., 1995), empleando la
siguiente ecuación:
Siendo A el peso del tubo vacío, B el peso de la muestra húmeda y el tubo y C el peso
de muestra seca y tubo.
AB
ACABHumedad
!
!!!!=
)()(100(%)

Resumen en español
………………………………………………………………………………………......
212
9.3.7.1.2 Cenizas
El contenido de cenizas se midió tras secar las muestras (aproximadamente 200 mg)
en una estufa a 450º hasta que se alcanzó un peso constante (A.O.A.C., 1995).
9.3.7.1.3 Proteínas
Las proteínas se estimaron a partir del nitrógeno total contenido en la muestra (~250
mg) usando el método Kjeldhal (A.O.A.C., 1995) tras la digestión de la misma con
ácido sulfúrico a una temperatura de 420ºC. El nitrógeno total fue convertido en
proteínas crudas totales tras multiplicar por el factor empírico 6,25.
9.3.7.1.4 Lípidos totales
Los lípidos se extrajeron siguiendo el método de Folch et al. (1957). La extracción
comienza con el homogeneizado de la muestra (50-200 mg) en un Ultra Turrax (IKA-
Werke, T25 BASIC, Staufen, Alemania) durante 5 min en una solución de 5 ml de
cloroformo:metanol (2:1) con BHT al 0,01%. La solución resultante fue filtrada y a
continuación se añadió KCl al 0,88% para incrementar la polaridad de la fase acuosa.
Esto fue seguido de decantación y centrifugación a 2000 rpm durante 5 min para así
separar la fase acuosa de la orgánica. Una vez descartada la fase acuosa, se evaporó el
solvente bajo atmósfera de nitrógeno y se pesaron los lípidos.
9.3.7.2 Preparación y cuantificación de ésteres metílicos de ácidos grasos
Los ésteres metílicos de ácidos grasos (FAMEs) se obtuvieron por transmetilación
ácida de los lípidos totales con 1% de ácido sulfúrico en metanol según el método de
Christie (1982). La reacción se llevó a cabo en la oscuridad durante 16 h a 50ºC en
atmósfera de nitrógeno. Después, los ésteres metílicos de los ácidos grasos se
extrajeron con hexano:éter dietílico (1:1; v:v) y fueron purificados por cromatografía
de adsorción en cartuchos NH2 Sep-pack (Waters S.A., Massachussets, EEUU) tal y
como describió Christie (1982). Los FAME fueron separados por GLC (GC-14A,
Shimadzu, Tokyo, Japan) en una columna capilar de sílica (Supercolvax-10-fused;
longitu: 30 mm, diámetro interno: 0.32 mm; Supelco, Bellefonte, EEUU) utilizando

Resumen en español
………………………………………………………………………………………......
213
helio como gas transportador. La temperatura de la columna fue de 180ºC durante los
primeros 10 min, aumentando a 215ºC durante 10 min, según las condiciones
descritas por Izquierdo et al., (1992). Los FAME se cuantificaron por FID y se
identificaron por comparación con estándares externos y aceites de pescado bien
caracterizados (EPA 28, Nippai, Ltd. Tokio, Japón).
9.3.7.3 Clases lipídicas
La separación de clases lipídicas se realizó mediante el desarrollo doble de
cromatografía de capa fina de alto rendimiento (HPTLC) usando el método descrito
anteriormente (Tocher y Harvie 1988; Olsen y Henderson, 1989). Las clases lipídicas
se visualizaron por carbonización a 160oC durante 15 min de placas de TLC después
de la pulverización con 3% (w / v) de acetato cúprico acuoso con un 8% (v / v) de
ácido fosfórico. Fueron cuantificadas por densitometría usando un escaner CAMAG-3
TLC (versión firmware 1,14 .16; CAMAG, Muttenz, Suiza) con el programa
winCATS Planar Chromatography Manager. Las clases lipídicas fueron identificadas
de manera individual al compararlas concomparación con los valores Rf de estándares
analizados junto con las muestras en placas de HPTLC y desarrollada en las mismas
condiciones. Los glicerofosfolípidos totales, incluyendo la lisofosfatidilcolina (LPC),
la fosfatidilcolina (PC), la fosfatidiletanolamina (PE), el fosfatidilinositol (PI) y la
fosfatidilserina (PS), se aislaron a partir de placas de HPTLC colectivamente y se
sometieron a transesterificación catalizada por ácido de acuerdo con el método de
Christie (1982 ). La extracción y purificación se realizaron siguiendo el método
descrito por Tocher y Harvie (1988).
9.3.7.4 Determinación de actividades de enzimas digestivas
La determinación de las actividades enzimáticas se llevo a cabo en el Departamento
de Biología Aplicada de la Universidad de Almería (Escuela Politécnica Superior de
la Universidad de Almería, España). Las actividades de la fosfatasa alcalina, la
tripsina y lipasa se expresan como unidades de fluorescencia relativa (RFU) y la de la

Resumen en español
………………………………………………………………………………………......
214
PLA2 se expresó como unidades (U); una uindad es capaz de hidrolizar 1.0 µmol of
soybean L-!-phosphatidylcholine a L-!-lysophosphatidylcholine y ácido graso por
minuto. Las larvas se homogeneizaron mediante un sonicador de ultrasonidos
(Misonix Microson XL2007 homogeneizador ultrasónico) en hielo en 110µl de agua
de alta purificación, se centrifugaron y el sobrenadante fue usado como la solución
madre de la muestra.
La actividad de la fosfatasa alcalina se cuantificó por ensayo fluorimétrico utilizando
un espectrofluorómetro (Thermolab Systems; Helsinki, Finlandia) a longitud de onda
de excitación de 358 nm y longitud de onda de emisión de 455 nm. Después de la
preparación de 140 "l de tampón de reacción pH 10,4 (100 mM de Glicina, 1 mM
MgCl2, 1 mM ZnCl2), y 50 "l de solución de sustrato (200 mM de 6,8 difluoro-4
fosfato methyllumbelliferyl (DiFMUP) en DMSO), la reacción se inició mediante la
adición de 10 "l de la solución madre de la muestra y las curvas cinéticas se
registraron durante 20 min (Gee et al., 1999).
La actividad de la tripsina se cuantificó mediante ensayo fluorométrico utilizando un
espectrofluorimétro a longitud de onda de excitación de 380 nm y longitud de onda de
emisión de 440 nm. Después de la preparación de 195 "l de tampón de reacción pH
8,0 (50 mM Tris-HCl, 10 mM CaCl2), y 5 "l de solución de sustrato (20 "M de Boc-
Gln-Ala-Arg-7 clorhidrato metilcumarina amido-4 en DMSO), la reacción se inició
mediante la adición de 10 "l de solución madre de la muestra y las curvas cinéticas se
registraron durante 5 min (Rotllant et al., 2008).
La actividad de la lipasa neutra se cuantificó por ensayo fluorimétrico utilizando un
espectrofluorómetro a longitud de onda de excitación de 355 nm y longitud de onda
de emisión de 460 nm. En primer lugar se mezclaron 247,4 "l de tampón de reacción
fosfato 0,1M pH 7,0 (19,5 ml de 0,2 M fosfato monobásico; NaH2PO4 1 H2O) y 30,5
ml de una solución de fosfato dibásico 0,2 M (NaH2PO4 7 H2O), completándose hasta
los 100 ml de volumen mediante la adición 50 ml agua de alta purificación, a
continuación se añadieron 2.6µl de solución de sustrato (40 mM de butirato
4Methylumbelliferol (MUB) en N, N dimetil formamida (DMSO)) y la reacción se
inició tras la adición de 10 "l de la solución madre de la muestra. Las curvas cinéticas
se registraron durante 5 min (Rotllant et al., 2008).
La actividad de la PLA2 se cuantificó por ensayo fluorimétrico utilizando un
espectrofluorómetro a longitud de onda de excitación de 377 nm y longitud de onda
de emisión de 450 nm. En primer lugar, se preparó un mix conteniendo 160 "l de

Resumen en español
………………………………………………………………………………………......
215
tampón de reacción pH 8 (50 mM Tris-HCl, 100 mM de NaCl, 2 mM de NaN3,
5µg/ml albúmina de suero bovino, y 10 !l 1-anilinonaphthalene-8-sulfonato de
sodio), 20 !l de solución de sustrato (50 !l de 1 ,2-dimiristoil-sn-glicero-3-
fosfocolina en solución 40 mM, metanol mezclado con 15 !l solución de ácido
desoxicólico en 40 mM, metanol y rápidamente inyectado en 1 ml agua de alta
purificación, se agita durante 1 min y se sónico durante 2 min) y 10 !l de solución
100 mM de CaCl2, incubándose a 25 ° C durante 10 min. La reacción se inició
mediante la adición de 20 !l de la solución madre de la muestra y las curvas cinéticas
se registraron durante 40 min (Huang et al., 2006).
9.3.7.5 Determinación de las sustancias reactivas al ácido tiobarbitúrico
(TBARS)
La medida de TBARS se determinó por triplicado según el método de de Burk et al.
(1980) con algunas modificaciones. Se homogeneizaron aproximadamente 20-30 mg
de larvas en 1,5 ml de ácido tricoloroacético al 20% con 0,05 ml de BHT (Ultra
Turrax; IKA-Werke, T25 BASIC, Staufen, Alemania). A continuación se añadieron
2,95 ml de ácido tiobarbitúrico 50mM, antes de mezclarlo y calentarlo 10 min a
100ºC. Tras dejarlo enfriar y retirar los precipitados de proteína por centrifugación
(Sigma 4K15, Osterode y Harmz, Alemania) a 2000 X g. El sobrenadante se leyó en
un espectrofotómetro (Evolution 300, Thermo Scientific, Cheshire, Reino Unido) a
532 nm. La concentración de malonaldehído se expresó como nmol de MDA por g de
tejido usando el coeficiente de extinción 0.156 !M-1
cm-1
aplicando la siguiente
fórmula:
nmol MDA/g tejido = muestraPeso
A 50
156.0!
9.3.7.6 Determinación de selenio
En la presente Tesis se determinó la concentración total de selenio tanto en larvas
como en dietas. La muestras fueron acidificadas en un digestor microondas
(MarsXpress, CEM, Kamp-Lintfort, Alemania) con 5 ml de ácido nítrico puro al 69%.
La solución resultante se vertió tras la digestión en un tubo de plástico y se llevó a un

Resumen en español
………………………………………………………………………………………......
216
volumen de 10 ml con agua destilada. Se transfirieron un total de 0,4 ml de esta
solución a un tubo de 10 ml y se añadió 10 !l del estándar interno (Ga y Sc, 10 ppm)
y 0,3 ml de metanol. Los tubos se llevaron a un volumen de 10 ml con agua destilada
y se midió el selenio total con un ICP-MS de colisión/reacción de células (Thermo
Scientific, Cheshire, Reino Unido) empleando argón e hidrógeno como gases
transportadores.
9.3.8 Estudios histológicos
9.3.8.1 Tinción de hueso y cartílago
Se utilizó un protocolo de tinción para determinar el grado de mineralización y la
incidencia de deformidades de las larvas a los 45 días post eclosión. Las larvas fueron
fijadas en formol tamponado al 10% para examinar las deformidades esqueléticas y el
grado de osificación. Fueron teñidas con rojo Alizarina para detectar el hueso según el
protocolo de Vandewalle et al. (1998) (Tabla 9.2). Para evitar cualquier variabilidad
técnica, las larvas de los distintos tratamientos se tiñeron a la vez.
Tras la tinción, las larvas se midieron en un proyector de perfiles (V-12A Nikon,
Nikon Co., Tokio, Japón) bajo un aumento de 50X y fueron clasificadas en tres clases
de tamaño (<10 mm; 10-12 mm and >12 mm). Para el estudio de deformidades, las
larvas fueron observados bajo la lupa (Leica DM2500, Nussloch, Alemania).
Tabla 9.2 Protocolo de tincíon según Vandewalle et al. (1998)
Paso Duración
Importancia del
paso Soluciones
Azul alcián
(8GX) en el
protocolo dices
que solo usaste
rojo….
2 horas
Tinción de
proteoglicanos
(cartílago)
Para 100 mL:
80 mL alcohol 95%
20 mL ácido acético glacial
10 mg azul alcián
Etanol 95% 1 hora
Hid
rata
ción
Para 100 mL:
95 mL etanol absoluto
5 mL agua destilada
Etanol 95% 1 hora
Etanol 95% 1 hora
Etanol 75% 1 hora
Para 100 mL:
75 mL etanol absoluto
15 mL agua destilada

Resumen en español
………………………………………………………………………………………......
217
9.3.9 Biología molecular
Los análisis de biología molecular se llevaron a cabo en el IUSA (Instituto
Universitario de Sanidad Animal de la Universidad de Las Palmas de Gran Canaria,
España). El ARN total de las muestras de las larvas (peso promedio por muestra de 60
mg) fue extraído utilizando el RNeasy Mini Kit (Qiagen). Los tejidos se
homogeneizaron usando el TissueLyzer-II (Qiagen, Hilden, Alemania) con el reactivo
Etanol 40% 1 hora
Para 100 mL:
40 mL etanol absoluto
60 mL agua destilada
Etanol 15% 1 hora
For 100 mL:
15 mL etanol absoluto
75 mL agua destilada
Agua destilada 1 hora o toda la noche
Solución de
tripsina 1 hora
Dig
esti
ón d
e
teji
do 90 mg de tripsina de
pancreas porcino
70 mL agua destilada
30 mL de solución saturada
de Na2B4O7
Rojo alizarina 1 hora y 30 min
Tin
ción de
cali
co (
hues
o)
1g L-1
rojo alizarina en una
solución 0.5% de KOH
Glicerina:KOH
1:3 12 a 24 horas
Para 100 mL:
25 mL Glicerina
75 % KOH (0.5%)
Glicerina:KOH
1:1 12 a 24 horas
Acl
arad
o
Para 100 mL:
50 mL Glicerina
50 mL KOH (0.5%)
Glicerina:KOH
3:1 12 a 24 horas
Para 100 mL:
75 mL Glicerina
25 mL KOH (0.5%)
Glicerina pura
con algunos
granos de timol
Alm
acen
aje

Resumen en español
………………………………………………………………………………………......
218
de lisis QIAzol (Qiagen). Se centrifugaron las muestras con cloroformo para la
separación de fases (12000g, 15 min, 4 ºC). La fase superior acuosa que contiene
ARN se mezcló con 75% de etanol y se transfirió a una columna de RNeasy donde el
ARN total quedó unido a una membrana y los contaminantes fueron arrastrados por
RW1 y tampones de RPE (Qiagen). El ARN purificado se eluyó con 30 ml de agua
libre de RNasa. La calidad y la cantidad de ARN se analizaron usando el
espectrofotómetro NanoDrop 1000 (Thermo Scientific, Wilmington, DE, EE.UU.). La
síntesis de cDNA se llevó a cabo usando el kit de síntesis de ADNc iScript (Bio-Rad)
de acuerdo con las instrucciones del fabricante en un ciclador térmico iCycler (Bio-
Rad, Hercules, CA, EE.UU.). 100 ng de ARN total se transcribieron inversamente a
cDNA complementario. La eficiencia del cebador fue probada con diluciones seriadas
de un conjunto de ADNc (1:1, 1:5, 1:10, 1:15, 1:20 y 1:25). El tamaño del producto
de la amplificación obtenido tras la qPCR en tiempo real verificado por análisis de
electroforesis utilizando PB322 cortado con HAEIII como un estándar. La PCR
cuantitativa a tiempo real se realizó en un iQ5 Multicolor Real-Time PCR (Bio-Rad,
Hercules, CA, EE.UU.), utilizando !-actina como gen de referencia (house-keeping
gene) en un volumen final de 20 µl por pocillo de reacción. Cada muestra se analizó
una vez por gen. Las condiciones de PCR fueron las siguientes: 95 º C por 3min y 30
seg seguido por 40 ciclos de 95 º C durante 15 segundos, 61 º C durante 30 segundos
y 72 º C durante 30 segundos, 95 º C durante 1 minuto, y una etapa final de
desnaturalización de 61 º C a 95 º C por 10 seg. Los datos obtenidos se normalizaron
de acuerdo al método de Livak (2-""Ct
) para determinar los niveles relativos de
expresión de ARNm. Los cebadores específicos para dorada se diseñaron después de
buscar wn la base de datos NCBI de nucleótidos y utilizando el software de análisis
Oligo 7 Primer (Molecular Insights Biología, Cascade, CO, EE.UU.). La información
detallada de secuencias de los cebadores y números de acceso se presenta en la Tabla
9.3.

Resumen en español
………………………………………………………………………………………......
219
Tabla 9.3 Genes estudiados en la presente tesis
Gene Primer No de acceso
Catalasa (CAT) Forward primer: 5´-ATGGTGTGGGACTTCTGGAG-3´
Reverse primer: 3´-AGTGGAACTTGCAGTAGAAAC-5´
FJ860003
Superoxido
dismutasa (SOD)
Forward primer: 5´- AAGAATCATGGCGGTCCTACTGA-3´
Reverse primer: 3´- TGAGCATCTTGTCCGTGATGTCT -5´
AJ937872
Glutathion
peroxidasa (GPX)
Forward primer: 5´- TCCATTCCCCAGCGATGATGCC-3´
Reverse primer: 3´- TCGCCATCAGGACCAACAAGGA-5´
DQ524992
Osteocalcina Forward primer: 5´-AGCCCAAAGCACGTAAGCAAGCTA-3´
Reverse primer: 3´- TTTCATCACGCTACTCTACGGGTT-5´
AF048703
Osteopontina Forward primer: 5´- AAGATGGCCTACGACATGACAGAC- 3´
Reverse primer: 3´- CCTGAAGAGCCTTGTACACCTGC-5´
AY651247
Osteonectina Forward primer: 5´- AAAATGATCGAGCCCTGCATGGAC-3´
Reverse primer: 3´- TACAGAGTCACCAGGACGTT-5´
AY239014
aRUNX2 Forward primer: 5´- GCCTGTCGCCTTTAAGGTGGTTGC-3´
Reverse primer: 3´- TCGTCGTTGCCCGCCATAGCTG-5´
AJ619023
Alkalina
phosphatasa
Forward primer: 5´- AGAACGCCCTGACGCTGCAA-3´
Reverse primer: 3´- TTCAGTATACGAGCAGCCGTCAC-5´
AY266359
Matrix Gla proteina Forward primer: 5´- GTGCCCTCCTTCATTCCAC-3´
Reverse primer: 3´- TATGACCACGTTGGATGCCT-5´
AY065652
bBMP4 Forward primer: 5´- CCACCAGGGCAGACACGTCC-3´
Reverse primer: 3´- GCGTAGCTGCTCCCAGTCCTC-5´
FJ436409
!-actina Forward primer: 5´- TCTGTCTGG ATC GGAGGCTC-3´
Reverse primer: 3´- AAGCATTTG CGGTGGACG -5´
X89920
a RUNX2 (Runt-related transcription factor 2).
b BMP4 (Bone morphogenetic proteina 4).
9.3.10 Análisis estadístico
Los análisis estadísticos realizados en la presente tesis se llevaron a cabo empleando
en programa SPSS (SPSS for Windows 11.5; SPSS Inc., Chicago, IL, USA). Se
consideró un nivel de significancia del 5% (P<0.05) en todas las pruebas estadísticas.
Para cada parámetro medido se calculó la media aritmética como una estima de la
media poblacional junto con la desviación estándar (SD) para representar así la
distribución de las muestras.

Resumen en español
………………………………………………………………………………………......
220
9.4 Resúmenes de los experimentos
9.4.1 Capítulo 3:
Contenido óptimo de fosfolípidos de krill en microdietas de larvas de dorada
(Sparus aurata)
Resumen
El objetivo del presente estudio fue determinar los niveles óptimos de fosfolípidos de
krill (KPL) en dietas de larvas de dorada (Sparus aurata) y su influencia en el
desarrollo larvario y en la actividad de algunas enzimas digestivas. Fueron utilizadas
cinco microdietas formuladas con cinco niveles diferentes de KPL. La sustitución
total de presas vivas con las microdietas experimentales produjo una supervivencia y
tasas de crecimiento altas, en particular en aquellas larvas alimentadas con los niveles
más altos de KPL. En el presente estudio el aumento de KPL de la dieta hasta el 12%
de inclusión (10% total PL) mejoró significativamente la supervivencia y crecimiento
larvario, sin embargo, un aumento adicional de PL no aumento ninguno de los dos.
Adicionalmente, fue observado un aumento de la actividad de fosfatasa alcalina,
tripsina y lipasa cuando la elevación de KPL fue hasta del 12%, denotando un mejor
funcionamiento del sistema digestivo de las larvas. Además, hubo un efecto
estimulador lineal del sustrato de KPL sobre la actividad de la fosfolipasa A2. Por
último, el aumento de KPL en la dieta permitió una mejor asimilación de los HUFA
n-3 especialmente deEPA, lo que se vió reflejado en el mayor contenido de estos
ácidos grasos en los lípidos neutros y polares de las larvas. En resumen, los KPL
resultaron ser una excelente fuente de lípidos para las larvas de dorada. Los niveles
óptimos de inclusión de este ingrediente en microdietas al sustituir completamente las
presas vivas en larvas fue del 12% de KPL.

Resumen en español
………………………………………………………………………………………......
221
9.4.2 Capítulo 4:
Contenido óptimo de lecitina de soja en microdietas de larvas de dorada (Sparus
aurata)
Resumen
El objetivo del presente estudio fue determinar los niveles óptimos de inclusión de
lecitina de soja (SBL) en dietas de larvas de dorada (Sparus aurata) y su influencia en
el cultivo y en la actividad de algunas enzimas digestivas. Fueron utilizadas cinco
microdietas formuladas con cinco niveles diferentes de SBL. La sustitución total de
presas vivas con las microdietas experimentales en el día 16 post-eclosión produjo
una supervivencia superior al 55%, en particular en aquellas larvas alimentadas con
los niveles más altos de SBL. Además, un incremento superior al 80 g kg-1
de
inclusión de SBT en la dieta mejoró significativamente el crecimiento, reflejándose en
una longitud y peso corporal final mayores. Adicionalmente, fue observado un
aumento de la actividad de fosfatasa alcalina cuando el nivel de inclusión de SBT se
elevó a 80 g kg-1
, denotando un mayor desarrollo del sistema digestivo. También hubo
un efecto estimulador de SBL sobre la actividad de la fosfolipasa A2. Por último, el
aumento de SBL en la dieta permitió una mejor asimilación de los HUFA de la dieta,
lo que se vió reflejado en el mayor contenido de este ácido graso en los lípidos
neutros y polares de las larvas. En resumen, con un incremento superior al 80 g kg-1
de inclusión de SBT en la dieta fue observada una mejora significativa de la actividad
enzimática, maduración de enterocitos, utilización y deposición de acidos grasos
esenciales y del crecimiento, como consecuencia de una mejor digestión, absorción,
transporte y deposición de los nutrientes de la dieta.

Resumen en español
………………………………………………………………………………………......
222
9.4.3 Capítulo 5:
Efecto de los fosfolípidos de krill vs lecitina de soja en microdietas de larvas de
dorada (Sparus aurata) sobre marcadores moleculares del estrés oxidativo y el
desarrollo óseo
Resumen
El objetivo del presente estudio fue comparar la eficacia de los fosfolípidos marinos
(MPL) obtenidos a partir de krill y lecitina de soja (SBL) sobre el rendimiento y el
desarrollo de larvas de dorada (Sparus aurata). Las larvas fueron alimentadas desde el
día 16 al 44 post-eclosión (dph) utilizando cinco microdietas formuladas con tres
niveles diferentes (5, 7 o 9%) de fosfolípidos (PL) obtenidos a partir de MPL o SBL.
Las larvas alimentadas con MPL mostraron una supervivencia, resistencia al estrés y
crecimiento superiores a las alimentadas con SBL, sin importar el nivel de PL de la
dieta. En general, el aumento de MPL hasta 7% de PL totales en la dieta fue suficiente
para mejorar el rendimiento en larvas de dorada, mientras que un nivel superior de
inclusión de SBL (9% de PL) no fue capaz de proporcionar un éxito similar en el
crecimiento o supervivencia. La inclusión de SBL aumentó notablemente el riesgo de
peroxidación lo que se vió reflejado en los mayores TBARS en larvas, así como una
mayor expresión de los genes CAT, GPx y SOD. Además, SBL tiende a producir
larvas con un menor número de vértebras mineralizadas y una menor expresión de los
genes OC, OP y BMP4. Finalmente, el aumento de la dieta de MPL o SBL llevó a una
mejor asimilación de los ácidos grasos poliinsaturados en las larvas, HUFA n-3
(especialmente 20:5 n-3) o ácidos grasos n-6 (especialmente 18:2 n-6),
respectivamente. En conclusión, MPL tuvo una eficacia superior en la promoción de
la supervivencia, crecimiento y mineralización esquelética de larvas de dorada en
comparación con SBL.

Resumen en español
………………………………………………………………………………………......
223
9.4.4 Capítulo 6:
Biomarcadores del desarrollo óseo y estrés oxidativo en larvas de dorada (Sparus
aurata) alimentadas con microdietas con varios niveles de lípidos polares y !-
tocoferol
Resumen
A pesar de que los fosfolípidos marinos son capaces de mejorar el rendimiento en el
cultivo de larvas de peces marinos de mejor manera que la lecitina de soja, ambos
tipos de fosfolípidos (PL) aumentan notablemente el riesgo oxidativo. La inclusión de
un antioxidante liposoluble como la vitamina E !-tocoferol podría permitir un mejor
control del estrés oxidativo. El objetivo del presente estudio fue determinar el efecto
combinado de niveles variables de !-tocoferol con diferentes niveles y fuentes de
fosfolípidos de krill (KPL) y lecitina de soja (SBL) sobre el crecimiento,
supervivencia, resistencia al estrés, estado oxidativo, expresion de genes relacionados
con el metabolismo óseo y composición bioquímica de larvas de dorada. Las larvas
fueron completamente destetadas el día 16 post-eclosión y alimentadas durante 30
días utilizando siete microdietas con tres niveles diferentes de PL (0, 4 y 8%) y dos de
!-tocoferol, 1.500 y 3.000 mg kg-1
de dieta. Las larvas de dorada alimentadas con
dietas sin suplementación de PL mostraron la menor supervivencia, crecimiento y
resistencia al estrés, mientras que el aumento en PL, especialmente KPL, promovió
notablemente la supervivencia y crecimiento. Sin embargo, la alimentación con SBL
incrementó notablemente los TBARS y la expresión del gen GPX, denotando el
mayor riesgo de peroxidación en las larvas. Además, la inclusión de KPL mejoró la
incorporación de HUFA n-3 y, en particular, de EPA en los tejidos de las larvas. Estos
ácidos grasos están correlacionados positivamente con la expresión de los genes
BMP-4, RUNX 2, ALP, OC y OP y en la mineralización del hueso en un determinado
tamaño. El incremento de !-tocoferol tiende a mejorar el crecimiento en relación con
los niveles de HUFA n-3 de la dieta, denotando la función protectora de esta vitamina
frente a la oxidación. En efecto, el !-tocoferol de la dieta disminuyó el estrés
oxidativo en las larvas, lo que se vió reflejado en la reducción de TBARS y la
expresión génica de SOD y CAT, pero no de GPX. Por lo tanto, el aumento de !-
tocoferol en la dieta previno eficazmente la formación de radicales libres a partir de

Resumen en español
………………………………………………………………………………………......
224
HUFA, en particular de EPA, pero no afectó a la incidencia de anomalías óseas o la
expresión de genes relacionados con los procesos osteogénicos.

Resumen en español
………………………………………………………………………………………......
225
9.4.5 Capítulo 7:
Niveles de selenio en dietas de destete precoz de larvas de dorada
Resumen
La inclusión de factores antioxidantes complementarios, como el selenio (Se), podría
contrarrestar el riesgo de oxidación en las dietas de destete precoz con un alto
contenido de ácidos grasos poliinsaturados (PUFA). El objetivo del presente estudio
fue investigar el efecto de niveles variables de Se derivado de levadura con krill PL
(KPL), en el desarrollo esquelético, supervivencia, resistencia al estrés, estado
oxidativo y composición bioquímica de larvas de dorada. Las larvas de dorada fueron
completamente destetadas al día 16 post-eclosión y alimentadas durante 30 días
utilizando cinco microdietas isoenergéticas e isoproteicas con diferentes niveles de
Se: 2SE, 4SE, 6SE, 8SE y 12SE (1.73, 3.91, 6.41, 8.47, 11.65 mg SE kg-1 de peso
seco de la microdieta, respectivamente).
El aumento de Se hasta un 11,65 mg kg-1 peso seco mejoró significativamente la
supervivencia (54%), la resistencia al estrés de las larvas y no afectó su crecimiento.
Las larvas alimentadas con dietas suplementadas con 12SE (11,65 mg kg-1)
mostraron un aumento gradual de este mineral de acuerdo a los niveles dietéticos de
Se, mostrando su progresiva absorción. El grado de oxidación de lípidos en las larvas
fue observado a través del contenido del malondialdehído (MDA) y la expresión del
gen AOE y fue significativamente menor en aquellas larvas alimentadas con las
dietas 8SE y 12SE en comparación con las dietas 2SE y 4SE.
Además, fue observada una respuesta reactiva como consecuencia de la inclusión en
Se a través del incremento de osteocalcina, osteonectina, osteopontina, fosfatasa
alcalina y la expresión génica de la proteína de la matriz GLA en los tejidos de las
larvas, sugiriendo un buen desarrollo esquelético. Estos resultados indican la alta
eficiencia de Se como un factor antioxidante y la importancia de su inclusión en
niveles adecuados (11,65 mg Se kg-1 peso seco de dieta) en dietas de destete precoz.

Resumen en español
………………………………………………………………………………………......
226
9.5 Conclusiones Generales
1. La deficiencia de PL reduce el rendimiento larvario, retarda el desarrollo
intestinal y la mineralización ósea, inhibe la actividad de las enzimas
digestivas y reduce la utilización de los lípidos de la dieta en larvas de dorada.
2. Los niveles óptimos de inclusión de PL de krill en microdietas que sustituyen
completamente las presas vivas a partir del día 16 después de la eclosión es
alrededor de 12% de PL de krill, proporcionando así un 10% del PL total.
3. Los niveles óptimos de inclusión de SBL en microdietas que sustituyen
completamente las presas vivas a partir del día 16 después de la eclosión es
alrededor de 8% de PL de krill, proporcionando así un 9% de PL total. Sin
embargo, la inclusión de SBL aumentó notablemente el riesgo de
peroxidación, indicado por la mayor TBARS en larvas, así como por una
mayor expresión de los genes CAT, GPx y SOD.
4. Los PL de krill son una excelente fuente de lípidos para larvas de dorada,
siendo marcadamente mejores que los de SBL.
5. Los requerimientos de PL de dorada en dietas que sustituyen completamente
las presas vivas entre los días 16 y 45 después de la eclosión es de
aproximadamente 9-10%. Estos valores parecen promover la digestión,
transporte y deposición de los lípidos de la dieta y contribuyen a reducir las
anomalías esqueléticas por la regulación de BMP-4, Runx2, ALP y las
proteínas de la matriz extracelular del esqueleto, induciendo una
mineralización temprana y la resistencia de los cuerpos vertebrales,
reduciendo así anomalías como lordosis y cifosis.
6. El aumento de !-tocoferol en la dieta promueve efectos beneficiosos en el PL
de la dieta, promoviendo el crecimiento de las larvas, mostrando su función
como protector contra la oxidación y la reducción de TBARS de las larvas y

Resumen en español
………………………………………………………………………………………......
227
de la expresión de los genes SOD y CAT.
7. La inclusión de 11,65 mg de Se kg-1 de dieta en microdietas mejora la
capacidad antioxidante de las larvas y la regulación de los genes implicados en
el desarrollo del esqueleto. La mejora de la supervivencia y la resistencia al
estrés debido al aumento de los niveles de Se orgánico en la dieta parece estar
relacionado por una parte con la reducción de radicales libres tóxicos, como lo
indican los bajos niveles de MDA y del contenido de AOE, y, por otro lado,
con una mejor utilización de los lípidos de la dieta.

References
……………………………………………………………………………………..........
228
References
-----------------------------------------------------------------------------
Amezaga MR and Knox D (1990) Riboflavin requirements in on-growing rainbow trout,
Oncorhynchus mykiss. Aquaculture 88, 87-98.
Ansaldo M, Luquet CM, Evelson PA, Polo JM and Llesuy S (2000) Antioxidant levels from
different Antarctic fish caught around South Georgia Island and Shag rocks. Polar
Biology 23,160–165.
A.O.A.C. (1995) Official method of analysis. Association official analytical chemistry
Washington DC. 1018.
APROMAR (2009) La acuicultura marina de peces en España. 68.
Arjmandi BH, Juma S, Beharka A, Bapna MS, Akhter M and Meydani SN (2002) Vitamin E
improves bone quality in the aged but not young adult male mice. The Journal of
Nutritional Biochemistry 13, 543-549.
Arteel GE and Sies H (2001) The biochemistry of selenium and the glutathione system.
Enviromental Toxicology and Pharmacology 10, 153-158.
Atalah E (2008) Importance of the proportions of dietary polyunsaturated fatty acids and
antioxidants in larval development of marine fish. Ph.D. University of Las Palmas of
Gran Canary, Spain.
Atalah E, Hernández-Cruz CM, Ganuza E, Benítez-Santana T, Ganga R, Roo J, Fernández-
Palacios H and Izquierdo MS (2010) Combined effects of vitamin C and vitamin E
microdiets for gilthead seabream, Sparus aurata. XIVth International Symposium on
Fish Nutrition and Feeding. May 31-June 4. Quingdao, China.
Atalah E, Hernández-Cruz CM, Ganuza E, Benítez-Santana T, Ganga R, Roo J, Fernández-
Palacios H and Izquierdo MS (2011) Enhancement of gilthead sea bream (Sparus
aurata ) larval growth by dietary vitamin E in relation to two different levels of
essential fatty acids. In press at Aquaculture Research DOI: 10.1111/j.1365-
2109.2011.02989.x
Atkinson TG, Barker HJ and Meckling-Gill KA (1997) Incorporation of long-chain n-3 fatty
acids in tissues and enhanced bone marrow cellularity with docosahexaenoic acid
feeding in post-weanling Fischer 344 rats. Lipids 32, 293–302.
Babin PJ and Vernier JM (1989) Plasma lipoproteins in fish. Journal of Lipid Research 30,
467-489.
Bai SC and Lee KJ (1998) Different levels of dietary DL-alpha-tocopheryl acetate affect the
vitamin E status of juvenile Korean rockfish Sebastes schlegeli. Aquaculture 161,
403- 412.
Baker RTM and Davies SJ (1997) Modulation of tissue !-tocopherol in African catfish,
Clarias gariepinus Burchell, fed oxidized oils, and the compensatory effect of
supplemental dietary vitamin E. Aquaculture Nutrition 3, 91-97.

References
……………………………………………………………………………………..........
229
Barnabé G and Guissi A (1994) Adaptation of the feeding behavior of larvae of the sea bass,
Dicentrarchus labrax L. to an altering live food/compound-food regime. Aquatic
Fisheries Management 25, 537-546.
Baskerville-Bridges B and Kling LJ (2000) Development and evaluation of microparticulate
diets for early weaning of Atlantic cod, Gadus morhua larvae. Aquaculture Nutrition
6, 171-182.
Bates JM, Akerlund J, Mittge E, and Guillemin K (2007) Intestinal alkaline phosphatase
detoxifies lipopolysaccharide and prevents inflammation in zebrafish in response to
the gut microbiota. Cell Host and Microbe 2, 371–382.
Bell JG, Pirie BJS, Adron JW and Cowey CB (1986) Some effects of selenium deficiency on
glutathione peroxidase (EC 1.11.19) activity and tissue pathology in rainbow trout,
Salmo gairdneri. British Journal of Nutrition 55, 305-311.
Bell JG, Cowey CB, Adron JW and Pirie BJS (1987) Some effects of selenium deficiency on
enzyme activities and indices of tissue peroxidation in Atlantic salmon parr, Salmo
salar. Aquaculture 65, 43-54.
Bernoud N, Fenart L, Molie`re P, Dehouck MP, Lagarde M, Cecchelli R and Lecerf J (1999)
Preferential transfer of 2-docosahexaenoyl-1- lysophosphatidylcholine through an in
vitro blood–brain barrier over unesterified docosahexaenoic acid. Journal of
Neurochemistry 72, 338 – 345.
Berridge MJ and Irvine RF (1989) Inositol phosphates and cell signalling. Nature 341, 197-
205.
Betancor MB, Atalah E, Caballero MJ, Benítez-Santana T, Roo J, Montero D and Izquierdo
MS (2011) !- tocopherol in weaning diets for European sea bass, Dicentrarchus
labrax L. improves survival and reduces tissue damage caused by excess dietary
DHA contents. Aquaculture Nutrition 17, 112-122.
Betancor MB, Caballero MJ, Benítez-Santana T, Saleh R, Roo J, Atalah E and Izquierdo MS
(2012a) Oxidative status and histological changes in sea bass larvae muscle in
response to high dietary content of DHA. Journal of Fish Diseases, doi: 10.1111-
j.1365-2761.2012.01447.x.
Betancor MB, Nordrum S, Atalah E, Caballero MJ, Benítez-Santana T, Roo J, Robaina L and
Izquierdo MS (2012b) Potential of three new krill products for seabream larval
production. Aquaculture Research 43, 395-406.
Betancor MB, Caballero MJ, Terova G, Saleh R, Atalah E, Benítez -Santana, T, Gordon Bell
J and Izquierdo M (2012c) Selenium inclusion decreases oxidative stress indicators
and muscle injuries in sea bass larvae fed high-DHA microdiets. British Journal of
Nutrition 13, 1-14.
Betancor MB, Caballero MJ, Terova G, Cora S, Saleh R, Bell JG, Benítez-Santana T,
Hernandez-Cruz CM and Izquierdo MS (2012d) Vitamin C enhances vitamin E status
and reduces oxidative stress indicators in sea bass larvae fed high DHA microdiets.
Lipids, doi: 10.1007/s11745-012-3730-x.
Betancor MB (2012) Oxidative stress in sea bass, Dicentrarchus labrax L. larvae fed high
DHA microdiets and its relation with several antioxidant nutrients. Ph.D., University
of Las Palmas of Gran Canary, Spain.

References
……………………………………………………………………………………..........
230
Blazer VS (1982) The effect of marginal deficiencies of ascorbic acid and !-tocopherol on the
natural resistance and immune response of rainbow trout Salmo gairdneri. Ph.D.,
University of Rhode Island.
Brown KM and Arthur JR (2001) Selenium, selenoproteins and human health: a review.
Public Health Nutrition 4, 593–599.
Buettner GR (1993) The pecking order of free radicals and antioxidants: lipid peroxidation,
!!tocopherol, and ascorbate. Archives of Biochemistry and Biophysics 300, 535–543.
Burk RF, Trumble MJ and Lawrence RA (1980) Rat hepatic cytosolic GSH-dependent
enzyme protection against lipid peroxidation in the NADPH microsomal lipid
peroxidation system. Biochimica et Biophysica Acta 618, 35-41.
Caballero MJ, Obach A, Rosenlund G, Montero D, Gisvold M and Izquierdo MS (2002)
Impact of different dietary lipid sources on growth, lipid digestibility, tissue fatty acid
composition and histology of rainbow trout, Oncorhynchus mykiss. Aquaculture 214,
253-271.
Caballero MJ, Izquierdo MS, Kjørsvik E, Montero D, Socorro J, Fernández, AJ and
Rosenlund G (2003) Morphological aspects of intestinal cells from gilthead
seabream, Sparus aurata fed diets containing different lipid sources. Aquaculture
225, 325–340.
Caballero MJ, Gallardo G, Robaina L, Montero D, Fernandez A and Izquierdo MS (2006a)
Vegetable lipid sources affect in vitro biosynthesis of triacylblycerols and
phospholipids in the intestine of seabream, Sparus aurata. British Journal of
Nutrition 95, 448-454.
Caballero MJ, Torstensen BE, Robaina L, Montero D and Izquierdo MS (2006b) Vegetable
oils affect the composition of lipoproteins in seabream, Sparus aurata. British
Journal of Nutrition 96, 830–839.
Cahu CL and Zambonino-Infante JL (1995a) Effect of molecular form of dietary nitrogen
supply in sea bass larvae: response of pancreatic enzymes and intestinal peptidases.
Fish Physiology and Biochemistry 14, 209–214.
Cahu CL and Zambonino-Infante JL (1995b) Maturation of the pancreatic and intestinal
digestive functions in sea bass, Dicentrarchus labrax L. effect of weaning with
different protein sources. Fish Physiology and Biochemistry 14, 431–437.
Cahu CL, Zambonino-Infante JL, Escaffre AM, Bergot P and Kaushik S (1998) Preliminary
results on sea bass, Dicentrarchus labrax L. larvae rearing with compound diet from
first feeding, comparison with carp Cyprinus carpio larvae. Aquaculture 169, 1-7.
Cahu CL and Zambonino-Infante J (2001) Substitution of live food by formulated diets in
marine fish larvae. Aquaculture 200, 161–180.
Cahu CL, Zambonino-Infante JL and Barbosa V (2003a). Effect of dietary phospholipid level
and phospholipid:neutral lipid value on the development of sea bass, Dicentrarchus
labrax L. larvae fed a compound diet. British Journal of Nutrition 90, 21–28.
Cahu CL, Zambonino-Infante J and Takeushi T (2003b). Nutritional components affecting
skeletal development in fish larvae. Aquaculture 227, 245–258.

References
……………………………………………………………………………………..........
231
Cahu C.L., Gisbert E, Villeneuve L, Morais S, Hamza N, Wold P, Zambonino-Infante JL
(2009). Influence of dietary phospholipids on early ontogenesis of fish. Aquaculture
Research 40, 989 – 999.
Chaiyapechara S, Casten MT, Hardy RW and Dong FM (2003) Fish performance, fillet
characteristics and health assessment index of rainbow trout, Oncorhynchus mykiss
fed diets containing adequate and high concentrations of lipid and vitamin E.
Aquaculture 219, 715-738.
Chang RSL, Raymond SL, Lotti VJ, Victor J and Chen TB (1984) Cholecystokinin receptor
mediated hydrolysis of inositol phospholipids in guinea pig gastric glands. Life
Sciences 36, 965-971.
Chen XS, Yang GQ, Chen XC, Wen ZM and Ge KY (1980). Studies on the relations of
selenium and Keshan Disease. Biological Trace Elements Research 2, 91-107.
Christie WW (1982) Lipid analysis. Pergamon, Oxoford.
Coetzee M, Haag M, Joubert AM and Kruger MC (2007) Effects of arachidonic acid,
docosahexaenoic acid and prostaglandin E2 on cell proliferation and morphology of
MG-63 and MC3T3-E1 osteoblast-like cells. Prostaglandins, Leukotrienes and
Essential Fatty Acids 76,35–45.
Collins DA, Chambers TJ (1991). Effect of prostaglandins E1, E2, and F2a on osteoclast
formation in mouse bone marrow cultures. J. Bone. Miner. Res. 6, 157–64.
Cornwell DG and Parganamala RV (1993) Vitamin E in health and disease. Lester Packer and
Jurgen Fuchs; eds. 1024 pages. New York: Marcel
Cousin JCB, Baudin-Laurencin F and Gabaudan J (1987) Ontogeny of enzymatic activities in
fed and fasting turbot, Scophtalmus maximus L. Journal of Fish Biology 30, 15–33.
Coutteau P, Geurden I, Camara MR, Bergot P and Sorgeloos P (1997) Review on the dietary
effects of phospholipids in fish and crustacean larviculture. Aquaculture 155, 149–
164.
Cross PC and Mercer KL (1993) Blood. In: Cell and Tissue Ultrastructure: A Functional
Perspective. WH Freeman and Company, New York 163–188.
Curnow J, King J, Bosmans J and Kolkovski S (2006a) The effect of reduced Artemia and
rotifer use facilitated by a new microdiet in the rearing of barramundi Lates calcarifer
(Bloch) larvae. Aquaculture 257, 204-213.
Curnow J, King J, Bosmans Partrige G and Kolkovski S (2006b) Effects of two commercial
microdiets on growh and survival of barramundi (Lates calcarifer Bloch) larvae
within various early weaning protocols. Aquaculture Nutrition 12, 247-255.
Dabrowski K and Guderley H (2002) Intermediary metabolism. In: Halver JE and Hardy R
(Eds). Fish Nutrition. Academic Press New York 309-365.
Delany AM, Pash JM and Canalis E (1994) Cellular and clinical perspectives on skeletal
insulin-like growth factor I. Journal of Cellular Biochemistry 55, 328–33.

References
……………………………………………………………………………………..........
232
Deplano M, Díaz JP, Connes R, Kentouri-Divanach M and Cavalier F (1991) Appearance of
lipidabsorption capacities in larvae of the sea bass, Dicentrarchus labrax L. during
transition to the exotrophic phase. Marine Biology 108, 361-371.
Di Battista JA, Dore S, Morin N and Abribat T (1996) Prostaglandin E2 up-regulates insulin-
like growth factor binding protein-3 expression and synthesis in human articular
chondrocytes by a c-AMP-independent pathway: role of calcium and protein kinase
A and C. Journal of Cellular Biochemistry 63, 320–33.
Di Giulio RT and Meyer JN (2008) Reactive oxygen species and oxidative stress. In: Di
Giulio RT and Hinton DE (Eds). The Toxicology of Fishes CRC Press Boca Raton FL
USA. 273–324.
Díaz ME, Furné M, Trenzado CE, García-Gallego M, Domezain A and Sanz A (2010)
Antioxidant defences in the first life phases of the sturgeon Acipenser naccarii.
Aquaculture 307, 123-129.
Elbal MT, García-Hernández MP, Lozano MT and Agulleiro B (2004) Development of the
digestive tract of gilthead seabream, Sparus aurata L. Light and electron microscopic
studies. Aquaculture 234, 215-238.
Evjemo JO, Reitan KL and Olsen Y (2003) Copepods and live food organisms in the larval
rearing of halibut larvae, Hippoglossus hippoglossus L. with special emphasis on the
nutritional value. Aquaculture 227, 191-210.
FAO (1998) Planing for Aquaculture Development. ACDP/REP/89/33 Roma Italia, pp 68.
FAO (1999) Manual on hatchery production of sea bass and gilthead sea bream. pp 5.
FAO (2011) World aquaculture 2010. FAO Fisheries and Aquaculture Technical Paper. pp
120
FEAP (2008) Production and price reports of the member association of the F.E.A.P. 2001-
2008. pp 17.
Felton SP, Landolt ML and Grace R (1996) Effects of selenium dietary enhancement on
hatchery-reared coho salmon, Oncorhynchus kisutch (Walbaum), when compared
with wild coho: hepatic enzymes and seawater adaptation evaluated. Aquaculture
Research 27, 135-142.
Fernández-Díaz C and Yúfera M (1997) Detecting growth in Sparus aurata larvae fed
microcapsules. Aquaculture 153, 93-102.
Fernández-Palacios H, Izquierdo MS, Gonzalez M, Robaina L and Valencia A (1998).
Combined effect of dietary a-tocopherol and n-3 HUFA on egg quality of gilthead
seabream broodstock, Sparus aurata. Aquaculture 161, 475–476.
Field FJ, Born E, Chen H, Murthy S and Mathur SN (1994) Regulation of Apolipoprotein A
secretion by biliary lipids in CaCo-2 cells. Journal of Lipid Research 35, 749-762.
Field FJ and Mathur SN (1995) Intestinal lipoprotein synthesis and secretion. Progress in
Lipids Research 34,185-198.
Filho DW, Giulivi C and Boveris A (1993) Antioxidative defences in marine fish:
References
……………………………………………………………………………………..........
233
Teleosts. Comparative Biochemistry and Physiology 106, 409– 413.
Folch J, Lees M and Stanley GHS. (1957) A simple method for the isolation and purification
of total lipids from animal tissues. The Journal of Biological Chemistry 226, 497-509.
Fontagné S (1996) Effet des phospholipides alimentaires sur la structure histologique du fole
et de I'Intestin de larves de carpe. Ph.D., Univ. Bordeaux (France).
Fontagné S, Geurden I, Escaffre AM and Bergot P (1998) Histological changes induced by
dietary phospholipids in intestine and liver of common carp, Cyprinus carpio L.
larvae. Aquaculture, 161, 213–223.
Fontagné S, Burtaire L, Corraze G and Bergot P (2000) Effects of dietary medium-chain
triacylglycerols (tricaprylin and tricaproin) and phospholipid supply on survival,
growth and lipid metabolism in common carp, Cyprinus carpio L. larvae.
Aquaculture 190, 289-303.
Foscarini R (1988) A review: intensive farming for red sea bream Pagrus major in Japan.
Aquaculture 72, 191–246.
Frankel EN (1998) Lipid oxidation. The Oily Press, Dundee, Scotland, 303 pp.
Frigg M, Prabucki AL and Ruhdel EU (1990) Effect of dietary vitamin E levels on oxidative
stability of trout fillets. Aquaculture 84, 145-158.
Ganga R, Bell JG, Montero D, Robaina L, Caballero MJ, and Izquierdo MS (2005) Effect of
dietary lipids on plasma fatty acid profiles and prostaglandin and leptin production in
gilthead seabream, Sparus aurata. Comparative Biochemistry and Physiology 142,
410-418.
Gangl A, Korauth W, Mlczoch J, Sulm O and Klose B (1980) Different metabolism of
saturated and unsaturated long chain plasma free fatty acids by intestinal mucosa of
rats. Lipids 15, 75-79.
Gatlin DM, Poe WE and Wilson RP (1986) Effects of singular and combined dietary
deficiencies of selenium and vitamin E on fingerling channel catfish, Ictalurus
punctatus. Journal of Nutrition 116, 1061-1067.
Gatta PP, Pirini M, Testi S, Vignola G and Monetti PG (2000) The influence of different
levels of dietary vitamin E on sea bass, Dicentrarchus labrax L. flesh quality.
Aquaculture Nutrition 6, 47-52.
Gee KR, Sun WC, Bhalgat MK, Upson RH, Klaubert DH, Latham KA and Haugland RP
(1999) Fluorogenic Substrates Based on Fluorinated Umbelliferones for Continuous
Assays of Phosphatases and b-Galactosidases. Analytical Biochemistry 273, 41–48 .
Geurden I, Coutteau P, Sorgeloos P, (1995a). Dietary phospholipids for European sea bass
(Dicentrarchus labrax L.) during first ongrowing. In: Lavens P, Jaspers E and
Roelants I (Eds). Larvi '95 – Fish and Shellfish symposium, Gent, Belgium. European
Aquaculture Society, 24, 175–178.
Geurden I, Radunz-Neto J and Bergot P (1995b) Essentiality of dietary phospholipids for
carp, Cyprinus carpio larvae. Aquaculture 131, 303-314.

References
……………………………………………………………………………………..........
234
Geurden I, Charlon N, Marion D and Bergot P (1997a). Influence of purified soybean
phospholipids on early development of common carp. Aquaculture International 5,
137–149.
Geurden I, Coutteau P and Sorgeloos P (1997b). Effect of dietary phospholipid
supplementation on growth and fatty acid composition of European sea bass,
Dicentrarchus labrax L. and turbot, Scophthalmus maximus L. juveniles from
weaning onwards. Fish Physiology and Biochemistry 16, 259–272.
Geurden I, Marion D, Charlon N, Coutteau P and Bergot P (1998a) Comparison of different
phospholipidic fractions as dietary supplements for common carp, Cyprinus carpio
larvae. Aquaculture 161, 225-235.
Geurden I, Bergot P, Schwarz L and Sorgeloos P (1998b). Relationship between dietary
phospholipids class composition and neutral lipid absorption in postlarval turbot. Fish
Physiology and Biochemistry 19, 217–228.
Gisbert E, Villeneuve L, ZamboninoInfante JL, Quazuguel P and Cahu CL (2005) Dietary
phospholipids are more efficient than neutral lipids for long chain polyunsaturated
fatty acid supply in European sea bass Dicentrarchus labrax L. development. Lipids
40, 1–10.
González MM, Izquierdo MS, Salhi M, Hernández-Cruz CM and Fernández-Palacios H
(1995) Dietary vitamin E for Sparus aurata larvae. European Aquaculture Society
Special Publication 24 , 239-242.
Govoni JJ, Boehlert GW and Watanabe Y (1986) The physiology of digestion in fish larvae.
Environmental Biology of Fishes 16, 59–77.
Greene DHS and Selivonchick DP (1987) Lipid metabolism in fish. Progress in Lipid
Research 26, 53-85.
Gurr MI and Harwood JL (1991). Lipid Biochemistry. An introduction. 4th
edition. Chapman
and Hall, Londres. pp 407.
Hadas E (1998) The influence of dietary phospholipids on feeding rate and absorption of fatty
acids in the larvae of the gilthead seabream (Sparus aurata). MSc Thesis, Hebrew
University of Jerusalem, Rehovot, Israel.
Hadas E, Koven WM, Sklan D and Tandler A (2003) The effect of dietary
phosphatidylcholine on the assimilation and distribution of ingested free oleic acid
(18:1n-9) in gilthead seabream, Sparus aurata larvae. Aquaculture 217, 577-588.
Hakeda Y, Kawaguchi H, Hand A, Pilbeam C, Hurley M, Abreu C, Kumegawa M and Raisz
LG (1993) Insulin-like growth factor binding protein-5 accumulates in bone matrix
and is released by parathyroid hormone and prostaglandin E. Journal of Bone and
Mineral Research 8, 5237.
Hall BK and Witten PE (2007) Plasticity of and transitions between skeletal tissues in
vertebrate evolution and development. In: Anderson JS and Sues DH (Eds). Major
transactions in vertebrate evolution. Bloominghton Indiana University Press. 56.
Halliwell B and Gutteridge JM (1990) Role of free radicals and catalytic metal ions in human
disease: an overview. Methods in Enzymology 186, 1-85.

References
……………………………………………………………………………………..........
235
Halliwell B and Chirico S (1993) Lipid-peroxidation-its mechanism, measurement and
significance. The American Journal of Clinical Nutrition 57, S715-S725.
Halliwell B and Gutteridge JMC (1996) Lipid peroxidation: a radical chain reaction. In:
Halliwell B and Gutteridge JMC. Free Radicals in Biology and Medicine. Clarendon
Press Oxford. 188-266.
Halliwell B and Gutteridge JMC (1999) Free Radicals in Biology and Medicine. 3rd edn.
Oxford Science Publication, Oxford, NY USA. 1-936.
Halliwell B and Gutteridge JMC (2007) Free Radicals in Biology and Medicine, 4th Ed.
Oxford University Press, New York.
Halver JE (2002a) The vitamins. In: JE Halver, R Hardy (Eds) Fish Nutrition, 2nd
edn.
Academic Press New York NY. 62-132.
Halver JE (2002b) The minerals. In: Halver JE and Hardy RW (Eds). Fish Nutrition, 3rd
edition. Academic Press San Diego. 61-141.
Hamre K and Lie O (1995) Minimum requirement of vitamin E for Atlantic salmon, Salmo
salar L. at first feeding. Aquaculture Research 26, 175-184.
Hamre K, Hjeltnes B, Kryvi H, Sandberg S, Lorentzen M and Lie Ø (1994) Decreased
concentration of hemoglobin, accumulation of lipid oxidation products and
unchanged skeletal muscle in Atlantic Salmon (Salmo salar ) fed low dietary vitamin
E. Fish Physiology and Biochemistry 12 , 421-429.
Hamre K, Berge RK and Lie O (1998) Oxidative stability of Atlantic salmon (Salmo salar L)
fillet enriched in alpha-, gamma- and delta-tocopherol through dietary
supplementation. Food Chemistry 72, 173-178.
Hamre K, Mollan TA, Sæle Ø and Erstad B (2008) Rotifers enriched with iodine and
selenium increase survival in Atlantic cod, Gadus morhua larvae. Aquaculture 284,
190-195.
Hamre K (2011) Metabolism, interactions, requirements and functions of vitamin E in fish.
Aquaculture Nutrition 17, 98-115.
Hamre K, Krossoy C, Lock EJ and Moren M (2010) Roles of lipid – soluble vitamins during
ontogeny of marine fish larvae. Aquaculture Research 41, 745-750.
Hamza N, Mhetli M, Ben Khemis I, Cahu C and Kestemont P (2008) Effect of dietary
phospholipd levels on performance, enzyme activities and fatty acid composition of
pikeperch, Sander lucioperca larvae. Aquaculture, 275, 274-282.
Hardy RW (1989) Diet preparation. In Halver JE (Ed). Fish Nutrition, 2nd edn, Academic
Press, San Diego CA. 476–544.
Henderson RJ (1996) Fatty acid metabolism in freshwater fish with particular reference to
polyunsaturated fatty acids. Arch Tierernahr 49, 5-22.
Henning SJ (1987) Functional development of the gastrointestinal tract. In Johnson LR.
Physiology of the Gastrointestinal Tract, New York: Raven Press. 285–300.

References
……………………………………………………………………………………..........
236
Hilton JW, Hodson PV and Slinger SJ (1980) The requirement and toxicity of selenium in
rainbow trout, Salmo gairdneri. Journal of Nutrition 110, 2527–2535.
Hoehne-Reitan K and Kjørsvik E (2004) Functional development of the liver and exocrine
pancreas. In: J.J. Govoni (Ed). The development of form and function in fishes and the
question of larval adaptation. American Fisheries Society. Symposium 40, Bethesda,
Maryland. 9-36.
Huang C, Lu Z, Ying L and Luhua L (2006) A continuous fluorescence assay for
phospholipase A2 with nontagged lipid. Analytical Biochemistry 351, 11–17.
Hung S and Lutes P (1988) A preliminary study on the non-essentiality of lecithin for
hatchery-produced juvenile white sturgeon (Acipenser transmontanus). Aquaculture
68, 353-360.
Iijima N, Zama K and Kayama M (1983) Effect of the oxidized lipids on the metabolic
pathway of lipid biosynthesis in the intestine of carp, Ciprinus carpio. Nippon Suisan
Gakkaishi 49,1465-1470.
Iijima N, Nakamura M, Uematsu K and Kayama M (1990) Partial purification and
characterization of Phospholipase A2 from the hepatopancreas of red sea bream.
Nippon Suisan Gakkaishi 56, 1331-1339.
lijima N, Tanaka S and Ota Y (1998) Purification and characterization of bile salt-activated
lipase from the hepatopancreas of red seabream, Pagrus major. Fish Physiology and
Biochemistry 18, 59-69.
Ito T (1960). On the culture of the mixohaline rotifer, Brachionus plicatilis O.F. Muller, in
sea water Rep. Fac. Fish prefect. Mie University 3, 708-740.
Izquierdo MS, Watanabe T, Takeuchi T, Arakawa T and Kitajima C (1990) Optimum EFA
levels in Artemia to meet the EFA requirements of red sea bream, Pagrus major. In:
Takeda M and Watanabe T (Eds). The Current Status of Fish Nutrition in
Aquaculture. Tokyo University of Fisheries, Tokyo. 221-232.
Izquierdo MS, Arakawa T, Takeuchi T, Haroun R and Watanabe T (1992) Effect of n-3
HUFA levels in Artemia on growth of larval japanese flounder (Paralichthys
olivaceous). Aquaculture 105, 73-82.
Izquierdo MS (1996) Essential fatty acid requirements of cultured marine fish species.
Aquaculture Nutrition 2 , 183-191.
Izquierdo MS and Fernández-Palacios H (1997) Nutritional requirements of marine fish
larvae and broodstock. Cahiers Options Mediterraneénnes 22, 243–264.
Izquierdo MS and Henderson RJ (1998) The determination of lipase and phospholipase
activities in gut contents of turbot, Scophthalmus maximus by fluorescence-based
assays. Fish Physiology and Biochemstry 19, 153-162.
Izquierdo MS, Socorro J, Arantzamendi L and Hernández-Cruz L (2000) Recent advances in
lipid nutrition in fish larvae. Fish Physiology and Biochemistry 22, 97-107.
Izquierdo MS, Tandler A, Salhi M and Kolkovski S (2001) Influence of dietary polar lipids
quantity and quality on ingestion and assimilation of labelled fatty acids by larval

References
……………………………………………………………………………………..........
237
gilthead seabream. Aquaculture Nutrition 7, 153-160.
Izquierdo MS, Obach A, Arantzamendi L, Montero D, Robaina L and Rosenlund G (2003)
Dietary lipid sources for seabream and seabass: growth performance, tissue
composition and flesh quality. Aquaculture Nutrition 9, 397-407.
Izquierdo MS and Lall S (2004) Experimental design for lipid research. Workshop on
Methodologies in Fish Nutrition Research. Phuket, Thailand.
Izquierdo MS, Montero D, Robaina L, Caballero MJ, Rosenlund G and Ginés R (2005)
Alterations in fillet fatty acid profile and flesh quality in gilthead seabrem, Sparus
aurata fed vegetable oils for a long term period. Recovery of fatty acid profiles by
fish oil feeding. Aquaculture 250, 431-444.
Izquierdo MS (2005) Essential fatty acid requirements in Mediterranean fish species. Cahiers
Options Mediterraneénnes 63, 91–102.
Izquierdo MS and Koven WM (2010) Lipids. In: Holt J. (Ed). Larval Fish Nutrition. Wiley-
Blackwell, John Wiley and Sons Publisher. 47-82
Izquierdo MS, Socorro J and Roo J (2010) Studies on the appearance of skeletal anomalies in
red porgy: effect of culture intensiveness, feeding habits and nutritional quality of
live preys. Journal of Applied Icthyology 26, 320-326.
Izquierdo MS, Scolamachia M, Betancor MB, Roo J, Caballero MJ, Terova G and Witten PE
(2012) Effects of dietary DHA and !-tocopherol on bone development, early
mineralisation and oxidative stress in Sparus aurata (Linnaeus, 1758) larvae. British
Journal of Nutrition doi: 10.1017/S0007114512003935.
Jalali MA, Hosseini SA and Imanpour MR (2008) Effect of vitamin E and highly unsaturated
fatty acid-enriched Artemia urmiana on growth performance, survival and stress
resistance of Beluga (Huso huso) larvae. Aquaculture Research 39, 1286-1291.
Jee WSS and Ma YF (1997) The in vivo anabolic actions of prostaglandins in bone. Bone 21,
297–304.
Jilka RL, Winstein RS, Takahashi K, Parffit AM and Manologas SC (1996) Linkage of
decreased bone mass with impaired osteoblastogenesis in a murine model of
accelerated senescence. Journal of Clinic Investigation 97, 1732-1740.
Johansson L, Gafvelin G and Arnér ESJ (2005) Selenocysteine in proteins – properties and
biotechnological use. Biochimica et Biophysica Acta 1726, 1-13.
Jones DA, Kamurudin MS and Levay L (1993) The potential for replacement of live feeds in
larvae culture. Journal of the World Aquaculture Society 24, 191-210.
Kagan VE, Tyurin VA, Gorbunov NV, Prilipko LL and Chelomin VP (1984) Are changes in
the microviscosity and an asymmetrical distribution of phospholipids in the
membrane necessary conditions for signal transmission? A comparison of the
mechanisms of signal transmission in plasma membranes of brain synaptosomes and
photoreceptor membranes of the retina. Journal of Evolutionary Biochemistry and
Physiology 20, 6–11.
Kanazawa A, Teshima S, Inamori S, Iwashita T and Nagao A (1981) Effect of phospholipids

References
……………………………………………………………………………………..........
238
on growth, survival rate, and incidence of malformation in larval ayu. Memoirs of the
Faculty of Fisheries Kagoshima University, 30, 301–309.
Kanazawa A, Teshima S, Inamori S and Matsubara H (1983a) Effect of dietary phospholipids
on growth of the larval red sea bream and knife jaw. Memoirs of the Faculty of
Fisheries Kagoshima University 32, 109-114.
Kanazawa A, Teshima S, Kobayashi T, Takae M, Iwashita T and Uehara R (1983b) Necessity
of dietary phospholipids for growth of the larval ayu. Memoirs of the Faculty of
Fisheries Kagoshima University 32, 115-120.
Kanazawa A (1983) Effect of phospholipids on aquatic animals. Feed Oil Abstracts 18, 1–5.
Kanazawa A, Teshima S and Sakamoto M (1985) Effects of dietary bonito-egg phospholipids
and some phospholipids on growth and survival of the larval ayu, Plecoglossus
altivelis. Journal of Applied Ichthyology 4, 165–170.
Kanazawa A (1985). Essential fatty acid and lipid requirements of fish. In: Cowey, CB,
Mackie, AM, Bell, JG (Eds). Nutri- tion and feeding in fish. Academic Press,
London. 281-289
Kanazawa A, Koshio S and Teshima S (1989) Growth and survival of larval red sea bream
Pagrus major and Japanese flounder Paralichthys olivaceus fed microbound diets.
Journal of the World Aquaculture Society 20, 31–7.
Kanazawa A (1993) Essential phospholipids of fish and crustaceans. In: Kaushik SJ and
Luquet P (Eds). Fish Nutrition in Practice. IV International Symposium on Fish
Nutrition and Feeding, INRA, France. National Institute for Agricultural Research.
519–530.
Kanazawa K (1991) Hepatotoxicity caused by dietary secondary products originating from
lipid peroxidation. In: Friedman M (Ed). Nutritional and Toxicology Consequences
of Food Processing. Plenum New York. 237–253.
Kanazawa K (1993) Tissue injury induced by dietary products of lipid peroxidation. In:
Corongiu F (Ed.), Free Radicals and Antioxidants in Nutrition. Richelieu Press,
London. 383– 399.
Kawatsu H (1969) Studies on the anemia of fish-III. An example of macrocytic anemia found
in brook trout, Salvelinus fontinalis. Bulletin of the Freshwater Fish Research
Laboratory 19, 161–167.
Kjørsvik E, van der Meeren T, Kryvi H, Arnfinnson J and Kvenseth PG (1991) Early
development of the digestive tract of cod larvae, Gadus morhua L. during start-
feeding and starvation. Journal of Fish Biology 38, 1-15.
Kjørsvik E (2009) Phospholipids vs. neutral lipids: effects on digestive enzymes in Atlantic
cod, Gadus morhua larvae. Aquaculture 272, 502–513.
Kjørsvik E, Olsen C, Wold PA, Hoehne-Reitan K, Cahu CL, Rainuzzo J, Olsen AI, Øie G and
Olsen Y (2009) Comparison of dietary phospholipids and neutral lipids on skeletal
development and fatty acid composition in Atlantic cod, Gadus morhua. Aquaculture
294, 246–255.

References
……………………………………………………………………………………..........
239
Kohlmeier M (2003) Nutrient Metabolism. Academic Press, San Diego, CA, USA. 722- 728.
Kolkovski S, Tandler A, Kissil GW and Gertler A (1993) The effect of dietary exogenous
digestive enzymes on ingestion, assimilation, growth and survival of gilthead
seabream, Sparus aurata L. Fish Physiology and Biochemistry 12 , 203-209.
Kolkovski S, Arieli A and Tandler A (1995) Visual and olfactory stimuli as determining
factors in the stimulation of microdiet ingestion in gilthead seabream Sparus aurata
larvae. In: Lavens P, Jaspers E and Roelants I (Eds). Larvi ’95 – Fish and Shellfish
Symposium, Gent, European Aquaculture Society Special Publication 24, 289–92.
Kolkovski S (2001) Digestive enzymes in fish larvae and juveniles – implications and
applications to formulated diets. Aquaculture 200, 181-201.
Kolkovski S, Curnow J and King J (2004) Intensive rearing system for fish larvae research: I.
marine fish larvae rearing system. Aquacultural Engineering 31, 295–308.
Kolkovski S, Lazo Corvera JP, and Leclercq D (2009) Fish larvae nutrition and diet: new
developments. In: Burnell G and Allan G (Eds). New Technologies in Aquaculture:
Improving Production Efficiency, Quality and Environmental Management.
Woodhead Publishing. Cambridge, UK. 315-369.
Koven W, Barr Y, Lutzky S, Ben-Atia I, Weiss R, Harel M, Behrens P and Tandler A (2001)
The effects of dietary arachidonic acid (20:4n-6) on growth, survival and resistance to
handling stress in gilthead seabream Sparus aurata larvae. Aquaculture 193, 107-122.
Koven WM (2003) Key factors influencing juvenile quality in mariculture: A review. Israeli
Journal of Aquaculture-Bamidgeh 55, 283-297.
Kruger MC, Coetzee M, Haag M and Weiler H (2010) Long-chain polyunsaturated fatty
acids: Selected mechanisms of action on bone. Progress in Lipid Research 49, 438–
449
Lall SP and Bishop FJ (1977) Studies on mineral and protein utilization by Atlantic salmon,
Salmo salar grown in sea water. Fisheries and Marine Service 688, 16.
Lall SP (2002) The minerals. In: Halver JE and Hardy RW (Eds.) Fish Nutrition. Academic
Press, San Diego, CA, USA. 259- 307
Lall SP and Lewis–McCrea LM (2007) Role of nutrients in skeletal metabolism pathology in
fish. Aquaculture 267, 3 – 19.
Lauff M and Hofer R (1984) Development of proteolytic enzymes in fish and the importance
of dietary enzymes. Aquaculture 37, 335–346.
Lazo Corvera JP, Mendoza SR and Holt GJ (2007) Characterization of digestive enzymes
during larval development of red drum, Sciaenops ocellatus. Aquaculture 265, 1-4.
Lemaire P, Viarengo A, Canesi L and Livingstone DR (1993) Pro-oxidant and antioxidant
processes in gas gland and other tissues of cod (Gadus morhua). Journal of
Comparative Physiology 163, 477– 486.
Lewis-McCrea LM and Lall SP (2007) Effects of moderately oxidized dietary lipid and the
role of vitamin E on the development of skeletal abnormalities in juvenile Atlantic

References
……………………………………………………………………………………..........
240
halibut, Hippoglossus hippoglossus. Aquaculture 262, 142-155.
Li Y, Seifert MF, Ney DM, Grahn M, Grant AL and Allen KGD (1999) Dietary conjugated
linoleic acids alter serum IGF-I and IGF binding protein concentrations and reduce
bone formation in rats fed (n-6) or (n-3) fatty acids. Journal of Bone and Mineral
Research. 1114, 1153–1162.
Lie O, Sandvin A and Wagboo R (1993) lnfluence of dietary fatty acids on the lipid
composition of lipoproteins in farmed Atlantic Salmon, Salmo salar. Fish Physiology
and Biochemistry 13, 249-260.
Lied O and Lambertsen G (1982) Apparent availability of fat and individual fatty acids in
Atlantic cod, Gadus morhua. Fiskeri Dir. Skrifter. Ser, Ernaring 2, 63-75.
Lin YH and Shiau SY (2005) Dietary selenium requirement of grouper, Epinephelus
malabaricus. Aquaculture 250, 356-363.
Liou AP, Lu X, Sei Y, Zhao X, Pechhold S, Carrero RJ,Raybould HE, Wank S (2012) The G-
protein-coupled receptor GPR40 directly mediates long-chain fatty acid-induced
secretion of cholecystokinin. Gastroenterology, in press
Little TJ, Russo A, Horowitz M, Meyer JH, Smyth D, Jones KL, Wishart J, Bellon M and
Feinle C (2007) The effects of free fatty acids on gastric emptying, plasma
cholecystokinin (CCK) and peptide YY (PYY), appetite and energy intake in humans
are more potent than those of triglycerides. Appetite 49, 308.
Liu J, Caballero MJ, El-Sayed Ali T, Izquierdo MS, Hernandez Cruz CM, Valencia A, and
Fernandez-Palacios H (2002) Effect of dietary lecithin and eicosapentaenoic acid on
growth, survival, stress resistance and lipid transport in gilthead seabream, Sparus
aurata. Fisheries Science 6, 1165-1172.
Livingstone DR (2003) Oxidative stress in aquatic organism in relation to pollution and
agriculture. Revue de Medecine Veterinaire 154, 427–430.
López-Alvarado J, Langdon CJ, Teshima SI and Kanazawa A (1994) Effects of coating and
microencapsulation of crystalline amino acids on leaching in larval feeds.
Aquaculture 122, 335-346.
Lykidis A (2007). Comparative genomics and evolution of eukaryotic phospholipid
biosynthesis. Progress in Lipid Research 46, 171–199.
Machlin LJ (1984) Vitamin E. In: Machlin, L.J. (Ed.), Handbook of Vitamins. Marcel
Dekker, New York, pp. 99– 145.
Machlin LJ and Bendich A (1987) Free radical tissue damage, protective role of antioxidant
nutrients. Federation of American Societies for Experimental Biology Journal 1, 441-
445.
MacQueen Leifson R, Homme JM, Lie Ø, Myklebust R and Strøm T (2003) Three different
lipid sources in formulated start feeds for turbot, Scophthalmus maximus L. larvae,
effect on growth and mitochondrial alteration in enterocytes. Aquaculture 1, 33–42.
Matés JM (2000) Effects of antioxidant enzymes in the molecular control of reactive oxygen
species toxicology. Toxicology 153, 83–104.

References
……………………………………………………………………………………..........
241
McCarthy TL, Centrella M, Raisz LG and Canalis E (1991) Prostaglandin E2 stimulates
insulin-like growth factor I synthesis in osteoblast-enriched cultures from fetal rat
bone. Endocrinology 128, 2895–900.
McCarthy TL, Casinghino S, Centrella M and Canalis E (1994) Complex pattern of
insulinlike growth factor binding protein expression in primary rat osteoblast
enriched cultures: regulation by prostaglandin E2, growth hormone, and the insulin-
like growth factors. Journal of Cell Physiology 160, 163–75.
McCord JM and Fridovich I (1969) Superoxide dismutase: an enzymic function for
erythrocuprein. Journal of Biological Chemistry 244, 6049–6055.
Monteiro DA, Rantin FT and Kalinin AL (2009) The effects of selenium on oxidative stress
biomarkers in the freshwater characid fish matrinxa, Brycon cephalus exposed to
organophosphate insecticide Folisuper 600 BRw (methyl parathion). Comparative
Biochemistry and Physiology 149, 40–49.
Montero D, Tort L, Izquierdo MS, Socorro J, Robaina L, Vergara JM and Fernández-Palacios
H (1996) Effect of alphatocopherol and n - 3 HUFA deficient diets on blood cells,
selected immune parameters and proximate body composition of gilthead seabream
(Sparus aurata). In: Modulators of Immune Response. The Evolutionary Trail
(Stolen, J.S., Fletcher, T.C., Bayne, C.J., Secombes, C.J., Zelikoff, J.L., Twerdock,
L., & Anderson D.P., eds.) pp. 251–266. S.O.S. Publications, Fair Haven.
Montero D, Tort L, Izquierdo MS, Robaina L and Vergara JM (1998) Depletion of serum
alternative complement pathway activity in gilthead seabream caused by !-tocopherol
and n-3 HUFA dietary deficiencies. Fish Physiology and Biochemistry 18, 399–407.
Montero D, Tort L, Robaina L, Vergara JM and Izquierdo MS (2001) Low vitamin E in diet
reduces stress resistance of gilthead seabream, Sparus aurata juveniles. Fish and
Shellfish Immunology 11, 473-490.
Morais S, Koven W, Rønnestad I, Dinis MT and Conceicao LEC (2005) Dietary protein:lipid
ratio and lipid nature affects fatty acid absorption and metabolism in a teleost larva.
British Journal of Nutrition 93, 813–820.
Morais S, Torten M, Nixon O, Lutzky S, Conceição LEC, Dinis MT, Tandler A and Koven W
(2006) Food intake and absorption are affected by dietary lipid level and lipid source
in seabream, Sparus aurata larvae. Journal of Experimental Marine Biology
and Ecology 331, 51–63.
Mourente G, Diaz-Salvago E, Bell JG and Tocher DR (2002) Increased activities of hepatic
anti-oxidant defence enzymes in juvenile gilthead sea bream, Sparus aurata L. fed
dietary oxidised oil: attenuation by dietary vitamin E. Aquaculture 214, 343–361.
Moyad MA (2005) An introduction to dietary/supplemental omega-3 fatty acids for general
health and prevention: Part I. Society of Urologic Oncology 23, 28–35.
Moyano FJ, Díaz M, Alarcón FJ and Sarasquete MC (1996) Characterization of digestive
enzyme during larval development of gilthead seabream Sparus aurata. Fish
Physiology and Biochemistry 2, 121-130.
Murai T and Andrews JW (1974) Interactions of dietary !-tocopherol, oxidized menhaden oil
and ethoxyquin on channel catfish, Ictalurus punctatus. Journal of Nutrition 104,

References
……………………………………………………………………………………..........
242
1416-1431.
Nishida Y (2011) The chemical process of oxidative stress by copper (II) and iron (III) ions in several neurodegenerative disorders. Monatshefte fur Chemie 142, 375–384.
Nishimoto NK, Waite JH and Kriwacki RW (2003) Structure, activity, and distribution of fish osteocalcin. Journal of Biology and Chemistry 278, 11843-11848.
Nordivick K (2007). From notochord to vertebral column: studies on Atlantic salmon, Salmo
salar L. Ph. D. Thesis. University of Bergen, Norway, pp 25.
NRC (Nacional Research Council) (1993) Nutrient requirements of fish. National Academy
Press, Washington DC, 62-63.
Olsen RE and Ringø E (1997) Lipid digestibility in fish: a review. Recent Research
Development in Lipid Research 1, 199–265.
Olsen RE and Henderson RJ (1989) The rapid analysis on neutral and polar marine lipids using double development HPTLC and scanning densitometry. Journal of
Experimental Marine Biology and Ecology 129, 189-197.
Olsen RE, Henderson RJ, Ringø E (1998) The digestion and selective absorption of dietary fatty acids in Arctic charr, Salvelinus alpinus. Aquaculture Nutrition 4, 13–21.
Olsvik PA, Torestensen BE, Hemre GI, Sanden M and Waagbo R (2011) Hepatic oxidative stress in Atlantic salmon, Salmo salar L. transferred from a diet based on marine feed ingredients to a diet based on plant ingredients. Aquaculture Nutrition 17, 424-436
Önal U and Langdon C (2004) Lipids spray beads for delivering of riviflavin to first-feeding fish larvae. Aquaculture 233, 477-493.
Ono H and Iijima N (1998) Purification and characterization of phospholipase A2 isoforms from the hepatopancreas of red sea bream, Pagrus major. Fish Physiology and
Biochemistry 18, 135–147.
Ortuño J, Esteban MA and Meseguer J (2000) High dietary intake of !-tocopherol acetate enhances the non-specific immune response of gilthead sea bream, Sparus aurata L. Fish and Shell fish Immunology 10, 293-307.
Ozkizilcik S, Fu-Lin C and Place AR (1996) Ontogenetic changes of lipolytic enzymes in striped bass (Morone saxatilis). Comparative Biochemistry and Physiology 13, 631-637.
Parhami F (2003) Possible role of oxidized lipids in osteoporosis: could hyperlipidemia be a risk factor? Prostaglandins, Leukotrienes and Essential Fatty Acid 68, 373- 378.
Patton JA, Nevenzel JC and Benson AA (1975) Specificity of digestive lipases in hydrolysis of wax esters and triglycerides studied in anchovy and other selected species. Lipids 10, 575–583.
Paul BN, Sarkar S and Mohanty SN (2004) Dietary vitamin E requirement of mrigal, Cirrhinus mrigala fry. Aquaculture 242, 529-536.

References
……………………………………………………………………………………..........
243
Penglase S, Nordgreen A, van der Meeren T, Olsvik PA, Sæle Ø, Sweetman JW, Baeverfjord
G, Helland S and Hamre K (2010) Increasing the level of selenium in rotifers
Brachionus plicatlis “Cayman” enhances the mRNA expression and activity of
glutathione peroxidase in cod, Gadus morhua L. larvae. Aquaculture 306, 259-269.
Person Le Ruyet J, Alexandre JC, Thébaud L and Mugnier C (1993) Marine fish larvae
feeding: Formulated diets or live prey? Journal of the World Aquaculture Society 24,
211-224.
Pirini M, Gatta PP, Testi S, Trigari G and Monetti PG (2000) Effect of refrigerated storage on
muscle lipid quality of sea bass, Dicentrarchus labrax L. fed on diets containing
different levels of vitamin E. Food Chemistry 68, 289-293.
Poston HA (1990a) Performance of rainbow trout fry fed supplemental soy lecithin and
choline. Progress in Fish Culture 52, 218-225.
Poston HA (1990b) Effect of body size on growth, survival and chemical composition of
Atlantic salmon fed soy lecithin and choline. Progress in Fish Culture 52, 226-230.
Poston HA (1991) Response of Atlantic salmon fry to feed-grade lecithin and choline.
Progress in Fish Culture 53, 224-228.
Pousão-Ferreira P, Santos P, Carvalho AP, Morais S and Narciso L (2003) Effect of an
experimental microparticulated diet on the growth, survival and fatty acid profile of
gilthead seabream, Sparus aurata L. larvae. Aquaculture International 11, 491-504.
Putnam ME and Comben M (1987) Vitamin E. Veterinary Records 121, 541-545.
Radi AAR and Markovics B (1988) Effects of metal ions on the antioxidant enzyme
activities, proteins contents and lipid peroxidation of carp tissues. Comparative
Physiology and Biochemistry 90C, 69– 72.
Rainuzzo JR, Reitan KI and Olsen Y (1997) The significance of lipids at early stages of
marine fish: a review. Aquaculture 155, 103–115.
Raisz LG (1993) Bone cell biology: new approaches and unanswered questions. Bone and
Mineral Research 8, 57–65.
Rando TA (2002) Oxidative stress and the pathogenesis of muscular dystrophies. American
Journal of Physical Medicine and Rehabilitation 81, 175-186.
Ribeiro L, Zambonino-Infante JL, Cahu CL and Dinis MT (1999) Development of digestive
enzymes in larvae of Solea senegalensis, Kaup 1858. Aquaculture 179, 465–473.
Rider SA, Davies SJ, Jha AN, Clough R and Sweetman JW (2010) Bioavailability of co-
supplemented organic and inorganic zinc and selenium sources in white fishmeal-
based rainbow trout, Oncorhynchus mykiss diet. The Journal of Animal
Physiology and Animal Nutrition 94, 99–110.
Rinchard J, Czesny S, Dabrowski K (2007). Influence of lipid class and fatty acid deficiency
on survival, growth, and fatty acid composition in rainbow trout juveniles.
Aquaculture 264, 363–371.
Rojas-García CR and Rønnestad I (2002) Cholecystokinin and tryptic activity in the gut and
References
……………………………………………………………………………………..........
244
body of developing Atlantic halibut larvae: evidence for participation in the
regulation of protein digestion. Journal of Fish Biology 61, 973–986.
Romano R, Bayer TM and Moroder L (2003) Lipophilic derivatization and its effect on the
interaction of cholecystokinin (CCK) nonapeptide with phospholipids. Biochimica et
Biophysica Acta 2, 111-119.
Roo J, Hernández-Cruz CM, Fernández-Palacios H and Izquierdo MS (2005) Development of
skeletal deformities in gilthead seabream, Sparus aurata reared under different larval
culture and dietary conditions. In: Hendry CI, Van Stappen G, Wille M and Sorgeloos
P (Eds). Larvi’05-Fish and Shellfish Larviculture Symposium. European Aquaculture
Society 36, 441-444.
Rosenlund G, Stoss J and Talbot C (1997) Co-feeding marine fish larvae with inert and live
diets. Aquaculture 155, 183-191.
Rotllant G, Moyano FJ, Andrés M, Díaz M, Estévez A and Gisbert E (2008) Evaluation of
fluorogenic substrates in the assessment of digestive enzymes in a decapod
crustacean Majabrachydactyla larvae. Aquaculture 282, 90–96.
Rudneva II (1997) Blood antioxidant system of Black Sea elasmobranch and teleost.
Comparative Biochemistry and Physiology 118, 255-260.
Ruff N, FitzGerald RD, Cross TF, Hamre K and Kerry JP (2003) The effect of dietary
vitamin E and C level on market-size turbot, Scophthalmus maximus fillet quality.
Aquaculture Nutrition 9, 91-103.
Ruff N, Fitzgerald RD, Cross TF and Kerry JP (2004) Comparative composition and shelf-
life of of fillets of wild and cultured turbot (Scophtalmus maximus) and Atlantic
halibut (Hippoglossus hippoglossus). Aquaculture International 10, 241-256.
Saito H, Lund-Katz S and Phillips MC (2004). Contributions of domain structure and lipid
interaction to the functionality of exchangeable human apolipoproteins. Lipid
Research 43, 350-80
Sakai T, Murata H, Endo M, Yamauchi K, Tabata N and Fukudome M (1989) 2-
Thiobarbituric acid values and contents of ! -tocopherol and bile pigments in the liver
and muscle of jaundiced yellowtail, Seriola quinqueradiata. Agricultural and
Biological Chemistry 53, 1739-1740.
Salari P, Rezaie A, Larijani B and Abdollahi M (2008) A systematic review of the impact of
n-3 fatty acids in bone health and osteoporosis. Medical Science Monitor 14, RA37–
44.
Saleh R, Betancor MB, Roo J, Benítez-Santana T, Hernandez-Cruz CM, Moyano, FJ and
Izquierdo MS (2012a) Optimum krill phospholipids contents in microdiets for
gilthead seabream, Sparus aurata larvae. Aquaculture Nutrition doi: 10.1111/j.1365-
2095.
Saleh R, Betancor MB, Roo J, Hernández-Cruz CM, Moyano FJ and Izquierdo MS (2012b).
Optimum soybean lecithin contents in microdiets for gilthead seabream, Sparus
aurata larvae. Aquaculture Nutrition doi: 10.1111/anu.12009.
Saleh R, Betancor MB, Roo J, Benítez-Dorta V, Zamorano MJ and Izquierdo M. Effect of

References
……………………………………………………………………………………..........
245
krill phospholipids vs soybean lecithin in microdiets for gilthead seabream (Sparus
aurata) larvae on molecular markers of antioxidative metabolism and bone
development. Aquaculture Nutrition submitted.
Salhi M, Izquierdo MS, Hernández-Cruz CM, Socorro J and Fernández-Palacios H (1997)
The improved incorporation of polyunsaturated fatty acids and changes in liver
structure in larval gilthead seabream fed on microdiets. Journal of Fish Biology 51,
869 – 879.
Salhi M, Hernández-Cruz CM, Bessonart M, Izquierdo MS and Fernández-Palacios H (1999)
Effect of different dietary polar lipid levels and different n-3 HUFA content in polar
lipids on gut and liver histological structure of gilthead sea bream, Sparus aurata
larvae. Aquaculture, 179, 253–263.
Sandel E, Nixon O, Lutzky S, Ginsbourg B, Tandler A, Uni Z and Koven W (2010) The
effect of dietary phosphatidylcholine/phosphatidylinositol ratio on malformation in
larvae and juvenile gilthead sea bream, Sparus aurata. Aquaculture 304, 42–48.
Sanderson IR and Naik S (2000) Dietary regulation of intestinal gene expression. Annual
Reviews Nutrition 20, 311–338.
Sargent JR, Henderson RJ and Tocher DR (1989) Lipids. In: Halver JE(ed). Fish Nutrition
2nd ed, Academic Press, New York.153-218.
Sargent JR, McEvoy LA and Bell JG (1997) Requirements, presentation and sources of
polyunsaturated fatty acids in marine fish larval feeds. Aquaculture 155, 117-127.
Sargent JR, Bell JG, McEvoy L, Tocher DR and Estevez A (1999) Recent developments in
the essential fatty acid nutrition of fish. Aquaculture 177, 191–200.
Sargent JR, Tocher DR and Bell JG (2002) The lipids. In: Halver JE and Hardy RW (Eds).
Fish Nutrition, 3rd ed. Academic Press, San Diego. 181–257.
Scaife JR, Onibi GE, Murray I, Fletcher TC and Houlihan DF (2000) Influence of !
tocopherol acetate on the short- and long-term storage properties of fillets from
Atlantic salmon, Salmo salar fed a high lipid diet. Aquaculture Nutrition 6, 65-71.
Schmid C, Schläpfer I, Waldvogel M, Zapf J and Froesch ER (1992) Prostaglandin E2
stimulates synthesis of insulin-like growth factor binding protein-3 in rat bone cells in
vitro. Bone and Mineral Research 7,1157–63.
Schwarz K and Foltz CM (1957) Selenium as an integral part of factor 3 against dietary
necrotic liver degeneration. Journal of the American Chemical Society 79, 3292-
3293.
Seiliez I, Bruant JS, Zambonino-Infante JL, Kaushik S and Bergot P (2006) Effect of dietary
phospholipid levels on the development of gilthead sea bream, Sparus aurata larvae
fed a compound diet. Aquaculture Nutrition 12, 372-378.
Sen CK (1995) Oxygen toxicity and antioxidants: state of the art. Indian Journal of
Physiology and Pharmacology 39, 177-196.
Simes DC, Viegas CB, Williamson MK, Price PA, Cancela L (2008) Purification of matrix
Gla protein and osteocalcin from the adriatic sturgeon (Acipencer naccarii), an

References
……………………………………………………………………………………..........
246
ancient bony fish with a cartilaginous endoskeleton. Bone 42, S65.
Sheridan MA (1988) Lipid dynamics in fish: aspects of absorption, transportation, deposition and mobilization. Comparative Biochemistry Physiology 4, 679-690.
Sies H (1985) Oxidative stress: introductory remarks. In: Sies H (Ed). Oxidative stress. Academic Press, London 1–8.
Sire MF and Vernier JM (1981) Étude ultrastructurale de la synthese de chylomicrons au cours de I'absorption intestinale des lipids chez la Truite. Influence de la nature des acides gras ingérés. Biology of the Cell 40, 47-62.
Smith EL, Hill R, Lehman IR, Lefkowitz RJ, Handler P and White A (1983) Principles of
Biochemistry: General Aspects. McGraw and Hill, Singapore 886.
Sun D, Krishnan A, Zaman K, Lawrence R, Bhattacharya A and Fernandes G (2003) Dietary n-3 fatty acids decrease osteoclastogenesis and loss of bone mass in ovariectomized mice. Bone and Mineral Research 18, 1206–1216.
Sutton J, Balfry S, Higgs D, Huang CH and Skura B (2006) Impact of iron-catalyzed dietary lipidperoxidation on growth performance, general health and flesh proximate and fatty acid composition of Atlantic salmon, Salmo salar L. reared in seawater. Aquaculture 257, 534-557.
Stéphan G, Guillaume J and Lamour F (1995) Lipid peroxidation in turbot Scophtalmus maximus tissue: effect of dietary vitamin E and dietary n-6 or n-3 polyunsaturated fatty acids. Aquaculture 130 , 251-268.
Tacon AGJ (1991) Standard Methods for the Nutrition and Feeding of Farmed Fish and Shrimp. The Essential Nutrients, Vol. 1. Argent Laboratories Press, Washington.
Takeuchi T (1997) Essential fatty acid requirements of aquatic animals with emphasis on fish larvae and fingerlings. Review in Fisheries Science 5, 1-25.
Takeuchi T, Arakawa T, Satoh S and Watanabe T (1992) Supplemental effect of phospholipids and requirement of eicosapentaenoic acid and docosahexaenoic acid of juvenile striped jack. Nippon Suisan Gakkaishi 58, 707–713.
Tinggi U (2003) Essentiality and toxicity of selenium and its status in Australia: a review. Toxicology Letters 137, 103–110.
Tocher DR and Harvie DG (1988) Fatty acid compositions of the major phosphoacylglycerols from fish neural tissues; n-3 and n-6 polyunsaturated fatty acids in rainbow trout (Salmo gairdneri) and cod (Gadus morhua) brains and retinas. Fish Physiology and
Biochemistry 5, 229-239.
Tocher DR (1995) Glycerophospholipid metabolism. In: Hochachka PW and Mommsen TP (Eds). Biochemistry and Molecular Biology of Fishes. Metabolic and Adaptational Biochemistry, vol. 4. Elsevier Press, Amsterdam 119–157.
Tocher DR, Mourente G, Van der Eecken A, Evjemo JO, Díaz E, Bell JG, Geurden I, Lavens P and Olsen Y (2002) Effects of dietary vitamin E on antioxidant defence mechanisms of juvenile turbot, Scophtalmus maximus, halibut, Hippoglossus
hippoglossus L. and sea bream, Sparus aurata. Aquaculture Nutrition 8, 195-207.

References
……………………………………………………………………………………..........
247
Tocher DR (2003) Metabolism and functions of lipids and fatty acids in teleost fish. Reviews
in Fisheries Science 11, 107-184.
Tocher DR, Bendiksen E, Campbell PJ and Bell JG (2008) The role of phospholipids in
nutrition and metabolism of teleost fish. Aquaculture 280, 21–34.
Tou JC, Jaczynski J and Chen YC (2007) Krill for human consumption: nutritional value and
potential health benefits. Nutrition Reviews 65, 63-77.
Traber MG and Parker L (1995) Vitamin E: beyond antioxidant function. The American
Journal of Clinical Nutrition 62, 1505-1509.
Ueberschär B (1993) Measurement of proteolytic enzyme activity: significance and
application in larval fish research. In: Walther BT and Fyhn HJ (Eds). Physiological
and Biochemical Aspects of Fish Development. University of Bergen, Norway 233-
237.
UNEP/MAP/MED POL (2004) Mariculture in the Mediterranean. MAP Technical reports
series n° 140, UNEP/MAP, Athens.
Van Der Meeren T, Olsen RE, Hamre K and Fyhn HJ (2008) Biochemical composition of
copepods for evaluation of feed quality in production of juvenile marine fish.
Aquaculture 274, 375–397.
Vandewalle P, Gluckmann I and Wagemans F (1998) A critical assessment of the alcian
blue/alizarin double staining in fish larvae and fry. Belgian Journal of Zoology 128,
93-95.
Verreth J (1994) Nutrition and related ontogenetic aspects in larvae of the african catfish,
Clarias gariepinus. PhD Thesis, Wageningen Agricultural University, The
Netherlands, 205 pp. In: Planas M and Cunha I (1999) Larviculture of marine fish:
problems and perspectives. Aquaculture 177, 171–190.
Villeneuve L, Gisbert E, Le Delliou H, Cahu CL and Zambonino-Infante J (2006) Intake of
highlevels of vitamin A and polyunsaturated fatty acids during different
developmental periods modifies the expression of morphogenesis genes in European
sea bass (Dicentrarchus labrax ). British Journal of Nutrition 95, 677-687.
Walford J, Lim TM and Lam TJ (1991) Replacing live finds with microencapsulated dietsin
the rearing of seabass (Lates calcarifer) larvae: do the larvae ingest and digest
protein-membrane microcapsules? Aquaculture 92, 225-235.
Walford J and Lam TJ (1993) Development of digestive tract and proteolytic enzyme activity
in sea bass, Lates calcarifer larvae and juveniles. Aquaculture 109, 187–205.
Wang C and Lovell RT (1997) Organic selenium sources, selenomethionine and selenoyeast,
have higher bioavailability than an inorganic selenium source, 246 sodium selenite, in
diets for channel catfish, Ictalurus punctatus. Aquaculture 152, 223-234.
Wang Z, Mai K, Liufu Z, Ma H, Xu W, Ai Q, Zhang W, Tan B and Wang X (2006) Effect of
high dietary intakes of vitamin E and n-3 HUFA on immune responses and resistance
to Edwarsiella tarda in Japanese flounder (Paralichthys olivaceous). Aquaculture
Research 37, 681-692.

References
……………………………………………………………………………………..........
248
Watanabe T, Takashima F, Ogino C and Hibiya T (1970) Effect of !-tocopherol on carp.
Nippon Suisan Gakkaishi 36, 623–630.
Watanabe T, Takeuchi T, Matsui M, Ogino C and Kawabata T (1977) Effect of atocopherol
deficiency on carp: VII. The relationship between dietary levels of linoleate and a-
tocopherol requirement. Bulletin of the Japanese Society for the Science of Fish. 43,
935– 946.
Watanabe T (1982) Lipid nutrition in fish. Comparative Biochemistry and Physiology 73 , 3-
15.
Watanabe T, Kitajima C and Fujita S (1983) Nutritional value of live organisms used in Japan
for mass propagation of fish: a review. Aquaculture 34, 115–143.
Watanabe T, Takeuchi T, Saito M and Nishimura K (1984) Effect of low protein-high caloric
or essential fatty acids deficiency in diet on reproduction of rainbow trout. Bulletin of
the Japanese Society of Science in Fisheries 50, 1207-1215.
Watanabe T and Kiron V (1994). Prospects in larval fish dietetics, Aquaculture 124, 223–251.
Watkins BA and Seifert MF (2000) Conjugated linoleic acid and bone biology. Journal of the
American College of Nutrition 19, 478S–486S.
Watkins BA, Li Y, Lippman HE and Feng S (2003) Modulatory effect of omega-3
polyunsaturated fatty acids on osteoblast function and bone metabolism.
Prostaglandins Leukot Essent Fatty Acids 68, 387–398.
Watkins BA, Li Y and Seifert MF (2006) Dietary ratio of n"6/n"3 PUFAs and
docosahexaenoic acid: actions on bone mineral and serum biomarkers in
ovariectomized rats. Journal of Nutritional Biochemistry 17, 282–289.
Wdzieczak J, Zalesna G, Wujec E and Peres G (1982) Comparative studies on superoxide
dismutase, catalase and peroxidase levels in erythrocytes and livers of different
freshwater and marine fish species. Comparative Biochemistry and Physiology 73B,
361– 365.
Wilson RP, Bowser PR and Poe WE (1984) Dietary vitamin E requirement of fingerling
channel catfish. Journal of Nutrition 114, 2053-2058.
Winston GW and Di Giulio RT (1991) Prooxidant and antioxidant mechanisms in aquatic
organisms. Aquatic Toxicology 19, 137–161.
Wold PA, Hoehne-Reitan K, Cahu CL, Zambonino Infante JL, Rainuzzo J and Kjørsvik E
(2007) Phospholipids vs. neutral lipids: effects on digestive enzymes in Atlantic cod,
Gadus morhua larvae. Aquaculture 272, 502–513.
Xu H, Watkins BA and Seifert MF (1995) Vitamin E stimulates trabecular bone formation
and alters epiphyseal cartilage morphometry. Calcified Tissue International 57, 293-
300.
Yildiz M (2004) The study of fillet quality and the growth performance of rainbow trout,
Oncorhynchus mykiss fed with diets containing different amounts of vitamin E.
Turkish Journal of fisheries and Aquatic Sciences 4, 81-86.

References
……………………………………………………………………………………..........
249
Yu BP (1994) Cellular defenses against damage from reactive oxygen species. Physiological
Reviews 74, 139-162.
Yúfera M and Pascual E (1984) Influencia de la dieta sobre la puesta del rotifero Brachionus
plicatilis en cultivo. Investigación Pesquera 48, 549-556.
Yúfera M, Parra G, Santiago R and Carrascosa M (1999) Growth, carbon, nitrogen and caloric
content of Solea senegalensis Kaup (Pisces, Soleidae) from egg fertilization to
metamorphosis. Marine Biology 134, 43-49.
Zambonino-Infante JL and Cahu CL (1999) High dietary lipid levels enhance digestive tract
maturation and improve Dicentrarchus labrax larval development. Journal of
Nutrition 129, 1195–1200.
Zambonino-Infante JL and Cahu CL (2001) Ontogeny of the gastrointestinal tract of marine
fish larvae. Comparative Biochemistry and Physiology 130, 477–487.
Zambonino-Infante JL and Cahu CL (2007) Dietary modulation of some digestive enzymes
and metabolic processes in developing marine fish: applications to diet formulation.
Aquaculture 268, 98–105.
Zhang H, Mu Z, Xu L, Xu G, Liu M and Shan A (2009) Dietary lipid level induced
antioxidant response in Manchurian trout, Brachymystax lenok (Pallas) larvae. Lipids
44, 643–654.
Zhang X, Schwartz EM, Young DA, Puzas JE, Rosier RN and O’Keefe RJ (2002)
Cyclooxygenase-2 regulates mesenchymal cell differentiation into the osteoblast
lineage and is critically involved in bone repair. Journal of Clinical Investigation 109,
1405–15.

University of Las Palmas of Gran Canaria,
Spain 2013