Range and Optimum Growth Concentrations of Phosphate ...
76
Eastern Illinois University e Keep Masters eses Student eses & Publications 1972 Range and Optimum Growth Concentrations of Phosphate and Nitrate for Chlamydomonas reinhardtii omas E. Hill Eastern Illinois University is research is a product of the graduate program in Zoology at Eastern Illinois University. Find out more about the program. is is brought to you for free and open access by the Student eses & Publications at e Keep. It has been accepted for inclusion in Masters eses by an authorized administrator of e Keep. For more information, please contact [email protected]. Recommended Citation Hill, omas E., "Range and Optimum Growth Concentrations of Phosphate and Nitrate for Chlamydomonas reinhardtii" (1972). Masters eses. 3934. hps://thekeep.eiu.edu/theses/3934
-
Upload
khangminh22 -
Category
Documents
-
view
0 -
download
0
Transcript of Range and Optimum Growth Concentrations of Phosphate ...
Eastern Illinois UniversityThe Keep
Masters Theses Student Theses & Publications
1972
Range and Optimum Growth Concentrations ofPhosphate and Nitrate for ChlamydomonasreinhardtiiThomas E. HillEastern Illinois UniversityThis research is a product of the graduate program in Zoology at Eastern Illinois University. Find out moreabout the program.
This is brought to you for free and open access by the Student Theses & Publications at The Keep. It has been accepted for inclusion in Masters Thesesby an authorized administrator of The Keep. For more information, please contact [email protected].
Recommended CitationHill, Thomas E., "Range and Optimum Growth Concentrations of Phosphate and Nitrate for Chlamydomonas reinhardtii" (1972).Masters Theses. 3934.https://thekeep.eiu.edu/theses/3934

PAPER CERTIFICATE #2
TO: Graduate Degree Candidates who have written formal theses.
SUBJECT: Permission to reproduce theses.
The University Library is receiving a number of requests from other
institutions asking permission to reproduce dissertations for inclusion
in their library holdings. Although no copyright laws are involved, we
feel that professional courtesy demands that permission be obtained from the author before we allow theses to be copied.
Please sign one of the following statements:
Booth Library of Eastern Illinois University has my permission to lend
my thesis to a reputable college or university for the purpose of copying
it for inclusion in that institution's library or research holdings.
{{11-J . ilte I Cf7 2
I respectfully request Booth Library of Eastern Illinois University not
allow my thesis be reproduced because ����������������
Date Author
pdm
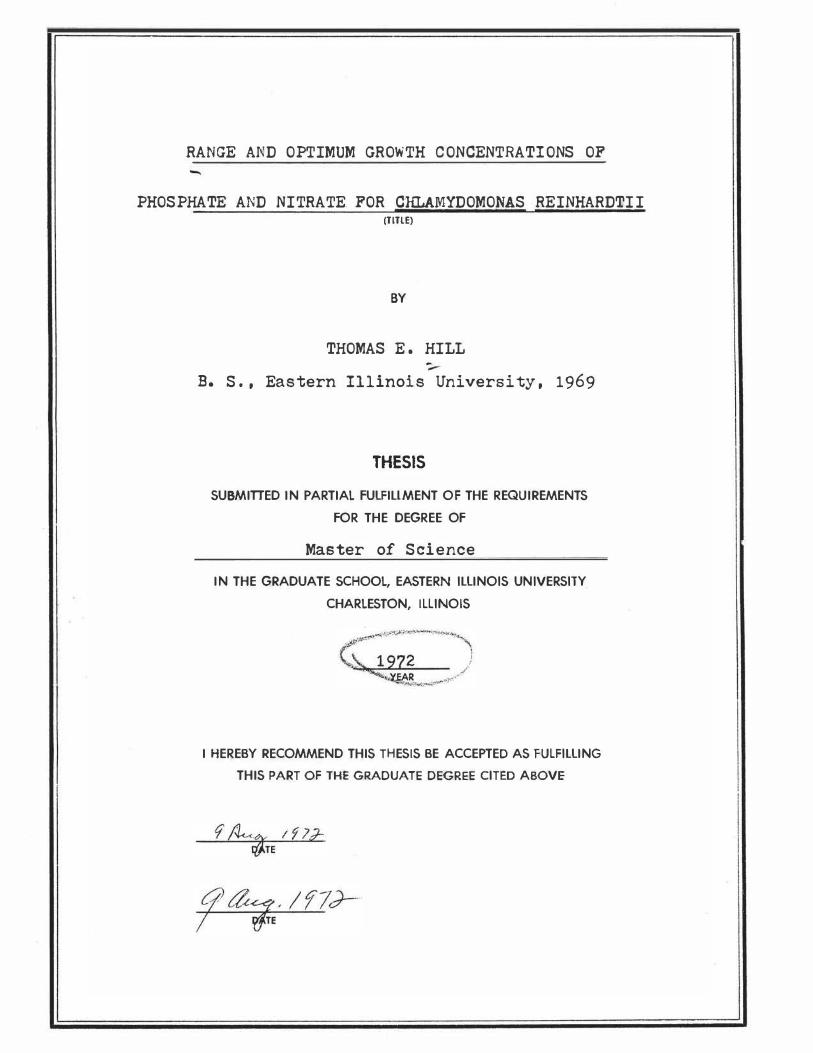
RANGE AND OPTIMUM GROWTH CONCENTRATIONS OF
PHOSPHATE AND NITRATE. FOR Clil.,AMYDOMONAS REINHARDTII (TITLE)
BY
THOMAS E. HILL
B. S., Eastern Illinois University, 1969
THESIS
SUBMITIED IN PARTIAL FULFILLMENT OF THE REQUIREMENTS
FOR THE DEGREE OF
Master of Scrience
IN THE GRADUATE SCHOOL, EASTERN ILLINOIS UNIVERSITY
CHARLESTON, ILLINOIS
I HEREBY RECOMMEND THIS THESIS BE ACCEPTED AS FULFILLING
THIS PART OF THE GRADUATE DEGREE CITED ABOVE

ABSTRACT
A study was conducted on the alga Chlamydomonas
reinhardtii to determine the range and optimum growth
concentrations of phosphate and nitrate. There are only
a few species of algae for which this type of data is
known. Inorganic nutriti9nal data is basic to the under
standing of the complexities of p�ytoplankton ecology and
eutrophicati on.
The "plus" strain of this heterothallic alga was
cultured in a TRIS-buffered inorganic medium with various
concentrations of sodium phosphate and potassium nitrate
and adjusted to a pH of 7.4. The axenic cultures were
evaluated at the end �f 6 days with a spectrophotometer ,
at a wavelength of 645 millimicrons. An environmental
chamber adjusted to 12 hours day/night length and illumi
nation . of 1 ,400 footcandles at 22°0 was employed in the
study. Tne phosphate range of growth was 0.07 to J , 200
ppm P04 with optimum growth from J to 950 ppm P04. The
nitrate range of growth was 2 to 9,700 ppm NO) with opti
mum growth from 33 to 5 , 000 ppm N03• These data confirm
earlier work which indicated that this organism is very
tolerant of organic pollution. This alga has high nutri
ent requirements for survival and optimum growth com-
pared to other algae.
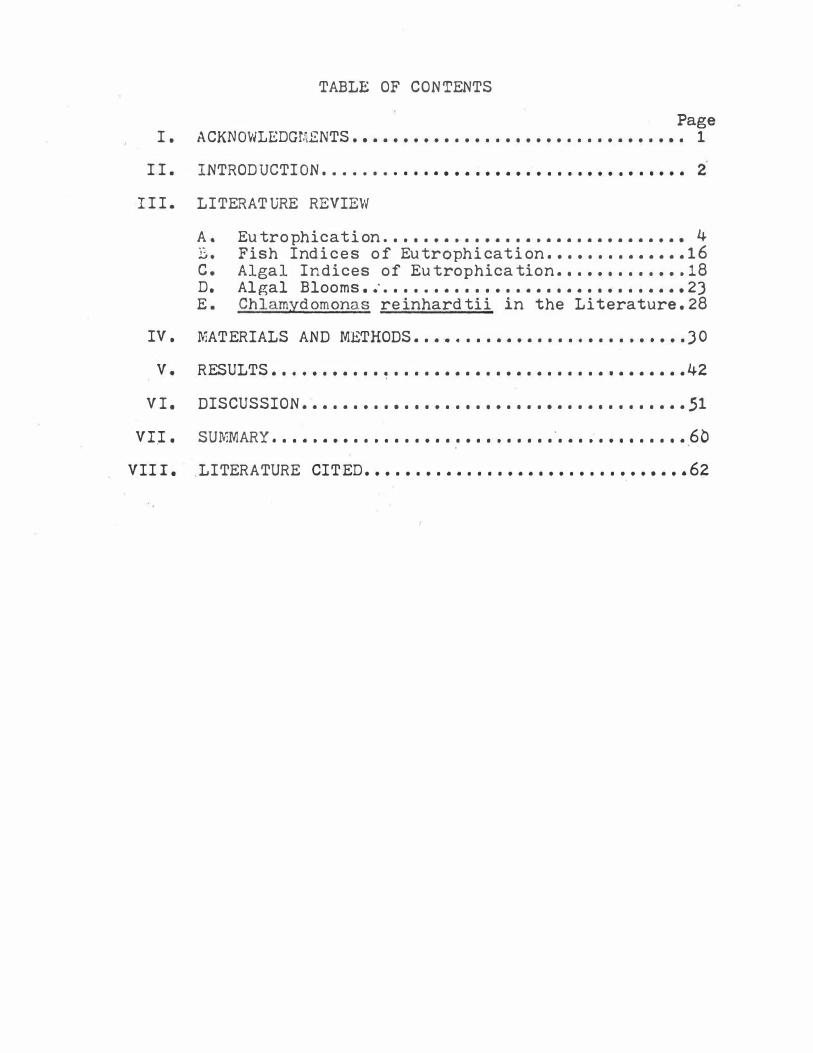
TABLE OF CONTENTS
Page I . ACKNOWLEDG�ENTS••••••••••••••••••••••••••••••••• 1
I I .
I I I .
INTRODUCTION • . . . . • . • • • • • • • • • • • • • • • • • • • • • • • • • • • • •
LITERATURE REVIEW
A. Eutrophication •••••••.•••••••.•••••••••••••• 4 B. Fish Indices of Eutrophication •••••••••••••• 16 c. Algal Indices of Eutrophication ••••••••••••. 18 D. Algal Blooms . ; . ••• . ••••••••••••••••••••••••• 23 E . Chlamydomonas reinhardtii in the Literature . 28
IV . MATERIALS AND METHODS ••••••••••••••••.••••.••••• J 0
V . RESULTS ••• , ••••••• � ••••••••••••••••••••• , ••••••• 42
V I . DISCUSSION •••••••••••••••••••••••••••••••••••••• .51
VII . SUMMARY .•••.•••••.•••••••••••.••••• · •••.••••••••• 60
VIII. ,LITERATURE CITED •••••••••••••••••••••••••••••••• 62

-1 -
ACKNOWLEDGMENTS
I would like to dedicate this thesis to my fiancee,
Jackie Schildroth , who spent many hours in the laboratory
and whose understanding and patience were most appreci
ated. Special mention is due to Dr. L. Stephen Whitley
for his continual encouragement and advice, which proved
invaluable in the completion of this study. I would
like to thank Dr . Richard L. Smith for his advice and
generous loan of equipment. The writer i s also indebted
to Dr. Bill T. Ridgeway and Dr. Leonard Durham for their
suggestions in writing this paper . Gratitude is also
extended to Theresa Walker for p:roofreading and typing
this paper.

-2 -
IN'l'RODUCTION
One of the greatest threats to aquatic ecosystems
today is the accelerated eutrophication caused by man .
The problem of eutrophication is as complicated as i t i s
widespread . Recent recognition of this major water pol
lution problem has stimulated a search for information
concerning the nature of eutrophication . Many stud ies
have been made on nutrient levels and their effect on
the productivity of lakes , but few studies have been
made on the effects of nutrient levels on specific algae.
It is important to understand the complex nature of
phytoplankton ecology and to isolate and test each fac
tor separately. The determination of the effective range
and optimum levels of nutrients in axenic cultures of
algae is one important factor in understanding the com
plex interactions of the many algae present in a dynamic
ecosystem ·in nature. Expansion of the knowledge of
phytoplankton ecology would be helpful in solving the .
problem of eutrophication . Reliable knowledge of the
algal succession during the process of eutrophication
would enable workers to d etermine the level· and rate of
eutrophication and predict future phytoplankton popula
tions. The ability to "read" the phytoplankton would im
prove aquatic management and pollution detection.
Man has finally realized that his existence depends
on the existence of a balanced e cosystem. Man needs a
balanced aquatic ecosystem to obtain drinking water ,
�-
wa ter for industry, for livestock and crops , recreation,
aesthetic s , food , transportation , and many other use s .
The fact that a balanced aquati c environment i s s o useful
to man and an unbalanced aquati c environment is so detri
mental, makes eutrophication an important problem .to be
overcome.
-4-
LITERATURE REVIEW
Eutrophication
Most authors agree that eutrophication is the evolu
tion of events. caused by nutrient enrichment. which
eventually leads to extinction of a lake. It i s impor-
tant to remc ... her that lakes tend to act as nutrient-sedi-
ment traps and reaction vessels for biological producti
vity (Sawyer. 1966). In some areas , sediments can fill a
lake to extinction in a short time without any measurable
change in productivity. Turbidity is so high in such
cases that even high nutrient concentrations cause no
algal blooms nor raise the light-limited productivity of
the lake. Lake Mead , on the C�lorado River, for example ,
has a life expectancy of only 150 years due to heavy
sedimentation (Stevens , 1946).
Streams and rivers may carry heavy loads of organic
and inorganic materialsvhich are deposited in the still
water of lakes. Sand. soil , and gravel can be moved by
rivers. The driving force of a river varies as the
square of its velocity. Therefore , doubling the velocity
of a river increases i ts ability to carry sediment b�
four times ( Coker, 1968). Even slow streams can carry
and deposit huge amounts of sediment over the years . A
stream with a flow of one million gallons a day and only
30 ppm suspended solids can deposit JOO lbs of sediment
per day in a lake ( Klein , 1962). Strom (1928) went so

-5-
f�r as to say that lakes receiving no sediment will have
an infini�e life , if only natural amounts of nutrients
are available.
Lakes can be very efficient traps for nutrients ,
even in highly minerali zed forms (Hynes, 1960 ) . In a
lake near Copenhagen , 24 tons of saline nitrogen and 4
tons of saline phosphorus · entered the lake each year but
only 3} tons of nitrogen and 200 lbs of phosphorus left
the lake ( Berg, 1958 ) . The Madi son lakes studied by
Sawyer ( 1947 ) were found to retain JO t o 60 percent of
t�e nitrogen they received. The most productive lakes
tended to retain the most nitrogen. Pearsall found that
nutrients entering four English lakes were significantly
higher than the amount leaving the lakes . One lake had
a net annual gain of 8 tons of nitrogen which promoted
the growth of 1 00 tons (dry weight ) biomass . Nutrients
that enter the lake tend to be quickly fixed in the lake's
biomass ( Pearsal l , Gardiner , . and Greenshields , 1946 ).
The biomass in oligotrophic lakes slowly increases
as more and more nutrients and sediments are trapped by
the lake. Increasing amounts of dead organisms fall t o
the bottom and make increasing demands for hypolimne�ic
oxygen. The amount of oxygen required to decompose this
organic matter finally reaches the point where the hypo
limnion becomes devoid of oxygen just before the fall
overturn • . As the yearly bi ological oxygen demand in
creas e s , anaerobic conditions in the hypolirnnion occur

-6-
sooner after the sp�ing overturn and last for a longer
period (Sawyer, 1947, 1966). When a lake reaches the point where the hypolimnion
becomes anaerobi c , the lake becomes considerably more
productive and may produce nuisance blooms quite suddenly
(Hyn:s, 1960). Once a lake reaches the eutrophic stage ,
tne character of the lake ' rapidly changes , often within
a few years (Strom , 1928) • . There is a rapid change from
oligotrophy to eutrophy ,, called mesotrophy, with long
periods of stability before and after the change (Skul
berg, 1964). Lake Zurich in Switzerland changed from
oligotrophy to eutrophy within a few decades (Hasler,
1947). The decrease in the amount of oxygen in the hypolim
ni on coincides with the rapid increase in productivity of
the lake . This phenomenon occurs during the mesotrophic
stage. (see Fig . 1). The decline in oxygen levels in the
hypolimnion is proportionate to the amount of nutrients
added to a lake ( Tanner , 1960). Anaerobic conditions in the hypolimnion are charac
teristic of eutrophic lakes (Mortimer , 19411 Hasler, 1947; Sawyer , 1966; Fruh , 1967; Bartsch, 1968; King , 1970)�. When there are aerobic conditions in
.the hypolimnion , the
benthic mud is covered by a thin layer of insoluble iron
ir. the ferric oxidation state . This layer seals the bot
tom mud and prevents the release of nutrients back into
solution. In fact , i t often absorbs phosphorus from the

( I I I i I I I I I I I
exti�tion
I ____ __,,
-7-
extinA\tion
I
,�--) I I extinctio
--Natural Eutrophicatio
- --Artificial Eutrophica ion
Age of the La� Fig. 1. Hypothetical curve of the course of eutrophication
in a lake. The broken lines show the rapid increase in productivity characteristic of lakes which are artificially accelerated by �n in the oligotrophic stage or in the eutrophic stage (From Hasler, 1947').
-8-
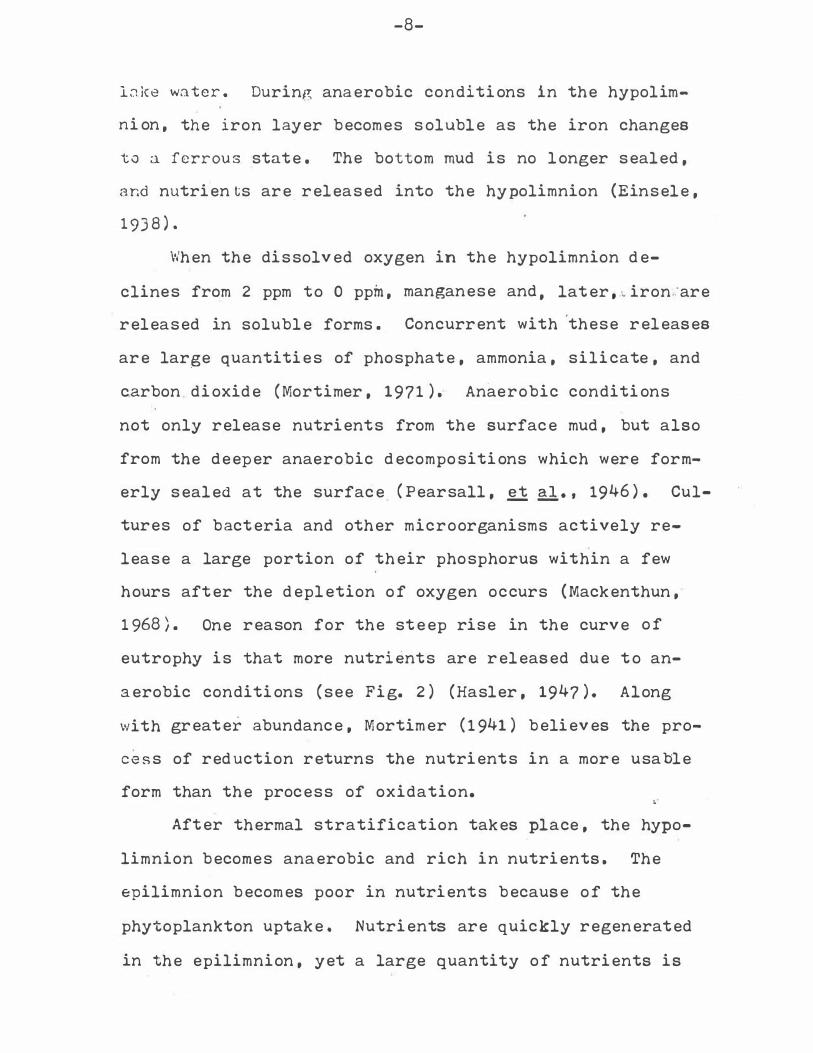
loke water. DurinR anaerobic conditions in the hypolim
ni on, the iron layer becomes soluble as the iron changes
to a ferrous state . The bottom mud is no longer sealed,
and nutrients are released into the hypolimnion (Einsele,
l 9J8). When the dissolved oxygen in the hypolimnion de
clines from 2 ppm to 0 ppin, manganese and, later, � iron;:are
released in soluble forms . Concurrent with these releases
are lar�e quantities of phosphate, ammonia, silicate, and
carbon dioxide (Mortimer, 1971). Anaerobic conditions
not only release nutrients from the surface mud, but also
from the deeper anaerobic decompositions which were form
erly sealed at the surface ( Pearsall, �� • • 1946 ) . Cul
tures of bacteria and other microorganisms actively re
lease a large portion of their phosphorus within a few
hours after the depletion of oxygen occurs (Mackenthun,
1 968) . One reason for the steep rise in the curve of
eutrophy is that more nutrients are released due to an
aerobic conditions (see Fig. 2) (Hasler, 1947). Along
with greate� abundance, Mortimer ( 1 941) believes the pro
cess of reduction returns the nutrients in a more usable
form than the process of oxidation.
After thermal stratification takes place, the hypo
limnion becomes anaerobic and rich in nutrients . The
epilimnion becomes poor in nutrients because of the
phytoplankton uptake. Nutrients are quickly regenerated
in the epilimnion, yet a large quantity of nutrients is

I I
-9-
extinction
Nutrient InflOWi
i�ligotrophic {;so trophic Eutrophia.
Fig o Z. Conceptualization of the process of eu trophication. In the mesotrophic stage, there is a rapid increase in productivity concurrent with a rapid decline in dissolved oxygen in the hypolimnion during stagnation. The nutrient inflow and outflow lines illustrate the progressive nutrient fixing by the lake. The productivity curve could also be labeled turbidity or nutrient availability which also change in this manner.

-1 0-
loct as dc�d organisms descend t o the bottom. Several
mcchanioms have been discovered which return nutrients
from the rich hypolimnion back into the epilimnion. With-
o�t this source of nutrients , the epilimnion could not
continue its high rate of productivity. The epilimnion
slowly warms and during the critical summer months the
cescending thermocline gradually feeds nutrient-rich
waters from the hypolimnion into the epilimnion . The
sooner anaerobic conditions develop in the hypolimnion,
the more nutrients are released into the waters above
(Sawyer, 1947 ) . Organisms sedimented in l ittoral areas
decompose and provide a continuing nutrient source for
the epilimnion throughout the stratification period
(Hasler arid Einsele , 1948 ) . Lakes as deep as 30 feet
may have their thermal stratification destroyed by
strong winds ( Pearsall , et al . , 1 946 ) .
Perhaps the first method used to assess the degree
of eutrophication was the determination of dissolved
oxygen after stratification • . Thienemann ( 1 928) proposed
that lakes could be typed by determining the oxygen con
tents of the hypolimnion and epilimnion and representing
them as a ratio.
Hutchinson ( 1 93 8 ) , after measuring many types of
lakes , determined the rate of l oss of hypolimnetic oxygen
ina oligotrophic lakes eutrophic lakes
0 . 004 0 . 05
0 . 033 mg/day/sq cm 0. 14 mg/day/sq cm

-11-
Mortimer ( 1 941 ) found similar results:
oligotrophic lakes mesotrophic lakes eutrophic lakes
under 0 . 025 mg/day/sq cm 0 . 025 - 0.055 mg/day/sq cm over 0 . 055 mg/day/sq cm.
Recently, Bazin and Saunders ( 1971 ) used the method
of computing the rates of change of the total oxygen be
low the thermocline to predict future oxygen levels in
the hypolimnion.
Sawyer ( 1966 ) outlined the various methods for
measuring eutrophication.as followsa
I . · Indirect Indicators These play no part in increasing productivity but indicate evidence of human , industrial , and agricultural wastes. Increases of: total solids
calcium sodium potassium sulfate chloride
II . Direct Indicators (Qualitative ) A . The presence o f salmonid fish indicates oligo
trophy. B. The quality of phytoplankton
III . Direct Indicators (Quantitativ e ) A. Hypolimnetic Oxygen
1 . Dissolved 2 . Rate of consumpti on
B. Biological Productivi ty 1 . Standing crop 2. Volume of algae J. Transparency 4 . Chlorophyll in epilirnnion 5. Oxygen production 6. Carbon dioxide utilization
c. Nutrient Levels 1. Phosphorus 2. Nitrogen 3. Nitrogen-phosphorus ratios
-12-
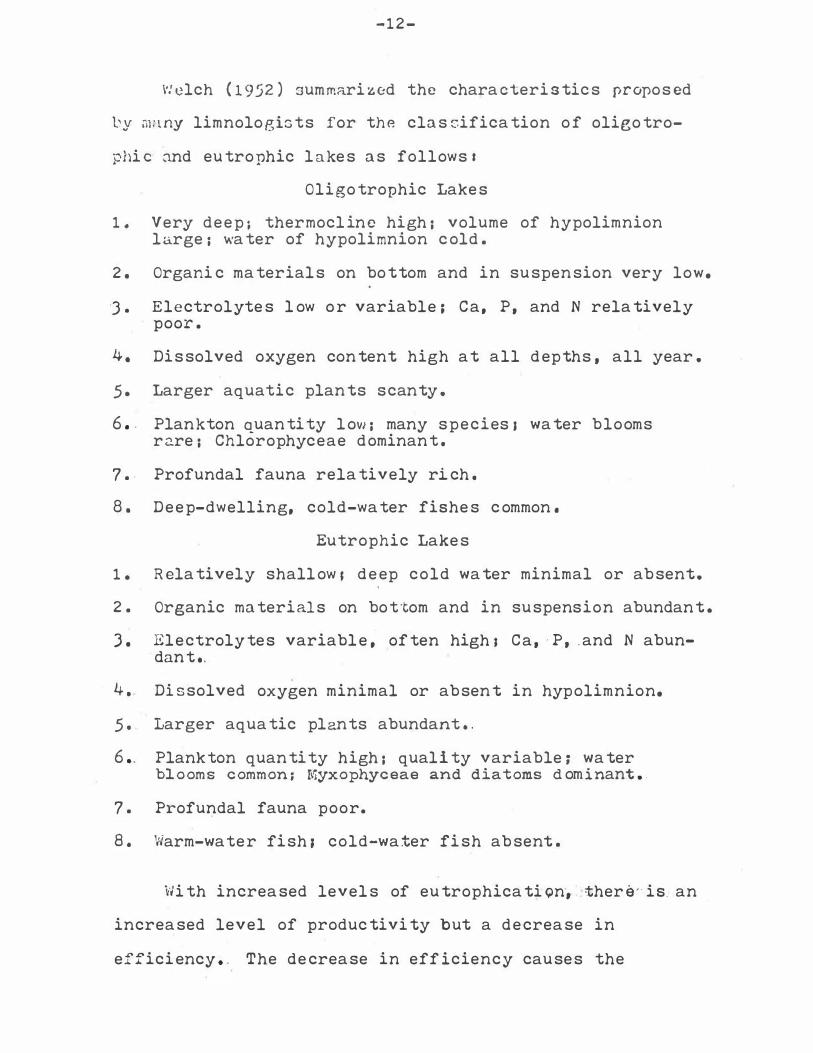
v:elch ( 1952) summarized the characteristics proposed
l'y many limnoloe;ists for thf! clas$ification of oligotro-
phic and eutrophic lakes as follows a
Oligotrophic Lakes
1. Very deep; thermoclinc high; volume of hypolimnion large; water of hypolimnion cold .
2 . Organi c materials on bottom and in suspension very low.
J . Electrolytes l ow or variable ; Ca, P, and N relatively poor .
4. Dissolved oxygen content high at all depths , all year.
5 . Larger aquatic plants scanty.
6 • . Plankton quantity low; many speciesa water blooms r�re; Chlorophyceae dominant .
7. Profundal fauna relatively rich .
8 . Deep-dwelling, cold-water fishes common.
Eutrophic Lakes
1 . Relatively shallows deep cold water minimal or absent.
2 . Organic materials on bottom and in suspension abundant .
J . Electrolytes variable , often highi Ca, · P, .and N abundant •.
4 . Dissolved oxygen minimal or absent in hypolimnion.
5 . Larger aquatic plants abundant • .
6 •. Plankton quantity high; quality variable; water blooms common; Myxophyceae and diatoms d ominant • .
7. Profundal fauna poor.
8. Warm-water fisha cold-water fish absent .
With increased levels of eutrophication, there'· is. an
increased level of productivity b ut a decrease in
efficiency • . The decrease in efficiency causes the

-lJ-
nccumulation of oren.nic material which fills in the lake
."l.nd c:iuses extinction (Findenage, 1 964 ) . All of the nu
trients. cannot be utilized by the phytoplankton because
the algal turbidity �ecreases the photosynthetic zone of
the lake (Lund, 1969) . Z ooplankton will not consume many
types of blue-green algae, so much of the algae dies and
settles to the lake bottom . (Lund. 1 969 ) . Decomposition
is retarded by anaerobic conditions and a thick layer of
bottom sediments builds up ( Pearsal l , et al . , 1 946 ) . A
stage i s reached where the recycling of nutrients i s high
enough for continued nuisance algal growth (Fruh, 1967;
Bartsch, 1968).
The building of bottom sediments causes more and
more of the lake to become littoral in nature. Emergent
vegetation contains much supporting tissue ( cellulose ) which cannot be used by most herbivores and decays very
slowly (Russell and Hunter, 1 970 ) . The rooted aquatic
plants accumulate sediment and cause the steady encroach
ment of the shores. The open lake becomes littoral, the
littoral areas become dry land. The eutrophic lake dis
appears as a lake when the littoral vegetation has
gained foothold throughout its bottom (Welch, 1952 ) .
The length of time for a lake to become extinct
generally varies from 100 to thousands of years . The
�aj ority of the world ' s large lakes will cease to exist
in less than 20,000 years •. An exception is Lake Geneva,
W�'lich may last 40, 000 years {Russell and Hunter , 1970 ) .

-14-
'l'he Great L:1.kcs are es ti mated to be 8 , 000 years old . 'l'he
r�te at which eutrophication proceeds depends on geochemi-
c�l and.morphometric factors and the intelligence of man
(Hynes. 196 0 ) .
Many limnologists beli eved that eutrophicati on,
whether caused by man or by nature , was not reversible
(Hasler, 1947 ) . After some notable successes in revers-
ing the trend of eutrophication, limnologists now believe
that the fate of many lakes can be significantly improved.
This is especially the case with artificially accelerated
lakes (Edmondson , 1 969r Hasler, 1 969 ) . In Lake Washing
ton (Washington ) , 99 percent of the sewage entering the
lake was diverted by 1 967 . By 1969, the phosphate concen-
trati6n had been reduced 72 percent and the nitrate con
centration reduced 20 percent from the 1 963 record levels .
The secchi disk transparency increased from 1 . 0 meter in
1 963 to 2 . 8 meters in 1969 (Edmondson, 1 970 ) .
All sewage was diverted from Lake Monona (Madison,
Wisconsin) in 1936 , but between 1 943 and 1 950 sewage again
entered the lake . After 1950 no sewage effluent entered
L�ke Monona and in 1 958 all sewage was diverted from the
Madison lakes .. After diversion, appreciable decreases in ..
nitrogen and phosphorus occurred . There was a shift from
single species bloom of Microcystis to lesser blooms of a
variety of species . The use of copper sulfate t o c ontrol
blooms decreased dramatically (Lawton, 1 961; Hasler, 1969 ) .
Afte� a study made in 1 963 by Rohlich and McGauhey.

-15-
the citi z e n s voted to have the treated effluent diverted
from Lake Tahoe, CEliforniu. This lake has been described
2s tte clearest lake· in N orth America and yet the rapidly
increasing �ewaee load threatened to destroy its aesthetic
a�c bi olo�ical value . Here i s a case where nuisance con
ditions were stopped before they started (Hasler, 1969 ) .
The abatement of pollution on the St • • Clair and
Detroit Rivers should dramatically improve conditi ons in
Lake Erie . This is because it i s theoretically possible
to exchange all Lake Erie's water in three years since
the lake is so shallow and its flow is so great (Hasler
and Swenson, 1967) .
Crecy Lake in New Brunswick is a small unstratified
lake which was artificially fertilized three times in 1 8
years . Each time , the eutrophic conditions induced by
the fertilization program reverted back t o oligotrophic
conditions when fertilization ceased {Smith, 1 96 9 ) .

-16-
Fi5h Indi ces of Eutrophication
Most suthors agree that coregonines and salmonids
are the first fish to disa.ppear as an oligotrophic lake
evolves into a eutrophic type.
Kriegsmann (1955 ) studied the species composition of the
clieotrophic Lake Obersee and the eutrophic Lake Untersee
from 1910 to 1954 . He theorized, by splicing the records
of the two lakes together , that the cold-water fish popula
tion would suddenly decline and the coarse fish popula-
tion would suddenly increase in the mesotrophic stage .
Even though the whitefish and trout populations de
clined and disappeared , the total fish production of the
Wisconsin lakes increased with increasing eutrophication
( Pearse, 1 934 ) .
Lake Zurichsee in Switzerland changed from a trout
whitefish population to a coarse fish population con
current with heavy domestic enrichment. Restocking the
lake has not been successful , indicating that the condi
tions for survival of game fish no longer exist (Hasler,
1 947 ) . Lake Monona and Lake Mendota cisco populations
greatly declined during the 3 0's due to eutrophi cation
(hasler, �947 ) . Lake Erie has shown a dramatic collapse of
the whitefish, lake trout , cisc o , and blue pike fisheries
during the period when extensive oxygen depletion in the
hypolimnion occurred in the lake ( Beeton, 1 969 ) . Tanner
-17-
( 1960) fertilized four Michigan trout lakes at different
rates. Generally , the more fertilized the lake , the
greater was the reduction of oxygenated water during the
summer. The epilimnion was too warm for the trout and
the hypolimnion was often anaerobic. Since most trout
need approximately 4 ppm dissolved oxygen , the trout
were restricted to a narrow band of water in the thermo-
cline with enough oxygen and low temperature water. It
is easy to see how a trout population could be eliminated
from such a lake during a spell of very hot weather and/ or heavy nutrient load . Other s ources of mortality may
be hydrogen sulfide accumulations from anaerobic areas of
the lake and egg mortality caused by anaerobic conditions
during the winter (Hasler, 1969 ) .
The succession of dominant fish species in the evo
lution of a hypothetical glacial lake in North America
would be a cisco, trout , perch, northern pike, smallmouth
bas s , bluegill , largemouth bas s , common sunfish, bullhead
(Lagler, Bardach , and Miller, 1962 ) . Larkin and North
cote ( 1 96 9 ) believe the progression of fish groups would
bea trout , warm-water bass and perch , plant-eating types ,
and finally, bottom feeders. Data such as these are : ..
helpful in determining the stage and rate of eutrophica-
tion of a lake.

-18-
Algal Indices of Eutrophication
The idea that phytoplankton could be used to deter
ffiinc the trophic lake type has been pursued mainly by
European workers . . The usual s, . . eme for distinguishing
oligotrophic plankton from eutrophic plankton is indicated
in Table 1 (Unless otherwise cited , all citati ons belong
to Rawson, 1956).
TABLE 1. Plankt on of oligotrophic and eutrophic lakes
Quantity
Variety
Distribution
Diurnal migration
Via ter blooms
Characteristic· algal groups and genera
Oligotrophic
Poor
Many species
To great depths
Extensive
Very rare
Chlorophyceae Desmids
( if low Ca ) Staurastrum
Diatcmaceae Tabellaria Cyclotella
Chrysophyceae Dinobryon
Eu trophic
Rich
Few species
Surface
Limited
Frequent
Cyanophyceae Anab::i.ena Aphanizomenon Microcystis
Diatomaceae Melosira Fragilaria Stephanodiscus Asteri onella
The quantity of plankton is an excellent indicator
of the productivity of a lake , and thus , i ts trophic type .
Eutrophic lakes �ay have at least 5 times as much

-19-
plankton as an oligotrophic lRke . The variety of species
of plankton can be deceptive except in extreme conditions
of olig�trophy or eutrophy. Eutrophic lakes may be domi--
nat�d by a tremendous number of individuals of one species
of blue-green algae and yet have many species with only
a few individuals each . The extent of vertical migration
is not easily determined nor particularly significant.
The frequent occurrence of algal blooms is a univers�lly
accepted sign of eutrophic conditions.
There has been a c oncentrated effort by many re-
searchers to discover algal groups or species to:indicate
trophic lake types. Rawson , in his study of Great Slave
Lake ( Canada ) , found phytoplankton characteristic of both
oligotrophic and eutrophic lakes, although all physical
and chemical data contend that Great Slave Lake i s oligo
trophic. Blue-green algae are s carce and no algal blooms
have been recorded , yet desmind are also scarce (prob-
ably due to high calcium levels ) and the diatom popula-
tion i s typical of eutrophic conditions . This is the
problem in applying the traditional scheme of algal types
to a particular lake. Large lakes may have inshore areas
which are eutrophic and open water areas that are ol�go
trophic .
More accurate field and laboratory studies may indi-
cate �rue algal indices of the trophic condition. Rodhe
(194 8 ) and Lund (1964 ) concluded that Dinobryon divergens
and Uroglena americana thrive in low nutrient
-20-
concentrations and are inhibited by phosphate concentra
ti ons that are not characteristic of oligotrophic condi
tions. Indicator species of eutrophic conditions are
well known . Persistent algal blooms of any blue-green
algae , especially Vicrocystis , AnRbaena, Oscillatoria,
and Aphanizomenon, are reliable indices of the lake's
trophic leve l . There are' no reliable algal indicators
of mesotrophic conditions .
Much needs to be done to improve field studies .
Exhaustive studies should be made to determine all the
species present and which species i s dominant by numeri
cal and volumetric percentages of the total community.
Data should be based on collections throughout the year.
Often field studies report only general classifications
of algae such as diatoms , desmids , blue-green algaes
sometimes genera are reported: rarely are the algae iden
tified to species. A genus may contain species indica
tive of widely different conditi ons . There i s evidence
that physiological races within a single species may
thrive under different nutrient conditions without show
ing any morphological difference s . More care should be
taken in taxonomic work in field studies.
Nutrient bioassays of algal species in the labora-
tory together with field studies should yield reliable
information defining algal indicators of a la�e•s tro-
phic condition. Such indicator species would be present
and/or dominant only in one trophic level of eutrophication.

-21-
An exhaustive survey of the literature to determine
the succession of algal species during the process of
eutrophication reveals that no universal , well-defined
list exists at this time . Rawson formulated the algal
succession from oligotrophy to eutrophy for the lakes
i� western Canada . The list represents the sequential
order of dominant species� The d ominant species were
determined by a high percentage of the plankton count
over th? summer season. This list is based on observa-
tions over a 25-year period .
TABLE 2 . Approximate trophic distribution of dominant limnetic algae in lakes of western Canada
Oligotrophic
l'l.esotrophic
Eu trophic
Asterionella formosa Melosira islandica Tabellaria fenestrata Tnbellaria flocculosa Dinobryon divergens Fragilaria capucina Stephanodiscus niagarae Staurnstrum .§.12.12• Melosira granulatn Fragilaria crotonensis Ceratium hirundinella ?0diastrum boryanum ?ediastrum duplex Coelosphaeri um naegelianum· Anabaena. .§..12.}2• Anhanizomenon flos-aguae Microcystis aeruginosa · Microcystis flos-aguae
This sequence may be accurate for western Canada,
but it disagrees in many ways with European data and

-22-
l�;.boratory work of Chu ( 1942, 1 943 ) and Rod.he ( 1 948 ) . It
scc�s that each geosraphical region has its own particular
sequence of succession, with the same end , blooms of blue-
8reen algae . An accurate list of algal succession would
�e a auick and reliable method for determining position
in, and rate of, the process of eutrophication. It i s
extre�ely important t o knbw mesotrophic indicators ,
particularly species that occur just before blue-green
algae become dominant. If these warning signals were
known, steps might be taken to avert the problems caused
by blue-green algal blooms .
Zooplankton have not received the attention that
fish and algae have received ; yet , when they are men
tioned in connection with eutrophication, the genus
Bosmina is invariably discussed.. Bosmina longirostris
replaced B. coregoni in Lake Zurich when it changed from
oligotrophy to eutr ophy (Hasler ,. 1 969 ) . ]. longirostris
is only found in eutrophic lakes in Finland (Jarnefelt,
1 952 ) . B. longirostris has replaced B. coregoni in
Lake Michigan ( Bartsch, 1968 ) . The zooplankton will
undoubtedly be important in characterizing the trophic
levels of . bodies of water when their . ecology is better
understood.

-23-
Algal Blooms
An algal bloom is defined as 500 or more ·individuals per
milliliter of raw water (Lackey, 1 949� . It i s generally
accepted that increased nutrients cause increased produc-
tion of phytoplankton. This increase in phytoplankton
often �eaches bloom levels in eutrophic lakes.
Most authors believe that of all the nutrients need
ed by phytoplankton, nitrogen and especially phosphorus
are the most important factors in causing algal blooms ·
(Sawyer, 1 947; Lackey , 1 949: Lund , 1 965; Hutchinson , 1967,
Mackenthun and Ingram� 1967; 'Bartsch 1 968; Mackenthun,
1 968; Hasler, 1 969; Thomas , 1 969; Edmondson, 1970;
Schindler ,. 1 971: Fuhs , et al., 1 972; Maloney , Miller, and
Shiroyama , 1 972; Powers , et al . , 1 972a Schelske and Stoer
mer, 1 972 ) . Some limnologists have determined the levels
of nut�ients which are required to produce algal blooms
(see Table 3 ) .
Altnough high levels of phosphorus and nitrogen
enable phytoplankton to reach bloom levels , many other
factors help to d etermine the periodicity and succession
of algal species. Mackenthun and Ingram (1967 ) mentioned
some important factors which affect algae , including �·
temperature , sunlight , shape and size of lake , substratum ,
water quality, predation, viruses , autointoxicants , extra
cellular mo·v�bolites , auxins , ·hormones , trace· elements ,
�nd vitamins. Russell a�� Hunter ( 1 970 ) determined the

-24-
TABL� J . Minimum concentrations o f nitrogen and phosphorus which can produce algal blooms
Cone.
I\=)OOppb P= lOppb
N=lOOppb P= 9ppb
N=200ppb P= lOppb
N= ?Oppb P= 5ppb
P=lOOppb/ rivers
P= 50ppb/ lakes
JOOppb N 03/N
600ppb total N
7ppb NO /N
2_'.;·;>�b total P
Studied
\'Ji sc onsin Lakes
Lab. experiments with Pedi::i.strum, Stnurastrum, . Botryococcus , & 4 diatoms
Seattle's Green Lake
Wisconsin Lakes
Data from Fed. Water Poll. Contr. Adm in.
German Rivers
Analyses of many eutrophic lakes
Comments
This cone. at the start of growing season c ould produce nuis::nce blooms .
Below this cone. the 7 algae were inhibited.
Nuisance algal blooms commenced at this cone.
Minimum cone • . for algal blooms
Guidelines for total phosphorus in lakes and rivers
Excessive algal growths in polluted rivers can be avoided i f the N can be kept be-1 ow these c oncentrations .
Lakes which have concentrations above these will have blooms .
Ci tation
Sawyer , 1 947
Chu, 194.3
Sylvester ,. 1 961
Lackey, 1960
Mackenthun, 1968
Muller, 1953
Prescott, 1 968 �-

-25-
essential nutrients for aquatic organisms 1 elements
comprising 1 percent or more dry weight (in order of im
portance ) a C , 0 , H , N, P ; comprising 0 . 05 to 1 percenta
S , Cl , K , Na, Ca, . rlig, F e , Cu: comprising less than 0 . 05
percenta B , Wn , Zn, S i , Co , I, F; certain organisms may
need trace amounts of Sr, M o , Br , V , Ti , Al , Ga .
·Theoretically , any one of the previously mentioned
factors can be limiting (Liebig's law of the minimum) or
toxic (�aw of the maximum) in a particular aquatic eco-
system: or to any par�icular species within a system. In
prac�ice , phosphorus is usually the limiting factor for
productivity, while the interaction of many factors seems
to ccntrol the occurrence and abundance of any one species.
Carbon is most likely to be limiting in those waters that
are low in bicarbonate (Ruttner , 1963 ) . Molybdenum is a
limiting factor in Castle Lake , California (Goldman, 1960 ) .
Light and temperature limit Asterionella in mid-winter,
but nutrient concentrations ·d o not (Lund , Mackereth, and
Mortimer,. 1963 ). Requirements for vitamin B12• biotin, and
thiamine limit algal growth in some environments (Eyster, 1 968 ) .
Selective grazing by z ooplankton can affect the algal
species composition (Lund , 1969 ) . Silica concentrations
can determine the species of diatoms which are dominant
(Kilham , 1971 ) . Many authors believe ·that toxic substances
produced by organisms are responsible for dominance and
succession in the aq�:•:.:-�ti c environment. Chlamydomonas
reinhardtii produces substances which are toxic to

-26-
J��mntococcus pluvialis ( Proctor , 1957 ) . Lefevre ( 1 964 )
demonstrated autoinhibition in Sccnedesmus cultures .
Chlorella vulenris can produce antibiotics effective
against gram-n�gative and gram-positive bacteria .
Limiting factors may modify the effect of other
limiting factors . Asterionella is severely inhibited in
growth when the silica conbentration falls below 0 . 5 ppm .
In high concentrations of phosphate , the limiting
threshold of silicate is reduced by an amount which de
pends on illumination and temperature (Lund , 1 950 ) .
Eutrophic waters have frequent and prolonged algal
blooms which make the body of water less useful to man.
Algal blooms in a municipal water supply often cause taste
and odor problems in the drinking water (Pearsall , �� . ,
1946; Whippl e , Fair, and Whippl e , 1948: Palmer , 1 96 2 ) . It
has been suggested that the decomposition of blue-green
algae on sand filters of waste treatment plants allows
toxins to contaminate the drinking water and cause gastro
intestinal disturbances (Nelson, 1 941 ) . Pipes and concrete
corrode at an accelerated rate due to c�rtain algae (Myer s ,
1 947; Oborn and Higginson, 1 954 ) . ·Filters i n water treat
ment plants will clog faster during algal blooms ( Bay�is , . .
1955 ) . In general , frequent algal blooms cause the drink-
ing water to be of lower quality and more costly.
Bodies of water used for recreation may be greatly
reduced in value. Floating masses of blue-green algae or
emergent vegetation reduce boating areas. Sport fishing

-27-
can be stopped by fish kills caused by the sudden anaerobic
conditions following an algal bloom. It has been reported
that certain blue-green algae can release toxins that
kill fish (Ingram and Prescott, 1954 ). Excessive fila
mentous algae may reduce fish populations ( Lawrence , 1958 ).
Beaches become less popular as they become littered with
decomposing algae. Swimmers avoid beaches where waters
are covered with floating algal scums. Contact dermatitis
and symptoms of "hay fever" have been associated with
Anabaena ,. Ana.cysti s , and Lyngbya blooms (Heise, 19.5ls
Cohen and Reif, 19.5J ) . The aesthetic qualities , such as
transparency and lack of color , are destroyed by opaque,
green water. Turbidity increases with the ·increase in
phytoplankton density (Welch , 1952 ) . Decomposing algae
and anaerobic conditions cause odor problems. Hydrogen
sulfide gas from anaerobi c decomposition can stain white
lead paint on nearby houses. Eutrophic lakes can have
prolific midge populations which plague visitors ( Lackey,
1949; Mackenthun , 1969 ) .
Commercial interests may be eliminated or made less
profitable when a lake becomes eutrophic. Water used in
the food and beverage industry must be of high quali�y •.
Eutrophic waters require much expense to purify them.
Agricultural enterprises may be hurt because algal blooms
can poison livestock and game birds ( Fitch , � �·• 19J4).
Freshwater fisheries are hurt because valuable commercial
fish are replaced by rough fish characteristic of eutrophic
waters '(Lark�n and Northcote, 1969).
-28-
Chl8.mydomonas reinhardtii in the Literature
The taxonomy and morphology of this genus began with
Ehrenberg. He described the genus Chlamydomonas in · 18JJ.
Pascher . ( 1.927 ) monographed the known specie s . Later
Gerloff furthered the systematics of the genus in 1 940.
The latest review of the genus was by Huber-Pestalozzi
in 1961.
The first genetic studies using algae were with the
genus Chlamydomonas ( Pascher, 1 91 8 ) . The next major ad
vance in algal genetics·cccurred when Smith and Regnery
( 1950) initiated the use of Q. reinhardtii to study link
age relationships and the mechanism of crossing-over in .
mutant-strains. From that time until today, Q• reinahrdtii
is still the major algal species in genetic research. For
reviews of Chlamydomonas genetics , refer to Levine and
Ebersold (196 0 ) , Ebersold ( 1962 ) , Sager ( 1 964 ) , and
Mattoni ( 1 968 ) .
Klebs ( 1 896 ) reported that the suspension in dis
tilled water� starvation, and the· staling of the medium
could evoke sexuality in a wide variet� of microorganisms.
Sager and Granick ( 1953, 1954) were the first to determine
that both .ni.trogen concentration ·and light control gamete .
formation in c. reinhardti i . These: studies s e t the stage ' -
for further investigation· by many authors delving into the
mechanism of reproduction in Q. reinhardtii and other algae .
Artari ( 1 913 ) performed the most notable early study
on the physiology of Chlamydomonas. This was followed

-29-
by Moewus ( 1931 , 1933 ) and Lutsch ( 1932 ) , who also made
significant ·contributions ' to the knowledge of the physiol
ogy of this alga. Recently, many studie s , too numerous
to mention, have been published .
Cain ( 1963) found that Q. reinhardtii could utilize
nitrate or nitrite equally wel l . He also found that when
ammonium and nitrate were ' available simultaneously,
ammonium was used preferentially but growth was not as
good· as with nitrate alone. Proctor ( 1 957 ) showed that
the ammonium ions were preferentially assimilated and
that the nitrate ions were utilized only after the
ammonium had been exhausted • . Culp ( 1971) demonstrated
that this alga grew equally well utilizing . nitrate ,
ammonia , or a combination of . the two.
Palmer ( 1 96 9 ) rated the ability of algae to tolerate
high organic pollution. One hundred-sixty-five authors
were reviewed and the algae ranked by the number of
authors that specified a particular genus or species.
Chlamydomonas was considered the third most tolerant
genus • . Chlamydomonas reinhardtii ranked 45th out of 1 000
species reported as tolerant of organic pollution.
Palmer ( 1.962 ) . believes Q. reinhardtii is very pollut�.on
tolerant but cautions that there are ma�y species in
this genus and many algae have chlamydomonad stages 1
consequently, many workers do not identify chlamydomonad
specimena · �o speci e s , or they do i t incorrectly.

-JO-
MATERIALS AND METHODS
Axenic cultures of Chlamydomona.s reinhardtii Dangeard
were obtained from the Culture Collection of Algae at . '
Indiana· University ( C C'IU) . G •. M. Smith isolated £.• rein-
hardtii plus strain ( CCIU no. 89) and minus strain
«c.cru no. 9 0 ) .
Media
Stock and inoculation cultures were grown in a TRIS
buffered inorganic medium (TBIM) devised by Smith and
Wi edeman ( 1964 ) ( see Table 4 ) . The same medium with modi-
fied nitrate and phosphate concentrations was used through
the study for test media. The media were not enriched
with vitamins because Q. reinhard·tii has been shown not
to require them ( Cain, 1963 ) .
The test media were synthesized in the following
manner •. · A st.ock solution of quadruple strength TBIM
(4XTBIM ) , but without phosphates or nitrates was prepared.
NaCl ( 0. 1 18 g/1 ) · and KCl ( 0 . 15Q.g/l ) �ere added to insure
�hat the Na and K ions were not limiting at very low
KN03 and NazHP04 levels... When phosphates and nitrates
are omi ttec;l and potassium chloride and sodium·· chlorid�
are added to TBIM, the abbreviation TBIM-S will signify
the modification.
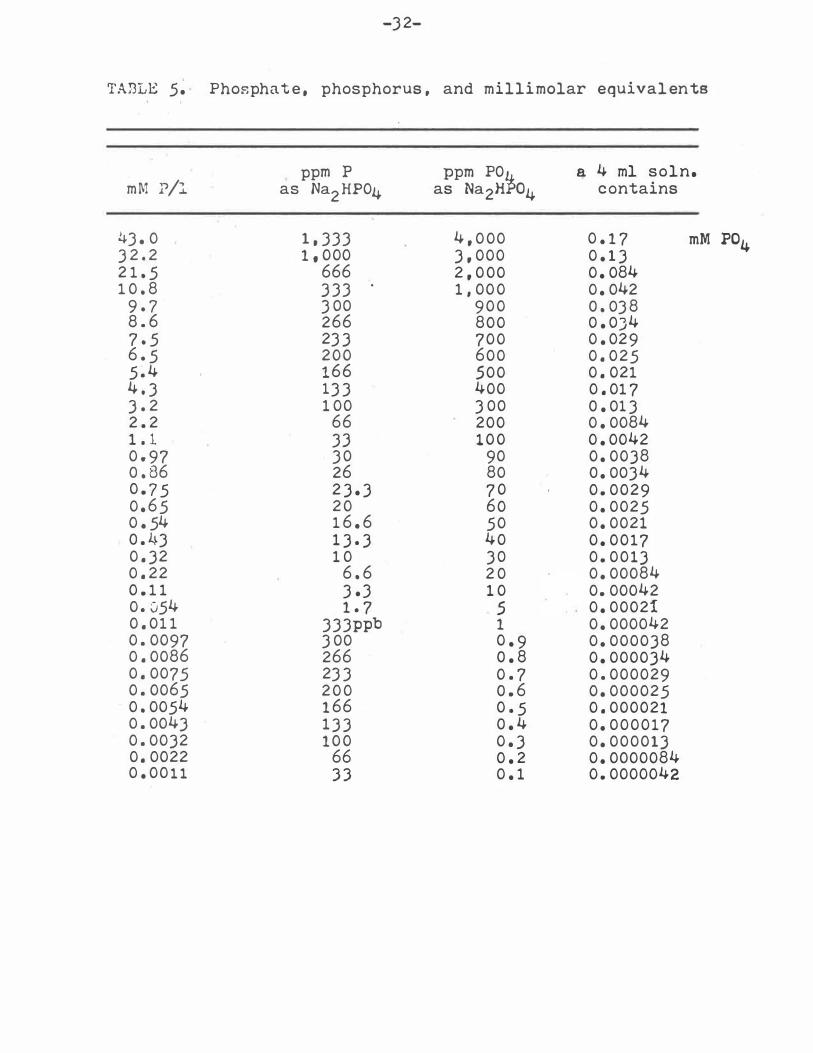
To achieve the desired concentration":of phosphate
and nitrate in ; ac� 4-ml solution, the millimolar value
needed . was calculated (see Tables S and 6 ) . Stock

-Jl -
TABLE 4 . Preparation of TRIS-buffered inorganic medium (TBIM)a
Stock Solutions Amount
0. 1 M KNO; 20 ml
0 . 1 M Na2HP04 10 ml
0 . 1 M MgS04• ?H20 3 ml
O � l M CaCl2• 2H20 1 ml
0. 2 M · ·TRIS (hydroxyinethlyaminomethane ) 25 ml
Ea�h of the above is added to approximately 800 ml of glass distilled water. One ml of each of the following micronutrient stock solutions is then added and a final dilution to 1 liter made.
I •
II.
III.
IV.
. EDTA K�H, 85%
H;BO; FeS04. ?H20
ZnS04. ?H20 MnCl2• 4H20 MoO ·
Cus6�· .5H�O C'o (N ; )2 6H20
From Smith and Wiedeman, 1964
50.00 g� per liter J l . 00 g glass
distilled 11.42 g water
4 . 98 g per
8. 82 g liter 1.44 g acidi-:
. o . 71 g fied 1 . 57 g waterb o .49 g
aThe pH of this medium will be approximately 8 . � .•
To adjust : the pH to ?.4, HCl was added.
bAcidified water • 999 ·ml glass distilled water, 1 ml c�ncentrated H2S04.
-J2-
'I'AJ3LE 5. Phosphate, phosphorus , and millimolar equivalents
ppm p ppm POi � 4 ml soln. mM ?/l as Na2 HP04 as Na2H o4 contains
l�J. 0 1 , JJJ 4 , 0 00 0 . 1 7 mM P04 3 2 . 2 1 , 000 3 , 000 0 . 1 3 2 1 . 5 666 2 , 0 00 0 . 084 1 0 . 8 3 JJ 1 , 00 0 0 . 042
9 . 7 JOO 9 0 0 o . OJ8 8 . 6 266 800 O . OJ4 7 . 5 2J3 700 0 . 029 6 . 5 200 600 0 . 025 5 . 4 166 .500 0 . 021 4 . J lJJ 400 0 . 01 7 3 . 2 1 00 JOO o . OlJ 2 . 2 66 200 0 . 0084 1 . 1 J3 1 0 0 0 . 0042 0 . 97 JO 90 0 . 0038 o . 86 26 80 o . OOJ4 0 . 7 5 2 3 . 3 7 0 0 . 0029 0 . 6 5 2 0 60 0 . 0025 0 . 54 1 6 . 6 50 0 . 0021 o . 4J 1 3 . 3 40 0 . 0017 0 . 32 1 0 JO 0 . 0013 0 . 22 6 . 6 2 0 0 . 00084 0 . 1 1 J.J 1 0 0. 00042 0 . 054 1 . 7 .5 0 . 00021 0 . 01 1 JJJppb 1 0 . 000042 0 . 0097 JOO 0 . 9 0 . 000038 0 . 0086 266 o . 8 0 . 000034 0 . 0075 2JJ 0 . 7 0 . 000029 0 . 0065 2 0 0 o . 6 0 . 000025 0 . 0054 1 66 0 . 5 0 . 000021 0 . 0043 1 3 3 o . 4 0 . 000017 0 . 0032 1 0 0 0 . 3 0 . 000013 0 . 0022 66 0 . 2 0 . 0000084 0 . 00 1 1 3 3 0 . 1 0 . 0000042

-33-
TABLE 6 . Nitrate , nitrogen, and millimolar equivalents
ppm N ppm N03 a 4 ml eoln. mtv; N/l as KN03 a s KNOJ contains
1 97 . 1 2 , 760 1 2 , 000 0 . 77 mM NOJ 1 8 0 . 7 2 , 53 0 1 1 , 000 0 . 70 164 . 2 2 , J O O 1 0 , 000 o . 64 147 . 8 2 , 070 9 , 000 0 . 5 8 1 3 1 . 4 1 , 840 e . ooo 0 . 51 1 1 5 1 , 6 1 0 7 , 0 00 o . 45
98 . 5 1 , 380 6 , 000 0 . 38 82 . 1 1 , 2 50 5 , 000 0 . 3 2 6 5 . 6 9 2 0 4 , 000 0 . 25 49 . 2 690 J , 000 0 . 1 9 32 . 8 460 2 , 000 0 . 1 3 1 6 . 4 230 1 , 000 0 . 064 1 4 . 7 207 900 0 . 058 1 3 . 1 1 84 800 0 . 051 1 1 . 5 1 6 1 7 0 0 0 . 045
9 . 9 1 3 8 6 0 0 0 . 038 8 . 2 . 1 1 5 500 0 . 032 6 . 6 92 400 o . 025 4 . 9 69 3 0 0 o . 0 1 9 3 . 2 46 200 0 . 01 3 1 . 6 2 3 1 0 0 0 . 0064 1 . 5 2 0 . 7 90 0 . 0058 1 . 3 1 8 . 4 80 0 . 0051 1 . 1 6 1 6 . 1 7 0 0 . 0045 0 . 99 1 3 . 8 6 0 0 . 0038 0 . 82 1 1 . 5 50 0 . 0032 o . 66 9 . 2 40 0 . 0025 o . 49 6 . 9 J O 0 . 0019 0 . 32 4 . 6 2 0 0 . 0013 0 . 1 6 2 . 3 1 0 o . oco64 0 . 082 1 . 1 5 5 0 . 00032 0 . 016 2J Oppb 1 0 . 000064 0 . 0 1 5 207 0 . 9 0 . 000058 0 . 01 3 1 84 o . 8 o . 0000.51 o. 012 . 1 6 1 0 . 7 O . O OOC°45 0 . 0099 1 3 8 o . 6 0 . 000038 0 . 0082 1 1 5 0 . 5 0 . 00003 2 0 . 0066 92 0 . 4 0 . 000025 0 . 0049 69 O . J 0 . 000019 0 . 0032 46 0 . 2 0 . 000013 0 . 0016 23 0 . 1 0 . 0000064

-J4-
solutions of phosphates and nitrates were made up at 1 . 0 ,
0 . 1·, 0 . 01 , 0 . 001 , 0. 0001 , 0 . 00001 , and 0. 000001 molar
concentrations respectively. The desired concentrations
were prepared using these stock concentrations.
Example a A concentration of J OO ppm NOJ and 40 ppm P04
JOO ppm NOJ =0. 019 mM=0 . 1 9 ml of 0 . 1 M KNOJ 40 ppm P04=0. 0017 mM=0. 1 7 ml of 0 . 01 M Na2HP04
1 ml of 4XTBIM-S was then added.
Various nitrate and phosphate concentrations were prepared
in· this fashion and tested with a Hach Direct Reading
Photoelectric Colorimeter1 and found to be accurate.
The medium TBIM has a c oncentration of 124 ppm N03 ,
28 ppm N , or 2 mM N/l , and a concentration of 95 ppm P04 ,
Jl ppm P,· or 1 mM P/l . Throughout this paper , concentra
tions of phosphorus and ni�rogen are given in all three
forms because of the compounds in which they are found
( e . g .• , ortho-phosphates , nitrates ,. ammonia,· etc. ) •
. Studies .of eutrophi cation have shown that the total avail
able phosphorus and nitrogen levels are more important
than the forms in which they are found. Laboratory
phycologists who work with many types of media find mM/l
conceritrations more meaningful to use.
1 . Hach .Chemical Company , Ames , Iowa 50010 .
-JS-
Stnndnrd Cond itions
All cultures were grown in a Sherer Control led
Environmental Chamber2 , model CEL 25-7 . Cain ( 1963 )
cultured a number of Chl�myd omonas .fill.!l• including £.
reinhRrdtii at 22°c with much success. In the use of
c . gelatinosa as a pollution bioassay organism, Matulova - .
( 1 96 9 ) recommends 20-22°c . Sager and Granick ( 1 953 )
maintained their cultures of C . reinhardtii at 25°c .
A constant day and night temperature o f 22°c was main
tained in the experiments reported herein, except for
experiment number 1 . Experiment number 1 had a day l ength
of 14 hours and a night length of 1 0 hours. All other
experiments had 1 2 hour day and night lengths for simpli
city. Light was furnished by KEN-RAD 0 cool white0
fluorescent lamps at an intensity of about 1 ,400 foot
candles on the test tube s . It was found that £. reinhardtii
has about 1 , 500 footcandles as i ts upper limit for opti
mum growth rate (Krauss , 1 961 ) . Salageanu ( 1 96 7 ) obtained
excellent growths of £. reinhardtii without agitation or
the introduction of gaseous carbon dioxide , neither of
which was used in the present study.
Baus.ch and Lomb Selected Spectronic 2 0 Test Tubes
(� in. diameter ) were employed i n specially made wire
mesh test tube racks . These racks allowed approximately
1 .cm se·paration between tubes and were designed to set
2Sherer-Gillett Division, Kysor Industrial Corp . , Marshall , Mich. 49068.

-36-
.the tubes at a 45° angle from vertical to provide greater
exposure to light and increased gas exchange at the surface.
The growth measured in these tests is derived strict
ly from asexual reproduction. Q. reinhardtii is a hetero
thallic alga, with plus and minus mating type s . Only one
strain (plus ) was used throughout the study, to avoid
possible irregularities in growth rate due to sexual
reproduction.
Six days for the length of the test cultures worked
well in all tests , except experiment number 1 0 . The
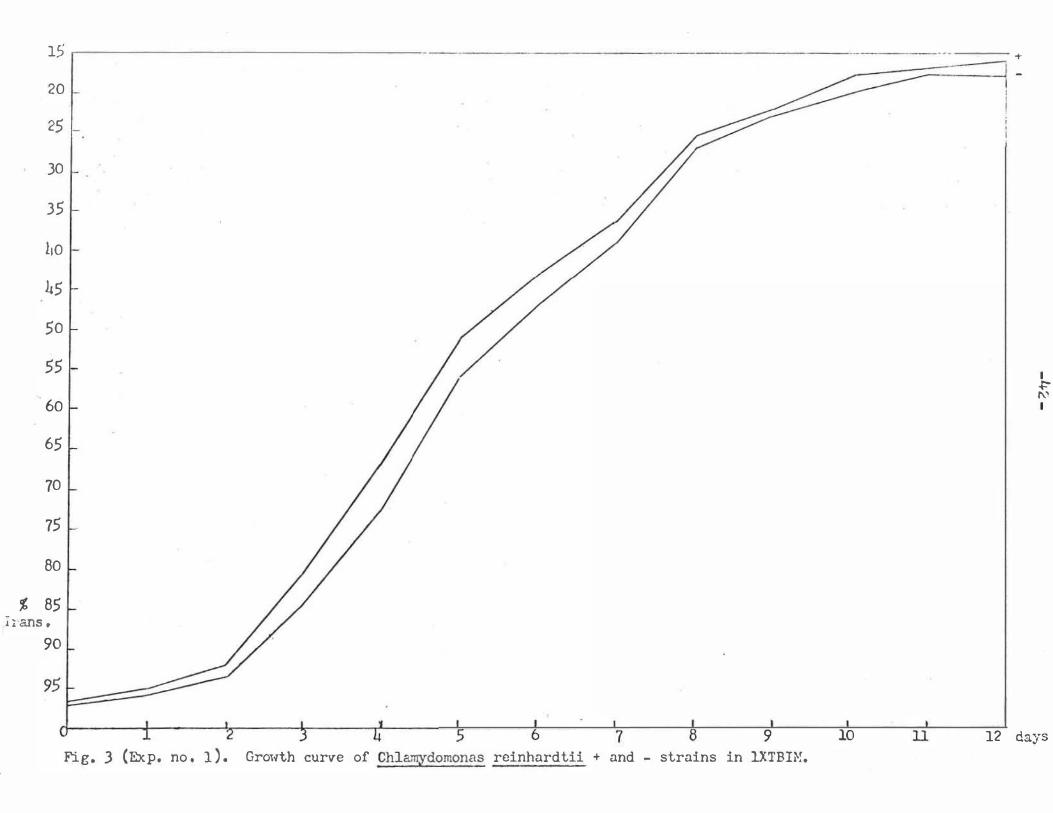
growth curve study (Fig. 3 ) showed that Q. _ reinhardtii
had a rather constant growth rate in the range of from 92
to 27 percent transmittance . The ideal growth period "
should be one in which a large amount of growth (low trans
mittance reading ) takes place and yet doesn ' t reach a
level where the growth. slows down ( past 27 percent trans
mittance ) . A large amount of growth helps delineate be
tween nutrient concentrations that promoted rapid growth
and those that didn ' t. In experiment number 1 the average
growth of both strains reached only 45 percent in 6 days ,
while later tests often reached a more desirable 3 0 per
cent. Examination of the test condition table (Table 7 ) ' �
shows that many conditions were different in experiment
numbe·r 1 than in subsequent tests. One significant fac
tor, that of pH, will be discussed later.
The plus and minus. strains of Q. reinhardtii grow at
the same rate in TBIM. Cain ( 1 963 ) found that using
-37-
Bold ' s Basal Medium enriched with vitamins ( BBMV ) and
using nitrate as the nitrogen souree , both strains grew
equally well. Using four different c oncentrations of KNO;
in TBIMV, Culp ( 1 971 ) determined that both strains showed
identical responses at each concentration. . In experiment
number 1 ( see Fig. J ) the difference in growth between the
plus and minus strains ranged from 1 to 5 percent • . Even
this slight difference in growth can be accounted for by
inequities in the amount of cells inoculated into the
cultures. Therefore, only one strain ( plus ) was used for
experimentation in this study. In· this way, the inocula
tion 'flasks which were derived from one stock culture
flask were more nearly equal in number of organisms , and
each test tube was more likely tb be inoculated with equal
numbers of cells . If both strains were used, it would
have been very difficult to inoculate the plus tubes and
minus tubes with the same number of algal cells. Thus , for
reliability and efficiency ' s sake , only one strain was
used .
Four milliliters of medium was used because that
amount of medium allowed the algae to quickly reach a
high density population. To use 5 ml or more of medium
would tend . to allow cells to become trapped in the cotton
plugs during agitation and cause inaccurate Spectronic 2 0
readings .
-38-
Procedure
Stock cultures and inoculation cultures were grown
in 50 ml cotton-s�oppered flasks in the Sherer Controlled
Environmental Chamber. Both were grown in TBIM under
standard conditions . TBIM proved to be a good medium for
this purpose because it qu�ckly produced large amounts of
high density populations for inoculation. Stock cultures
were transferred axenically every week into new medium by
autoclaved pipettes. Frequent transfers into new medium
prevented cultures from growing erratically because of
senility. Each time new cultures . were prepared , they were
tested for possible contamination with Bacto-AC broth
mediumJ and streaked out on Bacto-Nutrient Agar3 slants .
The desired ppm values were selected and the stock
solution equivalents calculated. The day before inocula
tion, 'the media were pipetted into each tube and the pH
was adjusted to 7 .4 by adding HCl. The c oncentration of
phosphate usually determined the · amount of diluted l N
HCl to be added.. Th.e pH had to be adjusted in each tube
because each tube usually had a d ifferent concentration of
phosphat�. The pH was checked by the use of a Coleman Met
rion IV pH. meter4 with a Semi-Micro Combination pH Electrodes
Joifc·o Laboratories , Detroi t, Michigan. 4·coleman Instruments , Division of Perkin-Elmer Corp. ,
42 Madison Street, Maywood , . Ill. 60153 .
S.scientific Instruments , Corning Glass Company.

-J'9-
which will fit into a ! in. Spectronic 20 test tube.
The labeled tubes were next stoppered with cotton
and autoclaved for 20 minutes at 250°F. The media were
allowed to cool for 24 hours. The inoculation cultures
were grown in flasks for exactly 7 days. Each flask was
used for the inoculation of 20 tubes of test media.
Sterilized pipettes and bacteriological procedures were
used to maintain axenic conditions. One drop of inoculwn
was used to minimize the amount of carry-over nutrients
in the inoculum. . Three to ten tubes in each test had
identical medium in them (see Table 7 ) to increase the
accuracy of the results. The data plotted in the results
section are the average values of the tubes at each con-
centration • .
Along with the tubes with various nutrient concentra
tions, there were control tubes with TBIM and TBIM-S , and
one uninoculated TBIM tube used as a c ontrol and to zero
the Spectronic 20. The amount of growth in the TBIM
controls would tend to indicate differences in the amount
of inoculated organisms and how other concentrations com
pared with a known optimum level concentration. The
TBIM-S control reveals the base line growth or amount of .. growth due to stored nutrients from the .inoculation media.
After 20 inoculations , each flask was tested with
AC broth for contamination. The test cultures were then
placed in ·the environmental chamber 6 hours into the 12-
hour light phase . Exa�tly 6 days later and in the middle

-40-
of the light. phase , the cultures were evaluated with a
Bausch and Lomb Spectronic 20 spectrophotometer6 • Each
tube was asitated by a Vortex Junior Mixer? for 20 seconds
to insure a uniform distribution of cells for a more
accurate reading • .
The Spectronic 20 was set at a waveleneth of 645
millimicrons . At this wavelength, mainly chlorophyll-a
will be measured . It must be kept in mind that an in
crease in chlorophyll i s interpreted as an increase in
biomass or growth. This is probably due to the increase
in number of cells , but there i s a remote chance that
the cells increased in size but not in number . Data
consists of values from the percent transmittance scale
on the Spectronic 20 . The percentage reading i s inversely
proportional to the amount of growth • . That is , the lower
the percent transmittance, the higher the growth.
6Bausch and Lomb Incorporated , Rochester, New _York. . .
?scientific · Industries Inc . ,. Queens Village , New York.

-41-
TABLE 7 . Experimental conditions of each · J ·� the ten experiments i� this study
Exp. no. 1 2 J 4 5 6 7 8 9 10
Day/night 14/ 12/ 12/ 12/ 12/ 12/ 12/ 12/ 12/ 12/ l ength 10 12 12 12 12 12 12 12 12 12
pH 7 . 2 7 . 4 7 . 4 7'.4 7 . 4 7 . 4 7 . 4 7 . 4 7 . 4
No. o f drops inoculum
2 1 1 1 1 1 · 1 1 1 l
Temp. OC 20 22 22 22 22 22 22 22 22 22
ml of medium 5 4 4 4 4 4 4 4 4 4 in each tube
Length of 12 6 6 6 6 6 6 6 · 6 8 culture in days
No. of tubes 10 _ J } J 3 4 4 6 4 per c one.
Strain used +, - + + + + + + + + + Inoculation TBIM TBIM TBIM TBIM TBIM TBIM TBIM TBIM TBIM Depletion culture medium medium
Length of 7 7 7 7 inoculation
7 7 7 7 7 21
culture

RESULTS
15 - ---
20 [ - + - I -� ----
25 ,_
30
35
!10
45
50
55 I I ,, I I +:-60 I- I I I "'
I
65
70
75
80
% 85 I rans .
90
7 9 10 ll 12 days Fig. 3 (Exp. no . 1 ) . Growth curve of Chla.;rYdomonas reinhardtii + and - strains in 1.XTBIN.
30
JS
Lo
LS
50
55
60
6S
70
15
80
% 85
\ "\exp. , 3 lrans ,
L exp. 2 90
95 '.
1 10 20 JO LO 50 60 70 80 90 100 200 300 !100 500 600 700 800 900 1000 2CC{I 3CC'O LCC0 oor:: � .33 J.3 6.6 10 13 16 20 23 26 30 33 66 100 133 166 200 233 266 300 333 666 10('(' 1333 �m P .01 .11 .22 .32 .43 .SL .6S .7S .86 .97 1 . 1 2.2 3 . 2 L .3 .s . L 6 . S 7.S 8.6 9.7 10.8 21.5 32.2 h3 �! P/l
Fig . L (Exp. no . 2 and 3) . Ranee of growth of C . reinhardtii (+ strain) at various phosphate concentrations, with nitrates in the optinrum ranee.
-
I +\....> I

30
35
LO
. 45
50
55
60
65
70
15
80
% 85 �r-ans .
90
95
•.
1 20 40 60 80 100 200 Loo 600 800 1000 2000 3000 Loco 6000 .23 L .6 9 . 2 13 .8 18.L 23 46 92 138 18L 230 L6o 690 920 1380
.016 .32 .66 .99 1 .3 1 .6 3.2 6.6 9 . 9 13 16.4 32.8 49.2 65.6 98.5
exp. 5
I I I I I 8000 10000 12CCC' 1840 23C'O 2760 131.4 164 .2 197.1
Fig . 5 (Exp. no. 4 and 5 ) . Range of growth of C. reinhardtii ( + strain) at various nitrate concentrat"!.ons , with phosphates in the optimum range.
-
ppm NCJ p�rn N ?r�I N/l
I +:+:I

"' Trans.
25
30
35
4-0
45
50
55 t 60
65
70
75
80
85
90
95
0 .
-45-
. 3 .6 1 2 3 4 5 6 7 8 9 10
. 1 .2 .33 .67 1 1.3 1 . 7 2 . 2 . 3 2 . 6 3 3 . 3 • 003 .006 .011 : . • 021 · .032 - .o4 .054 .06 .074 .083 .096 .11
4{) ppm P04 13 ppm P
.43 mM P/l
Fig. 6 (Exp. no. 6 ) . Growth of c. reinhardtii (+ strain) in the low range of phosphate ·ooncentrations , with nitrates in the optimum range.
·

30
35
Lo
L5
50
55
(£)
. 65
70
15
80
% 85
1:-ans •
. �90
95
o .5 i 5 io 15 20 25 30 · 35 Lo L5 5o 55 6o 65 10 15 Bo es 90 95 ico .12 .23 i . 2 2.3 3 .L L .6 S . 7 6 , 9 8 . o 9,2 io.3 11".) ·12.6 13 .8 11 .9 16 17 18.4 19.5 21 22 23
.008 .016 .08 .16 .2L .32 .Lo .L9 .57 .66 .73 .82 .89 .99 1.06 1 .16 1.2 1 .3 l.L 1.5 l.SL 1.6
Fig. 7 (E>ep. no . ? ) . Growth of C . reinhardtii (+ strain) in the low range of nitrate concentrations , with phosphates in the optilTllln range .
ppm NOJ ppm N mN N/l
I +:-°' I

. . ' - - -,-·-. ' .
j- - -1 I I L-- -· I I
I
· I
I -1--
1 1 ·
� -· _ _ l _ I I I I
, --1 I I - -1 �
' I I I
u1----r- I 1- -1 I
-1 - -1
- -, -
I I
- -I -I
I
-47-
I I I
__:. _ + I I I
- - - l-1 I I
_ _ j_
I Wn ppm mM PP4 P P/1
I . - - T - - , -- -r' � 1 . oo;
I I I
- - - - - - - - - - -� 6 .2 .o� I I I
I I I -- -l- - - _ _ I - - - -� .JJ .01 I
I I
- - - 4 �66 .02 I --1-
l�----t-r-----+�-- I I
. I _ _ _J .
I I I I
- + - - __ I I �--
1 I - 1-. I
I I
--- --b �99 . OJ
I . I I
I .
I - --- -14 1 . ; .o4
I I .
I
I
I I I
-5 1.7 .05 I I I I I
1 1 I I I - - _ J - - - _1 _. _ _ _ _ l _ _ _ _ _i -·· ___ _J _ _ _ _
l
ppm NO; , 1 ppm N .23 111M N/l • 016
5 10 20 JO 40 1 . 1 5 2 . 3 4.6 6 . 9 9.2 .
. • 082 .16 .32 .49 .66
10 J.J . 1 90
20.7 1 . 5
Fig. 8 (Exp. no. 8 ) . Growth of .£. reinhardtii (+ strain) at various combinations of phosphate and nitrate concentrations. The relative amount of growth of each nutrient combination (dash line grid) is represented by the amount of dislocation of the solid line grid.

30
35
Lo
45
50
55
60
65
70
75
80
% 85 Jr an�
95
� 3 i-f I > I )
J-7
7 7 . 9 9. 10
. .._, H ..,
< < I I (�������--4
Fig. 9 (Exp. no . 9) . Growth of c . reinhardtii (+ strain) at s�lected pH levels. rur.mmt of pH shift, before cmd after cul tu ring .
Arrows denote direction and
11 p:{
I � CX> '

-49-
40
45
55
60
70
75
80
� 85 Trans ., ,
90
95
0 .3 . .6 1 2 3 4 5 6 7 8 9 10 .1 .2 . JJ .67 1 1 . J 1 . 6 2 2 . 3 2 . 6 3 J.J
. 003 .006 .011 .021 .OJ2 .04 .05 .064 .0?4 . 08 .096 . 1 1
40 13
.4J
ppm P04 ppm p mM P/l
Fig. 10 . (Exp. l')O. 10). Growth of f• reinhardtii (+ strain) in the'.low range of phosphate concentrations, with nitrates in the optimum range. Inoculation cultures were grown tor 21 days 1n 10 ppm P04 anq 90 PFm N03•

-50-
TABLE 8 . Morpholoeical characteristics of Chl�mydomonri.s reinhnrd �ii at different nutrient levels
Hit;h Phosphate &
HiB;h Nitrate a
Low Phosphate &
Low Nitrate i
Cells green1 non-motile a proteinaceous sheath around each cell a 2 to 4 cells
· per clump ; cells granular in appearance .
Cells green s l arge clumps of many cells i non-motile i no sheath.
Cells nearly transparent ; solitaryJ slightly motile ; very large vacuol e .
Same as above .
Optimum Nutrients & Cells green s highly motile a solitary ; · small vacuole •.
TABLE 9 . Results o f the growth in the TBIM and TBIM-S controls
Exp. no.
TBIM
TBIM-S
2
32
90
J
27
89
4
27
89
5
J2
90
6
31
88
7
31
88
8
51
90
9
39
89
10
44 per
cent 90 trans.

-51-
DISCUSSION
Experiment number 1 established that the plus and
minus strains of Chlamydomonas reinhnrdtii grew at the
same rate . These results confirm ·the earlier works of
Cain ( 1 963 ) and Culp ( 1 971 ) . This experiment led to the
use of only one strain (plus strain) throughout the re
mainder of the experiments . The results of this experi
ment were also used to determine the length of the culture
period. It was determined that the optimum measurement
of the relative amounts of growth is made in the middle of
the exponential growth phase. From this experiment , it
was found that after 6 days of growth , 45 percent trans
mittance was reached. Even in later experiments , which
attained higher levels of growth , 6 days proved to be
the best length for the culture period. Even the highest
growth levels remained in the exponential growth rate
range and were not stifled ,by the cell density of the
senescent stage (15 to 25 percent transmittance ) .
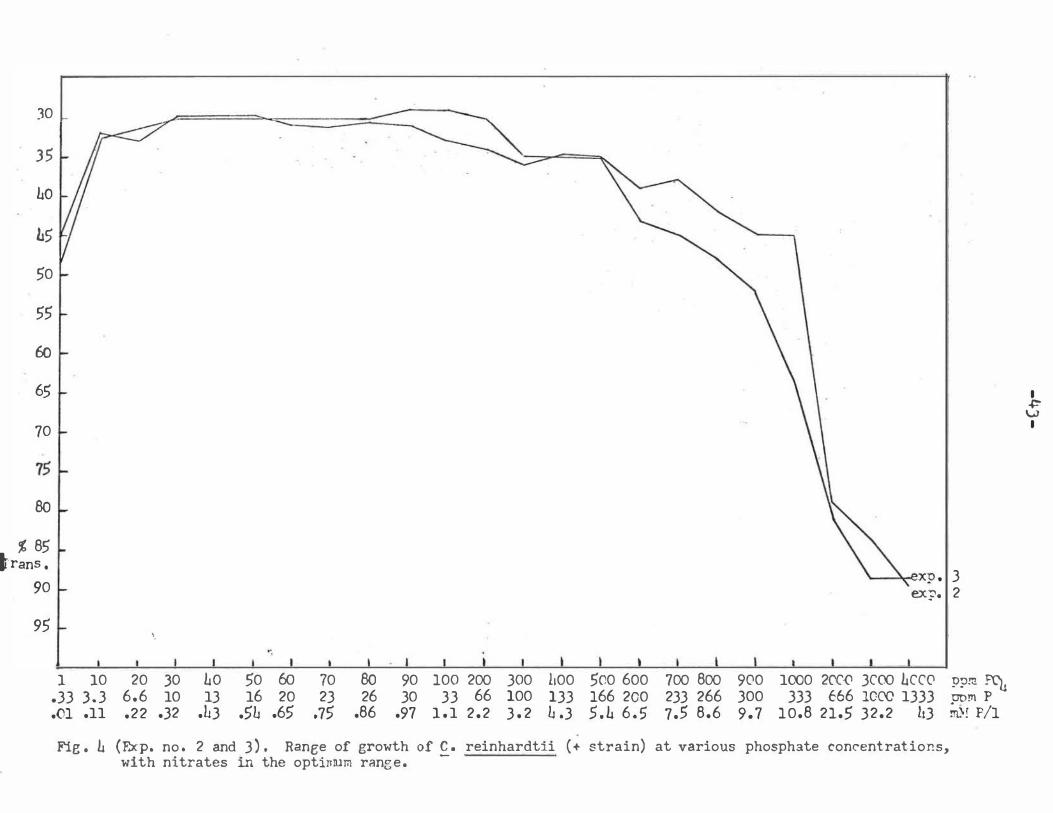
Experiments 2 and J were run separately. These ex
periments employed a wide range of phosphate concentra
tions with only one concentration of nitrate. The nitrate
concentration was the same concentration found in TBIM
(125 ppm N03 ) and proved to be in the optimum growth
range for nitrates . The specific purpose of experiments
2 and J was to determine the upper optimum growth limit
and up'per growth limit for phosphate .
The SO . percent transmittance reading was used to
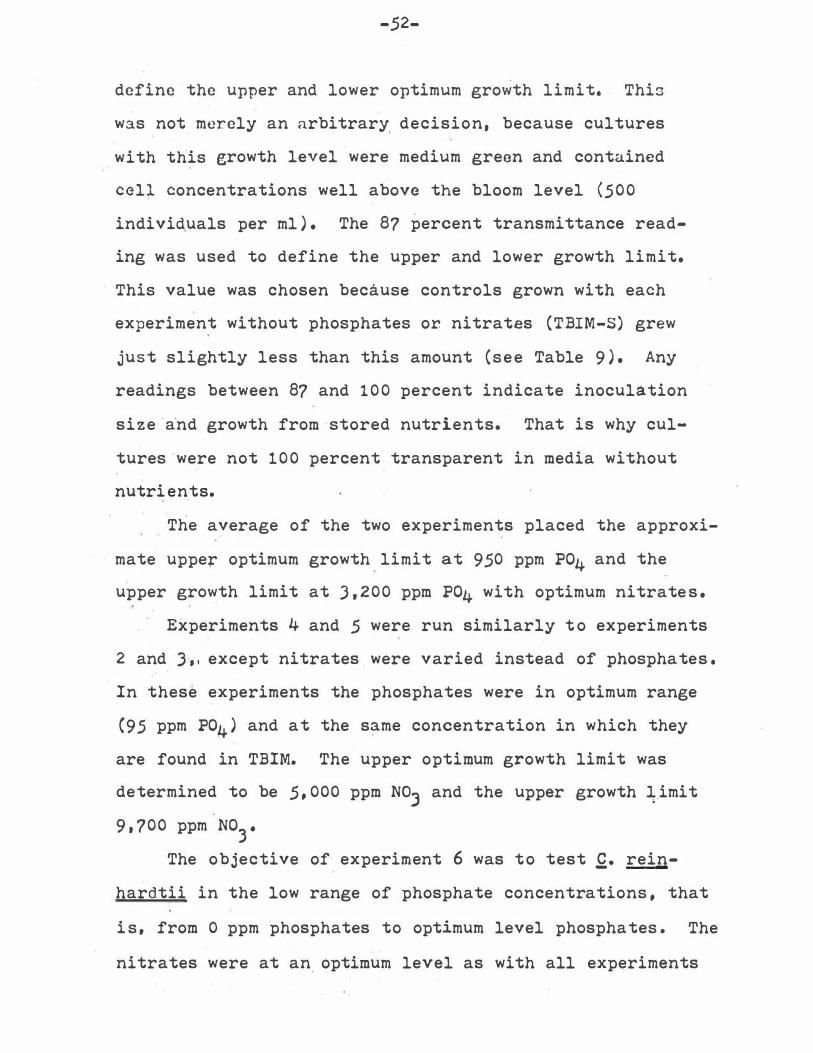
-52-
define the upper and lower optimum growth limit. ThiG
was not merely an arbitrary decision. because cultures
with this growth level.were medium greon and contained
eel� concentrations well above the bloom level (500
indivi�uals per ml ) . The 87 percent transmittance read
ing was used to define the upper and lower growth limit.
This value was chosen because controls grown with each
experiment without phosphates or. nitrates (TBIM-S) grew
just slightly less than this amount (see Table 9 ) . Any
readings between 87 and 1 0 0 percent indicate inoculation
size and growth from ·stored nutrients. That is why cul
tures were not 1 0 0 percent transparent in media without
nutri ents.
The average of the two experiments placed the approxi
mate upper optimum growth limit at 950 ppm P04 and the
upper growth limit at J . 200 ppm P04 with optimum nitrate s .
· Experiments 4 and 5 were run similarly t o experiments
2 and J ·, , except nitrates were varied instead of phosphates .
In these experiments the phosphates were in optimum range
(95 ppm P04 ) and at the same concentration in which they
are found in TBIM. The upper optimum growth limit was
determined to be 5 , 000 ppm NO; and the upper growth �.imi t
9 . 700 ppm N03
•
The objective of· experiment 6 was to test Q. rein
hardtii in the low range of phosphate concentrations , that
i s . from 0 ppm phosphates to optimum level phosphates . The
nitrates were at an optimum level as with all experiments

-53-
of this type . I t was hoped that this experiment would
yield the lower optimum growth limit and the lower growth
limit for phosphates . The results indicated (see Fie . 6 )
high growth even with 0 ppm Po4• The control tubes with
no phosphates or nitrates ( TBIM-S ) (see Table 9 ) yielded
low growth and the optimum nutrient controls (TBIM ) indi
cated high growth. The solution to this paradoxical prob
lem was not found until experiment 1 0 .
Experiment 7 was a test of the low range of nitrate
concentrations with an optimum level of phosphate . The
results indicate that the lower optimum growth limit is
approximately JJ ppm NO; and the lower growth limit is 2
ppm No3• These data agree favorably with the results of
experiments 4 and 5 which tested the same area of concen
trations but less precisely.
Experiment a·-·was an attempt to dramati z e , with the.
use of a )-dimensional graph, the growth of Q. reinhard tii
with various combinations of nitrates and phosphates .
This is in contrast to earlier experiments which tested
various .concentrati ons of one nutrient while keeping the
other nutrient at an optimum leYel. The concentrations
used in this experiment were supposed to represent t�e
low growth to optimum growth ranges. Ho.wever, high growth
was again found with the low phosphate concentrati ons as
was the case in experiment 6 . The results of experiment
8 show li t'tle difference in growth from the lowest to the
highest concentrations of phosphate. At low nitrate

-54 -
c oncentrations , tho phosphate levels had no effect. At
hir;her nitrate levels , · an increase in phosphate caused a
slight increase in the amount of growth. In high and low
concentrati ons of phosphates , an increase in nitrates re
sulted in an increase in growth . Clearly, in all combi
n�tions , the controlling influence was the nitrate concen
tration • . This was nore m�nifest in the lower concentra
ti ons of nutrients than in the higher concentrations . The
lowest growth was found in the lowest concentration of
nitrate. The highest growth was found in the highest
combination of nitrate and phosphate levels .
Experiment 9 tested the growth response of Q. rein
hardti i to a wide range of .PH values . The pH in each tube
was adjusted with HCl or NaOH to the desired value. One
day later the pH was checked and readjusted if needed , and
autoclaved.. The final pH was measured at the termination
of the experiment.. The TRIS buffer was not added to the
tubes below the ad j usted pH �f 6 . 5 . The media buffered well
from a pH of 6 . 5 to 8 . 5 with pH shifts toward these values
by lower and higher adjusted pH values. The lower growth
l{mit was estimated t o be J . 4 and the upper growth limit ,
1 0 . 9 . The l ower optimum growth limit and upper opti�um
growth limit were 7.2 and 1 0. 2 , respectively. These fig
ures indicate a distinct preference for the alkaline pH
and that its upper optimum growth limit is very close to
the maximum toxic pH level . Nielson ( 1 955 ) found that
photosynthesis is inhibited in most algae at pH values
-55-
between 10 and 1 1 .
Experiment 10 had the same purpose as experiment 6 ,
that i a , to test the low range of phosphate concentrati ons .
Experiment 1 0 was identical to experiment 6 except that
the inoculation cultures were grown for 21 days in deple
tion medium instead of 7 days in TBIM (see Table ? ) . The
depletion medium had a concentration of 90 ppm NO; and
1 0 ppm P04 , while TBIM has a concentration of 125 ppm NOJ
and 95 ppm P04. The lengthy inoculation culture period
and the use of depletion medium would prevent the luxury
uptake and storage of phosphorus from the inoculation
medium. Phosphorus can be taken up by cells far in excess
of present needs when the phosphorus concentration i s
high. This stored supply can maintain growth even when
the external phosphorus concentration is very low (Macke
reth, 1953 ) . This phenomenon of luxury consumption of
phosphorus would explain why Chlamydomonas grew so well ,
even in media devoid of phosphorus in experiment 6 . The
cells had absorbed enough phosphorus from the inoculation
cultures to promote growth in the test cultures . This
mechanism also showed up in the results of experiment 8 .
I n the l ow nitrate concentrations , the phosphates were
not limiting, even at the lowest phosphate concentrations.
Tha high nitrate concentrations began to show phosphate
limitation at the lower phosphate levels . This i s be
cause the stored phosphorus was not adequate for the high
growth promoted by the elevated nitrate levels. Growth

-56-
l evels then depended . on the phosphate levels in the media .
There was no such problem with nitrate carry-over because
nitrates are needed in larger quantities than phosphates
and are not stored by algae to any great extent (Gerloff
and Skoog, 1954 ) .
The length of the culture period was 8 days inst�ad
of . the usual 6 days . This' was because the inoculation
cultures were grovm for 21 days instead of 7 days. The
long inoculation culture period increased the lag phase
in the test cultures . To obtain a high yield , the length
of the test culture period was increased to 8 days .
From this experiment , the l ower growth limit was
0 . 07 ppm P04 and the lower optimum growth limit 3 ppm P04 .
The summary of the nutrient limits for Chlamydomonas
reinhardtii is as follows :
ppm P04 ppm P04/P
ppm NOJ ppm NOJ/N
Lower Lower Optimilm Upper Optimum Upper Growth Limit Growth Limit Growth Limit Growth Limit
0 . 07 0 . 023
2 . 0 o . 46
3 . 0 1 . 0
33 7 . 6
950 317
5 , 000 1 , 150
3,200 1 , 066
9 , 700 2 , 2Jl
This organism has an extraordinarily wide growth
range . For this reason, it would make an excellent
n�trient bioassay test alga. . It is very resistant to
extremely high concentrations of nitrate and phosphate.
Algae tested by Chu ( 1 943 ) showed marked inhibition in
c oncentrations of phosphorus or nitrogen above 45 ppm.
-57-
Tho tbxic levels of these nutrients with regard to phyto
plankton cannot be generalized from the seven algae test
ed by Chu. Some scientists advocate the increase in
�utrient levels of hypereutrophic waters in order to
reach toxic concentrations . Acknowledgment of the resis
tance of c . reinhardtii to high nutrient concentrations
should discourage that hypothes i s .
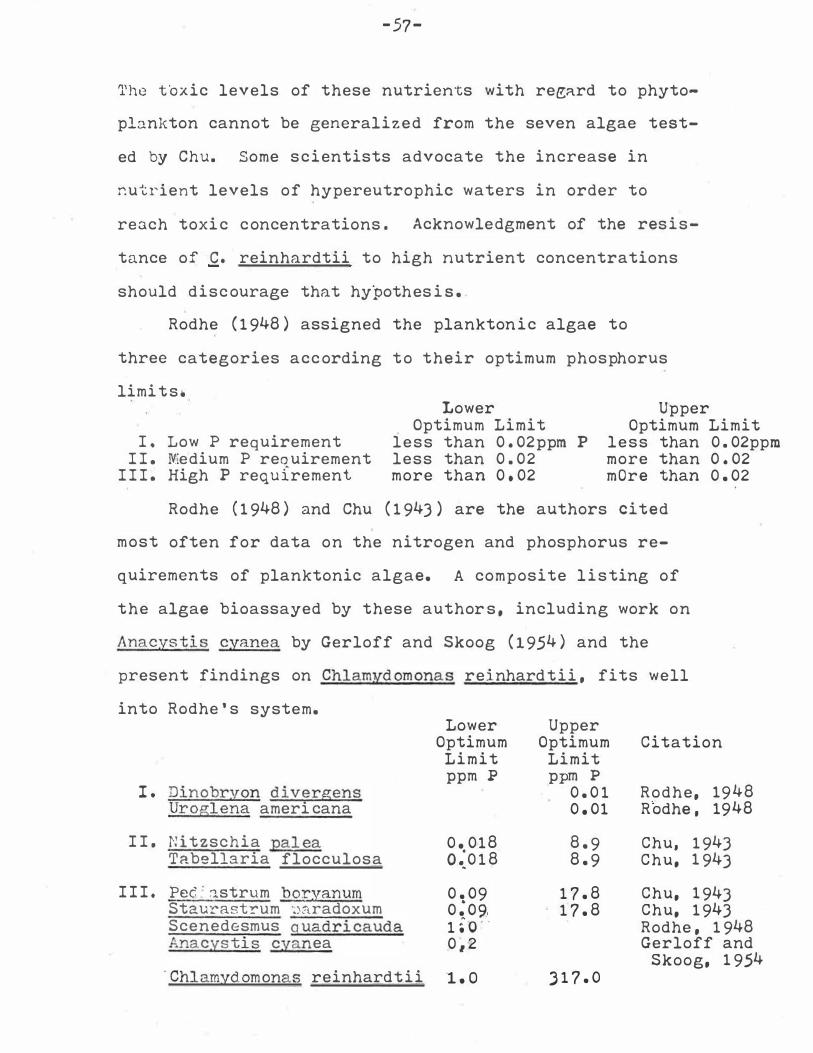
Rodhe ( 1 948 ) assigned the planktonic algae to
three categories according to their optimum phosphorus
limits. Lower Upper
I. Low P requirement I I . OCedium P reauirement
III. High P requfrement
Optimum Limit less than 0 . 02ppm P less than 0 . 02 more than 0 , 02
Optimum Limit less than 0 . 02ppm more than 0 . 02 more than 0 . 02
Rodhe ( 1 948 ) and Chu ( 1 943 ) are the authors cited
most often for data on the nitrogen and phosphorus re
quirements of planktonic algae. A composite listing of
the algae bioassayed by these author s , including work on
Anacystis cyanea by Gerloff and Skoog ( 1954 ) and the
present findings on Chlamyd omonas reinhardtii , fits well
into Rodhe ' s system. Lower Upper
Optimum Optimum Citation
r .
I I .
I I I .
Dinobryon divergens Uroglena ameri cana
Nitzschia palea Tabellaria flocculosa
Ped ' astrum boryanum Staurastrum �aradoxum Scenedesmus guadricauda Anacystis cyan ea
· Chlamydomonas reinhardtii
Limit ppm p
0 . 018 o.: 0 1 8
0 . 09 .
0 "09. 1 • 0 " " 0 , 2
l .. O
Limit ppm p
0 . 0 1 Rodhe, 1948 0 . 01 Rodhe , 1948
8 . 9 Chu, 1 943 8 . 9 Chu, 1 943
1 7 . 8 Chu, 1 943 1 7 . 8 Chu, 1 943
Rodhe , 1 948 Gerloff and
Skoog, 1 954 ; 1 7 . 0
-58-
-
It is interesting to note that group I i� composed of
Chrysophy c ea e , group II Diatomaceae , and group III Chloro-
phyta 8nd Cyanophyta.
Along with similar phosphorus requirements , Scenedes-
r. n � s n undri c:-�uda , Anacys t i s cyanea, and Chlamycl omonn.s
rei::'lh:l rdtii have similar lower optimum nitrogen require-
ments , 5 . 0 ppm N , . 8.0, and 7 . 6 , respectively. Palmer
( 1 969 ) ranked these three genera among the top 20 most
organic polluti on-tolerant genera of algae . Perhaps to I
Rodhe ' s list should be added a four.th category with a l ower
optimtim limit of 0.2 ppm P and inclusion of nitrogen re-
quirements u s part of the criteria for categorizing algae.
Average domestic sewage has a concentration of 61 . 3
ppm N and 10. 7 ppm P (Oswald , 1 960) . Both of these
nutrient levels are within the optimum range of Q. rein
hardti i . Many species in the genus Chlamydomonas are
known to inhabit sewage stabilization ponds (Eppley and
Macias , 1962 ; Singh and Saxena , 1969 ) . Although ecologi-
cal data on Chlamydomonas reinhardtii are virtually non
existent, the findings of this study and the general
e c ological preference of this genus indicate that this
organism occurs in eutrophic bodies of water or othe�.
high nutrient situations.
The data show that the optimum levels of nitrogen
and phosphorus for this organism are far above the minimum
algal bloom c oncentrations ( see Table J ) . In fact, the
l ower growth limit i s above all the recommended
-59-
bloom concentrations except those by Mackenthun ( 1 968 )
and Prescott ( 1 968 ) . This reinforces the concept that
this alga h�s high nutrient requirements •
. Ecological data alone are not sufficient to deter
mine the nutritional requirements of an alga. Blooms of
blue-green algae may be found in waters with very low
a�ounts . of phosphates. The luxury consumption of phos
phates or other nutrients d�ring periods when nutrients
were abundant can lead to blooms even when nutrients are
scarce . Therefore , nutrient requirements of specific
aleae must be determined in the laboratory in order to
interpret the ecological data.
Laboratory data should not be the sole basis for
determining nutrient requirements either. Experimental
conditions can never accurately duplicate all the environ
mental conditions of the field. Organisms can adapt to
laboratory culturing and behave differently than they
ever would in natural environments . Field observations
and laboratory experiments must be examined together in
order to obtain reliable results .
The nutrient parameters found in this study are
accurate for this set of conditions , but how these
nutrient requirements vary with d ifferent levels of these
conditions or with the multitude of factors in a natural
habitat is still unknown.

-60-
SUMMARY
:i. . Chl8myd omonas reinh8.rd ti i was grown axenically in
various concentrations of phosphate and nitrate to
determine the range of optimum growth concentr�tions .
2 . Nutrient data o f this type i s only known for a few
select species of algae . The relationship between
nut�ient levels and algal growth ls an important
first step in understanding phytoplankton ecology
and the problem of eutrophication.
J . A TRIS-buffered inorganic medium, adjusted to a pH of
7 . 4 , with various concentrations of sodium phosphate
and potassium nitrate , was utilized in this study.
4 . The plus strain o f Q. reinhardtii was cultured in
cotton-stoppered spectrophotometer test tubes and
evaluated with a spectrophotometer at the end of 6
days of culture .
5 . The cultures were grown · in an environmental chamber
with a day/night length of 1 2 hours at 22oc and
illumination of 1 , 400 footcandles .
6 . The phosphate range of growth was 0 . 07 to J , 200 ppm
P04 with optimum growth from 3 to 950 ppm P04. The
nitrate range of growth was 2 to 9 , 700 ppm N03 with
optimum growth from 33 to 5 , 000 ppm No3 •
7 . Compared with other algae , c . reinhardtii has a wide
growth range and is tolerant of extremely high
nutrient concentrations . Thi·s alga has relatively

-61-
high nutrient requirements for survival and optimum
growth.

-62-
LITERATURE CITED
Artari , A . 1 91 3 . Zur . Physiologie der Chlamydomonaden. Jahrb. f . wiss • . Bot . 52 1 41 0-466 .
Bartsch , A . F. 1 968. Eutrophication. Outdoor Indiana 3J ( 4 ) I 4-5•
Bazin, M • . and G . w . Saunders . 1 971 . The hypolimnetic oxygen deficit as an index of eutrophication in Douglas Lake , Michigan. Mich • . Acad. 3 (4 ) 1 91-106.
Bayl i s , . J. R . 1 955. Effect o f microorganisms o n lengths of filter runs •. Water Works Eng •. 1 08 1 1 27-1 28.
Beeton, A . M. 1 969. Changes i n the environment and bi ota of the Great Lakes , p . 1 50-1 87. In a Eutrophica ti on 1 causes , consequences , . correctives. Proc • . Int. Symp . on Eutrophi cation. Nat. Acad . S c i , Washington, D . C�
Berg,. K . 1 958. Furesoundersogelser 1 950-54. Folia limnol. s cand . 1 0 . 1 89 p .
Cain�. B . J . 1 963 . The morphology, taxonomy, and physiology of certain Chlamydomonas-like alga e . Ph . D . Dissertation • . Univ. Texas.. 1 1 5 p . Austin, Texas • .
Chu, s . P . 1 942. The influence of the mineral compos i tion of the medium on the growth of planktonic algae. Part I . Methods and culture media • . J . Ec ol . 3 0 1 284-325 . .
���- · 1 943 . The influence o f the mineral composition of the medium on the growth of planktonic algae . Part I I . The influence of the concentration of inorganic ni trogen and phosphate phosphorus . J . Ecol . 31 1 1 09-148.
Cohen, s . G. and c . B . R e i f . 1 953 . Cutaneous sensitization to blue-green algae • . J. Allergy. 24 1 452-457.
Coker, R • . E . 1 968. Row , New York.
Stream s , lake s , ponds . 327 P •
Harper and
Cul p , w . H. 1971 . Comparative n itrogen nutrition of certain fresh-water algae. M. s . Thesis. Eastern Illinois Univ. 1 00 p . Charl eston , Ill.
Ebersold , w. T . 1 962. Biochemical geneti c s , p. 731 -737. In a R . A . Lewin ( ed . ) Physi ology and biochemi s try of algae . Acad . Press , New York.

-63-
Edmond s o n , w . T. 1 96 9 . Eutrophi cation in North America . p . 1 24-149. I n 1 Eutrophi cati on a causes , consequence s , corrective s . Proc . Int. Syrop. on Eutrophi cation. Nnt. Acad . S ci . , Washington , D. c .
• 1 9 7 0 . Phosphorus , nitrogen and algae in Lake ���\,·-ashington after diversion of sewag e . S c i ence 1 6 9 1 690-691 .
Ehrenberg , E . 1833 . Dritter Bei trag zur Erkenntis grosser Organisation in der Richtung des kleinsten Raumes . Phys . Abhandl • . 145-JJ6 .
Eins e l e , w . 1 93 8 . Uber chemi sche and colloidale chemi s che Vorgange in �is en-Phosphor-Systemen unter limnochemischen und limnoge ol ogi s chen Gesichtspunkten. Arch. Hydrobi o l . 33 • J61 -J87 .
Eppley, R. w . and R . F . Macias .· 1 9 6 2 . Metabolism o f Chlamvd omonas mundana in s e wage lagoons . In a Botanical Soci ety of Amer, , Oregon State Univ . , Corvall i s , August 1 96 2 . Amer • . J. Bot . 49 ( 6 Pt . 2 ) 1 6 7 1 ( abstrac t ) .
Eyster, c . 1968 . Mi croorgani c and microinorgani c reauirements for algae , p . 2 7 -J6 . In a D . F . Jackson ( e d . ) Alga e , man, and the environment. Syracuse Univ. Pre s s , Syracus e , New York.
Fitch , C . F . , L. M. Bishop , · W . L. Boyd , R. A . Gortne r , c . F. Rogers , and J . E . Tilden . 1 93 4 . Water bloom as a cause of p o i s oning in d om e s t i c animals . Cornell V e t . 241 3 0-3 9 .
Frindenegg , , I . 1 964 . Bestimmung d e s trophiegrades von seen nach der radi ocarbonmethod e . Naturwissenschaften 51 1 J68-J69.
Fruh , E . G . 1 967 . The overall picture of eutrophication . J . Water Pollut . Contr. Fed . 3 9 • 1449-1463 .
Fuhs , G . w . , S . D . Demmerl e , E . Canelli , and M . Chen. 1972 . Characterization of phosphorus-limited plankton �lgae, P • 1 1 3 - 1 3 3 . In : Nutrients and eutrd�hication 1 the limiting-nutrient controversy. Amer. Soc , o f Limnol . and Oceanogr. Allen Pre s s , Lawrence , Kansas .
Gerloff, G . 1 94 0 . Bei trage zur Kenntni s der Variabilitat und Systenatik der Gattung Chlamydomonas . Arch. ,Protistenk. 94 a J l l -502.

-64-
and F. Skoog. 1954. Cell contents of ni trogen arid phosphorus as a measure o f their availability for growth of Microcystis aerueinosa . Ecol ogy 3 5 1 J48 -353 .
Goldman, C . R . 1 9 6 0 . Molybdenum as a factor limiting primary productivity in Castle Lak e , Californi a . � c i ence 1 3 2 , 1 016-1 0 1 7 .
.Hasler, A . D . drainage .
--� · 1969. Bioscience
1 94 7 . Eutrophication of lakes by domestic Ecology 28 1 385-395.
Cultural eutrophication is revers i ble . 1 9 • 425-43 1 .
and w . G . Einsele. 1 94 8 . Fertilization for increasing productivity of natural inland waters , p . 521 -55 5 . Trans . Thirteenth N . Amer. Wildlife Conf.
and M. E . Swens on . 1 96 7 . Eutrophi cation. Science 1 58 1 278-2 8 2 .
Heise , H . A . algae .
1 951 . Symptoms o f hay fever caused by Ann. Allergy 9 • 1 00-1 01 . ·
Huber-Pestalozzi , G . 1 961 . Die Binnengewasser. Band XVI , Teil .5 ·
Hutchinson, G . E . 1 9 3 8 . On the relation between the oxygen d e f i c i t and the productivity and typology of lakes . Int. Rev. Hydrobiol . J o a 336-3 55.
���- · 1 96 7 . A treatise o n limnology. Vol . 2 . Introduction to lake biol ogy and the limnoplankton. Wiley and Sons , New York. 1 1 1 5 P•
Hyne s , H. B. N . 1 96 0 . The biology of polluted waters . Liverpool Univ. Press , Liverpool. 202 p .
Ingram , w . M . and G . w . Prescot t . 1 954. Toxic freshwater algae . Amer. Midland Naturalist 52 1 75-87.
Jarnefel t , H. 1 952 . Plankton als indikator der trophi egruppen der seen. Ann. Acaq . S c i . Fennicae A . � 4 a 1 -2 9 .
Kilham , P . 1 971 . A hypothes i s .c oncerning s i l i ca and the freshwater planktonic diatoms . Limnol . O ceanogr. 1 6 1 1 0 - 1 8 .
Kir.g, D . L . 1 9 7 0 . The rol e of carbon i n eutrophication. J . • Water Pollut. Contr. Fed. 4 2 1 2035-205 1 .
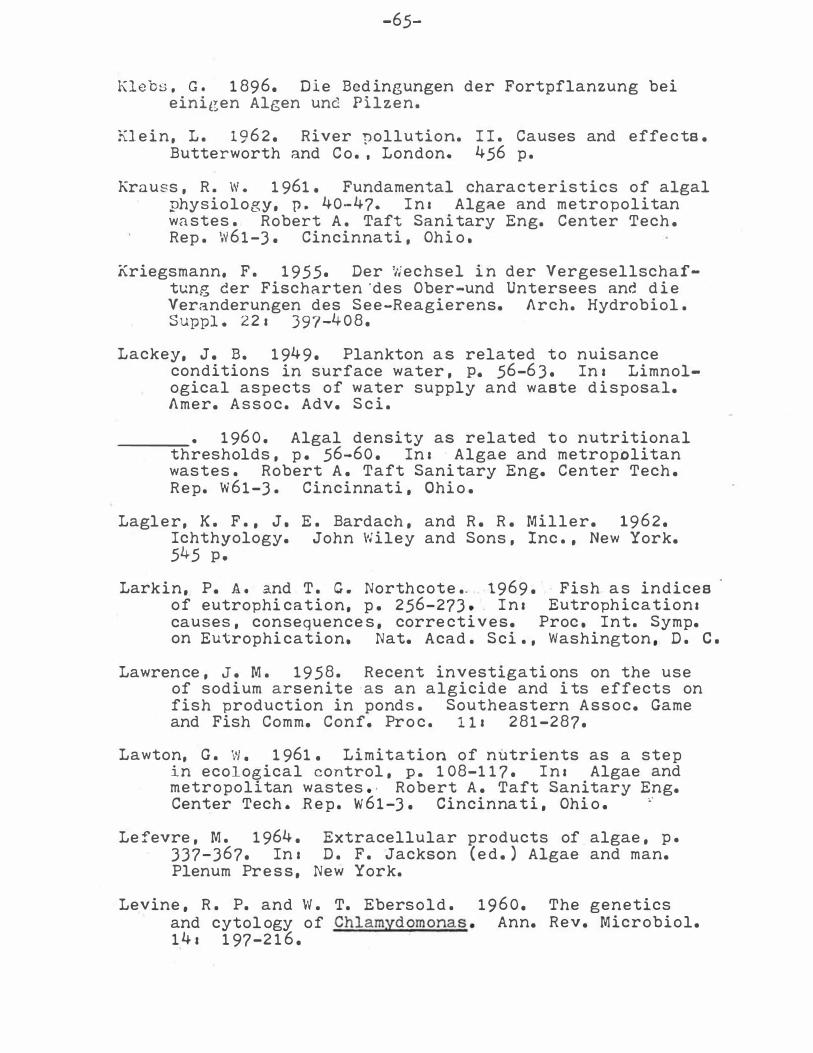
-65-
Klebs , G . 1 896. D i e Bcd ingungen der Fortpflanzung bei einigen Algen und Filzen.
Kl e i n , L . 1962. River pollution. I I . Causes and effe c ts . Butterworth and C o . , London. 456 p .
Krauss , R . w . 1 961 . Fundamental characteristics of algal physiology, p . 40-47. I n a Algae and metropolitan wa stes . Robert A . Taft Sani tary Eng. Center Tech . Rep . W61-3 . Cincinnati , Ohi o .
Kriegsmann. F . 1 955. Der Wechsel i n der Vergesellschaftung der Fischarten 'des Ober-und Untersees and d i e Veranderungen des See-Reagierens. Arch. Hydrobiol . Suppl . 22 a 397-408.
Lackey, J . B. 1 949. Plankton a s related to nuisance conditions in surface water , P• 56-6 3 . In a Limnological aspects of water supply and waste d i sposal. Amer. A s s o c . Adv. S c i .
���- · 1 960. Algal density as related t o nutritional thresholds , p . 56-60 . In a Algae and metropolitan wastes . Robert A . Taft Sani tary Eng. Center Tech . Rep. W61-3 . Cincinnati , Ohi o .
Lagler, K . F . , J . E . Bardach , and R . R . Miller. 1962. Ichthyology. John Wiley and Sons , Inc . , New York. 545 P •
Larkin, P. A . and T . G . Northcote .. 1969 . Fish a s indices of eutrophi cation, p . 256-273 • . I n a Eutrophicationa causes , consequence s , corre ctives. Proc . Int. Symp. on Eutrophi cation. Nat. Acad . S ci . , Washington ,, D . c .
Lawrence , J . M . 1958. Recent investigati ons on the use of sodium arsenite · as an algicide and i ts effects on fish production in pond s . Southeastern A s s o c . Game and Fish Comm. Conf. Pro c . l l a 281-287.
Lawton, G . w . 1 961 . Limitation of ntitrients as a step in ecological control , p . 1 08-1 1 7 . I n a Algae and metropolitan wastes • . Robert A . Taft Sanitary Eng. Cen�er Tech . R e p . W61-3 . Cincinna t i , Ohi o . �
Le fevre , M . 1 964 . Extracellular products of algae , p . 337-367. In a D . F . Jackson ( e d . ) Algae and man. Plenum Pre s s , New York.
Levine , R . P. and W . T. Ebersold . 1960. The genetics and cytol ogy of Chlamydomona s . Ann. Rev. Microbiol. 14 a 1 97-2 1 6 .

-66-
Lund , · J . w . G . 1950. Stud i e s on Asterionella formona a nutrient depletion and the spring maximum. J . Ecol . 38 1 1-J 5 .
• 1964 . Primary production and period i city of ---p.,....hytoplankton. Verh. int . Ver. Limnol.. 1.5 a 37-.56.·
--�- · 1 965. The ecol ogy of freshwater phytoplankton.
Biol . Rev. Cambridge Phi l . S o c . 40 1 231 -293 .
��__,_ · 1 96 9 . Phytoplankton , p . 306-328. Ina Eutrophica ti on a caus e s , consequences , correctives. Pro c . Int . Symp. on Eutrophica t i on . Nat. Acad . Sc i . , Washington, D . C .
---.,,,..,-, F . J . H . Mackereth, and C . H . Mortimer. 1 963 .
Changes i n depth and time of certain chemical and physical conditions and of the standing crop of · Asterionella formosa Huss • . in the north basin of '.\11.ndermere in 1 947 . Phil . Trans . Roy. Soc . , B . 246 s 255-290.
Lutsch, I . 1 932 . Ernahrungshysiologische Untersuchungen an Chlamyd omonaden.. Beih. Bot. Centralbl. 50 1 64-94 .
W.ackenthun, K . M . 1 968. The phosphorus problem. J. Amer. Water Works Assoc. 6 0 1 1 047-10.54.
-�--.,..,� · 1 969. The practice o f water pollution bi ology. U . S . Dep . of Interior , Washington, D . c . � 281 P•
and W . M . Ingram. 1 967. Biological a s s ociated problems in freshwater environments a their identificati on , investiga t i on and control . u. s . Dep . of Interi or , Washington , D. C . 287 P•
Mackereth, F . J . 1 953 . Phosphorus utilization by Asteri onella formosa Hus s . . J . Exp. Bot. 4 1 296-3 1 3 .
Maloney, T . E . , w . E . Miller , and T. Shiroyama . 1972. Algal responses t o nutrient additions i n natural waters . I . Laboratory assays , P• 1 34�140 . I n a �
Nutrients and eutrophi cation a the limitine-nutrient controversy. Amer. S o c . of Limnol . and Oceanogr. Allen Press , Lawrence , Kansas • .
Mattoni , R. H. T . 2 1 1 . I n s D. environment. York .
1 968. Trends · i n algal genetics , p . 201-F . Jackson ( ed . ) Algae , man and the Syracuse Univ. Press , Syracuse , - New
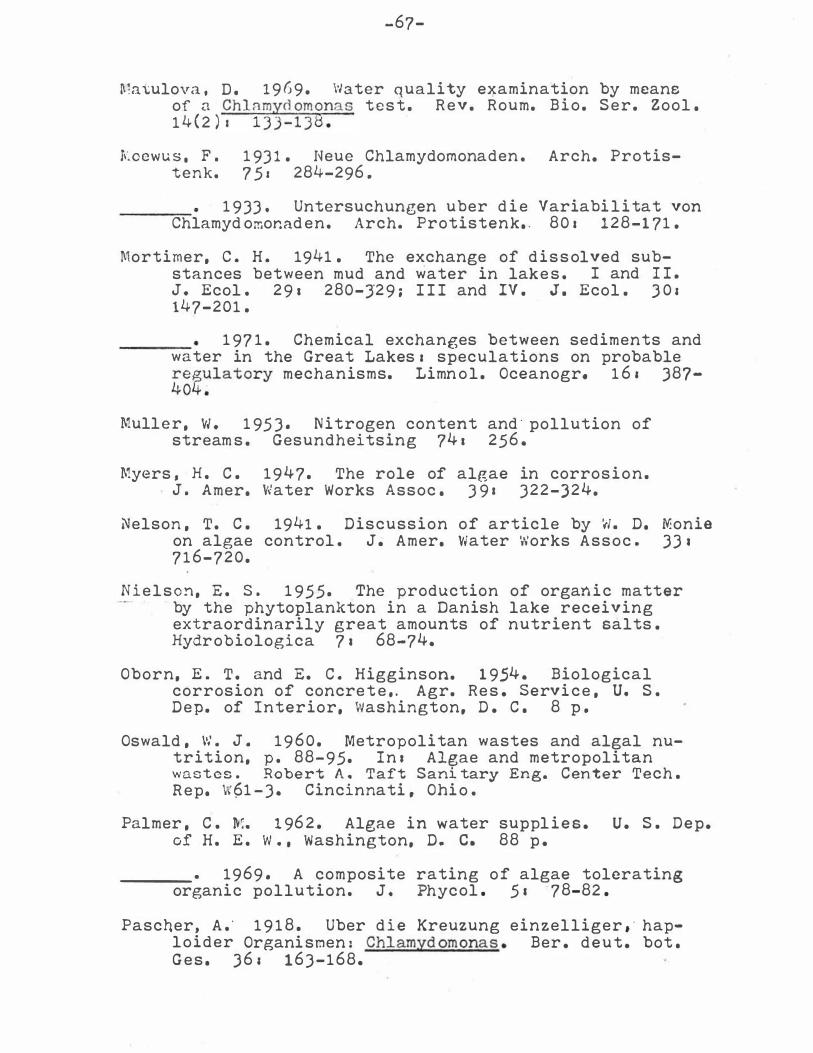
-67-
��atulova , D. 1 9 6 9 . \•Jater quality examination by meane of a Chlamyd omonas t e s t . Rev. Roum. B i o . Ser. Zool . 1 4 ( 2 ) ' 133-138.
�oewu s , F . 1 93 1 . Neue Chlamydomonaden . Arch. Protistenk. 7 5 , 284-296 .
���- · 1 933 . Untersuchungen uber d i e Variabi l i tat von Chlamyd omonad en. Arch. Protistenk. . 80 a 128-1 71 .
Mortimer, C . H . 1941 . The exchange of d i s s olved substances between mud and water in lake s . I and I I . J . Ecol . 29 1 280-}29 ; I I I and IV . J . Ecol . J 0 1 147-201 .
���- · 1 97 1 . Chemical exchanges between sediments and water in the Great Lakes a speculations on probable re gulatory mechanisms. Limn o l . Oceanogr. 1 6 1 J87-404 .
Muller, w . 1 95 3 . Nitrogen content and · pollution of stream s . Gesundheitsing 74 1 256 .
Myers , H . C . 1947. The role of algae in corros i o n . J . Amer. Water Works Assoc . 3 9 , 322-)24.
Nelson , T. C . 1941 . Discussion of article by w. D. Monie on algae control . J . Amer. Water Works Assoc . JJ • 7 1 6-720.
N i e l s o n , E . s . 1 955. The production of organ i c matter by the phytoplankton in a Danish lake receiving extraordinarily great amounts of nutrient salts . Hydrobiologica 7 • 68-74.
Oborn, E . T . and E. c . Higginson. 1 9)4 . Biological corrosion of concre t e . . Agr. Re s . Servi c e , U. S . Dep. of Interior, Washington, D . C . 8 p .
Oswald , w . J . 1 9 6 0 . Metropolitan wastes and algal nutrition, p . 88-95. In a Algae and metropolitan wastes . Robert A . Taft Sani tary Eng. Center Tech . Rep. �61 - 3 . Cincinnati , Ohi o .
Palmer , C . lf.. 1 96 2 . Algae in water suppl i e s . u. S . Dep. of H. E . w . , Washington, D. c. 88 p .
���- · 1969 . A composite rating o f algae tolerating organic pollution. J . Phyc.ol . 5 , · 78-82 .
Pascner, A . · 1 9 1 8 . Uber d i e Kreuzung einzelliger , · haploider Organi snen : Chlamyd omona s . Ber . d e u t . bot . G e s . J6 1 163-168.
·-68-
---- • 1 927 . Die Sussw�sserflora Deutschlands , Osterreichs und der Schwei z . Heft 4 . Gustav Fischer, Jena .
Pearsall , w . H . , A . C . Gardiner , and F . Greenshield s . 1 946 . Freshwater biology and water supply i n Britain. Sci . Pub. ,Freshwater ·Biol. Assoc . 1 1 . 90 p .
Pearse , A . s . Monogr.
1 934. Ecology of lake fishes. 4 t 475-480.
Ecol .
?owers , C . F . , D . w . Schults , K . w . Malueg , R. M . Brice , and M. D . Schuld t . ·1 9 7 2 . Algal responses to nutrient add itions in natural waters . I I . Field experiments , p . 1 4 1 - 1 56 . In z Nutrients and eutrophicat i on z the limiting-nutrient controversy. Amer. Soc . of Limnol. and Oceanogr. Allen Press , Lawrence , Kansas .
Prescott, G . w . 1 9 6 8 . The algae a a review. Houghton Mifflin Co. , Boston. 436 P •
Proctor, V . \'J . 1 95 7 , Studies of algal anibiosis using Hematococcus and Chlamydomonas. Limnol . Oceanogr, 2 1 1 25-139.
Rawson , D. s . 1 956. Algal indicators of trophic lake types . Limnol. Oceanogr. l a 1 8-25.
Rodh e , W � 1948, Environmental requirements of freshwater plankton algae . Symbolae Botanicae Upsaliensis l O ( l ) s 1 -149 .
Russell , w . D . and Hunter. 1 9 7 0 . Aquatic productivity s an introduct�0� to some bas i c aspects of biological oceanography and limnology. The Macmillan Co . , New York. 306 p .
Ruttner, F . 1963 . Fundamentals of limnology , Jrd e d • .
Univ • . Toronto Press , Toronto, Canada . 295 p .
Sager , R . 1 964. Stud i e s o f cell heredity with Chlamydomonas , p . 297-3 1 8 . In 1 Biochemistry and physiology of Protozoa, Vol . 3 . Acad . Press , New York. ··
and S . Granick. 1 953 . Nutritional studies with Chlam�domonas reinhardi • . Ann. N . Y. Acad . Sci • .
56: 3 1 -838.
and • 1 954. Nutritional control of sexu-ali ty in Chlamydomonas reinhard i , J . Gen. Physiol. 37 : 729-742.
-69-
Salaee�nu , N. 1 9 6 7 . Experiments with the mass culture of the ale;a Chlnmyd omonas in the laboratory H.nd in the open . Rev . Rourn . Bi o . Ser. Bot . 1 2 ( 2/J ) a 2 1 1 -2 1 7 .
Snwyer , c . N . 1 94 7 . Fertilization o f lakes by agricultural and urban drainage. J. New England Water Works A s s o c . 61 1 1 0 9 .
---- • 1 96 6 . Basic concepts of eutrophication . J . Water Poll u t . Contr. Fed . 3 8 1 737-744.
Schelsk e � C . L . and E . F; Stoermer. 1 9 7 2 . Phosphorus , s i l i c a , arid eutrophication o f Lake Michigan, P • 1 5 7 -1 7 1 . In a Nutrients and eutrophi cation 1 the limiting-nutrient controversy. Amer. Soc . of ·Limnol . and Oceanogr. Allen , Press , Lawrence , Kansas .
Schindler , D . w . 1 9 71 . Carbon, nitrogen, and phosphorus and the eutrophi cation of freshwater lakes. J . Phycol . 7 : 3 2 1 -329 .
Singh, V . P . and P . N . Saxena. 1 969 , Preliminary s t ud ie s on algal succession i n raw and stabi l ized sewage . Hydrobiologica J4 ( 3/4 ) a 503-51 2 .
Skulberg , O . M . 1 964. Algal problems related t o the eutrophi cation of European water supplies , and a . bioassay method to assess fertilizing influences of pollution on inland ·waters , p . 262-299 . In a D. F . Jackson ( ed , ) Algae and man. Plenum Pre s s , New York.
Smith, G . M. and D � Regnery. 1 95 0 . Inheritance of sexuality in Chlamyd omonas re inhard i . Pro c . Nat . Acad. Sci . U . s . 36: 2460248.
Smith, M . w . 1969 . Changes in environment and biota o f a natural lake after fertilization. J. Fish Res . Bd . Can. 26 & 3 1 01 -3 1 3 1 .
Smith, R . L . and V . E . Wiedeman. 1 964. A new alkaline growth medium for algae. Can. J. Bot. 42 1 1582-1 586 .
Steven s , j . c . 1 946. Butte Reservoir. 1 23 1 .
Future of Lake Mead and Elephant Tran s . Amer, S oc , , Civil Eng. ll l a
Strom , K . M . 1 92 8 . Production biology of temperate lakes,· Int . Rev , d . ges . Hydrobi o l , u . Hydrogr. 1 9 • 329-348 . ,-
-70-
Sylves ter , R . o . 1 96 1 . Nutrient content of d rnin8 ge water from forested , urban , and agricultural areas, p . 80-8 7 . In s AlBae and metropolitin wastes . �obert A . Taft Sanitary Eng. Center Tech. Rep. W61-J. Cincinnati , Ohi o .
Tanner , H . A . 1 96 0 . Some consequences of adding fertil i zer to five Michiean trout lake s . Amer • . Fish Soc. Trans . 89 1 198-205.
Thienemann, A . 1 92 8 . Der Sauerstoff im eutrophen und oligotrophen. Die Binnengewasser 4 . Stuttgart.
Thomas , E . A . 1 96 9 . The process of eutrophication in central European lakes , P • 29-49 . · In a Eutrophication 1 causes , consequence s , correctives. Proc. Int. Syrnp . on Eutrophication. Nat . Acad . S ci . , Washington, D . c .
Welch, P . S . 1 9 5 2 . Limnology. McGraw-Hill C o . , New York. 538 p .
Vihipple, G . C . , G . M . Fair, and M. C . Whipple . The mi.Jcroscopy of drinking water, 4th ed . and �ons , New York. 586 P •
1 948. Wiley