
Grey Wolf Optimization-Based Optimum Energy-Management ...
27
Energies 2018, 11, 847; doi:10.3390/en11040847 www.mdpi.com/journal/energies Article Grey Wolf Optimization-Based Optimum Energy-Management and Battery-Sizing Method for Grid-Connected Microgrids Kutaiba Sabah Nimma 1, *, Monaaf D. A. Al-Falahi 1 , Hung Duc Nguyen 1 , S. D. G. Jayasinghe 1 , Thair S. Mahmoud 2 and Michael Negnevitsky 3 1 Australian Maritime College, University of Tasmania, Newnham, TAS 7248, Australia; [email protected] (M.D.A.A.-F.); [email protected] (H.D.N.); [email protected] (S.D.G.J.) 2 School of Engineering, Edith Cowan University, Joondalup, WA 6027, Australia; [email protected] 3 Center for Renewable Energy and Power System School of Engineering, University of Tasmania, Hobart, TAS 7005, Australia; [email protected] * Correspondence: [email protected] Received: 26 February 2018; Accepted: 3 April 2018; Published: 4 April 2018 Abstract: In the revolution of green energy development, microgrids with renewable energy sources such as solar, wind and fuel cells are becoming a popular and effective way of controlling and managing these sources. On the other hand, owing to the intermittency and wide range of dynamic responses of renewable energy sources, battery energy-storage systems have become an integral feature of microgrids. Intelligent energy management and battery sizing are essential requirements in the microgrids to ensure the optimal use of the renewable sources and reduce conventional fuel utilization in such complex systems. This paper presents a novel approach to meet these requirements by using the grey wolf optimization (GWO) technique. The proposed algorithm is implemented for different scenarios, and the numerical simulation results are compared with other optimization methods including the genetic algorithm (GA), particle swarm optimization (PSO), the Bat algorithm (BA), and the improved bat algorithm (IBA). The proposed method (GWO) shows outstanding results and superior performance compared with other algorithms in terms of solution quality and computational efficiency. The numerical results show that the GWO with a smart utilization of battery energy storage (BES) helped to minimize the operational costs of microgrid by 33.185% in comparison with GA, PSO, BA and IBA. Keywords: battery energy storage sizing; optimization; energy management systems; economic load dispatch; grey wolf optimization (GWO); microgrid 1. Introduction With the ever-growing energy demand, greenhouse gas (GHG) emission reductions, energy- efficiency improvements, and adequate clean power have become major challenges in the energy sector. A promising solution to this issue is the development of microgrids with renewable energy sources such as solar, wind and fuel cells. The microgrids can be self-sufficient power grids (standalone microgrids) working with local sources or grid-connected microgrids attached to the conventional utility grid. Irrespective of the microgrids’ form, they have succeeded in reducing the CO2 amount and cutting energy costs [1,2]. However, due to the fluctuations and intermittency of renewable-energy sources such as wind turbines (WTs) and photovoltaic (PV) units, the utilization of storage devices has become crucial in the microgrids [3]. These storage devices can inject auxiliary
-
Upload
khangminh22 -
Category
Documents
-
view
0 -
download
0
Transcript of Grey Wolf Optimization-Based Optimum Energy-Management ...

Energies 2018, 11, 847; doi:10.3390/en11040847 www.mdpi.com/journal/energies
Article
Grey Wolf Optimization-Based Optimum
Energy-Management and Battery-Sizing Method for
Grid-Connected Microgrids
Kutaiba Sabah Nimma 1,*, Monaaf D. A. Al-Falahi 1, Hung Duc Nguyen 1, S. D. G. Jayasinghe 1,
Thair S. Mahmoud 2 and Michael Negnevitsky 3
1 Australian Maritime College, University of Tasmania, Newnham, TAS 7248, Australia;
[email protected] (M.D.A.A.-F.); [email protected] (H.D.N.);
[email protected] (S.D.G.J.) 2 School of Engineering, Edith Cowan University, Joondalup, WA 6027, Australia; [email protected] 3 Center for Renewable Energy and Power System School of Engineering, University of Tasmania, Hobart,
TAS 7005, Australia; [email protected]
* Correspondence: [email protected]
Received: 26 February 2018; Accepted: 3 April 2018; Published: 4 April 2018
Abstract: In the revolution of green energy development, microgrids with renewable energy sources
such as solar, wind and fuel cells are becoming a popular and effective way of controlling and
managing these sources. On the other hand, owing to the intermittency and wide range of dynamic
responses of renewable energy sources, battery energy-storage systems have become an integral
feature of microgrids. Intelligent energy management and battery sizing are essential requirements
in the microgrids to ensure the optimal use of the renewable sources and reduce conventional fuel
utilization in such complex systems. This paper presents a novel approach to meet these
requirements by using the grey wolf optimization (GWO) technique. The proposed algorithm is
implemented for different scenarios, and the numerical simulation results are compared with other
optimization methods including the genetic algorithm (GA), particle swarm optimization (PSO), the
Bat algorithm (BA), and the improved bat algorithm (IBA). The proposed method (GWO) shows
outstanding results and superior performance compared with other algorithms in terms of solution
quality and computational efficiency. The numerical results show that the GWO with a smart
utilization of battery energy storage (BES) helped to minimize the operational costs of microgrid by
33.185% in comparison with GA, PSO, BA and IBA.
Keywords: battery energy storage sizing; optimization; energy management systems; economic
load dispatch; grey wolf optimization (GWO); microgrid
1. Introduction
With the ever-growing energy demand, greenhouse gas (GHG) emission reductions, energy-
efficiency improvements, and adequate clean power have become major challenges in the energy
sector. A promising solution to this issue is the development of microgrids with renewable energy
sources such as solar, wind and fuel cells. The microgrids can be self-sufficient power grids
(standalone microgrids) working with local sources or grid-connected microgrids attached to the
conventional utility grid. Irrespective of the microgrids’ form, they have succeeded in reducing the
CO2 amount and cutting energy costs [1,2]. However, due to the fluctuations and intermittency of
renewable-energy sources such as wind turbines (WTs) and photovoltaic (PV) units, the utilization
of storage devices has become crucial in the microgrids [3]. These storage devices can inject auxiliary
Energies 2018, 11, 847 2 of 27
power to the grid during a power shortage or store the surplus power from the renewable sources
during off-peak load demands.
As mentioned above, the storage devices’ participation (charging/discharging) in microgrids is
essential to maintain the power balance. Nevertheless, excessive battery capacity would increase the
cost while a very small battery capacity results in insufficient power that leads to instabilities or
increases the cost of conventional fuel usage. Therefore, finding the optimum capacity or size for
storage devices is highly important for minimizing microgrid dispatch problems and optimizing
operation costs [4–6].
In addition, intelligent energy-management methods aim to specify the optimum size of the
battery, as well as reduce the use of conventional fuel and overall operating cost. As a result, several
types of research have been conducted to address the optimal sizing of renewable-energy sources.
The authors in [7] described the technical and economical sizing comparison of energy-storage
systems (ESS) with three renewable-energy sources PV, wind, and wave power, using a heuristic
optimization stand on an adaptive storage operation. Aghamohammadi and Abdolahinia [8]
determined the optimal size of the battery energy-storage system (BESS) based on the primary
frequency control of the microgrid. A mixed-integer linear programming algorithm was utilized to
address the optimum dispatching power flow in the microgrid, as well as the optimum sizing of
storage devices [9–14]. Meta-heuristic algorithms have been applied in the hybrid energy system to
find the optimal size of the battery devices in the microgrid [15–20]. A dynamic programming
algorithm was employed in [21,22] to find the optimal scheduling problem, considering the efficiency
and operating characteristics of storage devices in microgrids with isolated and grid-connected
modes.
A genetic algorithm (GA) was utilized in [23,24] based on an optimization method to find the
optimum sizing of microgrid components that consisted of a PV array, fuel cell (FC) and storage
device as well as distributed generation (DG) units under the hybrid electricity market. This method
was conducted to increase the lifecycle cost and minimize the GHG of the microgrid. However, some
researchers employed particle swarm optimization (PSO) to evaluate the optimum size of BESS at a
lower total cost [25–27].
Conversely, some researchers were concerned about minimizing the operation cost of the power
networks that affect the optimum sizing of the components of a microgrid. Ahmadi and Abdi [28]
demonstrated an efficient method that depends on a hybrid big bang–big crunch algorithm, which
reduced the total present cost of the system. A non-linear programming optimization model was
proposed to determine the optimal operation and sizing of the storage systems, reducing the cost of
the hybrid system while satisfying the service requirements [29]. Active distribution networks
(ADNs) are optimal operations used to minimize network losses, as well as the cost of power
imported from the external grid. Nick et al. [30] considered the ESS size which is the main factor that
affects the performance of ADNs. The differential evolution algorithm was utilized in [31] to
determine the size of the renewable-energy sources, reduce power losses, enhance voltage constancy
of the system, and reduce the cost in the microgrid.
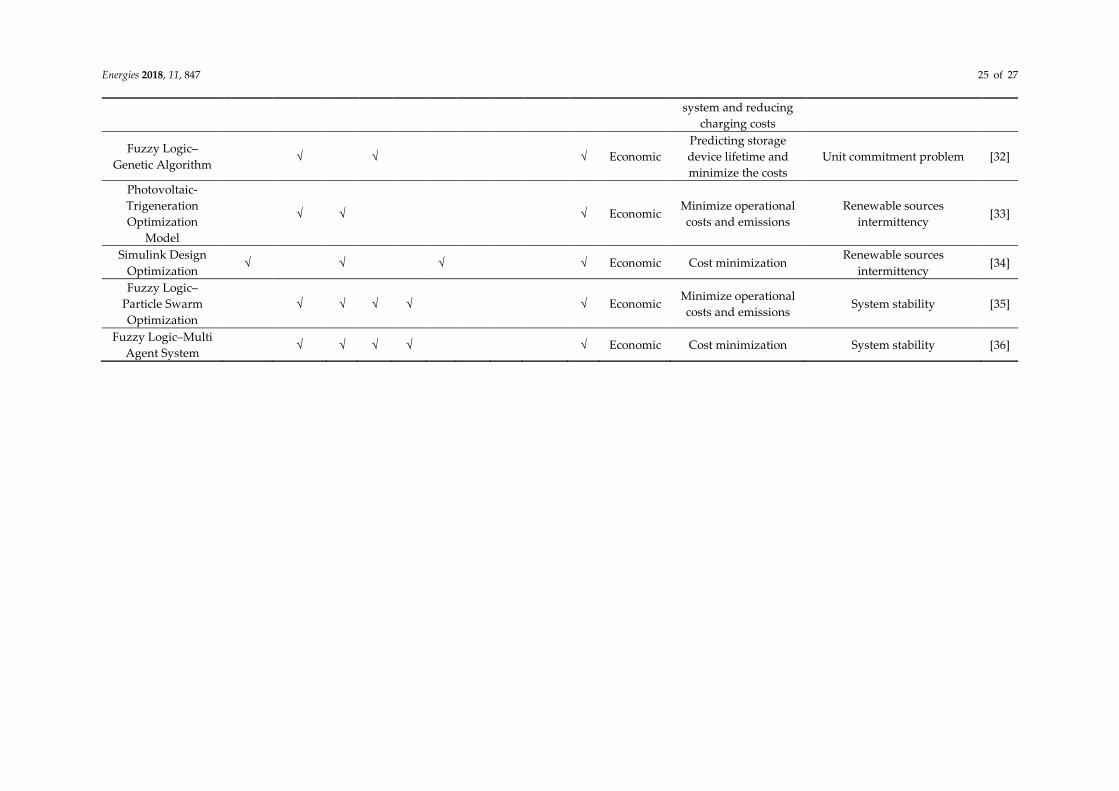
Recently, hybrid algorithm techniques that combine more than one algorithm have been widely
utilized to solve optimization problems and satisfy problem constraints. GA based on the fuzzy
expert system was used in [32] to determine the sizing of the ESS and set its power output. GA based
on multi-objectives called photovoltaic-trigeneration optimization was used in [33]. A new sizing
method based on simulink design optimization was employed in [34] to perform technical
optimization of the hybrid system components. A PSO algorithm integrated with the fuzzy logic
expert system that was applied to different scenarios was used in [35] to enhance the performance of
storage devices in supplying power in the microgrid. A decision tree on a linear programming based
on fuzzy and multi-agent systems was implemented to adapt pricing rules and minimize the
generation cost for a typical autonomous microgrid [36]. Appendix A provides more details about
the related works’ approaches.
However, some of the meta-heuristic algorithms search only in the neighborhood space for the
best solutions without paying attention to the global space. This type of algorithm may mislead the

Energies 2018, 11, 847 3 of 27
search process and leave the optimization-searching space stuck to a local solution only. Furthermore,
some algorithms have perfect global search abilities, but their local exploration capability is limited.
Due to these limitations, more robust algorithms are needed for premature concurrence and
accelerate the exploration process. In this regard, a new advanced meta-heuristic algorithm named
grey wolf optimization (GWO) that has a good balance between the local and global search spaces is
implemented in this paper. The main objective of this study is to minimize the operation dispatch
costs in the microgrid by taking into account the optimum size of the battery-storage devices. The
proposed algorithm is based on the hunting attitude of a pack of grey wolves with a high balance
between the exploration and exploitation [37]. Finally, to verify the performance and the stability of
the proposed algorithm, it is implemented on a typical low-voltage microgrid system. Different
scenarios have been conducted and the simulation results compared with other optimization
methods. The GWO results prove the capability of the proposed method in finding the best global
optima in the optimization problem in terms of solution quality and computational efficiency. The
main contribution of this study can be presented as follow: (1) proposing a novel approach to an
intelligent energy-management method that increases the penetration of the renewable-energy
sources and reduces the dependence on fossil fuel in the microgrid; and (2) takes into account the
effect of the optimum size of battery-storage system on the operation management as well as the
overall cost of the microgrid.
This paper is organized as follows: Section 2 illustrates the mathematical problem formulation
of the operational cost management in the microgrid. Section 3 gives a brief description of the
proposed grey wolf algorithm. The implementation of the GWO in the microgrid and the monitoring
method for the storage devices are described in Section 4. Numerical results and a discussion are
presented in Section 5. Finally, Section 6 provides the conclusion of this research.
2. Mathematical Problem Formulation
The optimum sizing and load dispatch are important aspects of power-system management. The
mathematical objectives and constraints considered in GWO formulation can be presented as follows:
2.1. Objective Function
This paper aims to reduce the operation cost while satisfying all the constraints, Therefore,
determining the potential cost of the generation sources in the microgrid is extremely important, and
based on that the different cost functions of the generation sources are determined as follows
[3,12,38,39]:
𝑀𝑖𝑛𝐹(𝑋) = ∑ 𝑓𝑡 + 𝑂𝑀𝐷𝐺 + 𝑇𝐶𝑃𝐷𝐵𝐸𝑆
𝑇
𝑡=1
𝑏 (1)
where
𝑓𝑡
= ∑ 𝐶𝑜𝑠𝑡𝑔𝑟𝑖𝑑,𝑡 + 𝐶𝑜𝑠𝑡𝐷𝐺,𝑡 + 𝐶𝑜𝑠𝑡𝐵𝐸𝑆,𝑡 + 𝑆𝑈𝐶𝑀𝑇,𝑡 + 𝑆𝑈𝐶𝐹𝐶,𝑡 + 𝑆𝐷𝐶𝑀𝑇,𝑡
𝑇
𝑡=1
+ 𝑆𝐷𝐶𝐹𝐶,𝑡
(2)
𝐶𝑜𝑠𝑡𝑔𝑟𝑖𝑑,𝑡 = {
𝐵𝑔𝑟𝑖𝑑,𝑡𝑃𝑔𝑟𝑖𝑑,𝑡 𝑖𝑓 𝑃𝑔𝑟𝑖𝑑,𝑡 > 0
(1 − 𝑡𝑎𝑥)𝐵𝑔𝑟𝑖𝑑,𝑡𝑃𝑔𝑟𝑖𝑑,𝑡 𝑖𝑓 𝑃𝑔𝑟𝑖𝑑,𝑡 < 0
0 𝑖𝑓 𝑃𝑔𝑟𝑖𝑑,𝑡 = 0
} (3)
𝐶𝑜𝑠𝑡𝐷𝐺,𝑡 = 𝐵𝑀𝑇,𝑡𝑃𝑀𝑇,𝑡𝑢𝑀𝑇,𝑡 + 𝐵𝐹𝐶,𝑡𝑃𝐹𝐶,𝑡𝑢𝐹𝐶,𝑡 + 𝑃𝑃𝑉,𝑡𝐵𝑃𝑉,𝑡 + 𝑃𝑊𝑇,𝑡𝐵𝑊𝑇,𝑡 (4)
𝐶𝑜𝑠𝑡𝐵𝐸𝑆,𝑡 = 𝐵𝐵𝐸𝑆,𝑡𝑃𝐵𝐸𝑆,𝑡𝑢𝐵𝐸𝑆,𝑡 (5)
𝑆𝑈𝐶𝑀𝑇,𝑡 = 𝑆𝑈𝑀𝑇 × 𝑚𝑎𝑥(0, 𝑢𝑀𝑇,𝑡 − 𝑢𝑀𝑇,𝑡−1) (6)
𝑆𝑈𝐶𝐹𝐶,𝑡 = 𝑆𝑈𝐹𝐶 × 𝑚𝑎𝑥(0, 𝑢𝐹𝐶,𝑡 − 𝑢𝐹𝐶,𝑡−1) (7)

Energies 2018, 11, 847 4 of 27
S𝐷𝐶𝑀𝑇,𝑡 = 𝑆𝐷𝑀𝑇 × 𝑚𝑎𝑥(0, 𝑢𝑀𝑇,𝑡−1 − 𝑢𝑀𝑇,𝑡) (8)
𝑆𝐷𝐶𝐹𝐶,𝑡 = 𝑆𝐷𝐹𝐶 × 𝑚𝑎𝑥(0, 𝑢𝐹𝐶,𝑡−1 − 𝑢𝐹𝐶,𝑡) (9)
𝑂𝑀𝐷𝐺 = (𝑂𝑀𝑀𝑇 + 𝑂𝑀𝐹𝐶 + 𝑂𝑀𝑃𝑉 + 𝑂𝑀𝑊𝑇) × 𝑇 (10)
The total operation dispatch of the microgrid is comprised of the operation dispatch cost of the
utility grid, the costs of fuel DG units, the price of the battery energy storage (BES) operation,
operation and maintenance costs of DGs, costs of startup/shutdown of Micro-Turbine (MT) and Fuel
Cell (FC), and the total cost per day of BES (TCPDBES). The cost of BES constraints is determined by
considering the one-time fixed cost (FCBES) and the annual maintenance cost of the battery (MCBES);
these costs are proportional to the battery size. The storage cost when the size of the battery is equal
to its maximum size is calculated by considering the FCBES and the MCBES, which are as follows:
𝐶𝑜𝑠𝑡𝐵𝐸𝑆 = (𝐹𝐶𝐵𝐸𝑆 + 𝑀𝐶𝐵𝐸𝑆) × 𝐶𝐵𝐸𝑆,𝑚𝑎𝑥 (11)
The time horizon (T) used in this paper is one day (24 h), in which the calculation of the operation
time was based on that time. TCPD is determined in this study by accounting the interest rate (IR) of
the financing installation and the lifetime (LT) of BES, which is as follows [3,12]:
𝑇𝐶𝑃𝐷𝐵𝐸𝑆 =𝐶𝐵𝐸𝑆,𝑚𝑎𝑥
365(
𝐼𝑅(1 + 𝐼𝑅)𝐿𝑇
(1 + 𝐼𝑅)𝐿𝑇 − 1 𝐹𝐶𝐵𝐸𝑆 + 𝑀𝐶𝐵𝐸𝑆) (12)
2.2. Constraints
The minimization of the operational cost in a microgrid is subjected to a number of constraints
including the balance of the electrical load demands, the boundaries of DGs constraints, the operation
reserve (OR) constraints, and the BES constraints. Details of the aforementioned constraints are
described below.
2.2.1. Balance of Electrical Load Demands
The microgrid power generation sources that including MT, FC, PV, WT, and the power injected
from BES or the external power from the utility grid, should satisfy the demands of the electrical load
(PD,t) in the microgrid with minimum operating costs. This constraint can be represented by using
Equation (13).
P_MT,t u_MT,t + P_FC,t u_FC,t + P_PV,t + P_WT,t + P_BES,t u_BES,t + P_grid,t = PD,t t = 1, 2, …, T (13)
2.2.2. Boundaries of Distributed Generation (DG) Constraints
The output operation of the distributed generators of each unit should be within the maximum
and minimum limits [40], which is as follows:
P_MT,min ≤ P_MT,t ≤ P_MT,max t = 1, …, T (14)
P_FC,min ≤ P_FC,t ≤ P_FC,max t = 1, …, T (15)
P_PV,min ≤ P_PV,t ≤ P_PV,max t = 1, …, T (16)
P_WT,min ≤ P_WT,t ≤ P_WT,max t = 1, …, T (17)
2.2.3. Grid Constraints
The power supplied from the utility grid should be within the maximum and minimum limits
in each time step:
𝑃𝑔𝑟𝑖𝑑,𝑚𝑖𝑛 ≤ 𝑃𝑔𝑟𝑖𝑑,𝑡 ≤ 𝑃𝑔𝑟𝑖𝑑,𝑚𝑎𝑥 𝑡 = 1, … , 𝑇 (18)

Energies 2018, 11, 847 5 of 27
2.2.4. Operation Reserve (OR) Constraints
The reserve power can be pumped into the microgrid in less than 10 min from the electrical
power generation by turning on the MT, FC, utility and BES, and is formulated as follows [3]:
P_MT,t u_MT,t + P_FC,t u_FC,t + P_PV,t + P_WT,t + P_BES,t u_BES,t + P_grid,t ≥ PD,t + ORt t = 1, 2, …, T (19)
where ORt is 10 min.
2.2.5. Battery Energy Storage (BES) Constraints
The lithium battery is used for the BES system for the microgrid in this research. This type of
battery has many advantages such as lack of memory effect, a high energy density, and its ability to
lose power is slow when not engaged [3,12,41,42]. Battery constraints can be classified into charging
and discharging modes:
Discharging Mode
𝐶𝐵𝐸𝑆,𝑡+1 = 𝑚𝑎𝑥 {(𝐶𝐵𝐸𝑆,𝑡 − ∆𝑡𝑃𝐵𝐸𝑆,𝑡
ƞ𝑑
) , 𝐶𝐵𝐸𝑆,𝑚𝑖𝑛} 𝑡 = 1, … . , 𝑇 (20)
where
𝑃𝐵𝐸𝑆,𝑚𝑖𝑛 ≤ 𝑃𝐵𝐸𝑆,𝑡 ≤ 𝑃𝐵𝐸𝑆,𝑚𝑎𝑥 𝑡 = 1, … , 𝑇 (21)
Charging Mode
𝐶𝐵𝐸𝑆,𝑡+1 = 𝑚𝑖𝑛{(𝐶𝐵𝐸𝑆,𝑡 − ∆𝑡𝑃𝐵𝐸𝑆,𝑡 ƞ𝑐), 𝐶𝐵𝐸𝑆𝑚𝑖𝑛} 𝑡 = 1 … . 𝑇 (22)
where
𝑃𝐵𝐸𝑆,𝑚𝑖𝑛 ≤ 𝑃𝐵𝐸𝑆,𝑡 ≤ 𝑃𝐵𝐸𝑆,𝑚𝑎𝑥 𝑡 = 1, … , 𝑇 (23)
where
𝑃𝐵𝐸𝑆,𝑡 𝑚𝑎𝑥 = 𝑚𝑖𝑛 {𝑃𝐵𝐸𝑆,𝑚𝑎𝑥 ,(𝐶𝐵𝐸𝑆,𝑡 − 𝐶𝐵𝐸𝑆,𝑚𝑖𝑛)ƞ𝑑
∆𝑡} 𝑡 = 1, … , 𝑇 (24)
𝑃𝐵𝐸𝑆,𝑡 𝑚𝑖𝑛 = 𝑚𝑖𝑛 {𝑃𝐵𝐸𝑆,𝑚𝑎𝑥 ,(𝐶𝐵𝐸𝑆,𝑡 − 𝐶𝐵𝐸𝑆,𝑚𝑖𝑛)ƞ𝑑
∆𝑡} 𝑡 = 1, … , 𝑇 (25)
The boundary limits of BES power in discharging and charging modes are expressed in
Equations (21) and (23), respectively. The battery capacity in charging and discharging modes are
expressed in Equations (20) and (22), respectively. The maximum power of BESS is expressed
mathematically in Equation (24), whereas the minimum power of BES is expressed in Equation (25).
The proposed storage device should satisfy all the constraints from (20)–(25).
3. Grey Wolf Optimizer (GWO)
Grey wolf optimizer (GWO) is one of the powerful meta-heuristic algorithms proposed by [37].
As a newly developed algorithm it has the ability to compete with others algorithms such as PSO,
GA and many other algorithms in terms of solution accuracy, minimum computational effort, and
aversion of premature convergence. GWO was inspired by grey wolves, members of the Canidae
family which are leading predators on top of the food chain. This type of wolves lives in groups of 5
to 12 members.
The leader of the wolf pack is called alpha, and is responsible for the pack. While beta is the
second level after alpha who reinforces the alpha’s instructions throughout the pack and delivers
feedback to alpha. The lower level of the grey wolf hierarchy is called omega and usually plays the
role of scapegoat. Moreover, if the wolf is not alpha, beta or omega, then he or she is called delta.
The duties of delta wolves are as scouts, sentinels, elders, hunters and caretakers. Figure 1 illustrates
the social dominant hierarchy of the grey wolves. The GWO steps for hunting the prey are presented
in the next sub-section.

Energies 2018, 11, 847 6 of 27
Figure 1. The dominance hierarchy of grey wolves.
Mathematical Formulation of GWO
The behavior of the GWO can be formulated mathematically, where the alpha (α) wolf position
is assumed to be the best answer in the proposed GWO algorithm, while the beta (β) and delta (δ)
positions are the second and third best answers, respectively. The omega (ω) represents the rest of
the answers to the problem. The hunting in GWO algorithm is directed by α, β, and δ, while the
omega follows them. The attacking process of the grey wolves involves several steps before they
catch the prey. First, the wolves tend to encircle the prey to stop her from moving, this encircling
behaviour can be represented by the following set of equations:
𝐷→ = |𝐶→. 𝑋𝑝→(𝑡) − 𝑋→(𝑡)| (26)
𝑋→(𝑡 + 1) = 𝑋𝑝→(𝑡)−𝐴→. 𝐷→ (27)
where 𝐴→ and 𝐷→ are the vector coefficients, 𝑋𝑝→ is the vector location of the prey, t is current
iteration, and 𝑋→ is the location vector of a grey wolf. The encircling equations can be obtained by
finding the 𝐴→ and 𝐶→ vectors.
𝐴→ = 2𝑎→. 𝑟1→ − 𝑎→ (28)
𝐶→ = 2. 𝑟2→ (29)
𝑎 = 2 − 𝑡 ∗2
𝑚𝑎𝑥𝑖𝑚𝑢𝑚 𝑖𝑡𝑒𝑟𝑎𝑡𝑖𝑜𝑛 (30)
where 𝑎→ is linearly changed from 2 to 0 during the algorithm iterations, and r1 and r2 are random
values between (0, 1). In each iteration, the best solutions from alpha, beta and delta are saved and
the other wolves (omega) update their positions based on the best solutions. These steps are
represented by the following equations:
𝐷𝐴𝑙𝑝ℎ𝑎→ = |𝐶1
→. 𝑋𝐴𝑙𝑝ℎ𝑎→ − 𝑋→| (31)
𝐷𝐵𝑒𝑡𝑎→ = |𝐶2
→. 𝑋𝐵𝑒𝑡𝑎→ − 𝑋→| (32)
𝐷𝐷𝑒𝑙𝑡𝑎→ = |𝐶3
→. 𝑋𝐷𝑒𝑙𝑡𝑎→ − 𝑋→| (33)
The vector positions of the prey can be determined based on the alpha, beta and delta positions
using the following equations:
𝑋1→ = |𝑋𝐴𝑙𝑝ℎ𝑎
→ − 𝐴1→. 𝐷𝐴𝑙𝑝ℎ𝑎
→ | (34)
Energies 2018, 11, 847 7 of 27
𝑋2→ = | 𝑋𝐵𝑒𝑡𝑎
→ − 𝐴2→. 𝐷𝐵𝑒𝑡𝑎
→ | (35)
𝑋3→ = |𝑋𝐷𝑒𝑙𝑡𝑎
→ − 𝐴3→. 𝐷𝐷𝑒𝑙𝑡𝑎
→ | (36)
𝑋→(𝑡 + 1) =𝑋1
→ + 𝑋2→ + 𝑋3
→
3 (37)
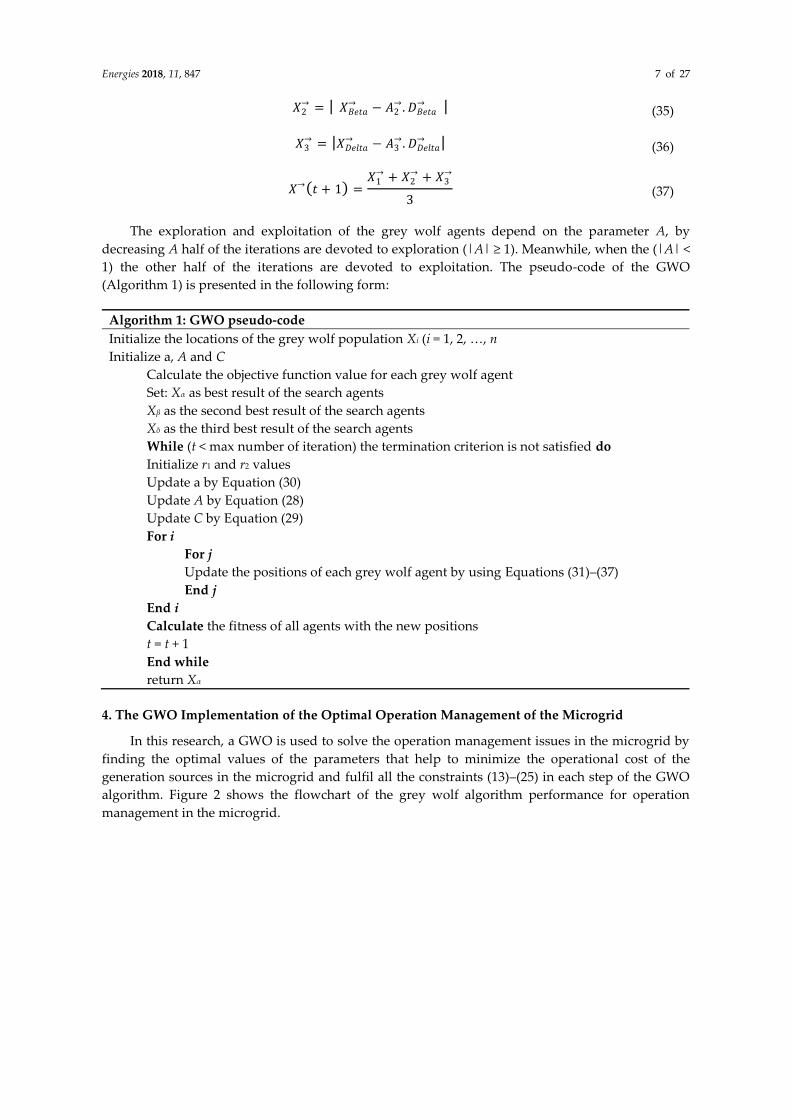
The exploration and exploitation of the grey wolf agents depend on the parameter A, by
decreasing A half of the iterations are devoted to exploration (|A| ≥ 1). Meanwhile, when the (|A| <
1) the other half of the iterations are devoted to exploitation. The pseudo-code of the GWO
(Algorithm 1) is presented in the following form:
Algorithm 1: GWO pseudo-code
Initialize the locations of the grey wolf population Xi (i = 1, 2, …, n
Initialize a, A and C
Calculate the objective function value for each grey wolf agent
Set: Xα as best result of the search agents
Xβ as the second best result of the search agents
Xδ as the third best result of the search agents
While (t < max number of iteration) the termination criterion is not satisfied do
Initialize r1 and r2 values
Update a by Equation (30)
Update A by Equation (28)
Update C by Equation (29)
For i
For j
Update the positions of each grey wolf agent by using Equations (31)–(37)
End j
End i
Calculate the fitness of all agents with the new positions
t = t + 1
End while
return Xα
4. The GWO Implementation of the Optimal Operation Management of the Microgrid
In this research, a GWO is used to solve the operation management issues in the microgrid by
finding the optimal values of the parameters that help to minimize the operational cost of the
generation sources in the microgrid and fulfil all the constraints (13)–(25) in each step of the GWO
algorithm. Figure 2 shows the flowchart of the grey wolf algorithm performance for operation
management in the microgrid.

Energies 2018, 11, 847 8 of 27
Figure 2. Flowchart of the grey wolf optimization algorithm used in the microgrid.

Energies 2018, 11, 847 9 of 27
However, due to the limitations of the generation sources and the energy-management
constraints, the function handle (Algorithm 2) should be utilized as follows:
Algorithm 2: Function handle
For t = 1 to NT do
For m = 1 to NOA do
Part 1: power balance and generation source capacity handling
Calculate the power difference between the generation sources and load demand
Pdiff = (P_MT,t u_MT,t + P_FC,t u_FC,t + P_PV,t + P_WT,t + P_BES,t u_BES,t + P_grid,) − PD,t;
Select random generation sources based on their capacity
While P_diff ≠ 0 do
Subtract P_diffm,t from the selected units
Check the capabilities of the generation units based on lower and upper limits as follows:
If Pm,FC,t < PFC,min then Pm,FC, = PFC,min;
or Pm,MT,t < PMT,min then Pm,MT,t = PMT,min;
or Pm,grid,t < Pgrid,min then Pm,grid,t = Pgrid,min;
or Pm,BES,t < PBES,min then Pm,BES,t = PBES,min;
Elseif Pm,FC,t > PFC,max then Pm,FC, = PFC,max;
or Pm,MT,t > PMT,max then Pm,MT,t = PMT,max;
or Pm,grid,t > Pgrid,max then Pm,grid,t = Pgrid,max;
or Pm,BES,t < PBES,max then Pm,BES,t = PBES,max;
End if
Calculate P_diffm,t
Select another generation units randomly
End while
Part 2: ORs handling
Calculate objective function (ft) by using Equation (2)
If P_MT,t u_MT,t + P_FC,t u_FC,t + P_PV,t + P_WT,t + P_BES,t u_BES,t + P_grid,t < PD,t + ORt
Then ft = ft + Penalty_Factor ×(P_MT,t u_MT,t + P_FC,t u_FC,t + P_PV,t + P_WT,t + P_BES,t u_BES,t + P_grid,t – (PD,t +
ORt))
End if
End for m
Calculate Equation (1)
End for t
Since the OR’s constraints should be met, the penalty factor value considered in this paper is 10.
The grey wolves’ numbers (search agents) and the iterations numbers are set. The population vector
of the GWO can be represented as follows:
𝑋 = [𝑥1
1 ⋯ 𝑥𝑛1
⋮ ⋱ ⋮𝑥1
𝑝⋯ 𝑥𝑛
𝑝] (38)
where n represents the control variable numbers or search agents positions. The population number
(grey wolves) is represented by p.
To minimize the operational cost in the microgrid, we employed a monitoring method for the
microgrid operations to set the charging and discharging rules for storage devices that integrated
with the grey wolf algorithm. The method is based on evaluating the economical price factor of the
microgrid within 24 h. Therefore, the batteries’ decisions in the microgrid charge and discharge are
based on the difference between the highest and lowest mean price of the utility market and the DGs
within 24 h. The grey wolf algorithm makes the charging decision by comparing the dispatch cost of
the storage devices with other DGs such as gas and the dynamic generation price of the utility grid.
Moreover, a switching mechanism is integrated with the GWO that controls the storage devices’
operation by comparing the instantaneous capacity of storage devices with its full practical capacity.

Energies 2018, 11, 847 10 of 27
A signal indicates when the battery capability goes below full-capacity status. This signal indicator
will be considered under other price factors:
A. The charging signal will be activated when the price of local distribution generators is below
the mean value of the price of DGs or the utility market price.
B. The discharging signal will activate to supply electrical power to loads of the microgrid when
the battery-charging price is lesser than the other prices of the generation source.
C. A standby signal is generated when the charging cost of storage devices is above the DG price,
or when the storage devices have been charged with a higher price than other generation sources in
a microgrid at the time of comparison.
The following equations illustrate the conditions of charging and discharging operations of the
storage devices:
𝐵𝐸𝑆𝑐ℎ,𝑡 = {
𝑃𝐵𝐸𝑆,𝑡 = 𝑃𝑔𝑟𝑖𝑑,𝑡 𝑖𝑓 𝐵𝑃𝑔𝑟𝑖𝑑,𝑡 < 𝐵𝑃𝐷𝐺,𝑡
𝑃𝐵𝐸𝑆,𝑡 = 𝑃𝐷𝐺,𝑡 𝑖𝑓 𝐵𝑃𝐺𝐷,𝑡 < 𝐵𝑃𝑔𝑟𝑖𝑑,𝑡
𝑃𝐵𝐸𝑆,𝑡 = 0 𝑖𝑓 𝐵𝑃𝐵𝐸𝑆,𝑡 > 𝐵𝑃𝑔𝑟𝑖𝑑,𝑡
𝑜𝑟 𝐵𝑃𝐷𝐺,𝑡
(39)
𝐵𝐸𝑆𝑑𝑖𝑠,𝑡 = {
𝑃𝐷,𝑡 = 𝑃𝐵𝐸𝑆,𝑡 + 𝑃𝐷𝐺,𝑡 𝑖𝑓 𝐵 (𝑃𝐵𝐸𝑆,𝑡 + 𝑃𝐺𝐷,𝑡) < 𝐵𝑃𝐷𝐺,𝑡
𝑃𝐷,𝑡 = 𝑃𝐵𝐸𝑆,𝑡 + 𝑃𝑔𝑟𝑖𝑑,𝑡 𝑖𝑓 𝐵 (𝑃𝐵𝐸𝑆,𝑡 + 𝑃𝑔𝑟𝑖𝑑,𝑡) < 𝐵𝑃𝑔𝑟𝑖𝑑,𝑡
𝑃𝐵𝐸𝑆,𝑡 = 0 𝑖𝑓 𝐵𝑃𝐵𝐸𝑆,𝑡> 𝐵𝑃𝑔𝑟𝑖𝑑,𝑡
𝑜𝑟 𝐵𝑃𝐷𝐺,𝑡
(40)
The GWO will treat the battery devices as a source, load or standby source depending on the
generated signals at the time of comparison, as shown in the equations below:
𝑃𝑀𝑇,𝑡 𝑢𝑀𝑇,𝑡 + 𝑃𝐹𝐶,𝑡𝑢𝐹𝐶,𝑡 + 𝑃𝑃𝑉,𝑡 + 𝑃𝑊𝑇,𝑡 + 𝑃𝐵𝐸𝑆,𝑡𝑢𝐵𝐸𝑆,𝑡 + 𝑃𝑔𝑟𝑖𝑑,𝑡 = 𝑃𝐷,𝑡 (41)
𝑃𝑀𝑇,𝑡 𝑢𝑀𝑇,𝑡 + 𝑃𝐹𝐶,𝑡𝑢𝐹𝐶,𝑡 + 𝑃𝑃𝑉,𝑡 + 𝑃𝑊𝑇,𝑡 + 𝑃𝑔𝑟𝑖𝑑,𝑡 = 𝑃𝐷,𝑡 + 𝑃𝐵𝐸𝑆,𝑡𝑢𝐵𝐸𝑆,𝑡 (42)
𝑃𝑀𝑇,𝑡 𝑢𝑀𝑇,𝑡 + 𝑃𝐹𝐶,𝑡𝑢𝐹𝐶,𝑡 + 𝑃𝑃𝑉,𝑡 + 𝑃𝑊T,𝑡 + 𝑃𝑔𝑟𝑖𝑑,𝑡 = 𝑃𝐷,𝑡 (43)
To validate the efficiency of the monitoring method with different capacities of the battery and
to select the optimal size of the battery, the maximum capacity of the battery device is set as a control
variable, and the minimum capacity set to 10% of the maximum capacity. This means that the
optimization and the energy stored in the BES after determining the operation cost should be within
the range [50 kWh–500 kWh]. The step size between the maximum and minimum capacity of the BES
is 100 kWh in each step and the algorithm takes it gradually until the optimal size of the BES is
reached. Figure 3 illustrates the sizing process for selecting the optimal size.

Energies 2018, 11, 847 11 of 27
Figure 3. Flowchart of sizing process.
5. Numerical Results and Discussion
The effectiveness of the developed grey wolf algorithm is demonstrated in this paper by utilizing
it to solve different non-linear parameters and complex problems by considering the load dispatch
issues in the microgrid.

Energies 2018, 11, 847 12 of 27
Description of the Microgrid Test System and the Data Inputs
The proposed grey wolf algorithm is designed to work with any application as well as different
profiles. Therefore, in order to access the validity and robustness of the algorithm, it is tested on a
typical low-voltage microgrid system as depicted in Figure 4. The microgrid system has different
generation sources such as MT, FC, PV, WT and a Li-ion battery energy system. In addition, the case
study is assumed to have highly rated conductors, and therefore the thermal constraints will not be
considered in the dispatch analysis. Furthermore, the feeders supplying distributed loads from the
generators have a relatively short distance which does not have a significant impact on the voltage
profile (no reactive compensation is required), and hence the power losses are neglected in this study.
All the coefficients and source limitations that are used in this paper are referred to [3].
Figure 4. A typical low-voltage microgrid system.
Figures 5 and 6 show the forecasting output powers of WT and PV, respectively, both figures
are scaled for 24 h [3].
Power Communication
Battery Storage Fuel Cell Micro-Turbine
Utility Grid
Load Demands
Photovoltaic Cell Wind Turbine
Control Room
PCC

Energies 2018, 11, 847 13 of 27
Figure 5. Forecasted power of wind turbine (WT).
Figure 6. Forecasting power of photovoltaic unit (PV).
The load demand and real forecast utility price that are used to test GWO in the low-voltage
network are shown in Figures 7 and 8, respectively [3, 12].

Energies 2018, 11, 847 14 of 27
Figure 7. Forecasting load demand.
Figure 8. Real utility market prices.
Several factors are considered in GWO to minimize the economic dispatch of the low-voltage
network in this paper. For instance, the OR factor is set to 5% of the load demand for each time step,
and the maintenance and fixed labour for BESS installation and operation are set to 465 (€ct/kWh)
and 15 (€ct/kWh), respectively. The BESS LT and IR are set to 3 and 0.06, respectively; and tax is set
to 10%. The charging and discharging efficiencies of BESS are both set to 90%. The maximum capacity
of the BESS is set to 500 kWh, and the minimum capacity is fixed to 10% from the maximum capacity.
The minimization cost in this study is performed for one day (24 h).

Energies 2018, 11, 847 15 of 27
The algorithms are solved using MATLAB software (2017b) and tested on a 3.6 GHz CUP and
16 GB RAM university computer. Accordingly, in order to verify the performance of the algorithm
the GWO iteration is set to 1000, and the number of implemented search agents is set to 100. To study
the performance of the GWO, the simulation results are compared with various methods such as GA,
the bat algorithm (BA), PSO, and the improved bat algorithm (IBA) [3] and different scenarios are
conducted also, as follows:
Scenario A: The microgrid operates without BES.
Scenario B: The microgrid’s BES does not have an initial value (uncharged).
Scenario C: The microgrid’s BES has an initial value equal to its size (fully charged).
Scenario A
Multiple sources are considered in the microgrid of this case study to compare the performance
of the proposed algorithm with other algorithms like GA, PSO, BA and IBA. In this scenario, it is
assumed that the microgrid does not have storage devices in its operation and all power should be
provided from the DGs (renewable energy source (RES) and non-RES) and the utility grid to satisfy
the load demand at any hour during the day.
Based on the daily forecasting load demand curve and the maximum power output from
renewable sources and non-renewable sources of this case study, we demonstrated the numerical
outcomes of the optimal operation of generation sources under the microgrid circumstances in Figure
9 by using the grey wolf algorithm. GWO is a random method of probability patterns, thus the
randomness in the results of the simulation are comprehensible. The load dispatch problem is
determined in real-time; hence, the program should approach the optimum solution over time.
Figure 9 shows the best output power from the generation sources to satisfy the load demands
during the day. Due to the absence of storage devices in this scenario that act as an ancillary service,
the output power of the DGs and utility grid should be greater than the load demands to ensure the
stability of the operation system as well as to show the need for purchasing the power from the utility
grid for most of the day. Due to the lower bid of the FC source compared with another source (MT),
the microgrid uses more power from FC than MT. The status of each DG and utility grid that is
dispatched is in Table 1.
Figure 9. Optimal output of the generation sources obtained by GWO for Scenario A.

Energies 2018, 11, 847 16 of 27
Table 1. Corresponding status of the generation sources obtained by GWO for Scenario A.
Time (hour) MT FC PV WT Utility Grid
1 0 1 0 1 1
2 0 1 0 1 1
3 0 1 0 1 1
4 1 1 0 1 1
5 1 1 0 1 1
6 1 1 0 1 1
7 1 1 0 1 1
8 1 1 1 1 1
9 1 1 1 1 1
10 1 1 1 1 1
11 1 1 1 1 0
12 1 1 1 1 0
13 1 1 1 1 0
14 1 1 1 1 0
15 1 1 1 1 1
16 1 1 1 1 1
17 1 1 1 1 1
18 1 1 0 1 1
19 1 1 0 1 1
20 1 1 0 1 1
21 1 1 0 1 1
22 1 1 0 1 1
23 1 1 0 1 1
24 1 1 0 1 1
Table 2 shows the optimal, average, and worst-cost solutions obtained from GWO compared
with other algorithms, which emphasizes the robust performance of GWO. The agents in the GWO
algorithm always update their positions according to alpha, beta and delta behaviour. Thus, the GWO
algorithm gives the best results and those results continue to improve with each iteration during the
simulation. Due to that, the optimal dispatch cost of this scenario with the absence of the storage
device is 813.6850 €ct, and the worst-solution dispatch cost of GWO in this scenario is significantly
less than the best solution using other methods. Therefore, the grey wolf algorithm shows a significant
reduction in cost compared with the GA, PSO, BA and IBA algorithms. The cost saving obtained by
comparing the GWO operational cost with other methods is presented in Figure 10.
Figure 10. Cost saving of GWO compared with other algorithms in Scenario A.

Energies 2018, 11, 847 17 of 27
Table 2. Demonstration of operation dispatch costs of the microgrid in Scenario A.
Methodology Best operation Cost (€ct) Mean Operation Cost (€ct) Worst Operation Cost (€ct)
GA 1041.8376 1196.3251 1361.2437
PSO 968.0190 1081.8351 1241.7459
BA 933.8145 989.3718 106.9860
IBA 825.8849 825.8849 825.8849
GWO 813.6850 815.5231 816.8512
Scenario B
In this scenario, the battery-storage devices are added to the microgrid system with the initial
battery charge value set to zero. The battery-storage system is an essential source in the microgrid
that helps to maintain system stability, enhance the power quality and mitigate the transit period of
the microgrid between the grid-connected mode and islanded mode. Furthermore, the difference
between the peak and off-peak of the real market prices gives an opportunity to the BES to be
economically beneficial by purchasing the power from the utility grid overnight (off-peak) and
selling that power back to the utility grid during peak demand.
All DGs, either renewable or traditional energy sources, should work to fulfil the load demands
and operation constraints until the storage devices are charged and can contribute to a microgrid load
demand based on how much it is charged in previous hours. The robustness of the proposed
algorithm is apparent from its capability to satisfy all the constraints and create reliable results.
Figure 11 demonstrates the numerical outputs of the MT, FC, PV, WT, BES and utility grid by
utilizing the GWO. It is obvious from the figures that the first five hours from the day the BES is not
utilized as a power supply for load demands, whereas for the rest of the day it is used as one of the
microgrid-generation sources. Based on Figure 11 and the input data used, the variation in the market
price of the utility grid gives the opportunity to the storage device to participate in minimizing the
operational cost and to gain some benefits by selling the power back to the utility grid whenever the
market price of power is high (peak load) and buying the power from the utility grid overnight due
to the low price (off-peak). The status of each DG and utility grid dispatched is shown in Table 3. It
is clear that the optimal size of BES in this scenario is 140 kWh.
Figure 11. Optimal output of the generation sources obtained by GWO for Scenario B.

Energies 2018, 11, 847 18 of 27
Table 3. Corresponding status of the generation sources obtained by GWO for Scenario B.
Time
(hour)
Microturbine
(MT)
Fuel Cell
(FC)
Photovoltaic
(PV)
Wind Turbine
(WT)
Battery-Energy
Storage (BES)
Utility
Grid
1 1 1 0 1 1 1
2 1 1 0 1 1 1
3 1 1 0 1 1 1
4 1 1 0 1 1 1
5 1 1 0 1 1 1
6 1 1 0 1 1 1
7 1 1 0 1 1 1
8 1 1 1 1 1 1
9 1 1 1 1 1 1
10 1 1 1 1 1 1
11 1 1 1 1 1 1
12 1 1 1 1 1 1
13 1 1 1 1 1 1
14 1 1 1 1 1 1
15 1 1 1 1 1 1
16 1 1 1 1 1 1
17 1 1 1 1 1 1
18 1 1 0 1 1 1
19 1 1 0 1 1 1
20 1 1 0 1 1 1
21 1 1 0 1 1 1
22 1 1 0 1 1 1
23 1 1 0 1 1 1
24 1 1 0 1 1 1
Table 4 shows the comparison of the operation cost of the microgrid optimal, average, and worst
solutions obtained from GWO compared with other algorithms. From this table, it is clear that the
significant performance of GWO in minimizing the microgrid dispatch cost to 445.3254 €ct is better
than the dispatch cost in Scenario A due to the existing storage devices. The worst-solution dispatch
cost of GWO in this scenario is significantly less than the other methods. Therefore, the GWO
technique is remarkably more efficient than the other existing methods. The cost saving obtained by
comparing the GWO outputs with other methods is presented in Figure 12.
Table 4. Demonstration of operation dispatches cost of the microgrid (MG) of Scenario B.
Methodology Best Operation Cost (€ct) Mean Operation Cost (€ct) Worst operation Cost (€ct)
GA 615.9034 623.4835 638.6436
PSO 567.5185 575.1266 592.8787
BA 520.2354 532.1278 550.6589
IBA 497.0082 - -
GWO 445.3254 450.6587 465.2154
Figure 12. GWO cost saving compared with other algorithms in Scenario B.

Energies 2018, 11, 847 19 of 27
Scenario C
In this scenario, the initial value for a storage device is set to the maximum size capacity of the
battery and utilized to complicate the system test and judge the effectiveness of the GWO method
with non-linear constraints, and to show the feasibility of the proposed method for the dispatch cost
and sizing BES. Figure 13 shows the optimal outputs of the MT, FC, PV, WT, BES and utility grid by
utilizing the GWO. It is clear that from the figure that the BES participates in satisfying the load
demands during the day and minimizes purchasing power from the upstream power grid. The status
of each DG and utility grid dispatched is in Table 5.
Figure 13. Optimal output of the generation sources obtained by GWO for Scenario C.
Table 5. Corresponding status of the generation sources obtained by GWO for Scenario C.
Time (hour) MT FC PV WT BES Utility Grid
1 0 0 0 1 1 1
2 0 0 0 1 1 1
3 0 0 0 1 1 1
4 0 0 0 1 1 1
5 0 0 0 1 1 1
6 1 1 0 1 1 1
7 1 1 0 1 1 1
8 1 1 1 1 1 1
9 1 1 1 1 1 1
10 1 1 1 1 1 1
11 1 1 1 1 1 1
12 1 1 1 1 1 1
13 1 1 1 1 1 1
14 1 1 1 1 1 1
15 1 1 1 1 1 1
16 1 1 1 1 1 1
17 1 1 1 1 1 1
18 1 1 0 1 1 1
19 1 1 0 1 1 1
20 1 1 0 1 1 1
21 1 1 0 1 1 1
22 1 1 0 1 1 1
23 0 1 0 1 1 1
24 0 0 0 1 1 1

Energies 2018, 11, 847 20 of 27
Table 6 shows the optimal dispatch cost obtained by the proposed GWO method. The simulation
results clearly prove that GWO creates feasible solutions. The statistical results from that simulation
are compared with other methods, namely, GA, BA, PSO and IBA [3]. Considering this scenario with
optimal BES size (220 kWh), the dispatch cost by the GWO with BES fully charged is the best (297.5429
€ct) among other algorithms. However, the best cost of the other algorithms is IBA (424.1339 €ct),
which is significantly higher than the worst cost of the GWO, as illustrated in Table 6.
Table 6. Demonstration of operation dispatches cost of the microgrid (MG) of Scenario C.
Methodology Best Operation Cost (€ct) Mean Operation Cost (€ct) Worst Operation Cost (€ct)
GA 499.0665 506.4029 523.5212
PSO 459.8236 466.6086 485.2675
BA 436.7845 446.3267 456.2547
IBA 424.1339 - -
GWO 297.5429 299.3274 312.8742
The economic cost saving achieved by this scenario is notably higher than that of Scenarios A and B
when the initial value of the BES is fully charged, which helps to minimize importing power from the
utility grid and at the same time cut down relying on the MT and FC, as presented in Figure 14.
Figure 14. GWO cost saving compared with other algorithms in Scenario C.
The crucial role of the storage devices in minimizing the cost in the microgrid, balancing the
operation during the transit period, and identifying the solidity of the proposed grey wolf algorithm
can clearly be seen in all scenarios compared with the other algorithms. In addition, the charging and
discharging techniques of the storage devices played a crucial role in minimizing the total operation
cost of the microgrid as shown by the numerical results of the analysis in the scenarios.
6. Conclusions
In this paper an intelligent energy-management method and a new algorithm named GWO is
proposed to solve the load dispatch problems based on finding the optimal size of the microgrid
sources. The GWO method satisfies the load demands and constraints in the microgrid based on the
smart use of storage devices among other sources in the network. Different scenarios are employed
to illustrate the GWO’s applicability. GWO shows a superior performance with storage device
charging and discharging techniques by reducing the dispatch cost of the microgrid operation in all
scenarios. The storage device technique operates based on tracking the local generation cost of the
microgrid and the total cost of the storage device. Charging prices are generated to increase the
chance of charging the battery with low prices and increase the opportunity of having cheaper
microgrid operation cost during the storage device’s lifetime.
The numerical results are tested with other existing methods, namely, GA, BA, PSO and IBA, to
validate GWO performance. The GWO algorithm shows superior results over other algorithms,
considering robustness, minimum computational efforts, and aversion of premature convergence.

Energies 2018, 11, 847 21 of 27
Furthermore, the simulation results show that smart utilization of the BES by GWO helped to
minimize the operational costs by 33.185%. Moreover, the proposed method helped to cut down the
amount of the imported power from the utility grid, and at the same time reduce dependency on
fossil fuel (MT and FC) which has a significant impact on the operational cost reduction in all the
microgrid scenarios. GWO outperforms other competing methods in battery sizing and energy
management in microgrids and, therefore, it has a significant potential to be implemented in a wide
range of microgrids in the future.
Author Contributions: All authors contributed to the implementation of the research, to the analysis of the
results and to the writing of the manuscript.
Conflicts of Interest: The authors declare no conflicts of interest.
Nomenclature
Indices
ADNs Active distribution networks
ASO Adaptive storage operation
BA Bat algorithm
BBO Biogeography- based optimisation
BES, grid Battery energy storage and grid indices, respectively
BESS Battery energy storage system
DE Differential evolution
DG Distribution generation
DP Dynamic programming
ESS Energy storage system
FC, MT Fuel cell and micro-turbine indices, respectively
GA Genetic algorithm
GHG Greenhouse gas
GWO Grey wolf optimizer
HBB-BC Hybrid big bang–big crunch
t time index
T Operation time horizon (h)
TLBO Teaching-learning based optimisation
TPC Total present cost
TS Tabu search
iter iteration index of the GWO algorithm
MAS Multi-agent system
MGCC Microgrid central controller
MILP Mixed-integer linear programming
NOA Number of agents
PSO Particle swarm optimization
PV, WT Photovoltaic and wind turbine indices, respectively
SD Storages devices
SDO Simulink design optimization
IBA Improved bat algorithm
IR Interest rate for financing the installed BES
RES Renewable sources
Constants
Bgrid,t, BBES,t, BMT,t, BFC,t, BPV,t, BWT,t Bid of utility, BES, MT, FC, PV and WT, respectively, at time t (€ct/kWh).
CBES,min, CBES,max Minimum and maximum size of BES (kWh)
CSD_Max Maximum capacity of storage device
CSD_Min Minimum capacity of storage devices
FCBES, MCBES Fixed and maintenance cost for BES, respectively (€ct/kWh)
Iter_max Maximum number of iteration for the GWO algorithm
LT Lifetime of the installed BES (year)
OMDG Fixed operation and maintenance cost of distributed generators (DGs; €ct)

Energies 2018, 11, 847 22 of 27
OMMT, OMFC OMPV, OMWT Fixed operation and maintenance cost of MT, FC, PV and WT,
respectively (€ct/kWh)
ORt Minutes operating reserve requirements (kW)
PBESmax,t PBESmin,t Maximum discharge and charge rates of BES, respectively, at time t (kW)
ηd, ηc Discharge and charge efficiencies of BES, respectively
SDCMT,t, SDCFC,t Shutdown cost for MT and FC, respectively, at time t (€ct)
SDMT, SDFC Shutdown cost coefficient for MT and FC, respectively (€ct)
SUCMT,t, SUCFC,t Startup cost for MT and FC, respectively, at time t (€ct)
SUMT, SUFC Startup cost coefficient for MT and FC, respectively (€ct)
tax Tax rate of utility power grid
Δt Time interval duration
Pgrid,max, Pgrid,min Maximum/minimum limits of power production for utility, respectively
(kW)
PMT,max, PFC,max, PPV,tmax, PWT,t max,
PBES,max
Maximum producible power of MT, FC, PV, WT and BES respectively
(kW)
PMT,min, PFC,min, PPV,tmin, PWT,t min,
PBES,min
Minimum producible power of MT, FC, PV, WT and BES respectively
(kW)
PSD_Max Maximum power of storage device
Variables
CostDG,t, CostBES,t Cost of fuel and operating power of DGs and BES, respectively, at time t (€ct)
F Total costs (€ct)
Pgrid,t, PBES,t, PMT,t, PFC,t PPV,t, PWT, t Power of utility, BES, MT, FC, PV, and WT, respectively (kW)
PSD_min Minimum power of storage device
TCPDBES Total cost per day of BES (€ct)
Up Utility price
X Position vector of a grey wolf in GWO algorithm
XP Position vector of the prey in GWO algorithm
Gp Gas price
Costgrid,t Cost of trade with the upstream grid at time t (€ct)
CSD_Max Maximum capacity of storage device
PD,t Electrical load demand at time t (kW)
CBES,t Energy stored in BES at time t (kWh)
uBES,t, uMT,t, uFC,t Status (on or off) of BES, MT, and FC, respectively, at time t
Sg Dispatch of storage device

Energies 2018, 11, 847 23 of 27
Appendix A
Table A1. Selected optimization methods.
Method Method Mode Generation SOURCE
Analysis Objective Function CONSTRAINTS Ref. Single Hybrid PV WT DG FC MT HB Wave SD
Adaptive Storage
Operation √ √ √ √ √
Techno-
Economic Forecast accuracy Energy balance [7]
PSCAD/EMTDC
Software √ √ √ √ √ √ Techno
Primary frequency
control
Overloading characteristics
and limitations of the state of
charge (SOC) of SD
[8]
Mixed Integer
Linear
Programming
√ √ √ Economic Microgrid operation
cost Non-linear loads [9]
√ √ √ √ √ Economic
Minimization of the
levelized cost of
energy (LCOE)
Renewable sources
intermittency [10]
√ √ √ √ √ Techno-
Economic
Optimal design of
standalone microgrid
Uncertainty of the generation
sources [11]
√ √ √ √ √ √ Economic
Optimal size of
storage device based
on cost-benefit
Unit commitment problem
with spinning reserve of
microgrid
[12]
√ √ Economic
Minimizes the
annualized
investment and
operation costs
Optimal type, size and
allocation of distributed
generators in radial
distribution system
[13]
√ √ Techno-
Economic
Non-convex economic
dispatch (ED)
Ramp rate constraints, valve-
point effect (VPE), prohibited
operating zones (POZs),
transmission loss, and
spinning reserve constraints.
[14]
Linear Programing √ √ √ √ √ Techno-
Economic
Maximizing the
economic and
minimize the annual
cost
energy prices, ambient
conditions, energy demand,
units’ characteristics,
electricity grid constraints
[15]
Cuckoo Search √ √ √ √ Economic Minimize the
operational costs System reliability [16]
Inventory Models √ √ √ Economic Minimize the
operational costs
Energy source cost and
availability [17]

Energies 2018, 11, 847 24 of 27
Self-Adaptive
Mutation Strategy √ √ √ √ √ √ Economic Cost minimization
Ramp rate of generation
sources [18]
Distributed
Economic Model
Predictive Control
√ √ √ Economic Cost minimization System stability [19]
Multi-Objective
Evolutionary
Algorithm
√ √ √ Techno-
Economic
Decreasing switching
operation System stability [20]
Dynamic
Programming
Algorithm
√ √ √ √ Techno-
Economic
Maximize the power
rating
Reliability and system
efficiency [21]
Self-Adaptive
Dynamic
Programming
√ √ √ Economic Cost minimization System stability [22]
Genetic Algorithm
√ √ √ √ Techno-
Economic
Maximize the power
rating System stability [23]
√ √ √ √ √ Economic
minimization of life-
cycle cost of the
generation sources
Limitation of battery state of
charge [24]
Particle Swarm
Optimization
√ √ √ √ Techno-
Economic Cost minimization System stability [25]
√ √ √ √ Techno-
Economic
Improve system
stability and
performance
System frequency control [26]
Particle Swarm–
Nelder–Mead √ √
Techno-
Economic Cost minimization System stability [27]
Big Bang–Big
Crunch algorithm √ √ √ √ Economic Cost minimization System reliability [28]
Non-Linear
Programming
Optimization
√ √ √ √ Economic
Maximize the
revenues of the
renewable farm
System stability [29]
Alternating
Direction Method
of Multipliers
√ √ √ √ Techno-
Economic
Minimize network
losses and energy cost Network voltage limitation [30]
Differential
Evolution
algorithm
√ √ √ √ Techno-
Economic
Reducing power
losses, improving
voltage stability of the
Network voltage limitation [31]
Energies 2018, 11, 847 25 of 27
system and reducing
charging costs
Fuzzy Logic–
Genetic Algorithm √ √ √ Economic
Predicting storage
device lifetime and
minimize the costs
Unit commitment problem [32]
Photovoltaic-
Trigeneration
Optimization
Model
√ √ √ Economic Minimize operational
costs and emissions
Renewable sources
intermittency [33]
Simulink Design
Optimization √ √ √ √ Economic Cost minimization
Renewable sources
intermittency [34]
Fuzzy Logic–
Particle Swarm
Optimization
√ √ √ √ √ Economic Minimize operational
costs and emissions System stability [35]
Fuzzy Logic–Multi
Agent System √ √ √ √ √ Economic Cost minimization System stability [36]

Energies 2018, 11, 847 26 of 27
References
1. Nosratabadi, S.M.; Hooshmand, R.-A.; Gholipour, E. A comprehensive review on microgrid and virtual
power plant concepts employed for distributed energy resources scheduling in power systems. Renew.
Sustain. Energy Rev. 2017, 67, 341–363.
2. Al-Falahi, M.D.; Jayasinghe, S.; Enshaei, H. A review on recent size optimization methodologies for
standalone solar and wind hybrid renewable energy system. Energy Convers. Manag. 2017, 143, 252–274.
3. Bahmani-Firouzi, B.; Azizipanah-Abarghooee, R. Optimal sizing of battery energy storage for micro-grid
operation management using a new improved bat algorithm. Int. J. Electr. Power Energy Syst. 2014, 56, 42–
54.
4. Al-Falahi, M.D.; Wanik, M.Z.C. Modeling and Performance Analysis of Hybrid Power System for
Residential Application. In Proceedings of the 2015 Australasian Universities Power Engineering
Conference (AUPEC), Wollongong, Australia, 27–30 September 2015; pp. 1–6.
5. Al-Falahi, M.D.; Nimma, K.S.; Jayasinghe, S.; Enshaei, H. Sizing and Modeling of a Standalone Hybrid
Renewable Energy System. In Proceedings of the IEEE Annual Southern Power Electronics Conference
(SPEC), Auckland, New Zealand, 5–8 December 2016; pp. 1–6.
6. Geem, Z.W.; Yoon, Y. Harmony search optimization of renewable energy charging with energy storage
system. Int. J. Electr. Power Energy Syst. 2017, 86, 120–126.
7. Bridier, L.; Hernández-Torres, D.; David, M.; Lauret, P. A heuristic approach for optimal sizing of ESS
coupled with intermittent renewable sources systems. Renew. Energy 2016, 91, 155–165.
8. Aghamohammadi, M.R.; Abdolahinia, H. A new approach for optimal sizing of battery energy storage
system for primary frequency control of islanded microgrid. Int. J. Electr. Power Energy Syst. 2014, 54, 325–
333.
9. Rigo-Mariani, R.; Sareni, B.; Roboam, X. Fast power flow scheduling and sensitivity analysis for sizing a
microgrid with storage. Math. Comput. Simul. 2017, 131, 114–127.
10. Malheiro, A.; Castro, P.M.; Lima, R.M.; Estanqueiro, A. Integrated sizing and scheduling of
wind/PV/diesel/battery isolated systems. Renew. Energy 2015, 83, 646–657.
11. Billionnet, A.; Costa, M.-C.; Poirion, P.-L. Robust optimal sizing of a hybrid energy stand-alone system.
Eur. J. Oper. Res. 2016, 254, 565–575.
12. Chen, S.; Gooi, H.B.; Wang, M. Sizing of energy storage for microgrids. IEEE Trans. Smart Grid 2012, 3, 142–
151.
13. Rueda-Medina, A.C.; Franco, J.F.; Rider, M.J.; Padilha-Feltrin, A.; Romero, R. A mixed-integer linear
programming approach for optimal type, size and allocation of distributed generation in radial distribution
systems. Electr. Power Syst. Res. 2013, 97, 133–143.
14. Wu, Z.L.; Ding, J.Y.; Wu, Q.H.; Jing, Z.X.; Zhou, X.X. Two-phase mixed integer programming for non-
convex economic dispatch problem with spinning reserve constraints. Electr. Power Syst. Res. 2016, 140, 653–
662.
15. Brandoni, C.; Renzi, M. Optimal sizing of hybrid solar micro-CHP systems for the household sector. Appl.
Therm. Eng. 2015, 75, 896–907.
16. Sanajaoba, S.; Fernandez, E. Maiden application of Cuckoo Search algorithm for optimal sizing of a remote
hybrid renewable energy System. Renew. Energy 2016, 96, 1–10.
17. Schneider, M.; Biel, K.; Pfaller, S.; Schaede, H.; Rinderknecht, S.; Glock, C.H. Optimal sizing of electrical
energy storage systems using inventory models. Energy Procedia 2015, 73, 48–58.
18. Mohammadi, S.; Mohammadi, A. Stochastic scenario-based model and investigating size of battery energy
storage and thermal energy storage for micro-grid. Int. J. Electr. Power Energy Syst. 2014, 61, 531–546.
19. Zhang, X.; Bao, J.; Wang, R.; Zheng, C.; Skyllas-Kazacos, M. Dissipativity based distributed economic
model predictive control for residential microgrids with renewable energy generation and battery energy
storage. Renew. Energy 2017, 100, 18–34.
20. Camillo, M.H.M.; Fanucchi, R.Z.; Romero, M.E.V.; de Lima, T.W.; Soares, A.D.; Delbem, A.C.B.; Marques,
L.T.; Maciel, C.D.; Junior, J.B.A.L. Combining exhaustive search and multi-objective evolutionary algorithm
for service restoration in large-scale distribution systems. Electr. Power Syst. Res. 2016, 134, 1–8.
21. Nguyen, T.A.; Crow, M.L.; Elmore, A.C. Optimal sizing of a Vanadium Redox battery system for microgrid
systems. IEEE Trans. Sustain. Energy 2015, 6, 729–737.
22. Rigo-Mariani, R.; Sareni, B.; Roboam, X.; Turpin, C. Optimal power dispatching strategies in smart-
microgrids with storage. Renew. Sustain. Energy Rev. 2014, 40, 649–658.
Energies 2018, 11, 847 27 of 27
23. Mohammadi, M.; Hosseinian, S.; Gharehpetian, G. GA-based optimal sizing of microgrid and DG units
under pool and hybrid electricity markets. Int. J. Electr. Power Energy Syst. 2012, 35, 83–92.
24. Zhao, B.; Zhang, X.; Li, P.; Wang, K.; Xue, M.; Wang, C. Optimal sizing, operating strategy and operational
experience of a stand-alone microgrid on Dongfushan Island. Appl. Energy 2014, 113, 1656–1666.
25. Kerdphol, T.; Fuji, K.; Mitani, Y.; Watanabe, M.; Qudaih, Y. Optimization of a battery energy storage system
using particle swarm optimization for stand-alone microgrids. Int. J. Electr. Power Energy Syst. 2016, 81, 32–
39.
26. Kerdphol, T.; Qudaih, Y.; Mitani, Y. Optimum battery energy storage system using PSO considering
dynamic demand response for microgrids. Int. J. Electr. Power Energy Syst. 2016, 83, 58–66.
27. Mesbahi, T.; Khenfri, F.; Rizoug, N.; Chaaban, K.; Bartholomeüs, P.; le Moigne, P. Dynamical modeling of
Li-ion batteries for electric vehicle applications based on hybrid Particle Swarm–Nelder–Mead (PSO–NM)
optimization algorithm. Electr. Power Syst. Res. 2016, 131, 195–204.
28. Ahmadi, S.; Abdi, S. Application of the Hybrid Big Bang–Big Crunch algorithm for optimal sizing of a
stand-alone hybrid PV/wind/battery system. Solar Energy 2016, 134, 366–374.
29. Berrada, A.; Loudiyi, K. Operation, sizing, and economic evaluation of storage for solar and wind power
plants. Renew. Sustain. Energy Rev. 2016, 59, 1117–1129.
30. Nick, M.; Cherkaoui, R.; Paolone, M. Optimal siting and sizing of distributed energy storage systems via
alternating direction method of multipliers. Int. J. Electr. Power Energy Syst. 2015, 72, 33–39.
31. Moradi, M.H.; Abedini, M.; Tousi, S.R.; Hosseinian, S.M. Optimal siting and sizing of renewable energy
sources and charging stations simultaneously based on Differential Evolution algorithm. Int. J. Electr. Power
Energy Syst. 2015, 73, 1015–1024.
32. Fossati, J.P.; Galarza, A.; Martín-Villate, A.; Fontán, L. A method for optimal sizing energy storage systems
for microgrids. Renew. Energy 2015, 77, 539–549.
33. Nosrat, A.H.; Swan, L.G.; Pearce, J.M. Simulations of greenhouse gas emission reductions from low-cost
hybrid solar photovoltaic and cogeneration systems for new communities. Sustain. Energy Technol. Assess.
2014, 8, 34–41.
34. Castañeda, M.; Cano, A.; Jurado, F.; Sanchez, H.; Fernandez, L.M. Sizing optimization, dynamic modeling
and energy management strategies of a stand-alone PV/hydrogen/battery-based hybrid system. Int. J.
Hydrogen Energy 2013, 38, 3830–3845.
35. Mahmoud, T.S.; Habibi, D.; Bass, O. Fuzzy Logic for Smart Utilisation of Storage Devices in a Typical
Microgrid. In Proceedings of the 2012 International Conference on Renewable Energy Research and
Applications (ICRERA), Nagasaki, Japan, 11–14 November 2012; pp. 1–6.
36. Mahmoud, T.S.; Habibi, D.; Bass, O. Fuzzy-Based Adaptive Pricing Rules for a Typical Microgrid Energy
Management system. In Proceedings of the 9th IET International Conference on Advances in Power System
Control, Operation and Management (APSCOM 2012), Hong Kong, China, 18–21 November 2012; pp. 1–6.
37. Mirjalili, S.; Mirjalili, S.M.; Lewis, A. Grey wolf optimizer. Adv. Eng. Softw. 2014, 69, 46–61.
38. Kamboj, V.K.; Bath, S.; Dhillon, J. Solution of non-convex economic load dispatch problem using Grey Wolf
Optimizer. Neural Comput. Appl. 2016, 27, 1301–1316.
39. Sheng, W.; Liu, K.-Y.; Meng, X.; Ye, X.; Liu, Y. Research and practice on typical modes and optimal
allocation method for PV-Wind-ES in microgrid. Electr. Power Syst. Res. 2015, 120, 242–255.
40. Moghaddam, A.A.; Seifi, A.; Niknam, T. Multi-operation management of a typical micro-grids using
Particle Swarm Optimization: A comparative study. Renew. Sustain. Energy Rev. 2012, 16, 1268–1281.
41. DiOrio, N.; Dobos, A.; Janzou, S.; Nelson, A.; Lundstrom, B. Technoeconomic Modeling of Battery Energy
Storage in SAM; National Renewable Energy Laboratory, Golden, CO, USA, 2015.
42. Feng, X.; Gooi, H.B.; Chen, S. Capacity fade-based energy management for lithium-ion batteries used in PV
systems. Electr. Power Syst. Res. 2015, 129, 150–159.
© 2018 by the authors. Licensee MDPI, Basel, Switzerland. This article is an open access
article distributed under the terms and conditions of the Creative Commons Attribution
(CC BY) license (http://creativecommons.org/licenses/by/4.0/).