
Determination of optimum parameters with multi-performance characteristics in laser drilling—A...
11
ORIGINAL ARTICLE Determination of optimum parameters with multi-performance characteristics in laser drilling—A grey relational analysis approach Sumanta Panda & Debadutta Mishra & Bibhuti B. Biswal Received: 23 October 2009 / Accepted: 11 October 2010 / Published online: 6 November 2010 # Springer-Verlag London Limited 2010 Abstract Laser drilling is increasingly becoming the method of choice for precision drilling for variety of components. However, a number of defects such as spatter, recast, heat-affected zone (HAZ), and taper limit the application. Elimination of these defects is the subject of intense research. This paper presents a grey relational optimization approach for the determination of the optimum process parameters which minimize the HAZ and hole circularity and maximize material removal rate in a Pulsed Nd:YAG laser micro-drilling in high carbon steel within existing resources. The input process parameters considered are pulse width, number of pulses, assist gas (oxygen) flow rate, and its supply pressure. A higher resolution-based L 25 orthogonal array has been used for conducting the experi- ments. The designed experimental results are used in grey relational analysis and the weights of the quality character- istics are determined optimizing the parameters. On the basis of optimization results, it has been found that the optimal parameter level gives a small HAZ, fine hole, and maximum material removal rate. Subsequently, the results are also verified and found appropriate by running confirmation tests. Keywords Hole circularity . Heat-affected zone . Laser micro-drilling . Grey relational analysis 1 Introduction Laser-drilling technique has progressed remarkably to become the method of choice for meeting a vast majority of potential industrial requirements for micro hole drilling in diverse components such as watches, turbine blades, circuit boards, etc. [1]. Beam-energy-based material pro- cesses are of benefit in the processing of difficult-to-process materials with stringent design requirements, complex shape, and unusual size of work piece. In beam machining processes, the thermal source of energy for processing is achieved by focusing a beam of photons, electrons, +ve ions, or plasma on to the work piece. Pulsed laser drilling has progressed remarkably over the years to become an essential tool for micro-hole drilling in many components used in the technologically advanced industries. The basic material removal mechanism in laser drilling is based on the absorption of laser energy from a series of laser pulses at the same spot [2, 3]. Material is melted and ejected to form a hole. The use of laser micro- drilling or micro-machining in manufacturing industry can be attributed to several advantages like high production rate, applicable to both conductive and non-conductive materials, no mechanical damage or tool wear due to non- contact processing, improved product quality, low material wastage, low production cost, small heat-affected zone (HAZ), and ecologically clean technology. A pulsed Nd: YAG laser produces high intensity infrared radiation at a wavelength of 1.06 μm, power ranging from 500 to 12,000 W. Due to its short wavelength (compared withCO 2 lasers), it enables processing of highly reflective materials with less laser power [4]. Taper formation and production of non-circular holes are characteristic of the laser micro- drilling operation, as laser machining is based on the interaction of a laser beam with inherent focusing character- S. Panda : D. Mishra (*) Department of Manufacturing Science and Engineering, VSS University of Technology, Burla 768018 Orissa, India e-mail: [email protected] B. B. Biswal Department of Training and Placement, National Institute of Technology, Rourkela 769008 Orissa, India Int J Adv Manuf Technol (2011) 54:957–967 DOI 10.1007/s00170-010-2985-8
Transcript of Determination of optimum parameters with multi-performance characteristics in laser drilling—A...
ORIGINAL ARTICLE
Determination of optimum parameterswith multi-performance characteristics in laserdrilling—A grey relational analysis approach
Sumanta Panda & Debadutta Mishra & Bibhuti B. Biswal
Received: 23 October 2009 /Accepted: 11 October 2010 /Published online: 6 November 2010# Springer-Verlag London Limited 2010
Abstract Laser drilling is increasingly becoming themethod of choice for precision drilling for variety ofcomponents. However, a number of defects such as spatter,recast, heat-affected zone (HAZ), and taper limit theapplication. Elimination of these defects is the subject ofintense research. This paper presents a grey relationaloptimization approach for the determination of the optimumprocess parameters which minimize the HAZ and holecircularity and maximize material removal rate in a PulsedNd:YAG laser micro-drilling in high carbon steel withinexisting resources. The input process parameters consideredare pulse width, number of pulses, assist gas (oxygen) flowrate, and its supply pressure. A higher resolution-based L25
orthogonal array has been used for conducting the experi-ments. The designed experimental results are used in greyrelational analysis and the weights of the quality character-istics are determined optimizing the parameters. On thebasis of optimization results, it has been found that theoptimal parameter level gives a small HAZ, fine hole, andmaximum material removal rate. Subsequently, the resultsare also verified and found appropriate by runningconfirmation tests.
Keywords Hole circularity . Heat-affected zone .
Laser micro-drilling . Grey relational analysis
1 Introduction
Laser-drilling technique has progressed remarkably tobecome the method of choice for meeting a vast majorityof potential industrial requirements for micro hole drillingin diverse components such as watches, turbine blades,circuit boards, etc. [1]. Beam-energy-based material pro-cesses are of benefit in the processing of difficult-to-processmaterials with stringent design requirements, complexshape, and unusual size of work piece. In beam machiningprocesses, the thermal source of energy for processing isachieved by focusing a beam of photons, electrons, +veions, or plasma on to the work piece.
Pulsed laser drilling has progressed remarkably over theyears to become an essential tool for micro-hole drilling inmany components used in the technologically advancedindustries. The basic material removal mechanism in laserdrilling is based on the absorption of laser energy from aseries of laser pulses at the same spot [2, 3]. Material ismelted and ejected to form a hole. The use of laser micro-drilling or micro-machining in manufacturing industry canbe attributed to several advantages like high productionrate, applicable to both conductive and non-conductivematerials, no mechanical damage or tool wear due to non-contact processing, improved product quality, low materialwastage, low production cost, small heat-affected zone(HAZ), and ecologically clean technology. A pulsed Nd:YAG laser produces high intensity infrared radiation at awavelength of 1.06 μm, power ranging from 500 to12,000 W. Due to its short wavelength (compared withCO2
lasers), it enables processing of highly reflective materialswith less laser power [4]. Taper formation and productionof non-circular holes are characteristic of the laser micro-drilling operation, as laser machining is based on theinteraction of a laser beam with inherent focusing character-
S. Panda :D. Mishra (*)Department of Manufacturing Science and Engineering,VSS University of Technology,Burla 768018 Orissa, Indiae-mail: [email protected]
B. B. BiswalDepartment of Training and Placement,National Institute of Technology,Rourkela 769008 Orissa, India
Int J Adv Manuf Technol (2011) 54:957–967DOI 10.1007/s00170-010-2985-8
istics [5]. But it is desirable to make the drilled holescircular without taper. Modeling of the process is requiredto be able to control these two important characteristics.Developing a physical model for laser percussion drilling isvery complicated since a large number of parameterscontrol the process. Some prior studies have used statisticalmodels to analyze and determine optimal parameter settingof the process.
Kuar et al. [6] experimentally investigated the influenceof laser machining parameters on the heat affected zonethickness and phenomena of tapering during CNC-pulsedNd:YAG laser micro-drilling of zirconium oxide(ZrO2) andperformed parametric analysis through response surfacemethodology (RSM). In another study, Kuar et al. [7]investigated the effect of several laser machining parame-ters on HAZ thickness and taper of the micro drilled holeson alumina–aluminum composite. Ghoreishi et al. [8]employed a statistical model to analyze and compare holetaper and circularity in laser percussion drilling on stainlesssteel and mild steel. Jackson and O’Neill [9] investigatedthe interaction phenomena of Q-switched, diode-pumpedNd:YAG laser using different wavelengths on M2 toolsteel. Yilbas and Yilbas [10] used a statistical method toinvestigate the effects of the variation of single-pulse laserdrilling parameters on the hole geometry for Nimonic75-workpiece material by using a full factorial design toidentify the main and first-order interaction effects on thehole quality in single-pulse drilling including re-solidifiedmaterial, taper, barreling, inlet cone, exit cone, surfacedebris, and mean hole diameter. Yilbas [11] examined fourmaterials nickel, tantalum, EN-58-B, and titanium to obtainlaser drilling speed using a statistical analysis. In anotherstudy, Yilbas [12] conducted drilling experiments on threematerials, stainless steel, nickel, and titanium, using single-pulsed laser beam. It has been shown that the extent oftaper formation during laser percussion drilling of thinsections can be significantly reduced by suitable control oflaser variables. His work has further revealed that optimi-zation of parameters like focal position, pulse energy, pulsewidth and pulse frequency can effectively control recastlayer formation inside the drilled hole. In this context, it canbe suggested that the required peak power should bepreferably obtained by appropriate control of pulse energyand pulse duration. Bandhopadhayay et al. [13] investigatedthe influence of the process variables on hole diameter andtaper angle of drilled holes produced on thick IN 718 andTi-6Al–4V sheets by Nd:YAG laser. French et al. [14] usedtwo level factors in Nd:YAG laser percussion drilling tofind the significant factors from a list of 17 factors. Themain effects of factors and first- and second-order inter-actions were analyzed, and it was found that pulse shape,energy, peak power, focal position, gas pressure, and Nd:YA Glaser rod were the most significant influences on the
hole taper and circularity. In addition to statistical analysisof hole taper, some recent efforts have also been made tocontrol hole taper via the development of drilling techni-ques [15, 16]. Almeida et al. [17] investigated the effects ofNd:YAG laser machining on quality and formation ofphases in the cut surface on commercially pure titanium(grade 2) and Ti-6Al-4V (grade 5) sheets. The processparameters were investigated using factorial. Normally, ahigh peak power is desirable to promote material removalby vaporization rather than melting, and the high vaporpressure generated in the process also serves to efficientlyeject molten material, thereby suppressing formation ofrecast layer. Studies by Yeo et al. [18] and results reportedby Chen et al. [19] indicate that excessively long pulseduration or a very high pulse energy can both lead todeformation of parent material structure as well asadversely influence taper and recast layer formation. Otherresearch efforts have established that a shorter pulseduration minimizes the recast layer and reduces micro-cracking at the sidewalls of the laser-drilled hole [20, 21],with a pulse duration of 0.1–2.5 ms being proposed asbeing most suitable for deep hole drilling [22]. There hasalso been an initiation of efforts aimed at tailoring the pulsepattern to enhance hole quality, and this has yieldedencouraging results [23, 24]. Several methods involvingapplication of anti-spatter coatings [18, 25, 26] as well asdrilling in transparent media [22] have also been experi-mented with to minimize spatter formation.
Researchers have investigated the effect of laser cuttingparameters on performance of laser micro-drilling qualityand also suggested the optimal parameter ranges duringcutting of conventional sheet metals and also few advancedsheet materials like ceramics, composites and super alloysby varying the one factor at a time. But this techniquerequires a large number of experimental runs. To overcomethis problem, few researchers have also applied the designof experiment approach for deciding the optimal parameterlevels during study of laser beam cutting process perfor-mance. The Taguchi method (TM) is a statistical approachfor the purpose of designing and improving product quality.It uses orthogonal array to set up the experiment for theadvantage of less number of experiments,and optimizes theprocess parameters by the analysis of signal-to-noise ratioresponse table and response graph. The optimal processparameters can improve the robustness of products, so theTaguchi method is also called parameter design. In recentyears, the TM has become a powerful tool for improving theproductivity during research and development stage so thatquality products can be produced quickly and at low cost.
Some researchers have concentrated on achieving mul-tiple quality characteristic at a time as a function ofdifferent appropriate level of input parameter settings.Dubey et al. [27–29] applied TM, orthogonal array with
958 Int J Adv Manuf Technol (2011) 54:957–967
principle component analysis and TM, and RSM tooptimize multiple quality characteristics during pulsed Nd:YAG laser cutting of different thin sheets. Some researchersalso tried to solve the problem with multiple qualitycharacteristics by the grey relational analysis (GRA). In1982, Deng first proposed grey relational analysis to fulfillthe crucial mathematical criteria for dealing with a poor,incomplete, and uncertain system [30]. In GRA, blackrepresents having no information and white representshaving all information. A grey system has a level ofinformation between black and white. It avoids the inherentshortcomings of conventional, statistical methods and onlyrequires a limited data to estimate the behavior of anuncertain system. It also provides an efficient solution tothe uncertain, multi-input, and discrete data problem. Themain function of the GRA is to indicate the relational degreebetween two sequences by using discrete measurementmethod the distance. GRA can be effectively recommendedas a method for optimizing the complicated interrelation-ships among multiple performance characteristics [31, 32].
2 Experimental procedure
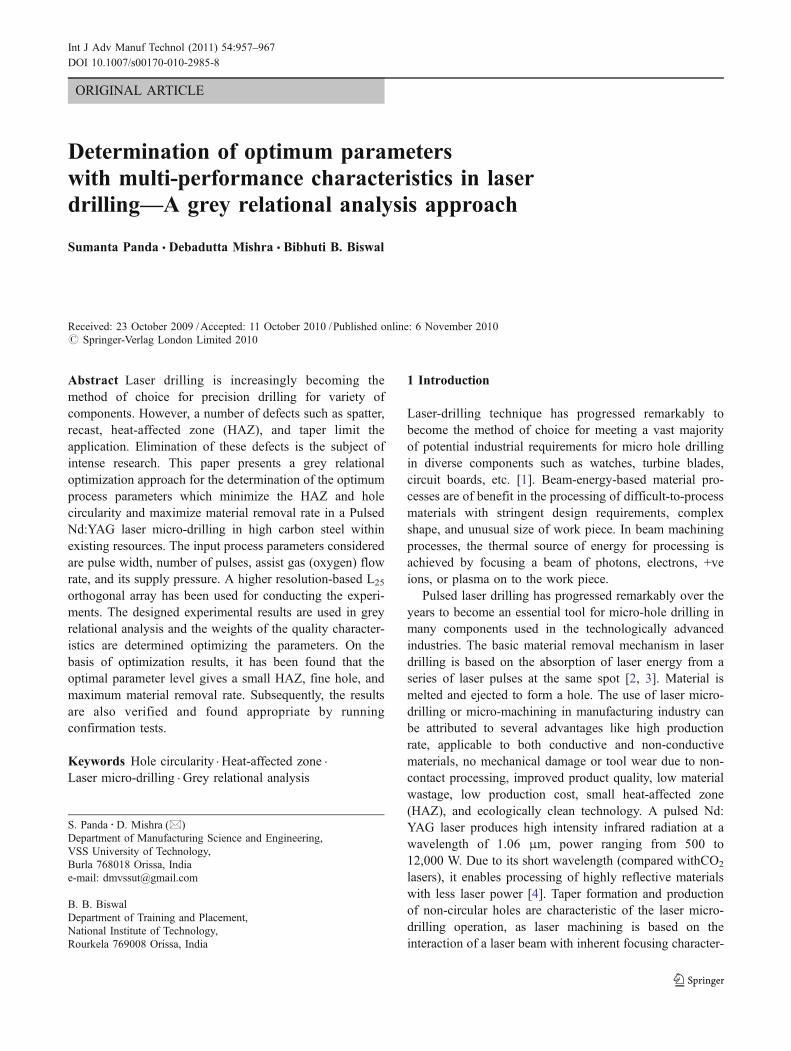
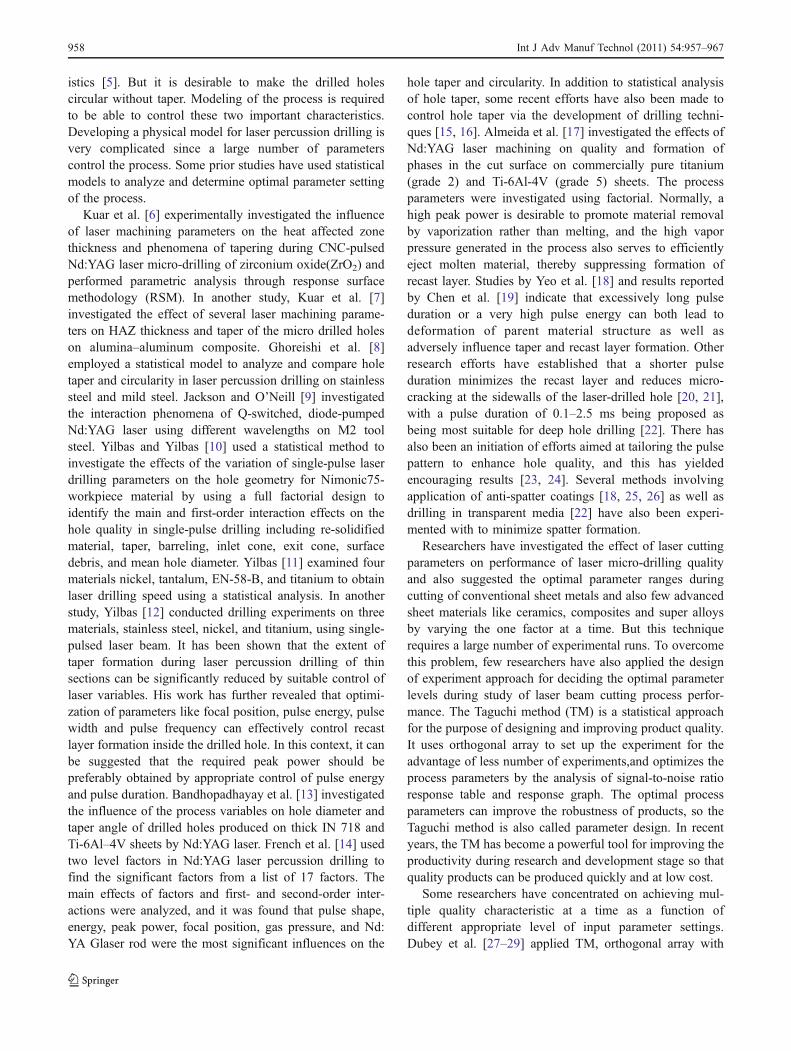
The experiments of laser drilling were conducted using a100-W-pulsed Nd:YAG laser beam system (SIL-100 model,SI Laser, Pune, India) with wavelength 1.06 μm (Figs. 1, 2).Oxygen was used as the assist gas, and it is supplied at apressure of 2 Kg/cm2. The assist gas was passed through aconical nozzle of diameter 1.0 mm co-axially with the laserbeam. The laser beam was focused using a lens of focallength 50 mm. The stand-off distance (SOD) was set at1.0 mm. The work piece was a high carbon steel DomexC67 thin sheet, the chemical composition of which is givenin Table 1. Nozzle diameter, focal length of lens, nozzlestand-off distance, and work piece material thickness werekept constant throughout the experimentation. Because of
large number of independent parameters that control thelaser micro-drilling process, a parametric study wasconducted by Biswas et al. [33] in order to determinewhich parameters should be considered for optimization. Inthis case, the pulse width was varied keeping pulse rateconstant, and it was found that power output was remainconstant for range of pulse width and the experiments wereconducted in those range of pulse with. Therefore theoptimization of the laser micro-drilling process wasobtained by varying only the pulse width, pulse rate, assistgas flow rate, and assist gas supply pressure in this study.
During experimentation, some errors may be induced dueto system sensitivity and other process-related activities.Oxygen as assist gas acts as an additional heat source andhelps in improving the rate of machining. The formation ofoxides like Cr2O3 formed during the process also supportsthis argument. In this context, it is relevant to mention thatmaterial removal during micro-drilling occurs as a result ofboth vaporization and melting. The molten metal is ejectedout from the entry side by the recoil pressure generated bymaterial vaporization and it can erode the wall of hole. Thisresults in greater interaction between hole wall and the meltand may lead to higher hole diameter. Higher flow rate ofassist gas increases the material removal rate as more gaswill be available for oxidation during machining process buthigh gas line pressure may increase the entry side diameter.
Further, at higher pulse frequency less or no time isavailable for the molten material to re-solidify and as a resultthe hole diameter tend to increase. Also at higher pulse widthand low pulse frequency material removal rate, width of HAZand hole diameter may be affected. The SOD between thelaser head and the workpiece is mechanical which may inducesome backlash error in the gauges leading to variation in holesize. Also, the beam spot may not fall exactly on theworkpiece surface due to this variation.
Photographic view of pulsed ND: YAG Laser drilling system
Fig. 1 Photographic view of pulsed ND:YAG laser drilling system
Schematic representation of ND:YAG Laser Beam Drilling Process
Mirror (Partial Reflective)
Cooling Unit
Xenon Flash Lamp- Excitation source
LASER MEDIUM (ND:YAG Rod
Lens
Work Piece
Table
Supply of O2 gas to
nozzle
Rear Mirror (Reflective)
Beading Mirror
Fig. 2 Schematic representation of ND:YAG laser beam drillingprocess
Int J Adv Manuf Technol (2011) 54:957–967 959
In multiobjective optimization, the loss in some qualitycharacteristics is always expected as compared to a singleobjective optimization but the overall quality alwaysimproves. In the present case, performance characteristicslike the hole circularity, small HAZ, and high materialremoval rate (MRR) have improved considerably.
The summary of experimental conditions is listed inTable 2. The experimental results after laser micro-drillingwere evaluated in terms of the following measuredmachining performances: (1) hole diameter; (2) widthHAZ; (3) MRR. Each parameter was measured five timesand average value taken for a more accurate reading. Thehole diameter and width of HAZ of laser micro-drillingsurfaces were measured using a OLYMPUS GX41 (×100)microscope. In order to achieve best drilling quality,Taguchi’s experimental design, an efficient plan, was usedfor conducting experiments (Fig. 3). For this purpose, a L25
orthogonal array was used for experiment (Table 3). Theexperimental results are summarized in Table 3.
In order to perform the experiment, the following stepsare followed:
Step 1: In order to perform the experiment work-piece ofspecific dimension was taken and it was cut intofive pieces, and surface of each work-piecespecimen was grinded using surface grindingmachine. Then, it was polished in the surfacepolishing machine, using emery paper of differentgrades like—400, 220, 100, 80, 0/1, 0/2, 0/3, 0/4.
Step 2: On a sample work piece of same material laserdrilling was done by keeping the pulse rateconstant and varying pulse width. Output powerwas measured using the wattmeter. Pulse widthrange for which output power remains constantwas determined from the experiment.
Step 3: Drilling of microholes was carried out by focusinglaser light on the specimen one by one by varyingits pulse width, number of pulses, assist gas flowrate and pressure subsequently. For each pulse widthfrom the previously determined range, the pulse ratewas varied in the range 1 to 5 with variation of assist
gas pressure and flow rate according to taguchi L25
array, and holes were drilled and the output powerwas measured simultaneously.
Step 4: The work pieces were etched with the solution ofnatal (dehydrated ethyl alcohol (C2H5OH) andconcentrated nitric acid (HNO3) 10% v/v).Thepost-etched work pieces were again polished withfine-grade emery paper.
Step 5: After getting completely smooth surface, thespecimens were kept under the electronic micro-scope which was interfaced to the computerthrough a data cable. The digital camera wasused to capture the photographs of each hole.Using the Material-plus software the holes andHAZ diameter measurement were measured.
3 Grey relational analysis
In grey relational analysis, black represents having noinformation and white represents having all information. Agrey system has a level of information between black andwhite [34]. This analysis can be used to represent the gradeof correlation between two sequences so that the distance oftwo factors can be measured discretely. In the case whenexperiments are ambiguous or when the experimentalmethod cannot be carried out exactly, grey analysis helpsto compensate for the shortcoming in statistical regression[35]. Grey relation analysis is an effective means ofanalyzing the relationship between sequences with lessdata and can analyze many factors that can overcome thedisadvantages of statistical method [36].
3.1 Data pre-processing
In GRA, when the range of sequences is large or thestandard value is large, the functions of factors areneglected. However, if a factor’s measured unit, goals,and directions are different, the grey relational analysismight produce incorrect results. Therefore, original exper-
C Si Mn P S Cr Mo V Fe
0.7 0.35 0.7 0.025 0.025 0.3 0.015 0.01 Balance
Table 1 Nominal chemicalcomposition of Domex C67steel
Symbol Cutting factors Level 1 Level 2 Level 3 Level 4 Level 5
A Pulse width 1,700 1,800 1,900 2,000 2,100
B No. of pulses 1 2 3 4 5
C Assist gas pressure 2 3 4 5 6
D Assist gas flow rate 1 2 3 4 5
Table 2 Laser micro-drillingfactors and their levels
960 Int J Adv Manuf Technol (2011) 54:957–967
imental data must be pre-processed to avoid such effects.Data pre-processing is the process of transforming theoriginal sequence to a comparable sequence. For thispurpose, the experimental results are normalized in therange of zero and one, the process is called grey relationalgenerating. Three different types of data normalizationaccording to whether we require the lower is better, thehigher is better, or nominal the best. The normalization istaken by three approaches. If the target value of originalsequence is infinite, then it has a characteristic of “the-larger-the-better” (e.g. benefit). The original sequence canbe normalized as follows [37];
x»
i ðkÞ ¼x»i ðkÞ �min x0i ðkÞ
max x0i ðkÞ �min x0i ðkÞð1Þ
If the expectancy is the-smaller-the-better (e.g. cost anddefects), then the original sequence should be normalized asfollows:
x»
i ðkÞ ¼max x0i ðkÞ � x0i ðkÞ
max x0i ðkÞ �min x0i ðkÞÞð2Þ
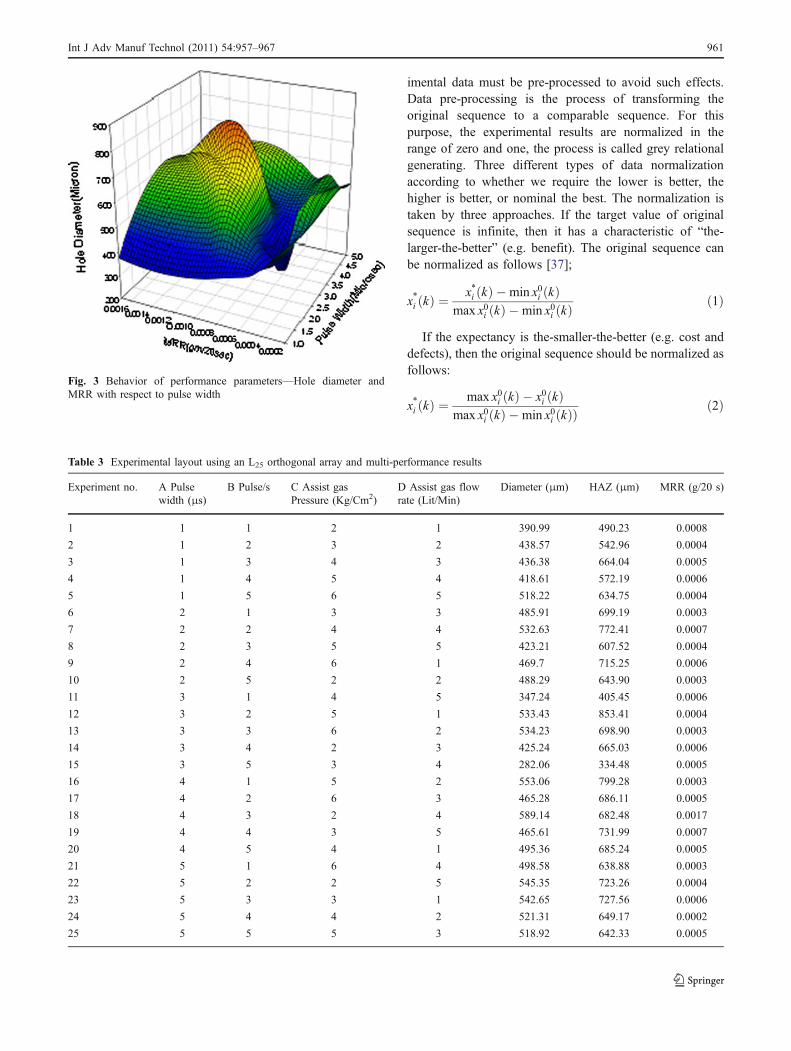
Fig. 3 Behavior of performance parameters—Hole diameter andMRR with respect to pulse width
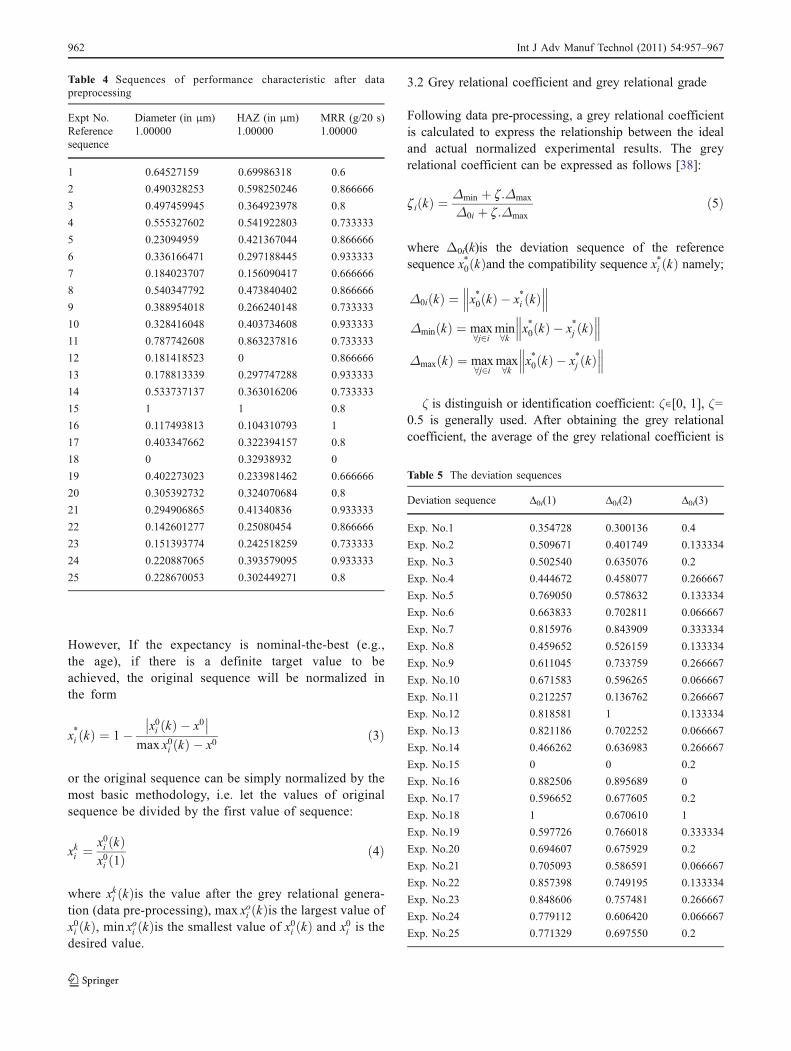
Table 3 Experimental layout using an L25 orthogonal array and multi-performance results
Experiment no. A Pulsewidth (μs)
B Pulse/s C Assist gasPressure (Kg/Cm2)
D Assist gas flowrate (Lit/Min)
Diameter (μm) HAZ (μm) MRR (g/20 s)
1 1 1 2 1 390.99 490.23 0.0008
2 1 2 3 2 438.57 542.96 0.0004
3 1 3 4 3 436.38 664.04 0.0005
4 1 4 5 4 418.61 572.19 0.0006
5 1 5 6 5 518.22 634.75 0.0004
6 2 1 3 3 485.91 699.19 0.0003
7 2 2 4 4 532.63 772.41 0.0007
8 2 3 5 5 423.21 607.52 0.0004
9 2 4 6 1 469.7 715.25 0.0006
10 2 5 2 2 488.29 643.90 0.0003
11 3 1 4 5 347.24 405.45 0.0006
12 3 2 5 1 533.43 853.41 0.0004
13 3 3 6 2 534.23 698.90 0.0003
14 3 4 2 3 425.24 665.03 0.0006
15 3 5 3 4 282.06 334.48 0.0005
16 4 1 5 2 553.06 799.28 0.0003
17 4 2 6 3 465.28 686.11 0.0005
18 4 3 2 4 589.14 682.48 0.0017
19 4 4 3 5 465.61 731.99 0.0007
20 4 5 4 1 495.36 685.24 0.0005
21 5 1 6 4 498.58 638.88 0.0003
22 5 2 2 5 545.35 723.26 0.0004
23 5 3 3 1 542.65 727.56 0.0006
24 5 4 4 2 521.31 649.17 0.0002
25 5 5 5 3 518.92 642.33 0.0005
Int J Adv Manuf Technol (2011) 54:957–967 961
However, If the expectancy is nominal-the-best (e.g.,the age), if there is a definite target value to beachieved, the original sequence will be normalized inthe form
x»
i ðkÞ ¼ 1� x0i ðkÞ � x0�� ��
max x0i ðkÞ � x0ð3Þ
or the original sequence can be simply normalized by themost basic methodology, i.e. let the values of originalsequence be divided by the first value of sequence:
xki ¼x0i ðkÞx0i ð1Þ
ð4Þ
where xki ðkÞis the value after the grey relational genera-tion (data pre-processing), max xoi ðkÞis the largest value ofx0i ðkÞ, min xoi ðkÞis the smallest value of x0i ðkÞ and x0i is thedesired value.
3.2 Grey relational coefficient and grey relational grade
Following data pre-processing, a grey relational coefficientis calculated to express the relationship between the idealand actual normalized experimental results. The greyrelational coefficient can be expressed as follows [38]:
z iðkÞ ¼Δmin þ z:Δmax
Δ0i þ z:Δmaxð5Þ
where Δ0i(k)is the deviation sequence of the referencesequence x
»0ðkÞand the compatibility sequence x
»i ðkÞ namely;
Δ0iðkÞ ¼ x»
0ðkÞ � x»
i ðkÞ���
���
ΔminðkÞ ¼ max8j2i
min8k
x»
0ðkÞ � x»
j ðkÞ���
���
ΔmaxðkÞ ¼ max8j2i
max8k
x»
0ðkÞ � x»
j ðkÞ���
���
ζ is distinguish or identification coefficient: ζ∊[0, 1], ζ=0.5 is generally used. After obtaining the grey relationalcoefficient, the average of the grey relational coefficient is
Table 4 Sequences of performance characteristic after datapreprocessing
Expt No. Diameter (in μm) HAZ (in μm) MRR (g/20 s)Referencesequence
1.00000 1.00000 1.00000
1 0.64527159 0.69986318 0.6
2 0.490328253 0.598250246 0.866666
3 0.497459945 0.364923978 0.8
4 0.555327602 0.541922803 0.733333
5 0.23094959 0.421367044 0.866666
6 0.336166471 0.297188445 0.933333
7 0.184023707 0.156090417 0.666666
8 0.540347792 0.473840402 0.866666
9 0.388954018 0.266240148 0.733333
10 0.328416048 0.403734608 0.933333
11 0.787742608 0.863237816 0.733333
12 0.181418523 0 0.866666
13 0.178813339 0.297747288 0.933333
14 0.533737137 0.363016206 0.733333
15 1 1 0.8
16 0.117493813 0.104310793 1
17 0.403347662 0.322394157 0.8
18 0 0.32938932 0
19 0.402273023 0.233981462 0.666666
20 0.305392732 0.324070684 0.8
21 0.294906865 0.41340836 0.933333
22 0.142601277 0.25080454 0.866666
23 0.151393774 0.242518259 0.733333
24 0.220887065 0.393579095 0.933333
25 0.228670053 0.302449271 0.8
Table 5 The deviation sequences
Deviation sequence Δ0i(1) Δ0i(2) Δ0i(3)
Exp. No.1 0.354728 0.300136 0.4
Exp. No.2 0.509671 0.401749 0.133334
Exp. No.3 0.502540 0.635076 0.2
Exp. No.4 0.444672 0.458077 0.266667
Exp. No.5 0.769050 0.578632 0.133334
Exp. No.6 0.663833 0.702811 0.066667
Exp. No.7 0.815976 0.843909 0.333334
Exp. No.8 0.459652 0.526159 0.133334
Exp. No.9 0.611045 0.733759 0.266667
Exp. No.10 0.671583 0.596265 0.066667
Exp. No.11 0.212257 0.136762 0.266667
Exp. No.12 0.818581 1 0.133334
Exp. No.13 0.821186 0.702252 0.066667
Exp. No.14 0.466262 0.636983 0.266667
Exp. No.15 0 0 0.2
Exp. No.16 0.882506 0.895689 0
Exp. No.17 0.596652 0.677605 0.2
Exp. No.18 1 0.670610 1
Exp. No.19 0.597726 0.766018 0.333334
Exp. No.20 0.694607 0.675929 0.2
Exp. No.21 0.705093 0.586591 0.066667
Exp. No.22 0.857398 0.749195 0.133334
Exp. No.23 0.848606 0.757481 0.266667
Exp. No.24 0.779112 0.606420 0.066667
Exp. No.25 0.771329 0.697550 0.2
962 Int J Adv Manuf Technol (2011) 54:957–967
normally taken as the grey relational grade. The greyrelational grade is defined as follows:
gi ¼1
n
Xn
k¼1
z iðkÞ ð6Þ
However, since in real application, the effect of eachfactor on the system is not exactly same. Equation 6 can bemodified as:
gi ¼1
n
Xn
k¼1
wkz iðkÞXn
k¼1
wk ¼ 1 ð7Þ
Where wk represents the normalized weighing valueof factor k. Given the same weights, Eqs. 6 and 7 areequal.
In the grey relational analysis, the grey relational gradeis used to show the relationship among the sequences. If thetwo sequences are identical, then the value of greyrelational grade is equal to 1. The grey relational gradealso indicates the degree of influence that the comparabilitysequence could exert over the reference sequence. There-fore, if a particular comparability sequence is moreimportant than the other comparability sequences to thereference sequence, then the grey relational grade for that
Expt no. Grey relational coefficient Grey relational grade Order
Diameter HAZ MRR
1 0.584981 0.624893 0.555555 0.588476 5
2 0.495210 0.554478 0.789472 0.613053 3
3 0.498733 0.440499 0.714285 0.551172 13
4 0.529284 0.521878 0.652173 0.567778 11
5 0.393995 0.463550 0.789472 0.549005 14
6 0.429614 0.415692 0.882352 0.575886 8
7 0.379946 0.372049 0.599999 0.450664 24
8 0.521022 0.487253 0.789472 0.599249 4
9 0.450026 0.405265 0.652173 0.502488 20
10 0.426773 0.456094 0.882352 0.588406 6
11 0.701993 0.785222 0.652173 0.713129 2
12 0.379195 0.333333 0.789472 0.500666 21
13 0.378447 0.415886 0.882352 0.558895 12
14 0.517457 0.439760 0.652173 0.536463 15
15 1 1 0.714285 0.904761 1
16 0.361662 0.358245 1 0.573302 10
17 0.455933 0.424590 0.714285 0.531602 16
18 0.333333 0.427127 0.333333 0.364597 25
19 0.455487 0.394939 0.599999 0.483475 22
20 0.418547 0.425195 0.714285 0.519342 18
21 0.414905 0.460154 0.882352 0.585803 7
22 0.368351 0.400257 0.789472 0.519360 17
23 0.370753 0.397620 0.652173 0.473515 23
24 0.390896 0.451907 0.882352 0.575051 9
25 0.393289 0.417519 0.714285 0.508364 19
Table 6 Grey relational coeffi-cient and Grey relational grade
Cutting parameters Average grey relational grade by factor level
Level 1 Level 2 Level 3 Level 4 Level 5 Max–min
A 0.5738968 0.5433386 0.642782a 0.4944636 0.5324186 0.148319
B 0.607319 0.514264 0.509485 0.5330506 0.613975a 0.104490
C 0.516589 0.554567 0.627694a 0.540326 0.547722 0.111100
D 0.517974 0.566086 0.541904 0.610708a 0.529715 0.092734
Table 7 Response table for thegrey relational grade
a Optimal level
Int J Adv Manuf Technol (2011) 54:957–967 963
comparability sequence and reference sequence will behigher than other grey relational grades [15]. The greyrelational algorithm involves the following steps.
Step 1: Normalize the experimental results of eachperformance characteristic.
Step 2: Compute the value of $0iðkÞ ¼ x»0ðkÞ � x
»i ðkÞ
�� ��,$minðkÞ ¼max
8j2imin8k
x»0ðkÞ�x
»j ðkÞ
������ and $maxðkÞ ¼
max8j2i
max8k
x»0ðkÞ � x
»j ðkÞ
������ to calculate the grey
relational coefficient.Step 3: Calculate the grey relational grade by the mean
value of grey relational coefficient.Step 4: Compute the response table and response graph
for each level of the laser drilling parameters.Step 5: Recognize the noticeable variable factors and
selects the optimal levels of drilling parameter.Step 6: Run confirmation test and verify.
4 Analysis and interpretation of experimental results
In the present study, the hole diameter, width of HAZ, andMRR for different pulsed width and pulse rate aremeasured, and the experimental runs are listed in Table 3.Typically, lower values of the hole diameter, width of HAZ,and higher MRR as the target values are desirable.Therefore, the data sequences have a smaller the bettercharacteristic for hole diameter and HAZ and larger thebetter characteristics for MRR.
The values of the hole diameter, width of HAZ, andMRR are set to be the reference sequence, x
»i ðkÞ, k=1−3.
Moreover, the results of 25 experiments were the compa-rability sequences x
»0ðkÞ, i=1,2……25, k=1−3. Table 4
lists all of the sequences following data pre-processingusing Eq. 2 for hole diameter and HAZ and Eq. 1 for MRR.
The deviation sequences; Δ0i, Δmax(k), and Δmin(k) fori=1,2……25, k=1−3 can be calculated as follows:
$01ð1Þ ¼ x»
0ð1Þ � x»
1ð1Þ���
��� ¼ 1� 0:64527159j j ¼ 0:354728
$02ð2Þ ¼ x»
0ð2Þ � x»
1ð2Þ���
��� ¼ 1� 0:69986318j j ¼ 0:300136
$03ð3Þ ¼ x»
0ð3Þ � x»
1ð3Þ���
��� ¼ 1� 0:6j j ¼ 0:4
The results for all deviation sequence are given inTable 5.
Using Table 5, the Δmax and Δmin can be found asfollows;
$max ¼ $18 1ð Þ ¼ $12 2ð Þ ¼ $18 3ð Þ ¼ 1
$min¼$15 1ð Þ ¼ $15 2ð Þ ¼ $16 2ð Þ ¼ 0
The distinguishing coefficient ζ can be substituted forthe grey relational coefficient in Eq. 5. If all the processparameters have equal weighting, ζ is 0.5. Table 6 lists the
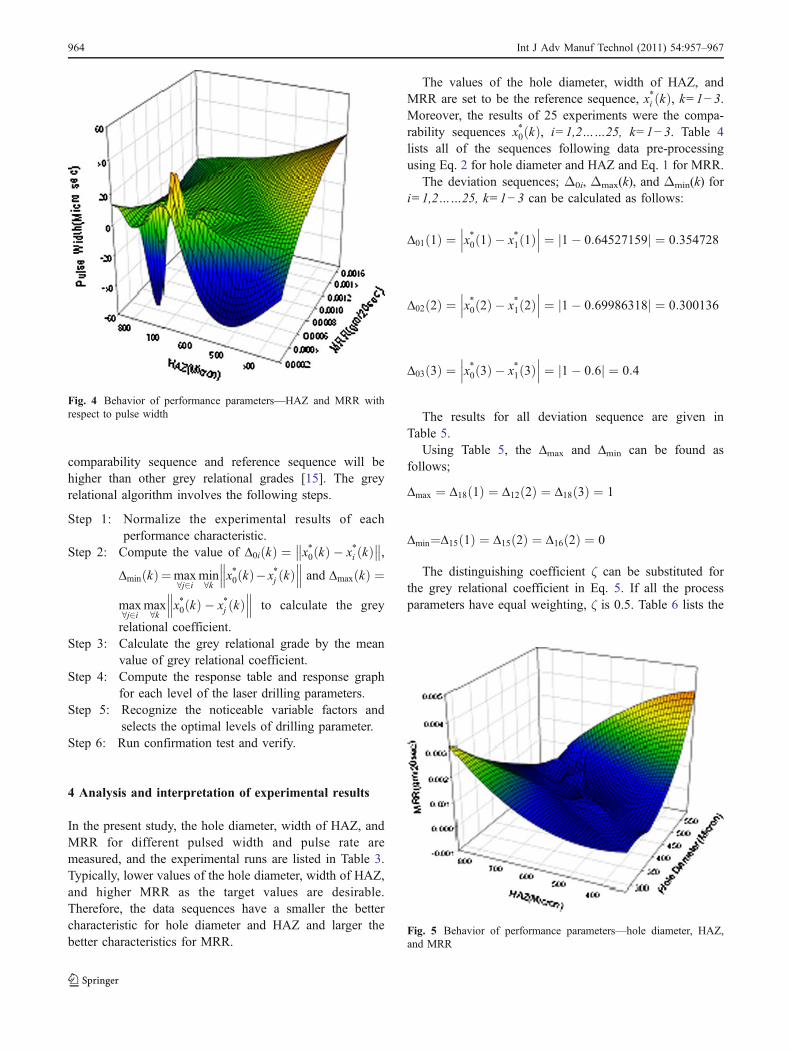
Fig. 5 Behavior of performance parameters—hole diameter, HAZ,and MRR
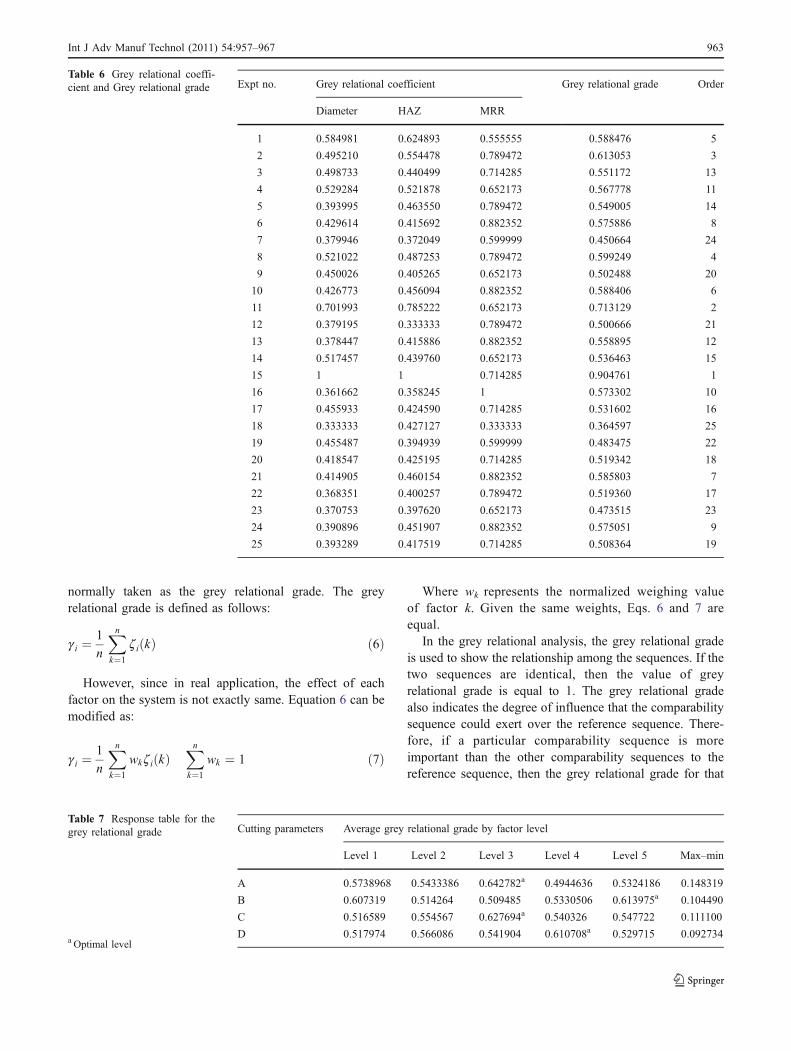
Fig. 4 Behavior of performance parameters—HAZ and MRR withrespect to pulse width
964 Int J Adv Manuf Technol (2011) 54:957–967
grey relational coefficient and grade for each experiment ofthe L25 orthogonal array by applying Eqs. 5 and 6.
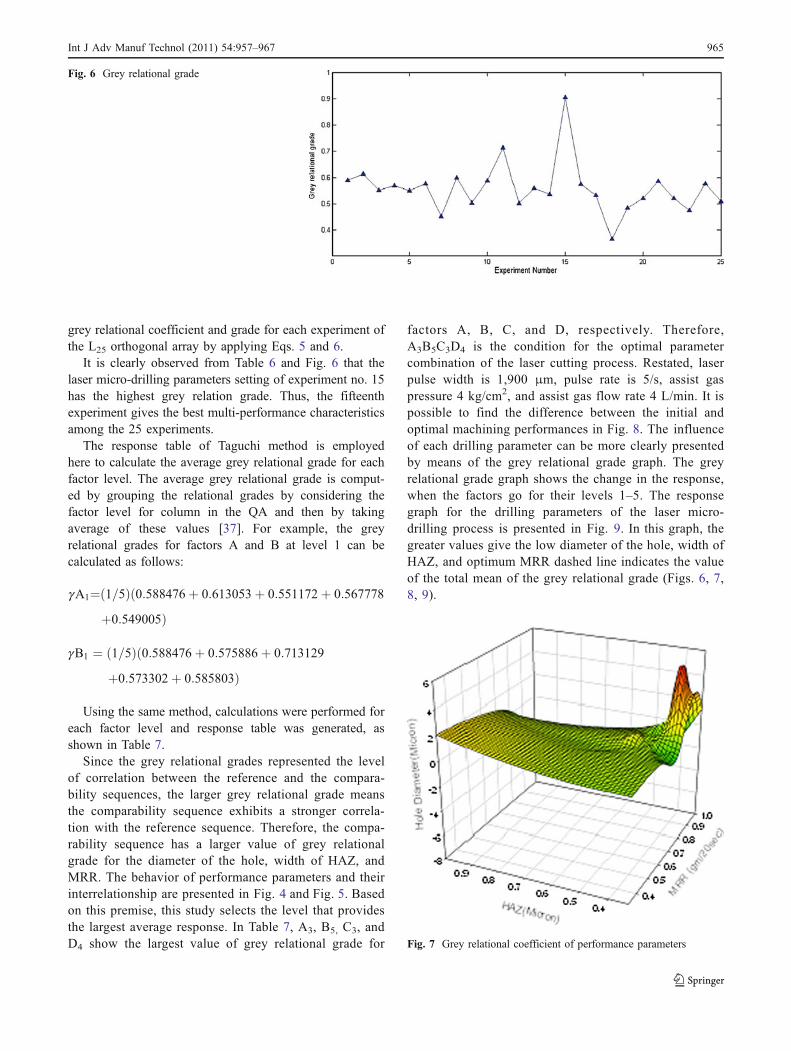
It is clearly observed from Table 6 and Fig. 6 that thelaser micro-drilling parameters setting of experiment no. 15has the highest grey relation grade. Thus, the fifteenthexperiment gives the best multi-performance characteristicsamong the 25 experiments.
The response table of Taguchi method is employedhere to calculate the average grey relational grade for eachfactor level. The average grey relational grade is comput-ed by grouping the relational grades by considering thefactor level for column in the QA and then by takingaverage of these values [37]. For example, the greyrelational grades for factors A and B at level 1 can becalculated as follows:
gA1¼ 1 5=ð Þ 0:588476þ 0:613053þ 0:551172þ 0:567778ðþ0:549005Þ
gB1 ¼ 1 5=ð Þ 0:588476þ 0:575886 þ 0:713129ðþ0:573302þ 0:585803Þ
Using the same method, calculations were performed foreach factor level and response table was generated, asshown in Table 7.
Since the grey relational grades represented the levelof correlation between the reference and the compara-bility sequences, the larger grey relational grade meansthe comparability sequence exhibits a stronger correla-tion with the reference sequence. Therefore, the compa-rability sequence has a larger value of grey relationalgrade for the diameter of the hole, width of HAZ, andMRR. The behavior of performance parameters and theirinterrelationship are presented in Fig. 4 and Fig. 5. Basedon this premise, this study selects the level that providesthe largest average response. In Table 7, A3, B5, C3, andD4 show the largest value of grey relational grade for
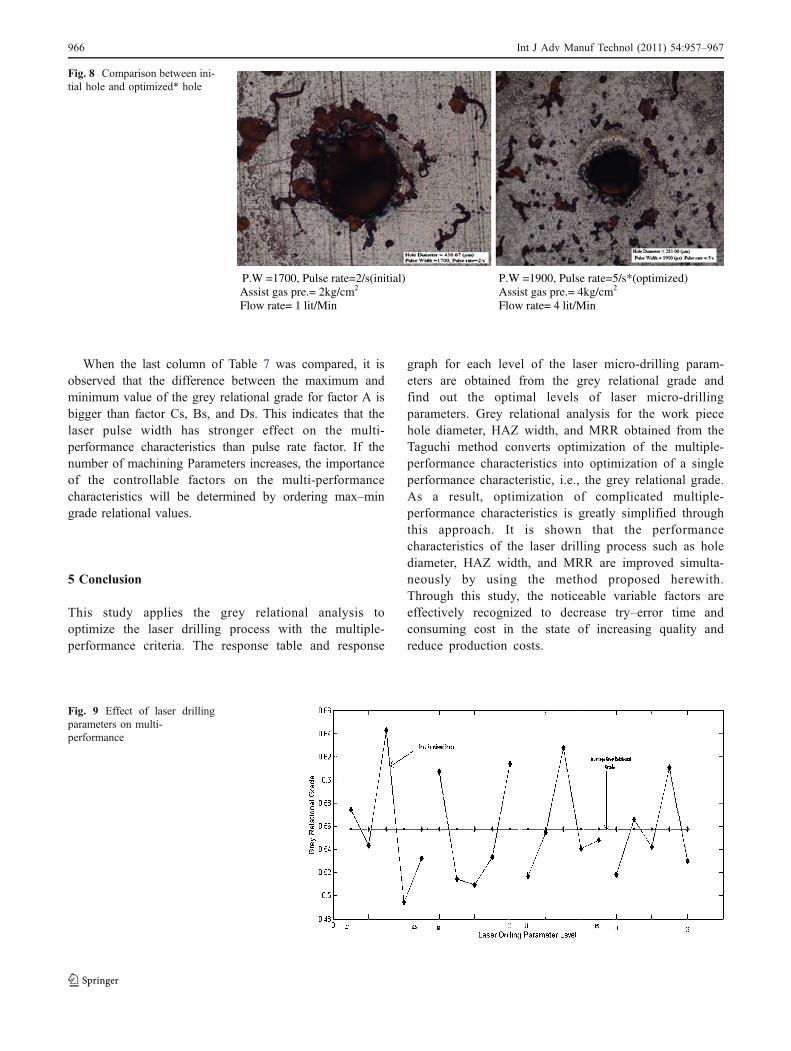
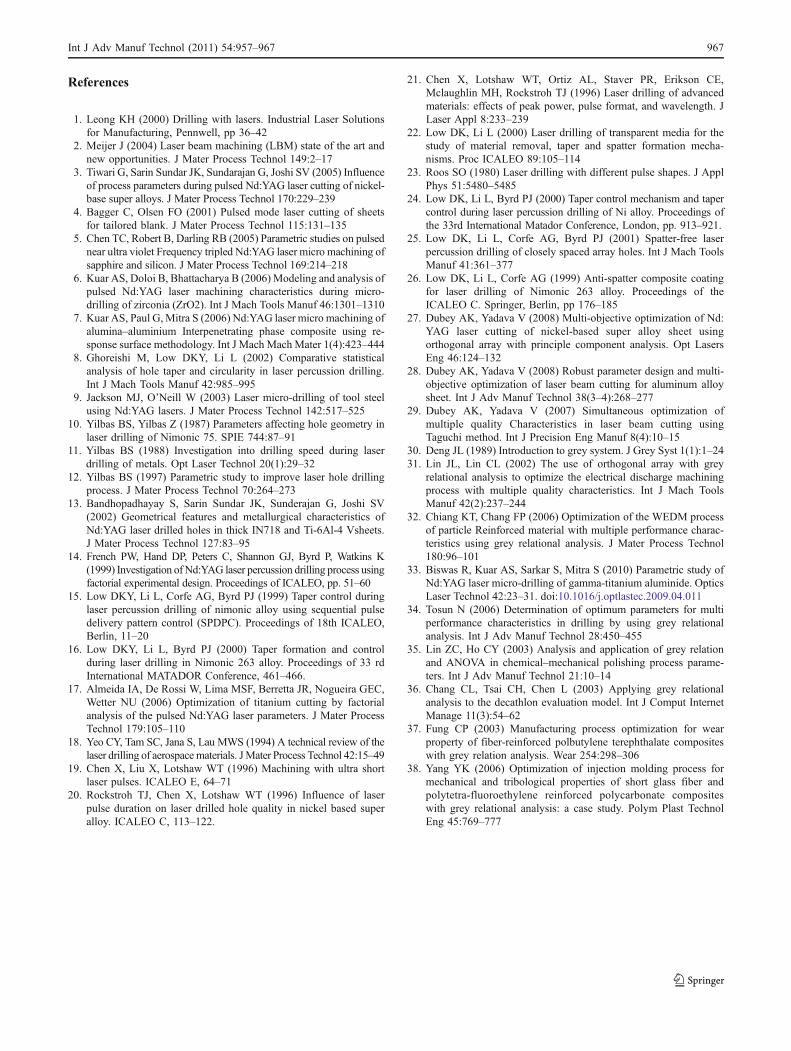
factors A, B, C, and D, respectively. Therefore,A3B5C3D4 is the condition for the optimal parametercombination of the laser cutting process. Restated, laserpulse width is 1,900 μm, pulse rate is 5/s, assist gaspressure 4 kg/cm2, and assist gas flow rate 4 L/min. It ispossible to find the difference between the initial andoptimal machining performances in Fig. 8. The influenceof each drilling parameter can be more clearly presentedby means of the grey relational grade graph. The greyrelational grade graph shows the change in the response,when the factors go for their levels 1–5. The responsegraph for the drilling parameters of the laser micro-drilling process is presented in Fig. 9. In this graph, thegreater values give the low diameter of the hole, width ofHAZ, and optimum MRR dashed line indicates the valueof the total mean of the grey relational grade (Figs. 6, 7,8, 9).
Fig. 7 Grey relational coefficient of performance parameters
Fig. 6 Grey relational grade
Int J Adv Manuf Technol (2011) 54:957–967 965
When the last column of Table 7 was compared, it isobserved that the difference between the maximum andminimum value of the grey relational grade for factor A isbigger than factor Cs, Bs, and Ds. This indicates that thelaser pulse width has stronger effect on the multi-performance characteristics than pulse rate factor. If thenumber of machining Parameters increases, the importanceof the controllable factors on the multi-performancecharacteristics will be determined by ordering max–mingrade relational values.
5 Conclusion
This study applies the grey relational analysis tooptimize the laser drilling process with the multiple-performance criteria. The response table and response
graph for each level of the laser micro-drilling param-eters are obtained from the grey relational grade andfind out the optimal levels of laser micro-drillingparameters. Grey relational analysis for the work piecehole diameter, HAZ width, and MRR obtained from theTaguchi method converts optimization of the multiple-performance characteristics into optimization of a singleperformance characteristic, i.e., the grey relational grade.As a result, optimization of complicated multiple-performance characteristics is greatly simplified throughthis approach. It is shown that the performancecharacteristics of the laser drilling process such as holediameter, HAZ width, and MRR are improved simulta-neously by using the method proposed herewith.Through this study, the noticeable variable factors areeffectively recognized to decrease try–error time andconsuming cost in the state of increasing quality andreduce production costs.
P.W =1700, Pulse rate=2/s(initial) Assist gas pre.= 2kg/cm2 Flow rate= 1 lit/Min
P.W =1900, Pulse rate=5/s*(optimized)Assist gas pre.= 4kg/cm2
Flow rate= 4 lit/Min
Fig. 8 Comparison between ini-tial hole and optimized* hole
Fig. 9 Effect of laser drillingparameters on multi-performance
966 Int J Adv Manuf Technol (2011) 54:957–967
References
1. Leong KH (2000) Drilling with lasers. Industrial Laser Solutionsfor Manufacturing, Pennwell, pp 36–42
2. Meijer J (2004) Laser beam machining (LBM) state of the art andnew opportunities. J Mater Process Technol 149:2–17
3. Tiwari G, Sarin Sundar JK, Sundarajan G, Joshi SV (2005) Influenceof process parameters during pulsed Nd:YAG laser cutting of nickel-base super alloys. J Mater Process Technol 170:229–239
4. Bagger C, Olsen FO (2001) Pulsed mode laser cutting of sheetsfor tailored blank. J Mater Process Technol 115:131–135
5. Chen TC, Robert B, Darling RB (2005) Parametric studies on pulsednear ultra violet Frequency tripled Nd:YAG laser micro machining ofsapphire and silicon. J Mater Process Technol 169:214–218
6. Kuar AS, Doloi B, Bhattacharya B (2006) Modeling and analysis ofpulsed Nd:YAG laser machining characteristics during micro-drilling of zirconia (ZrO2). Int J Mach Tools Manuf 46:1301–1310
7. Kuar AS, Paul G,Mitra S (2006) Nd:YAG laser micro machining ofalumina–aluminium Interpenetrating phase composite using re-sponse surface methodology. Int J Mach Mach Mater 1(4):423–444
8. Ghoreishi M, Low DKY, Li L (2002) Comparative statisticalanalysis of hole taper and circularity in laser percussion drilling.Int J Mach Tools Manuf 42:985–995
9. Jackson MJ, O’Neill W (2003) Laser micro-drilling of tool steelusing Nd:YAG lasers. J Mater Process Technol 142:517–525
10. Yilbas BS, Yilbas Z (1987) Parameters affecting hole geometry inlaser drilling of Nimonic 75. SPIE 744:87–91
11. Yilbas BS (1988) Investigation into drilling speed during laserdrilling of metals. Opt Laser Technol 20(1):29–32
12. Yilbas BS (1997) Parametric study to improve laser hole drillingprocess. J Mater Process Technol 70:264–273
13. Bandhopadhayay S, Sarin Sundar JK, Sunderajan G, Joshi SV(2002) Geometrical features and metallurgical characteristics ofNd:YAG laser drilled holes in thick IN718 and Ti-6Al-4 Vsheets.J Mater Process Technol 127:83–95
14. French PW, Hand DP, Peters C, Shannon GJ, Byrd P, Watkins K(1999) Investigation ofNd:YAG laser percussion drilling process usingfactorial experimental design. Proceedings of ICALEO, pp. 51–60
15. Low DKY, Li L, Corfe AG, Byrd PJ (1999) Taper control duringlaser percussion drilling of nimonic alloy using sequential pulsedelivery pattern control (SPDPC). Proceedings of 18th ICALEO,Berlin, 11–20
16. Low DKY, Li L, Byrd PJ (2000) Taper formation and controlduring laser drilling in Nimonic 263 alloy. Proceedings of 33 rdInternational MATADOR Conference, 461–466.
17. Almeida IA, De Rossi W, Lima MSF, Berretta JR, Nogueira GEC,Wetter NU (2006) Optimization of titanium cutting by factorialanalysis of the pulsed Nd:YAG laser parameters. J Mater ProcessTechnol 179:105–110
18. Yeo CY, Tam SC, Jana S, Lau MWS (1994) A technical review of thelaser drilling of aerospacematerials. JMater Process Technol 42:15–49
19. Chen X, Liu X, Lotshaw WT (1996) Machining with ultra shortlaser pulses. ICALEO E, 64–71
20. Rockstroh TJ, Chen X, Lotshaw WT (1996) Influence of laserpulse duration on laser drilled hole quality in nickel based superalloy. ICALEO C, 113–122.
21. Chen X, Lotshaw WT, Ortiz AL, Staver PR, Erikson CE,Mclaughlin MH, Rockstroh TJ (1996) Laser drilling of advancedmaterials: effects of peak power, pulse format, and wavelength. JLaser Appl 8:233–239
22. Low DK, Li L (2000) Laser drilling of transparent media for thestudy of material removal, taper and spatter formation mecha-nisms. Proc ICALEO 89:105–114
23. Roos SO (1980) Laser drilling with different pulse shapes. J ApplPhys 51:5480–5485
24. Low DK, Li L, Byrd PJ (2000) Taper control mechanism and tapercontrol during laser percussion drilling of Ni alloy. Proceedings ofthe 33rd International Matador Conference, London, pp. 913–921.
25. Low DK, Li L, Corfe AG, Byrd PJ (2001) Spatter-free laserpercussion drilling of closely spaced array holes. Int J Mach ToolsManuf 41:361–377
26. Low DK, Li L, Corfe AG (1999) Anti-spatter composite coatingfor laser drilling of Nimonic 263 alloy. Proceedings of theICALEO C. Springer, Berlin, pp 176–185
27. Dubey AK, Yadava V (2008) Multi-objective optimization of Nd:YAG laser cutting of nickel-based super alloy sheet usingorthogonal array with principle component analysis. Opt LasersEng 46:124–132
28. Dubey AK, Yadava V (2008) Robust parameter design and multi-objective optimization of laser beam cutting for aluminum alloysheet. Int J Adv Manuf Technol 38(3–4):268–277
29. Dubey AK, Yadava V (2007) Simultaneous optimization ofmultiple quality Characteristics in laser beam cutting usingTaguchi method. Int J Precision Eng Manuf 8(4):10–15
30. Deng JL (1989) Introduction to grey system. J Grey Syst 1(1):1–2431. Lin JL, Lin CL (2002) The use of orthogonal array with grey
relational analysis to optimize the electrical discharge machiningprocess with multiple quality characteristics. Int J Mach ToolsManuf 42(2):237–244
32. Chiang KT, Chang FP (2006) Optimization of the WEDM processof particle Reinforced material with multiple performance charac-teristics using grey relational analysis. J Mater Process Technol180:96–101
33. Biswas R, Kuar AS, Sarkar S, Mitra S (2010) Parametric study ofNd:YAG laser micro-drilling of gamma-titanium aluminide. OpticsLaser Technol 42:23–31. doi:10.1016/j.optlastec.2009.04.011
34. Tosun N (2006) Determination of optimum parameters for multiperformance characteristics in drilling by using grey relationalanalysis. Int J Adv Manuf Technol 28:450–455
35. Lin ZC, Ho CY (2003) Analysis and application of grey relationand ANOVA in chemical–mechanical polishing process parame-ters. Int J Adv Manuf Technol 21:10–14
36. Chang CL, Tsai CH, Chen L (2003) Applying grey relationalanalysis to the decathlon evaluation model. Int J Comput InternetManage 11(3):54–62
37. Fung CP (2003) Manufacturing process optimization for wearproperty of fiber-reinforced polbutylene terephthalate compositeswith grey relation analysis. Wear 254:298–306
38. Yang YK (2006) Optimization of injection molding process formechanical and tribological properties of short glass fiber andpolytetra-fluoroethylene reinforced polycarbonate compositeswith grey relational analysis: a case study. Polym Plast TechnolEng 45:769–777
Int J Adv Manuf Technol (2011) 54:957–967 967