Optimum market-positioning models for South African arts ...
433
OPTIMUM MARKET-POSITIONING MODELS FOR SOUTH AFRICAN ARTS FESTIVAL SCENARIOS by CINÁ VAN ZYL submitted in accordance with the requirements for the degree of DOCTOR OF COMMERCII in the subject TOURISM MANAGEMENT at the UNIVERSITY OF SOUTH AFRICA PROMOTER: DR C BOTHA JOINT PROMOTORS: PROF JW STRYDOM PROF A BRITS 30 NOVEMBER 2005
-
Upload
khangminh22 -
Category
Documents
-
view
0 -
download
0
Transcript of Optimum market-positioning models for South African arts ...

OPTIMUM MARKET-POSITIONING MODELS FOR SOUTH AFRICAN ARTS FESTIVAL SCENARIOS
by
CINÁ VAN ZYL
submitted in accordance with the requirements for the degree of
DOCTOR OF COMMERCII
in the subject
TOURISM MANAGEMENT
at the
UNIVERSITY OF SOUTH AFRICA
PROMOTER: DR C BOTHA
JOINT PROMOTORS: PROF JW STRYDOM PROF A BRITS
30 NOVEMBER 2005
ii
ABSTRACT
The purpose of the study was to develop an optimum market-positioning model for
the special interest tourism market to support arts festivals in South Africa (SA).
Three subareas were deemed essential for the model, namely determining which
attributes contribute to the success of three arts festival scenarios, comparing the
different arts festival packages as a tourism attraction and then combining these
subareas to develop a model enabling future researchers and marketers to present a
successful arts festival in South Africa.
The three main arts festivals in South Africa, at Potchefstroom, Grahamstown and
Oudtshoorn, were studied. Screening questions followed by judgmental and quota
sampling were used to select only like-minded respondents from festival attendees
on a scenario basis. In personal interviews the data were collected and then
analysed using conjoint analysis and game theory. Conjoint analysis was used in a
linear regression model with individual ratings for each product. The average of the r-
squares in this study was 0,83, indicating a good fit between data and model
developed. Then these results were used in the game theory, comparing the three
arts festival scenarios to identify the most successful tourism attraction. A different
combination of attributes gave each of the three festival scenarios an optimum
market position in its own niche market.
The study contributes to the existing body of positioning knowledge, specifically in
the festivals and events domain. It also adds value as this model can be applied to
other festivals in South Africa and also to other business sectors.
Key terms: Arts festivals, tourism, special interest tourism, market-positioning model,
conjoint analysis, game theory

iii
ACKNOWLEDGEMENTS
I wish to express my sincere gratitude and appreciation to the following people and
institutions for their contribution to this thesis:
My Creator, for giving me strength and willpower to complete the thesis;
Doctor C. Botha, my promoter, for her assistance, guidance and constant
encouragement throughout the study;
Professors J.W. Strydom and A. Brits, my joint promoters, for their constant
encouragement and intellectual support at critical points during the course of the
study;
The University of South Africa (Department of Transport Economics and Logistics),
for financial assistance;
My husband, Jan and our two children, Isa and Jano, for their continuous support
and encouragement. Without their patience and understanding the venture could
never have started and would never have been completed;
My family, for their trust and moral support during my studies;
Consulta Research Company and Prof A.N. Schreuder, for the analysis of the data;
The Buro of Market Research at Unisa and Prof C.J. van Aardt and Dr D.H. Tustin,
for the advice and input on the methodology of the study;
Ms Jackie Viljoen and Ms Gillian de Jager for editing the text.
iv
FINANCIAL ASSISTANCE
The financial assistance provided by the University of South Africa Domestic
Research Fund in respect of the costs of this research is gratefully acknowledged.
The opinions or conclusions expressed in the study are those of the writer and
should not be seen as representing the views, opinions or conclusions of the
Domestic Research Fund at the University of South Africa.

v
DECLARATION
I declare that this Doctor’s thesis, which I hereby submit for the degree D. Com.
Tourism Management at the University of South Africa, is my own work and has not
previously been submitted by me for a degree at another university.
vi
ABBREVIATIONS
ABSA Amalgamated Bank of South Africa
CA Conjoint analysis
CVA V2 Conjoint value analysis version two
CHE Christian higher education
GDP Gross domestic product
IFEA International Festival and Event Association
KKNK Klein Karoo National Arts Festival
LSM Living standards measure index
MDS Multi dimensional scaling
MICE Meetings, incentives, conventions and exhibitions
NASPERS National South African Press
NEA National endowment for arts
OLS Ordinary least squares
PC Personal computer
SA South Africa
SABC South African Broadcasting Corporation
SIT Special interest tourism
St Standard
SSPS Statistical Software package for the social sciences
T&T Travel and tourism industry or economy
UK United Kingdom
USA United States of America
USP Unique selling proposition
WTO World Tourism Organisation
WTTC World Travel and Tourism Council
4Ps Four marketing mix instruments, namely product, place, price,
promotion

vii
TABLE OF CONTENTS
ABSTRACT.......................................................................................................................................... II
ACKNOWLEDGEMENTS ................................................................................................................... III
FINANCIAL ASSISTANCE ................................................................................................................. IV
DECLARATION....................................................................................................................................V
ABBREVIATIONS...............................................................................................................................VI
LIST OF FIGURES ..............................................................................................................................XI
LIST OF TABLES..............................................................................................................................XIII
LIST OF APPENDICES......................................................................................................................XV
CHAPTER 1 ......................................................................................................................................... 1
1 BACKGROUND TO THE STUDY................................................................................................ 1
1.1 INTRODUCTION ...................................................................................................................... 1 1.2 PROBLEM STATEMENT ............................................................................................................ 3 1.3 RESEARCH OBJECTIVES........................................................................................................ 18
1.3.1 Primary objective........................................................................................................... 18 1.3.2 Secondary objectives .................................................................................................... 18
1.4 RESEARCH METHODOLOGY OF THESIS ................................................................................... 19 1.4.1 General ......................................................................................................................... 19 1.4.2 Secondary research ...................................................................................................... 19 1.4.3 Primary research ........................................................................................................... 20
1.5 DEFINITIONS OF TERMS ........................................................................................................ 27 1.5.1 Tourism and Special Interest Tourism ........................................................................... 27 1.5.2 Special events and festivals .......................................................................................... 29 1.5.3 Market positioning ......................................................................................................... 31
1.6 ORGANISATION OF THESIS .................................................................................................... 34
CHAPTER 2 ....................................................................................................................................... 36
2 TAXONOMY OF TOURISM, SPECIAL INTEREST TOURISM: ARTS FESTIVALS AND EVENTS ............................................................................................................................................. 36
2.1 INTRODUCTION .................................................................................................................... 36

viii
2.2 FLOW PROCESS OF THE TOURISM PHENOMENON..................................................................... 37 2.3 THE TOURISM PHENOMENON ................................................................................................. 40
2.3.1 Defining tourism ............................................................................................................ 40 2.4 SPECIAL INTEREST TOURISM (SIT).......................................................................................... 46 2.5 FESTIVALS AND EVENTS........................................................................................................ 51
2.5.1 Introduction.................................................................................................................... 51 2.5.2 History of festivals and events ....................................................................................... 53 2.5.3 Definition of festivals and events ................................................................................... 54 2.5.4 Classification of festivals and events ............................................................................. 55 2.5.5 Arts festivals .................................................................................................................. 60 2.5.6 South African arts festivals ............................................................................................ 73 2.5.7 Trends in and impacts on the festivals and events sector.............................................. 74
2.6 CONCLUSION ....................................................................................................................... 76
CHAPTER 3 ....................................................................................................................................... 79
3 MARKETING AND MARKET POSITIONING IN THE ARTS FESTIVAL CONTEXT ................. 79
3.1 INTRODUCTION .................................................................................................................... 79 3.2 DEFINING MARKETING........................................................................................................... 81 3.3 MARKETING MIX ................................................................................................................... 86 3.4 SEGMENTING FESTIVAL AND EVENT CUSTOMERS..................................................................... 90
3.4.1 Demographic segmentation........................................................................................... 95 3.4.2 Socio-economic segmentation....................................................................................... 95 3.4.3 Geographic segmentation ............................................................................................. 96 3.4.4 Psychographic segmentation......................................................................................... 96
3.5 MARKET POSITIONING......................................................................................................... 101 3.5.1 Introduction.................................................................................................................. 101 3.5.2 Defining positioning in various contexts....................................................................... 102 3.5.3 Marketing..................................................................................................................... 102 3.5.4 Positioning in the tourism context ................................................................................ 105 3.5.5 Positioning in festivals and events............................................................................... 109
3.6 RESEARCH ON POSITIONING (MODELS OF POSITIONING) ........................................................ 121 3.6.1 Pioneering model by Ries and Trout (2001, 1982, 1981)............................................. 122 3.6.2 Market targeting and positioning decisions model by Boyd and Walker (1990:315-344)
124 3.6.3 Kotler’s (2003, 2000, 1991) differentiation and positioning model................................ 134 3.6.4 Lovelock and Wirtz’s (2004) and Lovelock’s (2003, 1991, 1984) model for positioning a
service in the market ................................................................................................................ 139 3.6.5 Positioning strategy model by Aaker and Shansby (1982)........................................... 142

ix
3.6.6 Reich’s (1999, 1997) model for positioning tourism destinations ................................. 146 3.7 FESTIVAL BRANDING........................................................................................................... 154 3.8 CONCLUSION ..................................................................................................................... 157
CHAPTER 4 ..................................................................................................................................... 159
4 RESEARCH METHODOLOGY................................................................................................ 159
4.1 INTRODUCTION .................................................................................................................. 159 4.2 ARTS FESTIVAL SCENARIOS................................................................................................. 161
4.2.1 Scenario A................................................................................................................... 162 4.2.2 Scenario B................................................................................................................... 163 4.2.3 Scenario C................................................................................................................... 164
4.3 DEVELOPING THE SAMPLE PLAN .......................................................................................... 165 4.3.1 Step 1: Define the population of interest...................................................................... 166 4.3.2 Step 2: Choose a data collection method .................................................................... 167 4.3.3 Step 3: Identify a sampling frame ................................................................................ 168 4.3.4 Step 4: Select a sampling method ............................................................................... 168 4.3.5 Step 5: Determine the sample size.............................................................................. 172 4.3.6 Step 6: Develop operational procedures for selecting a sampling plan........................ 173 4.3.7 Step 7: Execute the operational sampling plan............................................................ 174
4.4 DESIGN THE RESEARCH INSTRUMENT................................................................................... 174 4.5 FIELDWORK: DATA COLLECTION AND EDITING........................................................................ 178 4.6 DATA CODING .................................................................................................................... 183 4.7 DATA CAPTURING AND CLEANING......................................................................................... 183 4.8 DATA ANALYSIS.................................................................................................................. 185
4.8.1 Cluster analysis ........................................................................................................... 186 4.8.2 Correspondence analysis ............................................................................................ 187 4.8.3 Conjoint analysis ......................................................................................................... 190 4.8.4 Types of conjoint analyses .......................................................................................... 191 4.8.5 Basic steps in a conjoint analysis experiment.............................................................. 192
4.9 GAME THEORY................................................................................................................... 204 4.10 METHODOLOGICAL LIMITATIONS .......................................................................................... 207 4.11 CONCLUSION ..................................................................................................................... 208
CHAPTER 5 ..................................................................................................................................... 209
5 ANALYSIS OF ARTS FESTIVAL DATA AND DISCUSSION OF RESULTS .......................... 209
5.1 INTRODUCTION .................................................................................................................. 209 5.2 DEMOGRAPHIC, GEOGRAPHIC AND BEHAVIOURAL CRITERIA OF RESPONDENTS AT THE THREE ARTS
FESTIVAL SCENARIOS ...................................................................................................................... 211
x
5.2.1 Situational inhibitors of respondents at each of the three arts festival scenarios ......... 215 5.3 CONJOINT ANALYSIS........................................................................................................... 219
5.3.1 Relative attribute importance and individual attribute importance for the three arts
festivals scenarios.................................................................................................................... 220 5.3.2 Relative attributes' level of importance for the three arts festival scenarios ................. 222 5.3.3 Cluster analysis for arts festival scenarios................................................................... 231 5.3.4 Correspondence analysis of arts festival scenarios ..................................................... 235 5.3.5 Conjoint simulation analyses for arts festival scenarios ............................................... 243
5.4 GAME THEORY................................................................................................................... 251 5.5 CONCLUSION ..................................................................................................................... 271
CHAPTER 6 ..................................................................................................................................... 276
6 CONCLUSIONS AND RECOMMENDATIONS........................................................................ 276
6.1 INTRODUCTION .................................................................................................................. 276 6.2 CONCLUSIONS AND RECOMMENDATIONS OF DATA ANALYSIS .................................................. 279
6.2.1 General information ..................................................................................................... 279 6.2.2 Motivating factors at arts festival scenarios ................................................................. 280 6.2.3 Situational inhibitors at arts festival scenarios ............................................................. 281 6.2.4 Attributes and attribute composition of arts festival scenarios ..................................... 282 6.2.5 Comparison of the three arts festival scenarios ........................................................... 287
6.3 PROPOSED MARKET-POSITIONING MODEL FOR ARTS FESTIVALS ............................................. 290 6.3.1 Flow of the model ........................................................................................................ 292
6.4 CONTRIBUTIONS, CONFIRMATIONS, LIMITATIONS OF THE STUDY.............................................. 307 6.5 RECOMMENDATIONS FOR FUTURE RESEARCH....................................................................... 309 6.6 CONCLUSION ..................................................................................................................... 311
LIST OF REFERENCES................................................................................................................... 314
APPENDICES .................................................................................................................................. 348

xi
LIST OF FIGURES
Figure 1.1: The different types of SIT opportunities ........................................................................ 5 Figure 1.2: Chapter outline of the thesis......................................................................................... 35 Figure 2.1: Flow process of the tourism phenomenon.................................................................. 37 Figure 2.2 A categorisation of the two terms, festivals and events............................................. 52 Figure 2.3: Arts festivals: features that attract tourists (adapted from Hughes, 2000:90). ......... 65 Figure 2.4: The composition of the arts festival audience ............................................................ 67 Figure 3.1: Different strategies for target marketing (Armstrong & Kotler, 2005:200) ................ 91 Figure 3.2: Basic elements of segmentation (Dibb, et al., 2001:209). ......................................... 104 Figure 3.3: Steps in the positioning process (adapted from Boyd & Walker, 1990:329) ........... 126 Figure 3.4: The three-step approach to positioning (Kotler, Bowen & Makens, 2003:264) ....... 138 Figure 3.5: Developing a market positioning strategy (Lovelock & Wirtz, 2004:67) .................. 140 Figure 3.6: The process of marketing research needed for positioning (adapted from Aaker &
Shansby, 1982:59) .................................................................................................................. 144 Figure 3.7: The positioning process for tourism destinations/festivals (adapted from Reich,
1999:78)................................................................................................................................... 147 Figure 3.8: An illustration of an arts festival’s brand mark ......................................................... 154 Figure 3.9: The four major elements of brand equity (Aaker, adapted in Pride & Ferrell,
2003:300)................................................................................................................................. 156 Figure 4.1: Primary research in the research process (adapted from Tustin, Ligthelm, Martins &
Van Wyk, 2005) ....................................................................................................................... 160 Figure 4.2: Design of plan for drawing the sample (adapted from McDaniel & Gates, 2004:272)
................................................................................................................................................. 166 Figure 4.3: An example of a profile question................................................................................ 177 Figure 4.4: Basic steps when conducting a conjoint design (adapted from Churchill &
Iacobucci, 2002:753) .............................................................................................................. 193 Figure 4.5: The relationship between profiles, attributes and levels (Sambidi, 2003)............... 199 Figure 5.1: Relative importance of attributes at each of the three festival scenarios ............... 221 Figure 5.2: Attribute importance per individual respondent across the three festival scenarios
................................................................................................................................................. 222 Figure 5.3: The three arts festival scenarios and the four clusters ............................................ 235 Figure 5.4: Correspondence between arts festival scenarios and attribute importance – inertia
of 97,6% .................................................................................................................................. 236 Figure 5.5: Correspondence between age and festival attributes – inertia of 80,7% ................ 239 Figure 5.6: Correspondence between arts festival scenario and home language – inertia of
99,8%....................................................................................................................................... 241 Figure 5.7: Correspondence between arts festival scenarios and clusters – inertia of 96,12%242
xii
Figure 6.1: The most prominent differences and similarities between the three arts festival scenarios ................................................................................................................................ 289
Figure 6.2: An optimum market-positioning model for arts festivals ......................................... 291 Figure 6.3: Positioning maps of the three arts festival scenarios .............................................. 296 Figure 6.4: Steps in the market-positioning model ...................................................................... 297 Figure 6.5: The four clusters of the groups of respondents at the arts festival scenarios....... 299 Figure 6.6: The optimum combination of the attribute marketing package per festival scenario
................................................................................................................................................. 301 Figure 6.7: An optimum market position for Festival A............................................................... 303 Figure 6.8: An optimum market position for Festival B............................................................... 304 Figure 6.9: An optimum market position for Festival C............................................................... 305
xiii
LIST OF TABLES
Table 1.1: WTTC estimates and forecasts – travel and tourism’s contribution to South Africa’s economy and jobs...................................................................................................................... 2
Table 1.2: A detailed list of festivals and events in South Africa as at January 2005 ................... 7 Table 1.3: Population and sample size of the three selected arts festival scenarios in South
Africa......................................................................................................................................... 23 Table 2.1: Analysis of the different types of SIT opportunities ..................................................... 47 Table 2.2: Definitions of festivals, events and special events ...................................................... 54 Table 2.3: Classification into three broad categories of festivals and events ............................. 56 Table 2.4: Festival categories, definition and themes of the South Africa festival and events
calendar .................................................................................................................................... 59 Table 2.5: Reasons or aims for holding arts festivals ................................................................... 63 Table 2.6: Reasons for participation or non-participation in arts festivals .................................. 68 Table 2.7: The advantages and disadvantages of arts festival tourism ....................................... 71 Table 3.1: The marketing mix and its elements for South African festivals and events ............. 88 Table 3.2: Major segmentation variables for festival and event markets ..................................... 94 Table 3.3: Development of positioning research in tourism ....................................................... 106 Table 3.4: A summary of positioning research articles reviewed and research techniques used
in marketing and tourism literature ...................................................................................... 113 Table 3.5: Alternative techniques used for analysing customers' perceptions of the semi-
competitive positions of different festival products or brands .......................................... 129 Table 3.6: Four major positioning errors as documented by Kotler........................................... 136 Table 3.7: Characteristics of a good brand name ........................................................................ 155 Table 4.1: Types of probability and non-probability sampling methods.................................... 169 Table 4.2: Interlocking quota sample for the three arts festival scenarios ................................ 171 Table 4.3: Population and sample size of the three selected arts festival scenarios in South
Africa....................................................................................................................................... 173 Table 4.4: Types of questions used .............................................................................................. 175 Table 4.5: Attributes and attribute levels ...................................................................................... 198 Table 5.1: General information about respondents across the three arts festival scenarios... 211 Table 5.2: Situational inhibitors across the three arts festival scenarios .................................. 217 Table 5.3: Attributes' level of importance for all three festival scenarios “globally” ................ 224 Table 5.4: Attributes' level of importance for Festival A.............................................................. 226 Table 5.5: Attributes' level of importance for Festival B.............................................................. 228 Table 5.6: Attributes' level of importance for Festival C.............................................................. 230 Table 5.7: Differences in the relative importance of attributes at arts festival scenarios (cluster
analysis process; 4-factor solution) ..................................................................................... 233

xiv
Table 5.8: Attribute simulation tool for Festival A – example one .............................................. 244 Table 5.9: Attribute simulation tool for Festival A – example two .............................................. 244 Table 5.10: Attribute simulation tool for Festival A – example three.......................................... 245 Table 5.11: Attribute simulation tool for Festival A...................................................................... 246 Table 5.12: Attribute simulation tool for Festival B...................................................................... 248 Table 5.13: Attribute simulation tool for Festival C...................................................................... 249 Table 5.14: A matrix with the ranges and attribute levels at arts festivals................................. 253 Table 5.15: The game theory as set up for Festivals A, B and C................................................. 254 Table 5.16: Weight and percentage awarded to each attribute level in the game and the
outcome of the game for each festival scenario.................................................................. 255 Table 5.17: Weight and percentage awarded to each attribute level in the game and the
outcome of the game if Festival C’s score for Quality music is improved ........................ 257 Table 5.18: Weight and percentage awarded to each attribute level in the game and the
outcome of the game if Festival A’s score for Festival brands is weakened .................... 259 Table 5.19: Weight and percentage awarded to each attribute level in the game and the
outcome of the game if Festival A’s score for Quality arts is improved............................ 260 Table 5.20: Weight and percentage awarded to each attribute level in the game and the
outcome of the game if Festival A’s score for Quality performances is weakened.......... 262 Table 5.21: Weight and percentage awarded to each attribute level in the game and the
outcome of the game if Festival C’s score for Quality refreshments is improved............ 263 Table 5.22: Weight and percentage awarded to each attribute level in the game and the
outcome of the game if Festival B’s score for Friendly service is improved .................... 265 Table 5.23: Weight and percentage awarded to each attribute level in the game and the
outcome of the game if Festival A’s score for Good transport is improved...................... 267 Table 5.24: Weight and percentage awarded to each attribute level in the game and the
outcome of the game if Festival A’s score for Sufficient parking is improved ................. 268 Table 5.25: Weight and percentage awarded to each attribute level in the game and the
outcome of the game if Festival A’s score on Ticket prices is changed to the same price................................................................................................................................................. 269
Table 5.26: A summary of three arts festival scenarios and optimum attribute levels ............. 272 Table 6.1: The three arts festival scenarios summarised ............................................................ 286
xv
LIST OF APPENDICES
APPENDIX A: The data collection instrument .............................................................................. 348 A1: A map of South Africa and the three provinces of the arts festival scenarios.................... 349 A2: Quota control sheets for the various festivals ...................................................................... 351 A3: Arts festival questionnaire (Eng. & Afr.) ................................................................................ 354 A4: Arts festival scenario conjoint show-cards, instructions and profiles in Eng. & Afr.......... 364 Arts festival scenario conjoint analysis........................................................................................ 370 Aanwysings en profiele in Afrikaans ............................................................................................ 389 APPENDIX B: Conjoint analysis raw data..................................................................................... 408 B1: Example of conjoint analysis raw data for 10 respondents.................................................. 409 B2: R-squares of conjoint data ...................................................................................................... 416

1
CHAPTER 1
1 BACKGROUND TO THE STUDY
1.1 INTRODUCTION
In a world of change, one constant has been the continued growth of tourism. In a
global context, tourism has been remarkable in its resistance to adverse economic
and political conditions (Cooper, Fletcher, Gilbert & Wanhill, 1998:1). By the mid-
1990s, the World Travel and Tourism Council (WTTC) estimated that tourism was the
world’s largest industry (WTTC, 1996:1). According to Grant Thornton Kessel
Feinstein (2002:45), travel and tourism in South Africa in 2002 amounted to a R108,5
billion industry in terms of total demand, and this figure is expected to grow by 4,8%
per annum between 2002 and 2012. The travel and tourism industry (T&T) currently
contributes 3% to South Africa’s Gross Domestic Product (GDP), and measured in its
broadest form, the travel and tourism economy contributes 7,1% of South Africa’s
GDP. The WTTC expects this figure to increase to 8,1% by 2012.1
The WTTC is the business leaders’ forum for Travel and Tourism and its forecast for
South Africa is shown in Table 1.1.
1 The WTTC calculates the economic impact and job creation potential of tourism on the basis of two
definitions: that of the Travel and Tourism Economy and the Travel and Tourism Industry. The Travel
and Tourism Economy includes the Travel and Tourism Industry and capital expenditure on tourism,
for example investment in hotel buildings, transport vehicles and craft, furniture and equipment, as
well as personal capital expenditure. In contrast, the Travel and Tourism Industry only includes direct
spending by tourists and not capital expenditure, making theirs a narrower definition.

2
Table 1.1: WTTC estimates and forecasts – travel and tourism’s contribution to South Africa’s economy and jobs
2002 2012
Rands
Bn
% of total GDP
Growth %
Rands Bn
% of total GDP
Growth %
T&T industry 31,1 3,0 2,2 84,8 3,5 5,1
GD
P
T&T economy 72,5 7,1 3,2 194,3 8,1 4,9
2002 2012
000’s
% of total
employ- ment
Growth %
000’s % of total
employment Growth
%
T&T industry 492,7 3,0 1,8 679,2 3,4 3,3
Empl
oy-
men
t
T&T economy 1 148,0 6,9 2,7 1 555,3 7,9 3,1
Source: WTTC, 2003:1.
Although the WTTC forecast emphasises the growth and prosperity of this industry,
the threat of maturity and levelling off which often follows steep growth should be
recognised. Based on the Annual Tourism Report (South African Tourism, 2005:11)
the South African tourism industry will eventually also level off and reach the maturity
phase of the product life cycle. This natural process of the tourism product life cycle
should be monitored in the leisure and the business travel markets (WTO,
1999a:117).
The continued growth and expansion of the tourism industry has resulted in more
opportunities in this sector than in many others, i.e. there is a wider selection of
products and services to choose from (Poon, 2003:133).
3
However, Derrett (2001:7) and the World Tourism Organization (1999:118) state that
tourists have become more knowledgeable and sophisticated, as they are more
mobile, have more money, can choose from a wider selection of tourism activities
and have extensive knowledge due to the new information technology available
worldwide.
In other words, tourists have become more “streetwise” and approach tourism with
different expectations. This is why tourism stakeholders should take note of the
changing needs or requirements of tourists and develop suitable products in both the
leisure and business travel markets.
1.2 PROBLEM STATEMENT
Continuous innovation is required to survive in today's rapidly changing tourism
market (Poon, 2003:139). Innovation in this instance refers to being creative and
bringing new ideas and tourism services to the market place (Poon, 2003:139).
Traditional tourism products like sunbathing and sightseeing will no longer be
adequate for the emerging new generation of tourists (Buhalis cited in Wahab &
Cooper, 2001:80). Instead, Buhalis notes that a more individualised tourism product
is needed which should be sophisticated enough to attract the new, streetwise
customer. Moreover, a degree of specialisation is required to cater for individual
needs and wants. This sophistication and specialisation can only be achieved by
detailed market segmentation and tailor-made product offerings that strive for total
customer satisfaction with the tourism product and thus manage to “seduce” the
tourism clientele (Buhalis cited in Wahab & Cooper, 2001:92).
All tourism stakeholders will have to gain a thorough understanding of the changing
trends in demand and of the use of modern marketing and information technology
tools. In essence, the producer has to get closer to the customers, the new
“streetwise” tourists, to know their needs and wants (Poon, 2003:139). Only by
understanding the tourism market can a producer satisfy the market.
4
Tourism organisations that do not understand this, and destinations which do not
achieve this, will probably lose their sustainable competitive advantages in the
market place.
This realisation creates new segments in the tourism domain, and one of these
segments; namely, special interest tourism (SIT), in the leisure travel market is the
most comprehensive (WTO, 1999a:118).
Special interest tourism is defined as the provision of customised leisure and
recreational experiences driven by the specific expressed interests of individuals and
groups (Derrett cited in Douglas, Douglas & Derrett, 2001:3). The other segment in
the business travel market is often referred to as the meetings, incentives,
conventions and exhibitions (MICE) market (WTO, 1999a:125).2 Figure 1.1 indicates
the different types of SIT, which may include eco-tourism as well as tourism for
adventure, cultural events, education, festivals and events, health, heritage, regional,
rural, wine and food, sex and sports.
2 The terms special events, events and festivals (including arts festivals) are classified under the
collective noun: events, as recommended by Dimmock and Tiyce (cited in Douglas et al., 2001:356-
357; Getz, 1997:1).

5
Figure 1.1: The different types of SIT opportunities
The different types of SIT opportunities in the market place are analysed further in
Chapter 2. This growth trend in special interest tourism was reported as long ago as
the 1990s and is increasingly being reported in the new millennium (Derret, 2001:21;
Weiler & Hall, 1992:1). One type of SIT firmly established in the market place is event
tourism (Tassiopoulos, 2005:25).
Event tourism (a subcategory of SIT) has shown a stronger growth curve than overall
leisure demands (Kim, Uysal & Chen, 2002:127; Shifflet & Bhata, 1999:26). It refers
to leisure-oriented special events, fairs, festivals, arts festivals, shows and
exhibitions. The performing arts and other festivals (central to the concept of events)
have now become a worldwide tourism phenomenon (Prentice & Andersen, 2003:8;
Grant & Paliwoda, 1998:217). In the South African arena, attendees have a choice of
more than 85 festivals throughout the country (Witepski, 2002:52). Ironically,
however, the popularity and growth of the festival industry in South Africa might
threaten its survival as prospective attendees have on average a choice of four

6
festivals per month or one festival per week. This overabundance of festivals has a
direct impact on the sustainability of the individual festivals as it ultimately leads to a
situation of “festival fatigue” where it becomes financially impossible for a festival
attendee to choose among the profusion of festivals. While people in South Africa
might find that attending festivals is gradually losing its novelty, research into what
makes a festival a tourism attraction is becoming of paramount importance.
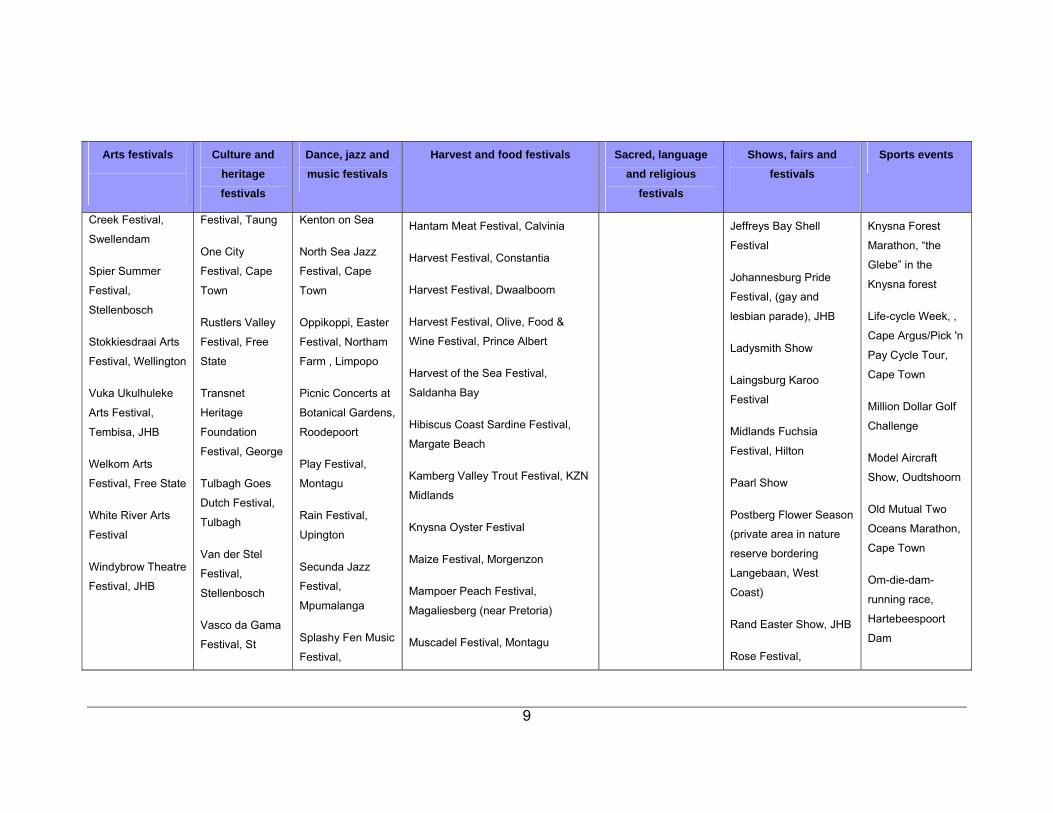
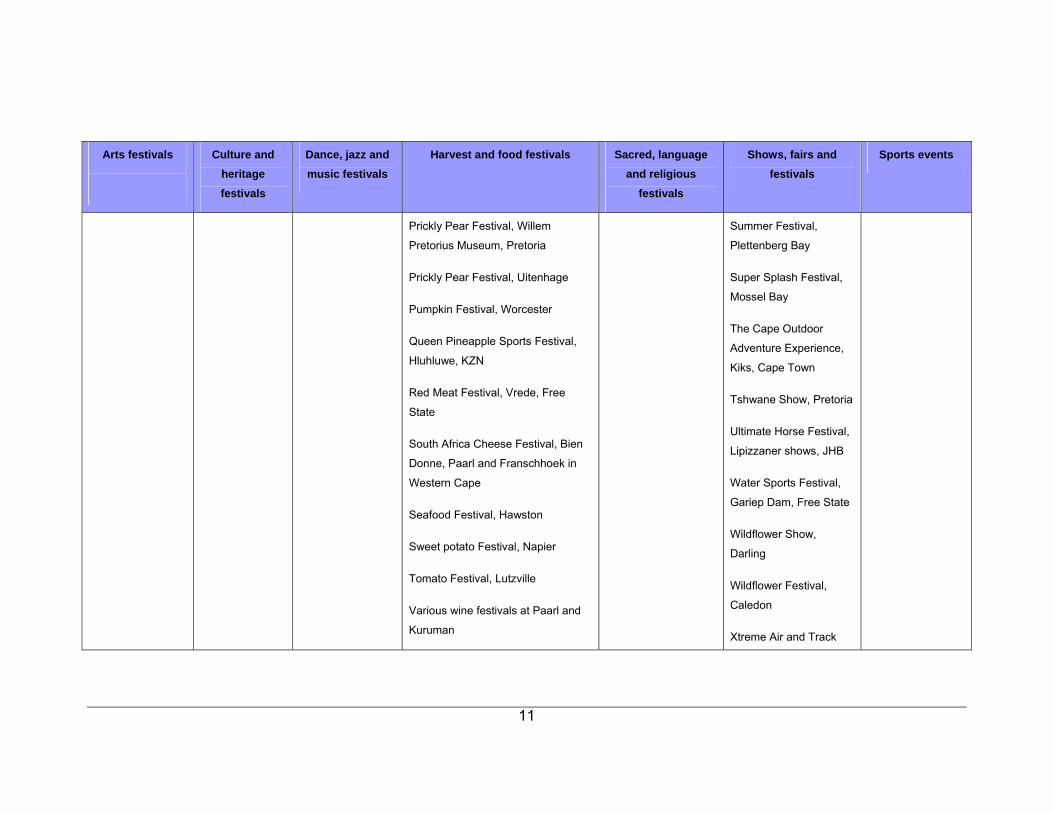
Table 1.2 contains a list of the calendar of festivals and events in South Africa (SA).
The list is based on exploratory research and various resources is consulted and
used in the process. It should be noted that the exploratory nature of the list of South
Africa festivals and events as well as the continuous entry of new events, caused that
some festivals and events might have been overlooked and not included in the list
that has been updated up to January 2005. On the basis of research by Wilson and
Udall (1982:3), the types of festivals have been divided into seven broad categories:
arts festivals; dance, jazz and music festivals; sacred, language and religious
festivals; heritage and culture festivals; harvest and food festivals; shows, fairs and
festivals; and sports events.

7
Table 1.2: A detailed list of festivals and events in South Africa as at January 2005
Arts festivals
Culture and heritage
festivals
Dance, jazz and music festivals
Harvest and food festivals Sacred, language and religious
festivals
Shows, fairs and festivals
Sports events
Aardklop National
Arts Festival,
Potchefstroom
Bloemfontein
National Arts
Festival, Free State
Cape Town
Festival (arts &
culture festival)
Cederberg
Voorbrand Festival,
Clanwilliam
Cullinan Arts
Festival
InniBos-Lowveld
National Arts
Festival, Nelspruit
150-year
Commemoration
Festival,
Middelburg,
Eastern Cape
Africana Arts
and Water
Festival,
Deneysville
Apollo Festival
of South African
films, Victoria
West
Bastille Festival,
Franschoek
Dias Festival,
Mossel Bay
Durban
Afrikaans Music
Festival, Margate
Beach, KZN
Afrikaans Rock
Festival,
Roodepoort
Arts Alive, JHB
Awesome Africa
Music Festival
FNB Dance
Umbrella, Wits
Theatre, JHB
Giant Steps
African Music
Festival, Spier,
Stellenbosch
Guinness Jazz
Algoa Bay Chilli Festival, Port
Elizabeth
Aloe Festival, Albertinia
Amajuba Winter Festival, Newcastle
Apple Festival, Uniondale
Asparagus Festival, Fouriesburg
Banana Festival, Port Edward
Beer and Bread Festival, Caledon
Bieliemealie Festival, Reitz
Biltong Festival, Mokopane
Calamari Festival, Plettenberg Bay
Cattle Festival, Stella
Cherry Festival, Ficksburg
9th Poetry Africa
Festival, Durban
Afrikaans
Word/Language
Festival, Stellenbosch
Barney Simon Young
Writers Festival, JHB
Carols by Candlelight
Festival of Lights,
Pietermaritzburg
Fire-walking, Durban
Fireworks Festival,
Saldanha
FNB Diwali Festival of
Light, Durban
Helderberg Festival of
Addo Rose Festival
Agricultural and
Wildflower Show,
Piketberg
Bien Donne Expo, Paarl
Bloemfontein Rose
Festival
Cape Gourmet Festival,
Good Hope Centre,
Cape Town
Cape Town International
Flower Show
Cape Town International
Kite Festival,
Muizenberg
Decorex, Midrand,
Burger-Sanlam
cycle race, Bellville
Caltex-Voet van
Afrika Marathon,
Bredasdorp
Cape Epic-
mountain bike race
Cars in the Park,
Pretoria
Comrades
Marathon, Durban
Currie cup finals
Dusi Canoe
Marathon,
Pietermaritzburg
Easter Schools

8
Arts festivals
Culture and heritage festivals
Dance, jazz and music festivals
Harvest and food festivals Sacred, language and religious
festivals
Shows, fairs and festivals
Sports events
KKNK, Oudtshoorn
Magoebaskloof
Spring Festival
Natal Witness
Hilton Arts Festival,
KwaZulu-Natal
National Festival of
the Arts, Grahams-
town
One City Festival in
Cape Town
Oude Libertas Arts
Programme,
Amphitheatre,
Stellenbosch
Pink Loerie Knysna
Festival
Savanna up the
International
Film Festival
Groot Marico
Culture Festival,
North West
Province
Jacaranda
Festival, Pretoria
Karoo Festival,
Graaff-Reinet
Macufe Festival,
Bloemfontein
Mangaung
African Cultural
Festival,
Bloemfontein
North West
Cultural
Calabash
Festival, JHB
Haenertsburg
Spring Fair,
Letaba, Northern
Province
International
Eisteddfod of
South Africa,
Roodepoort
Jomba
Contemporary
Dance Experience,
Durban
Minstrel Carnival,
New Year, Cape
Town
National Choir
Festival, JHB
Neptune's Festival,
Citrus Festival, Citrusdal
Drostdy Flower Festival, Tulbagh
Dundee Biltong Festival, Dundee
Eastern Cape Biltong Festival,
Somerset East
Eleven O'clock Rooibos Cederberg
Festival, Clanwilliam
Farm Festival, Agri Moedwil, near
Rustenburg
Food and Wine Festival,
Malmesbury, Simonsberg
Game Festival, Thabazimbi
Gansbaai Crayfish Derby, Gansbaai
Graca Crayfish Festival, Lambert's
Bay
Grape Festival, Nylstroom
Lights, Somerset
West
Kavady Hindu
Festival, Durban
Leipoldt Festival,
Clanwilliam
Love Festival, Elim
Maynardville Open Air
Theatre, Wynberg
Time of the Writer
Festival, Durban
Zionist Church
Gathering, Polokwane
Johannesburg
Design for Living
Festival, Cape Town
Festival of the
Mountains, Koue
Bokkeveld, Ceres
Flower Festival, Elim
Fynbos Festival,
Stanford
Gardenex & Growtech
Flower and Garden
Show, Northgate
Getaway Show, JHB
Hermanus Whale and
Calf Festival
Hibiscus Festival, South
Coast
Festival-Rugby,
JHB
Fish River Canoe
Marathon, Cradock
Gunston 500,
surfing, Durban
Ironman Triathlon,
Port Elizabeth
Isuzu Berg River
Canoe Marathon,
Paarl
J & B Met, (horse-
racing) Kenilworth,
Cape Town
July Handicap,
(horse-racing),
Durban
Knysna Cycle Tour
9
Arts festivals
Culture and heritage festivals
Dance, jazz and music festivals
Harvest and food festivals Sacred, language and religious
festivals
Shows, fairs and festivals
Sports events
Creek Festival,
Swellendam
Spier Summer
Festival,
Stellenbosch
Stokkiesdraai Arts
Festival, Wellington
Vuka Ukulhuleke
Arts Festival,
Tembisa, JHB
Welkom Arts
Festival, Free State
White River Arts
Festival
Windybrow Theatre
Festival, JHB
Festival, Taung
One City
Festival, Cape
Town
Rustlers Valley
Festival, Free
State
Transnet
Heritage
Foundation
Festival, George
Tulbagh Goes
Dutch Festival,
Tulbagh
Van der Stel
Festival,
Stellenbosch
Vasco da Gama
Festival, St
Kenton on Sea
North Sea Jazz
Festival, Cape
Town
Oppikoppi, Easter
Festival, Northam
Farm , Limpopo
Picnic Concerts at
Botanical Gardens,
Roodepoort
Play Festival,
Montagu
Rain Festival,
Upington
Secunda Jazz
Festival,
Mpumalanga
Splashy Fen Music
Festival,
Hantam Meat Festival, Calvinia
Harvest Festival, Constantia
Harvest Festival, Dwaalboom
Harvest Festival, Olive, Food &
Wine Festival, Prince Albert
Harvest of the Sea Festival,
Saldanha Bay
Hibiscus Coast Sardine Festival,
Margate Beach
Kamberg Valley Trout Festival, KZN
Midlands
Knysna Oyster Festival
Maize Festival, Morgenzon
Mampoer Peach Festival,
Magaliesberg (near Pretoria)
Muscadel Festival, Montagu
Jeffreys Bay Shell
Festival
Johannesburg Pride
Festival, (gay and
lesbian parade), JHB
Ladysmith Show
Laingsburg Karoo
Festival
Midlands Fuchsia
Festival, Hilton
Paarl Show
Postberg Flower Season
(private area in nature
reserve bordering
Langebaan, West
Coast)
Rand Easter Show, JHB
Rose Festival,
Knysna Forest
Marathon, “the
Glebe” in the
Knysna forest
Life-cycle Week, ,
Cape Argus/Pick 'n
Pay Cycle Tour,
Cape Town
Million Dollar Golf
Challenge
Model Aircraft
Show, Oudtshoorn
Old Mutual Two
Oceans Marathon,
Cape Town
Om-die-dam-
running race,
Hartebeespoort
Dam

10
Arts festivals
Culture and heritage festivals
Dance, jazz and music festivals
Harvest and food festivals Sacred, language and religious
festivals
Shows, fairs and festivals
Sports events
Helena Bay Underberg (in
Drakensberg Mts)
Standard Bank
Cape Town,
Jazzathon, V & A
Waterfront
Summer Sunset
Concerts, at
Kirstenbosch
National Botanical
Gardens, Cape
Town
Unyazi Electronic
Music Festival,
JHB
Voorkamerfest at
the Hello Darling!
Festival, Darling
Womad in Benoni
McGregor Apricot Carnival,
McGregor
Merino Festival, Colesberg, Eastern
Cape
Nampo, Harvest Day/Festival,
Bothaville
Natrossie Festival [Bunch of
grapes], De Doorns
Nouveau Wine Festival, Paarl
Olive Festival, Groot Constantia
Ostrich Festival, Oudtshoorn
Port Festival, Calitzdorp
Potato and Venison Festival,
Petrusburg
Potato Festival, Bethal
Prawn Festival, Mtunzini, Zululand
Germiston
Rose Festival, Stilfontein
Royal Show,
Pietermaritzburg
Sabie Forest Festival
SARCDA International
Trade Exhibition,
Midrand
Sasol Kruger National
Park Bird-watching
weekend, Skukuza
Sasol-Marakele Bird-
watching weekend,
Marakele National Park
Sasol-Sci-fest,
Grahamstown
Splash Festival, Port
Elizabeth
Pick-‘n-Pay-94,7
Cycle Race, JHB
Soweto Marathon,
JHB
Stilbaai Touchies,
Stilbaai
Trans-Agulhas
Rubber duck Race,
Keurboomstrand,
Hermanus
Vodacom/Clifton
Touch Rugby,
Cape Town
Witwarm Touchies,
Strand, Hermanus,
Struisbaai, Mossel
Bay, Plettenberg
Bay
11
Arts festivals
Culture and heritage festivals
Dance, jazz and music festivals
Harvest and food festivals Sacred, language and religious
festivals
Shows, fairs and festivals
Sports events
Prickly Pear Festival, Willem
Pretorius Museum, Pretoria
Prickly Pear Festival, Uitenhage
Pumpkin Festival, Worcester
Queen Pineapple Sports Festival,
Hluhluwe, KZN
Red Meat Festival, Vrede, Free
State
South Africa Cheese Festival, Bien
Donne, Paarl and Franschhoek in
Western Cape
Seafood Festival, Hawston
Sweet potato Festival, Napier
Tomato Festival, Lutzville
Various wine festivals at Paarl and
Kuruman
Summer Festival,
Plettenberg Bay
Super Splash Festival,
Mossel Bay
The Cape Outdoor
Adventure Experience,
Kiks, Cape Town
Tshwane Show, Pretoria
Ultimate Horse Festival,
Lipizzaner shows, JHB
Water Sports Festival,
Gariep Dam, Free State
Wildflower Show,
Darling
Wildflower Festival,
Caledon
Xtreme Air and Track

12
Arts festivals
Culture and heritage festivals
Dance, jazz and music festivals
Harvest and food festivals Sacred, language and religious
festivals
Shows, fairs and festivals
Sports events
Venison Festival, Dundee
Venison Festival, Thabazimbi
Wheat Festival, Groblersdal
Witblits Festival, Philippolis, Free
State
Wool Festival, Ermelo
Yellowtail Festival, Struisbaai
Festival, Pretoria

13
As shown in Table 1.2, more than 85 festivals of various kinds are held throughout
the year in South Africa, creating an overabundance in the market. Research is
therefore undertaken into the festival package or arts festival presentation to
determine what makes a festival successful and sustainable as a tourism attraction in
a crowded market place. The different niche markets in which these festivals operate
should also be identified. The following three prominent arts festivals were chosen
from the list and are considered as three scenarios in this study:
• In scenario A, Festival A refers to the Aardklop National Arts Festival in
Potchefstroom.
• In scenario B, Festival B refers to National Festival of the Arts in
Grahamstown.
• In scenario C, Festival C refers to the Klein Karoo National Arts Festival
(KKNK) in Oudtshoorn.
Scenarios were selected for the purposes of this study based on reseach by Handy
(1996) that noted scenarios are typically used in cases where uncertainties in
possible future outcomes need to be determined. These three are regarded as major
arts festivals in the South African arena and are semi-competitive in the market place
(Witepski, 2002: 52-53). In semi competition due to the fact that they are held at
different times of the year and at different places in South Africa. These particular
arts festival scenarios were selected for the following reasons:
• These three arts festivals have the longest time frame (have been held for
more than five years) and attract more than 100 000 attendees each year. The
National Festival of Arts in Grahamstown has been held for 32 successive
years, KKNK for 12 years and the Aardklop Arts Festival for the past 8 years.
• Research by the North-West University shows that the KKNK generated an
income of almost R98 million in 2003, compared with Aardklop's R65 million
and the Grahamstown Festival's R35 million (Saayman, 2004). Although
various other arts festivals, such as the Volksblad National Arts Festival and
the Innibos-Lowveld National Arts Festival have been added to the festival
14
calendar during recent years, their economic impact does not yet justify their
inclusion in the category of South Africa’s prominent arts festivals. These
younger festivals only generate about R9 million million annually (Van Niekerk
& Saayman, 2004).
• Previous research at master’s level identified a lack of positioning for the
Aardklop Festival (Van Zyl, 2002:158). The dissertation titled “The participation
of the host community in the Aardklop National Arts Festival” determined the
motivational factors that push and pull the local residents of Potchefstroom,
South Africa, to attend and participate in the Aardklop Festival, as well as the
situational inhibitors that discourage them from participating in the festival. The
specific festival activities they enjoyed most were also identified, namely
performances, music and art. The major findings of the research revealed that
family togetherness and event novelty were the strongest overall push
attributes, whereas information and marketing, food and beverages
(refreshments) and entertainment or festival activities were the strongest pull
attributes at the festival. Time and money, accessibility/transport and social
problems were considered the largest situational inhibitors or constraints
preventing the respondents from attending the festival.
• The selected three festivals also entail a longitudinal study, as empirical data
from previous research were the conceptual basis of the data-collecting
instrument (questionnaire) for the present research.
Irrespective of the growth of festivals and events and increased profit generating, it
should also be noted that it is highly unlikely that this widespread growth in the
festivals and event industry will continue at full strength nationally and internationally
(Van Zyl; 2003; Witepski, 2002:52; Getz cited in Gartner & Lime, 2000a:175; Wicks &
Fesenmaier, 1993:19). This is also apparent with regards to the three arts festivals
selected. In some cases, a slight decline in the number of attendees and ticket sales
has already been noted in South Africa, which could threaten the future of the
individual festival (Burger, 2003:3; Malan, 2003:21; Slabbert, 2002:36).
15
The National Arts Festival in Grahamstown recorded a decline in the number of
attendees and ticket sales in 2001, though the Aardklop Festival in Potchefstroom
recorded the same ticket sales in 2001 as in 2000 (Nieuwoudt, 2002:5). To prevent
this research should be conducted into the perception prevailing in the market
regarding which combination of attributes induces the attendees to choose to attend
a specific arts festival in preference to another arts festival; in other words, what
unique position does the festival hold in their minds (Van Gessel, 2003).
The greater ability of one tourism product (festival) to attract a market segment vis-à-
vis others in the market, is based on the market positioning of that tourism product
(Calantone & Mazanec, 1991:101-119). For the purpose of this study an arts festival
is classified as a service (intangible characteristics) however, it can also be a referred
to as a tourism product (tangible characteristics) therefore the words product and
service will be used interchangeably. (Refer to Section 3.5.4 with regards to this
classification). In tourism, market positioning is the process of establishing and
maintaining in the minds of the potential visitors a distinctive place for a tourism
product in the market (George, 2004:138; Walker, 2004:752; Chacko, 1997:1;
Echtner & Ritchie, 1993:3; Crompton, Fakeye & Lue, 1992:20). In addition, Lovelock
(2003:110) argues that market positioning involves developing and communicating
the attributes of a key product or service, and is not primarily about creating
advertising images. Kotler, Bowen and Makens (2003:283) augment this by noting
that “positioning is the way the product is defined by consumers on important
attributes”.
It may be argued that the decision on market positioning for a tourism product (arts
festival) is the most critical strategic decision for a producer because it is central to
determining visitors’ perceptions and their decisions about choices (Alford, 1998:67).
Aaker and Shansby (1982:56) mention that market-positioning decisions often mean
selecting those associations and attributes to be emphasised, and those to be de-
emphasised. Therefore, when using a market-positioning approach to tourism
marketing, the marketer first has to do market research to ascertain which product
attributes determine tourism (festival) choice.

16
Thus, survival in the crowded festival market means that market positioning is
paramount. Consequently, festival managers have to consider the dynamic business
environment so that they can operate successfully. Festivals have to be positioned
and differentiated in the market to keep their customers. These factors have to be
addressed and researched, particularly in event tourism (Kay, 2004:191). For the
purpose of this study the terms customer, tourist and attendee are used
interchangeably as a tourist can be an attendee to a festival and at the same time be
a customer that consumes a service.
The notions of market positioning have been well researched in the field of marketing
and to a lesser extent in tourism, but this research is not mirrored in the area of
festivals and events. In fact, secondary research indicates that the growth pattern of
tourism and specifically that of festivals and events does not match the growth curve
researched for the tourism field (Hughes, 2003; Getz, 2000b:10). It has also been
proved that the use of market positioning in tourism is fairly uncommon and that the
use of more sophisticated research techniques in the science of marketing has not
evolved in the tourism (events and festival) industry (Reich, 1999:1; Grabler,
1997:101). Furthermore, various authors (Van Gessel, 2003; Allen, O’Toole,
McDonnell & Harris, 2002 Getz, 2000b; Formica, 1998; Smith & Jenner 1998; Scott,
1996) agree that this weakness is a tremendous opportunity for researchers to
contribute to tourism.
A comprehensive summary of the positioning articles reviewed, indicates a vast
number of application studies and various techniques for positioning analysis in the
marketing and tourism literature. The various techniques used in the positioning
process are discussed in Chapter 3 (Section 3.5.5). However, preliminary research
on arts festivals, especially in the South African domain, offered little or no results on
the market positioning of arts festivals. To date, little empirical research has been
undertaken to determine which attributes are better for positioning purposes. The
core concern of this thesis is therefore to conduct research into the three dimensions
of the problem.
17
Firstly there is a crowded festivals and events calendar in South Africa, secondly,
new ones are added continuously to the calendar creating confusion in the market
place, and, thirdly, no market-positioning model is available, which could
communicate a simple message to the market to help ensure a sustainable future for
festivals and events. The following three subareas have been identified in the
problem statement, namely –
1. to determine which attributes and/or combination of attributes would drive best
practices in arts festival scenarios. The situational inhibitors that might prevent
respondents from participating in each of these scenarios should also be
addressed;
2. to compare the different arts festival packages and their attributes with one
another and to determine the optimum arts festival package and position for
each arts festival in the market; and
3. to determine how an arts festival could gain the best possible market position
to ensure its future survival. A model should be developed specifically for arts
festivals, which could be used to ensure the sustainability of these festivals.
This research will make a valuable and unique contribution to the existing body of
positioning knowledge, specifically in the festival and events domain. The
development of such a market-positioning model for this niche tourism sector will add
value to the future of these festivals. The value added to the field of Tourism
Management is that, though this model would concentrate specifically on arts
festivals, it could also be applied to other festivals in South Africa. Furthermore, the
market-positioning model could also be applied to other business sectors in the
economy such as banking and insurances, and motor manufacturing etc. as these
business sectors could apply the steps followed in the study.

18
1.3 RESEARCH OBJECTIVES
The primary and secondary objectives of this thesis are elaborated below:
1.3.1 Primary objective
To develop a market-positioning model in the special interest tourism (SIT) market for
South African arts festival scenarios.
1.3.2 Secondary objectives
In this case, a number of objectives have been identified:
• to determine which attributes and combination of attributes make the different
arts festival scenarios successful as well as the situational inhibitors that might
prevent respondents from attending festivals;
• to compare the different arts festival packages and their attributes with one
another to determine the optimum arts festival presentation in terms of a
tourism attraction;
• to integrate the data and then use the result in the design of the model;
• to refine a classification system for the festivals and events that forms part of
special interest tourism in South Africa;
• to evaluate the available market-positioning models used in marketing, tourism
marketing, festivals and events;
• to carry out longitudinal research based on the results obtained for this study
vis-à-vis the dissertation completed in 2002;
• to contribute to the existing body of knowledge in the field of study; and

19
• to identify opportunities for future research.
1.4 RESEARCH METHODOLOGY OF THESIS
1.4.1 General
The primary objective of the thesis is to develop a market-positioning model in the
special interest tourism market for arts festivals in South Africa. In order to determine
how attendees evaluate an arts festival package offered in the market, three
prominent arts festivals in South Africa were identified and presented as scenarios.
The population for each scenario was a group of people attending arts festivals and
residing in the three scenario areas (Potchefstroom, Grahamstown and Oudtshoorn).
Only those likeminded individuals who attended at least one of the arts festivals in
2003 or any of the previously held festivals and who were familiar with the prominent
arts festivals, were considered. Therefore, the current study will generate meaningful
results on the optimum combination of attributes for attendees of arts festival
scenarios in the South African market and consequently the best market positioning
of an arts festival. The secondary research, analysing previous research on the
Aardklop Festival, was summarised and the available literature evaluated in order to
achieve the objectives of the study.
1.4.2 Secondary research
The term secondary literature research is defined by Cooper and Schindler
(2003:281) as studies made by others for their own purposes. The main advantages
of secondary data sources are that information can be obtained more quickly and
cheaply and that secondary sources provide information useful for interpreting the
primary data. In addition, secondary information can also be used as a guideline on
the formulation of recommendations. An extensive literature study was undertaken.
This is outlined in Chapters 2, 3 and 4 of the thesis.
20
The secondary study for this thesis embraced the following four concepts: (1) tourism
and special interest tourism; (2) festivals and events; (3) tourism marketing in South
Africa; and (4) market-positioning models.
The databases consulted included library databases; South African magazines;
theses, multimedia; Educational; ABI/Inform (R) Global; General Business File
International; Newspaper Source Plus; Science Direct; Emerald Full Text; Econ Lit;
Sabinet Online Record Display; Nexus Database System; NISC DIS Cover Report;
EBSCO host; Book Data Premier-CD. A detailed list of the sources consulted
appears in the list of references at the end of this thesis.
1.4.3 Primary research
Primary data are obtained from original research and consist of information collected
especially for the specific purpose at hand (Cooper & Emory, 1995:240). As good
data are essential to formulate good decisions, care has to be taken when collecting
original data to ensure that such data provide the most relevant, accurate, up-to-date
and unbiased information to the decision maker.
The primary research for the study was undertaken in an endeavour to achieve the
primary objective of the study, namely to develop a market-positioning model for
attendees at arts festival scenarios in South Africa. This primary research objective of
the study is underpinned by secondary research objectives. The first is to determine
which attributes and combination of attributes will drive the best practices offered by
arts festival scenarios. The situational inhibitors that might prevent respondents from
attending a festival in these scenarios are also addressed.
The second is to compare the different arts festival packages with one another and
by doing so to identify the most successful arts festival presentation in terms of a
tourism attraction. In support of this, the third secondary objective is to integrate the
data and design a model specifically for arts festivals. It is hoped that this market-

21
positioning model would add value and contribute to the body of knowledge about
South African arts festivals.
Primary data were gathered from prominent arts festivals in South Africa in order to
address the before-mentioned research objectives of the study. The three arts
festivals selected for research were identified in the problem statement, Section 1.2
of the study. (Refer to Appendix A1 for a map of South Africa and the three
respective provinces where the festivals are held). This study is scenario-based and
the three arts festivals are presented as three scenarios. Scenario-based studies are
typically used in cases where uncertainties in possible future outcomes need to be
determined (Handy, 1996). Based on these trajectory routes of arts festivals
scenarios were used. The primary research followed in the present study is
discussed according to the seven steps of the research process as illustrated in
Figure 4.1 of Chapter 4. Each of these steps as applied in the present study is briefly
discussed below.
One of the first steps in primary research is to develop the sample plan. The design
plan for drawing a sample consists of defining the population of interest. The survey
population for the present study was selected from a group of people attending
festivals and residing in the three scenario areas (A, B, and C). The sample unit
refers to those individuals (known as repeat visitors) residing in the survey/scenario
areas. The sample element included individual members residing in the
survey/scenario areas (A, B, and C), who attended at least one of the arts festivals in
2003 or any of the previous years’ arts festivals and who were familiar with the
prominent arts festivals presented in any of the arts festival zones. The survey was
conducted in 2003. The selection of the survey areas was based on the regions
(geographic areas where the festivals took place) and represents prominent arts
festival zones in South Africa (Scenarios A, B and C). The assumption was that
people residing in these areas and repeat attendees would be more likely to have an
informed opinion (they are likeminded individuals) about arts festivals than people
residing outside these areas (Assael, 2004:224; Schreuder, 2003; Van Zyl, 2003).

22
The nature of the research instrument (see Section 4.4) of this study largely
determined the choice of personal face-to-face interviews as the data collection
method. Unfortunately it was not possible to obtain a master list of arts festival
attendees who had attended all three of the prominent arts festivals in South Africa.
There was no database on any of the three arts festival scenarios at the time of
conducting this research.
The current research is scenario-based and therefore requires a scenario-based
sample. (See paragraph 4.1 for justification of scenarios used). A combination of
judgmental and interlocking quota samples was drawn for the current study, based
on the specific criteria stipulated. (Refer to paragraph 4.3.4 for sampling method
criteria used). It should be noted that the current study is not a representative sample
of the population.
The sample size of 380 was determined on the basis of the scenarios and by using
the judgement of an expert researcher in the field. The selected sampling procedure
for this study was based on the guidelines of Cooper and Emory (1995:207) and
Krejcie and Morgan (1970:608) for general research activities, applicable to any
defined population, which states that for a population (N) of 100 000 the
recommended sample size (S) is 384.
However, these authors also state the apparently applicable rule of the thumb that
diminishing returns are obtained when the sample size increases beyond 300. The
total population in the scenario of 392 000 arts festival attendees (based on 2002
figures in this regard), made the recommended sample size of 380 appear
appropriate to the current study. A sample of 0,096% from each of the three festival
scenarios was proportionally drawn. The sample size was also affected by the
method of collecting data, as personal interviewing is an expensive method but
produces some of the best results. Table 1.3 indicates the sample size of the three
selected arts festival scenarios.
23
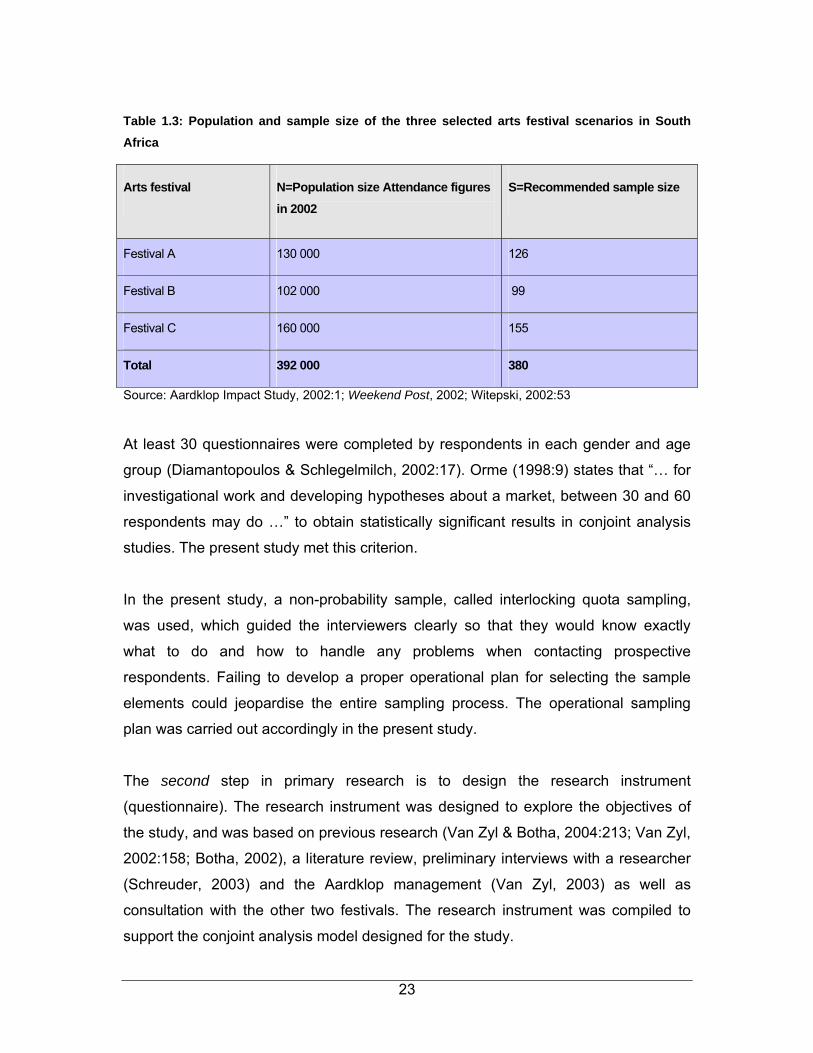
Table 1.3: Population and sample size of the three selected arts festival scenarios in South Africa
Arts festival N=Population size Attendance figures in 2002
S=Recommended sample size
Festival A 130 000 126
Festival B 102 000 99
Festival C 160 000 155
Total 392 000 380
Source: Aardklop Impact Study, 2002:1; Weekend Post, 2002; Witepski, 2002:53
At least 30 questionnaires were completed by respondents in each gender and age
group (Diamantopoulos & Schlegelmilch, 2002:17). Orme (1998:9) states that “… for
investigational work and developing hypotheses about a market, between 30 and 60
respondents may do …” to obtain statistically significant results in conjoint analysis
studies. The present study met this criterion.
In the present study, a non-probability sample, called interlocking quota sampling,
was used, which guided the interviewers clearly so that they would know exactly
what to do and how to handle any problems when contacting prospective
respondents. Failing to develop a proper operational plan for selecting the sample
elements could jeopardise the entire sampling process. The operational sampling
plan was carried out accordingly in the present study.
The second step in primary research is to design the research instrument
(questionnaire). The research instrument was designed to explore the objectives of
the study, and was based on previous research (Van Zyl & Botha, 2004:213; Van Zyl,
2002:158; Botha, 2002), a literature review, preliminary interviews with a researcher
(Schreuder, 2003) and the Aardklop management (Van Zyl, 2003) as well as
consultation with the other two festivals. The research instrument was compiled to
support the conjoint analysis model designed for the study.

24
The structured questionnaire for the interviews appears in Appendix A3 and A4.
Show cards were included to facilitate the completion of the questionnaire. The
questionnaire consisted of four sections, Sections A, B, C and D.
Section A contained a few screening questions to determine whether or not a
respondent qualified to participate in the research project. Section B consists of an
introductory section, prompting respondents to complete all the questions; an
example question on one profile and the 16 actual questions on profiles. A 9-point
semantic differential rating scale was used to rate the 16 packages. Five different
attributes with three different attribute levels were developed and the rationale for
selection is discussed in Section 4.8.5 of the present study. Section C measures the
perception of the situational inhibitors that might prevent respondents from attending
an arts festival. The rationale for the situational inhibitors selected in the present
study and their levels are discussed in Section 4.8.5. An 11-point interval rating scale
was used to evaluate the situational inhibitors that might influence the respondent’s
decision negatively. In Section D, the responses to questions on certain demographic
information about the respondent were incorporated as variables with a rank-order
rating of the various push attributes identified in previous research (Van Zyl,
2002:105).
The questionnaire was pre-tested on 15 respondents to identify and eliminate
potential problems. No problems were reported and respondents understood the
questionnaire. The analysis of the pre-test responses was used when checking the
actual survey to ensure that the data collected contained the necessary information.
R-square testing was done on Section B of the questionnaire for the 16 profile
packages to test whether the respondents understood the conjoint section, thereby
testing the validity of the questionnaire. In this study, any R-squared values below 0,4
were omitted from the study. Individual respondent numbers 210 and 185 were
deleted as their R-squares were below the norm. The average of R-squares for this
study was 0,83, which indicated a good fit between the data and the model. (See
discussion in paragraph 4.8.5 on Step 6 for the ideal R-square value).
25
The following three steps (Steps 3 to 5) in the primary research process are
concerned with the data namely the fieldwork (data collection and editing), the coding
of the data, the capturing and cleaning of the data.
The fieldwork was performed and the interviews were conducted between 15 and 27
October 2003, which included weekdays and a weekend. The data collection times
were between 08:00-12:00, 14:00-18:00 and 19:00-22:00. The interviews were
conducted in the three scenario areas as demarcated by the Municipal Demarcation
Board where the arts festivals are held annually. Each interview took 20-30 minutes
and only respondents who met the design criteria were interviewed. In total, 31
interviewers/field workers were used for data collection at all three festival scenarios.
They were fully briefed beforehand on the background of the study, as well as the
manner in which interviews should be conducted. The respondents who took part in
the research were briefed on its purpose, and responded openly and honestly. For
convenience and to assist the interviewers, they were given written instructions on
conducting the interview (see questionnaire in Appendix A4). A quota control sheet in
the middle of the flip file contained the exact quota of respondents the particular
interviewer had to interview in the geographical region of the festival in the scenario
(see Appendix A2).
The fieldwork supervisor checked that each interviewer had collected the exact quota
of respondents and interviewees were awarded incentives accordingly. A total of 380
personal face-to face interviews were conducted. The data for the present study were
edited during the fieldwork. A 10% check-back was performed for verification to test if
completed questionnaires were correct.
Data coding in this study, was done by using numerical codes to combine the pre-
coding and post-coding. At this point, data capturing and cleaning took place as the
data from questionnaires had been entered into a database and stored electronically.
A final check was done for errors before proceeding with the tabulation and statistical
analysis of the survey results. One returned questionnaire, File number 152,
contained missing data was therefore deleted from the data set.

26
Two other returned questionnaires were deleted because their r-squares were below
0,4 (see Section 4.8.5). In total, 377 questionnaires were used in the analysis of the
data. The sixth step is the analysis of the data and the two techniques used for analysing
the data in the current study are conjoint analysis and game theory. The conjoint
analysis technique was employed to address the secondary research objective of the
study, namely to determine which attributes and combination of attributes would drive
the best practices of arts festival scenarios. With conjoint analysis (CA), the
importance of each attribute as well as the part-worth values of each level of each
attribute of the three arts festival scenarios can be assessed by means of a linear
regression model using the rating each person gave to each product (a combination
of levels of attributes). Such a rating indicates how much a respondent prefers a
particular arts festival product.
The conjoint technique as employed in the present study, is discussed in Section
4.8.3. In addition, two techniques often used as complementary to and in conjunction
with conjoint analysis, namely cluster and correspondence analysis, were mainly
used to draw the positioning maps contained in the study. Cluster and
correspondence analysis are discussed in Section 4.8.1 and 4.8.2.
The results of the conjoint analysis were used to construct the game theory. Game
theory studies decision making in situations where there is semi-competition
(Mansfield & Yohe, 2004:441). The game theory technique is employed to address
the secondary research objective, namely to compare the different arts festival
scenarios with one another and to identify the most successful arts festival
presentation as a tourism attraction. The outcome of these games was used in
developing the market-positioning model for arts festivals. The game theory
technique as employed in the current study, is discussed in Section 4.9.
The last step in the research process is to present the research findings and is
discussed in Chapter 5 of the study.
27
The demographic, geographic and behaviour criteria of respondents who attend arts
festivals are listed in Section 5.2, Table 5.1. The situational inhibitors that affect
respondents in the three selected arts festival scenarios negatively are discussed in
Section 5.2.1. These inhibitors provide valuable information about the respondents in
the three arts festival scenarios and can add value to the market-positioning model.
The inhibitors were incorporated as a demographic variable in the analysis of the
data.
The conjoint analysis technique was employed to address the first secondary
objective of the study and the results are presented in Sections 5.3.1 to 5.3.5. The
results from these sections make it possible to determine the optimum combination of
attributes for each arts festival scenario. In order to take the results to the next level
another technique that of “game theory” was used. The “game theory” technique is
used to address the second secondary objective of the study and the results are
reported in Section 5.4. The information gained from the above-mentioned analysis
was used to develop a market-positioning model specifically for arts festivals.
The research methodology is discussed in more detail in Chapter 4.
1.5 DEFINITIONS OF TERMS
1.5.1 Tourism and Special Interest Tourism
The Tourism Society in the United Kingdom has adopted a short definition by Burkart
and Medlik (1981:1) according to which “… tourism is deemed to include any activity
concerned with the temporary short-term movement of people to destinations outside
the places where they normally live and work, and their activities during the stay at
these destinations”. The World Tourism Organization’s (WTO) current definition is
very similar to the above definition, as it is workable and has gained acceptance
globally (Lumsdon, 1997:2).

28
In recent years, the same-day visitor or excursionist (low involved tourism) has been
included in the statistics, but here too there are definitional issues. Although the
literature offers various working definitions of tourism, in summary it involves
movement away from the home environment for varying periods of time, even only
for a day. Literature describes the total experience (from planning the trip to
reminiscing about it afterwards) of individuals who participate in different activities
and who use various forms of transportation and hospitality services.
When considering the dynamic nature of tourism, it is natural for various
subsegments to develop. One of these segments, special interest tourism (SIT) was
new in the 1980s, but has become firmly established as a significant ingredient in the
marketing strategies for destinations and places (Getz, 1997:2). SIT is akin to
adventure, culture, heritage, sports, eco-tourism and other special interest markets.
Twenty-five years ago, Read argued that special interest tourism would become a
“prime force in the expansion of tourism”, and would “… dominate the industry in the
next decade and be responsible for an unprecedented rise in visitor satisfaction”
(1980:195). He also defined special interest tourism as “travel for people who are
going somewhere because they have a particular interest that can be pursued in a
particular region or at a particular destination” (Read, 1980:195).
Weiler and Hall (1992:5) refer to the term SIT as active or experiential travel and this
only “occurs when the traveller’s motivation and decision-making are primarily
determined by a particular special interest”.
Derrett (2001:3) takes a different approach and covers some new ground, different
from that important earlier work. This author claims that special interest tourism (SIT)
may be defined as “the provision of customised leisure and recreational experiences
driven by the specific expressed interests of individuals and groups”. A special
interest tourist chooses to engage with a product or service that satisfies particular
interests and needs. SIT is either the focus of the entire holiday, or a way of spending
one or two days during a holiday (Swarbrooke & Horner, 1999:38). SIT may be a new

29
term, but is not a new phenomenon and many new names have been given in the
literature for the services offered to participants in "serious" leisure and tourism.
In summary, SIT is a subset niche market in tourism and encompasses an
extraordinarily diverse range of special interest opportunities, of which festivals and
events are an important sector (Derrett, 2001:357; Hall, 1997; Uysal, Gahan &
Martin, 1993:5). The complex nature of this sector is outlined and defined in the next
section.
1.5.2 Special events and festivals
Special events and festivals and events are terms frequently used in the events
literature. Even though the core meaning of these terms are similar (a specific
happening celebrated in a certain way), their definitions vary, which often causes
confusion (Getz, 1997:4).
The field of special events is so vast that it seems difficult, if not impossible, to give a
definition that includes all varieties and shades of events (Allen, O’Toole, McDonnell
& Harris, 2002:11). The Collins English Dictionary (1998:535) defines an event as
“anything that takes place or happens, especially something important; happening;
incident”.
Although the definition is very wide, it specifies things of significance that happen.
The definition by Goldblatt (2002:6), namely that “a special event recognises a
unique moment in time celebrated with ceremony and ritual to satisfy specific needs”
is more flexible and can suit different situations. Groundbreaking work by Getz
(1997:4) on the typology of events, defines events as “transient, and every event is a
unique blending of its duration, setting, management, and people”. It is rather
confusing to determine when an event is a special event or just an event, because of
the difficulty of defining the element special. For the purpose of this thesis, the terms
special event and events are therefore regarded as synonymous.
30
A festival can be classified as a hallmark tourist event (Dimmock & Tiyce cited in
Douglas et al., 2001:356; Getz, 1997:4; McCleary, 1995:1; Ritchie, 1984:2). Hallmark
event is another term frequently used. A hallmark is a symbol of quality or
authenticity which distinguishes goods or pertains to a distinctive feature (Getz cited
in Jafari, 2000d:210). An event or festival, can aspire to be a hallmark of its
destination, facility or organisation and therefore the link. The different types of
festivals, of which arts festivals is one type, as well as their definitions, are discussed
below.
Festivals are categorised by Wilson and Udall (1982:3) as sacred; harvest and food;
festive subgroup gatherings; regional and local folk art festivals; and special activity
festivals. Arts festivals are among the most acknowledged festivals in the secondary
literature (Gitelson & Kerstetter cited in Allen, Harris, Jago & Veal 2000:179; Hughes,
2000:27; Smith & Jenner, 1998:86; Getz, 1997:11) and are the primary focus of this
research. For the purpose of this study a festival is an event which is an arts festival,
thus the three terms are used interchangeably in this thesis.
Although there are a wide variety of festivals, the definitions essentially apply to all
types of festivals and the object of celebration is often recognisable in the name
(Getz, 1997:8), such as the Aardklop National Arts Festival, which indicates its
nature.
A key characteristic of a festival, which distinguishes it from other events, is that there
is a clearer community and celebratory focus to the occurrence. Wilson and Udall
(1982:3) define a festival as "a public celebration of some happening, either a fact or
a concept". As Manning (1983:4) explains, a celebration is a performance: “It is, or
entails the dramatic presentation of cultural symbols.” Falassi (1987:2) describes
festivals as “a sacred or profane time of celebration, marked by special
observances”. Getz (1997:8) defines a festival as “a public, themed celebration”.
In summary, festivals are:

31
• public in nature and usually have a central celebratory theme;
• the cultural resources of an area that enable the successful hosting of visitors;
• important attractions for tourists, which provide unique experiences for
attendees;
• derived from the word feast and imply a time of celebration;
• an escape from the ordinary day-to-day activities and provide experiences
beyond normal life;
• family-fun events that are regarded as “owned” by a community because the
community provides the support services for the festival; and
• annually recurring events of limited duration, which develop their character
and reputation over a number of years.
However, although these mentioned definitions and characteristics have been
covered in literature there remains a need to address marketing issues as well in this
study. In order for festivals and more specifically arts festivals to sustain and survive
in the long term, they have to be effectively positioned in the market place (Crompton
2003:1; Van Zyl, 2003; Allen et al., 2002:176).
Therefore, market positioning can assist a festival management with successfully
distinguishing its festival from other festivals in the market and with increasing its
attendance figures.
1.5.3 Market positioning
In a series of articles in 1972, Ries and Trout (1981:3) define positioning as “… not
what you do to the product. It is what you do to the mind of the prospect”. Their latest
definition (2001:3) is: “How you differentiate yourself in the mind of your prospect.”
These authors focus on the end product of positioning strategies, namely the position
that the product, or the service, holds in the minds of customers. Since the 1970s,
various other authors have endorsed Ries and Trout’s idea and have expanded on

32
their original concept (Mullins et al., 2005; Jobber, 2004; Kotler, Bowen & Makens,
2003; Lovelock, 2003; Morrison, 2002; Kotler, 2000; Lewis & Chambers, 2000).
Boyd and Walker (1990:315) and Kotler (2000:298) state that positioning can be
defined as the act of creating a positive and unique image of an organisation’s
offering to occupy a distinctive place in the mind of the target market. Lovelock and
Wirtz (2004:63) add to this, and define positioning as “the process of establishing and
maintaining a distinctive place in the market for an organisation and / or its individual
product offerings”. Kotler, Bowen and Makens (2003:282) define market positioning
as “the way the product is defined by consumers on important attributes ! the place
the product occupies in consumers’ minds relative to competing products”. Top-of-
the-mind awareness, optimum selling idea, and unique selling proposition (USP) are
some of the terms that new era marketers frequently use, but the core meaning
remains the same.
It is the customer-oriented (Reich, 1999:2), “top-of-the-mind” awareness that
motivates tourists (attendees) to select one tourism product (festival) above another
(Reich, 1997:5; Ennis, 1982:261).
Positioning is a facilitating process which co-ordinates the marketing functions and is
relevant to the micro and the macro levels of marketing.
Positioning can be based on the physical characteristics of a festival (attributes) and
the images created through promotional efforts (Burnett, 1993), which often
highlights the brand. It is through positioning that marketers strive to find or create a
perception, image or brand – to establish a position – in the targeted visitor's mind, a
niche which is not occupied by another (Mill & Morrison, 2002:176; Morgan &
Pritchard, 2001:247; Lewis & Chambers, 2000:286). Branding is closely related to
positioning and branding has become so strong that hardly anything goes
unbranded, even fruits and vegetables (Kotler & Armstrong, 2004:285; Kotler,
2004:30).
33
Therefore, positioning is the process of establishing and maintaining a distinctive
place for a festival in the minds of potential customers in selected target markets in
the market place.
In summary, positioning:
• is about groups of customers and competitors and is therefore a
multidimensional issue;
• is the favourable distinguishing of one festival from other festivals;
• compares one’s product with others in the market on specific attributes,
features, customer benefits or brand;
• creates a distinctive place in the minds of potential customers;
• is something one does to influence the minds of customers;
• is the “top-of-the-mind” awareness that motivates tourists or attendees;
• is a facilitating process, which co-ordinates the marketing functions;
• is relevant to the micro and the macro levels of marketing;
• is tangible (physical characteristics of the festival) or intangible (based on the
images created through promotion);
• strives to find a distinctive niche in tourists’ minds;
• differentiates one festival from another in their minds; and
• has a strong relation with the specific brand.
The specific attributes of a festival that lure attendees to the festival can be defined
as the positioning attributes (Van Zyl, 2002:21; Botha, 1998:12; Crompton & McKay,
1997:425). Positioning attributes refer to the "push" factors (social-psychological
motivators) and "pull" factors (festival attributes) likely to motivate attendees to select
one festival from a wide variety of alternative leisure activities in the tourism industry
(Van Zyl, 2002:47; Botha, 1998:12; Crompton & McKay, 1997:425). However, when
analysing the positioning attributes of a festival, the situational inhibitors (barriers or
constraints), which might prevent attendance, also have to be considered (Van Zyl,
2002:58; Botha, 1998:13).

34
1.6 ORGANISATION OF THESIS
In view of the problem statement given in the previous section, the chapters in the
thesis are arranged as follows:
Chapter 1 is a general introduction to the thesis, providing the background context,
the problem statement, research objectives, research methodology and definitions of
the relevant terms used throughout this thesis.
Chapter 2 contains a review of the literature relating to the tourism phenomenon,
special interest tourism, festivals and events, and more specifically, arts festivals
from a South African perspective.
Tourism marketing and the theory of the market positioning of arts festivals in the
South African context are outlined in Chapter 3.
Chapter 4 describes the research methodology used for collecting the data on the
arts festival scenarios. The survey population, the development of the measuring
instrument and administrative procedures are also included. The specific statistical
techniques used for analysing the data are also discussed in Chapter 4.
Chapter 5 reports the results of the analyses and interprets the data on the attendees
at each of the three selected arts festival scenarios in South Africa.
The thesis concludes in Chapter 6 with a summary of the findings and a discussion of
the implications these findings might have, the market-positioning model designed
specifically for arts festival scenarios as a recommendation, the limitations of the
study and recommendations for further research. Figure 1.2 is a flowchart of the
following chapters in the thesis.
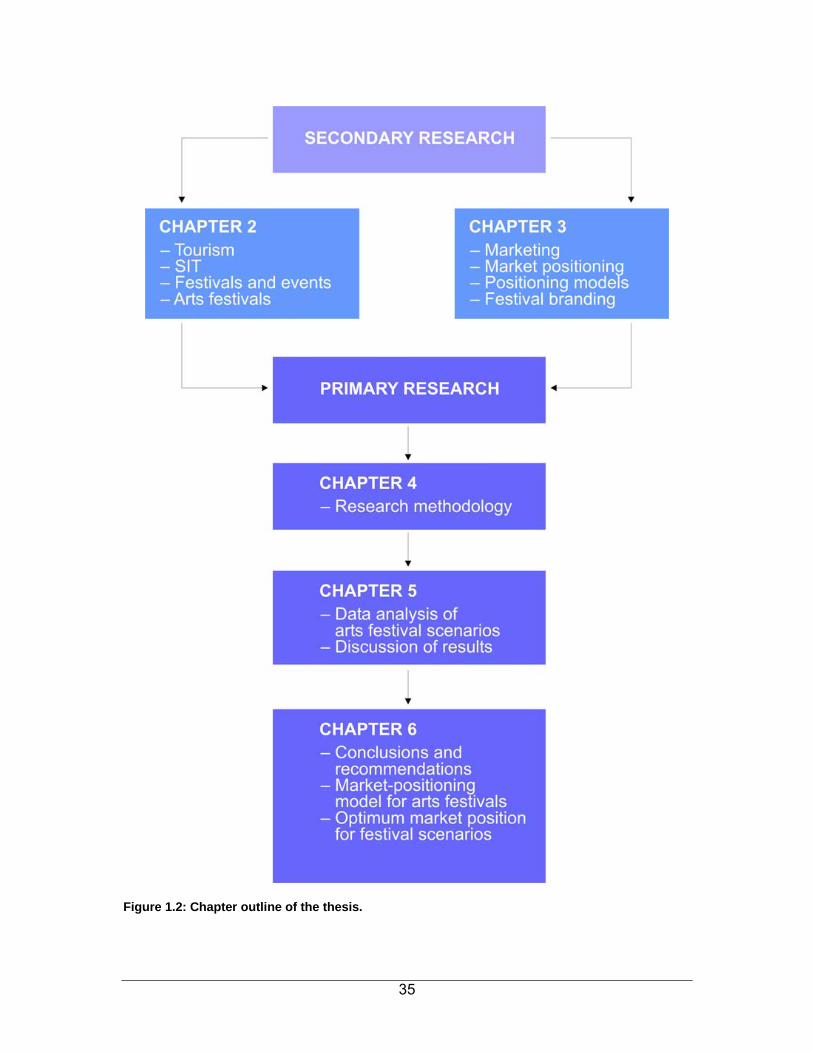
35
Figure 1.2: Chapter outline of the thesis.
36
CHAPTER 2
2 TAXONOMY OF TOURISM, SPECIAL INTEREST TOURISM: ARTS FESTIVALS AND EVENTS
2.1 INTRODUCTION
Tourism is a multifaceted industry, which interfaces with all spheres of life, and which
is the world’s largest and most diverse industry (WTO, 1999a:3). Growth in tourism
has continued in the late twentieth century and the new millennium (Page, 2003:2;
Cooper et al., 1998:1). There are many attempts in the literature to define the
concept of tourism (see Section 2.3.1). In mid-1996 the entire tourism industry
worldwide, and especially in South Africa, has recorded sustained growth. This
growth is currently perceived as very positive as it contributes between 7%-8% to
GDP and creates approximately 512 000 job opportunities (South African Tourism,
2004:1).
Inevitably, like all industry lifecycles, Cooper et al. (1998:2) notes that the pattern of
growth is beginning to slow down as the market matures and as the type of tourists
and their demands or needs change (see Section 2.3.1.2). These authors suggest
that the tourism sector would have to be more creative in supplying products to
satisfy the new tourist’s dynamic demands. Adding to this complexity is the constantly
evolving, developing and reformulating nature of the tourism phenomenon (Page,
2003:3).
Page (2003:3) further argues that the tourism industry and private businesses has to
appeal to the tourist in a focused manner. This entails aligning new marketing ideas,
products, services and destinations to the varied needs of the new tourists. The next
section focuses on the flow process from the “new” tourist to the arts festival tourist.

37
2.2 FLOW PROCESS OF THE TOURISM PHENOMENON
The phenomenal growth of tourism has contributed to maturity in the market and the
changing needs and demands in this sector (Derrett, 2001:7). This “filtering down” or
flow process of the tourism phenomenon is illustrated in Figure 2.1. Although there
are different types of SIT opportunities in the market as illustrated in Figure 1.1 only
one type i.e. festival and event tourism is depicted in Figure 2.1 and more specifically
arts festivals resulting from that.
Figure 2.1: Flow process of the tourism phenomenon
38
The concern in the tourism industry manifests internationally in an interest in
developing niches to cater for the specific interests and activities that the “new”
tourists might find interesting and worth spending their money and leisure time on
(Page, 2003:3; Derrett, 2001:5; Weiler & Hall, 1992:1). Ultimately, this understanding
has been translated into the rise of special interest tourism (SIT), for example nature-
based tourism or ecotourism including bush walking, bird- and whale-watching or
festival and event tourism. Various authors (Douglas, Douglas & Derrett, 2001:1)
comment that special interests are a rapidly developing pattern in tourist activity and
that these are not restricted to a handful of selected individuals. Tourists may engage
in a number of special interest tourism products simultaneously or combine a special
interest with a conventional holiday product (Douglas et al., 2001:1). (See Section 2.4
for the different types of SIT opportunities.)
One of the key aspects of special interest tourism is that it holds a promise of
incorporating the principles of sustainability (Derrett, 2001:7). Special interest tourism
(SIT) has the potential to contribute to the wellbeing of the host destination and is
therefore always welcomed (Weiler & Hall, 1992:11). SIT may offer new opportunities
to establish a form of tourism compatible with the socio-cultural and natural
environments of a particular area. One of these subcategories of this type or tourism,
associated with the culture and heritage of an area, is festival and event tourism
(Lee, Lee & Wicks, 2004:61).
This subcategory has grown strongly and is now a worldwide tourism phenomenon
(Goeldner & Ritchie, 2003:224; Prentice & Andersen, 2003:8; Derrett, 2000:120).
Interest in and research on festivals and events has grown considerably in the past
15 years, owing to the large number of public celebrations and their social and
economic contribution to society (Arcodia & Robb, 2000:154; Formica, 1998:131;
Schneider & Backman, 1996:139). Although the benefits of festival and event tourism
are increasingly being recognised in South Africa, more research is needed on this
market segment (Tassiopoulos, 2005:25).

39
Ironically, the very popularity and growth of the festival industry in South Africa might
threaten its future (Witepski, 2002:52). Festivals and events are discussed in Section
2.5, and Section 2.5.4 contains a classification of festivals in the South African
context. This classification could help to create and maintain positive images in the
minds of festival attendees or customers by creatively marketing and effectively
positioning of a festival or event.
As might be expected for an emerging industry, literature on festival and event
tourism is growing but still limited, especially regarding the specialised field of arts
festivals (O’Sullivan & Jackson, 2002:325; Getz, 2000b:10). Arts festivals were
selected for the purpose of the research for this thesis, as these are currently one of
the fastest-growing sectors of tourism (Gitelson & Kerstetter, cited in Allen et al.,
2000:180). The definitions, reasons for participation and establishing festivals, as
well as the advantages and disadvantages of arts festivals are discussed more fully
in Section 2.5.5. This particular category of festivals is of particular significance to this
study and the following determinants also played a role in the selection of the
prominent arts festival scenarios to be researched:
• large in size with more than 100 000 attendees;
• significant for host community's wellbeing and community pride;
• recurrence period as the festivals should have been held annually for more
than five years;
• of limited duration, i.e. held for between 5-8 days only;
• capacity to enhance the awareness, appeal and profitability of a destination in
the short term with considerable economic impact (more than R37 million per
festival).
The three arts festivals in South Africa classified as hallmark tourist events3 by Van
Zyl (2002:24) are as follows:
3 Hallmark events are events that become so identified with the spirit or ethos of a town, city or region
that such events become synonymous with the name of the place, and gain widespread recognition
and awareness (Bowdin, McDonnell, Allen & O’Toole, 2001:17).

40
• Aardklop Festival in Potchefstroom, referred to in this thesis as Festival A,
• National Arts Festival in Grahamstown, referred to in this thesis as Festival B,
• KKNK in Oudtshoorn referred, to in this thesis as Festival C.
The future trends affecting tourism industry as well as the challenges these trends
pose to the marketing and positioning of festivals in the global and South African
market are discussed in Section 2.5.7.
2.3 THE TOURISM PHENOMENON
2.3.1 Defining tourism
The dynamic nature of tourism entails that a definition for tourism is still evolving.
Various authors and stakeholders interpret and define tourism according to their own
relevant frame of reference, and each country tends to adopt a different definition
(Goeldner & Ritchie, 2003:7).
The British definition of tourism by Burkart and Medlik (1981:1) in Section 1.5.1 is
very similar to the definition established in 1991-2 by the World Tourism Organization
(1993:1), the major intergovernmental body concerned with tourism. The WTO
definition is workable and has gained acceptance worldwide (Lumsdon, 2000:2), and
is intended for general use:
• “Tourism comprises the activities of persons travelling to and staying in places
outside their usual environment for not more than one consecutive year for
leisure, business, and other purposes.”
Furthermore, although literature offers various working definitions of tourism, such as
those by Middleton (2001:8-9), Goeldner, Ritchie and McIntosh (2000:16) or Burkart
and Medlik (1981:2), the definition given by Mill and Morrison (2002:8) is perhaps the
most comprehensive as it includes elements of pre- and post-event trip evaluation as
41
well as those activities which take place at the destination. According to the definition
by these authors, an understanding of the entire tourism process has fundamental
implications for the tourism marketer:
• “Tourism is the term given to the activity that occurs when people travel. This
encompasses everything from the planning of the trip, the travel to the
destination area, the stay itself, the return, and the reminiscences about it
afterwards. It includes the activities the traveller undertakes as part of the trip,
the purchases made and the interactions that occur between host and guest in
the destination area. In sum, it is all of the activities and impacts that occur
when a visitor travels.”
Mill and Morrison (2002:8) also note that the term recreation overlaps in many ways
with the term tourism. Accordingly, recreation is defined as what happens during an
individual’s leisure time. Furthermore, the activities in which people engage during
leisure time, such as attending an arts festival, are known as recreation.
This definition of recreation includes the overlapping stages of customer activity and
provides a useful point of departure for the analysis of the tourism process. It gives
the tourism marketer an opportunity to understand the complete tourism process and
not only the travel journey and the destination.
In summary, tourism involves movement away from the home environment for
varying periods of time (even for just a day). It describes the total experience (from
planning the trip to the reminiscing afterwards) of individuals who participate in
different activities and who use various forms of transportation, hospitality and
accommodation facilities. Based on the above definition, the people who attend arts
festivals (special interest tourists) will be classified as tourists for the purposes of this
study.

42
2.3.1.1 The growth of tourism
The concept of travel and tourism is as old as civilisation itself and can be traced
back many thousands of years to the Ancient Greeks and the Romans (Mill &
Morrison, 2002:9). A ten-volume travel guide entitled A guide to Greece published in
170 AD was the first to be documented in literature (WTO, 1999a:9). Since then,
tourism has grown remarkably as an activity and also as an industry in the economy
of the world, and has also gained global importance and significance. Tourism has
emerged as one of the world’s major socio-economic sectors, and has steadily
expanded at an average rate of about 4-5 % annually during the last quarter of the
20th century (WTO, 1998:14).
The current tourism industry is worth US$4,4 trillion and is projected to grow to
US$10 trillion by 2010, with international tourist arrivals increasing by 4,3% p.a.
between 1995 and 2020 (WTO, 1998:14). Grant Thornton Kessel Feinstein (1998:5)
reports that travel and tourism in South Africa was worth nearly R60,5 billion in 1997,
and is set to grow at a rate of 12,2% p.a. until 2010. Tourism already contributes
between 7% and 8% of South Africa’s gross national product (GDP), and this is
predicted to grow to more than 10% by 2010.
Furthermore, Africa recorded a 4,6% increase in international arrivals in 2001,
despite a worldwide decline (WTO, 2002:4). The WTO Tourism 2020 Vision
(1999b:3) further forecasts growth rates of over 5% per annum in Africa, compared to
the world average of 4,1%, and South Africa remains the most important destination
in Africa. As a result of a steady increase in overseas tourist arrivals, the South
African tourism industry is increasingly gaining buoyancy (South African Tourism,
2005:4). This growth can be attributed to several factors, including the increasing
perception of South Africa as a “safe” destination after global events such as post 11
September 2002, the war in Iraq, and the latest terrorist attacks in places such as
London and Egypt.

43
Although the growth and prosperity of the South African tourism industry are
recognised, tourism marketers cannot afford to ignore the challenges posed to this
dynamic industry.
As periods of continued growth will not persist, any signs of maturity in the South
African market should be monitored. This is particularly important, as continued
growth in the tourism industry has led to maturity in the market elsewhere such as a
decline of the seaside resort in the United Kingdom as a long-stay destination and in
several other European countries (Hughes, 2000:84; WTO, 1999a:117).
The continued growth and expansion in tourism have resulted in a wider selection of
tourism products and services (Page, 2003:3). In addition, tourists have also become
more knowledgeable and there is a new generation of tourists with completely
different expectations (Buhalis, 2001:71). If tourism stakeholders and planners are to
survive, they will increasingly need to identify the changes (new trends in demand) in
the market. This is challenging in an environment characterised by a constant state
of flux. For this reason, the tourism industry should offer and market meaningful
tourism products to satisfy tourists' constantly changing and increasingly
sophisticated demands.
2.3.1.2 Changing needs of tourists
Various authors report that the rapid growth in tourism has led to fundamental
changes in the needs and demands in the industry as well as to a new, more
“streetwise” tourist (Page, 2003:4; Buhalis, 2001:69; Swarbrooke & Horner, 1999:29;
Lickorish & Jenkins, 1997:4). The tourism market has to respond to these changing
patterns so that it can meet the demands of these tourists (Poon, 2003:139). No
longer is sunbathing next to the pool of a luxury five-star hotel (old traditional tourism
market) the main attraction. Instead, there has been a shift to new kinds of
experiences and tourism products (Poon, 2003:141; WTO, 1999a:118). The most
significant trends or changing patterns in the tourism sector have been summarised
in various sources (Allen et. al., 2002:8; Buhalis, 2001:71; Chang, Milne, Fallon &

44
Pohlmann, 1996:284; Van Harssel, 1994:3; Goodall, 1988:34; WTO, 1985:9) and
include the following:
• socio-demographic changes, marked by an active but ageing population, later
marriage, two-income families, childless couples and a rising population of
single adults;
• higher incomes, more leisure time and changing lifestyles, indicating
continued expansion in the industry and more demands for tailor-made
tourism packages and experiences (Van Harssel, 1994:3);
• the development of public events, celebrations and entertainment resulting
from such changes (Allen et. al., 2002:8);
• changes in tourism demand towards new types of tourism products which
value the individuality and independence of tourists (Buhalis, 2001:71);
• a new generation of tourists that is better educated, more experienced and
knowledgeable, and demands good quality facilities and services in its travels,
but at good value for money (Buhalis, 2001:71; Goodall, 1988:34);
• the rapid expansion of special interest and adventure tourism, as well as other
specialised forms of tourism, including festivals and events, nature-based or
ecotourism, "roots", regional, health and religious tourism;
• growth in cultural and heritage tourism, with the phenomenon of heritage
tourism predicted to rise as people become more mobile and can reach the
sites of cultural resources (Chang et al., 1996:284);
• a desire to participate or a “preference to live holidays rather than to spend
them” by taking part in activities such as recreation, sports and adventure, and
also by learning more about the history, culture and natural environment of
areas that tourists visit (WTO, 1985:9);
• the growing popularity of ecotourism as a means of justifying and achieving
conservation objectives; especially as more environmentally sensitive tourists
wish to visit well-planned destinations and avoid creating environmental or
social problems;
• more frequent, shorter vacation trips taken throughout the year;

45
• more travelling by older, active retired people, although younger middle-aged
people also still travel in large numbers;
• the continued expansion of business travel, travel as a business incentive, and
travel to attend meetings, conferences and exhibitions (MICE); and
• the growing use of modern technology as an important information and
marketing tool, for example using the Internet for reservation services and
marketing.
These trends or changes contributed to the substantial difference in the tourism and
travel markets between the 1970s and early 1980s and again during the 1990s to
2000s. The changing needs of the travelling public drive the greater product
differentiation in the tourism market (WTO, 1999a:132).
Furthermore, these changing demand patterns have serious implications for
marketing management, as marketing is central to the growth, acceptance and
sustainability of the new tourism products and services (Derrett, 2001:8). The
challenge for public-sector and private-sector tourism planners and management in
countries such as South Africa will be to meet the changing needs of more
sophisticated tourists while using the country's scarce resources responsibly,
preserving traditions and cultures and satisfying these niche markets.
One of these specialised tourism trends has been identified as special interest
tourism (SIT) (Goeldner et al., 2000:689). The growth and proliferation of tourism
products in this niche market is set to provide the tourist of the twenty-first century
with a wide array of travel choices (Swarbrooke & Horner, 1999:146). Since special
interest tourism, like other tourism sectors, is market-driven, marketers should
respond to these specific needs of the target market (Derrett, 2001:8).
Special areas of leisure travel are notoriously difficult to consider, because special
interest tourism “appeals to the human imagination” and that, as an activity, has no
boundaries (Page, 2003:4). New special types of tourism services are continually
46
being added to meet the travel needs of this sector. The origin and different types of
SIT opportunities are discussed in the next section.
2.4 SPECIAL INTEREST TOURISM (SIT)
Tourism stakeholders have noted the dynamic nature of tourism demand in special
needs and the special interests emanating from it. Read (1980:195) observes that
special interest travel will become a “prime force in the expansion of tourism and
would dominate the industry in the next decade and be responsible for an
unprecedented rise in visitor satisfaction”.
Weiler and Hall (1992:5), the pioneers in the field of special interest tourism, define
special interest tourists as “those tourists whose motivation and decision-making are
primarily determined by a particular special interest”. However, the term has different
meanings to different authors. Derrett (cited in Douglas et al., 2001:3) defines special
interest tourists as “the provision of customised leisure and recreational experiences
driven by the specific expressed interests of individuals and groups”. By contrast,
Hughes (2000:60) argues that SIT is defined not as much by type of activity but
rather by interest, motivation and involvement. Special interest tourists will therefore
choose products or services that satisfy particular interests and needs. There is also
an element of fashion and trendsetting or of being “in with the crowd” in their
motivation to participate in this type of tourism.
In spite of the many different opinions, SIT represents some of the faster-growing
areas of tourism. There are many new names given in literature to the services being
offered to participants in “serious” leisure and tourism. SIT is therefore set to provide
tourists with an array of different travel choices, ranging from ecotourism, rural,
adventure, health and educational tourism to regional, cultural, heritage, festival and
event tourism, as shown in Figure 1.1 of Chapter 1. SIT and its various subcategories
are relatively new to academic circles, except for nature-based tourism and
ecotourism, and little research has yet been done on SIT.
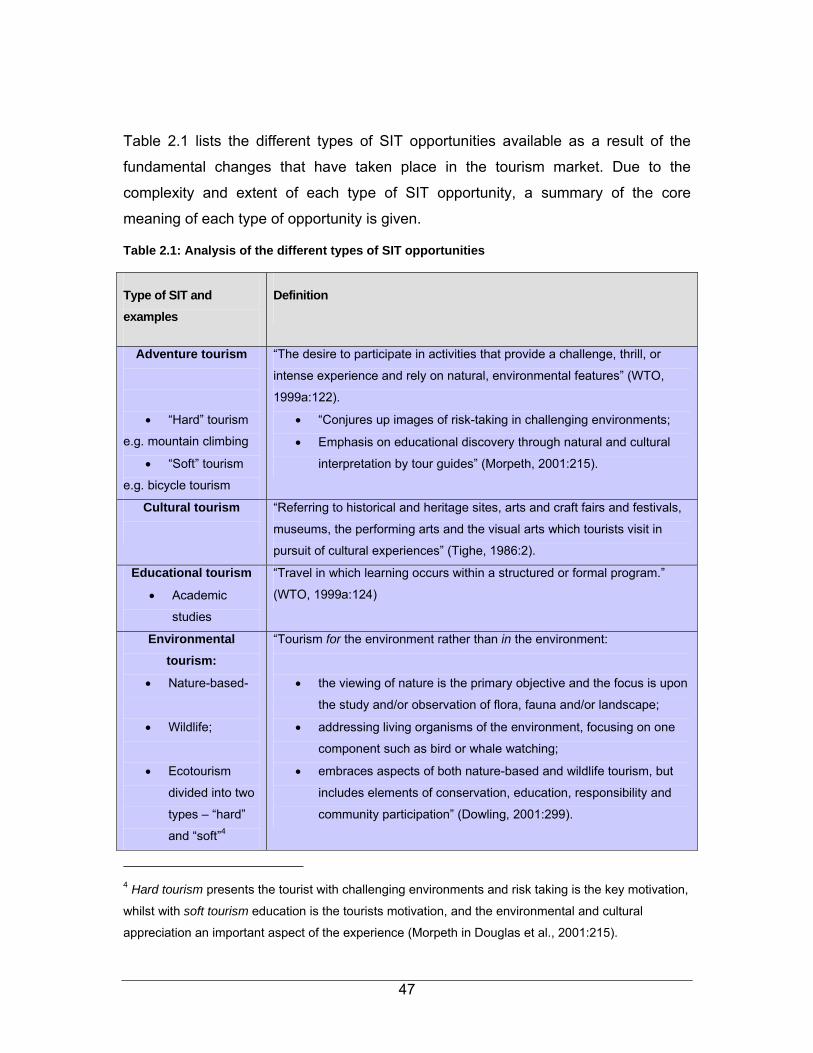
47
Table 2.1 lists the different types of SIT opportunities available as a result of the
fundamental changes that have taken place in the tourism market. Due to the
complexity and extent of each type of SIT opportunity, a summary of the core
meaning of each type of opportunity is given.
Table 2.1: Analysis of the different types of SIT opportunities
Type of SIT and examples
Definition
Adventure tourism
• “Hard” tourism
e.g. mountain climbing
• “Soft” tourism
e.g. bicycle tourism
“The desire to participate in activities that provide a challenge, thrill, or
intense experience and rely on natural, environmental features” (WTO,
1999a:122).
• “Conjures up images of risk-taking in challenging environments;
• Emphasis on educational discovery through natural and cultural
interpretation by tour guides” (Morpeth, 2001:215).
Cultural tourism
“Referring to historical and heritage sites, arts and craft fairs and festivals,
museums, the performing arts and the visual arts which tourists visit in
pursuit of cultural experiences” (Tighe, 1986:2).
Educational tourism
• Academic
studies
“Travel in which learning occurs within a structured or formal program.”
(WTO, 1999a:124)
Environmental tourism:
• Nature-based-
• Wildlife;
• Ecotourism
divided into two
types – “hard”
and “soft”4
“Tourism for the environment rather than in the environment:
• the viewing of nature is the primary objective and the focus is upon
the study and/or observation of flora, fauna and/or landscape;
• addressing living organisms of the environment, focusing on one
component such as bird or whale watching;
• embraces aspects of both nature-based and wildlife tourism, but
includes elements of conservation, education, responsibility and
community participation” (Dowling, 2001:299).
4 Hard tourism presents the tourist with challenging environments and risk taking is the key motivation,
whilst with soft tourism education is the tourists motivation, and the environmental and cultural
appreciation an important aspect of the experience (Morpeth in Douglas et al., 2001:215).

48
Type of SIT and examples
Definition
Festival and event tourism
• Special event
• Mega event
• Hallmark event
• Community
festivals
“That which is different from a normal day of living” (Goldblatt, 2002:6).
“Huge, affects whole economies, reverberates in the global media”
Dimmock & Tiyce, 2001:356).”
“Major one-time or recurring events of limited duration often developed
primarily to enhance awareness, appeal and profitability of a tourism
destination in the short term and/ or long term. Such events rely for their
success on uniqueness, status, or timely significance to create interest and
attract attention” (Ritchie, 1984:2).
“Celebration of something the local community wishes to share” (Dimmock
& Tiyce, 2001:356).
Food and wine tourism
“Food is the visitation to primary and secondary food producers, food
festivals, restaurants and specific locations for which food tasting and/or
experiencing the attributes of a specialist food production region are the
primary motivating factors to travel;
Wine is the visitation to vineyards, wineries, wine festivals and wine shows
for which grape wine tasting and/or experiencing the attributes of a grape
wine region are the prime motivating factors for visitors” (Hall & Mitchell,
2001:308).
Health tourism
• Health, fitness
travel
• Spa tourism
• Reconstructive
surgery
• Medical
treatment
“Travel to facilities and destinations for obtaining health-care services or
health-related benefits” (WTO, 1999:123).
Heritage tourism
• A subset of
cultural tourism
“Movements of persons for essentially cultural motivations such as study
tours, performing arts and cultural tours, travel to festivals and other
cultural events, visits to sites and monuments, travel to study nature,
folklore or art, and pilgrimages” (WTO, 1985:6).
Ocean cruise experience
“A voyage on a ship undertaken wholly for reasons of leisure and
recreation” (Douglas & Douglas; 2001:459)
Regional tourism “Tourism in concentrated tourist areas, coastal resorts, towns and other

49
Type of SIT and examples
Definition
urban settlements, and the countryside, hinterland or coastline outside
capital cities. It does not rely on particular activities or experiences; rather,
its character is determined by the environments in which it takes place”
(Prosser, 2001:89).
Rural tourism
• Farm tourism
“Travel to simpler less developed areas and includes a multitude of forms”
(WTO, 1999a:121).
Senior tourism “Distinctive aspects of tourism in which older tourists have specific needs
and wants” (Ruys & Wei; 2001:459)
Sex tourism
• Gay and lesbian
celebration
• Prostitution
“Travel associated with sex, whether involving intercourse, voyeurism or
observation” (Ryan, 2001:385).
Sports tourism
• Participators
• Spectators
“All forms of active and passive involvement in sporting activity,
participated in casually or in an organized way for non-commercial or
business reasons, that necessitate travel away from home and work
locality” (Weed & Bull, 2004:44).
It is clear that tourists might engage in a number of SIT categories simultaneously.
Getz (cited in Uysal, Gahan & Martin, 1993:5) notes that festivals and events are
becoming increasingly popular as a form of SIT. Allen et al. (2002) argue that festival
and event tourism should be seen as catalysts for attracting visitors and increasing
their average expenditure and length of stay. These authors add that festivals and
events are also seen as image-makers, creating a profile for destinations, positioning
them in the market and providing a competitive marketing advantage. This category
is associated with the content of the thesis and is discussed in Section 2.5.
Furthermore, festivals and events tourism is distinguished from the remaining items
on the list. The reasons for this distinction include the following:
• festivals and events are an important part of the tourism industry (Goeldner et
al., 2000:234);
• festivals and events have become more important in recent years to countries
and their economies (O’Toole, 2005:215);
50
• academic interest in and research on festivals and events have grown
considerably in the past 15 years (Kim et al., 2002:127; Shifflet & Bhata,
1999:26; Schneider & Backman, 1996:139);
• previous research by Van Zyl (2002:159) revealed that limited research has
been done in the area of festivals and events in South Africa, particularly with
regard to the marketing of festivals;
• secondary literature in South Africa indicates that, although research has been
done among other things on nature-based tourism and more specifically
ecotourism (Cousins & Kepe, 2004; Tapela, 2001; Mosidi, 1996), and there is
some research on sports tourism (Marx, 2003; Saayman & Uys, 2003; Herbst
& Schreuder; 1999), the area of festivals and events has been largely
neglected. Apart from various economic impact studies on arts festivals and
some relating to the artistical content (Saayman & Saayman, 2004; Snowball
& Antrobus, 2002; Van Heerden, 2002; Van Zyl, 2002; Witepski, 2002;
Snowball & Antrobus, 2001; Silva, 1998; Williams, 1997) little research has
been done on the marketing and positioning of arts festivals; and
• festivals and events are identified as one of the fastest-growing forms of
leisure and are a tourism-related phenomenon globally (Lee et al., 2004:62;
Derret, 2000:120). Tassiopoulos (2005:4) identifies the festivals and events
industry in South Africa as “young and dynamic”, and as growing and maturing
rapidly with a great deal growth potential.
The above clearly indicates the need for formal and scientific research that would
enable the field of SIT to grow to its full potential in the South African market. Getz
(1997) argues that festivals and events are some of the most common forms of
cultural celebration and, although many of these festivals and events are traditional
with long histories, the majority has only come into existence in recent decades.
Shone and Parry (2004:2) add that festivals and events have long played an
important role in human society, as there have always been reasons for festivity
where people can come together in celebrating, demonstrating, worshipping,
honouring, remembering and socialising.
51
The variety and range of festivals and events are astonishing, from big internationally
organised sports spectaculars, such as the Olympic Games, to parades and trade
fairs and even to the family ceremony for christening the new baby next door (Shone
& Parry, 2004:3). As it is sometimes difficult to grasp the full extent of these festival
and event activities, their variety, their role and how they operate, some kind of
definition and a means of classification are clearly necessary.
2.5 FESTIVALS AND EVENTS
2.5.1 Introduction
Festivals and events have become strong demand generators that play a significant
role, and which make a considerable contribution to the tourism industry of a country
(Arcodia & Robb, 2000:154). This sector of the tourism industry has been identified
globally as well as in South Africa as having growth potential (Tassiopoulos, 2005:25;
Goldblatt, 2000:9). Tourism stakeholders are increasingly turning to this growth
industry, which is capable of delivering economic benefits to their region and country.
The terms festivals and events can be quite confusing as literature implies a similarity
between the two. This can be attributed to the relatively young nature of the
emerging industry and the limited literature available in the field (Arcodia & Robb,
2000:155). Adding to this confusion, most of the literature sources available describe
international research. In addition, the terms used in current literature have not
always been standardised, making it difficult to translate them to the South African
scene. It may be appropriate at this point to clear up some of the confusion by
illustrating the use of these two terms. Figure 2.1 demonstrates the meaning of the
two terms, festivals and events by categorising the salient aspects.
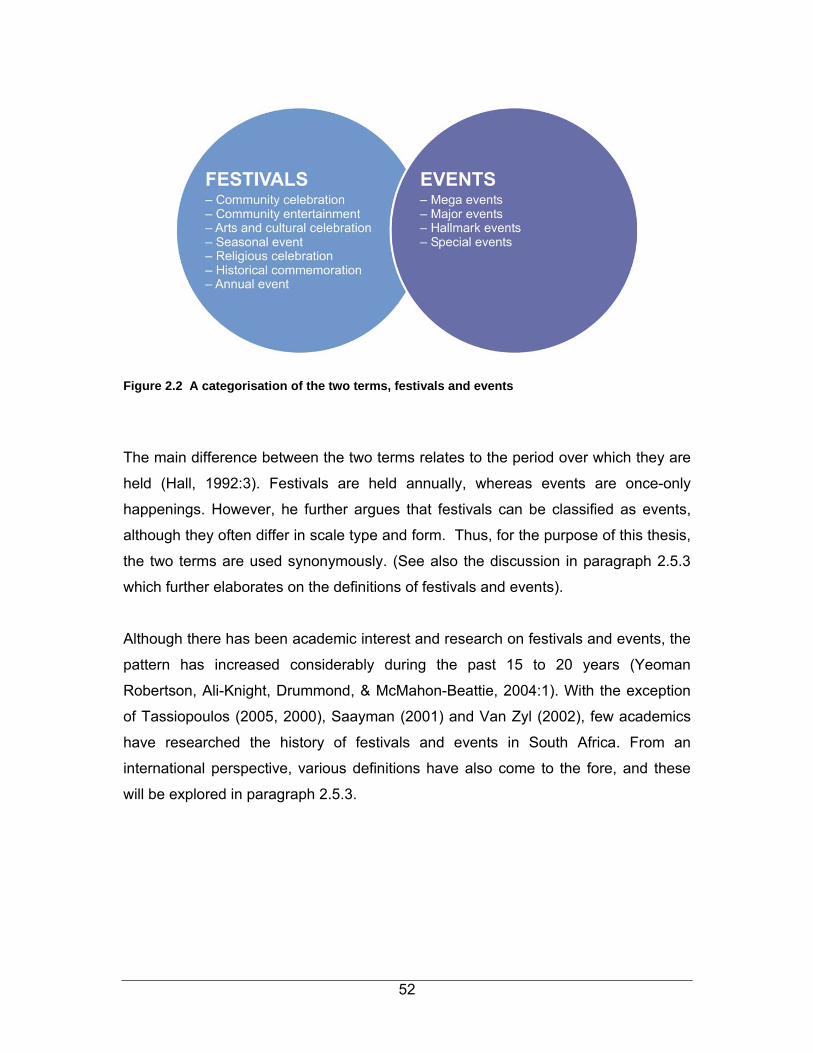
52
Figure 2.2 A categorisation of the two terms, festivals and events
The main difference between the two terms relates to the period over which they are
held (Hall, 1992:3). Festivals are held annually, whereas events are once-only
happenings. However, he further argues that festivals can be classified as events,
although they often differ in scale type and form. Thus, for the purpose of this thesis,
the two terms are used synonymously. (See also the discussion in paragraph 2.5.3
which further elaborates on the definitions of festivals and events).
Although there has been academic interest and research on festivals and events, the
pattern has increased considerably during the past 15 to 20 years (Yeoman
Robertson, Ali-Knight, Drummond, & McMahon-Beattie, 2004:1). With the exception
of Tassiopoulos (2005, 2000), Saayman (2001) and Van Zyl (2002), few academics
have researched the history of festivals and events in South Africa. From an
international perspective, various definitions have also come to the fore, and these
will be explored in paragraph 2.5.3.
53
2.5.2 History of festivals and events
Since the dawn of history, festivals and events have been important features of
people’s lives. Festivals and events evolved as celebrations to mark high points in
the Christian calendar, saints’ days and the like (Allen et al., 2002:5). The origins of
the very first festival and the father of all festivals are outlined in the next paragraph.
Handel (whose centenary was commemorated in 1784) might be regarded as the
father of all arts festivals as no other composer ever stimulated so much musical
homage and devotion (Schofield, 1995:7). The Three Choirs event (1713) is hailed
as the first arts festival, was established nearly two centuries ago (Hughes, 2000:89).
Schofield (1995:7) notes that in 1769 the town of Stratford-on-Avon marked the
bicentennial of Shakespeare’s birth with a festival for which Thomas Arne composed
special music. However, the majority of music festivals have been held since the
1960s, when the Woodstock Festival was one of the best-known. Globally, the
festival and event industry emerged during the 1980s and 1990s (Bowdin et al.,
2001:9).
From a local perspective, the South African festival and event culture originated with
the commemoration of the arrival of the 1820 British Settlers in Grahamstown, and
had very modest beginnings in 1974. Only this one festival became well established
during the 1980s (Silva, 1998:1). Secondary research found that the majority of
South African festivals and events became established later, during the late 1990s,
and began peaking from 2000 onwards.
It is clear that some form of definition and classification is essential, because festivals
and events differ enormously in scale, type and form.
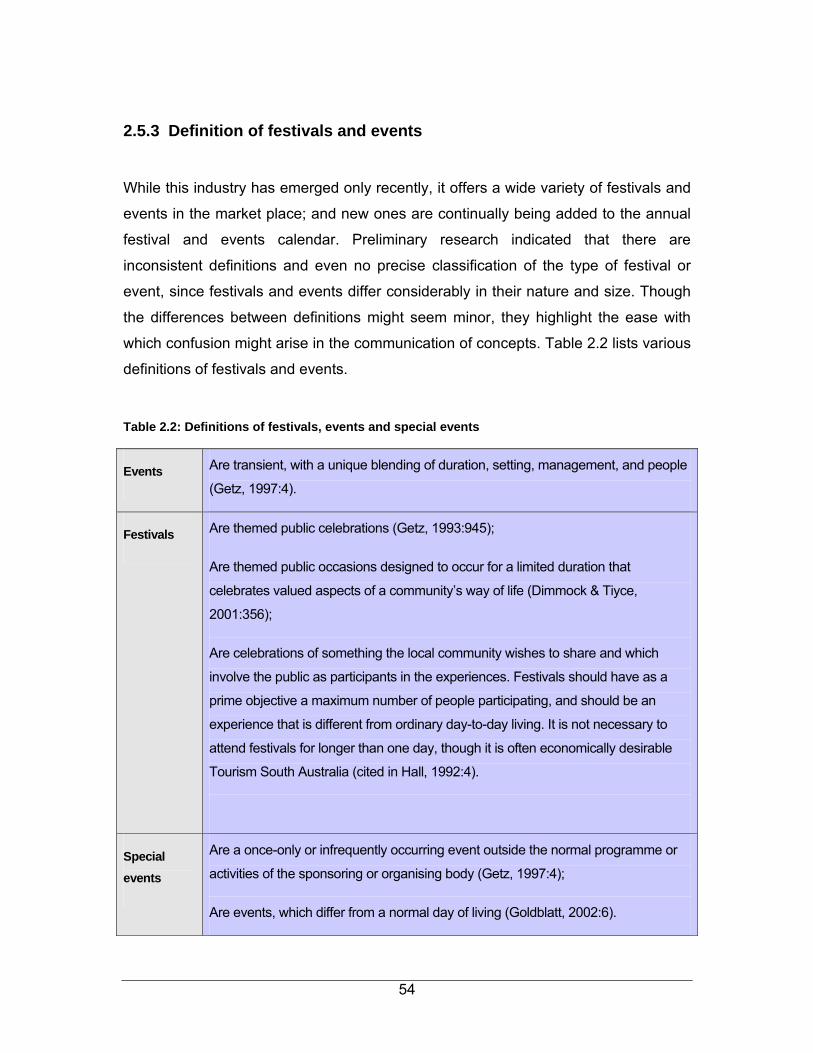
54
2.5.3 Definition of festivals and events
While this industry has emerged only recently, it offers a wide variety of festivals and
events in the market place; and new ones are continually being added to the annual
festival and events calendar. Preliminary research indicated that there are
inconsistent definitions and even no precise classification of the type of festival or
event, since festivals and events differ considerably in their nature and size. Though
the differences between definitions might seem minor, they highlight the ease with
which confusion might arise in the communication of concepts. Table 2.2 lists various
definitions of festivals and events.
Table 2.2: Definitions of festivals, events and special events
Events Are transient, with a unique blending of duration, setting, management, and people
(Getz, 1997:4).
Festivals Are themed public celebrations (Getz, 1993:945);
Are themed public occasions designed to occur for a limited duration that
celebrates valued aspects of a community’s way of life (Dimmock & Tiyce,
2001:356);
Are celebrations of something the local community wishes to share and which
involve the public as participants in the experiences. Festivals should have as a
prime objective a maximum number of people participating, and should be an
experience that is different from ordinary day-to-day living. It is not necessary to
attend festivals for longer than one day, though it is often economically desirable
Tourism South Australia (cited in Hall, 1992:4).
Special events
Are a once-only or infrequently occurring event outside the normal programme or
activities of the sponsoring or organising body (Getz, 1997:4);
Are events, which differ from a normal day of living (Goldblatt, 2002:6).

55
It is clear that a key characteristic of festivals, which distinguishes them from other
events, is that the occurrence has a clearer focus on community and celebration.
Although there are various definitions in literature, most definitions of festivals include
the following elements:
• the word festival calls to mind images of fun, festivity, families, laughter, being
out together, and generally celebrating something;
• the celebration may involve a display of fine art and entertainment, bringing
people together to honour the work of an individual;
• whatever the theme, the object of celebration is a central element;
• it may involve a time of year, an annual occurrence, a special occasion, the
start or end of a particular thing, the showcasing of an asset, or anything else;
• festivals and events involve the principle of limited duration, so that people
know and expect such celebrations to end within a certain limited time frame;
they are therefore not continuous;
• these events may differ in size, volume and impact, and the rationale for
hosting them might differ widely; and
• festivals and events have a particular concentration of activities over a short
period of time.
Getz (1997:6) notes that the universe of festivals and events is so diverse that any
classification is bound to be incomplete. An attempt is made in the next section to
provide a classification or categorisation of particular types of festivals and events.
2.5.4 Classification of festivals and events
Various authors (Allen et al., 2002:17; Dimmock & Tiyce, 2001:356; Arcodia & Robb,
2000:155; Getz, 2000d:210; Getz, 1997:4; Hall, 1992:4) note the complexity of
festivals and events and attempt to classify them in categories, though categorisation
might limit the interrelationships that exist between certain categories of festivals and
events.
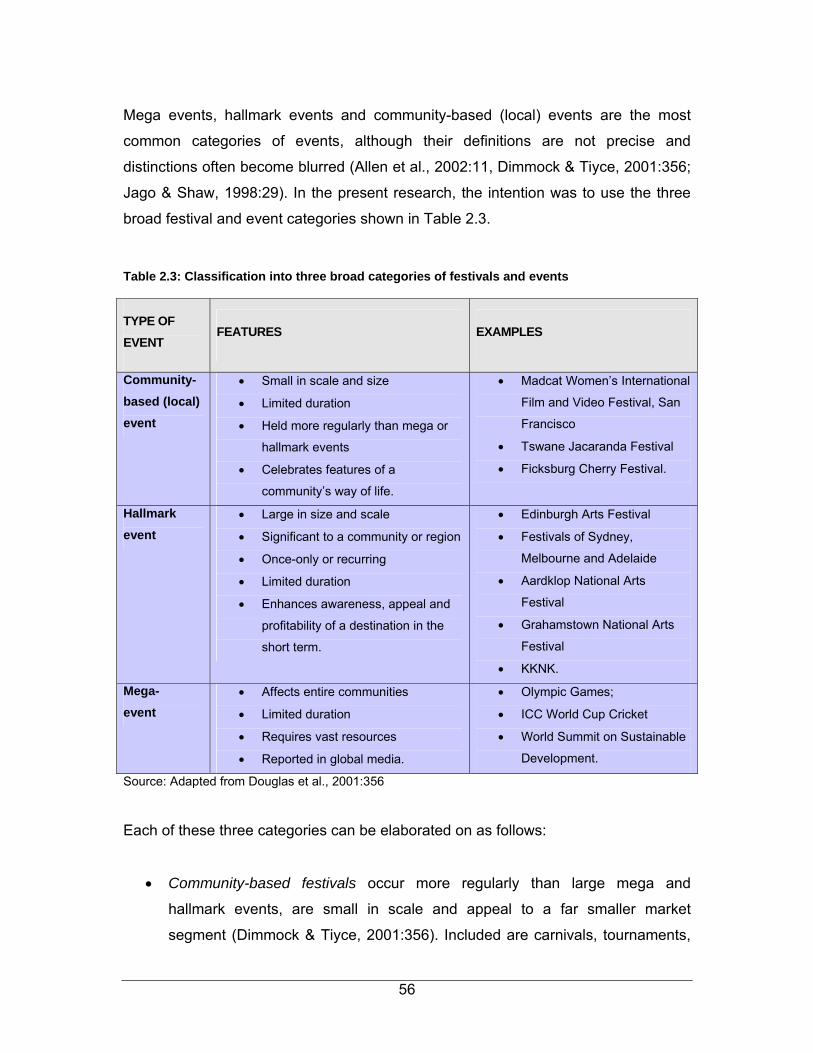
56
Mega events, hallmark events and community-based (local) events are the most
common categories of events, although their definitions are not precise and
distinctions often become blurred (Allen et al., 2002:11, Dimmock & Tiyce, 2001:356;
Jago & Shaw, 1998:29). In the present research, the intention was to use the three
broad festival and event categories shown in Table 2.3.
Table 2.3: Classification into three broad categories of festivals and events
TYPE OF EVENT
FEATURES EXAMPLES
Community-based (local) event
• Small in scale and size
• Limited duration
• Held more regularly than mega or
hallmark events
• Celebrates features of a
community’s way of life.
• Madcat Women’s International
Film and Video Festival, San
Francisco
• Tswane Jacaranda Festival
• Ficksburg Cherry Festival.
Hallmark event
• Large in size and scale
• Significant to a community or region
• Once-only or recurring
• Limited duration
• Enhances awareness, appeal and
profitability of a destination in the
short term.
• Edinburgh Arts Festival
• Festivals of Sydney,
Melbourne and Adelaide
• Aardklop National Arts
Festival
• Grahamstown National Arts
Festival
• KKNK.
Mega- event
• Affects entire communities
• Limited duration
• Requires vast resources
• Reported in global media.
• Olympic Games;
• ICC World Cup Cricket
• World Summit on Sustainable
Development.
Source: Adapted from Douglas et al., 2001:356
Each of these three categories can be elaborated on as follows:
• Community-based festivals occur more regularly than large mega and
hallmark events, are small in scale and appeal to a far smaller market
segment (Dimmock & Tiyce, 2001:356). Included are carnivals, tournaments,

57
contests, competitions, exhibitions, fetes, fiestas or shows, which originated in
a sector of the community with a need or desire to celebrate features of its
way of life or history. Festivals may be topic-specific, such as arts or music
festivals, and may include various types of leisure activities combined with
other cultural activities (Mihalik & Ferguson, 1994:75). The event may be held
annually to coincide with a crop harvest or floral bloom, such as the Rose
Festival in Bloemfontein, South Africa.
• Hallmark events recur at intervals and have such significance, in terms of
tradition, attractiveness, image or publicity, that the event gives the host
venue, community, or destination a competitive advantage (Getz, 1997:5). A
hallmark is a symbol of quality or authenticity, which distinguishes goods or
pertains to a distinctive feature (Getz, 2000d:210). The term hallmark event
cannot be confined solely to large-scale events held in cities. Community-
based festivals can also be described as hallmark events in relation to their
regional, local and cultural significance (Hall, 1992:4). As festivals constitute a
wide variety of activities including art, entertainment, music, sports and
recreation, the Aardklop National Arts Festival is classified as a hallmark event
on the basis of the above description (Van Zyl, 2002:24). However, the
concept of a hallmark event is sometimes used when describing an event that
often has a variety of connotations (Getz, 1997:5).
• Mega-events are so huge that they have the potential to affect whole
economies and reverberate in the global media (McDonnell, Allen, O’Toole,
1999:11). Therefore, these events can be defined as events that yield
extraordinarily high levels of tourism, media coverage, prestige or economic
impact for the host community or destination (Getz, 2000d:210). Examples
from an international perspective are the Olympic Games and World Fairs,
whereas locally South Africa’s first mega events have been the World Cup
Rugby (1995) and the ICC World Cup Cricket (2003). A future mega event will
be the World Cup Soccer to be held in 2010 in South Africa.

58
As festivals and events also play a significant role and make a considerable
economic contribution to the tourism industry in South Africa, there is a need for
standardised terminology. Defining and classifying become even more significant
when measuring the economic impact associated with festivals (Arcodia & Robb,
2000:155). It is well known that it may become extremely difficult to measure such an
economic impact as it is difficult to distinguish between local and visitor spending,
and this inability might obscure the value of the festival industry’s contribution to the
economy (Arcodia & Robb, 2000:155). Although Tassiopoulos (2005:11) defines
festivals and events in South Africa, he also manages to suggest a structure but does
not spell out the relationships between the various kinds of events.
The intention with the current research was to explore the concept of festivals and
events further and to design a categorisation system to accommodate the more than
85 festivals and events in South Africa.
These festivals are a celebration of South African folk spirit and should continue to
stimulate tourism and growth in this sector of the economy (Witepski, 2002:52). The
categorisation of the overcrowded festival calendar in South Africa is derived from
the system used by Wilson and Udall (1982:3). These authors based their
categorisation on six broad categories: namely sacred, harvest and food, festive
subgroup gatherings, regional and local folk art festivals and special activity festivals.
For the purposes of this study, the types of festivals in South Africa have been
classified into the following seven broad categories:
• arts festivals;
• dance, jazz and music festivals;
• heritage and culture festivals;
• harvest and food festivals,
• sacred, language and religious festivals;
• shows, fairs and festivals; and
• sports events.

59
Table 2.4 lists the definitions and themes on which the classification for South Africa
is based, with some examples to illustrate each category.
Table 2.4: Festival categories, definition and themes of the South Africa festival and events calendar
Festival category
Definition and theme Examples in South Africa
Arts festivals Celebrate an art form focusing on
the aesthetic, visual and theatrical
appeal of the arts.
Aardklop, KKNK, Grahamstown Festival
Dance, jazz, music festivals
Celebrate specifically dance or
music performance in any of these
speciality fields.
North Sea Jazz, FNB Dance Umbrella, National
Choir Festival
Heritage and culture festivals
Celebration is based on nostalgia
about the past or cultural traditions
inherited from the past.
North-West Cultural Calabash Festival, Tulbagh
Goes Dutch Festival
Harvest and food festivals
Celebrate the crop or harvest from a
specific agricultural area.
Cherry, Potato and Bieliemealie Festivals
Sacred, language, religious festivals
Celebration of a language or a
particular religion, holiday, sacred
sites. Most festivals originally
originated from this category.
Afrikaans Word Festival, Zionist Church
Gathering, Fire-Walking Festival
Shows, fairs, festivals
Contain either of these categories in
the name and do not belong to or fit
into the other popular categories.
Hermanus Whale Festival, Wildflower Show,
Darling
Sports events Celebration of the most popular
South Africa sports activities.
Rugby/Cricket Currie Cup finals, Comrades
Marathon,
J & B Metropolitan (horseracing).

60
At times it may be difficult to distinguish between the categories, as it is not always
clear whether a festival is categorised for example as an arts festival or a dance, jazz
and music festival. Nevertheless, the importance attached to arts festivals in the
South African context (as identified in the problem statement) indicates the urgent
need to do research on this category (Van Zyl, 2003). The following reasons played a
role in the selection of the arts festivals to be researched in this study:
• the exponential growth of arts festivals in South Africa;
• the economic impact that arts festivals have on the host region;
• the lack of marketing research on this category in South Africa;
• the stage of maturity of some South African arts festivals;
• the threat to the sustainability of arts festivals in South Africa;
• the South African government now consider the arts as so important that the
broader public should have access to arts festivals (Government Gazette of
South Africa, 2001:4);
• stimulating tourism as part of the reason for the growth in the number of arts
festivals (Hughes, 2000:95); and
• the changes in society, as mirrored in the changes in the style of public
events, such as civic and arts festivals (Allen et al., 2002:17).
The above clearly show that arts festivals are a topic meriting further research.
Section 2.5.5 below addresses the definitions, the reasons for establishing arts
festivals and for people participating in these festivals, the composition of arts festival
audiences as well as the advantages and disadvantages associated with arts festival
tourism.
2.5.5 Arts festivals
2.5.5.1 Introduction
Arts festivals can be regarded as a new form of tourism with the potential to create
economic prosperity and development nationally and internationally in cities, towns
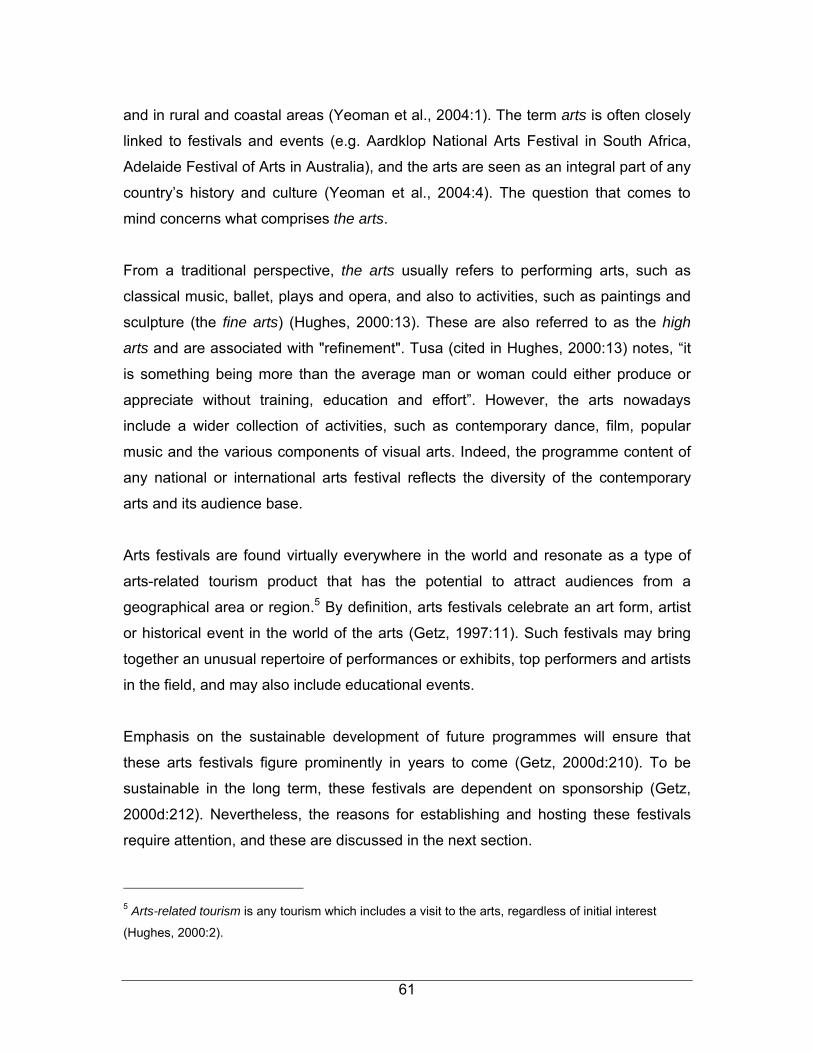
61
and in rural and coastal areas (Yeoman et al., 2004:1). The term arts is often closely
linked to festivals and events (e.g. Aardklop National Arts Festival in South Africa,
Adelaide Festival of Arts in Australia), and the arts are seen as an integral part of any
country’s history and culture (Yeoman et al., 2004:4). The question that comes to
mind concerns what comprises the arts.
From a traditional perspective, the arts usually refers to performing arts, such as
classical music, ballet, plays and opera, and also to activities, such as paintings and
sculpture (the fine arts) (Hughes, 2000:13). These are also referred to as the high
arts and are associated with "refinement". Tusa (cited in Hughes, 2000:13) notes, “it
is something being more than the average man or woman could either produce or
appreciate without training, education and effort”. However, the arts nowadays
include a wider collection of activities, such as contemporary dance, film, popular
music and the various components of visual arts. Indeed, the programme content of
any national or international arts festival reflects the diversity of the contemporary
arts and its audience base.
Arts festivals are found virtually everywhere in the world and resonate as a type of
arts-related tourism product that has the potential to attract audiences from a
geographical area or region.5 By definition, arts festivals celebrate an art form, artist
or historical event in the world of the arts (Getz, 1997:11). Such festivals may bring
together an unusual repertoire of performances or exhibits, top performers and artists
in the field, and may also include educational events.
Emphasis on the sustainable development of future programmes will ensure that
these arts festivals figure prominently in years to come (Getz, 2000d:210). To be
sustainable in the long term, these festivals are dependent on sponsorship (Getz,
2000d:212). Nevertheless, the reasons for establishing and hosting these festivals
require attention, and these are discussed in the next section.
5 Arts-related tourism is any tourism which includes a visit to the arts, regardless of initial interest
(Hughes, 2000:2).

62
2.5.5.2 Reasons for establishing arts festivals
The reasons (aims and objectives) for establishing arts festivals are crucial and need
to be highlighted as they affect many aspects of the event, including marketing and
sponsorship (Salem, Jones & Morgan, 2004:16). Getz (1997:1) notes that arts
festivals have different operating costs and might fall into either the not-for-profit or
the profit-making categories.
Arts festivals reflect almost unlimited diversity in the form and types of arts featured
and there are many different reasons or aims for holding these festivals.
The main reason or objective may be identical to that of the festival organiser whose
focus as a non-profit organization is on the survival of the arts, but will at least
complement the festival's aims and will have a key role in achieving them (Watt,
1998:11). Salem et al., (2004:16) argue that the reasons for establishing festivals
may fall into one of three main categories:
• the economic reasons may be direct or indirect, e.g. marketing a particular
product or area;
• social and cultural reasons may focus on encouraging local participation to
increase awareness of a venue, occasion, tradition or socio-cultural value;
increase civic pride; heighten an area’s profile; satisfy the needs of special
interest groups or conserve local heritage; and
• there may be political reasons, e.g. in cases where arts festivals become
"policy tools" for promoting cultural development, etc.
The above reasons emphasise further that most festivals have economic aims,
although these may not be the main reason and may at most only be to break even.
Therefore, the purposes of arts festivals vary and there are many tangible and
intangible reasons why communities host festivals and events (Backman, Backman,
Uysal, & Sunshine, 1995:15). Table 2.5 summarises the various reasons for holding
arts festivals.

63
Table 2.5: Reasons or aims for holding arts festivals
Getz (1993:11); Getz & Frisby (1989:7)
Making it happen: the cultural and entertainment industries handbook (1997:152)
Hughes (2000:90)
For agriculture To showcase a local industry or
product
For arts To celebrate a particular art or
sporting form or a mixture of
same
For community
celebration and cultural
identity
To celebrate local talent and
provide a "party" for a localised
community
An “artistic vision” such as a desire to
celebrate, promote awareness of and
increase an understanding of a particular art
form or culture
For culture and
education (Mayfield &
Crompton, 1995:14;
Dunstan, 1994:1)
To expose local people to
national or international artists or
sportspeople
The drive to establish an arts festival may
come from enthusiasts across the country,
who wish to come together to share a
common interest
For natural resources To highlight the natural and
human-made assets of an area
For recreation or
socialisation
To focus on cultural tourism
issues.
The tourism potential that an arts festival
provides has been an important consideration
for developing many of the more recent
festivals
For tourism To highlight the location of or
recent changes to an area
Making money is one
overt reason for both
external and internal
revenue generation
To increase tourism to an area
and generate economic impact
A desire to enable local residents of smaller
towns to attend arts festivals, since residents
of such towns may have few cultural
opportunities

64
The above summary clearly indicates that some festivals have an entertainment and
educational approach, which could be used to bring different communities together,
whereas other festivals may be used to enhance the economy of a region. The
bottom line is that, by their very nature, arts festivals are held for communities in
communities with different aims, for example, a festival may be held to celebrate the
culture and language of a particular region.
However, Hughes (2000:91) remarks that “this togetherness of people is the essence
of a festival, that is, a relatively large number of artists and performances together in
one place, over a concentrated period of time”. Figure 2.2 indicates the features of
arts festivals that attract tourists.
65
Figure 2.3: Arts festivals: features that attract tourists (adapted from Hughes, 2000:90).
Going to arts festivals is a leisure activity in which many people indulge; however not
all of them participate in the arts festival activities. Irrespective of the reason for
holding arts festivals, a wide range of audiences is involved, each with its own
different expectations, and this has a direct effect on the management process that
should be considered for each festival (Yeoman et al., 2004:1).
66
The challenge to the management of arts festivals is to complement the environment
in which the festival takes place and to have regard for diminishing resources and
also for the more discerning and sophisticated taste of arts festival audiences.
The audience is a core component because without it no arts festival can be held
(Van der Wagen, 2001:53). The arts festival audience has significant implications for
marketing and positioning strategies, as festivals are held in a semi-competitive
market (Watt, 2001:66). The key to the marketing concept is a focus on the customer
in the audience. This implies that good marketing should flow from a complete
understanding of who the members of the audience are, where they live and what
their needs are (Allen et al., 2002:192). The composition and characteristics of the
arts festival audience are discussed in the next section.
2.5.5.3 The arts festival audience
Identifying the potential audience of an arts festival remains a vital aspect of
marketing. Without an audience to whom the festival can be promoted, all the efforts
of the management and organisers will be futile. Old or young, rich or poor, arts or
music supporters, the target audience should be quite clear and the arts festival
should be planned to suit their specific needs. Getz (1997:251) warns that "many
events suffer from a 'product orientation' – that is, they try to sell their event with little
or no regard for what potential customers need, want, and will pay for". Figure 2.4
illustrates the composition of the arts festival audience.

67
Figure 2.4: The composition of the arts festival audience
The potential arts festival audience may be anywhere in the country or the world, and
is unlikely to be concentrated in one particular place. It may be appropriate to target
particular categories of people and/or particular parts of the country or world. Proper
market research can identify who and where the potential audiences are so that the
marketing and positioning effort can be directed strategically (Van der Wagen,
2001:53; Watt, 2001:64).
The composition of the arts festival audiences or the catchment areas of the people
consist of a local market (nearby and concentrated) and a non-local market (distant
and dispersed) (Hughes, 2000:103). The local market consists of day visitors or
excursionists and local residents mainly low involved tourists, whereas the non-local
market consists mainly of highly involved tourists.
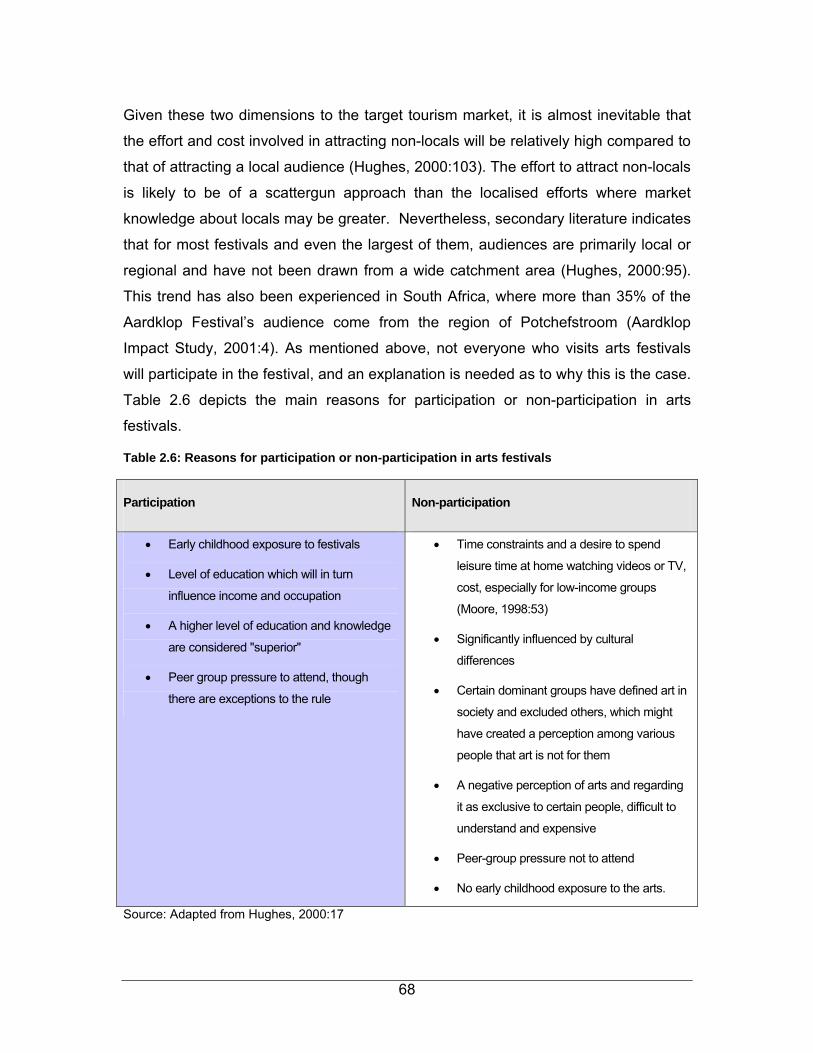
68
Given these two dimensions to the target tourism market, it is almost inevitable that
the effort and cost involved in attracting non-locals will be relatively high compared to
that of attracting a local audience (Hughes, 2000:103). The effort to attract non-locals
is likely to be of a scattergun approach than the localised efforts where market
knowledge about locals may be greater. Nevertheless, secondary literature indicates
that for most festivals and even the largest of them, audiences are primarily local or
regional and have not been drawn from a wide catchment area (Hughes, 2000:95).
This trend has also been experienced in South Africa, where more than 35% of the
Aardklop Festival’s audience come from the region of Potchefstroom (Aardklop
Impact Study, 2001:4). As mentioned above, not everyone who visits arts festivals
will participate in the festival, and an explanation is needed as to why this is the case.
Table 2.6 depicts the main reasons for participation or non-participation in arts
festivals.
Table 2.6: Reasons for participation or non-participation in arts festivals
Participation Non-participation
• Early childhood exposure to festivals
• Level of education which will in turn
influence income and occupation
• A higher level of education and knowledge
are considered "superior"
• Peer group pressure to attend, though
there are exceptions to the rule
• Time constraints and a desire to spend
leisure time at home watching videos or TV,
cost, especially for low-income groups
(Moore, 1998:53)
• Significantly influenced by cultural
differences
• Certain dominant groups have defined art in
society and excluded others, which might
have created a perception among various
people that art is not for them
• A negative perception of arts and regarding
it as exclusive to certain people, difficult to
understand and expensive
• Peer-group pressure not to attend
• No early childhood exposure to the arts.
Source: Adapted from Hughes, 2000:17

69
Table 2.6 clearly indicates that participation is triggered by certain external factors,
such as socio-economic background. The participation rates can be summarised as
being highest among:
• people who are relatively well-off,
• had previous exposure to arts or festivals,
• well-educated, and
• in the older age groups.
These criteria were also used in the judgemental sampling process to include only
the Living Standards Measure (LSM) groups 6, 7, 8, 9 and 10, but most of the
sample were mainly in LSM groups 7 to 10 (Martins, 1998:40).
According to the 1997 Survey of Public Participation in the Arts in the United States
of America (National Endowment for Arts, 1999:6) the following profile of arts festival
attendees can be depicted:
• the older age groups (between 45 and 54 years) prefer classical music, opera,
plays (musical) and ballet;
• the younger 18 to 24 age group prefers non-musical plays, jazz and other
dances;
• there is a definite relation between education and arts participation: those who
attended graduate school had the highest attendance rates for every arts
activity; and
• in terms of race and ethnicity, the highest participation rates were among
whites with the exception of the categories for jazz and other dance
performances.
Based on previous research this pattern of participation shows some similarity to
South Africa (Saayman & Saayman, 2004:634; Van Zyl, 2002:86). As a result, the
distribution of people participating in the arts does not usually match the
demographics of the general population (Hughes, 2000:16).

70
Furthermore, it may be of interest and of use for management to know where these
audiences come from and who they are so that the marketing and positioning activity
can be focused accordingly.
Although it is clear who the members of the arts festival audience could be and
where they come from, insight into the advantages and disadvantages of arts
festivals might provide valuable information for ensuring the long-term sustainability
and success of arts festivals. This is discussed in the next section.
2.5.5.4 The advantages and disadvantages of arts festivals
Arts festivals have strong drawing power and can attract large numbers of locals and
non-locals in the festival audiences (Hughes, 2000:78; Getz, 1997:44). Hughes
(2000:92) notes that greater awareness of the arts can be created through arts
festivals than through an ongoing arts or entertainment programme in a theatre, and
a larger number of people may recognise arts festivals than theatre programmes.
The main need for arts festivals is therefore to reach the widest possible audience
and to succeed in attracting locals and non-locals in the audience. Although this
indicates some of the advantages, the possible disadvantages should also be listed.
The advantages and disadvantages of arts festival tourism are outlined in Table 2.7.

71
Table 2.7: The advantages and disadvantages of arts festival tourism
Advantages Disadvantages
Spending by tourists (less and highly involved) in the
audience contributes to an additional flow of money
into the host region
In some cases, festival tourists have no economic
impact on the host region. They may have visited
anyway and others may have brought forward their
visit. In such cases, the festival brings no real
benefit
The festival may also create good publicity and a good
image for the area, with two possible effects:
• tourists at non-festival times; and
• other non-related businesses are encouraged
to locate in the area (inward investment)
Some regular visitors to the area may have been
deterred from coming because of the event, so the
festival tourists would therefore only replace them,
with little or no addition to overall numbers
Arts festivals held in the community establish a strong
sense of community pride and provide an opportunity
for all to attend, which might otherwise not have been
possible
There may be fewer tourists than anticipated at
festivals, partly because of people’s constraints
and beliefs that the festival would be overcrowded
or that they would be unable to obtain tickets or
book accommodation. The very popularity of a
festival may be counter-productive
Arts festivals hold strong elements of educating arts
and culture to previously excluded groups
Arts festivals may easily lose their unique appeal,
leading to a decline in attendance
Usually started by volunteers, are service-oriented
and on non-profit principles.
As it is difficult to do market research during
festivals, this leads to insufficient data on the
requirements of attendees
No barriers exist to entry into the field at present;
anyone can start a similar festival;
Attendees do not always have a responsible
attitude to the environment where the festival is
held
Festivals are likely to raise greater ongoing awareness
of the arts and confirm a sense of belonging to a
social group
Lack of quality in the production and management
of arts festivals
Festivals encourage audiences from a wide The positive impact of arts festivals seems to be

72
Advantages Disadvantages
catchment area, in the local as well as the non-local
market
short-lived
Word-of-mouth recommendation of festivals is still one
of the best marketing tools and is cheaper than other
tools
Certain productions are likely to be characterised
by high prices and this cost may deter the
audience from attending these
Create a “refinement” of the nation as the arts are now
available through festivals to a wider group of people
Some people might regard arts festivals as being
only for the well educated and wealthy sections of
society, thus excluding others
Tickets for performances are less expensive at arts
festivals than in city theatres and halls
Difficult to market arts festivals in the long term as
the nature of performances and audience might
change
Participation by all cultural groups of society is a
priority in sponsorships
Poor productions at festivals draw smaller
audiences, so there is less income to improve the
productions, causing a vicious circle
Live performances at festival can be more satisfying
than other aspects of popular culture at home such as
computer games, TV, recorded music.
Most spending by locals on tickets and associated
services adds little to the economic contribution
and may only be diverted from spending on other
local goods and services. It is merely local money
being recirculated unless it can be shown that the
locals would have spent that money outside the
area.
Source: Hughes (2000:93) and Getz (1997:16).
It is clear that cases of poor performances at arts festivals and negative media
publicity will have a negative impact on people's future attendance of arts festivals.
Such cases might result in less revenue, in turn endangering the future of the arts
festival (Hughes, 2000:96). The arts festivals might find that they are in a vicious
circle and should combat such a situation at all costs. Table 2.7 indicates why arts
festivals will continue while there is a demand for them.

73
Arts festivals have the power to help promote a destination and to attract tourists
(Robinson, Picard & Long, 2004:187). These might also include reasons for
establishing the arts festivals in South Africa.
2.5.6 South African arts festivals
The South African festival and events calendar has no shortage of arts festivals. The
phenomenon has grown exponentially since 1994 which marked the end of the
apartheid era (Hauptfleisch, 2001:169). Arts festivals, both globally and in South
Africa, have become a favourite way of experiencing and celebrating a country's
culture and heritage. These festivals serve the interests of special interest tourism
while also making the arts and culture available to some infrequently visited regions
of the country (Kakaza, 2000:6). The reasons for the proliferation of festivals in South
Africa are manifold and complex, but the collapse of the old, focused and wealthy
state-funded subsidy system for the performing arts, the disappearance of the
"struggle" support for anti-apartheid theatre and the rise of a predominantly freelance
theatre industry have been important (Hauptfleisch, 2001:169).
Although some of the characteristics of each arts festival are unique, others show
similarities. Tourists often seek out these festivals for an authentic cultural
experience (Getz, 2000d:226). The question arises whether the three selected and
prominent South African arts festivals would survive in a fast-changing market such
as leisure tourism. The answer might lie in marketing, which is widely regarded as a
core business function concerned with matching the needs, wants and interests of its
target market (Laws, 2002:4).
The value of sound marketing principles and effective positioning can therefore never
be underestimated, and the trends in and future impacts on the festival and event
sector should be acknowledged. Arts festival managers should therefore keep up
with the latest trends and market their event effectively against increasingly keen
competition for the customer’s time and money (Leisen, 2001:49; Getz, 1997:249).

74
A realisation of these trends and the effects thereof might have on the sustainability
of the festival is of significance.
2.5.7 Trends in and impacts on the festivals and events sector
In such a dynamic festival environment, each country should keep up to date with the
latest happenings in the industry. Understanding change and learning how to take
advantage of it is a vital aspect of successful festival and event management
(Janiskee, 1996:411). A thorough knowledge of trends and future impacts helps
festival and event management and organisers to develop tourism products suited to
the current needs of the festival or event, and the specific market it attracts.
Creativity is required to present the tourism product differently and in ways that
appeal to customers. Also required are the managerial skills necessary to ensure
these customers’ expectations of satisfying experiences are met, and that quality
services are provided (Laws, 2002:4). The festivals and events that will survive and
flourish in the long term should capitalise on the latest trends and should formulate
their marketing and positioning strategies accordingly. The following global trends
were identified in the festival and event industry:
• a spectacular growth in the number, diversity and popularity of events over the
past several decades and a continuation of this growth trend (Getz, 2000c:3;
Goldblatt, 2000:3; Janiskee, 1996:411);
• festivals and events with a strong cultural component are increasing
considerably in numbers and will continue to do so (Lee et al., 2004:61; Getz
cited in Gartner & Lime, 2000a:176);
• the explosive growth of festivals has generated too many events in some
areas, which might cause the risk of saturation and decline (Getz cited in
Gartner & Lime, 2000a:176);
• in some cases, there are indicators that many festivals and special events may
be losing their novelty appeal for many of their visitors (Richards, 1996:323);.

75
• the lack of strategic planning and research in the event organisations may
explain why some festivals will decline or cease to exist (Getz, 1998:33);
• attending festivals and events remains one of the top choices of the public,
because festivals offer the lowest cost per hour of any activity, i.e. festivals
offer relatively cheap entertainment (Epperson, 1986:1);
• the upward steep (growth) trend in festival and event production means more
intense semi-competition among all the different kinds of events (Getz cited in
Gartner & Lime, 2000a:175; Janiskee, 1994:10);
• in many communities, a glutted or overcrowded festivals and events calendar
will create severe problems for any new, lower-quality or poorly marketed or
advertised festival and event (Janiskee, 1994:10);
• event management should continually strive to improve the quality of festival
products, avoid stagnation and develop better marketing strategies to sustain
the festival in a Darwinian “survival-of-the-fittest” environment (Robinson &
Noel, 1991:78);
• festival and event management and organisers copy successful ideas on a
widespread basis, and many perform again at different events in the same
community, so a considerable amount of event “copycat” (homogenisation)
takes place in the industry;
• there is no barrier to entry and any individual may start an event;
• it is difficult for festivals or events to differentiate their festival product from the
rest. Festival audiences are also becoming more sophisticated and are more
likely to realise when festivals and events are average or have been staged
with shortcomings, such as insignificant interpretation and inferior performance
(Uzzell, cited in Janiskee, 1996:411; Plog, 1991);
• governments now consider the arts as so important that they want everyone in
the public to be encouraged to have access to arts festivals (Governmet
Gazette of South Africa, 2001:4); and
• festivals and events that do not freshen and modernise their offerings are
likely to be discontinued, because “competing for event audiences whose
expectations continue to rise will require new management strategies and an
emphasis on service quality" (Wicks, 1995:12).

76
Most of these global trends are being noted in the South African festivals and events
scenario. A thorough knowledge of trends helps to keep events topical and alive,
enabling the management of South African events to prepare longer-term strategies
and to survive. This means that each individual festival is responsible for determining
the relevance of these trends to its situation, and for detecting other trends of local or
regional significance. South Africa now has an overcrowded festivals and events
calendar, in which different festivals and events compete for the customer’s valuable
time and money. The rationale for this research was in fact the continuing growth in
the festival and events industry and the challenges this poses.
The long-term success of the festivals and events industry requires a stronger
differentiation among festivals and events in the market place as well as sound
marketing and strategic positioning in the market for special interest tourism. This
tourism sector is market-driven and responds to the specific needs of its participants.
2.6 CONCLUSION
The layout of this chapter follows the flow diagram of the tourism phenomenon
shown in Figure 2.1. The first focus in this chapter is on defining tourism and
addressing the growth in tourism, leading to a discussion of the changing needs or
demands of tourism (see Section 2.3). The different types of SIT opportunities are
identified in Section 2.4. Festivals and events are identified as one of the fastest-
growing categories of these new types of tourism offerings, as discussed in Section
2.5.
The history of festivals and events, definitions and classification of festivals in a
South African context appear in Sections 2.5.2, 2.5.3 and 2.5.4. The last part of the
chapter focuses on arts festivals (see Section 2.5.5) and the future trends that may
have an impact on the industry (see Section 2.5.7).

77
At the beginning of the new millennium, tourism (especially arts festivals) is still a
constantly evolving phenomenon, developing and reformulating itself as a customer
activity (Page, 2003:3). A greater range of niche products has been developed and
marketed to satisfy the demand for the increasingly sophisticated tastes of tourists.
Festivals and events are among the fastest growing categories of these new types of
tourism offerings.
This new trend is also seen in the South African scenario where customers can
choose from an average of four festivals a month, or one a week, with new festivals
constantly being added to the events calendar. One category that of arts festivals is
of selected for the purpose of this study. The successful development of niche
products as regards this, will certainly benefit the South African tourism industry, but
may also pose major challenges for tourism marketers. The characteristics of a
successful festival have to be determined so that the marketers of a festival can
sustain the festival despite the severely overcrowded environment and calendar. This
clearly indicates the importance of sound marketing and strategic positioning in this
special interest tourism sector.
Tourism marketers should target their promotional campaigns at the tourist markets
most likely to choose the given festival or destination (Leisen, 2001:58). The most
important attributes or benefits an arts festival offers should therefore be identified in
order to develop effective market positioning strategies and sound marketing
principles, especially in the current uncertain times beleaguering the tourism industry
since global threats such as the September 11 attacks on the USA, war and terrorist
attacks in the Middle East and Europe and the Indian Ocean Tsunami disaster,
SARS and avian flu viruses.
The future and the sustainability of arts festivals will be in jeopardy without sound
marketing and effective positioning from an organisational and management point of
view. Positioning is one of the classic tasks of marketing management and literature
gives a vast number of models and various techniques for positioning analysis
(Grabler, 1997:101).

78
However, positioning is not often applied to a festival context. To date, the more
sophisticated techniques of positioning developed in marketing science have not yet
spread into this particular field. The notion of positioning also recognises that tourists
or the customers of tourist services evaluate and buy products based on the
perceptions and images unique to each product or brand (Witt & Moutinho,
1994:332). The notion of marketing and market positioning in tourism and the festival
context is discussed in greater detail in Chapter 3.
An understanding of strengths and weaknesses is of paramount importance for
marketers, developers and planners involved in strategy development. As creating a
market position is vital to long-term success, strategies to gain an advantage in
market competitiveness should be of great interest to marketers (Chen & Uysal,
2002:987).
This chapter, the first of the two chapters on the secondary research focused on
South African tourism, special interest tourism and the festivals and events industry.
The next chapter focuses on tourism marketing in South Africa and the various
market-positioning models that can be used to position an arts festival strategically in
the market.

79
CHAPTER 3
3 MARKETING AND MARKET POSITIONING IN THE ARTS FESTIVAL CONTEXT
3.1 INTRODUCTION
Festivals and events in South Africa currently face increasing competition in the
market place with a choice of more than four festivals per month or one per week on
the annual events calendar. Each tourism product (arts festival or event) also has to
be marketed effectively against increasing competition for the customer’s leisure time
and money. It is a moot point whether all these festivals (more than 85 reported in
South Africa) would survive in the long term.
A festival or event will not succeed unless it can meet the motivations, expectations
and needs of the participants (which will often be the local community) and the
visitors (Shone & Perry, 2004:144; Hall, 1992:137). Marketing is the golden thread
that helps make an arts festival successful or an event possible (Hall, 1992:137).
Those festivals that determine customer requirements and that deliver the greatest
value to their customers (referred to as customer satisfaction) will be successful
(Lamb, Hair, McDaniel, Boshoff & Terblanche, 2004:5). Satisfying old and creating
new customers (customer satisfaction) is a basic tenet of marketing and it is
becoming more important than ever before in the South African festival and event
scenario.
Unfortunately, many festivals and events, especially the medium to smaller ones, are
probably conducted without the benefit of a marketing plan or positioning strategy
and such arts festivals will not survive in the long term (Hall, 1992:137). The arts
festivals and events that succeed in attracting audiences are those with proper
marketing and positioning strategies (Van der Wagen, 2001:53).
80
Successful arts festivals can best define and satisfy festival attendees' requirements
in the context of the ever-changing market environment.
The festival’s success depends largely on marketing and the right marketing mix,
then communicating it and ultimately positioning and branding the arts festival
strategically in the market.
The purpose of this chapter is to give an overview of the area of tourism marketing
and market positioning in an arts festival context in South Africa. Following on
Section 3.2, the definitions of marketing and event marketing are briefly discussed.
The eight elements involved in the marketing mix for events are discussed in Section
3.3. Market segmentation (Section 3.4) focuses on grouping together customers who
have similar requirements and buying characteristics, and introduces the festival and
event customer at the core of the market.
By addressing the benefits or attributes that customers seek (push and pull
attributes), a target group can be selected. Such a target group is central to market
positioning (Mullins et al., 2005:17). The marketing programme should aim at
positioning the festival product or service directly to the targeted customers in the
market. As market positioning is central to marketing, Section 3.5 defines market
positioning in a marketing and tourism context as well as in a festival context,
discusses positioning models and the steps to be followed in the positioning process,
which is explained in Section 3.6. Branding is briefly discussed in Section 3.7 and
concluded in Section 3.8.
The aim of this chapter is to introduce the body of knowledge on positioning in
marketing and tourism, discuss various positioning models, use them and build on
them in Chapters 4 and 5 by doing original research and integrating the literature on
positioning, as discussed in this chapter, with the previous secondary research and
the new empirical results appearing in Chapters 4 and 5. On this basis, the
development of a new model for positioning arts festivals is discussed in Chapter 6.

81
3.2 DEFINING MARKETING
The definitions of marketing demonstrate the different approaches that academics,
researchers or applied business purposes have taken to marketing philosophy (Dibb,
Simkin, Pride & Ferrell, 2001:5).
Marketing means far more than the popular view of only selling and advertising and
other sales promotions (such as coupons or complimentary tickets) or the traditional
“four Ps” of product, place, price and promotion (Perreault & McCarthy, 2002:4).
These implications are spelled out in the definitions below, as well as in the general
discussion. The principal definitions of marketing are introduced consecutively.
Kotler (2000:8), the American marketing academic, defines marketing as follows:
• “A social and managerial process by which individuals and groups obtain
what they need and want through creating, offering and freely exchanging
products and services of value with others.”
Perreault and McCarthy (2002:8) define marketing from both a micro and macro
perspective:
• “Micro marketing is the performance of activities that seek to accomplish an
organization’s objectives by anticipating customer or client needs and directing
a flow of need-satisfying goods and services from producer to customer or
client.”
• “Macro marketing is a social process that directs an economy’s flow of goods
and services from producers to consumers in a way that effectively matches
supply and demand and accomplishes the objectives of society.”

82
In other words, micro marketing looks at the needs of the potential customers of
individual organisations/festivals whereas macro marketing emphasis the whole
marketing system from production, from the planning of the festival to the execution
and evaluation thereof. It should be noted that as a result of the broad scope of
marketing and the overall relevance in all disciplines (corporate, academical, tourism
etc.) the application of marketing in this thesis will not distinguish between the
concepts of a festival, organisation or company individually but rather
interchangeably. However, for the purpose of this study a festival is an organisation
and in the case of direct quotation it is referred to as a company.
Other academics suggest that the marketing concept can only work if it is embedded
in the whole culture of the organisation/festival. The United States management
consultant Drucker (1973:64), for example, considers this view and defines marketing
as follows:
• “Marketing is so basic that it cannot be considered a separate function. It is
the whole business seen from the point of view of its final result, that is, from
the customer’s point of view…Business success is not determined by the
producer but by the customer.”
This author later adds – “Because the purpose of business is to create and keep
customers, it has only two central functions – marketing and innovation. The basic
function of marketing is to attract and retain customers at a profit” (1999:4).
This latter definition suggests that everyone who is involved in the marketing process
of an organisation/festival, should ultimately consider the customer as being central
to its activities. The notion of customer satisfaction is then the central pillar of
marketing. This suggests that marketing involves an all-encompassing philosophy,
which often means that an organisation/festival has to change its internal business
culture to accommodate this new approach.

83
The American Marketing Association, cited in the Dictionary of Marketing Terms
(1995) offers the following definition:
• “Marketing is the process of planning and executing the conception, pricing,
promotion, and distribution of ideas, goods, services to create exchanges that
satisfy individual and organizational goals.”
Dibb et al. (2001:5) give the following definition of marketing, which is similar to that
of the American Marketing Association:
• “Marketing consists of individual and organisational activities that facilitate and
expedite satisfying exchange relationships in a dynamic environment through
the creation, distribution, promotion and pricing of goods, services and ideas.”
In the dynamic world of marketing, an effective solution to satisfying customer’s
needs tends to be short-lived. Sunbathing on the beach no longer satisfies most
tourists’ needs; special interest travel, therefore, has taken a dominant share of the
market (Buhalis, 2001:71). (See the discussion in paragraph 2.3.1.2 which elaborates
on the changing needs of tourists). Marketers should constantly study their
customers’ requirements and be prepared to change their marketing activity
accordingly. The assessment of marketing opportunities is an ongoing process,
requiring regular revision and updating. The Chartered Institute of Marketing (Lynch,
1994:4), the professional body for practising marketers in the United Kingdom,
defines marketing as:
• “The management process responsible for identifying, anticipating and
satisfying customer requirements profitably.”
Although this definition has been criticised for its use of the word profitability, it is
argued that non-profit-making organisations (such as arts festivals) can use the
market philosophy to become more effective rather than simply more profitable.
84
The definition is useful in that it identifies the role of marketing as being to identify the
needs and wants of customers both now and in the future, and then to meet them.
Kotler (2004:30) refers to this as the traditional marketing approach and defines it as
to “… find needs and fill them”.
He also notes that the challenge is to invent new needs “… by creating a new value
proposition and/or a new business system that offers leaps in benefits and/or
reductions in acquisitions efforts/costs” (Kotler, 2004:30). Nowadays, marketing
should be understood in the new sense of satisfying customer needs.
This new sense refers to the theme connectedness which means that “… we are all
connected to each other and to things near and far in the world around us”
(Armstrong & Kotler, 2003:xvii).
The secondary literature has few definitions of marketing for festivals and events and
none that are original in the South African context, apart from Tassiopoulos
(2005:253) who cites Hall’s definition (1992) as quoted by Watt (1998:61) as “the
function of event management that can keep in touch the event’s participants and
visitors (consumers), read their needs and motivations, develop products that meet
these needs, and build a communication programme which expresses the event’s
purpose and objectives.”
However, those definitions that emphasise or focus on the process, a customer
orientation, a mutually beneficial relationship, and marketing to all the stakeholders
(participants and spectators, sponsors, media, VIPs, staff, advertisers, public) are
appropriate due to the comprehensiveness thereof to the South African festivals and
events sector. Getz (1997:250) accordingly defines marketing in the festivals and
events sector as:
85
• Marketing events is the process of employing the marketing mix6 to attain
organizational goals through creating value for clients and customers. The
organization must adopt a marketing orientation that stresses the building of
mutually beneficial relationships and the maintenance of competitive
advantages.”
The above-mentioned definitions stress that the core of the marketing concept
focuses on the target market being the festival or event attendee. The top marketing
priority for any South African festival and event should be to create, retain and satisfy
customers, seeking their loyalty and consumption. Selling more tickets to festival and
event customers, who in turn provide profits and ensure the sustainability of the
festival, is the reward for such festivals.
The fundamental principle is creating customer value and satisfaction as no festival
or event could be held without customers, neither globally nor in South Africa
(Jobber, 2004:13).
Marketing is a critical element in the hosting and management of a successful festival
and event as it focuses on satisfying the targeted customers’ needs and wants
(Duncan, 2002:13; Hall, 1992:136). The event manager can develop a specific
marketing mix in order to achieve goals, i.e. satisfy customers’ needs and wants
(Pride & Ferrell, 2003:7). In addition, these marketing goals should be achieved in a
manner that differentiates them in customers’ eyes from competitors’ marketing
mixes. This will give a competitive edge over rivals, though the marketing goals
should be regularly updated to reflect new trends and developments in the market
(Dibb et al., 2001:7).
The marketing mix traditionally involves four elements, namely product, price,
promotion and place or distribution (Jobber, 2004:16). These four Ps determine how
a service (festival) is presented, how much it costs (ticket price), where it is held and
6 The marketing mix is the unique blend of product/service, pricing, promotion, offerings and
distribution designed to meet the needs of a specific group of consumers (McDaniel & Gates, 2001:5).

86
distributed (region or town) and how it is presented in all festival communications. For
the purpose of this study an arts festival is classified as a service however, the words
products and service will be used interchangeably.
3.3 MARKETING MIX
Marketers need a marketing plan so that they can carry out their marketing functions.
This plan, amongst other, consists of marketing objectives, the identification of target
markets and a marketing mix, which will serve each of the target markets (Dibb et al.,
2001:22). The “marketing mix” consists of those elements or tools that the festival
and event manager has some ability to control, manipulate or influence to achieve
goals over the short term (Mullins et al., 2005:18). Traditionally, the four Ps in
marketing are defined as “the controllable variables that the company puts together
to satisfy a target group” (Perreault & McCarthy, 2002:46).
Armstrong and Kotler (2005:58) note that the four Ps represent the seller’s view of
the marketing tools available for influencing buyers. From the buyers’ viewpoint in
this age of connectedness, the four Ps might be better described as the four Cs:
• Four Ps Four Cs
• Product Customer solution
• Price Customer cost
• Place Convenience
• Promotion Communication
The customers see themselves as buying either value or solutions to their problems,
so each marketing tool should be designed to deliver a customer benefit (Armstrong
& Kotler, 2005:58). Because customers want two-way communication, the winning
companies will be those who first consider the four Cs and then build the four Ps on
that platform (Kotler & Armstrong, 2004:64).
87
In the marketing of services, Cowell (1984:6) developed a variation on the original
four Ps and proposes a seven-P marketing mix, comprising product, price, promotion,
place, people, physical evidence (layout, furnishing of venue, sound quality) and
process (customer involvement in the leisure service). However, the last three Ps are
only part of the product element of the marketing mix (Cowell, 1984:6). The product
is split into other P elements, which cause the additional Ps. This may confuse
people's marketing thinking and action, but could also assist festival and event
marketers to think strategically (Allen et al., 2002:212).
In addition to the traditional four Ps of marketing, tourism researchers such as
Morrison (2002:21) suggest another four Ps (people, packaging, programming and
partnership) that may be regarded as especially important in tourism marketing. The
Economic Planning Group of Canada (cited in Getz, 1991:197) suggests another P,
namely positioning.
Although positioning is undoubtedly important in the festival and event marketing
process, the current study regards positioning as a component of the traditional Ps
as positioning is integrated in the other eight Ps. Getz (1997:251) adapted Morrison’s
approach and used eight elements as mentioned below for festivals and events. A
tailor-made marketing mix for South African festivals and events based on Getz’s
(1997) approach is presented in Table 3.1, which summarises the eight Ps of the
marketing mix for festivals and events, listing the various elements of each P.
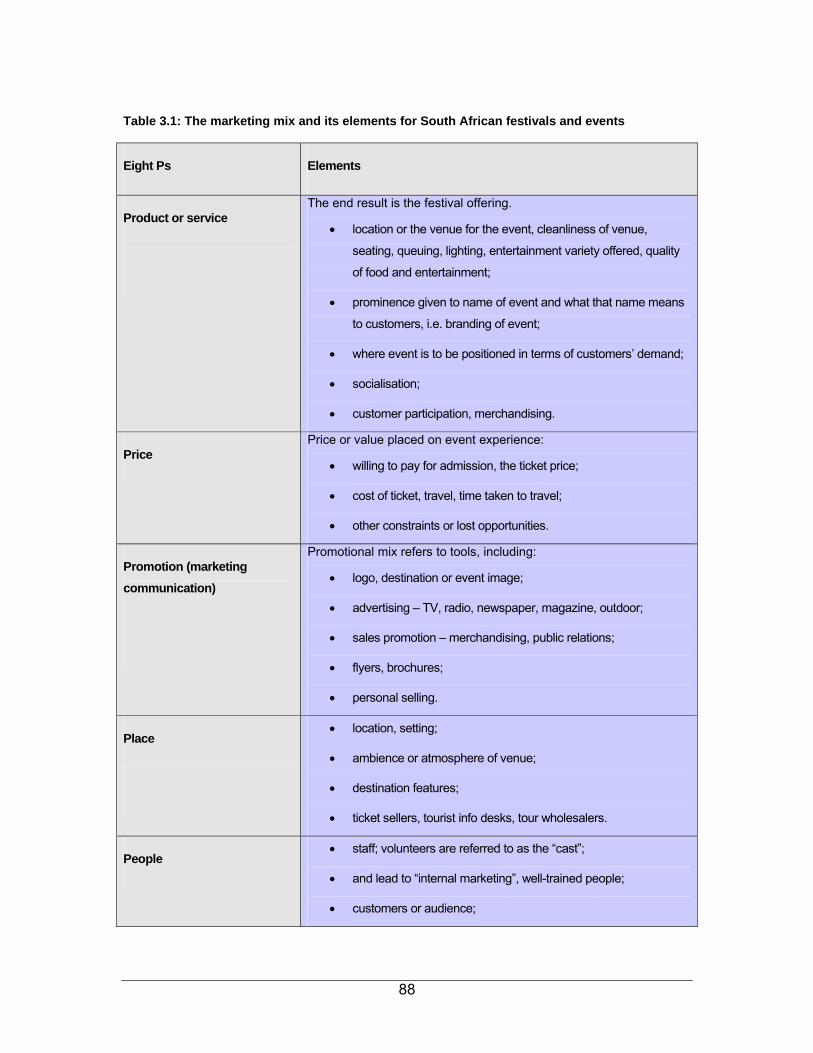
88
Table 3.1: The marketing mix and its elements for South African festivals and events
Eight Ps Elements
Product or service
The end result is the festival offering.
• location or the venue for the event, cleanliness of venue,
seating, queuing, lighting, entertainment variety offered, quality
of food and entertainment;
• prominence given to name of event and what that name means
to customers, i.e. branding of event;
• where event is to be positioned in terms of customers’ demand;
• socialisation;
• customer participation, merchandising.
Price Price or value placed on event experience:
• willing to pay for admission, the ticket price;
• cost of ticket, travel, time taken to travel;
• other constraints or lost opportunities.
Promotion (marketing communication)
Promotional mix refers to tools, including:
• logo, destination or event image;
• advertising – TV, radio, newspaper, magazine, outdoor;
• sales promotion – merchandising, public relations;
• flyers, brochures;
• personal selling.
Place
• location, setting;
• ambience or atmosphere of venue;
• destination features;
• ticket sellers, tourist info desks, tour wholesalers.
People • staff; volunteers are referred to as the “cast”;
• and lead to “internal marketing”, well-trained people;
• customers or audience;

89
Eight Ps Elements
• host and guest relations;
• customer care and teamwork.
Packaging and distribution Package is the combination of elements offered at a single price:
• the way the event is presented as a package.
The distribution network becomes important:
• intermediaries of various kinds are required (travel agents,
computerised ticketing agents, e.g. Compu-ticket).
Programming Events are a key programming element in animating the place:
• i.e. a scheduled event on an annual events calendar;
• elements of style; and
• quality of programming.
Partnerships • stakeholders in producing the event
• engage in joint marketing initiatives with city/town promotional
offices.
Source: Adapted from Allen et al., (2002:164); Morrison (2002:21); Van der Wagen (2001:61); Watt
(1998:66); Getz (1997:251) and Hall (1992:142)
All eight elements are important in the marketing mix of festivals and events due to
its complexity. However, the core of the mix is the promotional element, namely the
marketing communication between a festival or event and its customers, because
these variables can be manipulated to achieve an event’s objectives (Allen et al.,
2002:166). Three of the elements, namely product, promotion and place, require up-
front expenditure before any revenue is obtained from ticket sales. It is therefore
important for the marketing process to be thorough, thoughtful and realistic in
forecasting both revenue and expenditure (Allen et al., 2002:167). Any confusion in
the marketing process may have negative consequences for the viability,
sustainability and longevity of any festival and event.
Good marketing emanates from a full understanding of the festival and event
customers and the marketing mix attracting them (Van der Wagen, 2001:61).

90
A detailed understanding of the varying needs and requirements of different
customers is fundamental to the principles of marketing (Dibb & Simkin, 1996:10).
Identifying the festival and event customers' specific needs requires segmenting the
market or focusing on a particular group (Van der Wagen, 2001:57). The festival
management may perceive the visitors to festivals and events as a diverse market, in
which anyone within the geographic boundaries of South Africa or elsewhere in the
world may be a prospective festival and event customer. Some form of
categorisation/segmentation in the market is necessary to target groups with similar
requirements and similar buying characteristics.
3.4 SEGMENTING FESTIVAL AND EVENT CUSTOMERS
Because of the diverse market that it attracts, no festival or event can be all things to
all people. A marketer can rarely satisfy everyone in a market (Yeoman et al.,
2004:19). However, Hall (1992:137) observes it is essential to understand the
behaviour of festival and event visitors and to incorporate this knowledge into
marketing strategies. Marketers should design strategies that build the right
relationships with the right customers (Armstrong & Kotler, 2005:185). This includes
identifying the market segments that are likely to have their needs satisfied by the
festival and event activities, or to ensure the event contains those elements or
benefits/attributes which can satisfy an identified target market’s7 needs. Many
festivals and events now embrace target marketing (Shone & Parry, 2004:145; Getz,
1997:260).
According to Kotler (2000:256), target marketing requires marketers to take three
major steps:
7 “Target market is a group of people for whom a company creates and maintains a marketing mix that
specifically fits the needs and preferences of that group" (Dibb et al., 2001:21).

91
1. identifying and profiling distinct groups of buyers who might require separate
products/services or marketing mixes (market segmentation);
2. selecting one or more market segments to enter (market targeting); and
3. establishing and communicating the key distinctive benefits/attributes of the
products or services (market positioning) to the market.
Getz (1997:260) furthermore notes that, depending on the circumstances, festival
and event attendees are not homogeneous and any one segmentation strategy or
combination of strategies could be used to delineate the existing and target markets.
The larger an event, the more likely it is to attract a more diverse range of people, for
which more comprehensive market segmentation might be needed (Swarbrooke,
2002:58). Therefore, the technique marketers use for obtaining knowledge about the
diverse nature of markets is referred to as market segmentation (Jobber, 2004:210).
Market segmentation is a two-step process of: (1) naming broad product-markets and
(2) segmenting these broad product-markets in order to select target markets and
develop suitable marketing mixes (Perreault & McCarthy, 2002:73). Churchill and
Peter (1995:290) define market segmentation as the process of subdividing a market
into distinct subsets of customers who behave in the same way or have similar
needs. There are various levels and patterns of market segmentation, but market
segmentation shows the organisation's market segment opportunities (Armstrong &
Kotler, 2005:199). These various segments should be evaluated and the target
segments selected. Moreover, target marketing can be carried out at several different
levels, as indicated in Figure 3.1.
Figure 3.1: Different strategies for target marketing (Armstrong & Kotler, 2005:200)

92
The above figure indicates that festival management can target very broadly
(undifferentiated or mass marketing), very narrowly (micromarketing), or somewhere
in between (differentiated or concentrated marketing).
Although the starting point of any segmentation is mass marketing or undifferentiated
marketing,8 Armstrong and Kotler (2005:256) note that the “one-size-fits-all”
marketing concept is dying out. Differentiated (segmented) marketing is found when
a festival decides to target several market segments and designs separate offers for
each (Armstrong & Kotler, 2005:201). Concentrated or niche marketing is a market-
coverage strategy in which a festival goes after a large share of one or a few
segments, or niches (Armstrong & Kotler, 2005:201). This strategy is especially
popular if a festival’s resources are limited. In the previous two approaches,
marketers tailor their packages/offers and marketing programmes to meet the needs
of various market segments and niches, but do not customise them to each individual
customer (Armstrong & Kotler, 2005:202).
Many organisations are now turning to micromarketing in local areas and at individual
levels. Micromarketing practises the tailoring of products and marketing programmes
to suit the needs of specific individuals and local customer groups (Armstrong &
Kotler, 2005:202). Kotler (2000:259) notes that in future there is likely to be more
self-marketing, a form of individual marketing in which individual customers take a
greater initiative in designing their products and brands. However, festivals differ
widely in their abilities to serve different segments of the market (Armstrong & Kotler,
2005:185).
In addition to this strategy options in Figure 3.1 different kinds of segmentation bases
or strategies can be used in customer markets. Bennett and Strydom (2001:66)
continue and note that segmentation is a fairly subjective process, which may differ in
the case of each festival and event.
8 “Mass marketing is a market-coverage strategy in which a firm decides to ignore market segment
differences and go after the whole market with one offer” (Armstrong & Kotler, 2005:200).

93
In other words, there is no single way to segment a market, and a marketer has to try
different segmentation variables, alone and/or in combination (Bennett & Strydom,
2001:66). Segments may be identified along the lines of basic customer
characteristics such as geographic, demographic, psychographic and socio-
economic status; and should also consider product or festival-related behavioural
characteristics such as purchase behaviour, purchase occasion, the benefits or
attributes sought, consumption behaviour and the user's status and attitude to a
product or service (Dibb et al., 2001:211). Table 3.2 comprehensively illustrates the
options available to the festival and event marketer.

94
Table 3.2: Major segmentation variables for festival and event markets
Demographics: Who are the customers?
Age, sex or gender
Family status (one- and two-parent families)
Race/ethnicity
Religion
Family lifecycle concept
Socio-economics: Who are the customers?
Income level
Occupation
Level of education
Social class
Different income groups with different needs
Geographic location: From where are the visitors?
Country
Region
City
Psychographics: Who are the customers?
Personality
Beliefs; attitudes
Values
Motives
Lifestyle
Benefits sought: What do they want?
Trip motives (push and pull factors)
Experiences desired
Type of trip: Under which conditions will they attend?
Holiday
Day trip
Business
Visiting friends/relatives
Seasonality:
Peak season only
All-year potential
Repeat visits: How often will they attend?
Once only
First-time (might repeat) Source: Adapted from Dibb et al. (2001:211); Getz (1997:260-262)

95
Each of these segmentation variables will be discussed from a festival and event
perspective.
3.4.1 Demographic segmentation
Age and gender along with marital and family status are usually important factors
affecting the demand for events. Household type and size are potentially useful in
segmenting the market as well as race and ethnicity that reflect the multicultural
nature of the population (Getz, 1997:261). Multicultural festivals are often aimed at
fostering bettering communication and understanding between different cultures
therefore, any under-representation of certain groups should be determined (Getz,
1997:262).
The same author notes that young unmarried people have a set of values, desires,
opportunities and constraints, which is quite different from those of married couples,
“empty nesters” and elderly retired people. Arts and cultural festivals are more likely
to attract females (Getz, 1997:262). Demographic and geographic segmentation are
popular forms of segmentation because the statistics are readily available, uniformly
defined and accepted, and easy to use. It is common for demographic and
geographic segmentation to be used in combination, giving rise to geo-demographic
segmentation (Morrison, 2002:181).
3.4.2 Socio-economic segmentation
This group of variables pertains to an individual’s or household’s economic status
and related factors such as educational attainment (Getz, 1997:262). Certain
marketing academics include some of these variables in the demographics label.
Although income is the greatest predictor of travel and entertainment expenditure, it
is not a sufficient indicator to explain everything (Getz, 1997:262). The higher the
level of education, the greater a person's propensity to participate in cultural
activities, including arts and community festivals (Torkildsen, 1983:5).

96
Morgan (1996:103) observes that the age at which individuals finish their formal
education (16 or 18 years, or after higher education, at 21 years) may indicate their
aspiration and intelligence and, significantly for event managers, their curiosity about
the world in which they live. Festival and event management with arts and cultural
elements have a target market of an educated population (Allen et al., 2002:173).
3.4.3 Geographic segmentation
By dividing the market into different geographical units such as countries, regions,
cities, urban, rural and climatic regions, clusters of likeminded individuals and so
forth. These variables can also be used to differentiate between primary, secondary
and emerging markets (Bennett & Strydom, 2001:69).
It is extremely important to know where potential customers live or work in order to
communicate with them. Getz (1997:260) observes that most festival and event visits
will be generated inside the local or regional market area.
3.4.4 Psychographic segmentation
This form of segmentation has recently gained popularity in tourism research, but
some researchers have found it of limited value unless it is combined with other
segmentation variables (Getz, 1997:262). Psychographics is the development of
psychological profiles of customers and psychologically-based measures of
distinctive modes of living or lifestyles (Mill & Morrison, 1998:181). Plog (1987 cited in
Ritchie & Goeldner, 1994) identified the following eight dimensions commonly used in
psychographics-based tourist segmentation:
• Adventurousness (the explorer types);
• Pleasure-seeking (related to the desire for luxury);
• Impulsiveness (will spend a lot, without planning);
• Self-confidence (will travel alone);
97
• Plan-fullness (prefer package tours and bargains);
• Masculinity (the action-oriented and outdoor groups);
• Intellectualism (lured by culture and history);
• People orientation (want to be close to others).
Getz (1997:263) notes that whatever psychographic segmentation is employed, it
has to be linked to one or more of the other segmentation methods. In addition he
notes that the marketers of event tourism who use psychographic segmentation
could expect ideal segments, based on the following:
• Lifestyle: the concept is defined by how people spend their time (activities),
what they consider to be important in their environment (interests), and what
they think of themselves and the world around them (opinions) (Assael,
2004:280). These are all factors used in lifestyle segmentation, including being
active in a variety of sports, arts, or in the community; already a customer that
make use of similar products.
• Personality traits: personality variables are used to segment markets such as
conservatives who will buy packages, or adventurers who will seek out the
authentic and unique (Getz, 1997:263).
• Perceptions, values, and beliefs: these are classified as the behaviour
variables because perceptions, beliefs and values are strongly linked to
behaviour. Customers are categorising by grouping together those who view
the products in a festival market in a similar way and who have similar beliefs
(Jobber, 2004:217).
On the same topic the author concludes that there are apparent differences in
segmentation (especially with regards to psychographic and behavioural
segmentation) in the fields of traditional marketing versus tourism (festival)
marketing. According to Getz (1997:263), the below mentioned segments form part
of the psycographic segmentation, whilst Kotler and Armstrong (2004:244) view
psychograpic and behavioural segmentation separately.

98
• Benefits or attributes sought: customers can usually identify what they want
from an event or travel experience, such as a desire to enjoy social and family
relationships, to learn about cultures, to have fun and so forth (Getz,
1997:263). Customers or potential visitors will rank the attributes of most
interest to them and can then use these benefits. Segments based on stated
benefits have to be correlated with other factors, especially demographics. For
example, older adults with high incomes are more likely to seek an authentic
cultural experience. Benefit segmentation is the division of a market according
to the benefits customers want from the product or service (Dibb et al.,
2001:219);
• Type or purpose of trip: visitors to an event are most likely to attend as either a
day trip, a family vacation, visiting friends and relatives, on business, or
travelling only because of the event. Other segmentation variables can be
combined to form useful trip-type segments (Getz, 1997:263).
• Seasonality: although this variable is often ignored, it has particular relevance
to events. Some groups are easier to attract in the off-season, whereas others
are likely to be attracted in the summer holiday season or during school
holidays (Getz, 1997:263).
• Repeat visits: the loyal group of return visitors, usually including a high
proportion of area residents. This important group includes a segment with
strong “brand loyalty” to particular events, returning again and again, and a
segment which attends many different events. Arts and music festivals in
particular seem to attract a mobile audience, and sport has dedicated
travelling supporters. Research indicates that repeaters tend to be middle-
aged, married and well-educated, with fewer students, young people and
senior citizens (Getz, 1997:263).
• Product-related variables: people with an interest in sports events or arts
festivals can be identified by the equipment they own, the magazines they
read and their leisure activities. An event can also concentrate on people who
are frequent users of certain facilities, and clubs with specialised demands
(such as antique porcelain hobbyists). The main object is to identify the

99
products or services linked to the target market and the event (Getz,
1997:264).
• Distribution channel variables: target groups are defined by the ways in which
the event can be linked to potential customers in the way they are reached
(Getz, 1997:264).
Although psychographic segmentation has serious limitations for an event marketer,
it does provide valuable information about the characteristics of the target market and
the benefits that these groups seek from a leisure experience (Allen et al., 2002:175).
Perhaps the most popular bases for customer segmentation are the benefits or
attributes customers seek from purchasing, consuming, owning the product or having
the service (Dibb & Simkin, 1996:14). It is of the utmost importance to determine the
correct attributes or benefits (Chacko & Fenich, 2000:212). These authors state that
the review of literature shows that many (festival) attributes are important in the
selection but the extent of influence and importance of each attribute is not clear.
However, it should be noted that in the tourism literature the attributes or benefits of a
festival or event are referred to as the push and pull attributes or factors that are part
of the positioning attributes (Botha, 1998:59). In the marketing field, push and pull
factors have a slightly different meaning.9 Positioning attributes or push and pull
factors are terms borrowed from the marketing field and it may not always be
practical to translate them into another discipline, which is why new or different
meanings for words or concepts are adopted when translated into another field, such
as the tourism field in this case (Cooper & Schindler, 2003:42).
Positioning differentiates one festival from another festival due to attributes (push and
pull factors) that are meaningful to customers and that give the festival a competitive
advantage in the market (Chacko, 1997:1).
9 In the marketing field, push and pull are terms used as basic sales promotion strategies to move
products through the distribution channel from the point of manufacture to the point of consumption
(Duncan, 2002:571).

100
Positioning attributes are comprised of socio-psychological motivators (push factors)
and festival drawing-power or attributes (pull factors) (Botha, 1998:56). Push factors
deal with attendees' internal visitation motives per se and refer to the social-
psychological benefits offered by a festival’s attractions and people (Goossens,
2000:300; Botha, 1998:55).
Pull factors refer to the tangible attributes offered by a specific festival, such as sunny
weather, restaurants and performing artists. These motivational factors embrace the
external drawing power or attractiveness of the festival as perceived by attendees
(Hughes, 2000:36). However, when analysing the positioning attributes of a festival
the situational inhibitors (constraints), which might prevent attendance, also have to
be taken into account. Positioning attributes therefore refer to the push factors that
are intangible and origin-related, and they motivate or create a feeling or desire to
satisfy a need (Crompton, 1979:410) and pull factors are the motives aroused by the
festival, rather than emerging from the inner feelings of the festival attendee
(Crompton, 1979:410).
Nevertheless, no matter which way the market is segmented, for market segments to
be effective they have to satisfy the following eight criteria or requirements (Morrison,
2002:175; Kotler, 2000:274):
• measurable: it should be possible to measure the size, purchasing power and
characteristics of the segments;
• substantial: the segment should be big enough to be profitable;
• accessible or reachable: the segments should be effectively reached and
served with the marketing mix developed;
• defensible: the target market should be defended from competitors;
• durable or sustainable: the stability or sustainability of a segment over time.
i.e. a market segment should have a long-term potential and should be able to
survive. Some segments are short- or medium-term, meaning that they last for
less than a year;

101
• competitive or differentiable: the segment has to provide something distinct or
unique for these customers;
• homogenous: the segments should be different from one another, or be as
heterogeneous as possible, but the people in each segment should be as
similar, or homogeneous as possible; and
• compatible: the new target market should be compatible with existing target
markets that are already served.
Once market segments have been identified and targeting decisions made, it is
necessary to consider exactly how to position the festival product in the market. The
market position of the festival product relates to the attributes that customers ascribe
to it (Dibb & Simkin, 1996:17). The term market positioning is discussed in more
detail in the next section.
Each and every tourism destination or festival and event has one or more primary
markets and several secondary markets from which it attracts the majority of its
visitors or guests (Perdue, 1996:39; Bonn & Brand, 1995:31). The ability to attract
these market segments is based on the unique market position of the destination or
festival – it is the image it portrays in the minds of customers (Jeffrey & Xie,
1995:857; Herbig & Milewicz, 1993:18; Barich & Kotler, 1991:95; Calantone &
Mazanec, 1991:101).
3.5 MARKET POSITIONING
3.5.1 Introduction
The term positioning is such an all-encompassing concept that more attention should
be given to its meaning, importance and appropriate application, especially as
researchers and practitioners may interpret it differently, as may people in the
marketing, tourism and festival field of study. The next section contains a discussion

102
of the definitions as well as the importance and objectives of positioning in the fields
of marketing, tourism and, more specifically, festivals and events.
A comprehensive literature review of articles on positioning in tourism marketing
revealed a scarcity of literature on such positioning in the context of arts festivals,
especially in South Africa (as noted in the problem statement, Section 1.2). In order
to address the fifth secondary objective the generic models of positioning and their
application are evaluated according to the available market-positioning techniques in
Section 3.6. The origin of the concept is discussed in the next section.
3.5.2 Defining positioning in various contexts
The concept of positioning dates back to the late 1960s and early 1970s (Lamb et al.,
2004:189). In 1972, Ries and Trout (2001:3) addressed the concept of positioning in
a series of articles titled “The Positioning Era,” published in Advertising Age.
However, Driscoll and Lawson (1990:106) argues that the conceptual origin of
positioning began with the work of economists on market structure, the competitive
position of the firm, and the concepts of substitution and competition among products
(Wind & Robinson, 1972:155), although the behavioural foundation of positioning
originated in the Gestalt psychology. These latter authors claim that marketing
scholars and practitioners have adopted the conceptual and behavioural ideas and
incorporated them into the field of marketing.
3.5.3 Marketing
Effective marketing may take many forms, ranging from a formulated to a more
creative form. Marketing is typically seen as the task of creating, promoting and
delivering goods and services to customers and businesses (Kotler, 2000:28). The
key objective is still to satisfy the needs of numerous customers who might
continually change. Positioning is one of the marketer’s tools, which can be used to
develop an effective marketing strategy (Lamb et al., 2004:189).
103
There is general agreement that the concept of positioning has become one of the
fundamental components of modern marketing management (Mullins et al.,
2005:201; Hooley, Saunders & Piercy, 1998:203) and one of the bases for firms
(festivals) to create psychological barriers around their offerings (Bhat & Reddy,
1998:32; Sheinin, 1998:2). To define the term positioning in a marketing context and
to address the academic significance of positioning, it is first necessary to indicate
where the concept fits into the marketing process.
Various researchers assert that the concept of positioning is often used together with
the terms segmentation (first stage) and targeting (second stage) and that positioning
is the third stage in the marketing process (Lamb et al., 2004:182; Kotler et al.,
2003:264; Morrison, 2002:204; Perreault & McCarthy, 2002:85; Dibb et al.,
2001:209). These three elements work together closely when determining which way
to offer a product or a service (a festival) and in which markets to which target group.
The elements relate to one another as indicated in Figure 3.2:

104
Figure 3.2: Basic elements of segmentation (Dibb, et al., 2001:209).
Positioning in marketing can be defined as the act of designing the organisation’s
offering and image to occupy a distinctive place in the minds of people in the target
market (Kotler, 2000:298). Assael (2004:555) adds that products can be positioned
with respect to customers and with respect to competitors. Various authors note that
positioning is the process of creating an image for a product in the minds of target
customers (Evans cited in Baker 2003:279; Dibb et al., 2001:233; Ries & Trout,
2001:3).
Kalafatis, Tsogas and Blankson (2000:417) debate the issue of positioning and are of
the opinion that with respect to the widely quoted definitions of Ries and Trout, and
Kotler, “a single, universally accepted definition has yet to emerge”.
105
However, they also believe that the statement by Arnott (1992:14) that the various
definitions and terminologies are simply “… several sides of the same coin …”
illustrates the fact that most of the apparent definitional differences are substantively
superficial. The marketing literature contains several definitions of the concept of
positioning, but Arnott (1993) gives a definition, which combines both the strategic
and operational perspectives. He defines positioning as: “… the deliberate proactive,
iterative process of defining, measuring, modifying and monitoring consumer
perceptions of a marketable object …” So the process of positioning can also be
described as repetitive, as it requires the deliberate involvement of the marketer, it
involves decisions at conceptual, strategic and operational levels and it should reflect
the consultation of the company or organisation, its competitors and its target market
or customers.”
To summarise, any product offered has to have particular characteristics (attributes)
that set it apart (differentiate) from others in the eyes of the customers. Since
positioning is based on customers’ perceptions, it is only partly under the control of
(festival) marketers. External factors might influence the way customers think about a
product or festival. These factors can be widely diverse and may include changes in
the price or characteristics of competing products (festivals), reports by the media,
new legislation (such as legislation against smoking in public places), or changes in
customers’ preferences.
The term positioning originated in marketing literature and spread to tourism literature
during the early 1980s.
3.5.4 Positioning in the tourism context
Positioning is not a new phenomenon in the tourism industry and the topic is well
documented by an array of authors. Table 3.3 indicates that the term positioning in
tourism was first popularised during the early 1980s and later on by various authors
and reached a peak in the 1990s while the latest literature dates it to 2004.

106
Table 3.3: Development of positioning research in tourism
Author and period 1980-1989 Author and period 1990-1999 Author and period 2000 and onwards
Aaker & Shansby (1982), Lewis
(1981, 1982, 1985a, 1985b),
Lovelock (1984),
Ries & Trout (1981) and
Woodside (1982)
Fenton & Pearce (1988), Haahti
(1986),
Harris (1988),
Middleton (1988),
Morrison (1989)
Ashworth & Voogd (1994), Baker
(1992),
Burke & Resnick (1991),
Crompton, Fakeye & Lue (1992),
Connell (1994),
Dev, Morgan & Shoemaker
(1995),
Echtner & Ritchie (1993),
Fodness & Milner (1992),
Zins (1994),
Witt & Moutinho (1994) and Alford
(1998),
Bramwell & Rawding (1996),
Kotler , Bowen & Makens (1996,
1999),
Lovelock, Vandermerwe & Lewis
(1990,1999),
Mazanec (1995),
Morgan & Pritchard (1998), Reich
(1997, 1999),
Walmsley & Young (1998).
Chen & Uysal (2002),
Lewis & Chambers (2000),
Middleton (2001),
Morgan & Pritchard (2000, 2001),
Morrison, (2002),
Bennett & Strydom, (2001)
Moutinho (2000),
Scott, Parfitt & Laws (2002),
Dickman, (2003)
Kotler, Bowen & Makens, (2003),
Walker, (2004).
Many descriptions and definitions of the concept of positioning have been postulated
in tourism literature, and the term is subject to considerable differences in
interpretation similarly to the discussion on marketing in paragraph 3.6.1.

107
In tourism, positioning is the process of establishing and maintaining a distinctive
place for a destination (tourism product) in the minds of the potential
visitors/travellers in the targeted markets (Walker, 2004:752; Chacko, 1997:1;
Crompton, Fakeye & Lue, 1992:20). Lovelock and Wirtz (2004:63) describe
positioning in services marketing as the process of establishing and maintaining a
distinctive place in the market for an organisation and/or its individual product
offerings. These latter authors argue that positioning such services involves
developing and communicating key product attributes, and is not primarily about
creating advertising images.
In contrast to image, Crompton et al. (1992:20) applied Woodside’s (1982:2)
approach to positioning, which suggests that the key to successful positioning is
matching the benefits provided by a tourism product with the benefits sought by
consumers in a target market who consider paying a visit to that tourism product.
Furthermore, Kotler et al. (2003:283) define positioning as “the way the product is
defined by consumers on important attributes – the place the product occupies in
consumers’ minds relative to competing products”. Tourism marketers should seek to
match the attributes of their product and buyers’ perceptions of those attributes with
the needs and priorities of customers in that specific segment (Evans, Campbell &
Stonehouse, 2003:132). The main components of positioning can be summarised as
the segmentation decision, image, selection of product’s (festivals) features to
emphasise (differentiation) and branding (Kotler et al., 2003, Aaker & Shansby, 1982;
Woodside, 1982).
The above-mentioned authors emphasise segmenting the market and then matching
the product to the needs of those segments. It could be argued that the positioning
decision for a tourism product is the most critical strategic decision for a tourism
product because it is central to determining visitors’ perceptions and their decisions
about a choice (Alford, 1998:67). Aaker and Shansby (1982:56) mention that
positioning decisions often mean selecting the associations and attributes that should
be emphasised, and those that should be de-emphasised.

108
Therefore, when applying the positioning process to tourism product marketing, the
marketer first has to research the market to ascertain which product attributes
determine the tourism product choice.
Positioning can also be applied to other tourism-related product offerings such as
festivals and events; and there is also a difference between the marketing of
products and the marketing of services.
Positioning a tourism product presents a number of challenges, two of which are
inherent in marketing a service “product”, namely intangibility and inseparability
(Moutinho, 2000:134). Events are like services; they are distinctively different from
industrial products. For the purpose of this study an arts festival is classified as a
service, but can also be referred to as tourism product and thus the two terms are
used interchangeably in this thesis. Positioning is concerned with the attempt to
modify the tangible characteristics and the intangible perceptions of a marketable
object (a festival) in relation to others in the market (Arnott, 1993, 1992). Various
authors (Middleton, 2001:42; Van der Wagen, 2001:54; Watt, 2001:61; Moutinho,
2000:134) address the basic differences between products and services and
summarise the special features of services as follows:
• Intangibility: customers can experience the benefits and feel the enjoyment,
but cannot touch them. There is a large service component involved when
marketing something purely intangible such as the atmosphere at a festival. In
some respects, it is very difficult to market something that the customer cannot
take home or physically consume. There is also less quality control over
intangible than over tangible goods.
• Inseparability: the service and the service provider are distinguished by their
inseparability. This means that the event organiser relies heavily on staff and
the performers or participants, depending on the type of event, to meet the
needs of the audience/spectators. Customers associate one event with the
next; they identify with the organisation’s reputation for quality.

109
• Perishability: the fun of an event is transitory; it is rare to have lasting
evidence. The decision to attend or not to attend is generally made shortly
before the event and is irrevocable. If a customer decides not to attend, the
revenue is lost to the event organiser. In contrast to tangible products (such as
soft drinks) that can be bought and sold at a later stage, unsold tickets for an
event cannot be put back on the shelf at a reduced price.
• Consistency: customers demand consistency in for example the artists
performances and it is important to achieve it;
• Variability: different responses from two or more customers to the same
experience.
• Lack of ownership: events do not belong to anyone but are temporarily
enjoyed by many.
The product range may differ in the product lines for tangible goods and the products
are available throughout the year, but in the case of festivals, the products are
intangible, may differ widely and are not available throughout the year: this is more of
an incidental purchase. The positioning of festivals requires some thought to
distinguish one festival from other festivals, which are far away from one another,
and to have it regarded as unique. Positioning in a festival context seems to be more
complex because festivals are geographically dispersed (far away), take place at
different times of the year and each festival has a different approach.
Surprisingly, despite the fact that the concept of positioning is one of the fundamental
components of modern marketing management, marketing researchers have
overlooked issues relating to the positioning of festivals and events, such as in the
case of the three arts festival scenarios chosen for this study. Positioning in a festival
and event context is discussed in the next section.
3.5.5 Positioning in festivals and events
The topic of positioning has received some coverage in the tourism field but only
nominal coverage in festival and event literature, compared to its apparent
110
importance in this area. The only reports on festival and event researchers broadly
covering the topic are mainly in textbooks such as those by Hoyle (2002), Bowdin et
al. (2001), Hughes (2000) and Getz (1997). In academic journals, amongst others the
only references to positioning were by Prentice and Andersen (2003), Chacko and
Fenich (2000), Scott (1996) and Crompton and Love (1995). An array of research
covered the motivating factors for attending festivals, but not much is written about
the contribution that demonstrates motivations.
What motivates people to attend one festival is likely to differ from the motivations for
attending another festival. The research by Scott (1996:121) on the comparison of
visitors’ motivations to attend three urban festivals should be acknowledged.
Scott (1996:127) notes that people’s motivations to attend festivals have implications
for the marketing or positioning of different festivals. He cites the definition by
Morrison (2002:222) which is updated by the author, namely that effective positioning
entails creating an image, communicating customer benefits and differentiating the
brand (festival) from competitive services (festivals). He argues further that festival
organisers/management and marketers could more effectively sell their festivals by
understanding the unique combination of motivations or benefits that visitors seek,
and by formulating promotional strategies which highlight these benefits.
The objective of positioning is to create a distinctive place in the minds of potential
customers. Such a position should create images of an arts festival in the customers'
minds, namely positive images that differentiate the arts festival from other festivals
and portray it as a place that can satisfy their needs and wants (Chacko, 1997:1).
Essentially, if customers are offered a superior product (festival) at a reasonable
price, they are less likely to visit competitors' festivals (Reich, 1999:1).
Hoyle (2002:18) concludes that festival and event marketing relies on the proper
positioning of the product: positioning is the key to a successful marketing plan for
events, festivals and conventions and expositions. Positioning in the festival context
is a strategy for determining, through intuition, research, and evaluation, those areas

111
of consumer needs that the festival can fulfil. Festival marketers should therefore
take heed of the following questions:
• Which niche are we trying to fill?
• What makes us different?
• How can we exploit our unique qualities to market our festivals?
• Which markets will be receptive to our festival concept?
Marketers who can answer these questions have the best opportunity of fulfilling
customer expectations.
Chacko (1997:1) and DiMingo (1988:34) argue that true positioning is the process of
distinguishing a product (festival) from others along real dimensions – or product
features, or corporate values that are meaningful to customers – to become the
preferred product (festival) in the market and maintain a competitive edge. The aim of
positioning is therefore to distinguish your product (festival) as regards the attributes
that have meaning and relevance to the customer. It does not make sense to position
the festival on something customers do not value.
Kotler and Armstrong (2004:239), Hooley, Saunders and Piercy (1998:202) and
Grabler (1997:101) agree that the concept of positioning has become one of the
fundamental components of modern marketing management. It shows how groups of
potential customers (tourists) perceive competing or semi-competing products and
services in the market place. However, positioning has not yet received the attention
in the tourism field as in that of general marketing (Grabler, 1997:101) as the
secondary literature review did not yield any findings on the market positioning of
festivals or arts festivals in South Africa.
This indicates that positioning in tourism is fairly uncommon and that the more
sophisticated techniques of positioning developed in marketing science are not yet
being used in the tourist industry (Grabler, 1997:101).

112
Although various articles on positioning (see Table 3.4) can be found in tourism
literature, few were in a festival context, except for the festival-specific articles by,
among others, Prentice and Andersen (2003:8), Scott (1996:121) and Crompton and
Love (1995:20). The author researched these articles to illustrate which techniques
are used in positioning and which have not been used as much. Table 3.4 contains a
comprehensive summary of the positioning articles reviewed and indicates a vast
number of application studies and various research techniques used for positioning in
the general marketing and tourism literature.

113
Table 3.4: A summary of positioning research articles reviewed and research techniques used in marketing and tourism literature
Author Year Topic Study field
Act
ion-
grid
ana
lysi
s
Ana
lysi
s of
var
ianc
e (A
NO
VA)
Clu
ster
ana
lysi
s
Con
join
t ana
lysi
s
Cor
resp
onde
nce
anal
ysis
Cus
tom
er in
terc
hang
e an
alys
is
Dis
crim
inan
t ana
lysi
s
Des
crip
tive
stat
istic
s
Fact
or a
naly
sis
L ine
ar p
roba
bilit
y m
odel
s (L
ogit
mod
ellin
g)
Mul
tidim
ensi
onal
sca
ling
Mul
tiple
-reg
ress
ion
anal
ysis
M
ultiv
aria
te a
naly
sis
of v
aria
nce
(MA
NO
VA)
Perc
eptu
al m
appi
ng
P ref
eren
ce m
appi
ng
Self-
orga
nisi
ng m
aps
Gam
e th
eory
1 Wilkes, R.E. 1977 Product positioning by multidimensional
scaling.
Advertising
X X
2 Neal, W.D. 1980 Strategic product positioning a step-by
step guide.
Marketing
X
3
Arabie, P., Douglas
C.J., DeSarbo, W.,
Wind, J.
1981 Overlapping clustering: a new method for
product positioning.
Marketing
X
4 Lewis, R.C. 1981 The positioning statement for hotels. Tourism
5 Aaker, D.A. &
Shansby, J.G.
1982 Positioning your product.
Marketing
X
6 Lewis, R.C. 1982 Positioning analysis for hospitality firms. X X
7 Woodside, A.G. 1982 Positioning a province using traveller
research.
Tourism
8 Lewis, R.C. 1984 Isolating differences in hotel attributes. Tourism X X
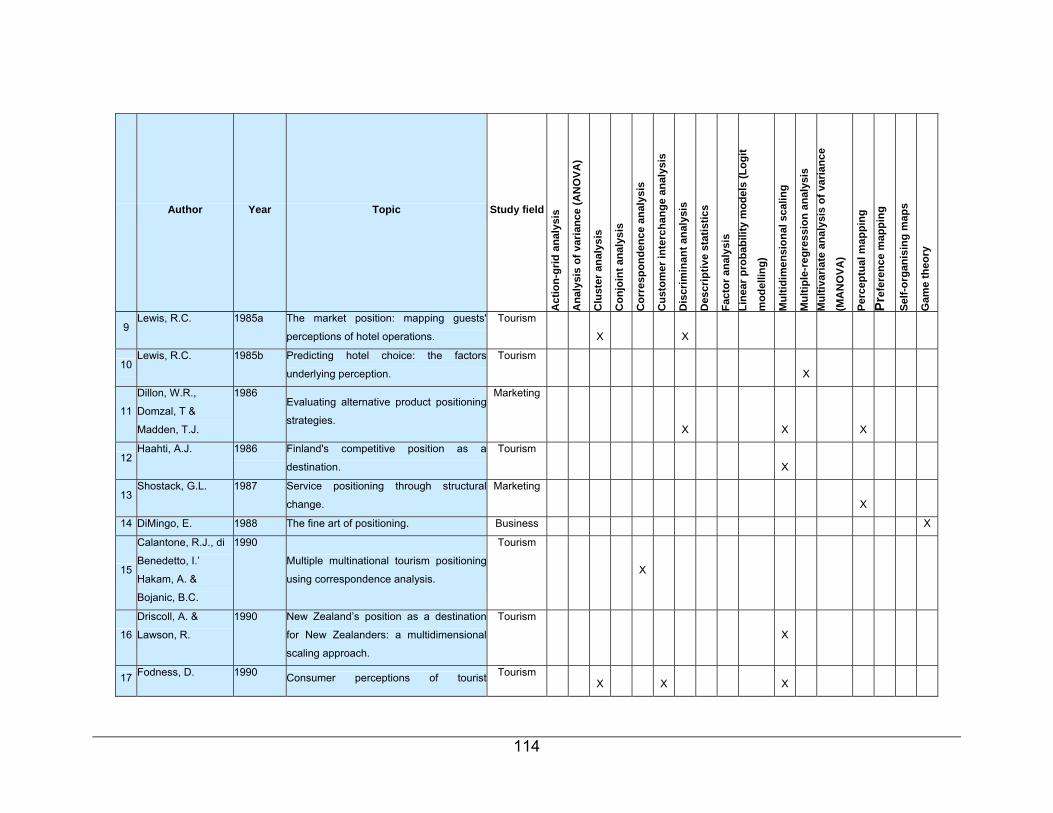
114
Author Year Topic Study field
Act
ion-
grid
ana
lysi
s
Ana
lysi
s of
var
ianc
e (A
NO
VA)
Clu
ster
ana
lysi
s
Con
join
t ana
lysi
s
Cor
resp
onde
nce
anal
ysis
Cus
tom
er in
terc
hang
e an
alys
is
Dis
crim
inan
t ana
lysi
s
Des
crip
tive
stat
istic
s
Fact
or a
naly
sis
L ine
ar p
roba
bilit
y m
odel
s (L
ogit
mod
ellin
g)
Mul
tidim
ensi
onal
sca
ling
Mul
tiple
-reg
ress
ion
anal
ysis
M
ultiv
aria
te a
naly
sis
of v
aria
nce
(MA
NO
VA)
Perc
eptu
al m
appi
ng
P ref
eren
ce m
appi
ng
Self-
orga
nisi
ng m
aps
Gam
e th
eory
9 Lewis, R.C. 1985a The market position: mapping guests'
perceptions of hotel operations.
Tourism
X X
10 Lewis, R.C. 1985b Predicting hotel choice: the factors
underlying perception.
Tourism
X
11
Dillon, W.R.,
Domzal, T &
Madden, T.J.
1986 Evaluating alternative product positioning
strategies.
Marketing
X X X
12 Haahti, A.J. 1986 Finland's competitive position as a
destination.
Tourism
X
13 Shostack, G.L. 1987 Service positioning through structural
change.
Marketing
X
14 DiMingo, E. 1988 The fine art of positioning. Business X
15
Calantone, R.J., di
Benedetto, I.’
Hakam, A. &
Bojanic, B.C.
1990
Multiple multinational tourism positioning
using correspondence analysis.
Tourism
X
16
Driscoll, A. &
Lawson, R.
1990 New Zealand’s position as a destination
for New Zealanders: a multidimensional
scaling approach.
Tourism
X
17 Fodness, D. 1990 Consumer perceptions of tourist Tourism X X X
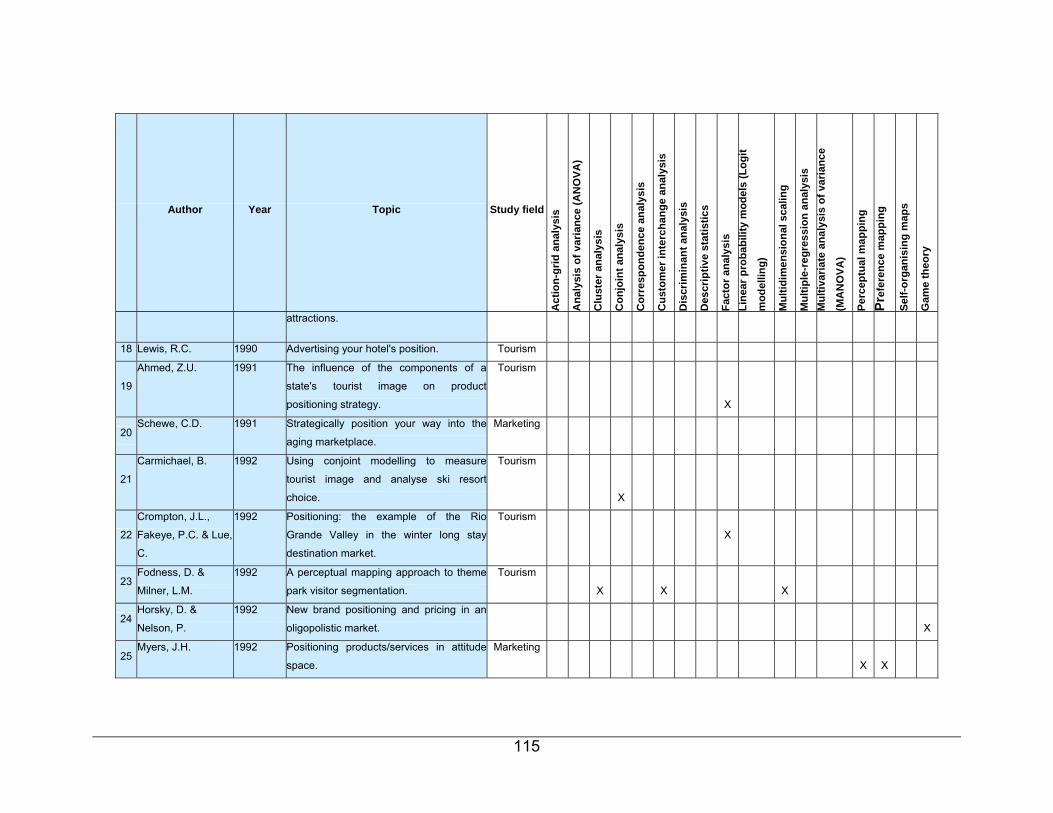
115
Author Year Topic Study field
Act
ion-
grid
ana
lysi
s
Ana
lysi
s of
var
ianc
e (A
NO
VA)
Clu
ster
ana
lysi
s
Con
join
t ana
lysi
s
Cor
resp
onde
nce
anal
ysis
Cus
tom
er in
terc
hang
e an
alys
is
Dis
crim
inan
t ana
lysi
s
Des
crip
tive
stat
istic
s
Fact
or a
naly
sis
L ine
ar p
roba
bilit
y m
odel
s (L
ogit
mod
ellin
g)
Mul
tidim
ensi
onal
sca
ling
Mul
tiple
-reg
ress
ion
anal
ysis
M
ultiv
aria
te a
naly
sis
of v
aria
nce
(MA
NO
VA)
Perc
eptu
al m
appi
ng
P ref
eren
ce m
appi
ng
Self-
orga
nisi
ng m
aps
Gam
e th
eory
attractions.
18 Lewis, R.C. 1990 Advertising your hotel's position. Tourism
19
Ahmed, Z.U. 1991 The influence of the components of a
state's tourist image on product
positioning strategy.
Tourism
X
20 Schewe, C.D. 1991 Strategically position your way into the
aging marketplace.
Marketing
21
Carmichael, B. 1992 Using conjoint modelling to measure
tourist image and analyse ski resort
choice.
Tourism
X
22
Crompton, J.L.,
Fakeye, P.C. & Lue,
C.
1992 Positioning: the example of the Rio
Grande Valley in the winter long stay
destination market.
Tourism
X
23 Fodness, D. &
Milner, L.M.
1992 A perceptual mapping approach to theme
park visitor segmentation.
Tourism
X X X
24 Horsky, D. &
Nelson, P.
1992 New brand positioning and pricing in an
oligopolistic market.
X
25 Myers, J.H. 1992 Positioning products/services in attitude
space.
Marketing
X X

116
Author Year Topic Study field
Act
ion-
grid
ana
lysi
s
Ana
lysi
s of
var
ianc
e (A
NO
VA)
Clu
ster
ana
lysi
s
Con
join
t ana
lysi
s
Cor
resp
onde
nce
anal
ysis
Cus
tom
er in
terc
hang
e an
alys
is
Dis
crim
inan
t ana
lysi
s
Des
crip
tive
stat
istic
s
Fact
or a
naly
sis
L ine
ar p
roba
bilit
y m
odel
s (L
ogit
mod
ellin
g)
Mul
tidim
ensi
onal
sca
ling
Mul
tiple
-reg
ress
ion
anal
ysis
M
ultiv
aria
te a
naly
sis
of v
aria
nce
(MA
NO
VA)
Perc
eptu
al m
appi
ng
P ref
eren
ce m
appi
ng
Self-
orga
nisi
ng m
aps
Gam
e th
eory
26 Shaw, M. 1992 Positioning and price: merging theory,
strategy, and tactics.
Tourism
27 Echtner, C.M &
Ritchie, J.R.B.
1993 The measurement of destination image:
an empirical assessment.
Tourism
X
28
Manrai, L.A. &
Manrai, A.K.
1993 Positioning European countries as brands
in a perceptual map: an empirical study of
determinants of consumer perceptions
and preferences.
Tourism
X
29
Crompton, J.L. &
Love, L.L.
1995 The predictive validity of alternative
approaches to evaluating quality of a
festival.
Tourism
X
30
Dev, C.S., Morgan,
M.S. & Shoemaker,
S.
1995
A positioning analysis of hotel brands.
Tourism
X
X
31
Mazanec, J 1995 Positioning analysis with self-organizing
maps: an exploratory study on luxury
hotels.
Tourism
X
32
Kim, H. 1996 Perceptual mapping of attributes and
preferences: an empirical examination of
hotel F&B products in Korea.
Tourism
X
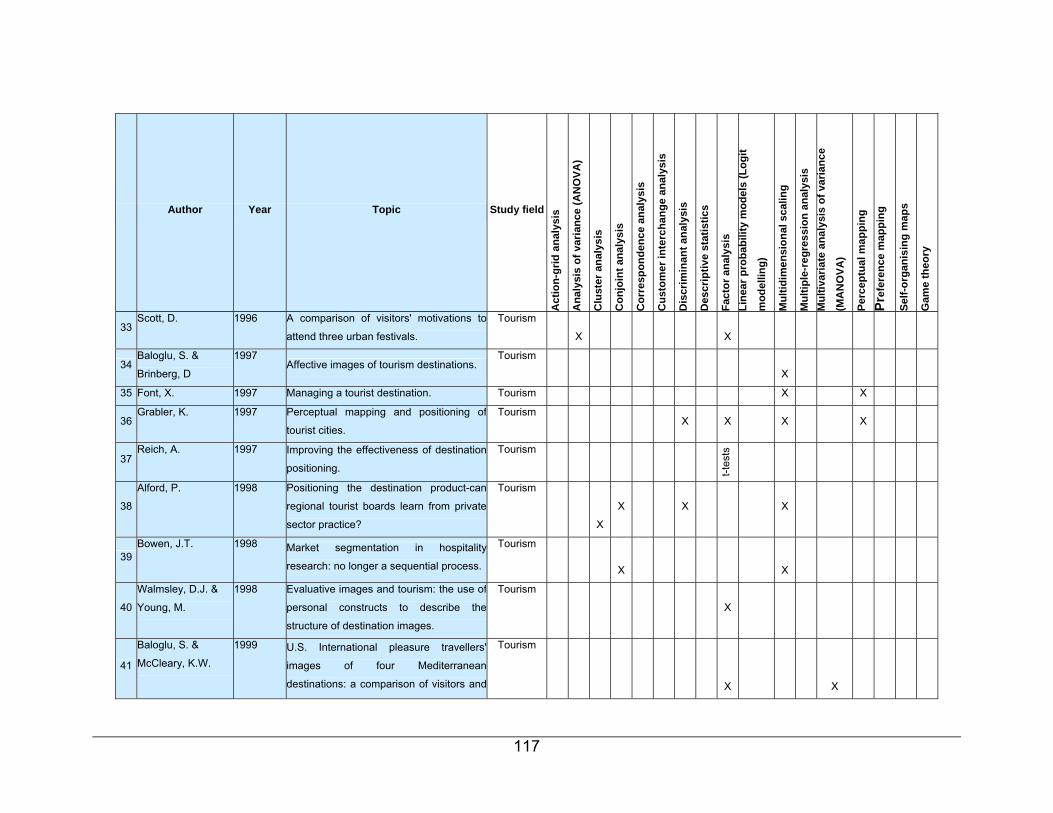
117
Author Year Topic Study field
Act
ion-
grid
ana
lysi
s
Ana
lysi
s of
var
ianc
e (A
NO
VA)
Clu
ster
ana
lysi
s
Con
join
t ana
lysi
s
Cor
resp
onde
nce
anal
ysis
Cus
tom
er in
terc
hang
e an
alys
is
Dis
crim
inan
t ana
lysi
s
Des
crip
tive
stat
istic
s
Fact
or a
naly
sis
L ine
ar p
roba
bilit
y m
odel
s (L
ogit
mod
ellin
g)
Mul
tidim
ensi
onal
sca
ling
Mul
tiple
-reg
ress
ion
anal
ysis
M
ultiv
aria
te a
naly
sis
of v
aria
nce
(MA
NO
VA)
Perc
eptu
al m
appi
ng
P ref
eren
ce m
appi
ng
Self-
orga
nisi
ng m
aps
Gam
e th
eory
33 Scott, D. 1996 A comparison of visitors' motivations to
attend three urban festivals.
Tourism
X X
34 Baloglu, S. &
Brinberg, D
1997 Affective images of tourism destinations.
Tourism
X
35 Font, X. 1997 Managing a tourist destination. Tourism X X
36 Grabler, K. 1997 Perceptual mapping and positioning of
tourist cities.
Tourism
X
X
X
X
37 Reich, A. 1997 Improving the effectiveness of destination
positioning.
Tourism
t-tes
ts
38
Alford, P. 1998 Positioning the destination product-can
regional tourist boards learn from private
sector practice?
Tourism
X
X
X
X
39 Bowen, J.T. 1998 Market segmentation in hospitality
research: no longer a sequential process.
Tourism
X X
40
Walmsley, D.J. &
Young, M.
1998 Evaluative images and tourism: the use of
personal constructs to describe the
structure of destination images.
Tourism
X
41
Baloglu, S. &
McCleary, K.W.
1999 U.S. International pleasure travellers'
images of four Mediterranean
destinations: a comparison of visitors and
Tourism
X X

118
Author Year Topic Study field
Act
ion-
grid
ana
lysi
s
Ana
lysi
s of
var
ianc
e (A
NO
VA)
Clu
ster
ana
lysi
s
Con
join
t ana
lysi
s
Cor
resp
onde
nce
anal
ysis
Cus
tom
er in
terc
hang
e an
alys
is
Dis
crim
inan
t ana
lysi
s
Des
crip
tive
stat
istic
s
Fact
or a
naly
sis
L ine
ar p
roba
bilit
y m
odel
s (L
ogit
mod
ellin
g)
Mul
tidim
ensi
onal
sca
ling
Mul
tiple
-reg
ress
ion
anal
ysis
M
ultiv
aria
te a
naly
sis
of v
aria
nce
(MA
NO
VA)
Perc
eptu
al m
appi
ng
P ref
eren
ce m
appi
ng
Self-
orga
nisi
ng m
aps
Gam
e th
eory
non-visitors.
42
Botha, C.,
Crompton, J.L. &
Kim, S.
1999 Developing a revised competitive position
for Sun/Lost City, South Africa.
Tourism
X
43
Mazanec, J.A. 1999 Simultaneous positioning and
segmentation analysis with topologically
ordered feature maps: a tour operator
example.
Tourism
X X
44 Nickerson, N.P. &
Moisey, N.
1999 Branding a state from features to
positioning: Making it simple?
Tourism
X X
45 Andreu, L., Bigne,
J.E. & Cooper, C.
2000 Projected perceived image of Spain as a
tourist destination for British Travellers.
Tourism
X
46 Chacko, H.E. &
Fenich, G.G.
2000 Determining the importance of US
convention destination attributes.
Tourism
x X
47
Uysal, M. Chen,
J.S. & Williams,
P.R.
2000 Increasing state market share through a
regional positioning.
Tourism
X
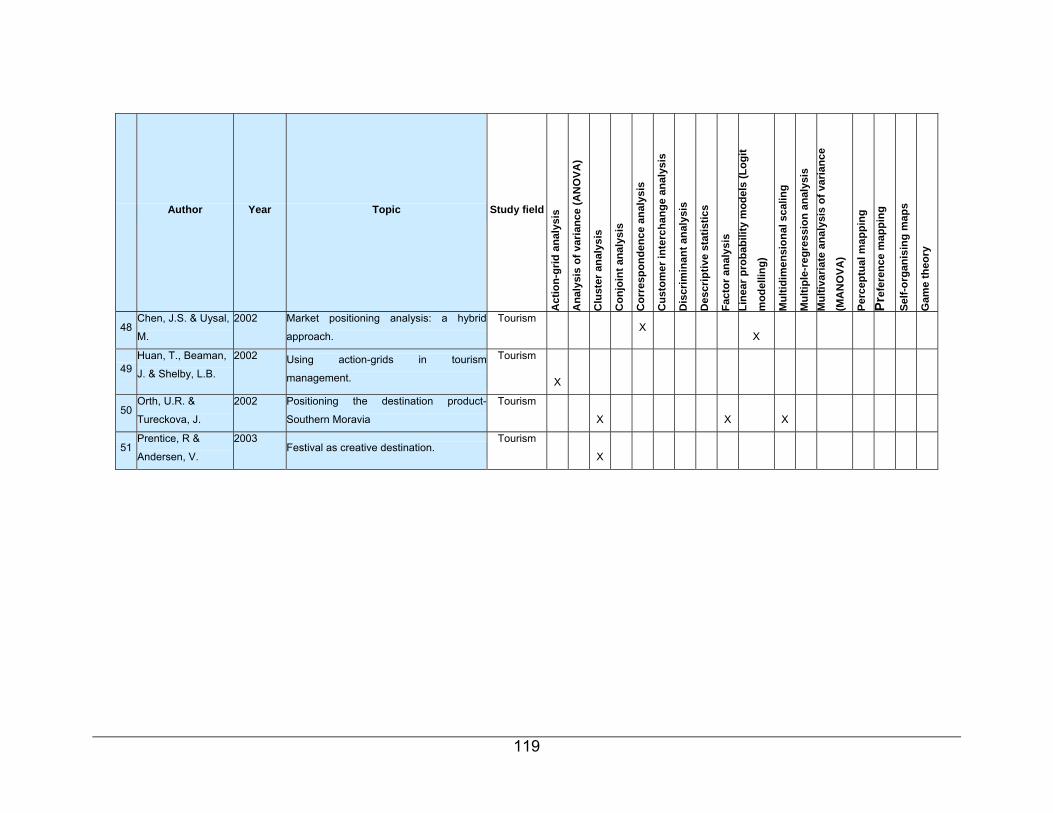
119
Author Year Topic Study field
Act
ion-
grid
ana
lysi
s
Ana
lysi
s of
var
ianc
e (A
NO
VA)
Clu
ster
ana
lysi
s
Con
join
t ana
lysi
s
Cor
resp
onde
nce
anal
ysis
Cus
tom
er in
terc
hang
e an
alys
is
Dis
crim
inan
t ana
lysi
s
Des
crip
tive
stat
istic
s
Fact
or a
naly
sis
L ine
ar p
roba
bilit
y m
odel
s (L
ogit
mod
ellin
g)
Mul
tidim
ensi
onal
sca
ling
Mul
tiple
-reg
ress
ion
anal
ysis
M
ultiv
aria
te a
naly
sis
of v
aria
nce
(MA
NO
VA)
Perc
eptu
al m
appi
ng
P ref
eren
ce m
appi
ng
Self-
orga
nisi
ng m
aps
Gam
e th
eory
48 Chen, J.S. & Uysal, M.
2002 Market positioning analysis: a hybrid
approach.
Tourism
X
X
49 Huan, T., Beaman,
J. & Shelby, L.B.
2002 Using action-grids in tourism
management.
Tourism
X
50 Orth, U.R. &
Tureckova, J.
2002 Positioning the destination product-
Southern Moravia
Tourism
X X X
51 Prentice, R &
Andersen, V.
2003 Festival as creative destination.
Tourism
X

120
In Table 3.4 positioning literature review demonstrates that various techniques are
used in the positioning process. Only 5 of the 51 articles on positioning reviewed,
employed the method of conjoint analysis, which demonstrates the minor use of this
technique in positioning an arts festival. However, the technique of game theory was
applied to marketing; only 1 article was linked with positioning and none in a tourism
context. The game theory technique is frequently applied to economics and on the
search “game theory and economics” in the database EconLit 2003-2005/05 a mere
53 records were returned.
The most popular techniques used for positioning research in the tourism and
marketing field of the 51 articles reviewed, were the following:
• perceptual and preference mapping in 13 cases
• factor analysis in 12 cases
• cluster analysis in nine cases
• multidimensional scaling in eight cases
• conjoint and discriminant analysis in five cases
• correspondence analysis in three cases
• analysis of variance (ANOVA) and multivariate analysis of variance
(MANOVA), customer interchange analysis, multiple regression and self-
organising maps in two cases each, and
• action-grid analysis, descriptive statistics, and linear probability models
(LOGIT) and game theory once.
The most popular techniques used in positioning research in these fields were
therefore perceptual and preference mapping, factor and cluster analysis and
multidimensional scaling.
It is clear that successfully positioning a product (festival) in the market requires more
than intuition and creative genius, therefore researchers have to depend upon
methods and techniques to understand the complex field (Hooley, Saunders &
Piercy, 1998:202).

121
Since positioning is based on customers’ perceptions, it is only partly under the
control of marketers (Dagmar Recklies, 2001:2). It is therefore advisable to use in-
depth market research techniques to determine the relevant parameters and gain an
understanding of how customers rate different products and marketing variables.
As the author is now familiar with positioning in the festival context due to the
covering of relevant literature, the current study addresses the different market
positioning models, the steps to be followed in the positioning process and the
various techniques or methods applied.
3.6 RESEARCH ON POSITIONING (MODELS OF POSITIONING)
Building upon the definitions of positioning in both marketing and tourism and more
specifically in arts festivals, six different market-positioning models (with the various
techniques used in the positioning process) are discussed, namely (1) Ries and Trout
(2001, 1982, 1981) the pioneers in the marketing field; (2) Boyd and Walker (1990)
who present some of the most comprehensive or thorough coverage of positioning
research in marketing; (3) Kotler (2003, 2000, 1991), one of the world’s foremost
authorities on marketing who, along with hospitality marketing experts Kotler, Bowen
and Makens (2003, 1999, 1996) applied marketing to the tourism industry; (4)
Lovelock (2003, 1991, 1984), one of the first to apply positioning to a service
business in the market place; (5) Aaker and Shansby (1982), marketing and
marketing strategy gurus with their six stages of developing a positioning strategy;
and (6) Reich (1999, 1997), who applied positioning to a tourism destination and
states that it can be applied to any hospitality-related product.
These six models are emphasised in the tourism literature by Reich (1999) though
relatively little research has been done and only minor attention given to the festival
and event scene.
122
In addition, these six positioning models were selected for the following reasons: the
models developed by Ries & Trout (2001), Kotler (2000), as well as Boyd and Walker
(1990) – the prominent authors of market positioning – have been adopted and
employed in the tourism literature. They have also received a considerate amount of
attention in marketing (consumer behaviour) and tourism literature.
Lovelock (2003) recognises positioning and applies it to the services marketing
business. He lists the pitfalls if businesses/festivals do not position themselves
effectively in the market. Aaker and Shansby (1982), who are frequently cited in the
tourism literature, draw conclusions on how to develop a positioning strategy in
marketing. Reich (1999, 1997) introduced and applies the topic of positioning to
hospitality and tourism marketing as well as to tourism destinations.
3.6.1 Pioneering model by Ries and Trout (2001, 1982, 1981)
Ries and Trout (2001:219-228), the pioneers of positioning in the marketing field,
suggest that one should work through the following six questions to get started on a
positioning programme:
• What position do you own?
• What position do you want to own?
• Whom must you outgun?
• Do you have enough money?
• Can you stick it out?
• Do you match your position?
They later expanded these ideas in a book (Ries & Trout, 2001:219; 1981:193). Their
principle of positioning is expressed in the following terms: “Instead of starting with
yourself, you start with the mind of the prospect. Instead of asking what you are, you
ask what position you already own in the mind of the prospect.

123
Changing minds in our over communicated society is an extremely difficult task. It’s
much easier to work with what you really are.”
In recent years, however, writers such as Kotler (2000) on the subject have also
credited Ries and Trout with being the authors who popularised the term positioning.
In their seminal work (2001:2; 1986), they conclude that:
• “Positioning starts with the product. A piece of merchandise, a service, a
company, an institution, or even a person. Perhaps yourself.”
At the same time, they note that it should be recognised that positioning is not what is
done to the product, but rather what is done to the mind of the prospect (i.e.
customer). The essence is to position the service or product in the mind of the
customer, so that “… positioning shifts the emphasis of marketing from the product to
the battle for your mind”. A newer definition entails ”…how you differentiate yourself
in the mind of your prospect" (2001:3).
Ries and Trout (1981:242) therefore focus on the end product of positioning
strategies, namely the position the product holds in the minds of customers.
However, they were criticised for viewing positioning in the limited context of
advertising as they asserted that positioning was achieved by “manipulating
customers’ perceptions of reality.” Other authors subsequently expanded on this
pioneering notion of positioning as it was recognised that it involved much more than
creative advertising (Crompton, Fakeye & Lue, 1992:20).
Ries and Trout (2001, 1982), together with a number of authors (Evans cited in
Baker, 2003:279; Woodside, 1982:2) note that positioning is finding a niche in the
mind of the customer and occupying that niche. Positioning is not something that is
done to the product, but is something that marketers do to the minds of customers
(Evans cited in Baker, 2003:280). However, Boyd and Walker (1990:333) also refer
to the work of Ries and Trout in their model for market targeting and positioning
decisions.

124
3.6.2 Market targeting and positioning decisions model by Boyd and Walker (1990:315-344)
In their publication, Marketing management: a strategic approach, these authors
(1990:315) present some of the most comprehensive and thorough coverage of
positioning research. They begin by defining the two terms:
• Market targeting – “determining which segment or segments within a market
the firm will direct its marketing efforts toward”;
• Market positioning – “designing a marketing program and product that a
segment’s customers will perceive as desirable, and that will give the firm a
differential advantage over current and potential competitors”.
Furthermore, they manage to link the two terms in describing the process of market
targeting and positioning. These two strategic decisions are the focus of their
comprehensive research. Firstly, evaluating the target market becomes increasingly
important, as customers' needs, organisation resources and objectives, or competitor
actions change over time and need to be adjusted. Secondly, once the target
segment is chosen, the critical question arises: “How can the business or
organisation position its offering so that customers perceive it as providing desired
benefits – and at the same time gain an advantage over current and potential
competitors?”
Only a few organisations utilise mass markets, and most will divide the market into
segments with relatively homogeneous requirements. Managers will then create a
marketing mix (products, prices, place and promotion) designed to attract the chosen
segments. A market’s attractiveness/business position matrix is recommended by the
authors as it provides a useful tool to help managers decide which market segments
to target and how to allocate resources and marketing efforts.

125
After choosing the appropriate targeting strategy (mass-market, niche and growth-
market strategy), it should be noted that the chosen market segments might change
over time due to changing customers' needs and competitors' actions or the
organisation's own objectives and resources. This means that the organisation’s
position in the marketplace has to be analysed and evaluated constantly.
Positioning, therefore, concerns the perceived match between a particular
product/service offering and the target market (Boyd & Walker, 1990:327). In some
instances, as in the case of the arts festival, positioning analysis provides useful
information to the marketer by identifying the festival's unique attributes and thus
differentiating it from other festival offerings in the market. The process of
determining the perceived positions of a set of product (festival) offerings and
evaluating strategies for positioning a new entry or repositioning an existing one,
involves the steps as set out in Figure 3.3.
An eight-step process is proposed for determining existing perceptions and making a
positioning decision for a new product or for repositioning a current product (Boyd &
Walker,1990:328). The steps in the positioning process have been adapted by
applying it to festivals in this research to fit into the framework of the current study,
and are shown in Figure 3.3:
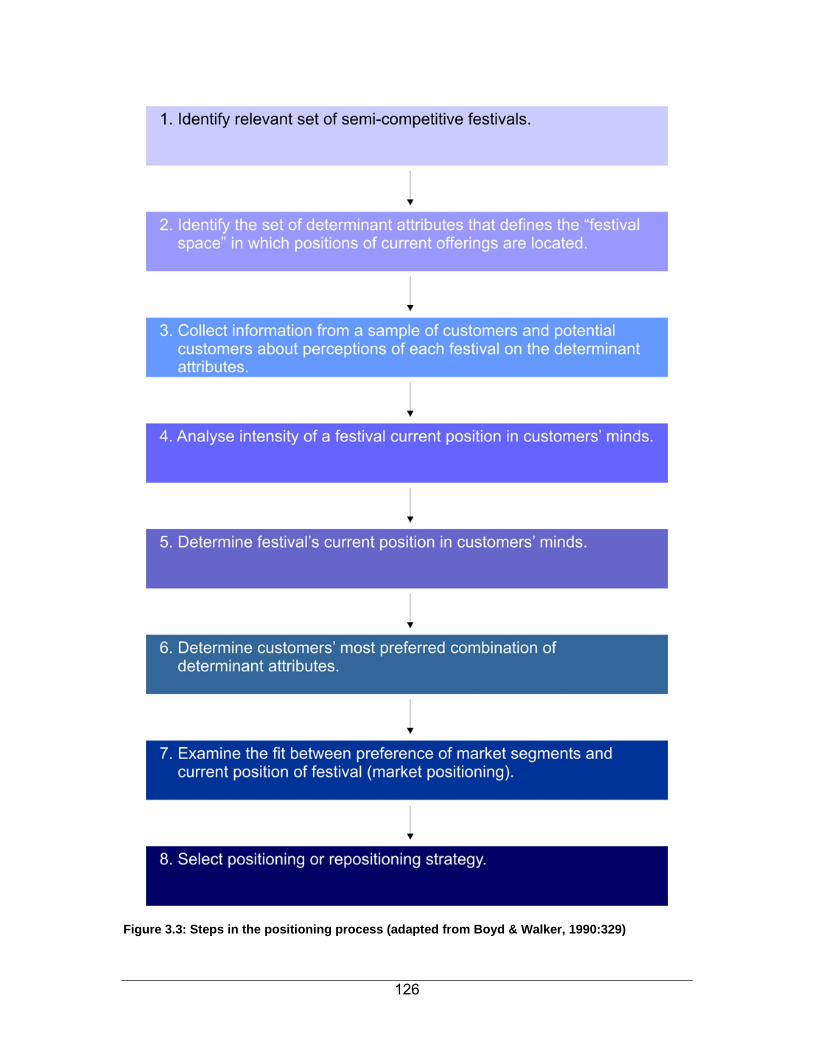
126
Figure 3.3: Steps in the positioning process (adapted from Boyd & Walker, 1990:329)

127
Each of these steps is introduced next, in the scope of the current study.
Step1: Identify a relevant set of festivals (products) First identify a relevant set of semi-competing arts festivals in the South African
festival market. Positioning analysis is undertaken on both the product category
(festival offering) and brand level. The product category level includes various
products regarded as substitutes for the product a business’s management is
attempting to position. Positioning of the product category and brand level examines
customer perceptions about the types of products they might consider as substitutes
to satisfy the same basic need.
Brand-level analysis is concerned with how the festival's/business’s brand is viewed
in terms of various important attributes as compared with other brands. The
positioning analysis should help determine the strengths and weaknesses relative to
others, and potentially viable or more suitable positions based on the festival’s
attributes. To understand the position of the festival in the market, the manager could
obtain customer perceptions of the other festivals and compare these to likely
substitute festivals, using various determinant attributes. Positioning maps can be
used in this case, although Boyd and Walker (1990:331) warn against a myopic view,
which conducts only a brand-level positioning analysis because it might overlook
threats from possible substitutes in other product categories.
Step 2: Identify determinant attributes that define the festival (product) space Determinant attributes should be identified in order to create the positioning maps in
Step 1. Determining these attributes will depend on the analytical technique the
marketer uses. The attributes applied in this study were derived from the authors
previous study where one of the objectives was to identify most prominent push and
pull factors in the arts festival context (Van Zyl, 2002:9).

128
Findings from the mentioned study concluded that some attributes, such as the
atmosphere at the festival (push attributes) may be important but are generally not
critical to the customer's decision on whether or not to attend the festival.
Determinant (pull) attributes are those that have the greatest influence on choice and
only these attributes should be used in the analysis. Previous research in this regard
identified a set of critical or determinant product (festival) attributes (Van Zyl,
2002:125):
• entertainment or festival activities
• refreshments (food and beverages)
• transport
• ticket prices.
Step 3: Collect information from a sample of customers and potential customers about their perceptions of each product on the determinant attributes (determine customers’ perceptions) Several techniques help marketers to collect and analyse customers’ perceptions
about the positions of alternative festival products or brands, and identify the
determinant attributes underlying those perceptions. Factor analysis, discriminant
analysis, conjoint measurement and multidimensional scaling are common
techniques used to identify perceptions. Table 3.5 briefly describes these techniques
as well as some of their advantages and disadvantages.

129
Table 3.5: Alternative techniques used for analysing customers' perceptions of the semi-competitive positions of different festival products or brands
1. Factor analysis 2. Discriminant analysis
3. Multi-attribute compositional models (conjoint measurement)
4. Multidimensional scaling (MDS)
To employ factor
analysis, the analyst first
has to identify the salient
attributes consumers
use to evaluate festival
products in the study
field. Then the analyst
collects data from a
sample of consumers
concerning their ratings
of each product or brand
on all attributes. The
factor analysis program
uses the data to
determine which
attributes are related to
the same underlying
construct.
The analyst uses those
underlying constructs or
factors as the
dimensions for a product
space map, and the
program indicates where
each product or brand is
perceived to be located
on each factor.
The technique
requires the same
input data as
factor analysis.
This program
then determines
the consumers’
perceptual
dimensions, on
the basis of which
attributes best
differentiate or
discriminate
among brands.
These underlying
dimensions can
be used to
construct a
product space
map; but they are
usually not as
easy to interpret
as the factors
identified through
factor analysis.
Conjoint
measurement
determines which
combination of a
limited number of
attributes is most
preferred by
consumers.
Unlike the other techniques, where
the underlying dimensions
identified depend on the attributes
supplied by the researcher when
collecting data, multidimensional
scaling produces dimensions
based on consumer judgements
about the similarity of – or their
preferences for – the actual
brands. These underlying
dimensions are thought to be the
basic affective dimensions that
consumers actually use to
evaluate alternative brands in the
product class. MDS programmes
that use similarity data construct
geometrically spaced maps on
which the brands perceived to be
most similar are placed together.
Those that use consumer
preferences produce joint space
maps that show consumer ideal
points and then position the most
preferred brands close to those
points.
Advantages: The analyst
can use objective and
Advantages: As
with factor
Advantages: The
technique is helpful
Advantages: it allows determinant
attributes to be inferred from

130
1. Factor analysis 2. Discriminant analysis
3. Multi-attribute compositional models (conjoint measurement)
4. Multidimensional scaling (MDS)
subjective attributes; and
the dimensions of the
product space are
relatively easy to
determine and interpret.
Disadvantages: The
analyst has to identify
the salient attributes
before collecting data;
and the factors identified
are a function of the
attributes used in data
collection.
analysis, the
underlying
dimensions may
be a function of
the attributes
used to collect
consumer ratings
rather than that of
the product
features that
consumers
actually regard as
most important.
for identifying
appealing new
product designs and
important points that
might be included in a
product’s advertising.
Disadvantages:
Although it can
provide some insights
into consumer
preferences, it cannot
provide information
about how
consumers perceive
the positioning of
existing products in
relation to product
dimensions.
customer perceptions about
similarities and differences among
product offerings
Disadvantages: The underlying
dimensions of the maps produced
by MDS can be difficult to interpret.
In addition, the dimensions
identified are only those that
already exist for currently available
brands. This makes the technique
less useful for investigating new-
product concepts that might
involve new characteristics. Finally,
the technique is subject to
statistical limitations when the
number of alternative brands being
investigated is small. As a rule,
such techniques should only be
used when at least eight or more
different products or brands are
being examined.
Source: Boyd & Walker (1990)
Boyd and Walker (1990) recommend multidimensional scaling (perceptual maps)
because of its ability to identify underlying attributes without a priori assumptions.
The primary advantage is that multidimensional scaling allows determinant attributes
to be inferred from customer perceptions about similarities and differences among
product offerings.
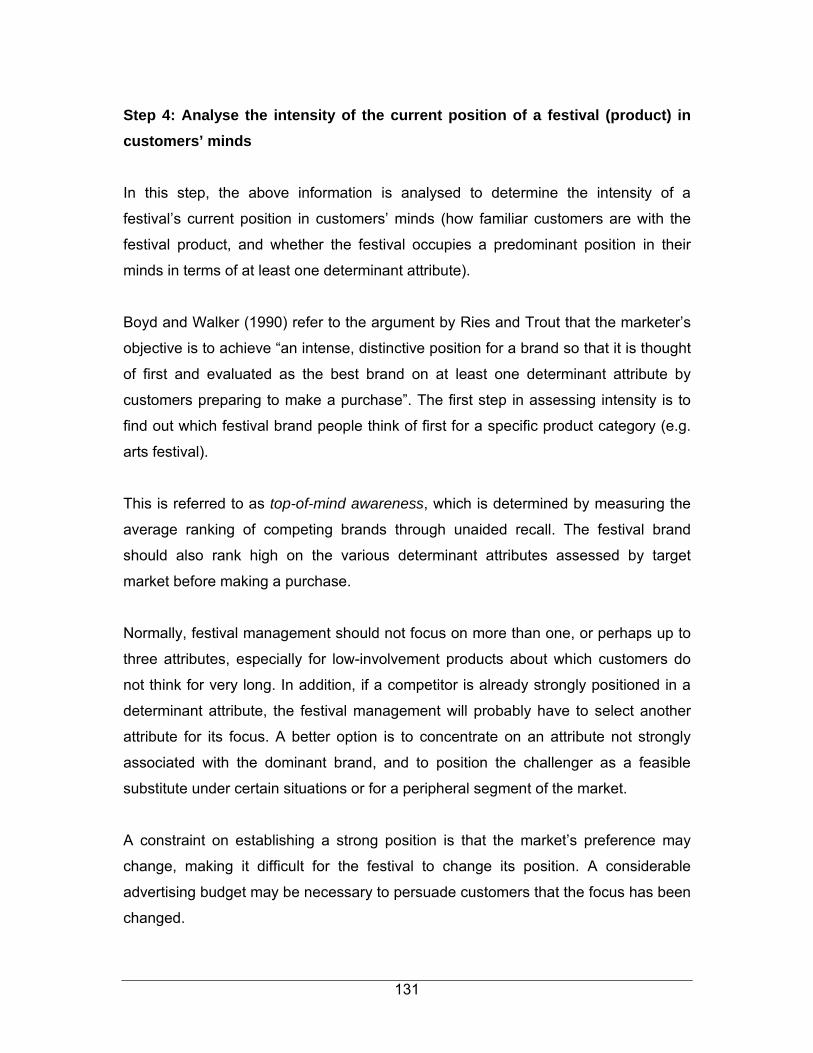
131
Step 4: Analyse the intensity of the current position of a festival (product) in customers’ minds In this step, the above information is analysed to determine the intensity of a
festival’s current position in customers’ minds (how familiar customers are with the
festival product, and whether the festival occupies a predominant position in their
minds in terms of at least one determinant attribute).
Boyd and Walker (1990) refer to the argument by Ries and Trout that the marketer’s
objective is to achieve “an intense, distinctive position for a brand so that it is thought
of first and evaluated as the best brand on at least one determinant attribute by
customers preparing to make a purchase”. The first step in assessing intensity is to
find out which festival brand people think of first for a specific product category (e.g.
arts festival).
This is referred to as top-of-mind awareness, which is determined by measuring the
average ranking of competing brands through unaided recall. The festival brand
should also rank high on the various determinant attributes assessed by target
market before making a purchase.
Normally, festival management should not focus on more than one, or perhaps up to
three attributes, especially for low-involvement products about which customers do
not think for very long. In addition, if a competitor is already strongly positioned in a
determinant attribute, the festival management will probably have to select another
attribute for its focus. A better option is to concentrate on an attribute not strongly
associated with the dominant brand, and to position the challenger as a feasible
substitute under certain situations or for a peripheral segment of the market.
A constraint on establishing a strong position is that the market’s preference may
change, making it difficult for the festival to change its position. A considerable
advertising budget may be necessary to persuade customers that the focus has been
changed.
132
Step 5: Determine the festival’s current location in the product space (product positioning) or analyse the current relative position of the festival (product) The location of the festival’s position relative to other festivals in the festival (product)
space is analysed in Step 5. Positioning maps with determinant attributes as the axes
can be used in the process (see Chapter 5, Section 5.3.4, Figure 5.4 for an
example). Analysing these maps can also give marketers information about any gaps
not currently being filled in the market.
Product positioning indicates how alternative products or brands are positioned
relative to one another in customers’ minds. Product positioning analysis has
limitations because it does not tell the marketer which positions appeal most to
customers. To overcome these limitations, the next step, market-positioning analysis,
is carried out.
Step 6: Market positioning – determine customers’ most preferred combination of determinant attributes The customers’ most preferred combination of determinant attributes should be
determined next. This requires the collection of additional data (Step 6). These
preferences can also be located in the festival space. The festival data are analysed
by means of various statistical techniques such as discriminant or factor analysis,
multivariate and multidimensional scaling (customers are surveyed to ascertain their
ideal product for any specific category), conjoint analysis, game theory, regression
analysis and t-tests. Then the festival’s product is compared with the attributes of this
ideal product. This step introduces the methodology used, which is discussed in
detail in Chapters 4 and 5.
133
Step 7: Examine the fit between preferences of market segments and the current position of the product (market positioning) or define market positioning and market segmentation The market-positioning map can also be used to identify market segments. In
addition to the location of various brands or products on the axes, segments of
customers with similar needs and wants can be identified. If most customers cluster
around one point on the positioning map, there is probably one segment for the
applicable variables. Two or more clusters denote distinct segments with different
requirements. The size of the segments can be represented on the map by varying
the size of a circle used for the segment. This step helps to inform marketers about
how well a festival is positioned to meet each segment’s needs and wants, what
positioning the semi-competitors have and what possibility there is of finding a unique
position in the market.
Because differences between customers’ ideal points reflect variations in the benefits
they seek, a market positioning analysis can simultaneously identify distinct market
segments as well as the perceived positions of different brands.
Step 8: Select positioning or repositioning strategies
In Step 8, the degree of fit between the positions of semi-competitive festivals
(products) and the preferences of various market segments can be examined as a
basis for choosing a successful strategy for positioning a new entry or for
repositioning an existing festival (product). The selection of a position considers the
preferences of market segments and the positions of semi-competing festivals. The
highest means or highest differentiators are taken to select the desired strategy.
Managers can use these highest means/differentiators to develop a positioning
strategy.
The basic choices include (Boyd & Walker, 1990:343-345):

134
• mono-segment positioning: targeting a marketing programme at a single
market segment;
• multisegment positioning: finding a location between two segments whose
needs and wants the business can satisfy;
• imitative positioning: the business can select the same position as an existing
successful brand, hoping that it can attract some of its customers. Since this
strategy will often elicit a response from the similar semi-competitor,
businesses attempting it should have some kind of competitive advantage,
such as a newer concept, a larger advertising budget or a better-quality
product;
• defensive positioning: if a business determines that it is vulnerable to imitation
positioning, it could defend itself by introducing similar products for its current
market. The purpose of this strategy would be to lower the attractiveness of its
market segment; and
• anticipatory positioning: if there is currently little demand for a certain location
on the positioning map, but marketers feel that demand will increase, then this
position might be pursued.
The positioning model by Boyd and Walker (1990) is often cited along with that of the
authoritative marketing author Kotler (2003, 2000, 1991), which have also been
adapted to other fields of study such as banking and insurances.
3.6.3 Kotler’s (2003, 2000, 1991) differentiation and positioning model
Kotler’s differentiation and positioning model receives considerable attention in
marketing and the tourism literature (Morrison, 2002:225; Bennett & Strydom,
2001:61; Middleton, 2001:129; Morgan & Pritchard, 2001:248; Kalafatis et al.,
2000:416; Swarbrooke & Horner, 1999:182; Reich, 1999:2; Vellas & Becherel,
1999:53; Hooley, Saunders & Piercy, 1998:203; Lumsdon, 1997:63). Kotler
(1991:374) focuses on identifying the unique attributes of the target market and
states: “In general, firms will occupy different competitive positions in the target
market”.
135
Kotler (2000:298) defines positioning as “the act of designing the company’s image
and value offer so that the segment’s customers understand and appreciate what the
company stands for in relation to its competitors”. He also defines differentiation and
positioning:
• “differentiation is the act of designing a set of meaningful differences to
distinguish the company’s offering from competitors’ offerings”; and
• “positioning is the act of designing the company’s offering and image to
occupy a distinctive place in the target market’s mind” (Kotler, 2000:298).
Although the definitions are virtually identical, Kotler views differentiation and
positioning as a linked pair of planning activities, firstly focusing on what to
differentiate, and secondly considering how to promote the differences so that they
will be valued by target customers. Once a festival has decided what segments to
enter, it should decide on its market positioning strategy and communicate it.
When developing a positioning strategy, marketers need a good understanding of
how their product differs from others. Kotler (2000:298) suggests that a difference is
worth establishing to the extent that it should satisfy the following criteria:
• important to a sufficient number of buyers;
• distinctive, i.e. the difference is not offered in the same way, or at all, by others
in the market;
• superior to others in achieving the same/more benefit;
• pre-emptive, i.e. difficult for others in the market to copy;
• affordable for the target market or buyers; and
• profitable and possible for the organisation to introduce the difference.
Kotler refers to Ries and Trout (1982), stating that a festival should select “one
consistent positioning message” or a “unique selling proposition” (USP) and stick to it
and heavily promote only that one benefit.

136
Since the target market tends to remember the “number one” message better than
others – particularly in today’s over-communicated society – this comment is still valid
today.
Typically, in the festival and event arena lower ticket prices, greater value, sufficient
safe parking at venues, high quality performances and excellent ticketing service are
examples of such single-benefit positioning messages. However, Kotler furthermore
proposes a double or triple benefit positioning strategy, depending on the
orginisation's/festival's specific nature. In addition, if semi-competing festivals
promote similar benefits, then an additional benefit or two could be added to the
strategy. One of the advantages of using benefit or need-based segmentation is that
it is most useful in determining the positioning strategy.
Kotler warns organisations/festivals of four major positioning errors, as listed in Table
3.6.
Table 3.6: Four major positioning errors as documented by Kotler
Under-positioning Over-positioning Confused positioning Doubtful positioning
Some companies discover
that buyers have only a
vague idea of the brand.
Buyers do not really know
something special about
it.
Buyers may have too
narrow an image of the
brand.
Buyers could have a
confused image of the
brand. This confusion
might result from making
too many claims or
changing the brand’s
positioning too frequently.
Buyers may find it hard
to believe the brand
claims in view of the
product’s features, price
or manufacturer.
Source: Kotler (2000:300)
When deciding which position to adopt, an organisation/festival should promote its
major strengths, provided the target market values these strengths. To overcome the
problem many organisations/festivals face of how to release the psychological grip
that large brands have on the market, an organisation/festival can decide on
determining the position on various attributes compared to semi-competitors, the
importance of improving on that position, the affordability and speed with which the
137
position can be changed, the semi-competitors’ ability to improve their position, and a
recommendation on what to do for each positioning attribute (among others hold,
improve, monitor).
If it is found that a festival and a semi-competitor are equally well rated in terms of
value, an important attribute for their target market, the festival has essentially two
options. It can either select another attribute to promote, or it can promote value and
one or more additional attributes. Once the positioning decision is made,
management can go ahead and select its marketing mix variables.
The world’s foremost marketing expert, Kotler (2000, 1991) co-author along with
Kotler, Bowen and Makens (2003, 1999, 1996) shares his knowledge and expertise,
applying it to hospitality and tourism marketing. Accordingly, market positioning
follows market segmentation and target marketing, and a product’s position is
therefore the way the product is defined by customers on important attributes – the
place the product occupies in customers’ minds relative to competing products
(Kotler et al., 2003:264).
Since customers do not have the time to evaluate products every time they make a
purchase, they perceptually position products based on how well the product
compares with alternatives. Different positioning strategies can be followed (Kotler et
al., 2003:282):
• attribute positioning: focusing on specific product attributes, such as Aardklop
Festival advertises its location near Gauteng;
• benefit positioning: focusing on the needs products fill or the benefits they
offer, for instance KKNK advertises itself as an “in place” or with ample food
and beverages;
• use or application positioning: positioning the product as best for some use or
application;
• user positioning: certain classes of users such as a festival advertising itself
as a “women’s arts festival”;
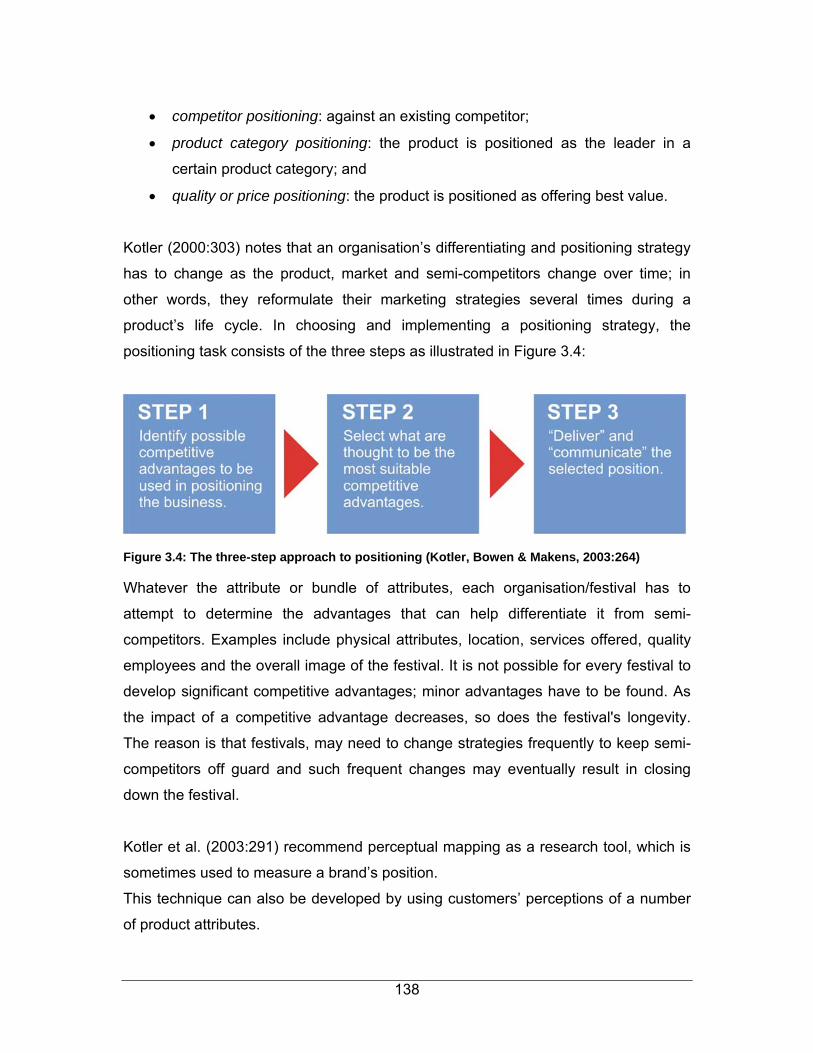
138
• competitor positioning: against an existing competitor;
• product category positioning: the product is positioned as the leader in a
certain product category; and
• quality or price positioning: the product is positioned as offering best value.
Kotler (2000:303) notes that an organisation’s differentiating and positioning strategy
has to change as the product, market and semi-competitors change over time; in
other words, they reformulate their marketing strategies several times during a
product’s life cycle. In choosing and implementing a positioning strategy, the
positioning task consists of the three steps as illustrated in Figure 3.4:
Figure 3.4: The three-step approach to positioning (Kotler, Bowen & Makens, 2003:264)
Whatever the attribute or bundle of attributes, each organisation/festival has to
attempt to determine the advantages that can help differentiate it from semi-
competitors. Examples include physical attributes, location, services offered, quality
employees and the overall image of the festival. It is not possible for every festival to
develop significant competitive advantages; minor advantages have to be found. As
the impact of a competitive advantage decreases, so does the festival's longevity.
The reason is that festivals, may need to change strategies frequently to keep semi-
competitors off guard and such frequent changes may eventually result in closing
down the festival.
Kotler et al. (2003:291) recommend perceptual mapping as a research tool, which is
sometimes used to measure a brand’s position.
This technique can also be developed by using customers’ perceptions of a number
of product attributes.

139
Multiple maps plotting different attributes should be studied to get a good "feel" for
the market place. Determining the right position should therefore be based on the
requirements of being important, distinctive, superior, communicable, pre-emptive,
affordable and profitable (Kotler et al., 2003:289).
After selecting the positioning characteristics and a positioning statement, the festival
then determines how it will communicate the position, differentiate from other
competitors and organise its marketing mix of variables to support it. The next
authors positioning model will be introduced. Lovelock and Wirtz’s (2004:57)
services positioning model note that positioning is the key to developing an effective
competitive posture, as discussed in the next section.
3.6.4 Lovelock and Wirtz’s (2004) and Lovelock’s (2003, 1991, 1984) model for positioning a service in the market
Lovelock covers positioning as a service in the market place and begins his model by
differentiating between goods and services. He defines this differentiation as the
process of establishing and maintaining a distinctive place in the market for an
organisation and/or its individual product offerings (Lovelock & Wirtz, 2004:57;
Lovelock, 1991:110). Heskett’s (1984:45) view is supported in that the service
business has to separate itself from semi-competitors by differentiating or altering the
common characteristics of its industry. In addition, repositioning is defined simply as
changing the existing position (Lovelock & Wirtz, 2004:57; Lovelock, 1991:110).
Lovelock further notes that many marketers associate positioning with the
promotional elements of the marketing mix, which he terms copy positioning, thus
ignoring the overall aspects of the term product positioning. Lovelock and Wirtz
(2004:64) and Lovelock (1991:111) highlight the uses of positioning for “product
development, service delivery, pricing, and communications strategy”. Three
procedures are involved in developing a positioning strategy for a service
organisation, namely market analysis, competitive analysis and internal analysis.
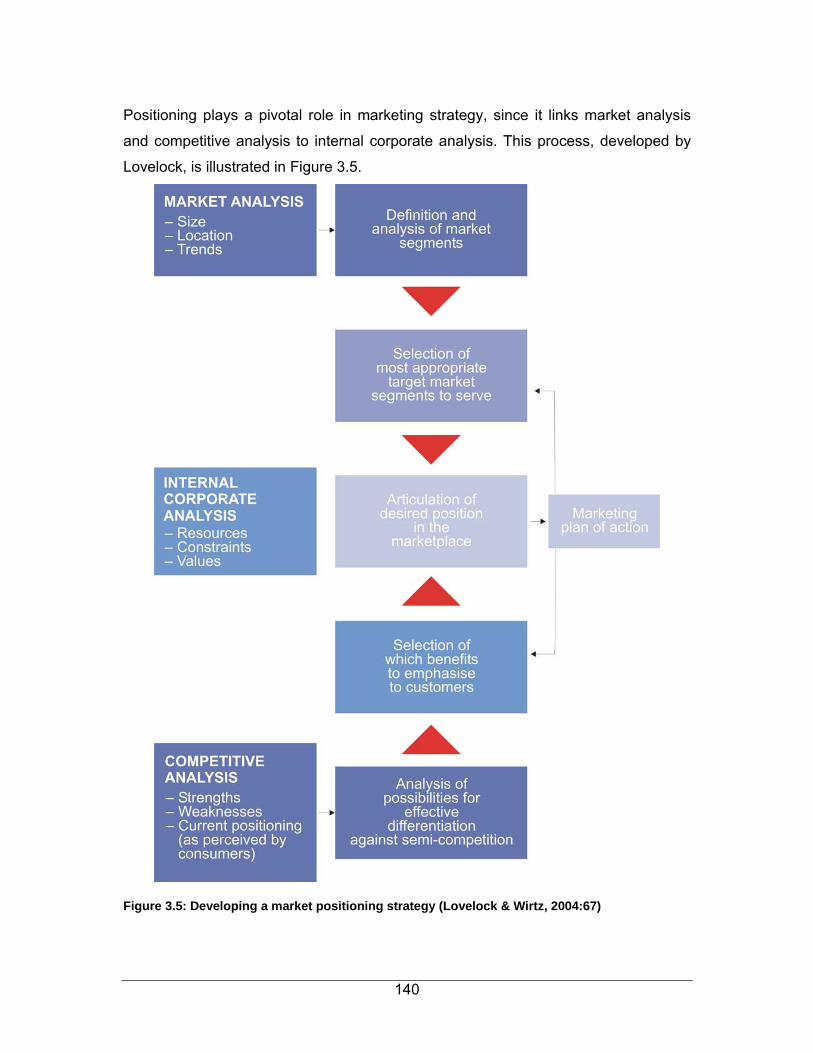
140
Positioning plays a pivotal role in marketing strategy, since it links market analysis
and competitive analysis to internal corporate analysis. This process, developed by
Lovelock, is illustrated in Figure 3.5.
Figure 3.5: Developing a market positioning strategy (Lovelock & Wirtz, 2004:67)

141
A positioning statement can be developed from these three procedures, enabling the
service organisation to answer the following questions:
• What is our product (or service concept)?
• How does it differ from competitive offerings?
• How well does it meet the needs of customers in different market segments?
A positioning strategy may have to be developed for the organisation, for a given
outlet or for a specific service. Failing to select a desired position in the marketplace
may have the following results:
1. facing head-on competition from stronger semi-competitors;
2. being pushed into a position with little customer demand;
3. customers not knowing how the firm is positioned (why they should
select it over other options);
4. having no position at all in the marketplace, because no one is aware
of it.
Once a position has been selected, management should prepare for the possibility
that a semi-competitor may select the same or a similar position, and the potential
reactions of that firm. One way to avoid this copying is to perform a detailed
competitor analysis, including developing the likely position that may be selected by
primary competitors.
Lovelock (2003) also recommends the use of positioning maps to identify perceived
differences in how customers view a firm or its offering. Of critical significance is the
differentiation between determinant attributes (key to determining choice) and
important attributes (those that are expected and offered by most semi-competitors).
Lovelock is careful to generalise about the priorities of a particular market segment.
142
Needs may vary for the same person, based on the purpose of the purchase, the
person(s) making the decision, timing (evening, day, week, season, and so forth),
whether alone or in a group, and the composition of the group. Some attributes are
easy to quantify, such as price or speed of service, but qualitative attributes, such as
atmosphere, may be more difficult to determine.
Lovelock concludes with a recommendation that, because of the dynamics of the
marketplace, managers should reassess their positions. Lovelock (cited in Alford,
1998:55) argues that positioning services involve developing and communicating key
product attributes, and are not primarily about creating advertising images. In
contrast to image, position requires a frame of reference, which is provided by
competitive destinations (Crompton, 1992:20). It is a stage subsequent to market
segmentation at which the marketer determines which of the visitor target market’s
important needs a destination is better able to service than its semi-competitors. By
contrast, Aaker and Shansby (1982:56) once again emphasise market segmentation
and matching the product to the needs of those segments, as discussed in the next
model.
3.6.5 Positioning strategy model by Aaker and Shansby (1982)
The positioning strategy model developed by Aaker and Shansby (1982:56) has
received attention in marketing and the tourism literature (Reich, 1999:73; Alford,
1998:55; Chacko, 1997:5; Crompton, Fakeye & Lue, 1992:20). They note that most
marketingmanagers address positioning questions; but positioning means different
things to different people. Yet all of the managers consider and address positioning
as a niche in the mind of the customer or attendee. Positioning is concerned with
three issues: the segmentation decision, image and the selection of a destination’s
features to emphasise (Aaker & Shansby, 1982:56).
The approach adopted by Aaker and Shansby of emphasising market segmenting
and then matching the products to the needs of those segments, is also taken by
Woodside (1982:2) in the tourism field.

143
Woodside (1982:2) suggests that the key to successful positioning is matching the
benefits provided by a destination or festival with the benefits sought by a target
market considering that destination or festival.
This relationship between attributes and benefits sought is evident in Kotler’s
(2000:404) explanation of product branding, a subject closely allied to positioning.
Kotler (2000:404) views branding as having six levels of meaning: attributes;
benefits; values; culture; personality and user. In addition, it may be argued that the
positioning decision is the most critical decision for a destination because it is central
to determining visitors’ perceptions and their choices (Crompton, Fakeye & Lue,
1992:20). It is the key to developing an effective competitive posture (Lovelock,
1984:134). Aaker and Shansby (1982:56) state: “Since all elements of the marketing
program can potentially affect the position, it is usually necessary to use a positioning
strategy as a focus for the development of the marketing program. A clear positioning
strategy can insure that the elements of the marketing program are consistent and
supportive.” Furthermore they provide the following six approaches to positioning
strategies:
1. positioning by attribute;
2. positioning by price/quality;
3. positioning with regard to use or application;
4. positioning by the product user;
5. positioning with regard to a product class; and
6. positioning with regard to a competitor.
Developing a strategy involves organising and synthesising different types of
information. The identification and selection of a positioning strategy are complex, but
the strategy is likely to be most effective if its evolution is supported by marketing
research. Burnett (1993:59) believes that “positioning is only as good as the research
it is based on”.
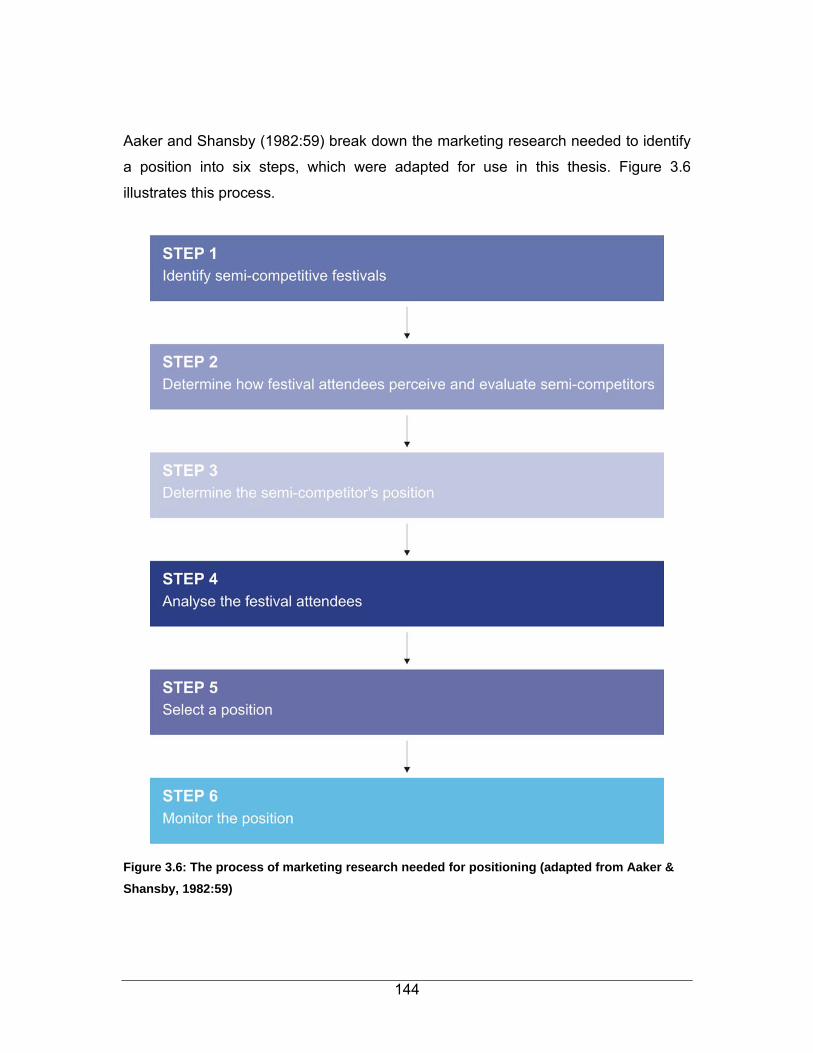
144
Aaker and Shansby (1982:59) break down the marketing research needed to identify
a position into six steps, which were adapted for use in this thesis. Figure 3.6
illustrates this process.
Figure 3.6: The process of marketing research needed for positioning (adapted from Aaker & Shansby, 1982:59)

145
In the first step, semi-competitive festivals, which include both primary and secondary
competitors, are identified. The second step is to determine how these semi-
competitors are perceived and evaluated by attendees. Identifying festival attributes
and measuring their relative importance by interviewing attendees achieves this.
Attributes include festival characteristics and attendees' benefits as well as the way
the festival is associated and compared with a competitive festival.
Thirdly, a semi-competitor’s position is analysed by measuring its characteristics.
This can be done through attribute-based multidimensional scaling (tourists are
asked to rate various elements on the attribute dimension scale), or by non-attribute-
based multidimensional scaling (which reflects the similarity of two objects in the
eyes of tourists). The fourth step is to analyse attendees by identifying which festival
attributes they perceive as being most important and then identifying groups of
tourists who value similar attributes. A position is selected by revising the information
derived from the first four steps. Five considerations are suggested prior to making
this final decision (Aaker & Shansby 1982:68):
1. the decision should be guided by an economic analysis based on potential
market size and penetration probability;
2. segmentation commitment;
3. sticking with successful advertising;
4. do not try to be something that you are not;
5. considering symbols likely to be associated with a tourist destination; and
6. monitoring of the position after it has been selected, since it may change over
time.
To summarise, positioning decisions often mean selecting those associations and
attributes to be emphasised, and those to be de-emphasised (Aaker & Shansby,
1982:56). Reich (1999, 1997) acknowledges most of the positioning models and
formulates his positioning process for tourism destinations and hospitality-related
product offerings.

146
3.6.6 Reich’s (1999, 1997) model for positioning tourism destinations
Reich (1999:78) proposes a positioning process, which can be applied to any
hospitality-related product, such as an arts festival. He believes that strategies need
a process to position hospitality-related products or a festival effectively in the
market. Though there is no single process or formula that will yield a perfect
positioning strategy, marketers should proceed in the most effective and efficient
manner possible. This model is reported but was not used in total, although elements
thereof overlap and was used, in the present research. Based on his experience in
the field and literature review, Reich (1999:78) recommends the positioning process
as shown in Figure 3.7.
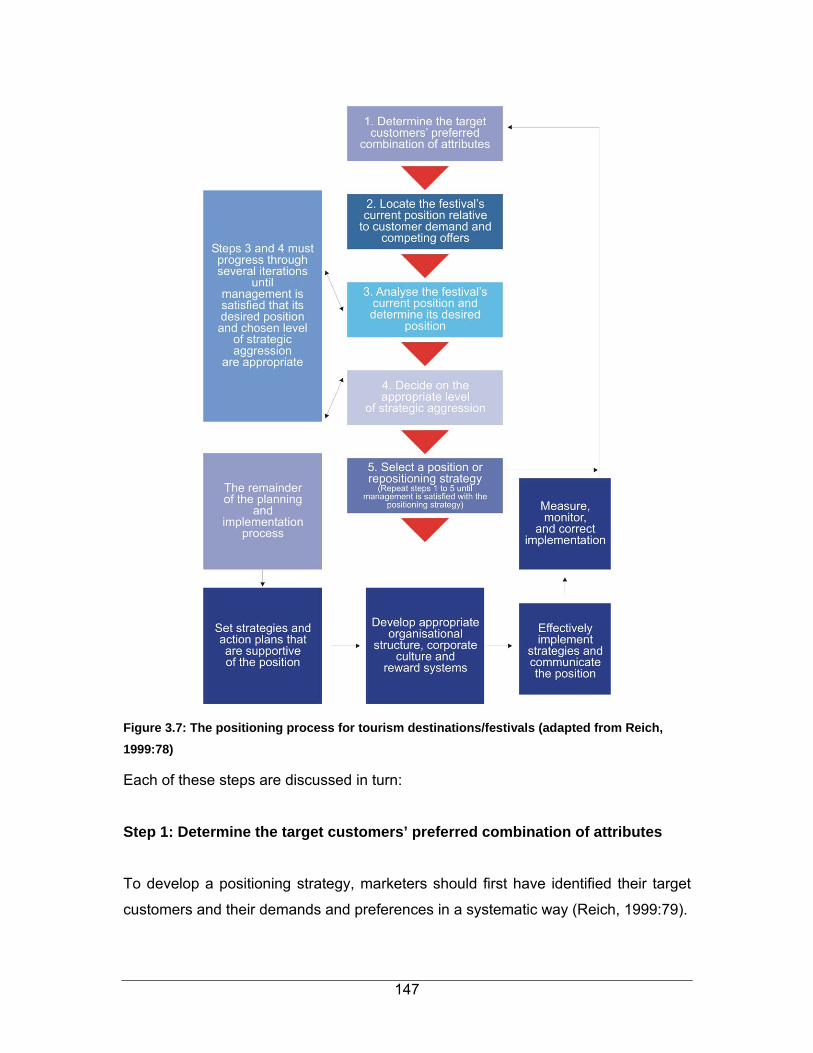
147
Figure 3.7: The positioning process for tourism destinations/festivals (adapted from Reich, 1999:78)
Each of these steps are discussed in turn:
Step 1: Determine the target customers’ preferred combination of attributes To develop a positioning strategy, marketers should first have identified their target
customers and their demands and preferences in a systematic way (Reich, 1999:79).

148
This is often a neglected area and to a certain extent it is easier to repeat what has
been done in the past instead of taking the time to analyse the broader markets for
untapped sources of customers (Reich, 1999:79).
The task of identifying preferred attributes is based on research methods (Reich,
1999:79). Since the second step in the positioning process deals with locating a
festival’s position and concurrently has a major research component, readers can
review it for recommendations on finding out what travellers or attendees expect. If
desired, steps one and two of the positioning process can be combined.
Future desired attributes: as a festival tries to find a unique position in its market, it
obviously has to study its customers' preferences and semi-competitors' offerings.
What customers desire in the near and long-term future can often be determined by
asking customers questions. Although such information is valuable it may not yield
enough differentiation to determine a unique and defendable position.
Step 2: Determine the target customers’ preferred combination of attributes or locate the festival's current position relative to customer demand and competing offers. Locate the geographic destination’s (festival’s) current linear position relative to customer demand and competing offers Instead of the usual positioning maps, a market position model or linear positioning is
designed to:
• display the destination (festival) and its environment graphically;
• help to explain and quantify the destination’s position relative to semi-
competing firms; and
• assist in selecting a future desired position.
There is a tendency for an organisation’s market position to move forward and
backward in a linear manner. There is also generally a direct (linear) and graphic
relationship between the image of a destination (and the primary components of that

149
image, such as product quality and value) and its financial success. The main
advantage of the market-position model over positioning maps is that it represents
the overall or linear position, as opposed to its position on selected attributes.
Although positioning maps play a supportive role in this task, they are valuable and
useful for determining the specific future position, rather than determining the overall
current position. The purpose here is not to discriminate between variables, but
rather to position the destination or festival based on how customers perceive it
holistically.
Step 3: Analyse the festival current position and determine its desired position: Market-position model for linear positioning
Determining the market position assists festivals by providing a graphic means of
displaying position information. A festival should determine its desired position (the
most effective combination of products to offer), because this would inform everyone
how resources should be allocated. Together with the impact of environmental
factors such as the economy, societal changes and competitors’ actions will
determine the festival’s market position. In Step 4, management is required to decide
how aggressive it should be to achieve the desired position.
Step 4: Decide on the appropriate level of strategic aggression Steps 3 and 4 have to progress through iterations until management is satisfied that
its desired position and chosen level of strategic aggression are appropriate. Only
then can management decide how aggressively they should act to achieve the
desired position. The festival must now decide on the choices available: whether it
should be proactive (identify opportunities and act before competitors), reactive
(“copy-cat” or quickly following innovators), passive (do the same with little focus on
changes, because this is what its market expects), adaptive (choose to be flexible to
allow the festival to adapt to a stable environment) or discordant (not a viable
selection, one that is acquired through poor performance, rather than chosen).
150
Sometimes more aggressive strategic options are needed to achieve desired
positions.
Step 5: Select a positioning or repositioning strategy Up to this point, management has gained information about its target customers’
desired attributes, the performance of the festival and of the performance by semi-
competitors and their current positions, the desired future position for the geographic
area, the forecast positions of semi-competitors and the appropriate level of strategic
aggression. Now management has to begin the process of deciding which attributes
should be focused on to achieve this desired position.
Repeat Steps 1 to 5 until management is satisfied with its new positioning strategy.
Before positioning decisions are made, management has to understand its attributes
thoroughly and they should review the environmental factors to learn about the
unique needs (attributes) of its targeted markets. Time should be taken before
making the positioning decisions. The goal is to satisfy customers in a manner that
will make the festival stand out from other festivals.
Reich (1999:108) notes that positioning and implementing the strategies are as
important as the strategies themselves. Reich concludes his model by addressing
positioning maps and makes extensive use of the work by Barich and Kotler
(1991:94-104).
Positioning models in the generic marketing field as well as the travel, tourism and
hospitality field were included. These six models discussed above were selected on
the basis of their marketing orientation and the significance of their contribution to the
topic of positioning in the current study. However, it should be noted that some
excellent references were not included owing to the similarity of their contents.

151
The six positioning models are dissected and evaluated to choose the most
appropriate model. Although these six models offer similarities, some distinct features
differentiate them from one another.
A decision was taken that the model by Boyd and Walker (1990) would be used,
based on the extensive research done on the topic among the six positioning models
researched. Boyd and Walker present some of the most thorough coverage of
positioning. They begin by offering definitions of the two terms, market targeting and
market positioning. A detailed description of the process should be followed in the
case of each of these two terms. The eight steps to be followed in determining
existing perceptions and the positioning decision for a new product or the
repositioning of a current product are outlined. As illustrated in Figure 3.3, this model
is workable for the current study because of the ease with which the model (the steps
in the positioning process) could be applied or adapted to the needs of the current
study.
The model by Ries and Trout (2001) has been incorporated into virtually all the
positioning research conducted. They were the first to popularise the concept of
positioning, as it concerned the communication or advertising elements of
positioning. The model of positioning is relatively recent and is generally attributed to
Ries and Trout.
These two authors wrote a book, titled Positioning: the battle for your mind (2001:3;
1982), in which they observe, “… positioning is what you do to the mind of the
prospect.” Since then other marketers have endorsed their idea and expanded on
their original concept or model. Kotler (2000) adopts the theme of Ries and Trout and
addresses positioning according to these authors' work in 1982. Kotler introduces
positioning of the product offering through the product life cycle. This is of value to
the current study as the three arts festivals chosen for this study are in the maturity
stage and, as arts festivals are in semi-competition (with other festivals), they copy
new ideas or attributes.

152
Therefore, festivals that can introduce new and valued benefits early are the ones
that will be profitable (Kotler, 2000:321). The body of positioning knowledge of Kotler
and Ries and Trout is acknowledged as some of the most widely quoted in literature.
These authors’ models have not been used specifically, although they are widely
incorporated into the literature framework of the study owing to their resemblance to
generic marketing.
Kotler distinguishes between positioning, which he sometimes calls product
positioning and competitive positioning. However, Kotler does not use the term
market position. He begins his positioning and differentiation model by offering
certain criteria to be met when developing a positioning strategy. Kotler introduced
the single, double and triple benefit positioning strategies and warns
organisations/festivals against the four major positioning errors (see Table 3.6).
Kotler later shared his knowledge with Bowen and Makens (2003, 1999, 1996) and
applied this knowledge to hospitality and marketing. Together these three authors
introduced the three-step approach to positioning (see Figure 3.4), which is useful in
the context of the current study but as it has a rather simplified nature, it has not
been used.
Lovelock and Wirtz (2004) and Lovelock (2003) cover positioning services in the
market place and leads up to his model by noting the differences between products
or goods and services. He addresses these differences as the problems and
challenges inherent in marketing a service product. Due to their intangible nature,
arts festivals have characteristics of services. Lovelock’s marketing textbook uses
Pearce’s model (see Figure 3.5) for developing positioning strategies.
This model proposes three procedures for developing a positioning strategy: market
analysis, internal analysis and competitor analysis. Lovelock argues that positioning
a service involves developing and communicating key product attributes, and does
not concern creating advertising images. He also warns against and lists certain
pitfalls for businesses/festivals, which do not effectively position these attributes. He
recommends the use of positioning maps and introduces repositioning.
153
Although his model provides a valid methodology, which allows researchers to be
equally accurate in determining attributes, it cannot accurately assess the customer’s
perceptions and is therefore not practicable for the current study.
Aaker and Shansby (1982) apply the approach of selecting a positioning-strategy
model, presented in a six-step process (see Figure 3.6). This model is similar to the
eight-step model by Boyd and Walker (see Figure 3.3) but has a more simplified
approach and two fewer steps. Although the Aaker and Shansby model is workable,
that of Boyd and Walker offers more detail in its application. Therefore the model by
Aaker and Shansby has not been used in the current study.
Although Reich’s five-step positioning model (see Figure 3.7) offers comprehensive
positioning research and a workable option, it shows similarities to the eight-step
model of Boyd and Walker (see Figure 3.3). Reich’s concepts of linear positioning
and strategic aggression are not covered in Boyd and Walker’s model. The current
study has not used Reich’s model, as some of the steps are duplicated in the model
by Boyd and Walker. This latter model proved to be the preferred model for the
current study.
Festivals and events face various problems when positioning themselves in the
market owing to the intangible outcomes and inseparable nature of the festival
product. Considering these challenges, one of the main tasks facing tourism
marketers of leisure products, such as arts festivals, is to overcome the challenge of
effectively positioning the brand (Morgan & Pritchard, 2001:261).
Therefore arts festivals operating in the tourism industry should pay special attention
to their branding decisions. Branding is also closely related to positioning (Kotler,
2004:30). The concept of branding is discussed in Section 3.7.

154
3.7 FESTIVAL BRANDING
Branding, among other things, is a way to position a festival product to create
recognition and perception in the market (Lewis & Chambers, 2000:321). Branding is
one of the oldest techniques in product marketing and is also a means of adding
perceived value or benefit to a product (Holloway, 2004:134). In the age of
information technology, branding is one of the most powerful tools a marketer can
use (Dickman, 1999:156).
Perreault and McCarthy (2002:260) state that branding involves the use of a name,
term, symbol, or design – or a combination of these – to identify a product.
Customers, and in this case festival attendees, view a brand as an important part of
the product, and branding can add value to that product (Armstrong & Kotler,
2003:289). A brand consists of a brand name and a brand mark (Pride & Ferrell,
2003:297). A brand name refers to the part of the brand that can be expressed
verbally. This includes the use of letters, words and numbers, such as KKNK.
The development of a brand name may in due course give the arts festival a
competitive advantage, but has to be monitored to ensure that this benefit endures.
The element of a brand that is not made up of words – often a symbol or design – is
a brand mark. An example is the flag of the Grahamstown National Arts festival, as
illustrated in Figure 3.8.
Figure 3.8: An illustration of an arts festival’s brand mark
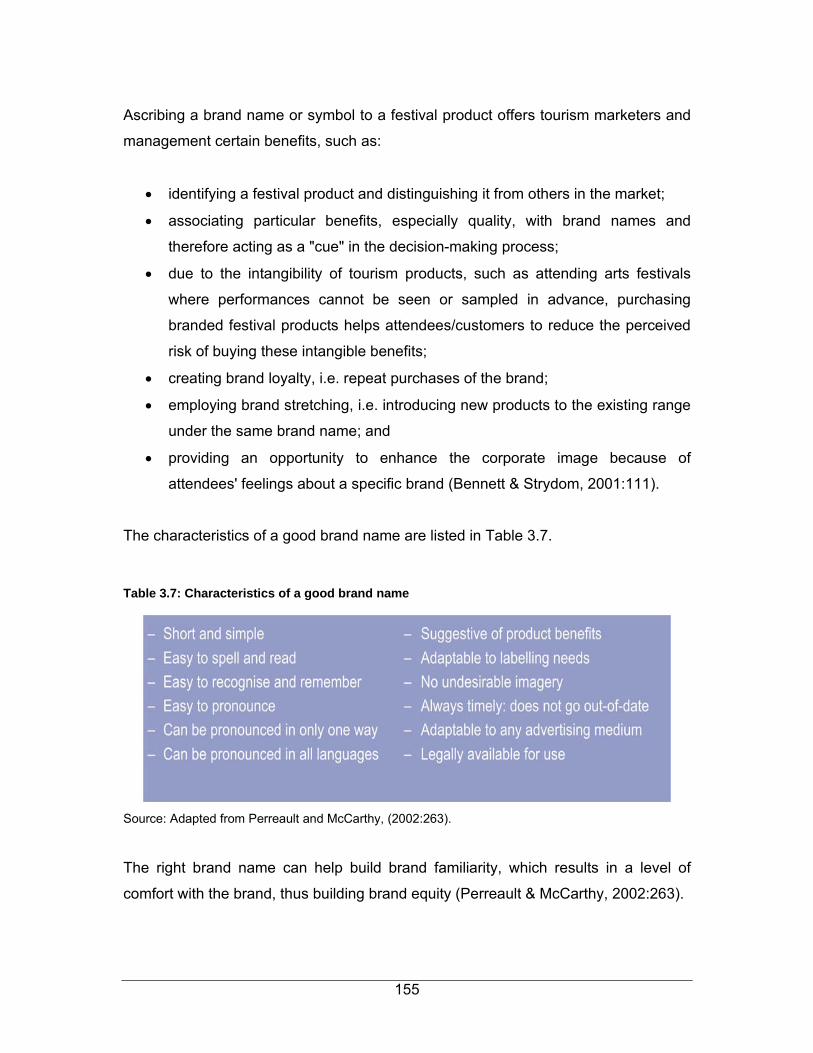
155
Ascribing a brand name or symbol to a festival product offers tourism marketers and
management certain benefits, such as:
• identifying a festival product and distinguishing it from others in the market;
• associating particular benefits, especially quality, with brand names and
therefore acting as a "cue" in the decision-making process;
• due to the intangibility of tourism products, such as attending arts festivals
where performances cannot be seen or sampled in advance, purchasing
branded festival products helps attendees/customers to reduce the perceived
risk of buying these intangible benefits;
• creating brand loyalty, i.e. repeat purchases of the brand;
• employing brand stretching, i.e. introducing new products to the existing range
under the same brand name; and
• providing an opportunity to enhance the corporate image because of
attendees' feelings about a specific brand (Bennett & Strydom, 2001:111).
The characteristics of a good brand name are listed in Table 3.7.
Table 3.7: Characteristics of a good brand name
Source: Adapted from Perreault and McCarthy, (2002:263).
The right brand name can help build brand familiarity, which results in a level of
comfort with the brand, thus building brand equity (Perreault & McCarthy, 2002:263).

156
A well-managed brand is an asset to an organisation and the value of this asset is
referred to as brand equity. Brand equity is therefore the marketing and financial
value associated with a brand’s strength in the market (Pride & Ferrell, 2003:299).
The four major elements underlying brand equity are illustrated in Figure 3.9.
Figure 3.9: The four major elements of brand equity (Aaker, adapted in Pride & Ferrell, 2003:300)
One of the elements of brand loyalty is significant to the case of the arts festival, as
most attendees usually indicate their plan to attend an arts festival again in future.
Brand loyalty indicates festival attendees' favourable attitude to a specific brand
(Pride & Ferrell, 2003:299).
To summarise, a brand is a method used either to differentiate a product or service
(arts festival) from others or to identify a service provided by an institution or
organisation. In today’s highly competitive leisure and tourism market, brand position
has to remain fresh and relevant. A powerful brand is a live asset and it may risk
losing its value over time if marketing is neglected (Middleton, 2001:133).
The value of branding and brand positioning in the arts festival context should not be
underestimated.

157
3.8 CONCLUSION
The first part of this chapter provided an overview of marketing in the context of arts
festivals in South Africa. The most important matters addressed are defining the
event marketing, identifying the marketing mix elements for South African festivals
and events and introducing the festival and event customer through market
segmentation (see Sections 3.2, 3.3, 3.4). By grouping customers with similar
requirements and buying behaviour, a target group can be selected which forms a
core part of market positioning.
Market positioning is central to marketing, and is the focus of the second part of the
chapter (see Section 3.5). The aim in this second part is to define the topic of
positioning in various contexts, such as in the marketing context whence it originated,
in the tourism context where it spread during the early 1980s, and in a festival and
event context where little coverage is reported in secondary literature. An important
aspect identified in this part of the chapter is the lack of research on the market
positioning of arts festivals and specifically in South Africa (see Section 3.5.5).
Familiarity with market positioning in the festival context as a result of previous
research informs the last part of the chapter, focusing on various authors' positioning
models, which can be used to gain an optimum position in the market (see Section
3.6). These six models were selected on the basis of their marketing orientation and
the significance of their contribution to the topic of positioning in the present study.
The six positioning models are dissected and evaluated to choose the most
appropriate model for the present study. Although these six models show similarities,
some distinct features differentiate them from one another. Positioning models in the
generic marketing field and the field of travel, tourism and hospitality were included in
this discussion.
These six models were selected as the models developed by Ries and Trout, Kotler,
and Boyd and Walker – the pioneers of the market positioning – have been adopted
and employed in tourism literature.

158
These authors have also received a considerate amount of attention in marketing
(consumer behaviour) and tourism literature. Lovelock (2003) recognises positioning
and applies it to the services-marketing business and lists the pitfalls for businesses,
which do not effectively position themselves. Aaker and Shansby (1982) draw
conclusions on developing a positioning strategy in marketing. These latter authors
are frequently cited in tourism literature. Reich (1999, 1997) introduces and applies
positioning to hospitality and tourism marketing and also to tourism destinations.
After extensive research on the topic and on the six positioning models, the model by
Boyd and Walker (1990) was selected for the present study. Boyd and Walker
present some of the most thorough coverage of positioning and begin by offering
definitions of the two terms: market targeting and market positioning. A detailed
description of the process to be followed in each of these two cases is given. Eight
steps should be followed for determining existing perceptions and making the
positioning decision for a new product or the repositioning of a current product. As
illustrated in Figure 3.3, the model by Boyd and Walker is workable for the current
study owing to the ease with which the model (the steps in the positioning process)
can be applied or adapted to the current study’s needs.
Chapters 2 and 3 comprise the secondary research chapters for the current study,
whereas Chapters 4, 5 and 6 are the primary research chapters. In Chapter 2,
tourism and the niche market SIT, specifically the festivals and events sector, are
acknowledged, whereas Chapter 3 acknowledges the body of knowledge on
positioning in the tourism and marketing field. This thesis is unique in its application
of these two bodies of knowledge to suit the needs of the research undertaken. By
integrating the secondary literature on tourism, SIT (Chapter 2) and market
positioning (Chapter 3) with the empirical results and primary research (Chapters 4,
5) of this study, it was possible to develop a new model for positioning (Chapter 6).
The next chapter discusses the methodology that was used in order to explore the
research objectives of the study.

159
CHAPTER 4
4 RESEARCH METHODOLOGY
4.1 INTRODUCTION
The earlier chapters provide some of the key theoretical foundations associated with
tourism, special interest tourism, festivals and events, as well as marketing and
market positioning of arts festivals. The focus in this chapter turns to the primary
research conducted on three arts festival scenarios in South Africa.
The primary research objective of the study is to construct a market-positioning
model, which South African event co-ordinators can use as guidelines for ensuring
an optimal arts festival. This primary research objective of the study is underpinned
by secondary research objectives. The first is to determine which attributes and
combination of attributes will drive the best practices offered by arts festival
scenarios. The situational inhibitors that might prevent respondents from attending a
festival in these scenarios are also addressed.
The second is to compare the different arts festival packages with one another and
by doing so to identify the most successful arts festival presentation in terms of a
tourism attraction. In support of this, the third secondary objective is to integrate the
data and design a model specifically for arts festivals. It is hoped that this market-
positioning model would add value and contribute to the body of knowledge about
South African arts festivals.
In the remainder of this chapter the research methodology of the study is discussed.
The methodological approach is shown in Figure 4.1.

160
Figure 4.1: Primary research in the research process (adapted from Tustin, Ligthelm, Martins & Van Wyk, 2005)

161
Figure 4.1 illustrates the steps associated with the primary research in the research
process. Certain specific steps have to be followed in any research project. The first
five steps of the research process are discussed in this chapter as applied in the
present study, and the sixth and last step is discussed in Chapter 5.
Primary data were gathered from prominent arts festivals in South Africa in order to
address the before-mentioned research objectives of the study. Refer to Appendix A1
for a map of South Africa and the three respective provinces where the festivals are
held. The three arts festivals selected for research are identified in this study as:
• Festival A, referring to the Aardklop National Arts Festival;
• Festival B, referring to the National Arts Festival in Grahamstown; and
• Festival C, referring to the Klein Karoo National Arts Festival (KKNK).
This study is scenario-based and the three arts festivals are presented as three
scenarios. Scenario-based studies are typically used in cases where uncertainties in
possible future outcomes need to be determined (Handy, 1996). Based on these
trajectory routes of arts festivals scenarios were used. The three scenarios are
discussed below in Section 4.2.
4.2 ARTS FESTIVAL SCENARIOS
There are various arts festivals in South Africa and different people from different
areas attend these festivals. (See the discussion in paragraphs 1.2 and 2.5.4 which
further elaborates on the reasons for selection of these festivals). Various
communities discovered the potential of festivals held in their midst (Getz,
2000d:210). In this study, three different arts festival scenarios have been selected
and are evaluated.
Each of these arts festivals, which are briefly described below, has its own unique
characteristics and its own unique niche market.

162
4.2.1 Scenario A
Scenario A refers to the Aardklop National Arts Festival held annually in the North
West Province at the town of Potchefstroom. Besides this town's claim to be the
oldest town in the North West Province, few other towns are as symbolic of South
Africa’s constitutional, cultural and religious origin and development. The first Staats
Courant (Government Gazette) was printed and published in Potchefstroom in 1857.
The town is home to the University of the North West and three other tertiary
institutions, 30 schools and several research and training centres. The Aardklop
National Arts Festival started in 1998 to meet the need for an arts festival in the
northern part of South Africa, and is currently in its eigth year of operation. The
festival is held for five days in September during spring. An estimated 130 000
people visit this festival annually. This festival is hailed by the organisers as a safe,
friendly arts festival for the whole family, and the festival audience is drawn mainly
from Gauteng and the North West Province. The estimated economic impact of the
festival in 2003 was R65 million (Saayman, 2004).
A few main sponsors are involved, such as the daily paper Beeld (media publicity),
AngloGold, Clover, First National Bank and Standard Bank, Sasol and the
Municipality of Potchefstroom. The festival programme includes the genres of
classical music, theatre, children’s and street theatre, dance, cabaret, rock, jazz,
literature and visual arts. New shows are staged each year at the festival. The shows
mainly have an Afrikaans perspective and origin, but also include other popular
languages, such as English and Dutch.
The name of the festival in Scenario A has a distinctive meaning. The first part of the
Afrikaans word aardklop, i.e. aard, means earth and has the connotation of the
belonging feeling of South Africans, as they are people from the soil and earth. The
second part, klop, means beat and refers to the pulsating rhythm of the music and
arts at the festival (Van Zyl, 2002:3).
163
The productions and shows are held at various venues throughout the town. The
festival's main activities take place at the Bult area near the university campus.
Ample parking is available at the venues. There are various food and beverage
outlets in the area as well as temporary food stalls and a flea market.
It is clear from this description that the Scenario A festival is typically held for a
certain niche market focusing on Afrikaans-speaking white South Africans, but
accommodates other language activities as well (Saayman & Saayman, 2004:634).
For the purpose of this study, the festival is referred to as Festival A and presented
as ∆ A.
4.2.2 Scenario B
Scenario B refers to the National Arts Festival that is held annually at Grahamstown
in the Eastern Cape Province. Formerly known as the Standard Bank National Arts
Festival, the festival changed its name after the main sponsor, Standard Bank,
withdrew in 2002. Grahamstown is known in South Africa not only as the festival
capital of South Africa, but also as the city of saints and scholars as it is home to
many churches, schools and the Rhodes University. The 1820 Settlers’ Foundation
held the first festival in 1974 to celebrate, re-establish, empower and maintain the
cultural heritage of English. Although this purpose has become broader, it is still the
essence of the festival, making this festival a unique and distinctive event.
This festival is currently in its 32nd year of operation and is the oldest arts festival in
South Africa. The festival is internationally renowned as one of the major festivals in
the world, and one of the first to introduce a multidisciplinary arts festival to South
Africa (Witepski, 2002:53). This Scenario B festival is in several ways a benchmark
for the organisers of other festivals as it was the first established South African arts
festival.

164
The Grahamstown festival is held for about nine days in June/July during winter and
is attended by an estimated 102 000 or more people. The festival audience is drawn
mainly from the local area and the southern provinces of South Africa.
Overseas attendees comprise a small percentage (11%) (Witepski, 2002:51). The
estimated economic impact of the festival in 2003 was R35 million (Saayman, 2004).
A few main sponsors are involved, such as the National Lottery Distribution Trust
Fund, the Eastern Cape provincial government, Standard Bank, The National Arts
Council and the South African Broadcasting Corporation. The festival programme
includes music, drama and comedy theatre, exhibitions, dance, music theatre,
children's choice, cabarets and indigenous theatre.
Every hall or large room becomes a theatre, and parks and sports fields become flea
markets. Temporary traffic officers control the congestion in the normally quiet streets
and parking is available at the venues or nearby areas. Various food and beverages
are available throughout the town. The festival has a certain niche market catering
especially for people interested in English literature and drama. For purpose of this
study, the festival is referred to as Festival B and presented as ∆ B.
4.2.3 Scenario C
Scenario C refers to the Klein Karoo National Arts Festival, more popularly known as
the KKNK, held at Oudtshoorn in the Western Cape Province. Oudtshoorn has
unique significance to the origins of the Afrikaans language. The first and revered
Afrikaans playwright C.J. Langenhoven (1873-1932) lived and worked in Oudtshoorn.
This arts festival, first held in 1994, was the first mainly Afrikaans arts festival in
South Africa and is currently in its 12th year of operation.
The festival is held for eight days in March/April. The estimated number of attendees
is 160 000 or more, and this art festival is hailed as one of the largest in South Africa
(Saayman & Saayman, 2004; Snyman, cited in Sawubona, 2002:34). The festival
audience is drawn from all corners of South Africa, but the southern provinces are
best represented. The estimated economic impact of the festival in 2003 was R98

165
million (Saayman, 2004). A few main sponsors are involved, such as NASPERS
(National Press) and ABSA Bank.
The festival programme includes mainly the visual and performing arts, music
theatre, classical music, opera, cabaret, drama, jazz, stand-up comedy and popular
folk music.
The productions and shows are held at various venues throughout the town and
parking is available at all these venues. There are various food and beverage outlets
in the area as well as temporary food stalls and a flea market. The arts festival is a
non-profit organisation run on sound business principles and it strives to take the arts
to all parts of the Little Karoo. The festival has a certain niche market catering
especially for people interested in the Afrikaans language (although English is also
catered for). The KKNK and Aardklop Festivals have been lauded for creating a trend
in local arts festivals by catering for niche markets such as attending arts festivals.
For the purposes of this study, the festival is referred to as Festival C and presented
as ∆ C.
The first five steps of the research used in the present study, as illustrated in Figure
4.1, are discussed below. The sixth and seventh step is discussed in Chapter 5. One
of the first steps in primary research is to develop the sample plan, which is
discussed in the next section.
4.3 DEVELOPING THE SAMPLE PLAN
The plan for drawing the sample used in the present study is discussed according to
the seven steps illustrated in Figure 4.2.
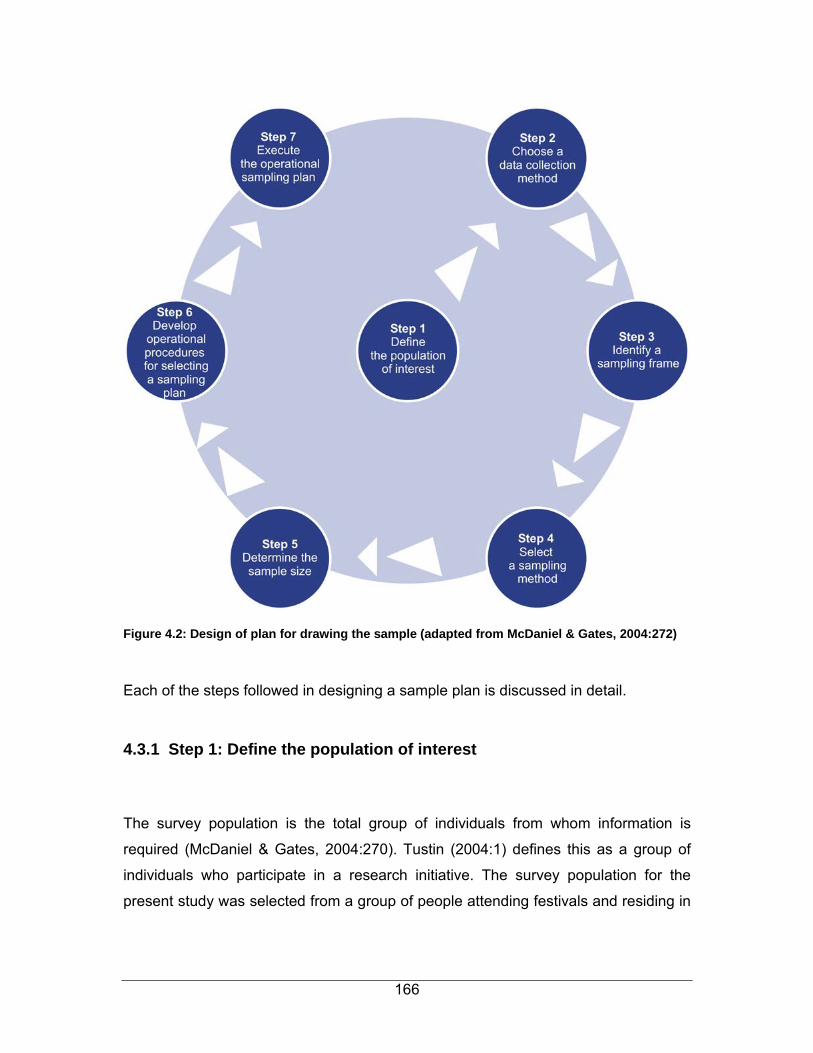
166
Figure 4.2: Design of plan for drawing the sample (adapted from McDaniel & Gates, 2004:272)
Each of the steps followed in designing a sample plan is discussed in detail.
4.3.1 Step 1: Define the population of interest
The survey population is the total group of individuals from whom information is
required (McDaniel & Gates, 2004:270). Tustin (2004:1) defines this as a group of
individuals who participate in a research initiative. The survey population for the
present study was selected from a group of people attending festivals and residing in
167
the three scenario areas (A, B, and C). The sample unit refers to those individuals
(known as repeat visitors) residing in the survey/scenario areas.
The sample element included individual members residing in the survey/scenario
areas (A, B, and C), who attended at least one of the arts festivals in 2003 or any of
the previous years’ arts festivals and who were familiar with the prominent arts
festivals presented in any of the arts festival zones. The survey/scenario area
included a group of people, who might be participants meaning performers, special
interest groups related to the event theme, known users of related events, repeat
visitors, tourists and potential tourists. In addition, the group might include tourists
and potential tourists who can evaluate an arts festival package and who travel not
only to this festival but also to other festivals.
The survey was conducted in 2003. The selection of the survey areas was based on
the regions (geographic areas where the festivals took place, see Chapter 1) and
represents prominent arts festival zones in South Africa (Scenarios A, B and C). The
assumption was that people residing in these areas and repeat attendees would be
more likely to have an informed opinion (they are likeminded individuals) about arts
festivals than people residing outside these areas (Assael, 2004:224; Schreuder,
2003; Van Zyl, 2003).
4.3.2 Step 2: Choose a data collection method
A data collection method describes the specific method used for gathering the data
and depends on the selected design. Either a paper-based or computer-based
method can be used. The nature of the research instrument (see Section 4.4) of this
study largely determined the choice of a paper-based method, namely personal face-
to-face interviews. A personal interview or face-to-face communication is defined as a
two-way conversation initiated by an interviewer to obtain information from a
participant (Cooper & Schindler, 2003:323).
168
The research instrument for this study was supplemented by show cards and
checklists, based on a conjoint analysis model (see Section 4.4).
Cooper and Emory (1995:270) remark that a personal interview, if conducted
successfully, is an excellent technique for data collection.
Personal interviewing based on the selected research instrument was the most
convenient and cost-effective method for the time frame and scope of the present
study.
4.3.3 Step 3: Identify a sampling frame
A sampling frame is a master list of all the population units in the population
(Diamantopoulos & Schlegelmilch, 2000:14). Unfortunately, no such list of population
units/elements was available for selecting the sample units/elements of the present
study. There was no database on either of the three arts festival scenarios at the time
of conducting this research.
4.3.4 Step 4: Select a sampling method
The sampling method or approach selected depends on the objectives of the study,
the financial resources available, time limits and the nature of the research problem
being investigated (McDaniel & Gates, 2004:276). The major sampling methods in
research are grouped into two broad categories of probability10 and non-probability11
samples (Churchill & Brown, 2004:403). Each type has several alternatives or a wide
range of alternatives to suit all sampling designs, as shown in Table 4.2.
10 Probability sampling is used where all the subsets of the population have a known non-zero chance
of being selected (Terre Blanche & Durrheim, 2002:276-281). 11 Non-probability sampling is used where certain subsets of the population have little or no chance of
being selected for the sample (Terre Blanche & Durrheim, 2002:276-281).
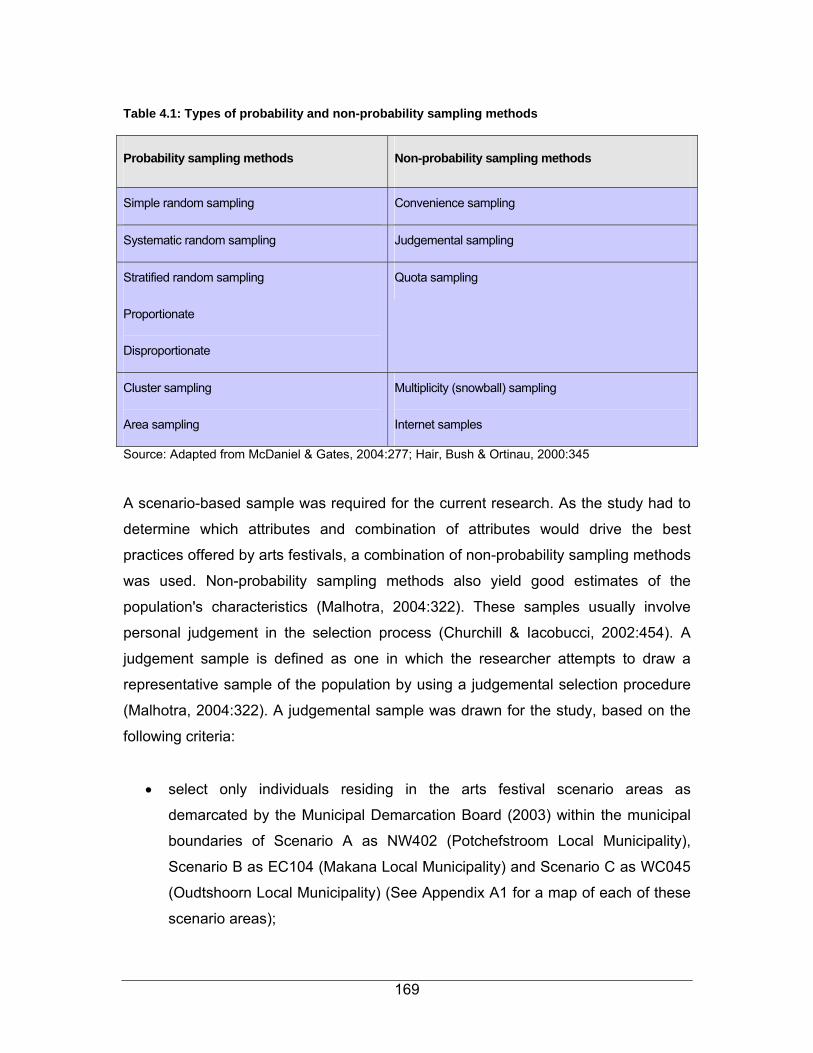
169
Table 4.1: Types of probability and non-probability sampling methods
Probability sampling methods Non-probability sampling methods
Simple random sampling Convenience sampling
Systematic random sampling Judgemental sampling
Stratified random sampling
Proportionate
Disproportionate
Quota sampling
Cluster sampling
Area sampling
Multiplicity (snowball) sampling
Internet samples
Source: Adapted from McDaniel & Gates, 2004:277; Hair, Bush & Ortinau, 2000:345
A scenario-based sample was required for the current research. As the study had to
determine which attributes and combination of attributes would drive the best
practices offered by arts festivals, a combination of non-probability sampling methods
was used. Non-probability sampling methods also yield good estimates of the
population's characteristics (Malhotra, 2004:322). These samples usually involve
personal judgement in the selection process (Churchill & Iacobucci, 2002:454). A
judgement sample is defined as one in which the researcher attempts to draw a
representative sample of the population by using a judgemental selection procedure
(Malhotra, 2004:322). A judgemental sample was drawn for the study, based on the
following criteria:
• select only individuals residing in the arts festival scenario areas as
demarcated by the Municipal Demarcation Board (2003) within the municipal
boundaries of Scenario A as NW402 (Potchefstroom Local Municipality),
Scenario B as EC104 (Makana Local Municipality) and Scenario C as WC045
(Oudtshoorn Local Municipality) (See Appendix A1 for a map of each of these
scenario areas);

170
• draw individuals from three different age groups which is 18-30, 31-45, and 46
years and older to ensure that all age groups typically present at arts festivals
would be represented (Van Zyl, 2002);
• include both males and females in a 50:50 % ratio;
• include only individuals in the Living Standards Measure (LSM) groups 6, 7, 8,
9 and 10, but mainly LSM groups 7 to 10 (Martins, 1998:40);
• select individuals who would understand the language, either English or
Afrikaans, used in the questionnaire. This would probably include people who
would attend such a festival as the main languages at the three selected
festivals are Afrikaans and/or English; and
• select only repeat attendees, using a screening question, to ensure that a
respondent had previously attended at least one of the selected arts festivals
in the scenarios. The screening question was intended to ensure that only
likeminded individuals familiar with festivals would be included in the sample.
Another non-probability sampling method, more specifically interlocking quota
sampling, was also used. Quota sampling is used to improve the representativeness
of each group (e.g. gender and age groups), and steps are taken to obtain a sample
similar to the population for some pre-specified characteristics (Martins, Loubser &
Van Wyk, 1996:254). These authors note that in interlocking quotas a specific
element has to comply with two or more characteristics. Table 4.2 shows the three
age groups, two gender groups and three arts festival scenario groups, giving a total
of 18 cells (3x2x3) for the present study. The table also indicates how the interlocking
quota sample was constructed for this study.

171
Table 4.2: Interlocking quota sample for the three arts festival scenarios
Age in years
18-30 31-45 46+
Total
Males 21 21 21 63
Fest
ival
A
Females 21 21 21 63
Subtotal 42 42 42 126
Males 17 16 16 49
Fest
ival
B
Females 17 17 16 50
Subtotal 34 33 32 99
Males 26 26 25 77
Fest
ival
C
Females 27 26 25 78
Subtotal 53 52 50 155
Total 129 127 124 380
The specific characteristics and quota size of each subgroup were based on the
researcher's judgement given previous research experience (Van Zyl, 2002) and an
expert researcher in the field (Schreuder, 2003), to ensure that the sample contained
the desired number of respondents (See paragraph 4.3.5 in this regard) in each
subgroup. Consequently, the present study used a combination of judgemental and
quota sampling.
The next step was to determine the sample size.
172
4.3.5 Step 5: Determine the sample size
The present study does not claim to have drawn a representative sample of the
population. The sample size of 380 used in the present study was a scenario-based
sample using the judgement of an expert researcher in the field (Schreuder, 2003).
However, for the purposes of this study, the number of festival attendees in 2002 was
used as a guideline for Festival A and Festival B. Ticket sales in 2002 were used for
Festival C as no figures on attendee numbers in 2002 could be obtained for Festival
C and the available information was used instead.
A decision was taken in conjunction with the management of the three festivals and
the Consulta Research Company, that only the qualifying attendees in the local
market area of each of the three arts festivals would be approached at a convenient
time for them. Local market area is defined as demarcated within the municipal
boundaries of Scenario A as NW402, Scenario B as EC104 and Scenario C as
WC045 (See Appendix A1 for a map of each area).
However, the selected sampling procedure for this study was based on the
guidelines of Cooper and Emory (1995:207) and Krejcie and Morgan (1970:608) for
general research activities, applicable to any defined population, which states that for
a population N of 100 000 the recommended sample size S is 384. However, these
authors also give as a rule of thumb that the law of diminishing returns will apply
when the sample size increases above about 300.
For the present study, the total average population (N) in the scenarios was 392 000
arts festival attendees (based on the 2002 figures for arts festival attendees in Table
4.3), so the recommended sample size (S) of 380 seemed appropriate. A sample of
0,096% was proportionally drawn from the population of each of the three festival
scenarios. The sample size of the group was also influenced by the method of
collecting data, as personal interviewing is an expensive method, but usually
produces the best results.

173
Table 4.3 lists the population and sample size of the three selected arts festival
scenarios in South Africa.
Table 4.3: Population and sample size of the three selected arts festival scenarios in South Africa
Arts festival N=Population size of scenario attendance figures in 2002
Percentage
distribution
S=Recommended sample size
Festival A 130 000 33,2 % 126 (380 X 33,2%)
Festival B 102 000 26,0 % 99 (380 X 26,0%)
Festival C 160 000 Ticket sales 40,8 % 155 (380 X 40,8%)
Total 392 000 100% 380
Source: Aardklop Impact Study (2002:1), Weekend Post (2002:16) and Witepski (2002: 53).
At least 30 questionnaires were completed by respondents in each gender and age
group (Diamantopoulos & Schlegelmilch, 2002:17). Orme (1998:9) states that “… for
investigational work and developing hypotheses about a market, between 30 and 60
respondents may do …” to obtain statistically significant results in conjoint analysis
studies. The present study met this criterion.
4.3.6 Step 6: Develop operational procedures for selecting a sampling plan
This step outlines the actual procedures used for contacting each of the respondents.
The type of sample used, determines the instructions that respondents should follow.
The procedures are far more important to the success of drawing a probability
sample than for a non-probability sample (McDaniel, & Gates, 2004:278). In the
present study, a non-probability sample, called interlocking quota sampling, was

174
used, which guided the interviewers clearly so that they would know exactly what to
do and how to handle any problems when contacting prospective respondents.
Failing to develop a proper operational plan for selecting the sample elements could
jeopardise the entire sampling process.
4.3.7 Step 7: Execute the operational sampling plan
The final step in the sampling process is to carry out the sampling plan discussed in
the previous step. It is important for this step to be controlled adequately to ensure
that data collectors follow the specified procedures (McDaniel & Gates, 2004:279). In
the current study, this step was similar to conducting the data collection activities in
fieldwork, as discussed in Section 4.4. After the plan for sampling has been
developed according to the seven steps outlined in Figure 4.2, the research
instrument or questionnaire should be designed, as discussed in Paragraph 4.4
below.
4.4 DESIGN THE RESEARCH INSTRUMENT
The next step in primary research is to design the research instrument
(questionnaire) as shown in Figure 4.1, Step 2. In this case, the research instrument
was designed to explore the objectives of the study, and was based on previous
research (Van Zyl & Botha, 2004:213; Van Zyl, 2002:158; Botha, 2002), a literature
review, preliminary interviews with a researcher (Schreuder, 2003) and the Aardklop
management (Van Zyl, 2003) as well as consultation with the other two festivals.
The research instrument was compiled to support the conjoint analysis model
designed for the study. The structured questionnaire for the interviews appears in
Appendix A3 and A4. Show cards were included to facilitate the completion of the
questionnaire. Table 4.4 contains an analysis of the types of questions in the
questionnaire.
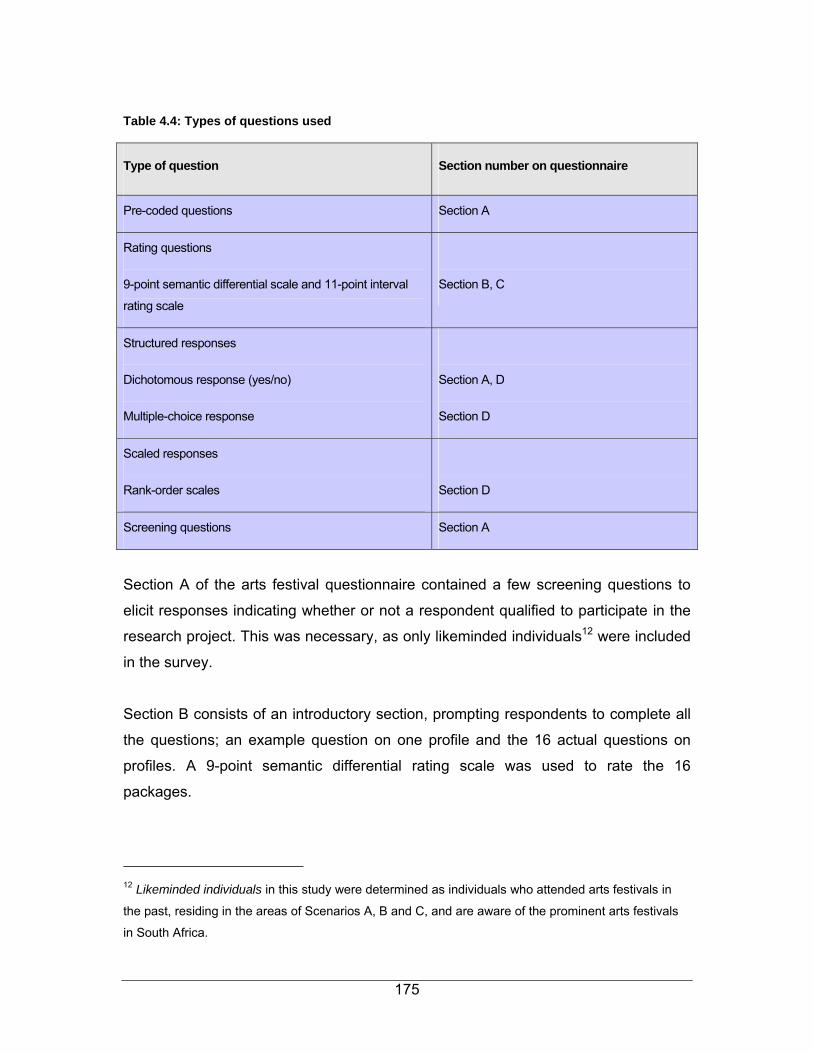
175
Table 4.4: Types of questions used
Type of question Section number on questionnaire
Pre-coded questions Section A
Rating questions
9-point semantic differential scale and 11-point interval
rating scale
Section B, C
Structured responses
Dichotomous response (yes/no)
Multiple-choice response
Section A, D
Section D
Scaled responses
Rank-order scales
Section D
Screening questions Section A
Section A of the arts festival questionnaire contained a few screening questions to
elicit responses indicating whether or not a respondent qualified to participate in the
research project. This was necessary, as only likeminded individuals12 were included
in the survey.
Section B consists of an introductory section, prompting respondents to complete all
the questions; an example question on one profile and the 16 actual questions on
profiles. A 9-point semantic differential rating scale was used to rate the 16
packages.
12 Likeminded individuals in this study were determined as individuals who attended arts festivals in
the past, residing in the areas of Scenarios A, B and C, and are aware of the prominent arts festivals
in South Africa.
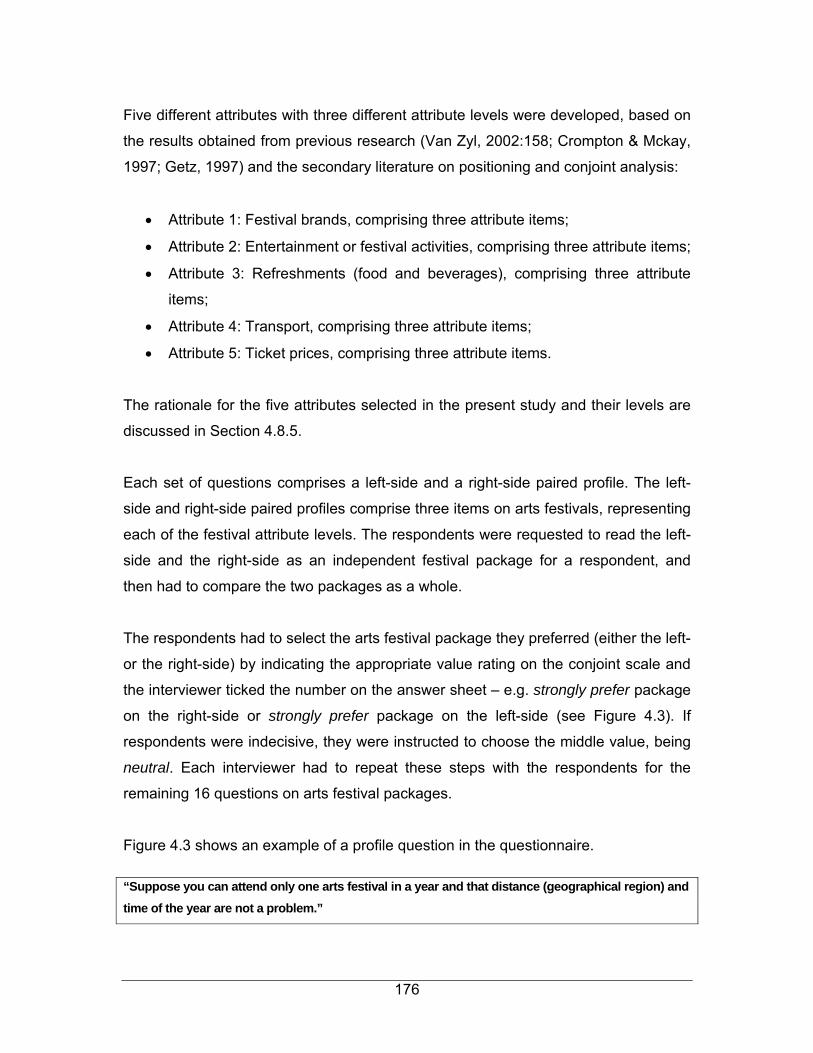
176
Five different attributes with three different attribute levels were developed, based on
the results obtained from previous research (Van Zyl, 2002:158; Crompton & Mckay,
1997; Getz, 1997) and the secondary literature on positioning and conjoint analysis:
• Attribute 1: Festival brands, comprising three attribute items;
• Attribute 2: Entertainment or festival activities, comprising three attribute items;
• Attribute 3: Refreshments (food and beverages), comprising three attribute
items;
• Attribute 4: Transport, comprising three attribute items;
• Attribute 5: Ticket prices, comprising three attribute items.
The rationale for the five attributes selected in the present study and their levels are
discussed in Section 4.8.5.
Each set of questions comprises a left-side and a right-side paired profile. The left-
side and right-side paired profiles comprise three items on arts festivals, representing
each of the festival attribute levels. The respondents were requested to read the left-
side and the right-side as an independent festival package for a respondent, and
then had to compare the two packages as a whole.
The respondents had to select the arts festival package they preferred (either the left-
or the right-side) by indicating the appropriate value rating on the conjoint scale and
the interviewer ticked the number on the answer sheet – e.g. strongly prefer package
on the right-side or strongly prefer package on the left-side (see Figure 4.3). If
respondents were indecisive, they were instructed to choose the middle value, being
neutral. Each interviewer had to repeat these steps with the respondents for the
remaining 16 questions on arts festival packages.
Figure 4.3 shows an example of a profile question in the questionnaire.
“Suppose you can attend only one arts festival in a year and that distance (geographical region) and time of the year are not a problem.”
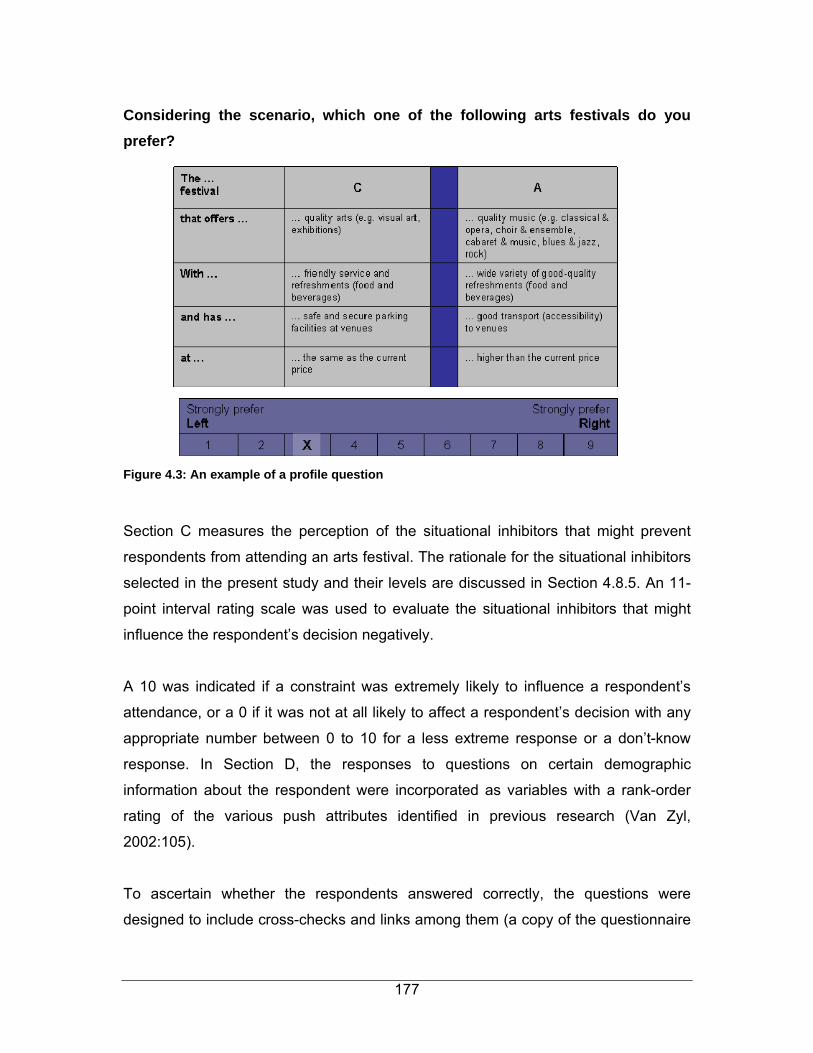
177
Considering the scenario, which one of the following arts festivals do you prefer?
Figure 4.3: An example of a profile question
Section C measures the perception of the situational inhibitors that might prevent
respondents from attending an arts festival. The rationale for the situational inhibitors
selected in the present study and their levels are discussed in Section 4.8.5. An 11-
point interval rating scale was used to evaluate the situational inhibitors that might
influence the respondent’s decision negatively.
A 10 was indicated if a constraint was extremely likely to influence a respondent’s
attendance, or a 0 if it was not at all likely to affect a respondent’s decision with any
appropriate number between 0 to 10 for a less extreme response or a don’t-know
response. In Section D, the responses to questions on certain demographic
information about the respondent were incorporated as variables with a rank-order
rating of the various push attributes identified in previous research (Van Zyl,
2002:105).
To ascertain whether the respondents answered correctly, the questions were
designed to include cross-checks and links among them (a copy of the questionnaire

178
appears in Appendices A3 and A4). The questionnaire was pre-tested on 15
respondents to identify and eliminate potential problems. No problems were reported
and respondents understood the questionnaire.
The author made sure that the respondents interviewed in the pre-test were similar to
those included in the actual survey in terms of their familiarity with arts festivals. The
respondents in the pre-test were drawn from the same population (five respondents
from each of the three festival scenario areas). The responses obtained from the pre-
test were then coded and analysed. The analysis of the pre-test responses was used
when checking the actual survey to ensure that the data collected contained the
necessary information. R-square testing was done on Section B of the questionnaire
for the 16 profile packages to test whether the respondents understood the conjoint
section, thereby testing the validity of the questionnaire. (See discussion in
paragraph 4.8.5 on Step 6 for the ideal and the current study’s R-square value).
Validity is defined as the extent to which respondents accurately reflect what they are
meant to reflect (Veal, 1997:186).
The following three steps in the primary research process are concerned with the
data as discussed in the following three sections (see Figure 4.1).
4.5 FIELDWORK: DATA COLLECTION AND EDITING
After developing a research instrument, one of the first steps is to do the fieldwork.
All fieldwork involves the selection, training and supervision of the people who collect
data (Malhotra, 2004:388). The number of interviewers used and process followed in
the study will be identified later on in this section. The validation of fieldwork and the
evaluation of field workers are also part of the data collection process, namely
collecting the data in the field and editing the data collected (see Figure 4.1 in this
regard).
179
The interviews were conducted between 15 and 27 October 2003, which included
weekdays and a weekend. The data collection times were between 08:00-12:00,
14:00-18:00 and 19:00-22:00. The interviews were conducted in the three scenario
areas as demarcated by the Municipal Demarcation Board where the arts festivals
are held annually. Each interview took 20-30 minutes and only respondents who met
the design criteria were interviewed.
The 31 interviewers approached respondents and invited only interested individuals
to participate by asking a screening question. In cases where the individuals were not
interested in participating, the field worker closed the interview without collecting
data. In each case, the following important criteria were set for participation by
respondents (see Appendix A3 Section A for the screening questions):
• Gender: Male or female;
• Age: 18-30 or 31-45 or 46+ (Age grouping was based on previous research);
• Did you attend the following arts festival? Festival A, referring to the Aardklop
Festival, or Festival B, referring to the Grahamstown Festival or Festival C,
referring to KKNK?
A time-test was done on the interview to ensure it did not exceed the time norm of
one hour. The length of the questionnaire (time to complete each questionnaire) and
the perceived level of complexity of a conjoint analysis questionnaire were initially a
concern. However, these factors did not prove be a problem, since the field workers
obtained the quotas and the response rate was high (100%). Only two participants
requested that their responses be kept confidential.
In total, 31 interviewers/field workers were used for data collection at all three festival
scenarios. They were fully briefed beforehand on the background of the study, as
well as the manner in which interviews should be conducted. The respondents who
took part in the research were briefed on its purpose, and responded openly and
honestly.
180
All the interviewers had a tertiary education qualification or were in their final year of
tourism studies. The number of interviewers involved for each arts festival scenario
was as follows:
• In Potchefstroom (Festival A), ten graduate students in the Department of
Tourism and Recreation at the North West University were each given an
interviewer number from 1-10,
• In Grahamstown (Festival B), nine graduates in the Department of Statistics at
Rhodes University were each given an interviewer number from 1-9.
• In Oudtshoorn (Festival C), 12 final-year diploma students in the Department
of Tourism at the South Cape College in Oudtshoorn were each given an
interviewer number from 1-12.
Interview numbers were assigned so that quality control checks could be done on
interviewers. A supervisor was appointed at each festival scenario to manage the
fieldworkers. The field workers were selected for their maturity, enthusiasm for the
project and background regarding each of the three selected arts festivals. As the
structured interview and the conjoint analysis interview were rather complex, the
author trained each of these groups of field workers to assist respondents if
necessary. The author also trained the interviewers beforehand to conduct a
personal interview and to complete a conjoint analysis questionnaire at each of the
three arts festival scenarios. They all had to perform role modelling to ensure they
understood the interviewing process.
When the interviewers introduced themselves to the prospective respondents, they
informed these of the tertiary institution at which they were studying or had studied,
and that they were not employed by any of the three arts festivals selected for the
scenarios. Following that, the interviewers explained that the aim of the study was to
gain a better understanding of the best way to position arts festivals so that the
festival could be sustained in the long term.
181
For convenience and to assist the interviewers, they were given written instructions
on conducting the interview (see questionnaire in Appendix A4). The training
included a description of the conjoint instructions for use in the interview and how to
handle any problems. Each interviewer was given a pencil and eraser as well as
show-cards and a detailed flip file on how to conduct the interview. The conjoint flip
files, conjoint show-cards, instructions and profiles had Afrikaans on one side and
English on the other side. The three age groups were clearly marked with the exact
quota in each folder on these age categories. This gave the interviewer an
opportunity to interview the respondent and to complete the questionnaire in the
respondent’s preferred language.
The interviewers were also informed during the training sessions that each
interviewer number would be checked. Their results of role playing were also
subjected to checking before they proceeded with the interviews.
In the first section of the questionnaire, the respondents were confronted with an
imaginary scenario that they might have experienced at an arts festival. In total, there
were 16 profiles or questions, each containing a different set of Benefit Packages13.
The respondents were asked to consider these packages against the scenario and to
indicate their strongest preference in each question. The subsequent sections of the
questionnaire were designed to establish the respondents' perceptions of situational
inhibitors and some demographic information. The procedures that the interviewers
followed were deemed to be valid and reliable for the purpose of this study.
A quota control sheet in the middle of the flip file contained the exact quota of
respondents the particular interviewer had to interview in the geographical region of
the festival in the scenario (see Appendix A2). The respondents were identified by
either targeting a residential or a business area in the specific geographic region or
13 Benefit Packages refer to the five items called attributes (Festival brands, Entertainment or festival
activities, Refreshments, Transport, Ticket prices) which comprise the arts festival scenario you might
experience.

182
survey area, and selected according to the exact design criteria of the questionnaire
in the parameters of the quotas.
A merged document contained the exact design criteria for each questionnaire in the
study, in which each questionnaire was numbered as follows:
• 1-126 for Potchefstroom (Festival A),
• 127-281 for Oudtshoorn (Festival C) and
• 282-380 for Grahamstown (Festival B).
A master checklist was kept for each questionnaire number assigned to each
interviewer number to check the status of the personal interviews. The supervisor in
each area as well as the researcher controlled this checklist procedure.
The fieldwork supervisor checked that each interviewer had entered his/her name on
the questionnaire and signed the checklist for each number taken. At the end of each
day the interviewers reported back to the supervisor and handed in the completed
questionnaires for checking. As an incentive, the author would pay a bonus to each
interviewer who interviewed the required quota of respondents and kept to the
deadline. Only the completed questionnaires handed in to the supervisor qualified for
such payment.
After the field workers/interviewers had been interviewed by the author and her team,
they held a total of 380 personal face-to-face interviews with the respondents
attending each of the three arts festivals (local market areas).
The data for the present study were edited during the fieldwork. Editing is the
process of checking the raw data for any errors made by either the interviewer or the
respondent (Hair et al., 2000:481). The field edit checked the interviewers by means
of monitoring and validation procedures, the process of ascertaining that interviews
had actually been conducted as specified (McDaniel & Gates, 2001:387).
183
Editing is therefore a review of the questionnaires with the objective of increasing
accuracy and precision (Malhotra, 2004:403). A 10% check-back was performed for
verification to test if completed questionnaires were correct.
Once the data had been collected in the field it had to be converted to a useable
format. This step is discussed in the next section. The results of the personal
interviews are discussed in detail in Chapter 5.
4.6 DATA CODING
The next step, as shown in Figure 4.1, is data coding, a technical procedure for
converting raw data into symbols. This procedure involves specifying the alternative
categories or classes into which the responses should be placed and assigning code
numbers to the classes (Churchill & Brown, 2004:518).
A questionnaire is coded to make it possible for a computer to aggregate the
responses (Clark, Riley, Wilkie & Wood, 2000:98). Codes can be assigned to various
questions either before the respondent completes the questionnaire (pre-coding) or
after the respondent has completed the questionnaire (post-coding).
In this study, the coding was done by using numerical codes to combine the pre-
coding and post-coding. This allowed the received data to be entered quickly and
with few errors. Pre-coding also aided the data analysis by making it straightforward
and free of problems.
4.7 DATA CAPTURING AND CLEANING
The last of the three steps concerned with data as shown in Figure 4.1 is the
capturing and cleaning of the data. Data capturing in this study was done by making

184
use of a numerical code to connect the question data with the respondents in the
study.
The responses were coded according to a coding template and variable names were
given; a consistent pattern was set for coding missing data; the responses were
coded numerically in the usual way with digits such as 1 for Male and 2 for Female;
and time was spent on detecting and correcting errors.
At this point, the data from questionnaires had been entered into a database and
stored electronically. A final check was done for errors before proceeding with the
tabulation and statistical analysis of the survey results. One returned questionnaire
(File number 152 was the only deleted person) contained missing data where the
respondent simply forgot to answer a question and this questionnaire was therefore
deleted from the data set. Two others were deleted because their r-squares were
below 0,4 (see Section 4.8.5). In total, 377 questionnaires were used in the analysis
of the data.
Consulta Research, a research company specialising in conjoint analysis and based
in Pretoria, South Africa, captured the data with an in-house programme written in
Microsoft Access. An output file was generated to import the data to Microsoft Excel.
Once the data had been captured, it was converted to an Excel Spreadsheet.
Spreadsheets are a specialised type of database and a convenient and flexible
means for entering and viewing data. Data entry on spreadsheets uses numbered
rows and alphabetic columns (Cooper & Schindler, 2003:471).
The statistical computer packages STATISTICA and SSPS (Statistical Package for
the Social Sciences) as well as Conjoint Value Analysis (CVA), version 2.0 of
SawtoothSoftware, Inc. were used to analyse the collected data. These computer
programmes are widely used, for example by the Bureau of Market Research at the
University of South Africa and by Consulta Research Company, one of the leaders in
expertise on conjoint analysis in South Africa. The data analysis is discussed in the
next section.

185
4.8 DATA ANALYSIS
The sixth step shown in Figure 4.1 is the analysis of the data. The data analysis
process used in this study consisted of two techniques, namely conjoint analysis and
game theory. The conjoint analysis technique was employed to address the
secondary research objective of the study, namely to determine which attributes and
combination of attributes would drive the best practices of arts festival scenarios.
With conjoint analysis (CA), the importance of each attribute as well as the part-worth
values of each level of each attribute of the three arts festival scenarios can be
assessed by means of a linear regression model using the rating each person gave
to each product (a combination of levels of attributes). Such a rating indicates how
much a respondent prefers a particular arts festival product.
The independent variables were therefore the various levels of attributes describing
the different products. Regression analysis was done for each individual respondent
to obtain the value that respondent gave to the various levels (called the part-worth
values). The attribute importance each respondent gave to each attribute was
derived from these part-worth values.
The technique as employed in the present study, is discussed in Section 4.8.3. In
addition, two techniques often used as complementary to and in conjunction with
conjoint analysis, namely cluster and correspondence analysis, are discussed.
The results of the conjoint analysis were used in the game theory. The game theory
technique is employed to address the secondary research objective, namely to
compare the different arts festival scenarios with one another and to identify the most
successful arts festival presentation as a tourism attraction. The game theory
technique is discussed in Section 4.9.
186
Cluster analysis and correspondence analysis were mainly used to draw the
positioning maps contained in the study.
4.8.1 Cluster analysis
Cluster analysis is defined as a multivariate interdependence technique whose
primary objective is to classify objects into relatively homogeneous groups based on
the set of variables considered (Hair et al., 2000:594). Cluster analysis is a way of
categorising a collection of objects, in this case the conjoint respondents, into groups
or clusters.
Cluster analysis is used in marketing for a variety of purposes, including the
following:
• segmentation and target marketing;
• understanding buyer behaviour;
• identifying new product opportunities;
• selecting test markets;
• reducing data (Malhotra, 2004:584-588);
• positioning (Botha, 2002); and
• branding (Schreuder, 2003).
Cluster analysis, like multidimensional scaling (MDS),14 is not a statistical inference
technique in which parameters from a sample are assessed as possibly being
representative of a population. Instead, it is an objective methodology for quantifying
the structural characteristics of a set of observations.
As such, it has strong mathematical properties but does not have a statistical
foundation (Hair, Anderson, Tatham & Black, 1998:490). It should be mentioned that
14 MDS is a technique that measures attitudes about objects in a multidimensional space on the basis
of respondents’ similarity judgements of objects (Zinkmund, 1994:590).

187
most clustering methods are relatively simple procedures which are not supported by
an extensive body of statistical reasoning (Malhotra, 2004:588).
The present study made use of a non-hierarchical clustering procedure referred to as
K-means clustering, since K-means clustering moves people across clusters in a way
that increases the accounted-for variance in the dependent variable (Krieger, Green
& Wind, 2004:8). This approach produces only a single cluster solution for a set of
clusters. A four-factor solution was conducted for the purposes of this study (see
Table 5.7). Cluster analysis classified these results based on the relative attribute
importance of the conjoint data. Once the homogenous groups (clusters) had been
classified, each cluster was categorised by labelling it as, for example, brand-
sensitive or price-sensitive (see Section 5.3.3). Formal procedures for assessing the
reliability and validity of clustering solutions are complex and not fully defensible
(Funkhouser, 1983:99). However, the present study employed a procedure of
multiple runs using different orders of cases until the solution stabilised to provide
adequate checks on the quality of clustering results.
In the present study, cluster analysis was performed on the importance values of the
attributes of the three arts festival scenarios. Then the results of the cluster analysis
were used in correspondence analysis. Correspondence analysis is an MDS
technique for scaling qualitative data in marketing research (Malhotra, 2004:621).
MDS is often used in conjunction with cluster analysis or conjoint analysis (Cooper &
Schindler, 2003:651). The technique of correspondence analysis is discussed in the
next section.
4.8.2 Correspondence analysis
Correspondence analysis is a multidimensional technique for scaling qualitative data,
which scales the rows and columns of the input contingency table15 in corresponding
15 A contingency table is a cross-tabulation of two non-metric or categorical variables in which the entries are the frequencies of responses that fall into each cell of the matrix (Hair et al., 1998:520).

188
units so that each can be displayed in the same low-dimensional space (Malhotra,
2004:621).
Hair et al. (1998:520) define correspondence analysis as “a compositional approach
to perceptual mapping that relates categories of a contingency table. Most
applications involve a set of objects and attributes, with the results portraying both
objects and attributes in a common perceptual map”.
Perceptual maps are defined as graphical representations of respondents’ beliefs
about the relationship between objects in respect of two or more dimensions (usually
attributes or features of the objects) (Hair et al., 2000:596). These spatial maps give
insight into the similarities and differences within the rows of a given column
category; similarities and differences within the column categories of a given row
category; and relationships among the rows and columns (Malhotra, 2004: 621).
Correspondence analysis is an exploratory technique designed to analyse simple
two-way and multi-way tables containing some measure of correspondence between
the rows and columns. The results provide information of a similar nature to those
produced by factor analysis techniques, allowing a researcher to explore the
structure of the categorical variables included in the table. The most commonly used
table of this type is the two-way frequency cross-tabulation table (STATISTICA,
1984-2004:1).
In the terminology of correspondence analysis, the row and column totals of the
matrix of relative frequencies are called the row mass and column mass inertia
respectively (Greenacre, 1984:35).
The term inertia in correspondence analysis is used by analogy with the definition of
"moment in inertia," in applied mathematics, which refers to the integral of mass
times the squared distance to the centroid (Greenacre, 1984:35). Inertia is defined as
the total Pearson Chi-square for the two-way divided by the total sum, whereas the
eigenvalues are the squared singular values, which will add up to the total inertia

189
(Greenacre, 1984:35). In simple terms, the closer the inertia total to 1,00, the better
the fit of the model.
As regards the statistical significance of correspondence analysis, it should be noted
that correspondence analysis is an exploratory technique. This method was
developed on the basis of a philosophical orientation, which emphasises the
development of models that fit the data, instead of focusing on rejection of the
hypotheses on the basis of lack of fit. Benzecri's "second principle" states: "The
model must fit the data, not vice versa" (cited in Greenacre, 1984:10). Consequently,
no statistical significance tests are customarily applied to the results of a
correspondence analysis; since the primary purpose of the technique is to produce a
simplified (low-dimensional) representation of the information in a large frequency
table (or tables with similar measures of correspondence) (STATISTICA, 1984-
2004:1).
In the present study, the results of the cluster analysis were used for the
correspondence analysis of the three arts festival scenarios to attribute importance in
Figure 5.4, age groups to attribute importance in Figure 5.5, language to arts festival
scenarios in Figure 5.6, and arts festival scenarios to clusters in Figure 5.7. In
positioning or perceptual mapping, graphical representations were produced by a
multidimensional scaling programme, namely correspondence analysis (see Section
5.3.4). These maps give a visual representation of the way the respondents
perceived the three arts festival scenarios relative to one another on key attributes
such as brand, catering and entertainment activities.
Conjoint analysis, a methodology related to multidimensional scaling techniques, is
particularly suited to measuring human perceptions and preferences (Green, Tull &
Albaum, 1988:600). These two techniques are complementary, as MDS develops a
spatial map depicting the stimuli in a multidimensional perceptual or preference
space, whereas conjoint analysis develops the part-worth or utility functions
describing the utility customers attached to the levels of each attribute (Green &

190
Srinivasan, 1990:3). The technique of conjoint analysis is discussed in the next
section.
4.8.3 Conjoint analysis
Conjoint analysis is one of the terms used to describe a broad range of techniques
for estimating the value people place on the attributes or features that define
products and services (Martins, Loubser, & Van Wyk, 1996:30). The first secondary
objective of the present study, and for which conjoint analysis (CA) was used, was to
determine which combination of attributes festival attendees want from arts festivals.
The concept conjoint analysis can be defined in several ways. Hair et al. (2000:601)
define it as follows: “conjoint analysis as a multivariate technique that estimates the
utility of the levels of various attributes or features of an object, as well as the relative
importance of the attributes themselves”. Sudman and Blair (1998:229-230) warn
that conjoint analysis is not a data analysis procedure such as factor analysis or
cluster analysis; it should rather be regarded as a type of “experiment” designed to
show how various elements of products or services (price, brand, style) predict
customer preferences for a particular product or service.
In real life, respondents may find it difficult to indicate which attributes they consider
of value and how they combine the attributes to form their overall opinion. The value
of conjoint analysis is that it estimates how much each of these attributes is valued.
Churchill and Iacobucci (2002:748) summarise the concept as “… the word conjoint
has to do with the notion that the relative values of things considered jointly can be
measured when they might not be measurable if taken one at a time”.
A statistical procedure is then used to “decompose” the preferences of respondents,
that is, to quantify the value placed on the various features. These “features” and key
terms should be addressed in order to gain an understanding of CA:

191
• Attribute is a general feature of a product or service – such as size, colour,
speed and delivery time. Each attribute is then made up of specific levels.
• Level is a specific value describing a factor (Hair et al., 1998:391). Therefore,
for the attribute colour, the levels might be red, green, blue and so on.
• Factor is the term used when describing a specific attribute or other
characteristic of the product or service (Hair et al., 1998:393).
• Profile is the combination of a few attributes.
• Attribute levels denote the possible values assigned to the attributes
(Malhotra, 2004:684).
• Utility is a subjective judgement of preference unique to each individual (Hair
et al., 1998:392).
• Part-worth or weighted utility values/scores describe the utility customers
attach to the levels of each attribute (Malhotra, 2004:622) or that represent the
importance of each aspect of a product or service in the subjects’ overall
preference ratings (Cooper & Schindler, 2003:631).
• Relative attribute importance is the relative importance attached to each
attribute, depending on the relative range between maximum and minimum
level utilities within attributes.
• Conjoint simulators are directional indicators, which can provide a great deal
of information about the importance of relative features and preferences for
products. Simulation refers to “what if" situations.
The next section gives a general description of the various conjoint analysis
techniques and lists the Conjoint Value Analysis (CVA) technique used for analysing
the research results.
4.8.4 Types of conjoint analyses
There are various conjoint analysis methods/techniques that can be used, such as
the following (Hair et al., 1998:389):

192
• choice-based conjoint approach – an alternative form of collecting responses
and estimating the conjoint model;
• traditional conjoint – employs the “classic” principles of conjoint analysis, using
an additive model of consumer preference and pair-wise comparison or full-
profile methods of presentation; and
• adaptive conjoint methodology – conducting a conjoint analysis, which relies
on information from the respondents to adapt the conjoint design and to make
the task simpler.
The present study employed the traditional conjoint approach, and used the
SawtoothSoftware Conjoint Value Analysis (CVA), a PC-based software system for
designing and analysing the full-profile conjoint questionnaires, as this approach
allows a researcher to create a paper-and-pencil questionnaire, build efficient fixed
designs and calculate utilities for full-profile pair-wise conjoint interviews. In the
present study, the products were presented to the respondent in a pair-wise fashion
(two products at a time), with the request that the respondent should indicate a
preference for one of the two products on a nine-point rating scale (see Appendix A4
for an example in questionnaire).
Producing a conjoint design (questionnaire) requires six basic steps, as discussed in
the next section.
4.8.5 Basic steps in a conjoint analysis experiment
There are six major steps to be followed in the design of a conjoint study (Churchill &
Iacobucci, 2002:753). Figure 4.4 shows these critical steps for a conjoint experiment.

193
Figure 4.4: Basic steps when conducting a conjoint design (adapted from Churchill & Iacobucci, 2002:753)
The design should be constructed when designing a conjoint analysis experiment.
Each of the steps shown in Figure 4.4 (as applied in the study) is discussed next:

194
Steps 1 and 2: Select attributes and determine attribute levels
The single most important component of carrying out a conjoint study is selecting the
conjoint attributes and levels. The attributes used will stem primarily from the
objectives of the study (Churchill & Iacobucci, 2002:754). In the present study,
attributes describe product features, such as entertainment or festival activities and
food and beverages in general. Conjoint analysis also frequently includes the
attributes of price and brand. The actual attributes used should follow these
guidelines:
• the attributes should all influence real decisions;
• the attributes should be independent; and
• the attributes should measure only one dimension (Market Vision Research,
2002:6).
The levels of attributes should include a wide enough range to allow the current and
future markets to be simulated. In general, the extrapolation of utilities to levels not
included should be avoided. If, after including a complete range of levels, the
researcher finds many unrealistic combinations of levels, the category definition
should be revised or the respondents were given customised conjoint studies. The
researcher should attempt to include a nearly equal number of levels for each
attribute. Recent research has indicated the presence of an artificial number of levels
effect that inflates the relative importance of attributes, which have larger numbers of
levels (Market Vision Research, 2002:6).
Clearly, the choice of attributes is important, as it would be futile to define a product
in terms of irrelevant attributes. The attributes selected in the present study to
describe a festival are given in Section 4.4. The reason for considering the attributes
(five in total) relevant to a description of an arts festival is discussed next.
The two attributes of festival brands and ticket prices (see Table 4.5) are included in
the conjoint analysis since most conjoint studies include the attributes of brand and

195
price (Market Vision Research, 2002:6). In each case, three respective attribute
levels were included (see Table 4.5). The rationale for using the other three
attributes, namely entertainment activities, food and beverages and transport to
venues as listed in Table 4.5, was based on previous research (Van Zyl, 2002:166-
168) and constructed in the manner discussed below.
The first step in a conjoint study is to select the attributes most appropriate to the
purchase decision (Cooper & Schindler, 2003:631). This required a brainstorming
session between the author and a leading conjoint expert with thorough market
knowledge in South Africa, Professor Adré Schreuder (Consulta Research Company,
2003). The conceptual framework or results of the previous master's dissertation
(Van Zyl, 2002) was used as the basis for selecting the attributes that festival
attendees would regard as most important in their decision-making process. The
criteria for selecting attributes were based on the guidelines mentioned beforehand.
The above-mentioned dissertation identified three main attribute dimensions, namely
push and pull factors as well as situational inhibitors (Van Zyl, 2002:166-168). These
three main attribute dimensions were too many to consider in a conjoint study, as
one of the guidelines states that a conjoint analysis can only measure one attribute
dimension at a time (Schreuder, 2003). In general, caution should be exercised when
constructing a conjoint design, because the researcher may not do a conjoint within a
conjoint (Schreuder, 2003). In other words, one main attribute dimension (value
proposition) cannot be compared with another main attribute dimension (value
proposition). The conjoint design starting with the selecting of attributes should be
correct or the “r-squared” value will be too low and lead to an inefficient design.
Therefore, the most important attribute had to be selected from the three main
attribute dimensions (push, pull factors and situational inhibitors). After eliminating
the less important factors being the push factors and situational inhibitors, the pull
factors emerged as the most important attribute dimension. Its major importance in
terms of positioning is due to the fact that pull factors are the most important feature
in attracting festival attendees to a festival (Van Zyl, 2002:107).
196
Kotler’s (2000:298) definition of positioning states that all things being equal, the
customer thinks of only one attribute at a time in a rating order. The customer does
not mentally differentiate between objective and subjective positioning.
The other two main attribute dimensions (push factors and situational inhibitors) were
incorporated and built into the demographic variables (see questionnaire in Appendix
A 3, Section C). The festival organisers have no control over the push factors, but
may be able to overcome some of the situational inhibitors (Van Zyl, 2002:111). The
push factors were incorporated into the questionnaire in a ranking order (Van Zyl,
2002:113).
An exploratory factor analysis was done by means of Principal Axis Factoring as an
extraction method and Promax with Kaizer Normalisation as the rotation method,
using the conceptual results of previous research for the master's dissertation (Van
Zyl, 2002:127). The present study used the explorative results of factor analysis,
taking this analysis one level higher (the higher-level concepts) by only using the
constructs (highest mean values). Three of the descriptive statistics on the situational
inhibitors with the highest means were selected (Van Zyl, 2002:127), namely:
• time and money (mean=3,07)
• accessibility/ transport (mean = 2,67)
• social problems (mean=2,50).
All four domains of the results from the descriptive statistics on the pull factors with
their mean values (Van Zyl, 2002:114) were considered, namely:
• information and marketing (mean = 4,21)
• food and beverages (mean = 4,17)
• entertainment (mean = 4,10)
• transport (mean = 3,94).

197
As information and marketing (highest rating) was regarded as the single most
important attribute, this feature was a focus of the present study.
The author decided to single this out to determine which combination of information
and marketing (value proposition) a festival should offer. Consequently, only the
other three domains – entertainment, food and beverages, and transport to venues –
of the pull factors were selected as attributes (see Table 4.5). An equal number of
attribute levels was used in the case of each attribute, consisting of the individual
items with the highest mean values in each case. It was decided that a minimum
attribute level would be retained and only the highest item values would be included
in each case. Concerning the levels of an attribute, an equal number (three) of levels
was specified per attribute in the present study. The reason is that an attribute with
more levels might be weighted as more important than an attribute with fewer levels
(Wittink, Krishnamurthi & Reibstein, 1989:113).
The five attributes and the three attribute levels selected are shown in Table 4.5.

198
Table 4.5: Attributes and attribute levels
Prompt: Which of the following options would you prefer at an arts festival?
Festival brands (Different festivals)
Entertainment activities (productions
offered)
Food and beverages (refreshments)
Transport to venues (accessibility)
Price of tickets (ticket prices)
The … festival that offers … With … and having ... At …
A
… quality arts (e.g. visual
art, exhibitions)
… a wide variety of
refreshments of good
quality (food and
beverages)
…good transport (accessibility)
to venues
… more than the current
price
B
… quality performances
(e.g. performing arts; dance
& movement; literature &
poetry; children’s theatre )
… friendly service with
refreshments (food and
beverages)
… sufficient parking facilities at
venues
… less than the current
price
C
… quality music (e.g.
classical & opera; choir &
ensemble; cabaret & music;
blues & jazz; rock)
… value for money
refreshments (at food
outlets)
… safe and secure parking
facilities at venues
… the same as the
current price

199
Step 3: Determine the attribute combinations to be used in the survey and select the form in which the questions in the survey are presented and the nature of the judgements required from the respondents in the survey (Step 4)
Step 3 consists of determining the attribute combinations to be used in the survey
(profile design). A particular product is a profile consisting of attributes and their
levels. Figure 4.5 explains the relationship between a profile and its attributes and
levels.
Figure 4.5: The relationship between profiles, attributes and levels (Sambidi, 2003)
When using conjoint analysis, a product is deemed to consist of various “attributes”
(Schreuder, 1999:1; CVA, SawtoothSoftware, 1996:2). For instance, the attributes in
this example are A, B and C. Each attribute has several possible “levels”, for
example, the levels of attribute A are A1, A2 and A3. The combination of several
attributes is called a profile and in the example, the profile consists of A3, B2 and C1.
In conjoint analysis, product concepts can be shown to respondents one at a time,
the single concept popularly called “card-sort”, or it can be presented pair-wise (CVA,
SawtoothSoftware, 1996:2). Pair-wise presentation may be more difficult for the
respondent, because each question requires an understanding of two concepts
instead of only one.

200
However, the comparative nature of the pair-wise task may allow the respondent to
make a finer distinction and could contribute more information than the single
concept presentation would.
Pair-wise presentation is useful for most conjoint projects, and especially so for
computer-administrated conjoint questionnaires (CVA, SawtoothSoftware, 1996:2).
Product concepts that are described for all the attributes being studied are referred to
as full profile. Most researchers would consider a full profile card-sort conjoint as a
traditional conjoint (Market Vision Research, 2002:1). The present study used pair-
wise presentation because much more information can be gathered from this
presentation. In the present study, these profiles are presented pair wise with a 9-
point semantic differential scale, requesting the respondent to indicate his/her
preference of the profiles (products) in a pair.
A distinction should be made between a full factorial design and a fractional factorial
design. In a full factorial design, all levels of factors are used, leading to many
profiles. The present study used five attributes with three levels each. This gave
3x3x3x3x3 = 243 profiles, which were far too many as this would require a
respondent to evaluate 243 profiles or compare about 121 profile pairs of profiles on
a 9-point scale. For this reason, a fractional factorial design was used in the present
study, as this design required only 16 pairs of profiles to be compared on a 9-point
semantic differential rating scale. Such a design enables the estimation of main
effects but not the interaction effects. Briefly, the efficiencies refer to the “measure of
design goodness” (Xu & Yuan, 2001:1). The design goodness aspect used in this
study is discussed in more detail below.
The conjoint design is a critical component in the success of any conjoint project
(CVA, SawtoothSoftware, 1996:4). A design with a zero correlation between pairs of
attributes is termed orthogonal. Balance occurs if each level within an attribute is
shown an equal number of times. Design efficiency refers to the degree to which a
design matches an orthogonal design. Design efficiency values range from 0 to 100,
in which 100 denotes an optimal design (Hair et al., 1998:390).

201
In real life it may not be possible to create a perfectly balanced orthogonal design for
a particular set of attributes. The CVA (1996:5) approach produces a sophisticated
algorithm for generating well-balanced, “nearly orthogonal” designs.
CVA generates a pool of potential questions (from which the final design will be
chosen) many times greater than the requested number of questions. After creating
the pool of potential questions, CVA reduces the pool to the desired number of
questions (tasks) in the following steps:
1. the D-efficiency of the design is calculated for the pool, excluding one conjoint
question at a time; and
2. CVA then examines every potential 2-way swap of conjoint questions that
remain with those that were discarded. CVA swaps any pairs of questions,
which results in greater efficiency.
CVA repeats Steps 1 and 2 many times, using different random starting points, and
selects the best final solution. Finally, for pair-wise designs, CVA flips left and right
concepts to improve the left/right balance of the design.
The CVA iterative designer seeks to maximise the D-efficiency that measures the
goodness of the design relative to the hypothetical orthogonal design. A perfect
design will be both orthogonal and balanced and will result in an efficiency of 100
(CVA, SawtoothSoftware, 1996:5-6). However, an orthogonal design is not always
possible, given the number of attribute levels and requested number of tasks. A final
efficiency of less than 100 may still indicate a satisfactory design (CVA, Sawtooth-
Software, 1996:5-6). In the present study, a design efficiency of 95% was achieved,
indicating a satisfactory design.
The data collection method depends on the specific conjoint technique to be used, as
the conjoint literature proposes three different methods of data collection such as
pair-wise, full profile and ranking. The suggested data collection method for the pair-
wise comparison is personal face-to-face interviews.
202
In the present study, personal face-to-face interviews were conducted with each
respondent, and each interviewer was trained to conduct the interview (see Section
4.4).
Step 5: Decide how judgements will be aggregated for analysis
This step involves deciding whether the responses from customers or groups of
customers will be aggregated and if so, how this will be done. If groups are formed,
the operational meaning is that of estimating the weighted utilities for the individual-
level models and then clustering them into homogeneous groups. According to
Churchill and Iacobucci (2002:759), this step highlights an attractive feature of
conjoint analysis because it allows market-share predictions for selected product
alternatives.
In the present study, the attribute importance and part-worth or weighted utility values
of attribute levels were calculated per individual for each of the three arts festival
scenarios. Following that, statistical analyses, such as cluster analysis,
correspondence analysis and multivariate analysis of variance procedures, were
performed on these values. These results are given in Sections 5.3.1 to 5.3.5.
Step 6: Select the appropriate conjoint analysis technique to conduct the analysis
The final step in the design of a conjoint analysis project is to select the technique
that will be used to analyse the data. The choice depends largely on the method
used for obtaining the input judgements from the respondents. For example, when
rank-order data have been obtained, the assumption of a linear relationship may be
doubtful, so a non-metric regression model may be substituted to estimate the
utilities (Churchill & Iacobucci, 2002:759). The present study did not use ranked data
but did require the respondents to rate the importance of one product compared to
another on a 9-point semantic differential scale. Ordinary linear regression analysis
was used to estimate the part-worth values of levels of attributes.

203
With CVA (1996:8), either ordinary least squares (OLS) or monotone regression can
be used to calculate utilities. OLS is the method of calculation used in most conjoint
studies, and which was also used in the present study.
It is comparatively quick and can provide valuable diagnostic information about the
quality of the calculated utilities. However, OLS is not appropriate for conjoint data
consisting of rank orders. For OLS to be appropriate, the assumption should be that
the data are “scaled at the interval level” (CVA, 1996:8). This means that the data are
scaled so that real differences in the items being measured are communicated by the
arithmetic differences in their values. CVA automatically sets a default in the case of
the attribute level higher than current price.
Furthermore, it should be mentioned that when CVA (1996:14) calculates utilities
using OLS the term R-squared value is used. As in a regression analysis, the R-
square indicates how well the data fit the model and R-square is therefore a
goodness-of-fit measure (Malhotra, 2004:612). R-square shows the proportion of the
variance of the customer’s preference that is explained by the combination of the
independent variables (attributes and attribute levels). R-square is a squared
correlation index, which indicates the proportion of variance of the optimally scaled
data that can be accounted for by the MDS procedure (Malhotra, 2004:612). Its
values range between 0 to 1, and a high R-square value indicates that the data fit the
model well.
By contrast, if the R-square has a low value, this is an indication that the data may
not fit the model well, either because there were some errors in the data collection or
some inconsistency occurred when customers performed their rating tasks (Xu &
Yuan, 2001:1). In this study, any R-squared values below 0,4 were omitted from the
study. Individual respondent numbers 210 and 185 were deleted as their R-squares
were below the norm. The average of R-squares for this study was 0,83, which
indicated a good fit between the data and the model.
204
Once the conjoint questionnaire had been designed, it was pre-tested and the data
were gathered by means of personal face-to-face interviews. The following steps
involve the calculations (the weighted utility profiles of 16 attribute combinations) and
presentation of the results discussed in Chapter 5. These results of the conjoint
technique were used to construct the game theory that is discussed next.
4.9 GAME THEORY
Game theory is a distinct and interdisciplinary approach to the study of human
behaviour in which the disciplines of mathematics, economics and other social and
behavioural sciences are involved (McCain, 1997:1). Mansfield and Yohe (2004:441)
report that “game theory is a tool that has been created to help us study decision-
making in situations in which there is a mixture of conflict and cooperation. Oligopoly
is thus a perfect context in which to display its power”. Game theory is intended to
overcome the problem of semi-competition. “Games” have always been a scientific
metaphor for more serious interactions in human society (McCain, 1997:2).
It should be noted that the theory of games is a rather complex mathematical
discipline, which falls beyond the scope of this study. Therefore this theory is
introduced only as a tool to address a secondary objective of this study, i.e. to
compare the three different arts festival scenarios and their attributes with one
another. In this case, game theory is used solely as an optimisation technique to
determine the best option or optimal arts festival offering.
This way, the researcher can determine the most successful or optimum arts festival
presentation as a tourism attraction. The game theory technique “is a tool for telling
us where incentives will lead,” but it “does not tell us to maximize utility, it explores
what happens when we do" (Eatwell, Milgate & Newman, 1987:479).

205
Game theory, as applied in the present study, was therefore used solely as a tool to
integrate the data, to compare the three different arts festival scenarios and to
choose the optimum arts festival presentation. The results were used to develop the
market-positioning model discussed in Chapter 6.
Game theory as a discipline recognises fully competitive games, such as Nash
equilibrium, and semi-competitive games such as non-price competition (Mansfield,
2003:441). The arts festival scenarios can be regarded as being involved in strictly
competitive games against one another, in other words either in direct competition, or
not in direct competition, or just in semi-competition, as is the case in the present
study. The non-competitive games, as used in this study, are based on the founding
theory of Bayes’s formula (Mizrahi & Sullivan, 1993:343).
In cases where experiments with sample spaces can be divided into two or more
mutually exclusive events, as can the three arts festival scenarios in this study, the
use of conditional probability leads to the famous formula of Bayes (Mizrahi &
Sullivan, 1993:338). Bayes's formula calculates the probability of an event E of a
sample space relative to another event F of the same sample space (Mizrahi &
Sullivan, 1993:338). That is, if prior information states that the outcome must be in a
set F, this information should be used to reappraise the likelihood that the outcome
will also be in E. The reappraised probability is denoted by P (E|F), and is read as:
“the conditional probability of E given F”. This answers the question, “How probable
is E, given that F has occurred?” Bayes’s general formula is discussed in the section
below (Mizrahi & Sullivan, 1993:343).
Let S be a sample space divided into n events, A1, ……, An. Let E be any event of S
for which P (E)>0. The probability of the event Aj (j=1, 2, ……, n), given the event E,
is
)()|()(
)|(EP
AEPAPEAP jj
j
•=
)|()()|()()|()()|()(
2211 nn
jj
AEPAPAEPAPAEPAPAEPAP
•+⋅⋅⋅+•+•
•=
206
The present study illustrates the use of Bayes’s formula when a sample space S is
divided into three events An = A3, namely the three arts festival scenarios. It can be
accepted that a tourist may evaluate all three arts festival packages, but the question
is what will motivate the tourist to make the active involved choice of going to or
preferring one particular arts festival package to another? One tourist may prefer
music; another may prefer drama or performance. A certain percentage likelihood
can be attributed to certain characteristics by means of the game theory technique.
Furthermore, exogenous and endogenous variables are considered in macro-
economic theory (Dornbusch & Fischer, 1995:57). For the purpose of this study, a
decision was taken to use the endogenous variables in the game, as these variables
can be manipulated, and weighted raw utility values can be calculated for each of the
variables. Endogenous variables are the variables whose values the researcher
wishes to determine, as opposed to exogenous variables, which are the variables
whose values are determined outside the model (Dornbusch & Fisher, 1995:57).
Although exogenous variables such as demographics and behaviour do play a role,
they are not the only variables to be considered. The endogenous variables such as
price, brand, refreshments and transport are the most significant variables to
consider because these variables can be changed and modified: the management of
arts festivals can do something about them.
The results of the attribute level importance (weighted raw utility value) for all three
festivals were used to design the matrix or scale for the game theory (refer
respectively to Tables 5.3 and 5.14 in this regard). A range was designed for each
attribute level. This was calculated by using the highest weighted raw utility value,
rounded off, as the top end of the scale. This top-end value was divided by three to
obtain the other values on the scale. The results of conjoint analysis were used to
design the game. A point of -1, 0, or 1 was awarded according to the weighted raw
utility value scale that was set for each attribute level.
207
A value of 1 was awarded to the highest-ranked bundle in the matrix or map, and 0 to
the second-highest ranked bundle, whereas a value of -1 was given to the next-
largest number on the list (refer to Table 5.15, which indicates the game as set for
festivals A, B and C).
The game was set up and a weight per individual attribute level awarded, based on
the results of the conjoint study. A percentage was also awarded for each
characteristic. The final outcome of the game as a set or “play out” was then
displayed (refer to Table 5.16 in this regard). Different games can be played or set up
depending on the changes in the endogenous variables.
The outcomes of the games might lead to different results in each of the cases of the
five endogenous variables, after making changes to the individual scores for the
variables of festival brand, entertainment or festival activities, refreshments (food and
beverages), transport and/or ticket price. The outcomes only explore what may
happen when changes are made to these scores. Refer to Chapter 5 in Tables 5.17
to 5.25 for an illustration of these outcomes.
The outcomes of these results were used to develop the market-positioning model in
Chapter 6.
4.10 METHODOLOGICAL LIMITATIONS
Although it would have been ideal to interview respondents while each of the three
selected festivals was being held, an alternative was proposed as conjoint analysis is
flexable and accommodates this method. This alternative was considered to be the
best option for data collection at the three areas in the scenarios, due to the
complexity of administering a conjoint questionnaire and the fatigue such a
questionnaire tends to cause.

208
4.11 CONCLUSION
This chapter discussed the research methodology of the study. Attention was given
to the research process pertaining to this study. As this was a scenario-based study,
the sampling was based on each of the three arts festival scenarios. These three
scenarios, namely Festival A, Festival B and Festival C, operate in a niche market
with characteristics unique to each festival scenario. The scenarios do not claim to be
representative of the population. A judgemental sample was drawn, using specific
criteria to ensure representativeness and homogeneity. The primary data were
collected to achieve the secondary research objectives of the study.
Of specific interest is the use of the two techniques, conjoint analysis and game
theory, in an arts festival context. The two techniques were used solely as tools to
analyse the data. Conjoint analysis was the first technique to be applied and its
results are discussed in Chapter 5. These results were used in the second technique,
namely the game theory. The outcome of the games in Chapter 5 was in turn used to
develop the market-positioning model described in Chapter 6. The next chapter
presents and discusses the research findings of the study.
209
CHAPTER 5
5 ANALYSIS OF ARTS FESTIVAL DATA AND DISCUSSION OF RESULTS
5.1 INTRODUCTION
The primary research objective of the study was to construct a market-positioning
model that could be used by South African event co-ordinators to provide guidelines
for ensuring a successful arts festival. This primary research objective was achieved
by means of secondary research objectives. The first was to determine which
attributes and combination of attributes would drive best practices to be offered in
arts festival scenarios. The situational inhibitors or constraints that might prevent
respondents from attending these scenarios are also addressed.
The next secondary objective was to compare the different arts festival packages and
their attributes with one another. Achieving this objective would provide information
on the most successful arts festival positioning in terms of a tourism attraction. The
third secondary objective was achieved by integrating the data to develop a market-
positioning model. This was then used to develop the maket-positioning model
specifically for arts festivals. This model could add value to the body of knowledge
about South African arts festivals. The analysis presented in this chapter is organised
to address these objectives and is arranged in three parts.
Firstly in Section 5.2, Table 5.1 lists the demographic, geographic and behaviour
criteria of respondents who attend arts festivals, and Section 5.2.1, the situational
inhibitors that affect respondents in the three selected arts festival scenarios
negatively. These inhibitors provide valuable information about the respondents in
the three arts festival scenarios and can add value to the market-positioning model.
The inhibitors were incorporated as a demographic variable in the analysis of the
data.

210
Secondly, the conjoint analysis technique was employed to address the first
secondary objective of the study. The analysis of the objective is arranged into four
sections and is presented in a specific order. In Section 5.3.1, the relative attribute
importance is calculated to determine the importance of the attributes of the three
arts festival scenarios, and in Section 5.3.2, the level of importance of each relevant
attribute is calculated. The results of Section 5.3.2 are used in Section 5.3.3 to
conduct cluster analyses that identify homogeneous subgroups or clusters of
respondents, irrespective of their current status. The results of these are used in
Section 5.3.4 to report on the correspondence analysis that indicates variables,
which correlate with each other, thus providing a method of differentiating among
respondents.
The results of the correspondence analysis are outlined in the positioning maps. In
Section 5.3.5, the attribute simulation tool is presented by using the results of Section
5.3.4. These results make it possible to determine the optimum combination of
attributes for each arts festival scenario. In order to take the results to the next level
another technique that of “game theory” was used.
The last part of the data analysis uses the results of the conjoint section in the “game
theory” technique to compare the different arts festival packages with one another to
determine the most successful arts festival package (see Section 5.4). The
information gained from the above-mentioned analysis was used to develop a
market-positioning model specifically for arts festivals.
Some of the demographic, geographic and behavioural information about the
respondents in each of the three arts festival scenarios is discussed below.

211
5.2 DEMOGRAPHIC, GEOGRAPHIC AND BEHAVIOURAL CRITERIA OF
RESPONDENTS AT THE THREE ARTS FESTIVAL SCENARIOS
Certain general information about the respondents in the three arts festival scenarios
and some behavioural data were gathered.
The CVA V2 program (1996) merged the ASCII-format segmentation variables of
age, gender, home language, will or will not attend arts festival again, educational
qualification level, push factors and situational inhibitors in the utility file format (refer
to Appendix B1). These segmentation variables provide information about positioning
arts festivals in the market and are listed in Table 5.1.
Table 5.1: General information about respondents across the three arts festival scenarios
Variables Festival A Festival B Festival C
Age
18-30 33% 33% 33%
31-45 34% 34% 34%
46+ 33% 33% 33%
Total 100% 100% 100%
Gender
Male 50% 50% 49%
Female 50% 50% 51%
Total 100% 100% 100%
Home language
Afrikaans 96% 8% 99%
English 2% 80% 1%
Other 2% 12% 0%
Total 100% 100% 100%
Attend festival again
Yes 100% 98% 97%
No 0% 2% 3%
Total 100% 100% 100%

212
Variables Festival A Festival B Festival C
Educational qualification
Standard 8-9 0% 5,1% 15,1%
Standard 10 34,1% 23,2% 47,4%
Diploma 4,0% 16,2% 21,7%
Higher diploma/degree 37,3% 21,2% 13,2%
Honours degree 10,3% 11,1% 0%
Master's degree 9,5% 12,1% 0,7%
Doctoral degree 4,8% 11,1% 0%
Total 100% 100% 100%
Push factors
Community pride 29 of 100% 57 of 100% 14 of 100%
Event novelty 34 of 100% 57 of 100% 9 of 100%
Socialisation with friends 52 of 100% 32 of 100% 16 of 100%
Family togetherness 67 of 100% 20 of 100% 13 of 100%
The distribution of the respondents in the sample by gender, age and area was pre-
determined by means of quota sampling at the three arts festival scenarios. These
three arts festival scenarios were held in different regions of South Africa, and the
dominant language and culture of each of these regions might differ.
It was found that Afrikaans was the home language of most of the respondents at
Festival A and Festival C, while the home languages of a smaller group at these
festivals were English and other languages. This probably reflects the character of
the area at Festival A, as the university and other secondary education institutions in
the area of Potchefstroom are mainly attended by Afrikaans speakers. Festival C
originated in 1994 as an Afrikaans alternative to the mainly English-dominated
Festival B and this is probably reflected in the respondent’s language preference.
English was the most preferred language of 80% of the respondents at Festival B.
Interestingly, Festival B originated as a commemoration of the 1820 British Settlers
and still has this character today. For that reason, Festival B differs significantly from
Festival C and Festival A with regard to the language preference of the respondents
at these festivals.

213
The responses to the question whether the respondents at each of the three arts
festival scenarios would attend the particular arts festival again, in future provided
useful information about the loyalty of respondents, as repeat attendance would
indicate loyalty to arts festivals (Getz, 1997:264). Most of the respondents (more than
97%) at the three arts festival scenarios indicated they would attend the next arts
festival again and are regarded as likeminded individuals.
These respondents can probably be regarded as “true festival attendees” as they had
attended an arts festival in the past (see Appendix A3, screening question in
questionnaire) and they indicated they would attend an arts festival again. If
attendees want to return, they have to be fairly satisfied with the previous experience
(Crompton & McKay, 1997:425). As a high percentage indicated that they would
attend the respective arts festival again, the conclusion can be drawn that the
respondents at each of the three arts festivals are relatively satisfied with the festival
held in the region.
Furthermore, according to literature, numerous festival surveys have detected a loyal
group of repeat attendees (“will go again”), obviously including a high proportion of
the residents in the region (Getz, 1997:263). This group of repeat attendees often
has a strong “brand loyalty” to a particular event, adding to their desire to support it.
The majority of respondents (75,1%) from Festival A fall in the category of higher
diploma or degree and Standard 10 with a smaller group (24,6%) in the top category
with honours, master's or doctoral degrees. Apparently there is a higher level of
tertiary education qualifications in this region, which might be attributed to the tertiary
educational institutions in the Potchefstroom area. However, previous research has
shown an association between educational qualification and attendance of arts
festivals (Hughes, 2000:16).
More than half of the respondents (55,5%) from Festival B had obtained a higher
education diploma, a bachelor's degree, and/or an honours, master's or doctoral
degree, and at least 23,2% had a Standard 10 qualification and 16,2% a diploma.
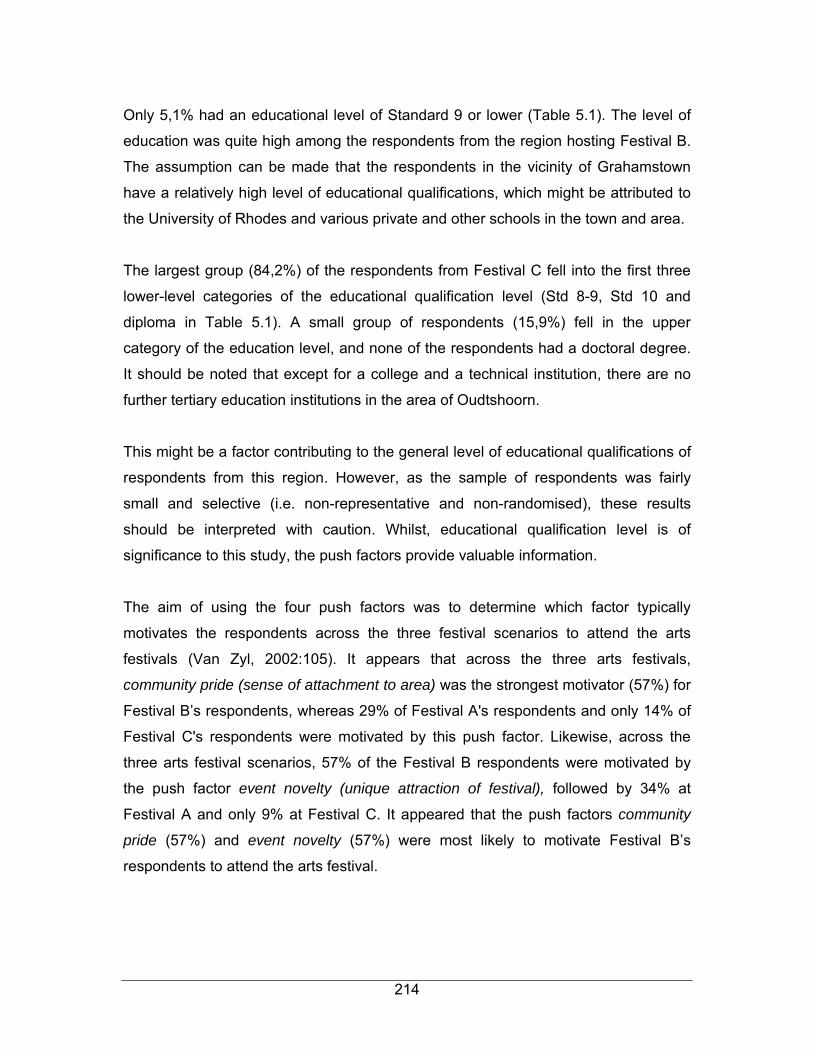
214
Only 5,1% had an educational level of Standard 9 or lower (Table 5.1). The level of
education was quite high among the respondents from the region hosting Festival B.
The assumption can be made that the respondents in the vicinity of Grahamstown
have a relatively high level of educational qualifications, which might be attributed to
the University of Rhodes and various private and other schools in the town and area.
The largest group (84,2%) of the respondents from Festival C fell into the first three
lower-level categories of the educational qualification level (Std 8-9, Std 10 and
diploma in Table 5.1). A small group of respondents (15,9%) fell in the upper
category of the education level, and none of the respondents had a doctoral degree.
It should be noted that except for a college and a technical institution, there are no
further tertiary education institutions in the area of Oudtshoorn.
This might be a factor contributing to the general level of educational qualifications of
respondents from this region. However, as the sample of respondents was fairly
small and selective (i.e. non-representative and non-randomised), these results
should be interpreted with caution. Whilst, educational qualification level is of
significance to this study, the push factors provide valuable information.
The aim of using the four push factors was to determine which factor typically
motivates the respondents across the three festival scenarios to attend the arts
festivals (Van Zyl, 2002:105). It appears that across the three arts festivals,
community pride (sense of attachment to area) was the strongest motivator (57%) for
Festival B’s respondents, whereas 29% of Festival A's respondents and only 14% of
Festival C's respondents were motivated by this push factor. Likewise, across the
three arts festival scenarios, 57% of the Festival B respondents were motivated by
the push factor event novelty (unique attraction of festival), followed by 34% at
Festival A and only 9% at Festival C. It appeared that the push factors community
pride (57%) and event novelty (57%) were most likely to motivate Festival B’s
respondents to attend the arts festival.

215
Across the three arts festival scenarios, the respondents at Festival A were highly
motivated by the push factor family togetherness (67%), whereas this push factor
only motivates 20% of the respondents at Festival B and 13% at Festival C. Similarly,
across the three arts festivals the push factor socialisation with friends was the
strongest motivator for Festival A respondents (52%) followed by 32% for Festival B
and 16% for Festival C.
Apparently the push factors family togetherness (67%) and socialisation with friends
(52%) were both the preferred motivators for respondents to attend Festival A, and
community pride (57%) and event novelty (57%) for respondents at Festival B,
whereas the respondents did not mention a specific or dominant motivator for
attending Festival C.
The situational inhibitors that might prevent respondents from attending an arts
festival are included as general information additional to those reflected in Table 5.1
and is discussed in the next section.
5.2.1 Situational inhibitors of respondents at each of the three arts festival scenarios
The aim of this question (see Appendix A3, Section C of questionnaire) was to
determine the respondents' perceptions of the situational inhibitors that might prevent
them from attending the respective arts festival scenarios. These inhibitors provide
some information supporting the positioning of arts festivals in the market. CVA V2
was used to extract the information. The CVA V2 program automatically converts an
11-point rating scale to a 0-100 score. Conditional formatting or provisional formatting
sets ranges between certain index points.
Each arts festival is evaluated individually. Three dimensions or domains, namely
time and money, accessibility and transport and social problems with individual items
in each were extracted. Only the most prominent figures are highlighted, or colour
coded. The CVA menu was used to customise a colour monitor.

216
The red colour-coded items were extremely likely (higher than the average) to
influence respondents negatively, whereas the blue colour-coded items were least
likely (less than average to influence person not to go) to influence them negatively.
The items in white have a neutral effect. In other words, the higher the red, the
stronger the influence and the smaller the blue, the weaker the influence, while white
has no real influence. The results are illustrated in Table 5.2.

217
Table 5.2: Situational inhibitors across the three arts festival scenarios
Total Festival A Festival B Festival C
Number of respondents 376 126 98 152
Situational inhibitors regarding time and money at an arts festival
58,8 57,7 60,4 58,8
a. The high cost of attractions and entertainment. 65,1 61,7 69,6 64,9
b. Not having enough money to spend on productions. 63,8 58,1 70,2 64,3
c. The higher prices in shops and restaurants. 72,3 64,4 64,9 83,5
d. The lack of time to attend an arts festival. 47,3 52,7 58,7 35,4
e. Willingness to pay for arts, performances and music. 45,8 51,7 38,0 45,7
Situational inhibitors regarding accessibility and transport at an arts festival
44,5 41,4 49,1 44,0
f. The lack of parking facilities at venues. 63,8 60,4 53,0 73,7
g. The lack of transport to get to an arts festival. 34,9 32,6 42,8 31,9
h. The arts festival is too far from home. 34,6 31,3 51,6 26,7
Situational inhibitors regarding social problems at an arts festival
41,6 42,8 37,0 43,6
i. The traffic congestion in the streets during festival time. 62,0 61,2 50,4 70,1
j. Crowded restaurants and shopping centres. 62,0 61,3 45,2 73,6
k. Too much noise during the festival. 34,1 31,3 31,3 38,2
l. Festival attendees who drink too much. 50,9 54,2 39,7 55,3
m. Too many festival attendees. 32,7 41,1 32,5 25,8
n. Too much effort to attend an arts festival. 24,1 24,4 31,4 19,0
o. Disruption of my daily life or routine. 25,4 25,7 28,2 23,4
Overall inhibitor index score 47,9 47,5 47,2 48,7
Scale explanation:
100 = Situational inhibitor that influences very negatively
0 = Situational inhibitor item that does not influence decision
Table 5.2 indicates that, from a global perspective across all three arts festival
scenarios, the higher prices in shops and restaurants (72%) was the single highest
inhibitor item in the dimension of time and money.

218
The inhibitor items the high cost of attractions and entertainment (65,1%) and not
having enough money to spend on productions (63,8%) regarding the dimension of
time and money, as well as the lack of parking facilities at venues (63,8%) regarding
the dimension of accessibility and transport to an arts festival were among the most
prominent inhibitors. The two items in the dimension of social problems were also
prominent, namely the traffic congestion in the streets during festival time (62%) and
crowded restaurants and shopping centres (62%) across the three arts festivals
scenarios.
The single highest inhibitor item of all dimensions, which negatively influenced
respondents at Festival A, was the higher prices in shops and restaurants (64,4%).
Some of the other most prominent items influencing Festival A’s respondents
negatively were the traffic congestion in the streets during festival time (61,2%) and
crowded restaurants and shopping centres (61,3%) regarding the dimension of social
problems as well as the lack of parking facilities at venues (60,4%) regarding the
dimension of accessibility and transport at an arts festival.
The inhibitor item not having enough money to spend on productions was the single
strongest inhibitor (70,2%) of all the dimensions negatively influencing Festival B’s
respondents against attending the festival. Some of the other most prominent items
regarding the dimension of time and money at an arts festival, which negatively
influenced Festival B’s respondents were the high cost of attractions and
entertainment (69,6%) and the higher prices in shops and restaurants (64,9%) as
well as the lack of time to attend an arts festival (58,7%). A relatively large number of
items had a neutral effect on Festival B’s respondents regarding the dimension of
accessibility and transport or a least likely influence on the dimension of social
problems at an arts festival.
The respondents at Festival C indicated that the situational inhibitor item, the higher
prices in shops and restaurants (83,5%) regarding the dimension of time and money
was the single strongest inhibitor negatively influencing them against attending the
festival.

219
Festival C’s respondents also indicated that the items the lack of parking facilities at
venues (73,7%) regarding the dimension of accessibility and transport, crowded
restaurants and shopping centres (73,6%), the traffic congestion in the streets during
festival time (70,1%) regarding the dimension of social problems influenced them
very negatively against attending the festival.
The situational inhibitors can be interpreted as indicating that each of the three
festival scenarios is constained by different inhibitors. However, if the overall inhibitor
index score is considered, the respondents at Festival C (score of 48,7) were the
most likely to be inhibited, followed by Festival A (score of 47,5) and slightly less of a
problem at Festival B (score of 47,2). All the scores differ significantly, as different
items and dimensions are considered. The inhibitor dimension time and money are
the most evident inhibitor dimension across all three festivals with a total score
ranging from 57,7% to 60,4%.
The next section discusses the use of the conjoint analysis technique for addressing
the first secondary objective of the study.
5.3 CONJOINT ANALYSIS
The first secondary objective of the study was to determine which attributes and
attribute profiles (composition or packages) would motivate the respondents at the
different arts festival scenarios to attend a particular arts festival, in other words
which attributes and combination of attributes would drive best practices to be offered
in arts festival scenarios. The conjoint analysis technique was employed to achieve
this objective.
Conjoint analysis is useful for learning how potential or current arts festival buyers
value its various aspects, features or attribute levels (CVA, 1996:7). The CVA V2.0
System conjoint software package from SawtoothSoftware (1996) was used in this
research study.

220
A data file of arts festival respondent answers to the CVA questions has to be
provided, and for this paper-and-pencil CVA study an ASCII data file was created
(refer to Appendix B1 in this regard).
The attributes selected were based on literature study conducted in previous
research (Van Zyl, 2002:166-168). (Also see paragraph 4.4 the design of the
research instrument and paragraph 4.8.5 steps 1 and 2 on attributes). The conjoint
data analysis is arranged into four different sections and each is discussed in
consecutive order. The next section explains how the relative attribute importance
was calculated to determine the importance of attributes at the arts festival scenarios.
5.3.1 Relative attribute importance and individual attribute importance for the three arts festivals scenarios
One of the first steps in the conjoint analysis process is to determine the relative
attribute importance of each of the three arts festival scenarios as well as the
attribute importance per individual respondent. The Ordinary Least Squares (OLS)
linear regression calculation method of CVA was used to calculate each arts festival
respondent’s utilities (strengths of preference) for festival product features. However,
it is valuable to use a method to test the quality of the calculated utilities. Correlation
is a measure of internal consistency of the respondents’ responses to the conjoint
questions. This is defined as R-squared if utilities were calculated using OLS. The
correlation cut-off point range is between 0 and 1. The average R-square of this
study was 0,83 which is a very high as the ideal is 1. Standard errors are provided for
each respondent’s utility values (CVA, 1996:G9-10) (refer to Appendix B2 in this
regard.) The R-squares of two respondents, No. 210 and 185, were too low (below
0,4) and had to be discarded.
Figure 5.1 illustrates the global results of relative attribute importance and the results
for each of the three arts festival scenarios, which are the first steps to be taken
when employing the conjoint analysis technique. Attribute importance is the average
of all the individual respondents' scores.

221
Figure 5.1 illustrates the relative importance of attributes globally and at each of the
three festival scenarios individually.
Attribute importance
28.7% 25.1% 24.2%34.7%
22.8% 25.8% 29.0% 16.3%
15.1% 14.9% 14.4% 15.7%
15.6% 15.4% 16.8% 15.0%
17.7% 18.7% 15.6% 18.2%
0%10%20%30%40%50%60%70%80%90%
100%
Total A B C
Festival
Ticket pricesTransportRefreshmentsEntertainment or festival activitiesFestival brands
Figure 5.1: Relative importance of attributes at each of the three festival scenarios
Figure 5.1 indicates from a global perspective across all three arts festival scenarios
how respondents value the attributes Festival brands (28,7%) and Entertainment or
festival activities (22,8%) as the two most important attributes. These latter two
attributes proof of major importance with festival brands as being the core attribute at
festivals.
Respondents at both Festivals A and B valued the two attributes Festival brands and
Entertainment or festival activities as most important whereas the respondents at
Festival C valued Festival brands (34,3%) as most important. However, it should be
noted that in each of the three arts festival scenarios, the attribute Refreshments was
least important to respondents, and that the attributes Transport and Ticket prices
were also less important.
Figure 5.2 illustrates the attributes' importance per individual respondent i.e. the
number of respondents to whom the attribute was important.

222
Attribute importance per individual
39.3% 33.3% 26.3%
52.6%
26.8% 34.1% 46.5%7.9%
4.8%6.1%
5.9%6.9% 6.3%
9.1%
5.9%
21.5% 21.4% 12.1%27.6%
5.6%
0%10%20%30%40%50%60%70%80%90%
100%
Total A B C
Ticket prices
Transport
Refreshments
Entertainment or festivalactivities
Festival brands
Figure 5.2: Attribute importance per individual respondent across the three festival scenarios
Across the three arts festival scenarios, Festival C had the highest weighted utility
value on brands (52,6%) whereas Festival B had the highest weighted utility value on
entertainment or festival activities (46,5%). The weighted utility values of
refreshments and transport were fairly evenly distributed across the three arts festival
scenarios. The weighted utility value of Festival C’s ticket prices was the highest
(27,6%).
The next section explains how the relative attributes' level of importance was
determined for all three of the arts festival scenarios as well as for each individual
arts festival scenario.
5.3.2 Relative attributes' level of importance for the three arts festival scenarios
The relative attributes' level of importance globally and at each individual arts festival
scenario individually is illustrated in Tables 5.3 to 5.6.

223
The CVA programme creates an index score out of 100 (percentage) to indicate an
attribute's importance, and a weighted raw utility value indicates the average of the
weights.
The importance of the 15 attribute levels is displayed in a 3 by 3 grid (see Appendix
B1 for analyses of these results). It is important to interpret the weighted raw utility
values only within each attribute level, for example the Festival brands with the brand
levels. The results of Tables 5.3 to 5.6 were used to set up the range of the game
theory matrix and to score each arts festival scenario in the outcome of the game.
Table 5.3 depicts the attributes' level of importance globally, across all three festival
scenarios.
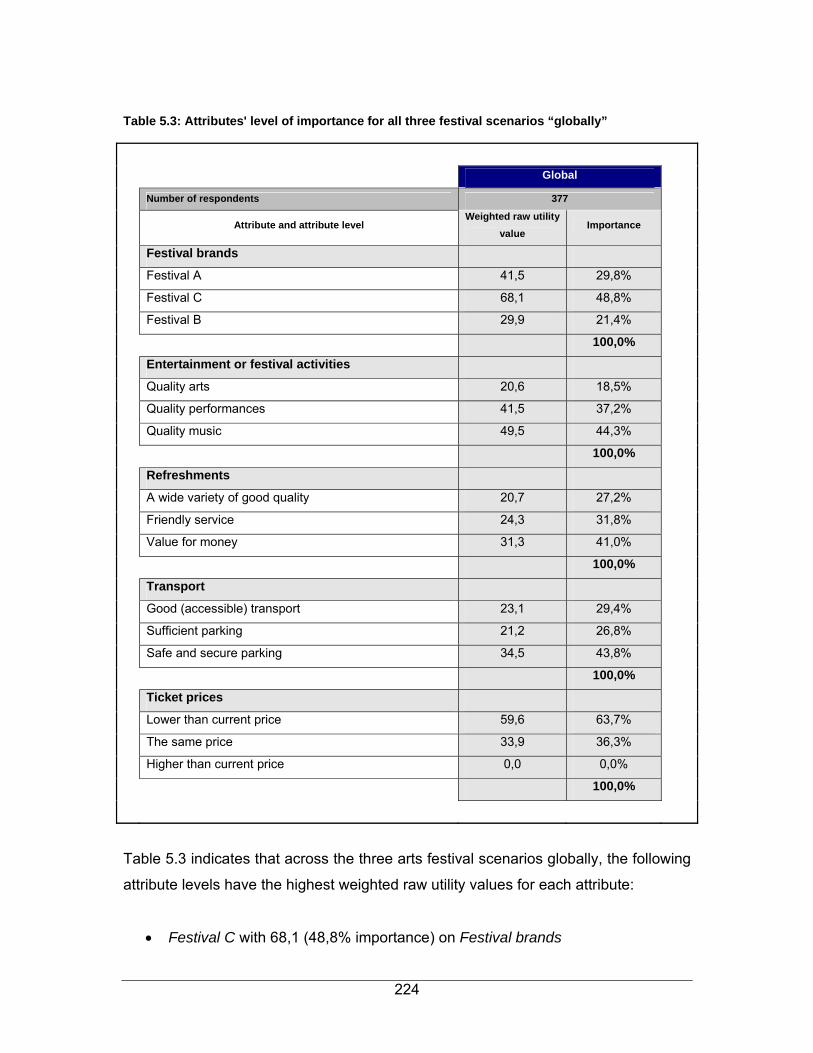
224
Table 5.3: Attributes' level of importance for all three festival scenarios “globally”
Global
Number of respondents 377
Attribute and attribute level
Weighted raw utility value
Importance
Festival brands
Festival A 41,5 29,8%
Festival C 68,1 48,8%
Festival B 29,9 21,4%
100,0%
Entertainment or festival activities
Quality arts 20,6 18,5%
Quality performances 41,5 37,2%
Quality music 49,5 44,3%
100,0%
Refreshments
A wide variety of good quality 20,7 27,2%
Friendly service 24,3 31,8%
Value for money 31,3 41,0%
100,0%
Transport
Good (accessible) transport 23,1 29,4%
Sufficient parking 21,2 26,8%
Safe and secure parking 34,5 43,8%
100,0%
Ticket prices
Lower than current price 59,6 63,7%
The same price 33,9 36,3%
Higher than current price 0,0 0,0%
100,0%
Table 5.3 indicates that across the three arts festival scenarios globally, the following
attribute levels have the highest weighted raw utility values for each attribute:
• Festival C with 68,1 (48,8% importance) on Festival brands

225
• Quality music with 49,5 (44,3% importance) on Entertainment or festival
activities
• Value for money with 31,3 (41 % importance) on Refreshments
• Safe and secure parking with 34,5 (43,8% importance) on Transport
• Lower than current price with 59,6 (63,7 importance) on Ticket price.
These scores are important as they were used as a hard code in the simulation tool
for the measurements shown in Tables 5.11 to 5.13, and to set up the range of the
matrix of the game theory in Table 5.14.
Table 5.4 depicts the attributes' level of importance for Festival A.

226
Table 5.4: Attributes' level of importance for Festival A
Festival A
Number of respondents 126
Attribute and attribute level
Weighted raw utility value
Importance
Festival brands
Festival A 67,9 53,8%
Festival C 45,1 35,8%
Festival B 13,1 10,4%
100,0%
Entertainment or festival activities
Quality arts 23,4 18,8%
Quality performances 42,6 34,2%
Quality music 58,6 47,0%
100,0%
Refreshments
A wide variety of good quality 26,1 36,3%
Friendly service 24,4 33,9%
Value for money 21,5 29,8%
100,0%
Transport
Good (accessible) transport 23,3 30,6%
Sufficient parking 23,7 31,2%
Safe and secure parking 29,0 38,2%
100,0%
Ticket prices
Lower than current price 62,0 61,2%
The same price 39,3 38,8%
Higher than current price 0,0 0,0%
100,0%
Table 5.4 indicates that the respondents at Festival A gave the following attribute
levels as having the highest weighted raw utility values for each attribute:
• Festival A with 67,9 (53,8 importance) on Festival brands
• Quality music with 58,6 (47,0%) on Entertainment or festival activities

227
• A wide variety of good quality with 26,1 (36,3 importance) on Refreshments
• Safe and secure parking with 29 (38.2 importance) on Transport
• Lower than current price with 62 (61,2% importance) on Ticket prices.
The results shown in this table were used to score Festival A in the game theory
shown in Table 5.15.
Table 5.5 depicts the attributes' level of importance for Festival B.

228
Table 5.5: Attributes' level of importance for Festival B
Festival B
Number of respondents 99
Attribute and attribute level Weighted raw utility value Importance
Festival brands
Festival A 20,4 17,6%
Festival C 27,1 23,5%
Festival B 68,1 58,9%
100,0%
Entertainment or festival activities
Quality arts 23,2 16,2%
Quality performances 47,3 33,1%
Quality music 72,7 50,7%
100,0%
Refreshments
A wide variety of good quality 22,4 30,4%
Friendly service 21,0 28,5%
Value for money 30,4 41,1%
100,0%
Transport
Good (accessible) transport 27,5 32,6%
Sufficient parking 21,9 25,9%
Safe and secure parking 35,0 41,5%
100,0%
Ticket prices
Lower than current price 52,8 63,6%
The same price 30,2 36,4%
Higher than current price 0,0 0,0%
100,0%
Table 5.5 indicates that the respondents at Festival B gave the following attribute
levels as having the highest weighted raw utility values for each attribute:
• Festival B with 68,1 (58,95) on Festival brands

229
• Quality music with 72,2 (50,7 % importance) on Entertainment or festival
activities
• Value for money with 30,4 (41,1 % importance) on Refreshments
• Safe and secure parking with 35 (41,5 % importance) on Transport
• Lower than current price with 52,8 (63,6 % importance) on Ticket prices.
The results shown in this table were used to score Festival B in the game theory
shown in Table 5.15.
Table 5.6 depicts the attributes' level of importance for Festival C.
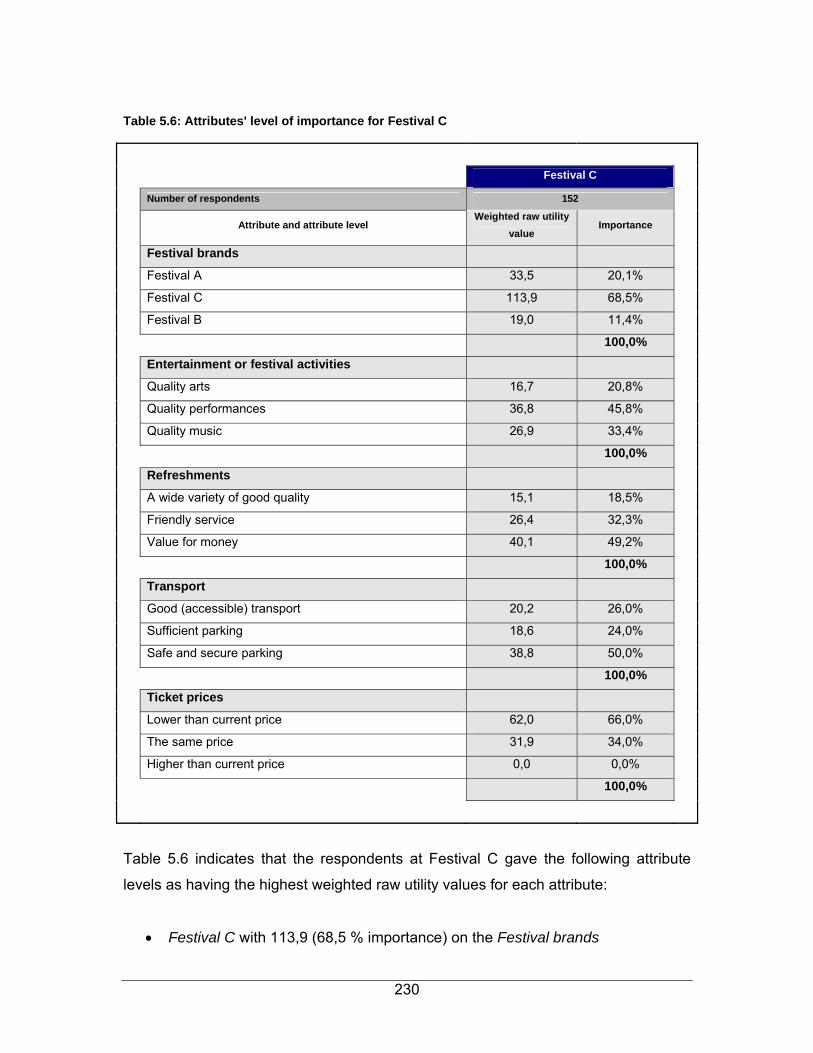
230
Table 5.6: Attributes' level of importance for Festival C
Festival C
Number of respondents 152
Attribute and attribute level
Weighted raw utility value
Importance
Festival brands
Festival A 33,5 20,1%
Festival C 113,9 68,5%
Festival B 19,0 11,4%
100,0%
Entertainment or festival activities
Quality arts 16,7 20,8%
Quality performances 36,8 45,8%
Quality music 26,9 33,4%
100,0%
Refreshments
A wide variety of good quality 15,1 18,5%
Friendly service 26,4 32,3%
Value for money 40,1 49,2%
100,0%
Transport
Good (accessible) transport 20,2 26,0%
Sufficient parking 18,6 24,0%
Safe and secure parking 38,8 50,0%
100,0%
Ticket prices
Lower than current price 62,0 66,0%
The same price 31,9 34,0%
Higher than current price 0,0 0,0%
100,0%
Table 5.6 indicates that the respondents at Festival C gave the following attribute
levels as having the highest weighted raw utility values for each attribute:
• Festival C with 113,9 (68,5 % importance) on the Festival brands

231
• Quality performances with 36,8 (45,8% importance) on Entertainment or
festival activities
• Value for money with 40,1 (49,2 % importance), for Refreshments
• Safe and secure parking with 38,8 (50 % importance) for Transport
• Lower than current price with 62 (66% importance) for Ticket prices.
The results shown in this table were used to score Festival C in the game theory
shown in Table 5.15.
These relative attribute importance and attribute utility values can be used to make
predictions about how respondents would choose among festivals (refer to Section
5.3.5 for the attribute simulation tool and Section 5.4 for the game theory).
In other words, by using conjoint analysis a festival's management can determine the
optimal features or preferences for a festival; moreover conjoint analysis and game
theory will also identify the best advertising message by indicating the most important
features considered in the choice of a specific festival.
In this sense, conjoint analysis contributes directly to the formulation of a value
proposition. The information can be edited with a text editor for further processing by
other analytical software packages, such as the cluster analysis programme of
STATISTICA (CVA, 1996:40). The above CVA results were used for cluster analysis
as explained in the next section, in order to explore the results further.
5.3.3 Cluster analysis for arts festival scenarios
Cluster analysis is a multivariate technique used to identify homogeneous subgroups
of respondents (Cooper & Schindler, 2003:613). Cluster analysis also differs from
discriminant analysis in that the latter begins with a well-defined group composed of
two or more distinct sets of characteristics, and then searches for a set of variables to
separate them (Malhotra, 2004:534). By contrast, cluster analysis begins with an
undifferentiated group of people, events or objects and then attempts to reorganise
them into homogeneous groups or subgroups.

232
A K-means clustering programme was used, with seed points found through a
preliminary hierarchical clustering method (see Section 4.8.1). Results were obtained
for six clusters, and a four-cluster solution was selected, primarily on the basis of
interpretability and balanced cluster sizes as illustrated in Table 5.7. Cluster sizes
ranged between 22 and 61 respondents. Table 5.7 illustrates the cluster centroids
(coded in green) that were computed to aid segment profiling. The highest
percentages are colour-coded (green) to simplify comparisons.
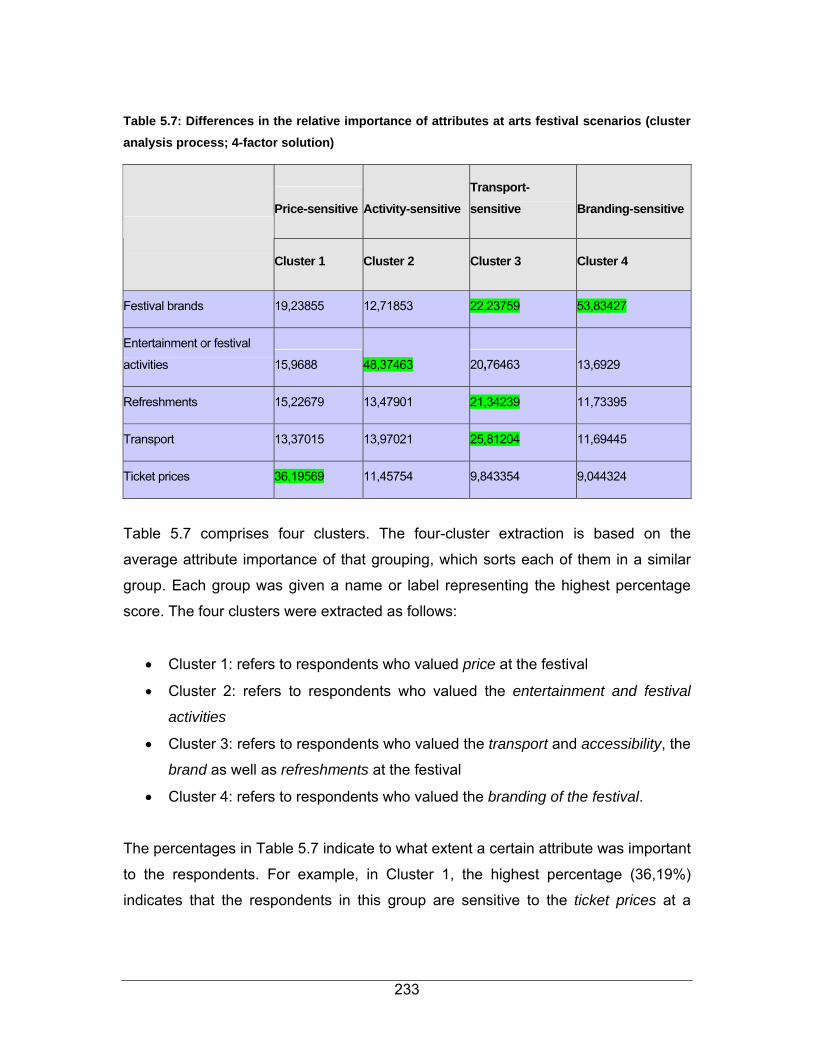
233
Table 5.7: Differences in the relative importance of attributes at arts festival scenarios (cluster analysis process; 4-factor solution)
Price-sensitive Activity-sensitive Transport-sensitive Branding-sensitive
Cluster 1 Cluster 2 Cluster 3 Cluster 4
Festival brands 19,23855 12,71853 22,23759 53,83427
Entertainment or festival
activities 15,9688 48,37463 20,76463 13,6929
Refreshments 15,22679 13,47901 21,34239 11,73395
Transport 13,37015 13,97021 25,81204 11,69445
Ticket prices 36,19569 11,45754 9,843354 9,044324
Table 5.7 comprises four clusters. The four-cluster extraction is based on the
average attribute importance of that grouping, which sorts each of them in a similar
group. Each group was given a name or label representing the highest percentage
score. The four clusters were extracted as follows:
• Cluster 1: refers to respondents who valued price at the festival
• Cluster 2: refers to respondents who valued the entertainment and festival
activities
• Cluster 3: refers to respondents who valued the transport and accessibility, the
brand as well as refreshments at the festival
• Cluster 4: refers to respondents who valued the branding of the festival.
The percentages in Table 5.7 indicate to what extent a certain attribute was important
to the respondents. For example, in Cluster 1, the highest percentage (36,19%)
indicates that the respondents in this group are sensitive to the ticket prices at a
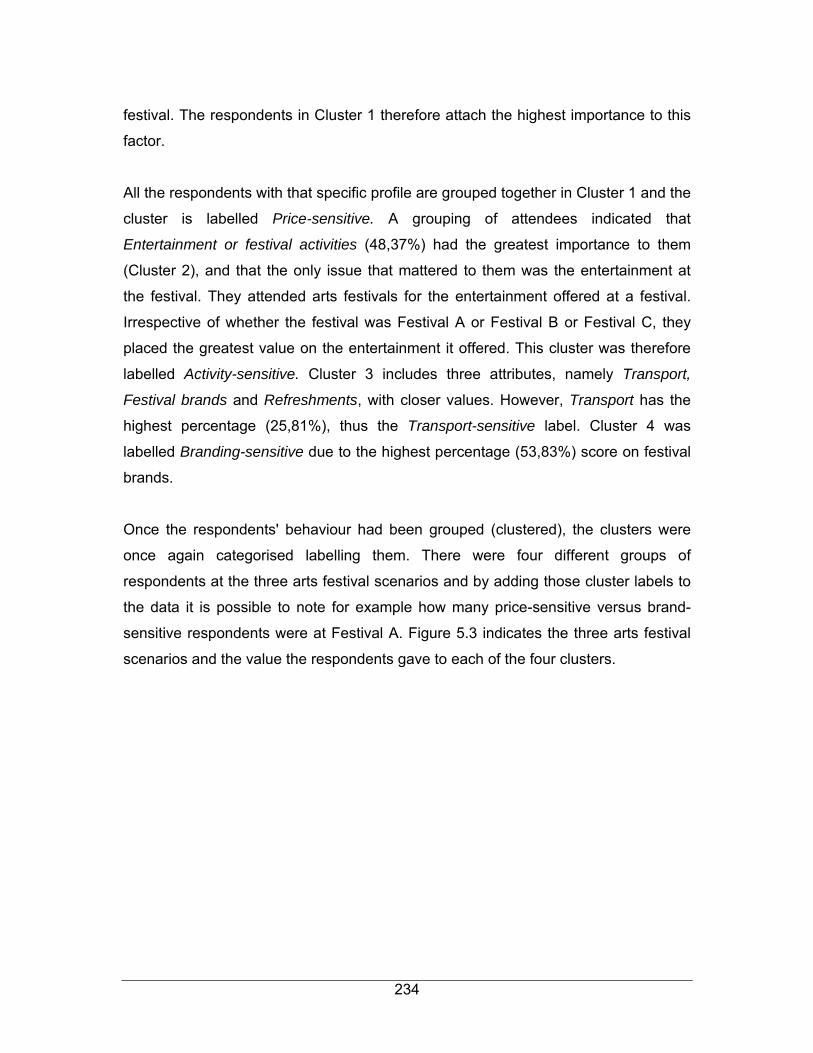
234
festival. The respondents in Cluster 1 therefore attach the highest importance to this
factor.
All the respondents with that specific profile are grouped together in Cluster 1 and the
cluster is labelled Price-sensitive. A grouping of attendees indicated that
Entertainment or festival activities (48,37%) had the greatest importance to them
(Cluster 2), and that the only issue that mattered to them was the entertainment at
the festival. They attended arts festivals for the entertainment offered at a festival.
Irrespective of whether the festival was Festival A or Festival B or Festival C, they
placed the greatest value on the entertainment it offered. This cluster was therefore
labelled Activity-sensitive. Cluster 3 includes three attributes, namely Transport,
Festival brands and Refreshments, with closer values. However, Transport has the
highest percentage (25,81%), thus the Transport-sensitive label. Cluster 4 was
labelled Branding-sensitive due to the highest percentage (53,83%) score on festival
brands.
Once the respondents' behaviour had been grouped (clustered), the clusters were
once again categorised labelling them. There were four different groups of
respondents at the three arts festival scenarios and by adding those cluster labels to
the data it is possible to note for example how many price-sensitive versus brand-
sensitive respondents were at Festival A. Figure 5.3 indicates the three arts festival
scenarios and the value the respondents gave to each of the four clusters.
235
Cluster analysis
29.4% 22.2% 22.2%40.1%
20.2% 27.0% 33.3%5.9%
21.0% 19.8%22.2%
21.1%
29.4% 31.0%22.2%
32.9%
0%
10%20%
30%40%
50%
60%70%
80%90%
100%
Total A B C
Arts festival
Price-sensitiveTransport-sensitiveActivity-sensitiveBrand-sensitive
Figure 5.3: The three arts festival scenarios and the four clusters
Figure 5.3 illustrates from a global perspective that the two clusters Brand- (29,4%)
and Price-sensitive (29,4%) are the most important. The cluster Price-sensitive (31%)
is most important to respondents at Festival A; those at Festival B value the cluster
Activity-sensitive (33,3%) as most important and those at Festival C value the cluster
Brand-sensitive as most important (40,1%).
Following that, the cluster analysis results were used in the correspondence analysis,
as discussed in the next section (refer to the correlation matrix in Appendix B1 for
significance statistical results [P-value is < 0,05]).
5.3.4 Correspondence analysis of arts festival scenarios
The correspondence analysis of this study was performed with the software package
STATISTICA. This statistical technique indicates variables, which correlate with one
another, thus providing a method for differentiating between respondents.

236
Inertia indicates how well the model fits – i.e. the closer the total percentage to 100%,
the better the fit (see Chapter 4, Section 4.8.2 on correspondence analysis).
5.3.4.1 Analysis of correspondence between arts festival scenarios and attribute importance
Figure 5.4 indicates the relative attribute importance per individual respondent across
the three arts festival scenarios in South Africa. The three arts festival scenarios
(Festival A, Festival B, Festival C) are mapped and their correspondence with the five
attributes is indicated. The inertia of 2,4% versus 97,6% is considered when reading
the map. The higher the inertia, the better the fit is. In other words, Dimension 1
(horizontal axis) explains most of the inertia (97,64% of the total solution) and is
used. On the vertical level, Dimension 2 explains a mere 2,4%; therefore the best
interpretative value will be gained from the horizontal level.
Figure 5.4 depicts the correspondence between the arts festival scenarios and
attribute importance – inertia of 97,6%.
Figure 5.4: Correspondence between arts festival scenarios and attribute importance – inertia of 97,6%

237
(a) Festival A The attributes Ticket prices and Entertainment or festival activities place Festival A in
the top quadrant of Figure 5.4. Festival A lies about mid-way in the area of
Entertainment/festival activities and Ticket prices. The attribute Ticket prices is of
approximately equal importance to Festival A and Festival C. The respondents at
Festival A and Festival B gave a higher value to the attribute Entertainment or festival
activities than the respondents at Festival C.
(b) Festival B
Festival B lies between entertainment/festival activities, transport and refreshments in
Figure 5.4. The attribute Ticket prices is less important to the respondents at this
festival. The respondents at Festival A and Festival B gave a higher value to the
attribute Entertainment or festival activities than the respondents at Festival C. The
attributes Refreshments and Transport were more important to respondents at
Festival B than for respondents interviewed at the other two festival scenarios.
(c) Festival C
The attribute Festival brands places Festival C in the bottom right quadrant of Figure
5.4, giving Festival C the top score of all the festival brands as the respondents at
Festival C gave this attribute the highest rating. Festival C appears to form a dividing
line, separating Festival B in the lower half from Festival A in the upper half. The
attribute Ticket prices is of relatively equal importance to Festival C and Festival A.
Figure 5.4 indicates that Festival A seems to be in a completely different league
compared to the other festivals. The assumption can be made that Festival A and
Festival B are furthest apart in their positioning. It is highly unlikely that Festival A’s
respondents would go to Festival B, and vice versa, but Festival B’s respondents
might attend Festival C, or Festival C’s respondents might attend Festival B.
238
The respondents stated that they preferred to attend Festival B as a result of the
attributes Refreshments, Transport and to a lesser degree because of the attribute
Entertainment, whereas they attended Festival A for the attribute Ticket prices as
these cost less, were within their financial means and were value for money, as well
as for the attribute Entertainment /festival activities. The respondents stated that they
attended Festival C for the attributes Festival brands and Ticket prices, but valued
these to a lesser degree than the attribute Ticket prices.
The correspondence is shown only on the horizontal level and the conspicuous
attributes are as follows: for Festival B the foremost attribute is Transport followed by
Refreshments. The attributes Transport and Refreshments came second for Festival
C and last for Festival A. The attribute Festival brands is foremost for Festival C, and
Festival B is slightly better positioned than Festival A for this attribute. The
assumption can be made that Festival A should take steps to improve its branding,
perhaps by striving for a more exclusive festival.
Festival B has apparently established a strong typical English arts festival brand and
Festival C a strong Afrikaans brand, whereas Festival A is somewhere in between
and its brand is not as well-established as the brands of the other two festivals.
Although the attribute Entertainment/Festival activities is on the other side of the
horizontal line, it is closer to Festival C and halfway between Festival A and Festival
B. The respondents at Festival C indicated that they most appreciated the attribute
Festival activities, but this attribute was split or divided between Festival A and
Festival B. The attribute Ticket prices was foremost at Festival A and has the highest
association with this festival.
In a vertical direction (2,35%), the attribute Festival brands is foremost for Festival C,
in second place for Festival A and last for Festival B. However, as the vertical
direction provides only the remaining 2,35% of the solution, not much more
interpretation can be gained from this axis.

239
5.3.4.2 Correspondence between age group and attributes
Figure 5.5 below shows the difference between the respondents' three respective
age groups (between 18 and 30, between 31 and 45, and older than 45) and the five
festival attributes. The horizontal axis in Figure 5.5 explains most of the inertia
(80,8%). The vertical axis also appears to explain a significant percentage of the
inertia (19,1%). Therefore both the horizontal and vertical distances between
attributes and age group should be considered when interpreting the correspondence
between attributes and age groups.
Figure 5.5 illustrates the correspondence between age and festival attributes – inertia
of 80,7%.
Figure 5.5: Correspondence between age and festival attributes – inertia of 80,7%
The respondents in the younger age group (between 18 to 30 years) rated the
attribute Ticket prices as most important to them. The respondents in the middle-age
group (between 31 to 45 years) stated that the entertainment and activities at the
festival were to them the most important aspect of the festival of greater importance.
240
The attribute Transport appeared to be a greater problem and of higher importance
for the higher age group (older than 45 years) than for the other groups, because this
attribute appears highest in Figure 5.5. The attribute Refreshments is shown on the
far right of Figure 5.5, far from all the age groups, and was therefore not an issue of
importance to the respondents in any of the three age groups.
As far as dimension 1 is concerned, the attribute Festival brands lies close to the
centroid 0,0 and therefore contributes little to the chi-square. The attribute Ticket
prices on the left of the horizontal line and the attribute Refreshments on the right
contributes most to the chi-square. As regards the age group of the respondents,
dimension one is mainly defined by the “between 18 and 30” age group on the left
and “older than 45” on the right. It appears to indicate that the respondents in the
“between 18 and 30” age group were mainly concerned about ticket prices whereas
those in the “older than 45” age group were mainly concerned about refreshments.
Dimension 2 is defined by Transport at the top and Entertainment or festival activities
at the bottom, as well as the age group “older than 45” at the top and “between 30
and 45” at the bottom. This may indicate that the older group of respondents is more
concerned about transport issues whereas the middle age group (between 30 and
45) is more concerned with entertainment or festival activities.
5.3.4.3 Correspondence between arts festivals and home language
Figure 5.6 indicates the difference between the three arts festival scenarios and the
home language of the respondents interviewed at the respective festivals. The three
arts festival scenarios are mapped and associated with the home language
(Afrikaans, English and other languages). The higher the inertia the better the fit;
therefore the inertia of 99,8% is used. The inertia’s dimension 1 on the horizontal
level is 99,77% of the total solution, but only 2,0% on the vertical level. Consequently
most of the interpretative value will be gained from the horizontal level.

241
Figure 5.6 illustrates the correspondence between the arts festival scenario and
home language – inertia of 99,8%.
Figure 5.6: Correspondence between arts festival scenario and home language – inertia of 99,8%
Figure 5.6 indicates that the respondents at Festival A and Festival C gave similarly
high values to Afrikaans as home language, but those at Festival B differ
significantly. English as home language seemed to be the single most important
home language for respondents at Festival B. The other language groups are
distributed equally as far from the main languages of English and Afrikaans,
indicating the relatively less importance of these languages at each of the three
festivals.
As Festival B has strong ties with the 1820 British Settlers, it is not surprising that
English is of such importance to the respondents of the region. By contrast,
Potchefstroom (Festival A) and Oudtshoorn (Festival C) both have strong ties with

242
the Afrikaans language, as Potchefstroom was the first town of the South African
Republic and Oudtshoorn the hometown of the famous Afrikaans poet C.J.
Langenhoven. Figure 5.6 indicates that Language is a homogenous attribute at each
of the three arts festival scenarios.
Positioning concerns the association with the arts festival in respondents' minds. In
Figure 5.6, Language is 99,8% on the horizontal line, thereby casting the three arts
festival scenarios and home languages in three different directions. Afrikaans is on
the left-hand side of the horizontal line and English on the right-hand side of the line,
whereas other languages are in the top right-hand quadrant. The Afrikaans language
figures closest to Festival A and Festival C, and English is closest to Festival B.
5.3.4.4 Correspondence between arts festival scenarios and clusters
Figure 5.7 is similar to Figure 5.5, with the only difference between them the manner
in which the clustering has been done. Figure 5.7 indicates the difference between
the three festivals and the four clusters – inertia of 96,12%.
Figure 5.7: Correspondence between arts festival scenarios and clusters – inertia of 96,12%
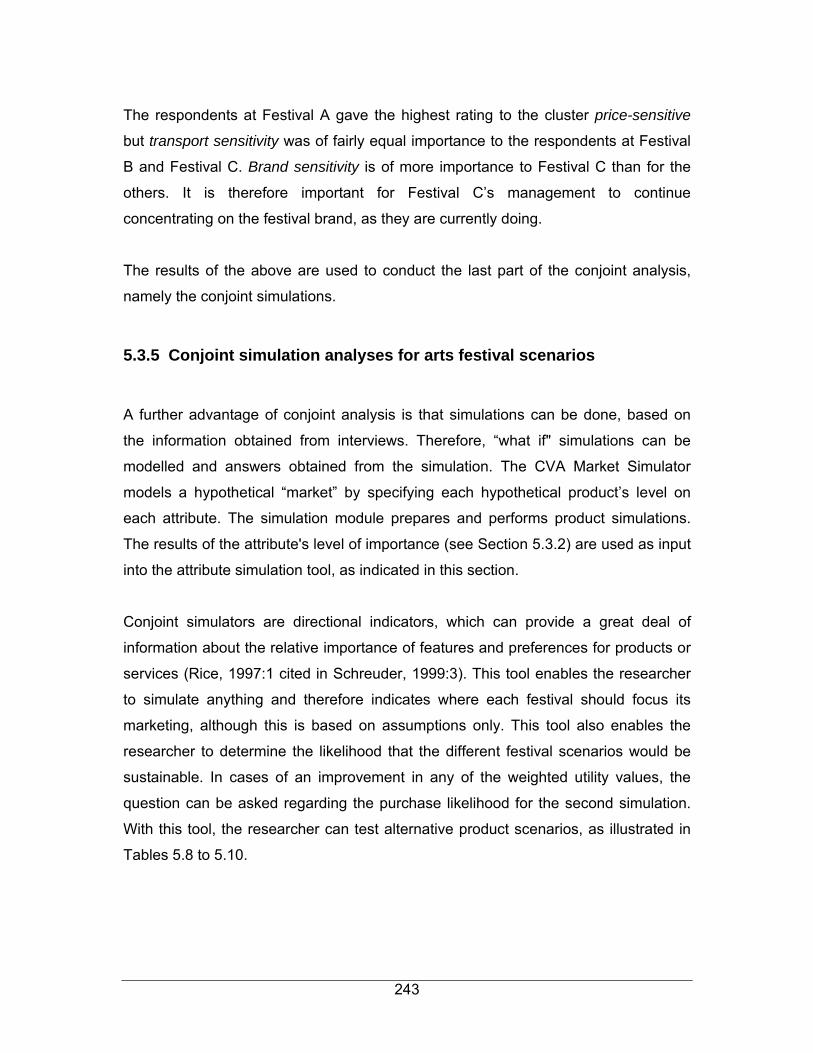
243
The respondents at Festival A gave the highest rating to the cluster price-sensitive
but transport sensitivity was of fairly equal importance to the respondents at Festival
B and Festival C. Brand sensitivity is of more importance to Festival C than for the
others. It is therefore important for Festival C’s management to continue
concentrating on the festival brand, as they are currently doing.
The results of the above are used to conduct the last part of the conjoint analysis,
namely the conjoint simulations.
5.3.5 Conjoint simulation analyses for arts festival scenarios
A further advantage of conjoint analysis is that simulations can be done, based on
the information obtained from interviews. Therefore, “what if" simulations can be
modelled and answers obtained from the simulation. The CVA Market Simulator
models a hypothetical “market” by specifying each hypothetical product’s level on
each attribute. The simulation module prepares and performs product simulations.
The results of the attribute's level of importance (see Section 5.3.2) are used as input
into the attribute simulation tool, as indicated in this section.
Conjoint simulators are directional indicators, which can provide a great deal of
information about the relative importance of features and preferences for products or
services (Rice, 1997:1 cited in Schreuder, 1999:3). This tool enables the researcher
to simulate anything and therefore indicates where each festival should focus its
marketing, although this is based on assumptions only. This tool also enables the
researcher to determine the likelihood that the different festival scenarios would be
sustainable. In cases of an improvement in any of the weighted utility values, the
question can be asked regarding the purchase likelihood for the second simulation.
With this tool, the researcher can test alternative product scenarios, as illustrated in
Tables 5.8 to 5.10.
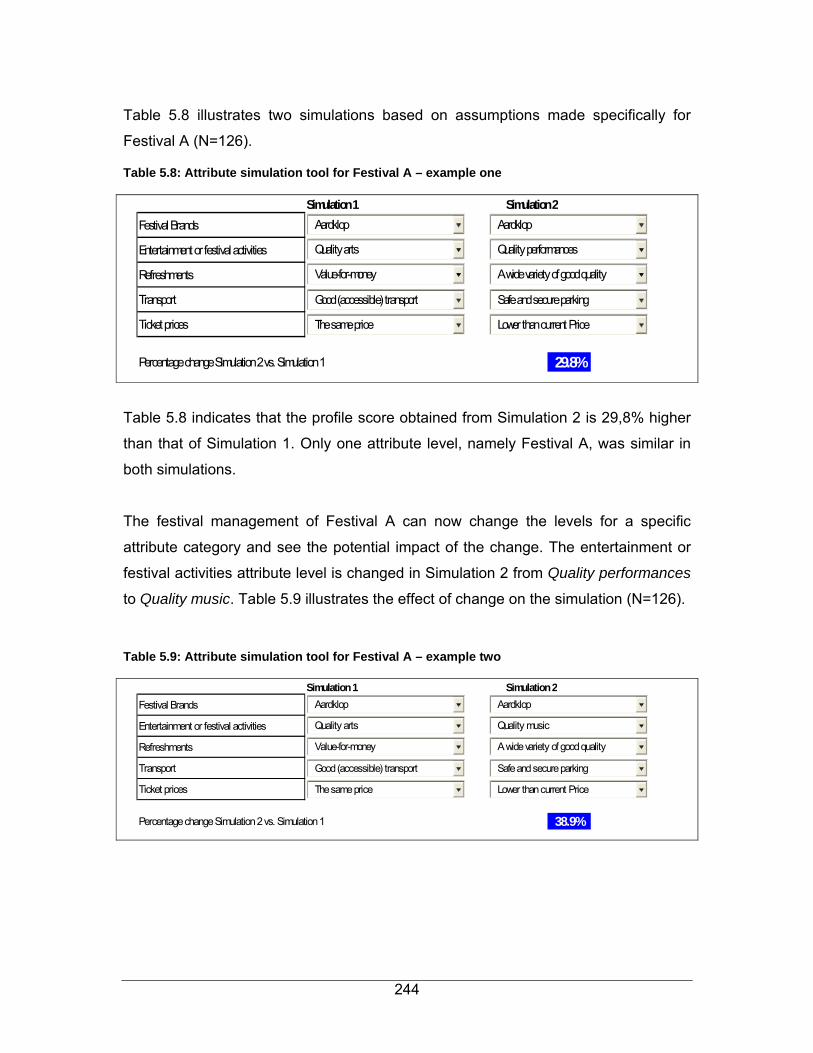
244
Table 5.8 illustrates two simulations based on assumptions made specifically for
Festival A (N=126).
Table 5.8: Attribute simulation tool for Festival A – example one
Simulation 1 Simulation 2Festival Brands Aardklop 67.88 Aardklop 67.88
Entertainment or festival activities Quality arts 23.37 Quality perf 42.55
Refreshments Value-for-money 21.48 A wide vari 26.14
Transport Good (accessible 23.28 Safe and se 29.00
Ticket prices The same price 39.33 Lower than 61.96175.34 227.53
Percentage change Simulation 2 vs. Simulation 1 29.8%
Aardklop
Quality arts
Value-for-money
Good (accessible) transport
The same price
Aardklop
Quality performances
A wide variety of good quality
Safe and secure parking
Lower than current Price
Table 5.8 indicates that the profile score obtained from Simulation 2 is 29,8% higher
than that of Simulation 1. Only one attribute level, namely Festival A, was similar in
both simulations.
The festival management of Festival A can now change the levels for a specific
attribute category and see the potential impact of the change. The entertainment or
festival activities attribute level is changed in Simulation 2 from Quality performances
to Quality music. Table 5.9 illustrates the effect of change on the simulation (N=126).
Table 5.9: Attribute simulation tool for Festival A – example two
Simulation 1 Simulation 2Festival Brands Aardklop 67.88 Aardklop 67.88
Entertainment or festival activities Quality arts 23.37 Quality mus 58.64
Refreshments Value-for-money 21.48 A wide vari 26.14
Transport Good (accessible 23.28 Safe and se 29.00
Ticket prices The same price 39.33 Lower than 61.96175.34 243.62
Percentage change Simulation 2 vs. Simulation 1 38.9%
Aardklop
Quality arts
Value-for-money
Good (accessible) transport
The same price
Aardklop
Quality music
A wide variety of good quality
Safe and secure parking
Lower than current Price
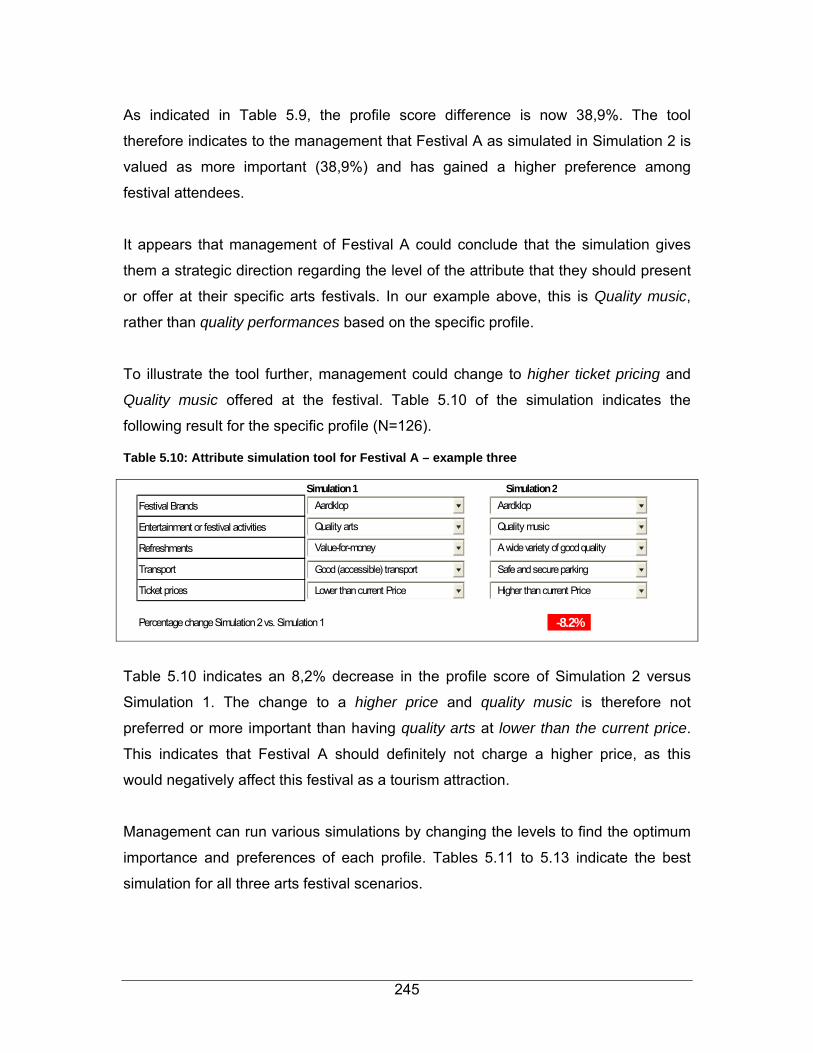
245
As indicated in Table 5.9, the profile score difference is now 38,9%. The tool
therefore indicates to the management that Festival A as simulated in Simulation 2 is
valued as more important (38,9%) and has gained a higher preference among
festival attendees.
It appears that management of Festival A could conclude that the simulation gives
them a strategic direction regarding the level of the attribute that they should present
or offer at their specific arts festivals. In our example above, this is Quality music,
rather than quality performances based on the specific profile.
To illustrate the tool further, management could change to higher ticket pricing and
Quality music offered at the festival. Table 5.10 of the simulation indicates the
following result for the specific profile (N=126).
Table 5.10: Attribute simulation tool for Festival A – example three
Simulation 1 Simulation 2Festival Brands Aardklop 67.88 Aardklop 67.88
Entertainment or festival activities Quality arts 23.37 Quality mus 58.64
Refreshments Value-for-money 21.48 A wide vari 26.14
Transport Good (accessible 23.28 Safe and se 29.00
Ticket prices Lower than curre 61.96 Higher than 0.00197.97 181.66
Percentage change Simulation 2 vs. Simulation 1 -8.2%
Aardklop
Quality arts
Value-for-money
Good (accessible) transport
Lower than current Price
Aardklop
Quality music
A wide variety of good quality
Safe and secure parking
Higher than current Price
Table 5.10 indicates an 8,2% decrease in the profile score of Simulation 2 versus
Simulation 1. The change to a higher price and quality music is therefore not
preferred or more important than having quality arts at lower than the current price.
This indicates that Festival A should definitely not charge a higher price, as this
would negatively affect this festival as a tourism attraction.
Management can run various simulations by changing the levels to find the optimum
importance and preferences of each profile. Tables 5.11 to 5.13 indicate the best
simulation for all three arts festival scenarios.
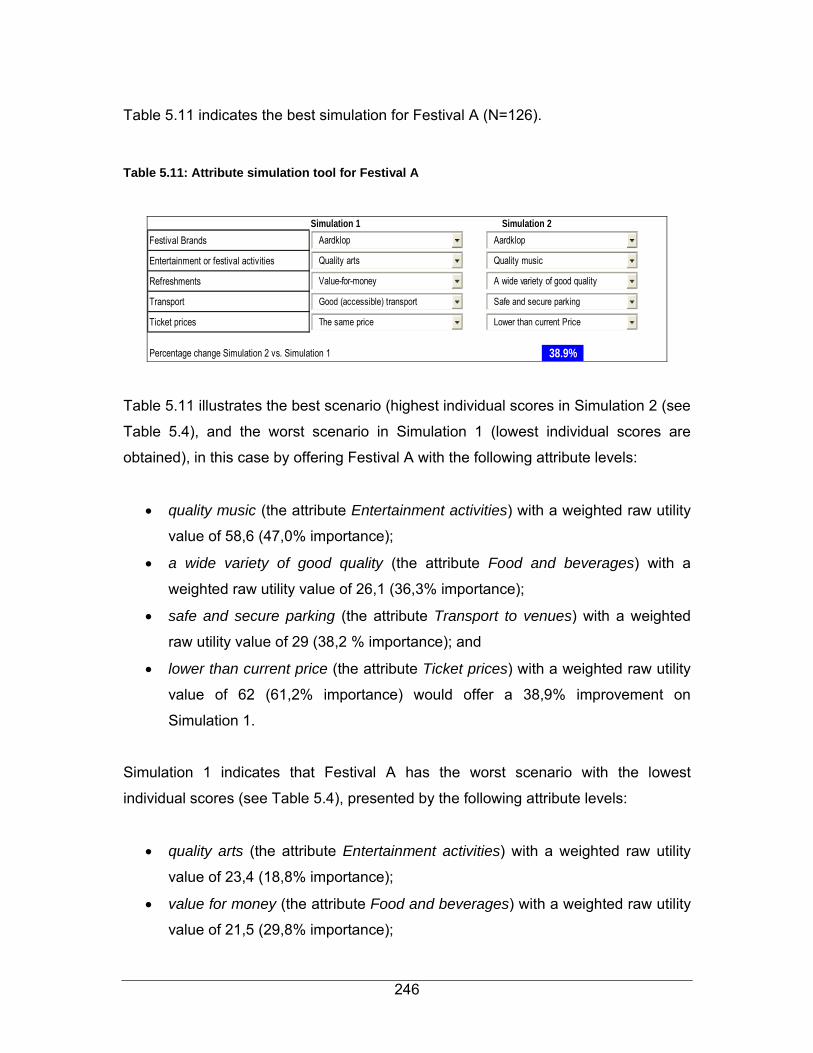
246
Table 5.11 indicates the best simulation for Festival A (N=126).
Table 5.11: Attribute simulation tool for Festival A
Simulation 1 Simulation 2Festival Brands Aardklop 67.88 Aardklop 67.88
Entertainment or festival activities Quality arts 23.37 Quality mu 58.64
Refreshments Value-for-money 21.48 A wide vari 26.14
Transport Good (accessibl 23.28 Safe and s 29.00
Ticket prices The same price 39.33 Lower than 61.96175.34 243.62
Percentage change Simulation 2 vs. Simulation 1 38.9%
Aardklop
Quality arts
Value-for-money
Good (accessible) transport
The same price
Aardklop
Quality music
A wide variety of good quality
Safe and secure parking
Lower than current Price
Table 5.11 illustrates the best scenario (highest individual scores in Simulation 2 (see
Table 5.4), and the worst scenario in Simulation 1 (lowest individual scores are
obtained), in this case by offering Festival A with the following attribute levels:
• quality music (the attribute Entertainment activities) with a weighted raw utility
value of 58,6 (47,0% importance);
• a wide variety of good quality (the attribute Food and beverages) with a
weighted raw utility value of 26,1 (36,3% importance);
• safe and secure parking (the attribute Transport to venues) with a weighted
raw utility value of 29 (38,2 % importance); and
• lower than current price (the attribute Ticket prices) with a weighted raw utility
value of 62 (61,2% importance) would offer a 38,9% improvement on
Simulation 1.
Simulation 1 indicates that Festival A has the worst scenario with the lowest
individual scores (see Table 5.4), presented by the following attribute levels:
• quality arts (the attribute Entertainment activities) with a weighted raw utility
value of 23,4 (18,8% importance);
• value for money (the attribute Food and beverages) with a weighted raw utility
value of 21,5 (29,8% importance);
247
• good (accessible) transport (the attribute Transport to venues) with a weighted
raw utility value of 23,3 (30,6% importance); and
• the same price (the attribute Ticket prices) with a weighted raw utility value of
39,3 (38,8% importance) would offer a worst-case scenario for Festival A.
These results illustrate what the management of Festival A could do to improve the
festival's positioning and also what they should not do to avoid harming its
positioning. Festival A should keep offering these attribute levels as they are, or they
should work on improving the other attribute levels:
• quality music (of the attribute Entertainment activities) should be offered at
Festival A, but on the long term Festival A could improve the quality of the
performances and arts offered at the festival. The festival management should
get better performances and better artists to perform at the festival;
• a wide variety of good quality (of the attribute Food and beverages) should
remain on offer, though the management could work on improving friendly
service as this attribute level was regarded as of secondary importance;
• safe and secure parking (of the attribute Transport to venues) has the highest
importance, thus is essential for optimal positioning; and
• lower than current price (of the attribute Ticket prices) should be considered,
as the respondents felt that the price might be too high. The festival
management should definitely not increase the ticket price, but should strive to
keep the prices low.
The simulations were also done for Festival B and Festival C and the optimum
importance and preferences of the profiles are listed in Tables 5.12 and Table 5.13.
Table 5.12 indicates the best simulation for Festival B (N=99).

248
Table 5.12: Attribute simulation tool for Festival B
Simulation 1 Simulation 2Festival Brands Grahamstown 68.06 Grahamsto 68.06
Entertainment or festival activities Quality arts 23.19 Quality mus 72.66
Refreshments Friendly service 21.01 Value-for-m 30.37
Transport Sufficient parking 21.86 Safe and se 35.03
Ticket prices The same price 30.24 Lower than 52.83164.35 258.94
Percentage change Simulation 2 vs. Simulation 1 57.6%
Grahamstown
Quality arts
Friendly service
Sufficient parking
The same price
Grahamstown
Quality music
Value-for-money
Safe and secure parking
Lower than current Price
Table 5.12 illustrates the best scenario in Simulation 2 (highest individual scores –
see Table 5.5), but the worst-case scenario is presented in Simulation 1, by offering
Festival B with the following attribute levels:
• quality music (Entertainment activities) with a weighted raw utility value of 72,7
(50,7% importance);
• value for money (Food and beverages) with a weighted raw utility value of
30,4 (41,1% importance);
• safe and secure parking (Transport to venues) with a weighted raw utility value
of 35 (41,5% importance); and
• lower than current price (Ticket prices) with a weighted raw utility value of 52,8
(63,3% importance) would offer a 57,6% improvement on Simulation 1.
Simulation 1 presents the worst-case scenario with the lowest individual scores (see
Table 5.5) for the following attribute levels:
• quality arts (Entertainment activities) with a weighted raw utility value of 23,2
(16,2% importance),
• friendly service (Food and beverages) with a weighted raw utility value of 21
(28,5% importance),
• sufficient parking (Transport to venues) with a weighted raw utility value of
21,9 (25,9 % importance),
• the same price (Ticket prices) with a weighted raw utility value of 30,2 (36,4%
importance) would be the worst-case scenario.

249
These results illustrate what the management of Festival B could do to improve the
festival's positioning and also what they should not do to avoid harming its
positioning. Festival B should focus on the attribute levels regarded as important:
• quality music (of the attribute Entertainment activities) is very important and
should be one of the unique selling propositions (USP) for this festival. It is
clear that the other 2 attribute levels (quality arts and quality performance) are
much lower. The festival management could investigate what aspects will
have a positive impact on the quality of music offered at the festival;
• value for money (of the attribute Food and beverages) is regarded as the most
important attribute level. As this concept is rather complex, management
should ascertain what elements will most likely influence this in a positive
manner for sustained growth;
• safe and secure parking (of the attribute Transport to venues) is important and
should always be offered. Good (accessible) transport might be considered in
future for added value to this festival; and
• lower than current price (of the attribute Ticket prices) is once again an
important attribute, indicating that respondents felt the prices might be too high
and these should therefore definitely not be increased too much.
Table 5.13 indicates the best simulation for Festival C (N=152).
Table 5.13: Attribute simulation tool for Festival C
Simulation 1 Simulation 2Festival Brands KKNK 113.93 KKNK 113.93
Entertainment or festival activities Quality arts 16.70 Quality perf 36.84
Refreshments A wide variety 15.14 Value-for-m 40.13
Transport Sufficient park 18.60 Safe and se 38.80
Ticket prices The same pric 31.89 Lower than 62.01196.26 291.72
Percentage change Simulation 2 vs. Simulation 1 48.6%
KKNK
Quality arts
A wide variety of good quality
Sufficient parking
The same price
KKNK
Quality performances
Value-for-money
Safe and secure parking
Lower than current Price
250
Table 5.13 illustrates that Simulation 2 offers the best scenario (highest individual
scores) (see Table 5.6), whereas Simulation 1 presents the worst scenario, in this
case by offering Festival C with the following attribute levels:
• quality performances (Entertainment activities) with a weighted raw utility
value of 36,8 (45,8% importance);
• value for money (Food and beverages) with a weighted raw utility value of
40,1 (49,2% importance);
• safe and secure parking (Transport to venues) with a weighted raw utility value
of 38,8 (50% importance); and
• lower than current price (Ticket prices) with a weighted raw utility value of 62
(66% importance) offering a 48,6% improvement on Simulation 1.
Simulation 1 presents the worst scenario with the lowest individual scores (see Table
5.6), in this case by offering a Festival B scenario with the following attribute levels:
• quality arts (Entertainment activities) with a weighted raw utility value of 16,7
(20,8% importance);
• a wide variety of good quality (Food and beverages) with a weighted raw utility
value of 15,1 (18,5% importance);
• sufficient parking (Transport to venues) with a weighted raw utility value of
18,6 (24% importance);
• the same price (Ticket prices) with a weighted raw utility value of 31,9 (34%
importance) will demonstrate a worst-case scenario.
These results illustrate what the management of Festival C could do to improve the
festival's positioning as well as what they should not do to avoid harming its
positioning. The management of Festival C should work on the following attribute
levels and/or they should continue providing them as they currently do:
• quality performances (of the attribute Entertainment activities) should remain
on offer as is currently the case and they should be kept the same.

251
Management might even consider investigating this offer in more detail as it
will most likely have a positive influence on the overall positioning of the
festival;
• value for money (of the attribute Food and beverages) is important for the
festival and should remain on offer. As mentioned before, this term is complex
and should not be interpreted lightly or in terms of the perception held by
management, but rather focuss on the question: “What’s in it for me?”;
• safe and secure parking (of the attribute Transport to venues) is important and
should not be underestimated at this festival. The other two attribute levels;
good (accessible) transport and sufficient parking was of similar importance
and should not be ignored in future; and
• lower than current price (of the attribute Ticket prices) is most important for
Festival C, as the respondents interviewed felt the prices might be too high
and should definitely not be increased too much.
Although conjoint analysis is a simulation technique, it is not the only technique that
can be used to optimise the data. Another technique “to take it to the next level”,
which can also be used to optimise the data, is that of “game theory“. This technique
takes the semi-competitive nature of arts festival scenarios into account as well as
the non-representativeness of the sample. The results obtained from the conjoint
analysis were used in the game theory technique. The comparison of the three arts
festival scenarios was used to take the interpretation of the data one step further and
to add value to the market-positioning model.
5.4 GAME THEORY
The secondary objective is to compare the three different arts festival scenarios and
their attributes with one another. This enables the researcher to determine the most
successful arts festival presentation as a tourism attraction. The game theory
technique is an optimisation tool to determine the optimal arts festival package.
252
The results obtained from the game theory are then used to develop a market-
positioning model, described in Chapter 6.
These arts festival scenarios are semi-competitive. Game theory recognises this
semi-competitiveness or in same cases non-competitiveness of these arts festivals.
The non-competitive games used to this end are based on the founding theory of
Bayes’s formula (Mizrahi & Sullivan, 1993:343).
Only the endogenous variables (Brand, Entertainment, Refreshments, Transport,
Price) are considered in setting up the game, as these variables can be manipulated.
The weighted raw utility values were calculated for each of these endogenous
variables. The results from the conjoint analysis shown in Table 5.3 (i.e. the attribute
level importance – weighted raw utility value – for all three festival scenarios globally)
were used to design the matrix or scale for the game theory.
A range was designed for each attribute level and calculated by using the highest
weighted raw utility value, rounded off, as the top end of the scale. This value was
then divided by three to obtain the other values on the scale. As mentioned in
Chapter 4, Section 4.9, a point of -1, 0, or 1 is awarded according to the weighted
raw utility value scale set up for each attribute level. A value of 1 is awarded to the
highest-ranked bundle in the matrix or map, and 0 to the second-highest ranked
bundle, whereas -1 is awarded to the next-largest number in the list. Table 5.14
illustrates the design matrix used for scoring the individual attribute levels.
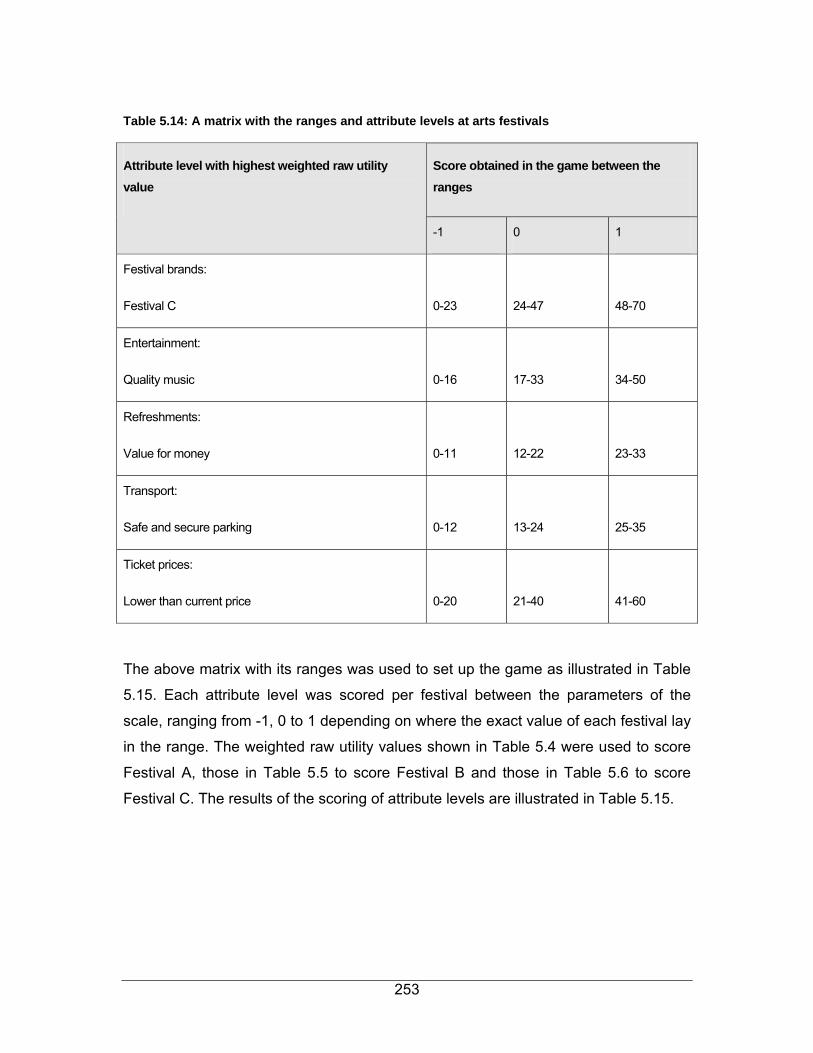
253
Table 5.14: A matrix with the ranges and attribute levels at arts festivals
Score obtained in the game between the ranges
Attribute level with highest weighted raw utility value
-1 0 1
Festival brands:
Festival C
0-23
24-47
48-70
Entertainment:
Quality music
0-16
17-33
34-50
Refreshments:
Value for money
0-11
12-22
23-33
Transport:
Safe and secure parking
0-12
13-24
25-35
Ticket prices:
Lower than current price
0-20
21-40
41-60
The above matrix with its ranges was used to set up the game as illustrated in Table
5.15. Each attribute level was scored per festival between the parameters of the
scale, ranging from -1, 0 to 1 depending on where the exact value of each festival lay
in the range. The weighted raw utility values shown in Table 5.4 were used to score
Festival A, those in Table 5.5 to score Festival B and those in Table 5.6 to score
Festival C. The results of the scoring of attribute levels are illustrated in Table 5.15.

254
Table 5.15: The game theory as set up for Festivals A, B and C
Attributes and levels Festival A Festival B Festival C
Festival brand
Festival A A1 1 -1 0
Festival B A2 -1 1 -1
Festival C A3 0 0 1
Entertainment or festival activities
Quality arts A4 0 0 0
Quality performances A5 1 1 1
Quality music A6 1 1 0
Refreshments
A wide variety of good quality A7 1 1 0
Friendly service A8 1 0 1
Value for money A9 1 1 1
Transport
Good transport A10 0 1 0
Sufficient parking A11 0 0 0
Safe and secure parking A12 1 1 1
Ticket prices
Lower than current price A13 1 1 1
The same price A14 0 0 0
Higher than current price A15 -1 -1 -1
Total 6 6 4
Table 5.15 indicates the game set up for Festivals A, B and C. If any of the cells (A1
to A15) changes, it will affect the outcome of the game. This game illustrates the
result for each festival's game, based on the scores given.
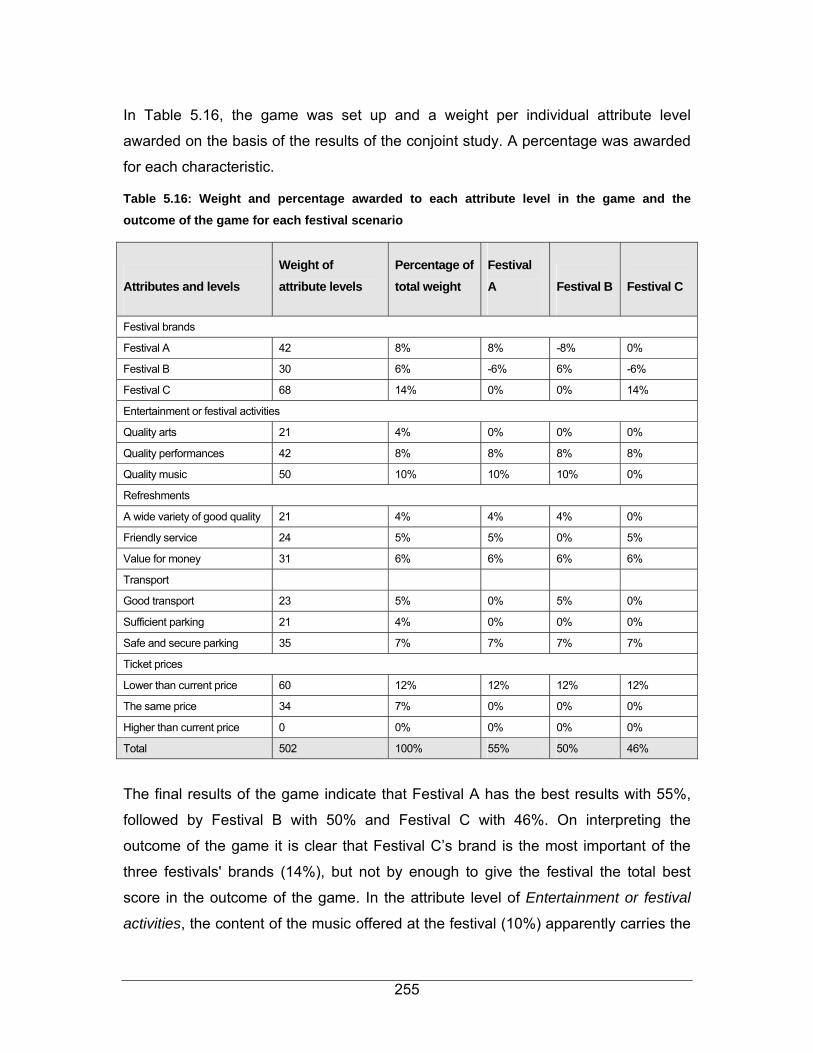
255
In Table 5.16, the game was set up and a weight per individual attribute level
awarded on the basis of the results of the conjoint study. A percentage was awarded
for each characteristic.
Table 5.16: Weight and percentage awarded to each attribute level in the game and the outcome of the game for each festival scenario
Attributes and levels Weight of attribute levels
Percentage of total weight
Festival A Festival B Festival C
Festival brands
Festival A 42 8% 8% -8% 0%
Festival B 30 6% -6% 6% -6%
Festival C 68 14% 0% 0% 14%
Entertainment or festival activities
Quality arts 21 4% 0% 0% 0%
Quality performances 42 8% 8% 8% 8%
Quality music 50 10% 10% 10% 0%
Refreshments
A wide variety of good quality 21 4% 4% 4% 0%
Friendly service 24 5% 5% 0% 5%
Value for money 31 6% 6% 6% 6%
Transport
Good transport 23 5% 0% 5% 0%
Sufficient parking 21 4% 0% 0% 0%
Safe and secure parking 35 7% 7% 7% 7%
Ticket prices
Lower than current price 60 12% 12% 12% 12%
The same price 34 7% 0% 0% 0%
Higher than current price 0 0% 0% 0% 0%
Total 502 100% 55% 50% 46%
The final results of the game indicate that Festival A has the best results with 55%,
followed by Festival B with 50% and Festival C with 46%. On interpreting the
outcome of the game it is clear that Festival C’s brand is the most important of the
three festivals' brands (14%), but not by enough to give the festival the total best
score in the outcome of the game. In the attribute level of Entertainment or festival
activities, the content of the music offered at the festival (10%) apparently carries the
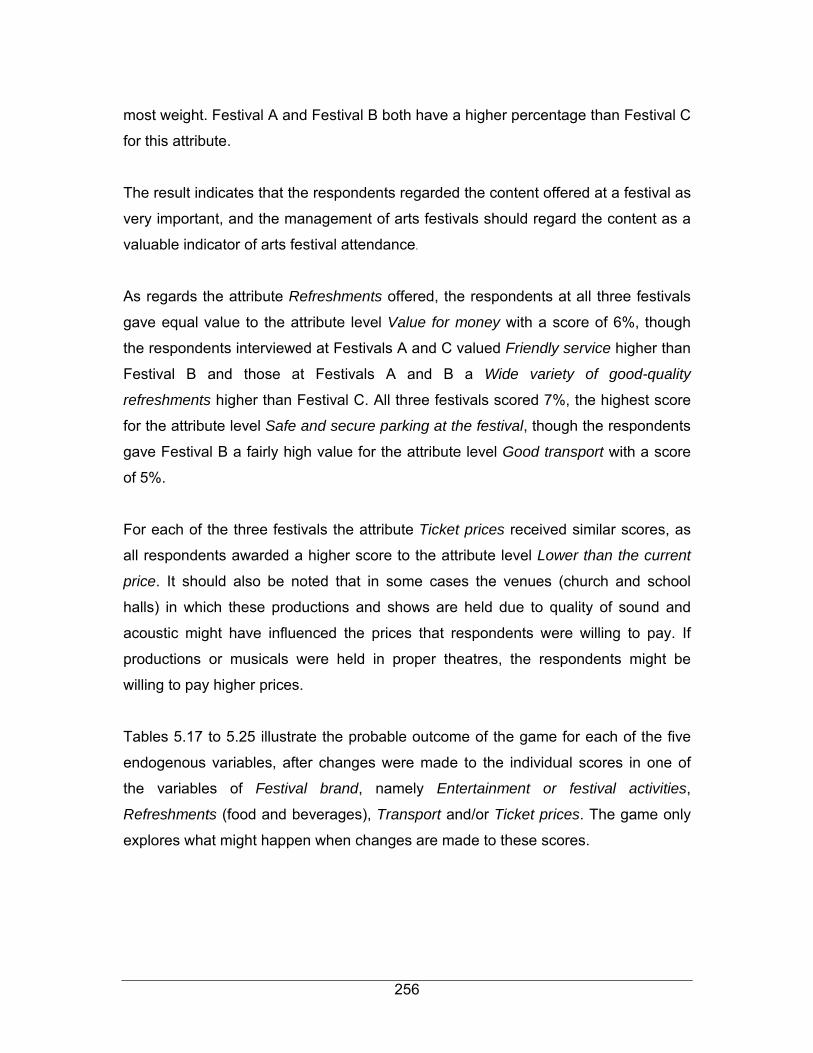
256
most weight. Festival A and Festival B both have a higher percentage than Festival C
for this attribute.
The result indicates that the respondents regarded the content offered at a festival as
very important, and the management of arts festivals should regard the content as a
valuable indicator of arts festival attendance.
As regards the attribute Refreshments offered, the respondents at all three festivals
gave equal value to the attribute level Value for money with a score of 6%, though
the respondents interviewed at Festivals A and C valued Friendly service higher than
Festival B and those at Festivals A and B a Wide variety of good-quality
refreshments higher than Festival C. All three festivals scored 7%, the highest score
for the attribute level Safe and secure parking at the festival, though the respondents
gave Festival B a fairly high value for the attribute level Good transport with a score
of 5%.
For each of the three festivals the attribute Ticket prices received similar scores, as
all respondents awarded a higher score to the attribute level Lower than the current
price. It should also be noted that in some cases the venues (church and school
halls) in which these productions and shows are held due to quality of sound and
acoustic might have influenced the prices that respondents were willing to pay. If
productions or musicals were held in proper theatres, the respondents might be
willing to pay higher prices.
Tables 5.17 to 5.25 illustrate the probable outcome of the game for each of the five
endogenous variables, after changes were made to the individual scores in one of
the variables of Festival brand, namely Entertainment or festival activities,
Refreshments (food and beverages), Transport and/or Ticket prices. The game only
explores what might happen when changes are made to these scores.
257
Table 5.17 indicates that changing Festival C's score for Quality music (cell A6) from
0 to 1 improves the festival's overall score by 10%.
Table 5.17: Weight and percentage awarded to each attribute level in the game and the outcome of the game if Festival C’s score for Quality music is improved
Attributes and levels
Weight of attribute levels
Percentage of total weight Festival A Festival B Festival C
Festival brands
Festival A A1 42 8% 8% -8% 0%
Festival B A2 30 6% -6% 6% -6%
Festival C A3 68 14% 0% 0% 14%
Entertainment or festival activities
Quality arts A4 21 4% 0% 0% 0%
Quality performances A5 42 8% 8% 8% 8%
Quality music A6 50 10% 10% 10% 10%
Refreshments
A wide variety of good quality A7 21 4% 4% 4% 0%
Friendly service A8 24 5% 5% 0% 5%
Value for money A9 31 6% 6% 6% 6%
Transport
Good transport A10 23 5% 0% 5% 0%
Sufficient parking A11 21 4% 0% 0% 0%
Safe and secure parking A12 35 7% 7% 7% 7%
Ticket prices
Lower than current price A13 60 12% 12% 12% 12%
The same price A14 34 7% 0% 0% 0%
Higher than current price A15 0 0% 0% 0% 0%
Total 502 100% 55% 50% 56%
Table 5.17 indicates that changing Festival C's score for Quality music from 0 to 1
improves the festival's total score from 46% to 56%. This might indicate that Festival
C could improve the content and quality of the music it offers, i.e. the attribute level
could be improved. In this case, Festival C obtained the best overall score of the
three of the festivals.
258
If the attribute level of Quality music is improved for Festival C, the total score for this
festival would improve too. The assumption can be made that Festival C’s
management still does not offer the optimum product in music. In this case, Festival
C could still optimise the entertainment product, which means there is room for the
improvement of the key product. Therefore the management should reconsider its
selection of music products, such as ensuring a better quality of bands or singers.
Either the music product at Festival C is not presented effectively or it does not meet
the required standard. The festival management should consider specific factors,
such as better musicians, bands and sound effects, to ensure that the best music
products are offered.

259
Table 5.18 indicates that changing Festival A’s score for Festival Branding (cell A1)
from 1 to a weaker 0 decreases the festival's overall score by 9%.
Table 5.18: Weight and percentage awarded to each attribute level in the game and the outcome of the game if Festival A’s score for Festival brands is weakened
Attributes and levels
Weight of attribute levels
Percentage of total weight Festival A Festival B Festival C
Festival brands
Festival A A1 42 8% 0% -8% 0%
Festival B A2 30 6% -6% 6% -6%
Festival C A3 68 14% 0% 0% 14%
Entertainment or festival activities
Quality arts A4 21 4% 0% 0% 0%
Quality performances A5 42 8% 8% 8% 8%
Quality music A6 50 10% 10% 10% 0%
Refreshments
A wide variety of good quality A7 21 4% 4% 4% 0%
Friendly service A8 24 5% 5% 0% 5%
Value for money A9 31 6% 6% 6% 6%
Transport
Good transport A10 23 5% 0% 5% 0%
Sufficient parking A11 21 4% 0% 0% 0%
Safe and secure parking A12 35 7% 7% 7% 7%
Ticket prices
Lower than current price A13 60 12% 12% 12% 12%
The same price A14 34 7% 0% 0% 0%
Higher than current price A15 0 0% 0% 0% 0%
Total 502 100% 46% 50% 46%
Table 5.18 indicates that changing Festival A’s score for Festival brands from 1 to 0
weakens the festival's total score from 55% to 46%. This might indicate that it would
be prudent to keep the branding unchanged at Festival A. The table also illustrates

260
that branding is important to each of the three festival scenarios. In this case, Festival
A and Festival C obtained the lowest overall scores of the three festivals.
Table 5.19 indicates that changing Festival A’s score for Quality arts (cell A4) from 0
to 1 improves the overall score of the festival by only 4%.
Table 5.19: Weight and percentage awarded to each attribute level in the game and the outcome of the game if Festival A’s score for Quality arts is improved
Attributes and levels
Weight of attribute levels
Percentage of total weight Festival A Festival B Festival C
Festival brands
Festival A A1 42 8% 8% -8% 0%
Festival B A2 30 6% -6% 6% -6%
Festival C A3 68 14% 0% 0% 14%
Entertainment or festival activities
Quality arts A4 21 4% 4% 0% 0%
Quality performances A5 42 8% 8% 8% 8%
Quality music A6 50 10% 10% 10% 0%
Refreshments
A wide variety of good quality A7 21 4% 4% 4% 0%
Friendly service A8 24 5% 5% 0% 5%
Value for money A9 31 6% 6% 6% 6%
Transport
Good transport A10 23 5% 0% 5% 0%
Sufficient parking A11 21 4% 0% 0% 0%
Safe and secure parking A12 35 7% 7% 7% 7%
Ticket prices
Lower than current price A13 60 12% 12% 12% 12%
The same price A14 34 7% 0% 0% 0%
Higher than current price A15 0 0% 0% 0% 0%
Total 502 100% 59% 50% 46%
261
Table 5.19 indicates that changing Festival A’s score for Quality arts from 0 to 1
improves the festival's total score only from 55% to 59%. This might indicate that
Festival A could improve slightly if it offered better-quality arts. In this case Festival A
obtained the best overall score of the three festivals. This might indicate that
improving the quality of the arts would not have as large an effect as improving the
quality of the music (see Table 5.17 in this regard).

262
Table 5.20 indicates that changing Festival A’s score for Quality performances (cell
A5) from 1 to 0 weakens this festival's overall score by 9%.
Table 5.20: Weight and percentage awarded to each attribute level in the game and the outcome of the game if Festival A’s score for Quality performances is weakened
Attributes and levels
Weight of attribute levels
Percentage of total weight Festival A Festival B Festival C
Festival brands
Festival A A1 42 8% 8% -8% 0%
Festival B A2 30 6% -6% 6% -6%
Festival C A3 68 14% 0% 0% 14%
Entertainment or festival activities
Quality arts A4 21 4% 0% 0% 0%
Quality performances A5 42 8% 0% 8% 8%
Quality music A6 50 10% 10% 10% 0%
Refreshments
A wide variety of good quality A7 21 4% 4% 4% 0%
Friendly service A8 24 5% 5% 0% 5%
Value for money A9 31 6% 6% 6% 6%
Transport
Good transport A10 23 5% 0% 5% 0%
Sufficient parking A11 21 4% 0% 0% 0%
Safe and secure parking A12 35 7% 7% 7% 7%
Ticket prices
Lower than current price A13 60 12% 12% 12% 12%
The same price A14 34 7% 0% 0% 0%
Higher than current price A15 0 0% 0% 0% 0%
Total 502 100% 46% 50% 46%
Table 5.20 indicates that changing Festival A’s score for Quality performances from 1
to 0 weakens the festival's total score from 55% to 46%. This might indicate that
Festival A should continue to offer quality performances because a lower score for
this attribute would weaken the festival's overall score. In this case Festival A and
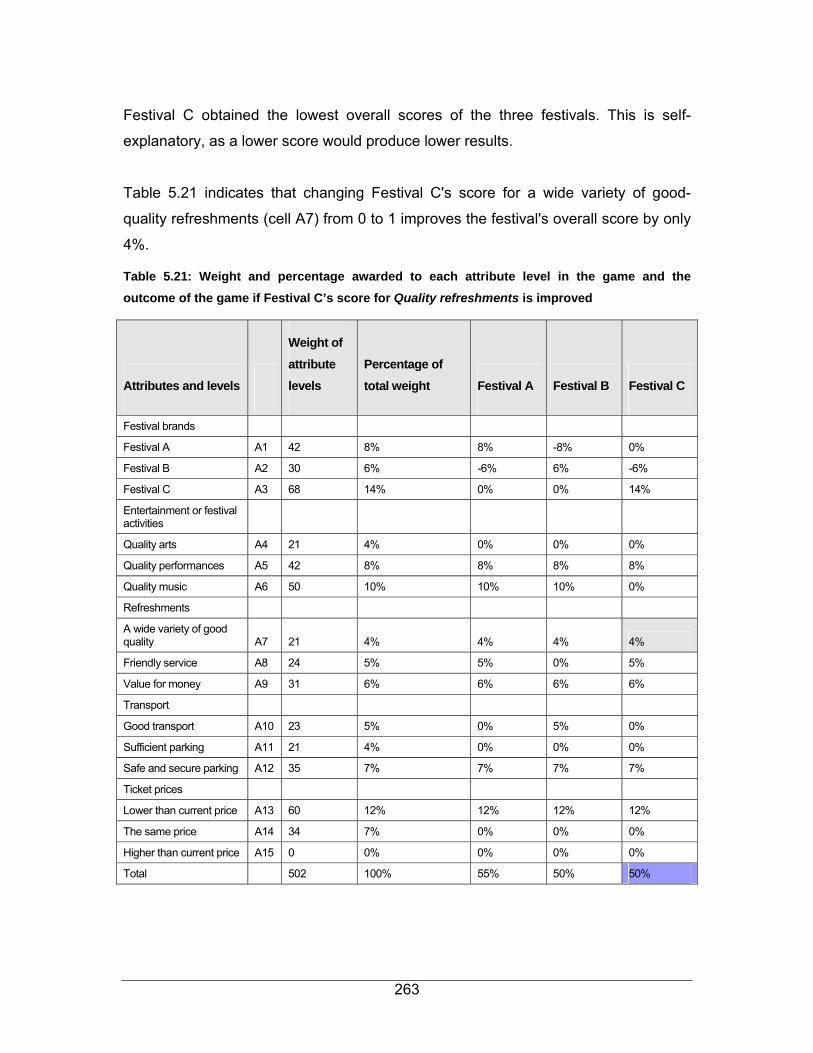
263
Festival C obtained the lowest overall scores of the three festivals. This is self-
explanatory, as a lower score would produce lower results.
Table 5.21 indicates that changing Festival C's score for a wide variety of good-
quality refreshments (cell A7) from 0 to 1 improves the festival's overall score by only
4%.
Table 5.21: Weight and percentage awarded to each attribute level in the game and the outcome of the game if Festival C’s score for Quality refreshments is improved
Attributes and levels
Weight of attribute levels
Percentage of total weight Festival A Festival B Festival C
Festival brands
Festival A A1 42 8% 8% -8% 0%
Festival B A2 30 6% -6% 6% -6%
Festival C A3 68 14% 0% 0% 14%
Entertainment or festival activities
Quality arts A4 21 4% 0% 0% 0%
Quality performances A5 42 8% 8% 8% 8%
Quality music A6 50 10% 10% 10% 0%
Refreshments
A wide variety of good quality A7 21 4% 4% 4% 4%
Friendly service A8 24 5% 5% 0% 5%
Value for money A9 31 6% 6% 6% 6%
Transport
Good transport A10 23 5% 0% 5% 0%
Sufficient parking A11 21 4% 0% 0% 0%
Safe and secure parking A12 35 7% 7% 7% 7%
Ticket prices
Lower than current price A13 60 12% 12% 12% 12%
The same price A14 34 7% 0% 0% 0%
Higher than current price A15 0 0% 0% 0% 0%
Total 502 100% 55% 50% 50%
264
Table 5.21 indicates that changing Festival C's score for a wide variety of good-
quality refreshments from 0 to 1 improves the festival's total score from 46% to 50%.
This might indicate that Festival C could improve slightly by providing better
refreshments at the festival. Once again, all things being equal, this change would
not have as great an effect as improving the music. In this case, Festival B and
Festival C obtained the same scores, but their scores were still weaker than that of
Festival A score for the quality of refreshments.

265
Table 5.22 indicates that changing Festival B's score for Friendly service (cell A8)
from 0 to 1 improves the festival's overall score by 5%.
Table 5.22: Weight and percentage awarded to each attribute level in the game and the outcome of the game if Festival B’s score for Friendly service is improved
Attributes and levels
Weight of attribute levels
Percentage of total weight Festival A Festival B Festival C
Festival brands
Festival A A1 42 8% 8% -8% 0%
Festival B A2 30 6% -6% 6% -6%
Festival C A3 68 14% 0% 0% 14%
Entertainment or festival activities
Quality arts A4 21 4% 0% 0% 0%
Quality performances A5 42 8% 8% 8% 8%
Quality music A6 50 10% 10% 10% 0%
Refreshments
A wide variety of good quality A7 21 4% 4% 4% 0%
Friendly service A8 24 5% 5% 5% 5%
Value for money A9 31 6% 6% 6% 6%
Transport
Good transport A10 23 5% 0% 5% 0%
Sufficient parking A11 21 4% 0% 0% 0%
Safe and secure parking A12 35 7% 7% 7% 7%
Ticket prices
Lower than current price A13 60 12% 12% 12% 12%
The same price A14 34 7% 0% 0% 0%
Higher than current price A15 0 0% 0% 0% 0%
Total 502 100% 55% 55% 46%
Table 5.22 indicates that changing Festival B's score for Friendly service from 0 to 1
improves the festival's total score from 50% to only 55%. This might indicate that
Festival B can improve only slightly by providing friendly service with refreshments at
266
the festival. In this case, Festival A and Festival B obtained the same scores, 5%
higher than that of Festival C.
If the score for the attribute Food and beverages offered at a festival is changed, the
outcome does not change as much as it would by changing the score for the attribute
Entertainment and, more specifically, the attribute level of Quality music. The
assumption can be made that increasing the scores for the other attributes would not
make as great an improvement as increasing the score for music, because improving
the quality of music has a much better end result for all the festival scenarios.
Table 5.23 indicates that changing Festival A's score for Good transport offered at
the festival (cell A10) from 0 to 1 improves the festival's overall score by only 4%.

267
Table 5.23: Weight and percentage awarded to each attribute level in the game and the outcome of the game if Festival A’s score for Good transport is improved
Attributes and levels
Weight of attribute levels
Percentage of total weight Festival A Festival B Festival C
Festival brands
Festival A A1 42 8% 8% -8% 0%
Festival B A2 30 6% -6% 6% -6%
Festival C A3 68 14% 0% 0% 14%
Entertainment or festival activities
Quality arts A4 21 4% 0% 0% 0%
Quality performances A5 42 8% 8% 8% 8%
Quality music A6 50 10% 10% 10% 0%
Refreshments
A wide variety of good quality A7 21 4% 4% 4% 0%
Friendly service A8 24 5% 5% 0% 5%
Value for money A9 31 6% 6% 6% 6%
Transport
Good transport A10 23 5% 5% 5% 0%
Sufficient parking A11 21 4% 0% 0% 0%
Safe and secure parking A12 35 7% 7% 7% 7%
Ticket prices
Lower than current price A13 60 12% 12% 12% 12%
The same price A14 34 7% 0% 0% 0%
Higher than current price A15 0 0% 0% 0% 0%
Total 502 100% 59% 50% 46%
Table 5.23 indicates that changing Festival A's score for Good transport from 0 to 1
improves the total score from 55% to 59%. This might indicate that Festival A can
improve slightly in terms of the transport offered at the festival. In this case Festival A
obtained the best overall score of all three festivals.

268
Table 5.24 indicates that changing Festival A's score for Sufficient parking (cell A11)
from 0 to 1 improves the festival's overall score by 4%.
Table 5.24: Weight and percentage awarded to each attribute level in the game and the outcome of the game if Festival A’s score for Sufficient parking is improved
Attributes and levels
Weight of attribute levels
Percentage of total weight Festival A Festival B Festival C
Festival brands
Festival A A1 42 8% 8% -8% 0%
Festival B A2 30 6% -6% 6% -6%
Festival C A3 68 14% 0% 0% 14%
Entertainment or festival activities
Quality arts A4 21 4% 0% 0% 0%
Quality performances A5 42 8% 8% 8% 8%
Quality music A6 50 10% 10% 10% 0%
Refreshments
A wide variety of good quality A7 21 4% 4% 4% 0%
Friendly service A8 24 5% 5% 0% 5%
Value for money A9 31 6% 6% 6% 6%
Transport
Good transport A10 23 5% 0% 5% 0%
Sufficient parking A11 21 4% 4% 0% 0%
Safe and secure parking A12 35 7% 7% 7% 7%
Ticket prices
Lower than current price A13 60 12% 12% 12% 12%
The same price A14 34 7% 0% 0% 0%
Higher than current price A15 0 0% 0% 0% 0%
Total 502 100% 59% 50% 46%
Table 5.24 indicates that changing Festival A's score for Sufficient parking from 0 to 1
improves the festival's total score from 55% to 59%. This might indicate that Festival
A can improve only slightly in terms of the attribute Transport and the attribute level
Sufficient parking offered at the festival. In this case, Festival A obtained the best
overall score of all three festivals.
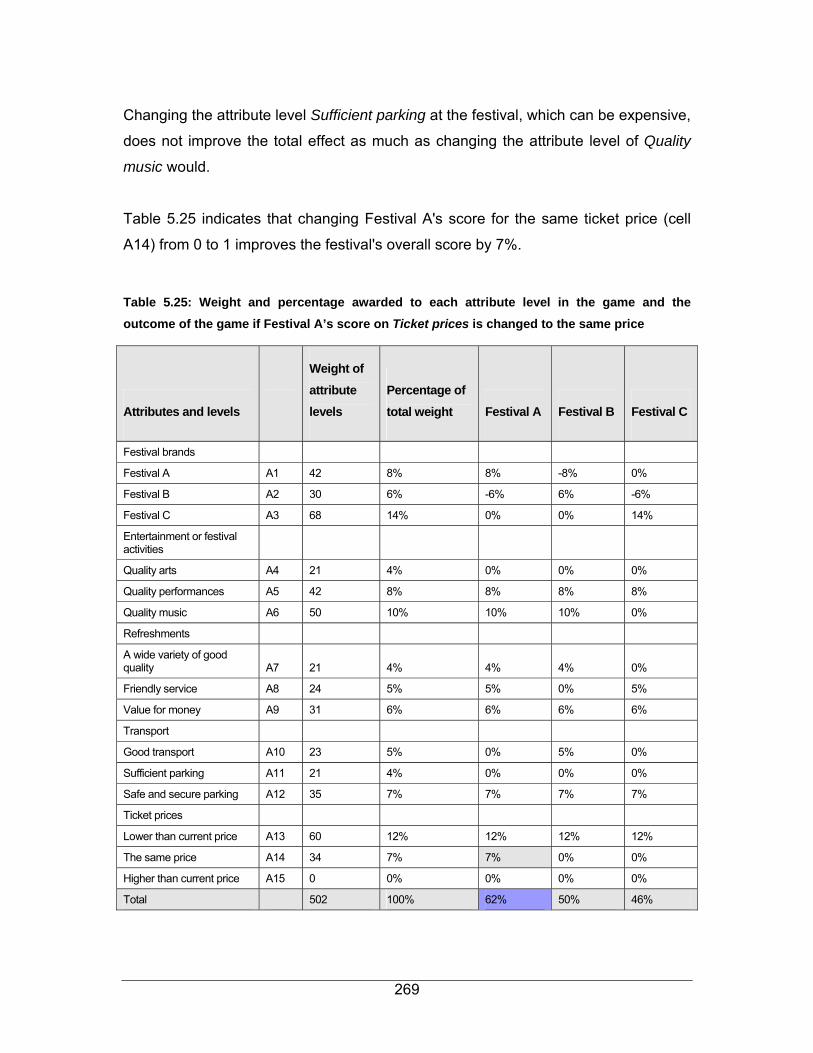
269
Changing the attribute level Sufficient parking at the festival, which can be expensive,
does not improve the total effect as much as changing the attribute level of Quality
music would.
Table 5.25 indicates that changing Festival A's score for the same ticket price (cell
A14) from 0 to 1 improves the festival's overall score by 7%.
Table 5.25: Weight and percentage awarded to each attribute level in the game and the outcome of the game if Festival A’s score on Ticket prices is changed to the same price
Attributes and levels
Weight of attribute levels
Percentage of total weight Festival A Festival B Festival C
Festival brands
Festival A A1 42 8% 8% -8% 0%
Festival B A2 30 6% -6% 6% -6%
Festival C A3 68 14% 0% 0% 14%
Entertainment or festival activities
Quality arts A4 21 4% 0% 0% 0%
Quality performances A5 42 8% 8% 8% 8%
Quality music A6 50 10% 10% 10% 0%
Refreshments
A wide variety of good quality A7 21 4% 4% 4% 0%
Friendly service A8 24 5% 5% 0% 5%
Value for money A9 31 6% 6% 6% 6%
Transport
Good transport A10 23 5% 0% 5% 0%
Sufficient parking A11 21 4% 0% 0% 0%
Safe and secure parking A12 35 7% 7% 7% 7%
Ticket prices
Lower than current price A13 60 12% 12% 12% 12%
The same price A14 34 7% 7% 0% 0%
Higher than current price A15 0 0% 0% 0% 0%
Total 502 100% 62% 50% 46%

270
Table 5.25 indicates that changing Festival A's score for a lower ticket price to the
same ticket price and from 0 to 1 improves the festival's total score from 55% to 62%.
This might indicate that Festival A could attract more attendees if the festival's ticket
price remains unchanged. In this case, Festival A obtained the best overall score of
the three festivals. However, this would be unreasonable, as festival attendees would
always prefer the price to remain unchanged, even though rising costs and inflation
would make it necessary to increase the ticket price.
The findings of the game theory clearly indicate the importance of the attribute level
Quality music in the total arts festival package. It also indicates that certain arts
festivals, whose management screens the musicians before letting them perform at
the festival, are already on the road to success, and this screening should therefore
continue. Generally, a festival's management need not concentrate so much on less
important matters, such as food and beverages and sufficient parking, since the
game theory indicates that attributes such as Transport (sufficient parking), and Food
and beverages are not as important as Quality music to the total presentation of an
arts festival.
The above clearly indicates, in the case of each individual variable, the possible
outcome of the game when a variable is changed, and that some variables have a
stronger or weaker effect on a festival's attractiveness to tourists. Furthermore, the
results substantiate the fact that some variables or components (e.g. the quality of
the music) do play an important role and that a festival's management should
concentrate on improving the most significant variables.
Each of the endogenous variables tested (Brand, Entertainment, Refreshments,
Transport, Price) resulted in a different outcome of the game theory and a different
total effect from the other variables. This may indicate that some components do not
play a major role, whereas others, such as music, have a stronger effect. The
festival's management should therefore concentrate on the presentation of the music
offered at the arts festival, and not as much attention to variables such as sufficient
parking and transport.

271
The findings of the study are that one of the key indicators of an arts festival's
success is the important attribute of Quality music and the festival's management
should therefore concentrate most on this attribute; the less important attributes
could receive little attention, without endangering the festival's success.
The results obtained from the games shown in Table 5.17 to Table 5.25 were used to
develop the market-positioning model intended specifically for arts festivals.
5.5 CONCLUSION
Among the general information listed in Table 5.1, the responses of most of the
respondents at all three arts festival scenarios indicated they would attend the
festival again in future, reflecting a loyal group of festival attendees. The responses
indicate that the two push factors family togetherness and socialisation with friends
were the main motivation for respondents to return to Festival A, and community
pride and event novelty for respondents to return to Festival B, but the responses
indicated no specific or dominant motivation to return to Festival C.
The respondents at both Festival A and Festival C indicated that the single highest
inhibitor item that negatively influenced them against attending was the higher prices
in shops and restaurants. The inhibitor item not having enough money to spend on
productions negatively influenced Festival B’s respondents from attending the festival
again.
One of the secondary objectives of the study was to determine which combination of
attributes offered by arts festivals would assure an optimum market position. The
results as indicated in Tables 5.4 to 5.6 of Section 5.3.2 were obtained by using the
conjoint analysis technique. Table 5.26 indicates the attribute levels with the highest
weighted raw utility values for each attribute.
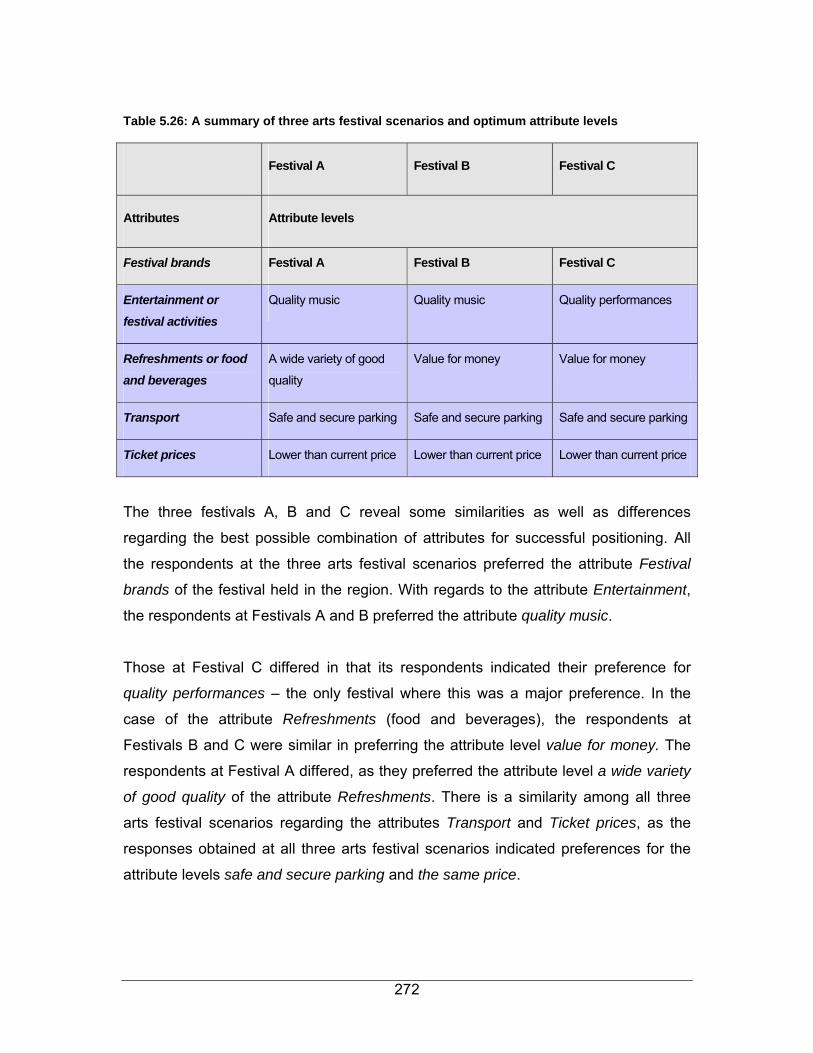
272
Table 5.26: A summary of three arts festival scenarios and optimum attribute levels
Festival A Festival B Festival C
Attributes Attribute levels
Festival brands Festival A Festival B Festival C
Entertainment or
festival activities
Quality music Quality music Quality performances
Refreshments or food and beverages
A wide variety of good
quality
Value for money Value for money
Transport Safe and secure parking Safe and secure parking Safe and secure parking
Ticket prices Lower than current price Lower than current price Lower than current price
The three festivals A, B and C reveal some similarities as well as differences
regarding the best possible combination of attributes for successful positioning. All
the respondents at the three arts festival scenarios preferred the attribute Festival
brands of the festival held in the region. With regards to the attribute Entertainment,
the respondents at Festivals A and B preferred the attribute quality music.
Those at Festival C differed in that its respondents indicated their preference for
quality performances – the only festival where this was a major preference. In the
case of the attribute Refreshments (food and beverages), the respondents at
Festivals B and C were similar in preferring the attribute level value for money. The
respondents at Festival A differed, as they preferred the attribute level a wide variety
of good quality of the attribute Refreshments. There is a similarity among all three
arts festival scenarios regarding the attributes Transport and Ticket prices, as the
responses obtained at all three arts festival scenarios indicated preferences for the
attribute levels safe and secure parking and the same price.
273
Another objective was to compare the different arts festival scenarios and their
attributes with one another. In this way, the author could determine what would be
the most successful arts festival presentation in terms of a tourism attraction. The
game theory technique was employed in the current study to integrate the data and
to compare the three different arts festival scenarios. The attribute level importance
(weighted raw utility value) for all three festivals scenarios globally, as shown in Table
5.3, was used to design the matrix or scale for the game theory.
Each attribute level was then scored per festival between the parameters of the scale
(Table 5.14), ranging from -1, 0, to 1, depending on where the exact value of each
festival lay in the range. The weighted raw utility values shown in Table 5.4 were
used to score Festival A, those in Table 5.5 to score Festival B and those in Table
5.6 to score Festival C. The results of the scoring of attribute levels are illustrated in
Table 5.15. In Table 5.16 the game is set up and a weight awarded to each individual
attribute level.
The final results of the game theory indicate that Festival A scored the best results
with a total score of 55%, followed by Festival B with 50% and Festival C with 46%.
Festival C’s brand was the most important of the three festivals' brands (14%), but
not strong enough to award a total best score in the outcome of the game.
The attribute Entertainment or festival activities and more specifically the Quality
music (10%) offered at the festival appeared to be extremely important. Festival A
and Festival B scored a higher percentage than Festival C on this attribute level.
The result indicates that the respondents give high importance to the music content
offered at a festival, which is the reason why the management of arts festivals should
regard this as a valuable indicator and take steps to assure better quality in the music
offered at an arts festival.

274
Regarding the attribute Refreshments offered, the responses indicated that the
attribute level Value for money was equally highly valued at the three festivals, with a
score of 6%. The responses obtained at Festivals A and C indicate that Friendly
service was valued and at Festivals A and B, a wide variety of good quality
refreshments was valued. All three festivals scored 7%, the highest score for the
attribute level Safe and secure parking at the festival, though Festival B gained a
fairly high score of 5% for the attribute level Good transport.
The attribute Ticket prices for each of the three festivals had an identical score as all
respondents awarded the same score to the attribute level Lower than current price.
Once again due to sound quality of venues (church and school halls) where these
productions and shows are held could influence the price that respondents are willing
to pay. If productions or musicals were held in proper theatres, festival attendees
might be willing to pay higher prices.
The outcomes of the different games, as displayed in Tables 5.17 to 5.25, indicate
the following:
• The attribute level Quality music improved by 10% in the outcome of a game if
the score is improved from 0 to 1;
• the attribute level Quality arts improved by 4% in the outcome of a game if the
score is improved from 0 to 1;
• the attribute level a Wide variety of good quality refreshments improved by 4%
in the outcome of a game if the score is improved from 0 to 1;
• the attribute level Friendly service with refreshments improved by 5% in the
outcome of a game if the score is improved from 0 to 1;
• the attribute level Good transport offered improved by 4% in the outcome of a
game if the score is improved from 0 to 1;
• the attribute level Sufficient parking – transport offered improved by 4% in the
outcome of a game if the score is improved from 0 to 1; and
• the attribute level The same ticket price offered improved by 7% in the
outcome of a game if the score is improved from 0 to 1.

275
The results of the game theory and conjoint analysis study were used to meet the
last secondary objective, namely to develop the market-positioning model, which
focuses on the data analysis contained in this chapter. In Chapter 6, the research
findings are integrated and interpreted more comprehensively and, resulting from
these conclusions and recommendations, a model is developed to assist with
positioning an arts festival in the market.
This model may add value to the tourism industry of South Africa by indicating the
essential focus of arts festivals. The next chapter concludes with the final
recommendations, comments on the limitations of the study and recommendations
for future research.

276
CHAPTER 6
6 CONCLUSIONS AND RECOMMENDATIONS
6.1 INTRODUCTION
Chapter 1 notes the growing number of festivals in South Africa, as new ones are
continually being added to the events calendar. Another secondary objective was
achieved by refining the numerous festivals forming part of special interest tourism in
the South African festival market. The festivals fell into the following seven broad
categories: arts festivals, dance, jazz and music festivals; sacred, language and
religious festivals; heritage and culture festivals; harvest and food festivals; shows,
fairs and festivals; and sport events.
Table 1.2 lists the calendar of festivals and events in South Africa. Chapter 2
reviewed literature relating to the tourism phenomenon, SIT, festivals and events,
and more specifically on arts festivals, whilst tourism marketing and the theory of the
market positioning thereof are addressed in Chapter 3. The research methodology
and design of the questionnaire are reported in Chapter 4, followed by the data
analysis and results in Chapter 5.
However, the purpose of this chapter is firstly to provide a summary of the research
findings and to make a recommendation on the use of a market-positioning model for
arts festivals on that basis. This model was developed from the results obtained from
surveys undertaken at the arts festival scenarios and based on the conclusions of the
study.
Positioning studies are some of the most useful research studies to marketers and
management in the tourism industry, because they provide a clear direction for
marketing efforts by comparing tourist products, such as arts festivals, and by
describing the position of a festival in the mind of a tourist (Prince, 1990:25).

277
In selecting an optimum position, a general understanding is necessary regarding
what festival attendees think of the attributes and attribute packages. The
perceptions of festival attendees at arts festival scenarios were tested to determine
the optimum position of each festival in the geographical region where the specific
festival was held.
The primary research objective of the study was to construct a market-positioning
model that could be used by South African event co-ordinators to provide guidelines
on ensuring a successful arts festival. The model, as discussed in this chapter, could
add value to the tourism industry and could also contribute to the body of knowledge
about South African arts festivals sustainability. The first secondary objective of the
study was to determine which attributes and combination of attributes would drive the
best practices of the management of arts festival scenarios. The situational inhibitors
that might prevent respondents from attending any of the arts festivals in these
scenarios were also addressed. The conjoint analysis technique was used to analyse
the data in this regard. The technique of conjoint analysis has frequently been used
for positioning in marketing but its application to tourism and more specifically arts
festivals in South Africa is seldom reported in literature (see Chapter 3, Table 3.4).
Following that, the results from these analyses were used to achieve the second
secondary objective, namely to compare the three selected arts festival packages
with the attributes and to determine the optimum combination of attributes for each
festival. The game theory technique allowed the author to compare the arts festival
scenarios with one another and to determine the attributes of the most successful
arts festival presentation as a tourism attraction.
The technique of game theory is usually employed in economics, mathematics and
other disciplines in the social and behavioural sciences (McCain, 1997:1). The
optimisation technique was deemed appropriate in this case as it takes into account
the semi-competitive situation of arts festivals as well as the non-representativeness
of the sample, as discussed in Section 4.9 of Chapter 4.

278
In support of this optimisation objective, the designing of a model for the tourism
industry of South Africa is explained in Section 6.3. The model was used to test
different combinations of the attributes typically related to arts festivals for the three
arts festival scenarios. The knowledge gained from testing these combinations of
attributes was employed to develop the market-positioning model, specifically for arts
festivals. The analysis presented in Chapter 5 has been organised in a way that
addressed these objectives.
The present research further employed the techniques of conjoint analysis and game
theory to refine the market positioning and optimisation. A structured conjoint
analysis questionnaire involving personal interviewing of a sample of respondents
was used to gather the data required for this study. This is a scenario-based study
and the data collected were based on judgemental and interlocking quota sampling.
Conjoint analysis is a widely accepted type of research technique as it measures
part-worth utilities for product attributes, typically at the level of the individual
respondents, and then estimates preferences for “what if” products through
simulations (CVA, 1996:1).
Conjoint analysis is useful for determining how the buyers of a product rate its
various characteristics, and is basically a “trade-off” exercise in which customers
have to make preference decisions based on the relative importance of one product
benefit over another (Botha, 2002:41). In an imaginary scenario, the respondents
were asked to compare one arts festival with a combination of attributes to another
arts festival with a different combination of attributes, and then to indicate their
strongest preference on a 9-point semantic differential rating scale.
Certain demographic, geographic and behavioural information was included in the
questionnaire. The situational inhibitors that might prevent respondents from
attending an arts festival were also measured on an 11-point interval rating scale and
treated as a demographic variable. These situational inhibitors provide additional
information about positioning an arts festival in the market.
279
The results of the attributes' level of importance (weighted raw utility value) indicated
that each of the three arts festival scenarios is unique in the combination of attributes
that festival attendees look for and the factors that inhibit them from attending such
festivals. The game theory technique was employed in the present study to integrate
the data and to compare the three different arts festival scenarios. The attributes'
level of importance (weighted raw utility value) for all three festivals scenarios
globally, shown in Table 5.3, were used to design the matrix or scale for the game
theory. The game was set up, and the outcome displayed the optimum position for
each festival in the market.
The main conclusions of the study are summarised, and the results are discussed
and interpreted in Section 6.2. Where appropriate, recommendations are made for
improving the festival scenarios. The findings derived from the analyses are used in
the discussion of the recommended market-positioning model in Section 6.3. The last
section of this chapter comments on the limitations of the study and identifies areas
for future research.
6.2 CONCLUSIONS AND RECOMMENDATIONS OF DATA ANALYSIS
The main conclusions and recommendations from the analysis of the data are
discussed in terms of the objectives of the study and presented under subheadings.
The model is one of the recommendations of the study and is discussed in Section
6.3.
6.2.1 General information
• The majority of respondents in the three arts festival scenarios indicated that
they would attend the specific arts festival again in future (see Table 5.1).
This indicates a group loyal to the brand and or offerings at the festivals of the
particular event held in the region and should be used in the future marketing
of these arts festivals.
280
• The level of educational qualifications of the respondents at the three arts
festival scenarios differed: respondents at Festival A and B had relatively
higher qualifications than those attending Festival C (see Table 5.1). These
higher qualification levels may be due to the universities in the towns where
Festivals A and B are held, whereas the town for Festival C only has colleges.
The deduction was that better-educated people tend to go to these arts
festivals and correlates with previous finding of Hughes (2000:17). These
respondents are perceived to be on a higher level according to Maslow’s
hierarchy of needs. Maslow explains that people are driven by particular
needs at particular times, and these needs are arranged in hierarchical order
from the most basic to the most important. Self-actualisation is the highest
level of needs, and includes taking an interest in the latest happenings in the
art world (cited in Armstrong & Kotler, 2003:155).
6.2.2 Motivating factors at arts festival scenarios
These results provided some valuable supportive information about the internal
psychological factors likely to motivate attendees to go to arts festivals.
• Table 5.1 indicates that the dominant push factor for respondents at Festival
B was Event novelty and Community pride. This was of such significance to
the respondents in the Grahamstown region that it could be regarded as a
factor differentiating it from the other two arts festival scenarios. The high
score may be due to the fact that Festival B has the longest history of arts
festivals in South Africa. These respondents had a more discerning taste as a
festival audience and this should be promoted in the festival' marketing
material.
• There were apparently two important push factors motivating the
respondents to attend Festivals A and C, namely socialisation with friends and
family togetherness (see Table 5.1). There was a distinct difference in the
push factors of the respondents at the mainly Afrikaans and those at the
281
mainly English festivals. The two mainly Afrikaans festivals are Afrikaans
events and the question that arises, is what would happen to Festivals A and
C if the main language is to change. By contrast, the respondents at the
mainly English Festival B represent the audience's discerning taste and a
preference for event novelty and community pride. The recommendation is
that these festivals should focus on their uniqueness in their marketing. The
respondents at Festival A and Festival C showed a similar push-factor pattern,
but Festival B is differentiated by the dominant push factors of “event novelty”
and “community pride”. It is recommended that Festival B should regard this
as a sustainable competitive advantage for its mainly English niche market.
Festival A and C operate in a uniquely Afrikaans niche market. Two niche
markets are therefore identified. One is mainly Afrikaans and, as it is
predominantly a folk festival, the festival management should focus on culture
and language. The other market indicates the more discerning taste of the
mainly English audience and the festival management should focus on
thought-provoking drama with novelty appeal.
6.2.3 Situational inhibitors at arts festival scenarios
These results met the objective to determine the situational inhibitors that might
prevent respondents from attending arts festival scenarios, and contribute further
information about positioning.
• Table 5.2 lists the situational inhibitors that might prevent respondents at the
three arts festival scenarios from attending the respective arts festival. The
strongest inhibitor items influencing the respondents overall relate to the
combined dimension time and money. The situational inhibitors involved in
money and prices appear to be the most significant for positioning an arts
festival in the market. It is therefore recommended that great care should be
taken with pricing and prices should not be raised unnecessarily. The three
arts festival scenarios should all note their audiences' price sensitivity and
should try to add value for their attendees.

282
• Table 5.2 indicates that attendees at both Festivals A and C were negatively
influenced mainly by the inhibitor item lack of parking facilities at venues. In
the case of Festival B a relatively large number of items had a neutral to least
likely effect on the dimension Accessibility and Transport and the dimension
Social problems at the arts festival.
• The situational inhibitors can be interpreted as having different inhibitory
effects on the three festival scenarios. However, the respondents at Festival C
are most likely to be inhibited, followed by those at Festival A, and are least
likely to influence the respondents at Festival B. The situational inhibitors all
differ significantly from one another and in their relative importance at each of
the three festival scenarios. The festival co-ordinators ought to understand
these inhibitors fully to ensure the survival and future success of their festivals.
6.2.4 Attributes and attribute composition of arts festival scenarios
These research results achieved the objective of determining the attributes and
attribute combination that would drive the success of arts festival scenarios in the
market.
• Based on the relative attribute importance to arts festival scenarios, shown
in Figure 5.1, the deduction is made that Festival C has the strongest branding
importance of the three arts festival scenarios, giving Festival C a competitive
advantage in the market for this attribute level. It is recommended that
Festivals A and B should in the future pay greater attention to the attribute
Festival Brand as the power of branding cannot be ignored. The attribute
Entertainment or festival activities is less important for Festival C than for the
other two festivals. It is recommended that the management of Festival C
should work on the attribute Entertainment or festival activities offered at the
festival by including a variety of shows and productions. The management of
these festival scenarios should also include this variety in the marketing and
promotion of the festival.

283
• Figure 5.2 indicates the attribute importance per individual respondent at
arts festival scenarios, revealing that Festival C has the highest weighted utility
value on Festival Brand and Festival B on Entertainment or festival activities.
The weighted utility values of Refreshments and Transport were relatively
equally distributed across the three arts festival scenarios. Festival C’s Ticket
prices have the highest weighted utility value across the three festival
scenarios. A recommendation can be made that the management of Festival
C should focus on branding while improving its entertainment and activities,
whereas that of Festivals A and B should improve their branding.
• Figure 5.3 depicts the cluster analysis of the three arts festival scenarios and the four clusters, indicating that Festival A is mainly price-sensitive,
Festival B activity-sensitive and Festival C brand-sensitive. This should be
considered when developing the marketing strategy for these festivals.
• Figure 5.4 depicts the correspondence between arts festivals and attribute importance and reveals the following important information about market
positioning.
o Festivals A and B are furthest apart in terms of positioning, indicating it
is highly unlikely that Festival A's respondents would attend Festival B,
and vice versa, but Festival B's respondents might attend Festival C,
and vice versa. The geographic distance between the three selected
arts festivals might be a contributing factor, as Festivals B and C are
both held in the Cape Province whereas Festival A is held in the North
West Province.
o Respondents attend Festival B predominantly for the attributes
Refreshments, Transport and Entertainment.
o Respondents attend Festival A mainly for the attribute Ticket prices,
because tickets are cheaper, within their financial means and offer
value for money. They also attend the festival for the entertainment
value of the festival activities.
284
o Respondents attend Festival C for the attributes Festival brand and to a
lesser degree for the attribute Ticket prices.
o Festival B is slightly better positioned on Festival brand than Festival A.
The management of Festival A should therefore improve its branding by
striving for a more exclusive festival. Festival B has already established
a strong and typical English arts festival view, and Festival C a strong
Afrikaans “folk festival” view, whereas Festival A, the newest of the
three, is in between and has not yet been firmly established.
• Figure 5.5 depicts the correspondence between age and festival attributes
at the three arts festival scenarios, revealing information about positioning.
Each of the three age groups tends to be associated with a specific festival
attribute and the following three subsegments can therefore be identified in the
market:
o The youngest group, between 18-30 years, gives highest value to the
attribute Ticket prices. Respondents in this age group do not yet earn
high salaries and the younger ones may still be their parents'
dependants. It is recommended that this subsegment should be offered
special concession prices for students.
o The middle age group, between 31 and 45 years, mainly value the
attribute Entertainment or festival activities. This may indicate the life-
cycle stage of the respondents, as they are probably more concerned
about family life and other factors. This subsegment should be
accommodated in the market, for example by providing baby-sitting and
family-care facilities as well as entertainment for primary school pupils
during the festival.
o The age group older than 45 years mainly value the attribute Transport.
This group may be less mobile and regard getting to the festival as a
struggle if it is too far from home. It is recommended that this
subsegment should be catered for in the festival and promotion material
by giving greater priority to transport and accessibility to the festival.

285
This older group should be given preference regarding transport to
venues, such as the minibus shuttles offered at venues.
o The age group older than 45 placed less emphasis on Ticket prices
than the two younger age groups, as the older group comprises semi-
retired people with a relatively high disposable income. It is
recommended that the needs of this subsegment should be met as far
as possible in future, for example by providing value-added services,
such as minibus shuttles, since people in this age group are generally
better off financially and would be willing to spend money at a festival.
• Figure 5.6 depicts the correspondence between arts festival scenario and home language, revealing that the three arts festival scenarios operate in a
unique market and providing valuable information about home-language
market positioning.
o Festivals A and C are generally associated with Afrikaans as the
attendees' home language. The towns of Potchefstroom and
Oudtshoorn have strong associations with the Afrikaans language. The
question is whether the management of Festivals A and C should
attempt to attract attendees who speak English and other languages, or
whether they should focus instead on those who speak Afrikaans as
their home language. Attendees from the English, Tswana, Xhosa,
Sotho and Tsonga groups could be targeted and attracted to Festivals
A and C by presenting shows in these languages, and in this way, if
borne out by market research, such festivals might fill a gap in the
market. However, it is recommended that Festivals A and C should not
change the mainly Afrikaans character of the festival, and that an effort
should be made to cater also for the Afrikaans-speaking coloured
people in the community.
o Festival B differs from Festivals A and C, as English and other
languages are the main home language of attendees. Grahamstown is
linked historically with the 1820 British Settlers and celebrates these
cultural ties, which is why the respondents regard English as of great

286
importance. Few attendees who speak Afrikaans and other languages
as their home language attend Festival B, leading to the same question
that was raised for Festivals A and C, i.e. whether the management of
Festival B should continue to concentrate on the English exclusiveness
that makes the festival unique. It is recommended that management
should continue to focus on and promote English as the preferred
language, and in this way keep the unique English character of the
festival. It is noted that most Afrikaans people in the LSM 8-10 groups
seldom understand English well.
• The attribute simulation tool enabled the simulation of the best possible
combination of attributes for each arts festival scenario. A summary of Tables
5.4 to 5.6 indicates that the following attribute levels have the highest
weighted raw utility values for each festival scenario, as illustrated below.
Table 6.1: The three arts festival scenarios summarised
Festival A Festival B Festival C
Attributes Attribute levels
Festival brands Festival A Festival B Festival C
Entertainment /festival activities
Quality music Quality music Quality performances
Refreshments/food and beverages
A wide variety of good
quality
Value for money Value for money
Transport Safe and secure
parking
Safe and secure
parking
Safe and secure parking
Ticket prices Lower than current
price
Lower than current
price
Lower than current price
287
6.2.5 Comparison of the three arts festival scenarios
The game theory results meet the objective of comparing each arts festival's
attributes with one another to determine the optimum arts festival presentation as a
tourism attraction.
• Table 5.16 shows a comparison of the three arts festival scenarios and the
attributes using game theory. The outcome of the game indicates that Festival
A has the highest score, followed by Festival B and lastly by Festival C.
• Festival C’s brand was the most important of the three festivals' brands, but
was still not strong enough to award it a total best score in the outcome of the
game.
• The attribute Entertainment or festival activities and more specifically Quality
music offered at the festival appears to be very important. Festivals A and B
both scored a higher percentage than Festival C on this attribute level. The
result indicates the great importance of the music content offered at a festival
to their attendees, and the management of arts festivals should regard this as
a valuable indicator for the success of a festival.
• Regarding the attribute Refreshments offered, the responses indicate that the
attribute level Value for money had an equal score for all three festivals,
though the responses for Festivals A and C indicate that Friendly service is
rated higher, and those for Festivals A and B indicate a higher rating for a
Wide variety of good quality refreshments.
• The three festivals all have a high score for the attribute level Safe and secure
parking at the festival, though Festival B scored relatively higher for the
attribute level Good transport.
• The attribute Ticket prices was the same for each of the three festivals as all
respondents awarded the highest score to the attribute level Lower than
current price.
• The outcomes of the different games in Tables 5.17 to 5.25 indicate the
attribute levels and percentage improvement in the outcome of games if the

288
score is changed. It is recommended that the management of festivals should
take note of the following results:
• Quality music gained 10%;
• The same ticket price gained 7%;
• Friendly service gained 5%;
• Quality arts, a Wide variety of good quality refreshments, Good transport offered, Safe and sufficient parking gained 4%.
A summary of these results is shown in Figure 6.1.

289
Figure 6.1: The most prominent differences and similarities between the three arts festival scenarios
290
6.3 PROPOSED MARKET-POSITIONING MODEL FOR ARTS FESTIVALS
The proposed market-positioning optimisation model for arts festivals, as discussed
below, is based on the conclusions of the study and forms an integral part of the
recommendations emanating from the study.
The top level of Figure 6.2 indicates that there are basically three main components,
which should be combined and integrated before obtaining the end result. These
ingredients are the body of knowledge on arts festivals (Chapter 2), marketing and
market positioning (Chapter 3) and the results of the cluster analysis,
correspondence analysis, conjoint analysis and game theory (Chapter 4). Along the
centre of Figure 6.2 are the eight steps of the model showing the way that conjoint
analysis is employed to determine the most preferred combination of attributes for
each of the three arts festival scenarios.
The lowest part of Figure 6.2 shows how these results of the conjoint are used, and
compares the three arts festivals by means of the game theory. The outcome of the
various games indicates the optimum position for each festival, which is illustrated by
the findings derived from the data reported in Chapter 5. The flow diagram of the
market-positioning model (Figure 6.2) illustrates how the findings could be utilised to
determine an optimum combination of attributes and a market position that would
ensure the sustainability of the festival.

291
Figure 6.2: An optimum market-positioning model for arts festivals
292
6.3.1 Flow of the model
The first column of the top row in Figure 6.2 refers to the body of knowledge on arts
festivals, i.e. the flow process of the tourism phenomenon as addressed in Chapter 2
and illustrated in Figure 2.1. The phenomenal growth of tourism has contributed to
maturity in the market and the changing needs in this sector (see Section 2.3.1.2).
These changing needs manifest in an international interest in developing niche
markets to cater for specific interests and activities to which the “new, more
streetwise tourist” might want to devote leisure time (Page, 2003; Douglas et al.,
2001; Weiler & Hall, 1992). One of these specialised new tourism trends is identified
as special interest tourism (SIT). The different types of SIT opportunities available to
the “new tourist” are identified in Table 2.1 in Section 2.4. One of these
subcategories of SIT associated with the culture and heritage of an area, is festivals
and events tourism.
This subcategory has had strong growth and is now a worldwide tourism
phenomenon (Prentice & Andersen, 2003). Festivals and events have been identified
as one of the fastest-growing categories of these new types of tourism offerings (see
Section 2.5). This is also being seen in South African where tourists/customers can
choose from an average of four festivals a month or one a week; and new festivals
are continually being added to the events calendar. The successful development of
these niche products not only benefits the South African tourism industry, but also
poses major challenges to tourism management. Tassiopoulos (2005:26) notes that,
although the benefits of festival and event tourism are increasingly being recognised
in South Africa, little research has been done in this area so far.
It is ironic that the very popularity and growth of the festival industry in South Africa
might threaten its future. Festivals and events are discussed in Section 2.5, which
also contains a classification of festivals in the South African context. Through
creative marketing and the effective market positioning of festivals this classification
could be used to create and maintain positive images in the minds of festival
attendees.
293
As festival and event tourism is an emerging industry, literature on research in this
field is growing but still limited, especially in the more specialised field of arts
festivals. Arts festivals are selected and presented in this thesis as scenarios for the
purpose of research, for reasons including the following:
• this is currently one of the fastest-growing sectors of tourism (Allen et al.,
2000);
• previous research done by the author that identified the gap (Van Zyl, 2002)
• three prominent arts festivals in South Africa, namely Aardklop Festival
(Festival A) in Potchefstroom, National Arts Festival (Festival B) in
Grahamstown, and KKNK (Festival C) in Oudtshoorn were previously
classified as hallmark tourist events16 (Van Zyl, 2002);
• the South African government regarded the arts as important and that
everybody in the community should have access to arts festivals.
If the management of arts festivals wants to sustain a festival in such an
overcrowded environment, the importance of sound marketing and positioning
becomes obvious. This is addressed in the second column of the top row in Figure
6.2, indicating the body of knowledge on marketing and market positioning in the arts
festival context, as addressed in Chapter 3.
Marketing is the golden thread running though all the activities which lead to a
successful festival or event (Hall, 1992). A festival or event will not succeed unless it
can fulfil the expectations and needs of the participants (often from the local
community) and the visitors (Shone & Perry, 2004; Hall, 1997). No festival or event
can be all things to all people, because of the diverse market it attracts (Yeoman et
al., 2004). A marketer can rarely satisfy everyone in a market, but should try to satisfy
most. That is why it is important to select a target group.
16 Hallmark events are events that become so strongly identified with the spirit or ethos of a town, city
or region that they become synonymous with the name of the place, and gain widespread recognition
and awareness (Bowdin et al., 2001:17).

294
The festival and event customer, at the core of the market, is introduced through
market segmentation where the focus is on grouping together those customers with
similar requirements and buying characteristics (see Table 3.2 of Section 3.4).
Market positioning is central to marketing, and the topic is defined in various
contexts, such as the marketing context where it had its origins, in the tourism
context where it spread during the early 1980s, and in a festival and event context
where nominal coverage is reported in the secondary literature (see Section 3.5.5).
This lack of empirical research on the market positioning of arts festivals, specifically
in the South African scenario, is identified and reported (see Table 3.4. of Section
3.5.5).
Familiarity with the features of market positioning in the festival context means that
the different positioning models of various authors can be used to determine an
optimum position in the market, as reported in Section 3.6. To address this
secondary objective of the study six positioning models were selected based on their
marketing orientation and the significance of their contribution to the topic of
positioning in the present study. These six models were selected for the following
reasons:
• The models developed by Ries and Trout (2001), Kotler (2003, 2000), Boyd
and Walker (1990) – prominent authors of market positioning – have been
adopted and employed in the tourism literature. These models have also
received a considerable amount of attention in marketing (consumer
behaviour) and tourism literature.
• Lovelock (2003) recognises that positioning applies to the services-marketing
business, and continues to list the pitfalls if businesses do not position
themselves effectively.
• Aaker and Shansby (1982) draw conclusions on developing a positioning
strategy in marketing and are frequently cited in tourism literature.
• Reich (1999, 1997) introduced and applied the topic to hospitality and tourism
marketing as well as tourism destinations.
295
The present study uses the model by Boyd and Walker, as a result of the extensive
research done on the topic among the six positioning models examined. Boyd and
Walker (1990) present some of the most thorough coverage of positioning and begin
by offering definitions of the two terms, namely market targeting and market
positioning. They give a detailed description of the process to be followed in each of
these two cases as well as the eight steps to be followed when determining existing
perceptions and the positioning decision for a new product or the repositioning of a
current product. As illustrated in Figure 3.3, this model is workable for the present
study because of the ease with which the model (the steps in the positioning
process) could be adapted to the needs of the present research.
The third and last column of the top row in Figure 6.2 refers to various techniques
used in data analysis. Various scholars’ theories on cluster analysis in Section 4.8.1,
correspondence analysis in Section 4.8.2, conjoint analysis in Section 4.8.3 and
game theory in Section 4.9 are acknowledged throughout this study.
The first two columns indicate the secondary research chapters (Chapters 2 & 3) of
the present study, and are combined with the last column (Chapters 4 & 5), namely
the primary research chapters. By integrating these three columns, i.e. secondary
literature on tourism, SIT (Chapter 2) and market positioning (Chapter 3) with the
empirical results/primary research of this study (Chapters 4 & 5), the author
developed a new model for positioning.
A model is available for the employment of conjoint analysis to determine the
optimum combination of attributes which festival attendees seek, and the results are
listed in the middle column of the second row in Figure 6.2. Following that, these
results were used in the game theory to compare the three arts festivals. The
outcome of the games indicated the optimum position for each festival in the market.
This model for employing conjoint analysis and game theory to position arts festivals
in the market is based on the body of knowledge about arts festivals and the market-
positioning models of various authors (Kotler, 2000; Boyd & Walker, 1990).
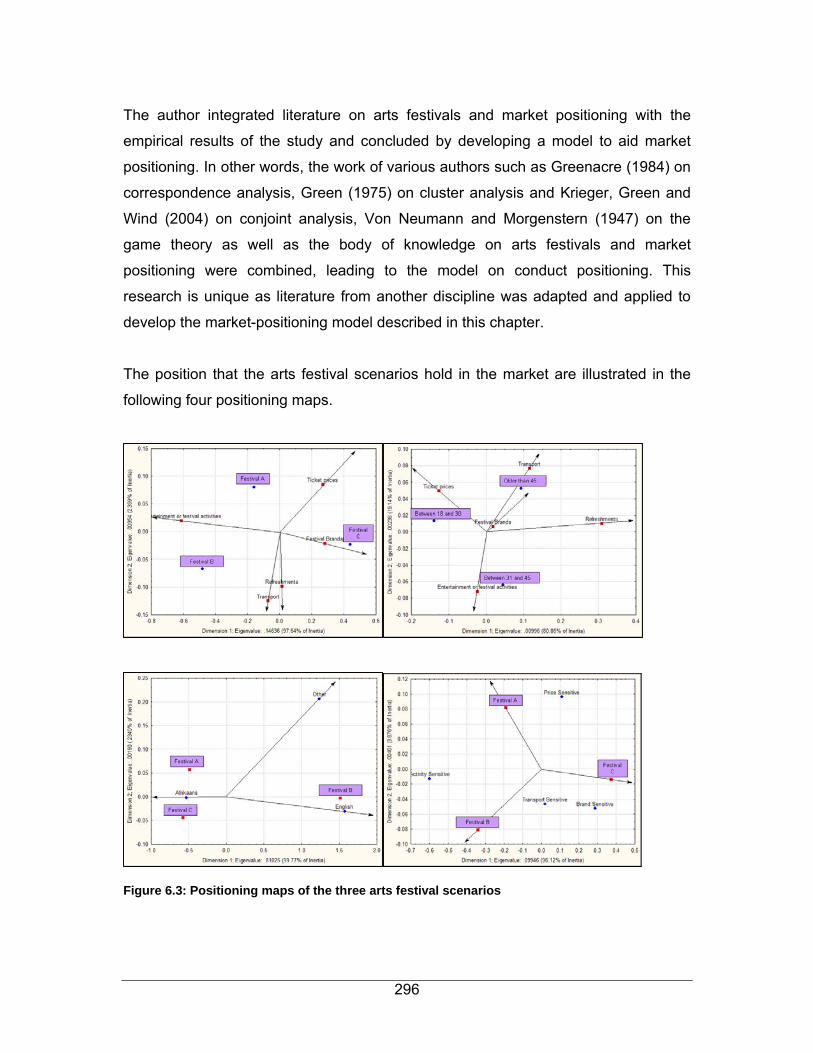
296
The author integrated literature on arts festivals and market positioning with the
empirical results of the study and concluded by developing a model to aid market
positioning. In other words, the work of various authors such as Greenacre (1984) on
correspondence analysis, Green (1975) on cluster analysis and Krieger, Green and
Wind (2004) on conjoint analysis, Von Neumann and Morgenstern (1947) on the
game theory as well as the body of knowledge on arts festivals and market
positioning were combined, leading to the model on conduct positioning. This
research is unique as literature from another discipline was adapted and applied to
develop the market-positioning model described in this chapter.
The position that the arts festival scenarios hold in the market are illustrated in the
following four positioning maps.
Figure 6.3: Positioning maps of the three arts festival scenarios

297
The steps to be followed in the market-positioning model are shown in the flow chart
in Figure 6.4.
Figure 6.4: Steps in the market-positioning model

298
Each of these steps is discussed as employed in the present study:
Step 1 is to design the conjoint analysis study. The selection of attributes and levels
is regarded as the single most important component of a conjoint analysis and
depends on the objectives of the study (see Section 4.8.5 in Chapter 4). The conjoint
design is a critical component in the success of any conjoint project (CVA,
SawtoothSoftware:1996).
The attributes and attribute levels were deconstructed in order to grasp which
variables segmented the market. The attributes describing a festival, which were
selected for the present study, are discussed in Section 4.8.5 in Chapter 4. The
reason for regarding these attributes (five in total) relevant to a description of an arts
festival is discussed next.
The two attributes Festival brands and Ticket prices (see Table 4.5) are included in
the conjoint as most conjoint studies include the attributes brand and price (Market
Vision Research, 2002:6). In each case, three attribute levels were determined for
each of the five attributes (see Table 4.5). Previous research was the rationale for
selecting the other three attributes, namely Entertainment or festival activities
activities, Food and beverages and Transport to venues (Van Zyl, 2002).
Furthermore, the behavioural, geographic and demographic segmentation variables
were considered jointly with the five main attributes and levels (see Table 3.2 in
Section 3.4). The behavioural component is determined by conjoint analysis, and the
demographic and geographic variables by classification. Following that, these two
are combined in the conjoint questionnaire. The situational inhibitors are included as
a variable that will most likely provide additional information about market positioning.
Step 2 is to administer the conjoint questionnaire to a quota sample of respondents
drawn from attendees at each of the three selected festival scenarios, and to gather
the data obtained from the face-to-face interviews based on the questionnaire.

299
Step 3 is to capture and analyse the conjoint data. One of the first analyses is aimed
at determining the relative importance of attributes and some part-worth or weighted
utility values of attributes. In the present study, the attribute importance and part-
worth or weighted utility values of the levels of attributes were calculated per
individual for each of the three arts festival scenarios (Sections 5.3.1 and 5.3.2).
Step 4 is to use the attribute importance and part-worth values to perform cluster
analysis. A cluster groups the respondents with the same behavioural pattern
together. Four clusters namely Price-, Entertainment or activity-, Brand- and
Transport-sensitive were identified in the present study (Section 5.3.3).
Step 5 is to use the cluster analysis to label or categorise the respondents into
groups with the same behavioural profiles. Once similar behaviour has been
identified, each group is given a label. Four groups namely, price-sensitive, activity-
or entertainment-sensitive, brand-sensitive and transport-sensitive were identified, as
shown in Figure 6.5.
Figure 6.5: The four clusters of the groups of respondents at the arts festival scenarios

300
It should be noted that a price-sensitive festival attendee differs from a brand-
sensitive attendee. This is where positioning is valuable, because all respondents
with similar behaviour are grouped in a cluster and then labelled. This clustering of
the respondents enabled the author to determine respondents' past behaviour,
however, this was outside the scope of this thesis. The research done in the past
identified the gender, residential area and home language as well as the income of
festival attendees, but did not reveal anything about their behaviour (Saayman &
Saayman, 2004; Van Zyl, 2002). However, the present study has bridged this gap in
the body of knowledge about arts festivals.
Step 6 uses the clusters with labels to perform the correspondence analysis.
Step 7 uses the results of the correspondence analyses to draw correspondence
maps or positioning maps (Section 5.3.4). The concept of market positioning
concerns the way in which the different attributes (such as brand, price, etc.) feature
in the mind of a prospective festival attendee, but does not indicate how a festival
should be positioned in the market. These maps only illustrate these findings visually.
Step 8 is to set up and run the attribute simulation tool. This tool allows the
researcher to make assumptions used for predicting and changing the respondents'
behaviour. A change in their behaviour changes the positioning map accordingly.
This property is unique to the positioning methodology, as no other methodology is
capable of performing this function.
Step 9 resulted in the best combination of attributes (value propositions) unique to
each arts festival scenario (Section 5.3.5), as illustrated in Figure 6.6.
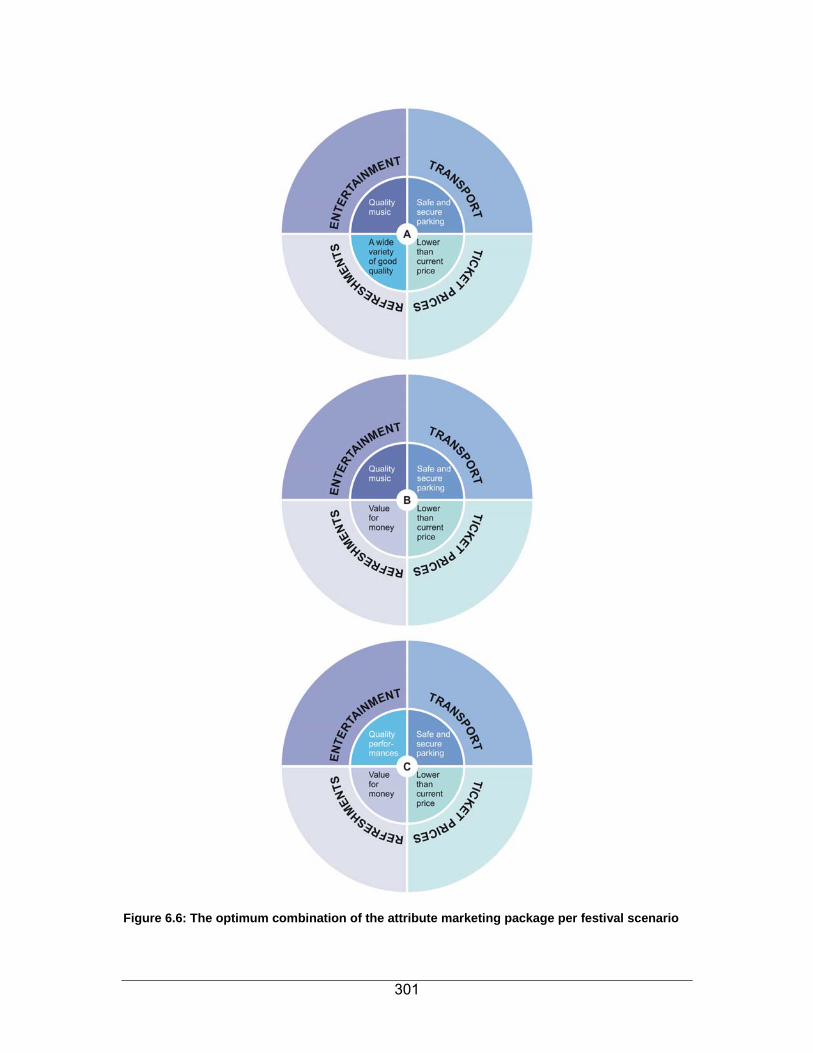
301
Figure 6.6: The optimum combination of the attribute marketing package per festival scenario
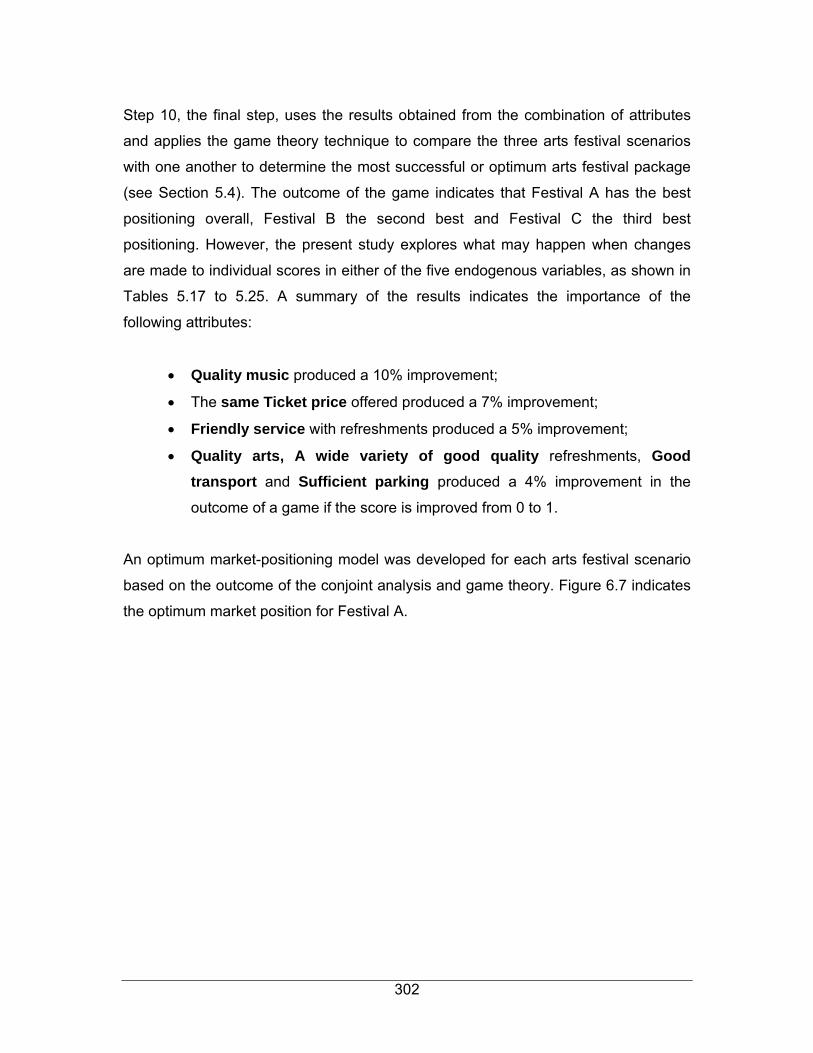
302
Step 10, the final step, uses the results obtained from the combination of attributes
and applies the game theory technique to compare the three arts festival scenarios
with one another to determine the most successful or optimum arts festival package
(see Section 5.4). The outcome of the game indicates that Festival A has the best
positioning overall, Festival B the second best and Festival C the third best
positioning. However, the present study explores what may happen when changes
are made to individual scores in either of the five endogenous variables, as shown in
Tables 5.17 to 5.25. A summary of the results indicates the importance of the
following attributes:
• Quality music produced a 10% improvement;
• The same Ticket price offered produced a 7% improvement;
• Friendly service with refreshments produced a 5% improvement;
• Quality arts, A wide variety of good quality refreshments, Good transport and Sufficient parking produced a 4% improvement in the
outcome of a game if the score is improved from 0 to 1.
An optimum market-positioning model was developed for each arts festival scenario
based on the outcome of the conjoint analysis and game theory. Figure 6.7 indicates
the optimum market position for Festival A.

303
Figure 6.7: An optimum market position for Festival A
The author identified the following unique features regarding the market position of
Festival A:
• The festival management could improve the attribute Festival brand
• The festival is not yet firmly established in terms of its branding
• The festival is the most recent of the three arts festival scenarios researched
• The festival operates in a niche of its own
• Attendees come to the festival mainly for the attribute Ticket prices
• The festival is the furthest removed from Festival B in terms of its positioning.
A market-positioning model was developed for arts festival scenario B, based on the
outcome of the conjoint and game theory, as shown in Figure 6.8.
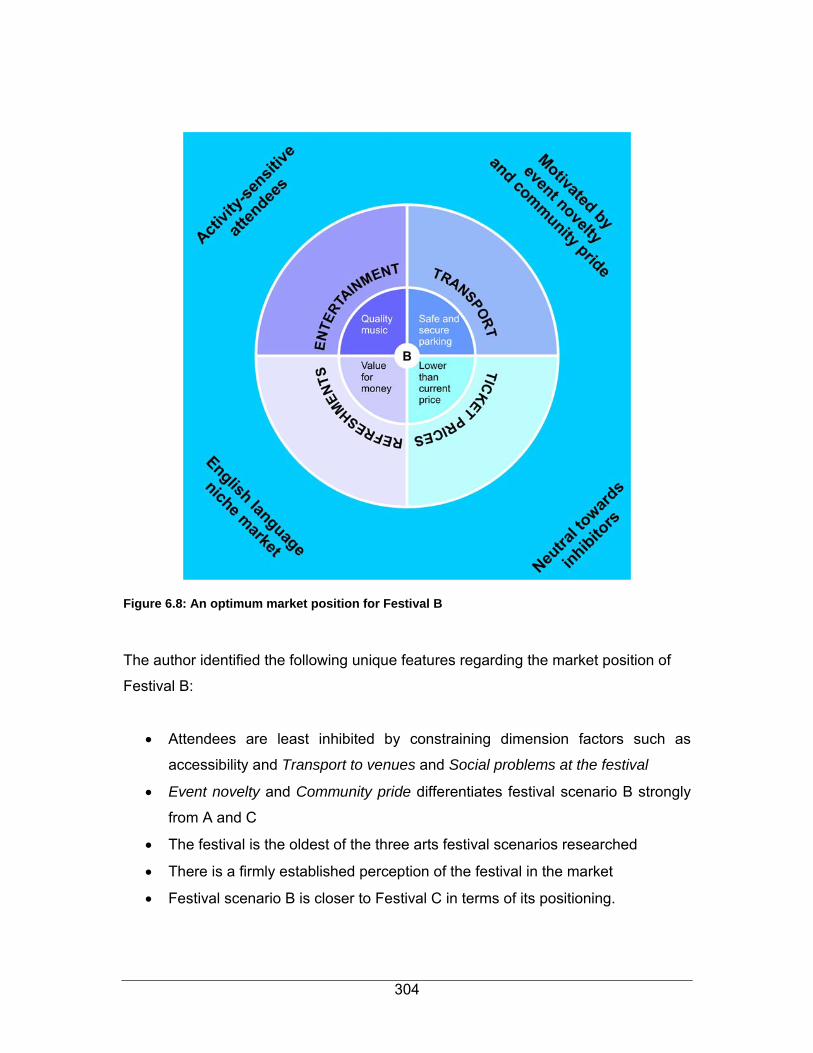
304
Figure 6.8: An optimum market position for Festival B
The author identified the following unique features regarding the market position of
Festival B:
• Attendees are least inhibited by constraining dimension factors such as
accessibility and Transport to venues and Social problems at the festival
• Event novelty and Community pride differentiates festival scenario B strongly
from A and C
• The festival is the oldest of the three arts festival scenarios researched
• There is a firmly established perception of the festival in the market
• Festival scenario B is closer to Festival C in terms of its positioning.

305
A market-positioning model was developed for arts festival scenario C, based on the
outcome of the conjoint and game theory, as shown in Figure 6.9.
Figure 6.9: An optimum market position for Festival C
The author identified the following unique features regarding the market position of
Festival C:
• The festival management could improve the entertainment/festival activities
offered at the festival
• This festival has the strongest brand identity of the three arts festival scenarios
researched
• Festival brand strongly differentiates this festival from the other two festivals

306
• Attendees at the festival tend to be inhibited mainly by factors such as high
ticket prices, traffic congestion and insufficient parking at venues.
The market position of the arts festival scenarios in Figure 6.6 could improve by
taking optimisation into account. The arts festival scenarios are firmly established in
terms of market positioning, but if the management of the respective festivals wants
to improve or optimise the specific festival's market position, there is still room for
improvement. The greatest improvement could be achieved by improving the
attribute Quality music offered at the festival and slightly less by keeping Ticket prices
unchanged at festivals. However, the assumption can be made that little or no
improvement is needed in the attributes Quality arts, Friendly service, and A wide
variety of good quality refreshments as well as Good and sufficient parking at
venues, as improvements will probably have a minor outcome and it is costly to
improve the infrastructure.
The quota sampling selected respondents at each festival scenario in the following
three subsegments in terms of age groups:
1. The younger group (between 18-30 years), who are mainly sensitive to ticket
prices. To counter this price sensitivity, the festival management could offer
special rates or concessions to students.
2. The middle group (between 31-45 years) is mostly associated with and
sensitive to the Entertainment offered at the festival. To encourage this group
to attend a festival, the management could offer baby-care facilities or
supervised care of younger children.
3. The older group (older than 45 years) is sensitive to Transport and
Accessibility. The festival management could give members of this group
preference in transport by minibus and shuttle services to venues. As this
group has more disposable income to spend at the festival, management
should endeavour to meet the needs of this segment.

307
The arts festival management should cater for these subsegments at the following
year’s festivals.
It should be noted that the ideal model for each festival merely illustrates the
optimum market position, rather than suggesting a definite strategy as there may be
other attributes worth considering in the conjoint design and a different segmentation
or classification of data from those used in the present research.
6.4 CONTRIBUTIONS, CONFIRMATIONS, LIMITATIONS OF THE STUDY
The contribution of this study was the development of a market-positioning model for
arts festivals, based on the body of knowledge about tourism and arts festivals,
conjoint analysis, correspondence analysis and game theory; and positioning
attributes. Using the model and its elements, the author was able to illustrate an
optimum market position for each of the three selected arts festival scenarios in
terms of the combination of attributes that would assure the best position and the
successful future of a particular festival scenario. This model could be applied to
other industries in the economy, such as banking and insurance, as well as motor
manufacturing.
Confirmations and disconfirmations by previous studies include:
• Nickerson and Moisey (1999:218) who report that in theory much of the
research (from branding to positioning) completed to date has analysed the
psychological contributions of destination image (positioning), motivation and
the travel decisions of visitors. The analysis by these authors has provided a
great many conference proceedings and academic papers, but has done little
as far as its application is concerned. By contrast, the present study applied positioning research to the South African festivals and events industry.
308
• Most of the respondents interviewed at the three arts festival scenarios
indicated that they would attend the next arts festival also. The respondents
could probably be regarded as “true festival attendees” as they had attended
an arts festival in the past (see Appendix A3, screening question in
questionnaire) and they indicated they would attend an arts festival again in
future. If visitors wish to return, they have to be fairly satisfied with the
previous experience (Crompton & McKay, 1997:125). As a high percentage of
the respondents indicated that they would attend the respective arts festivals
again, the assumption can be made that the respondents at each arts festival
scenario are relatively satisfied with the festival held in the respective region.
• Furthermore, numerous festival surveys have detected a loyal group of repeat
visitors (will go again), obviously including a high proportion of the residents in
the region (Getz, 1997:263). This group of repeat visitors often have a strong
“brand loyalty” to a particular event, adding to their desire to support it.
• The findings of the study confirm that arts festival attendees fall mainly in the
higher income group with a high level of tertiary education qualifications.
• As these demographic variables are probably a general trend among arts
festival attendees in South Africa, their distribution would differ from the
variables typical of the general characteristics of the population (Hughes,
2000:16). Moreover, it may be of interest to and useful for the festival
management to know where the arts festival audiences come from, who they
are and what they value in order to target their marketing and positioning
activity accordingly (see Section 2.5.5.3).
• The higher the level of education, the greater a person's propensity to
participate in cultural activities, including arts and community festivals
(Torkildsen, 1983). Morgan (1996:103) observes that the age at which
individuals completes their formal education (16 or 18 years, or after higher
education, at 21 years) may indicate their aspirations, intelligence and,

309
significantly for event managers, their curiosity about the world in which they
live. For the management of festivals and events associated with the arts and
cultural elements, the target market is an educated one (Allen et al.,
2002:173).
• Knowledge about household type and size, as well as race and ethnicity, are
potentially useful. Multicultural festivals are often aimed at fostering better
communication and understanding among diverse groups. Management
should determine whether certain groups are under-represented at a festival
or event (Getz, 1997:262). The shift to a multicultural and diverse society in
South Africa creates many challenges and tremendous opportunities for
researchers in particular for festivals.
• Getz (1997:260) observes that most visits to festivals and events are
generated in the local or regional area.
Limitations and potential consequences include
• A limitation of the study might be the quota sample drawn from the population
since this is a scenario-based study, which only included likeminded
individuals in the region of each festival scenario. Consequently, the data
might be biased in some cases
• The current study used attendance figures of 2002 as the year 2003’s
attendance figures for all the festivals in the scenarios were not available at
the time in 2003, when the actual fieldwork was conducted.
6.5 RECOMMENDATIONS FOR FUTURE RESEARCH
• The research indicated that no large groups speaking other languages and
belonging to other cultural groups are present at the arts festival scenarios. It
is recommended that festival managements should research this market

310
segment in future, to determine why these people (whose home languages
differ from that of the respondents at the three festival scenarios) and who are
in demographic terms a large part of the total population, do not attend the
arts festivals. In view of the shift to multicultural diversity and inclusivity, it is
important to determine the needs and wants of those whose home languages
are not English or Afrikaans in relation to an arts festival held in their region.
• In terms of brand positioning, the findings of the present study are that arts
festival attendees are loyal to the brand of the festival held in their region.
Future research could attempt to identify arts festival attendees who go to all
of the three selected arts festival scenarios to determine each festival's brand
positioning. The concept of brand loyalty and equity should be researched in
more detail for each festival, as the attribute Festival brands proved significant
in the findings of the present study.
• The explorative nature of this study requires further research into the
combination of attributes that would determine the optimum market position for
an arts festival in the South African context. Research into the following issues
would provide the management of South African arts festivals with a great
deal of useful data on which to base future decisions about the festival's
market position.
• the attribute Ticket price could be researched in detailed values, for
example R75 or R100 per show to ascertain the squel curve and level
of price sensitivity;
• the attribute Music could be subdivided into various categories and
kinds of performers e.g. Jazz, Classic, Kwaito etc;
• the attribute Branding could be researched to determine brand equity
and attendee loyalty;
• the attribute Accommodation could be added to future research if a
different kind of sample is drawn from the population;

311
• the choice of attributes might differ for each arts festival and future
research could determine the attributes of each arts festival
respectively.
6.6 CONCLUSION
The contribution of the study is its focus on determining the ideal attribute package
that would drive best practices at an arts festival to make it sustainable in the long
term. This positioning strategy may serve as a guide to the marketers and
management of such festivals. To this end, a market-positioning model has been
developed specifically for arts festivals and for use by the tourism industry. The value
added is that such a model may also be applied to other business sectors in the
economy.
In terms of tourism management, the value added by the study is the finding that the
three selected hallmark arts festival scenarios each holds a strong but unique
position in the market. Therefore each of the three arts festivals can continue
operating in the same way. However, if the management of these arts festivals want
to optimise their position in the market, the attribute Quality music should receive
more attention, either by offering mixed genres or a single genre, for example many
different kinds of music, or only jazz.
The arts festivals should stage shows with the top performers and musicians in the
particular field. These performers, such as well-established golden oldies as well as
new up-and-coming musicians, should be auditioned and screened before being
allowed to perform. The venues where performances are held, including sound and
lightning, should be approved in advance. The findings further indicate that the
attributes Transport, Food and beverages and Ticket prices were of slightly lesser
importance to the respondents, and that the attribute Entertainment offered at the
festival was rated highest. This finding could also add value to the existing body of
knowledge on arts festivals in South Africa.

312
The organisers or management of arts festivals can now decide whether to
implement the recommendations on attributes or to focus more on the optimum
positioning of a festival in the attendees' minds.
Festival organisers could realign the festival’s position in the market either by
marketing the attributes that the respondents valued as most important or by
reducing the inhibitors preventing them from attending the festival. Changing an
existing position is not recommended to the festival management and organisers,
since the findings of the study indicate that each of the three festivals has unique
characteristics and a sound market positioning in certain niche markets.
There are two main arguments, taking into account the information about the
optimum market position for each festival. One is that the festivals could change their
identity and language focus to offer an inclusive festival, catering for the cultural and
language diversity in the market, which would mean abandoning the unique niche
each festival has. The second is that the festivals should continue to focus on the
language and culture they currently offer in their respective markets, in other words
the festivals should retain their present focus on a particular culture and language, as
this perception is currently established in the attendees’ minds.
It is recommended that each of the three arts festivals studied should retain its
unique characteristics and the position it occupies in the minds of attendees. The two
newcomers, namely Festivals A and C – the mainly Afrikaans language and culture
festivals – cater for a specific niche market with a unique “folk festival” perception in
customer’s minds. Attendees perceive Festival B as a mainly English language,
highbrow, novel, discerning arts connoisseurs' festival. These festivals therefore
differ significantly in their market positioning.
313
Based on the findings of the study and the market-positioning model, it is therefore
recommended that each festival should continue operating as it currently does and
retain the niche it currently has in the market. There is a danger that changing a
workable and successful market position may make a festival unsustainable. For
example, changing a festival to make it too general and inclusive could make it lose
its character, causing it to fail to attract audiences. The market positioning of the arts
festivals indicates that each of the three selected arts festivals has a unique niche in
the market. The final assumption is that the management of each festival should
continiously identify the unique selling proposition (USP) that will most likely position
them favourably against its perceived competitors and ensure sustainability.

314
LIST OF REFERENCES
Aaker, D.A. 1991 in Pride, W.M. & Ferrell, O.C. 2003. Marketing: Concepts and
Strategies, 12th edn. Boston, MA: Houghton Mifflin Company.
Aaker, D.A. & Shansby, J.G. 1982. Positioning your product. Business Horizons,
May-June:56-61.
Aardklop National Arts Festival Impact Study, 2001. Festival statistics. [Online]
Available:http://www.aardklop.co.za/Impakstudie%2002.html
[Accessed: 2002-02-25].
Aardklop National Arts Festival Impact Study. 2002. Festival statistics. [Online]
Available:http://www.aardklop.co.za/Impakstudie%202002.html
[Accessed: 2003-04-19].
Ahmed, Z.U. 1991 The influence of the components of a state's tourist image on
product positioning strategy. Tourism Management, 1991, 12(4):331-340.
Alford, P. 1998. Positioning the destination product – can regional tourist boards
learn from private sector practice? Journal of Travel & Tourism Marketing, 1998,
7(2):53-68.
Allen, J. Harris, R., Jago, L.K. & Veal, A.J. 2000, in Events beyond 2000: Setting the
agenda. Proceedings of conference on event evaluation, research and education,
Sydney, July 2000. Australian Centre for Event Management, University of
Technology: Sydney.
Allen, J., O'Toole, W., McDonnell, I. & Harris, R. 2002. Festival and special event
management. 2nd edn. Australia: John Wiley.

315
Andreu, L., Bigne, J.E. & Cooper, C. 2000. Projected perceived image of Spain as a
tourist destination for British travellers. Journal of Travel & Tourism Marketing, 2000,
9(4):47-67.
Arabie, P., Douglas, C.J., DeSarbo, W. & Wind, J. 1981. Overlapping clustering: A
new method for product positioning. Journal of Marketing Research, copyright 2001,
xviii:310-317.
Arcodia, C. & Robb, A. 2000. A future for event management: A taxonomy of event
management terms, in J. Allen., R. Harris, L.K. Jago & A.J. Veal (eds.). Events
Beyond 2000: setting the agenda. Proceedings of conference on event evaluation,
research and education, Sydney, July 2000. Australian Centre for Event
Management, University of Technology: Sydney.
Armstrong, G. & Kotler, P. 2003. Marketing: an introduction. 6th edn. Upper Saddle
River, New Jersey: Pearson Prentice-Hall.
Armstrong, G. & Kotler, P. 2005. Marketing: an introduction. 7th edn. Upper Saddle
River, New Jersey: Pearson Prentice-Hall.
Arnott, D. 1992. Bases of financial services, positioning. Unpublished Ph.D. Thesis,
Manchester Business School, University of Manchester, United Kingdom.
Arnott, D. 1993. Positioning: Redefining the concept. Warwick Business School
Research Paper, 1993, no. 81, (March).
Ashworth, G.J. & Voogd, H. 1994. Marketing of tourism places: what are we doing?
Journal of International Consumer Marketing, 6(3/4):5-19.
Assael, H. 2004. Consumer behaviour: A strategic approach. Boston: Houghton
Mifflin Company.
316
Backman, K.F., Backman, S.J., Uysal, M. & Sunshine, K.M. 1995. Event tourism: an
examination of motivations and activities. Festival Management & Event Tourism,
3:15-24.
Baker, M.J. 1992. Marketing strategy and management. 2nd edn. London: Macmillan.
Baker, M.J. 2003. The marketing book. 5th edn. Oxford: Butterworth Heinemann.
Baloglu, S. & Brinberg, D. 1997. Affective images of tourism destinations. Journal of
Travel Research, 36:11-15.
Baloglu, S. & McCleary, K.W. 1999 U.S. International pleasure travellers' images of
four Mediterranean destinations: A comparison of visitors and non-visitors. Journal of
Travel Research, 38:144-152.
Barich, H. & Kotler, P. 1991. A framework for marketing image management. Sloan
Management Review, 32(2):94-104.
Bhat, S. & Reddy, S.K. 1998. Symbolic and functional positioning of brands. Journal
of Consumer Marketing, 15(1):32-43.
Bennett, J.A. & Strydom, J.W. 2001. Introduction to travel and tourism marketing.
Lansdowne, SA: JUTA.
Benzérci, J.P. 1973. L' Analyse des Donnees, vol. II. L' Analyses des
Correspondences. Paris: Dunod.
Bonn, M.A. & Brand, R.R. 1995. Identifying market potential: the application of brand
development indexing to pleasure travel. Journal of Travel Research, 34(2):31-35.
Botha, C. 1998. The efficacy of tourist destination positioning model. Unpublished
doctoral thesis. Potchefstroom: Potchefstroom University for CHE.

317
Botha, C. 2002. Applying benefit segmentation in a frequent guest programme to
increase member retention. Unpublished MBA management report. Pretoria:
University of Pretoria.
Botha, C., Crompton, J.L. & Kim, S. 1999 Developing a revised competitive position
for Sun/Lost City, South Africa. Journal of Travel Research, 37:341-352.
Bowdin, G.A.J., McDonnell, I., Allen J. & O'Toole, W. 2001. Events Management.
Oxford: Butterworth Heinemann.
Bowen, J.T. 1998. Market segmentation in hospitality research: no longer a
sequential process. International Journal of Contemporary Hospitality Management,
10(7):289-296.
Boyd, H.W. Jr & Walker, O.C. Jr. 1990. Marketing management: A strategic
approach. Homewood, IL: Irwin.
Bramwell, B. & Rawding, L. 1996. Tourism marketing images of industrial cities.
Annals of Tourism Research, 23(1):201-221.
Buhalis, D. 2001. The tourism phenomenon – the new tourist and consumer, in S.
Wahab & C. Cooper (eds.). Tourism in the age of globalisation. London & New York:
Routledge.
Burger, K. 2003. KKNK moet nou koers kies. Beeld, Plus, 9 April:3.
Burkart, A.J. & Medlik, S.W. 1981. Tourism: Past, present and future, 2nd edn.
London: Heinemann.
Burke, J.F. & Resnick, B.P. 1991. Marketing and selling the travel product.
Cincinnati: South Western.

318
Burnett, J.J. 1993. Promotion management. Boston: Houghton Muffin.
Calantone, R.J. & Mazanec, J.A. 1991. Marketing management and tourism. Annals
of Tourism Research, 18:101-119.
Calantone, R.J., Di Benedetto, I., Hakam, A. & Bojanic, B.C. 1990. Multiple multi-
national tourism positioning using correspondence analysis. Journal of Travel
Research, 28:25-32.
Carmichael, B. 1992. Using conjoint modelling to measure tourist image and analyse
ski -resort choice, in P. Johnson & B. Thomas (eds.). Choice and demand in tourism.
Singapore: Mansell.
Chacko, H.E. 1997. Positioning a tourism destination to gain a competitive edge.
[Online] Available: http://www.hotel-
online.com/Neo/Trends/AsiaPacificJournal?PositionDestination.html [Accessed:
2003-05-28].
Chacko, H.E. & Fenich, G. 2000. Determining the importance of US convention
destination attributes. Journal of Vacation Marketing, 6(3):211-225.
Chang, T.C., Milne, S., Fallon, D. & Pohlmann, C. 1996. Urban heritage tourism: the
global-local nexus. Annals of Tourism Research, 23(2):284-305.
Chen, J.S. & Uysal, M. 2002. Market positioning analysis: a hybrid approach. Annals
of Tourism Research, 29(4):987-1003.
Churchill, G.A. Jr. & Brown, T.J. 2004. Basic marketing research. 5th edn. Australia:
Thomson Corporation, South-Western Publishing.

319
Churchill, G.A. & Iacobucci, D. 2002. Marketing research: methodological
foundations. 8th edn. London: Harcourt.
Churchill, G.A. & Peter, J.P. 1995. Marketing: creating value for customers. Burr
Ridge, Illinois: Irwin, Austen Press.
Clark, M.A., Riley, M.J., Wilkie, E. & Wood, R.C. 2000. Researching and writing
dissertations in hospitality and tourism. Australia: Thomson Learning.
Collins English Dictionary.1998. 4th edn. S.v. “event”. Glasgow, United Kingdom:
Harper Collins.
Conjoint Value Analysis (CVA), SawtoothSoftware. 1996. CVA: a full-profile conjoint
system from SawtoothSoftware, Version 2. Washington, USA: SawtoothSoftware.
Connell, J. 1994. Repositioning Forte Hotels Portfolio. English Tourist Board Insights,
London:C43-51.
Consulta Research Company. 2003. Brainstorming session Schreuder, A.N, Botha,
C. & Van Zyl, C. Burnett Street, Hatfield, Pretoria, South Africa
Cooper, C., Fletcher, J., Gilbert, D. & Wanhill, S. 1998. Tourism: Principles and
practices. 2nd edn. New York: Addison Wesley Longman.
Cooper, D.R. & Schindler, P.S. 2003. Business research methods. 8th edn. Boston,
Burr Ridge, Illinois: McGraw-Hill Irwin.
Cooper, D.R. & Emory, C.W. 1995. Business research methods. 5th edn. Chicago:
Irwin.
Cousins, B. & Kepe, T. 2004. Decentralisation when land and resource rights are
deeply contested: A case study of the Mkambati eco-tourism project on the Wild
320
Coast of South Africa. European Journal of Development Research, 16(1):41-54.
Cowell, D. 1984. The marketing of services. London: Heinemann.
Crompton, J.L. 1979. Motives for pleasure vacation. Annals of Tourism Research,
6(4):408-424.
Crompton, J.L. 1992. Structure of vacation destination choice sets. Annals of Travel
Research, 19(3):420-432.
Crompton, J.L. ([email protected]) 2003. Discussion of arts festival research.
[E-mail to:] Botha, C. ([email protected]) 9 March 2003.
Crompton, J.L., Fakeye, P.C. & Lue, C. 1992. Positioning: the example of the Lower
Rio Grande Valley in the winter long stay destination market. Journal of Travel
Research, 31:20-25.
Crompton, J.L. & Love, L.L. 1995. The predictive validity of alternative approaches to
evaluating quality of a festival. Journal of Travel Research, 34(1):11-24.
Crompton, J.L. & McKay, S.L. 1997. Motives of visitors attending festival events.
Annals of Tourism Research, 24(2):425-439.
Dagmar Recklies, 2001. Positioning as a strategic marketing decision. , Recklies
Management Project GmbH:1-4. [Online] Available:http://themanager.org [Accessed:
2003-07-06].
Derrett, R. 2000. Can festivals brand community cultural development and cultural
tourism simultaneously? in J. Allen, R. Harris, L.K. Jago, & A.J. Veal (eds.). Events
beyond 2000: setting the agenda. Proceedings of conference on event evaluation,
research and education Sydney, July Australian Centre for Event Management,
University of Technology: Sydney.

321
Derrett, R. 2001. Special interest tourism: Starting with the individual, in N. Douglas,
N., Douglas & R. Derrett (eds.). Special interest tourism: Context and cases.
Brisbane: John Wiley.
Dev, C.S., Morgan, M.S. & Shoemaker, S. 1995. A positioning analysis of hotel
brands. Cornell Hotel & Restaurant Administration Quarterly, 36(6):48-55.
Diamantopoulos, A. & Schlegelmilch, B. 2000. Taking the fear out of data analysis: A
step-by-step approach. Australia: Business Press Thomson Learning.
Dibb, S. & Simkin, L. 1996. The marketing segmentation workbook: target marketing
for marketing managers. London: Routledge.
Dibb, S., Simkin, L., Pride, W.M. & Ferrell, O.C. 2001. Marketing: concepts and
strategies. 4th European edn. Boston: Houghton-Mifflin.
Dickman, S. 1999, 2003. Tourism & hospitality marketing. Oxford: University Press.
Dictionary of marketing terms, 1995. 2nd edn. P.D. Bennett (ed.). Chicago: American
Marketing Association.
Dillon, W.R., Domzal, T. & Madden, T.J. 1986. Evaluating alternative product
positioning strategies. Journal of Advertising:29-35.
DiMingo, E. 1988. The fine art of positioning: There is more to positioning than clever
slogans and slick ad campaigns. The Journal of Business Strategy, 9(2):34-38.
Dimmock, K. & Tiyce, M. 2001. Festivals and events: Celebrating special interest
tourism, in N. Douglas, N. Douglas, & R. Derrett (eds.). Special interest tourism:
Context and cases. Brisbane: John Wiley.

322
Dornbusch, R. & Fischer, S. 1987. 1995. Macroeconomics. South African adaptation
by P. Mohr & C. Rogers. Johannesburg: Lexicon.
Douglas, N. & Douglas, N. 2001. The cruise experience, in N. Douglas, N. Douglas,
& R. Derrett (eds.). Special interest tourism: Context and cases. Brisbane: John
Wiley.
Douglas, N., Douglas, N. & Derrett, R. 2001. Special interest tourism: context and
cases. Brisbane: John Wiley.
Dowling, R. 2001. Environmental tourism, in N. Douglas, N. Douglas, & R. Derrett
(eds.). Special interest tourism: Context and cases. Brisbane: John Wiley.
Driscoll, A. & Lawson, R. 1990. New Zealand's position as a destination for New
Zealanders: a multidimensional scaling approach. New Zealand Journal of Business,
12:105-118.
Drucker, P.F. 1973. Management: Tasks, responsibility, practices. New York: Harper
& Row.
Drucker, P.F. 1999. The practice of management. London: Heinemann.
Duncan, T. 2002. IMC: Using advertising and promotion to build brands. Boston:
McGraw-Hill Irwin.
Dunstan, G. 1994. Becoming coastwise: The path of festivals and cultural tourism.
Unpublished paper prepared for the Coastwise Project – landscape and lifestyle
choices for the Northern Rivers Region of NSW. Lismore: Southern Cross University.
Eatwell, J., Milgate, M. & Newman, P. 1987. The New Palgrave: A Dictionary of
Economics. London, United Kingdom: Macmillan Press.

323
Echtner, C.M. & Ritchie, J.R.B. 1993. The measurement of destination image: an
empirical assessment. Journal of Travel Research, 1:3-13.
Ennis, F.B. 1982. Advertising Age, 53(11).
Epperson, A.F. 1986. Private and commercial recreation. State College, PA: Venture.
Evans, E. 2003. Market segmentation, in M. J. Baker (ed.). The marketing book. 5th
edn. Oxford: Butterworth Heinemann.
Evans, N., Campbell, N. & Stonehouse, G.. 2003. Strategic management for travel
and tourism. Amsterdam: Butterworth-Heinemann.
Falassi, A. 1987. Time out of time: Essays on the festival. Albuquerque: University of
New Mexico press.
Fenton, M. & Pearce, P. 1988. Multidimensional scaling and tourism research.
Annals of Tourism Research, 15:236-54.
Fodness, D. & Milner, L.M. 1992. A perceptual mapping approach to theme park
visitor segmentation. Tourism Management, 13(1):95-101.
Fodness, D. 1990. Consumer perceptions of tourist attractions. Journal of Travel
Research, 28(4):3-9.
Font, X. 1997. Managing a tourist destination. Journal of Vacation Marketing,
3(2):123-131.
Formica, S. 1998. The development of festivals and special event studies. Festival
Management & Event Tourism, 5:131-137.
324
Funkhouser, G.R. 1983. A note on the reliability of certain clustering algorithms.
Journal of Marketing Research, 30:99-102.
George, R. 2004. Marketing South African tourism. 2nd edn. Cape Town: Oxford
University Press.
Getz, D. & Frisby, W. 1989. Festival management: a case study perspective. Journal
of travel Research, :7-11.
Getz, D. 1991. Festivals, special events and tourism. New York: Van Nostrand
Reinhold.
Getz, D. 1993. Corporate culture in not-for-profit festival organisation: concepts and
potential applications. Festival Management & Event Tourism, 1:11-17.
Getz, D. 1997. Event management & event tourism. New York: Cognizant
Communication Corporation.
Getz, D. 1998. Information sharing among festival managers. Festival Management
& Event Tourism, 5(1/2):33-50.
Getz, D. 2000a cited in W. Gartner & D. Lime. Festivals and special events: Life-
cycle and saturation issues, in W. Gartner & D. Lime (eds.). Trends in outdoor
recreation, leisure and tourism. Wallingford, UK: CAB International.
Getz, D. 2000b. Developing a research agenda for the event management field, in J.
Allen, R. Harris, L. K. Jago & A. J. Veal (eds.). Events beyond 2000: setting the
agenda. Proceedings of conference on event evaluation, research and education
Sydney, July 2000. Australian Centre for Event Management, University of
Technology: Sydney.
Getz, D. 2000c. Defining the field of event management. Event Management, 6:1-3.

325
Getz, D. cited in J. Jafari 2000d. Event, in J. Jafari (ed.). Encyclopaedia of tourism.
London: Routledge.
Getz, D. cited in A. Pizam 2005. Festivals, in A. Pizam (ed.). International
Encyclopedia of hospitality management. Amsterdam: Butterworth Heinemann.
Gitelson, R. & Kerstetter, D. 2000. A new perspective on the decision-making
process of arts festivals, in J. Allen, R. Harris, L.K. Jago & A.J. Veal (eds.). Events
beyond 2000:Setting the agenda. Proceedings of conference on event evaluation,
research and education Sydney, July 2000. Australian Centre for Event
Management, University of Technology: Sydney.
Goeldner, C.R. & Ritchie, J.R.B. 2003. Tourism: principles, practices, philosophies.
9th edn. New York: John Wiley.
Goeldner, C.R., Ritchie, J.R.B. & McIntosh, R.W. 2000. Tourism: Principles,
practices, philosophies. 8th edn. New York: John Wiley.
Goldblatt, J. 2000. A future for event management: the analysis of major trends
impacting the emerging profession, in J. Allen, R. Harris, L.K. Jago & A.J. Veal (eds.).
Events beyond 2000: setting the agenda. Proceedings of conference on event
evaluation, research and education Sydney, July 2000. Australian Centre for Event
Management, University of Technology: Sydney.
Goldblatt, J. 2002. Special events: twenty-first century global event management.
New York: John Wiley.
Goodall, B. 1988. Changing patterns and structure of European tourism, in B.
Goodwall & G.H. Ashworth (eds.). Marketing in the tourism industry: The promotion
of destination regions. London: Routledge.
326
Goossens, C. 2000. Tourism information and pleasure motivation. Annals of Tourism
Research, 27(2):301-321.
Government Gazette of South Africa, 2001. Arts and culture. [Online]
Available:http://www.gov.za/yearbook/2001/arts.html [Accessed: 2002-02-25].
Grabler, K. 1997. Perceptual mapping and positioning of tourist cities, in K. Grabler &
J.A. Mazanec (eds.). International city tourism: Analysis and strategy. London:
Washington: Pinter.
Grant Thornton Kessel Feinstein, 1998. Tourism Talk Southern Africa: A bulletin on
tourism and its allied industries. Johannesburg, South Africa: Authorised distributors
of all publications of the WTO in Southern Africa.
Grant Thornton Kessel Feinstein. 2002. The Journal of South African Tourism,
2(2):42-47.
Grant, D. & Paliwoda, S. 1998. Segmenting Alberta arts and festival consumers.
Festival Management & Event Tourism, 5:207-220.
Green, P.E. 1975. Marketing applications of MDS: assessment and outlook. Journal
of Marketing, 39:24-32.
Green, P.E. & Srinivasan, V. 1990. Conjoint analysis in marketing: new
developments with implications for research practice. Journal of Marketing, 54(4):3-
19.
Green, P.E., Tull, D.S. & Albaum, G. 1988. Research for marketing decisions. 5th
edn. London: Prentice Hall International.
Greenacre, M.J. 1984. Theory and applications of correspondence analyses.
London: Academic Press.
327
Haahti, A.J. 1986. Finland's competitive position as a destination. Annals of Tourism
Research, 13:11-35.
Hair, J.F., Jr., Anderson, R.E., Tatham, R.L. & Black, W.C. 1998. Multivariate data
analysis, 5th edn. Upper Saddle River, New Jersey: Prentice Hall.
Hair. J.F., JR., Bush, R.P. & Ortinau, D.J. 2000. Marketing research: A practical
approach for the new Millennium. Boston: Irwin/McGraw-Hill.
Hall, C.M. 1992. Hallmark tourist events: Impacts, management and planning.
London: Belhaven Press.
Hall, C.M. & Mitchell, R. 2001. Wine and food tourism, in N. Douglas, N. Douglas &
R. Derrett (eds.). Special interest tourism: Context and cases. Brisbane: John Wiley.
Handy, C.B. 1996. Beyond certainty: the changing worlds of organisations. London:
Arrow Business.
Harris, M. 1988. Economical positioning. Cornell Hotel & Restaurant Administration
Quarterly, 29(2):97.
Hauptfleisch, T. 2001. The eventification of Afrikaans culture - Some thoughts on the
Klein Karoo Nasionale Kunstefees (KKNK). South African Theatre Journal, 15:169-
177.
Heskett, J.L. 1984. Managing in the service economy. Boston: Harvard Business
School Press.
Herbig, P. & Milewicz, J. 1993. The relationship of reputation and credibility to brand
success. Journal of Consumer Marketing, 10(3):18-24.
328
Herbst, F.J. & Schreuder, A.N. 1999. The influence of marketing effectiveness on
building long term relationships in a sports environment. South African Journal of
Economic & Management Sciences, 2(1):34-53.
Holloway, J.C. 2004. Marketing for tourism. 4th edn. New York: Financial
Times/Prentice Hall.
Hooley, G., Saunders, J. & Piercy, N.F. 1998. Marketing strategy and competitive
positioning. 2nd edn. Hemel, Hempstead: Prentice-Hall.
Horsky, D. & Nelson, P. 1992. New brand positioning and pricing in an oligopolistic
market. Marketing Science, 11(2):133.
Hoyle, L.H. 2002. Event marketing: How to successfully promote events, festivals,
conventions, and expositions. New York: John Wiley.
Huan, T., Beaman, J. & Shelby, L.B. 2002. Using action-grids in tourism
management. Tourism Management, 23:255-264.
Hughes, H. 2000. Arts, entertainment and tourism. Oxford: Butterworth-Heinemann.
Hughes, H. 2003. Personal communication with the author on 9 March at IFEA
Europe Conference: Vienna, Austria. Professor of Tourism Management: Manchester
Metropolitan University.
Jago, L.K. & Shaw, R.N. 1998. Special events: A conceptual and definitional
framework. Festival Management & Event Tourism, 5(1/2):21-33.
Janiskee, R.L. 1994. Some macro-scale growth trends in America's community
festival industry. Festival Management & Event tourism, 2(1):10-14.

329
Janiskee, R.L. 1996. Historic houses and special events. Annals of Tourism
Research, 23(2):398-414.
Jeffrey, D. & Xie, Y. 1995. The UK market for tourism in China. Annals of Tourism
Research, 22:857-876.
Jobber, D. 2004. Principles and practice of marketing. 4th edn. London: McGraw-Hill
Companies.
Kakaza, L. 2000. A feast of festivals. Arts 2000: The arts, culture and heritage guide
to South Africa:6-8.
Kalafatis, S.P., Tsogas, M.H. & Blankson, C. 2000. Positioning strategies in business
markets. Journal of Business & Industrial Marketing, 15(6):416-437.
Kay, P. 2004. Cross-cultural research issues in developing international tourist
markets for cultural events. Event Management, 8(4):191-202.
Kim, H. 1996. Perceptual mapping of attributes and preferences: an empirical
examination of hotel F&B products in Korea. International Journal of Hospitality
Management, 15(4,):373-391.
Kim, K., Uysal, M. & Chen, J.S. 2002. Festival visitor motivation from the organizers'
point of view. Event Management, 7:127-134.
Kotler, P. 1991. Marketing management: analysis, planning, implementation, &
control. 7th edn. Upper Saddle River, HJ: Prentice Hall.
Kotler, P. 2000. Marketing management, the Millennium edition. 10th edn. Upper
Saddle River, New Jersey: Prentice-Hall.

330
Kotler, P. 2003. Marketing management. 11th edn. Upper Saddle River, New Jersey:
Pearson Education International.
Kotler, P. 2004. Fall from grace path to recovery: marketing mistakes are common;
don't let them kill your brand. Brandweek, 45(17):24-30.
Kotler, P. & Armstrong, G. 2004. Principles of marketing. 10th international edn.
Upper Saddle River, New Jersey: Pearson/Prentice-Hall.
Kotler, P., Bowen, J. & Makens, J. 1996, 1999. Marketing for hospitality and tourism.
2nd edn. Upper Saddle River, New Jersey: Prentice-Hall.
Kotler, P., Bowen, J. & Makens, J. 2003. Marketing for hospitality and tourism. 3rd
edn. Upper Saddle River, New Jersey: Prentice-Hall.
Krejcie, R.V. & Morgan, D.W. 1970. Determining sample size for research activities.
Educational and Psychological Measurement, 30:607-610.
Krieger, A.M., Green, P.E. & Wind, Y.J. 2004. Adventures in Conjoint Analysis: A
practitioner's guide to trade-off modelling and applications. (Unpublished notes for
the book). Wharton School, University of Pennsylvania: Philadelphia.
Lamb, C.W., Hair, J.F., McDaniel, C., Boshoff, C. & Terblanche, N.S. 2004.
Marketing. 2nd South African edn. Cape Town: Oxford University Press.
Laws, E. 2002. Tourism marketing: Quality and service management perspectives.
London: Continuum.
Lee, C., Lee, Y. & Wicks, B.E. 2004. Segmentation of festival motivation by
nationality and satisfaction. Tourism Management, 25:61-70.

331
Leisen, B. Image segmentation: the case of a tourism destination. Journal of
Services Marketing, 15(1):49-66.
Lewis, R.C. & Chambers, R.E. 2000. Marketing leadership in hospitality: Foundations
and practices. 3rd edn. New York: John Wiley.
Lewis, R.C. 1981. The positioning statement for hotels. Cornell Hotel & Restaurant
Administration Quarterly, 22(1):51-61.
Lewis, R.C. 1982. Positioning analysis for hospitality firms. Hospitality Management,
1(2):115-118.
Lewis, R.C. 1984. Isolating differences in hotel attributes. The Cornell Hotel &
Restaurant, Administration Quarterly, 25:64-77.
Lewis, R.C. 1985a. The market position: Mapping guests' perceptions of hotel
operations. Cornell Hotel & Restaurant Administration Quarterly, 26(2):93.
Lewis, R.C. 1985b. Predicting hotel choice: the factors underlying perception. Cornell
Hotel & Restaurant Administration Quarterly, 25(4):88-89.
Lewis, R.C. 1990. Advertising your hotel's position. Cornell Hotel & Restaurant
Administration Quarterly, 31(2):84-91.
Lickorish, L.J. & Jenkins, C.L. 1997. An introduction to tourism. Oxford: Butterworth-
Heinemann.
Lovelock, C., Vandermerwe, S. & Lewis, B. 1990, 1999. Services marketing: A
European perspective. London: Prentice Hall Europe.
Lovelock, C.H. 1984. Services marketing. Englewood Cliffs, New Jersey: Prentice-
Hall.
332
Lovelock, C.H. 1991. Services marketing. 2nd edn. London: Prentice-Hall
International.
Lovelock, C.H. 2003. Services marketing. 5th edn. London: Prentice-Hall
International.
Lovelock, C.H. & Wirtz, J. 2004. Services marketing: people. Technology, strategy.
5th international edn. Upper Saddle River, NJ: Pearson Prentice-Hall.
Lumsdon, L. 1997. (reprinted 1999, 2000). Tourism marketing. London: International
Thomson Business Press.
Lynch, J. 1994. "What is marketing?", in N. Hart (ed.). Effective industrial marketing,
London: Kogan Page.
Making it happen: The Cultural and Entertainment Industries Handbook, 1997.
Centre for Professional Development. Kew, Victoria: Australia.
Malan, P. 2003. Uiteindelik die Boere-Nobel en 'n groot ”kick”. Rapport, 6 April:21.
Malhotra, N.K. 2004. Marketing research: An applied orientation. 4th edn. Upper
Saddle River, New Jersey: Pearson/Prentice Hall.
Manning, F.E. 1983. Cosmos and chaos: Celebration in the modern world, in: F.E.
Manning, (ed.). The celebration of society: perspectives on contemporary cultural
performance. Bowling Green: Bowling Green University Popular Press.
Manrai, L.A. & Manrai, A.K. 1993. Positioning European countries as brands in a
perceptual map: An empirical study of determinants of consumer perceptions and
preferences. Journal of Euromarketing, 2(3):101-129.
333
Mansfield, E. & Yohe, G. 2004. Micro economics: Theory/applications. 11th edn. New
York: W.W. Norton.
Mansfield, E. 1993/2000/2003. Microeconomics: Theory/applications. 9th, 10th, 11th
edn. New York: W.W. Norton.
Market Vision Research. 2002. Conjoint analysis. [Online] Available:http://www.mv-
research.com/pdf/Intro%20to%20Conjoint%202002.pdf [Accessed: 2004-11-20].
Martins, J.H. 1998. Income and expenditure patterns of households in the Cape
Peninsula. Bureau of Market Research, no. 250. Pretoria: University of South Africa
Press.
Martins, J.H., Loubser, M. & Van Wyk, H de J. 1996. Marketing research: A South
African approach. Pretoria, South Africa: University of South Africa Press.
Marx, M. 2003. Sports tourism a winner all the way: niche markets. The Journal of
Southern African Tourism, March.
Maslow, cited in G. Armstrong & P. Kotler. 2003. Marketing: An introduction. 6th edn.
Upper Saddle River, New Jersey: Prentice-Hall.
Mayfield, T.L. & Crompton, J.L. 1995. The status of the marketing concept among
festival organizers. Journal of Travel Research, 33(4):14-22.
Mazanec, J.A. 1995. Positioning analysis with self-organizing maps. Cornell Hotel &
Restaurant Administration Quarterly, 27(1):80-87.
Mazanec, J.A. 1999. Simultaneous positioning and segmentation analysis with
topologically ordered feature maps: a tour operator example. Journal of Retailing &
Consumer Services, 6(4):219-235.

334
McCain, R.A. 1997. Game theory: An introductory sketch. [Online] Available:
http://william-king.www.drexel.edu/top/eco/game/intro.html [Accessed: 2005-03-17].
McCleary, K.W. 1995. Applying international marketing techniques for better festival
organization and management. Festival Management & Event Tourism, 3:1-7.
McDaniel, C. & Gates, R. 2001. Marketing research essentials. 3rd edn. Australia:
South-Western College.
McDaniel, C. & Gates, R. 2004. Marketing research essentials. 4th edn. New Jersey,
USA: John Wiley.
McDonnell, I., Allen, J. & O'Toole, W. 1999. Festival and special event management.
Brisbane, Australia: John Wiley.
Middleton, V.T.C. 1988, 2001. Marketing in travel and tourism. 3rd edn. Oxford:
Butterworth-Heinemann.
Mihalik, B.J. & Ferguson, M. 1994. A case study of a tourism special event: An
analysis of an American state fair. Festival Management & Event Tourism, 2:75-83.
Mill, R.C. & Morrison, A.M. 1998, 2002. The tourism system: An introductory text. 4th
edn. Dubuque, Iowa: Kendall/Hunt Publishing Company.
Mizrahi, A. & Sullivan, M. 1993. Mathematics for business, life sciences, and social
sciences. 5th edn. New York: John Wiley.
Moore, J. 1998. Poverty and access to the arts: inequalities in arts attendance.
Cultural Trends, 31:53-73.
Morgan, M. 1996. Marketing for leisure and tourism. London: Prentice-Hall.

335
Morgan, N., & Pritchard, A. 1998. Moodmarketing: The new destination branding
strategy. Journal of Vacation Marketing, 4(3):215-229.
Morgan, N. & Pritchard, A. 2000, 2001. Advertising in tourism and leisure. Oxford:
Butterworth Heinemann.
Morpeth, N. 2001. The renaissance of cycle tourism, in N. Douglas, N. Douglas & R.
Derrett. Special interest tourism: Context and cases. Brisbane: John Wiley.
Morrison, A.M. 1989. Hospitality and travel marketing. 1st edn. Albany, New York:
Delmar Publishers.
Morrison, A.M. 2002. Hospitality and travel marketing. 3rd edn. Albany, New York:
Delmar/Thomson Learning.
Mosidi, S.M. 1996. Local rural community participation in ecotourism: The case of
Madikwe Game Park, North West Province, South Africa. Unpublished MA
dissertation: Pretoria: University of Pretoria.
Moutinho, L. 2000. Strategic management in tourism. New York: CABI Publishing.
Mullins, J.W., Walker, O.C., Boyd, H.W. & Larreche, J. 2005. Marketing
management: A strategic decision-making approach. Boston: McGraw-Hill/Irwin.
Municipal Demarcation Board, 2003. Maps and statistics. [Online] Available:
http://www.demarcation.co.za.index.info. [Accessed: 2003-05-17].
Myers, J.H. 1992. Positioning products/services in attitude space. Marketing
Research, 4(1):46-51.
National Endowment for Arts. 1999. Demographic characteristics of arts attendance.
Research Division Note #71. Washington DC: National Endowment for the Arts.
336
Neal, W.D. 1980. Strategic product positioning a step-by-step guide. Business, May-
June:34-42.
Nickerson, N.P. & Moisey, R.N. 1999. Branding a state from features to positioning:
making it simple? Journal of Vacation Marketing, 5(3):217-226.
Nieuwoudt, S. 2002. Skoolvakansie skuif nadelig, maar dit klop sterk op Potch.
Beeld, 30 September:5.
Oppewal, H. & Vriens, M. 2000. Measuring perceived service quality using integrated
conjoint experiments. The International Journal of Bank Marketing, 18(4):154-169.
Orme, B. 1998. Sample size issues for conjoint analysis studies, CVA, version 2.0, A
full-profile conjoint system, copyright SawtoothSoftware. Sequim, Washington, USA.
Available: http://www.sawtoothsoftware.com/ [Accessed: 2004-08-10].
Orth, U.R. & Tureckova, J. 2002. Positioning the destination product- Southern
Moravia. Journal of Vacation Marketing, 8(3):247-262.
O'Sullivan, D. & Jackson, M.J. 2002. Festival tourism: A contributor to sustainable
local economic development? Journal of Sustainable Tourism, 10(4):325-342.
O'Toole, W. 2005. Event project management, in A. Pizam (ed.). International
Encyclopedia of Hospitality Management. Oxford: Elsevier Butterworth-Heinemann.
Page, S.J. 2003. Tourism management: Managing for change. Oxford: Butterworth-
Heinemann.
Perdue, R. 1996. Target marketing selection and marketing strategy: the Colorado
downhill skiing industry. Journal of Travel Research, 34(4):39-46.

337
Perreault, W.D. & McCarthy, E.J. 2002. Basic marketing: A global-managerial
approach. 14th edn. Boston: McGraw-Hill/Irwin.
Plog, S.C. 1987. Understanding psychographics in tourism research, in J. Ritchie &
C. Goeldner (eds.) 1994. Travel, tourism and hospitality research. 2nd edn. New York:
Wiley.
Plog, S.C. 1991. Leisure travel: marketing it in a growth market … again! New York:
Wiley.
Poon, A. 2003. Competitive strategies for a ’new tourism', in C. Cooper (ed.). Classic
reviews in tourism. Clevedon: Channel View Publications:130-142.
Prentice, R. & Andersen, V. 2003. Festival as creative destination. Annals of Tourism
Research, 30(1):7-30.
Pride, W.M. & Ferrell, O.C. 2003. Marketing: Concepts and strategies. 12th edn.
Boston, MA: Houghton Mifflin Company.
Prince, M. 1990. How consistent is the inflation in positioning studies? Journal of
Advertising Research:25-30.
Prosser, G. 2001. Regional tourism, in N. Douglas, N. Douglas & R. Derrett (eds.).
Special interest tourism: Context and cases. Brisbane: John Wiley.
Read, S.E. 1980. A prime force in the expansion of tourism in the next decade:
Special interest travel. Tourism marketing and management issues. Washington DC:
George Washington University Press.
Reich, A.Z. 1997. Marketing management for the hospitality industry: A strategic
approach. New York: John Wiley.

338
Reich, A.Z. 1999. Positioning tourism destinations. Champaign, Illinois: Sagamore
Publishing.
Rice, I. 1997:1, cited in Schreuder, A.N. 1999. Conjoint analysis in a nutshell:
Working document. Hatfield, Pretoria: Consulta Research Management Consultants.
Richards, G. 1996. European cultural tourism: trends and future prospects, in G.
Richards (ed.). Cultural tourism in Europe. Wallingford, United Kingdom: CAB
International.
Ries, A. & Trout, J. 1981, 1982. Positioning: the battle for your mind. 1st edn. New
York: McGraw-Hill Company.
Ries, A. & Trout, J. 2001. Positioning: The battle for your mind. 20th anniversary edn.
Boston: McGraw-Hill.
Ritchie, J.R.B. 1984. Assessing the impact of hallmark events: Conceptual and
research issues. Journal of Travel Research, 23(1):2-11.
Robinson, A. & Noel, J. 1991. Research needs for festivals: a management
perspective. Journal of Applied Recreation Research, 16(1):78-88.
Robinson, M., Picard, D. & Long, P. 2004. Festival tourism: producing, translating,
and consuming expressions of culture(s). Event Management, 8(4):187-189.
Ruys, H. & Wei, S. 2001. Senior tourism, in N. Douglas, N. Douglas, & R. Derrett
(eds.). Special interest tourism: Context and cases. Brisbane: John Wiley.
Ryan, C. 2001. Sex tourism, in N. Douglas, N. Douglas, & R. Derrett (eds.). Special
interest tourism: Context and cases. Brisbane: John Wiley.
339
Saayman, M. & Uys, C. 2003. Profiling spectators at a one -day international cricket
match. Journal of Sports Tourism, 8(4):293.
Saayman, M. 2001. An introduction to sports tourism and event management.
Potchefstroom: Institute for Tourism and Leisure Studies, Potchefstroom University.
Saayman, M. 2004. Local communities benefit from art festivals. News North-West
University. [Online] Available: http://www.puk.ac.za/nuus/eng/news10.html
[Accessed: 2005-03-07].
Saayman, M. & Saayman, A. 2004. Economic impact of cultural events. South
African Journal of Economic & Management Sciences, 7(4):629-641.
Salem, G. Jones, E. & Morgan, N. 2004. An overview of events management, in I.
Yeoman, M. Robertson, J. Ali-Knight, S. Drummond & U. McMahon-Beattie (eds.).
Festival and events management: An international arts and culture perspective.
Amsterdam: Elsevier Butterworth Heinemann.
Sambidi, P.R. 2003. Factors affecting plant location decisions of U.S. broiler
executives. Unpublished thesis. Graduate Faculty of the Louisiana State University
and Agricultural. [Online] Available: http://etd02.lnx390.lsu.edu/docs/available/etd-
1114102-133418/unrestricted/CHAPTER3.pdf [Accessed: 2004-10-20].
Schewe, C.D. 1991. Strategically position your way into the aging marketplace.
Business Horizons, 34(3):59-66.
Schneider, I. & Backman, S.J. 1996. Cross-cultural equivalence in festival
motivations: a study in Jordan. Festival Management & Event Tourism, 4:139-144.
Schofield, L. 1995. Making and marketing a festival. SMARTS, 4:7-8.
340
Schreuder, A.N. 1999. Conjoint analysis in a nutshell: working document. Hatfield,
Pretoria: Consulta Research Management Consultants.
Schreuder, A.N. 2003. Personal interview. 2 April. Hatfield, Pretoria.
Scott, D. 1996. A comparison of visitors' motivations to attend three urban festivals.
Festival Management & Event Tourism, 3:121-128.
Scott, N., Parfitt, N. & Laws, E. 2002. Synergies in destination image management: a
case study and conceptualization. International Journal of Tourism Research, 4:39-
55.
Shaw, M. 1992. Positioning and price: merging theory, strategy, and tactics.
Hospitality Research Journal, 15(2):31-39.
Sheinin, D.A. 1998. Positioning brand extensions: implications for beliefs and
attitudes. Journal of Product & Brands Management, 7(2):1-12.
Shifflet, D.K. & Bhata, P. 1999. Event tourism market emerging. Hotel & Motel
Management, 214(15):26.
Shone, A. & Perry, B. 2004. Successful event management. Australia: Thomson.
Shostack, G.L. 1987. Service positioning through structural change. Journal of
Marketing, 51:34-43.
Silva, J. 1998. The change development and impact of the Grahamstown Arts
Festival, with special reference to music. Unpublished MA dissertation.
Grahamstown: Rhodes university.
Slabbert, D. 2002. Afrikaners is plesierig. Sawubona, 5(10):32-40.

341
Smith, C. & Jenner, P. 1998. The impact of festivals and special events on tourism.
Travel & Tourism Analyst, 4:73-91.
Snowball, J.D. & Antrobus, G.C. 2001. Measuring the value of the arts to society: the
importance of the value of externalities for lower income and education groups in
South Africa. The South African Journal of Economics, 69(4):752-766.
Snowball, J.D. & Antrobus, G.C. 2002. Valuing the arts: pitfalls in economic impact
studies of arts festivals. The South African Journal of Economics, 70(8):1297-1319.
Snyman, R., cited in Sawubona, 2002. Afrikaners is plesierig. Sawubona, 5(10):32-
38.
South African Tourism, 2004. 2003 Annual Tourism Report. Illovo, Johannesburg:
South African tourism.
South African Tourism. 2005. 2004 Annual Tourism Report. Illovo, Johannesburg:
South African tourism.
STATISTICA. 1984-2004. Correspondence analysis. [Online] Available:
http://www.statsoft.com/textbook/stcoran.html [Accessed: 2004-11-20].
Sudman, S. & Blair, E. 1998. Marketing research. Boston: McGraw Hill.
Swarbrooke, J. & Horner, S. 1999. Consumer behaviour in tourism. Oxford:
Butterworth: Heinemann.
Swarbrooke, J. 2002. The development and management of visitor attractions. 2nd
edn. Oxford: Butterworth-Heinemann.
342
Tapela, B.N. 2001. Community participation in natural resource management: the
case of the Makuleke community based natural resource management initiative.
Unpublished MA dissertation: Pretoria: University of Pretoria.
Tassiopoulos, D. 2000. Event management: A professional and developmental
approach. Lansdowne, Cape Town: Juta Education.
Tassiopoulos, D. 2005. Event management: A professional and developmental
approach. 2nd edn. Lansdowne, Cape Town: Juta Education.
Terre Blanche, M. & Durrheim, K. 2002. Research in practice: Applied methods for
the social sciences. Cape Town, SA: University of Cape Town Press.
Tighe, A.J. 1986. The arts-tourism partnership. Journal of Travel Research, (24):2-5.
Torkildsen, G. 1983. Leisure and recreation management. London: Spon.
Tusa, J. 1999, in H. Hughes. 2000. Arts, entertainment and tourism. Oxford:
Butterworth-Heinemann.
Tustin, D.H. 2004. Workshop research methodology: Day 2 marketing research
process (power point slides). Pretoria: Bureau of Market Research, University of
South Africa.
Tustin, D.H., Ligthelm, A.A., Martins, J.H. & van Wyk, H d J. 2005. Marketing
research in practice. Pretoria: University of South Africa Press.
Uysal, M. Chen, J.S. & Williams, P.R. 2000. Increasing state market share through a
regional positioning. Tourism Management, 21(1):89-96.
Uysal, M., Gahan, L. & Martin, B. 1993. An examination of event motivations: a case
study. Festival Management & Event Tourism, 1:5-10.
343
Uzzell, D., cited in Janiskee, R.L. 1994. Some macro-scale growth trends in
America's community festival industry. Festival Management & Event Tourism,
2(1):10-14.
Van der Wagen, L. 2001. Event management for tourism cultural, business and
sporting events. Sydney, Australia: Pearson Hospitality Press.
Van Gessel, P. 2003. Opening address at IFEA Europe Conference, Vienna 7 March.
Netherlands Board of Tourism, Chairman of IFEA Europe.
Van Harssel, J. 1994. Tourism: an exploration. 3rd edn. London: Prentice Hall Career
& Technology.
Van Heerden, A. 2002. Economic impact of the Aardklop National Arts Festival.
Unpublished Masters dissertation: Potchefstroom: Potchefstroom University for
Christian Higher Education.
Van Niekerk, M. & Saayman, M. 2004. Profile and economic impact of Innibos-
Lowveld National Arts Festival. Tshwane University of Technology, Mpumalanga
Campus and Potchefstroom Institute for tourism and leisure studies, Potchefstroom
University.
Van Zyl, C. & Botha, C. 2004. Motivational factors of local residents to attend the
Aardklop National Arts Festival. Event Management, 8(4):213-222.
Van Zyl, C. 2002. The participation of the host community in the Aardklop National
Arts Festival. Unpublished M. Phil dissertation: University of Pretoria.
Van Zyl, G. 2003. Qualitative interview: personal communication. 9 April. Pretoria.
Executive Director of the Aardklop National Arts Festival.

344
Veal, A.J. 1997. Research methods for leisure and tourism: A practical guide. 2nd
edn. London: Financial Times Pitman Publishing.
Vellas, F. & Becherel, L. 1999. The international marketing of travel and tourism: A
strategic approach. London: MacMillan Press.
Von Neumann, J. & Morgenstern, O. 1947, cited in R.Y. Awh. 1976. Microeconomics:
theory and applications. New York: John Wiley.
Walker, J.R. 2004. Introduction to hospitality management. Upper Saddle River, New
Jersey: Pearson/Prentice-Hall.
Walmsley, D.J. & Young, M. 1998. Evaluative images and tourism: the use of
personal constructs to describe the structure of destination images. Journal of Travel
Research, 36(3):65-69.
Waterman, S. 1998. Carnivals? For elites? The cultural politics of arts festivals.
Progress in Human Geography, 22(1):55-74.
Watt, D.C. 1998 (third impression 2001). Event management in leisure and tourism.
Essex, England: Addison Wesley Longman.
Weed, M. & Bull, C. 2004. Sports tourism: participants, policy and providers.
Amsterdam: Elsevier Butterworth-Heinemann.
Weekend Post. 2002. 102 000 flocked to fun, culture at 2002 Festival. Weekend
Post, 13 July: 2.
Weiler, B. & Hall, C.M. 1992. What is special about special interest tourism?, in: B.
Weiler & C. M. Hall. Special interest tourism. New York: Halsted Press.
Wicks, B. 1995. Celebrating festivals of the future. Trends, 20(2):12-19.
345
Wicks, B.E. & Fesenmaier, D.R. 1993. A comparison of visitor quality and vendor
perceptions of service quality at a special event. Festival Management & Event
Tourism, 1:19-26.
Wilkes, R.E. 1977. Product positioning by multidimensional scaling. Journal of
Advertising Research, 17(4):15-19.
Williams, V.E. 1997. The economic impact of the arts: a case study of the wealth and
employment attendant on the Grahamstown National Arts Festival. Unpublished M.
Com dissertation: Rhodes University, Grahamstown.
Wilson, J. & Udall, L. 1982. Folk festivals: a handbook for organisation and
management. Knoxville: University of Tennessee press.
Wind, Y. & Robinson, P.J. 1972. Product positioning: an application of
multidimensional scaling. Attitude Research in Transition:155-175.
Witepski, L. 2002. Tourism - Festivals: The show must go on. The Journal of
Southern African Tourism, 2(2):52-53.
Witt, S.F. & Moutinho, L. 1994. Tourism marketing and management handbook. 2nd
edn. New York: Prentice Hall.
Wittink, D.R., Krishnamurthi, L. & Reibstein, D.J., 1989. The effect of differences in
the number of attribute levels in conjoint results. Marketing Letters, 1(2):113-123.
Woodside, A.G. 1982. Positioning a province using travel research. Journal of Travel
Research, 20:2-6.

346
World Tourism Organization. 1985. The role of recreation management in the
development of active holidays and special interest tourism and consequent
enrichment of the holiday experience. Madrid, Spain: World Tourism Organization.
World Tourism Organization. 1993. Tourism compendium. Madrid, Spain: World
Tourism Organization.
World Tourism Organization. 1998. Guide for local authorities on developing
sustainable tourism. Madrid, Spain: World Tourism Organization.
World Tourism Organization. 1999b. Tourism:2020 vision. Madrid, Spain: World
Tourism Organization. [Online]. Available:http//www.world-tourism.org [2003-07-29].
World Tourism Organization. 1999a. International tourism: A global perspective, 2nd
edn. Madrid, Spain: World Tourism Organization.
World Tourism Organization. 2002. Tourism highlights. Madrid, Spain: World Tourism
Organization [Online]. Available:http//www.world-tourism.org [2003-07-29].
World Travel and Tourism Council (WTTC). 1996. Progress and priorities, 1966.
Brussels: World Travel and Tourism Council.
World Travel and Tourism Council (WTTC). 2003. Tourism Satellite Accounting.
Brussels: World Travel and Tourism Council.
Xu, G. & Yuan, Y. 2001. Conjoint analysis in pharmaceutical marketing research.
Quirks marketing research review [Online]. Available:
http://www.quirks.com/articles/article.asp?arg_ArticleId=690 [2004-10-10].
Yeoman, I., Robertson, M., Ali-Knight, J., Drummond, S. & McMahon-Beattie, U.
2004. Festival and events management: an international arts and culture perspective.
Amsterdam: Elsevier Butterworth Heinemann.
347
Zikmund, W.G. 1994. Business research methods: international edition. 4th edn. Fort
Worth: The Dryden Press.
Zins, A. 1994. On the derivation of a common space of competing leisure attraction
types. Journal of Marketing Management, 10:179-190.

348
APPENDICES
APPENDIX A: The data collection instrument

349
A1: A map of South Africa and the three provinces of the arts festival scenarios
Map of South Africa
Map of North West Province: Potchefstroom demarcated as NW402 (scenario A)
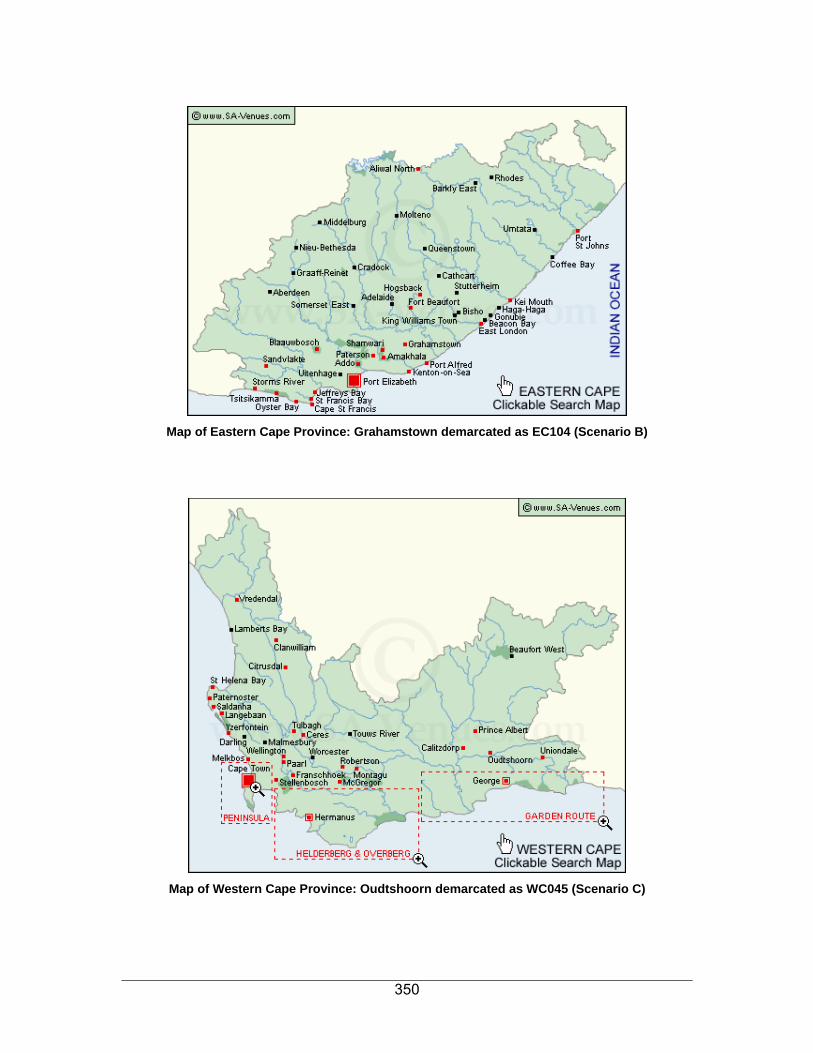
350
Map of Eastern Cape Province: Grahamstown demarcated as EC104 (Scenario B)
Map of Western Cape Province: Oudtshoorn demarcated as WC045 (Scenario C)

351
A2: Quota control sheets for the various festivals • Festival A in Potchefstroom,
• Festival B in Grahamstown and
• Festival C in Oudtshoorn
Quota control sheet of fieldworkers at Festival A in Potchefstroom
Festival A
18 - 30 31 - 45 46+ Total Check
Field worker Male Female Male Female Male Female
1 2 2 2 2 2 2 12 2 2 2 2 2 2 2 12 3 2 2 2 2 2 2 12 4 2 2 2 2 2 2 12 5 2 2 2 2 2 2 12 6 2 2 2 2 2 2 12 7 2 2 2 2 2 2 12 8 2 2 2 2 2 2 12 9 2 2 2 2 2 2 12
10 3 3 3 3 3 3 18
Total 21 21 21 21 21 21 126
Total Age group 42 42 42
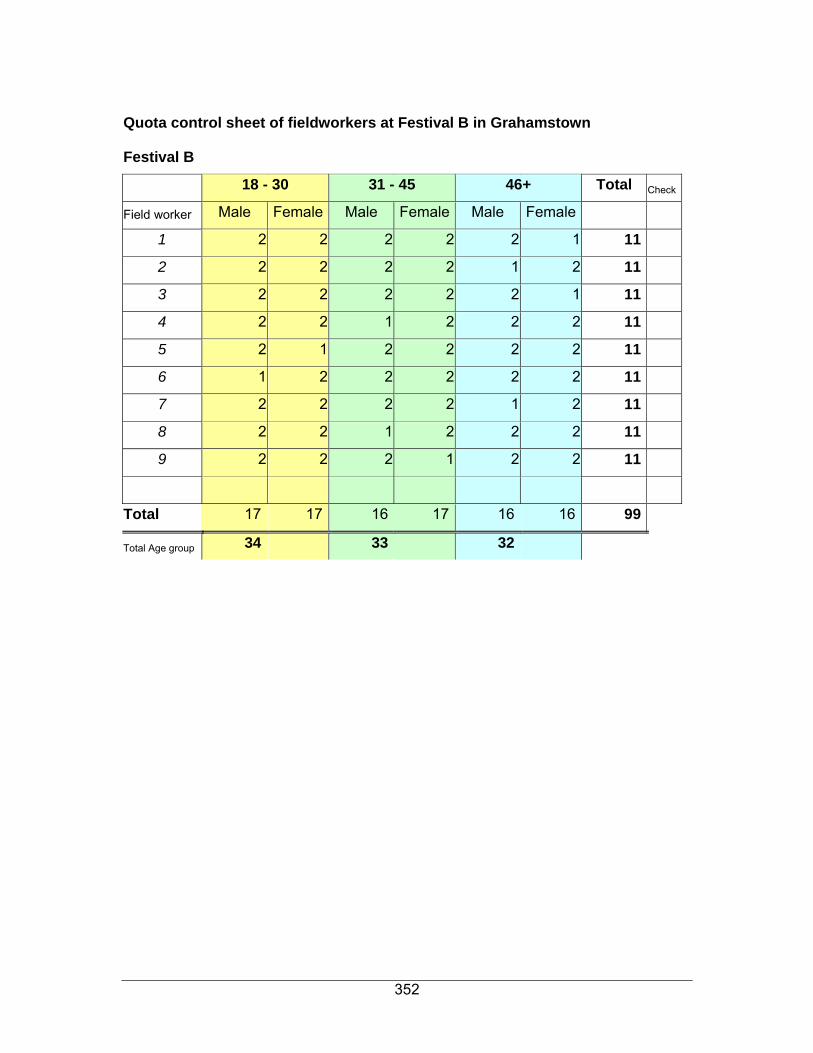
352
Quota control sheet of fieldworkers at Festival B in Grahamstown
Festival B
18 - 30 31 - 45 46+ Total Check
Field worker Male Female Male Female Male Female
1 2 2 2 2 2 1 11 2 2 2 2 2 1 2 11 3 2 2 2 2 2 1 11 4 2 2 1 2 2 2 11 5 2 1 2 2 2 2 11 6 1 2 2 2 2 2 11 7 2 2 2 2 1 2 11 8 2 2 1 2 2 2 11 9 2 2 2 1 2 2 11
Total 17 17 16 17 16 16 99
Total Age group 34 33 32

353
Quota control sheet of fieldworkers at Festival C in Oudtshoorn
Festival C
18 - 30 31 - 45 46+ Total Check
Field worker Male Female Male Female Male Female
1 3 2 2 2 2 2 13 2 2 3 2 2 2 2 13 3 2 2 3 2 2 2 13 4 2 2 2 3 2 2 13 5 2 3 2 2 2 2 13 6 2 2 2 2 2 3 13 7 2 2 2 2 3 2 13 8 2 2 2 3 2 2 13 9 2 2 3 2 2 2 13
10 2 3 2 2 2 2 13 11 3 2 2 2 2 2 13 12 2 2 2 2 2 2 12
Total 26 27 26 26 25 25 155
Total Age group 53 52 50

354
A3: Arts festival questionnaire (Eng. & Afr.) Questionnaire Number: 001
Arts Festival Questionnaire
SECTION A: Filter questions
Good day, my name is _____________(state your name). I am commissioned by Cina van Zyl, a
DCom student at the University of South Africa (UNISA) to conduct this survey. The aim is to gain a
better understanding of the best way to position an arts festival. Your participation is very valuable and
I only need about 20 minutes of your precious time.
Would you be interested in participating?
Yes No, Close Interview
Thank you for being willing to take part in this survey. I want to assure you that this is a confidential
survey, and that all data collected will be used for research purposes only.
Before we proceed, I wish to verify the following important criteria for participation:
Gender: Male
Age: 18-30
Did you attend the following Arts Festival?
Festival A (Aardklop)
If No – Close interview
Will you attend an arts festival in future?
Yes No
Your answers show that you do qualify to participate in the research project. Thank you very much for
your willingness to participate.
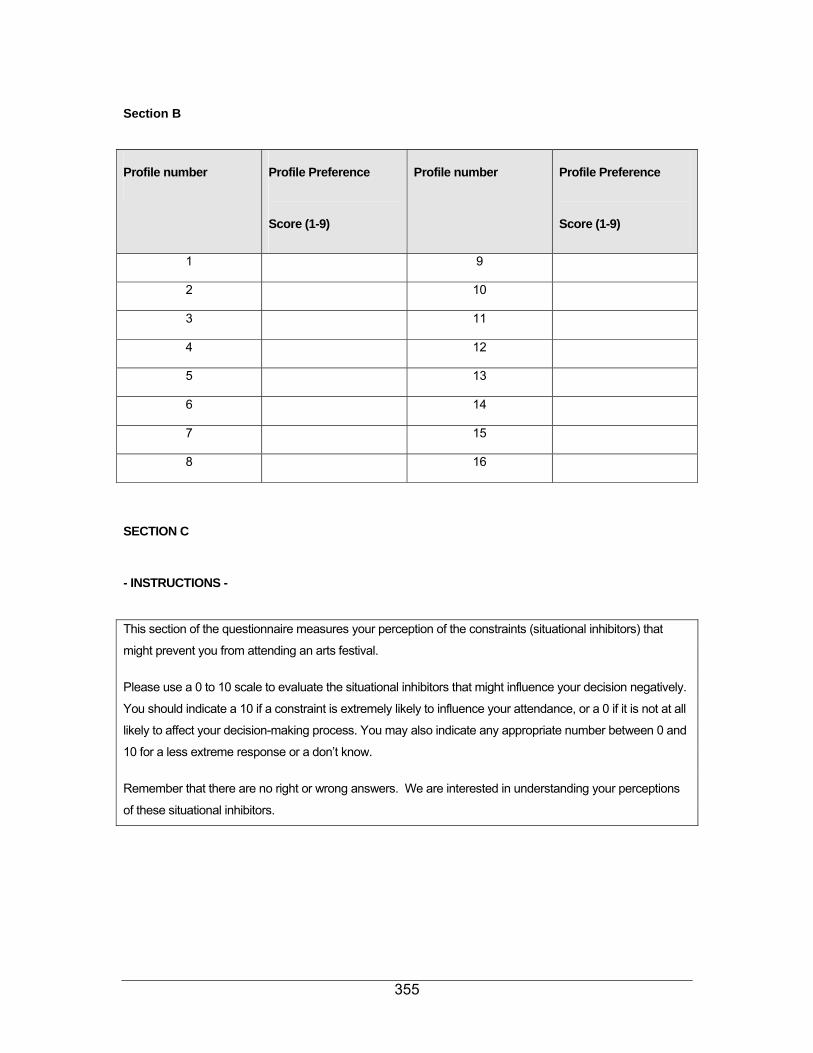
355
Section B
Profile number Profile Preference
Score (1-9)
Profile number Profile Preference
Score (1-9)
1 9
2 10
3 11
4 12
5 13
6 14
7 15
8 16
SECTION C
- INSTRUCTIONS -
This section of the questionnaire measures your perception of the constraints (situational inhibitors) that
might prevent you from attending an arts festival.
Please use a 0 to 10 scale to evaluate the situational inhibitors that might influence your decision negatively.
You should indicate a 10 if a constraint is extremely likely to influence your attendance, or a 0 if it is not at all
likely to affect your decision-making process. You may also indicate any appropriate number between 0 and
10 for a less extreme response or a don’t know.
Remember that there are no right or wrong answers. We are interested in understanding your perceptions
of these situational inhibitors.
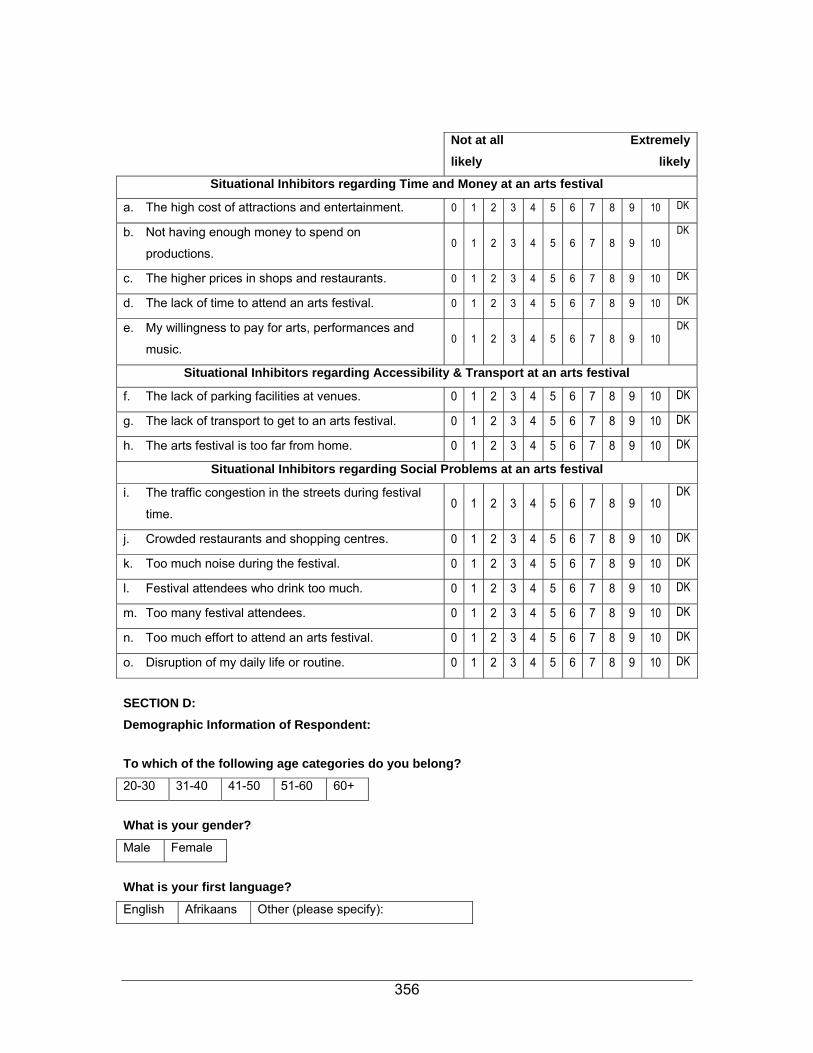
356
Not at all likely
Extremelylikely
Situational Inhibitors regarding Time and Money at an arts festival
a. The high cost of attractions and entertainment. 0 1 2 3 4 5 6 7 8 9 10 DK
b. Not having enough money to spend on
productions. 0 1 2 3 4 5 6 7 8 9 10
DK
c. The higher prices in shops and restaurants. 0 1 2 3 4 5 6 7 8 9 10 DK
d. The lack of time to attend an arts festival. 0 1 2 3 4 5 6 7 8 9 10 DK
e. My willingness to pay for arts, performances and
music. 0 1 2 3 4 5 6 7 8 9 10
DK
Situational Inhibitors regarding Accessibility & Transport at an arts festival
f. The lack of parking facilities at venues. 0 1 2 3 4 5 6 7 8 9 10 DK
g. The lack of transport to get to an arts festival. 0 1 2 3 4 5 6 7 8 9 10 DK
h. The arts festival is too far from home. 0 1 2 3 4 5 6 7 8 9 10 DK
Situational Inhibitors regarding Social Problems at an arts festival
i. The traffic congestion in the streets during festival
time. 0 1 2 3 4 5 6 7 8 9 10
DK
j. Crowded restaurants and shopping centres. 0 1 2 3 4 5 6 7 8 9 10 DK
k. Too much noise during the festival. 0 1 2 3 4 5 6 7 8 9 10 DK
l. Festival attendees who drink too much. 0 1 2 3 4 5 6 7 8 9 10 DK
m. Too many festival attendees. 0 1 2 3 4 5 6 7 8 9 10 DK
n. Too much effort to attend an arts festival. 0 1 2 3 4 5 6 7 8 9 10 DK
o. Disruption of my daily life or routine. 0 1 2 3 4 5 6 7 8 9 10 DK
SECTION D: Demographic Information of Respondent:
To which of the following age categories do you belong?
20-30 31-40 41-50 51-60 60+
What is your gender? Male Female
What is your first language? English Afrikaans Other (please specify):
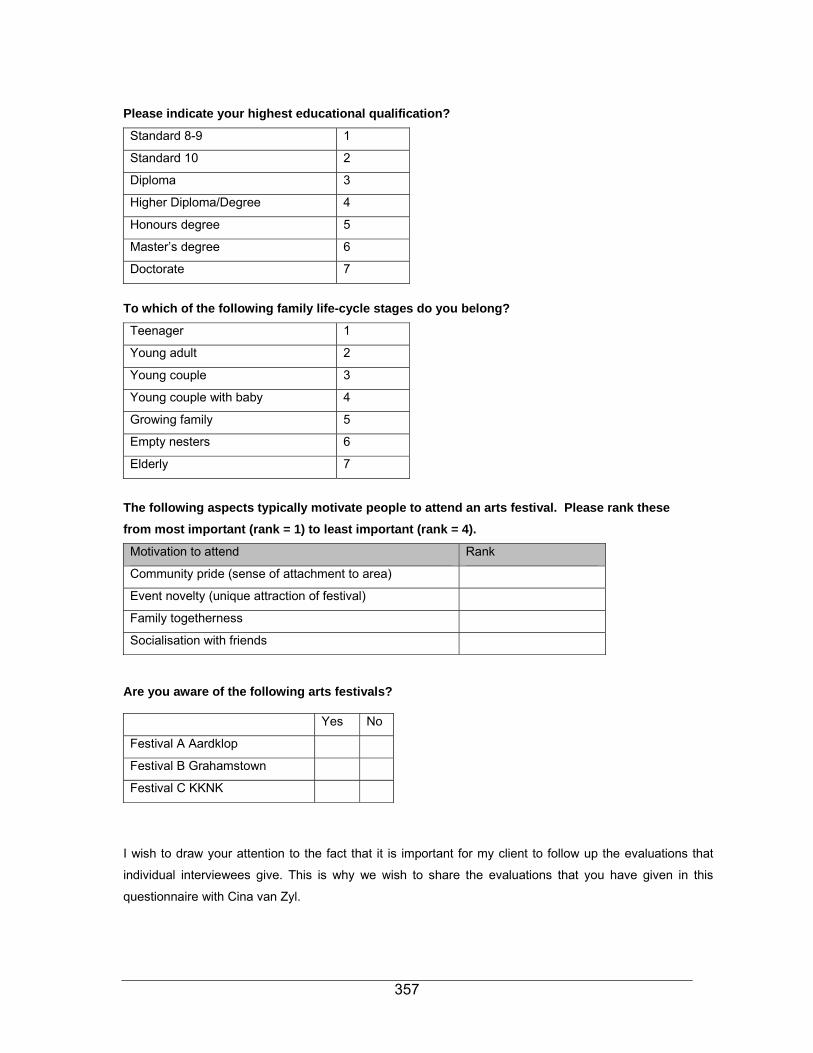
357
Please indicate your highest educational qualification?
Standard 8-9 1
Standard 10 2
Diploma 3
Higher Diploma/Degree 4
Honours degree 5
Master’s degree 6
Doctorate 7
To which of the following family life-cycle stages do you belong?
Teenager 1
Young adult 2
Young couple 3
Young couple with baby 4
Growing family 5
Empty nesters 6
Elderly 7
The following aspects typically motivate people to attend an arts festival. Please rank these from most important (rank = 1) to least important (rank = 4).
Motivation to attend Rank
Community pride (sense of attachment to area)
Event novelty (unique attraction of festival)
Family togetherness
Socialisation with friends
Are you aware of the following arts festivals?
Yes No
Festival A Aardklop
Festival B Grahamstown
Festival C KKNK
I wish to draw your attention to the fact that it is important for my client to follow up the evaluations that
individual interviewees give. This is why we wish to share the evaluations that you have given in this
questionnaire with Cina van Zyl.

358
Do you have any objections to disclosing the information?
Yes, I have an objection Please be assured that your individual information will not be disclosed to anybody.
No, I have no objection Thank you very much
THANK YOU FOR YOUR KIND CO-OPERATION
FILL IN AT THE END OF THE INTERVIEW – COMPULSORY INFORMATION
Respondent’s name and surname:___________________________________________________
Respondent’s Tel Number: ______________________________________________
Vraelys Nommer: 001

359
Vraelys oor Kunstefeeste AFDELING A: Filter vrae Dagsê, my naam is _____________(meld jou naam). Ek is deur Cina van Zyl, ‘n DCom-student aan
die Universiteit van Suid-Afrika (UNISA) opdrag gegee om hierdie opname te doen. Die doel daarvan
is om 'n beter begrip van die optimale posisionering van 'n kunstefees te verkry. U deelname is van
besondere waarde en ek sal slegs sowat 20 minute van u kosbare tyd in beslag neem.
Stel u daarin belang om deel te neem?
Ja Nee, sluit onderhoud af
Baie dankie vir u bereidwilligheid om aan hierdie opname deel te neem. Ek wil u graag verseker dat dit
'n vertroulike opname is, en dat alle ingesamelde gegewens slegs vir navorsingsdoeleindes gebruik
sal word.
Voordat ons begin, wil ek graag die volgende belangrike kriteria vir deelname nagaan:
Geslag: Manlik
Ouderdom: 18-30
Het u al die volgende Kunstefees bygewoon?
Festival A (Aardklop)
Indien Nee – Sluit onderhoud
Sal u in die toekoms weer 'n kunstefees bywoon? Ja Nee
U antwoorde dui daarop dat u wel vir deelname in die navorsingsprojek kwalifiseer. Dankie vir u
bereidwilligheid om deel te neem.

360
AFDELING B
AFDELING C
- AANWYSINGS -
Hierdie deel van die vraelys meet u persepsie van die hindernisse of beperkings (situasie-inhibeerders) wat
u dalk kan verhoed om 'n kunstefees by te woon.
Gebruik asseblief 'n skaal van 0 tot 10 om die situasie-inhibeerders te evalueer wat u besluit dalk negatief
kan beïnvloed. Merk die syfer 10 indien dit hoogs waarskynlik is dat 'n inhibeerder u bywoning kan
beïnvloed, of ‘n 0 indien daar geen waarskynliklikheid bestaan wat u besluitnemingsproses sal beïnvloed
nie. U kan ook enige toepaslike syfer tussen 0 en 10 aandui om 'n meer matige antwoord te gee of weet nie.
Hou asseblief in gedagte dat daar geen regte of verkeerde antwoorde is nie. Ons stel slegs daarin belang
om u persepsies van hierdie situasie-inhibeerders te verstaan.
Profiel Nommer Profiel Voorkeur
Telling (1-9)
Profiel Nommer Profiel Voorkeur
Telling (1-9)
1 9
2 10
3 11
4 12
5 13
6 14
7 15
8 16

361
Geen waarskynlikheid
Hoogswaarskynlik
Situasie-inhibeerders met betrekking tot Tyd en Geld by ‘n kunstefees
p. Die hoë koste van aantrekkings en
vermaaklikhede. 0 1 2 3 4 5 6 7 8 9 10
WN
q. Te min geld om op produksies uit te gee. 0 1 2 3 4 5 6 7 8 9 10 WN
r. Die hoër pryse in winkels en restaurante. 0 1 2 3 4 5 6 7 8 9 10 WN
s. Gebrek aan tyd om ‘n kunstefees by te woon. 0 1 2 3 4 5 6 7 8 9 10 WN
t. My bereidwilligheid om vir die kunste, opvoerings
en musiek te betaal. 0 1 2 3 4 5 6 7 8 9 10
WN
Situasie-inhibeerders met betrekking tot Toeganklikheid & Vervoer by ‘n kunstefees
u. Die gebrek aan parkeergeriewe by lokale. 0 1 2 3 4 5 6 7 8 9 10 WN
v. Die gebrek aan vervoer om by ‘n kunstefees uit te
kom. 0 1 2 3 4 5 6 7 8 9 10
WN
w. Die kunstefees is te ver van die huis geleë. 0 1 2 3 4 5 6 7 8 9 10 WN
Situasie-inhibeerders met betrekking tot Sosiale Probleme by ‘n kunstefees
x. Die verkeersknope in die strate gedurende feestye. 0 1 2 3 4 5 6 7 8 9 10 WN
y. Stampvol restaurante en winkelsentrums. 0 1 2 3 4 5 6 7 8 9 10 WN
z. Te veel lawaai gedurende die fees. 0 1 2 3 4 5 6 7 8 9 10 WN
aa. Feesbywoners wat te veel alkohol gebruik. 0 1 2 3 4 5 6 7 8 9 10 WN
bb. Te veel feesbywoners. 0 1 2 3 4 5 6 7 8 9 10 WN
cc. Te veel moeite om ‘n kunstefees by te woon. 0 1 2 3 4 5 6 7 8 9 10 WN
dd. Ontwrigting van my daaglikse lewe of roetine. 0 1 2 3 4 5 6 7 8 9 10 WN
AFDELING D Demografiese Inligting oor Respondent:
In watter van die volgende ouderdomsgroepe behoort u?
20-30 31-40 41-50 51-60 60+
Wat is u geslag? Manlik Vroulik
Wat is u eerste taal? Engels Afrikaans Ander (spesifiseer asseblief):

362
Dui asseblief u hoogste onderwyskwalifikasie aan?
Standerd 8-9 1
Standerd 10 2
Diploma 3
Hoër Diploma/Graad 4
Honneursgraad 5
Meestersgraad 6
Doktorsgraad 7
In watter van die volgende fases van die gesinslewensiklus behoort u?
Tiener 1
Jong volwassene 2
Jong paartjie 3
Jong paartjie met baba 4
Groeiende gesin 5
Leënes-ouers (sonder kinders) 6
Bejaarde 7
Die volgende aspekte motiveer mense tipies om 'n kunstefees by te woon. Orden dit asseblief van die belangrikste (rangnommer = 1) tot die onbelangrikste (rangnommer = 4).
Motivering om by te woon Rangnr.
Gemeenskapstrots (sin van
samehorigheid met area)
Feesnuwighede (unieke aantrekking
van fees)
Samesyn met gesin
Sosialisering met vriende
Is u bewus van die volgende kunstefeeste?
Ja Nee
FeesA Aardklop
Fees B Grahamstad
Fees C KKNK

363
Ek vestig graag u aandag daarop dat dit vir my kliënt belangrik is om die evaluering wat individuele
respondente gegee het, op te volg. Daarom wil ons graag die evaluering wat u in hierdie vraelys voorsien
het met Cina van Zyl deel.
Het u enige beswaar teen die openbaring van die inligting?
Ja, ek maak beswaar daarteen Wees asseblief verseker dat u individuele inligting nie aan enigeen openbaar sal word nie.
Nee, ek maak geen beswaar
daarteen nie
Baie dankie
BAIE DANKIE VIR U VRIENDELIKE SAMEWERKING
VOLTOOI AAN DIE EINDE VAN DIE ONDERHOUD – VERPLIGTE INLIGTING
Naam en van van respondent:____________________________________________
Kontak no. van respondent: ______________________________________________

364
A4: Arts festival scenario conjoint show-cards, instructions and profiles in Eng. & Afr. English conjoint show-cards:
The festival…
A B
C
that offers…
quality arts
quality music
quality performances
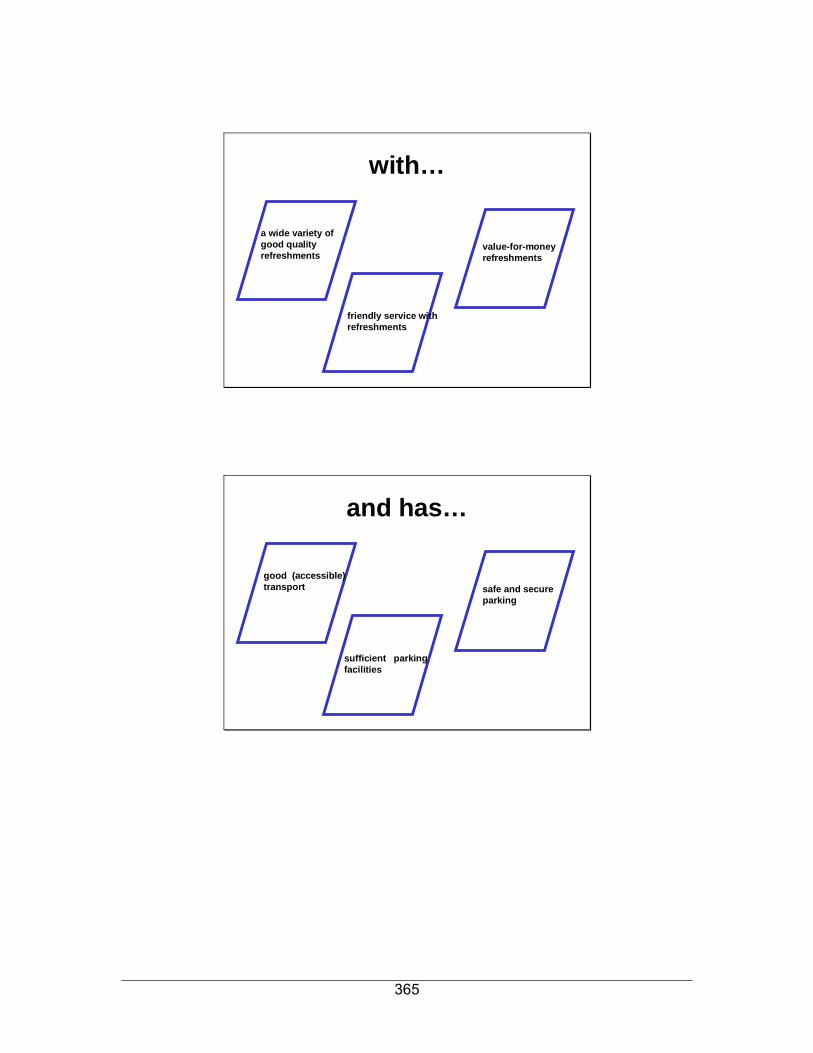
365
with…
a wide variety of good quality refreshments
friendly service with refreshments
value-for-money refreshments
and has…
good (accessible) transport
sufficient parking facilities
safe and secure parking

366
at…
higher that the current ticket price
lower that the current ticket price
the same as the current ticket price
987432 651
Strongly prefer left
Strongly prefer right
Conjoint scale
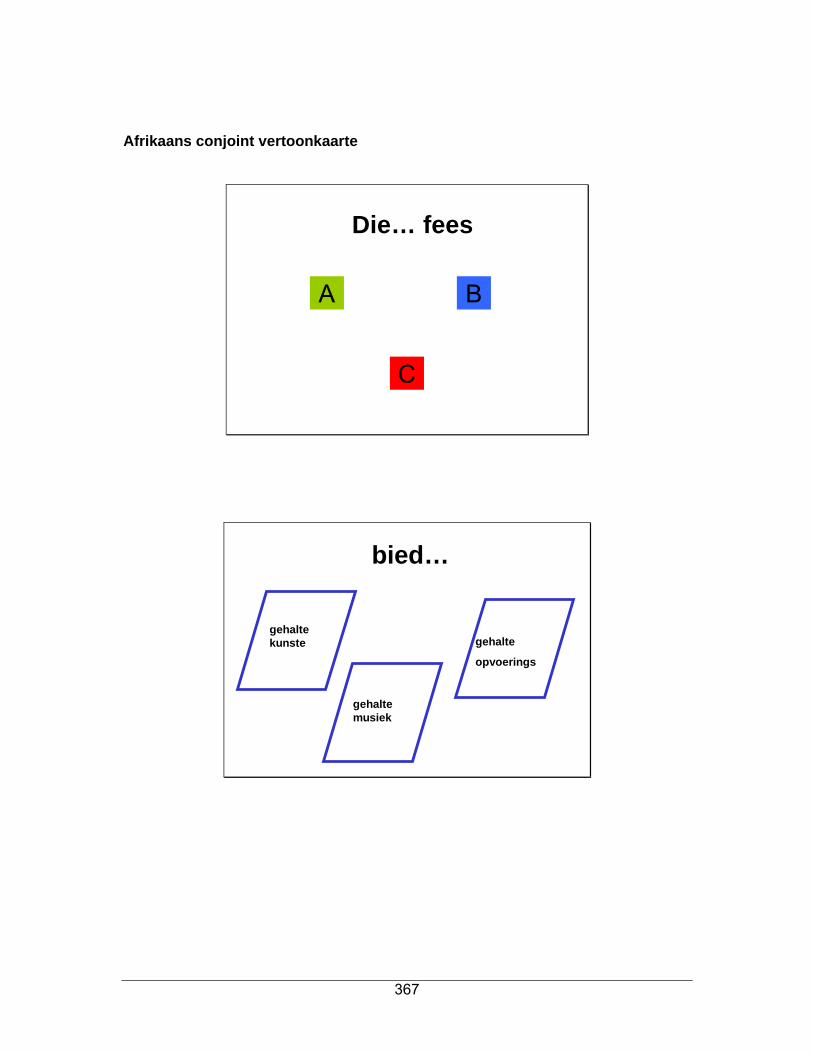
367
Afrikaans conjoint vertoonkaarte
Die… fees
A B
C
bied…
gehaltekunste
gehaltemusiek
gehalte
opvoerings

368
met…
vriendelikediens en verversings
wyeverskeidenheidgoeie gehalteverversings
waarde-vir-geldverversings
en…
Goeie vervoer
Voldoendeparkeergeriewe
Veilige & beskermdeparkeergeriewe

369
teen…
meer as die huidigekaartjieprys
minder as die huidigekaartjieprys
dieselfde as die huidigekaartjieprys
987432 651
Sterk voorkeurlinks
Sterk voorkeurregs
Conjoint skaal
370
Arts festival scenario conjoint analysis English instructions and profiles
- CONJOINT INSTRUCTIONS -
In the first section of the questionnaire, you will be given an imaginary scenario that you might experience at
an arts festival. In total there are 16 questions – each containing a different set of Benefit Packages. Please
consider these packages against the scenario below and indicate your strongest preference in each
question.
The scenario: “Suppose you can attend only one arts festival in a year and that distance (geographical
region) and time of the year is not a problem.”
Just follow these easy steps:
o EACH set of questions comprises a left-side Benefit Package and a right-side Benefit
Package.
o The left-side Benefit Package and right-side Benefit Package contain 5 benefit items each,
which make up a benefit package.
o Please read both the left-side Benefit Package and the right-side Benefit Package.
o Compare the two packages as a whole.
o Then, select the Benefit Package that you prefer best (either left-side or right-side) by marking
the appropriate number (e.g. if your prefer the left-side Benefit Package the most, mark
number 1 – but if you prefer the right-side Benefit Package the most, mark the number 9).
o If you do not have a stronger preference for either of the Benefit Packages, mark the middle
value – 5 (Neutral) to show your lack of preference.
o Please repeat these steps for the remaining 16 Benefit Package questions, each time
indicating your preference for that combination of Benefit Packages.
The options will always consist of five items (called attributes), which I will quickly explain before we
begin with the interview:
o Festival Brands: o This refers to the different arts festivals. Your options are:
o Festival A held in Potchefstroom
o Festival B held in Grahamstown o Festival C held in Oudtshoorn
371
o Entertainment or festival activities: o This refers to the different productions offered at the arts festivals. Your options are:
o Quality arts such as visual art and exhibitions
o Quality music such as classical and opera; choir and ensemble; cabaret and
music; blues, jazz and rock o Quality performances such as the performing arts; dance and movement;
literature and poetry; children’s theatre
o Refreshments (Food and beverages): o This refers to the food and beverages available at food outlets and restaurants at the
festival. Your options are: o A wide variety of good quality refreshments (food and beverages)
o Friendly service with refreshments (food and beverages)
o Value-for-money refreshments (food and beverages)
o Transport: o This refers to the accessibility of transport, as well as transport to and at the festival.
Your options are: o Good (accessible) transport to venues
o Sufficient parking facilities at venues
o Safe and secure parking facilities at venues
o Ticket prices: o This refers to the ticket prices of the shows at the festival . Your options are:
o Higher than the current ticket price
o Lower than the current ticket price
o The same as the current ticket price

372
EXAMPLE QUESTION:
“Suppose you can attend only one arts festival in a year and that distance (geographical region) and time of the year is not a problem.”
Example of Profile
Considering the scenario, which one of the following arts festivals do you prefer?
The …
festival C A
that offers … ...quality arts (e.g. visual art,
exhibitions)
...quality music (e.g. classical &
opera, choir & ensemble, cabaret
& music, blues & jazz, rock)
with …
...friendly service and
refreshments (food and
beverages)
...wide variety of good quality
refreshments (food and
beverages)
and has … ...safe and secure parking
facilities at venues
...good transport (accessibility) to
venues
at … ...the same as the current price ...higher than the current price
Strongly Prefer
Left
Strongly Prefer
Right
1 2 3 4 5 6 7 8 9

373
“Suppose you can attend only one arts festival in a year and that distance (geographical region) and time of the year is not a problem.”
Profile 1
Considering the scenario, which one of the following arts festivals do you prefer?
The …
festival C A
that offers … ...quality arts (e.g. visual art,
exhibitions)
...quality music (e.g. classical &
opera, choir & ensemble, cabaret
& music, blues & jazz, rock)
with …
...friendly service and
refreshments (food and
beverages)
...wide variety of good quality
refreshments (food and
beverages)
and has … ...safe and secure parking
facilities at venues
...good transport (accessibility) to
venues
at … ...the same as the current price ...higher than the current price
Strongly Prefer
Left
Strongly Prefer
Right
1 2 3 4 5 6 7 8 9

374
“Suppose you can attend only one arts festival in a year and that distance (geographical region) and time of the year is not a problem.”
Profile 2
Considering the scenario, which one of the following arts festivals do you prefer?
The …
festival A B
that offers …
...quality performances (e.g.
performing arts, dance &
movement, literature & poetry)
...quality arts (e.g. visual art,
exhibitions)
with …
...friendly service and
refreshments (food and
beverages)
...value-for-money refreshments
(at food outlets)
and has … ...safe and secure parking
facilities at venues
...sufficient parking facilities at
venues
at … ...lower than the current price ...higher than the current price
Strongly Prefer
Left
Strongly Prefer
Right
1 2 3 4 5 6 7 8 9

375
“Suppose you can attend only one arts festival in a year and that distance (geographical region) and time of the year is not a problem.”
Profile 3
Considering the scenario, which one of the following arts festivals do you prefer?
The …
festival C A
that offers ...
...quality performances (e.g.
performing arts, dance &
movement, literature & poetry)
...quality arts (e.g. visual art,
exhibitions)
with … ...value-for-money refreshments
(at food outlets)
...wide variety of good quality
refreshments (food and
beverages)
and has … ...sufficient parking facilities at
venues
...good transport (accessibility) to
venues
at … ...higher than the current price ...the same as the current price
Strongly Prefer
Left
Strongly Prefer
Right
1 2 3 4 5 6 7 8 9
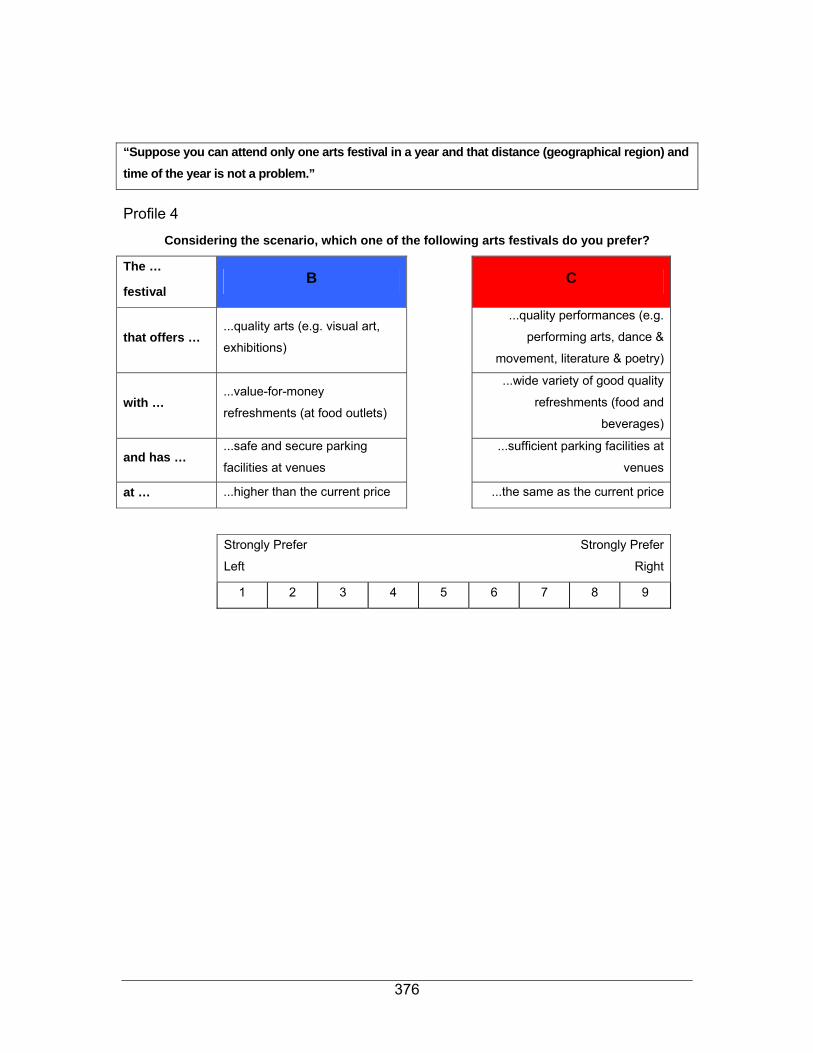
376
“Suppose you can attend only one arts festival in a year and that distance (geographical region) and time of the year is not a problem.”
Profile 4
Considering the scenario, which one of the following arts festivals do you prefer?
The …
festival B C
that offers … ...quality arts (e.g. visual art,
exhibitions)
...quality performances (e.g.
performing arts, dance &
movement, literature & poetry)
with … ...value-for-money
refreshments (at food outlets)
...wide variety of good quality
refreshments (food and
beverages)
and has … ...safe and secure parking
facilities at venues
...sufficient parking facilities at
venues
at … ...higher than the current price ...the same as the current price
Strongly Prefer
Left
Strongly Prefer
Right
1 2 3 4 5 6 7 8 9

377
“Suppose you can attend only one arts festival in a year and that distance (geographical region) and time of the year is not a problem.”
Profile 5
Considering the scenario, which one of the following arts festivals do you prefer?
The …
festival A B
that offers …
...quality music (e.g. classical &
opera, choir & ensemble,
cabaret & music, blues & jazz,
rock)
...quality performances (e.g.
performing arts, dance &
movement, literature & poetry)
with …
...wide variety of good quality
refreshments (food and
beverages)
...value-for-money refreshments
(at food outlets)
and has … ...sufficient parking facilities at
venues
...good transport (accessibility) to
venues
at … ...the same as the current price ...lower than the current price
Strongly Prefer
Left
Strongly Prefer
Right
1 2 3 4 5 6 7 8 9

378
“Suppose you can attend only one arts festival in a year and that distance (geographical region) and time of the year is not a problem.”
Profile 6
Considering the scenario, which one of the following arts festivals do you prefer?
The …
festival A C
that offers …
...quality performances (e.g.
performing arts, dance &
movement, literature & poetry)
...quality arts (e.g. visual art,
exhibitions)
with …
...friendly service and
refreshments (food and
beverages)
...value-for-money refreshments
(at food outlets)
and has … ...sufficient parking facilities at
venues
...safe and secure parking facilities
at venues
at … ...higher than the current price ...lower than the current price
Strongly Prefer
Left
Strongly Prefer
Right
1 2 3 4 5 6 7 8 9

379
“Suppose you can attend only one arts festival in a year and that distance (geographical region) and time of the year is not a problem.”
Profile 7
Considering the scenario, which one of the following arts festivals do you prefer?
The …
festival C A
that offers …
...quality music (e.g. classical &
opera, choir & ensemble, cabaret
& music, blues & jazz, rock)
...quality arts (e.g. visual art,
exhibitions)
with …
...wide variety of good quality
refreshments (food and
beverages)
...friendly service with
refreshments (food and
beverages)
and has … ...good transport (accessibility) to
venues
...safe and secure parking facilities
at venues
at … ...the same as the current price ...lower than the current price
Strongly Prefer
Left
Strongly Prefer
Right
1 2 3 4 5 6 7 8 9

380
“Suppose you can attend only one arts festival in a year and that distance (geographical region) and time of the year is not a problem.”
Profile 8
Considering the scenario, which one of the following arts festivals do you prefer?
The …
festival A B
that offers … ...quality arts (e.g. visual art,
exhibitions)
...quality performances (e.g.
performing arts, dance &
movement, literature & poetry)
with … ...value-for-money refreshments
(at food outlets)
...friendly service with
refreshments (food and
beverages)
and has … ...good transport (accessibility) to
venues
...safe and secure parking facilities
at venues
at … ...higher than the current price ...the same as the current price
Strongly Prefer
Left
Strongly Prefer
Right
1 2 3 4 5 6 7 8 9
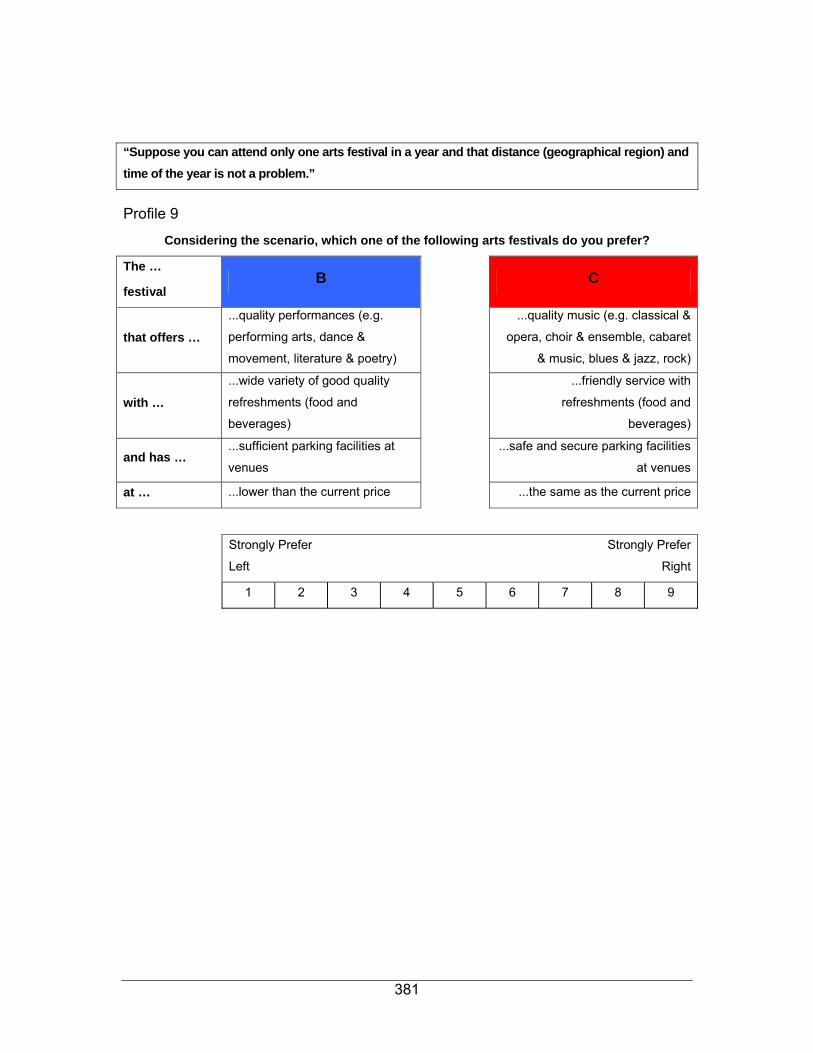
381
“Suppose you can attend only one arts festival in a year and that distance (geographical region) and time of the year is not a problem.”
Profile 9
Considering the scenario, which one of the following arts festivals do you prefer?
The …
festival B C
that offers …
...quality performances (e.g.
performing arts, dance &
movement, literature & poetry)
...quality music (e.g. classical &
opera, choir & ensemble, cabaret
& music, blues & jazz, rock)
with …
...wide variety of good quality
refreshments (food and
beverages)
...friendly service with
refreshments (food and
beverages)
and has … ...sufficient parking facilities at
venues
...safe and secure parking facilities
at venues
at … ...lower than the current price ...the same as the current price
Strongly Prefer
Left
Strongly Prefer
Right
1 2 3 4 5 6 7 8 9

382
“Suppose you can attend only one arts festival in a year and that distance (geographical region) and time of the year is not a problem.”
Profile 10
Considering the scenario, which one of the following arts festivals do you prefer?
The …
festival A C
that offers …
...quality music (e.g. classical &
opera, choir & ensemble, cabaret
& music, blues & jazz, rock)
...quality arts (e.g. visual art,
exhibitions)
with … ...value-for-money refreshments
(at food outlets)
...wide variety of good quality
refreshments (food and
beverages)
and has … ...good transport (accessibility) to
venues
...sufficient parking facilities at
venues
at … ...lower than the current price ...higher than the current price
Strongly Prefer
Left
Strongly Prefer
Right
1 2 3 4 5 6 7 8 9
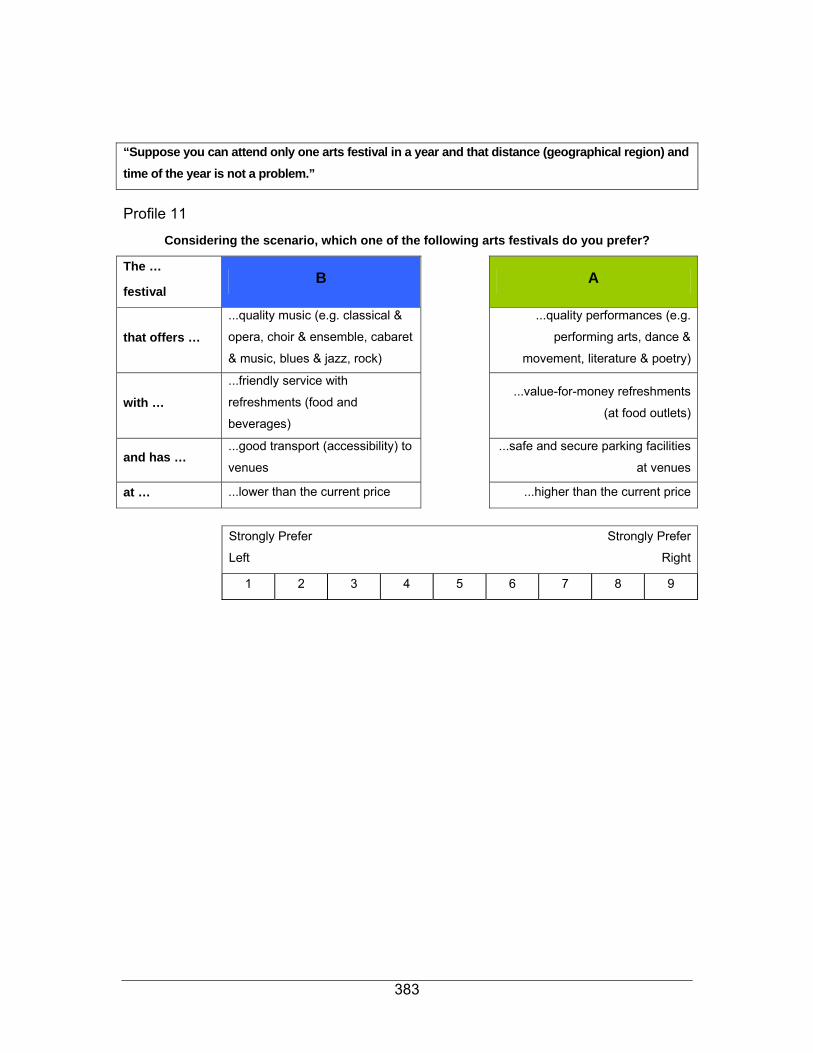
383
“Suppose you can attend only one arts festival in a year and that distance (geographical region) and time of the year is not a problem.”
Profile 11
Considering the scenario, which one of the following arts festivals do you prefer?
The …
festival B A
that offers …
...quality music (e.g. classical &
opera, choir & ensemble, cabaret
& music, blues & jazz, rock)
...quality performances (e.g.
performing arts, dance &
movement, literature & poetry)
with …
...friendly service with
refreshments (food and
beverages)
...value-for-money refreshments
(at food outlets)
and has … ...good transport (accessibility) to
venues
...safe and secure parking facilities
at venues
at … ...lower than the current price ...higher than the current price
Strongly Prefer
Left
Strongly Prefer
Right
1 2 3 4 5 6 7 8 9

384
“Suppose you can attend only one arts festival in a year and that distance (geographical region) and time of the year is not a problem.”
Profile 12
Considering the scenario, which one of the following arts festivals do you prefer?
The …
festival C A
that offers …
...quality music (e.g. classical &
opera, choir & ensemble, cabaret
& music, blues & jazz, rock)
...quality arts (e.g. visual art,
exhibitions)
with … ...value-for-money refreshments
(at food outlets)
...friendly service and
refreshments (food and
beverages)
and has … ...safe and secure parking
facilities at venues
...good transport (accessibility) to
venues
at … ...lower than the current price ...the same as the current price
Strongly Prefer
Left
Strongly Prefer
Right
1 2 3 4 5 6 7 8 9
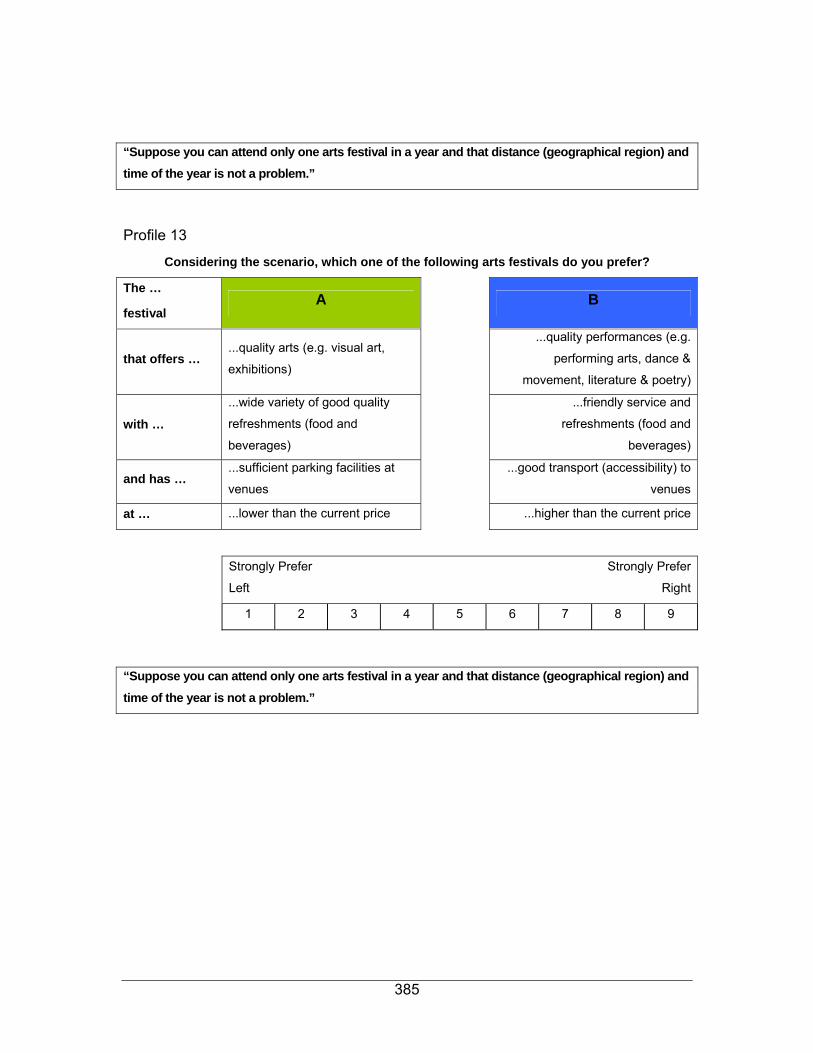
385
“Suppose you can attend only one arts festival in a year and that distance (geographical region) and time of the year is not a problem.”
Profile 13
Considering the scenario, which one of the following arts festivals do you prefer?
The …
festival A B
that offers … ...quality arts (e.g. visual art,
exhibitions)
...quality performances (e.g.
performing arts, dance &
movement, literature & poetry)
with …
...wide variety of good quality
refreshments (food and
beverages)
...friendly service and
refreshments (food and
beverages)
and has … ...sufficient parking facilities at
venues
...good transport (accessibility) to
venues
at … ...lower than the current price ...higher than the current price
Strongly Prefer
Left
Strongly Prefer
Right
1 2 3 4 5 6 7 8 9
“Suppose you can attend only one arts festival in a year and that distance (geographical region) and time of the year is not a problem.”

386
Profile 14
Considering the scenario, which one of the following arts festivals do you prefer?
The …
festival C B
that offers …
...quality performances (e.g.
performing arts, dance &
movement, literature & poetry)
...quality music (e.g. classical &
opera, choir & ensemble, cabaret
& music, blues & jazz, rock)
with … ...value-for-money refreshments
(at food outlets)
...wide variety of good quality
refreshments (food and
beverages)
and has … ...good transport (accessibility) to
venues
...safe and secure parking facilities
at venues
at … ...the same as the current price ...higher than the current price
Strongly Prefer
Left
Strongly Prefer
Right
1 2 3 4 5 6 7 8 9
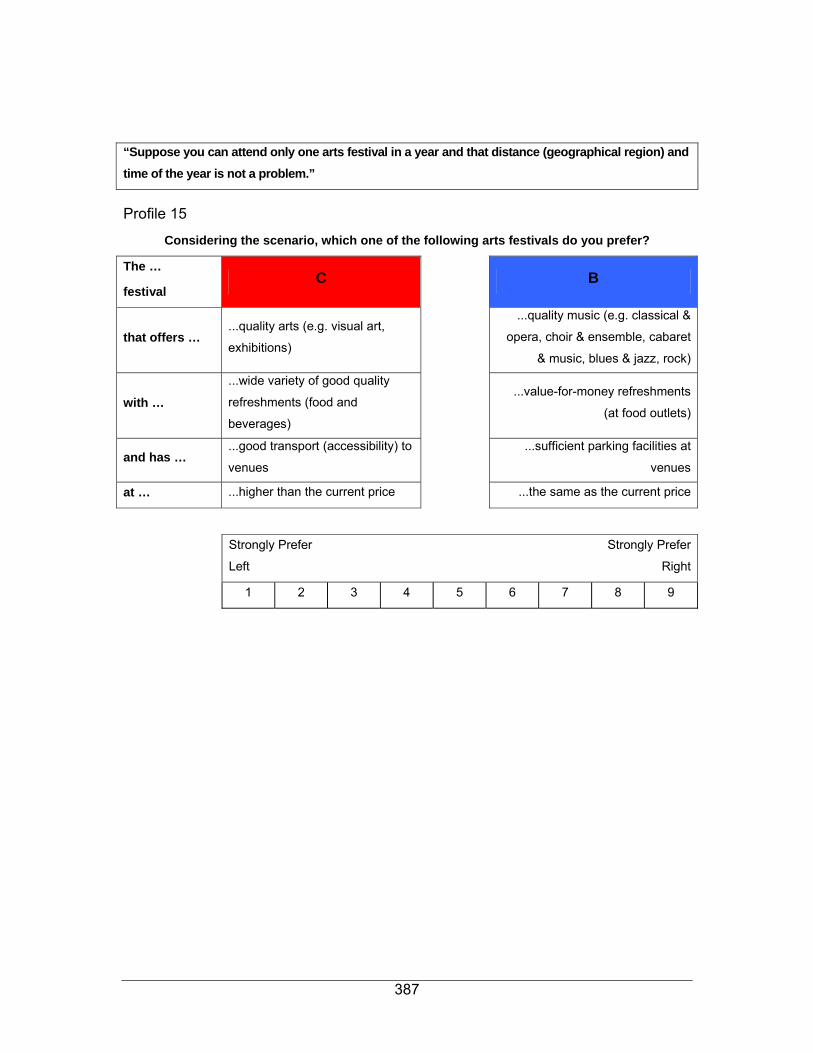
387
“Suppose you can attend only one arts festival in a year and that distance (geographical region) and time of the year is not a problem.”
Profile 15
Considering the scenario, which one of the following arts festivals do you prefer?
The …
festival C B
that offers … ...quality arts (e.g. visual art,
exhibitions)
...quality music (e.g. classical &
opera, choir & ensemble, cabaret
& music, blues & jazz, rock)
with …
...wide variety of good quality
refreshments (food and
beverages)
...value-for-money refreshments
(at food outlets)
and has … ...good transport (accessibility) to
venues
...sufficient parking facilities at
venues
at … ...higher than the current price ...the same as the current price
Strongly Prefer
Left
Strongly Prefer
Right
1 2 3 4 5 6 7 8 9
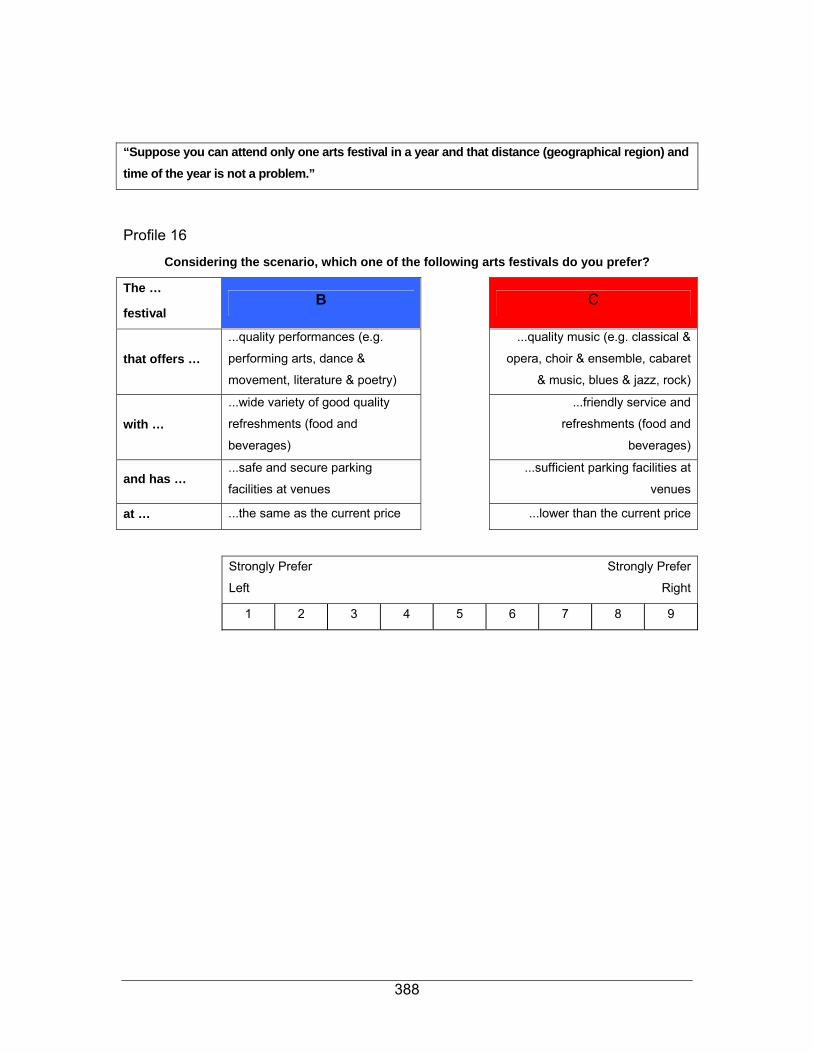
388
“Suppose you can attend only one arts festival in a year and that distance (geographical region) and time of the year is not a problem.”
Profile 16
Considering the scenario, which one of the following arts festivals do you prefer?
The …
festival B C
that offers …
...quality performances (e.g.
performing arts, dance &
movement, literature & poetry)
...quality music (e.g. classical &
opera, choir & ensemble, cabaret
& music, blues & jazz, rock)
with …
...wide variety of good quality
refreshments (food and
beverages)
...friendly service and
refreshments (food and
beverages)
and has … ...safe and secure parking
facilities at venues
...sufficient parking facilities at
venues
at … ...the same as the current price ...lower than the current price
Strongly Prefer
Left
Strongly Prefer
Right
1 2 3 4 5 6 7 8 9

389
Aanwysings en profiele in Afrikaans Conjoint Kunstefeeste Scenario Ontleding
- CONJOINT AANWYSINGS -
In hierdie deel van die vraelys word 'n denkbeeldige scenario aan u voorgehou, wat u dalk by 'n kunstefees
sal ondervind. Daar is 'n totaal van 16 vrae – elkeen bevat 'n verskillende stel Voordelepakkette. Oorweeg
asseblief hierdie pakkette teen die scenario hieronder op, en dui u sterkste voorkeur in elke vraag aan.
Die scenario: “Veronderstel u kan slegs een kunstefees per jaar bywoon en dat afstand (geografiese gebied)
en die tyd van die jaar geen probleem is nie.”
Volg net hierdie maklike stappe:
o ELKE stel vrae behels 'n Voordelepakket links en 'n Voordelepakket regs.
o Die Voordelepakket aan die linkerkant en die Voordelepakket aan die regterkant bevat elk 5
voordeelitems wat saam 'n voordelepakket uitmaak.
o U moet asseblief beide die Voordelepakket aan die linkerkant én die Voordelepakket aan die
regterkant lees.
o Vergelyk die twee pakkette as geheel.
o Dan word u versoek om die Voordelepakket waarvoor u die sterkste voorkeur het (of
linkerkant of regterkant) te kies deur die toepaslike nommer te merk (bv. as u die sterkste
voorkeur vir die linkerkant Voordelepakket het, merk nommer 1 – maar as u die sterkste
voorkeur vir die regterkant Voordelepakket het, merk die nommer 9).
o As u nie 'n sterker voorkeur vir enigeen van die Voordelepakket het nie, merk asseblief die
waarde in die middel – 5 (Neutraal) om die afwesigheid van voorkeur aan te dui.
o Herhaal asseblief hierdie stappe vir die vrae oor die res van die 16 Voordelepakkette, en dui
elke keer u voorkeur vir daardie kombinasie van Voordelepakkette aan.
Die opsies sal altyd uit vyf items (genoem kenmerke of attribute) bestaan, wat ek gou aan u sal
verduidelik voordat ons met die onderhoud begin:
o Handelsmerk van fees: o Dit het betrekking op die verskillende kunstefeeste. U opsies is:
o Fees A wat in Potchefstroom gehou word
o Fees B wat in Grahamstad gehou word o Fees C wat in Oudtshoorn gehou word

390
o Vermaaklikhede of feesaktiwiteite: o Dit het betrekking op die verskillende produksies wat by die kunstefeeste aangebied word. U
opsies is: o Gehalte kunste soos visuele kuns en uitstallings
o Gehalte musiek soos klassieke musiek en opera; koor- en ensemble-musiek;
kabaret en musiek; “blues” rock en jazz o Gehalte opvoerings soos die uitvoerende kunste; dans en beweging;
letterkunde en poësie; kinderteater
o Verversings (Voedsel en drank): o Dit het betrekking op die voedsel en drank wat by voedselverkooppunte en restaurante by die
fees beskikbaar is. U opsies is: o 'n Wye verskeidenheid verversings (voedsel en drank) van goeie gehalte
o Vriendelike diens met verversings (voedsel en drank)
o Verversings (voedsel en drank) bied waarde vir geld
o Vervoer: o Dit het betrekking op die toeganklikheid van vervoer asook vervoer na en by die fees. U
opsies is: o Goeie vervoer (toeganklikheid) na lokale
o Voldoende parkeergeriewe by lokale
o Veilige en beskermde parkeergeriewe by lokale
o Kaartjiepryse: o Dit het betrekking op die pryse van kaartjies vir die op-en of uitvoerings by die fees. U opsies
is: o Meer as die huidige kaartjieprys
o Minder as die huidige kaartjieprys
o Dieselfde as die huidige kaartjieprys

391
VOORBEELD VAN PROFIEL:
“Veronderstel u kan slegs een kunstefees per jaar bywoon en dat afstand (geografiese gebied) en die tyd van die jaar geen probleem is nie.”
Voorbeeld van Profiel
Met inagneming van die scenario, watter een van die volgende kunstefeeste verkies u?
Die …
fees C A
wat… ...gehalte kunste (bv. visuele
kuns, uitstallings)
...gehalte musiek (bv. klassieke &
opera, koor & ensemble, kabaret &
musiek, “blues”, rock & jazz)
met … ...vriendelike diens en
verversings (voedsel en drank)
...wye verskeidenheid goeie
gehalte verversings (voedsel en
drank)
en… ...veilige en beskermde
parkeergeriewe by lokale
...goeie vervoer (toeganklikheid)
na lokale
teen … ...dieselfde as die huidige prys ...meer as die huidige prys
Sterk Voorkeur
Links
Sterk Voorkeur
Regs
1 2 3 4 5 6 7 8 9
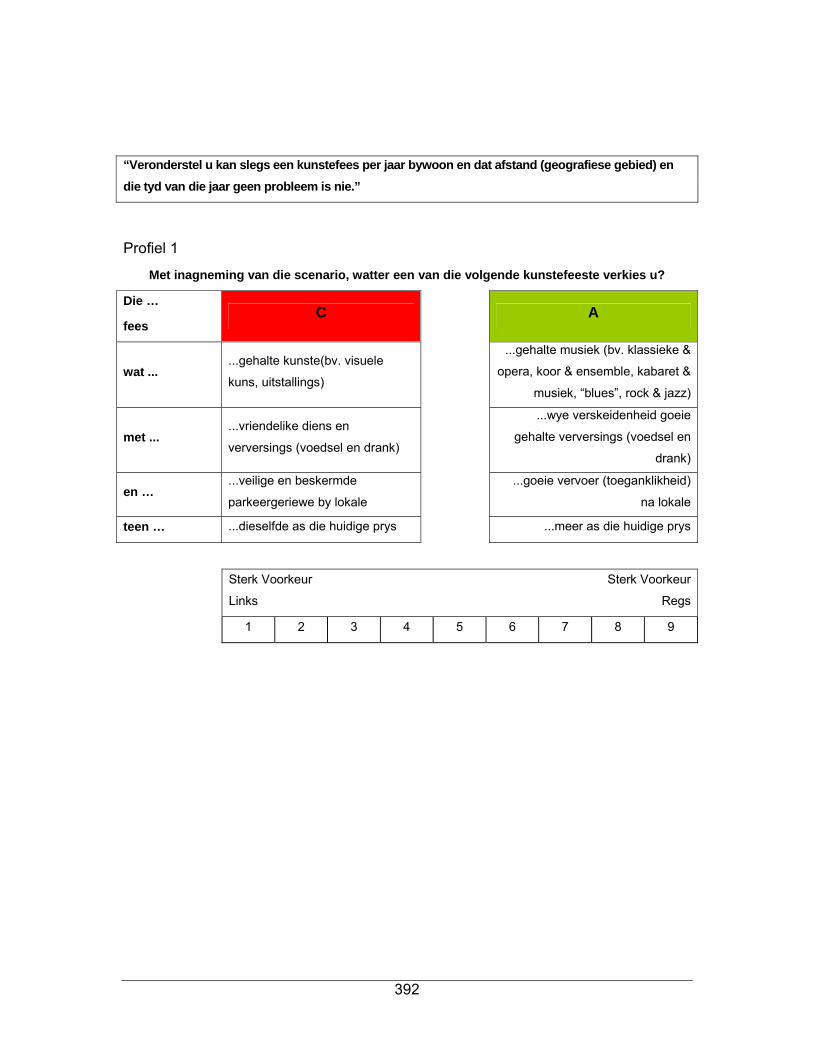
392
“Veronderstel u kan slegs een kunstefees per jaar bywoon en dat afstand (geografiese gebied) en die tyd van die jaar geen probleem is nie.”
Profiel 1
Met inagneming van die scenario, watter een van die volgende kunstefeeste verkies u?
Die …
fees C A
wat ... ...gehalte kunste(bv. visuele
kuns, uitstallings)
...gehalte musiek (bv. klassieke &
opera, koor & ensemble, kabaret &
musiek, “blues”, rock & jazz)
met ... ...vriendelike diens en
verversings (voedsel en drank)
...wye verskeidenheid goeie
gehalte verversings (voedsel en
drank)
en … ...veilige en beskermde
parkeergeriewe by lokale
...goeie vervoer (toeganklikheid)
na lokale
teen … ...dieselfde as die huidige prys ...meer as die huidige prys
Sterk Voorkeur
Links
Sterk Voorkeur
Regs
1 2 3 4 5 6 7 8 9

393
“Veronderstel u kan slegs een kunstefees per jaar bywoon en dat afstand (geografiese gebied) en die tyd van die jaar geen probleem is nie.”
Profiel 2
Met inagneming van die scenario, watter een van die volgende kunstefeeste verkies u?
Die …
fees A B
wat ...
...gehalte opvoerings (bv.
uitvoerende kunste, dans &
beweging, letterkunde & poësie)
...gehalte kunste(bv. visuele kuns,
uitstallings)
met ... ...vriendelike diens en
verversings (voedsel en drank)
...waarde-vir-geld-verversings (by
voedselverkooppunte)
en … ...veilige en beskermde
parkeergeriewe by lokale
...voldoende parkeergeriewe by
lokale
teen … ...minder as die huidige prys ...meer as die huidige prys
Sterk Voorkeur
Links
Sterk Voorkeur
Regs
1 2 3 4 5 6 7 8 9

394
“Veronderstel u kan slegs een kunstefees per jaar bywoon en dat afstand (geografiese gebied) en die tyd van die jaar geen probleem is nie.”
Profiel 3
Met inagneming van die scenario, watter een van die volgende kunstefeeste verkies u?
Die …
fees C A
wat ...
...gehalte opvoerings (bv.
uitvoerende kunste, dans &
beweging, letterkunde & poësie)
...gehalte kunste(bv. visuele kuns,
uitstallings)
met ... ...waarde-vir-geld-verversings (by
voedselverkooppunte)
...wye verskeidenheid goeie
gehalte verversings (voedsel en
drank)
en … ...voldoende parkeergeriewe by
lokale
...goeie vervoer (toeganklikheid)
na lokale
teen … ...meer as die huidige prys ...dieselfde as die huidige prys
Sterk Voorkeur
Links
Sterk Voorkeur
Regs
1 2 3 4 5 6 7 8 9
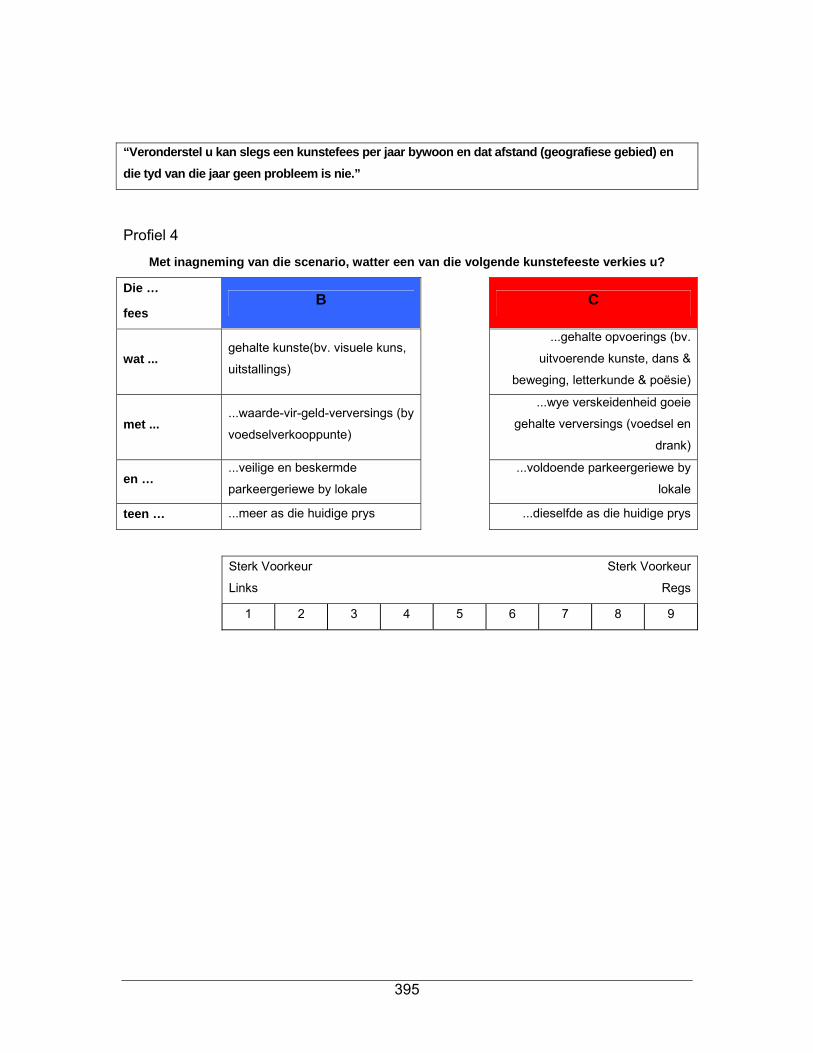
395
“Veronderstel u kan slegs een kunstefees per jaar bywoon en dat afstand (geografiese gebied) en die tyd van die jaar geen probleem is nie.”
Profiel 4
Met inagneming van die scenario, watter een van die volgende kunstefeeste verkies u?
Die …
fees B C
wat ... gehalte kunste(bv. visuele kuns,
uitstallings)
...gehalte opvoerings (bv.
uitvoerende kunste, dans &
beweging, letterkunde & poësie)
met ... ...waarde-vir-geld-verversings (by
voedselverkooppunte)
...wye verskeidenheid goeie
gehalte verversings (voedsel en
drank)
en … ...veilige en beskermde
parkeergeriewe by lokale
...voldoende parkeergeriewe by
lokale
teen … ...meer as die huidige prys ...dieselfde as die huidige prys
Sterk Voorkeur
Links
Sterk Voorkeur
Regs
1 2 3 4 5 6 7 8 9

396
“Veronderstel u kan slegs een kunstefees per jaar bywoon en dat afstand (geografiese gebied) en die tyd van die jaar geen probleem is nie.”
Profiel 5
Met inagneming van die scenario, watter een van die volgende kunstefeeste verkies u?
Die …
fees A B
wat ...
...gehalte musiek (bv. klassieke &
opera, koor & ensemble, kabaret
& musiek, “blues”, rock & jazz)
...gehalte opvoerings (bv.
uitvoerende kunste, dans &
beweging, letterkunde & poësie)
met ...
...wye verskeidenheid goeie
gehalte verversings (voedsel en
drank)
...waarde-vir-geld-verversings (by
voedselverkooppunte)
en … ...voldoende parkeergeriewe by
lokale
...goeie vervoer (toeganklikheid)
na lokale
teen … ...dieselfde as die huidige prys ...minder as die huidige prys
Sterk Voorkeur
Links
Sterk Voorkeur
Regs
1 2 3 4 5 6 7 8 9
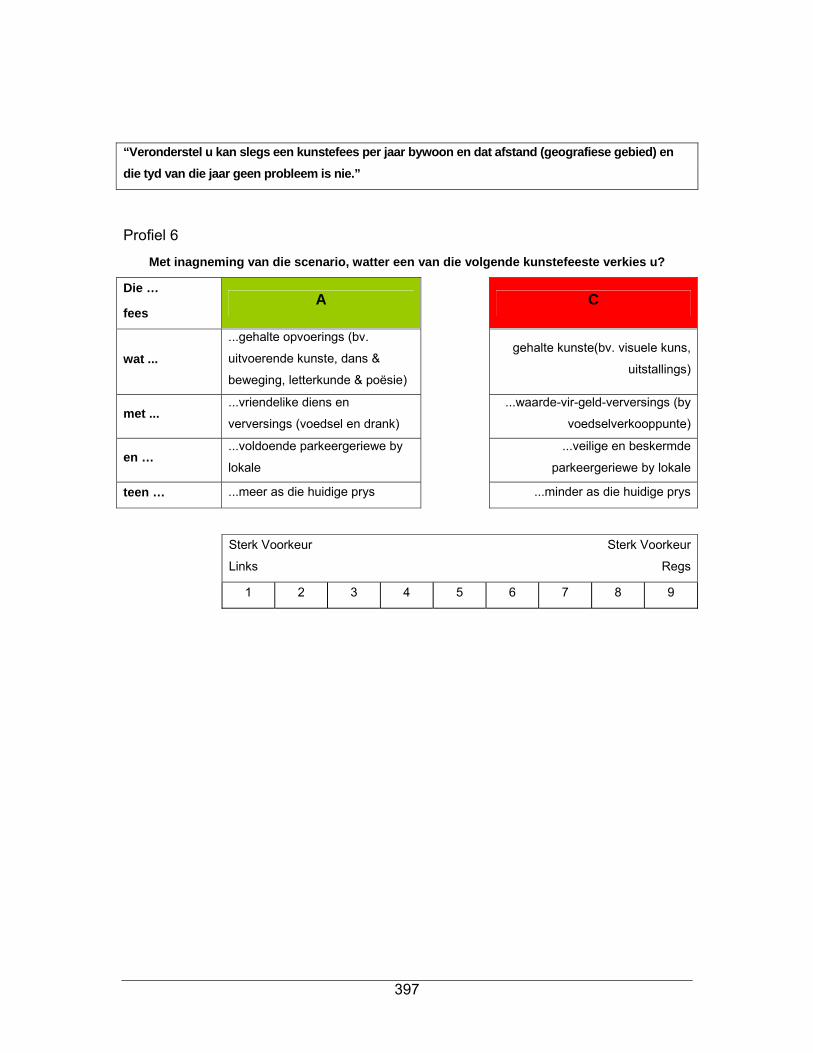
397
“Veronderstel u kan slegs een kunstefees per jaar bywoon en dat afstand (geografiese gebied) en die tyd van die jaar geen probleem is nie.”
Profiel 6
Met inagneming van die scenario, watter een van die volgende kunstefeeste verkies u?
Die …
fees A C
wat ...
...gehalte opvoerings (bv.
uitvoerende kunste, dans &
beweging, letterkunde & poësie)
gehalte kunste(bv. visuele kuns,
uitstallings)
met ... ...vriendelike diens en
verversings (voedsel en drank)
...waarde-vir-geld-verversings (by
voedselverkooppunte)
en … ...voldoende parkeergeriewe by
lokale
...veilige en beskermde
parkeergeriewe by lokale
teen … ...meer as die huidige prys ...minder as die huidige prys
Sterk Voorkeur
Links
Sterk Voorkeur
Regs
1 2 3 4 5 6 7 8 9

398
“Veronderstel u kan slegs een kunstefees per jaar bywoon en dat afstand (geografiese gebied) en die tyd van die jaar geen probleem is nie.”
Profiel 7
Met inagneming van die scenario, watter een van die volgende kunstefeeste verkies u?
Die …
fees C A
wat ...
...gehalte musiek (bv. klassieke &
opera, koor & ensemble, kabaret
& musiek, “blues”, rock & jazz)
gehalte kunste(bv. visuele kuns,
uitstallings)
met ...
...wye verskeidenheid goeie
gehalte verversings (voedsel en
drank)
...vriendelike diens en verversings
(voedsel en drank
en … ...goeie vervoer (toeganklikheid)
na lokale
...veilige en beskermde
parkeergeriewe by lokale
teen … ...dieselfde as die huidige prys ...minder as die huidige prys
Sterk Voorkeur
Links
Sterk Voorkeur
Regs
1 2 3 4 5 6 7 8 9

399
“Veronderstel u kan slegs een kunstefees per jaar bywoon en dat afstand (geografiese gebied) en die tyd van die jaar geen probleem is nie.”
Profiel 8
Met inagneming van die scenario, watter een van die volgende kunstefeeste verkies u?
Die …
fees A B
wat ... gehalte kunste(bv. visuele kuns,
uitstallings)
...gehalte opvoerings (bv.
uitvoerende kunste, dans &
beweging, letterkunde & poësie)
met ... ...waarde-vir-geld-verversings (by
voedselverkooppunte)
...vriendelike diens en verversings
(voedsel en drank)
en … ...goeie vervoer (toeganklikheid)
na lokale
...veilige en beskermde
parkeergeriewe by lokale
teen … ...meer as die huidige prys ...dieselfde as die huidige prys
Sterk Voorkeur
Links
Sterk Voorkeur
Regs
1 2 3 4 5 6 7 8 9

400
“Veronderstel u kan slegs een kunstefees per jaar bywoon en dat afstand (geografiese gebied) en die tyd van die jaar geen probleem is nie.”
Profiel 9
Met inagneming van die scenario, watter een van die volgende kunstefeeste verkies u?
Die …
fees B C
wat ...
...gehalte opvoerings (bv.
uitvoerende kunste, dans &
beweging, letterkunde & poësie)
...gehalte musiek (bv. klassieke &
opera, koor & ensemble, kabaret &
musiek, “blues”, rock & jazz)
met ...
...wye verskeidenheid goeie
gehalte verversings (voedsel en
drank)
...vriendelike diens en verversings
(voedsel en drank
en … ...voldoende parkeergeriewe by
lokale
...veilige en beskermde
parkeergeriewe by lokale
teen … ...minder as die huidige prys ...dieselfde as die huidige prys
Sterk Voorkeur
Links
Sterk Voorkeur
Regs
1 2 3 4 5 6 7 8 9
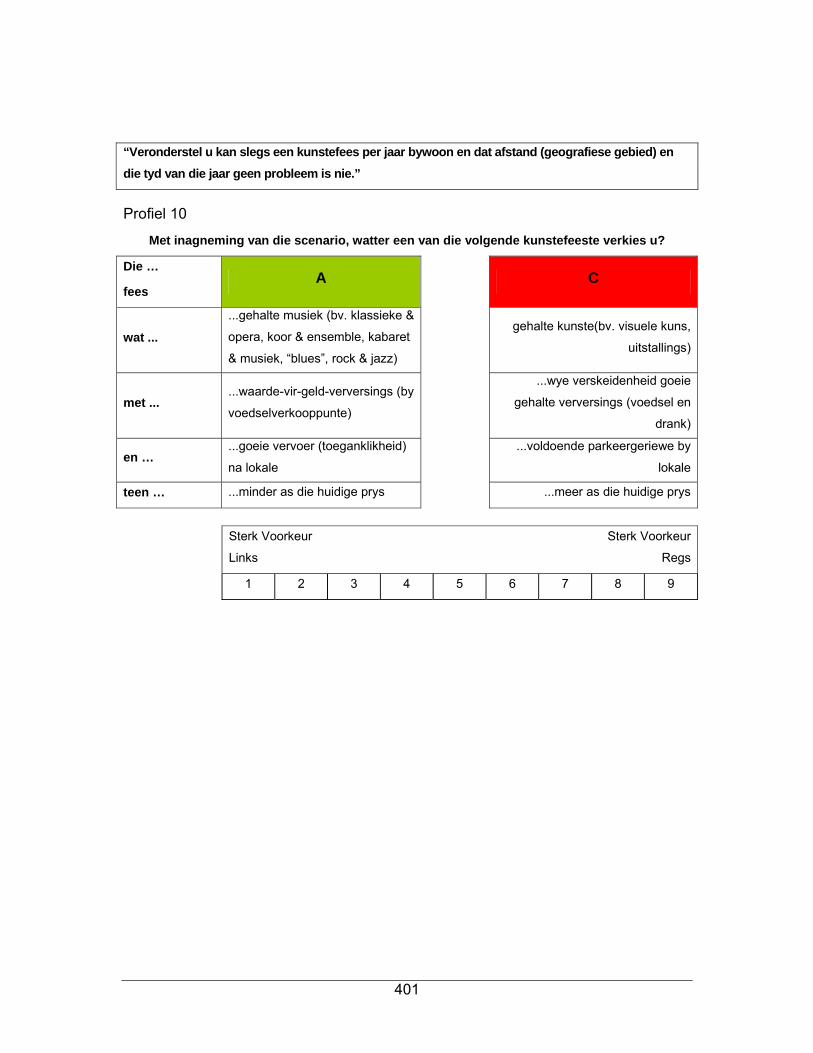
401
“Veronderstel u kan slegs een kunstefees per jaar bywoon en dat afstand (geografiese gebied) en die tyd van die jaar geen probleem is nie.”
Profiel 10
Met inagneming van die scenario, watter een van die volgende kunstefeeste verkies u?
Die …
fees A C
wat ...
...gehalte musiek (bv. klassieke &
opera, koor & ensemble, kabaret
& musiek, “blues”, rock & jazz)
gehalte kunste(bv. visuele kuns,
uitstallings)
met ... ...waarde-vir-geld-verversings (by
voedselverkooppunte)
...wye verskeidenheid goeie
gehalte verversings (voedsel en
drank)
en … ...goeie vervoer (toeganklikheid)
na lokale
...voldoende parkeergeriewe by
lokale
teen … ...minder as die huidige prys ...meer as die huidige prys
Sterk Voorkeur
Links
Sterk Voorkeur
Regs
1 2 3 4 5 6 7 8 9

402
“Veronderstel u kan slegs een kunstefees per jaar bywoon en dat afstand (geografiese gebied) en die tyd van die jaar geen probleem is nie.”
Profiel 11
Met inagneming van die scenario, watter een van die volgende kunstefeeste verkies u?
Die …
fees B C
wat ...
...gehalte musiek (bv. klassieke &
opera, koor & ensemble, kabaret
& musiek, “blues”, rock & jazz)
...gehalte opvoerings (bv.
uitvoerende kunste, dans &
beweging, letterkunde & poësie)
met ... ...vriendelike diens en
verversings (voedsel en drank
...waarde-vir-geld-verversings (by
voedselverkooppunte)
en … ...goeie vervoer (toeganklikheid)
na lokale
...veilige en beskermde
parkeergeriewe by lokale
teen … ...minder as die huidige prys ...meer as die huidige prys
Sterk Voorkeur
Links
Sterk Voorkeur
Regs
1 2 3 4 5 6 7 8 9

403
“Veronderstel u kan slegs een kunstefees per jaar bywoon en dat afstand (geografiese gebied) en die tyd van die jaar geen probleem is nie.”
Profiel 12
Met inagneming van die scenario, watter een van die volgende kunstefeeste verkies u?
Die …
fees C A
wat ...
...gehalte musiek (bv. klassieke &
opera, koor & ensemble, kabaret
& musiek, “blues”, rock & jazz)
gehalte kunste(bv. visuele kuns,
uitstallings)
met ... ...waarde-vir-geld-verversings (by
voedselverkooppunte)
...vriendelike diens en verversings
(voedsel en drank
en … ...veilige en beskermde
parkeergeriewe by lokale
...goeie vervoer (toeganklikheid)
na lokale
teen … ...minder as die huidige prys ...dieselfde as die huidige prys
Sterk Voorkeur
Links
Sterk Voorkeur
Regs
1 2 3 4 5 6 7 8 9

404
“Veronderstel u kan slegs een kunstefees per jaar bywoon en dat afstand (geografiese gebied) en die tyd van die jaar geen probleem is nie.”
Profiel 13
Met inagneming van die scenario, watter een van die volgende kunstefeeste verkies u?
Die …
fees A B
wat ... gehalte kunste(bv. visuele kuns,
uitstallings)
...gehalte opvoerings (bv.
uitvoerende kunste, dans &
beweging, letterkunde & poësie)
met ...
...wye verskeidenheid goeie
gehalte verversings (voedsel en
drank)
...vriendelike diens en verversings
(voedsel en drank
en … ...voldoende parkeergeriewe by
lokale
...goeie vervoer (toeganklikheid)
na lokale
teen … ...minder as die huidige prys ...meer as die huidige prys
Sterk Voorkeur
Links
Sterk Voorkeur
Regs
1 2 3 4 5 6 7 8 9
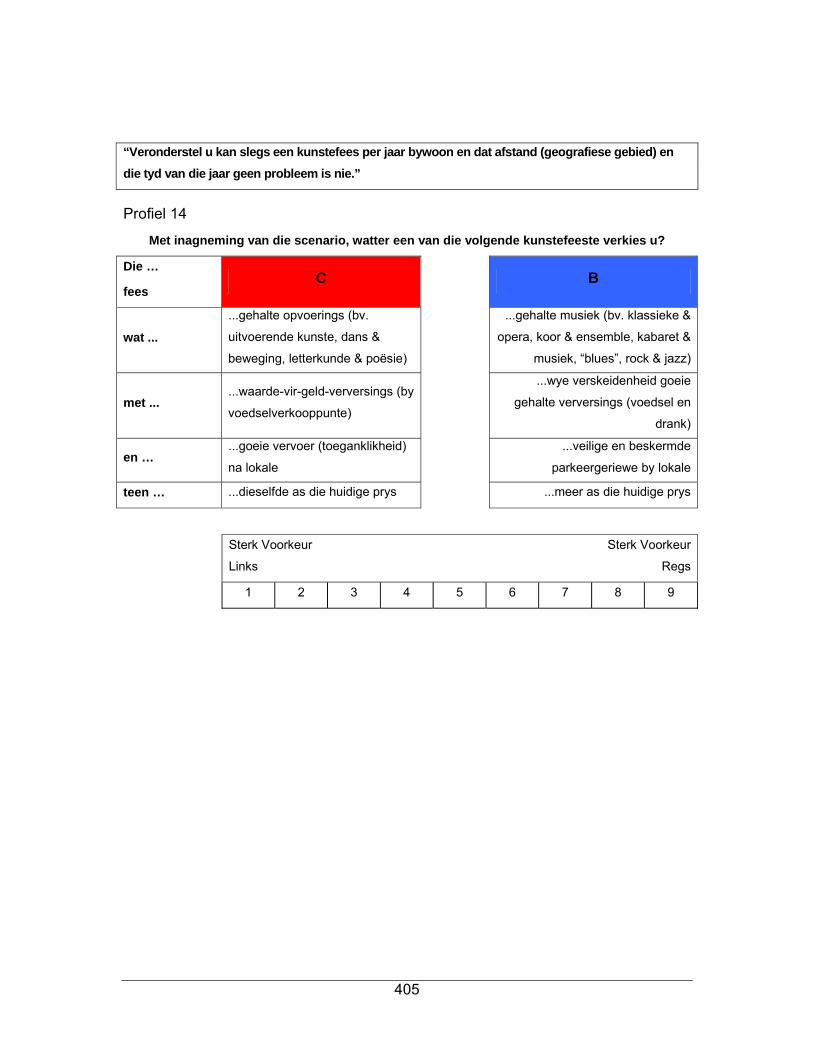
405
“Veronderstel u kan slegs een kunstefees per jaar bywoon en dat afstand (geografiese gebied) en die tyd van die jaar geen probleem is nie.”
Profiel 14
Met inagneming van die scenario, watter een van die volgende kunstefeeste verkies u?
Die …
fees C B
wat ...
...gehalte opvoerings (bv.
uitvoerende kunste, dans &
beweging, letterkunde & poësie)
...gehalte musiek (bv. klassieke &
opera, koor & ensemble, kabaret &
musiek, “blues”, rock & jazz)
met ... ...waarde-vir-geld-verversings (by
voedselverkooppunte)
...wye verskeidenheid goeie
gehalte verversings (voedsel en
drank)
en … ...goeie vervoer (toeganklikheid)
na lokale
...veilige en beskermde
parkeergeriewe by lokale
teen … ...dieselfde as die huidige prys ...meer as die huidige prys
Sterk Voorkeur
Links
Sterk Voorkeur
Regs
1 2 3 4 5 6 7 8 9

406
“Veronderstel u kan slegs een kunstefees per jaar bywoon en dat afstand (geografiese gebied) en die tyd van die jaar geen probleem is nie.”
Profiel 15
Met inagneming van die scenario, watter een van die volgende kunstefeeste verkies u?
Die …
fees C B
wat ... gehalte kunste(bv. visuele kuns,
uitstallings)
...gehalte musiek (bv. klassieke &
opera, koor & ensemble, kabaret &
musiek, “blues”, rock & jazz)
met ...
...wye verskeidenheid goeie
gehalte verversings (voedsel en
drank)
...waarde-vir-geld-verversings (by
voedselverkooppunte)
en … ...goeie vervoer (toeganklikheid)
na lokale
...voldoende parkeergeriewe by
lokale
teen … ...meer as die huidige prys ...dieselfde as die huidige prys
Sterk Voorkeur
Links
Sterk Voorkeur
Regs
1 2 3 4 5 6 7 8 9

407
“Veronderstel u kan slegs een kunstefees per jaar bywoon en dat afstand (geografiese gebied) en die tyd van die jaar geen probleem is nie.”
Profiel 16
Met inagneming van die scenario, watter een van die volgende kunstefeeste verkies u?
Die …
fees B C
wat ...
...gehalte opvoerings (bv.
uitvoerende kunste, dans &
beweging, letterkunde & poësie)
...gehalte musiek (bv. klassieke &
opera, koor & ensemble, kabaret &
musiek, “blues”, rock & jazz)
met ...
...wye verskeidenheid goeie
gehalte verversings (voedsel en
drank)
...vriendelike diens en verversings
(voedsel en drank
en … ...veilige en beskermde
parkeergeriewe by lokale
...voldoende parkeergeriewe by
lokale
teen … ...dieselfde as die huidige prys ...minder as die huidige prys
Sterk Voorkeur
Links
Sterk Voorkeur
Regs
1 2 3 4 5 6 7 8 9

408
APPENDIX B: Conjoint analysis raw data

409
B1: Example of conjoint analysis raw data for 10 respondents (Compact disk of raw data available from author)
Respondent
number TakePart Gender Age Art Festival Language Go Again SecB_1 SecB_2 SecB_3 SecB_4 SecB_5 SecB_6 SecB_7
1 11: Male 1: Between 18 and 30 AARDKLOP Afrikaans 1 3 3 6 7 8 6 7
2 11: Male 1: Between 18 and 30 AARDKLOP Afrikaans 1 8 2 2 8 7 3 3
3 11: Male 1: Between 18 and 30 AARDKLOP Afrikaans 1 8 3 6 8 1 8 9
4 11: Male 1: Between 18 and 30 AARDKLOP Afrikaans 1 4 3 4 7 2 4 8
5 11: Male 1: Between 18 and 30 AARDKLOP Afrikaans 1 2 7 6 3 6 7 1
6 11: Male 1: Between 18 and 30 AARDKLOP Afrikaans 1 8 2 3 6 2 4 3
7 11: Male 1: Between 18 and 30 AARDKLOP Afrikaans 1 9 7 8 2 2 2 2
8 11: Male 1: Between 18 and 30 AARDKLOP Afrikaans 1 7 4 7 8 2 8 3
9 11: Male 1: Between 18 and 30 AARDKLOP Afrikaans 1 9 6 8 7 2 8 8
10 11: Male 1: Between 18 and 30 AARDKLOP Afrikaans 1 6 2 8 7 3 9 9

410
Respondent
number SecB_8 SecB_9 SecB_10 SecB_11 SecB_12 SecB_13 SecB_14 SecB_15 SecB_16 SecC_A SecC_B SecC_C SecC_D SecC_E
1 6 7 4 2 4 2 2 3 6 70 70 100 70 50
2 4 3 2 2 2 1 6 7 1 100 50 80 100 50
3 8 7 6 2 9 7 8 3 9 100 100 80 20 60
4 7 5 1 2 6 2 2 6 8 100 100 70 50 70
5 8 3 2 3 3 6 2 8 2 70 20 80 60 80
6 2 7 6 7 3 3 3 2 7 50 80 90 90 60
7 7 2 3 3 8 3 3 2 1 80 40 100 50 50
8 7 3 3 1 4 1 2 6 4 70 30 40 70 10
9 8 7 1 3 6 2 2 7 8 30 70 90 0 40
10 7 1 2 1 8 2 3 8 9 60 70 100 0 80

411
Respondent
number SecC_F SecC_G SecC_H SecC_I SecC_J SecC_K SecC_L SecC_M SecC_N SecC_O Qualification Family Life Cyle
1 70 10 10 70 80 0 10 60 10 104: Higher Diploma / Degree 2: Young Adult
2 10 0 0 30 10 0 0 0 90 04: Higher Diploma / Degree 3: Young Couple
3 100 30 60 100 100 40 20 10 0 02: Standard 10 2: Young Adult
4 20 50 20 40 40 30 70 40 50 104: Higher Diploma / Degree 2: Young Adult
5 20 20 20 90 50 0 0 0 0 802: Standard 10 2: Young Adult
6 100 0 0 60 100 40 50 40 40 802: Standard 10 2: Young Adult
7 50 20 90 80 80 20 20 70 20 204: Higher Diploma / Degree 2: Young Adult
8 80 100 100 70 80 40 10 90 30 104: Higher Diploma / Degree 2: Young Adult
9 30 20 50 100 70 80 90 0 60 402: Standard 10 2: Young Adult
10 80 0 30 100 100 100 90 10 0 1002: Standard 10 2: Young Adult
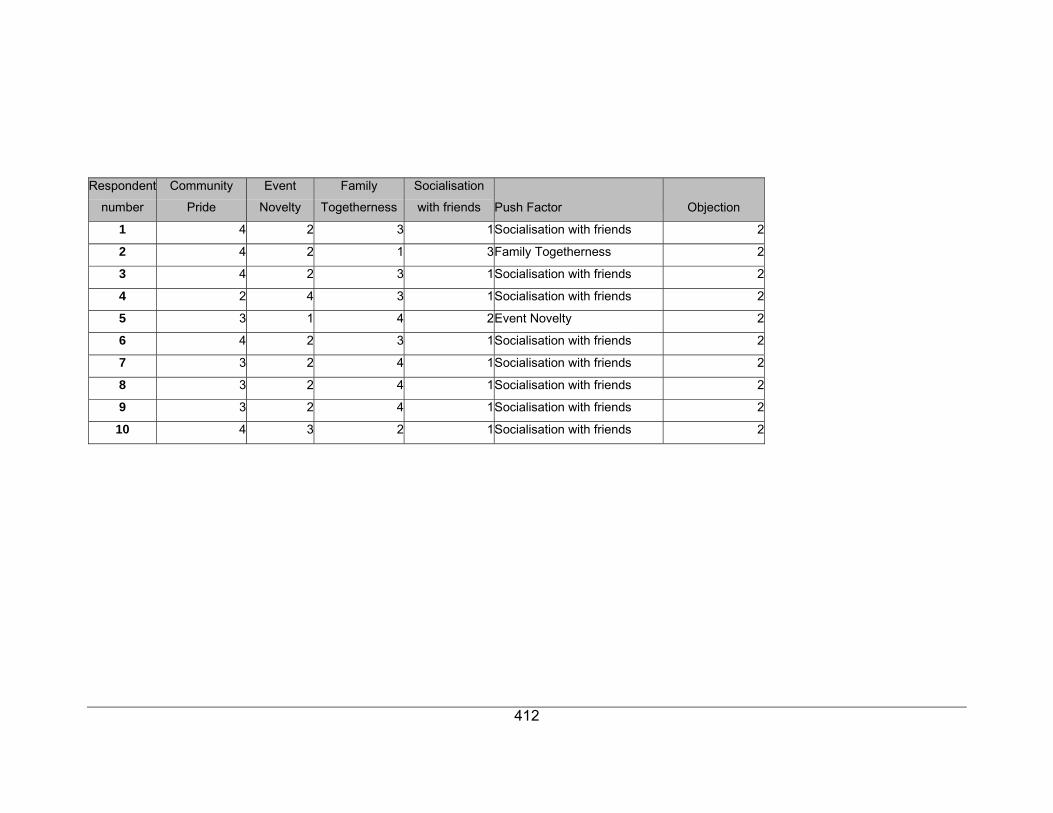
412
Respondent
number
Community
Pride
Event
Novelty
Family
Togetherness
Socialisation
with friends Push Factor Objection
1 4 2 3 1Socialisation with friends 2
2 4 2 1 3Family Togetherness 2
3 4 2 3 1Socialisation with friends 2
4 2 4 3 1Socialisation with friends 2
5 3 1 4 2Event Novelty 2
6 4 2 3 1Socialisation with friends 2
7 3 2 4 1Socialisation with friends 2
8 3 2 4 1Socialisation with friends 2
9 3 2 4 1Socialisation with friends 2
10 4 3 2 1Socialisation with friends 2
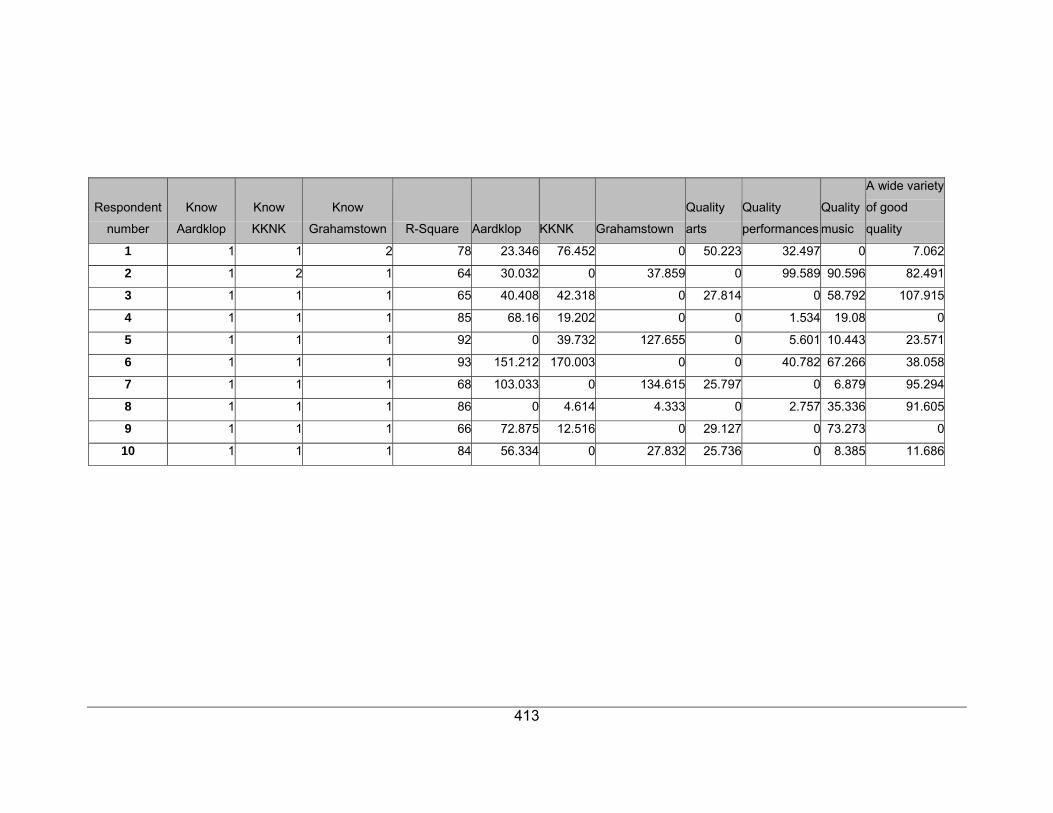
413
Respondent
number
Know
Aardklop
Know
KKNK
Know
Grahamstown R-Square Aardklop KKNK Grahamstown
Quality
arts
Quality
performances
Quality
music
A wide variety
of good
quality
1 1 1 2 78 23.346 76.452 0 50.223 32.497 0 7.062
2 1 2 1 64 30.032 0 37.859 0 99.589 90.596 82.491
3 1 1 1 65 40.408 42.318 0 27.814 0 58.792 107.915
4 1 1 1 85 68.16 19.202 0 0 1.534 19.08 0
5 1 1 1 92 0 39.732 127.655 0 5.601 10.443 23.571
6 1 1 1 93 151.212 170.003 0 0 40.782 67.266 38.058
7 1 1 1 68 103.033 0 134.615 25.797 0 6.879 95.294
8 1 1 1 86 0 4.614 4.333 0 2.757 35.336 91.605
9 1 1 1 66 72.875 12.516 0 29.127 0 73.273 0
10 1 1 1 84 56.334 0 27.832 25.736 0 8.385 11.686
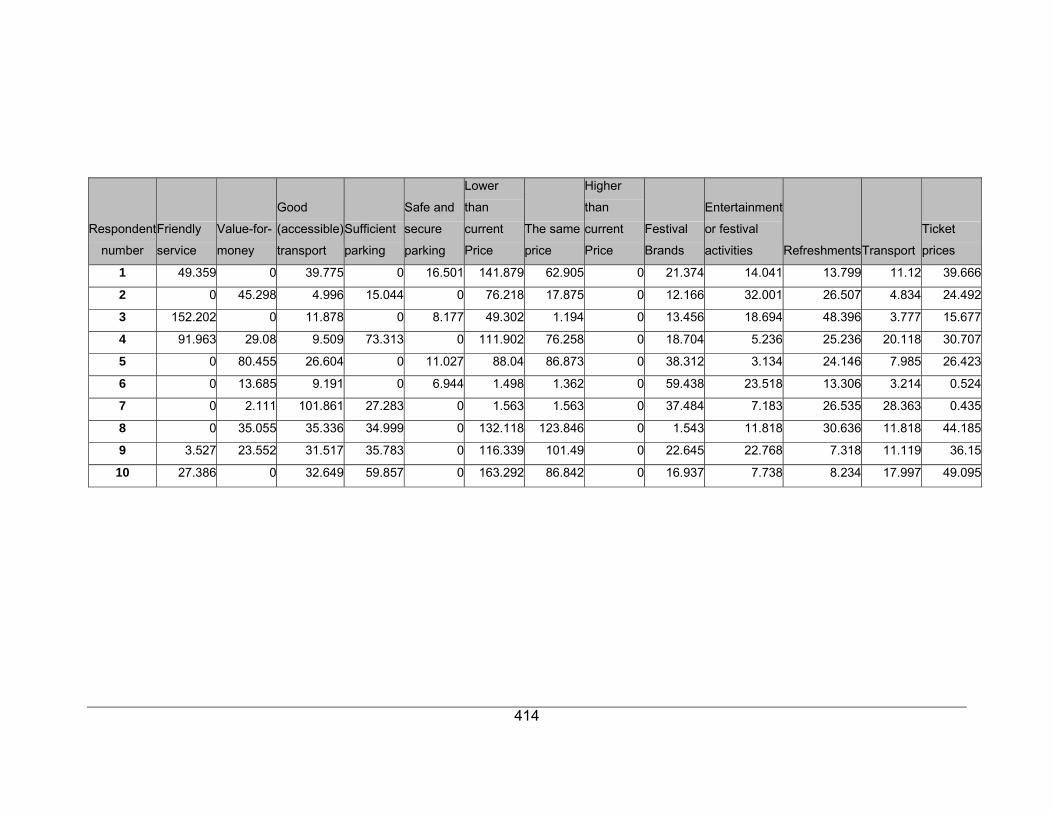
414
Respondent
number
Friendly
service
Value-for-
money
Good
(accessible)
transport
Sufficient
parking
Safe and
secure
parking
Lower
than
current
Price
The same
price
Higher
than
current
Price
Festival
Brands
Entertainment
or festival
activities RefreshmentsTransport
Ticket
prices
1 49.359 0 39.775 0 16.501 141.879 62.905 0 21.374 14.041 13.799 11.12 39.666
2 0 45.298 4.996 15.044 0 76.218 17.875 0 12.166 32.001 26.507 4.834 24.492
3 152.202 0 11.878 0 8.177 49.302 1.194 0 13.456 18.694 48.396 3.777 15.677
4 91.963 29.08 9.509 73.313 0 111.902 76.258 0 18.704 5.236 25.236 20.118 30.707
5 0 80.455 26.604 0 11.027 88.04 86.873 0 38.312 3.134 24.146 7.985 26.423
6 0 13.685 9.191 0 6.944 1.498 1.362 0 59.438 23.518 13.306 3.214 0.524
7 0 2.111 101.861 27.283 0 1.563 1.563 0 37.484 7.183 26.535 28.363 0.435
8 0 35.055 35.336 34.999 0 132.118 123.846 0 1.543 11.818 30.636 11.818 44.185
9 3.527 23.552 31.517 35.783 0 116.339 101.49 0 22.645 22.768 7.318 11.119 36.15
10 27.386 0 32.649 59.857 0 163.292 86.842 0 16.937 7.738 8.234 17.997 49.095
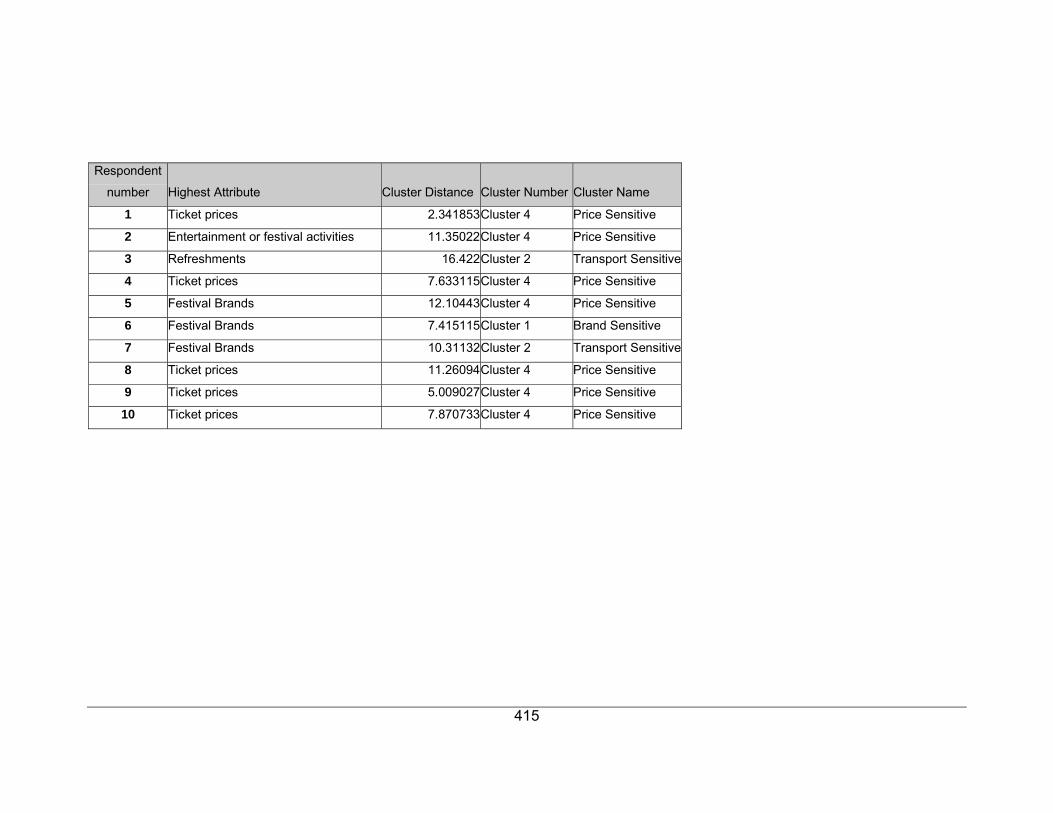
415
Respondent
number Highest Attribute Cluster Distance Cluster Number Cluster Name
1 Ticket prices 2.341853Cluster 4 Price Sensitive
2 Entertainment or festival activities 11.35022Cluster 4 Price Sensitive
3 Refreshments 16.422Cluster 2 Transport Sensitive
4 Ticket prices 7.633115Cluster 4 Price Sensitive
5 Festival Brands 12.10443Cluster 4 Price Sensitive
6 Festival Brands 7.415115Cluster 1 Brand Sensitive
7 Festival Brands 10.31132Cluster 2 Transport Sensitive
8 Ticket prices 11.26094Cluster 4 Price Sensitive
9 Ticket prices 5.009027Cluster 4 Price Sensitive
10 Ticket prices 7.870733Cluster 4 Price Sensitive
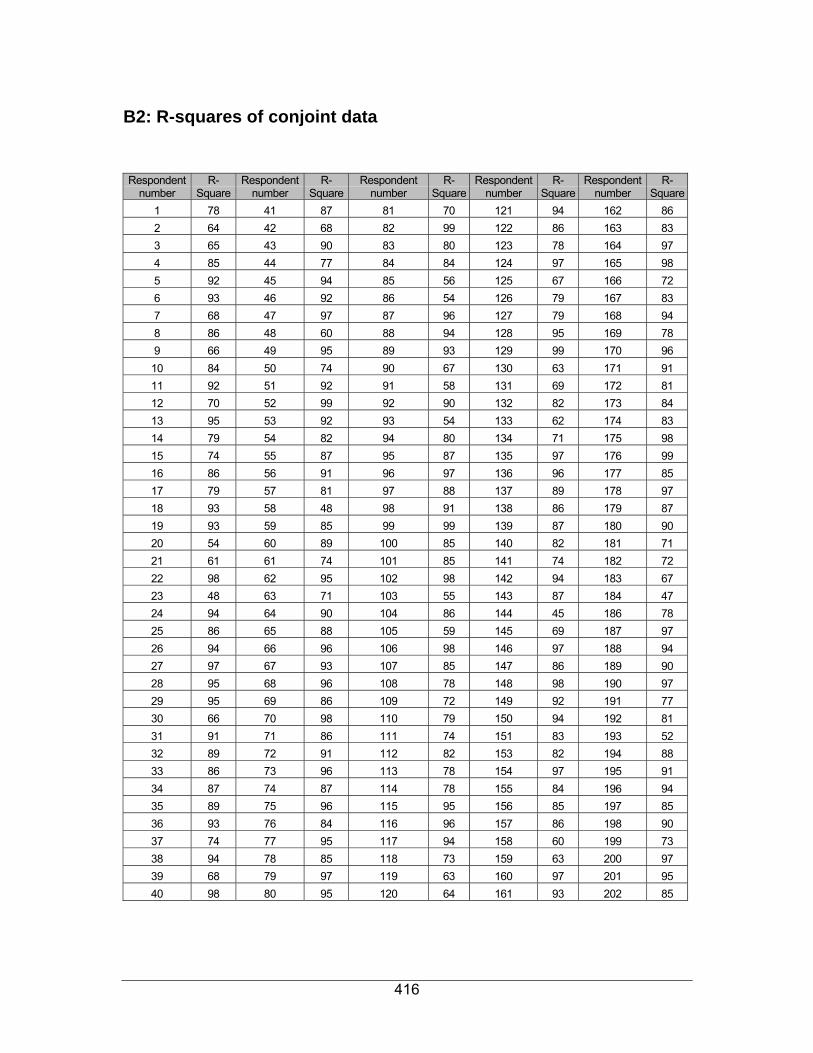
416
B2: R-squares of conjoint data
Respondent number
R-Square
Respondent number
R-Square
Respondent number
R-Square
Respondentnumber
R-Square
Respondent number
R-Square
1 78 41 87 81 70 121 94 162 86 2 64 42 68 82 99 122 86 163 83 3 65 43 90 83 80 123 78 164 97 4 85 44 77 84 84 124 97 165 98 5 92 45 94 85 56 125 67 166 72 6 93 46 92 86 54 126 79 167 83 7 68 47 97 87 96 127 79 168 94 8 86 48 60 88 94 128 95 169 78 9 66 49 95 89 93 129 99 170 96 10 84 50 74 90 67 130 63 171 91 11 92 51 92 91 58 131 69 172 81 12 70 52 99 92 90 132 82 173 84 13 95 53 92 93 54 133 62 174 83 14 79 54 82 94 80 134 71 175 98 15 74 55 87 95 87 135 97 176 99 16 86 56 91 96 97 136 96 177 85 17 79 57 81 97 88 137 89 178 97 18 93 58 48 98 91 138 86 179 87 19 93 59 85 99 99 139 87 180 90 20 54 60 89 100 85 140 82 181 71 21 61 61 74 101 85 141 74 182 72 22 98 62 95 102 98 142 94 183 67 23 48 63 71 103 55 143 87 184 47 24 94 64 90 104 86 144 45 186 78 25 86 65 88 105 59 145 69 187 97 26 94 66 96 106 98 146 97 188 94 27 97 67 93 107 85 147 86 189 90 28 95 68 96 108 78 148 98 190 97 29 95 69 86 109 72 149 92 191 77 30 66 70 98 110 79 150 94 192 81 31 91 71 86 111 74 151 83 193 52 32 89 72 91 112 82 153 82 194 88 33 86 73 96 113 78 154 97 195 91 34 87 74 87 114 78 155 84 196 94 35 89 75 96 115 95 156 85 197 85 36 93 76 84 116 96 157 86 198 90 37 74 77 95 117 94 158 60 199 73 38 94 78 85 118 73 159 63 200 97 39 68 79 97 119 63 160 97 201 95 40 98 80 95 120 64 161 93 202 85
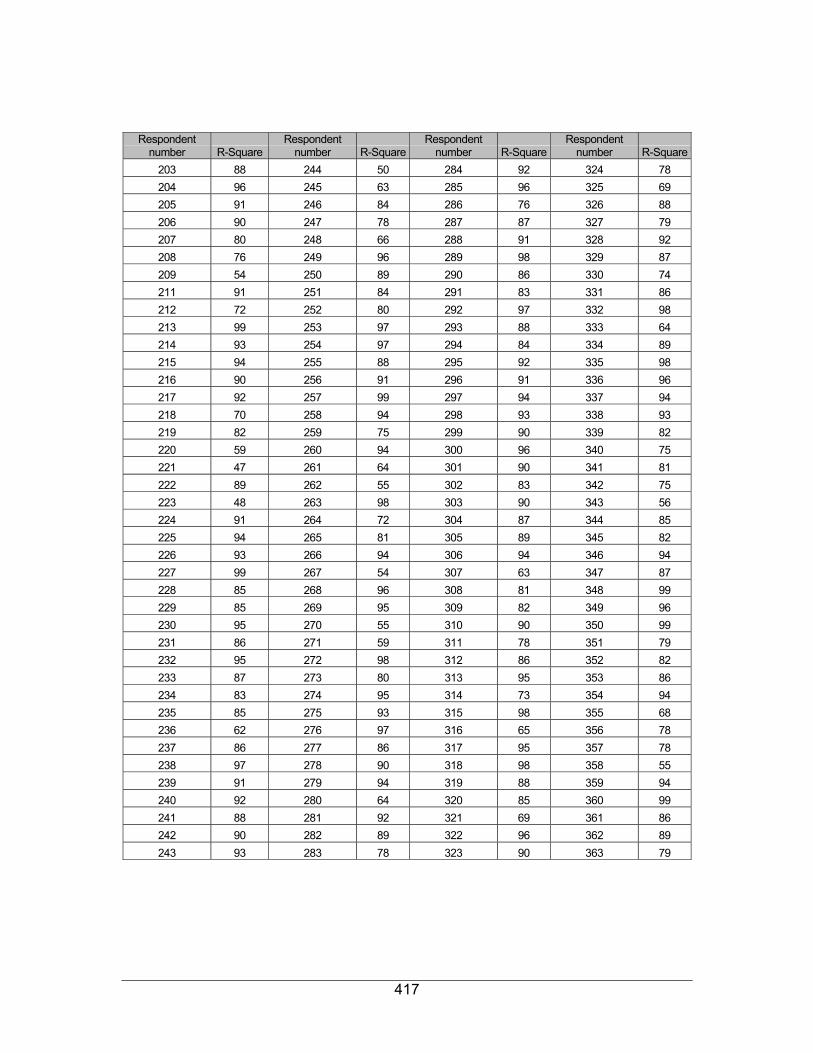
417
Respondent
number R-Square Respondent
number R-SquareRespondent
number R-SquareRespondent
number R-Square203 88 244 50 284 92 324 78 204 96 245 63 285 96 325 69 205 91 246 84 286 76 326 88 206 90 247 78 287 87 327 79 207 80 248 66 288 91 328 92 208 76 249 96 289 98 329 87 209 54 250 89 290 86 330 74 211 91 251 84 291 83 331 86 212 72 252 80 292 97 332 98 213 99 253 97 293 88 333 64 214 93 254 97 294 84 334 89 215 94 255 88 295 92 335 98 216 90 256 91 296 91 336 96 217 92 257 99 297 94 337 94 218 70 258 94 298 93 338 93 219 82 259 75 299 90 339 82 220 59 260 94 300 96 340 75 221 47 261 64 301 90 341 81 222 89 262 55 302 83 342 75 223 48 263 98 303 90 343 56 224 91 264 72 304 87 344 85 225 94 265 81 305 89 345 82 226 93 266 94 306 94 346 94 227 99 267 54 307 63 347 87 228 85 268 96 308 81 348 99 229 85 269 95 309 82 349 96 230 95 270 55 310 90 350 99 231 86 271 59 311 78 351 79 232 95 272 98 312 86 352 82 233 87 273 80 313 95 353 86 234 83 274 95 314 73 354 94 235 85 275 93 315 98 355 68 236 62 276 97 316 65 356 78 237 86 277 86 317 95 357 78 238 97 278 90 318 98 358 55 239 91 279 94 319 88 359 94 240 92 280 64 320 85 360 99 241 88 281 92 321 69 361 86 242 90 282 89 322 96 362 89 243 93 283 78 323 90 363 79

418
Respondent
number R-
Square 364 87 365 85 366 44 367 95 368 91 369 90 370 83 371 78 372 84 373 95 374 79 375 98 376 86 377 84 378 75 379 91 380 80