
Labour market outcomes of immigrants in a South European country: do race and religion matter?
No. 0321
Social Protection Discussion Paper Series
Trends in the Youth Labour Market in Developing and Transition Countries
Niall O’Higgins
October 2003
Social Protection Unit
Human Development Network
The World Bank
Social Protection Discussion Papers are not formal publications of the World Bank. They present preliminary and unpolished results of analysis that are circulated to encourage discussion and comment; citation and the use of such a paper should take account of its provisional character. The findings, interpretations, and conclusions expressed in this paper are entirely those of the author(s) and should not be attributed in any manner to the World Bank, to its affiliated organizations or to members of its Board of Executive Directors or the countries they represent.
For free copies of this paper, please contact the Social Protection Advisory Service, The World Bank, 1818 H Street, N.W., Washington, D.C. 20433 USA. Telephone: (202) 458-5267, Fax: (202) 614-0471, E-mail: [email protected]. Or visit the Social Protection website at http://www.worldbank.org/sp.

Trends in the Youth Labour Market in Developing and Transition Countries
Niall O’Higgins
October 2003
1
Trends in the Youth Labour Market in Developing and Transition Countries
Niall O’Higgins*
1. INTRODUCTION
This paper looks at youth labour market trends concentrating on developing and
transition countries. Questions relating to the integration of young people into decent work
have in recent times once again begun to occupy a central position in Government Policy
issues. Recently co-ordinated efforts also at the international level have begun to make
themselves felt. In particular, on the initiative of Kofi Annan, UN Secretary-General, the
Youth Employment Network (YEN) was established. This is a joint effort of the United
nations, the World Bank and the ILO and has provided a focus for the work of these
organisations on problems related to youth employment and unemployment. This paper aims
to provide a contribution to debate on the issues by giving an overview of trends in the youth
labour market, principally in Transition and developing countries.
In this section, after giving an outline of the paper, some basic definitional issues are
dealt with. In section two, the paper then looks at long-run trends in some broad aggregates
relevant to youth labour markets. The section discusses long-run movements in population
and population share, labour force and labour force participation, education and child labour.
The third section then considers labour market outcomes. The discussion centres on which
*The author Niall O’Higgins, professor, Department of Economics and Statistics, University of Salerno. E-mail address: [email protected] prepared this paper for the Youth Employment Workshop, World Bank, Washington DC, June2, 2003. I wish, above all, to acknowledge the enormous amount of labour embodied in the information presented in these pages, in particular, on the part of people working for national and international agencies responsible for the collection and compilation of the data employed here. This I have partaken of freely. For this work, and the opportunity to exploit it, I am most grateful. much of the analysis included here would not have been, indeed were not, possible even five years ago. I wish also to thank participants at the World Bank seminar for useful comments. Any additional comments would of course be most welcome.

2
and whose outcomes are appropriate to examine as well as their determinants. The fourth,
concluding section draws out some of the implications of the preceding analysis for policy,
research and data collection purposes.
Before embarking on the main discussion brief mention should be made of some
underlying definitional issues. The paper fairly rigidly employs the standard UN definition of
young people as those belonging to the 15-24 age-group, with the lower limit adjusting to
accommodate variations in minimum school- leaving age. Undoubtedly socioeconomic,
cultural and institutional contexts vary markedly across countries. The appropriate definition
of what constitutes a young person (or a child or an adult) will consequently vary with them.
There is no reason why countries, in formulating their youth employment policies, should
adhere rigidly to such definitions. Indeed, they do not. However, for the purposes of looking
at the bigger picture, uniformity is an asset, and the ‘15-24’ definition of the young is both
reasonable and useful, above-all, for comparisons across time and countries.
A word also about the countries under scrutiny here. What constitutes a ‘developing’
or a ‘transition’ country will vary with time and circumstance. On the other hand, as noted
above, uniformity and stability in categories is useful for data analysis particularly of the type
undertaken here across countries and time. This can lead to oddities. In the paper, data on
OECD countries are employed to examine specific questions for a subset of ‘transition’ and
‘developing’ countries. Yet, ‘OECD’ is often used as a synonym for ‘industrialised’ in
describing countries. Moreover, the category ‘transition country’ is qualitatively different
from ‘industrialised’ and ‘developing’ which are, conceptually at least, mutually exclusive.
For the purposes of the analysis of labour markets, the ‘Transition’ countries of Central and
Eastern Europe have at least as much in common with their ‘Industrialised’ neighbours in
Western Europe as they do with China.
Having introduced these caveats, in what follows I apply in standard fashion, and
without further consideration, the age and country classification commonly employed by data
collection agencies and analysts.
3
2. LONG-RUN TRENDS
2.1. Population and Labour force
Let us take a look at some of the longer-run trends affecting youth labour markets all
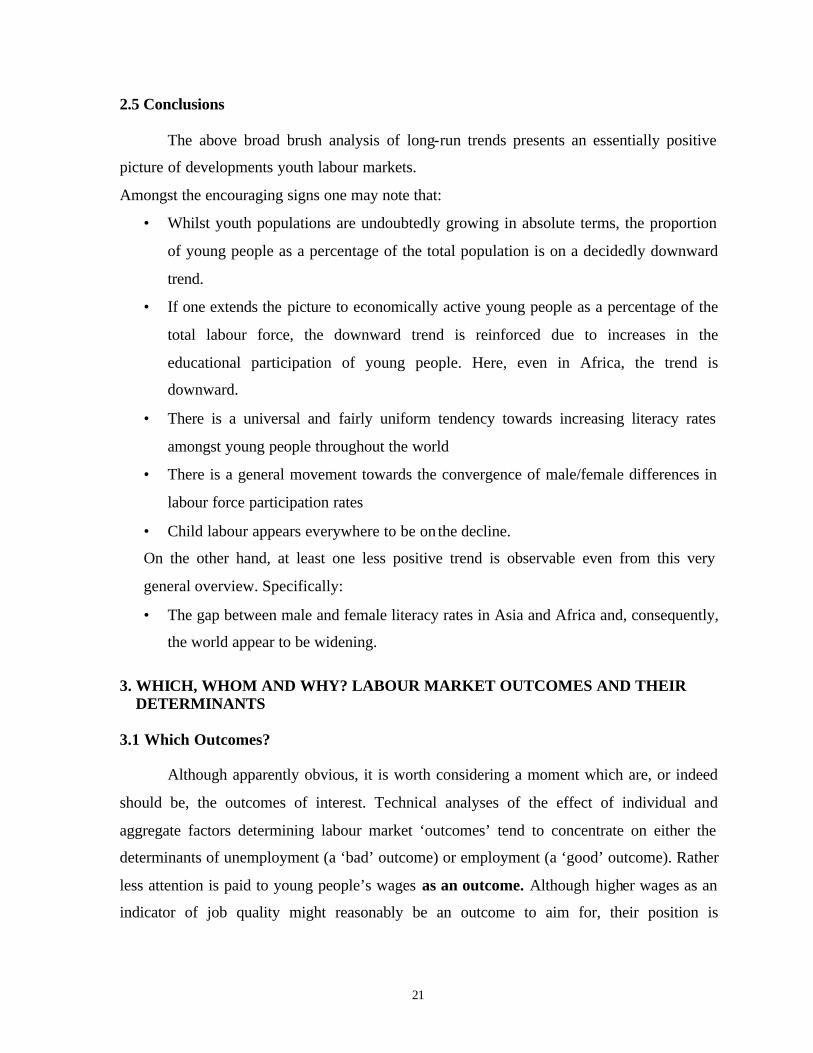
over the world. An obvious starting point is the growth in youth populations. Not
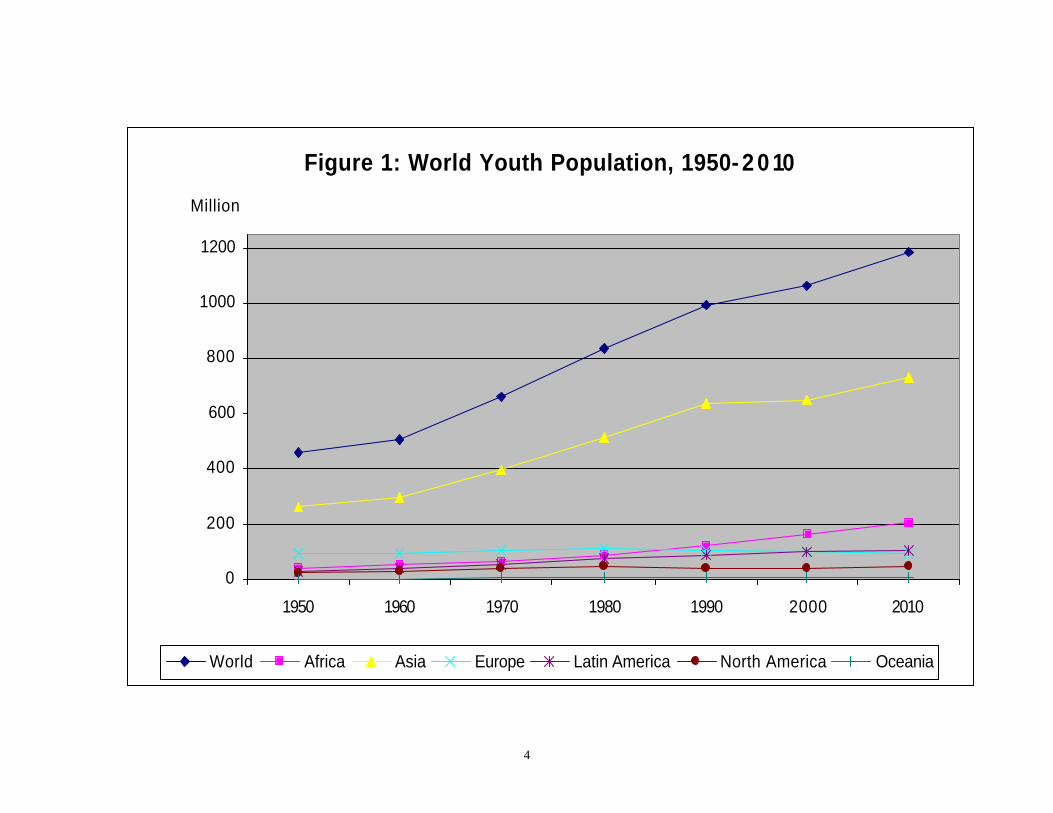
infrequently, rapidly growing youth populations are seen as a cause for concern1. Figure 12
illustrates the growth in youth populations for the major regions on the world over the period
1950-2010. Evidently the youth population has been and continues to grow rapidly. This is
particularly the case in Asia where, by 2000, young people in that region constituted over
61% of the world’s young people. Although of less significance numerically, the fastest
growing young populations are to be found in Africa3.
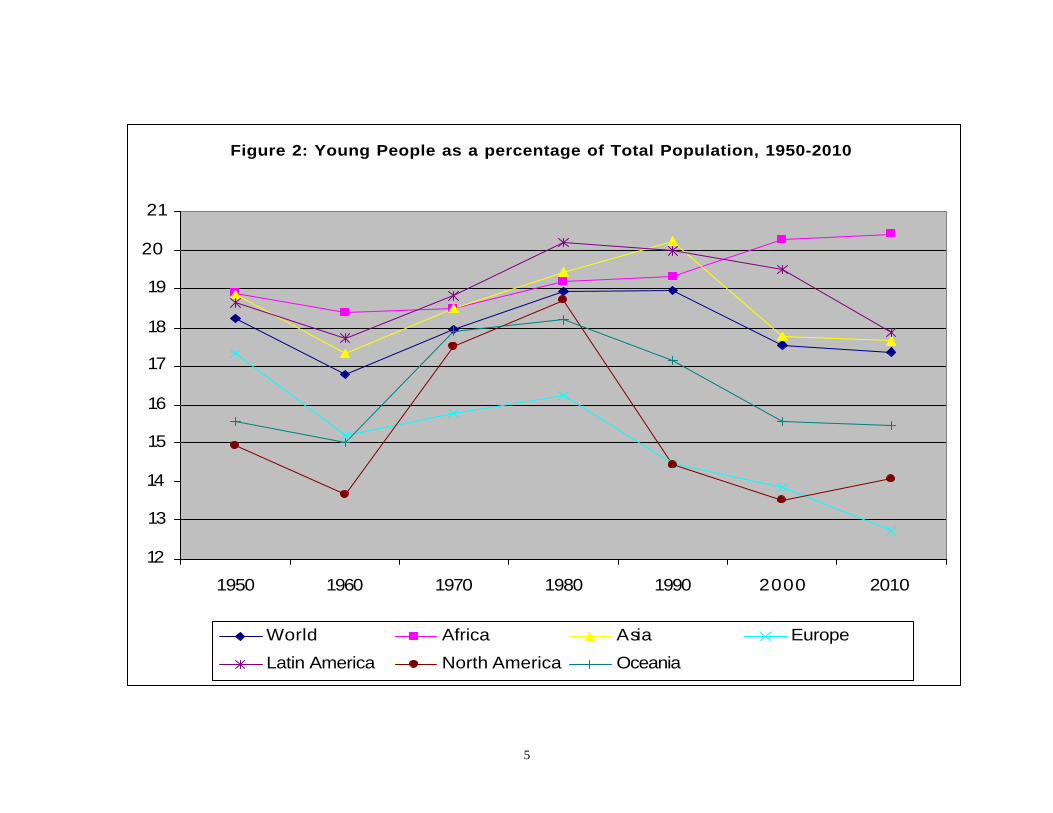
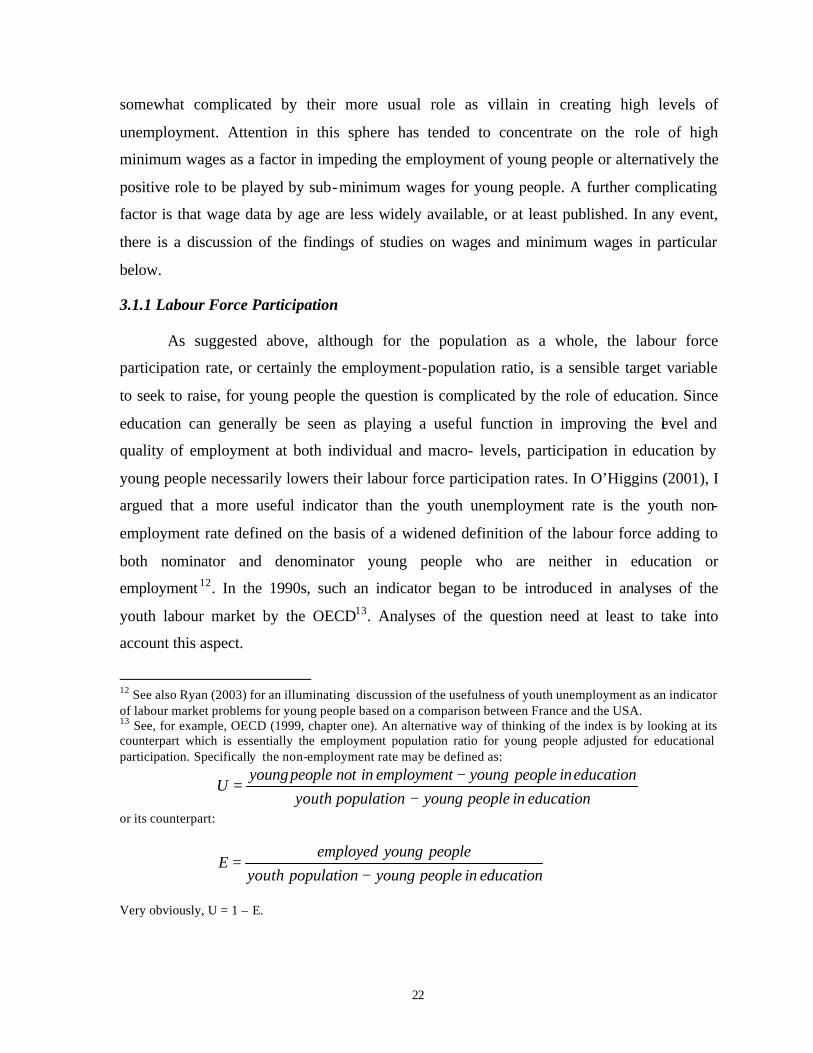
However, a number of observations are in order. First, the proportion of young people
in the total population has actually been falling in Europe, Latin America and the Caribbean,
North America and Oceania since 1980, and in Asia since 1990. Only in Africa is the
proportion expected to continue to grow into the new century (figure 2).
1 See, for example, Jones (1997) on Asia.. 2 Data Sources for the figures and table reported in this paper are given in an appendix. 3 Indeed, The proportion of Asians in the World youth population has actually fallen from a little over 64% in 1990.
4
Figure 1: World Youth Population, 1950- 2 0 10
0
200
400
600
800
1000
1200
1950 1960 1970 1980 1990 2000 2010
World Africa Asia Europe Latin America North America Oceania
Million
5
Figure 2: Young People as a percentage of Total Population, 1950-2010
12
13
14
15
16
17
18
19
20
21
1950 1960 1970 1980 1990 2000 2010
World Africa Asia Europe
Latin America North America Oceania
6
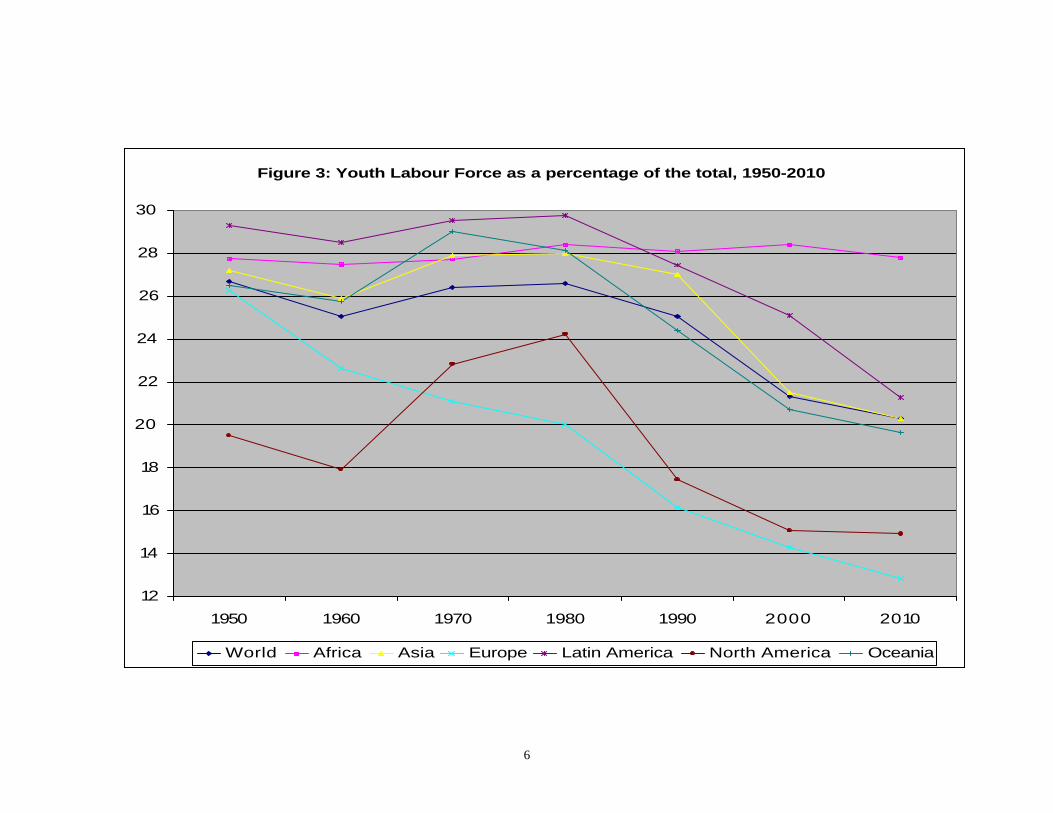
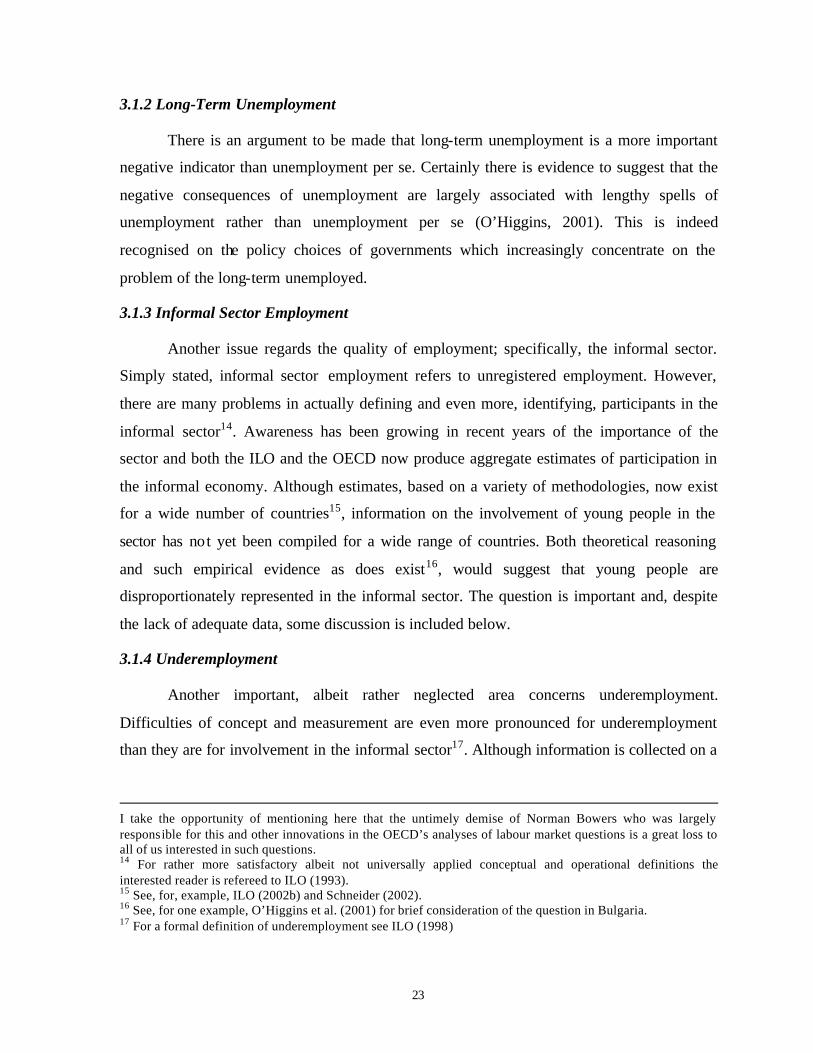
Figure 3: Youth Labour Force as a percentage of the total, 1950-2010
12
14
16
18
20
22
24
26
28
30
1950 1960 1970 1980 1990 2000 2010
World Africa Asia Europe Latin America North America Oceania
7
Second, if one considers the labour force, the trend is even more uniform. Even in
Africa, the youth labour force is expected to fall as a percentage of the total labour force
between 2000 and 2010. This reflects falling labour force participation rates amongst young
people. In as much as this is the result of increased participation in education as opposed to
higher levels of discouraged young workers, this in itself is a positive trend to which I will
return later.
Third, in recent years some questions have been asked concerning the effects of
demographic changes using more rigorous analyses. The latest emergence of the debate can
be dated to Korenman and Neumark’s 1997 paper on the effects of the youth share of the
population on youth unemployment rates4. Looking at OECD countries, they found an
elasticity of youth unemployment to the youth share in total population of around 0.5. This is
significantly lower than the elasticity found with respect to the adult unemployment rate of
0.7. This suggests that aggregate economic conditions determining both youth and adult
unemployment are more important than demographic changes. Furthermore, O’Higgins
(2001, chapter 3, Table 3.1) has estimated a similar specification to Korenman & Neumark’s,
the principal difference being that the effects for young adults (20-24) and teenagers (15-19)
are estimated separately. The results for teenagers are qualitatively similar to those found by
Korenman & Neumark, however, for young adults the effects of adult unemployment
completely dominate the effects of the youth population share which is not statistically
significant. A slightly different approach is taken by Shimer (1999). In this paper, the author
concentrates on the effect of the share of youth population on the unemployment and labour
force participation rates of different age groups leaving out of the equation (literally) the
effects of the adult unemployment rate on young people. The analysis considers state level
data for the USA over nearly thirty years. He finds that a higher youth population share
actually reduces the unemployment rate and raises the labour force participation rate of
young people. This apparently surprising result is supported by the plausible reasoning that
4 Korenman & Neumark (1997). Of course the debate is much older, particularly in the United states where papers through from the 1970s to the early 1990s predicted and confirmed a negative effect of the US Baby Boom on unemployment rates. See, for example, Flaim (1979 & 1990) and Gordon (1992).
8
labour markets with more young people tend to be more flexible and in such a context there
are more incentives for employers to create employment. These issues are returned to below,
however, it is interesting to note at this stage that the rather automatic assumption that having
more young people around creates additional pressures on the labour market forced to
accommodate them may be misleading.
2.2 Education
It is widely held that raising the educational level of young people (as indeed for
older people) is likely to raise employment at both individual and aggregate levels. Again,
this is returned to in a little more detail below. However, looking at the longer-run trends, it
is encouraging to note that, almost universally, educational levels are on a very definite
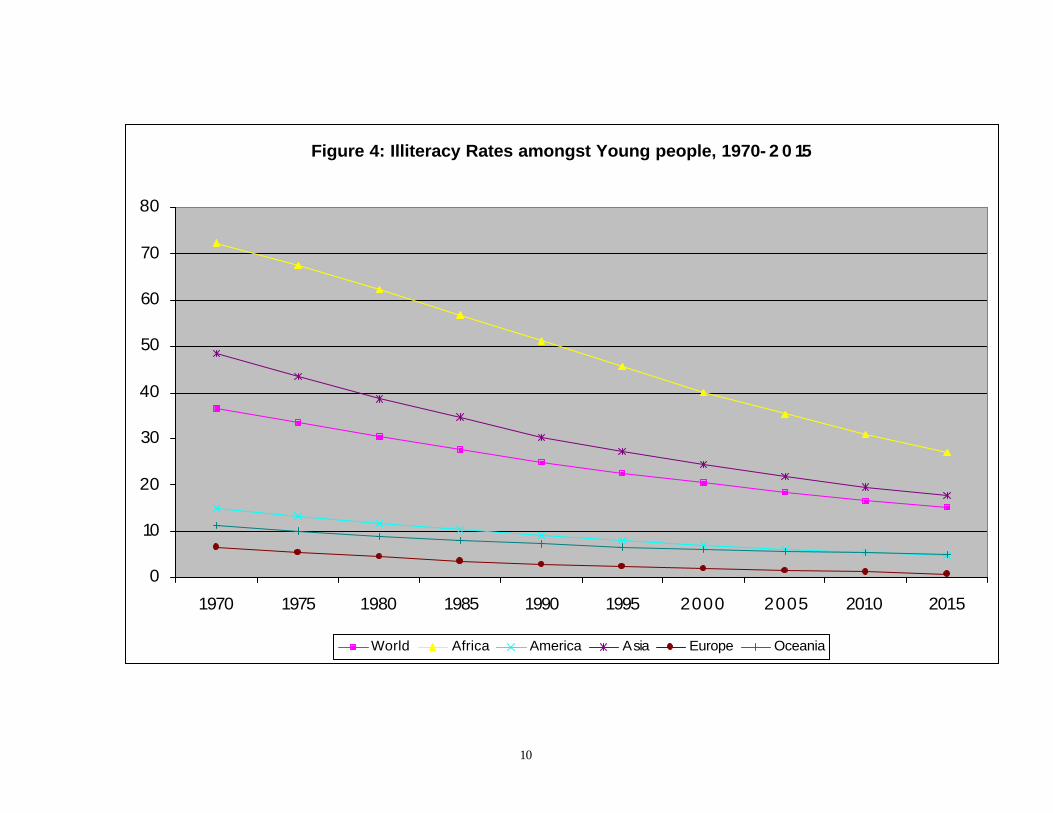
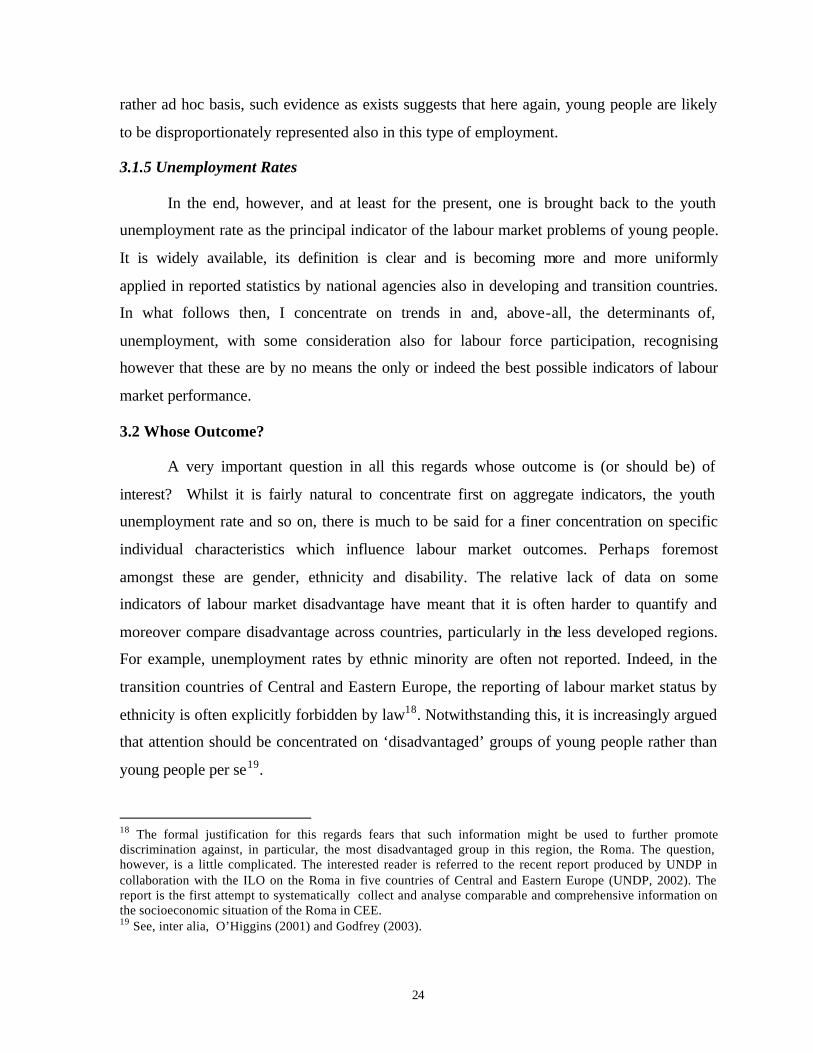
upward trend at least as regards broad regional aggregates. Figure 4 illustrates this trend. The
figure reports the estimated and projected illiteracy rates of young people (15-24) between
1970 and 2015 which I take here as a proxy for more general trends in educational levels.
Encouraging is the fact that illiteracy rates have fallen off sharply since 1970. Also
encouraging, albeit not very surprising given the starting point, is that the reduction is
slightly more marked in Africa and Asia where, by 2015, illiteracy rates are expected to have
fallen to one third of their 1970 levels.
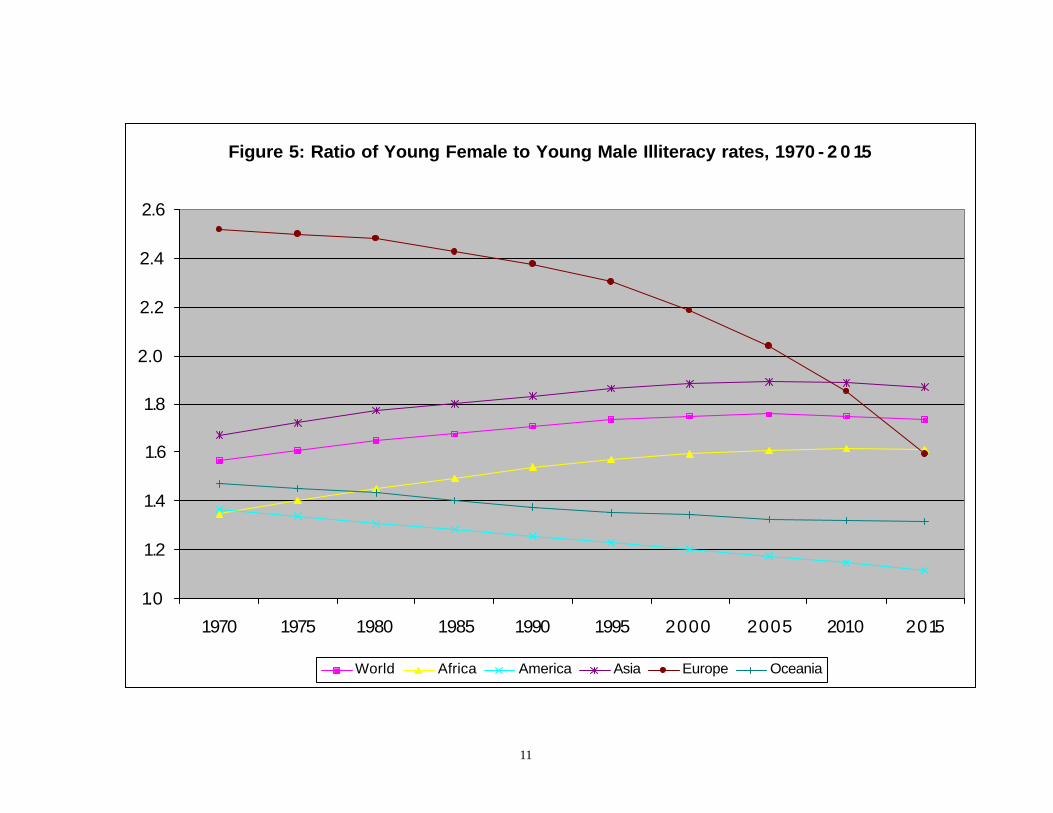
On the other hand, these figures hide a significant distinction between young men and
young women. Figure 5 reports the ratio of illiteracy rates of young women to that of young
men over the period. Whilst, in America, Oceania and above all Europe, the gap between
young women and young men appears to be narrowing, in Asia and Africa the tendency is
towards a wider gap with a slight tendency in the projections to fall between 2005 or 2010
and 2015. Moreover, in Europe, where the gap was most marked in 1970, the strong
downward tendency observable is only sufficient to bring this region in line with Africa by
2015. Finally, one might observe that only in America are illiteracy rates anywhere near the
one-to-one level as regards young men and young women.
Returning to the bright side, in recent years interest has developed in looking at
inequality in the education. One recent paper by Thomas, Wang & Fan (2000), suggests that

9
greater equality in education is associated with greater educational participation. Although
the paper makes no cla im to establish a causative relationship between the two, the
uniformity of the relationship, in the presence of widely increasing educational levels is
certainly a positive finding5.
5 I have some doubts, however, as to the appropriateness of the Gini coefficient in this context and wonder whether an Atkinson type index of inequality, or possibly a generalised Gini might not be more illuminative. Essentially the question concerns the relative weights attributed to different levels of variable of interest, in this case educational participation. For education, since a substantial proportion of the population do not participate, the Gini is essentially determined at the bottom end of the distribution. Certainly there is room for further analysis of this question.
10
Figure 4: Illiteracy Rates amongst Young people, 1970- 2 0 15
0
10
20
30
40
50
60
70
80
1970 1975 1980 1985 1990 1995 2000 2005 2010 2015
World Africa America Asia Europe Oceania
11
Figure 5: Ratio of Young Female to Young Male Illiteracy rates, 1970 - 2 0 15
1.0
1.2
1.4
1.6
1.8
2.0
2.2
2.4
2.6
1970 1975 1980 1985 1990 1995 2000 2005 2010 2015
World Africa America Asia Europe Oceania
12
2.3 Labour Force Participation
Falls in the youth share in the labour force were above attributed in part to falling
rates of labour force participation on the part of young people. Figures 6 and 7 illustrate this
phenomenon separately for teenagers and young adults. The distinction between these two
groups is particularly relevant here in as much as that whilst the teenage figures are
principally determined by levels of educational participation, for young adults two important
factors are at work. Participation in education is one, however at this age, this mainly means
participation in tertiary education; the preserve of a minority even in industrialised countries.
The second factor concerns participation in the labour force as opposed to undertaking other
non-educational activities. For adults, or indeed for the labour force as a whole, increasing
levels of the employment population ratio (as opposed to the unemployment rate), are
increasingly used as an indicator of the health of a country’s labour market. That is, the
employment-population ratio may be seen as an indicator of a country’s ability to create jobs
(ILO, 2002/2003)6. Thus, whilst falling labour force participation amongst teenagers is likely
to mainly reflect increased educational participation and is therefore unequivocally a ‘good’
sign, for young adults, the ‘good’ side of lowering labour force participation is tempered by
the bad side reflecting, as it may, a failure on the part of countries to create sufficient jobs.
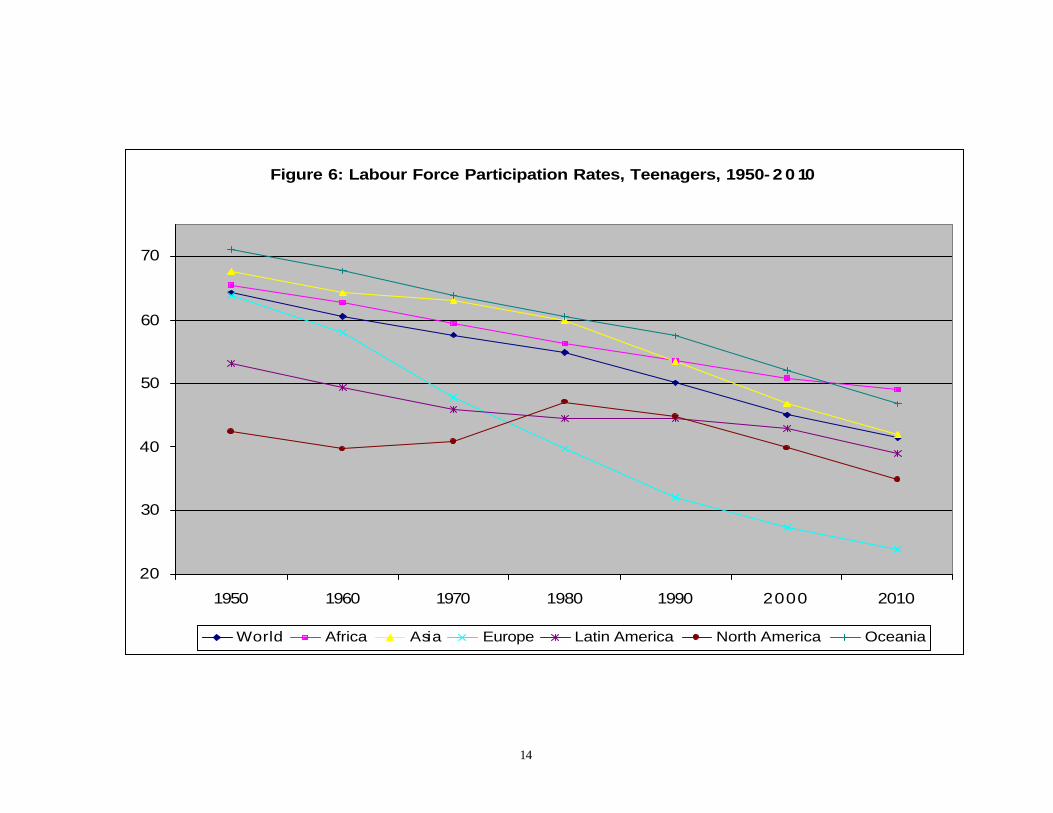
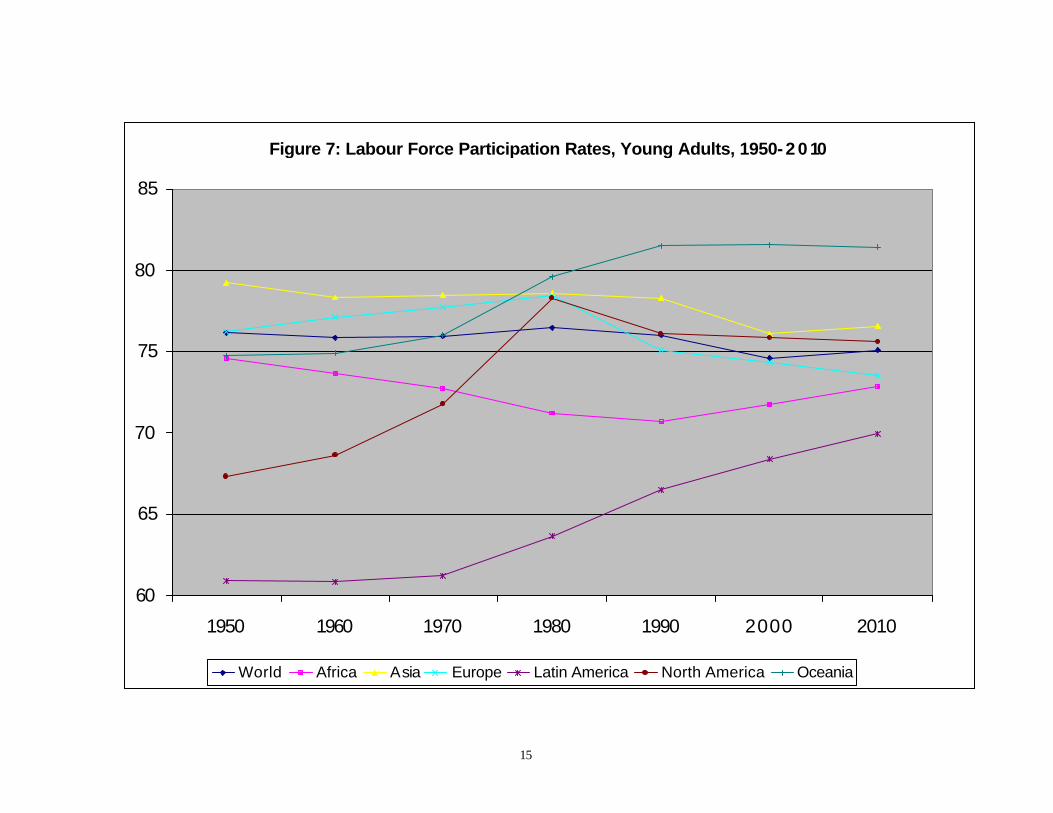
In any event, figure 6 shows that the long-run picture for young people is essentially
positive with labour force participation rates falling more or less uniformly throughout the
world7. The picture for young adults reported in figure 7 on young adults reflects the
presence of the two opposing forces mentioned above. Overall, in Europe, North America
Oceania a moderately downward trend is observable, at least since 1980 (and in Asia since
1990) suggesting the dominance of the ‘educational’ effect. In Africa, the picture is reversed
with sharply rising labour force participation rates since 1970 albeit from a relatively low
starting point. In as much as this reflects the dominance of a ‘good’ jobs effect, again here
the trend is positive.
6 Indeed, in EU countries, the labour market targets established at the Lisbon Summit concern employment-population ratios as opposed to unemployment rates. 7 One curiosity here is the increased labour force participation rate amongst the baby boom generation in North America reflected in the increase in labour force participation of teenagers in that region between 1970 and 1980.

13
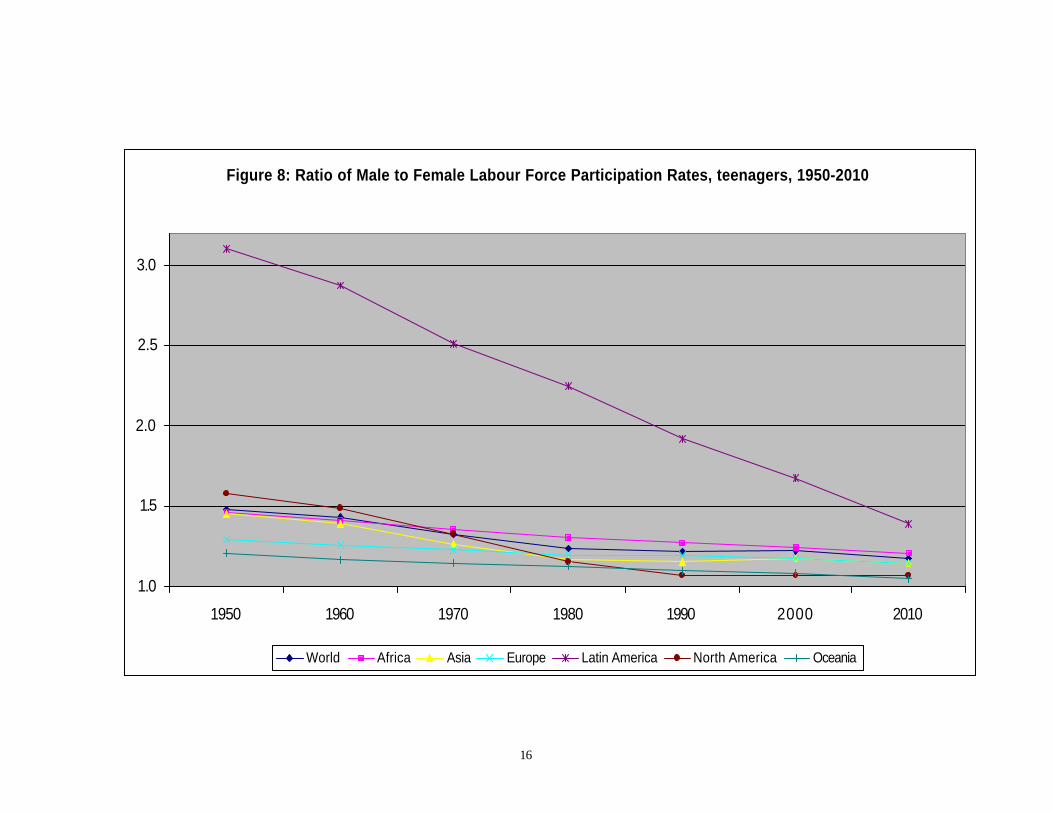
As before, additional insight may be gained by looking at this information
distinguishing between the sexes. Figures 8 and 9 reports the ratio of the labour force
participation rates of young women to that of young men for teenagers and young adults
respectively. In as much as there is a clear tendency towards convergence of the labour force
participation rates of young men and young women some encouragement may be drawn.
14
Figure 6: Labour Force Participation Rates, Teenagers, 1950- 2 0 10
20
30
40
50
60
70
1950 1960 1970 1980 1990 2000 2010
World Africa Asia Europe Latin America North America Oceania
15
Figure 7: Labour Force Participation Rates, Young Adults, 1950- 2 0 10
60
65
70
75
80
85
1950 1960 1970 1980 1990 2000 2010
World Africa Asia Europe Latin America North America Oceania
16
Figure 8: Ratio of Male to Female Labour Force Participation Rates, teenagers, 1950-2010
1.0
1.5
2.0
2.5
3.0
1950 1960 1970 1980 1990 2000 2010
World Africa Asia Europe Latin America North America Oceania

17
Figure 9: Ratio of Male to Female Labour Force Participation Rates, Young adults, 1950-2010
1.0
1.5
2.0
2.5
3.0
3.5
1950 1960 1970 1980 1990 2000 2010
World Africa Asia Europe Latin America North America Oceania
18
2.4 Child labour
These days, child labour and its abolition occupy central stage amongst the stated
concerns of Governments in developing countries. Children working rather than going to
school are quite clearly going to have fewer chances on the labour market. Although formal
evidence on this question is a little scarce, partly because of the lack of long-run panel data in
developing countries, I believe such a view is neither controversial nor controvertible.
Although traditional to separate entirely questions of ‘child labour’ from those concerning
‘youth employment’, accepting the reasoning above, there is little justification for doing so, if
one wishes to understand the labour market for young people8.
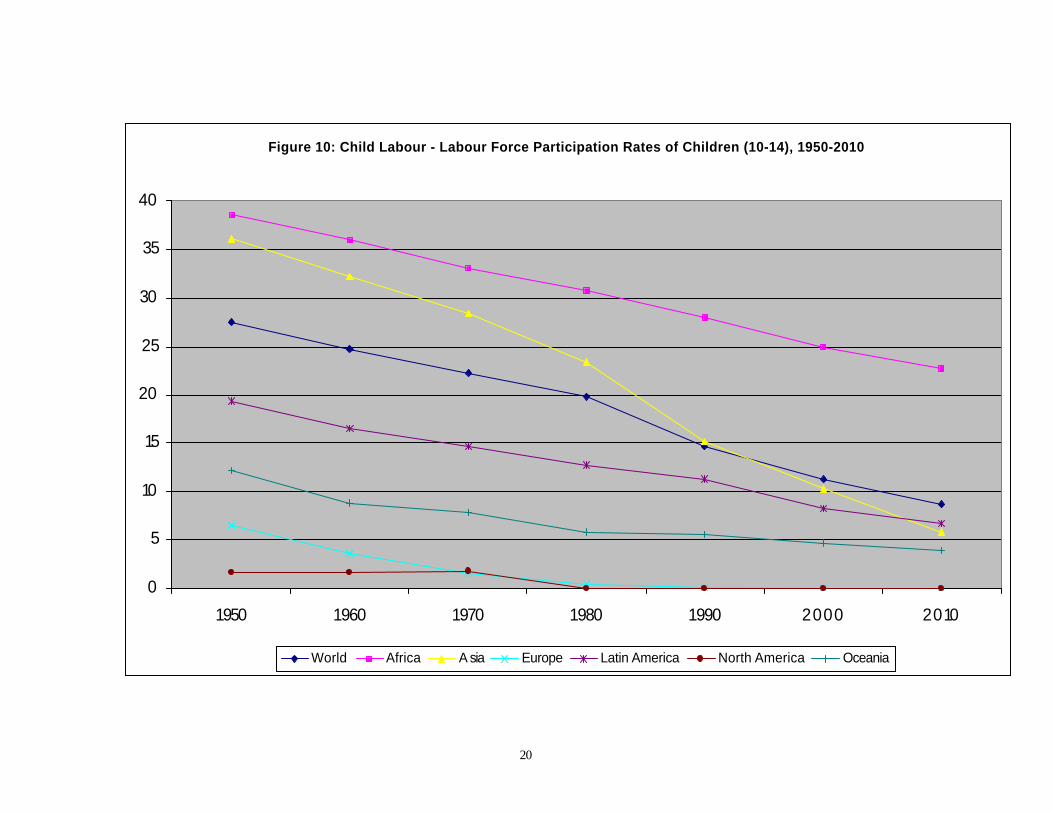
Figure 10 illustrates the positive downward trend in child labour, here approximated
by the labour force participation rates of children aged 10-14. In 1950, more than one in three
children aged 10-14 were working in Africa and Asia and one in four in the world as a
whole. By 2010, child labour is expected to fall to the extent that ‘only’ around one in five
children (10-14) will be working in Africa and around one in twenty in Asia and Latin
America so that in the in the World as a whole child labour will involve just one in ten
children. A major improvement certainly but much remains to be done. The widespread
existence of child labour is likely to continue to condition the experience of many young
people in developing countries at least for some time to come.
The long-run trends illustrated above however are reliant on rather rough and ready
proxy for child labour9. Recently, the ILO has made a serious attempt to quantify the extent
of different forms of child labour in a more precise manner (ILO, 2002a). Being the second
8 Even more so when one starts to look at Decent Work, as opposed to employment per se. 9 And the fact that data are collected for a different purpose. Of note is the fact that, according to the Labour force based figures, child labour has not existed in North America since 1980 and in Europe since 1990. This contrasts with the ILO child labour estimates for 2000, which suggest that 2% of (or one in fifty) children are working in developed countries. Kruse & Mahoney (1998) estimate that in the USA, 148,000 (or 0,5% of) minors were employed illegally in an average week and 290,000 at sometime during the year.

19
exercise of this type, the first having been undertaken in 199510, there is evidence to support
the view that child labour is on a downward trend, at least between 1995 and 200011.
According to these estimates, the number of economically active children (5-14) fell from
around 250 million to a little over 210 million. These figures imply that whilst in 1995, one
in four children aged between 5 and 14 was working, by 2000 the corresponding figure was
between one in five and one in six, with, it may be added, no significant difference between
male and female children.
10 ILO (1996). 11 As the report points out, however, the estimates are not directly comparable in as much as: a) the 2000 data are based on a much larger sample and therefore different extrapolation methods were used; and, b) the quality of the information collected at country level has improved markedly in both scope and depth in the intervening period.
20
Figure 10: Child Labour - Labour Force Participation Rates of Children (10-14), 1950-2010
0
5
10
15
20
25
30
35
40
1950 1960 1970 1980 1990 2000 2010
World Africa A sia Europe Latin America North America Oceania
21
2.5 Conclusions
The above broad brush analysis of long-run trends presents an essentially positive
picture of developments youth labour markets.
Amongst the encouraging signs one may note that:
• Whilst youth populations are undoubtedly growing in absolute terms, the proportion
of young people as a percentage of the total population is on a decidedly downward
trend.
• If one extends the picture to economically active young people as a percentage of the
total labour force, the downward trend is reinforced due to increases in the
educational participation of young people. Here, even in Africa, the trend is
downward.
• There is a universal and fairly uniform tendency towards increasing literacy rates
amongst young people throughout the world
• There is a general movement towards the convergence of male/female differences in
labour force participation rates
• Child labour appears everywhere to be on the decline.
On the other hand, at least one less positive trend is observable even from this very
general overview. Specifically:
• The gap between male and female literacy rates in Asia and Africa and, consequently,
the world appear to be widening.
3. WHICH, WHOM AND WHY? LABOUR MARKET OUTCOMES AND THEIR DETERMINANTS
3.1 Which Outcomes?
Although apparently obvious, it is worth considering a moment which are, or indeed
should be, the outcomes of interest. Technical analyses of the effect of individual and
aggregate factors determining labour market ‘outcomes’ tend to concentrate on either the
determinants of unemployment (a ‘bad’ outcome) or employment (a ‘good’ outcome). Rather
less attention is paid to young people’s wages as an outcome. Although higher wages as an
indicator of job quality might reasonably be an outcome to aim for, their position is
22
somewhat complicated by their more usual role as villain in creating high levels of
unemployment. Attention in this sphere has tended to concentrate on the role of high
minimum wages as a factor in impeding the employment of young people or alternatively the
positive role to be played by sub-minimum wages for young people. A further complicating
factor is that wage data by age are less widely available, or at least published. In any event,
there is a discussion of the findings of studies on wages and minimum wages in particular
below.
3.1.1 Labour Force Participation
As suggested above, although for the population as a whole, the labour force
participation rate, or certainly the employment-population ratio, is a sensible target variable
to seek to raise, for young people the question is complicated by the role of education. Since
education can generally be seen as playing a useful function in improving the level and
quality of employment at both individual and macro- levels, participation in education by
young people necessarily lowers their labour force participation rates. In O’Higgins (2001), I
argued that a more useful indicator than the youth unemployment rate is the youth non-
employment rate defined on the basis of a widened definition of the labour force adding to
both nominator and denominator young people who are neither in education or
employment 12. In the 1990s, such an indicator began to be introduced in analyses of the
youth labour market by the OECD13. Analyses of the question need at least to take into
account this aspect.
12 See also Ryan (2003) for an illuminating discussion of the usefulness of youth unemployment as an indicator of labour market problems for young people based on a comparison between France and the USA. 13 See, for example, OECD (1999, chapter one). An alternative way of thinking of the index is by looking at its counterpart which is essentially the employment population ratio for young people adjusted for educational participation. Specifically the non-employment rate may be defined as:
educationinpeopleyoungpopulationyouth
educationinpeopleyoungemploymentinnotpeopleyoungU
−−
=
or its counterpart:
educationinpeopleyoungpopulationyouth
peopleyoungemployedE
−=
Very obviously, U = 1 – E.
23
3.1.2 Long-Term Unemployment
There is an argument to be made that long-term unemployment is a more important
negative indicator than unemployment per se. Certainly there is evidence to suggest that the
negative consequences of unemployment are largely associated with lengthy spells of
unemployment rather than unemployment per se (O’Higgins, 2001). This is indeed
recognised on the policy choices of governments which increasingly concentrate on the
problem of the long-term unemployed.
3.1.3 Informal Sector Employment
Another issue regards the quality of employment; specifically, the informal sector.
Simply stated, informal sector employment refers to unregistered employment. However,
there are many problems in actually defining and even more, identifying, participants in the
informal sector14. Awareness has been growing in recent years of the importance of the
sector and both the ILO and the OECD now produce aggregate estimates of participation in
the informal economy. Although estimates, based on a variety of methodologies, now exist
for a wide number of countries15, information on the involvement of young people in the
sector has not yet been compiled for a wide range of countries. Both theoretical reasoning
and such empirical evidence as does exist16, would suggest that young people are
disproportionately represented in the informal sector. The question is important and, despite
the lack of adequate data, some discussion is included below.
3.1.4 Underemployment
Another important, albeit rather neglected area concerns underemployment.
Difficulties of concept and measurement are even more pronounced for underemployment
than they are for involvement in the informal sector17. Although information is collected on a
I take the opportunity of mentioning here that the untimely demise of Norman Bowers who was largely responsible for this and other innovations in the OECD’s analyses of labour market questions is a great loss to all of us interested in such questions. 14 For rather more satisfactory albeit not universally applied conceptual and operational definitions the interested reader is refereed to ILO (1993). 15 See, for, example, ILO (2002b) and Schneider (2002). 16 See, for one example, O’Higgins et al. (2001) for brief consideration of the question in Bulgaria. 17 For a formal definition of underemployment see ILO (1998)
24
rather ad hoc basis, such evidence as exists suggests that here again, young people are likely
to be disproportionately represented also in this type of employment.
3.1.5 Unemployment Rates
In the end, however, and at least for the present, one is brought back to the youth
unemployment rate as the principal indicator of the labour market problems of young people.
It is widely available, its definition is clear and is becoming more and more uniformly
applied in reported statistics by national agencies also in developing and transition countries.
In what follows then, I concentrate on trends in and, above-all, the determinants of,
unemployment, with some consideration also for labour force participation, recognising
however that these are by no means the only or indeed the best possible indicators of labour
market performance.
3.2 Whose Outcome?
A very important question in all this regards whose outcome is (or should be) of
interest? Whilst it is fairly natural to concentrate first on aggregate indicators, the youth
unemployment rate and so on, there is much to be said for a finer concentration on specific
individual characteristics which influence labour market outcomes. Perhaps foremost
amongst these are gender, ethnicity and disability. The relative lack of data on some
indicators of labour market disadvantage have meant that it is often harder to quantify and
moreover compare disadvantage across countries, particularly in the less developed regions.
For example, unemployment rates by ethnic minority are often not reported. Indeed, in the
transition countries of Central and Eastern Europe, the reporting of labour market status by
ethnicity is often explicitly forbidden by law18. Notwithstanding this, it is increasingly argued
that attention should be concentrated on ‘disadvantaged’ groups of young people rather than
young people per se19.
18 The formal justification for this regards fears that such information might be used to further promote discrimination against, in particular, the most disadvantaged group in this region, the Roma. The question, however, is a little complicated. The interested reader is referred to the recent report produced by UNDP in collaboration with the ILO on the Roma in five countries of Central and Eastern Europe (UNDP, 2002). The report is the first attempt to systematically collect and analyse comparable and comprehensive information on the socioeconomic situation of the Roma in CEE. 19 See, inter alia, O’Higgins (2001) and Godfrey (2003).
25
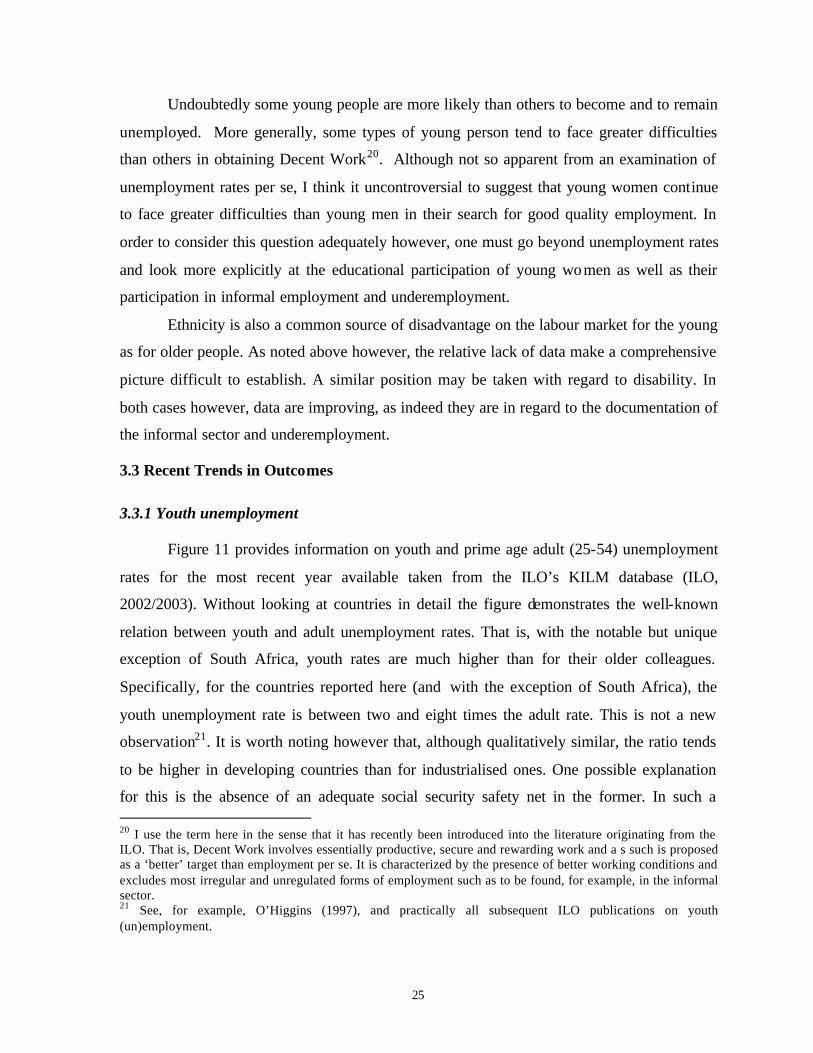
Undoubtedly some young people are more likely than others to become and to remain
unemployed. More generally, some types of young person tend to face greater difficulties
than others in obtaining Decent Work20. Although not so apparent from an examination of
unemployment rates per se, I think it uncontroversial to suggest that young women continue
to face greater difficulties than young men in their search for good quality employment. In
order to consider this question adequately however, one must go beyond unemployment rates
and look more explicitly at the educational participation of young women as well as their
participation in informal employment and underemployment.
Ethnicity is also a common source of disadvantage on the labour market for the young
as for older people. As noted above however, the relative lack of data make a comprehensive
picture difficult to establish. A similar position may be taken with regard to disability. In
both cases however, data are improving, as indeed they are in regard to the documentation of
the informal sector and underemployment.
3.3 Recent Trends in Outcomes
3.3.1 Youth unemployment
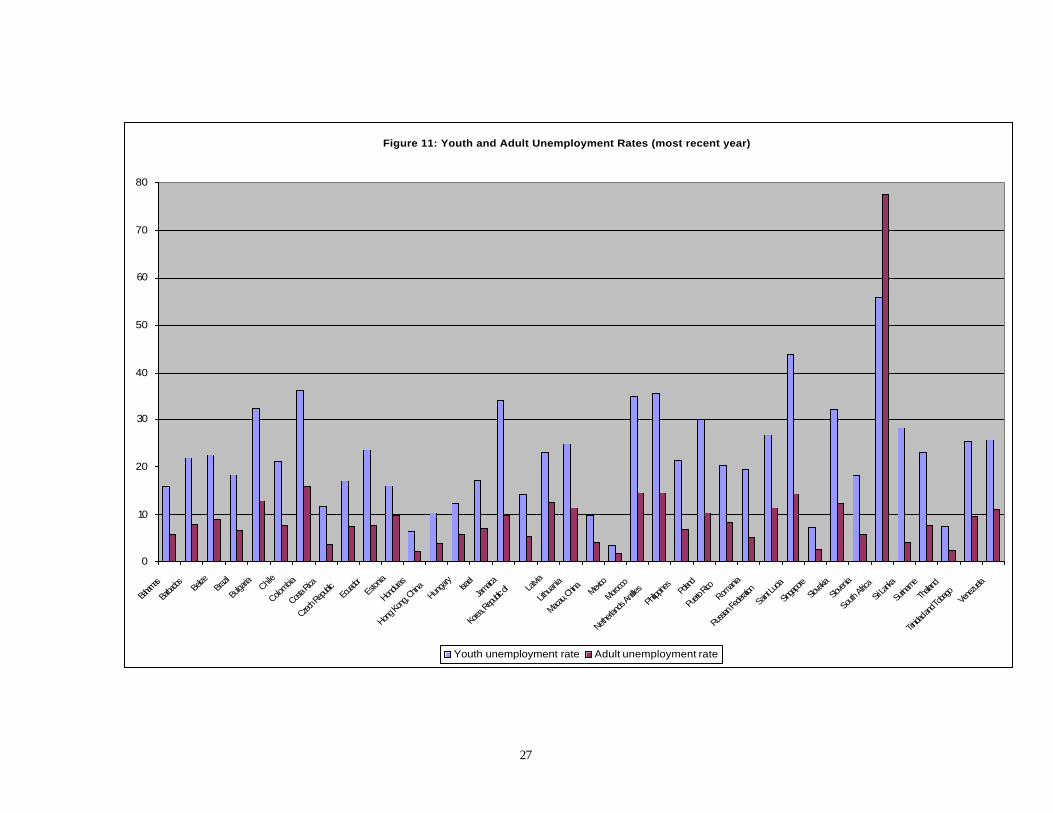
Figure 11 provides information on youth and prime age adult (25-54) unemployment
rates for the most recent year available taken from the ILO’s KILM database (ILO,
2002/2003). Without looking at countries in detail the figure demonstrates the well-known
relation between youth and adult unemployment rates. That is, with the notable but unique
exception of South Africa, youth rates are much higher than for their older colleagues.
Specifically, for the countries reported here (and with the exception of South Africa), the
youth unemployment rate is between two and eight times the adult rate. This is not a new
observation21. It is worth noting however that, although qualitatively similar, the ratio tends
to be higher in developing countries than for industrialised ones. One possible explanation
for this is the absence of an adequate social security safety net in the former. In such a 20 I use the term here in the sense that it has recently been introduced into the literature originating from the ILO. That is, Decent Work involves essentially productive, secure and rewarding work and a s such is proposed as a ‘better’ target than employment per se. It is characterized by the presence of better working conditions and excludes most irregular and unregulated forms of employment such as to be found, for example, in the informal sector. 21 See, for example, O’Higgins (1997), and practically all subsequent ILO publications on youth (un)employment.

26
situation, families are more likely to enter as providers of last resort for young people than
for adults. The fact that families may be too poor to do so obviously contributes to the oft-
noted phenomenon of educated unemployment in developing countries22 whereby the
(relatively well-educated) offspring of higher income parents are the ones who can actually
afford to remain unemployed.
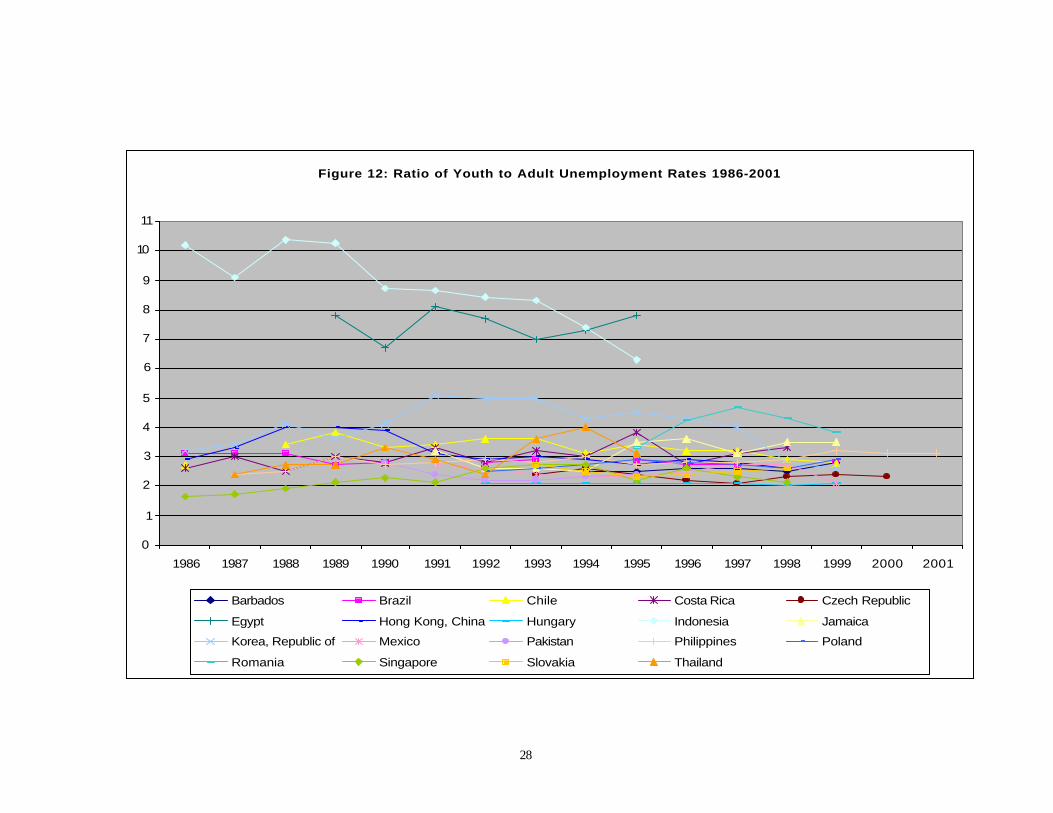
Figure 12 plots the ratio of youth to adult unemployment rates for a range of
transition and developing countries. With the exceptions of Egypt, Indonesia and Korea (and
in the mid-1990s, Romania), the youth unemployment rate in the countries reported here has
remained (more or less) in the range of two to four times the adult rate.
22 It is interesting to note, as well as being supportive of the family support hypothesis, that in Italy, which although an industrialized country, has no adequate social safety net for the unemployed, displays similar characteristics, namely a high ratio of youth to adult unemployment rates as well as a relatively high unemployment rate amongst graduates.
27
Figure 11: Youth and Adult Unemployment Rates (most recent year)
0
10
20
30
40
50
60
70
80
Baham
as
Barbad
os Belize
Brazil
Bulgaria Chile
Colombia
Costa R
ica
Czech
Repub
licEcu
ador
Estonia
Hondura
s
Hong Ko
ng, Chin
aHun
gary
Israel
Jamaica
Korea
, Repu
blic of La
tvia
Lithua
nia
Macau, C
hina Mexico
Morocco
Netherla
nds An
tilles
Philipp
ines
Poland
Puerto
Rico
Roman
ia
Russian
Federa
tion
Saint
Lucia
Singap
oreSlo
vakia
Sloven
ia
South
Africa
Sri Lan
ka
Surina
me
Thailan
d
Trinida
d and
Tobago Ve
nezuel
a
Youth unemployment rate Adult unemployment rate
28
Figure 12: Ratio of Youth to Adult Unemployment Rates 1986-2001
0
1
2
3
4
5
6
7
8
9
10
11
1986 1987 1988 1989 1990 1991 1992 1993 1994 1995 1996 1997 1998 1999 2000 2001
Barbados Brazil Chile Costa Rica Czech Republic
Egypt Hong Kong, China Hungary Indonesia Jamaica
Korea, Republic of Mexico Pakistan Philippines Poland
Romania Singapore Slovakia Thailand
29
3.3.2 Long-term Unemployment
There is a growing literature concerning the damage caused by long-run
unemployment to individuals’ human capital and, consequently, to societies’ economic
potential. The underlying belief is that the negative consequences of unemployment are
largely related to protracted (and/or repeated) periods of unemployment rather than the
incidence of unemployment per se. This type of argument has been used in the past to
suggest that the unemployment of young people is relatively innocuous. Young people tend
to have a high incidence of unemployment – a more or less natural consequence of shopping
around on the labour market to find appropriate work – but a lower average duration of
unemployment than older people; a young person is fairly likely to experience
unemployment but it probably won’t last very long.
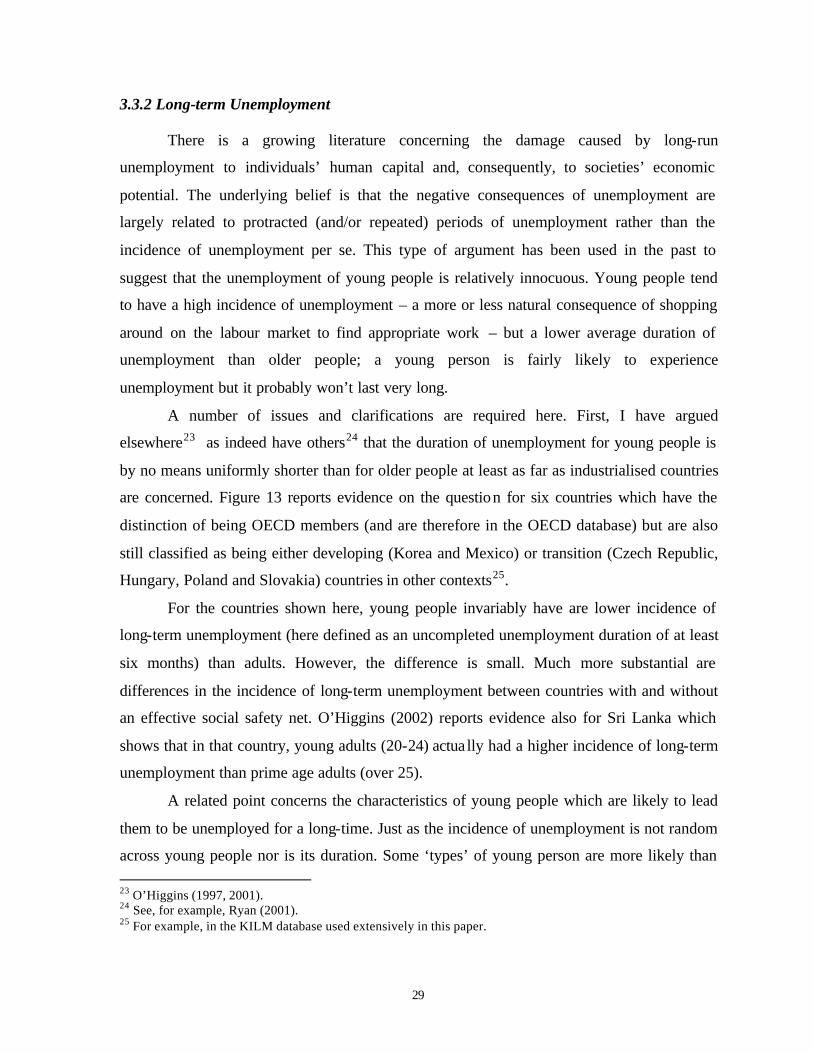
A number of issues and clarifications are required here. First, I have argued
elsewhere23 as indeed have others24 that the duration of unemployment for young people is
by no means uniformly shorter than for older people at least as far as industrialised countries
are concerned. Figure 13 reports evidence on the question for six countries which have the
distinction of being OECD members (and are therefore in the OECD database) but are also
still classified as being either developing (Korea and Mexico) or transition (Czech Republic,
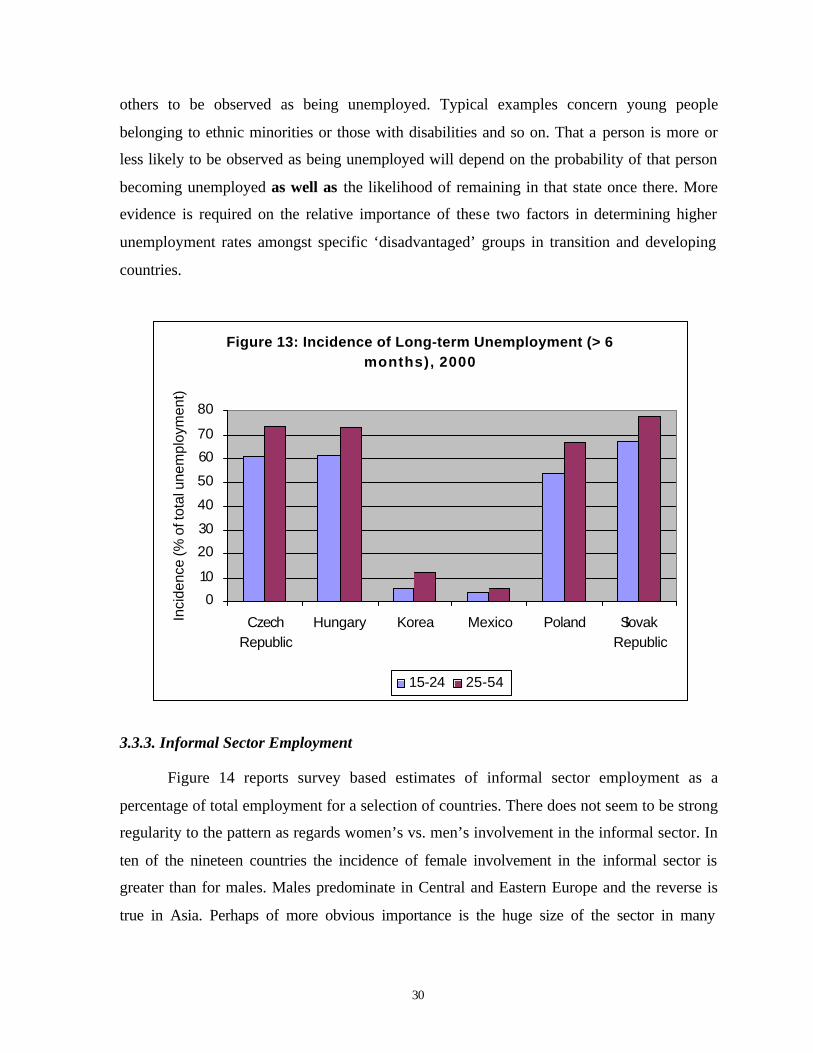
Hungary, Poland and Slovakia) countries in other contexts25.
For the countries shown here, young people invariably have are lower incidence of
long-term unemployment (here defined as an uncompleted unemployment duration of at least
six months) than adults. However, the difference is small. Much more substantial are
differences in the incidence of long-term unemployment between countries with and without
an effective social safety net. O’Higgins (2002) reports evidence also for Sri Lanka which
shows that in that country, young adults (20-24) actua lly had a higher incidence of long-term
unemployment than prime age adults (over 25).
A related point concerns the characteristics of young people which are likely to lead
them to be unemployed for a long-time. Just as the incidence of unemployment is not random
across young people nor is its duration. Some ‘types’ of young person are more likely than 23 O’Higgins (1997, 2001). 24 See, for example, Ryan (2001). 25 For example, in the KILM database used extensively in this paper.
30
others to be observed as being unemployed. Typical examples concern young people
belonging to ethnic minorities or those with disabilities and so on. That a person is more or
less likely to be observed as being unemployed will depend on the probability of that person
becoming unemployed as well as the likelihood of remaining in that state once there. More
evidence is required on the relative importance of these two factors in determining higher
unemployment rates amongst specific ‘disadvantaged’ groups in transition and developing
countries.
Figure 13: Incidence of Long-term Unemployment (> 6 months), 2000
0
10
20
30
40
50
60
70
80
CzechRepublic
Hungary Korea Mexico Poland SlovakRepublic
Inci
denc
e (%
of t
otal
une
mpl
oym
ent)
15-24 25-54
3.3.3. Informal Sector Employment
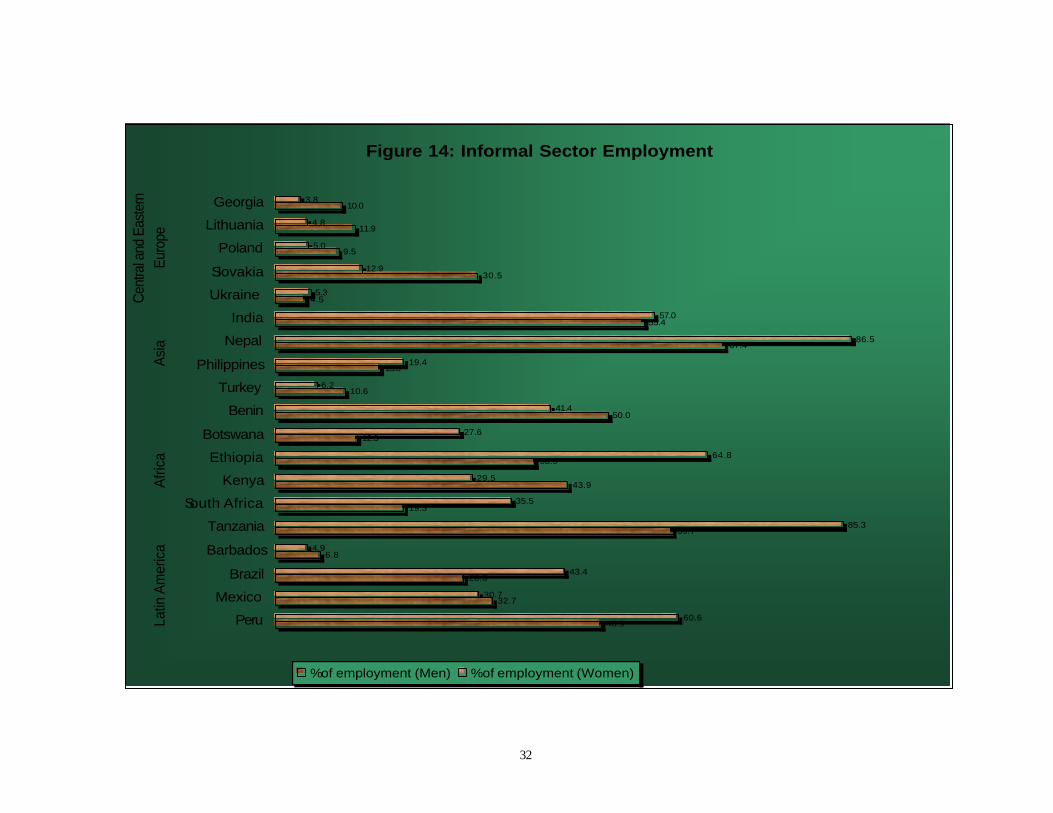
Figure 14 reports survey based estimates of informal sector employment as a
percentage of total employment for a selection of countries. There does not seem to be strong
regularity to the pattern as regards women’s vs. men’s involvement in the informal sector. In
ten of the nineteen countries the incidence of female involvement in the informal sector is
greater than for males. Males predominate in Central and Eastern Europe and the reverse is
true in Asia. Perhaps of more obvious importance is the huge size of the sector in many

31
countries. In Nepal and Tanzania, almost nine out of every ten employed women works in
the informal sector. In addition to being somewhat worrying of itself, rather obviously, it has
important implications for the types of employment policies which are appropriate in such
contexts.
32
Figure 14: Informal Sector Employment
48.9
32.7
28.3
6.8
59.7
19.3
43.9
38.9
12.3
50.0
10.6
15.8
67.4
55.4
4.5
30.5
9.5
11.9
10.0
60.6
30.7
43.4
4.9
85.3
35.5
29.5
64.8
27.6
41.4
6.2
19.4
86.5
57.0
5.3
12.9
5.0
4.8
3.8
Peru
Mexico
Brazil
Barbados
Tanzania
South Africa
Kenya
Ethiopia
Botswana
Benin
Turkey
Philippines
Nepal
India
Ukraine
Slovakia
Poland
Lithuania
Georgia
Latin
Am
eric
aA
frica
Asia
Cen
tral a
nd E
aste
rnEu
rope
% of employment (Men) % of employment (Women)
33
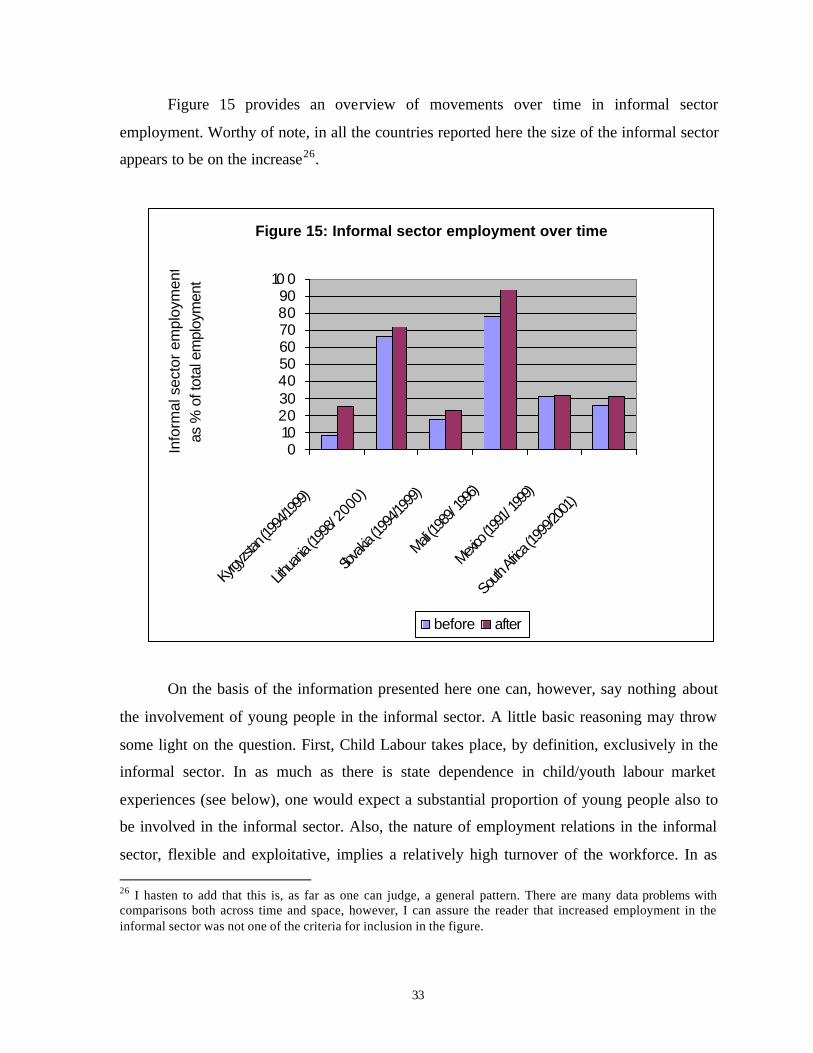
Figure 15 provides an overview of movements over time in informal sector
employment. Worthy of note, in all the countries reported here the size of the informal sector
appears to be on the increase26.
Figure 15: Informal sector employment over time
0102030405060708090
10 0
Kyrgy
zstan
(1994
/1999
)
Lithua
nia (1
998/
2000
)
Slovak
ia (19
94/19
99)
Mali (19
89/ 1
996)
Mexico
(1991/
1999)
South
Africa
(199
9/200
1)
Info
rmal
sec
tor
empl
oym
ent
as %
of t
otal
em
ploy
men
t
before after
On the basis of the information presented here one can, however, say nothing about
the involvement of young people in the informal sector. A little basic reasoning may throw
some light on the question. First, Child Labour takes place, by definition, exclusively in the
informal sector. In as much as there is state dependence in child/youth labour market
experiences (see below), one would expect a substantial proportion of young people also to
be involved in the informal sector. Also, the nature of employment relations in the informal
sector, flexible and exploitative, implies a relatively high turnover of the workforce. In as 26 I hasten to add that this is, as far as one can judge, a general pattern. There are many data problems with comparisons both across time and space, however, I can assure the reader that increased employment in the informal sector was not one of the criteria for inclusion in the figure.
34
much as young people are disproportionately represented amongst job seekers (O’Higgins,
2001), one would expect a correspondingly high proportion of young people amongst
informal sector workers. More systematic examination of this question is clearly in order,
however, one might add finally that casual observation of this author (as I would imagine for
the readers) in transition and above-all developing countries, certainly does not contradict the
idea of heavy involvement of young people in the sector.
3.4 Determinants of Outcomes
3.4.1 Youth unemployment and Labour Force participation – The Role of Demographics and Aggregate Demand
In recent years, the role of the size of the youth cohort in determining youth
unemployment has been the subject of some concern and, in industrialised countries at least,
analysis. Some work has also considered the importance of aggregate demand factors relative
to demography. Table 1 presents results of a set of panel regressions (with fixed country
effects and AR(1) correction) intended to look at this question for a selection of developing
and transition countries27. The dependent variables looked at are (the natural logs of) youth
unemployment rates, labour force partic ipation rates and the ratio of youth to adult
unemployment rates.
The table allows some comparison with previous results reported for OECD
countries. The first set of results concerning the determination of the youth unemployment
rate shows that both adult unemployment (representing aggregate demand factors) and the
share of young people in the working age population both have positive and significant
influences on youth unemployment rates. The results are qualitatively similar to those
reported by Korenman & Neumark (1997) and O’Higgins (2001) on OECD countries and
diverge from those reported by Shimer (1999) who, as noted above, finds a negative effect of
youth population share on youth unemployment for the USA. The estimated elasticity of
youth unemployment with respect to the population share is of the order of 0.6 (slightly
27 The selection of countries depended essentially on the presence of time -series data in the ILO’s KILM database. Although comparability across time and countries is still a major issue in this dataset, much efforts have been expended by the KILM staff in making the information presented compatible and comparable in terms of definitions used and so on. In order to be included in the dataset for estimation purposes, in addition to being present in the KILM dataset, the criterion of having information on all relevant variables for at least three consecutive periods was applied. The data are of course of annual.

35
larger for young women than for young men) without the inclusion of adult unemployment.
The addition of the latter reduces the estimated elasticity with respect to the population share
by around 0.2 but does not undermine its statistical significance. In this, the results differ
from those reported by Korenman & Neumark who find no significant impact of the
population share in the presence of the adult unemployment rate28. Taken at face value29, the
results imply that the falling youth population shares to be found in most developing and
transition countries are likely to ease the transition to employment of the upcoming
generations of young people.
Let us turn to the labour force participation rates of young people. The estimated
elasticities of labour force participation with respect to the youth share of the population are
substantially higher than (roughly twice) those reported by Shimer (1999). One plausible
explanation for this is that in less developed countries one would tend to find a higher youth
population share due to higher birth and death rates as well as a higher labour force
participation rate due to lower educational participation. That is to say, the relation estimated
here is, in part, not a causal one, but rather dependent on the joint determination of youth
population share and labour force participation. More analysis is clearly in order. Interesting
to note here also is the lack of statistical significance of the adult unemployment rate in
determining labour force participation adding further support to the idea of other factors
being at work30.
The final set of results reported concern the determination of the youth/adult
differential. Analyses of this form have been undertaken by, inter alia, Bertola et al. (2002)
and Jimeno & Rodriguez-Palenzuela (2002). The results essentially confirm (and indeed
reflect) the first set concerning the determination of youth unemployment. An elasticity of
youth unemployment with respect to adult unemployment of less than one implies that as
adult unemployment rates increase, youth unemployment rates also increase but less than 28 Korenman & Neumark (1997) report a series of results. I use as the main base of comparison here, the closest estimation reported in the paper, namely table 2, model D. Their preferred IV estimates of the elasticity with respect to the youth population are of the order of 0.5, very similar to those presented here 29 This, I hesitate to do at this stage. More examination and analysis of the data is required before I would be prepared to bet money on the specific point estimates, although I would defend the overall direction of the results reported here. 30 The lack of statistical significance also adds informal weight to the non-use of an instrument for the youth population share in the estimation of the determinants of youth unemployment. If adult unemployment is uncorrelated with youth labour force participation, the need for an instrument disappears.
36
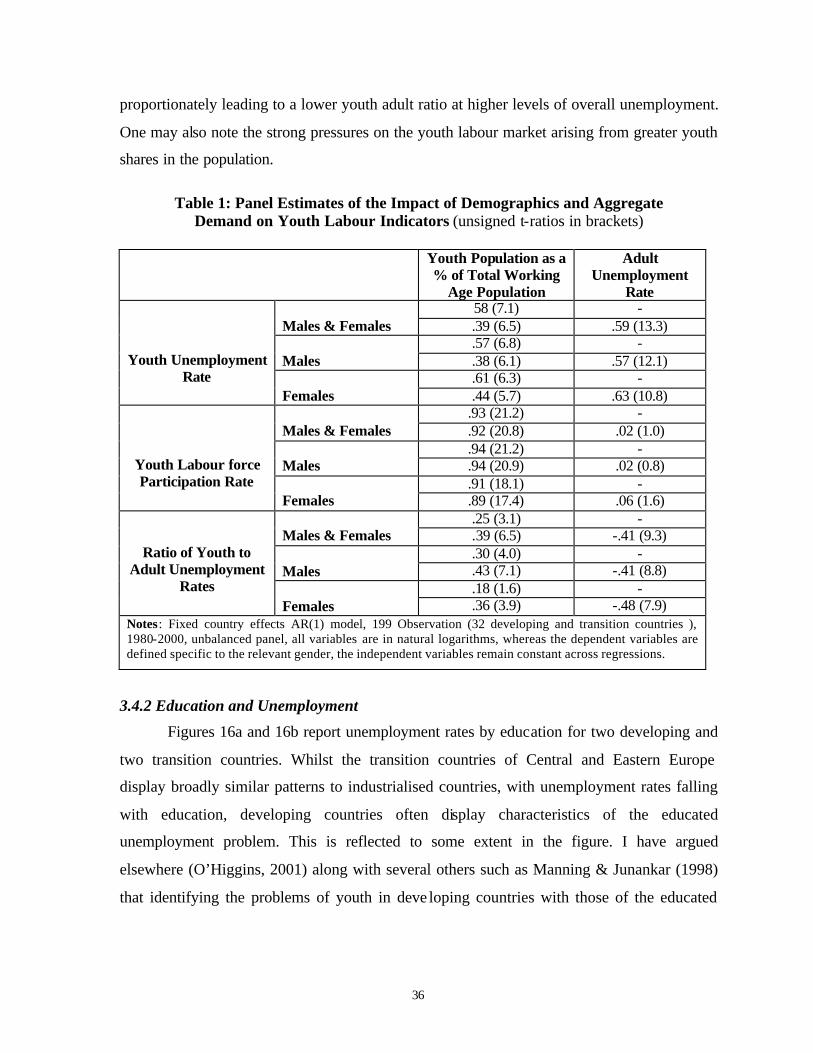
proportionately leading to a lower youth adult ratio at higher levels of overall unemployment.
One may also note the strong pressures on the youth labour market arising from greater youth
shares in the population.
Table 1: Panel Estimates of the Impact of Demographics and Aggregate Demand on Youth Labour Indicators (unsigned t-ratios in brackets)
Youth Population as a
% of Total Working Age Population
Adult Unemployment
Rate 58 (7.1) -
Males & Females .39 (6.5) .59 (13.3) .57 (6.8) -
Males .38 (6.1) .57 (12.1) .61 (6.3) -
Youth Unemployment Rate
Females .44 (5.7) .63 (10.8) .93 (21.2) -
Males & Females .92 (20.8) .02 (1.0) .94 (21.2) -
Males .94 (20.9) .02 (0.8) .91 (18.1) -
Youth Labour force Participation Rate
Females .89 (17.4) .06 (1.6) .25 (3.1) -
Males & Females .39 (6.5) -.41 (9.3) .30 (4.0) -
Males .43 (7.1) -.41 (8.8) .18 (1.6) -
Ratio of Youth to Adult Unemployment
Rates Females .36 (3.9) -.48 (7.9)
Notes: Fixed country effects AR(1) model, 199 Observation (32 developing and transition countries ), 1980-2000, unbalanced panel, all variables are in natural logarithms, whereas the dependent variables are defined specific to the relevant gender, the independent variables remain constant across regressions.
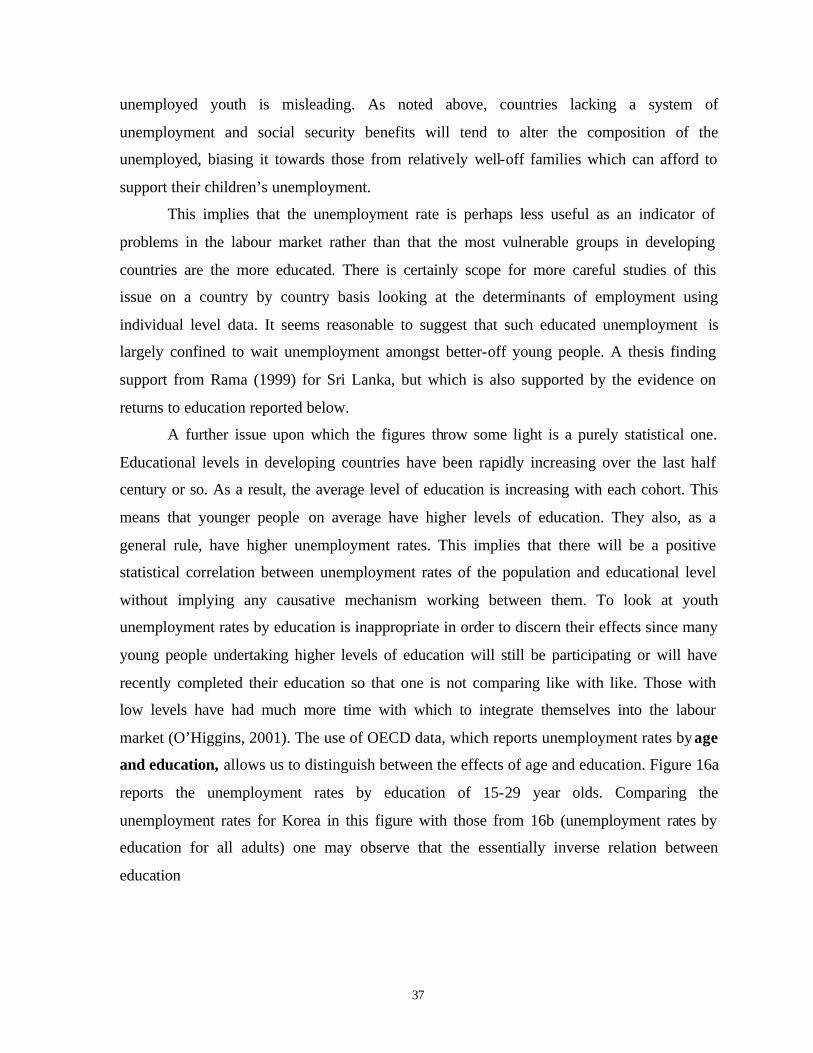
3.4.2 Education and Unemployment
Figures 16a and 16b report unemployment rates by education for two developing and
two transition countries. Whilst the transition countries of Central and Eastern Europe
display broadly similar patterns to industrialised countries, with unemployment rates falling
with education, developing countries often display characteristics of the educated
unemployment problem. This is reflected to some extent in the figure. I have argued
elsewhere (O’Higgins, 2001) along with several others such as Manning & Junankar (1998)
that identifying the problems of youth in deve loping countries with those of the educated
37
unemployed youth is misleading. As noted above, countries lacking a system of
unemployment and social security benefits will tend to alter the composition of the
unemployed, biasing it towards those from relatively well-off families which can afford to
support their children’s unemployment.
This implies that the unemployment rate is perhaps less useful as an indicator of
problems in the labour market rather than that the most vulnerable groups in developing
countries are the more educated. There is certainly scope for more careful studies of this
issue on a country by country basis looking at the determinants of employment using
individual level data. It seems reasonable to suggest that such educated unemployment is
largely confined to wait unemployment amongst better-off young people. A thesis finding
support from Rama (1999) for Sri Lanka, but which is also supported by the evidence on
returns to education reported below.
A further issue upon which the figures throw some light is a purely statistical one.
Educational levels in developing countries have been rapidly increasing over the last half
century or so. As a result, the average level of education is increasing with each cohort. This
means that younger people on average have higher levels of education. They also, as a
general rule, have higher unemployment rates. This implies that there will be a positive
statistical correlation between unemployment rates of the population and educational level
without implying any causative mechanism working between them. To look at youth
unemployment rates by education is inappropriate in order to discern their effects since many
young people undertaking higher levels of education will still be participating or will have
recently completed their education so that one is not comparing like with like. Those with
low levels have had much more time with which to integrate themselves into the labour
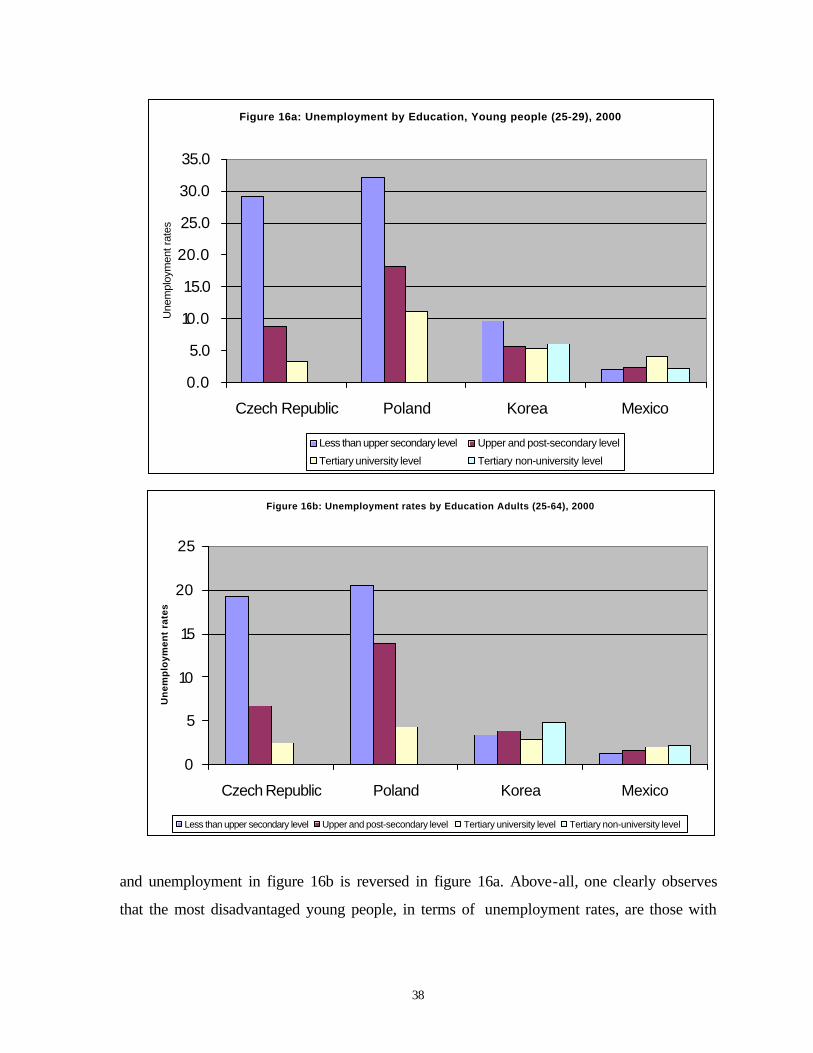
market (O’Higgins, 2001). The use of OECD data, which reports unemployment rates by age
and education, allows us to distinguish between the effects of age and education. Figure 16a
reports the unemployment rates by education of 15-29 year olds. Comparing the
unemployment rates for Korea in this figure with those from 16b (unemployment rates by
education for all adults) one may observe that the essentially inverse relation between
education
38
Figure 16a: Unemployment by Education, Young people (25-29), 2000
0.0
5.0
10.0
15.0
20.0
25.0
30.0
35.0
Czech Republic Poland Korea Mexico
Une
mpl
oym
ent r
ates
Less than upper secondary level Upper and post-secondary level
Tertiary university level Tertiary non-university level
Figure 16b: Unemployment rates by Education Adults (25-64), 2000
0
5
10
15
20
25
Czech Republic Poland Korea Mexico
Un
emp
loym
ent
rate
s
Less than upper secondary level Upper and post-secondary level Tertiary university level Tertiary non-university level
and unemployment in figure 16b is reversed in figure 16a. Above-all, one clearly observes
that the most disadvantaged young people, in terms of unemployment rates, are those with

39
less than secondary education. Not, as would appear form figure 16b, those with tertiary
(non-university) level education.
In Central and Eastern Europe, it is worth noting that during the years of transition (or
at least for the last decade or so during which time reliable data has been available) that the
gap between unemployment rates of those with different levels of education has widened. In
as much as such a widening of the gap reflects the introduction of market signals many
would find this an encouraging sign. At the same time, however, there is also evidence that
there has been growing inequality in access to basic education31; a somewhat less
encouraging sign.
3.4.3 Education and Wages
Evidence on the returns to education to individuals is far more widespread than on the
relationship between education and unemployment. Based on the seminal work of Mincer
and subsequently Becker, since the 1970s, returns to education estimates have been available
for a range of countries. George Psacharopoulos really got the ball rolling with his cross
country comparison in 1973 (Psacharopoulos, 1973) and has been providing updates every
ten years or so since culminating in his most recent contribution last year (Psacharopoulos &
Patrinos, 2002). The latest results essentially confirm the findings of previous work. That is,
(above-all private) rates of return to education are substantially higher in developing
countries than in the OECD. The highest returns to all levels of education (including tertiary
level) are to be found in Sub-Saharan Africa. However, also in Asia and Latin America, the
rates of return to education are well above those found in the OECD.
In any event, all the evidence strongly stands against the notion of an impoverished
and disadvantaged group of educated young people in developing countries.
Estimates of rates of return to education are, for obvious reasons, of more recent
vintage in countries of Central and Eastern Europe and here the pattern is a little different.
For the most part, these studies have found that rates of return to education have been
increasing during the first half of the 1990s although they remain well below the levels of
return to be found in comparable middle- income countries (Newell & Re illy, 1999). Again,
31 See, for example, UNICEF (2000).
40
this growing inequality in the wages of those with different levels of education indicating as
it does, growing benefits to educational participation is to some extent a reflection of the
introduction of market signals 32 and therefore would be considered by many as a positive
development.
One or two recent studies have however started to modify and refine this overall
view. Campos & Joliffe (2002) looking at the returns to education in Hungary from 1986 to
1998, find that although returns have been growing over the period, the main period of
change was in very early transition, between 1986 and 199233 and that since 1992, returns to
an additional year of education have been above 10% which is in line with other middle
income countries and well above those found in Western Europe. Somewhat similar results
have been found also in Belarus (Pastore & Vershchagina, 2002) On the other hand, recent
evidence for Russia (Cheidvasser & Benitez-Silva, 2000) suggests that rates of return in that
substantial country remain lower than the average for transition economies and, moreover,
have not increased to any significant extent since 1992. In the largest transition country of
them all, China, recent estimates (Li, 2003) suggest that there too economic reforms
increased the returns to education, with the main increase occurring in transition (1980-87)
with relatively little variation in rates of return in the subsequent period examined (1988-95).
At the Macro level, evidence also supports substantial benefits to rising levels of
education as a whole. Here the main debate concerns whether the stock of human capital (or
education) affects the level of income in an economy or its growth rate. Taken as a whole,
however, studies provide strong support for the view that raising the level of human capital in
an economy raises its productivity and therefore the earnings potential of an economy
(Sianesi & Reenen, 2002).
32 Indeed, Newell (2001) finds that growing wage inequality in Poland at least is attributable to rising participation in post-compulsory education and earlier retirement as opposed to changes in hourly wage inequality. 33 These results confirm and extend those reported by the Kertesi & Kollo (1999) looking at period upto 1996 in Hungary, Czech Republic and Poland.
41
3.4.4 Wages and Employment
Here the debate in recent times has centred on the effects of minimum wages on
employment in general and youth employment in particular. O’Higgins (2001) reports small
or zero employment effects of minimum wages. However, this was largely based on evidence
from OECD countries. There is some relatively recent evidence to support a negative impact
on employment on minimum wages in some developing countries at least. Worthy of note in
this regard are the papers by Maloney & Nunez (2000?) and Arya (2002). Both of these find
small but significant negative effects of minimum wages on employment. Maloney & Nunez
find an aggregate elasticity of employment with respect to the minimum wage of .15, whilst
Arya finds an even smaller albeit statistically significant negative effect of minimum wages
on teenage employment (but not on the employment of young adults) in Thailand. On the
whole there appears to be no reason to significantly revise the earlier view expressed in
O’Higgins (2001).
In general, because of the existence of large informal sectors as well as more general
difficulties in enforcing compliance with minimum wage regulations, the issue of the impact
of minimum wages has been seen as less relevant in developing countries. However, one
very interesting finding of the Maloney & Nunez paper is that, for a range of Latin American
countries at least, the minimum wage seems to affect wage determination not just in the
formal sector but also in the informal sector. This is indeed an important finding which needs
further investigation.
3.4.5 State Dependence
“What we do here today, echoes in all eternity.”34 Perhaps, perhaps not. Certainly,
however, what we do today has an important impact on what we will be able to do tomorrow.
Put in another way the labour market outcome(s) experienced by an individual today is (are)
likely to have an important influence on the labour market outcome(s) of that same individual
tomorrow. The consequence or outcome becomes, at least partially, the cause. In the context
of young people, perhaps two types of ‘state dependence’ are of particular importance. First,
34 Russell Crowe as Maximus in the film, Gladiator, 2000, Columbia-Tristar.
42
Child labour. More or less everybody agrees it is a bad thing35. It seems generally agreed that
it is likely to damage young people, impeding the acquisition of human capital and causing
physiological and psychological damage. However, actual evidence supporting these
assumptions is, to say the least, rather patchy. As the ILO’s report (ILO, 2002d) notes, more
needs to be known about the medical consequences of children working. In the context of the
labour market problems of young people, more also needs to be known also on the long-term
consequences on the labour market experiences of young people arising from their
involvement in child labour. As yet, whilst much is believed, little evidence has been
analysed. Now that evidence is being more systematically collected on child labour, it would
perhaps be an appropriate moment to start looking more seriously at the question of the links
between child and (young) adult labour market experiences.
The second kind of ‘state dependence’ question concerns the persistence of
unemployment. More precisely, the question arises as to whether the fact of being
unemployed today makes one more likely to be unemployed tomorrow. Moreover, for policy
purposes, it is also desirable to understand whether state dependence is greater for young
people than for adults. In industrialised countries this question has started to receive some
attention. In several European countries state dependence effects have been found for young
people 36. Moreover, such scarring effects have been found to last for at least seven years in
France and upto seventeen in the UK.37. In contrast, little evidence of state dependence has
been found in the USA (Ryan, 2001).
35 I refer here, of course, to Child labour as defined by the ILO, rather than working children per se. The ILO definition explicitly concerns forms of work undertaken by young people upto the age of eighteen which should be eliminated. Acceptable forms of infantile employment essentially concern ‘light work’ from the age of twelve and ‘non-hazardous work’ from the age of fifteen or thereabouts. For further details see ILO (2002d). 36 See the excellent discussion of this and other issues in Ryan (2001) and the papers cited therein. I do however find myself splitting hairs with one aspect of his analysis. Ryan states that current policies targeted at long-term young unemployed are predicated on three assumptions, one of which is that that state dependence is stronger for youths than for adults. I beg to differ. Even if state dependence were of the same order for youths and adults there is clear economic argument in favour of concentrating o the former. Specifically, young people are younger than adults and consequently state dependence effects will, on average, last longer. That is, the same negative state dependence effects leading to an equal permanent lowering of income and productivity will be quantatively larger for young people since, on average, they will last longer. 37 See Allaire et al. (1995) on France and Gregg (2001) on the UK.

43
3.5 Conclusions
Much of this section has been concerned with what we believe but as yet have little
hard evidence to support. Further research is clearly needed in a range of areas, of which
more below. Amongst the evidence based findings reported here the following are perhaps
worth highlighting:
• Youth unemployment in developing and transition countries appears to be strongly
influenced by both demographic factors and aggregate labour market conditions. In as
much as young people’s share in the working age population is on a downward trend
in most countries, this is an encouraging finding suggesting that falling youth
population shares may lead to an easing of difficulties in the transition to good quality
employment.
• The relatively small differences between the duration of unemployment for youths
and adults found here, suggest that attention needs to be paid to the long-run
unemployment of young people. More generally more attention to disadvantaged
groups amongst the young is in order
• Results on returns to education, the effects of education on unemployment and the
discussion of ‘which outcomes’ taken together cast further doubts, if such were
necessary, on the ‘educated unemployment’ hypothesis. There is no objective basis
for an exclusive concentration on the problems of educated unemployed.
• Evidence from industrialised countries suggests that state dependence in
unemployment is an important problem. More information and analysis is needed for
transition and developing countries on this question as well as on the links between
child labour and the labour market experiences of young people.
44
4. CONCLUDING REMARKS
4.1 Policy Implications
• Long-run evidence suggests that, whilst many improvements have been registered,
greater efforts are required in combating the educational disadvantage of young
women. Since education is a strong determinant of ‘success’ on the labour market,
wide, often widening gaps in the levels of education of young women and young men
remain a major cause for concern
• Youth Employment Policy needs to focus greater attention on disadvantaged groups
in the labour market. A first step in this requires objective identification of which
groups have greatest problems in obtaining and maintaining good quality
employment. In developing countries, it is time to discard the ‘educated unemployed’
hypothesis, popular for so long for fairly obvious but not objective reasons, and
concentrate on groups really requiring attention.
• Evidence accumulated on wages and employment does not provide strong support for
the hypothesis that minimum wages are damaging to the employment prospects of
young people. However, recent work has suggested that they may be more relevant in
developing countries than previously believed. Specifically, such evidence as exists
suggests that the detrimental employment effects of minimum wages may greater in
at least some developing countries than in the industrialised world. Further, evidence
from Latin America suggests that minimum wages may affect wage setting in both
formal and informal sectors. If true at a general level, this has important implications
for wage policy in developing countries.
4.2 Research implications
It is evident from the analysis presented here that many gaps remain in out
knowledge. Amongst possible topics for further research, I would emphasise the following:
• Links between child labour and later youth labour market experiences
• The extent and nature of the involvement of young people in the informal sector and
in underemployment
• State dependence in youth labour market experiences
45
• The extent and nature of youth labour market problems amongst different types of
young person
• To what extent are youth and adult labour markets separate entities? This is an
important, and rather neglected, issue. Understanding (potential or actual) substitution
and complementarity between workers of different ages can be a useful support to
designing policies which do not involve (unintentional) large-scale substitution
between workers of different ages
• The role of minimum wages on wage setting in both formal and informal sectors in
developing and transition countries.
4.3 Data Implications
Data collection, compilation and dissemination has improved enormously in recent
years. This is due largely to the efforts of national and international agencies, or rather, to the
efforts of the people who work for them. They are to be congratulated. It is to be hoped,
however, that further improvements may follow. In terms of the analyses presented here two
very obvious ways in which the available information might be improved are:
• The dissemination of data on labour market status (including unemployment duration)
disaggregated by age and a variety of other relevant characteristics. In general such
data is collected, however, it is often not (easily) available
• Collection of longitudinal information on the labour market experiences of children
and young people. Amongst other things, this would help throw light on ‘state
dependence’ crucial for the design of appropriate preventative as well as remedial
youth employment policies

46
References
Allaire, G., Cahuzac, E. & Tahar, G. – 1995 – "Persistence de Chomage et Insertion," in, A. Degenne, M. Mansury & P. Werquin (ed.s), L’Analyse Longitudinale du Marché du Travail, CEREQ, Marseille.
Arya, G. – 2002 – “Wages and Youth Employment in Thailand,” ILO-EASMAT,
Bangkok. www.ilo.org/public/english/region/asro/bangkok/conf/youth/con_stu/constu.htm
Bertola,G., Blau, F.D. & Kahn, L.M. – 2002 – “Labor market institutions and
Demographic Employment Patterns,” NBER working paper no. 9043, Cambridge, MA. www.nber.org/papers/
Campos, N.F. & Joliffe, D. – 2002 – “After, Before and During : Returns to Education
in the Hungarian Transition”, William Davidson working paper no. 475, Michigan. ideas.repec.org/s/wdi/papers.html
Cheidvasser, S. & Benìtez-Silva, H. – 2000 – “The Educated Russian’s Curse: Returns
to Education in the Russian Federation,” mimeo, Yale University. ms.cc.sunysb.edu/~hbenitezsilv/research.html
Flaim, P. – 1979 – “The Effect of Demographic Changes on the Nation’s Unemployment
Rate,” Monthly Labor Review, vol. 102, pp. 13-23. Flaim, P. - 1990 – “Population Changes, the Baby Boom and the Unemployment Rate,”
Monthly Labor Review, vol. 113, pp. 3-10. www.bls.gov/opub/mlr/archive.htm#1990
Godfrey, M. – 2003 – “Youth Employment Policy in Developing and Transition
Countries: prevention as well as cure,” paper prepared for the World Bank meeting on youth employment, Washington D.C., June 2. wbln0018.worldbank.org/HDNet/HDdocs.nsf/vtlw/CF861243EAB060D185256D34005466B2?OpenDocument
Gordon, R. – 1982 – “Inflation, Flexible Exchange Rates and the Natural Rate of
Unemployment,” in M. Baily (ed.), Workers, Jobs and Inflation, Brookings Institute, Washington D.C..
Gregg, P. – 2001 – “The Impact of Youth Unemployment on Adult Unemployment in
the NCDS,” Economic Journal, Vol. 111, pp. F626-F653.
47
ILO – 1993 – Resolution Concerning Statistics of Employment in the Informal Sector, adopted by the 15th International Conference of Labour Statisticians, ILO, Geneva. www.ilo.org/public/english/bureau/stat/res/infsec.htm
ILO – 1996 – Child Labour: Targeting the Intolerable, ILO, Geneva.
www.ilo.org/public/english/standards/ipec/publ/clrep96.htm ILO – 1998 - Resolution Concerning the Measurement of Underemployment and
Inadequate Employment Situations, adopted by the 16th International Conference of Labour Statisticians, Geneva, ILO. www.ilo.org/public/english/bureau/stat/res/underemp.htm.
ILO – 2002a – Every Child Counts: New Global Estimates on Child Labour, ILO,
Geneva. www.ilo.org/public/english/standards/ipec/simpoc/others/globalest.pdf ILO – 2002b – Women and Men in the Informal Sector: A Statistical Picture, ILO,
Geneva. www.ilo.org/public/english/employment/gems/download/women.pdf ILO – 2002c – Decent Work and the Informal Economy, Report VI, ILC 90th session,
ILO, Geneva. www.ilo.org/public/english/standards/relm/ilc/ilc90/reports.htm ILO – 2002d – A Future without Child Labour, Report 1 (B), ILC 90th session, ILO,
Geneva. www.ilo.org/public/english/standards/relm/ilc/ilc90/reports.htm ILO- 2002/2003 – Key Indicators of the Labour Market, 2001-2002, including 1st update,
ILO, Geneva. www.ilo.org/public/english/employment/strat/kilm/index.htm Jimeno, J. F. & Rodriguez-Palenzuela, D. – 2002 – “Youth Unemployment in the
OECD: Demographic Shifts, Labour market Institutions, and Macroeconomic Shocks,” European Central Bank, working paper no. 155, Frankfurt.. www.ecb.int/pub/wp/ecbwp155.pdf
Jones, G. – 1997 – “Population Dynamics and Their Impact on Adolescents in the
ESCAP Region,” Asia-Pacific Population Journal, Vol. 12, no. 3, pp. 3-30. Kertesi, G. & Kollo, J. – 1999 – “Economic Transformation and the Return to Human
Capital,” Budapest working papers on the Labour Market, University of Economics, Budapest.
Korenman, S. & Neumark, D. – 1997 – “Cohort Crowding and Youth Labor Markets:
A cross-national analysis,” NBER Working paper no. 6031, Cambridge, MA. www.nber.org/papers/
48
Kruse, D. & Mahoney, D. – 1998 – “Illegal Child Labor in the United States: Prevalence and Characteristics,” NBER working paper no. 6479, Cambridge, MA. www.nber.org/papers/
Li, H. – 2003 – “Economic Transition and Returns to Education in China,” Economics of
Education Review, vol. 22, pp. 317-328. Maloney, W.F. & Nunez, J. – 2000? – “Measuring the Impact of Minimum Wages:
Evidence from Latin America,” World Bank Policy Research Paper no. 2597. econ.worldbank.org/files/1717_wps2597.pdf
Manning, C. & Junankar, P.N. – 1998 – “Choosy Youth or Unwanted Youth? A
Survey of Unemployment,” Bulletin of Indonesian Economic Studies, vol. 34, no. 1, pp. 55-93.
Newell, A. – 2001 – “The Distribution of Wages in Transition Countries,” IZA
Discussion Paper no. 267. ideas.repec.org/p/iza/izadps/dp267.html Newell, A. & Reilly, B. – 1999 - “Rates of Return to Educational Qualifications in the
Transitional Economies,” Education Economics, vol. 7, no. 1, pp. 67-84. O’Higgins, N. – 1997 – The Challenge of Youth Unemployment, Employment and
Training Papers no. 7, ILO, Geneva. www.ilo.org/public/english/employment/skills/youth/publ/
O’Higgins, N. – 2001 – Youth Unemployment and Employment Policy: A Global
Perspective, ILO, Geneva. www.ilo.org/public/english/employment/skills/youth/publ/
O’Higgins, N. – 2002 – Youth Employment in Asia and the Pacific: Analyticial
Framework and Policy Recommendations, ILO-EASMAT, Bangkok. www.ilo.org/public/english/region/asro/bangkok/conf/youth/con_stu/constu.htm
O’Higgins, N., Pastore, F., Beleva, I. & Ivanov, A. – 2001 - “Targeting Youth
Employment Policy in Bulgaria,” Economic and Business Review, Vol.3, no. 2, 2001, pp. 113-135.
OECD – 1999 – Preparing youth for the 21st Century: The Transition from School to the
Labour Market, OECD, Paris. www.oecd.org Pastore, F. & Veshchangina, A. – 2002 – “The Distribution of Wages in Belarus,”
Paper presented at the AIEL Conference, September 26-27, Salerno. Psacharopoulos, G. – 1973 – Returns to Education: An International Comparison,
Elsevier, Amsterdam.
49
Psacharopoulos, G. & Patrinos, H.A. – 2002 – “Returns to Investment in Education : A Further Update,” World Bank Policy Research Working Paper no. 2881. econ.worldbank.org/files/1717_wps2881.pdf
Rama, M. – 1999 – “The Sri Lankan Unemployment Problem Revisited,” World Bank
Working paper no. 2227. econ.worldbank.org/files/1717_wps2881.pdf Ryan, P. – 2001 – “The School- to-Work Transition: A Cross-National Perspective,”
Journal of Economic Literature, Vol. 39, no. 1. www.econ.cam.ac.uk/faculty/ryan/
Ryan, P. -2003 – “The School-to-Work transition: Problems and Indicators,” in A.N.
Perret-Clermont, C. Pontecorvo, L. resnik, T. Zittoun & B. Burge (ed.s), Youth Learning and Society, CUP, Cambridge. www.econ.cam.ac.uk/faculty/ryan/
Schneider, F. – 2002 – “Size and Measurement of the Informal Economy in 110
Countries around the World,” Paper presented at a Workshop of the Australian National Tax Centre, Canberra, Australia, July 17, 2002. rru.worldbank.org/documents/informal_economy.pdf
Shimer, R. – 1999 – The Impact of Young Workers on the Aggregate Labour Market ,
NBER Working Paper no. 7306, Cambridge, MA. www.nber.org/papers/ Sianesi, B. & Reenen, J. van – 2002 – “The Returns to Education: A Review of the
Empirical Macro-Literature,” IFS Working Paper no. 02/05. www.ifs.org.uk/workingpapers/index.shtml
Thomas, V., Wang, Y. & Fan, X. – 2000 – “Measuring Education Inequality: Gini
Coefficients of Education,” Mimeo, World Bank Institute, Washington D.C.. www.econpapers.hhs.se/paper/wopwobael/2525.htm
UNDP – 2002 – Avoiding the Dependency Trap: The Roma in Central and Eastern
Europe, UNDP-RBEC, Bratislava. www.ilo-ceet.hu/publications/index.htm UNICEF – 2000 – Young People in Changing Societies, Regional Monitoring Report no.
7, IRC, Florence. www.unicef- icdc.org/research/ESP/youth/indice.html
50
Appendix: Data Sources for Figures and Tables
Figures 1-3: ILO – 2003 – Labour Force estimates and Projections 1950-2010, laborsta.ilo.org .
Figures 4-5: UNESCO – 2002 - Estimates and projections of adult illiteracy for
population aged 15 to 24 years old, by country and by gender, 1970-2015, UNESCO Institute for Statistics, Paris, www.unesco.org
Figures 6-10: ILO – 2003 – Labour Force estimates and Projections 1950-2010,
laborsta.ilo.org Figure 11-12: ILO – 2002/2003 Key Indicators of the Labour Market, 2001-2002,
including 1st update, ILO, Geneva. www.ilo.org/public/english/employment/strat/kilm/index.htm
Figure 13: OECD – 2003 - Labour market Statistics Database, www.oecd.org/topicstatsportal/0,2647,en_2825_495670_2759248_1_1_1_1,00.html Figure 14: ILO – 2002 – Decent Work and the Informal Economy, Report VI, ILC 90th
session, ILO, Geneva, table 2.1, p. 14. www.ilo.org/public/english/standards/relm/ilc/ilc90/reports.htm
Figure 15: ILO – 2002 – STAT database on the informal sector.
www.ilo.org/public/english/bureau/stat/papers/comp.htm Figures 16a & 16b: : OECD – 2003 - Labour market Statistics Database, www.oecd.org Table 1 – : ILO – 2002/2003 Key Indicators of the Labour Market, 2001-2002, including
1st update, ILO, Geneva, www.ilo.org/public/english/employment/strat/kilm/index.htm
Copyright © 2022 FDOKUMEN