INDIAN LABOUR JOURNAL
117
ISSN 0019-5723 INDIAN LABOUR JOURNAL (A MONTHLY PUBLICATION) Volume 54 December 2013 No. 12 GOVERNMENT OF INDIA MINISTRY OF LABOUR AND EMPLOYMENT LABOUR BUREAU SHIMLA/CHANDIGARH
-
Upload
khangminh22 -
Category
Documents
-
view
0 -
download
0
Transcript of INDIAN LABOUR JOURNAL

ISSN 0019-5723
INDIAN LABOUR JOURNAL (A MONTHLY PUBLICATION)
Volume 54 December 2013 No. 12
GOVERNMENT OF INDIA
MINISTRY OF LABOUR AND EMPLOYMENT
LABOUR BUREAU
SHIMLA/CHANDIGARH

EDITORIAL COMMITTEE
Chairman Daljeet Singh
Editor I.S.Negi
Associate Editor R.C.Jarial
Staff Writers
Laxmi Kant
Ravinder Kumar
NOTE TO CONTRIBUTORS
Non-controversial articles on labour matters of topical interest (e.g. labour and
wage policy; industrial relations; industrial management; trade union movement; labour
welfare; workers‟ participation in management; employment/ unemployment; labour
research of empirical value and of general interest etc.) are accepted for publication in
the Journal. The articles generally not exceeding ten thousand words may be sent in a
floppy diskette of 3.5” or C.D in Microsoft Word only with a print out in double space
on one side foolscap paper, addressed to the Director General, Labour Bureau,
„Cleremont‟, Shimla -171 004 alongwith a declaration by the author that the article has
neither been published nor submitted for publication elsewhere. All references and
footnotes, may be given only at the end of the articles.
Authors are solely responsible for the factual accuracy and the opinion
expressed in their signed articles. The Labour Bureau, however, reserves the right to
edit, amend and delete any portion of the article with a view to make it more
presentable and to reject any article, if not found suitable. The articles which are
rejected will not be returned and no correspondence will be entertained on the articles
which are rejected by the Editorial Committee.
A copy of the Journal, in which the article appears, is supplied to the author.
An honorarium up to Rs. 1,000 is also payable as per rules for each article published.
Our address: The Director General, Labour Bureau ‘Cleremont’, Shimla 171 004
Fax No: 0177-2655253 Website: http://labourbureau.nic.in E-mail [email protected]

PREFACE
“The Indian Labour Journal” earlier known as “Indian Labour Gazette” is a monthly publication being brought out since July, 1943. This publication is the only official publication of its kind in the country disseminating latest labour statistics and research in the field of labour which has immense utility for diverse stakeholders such as Employers‟ and Employees‟ Organizations, Research Scholars, Central and State Governments, Autonomous Bodies, Courts, Universities etc.
The Journal normally contains matters of interest on labour such as Labour Activities, News about Indian & Foreign Labour, Labour Decisions, Labour Literature and Labour Statistics. But, at times, non controversial articles on labour matters of topical interest and the gist of the Reports, Enquiries & Studies conducted by Labour Bureau are also published.
Suggestions for further improvement of the publication are welcome.
DALJEET SINGH
DIRECTOR GENERAL
LABOUR BUREAU,
SHIMLA-171004


INDIAN LABOUR JOURNAL
Published Monthly by
LABOUR BUREAU SHIMLA/CHANDIGARH
(First Published in July, 1943 as Indian Labour Gazette)
Vol.54 December, 2013 No 12
CONTENTS Page
SPECIAL ARTICLE
On Content & Extent of Coverage of Consumer Price Index for Industrial Workers
(CPI-IW) New Series
1201
LABOUR ACTIVITIES
Labour Situation 1218
Industrial Disputes 1221
NEWS IN BRIEF
(a) INDIAN LABOUR
Job Creation by Corporate India Hits Three-Year Low 1223
The Invisible Workers 1223
30% Indian IT Engineers Lack Basic Skills, Says Report 1224
Karnataka Exempts IT from Labour Law for Another 5 Years 1224
Workers at 5 Major Ports to Get Higher Wages 1224
Insurance Cover for Expatriate Workers in Gulf on the Anvil 1225
Industries/Services declared Public Utility Services under the Industrial Disputes Act 1947 1225
Consumer Price Index Numbers for Industrial Workers 1226
Consumer Price Index Numbers for Agricultural Labourers and Rural Labourers 1226
( b) FOREIGN LABOUR
ILO Director-General Calls on Countries to Boost Efforts to Fight Child Labour 1227
Unions Continue to Put UN under Fire for Not Respecting Workers‟ Rights 1227
New Global Index Exposes 'Modern Slavery' Worldwide 1227
Spain Jobless Rate Down A Tad Despite Recovery 1228
US Jobless Claims Fall Less Than Expected 1228
Asia Failing to Protect Rights of Domestic Workers 1228
Latin American and Caribbean Unemployment Rate Could Fall to 6.2% in 2013 1229
LABOUR DECISIONS
For Seeking Voluntary Retirement as per Regulation (12 b) Three Months Notice is
Mandatory
1230

Indian Labour Journal, December 2013
1200
LABOUR LITERATURE
Important Articles of Labour Interest Published in the Periodicals Received in the Labour
Bureau
1231
STATISTICS
Section A- Monthly Statistics 1235
Section B- Serial Statistics 1277
ANY REPRODUCTION FROM THE JOURNAL SHOULD BE SUITABLY ACKNOWLEDGED
Subscription and complaints, if any, regarding the distribution of the Indian
Labour Journal should be sent only to
THE CONTROLLER OF PUBLICATIONS, CIVIL LINES, DELHI 110054
Pre-payable subscription rates for the Indian Labour Journal
Annual Rate of Subscription Rs.900.00
Sale per copy Rs. 75.00

Indian Labour Journal, December 2013
1201
SPECIAL ARTICLE
On Content & Extent of Coverage of Consumer Price Index for Industrial
Workers (CPI-IW) New Series
By Daljeet Singh, Sunil Chaudhary and Amit Verma; Labour Bureau
“The consumer price index (CPI) is designed primarily to measure the changes over time in the
general level of prices of goods and services that a reference population acquires, uses or pays
for ”…………….. The Preamble ILO resolution concerning CPI.
1. Introduction:
1.1 The Consumer Price Index numbers for Industrial Workers [CPI (IW)] in India are being compiled and disseminated by the Labour Bureau since its inception on a monthly basis. The CPI numbers for industrial workers measure a change in the retail prices of fixed basket of goods and services being consumed by an average working class family. Amongst all the available population segment specific CPI series compiled at the National level, the CPI series for industrial worker is one of the important measure at the point of consumption and the most widely followed series as wages / salary of industrial workers as also of all salaried employees in public and private sectors, in services and trade etc., are indexed to the all India/centre specific series. 1.2 Basic Framework: There are two essential constituents of CPI (IW) namely; weighting diagram and retail prices. The weighting diagram is built up at the start of the series on the basis of Family Living Survey/Working Class Family Income & Expenditure Surveys (WCFI&ES) to determine the consumption pattern among the defined population group to which the index relates - Industrial workers in the instant case. The weighting diagram along with the prices of the item basket constitutes the basic framework on which the index series is compiled periodically.
1.3 Need for Base Updation: The consumption pattern of the working class population undergoes change over a period of time & therefore, it becomes necessary that the consumption basket is updated from time to time to account for these changes and to maintain the representative character of the index. The need for frequent revision of base (preferably in 5 years but not later than 10 years) on account of fast changing consumption pattern of the target group has been recommended by ILO, National Statistical Commission, National Commission on Labour and also Technical Advisory Committee on Statistics of Prices and Cost of Living. Therefore to update the base of CPI (IW) numbers, the first thing is the conduct of Family Living Survey/Working Class Family Income & Expenditure Survey (WCFI&ES) for computation of weighting system for the index series.
1.4 Historical Background: The Labour Bureau launched family living survey during 1958-59 in 50 important industrial centres all over the country on uniform and scientific lines laid down by the Technical Advisory Committee on Cost of Living Index Numbers. Based on the results of the survey and utilizing the retail prices regularly collected from the selected markets, the CPI (IW) on base 1960, for each of the 50 centres and all India had been compiled and published by the Labour Bureau. With the passage of time, to cater to the changing pattern of consumption of working class, the Income & Expenditure Survey in 70 industrially important centres was conducted during 1981-82 in accordance with the recommendations of the Technical Advisory Committee on Statistics of Prices and Cost of Living (TAC on SPCL) set up by the Government and the guidelines laid down by ILO for the 1982 series. A fresh Family Income & Expenditure Survey was undertaken at 78 centres in 1999-2000 on the basis of which CPI (IW) 2001 = 100 series was prepared and released.

Indian Labour Journal, December 2013
1202
1.5 Scope and Coverage: For the scope of CPI, the reference/target population is industrial worker. In the name of industrial workers only factory workers were covered in the 1944 & 1949 series. The scope of industrial workers was further extended to by including plantation and mining workers with effect from 1960 series. Taking cognizance of the recommendations of Rath committee on consumer price index numbers - 1978, the scope and coverage under the 1981-82 and 1999-2000 survey was enlarged with the inclusion of manual workers in four more sectors viz. Railways, Public Motor transport undertakings, Electricity Generating & Distributing Establishments and Ports & Docks; in addition to those three sectors, mentioned ante, covered in the 1960 series. Therefore for the current series, the concept of industrial workers encompasses the following seven sectors i.e. Factories, Mines, Plantations, Railways, Public Motor Transport Undertakings, Electricity Generating & Distributing Establishments and Port & Docks under the relevant legislation viz. The Factories Act 1948, The Mines Act 1952, The Plantation Labour Act 1951, The Indian Railways Act 1890, The Motor Transport Workers Act 1961, The Indian Electricity Act 1910, The Dock Workers Act (Regulation of Employment) Act 1948 and The Indian Dock Labourers Act 1934. 1.6 While there has been a significant increase in the number of centres from 50 on base 1960 = 100 to 70 on base 1982 = 100 and 78 in the current series of 2001 = 100, there has also been an enhanced coverage of working class families surveyed under the above three series which were 23400, 34776 and 41040 respectively.
Details of various series of CPI (IW)
Sl. No.
Base Year Sectors covered Coverage of Centres
1. 1944=100 Factory Sector 24
2. 1949=100 Factory Sector 27
3. 1960=100 Factory, Mining & Plantation Sectors 50
4. 1982=100 Factory, Mining, Plantation , Electricity Generation & Distribution, Railways, Public Motor Transport And Ports & Docks Sectors
70 + 6 additional centres
5. 2001=100 …………..Do………………… 78
2 The Index Review Committee (IRC): 2.1 The Government constituted an Index Review Committee on 17th November 2006 under the chairmanship of Prof. G. K. Chadha to review the Consumer Price Index numbers for Industrial Workers. The committee has submitted its Report to the Ministry in 2009. The IRC has made several recommendations in its report for effecting overall improvements in the new series of CPI-IW. The Labour Bureau, Ministry of Labour & Employment has accepted all the recommendations made in the IRC. 2.2 The IRC has made several recommendations covering all the aspects of CPI (IW) such as Price Collection Machinery, Working Class Family Income & Expenditure Survey, Conduct of Repeat House Rent Survey and Index Compilation etc. Some of the major recommendations of IRC are:
1. Base year of the new series of CPI (IW) should not go beyond 10 years. 2. Consultation with various stakeholders should be there from very beginning till the
end. 3. Standing Tripartite Committee of all the stakeholders like Trade Unions‟,
Employers Organizations‟, Central/State Government Departments, Women‟s

Indian Labour Journal, December 2013
1203
Organizations and representatives from the newly emerging sectors need to be constituted.
4. Coverage of sectors need to be extended beyond existing seven sectors, by adding at least one or two more sectors such as Handloom & Construction sectors.
5. Number of centers to be covered in the next WCFI&ES should be reviewed and new upcoming centers may be added in the next survey.
2.3 Pursuant to one of the crucial IRC recommendation, a Standing Tripartite Committee (STC) has also been constituted to widen the consultation base with Index users & State governments so as to arrive at conclusion on issues in a more filtered & coherent manner prior to placing it to Technical Advisory Committee on Statistics of Prices and Cost of Living (TAC on SPCL) – the apex (and one of the most important) advisory body on prices functioning in the country under M/O Statistics & Programme Implementation - for obtaining concurrence. The documentary support of IRC report & deliberations to take place in STC/TAC on SPCL would guide in ascertaining the technical & scientific aspects of CPI (IW) measurement for the new series. 2.4 As the Consumer Price Index for Industrial Workers [CPI-(IW)] is constructed from several sample-based sources, the base revision exercise would entail, inter alia, refreshment of all sample based components entering into the index. The foremost step is ascertaining content and extent of coverage – a) identifying industrial sectors which would form basis to define & cover the target population; and b) selecting industrially representative/important areas (centres) throughout the country in which WCFI&ES is to be carried out for generation of weights & recurring collection of prices will be done for compiling indices. 3 Content of Coverage: 3.1 As indicated in the introduction, the target population for the existing CPI (IW) series is working class family. At the time of collection of data for preparation of weighting diagram, a working class family has been defined as one (i) which was located within the center (industrial area), (ii) which had at least one member working as manual worker in an establishment in any of the seven sectors of employment covered viz., factories, plantations, mining, ports and docks, public motor transport undertakings, electricity generating and distributing establishments, and railways; and (iii) which derived 50 per cent or more of its income during the calendar month preceding the day of enquiry through any manual work. Thus, in sum, seven sectors are being covered for the scope of CPI-IW presently. 3.2 The IRC recommendations on coverage of sectors: The IRC deliberated on the issue of extended coverage in the CPI (IW) new series apart from these seven sectors. The major sectors discussed were Handloom, Textiles, Construction and Bidi sector. After discussion, the committee recommended that the coverage of sectors needs to be extended beyond the existing seven sectors, by adding at least one or two more sectors such as Handloom and Construction sectors, so that around 70% of the workers of non-agricultural sector get duly covered in the CPI (IW). The committee, while recognizing the fact that time has come to extend the scope of coverage under WCFIES, decided that the workers belonging to the newly recommended sectors should also fall within the ambit of definition of workers under the relevant legislation as is the case of workers belonging to seven existing sectors.
3.3 Pursuant to these recommendations a careful & comprehensive analysis has been made while exploring the feasibility of expansion of coverage to Handloom & Construction sectors. This includes a review of existing methodology with regard to sampling procedure etc., also endorsed by IRC and observations gathered through the field visit to Panipat, Haryana centre. We note numerous measurement issues in the expansion of coverage to the mentioned sectors as detailed in the following paragraphs.

Indian Labour Journal, December 2013
1204
4 Issues involved in coverage of Handloom and Construction Sector 4.1 Handloom Sector (An Overview): There are about 43 lakh handloom workers in the country scattered in various villages of various States. The sector is basically decentralized in nature and the handloom weaving is a household activity. The sector is unorganized in nature, but there are Apex/Primary handloom cooperative societies, National/State level Handloom Corporations which engage handloom workers for various pre and post loom activities. There are about 21000 such Apex/Primary handloom cooperative societies of which about 16000 are functional. About 43 lakh handloom weavers/workers are involved in various activities connected with handloom weaving, dyeing, processing, marketing etc. These societies are registered under respective State Cooperative Societies Acts. Apart from cooperative societies, there are individual weavers, entrepreneurs, handloom exporters, who are part of the handloom sector. About 1500 exporters are also members of Handloom Export Promotion Council, Chennai. The Handloom Export Promotion Council is functioning under the administrative control of Office of the Development Commissioner for Handlooms and it is involved in handloom export promotion activities. 4.2 Office of the Development Commissioner (Handlooms), M/O Textiles has recommended the following centres to be covered under the sector in proposed series on the basis of concentration of weavers:
Sl. No. State Centre
1 Andhra Pradesh Dharamavaram
2 Assam Guwahati
3 Haryana Panipat
4 Karnataka Bagalkota
5 Tamil Nadu Salem
6 Uttar Pradesh Varanasi
4.3 Issues: At the outset it may be reiterated that the Index Review Committee had suggested “that the workers belonging to the newly recommended sectors should also fall within the ambit of definition of workers under the relevant legislation as is the case of workers belonging to seven existing sectors”. There is however no sector-specific legislation in respect of handloom sector. 4.4 There are numerous handloom co-operative societies in a district/state besides state/national level corporations. Many handloom units having 20 or more workers are registered under the Factories Act 1948. Secondly, for some “registered factories”, handloom is a subsidiary activity. Thus, such units are already represented through the Factory Sector in the CPI (IW). Rest of the units are predominantly household based &/or unregistered.
4.5 These may pose serious problems in uniquely identifying the reference population – working class families with in the sector- as for undertaking the WCFI&ES each sector is treated as an independent entity in a centre & therefore sampling frame for each sector is prepared separately. The issue is whether to treat the handloom workers employed in a “registered handloom factory”, as industrial workers within the ambit of factory sector or handloom sector. If the workers are treated as belonging to handloom sector then how to treat the handloom workers employed in a “registered factory with handloom as its subsidiary activity”, or how to apportion such workers between industrial workers and handloom workers. These definitional issues are difficult to resolve.
4.6 Frame construction and type of sampling to be adopted for the income & expenditure survey requires information on the concentration of working class families in each ward of the municipal area in a centre. The sector for which the 80% or more working class families could

Indian Labour Journal, December 2013
1205
be identified through these wards tenement sampling method is adopted; alternatively, payroll sampling method is used. To meet this requirement the definitional scope of the industrial worker and working class family will have to appropriately modify so as to uniquely/precisely identify the sector specific reference population to determine centre boundaries. The reliability of the weighting diagram would be compromised if the sampling frame for drawing the sample is faulty.
4.7 While attempting to expand the definitional scope, it has to be borne in mind that “industrial handloom workers” (precisely falling under the factory sector) salaried & entitled to various benefits such as insurance cover, provident fund etc. and “handloom weavers” receiving wages on „piece rate‟ basis & deprived of social security benefits may form entirely different class of manual workers for the purpose of CPI (IW).
4.8 Handloom units, being predominantly household based activity, are scattered and relatively small in respect of size of employment. This may have a bearing on the other important element in the construction of CPI (IW), prices. It is necessary to collect price data on periodic basis from the markets representing purchases of large segment of the working class population in each of the selected centres, in respect of all the items. For the scattered target population selection of representative market(s) and subsequently selection of representative outlet(s) would be an uphill task. It may happen that the price behavior as collected through the sample price quotations may not be statistically representative of the entire universe of consumer transactions in respect of item(s). It is needless to mention that systematic discrepancy in the price data may result in the severe distortion of the index.
4.9 Field visit to the Panipat, Haryana centre revealed that most of the handloom co-operative societies have become dysfunctional. Those still serving, besides other registered handloom units, rely heavily on the migrant weavers from the nearby states rather than on the traditional local weavers. For large number of migrant workers engaged in large proportion of scattered, unorganized & relatively smaller units in respect of employment size, formation of cluster of blocks or cluster of establishments for the conduct of WCFI&ES would be difficult. Selected sample families are to be staggered evenly over a full twelve - month period for removal of seasonal effects. Migrant nature of the weavers in conjunction with the unorganized characteristic of the sector may lead to high degree of non-response thereby invalidating the results. It also follows that it would be difficult to keep index realistic if the concerned population group keep changing the outlet(s)/market(s). The nature of dispersed and migrant handloom may also affect the selection of houses for computing house rent index. 5 Construction Sector (An Overview): 5.1 The construction sector in India is the second largest economic activity after agriculture. This sector has grown at a Compounded Annual Growth Rate of about 11.1% over the last eight years on the back of massive infrastructure sectors such as ports, power plants, roads and rapid rise in housing demand. The construction industry remains largely unorganized. Organized industry segment comprises large firms in the corporate sector, class A contractors registered with various government construction bodies and thousands of small contractors, which compete for small jobs or work as subcontractors of prime or other contractors as detailed in the following table:
Organized Industry Segment No. of Employees No. of Firms
Small < 200 25,000-30,000
Medium 200-500 >500
Large >500 250
Unorganized Industry Segment (Standalone
Contractors)
120,000
[Source: Report of the Working Group on Construction Sector (Institutional Financing
Working) for the 12th five year plan, Dec 2011]

Indian Labour Journal, December 2013
1206
5.2 Consultation with NBCC: National Buildings Construction Corporation Limited (NBCC) has been consulted on inclusion of Construction sector in new CPI (IW) series. The comments of NBCC are summarized below:
i. Construction sector workers employed through contractors only, figure is not available with NBCC.
ii. The workers belonging to construction sector are unorganized and fall within the ambit of definition of worker under Construction Labour Act/Building and Other Construction Workers (Regulation of Employment and Conditions of Service) Act etc.
iii. The workers in construction sector are usually engaged on casual basis directly by the contractor.
iv. The workers in construction sector do not reside permanently or at least 10-15 years at one place in the case of construction site.
v. Normally the workers in construction sector are not available for a longer period at their existing sites.
5.3 Issues: The workers engaged in the construction sector fall within the ambit of the Construction Labour Act/Building and Other Construction Workers (Regulation of Employment and Conditions of Service) Act, 1996 and thus the criteria laid down by the Index Review Committee as mentioned earlier is supposedly met. Identification of workers for the sector may not be a concern; however, for the scope of CPI (IW) indices the “construction sector” has to be precisely defined as which type of construction activity would represent the sector. Construction can be classified in various types of activities such as building, road, bridge etc. Inclusion of all such activities may cause difficulty in ascertaining the geographic boundaries of the centre. 5.4 For the sake of operational convenience, it may be presumed that building construction would represent the sector, which is by and large concentrated in the urban areas, or in the periphery of cities/towns. Housing/Building projects of “individual households/ Stand-alone Contractors” engaging large number of workers may be difficult to mark out for the scope of CPI (IW); hence “index area” can be identified with big construction projects of companies/builders. For the workers engaged in these projects usually labour hutments/colonies are created by the concerned company/builder within/nearby the site of construction in compliance to the provisions laid down in the Building and Other Construction Workers (Regulation of Employment and Conditions of Service) Act, 1996 to this extent. These settlements usually have relatively short (and variable) life span, in comparison to the life of the index series, which may depend upon the status of a particular project. After completion of the project these settlements are demolished and the workers engaged shift to another project situated at a different location. It follows that this will have consequences both for the WCFI&ES as well as for the price collection mechanism. 5.5 Construction of reliable weighting diagram is vital for an unbiased and realistic index series. As undertaking WCFI&ES requires full twelve – month period, the demolition of these sample settlements during the survey period may create bias in the data. Moreover, migrant workers constitute large proportion of construction workers and thus seasonal variations in the no. of workers engaged at the time of harvest, festival etc would be sharp. Thus the consumption expenditure data arrived at from WCFI&ES would carry seasonal effects. In a nutshell, chances for distorted weighting diagram are very high.
The sample price quotations for the purpose of index series have to be collected on periodic basis from the markets patronized by the target population group. Because of a moving/shifting reference population, outlet(s)/market(s) have to be changed frequently, it may however induce severe bias in the indices as new outlet(s)/market(s) will often be distinctive in their pricing and service policy. For the same reasons, compiling house rent index would be difficult for this sector.
5.6 In the light of issues detailed herein above, it automatically follows that the expansion of scope of CPI (IW) to the Handloom and Construction sectors may not be operationally

Indian Labour Journal, December 2013
1207
feasible and therefore the coverage of the new series in respect of sectors may desirably be kept limited to the existing seven sectors only.
6 Extent of coverage: Selection of Centres- 6.1 Background: The number of centres to be surveyed during the period 1999-2000 was primarily decided on the basis of increase in employment of industrial workers vis-a vis the last survey, inclusion of States/Union Territories not represented earlier, the requirement for building up a representative all-India average Consumer Price Index Series, operational feasibility and resources available. Based on the above criteria, 78 centres were selected covering about 55% of the total All India employment of industrial workers in the seven sectors as against the 47% covered by 70 centres in the last survey. The allocation of 78 centres amongst Factory, Mining and Plantation sectors in various State/Union Territories was done on the basis of following three stage process/criteria laid down by the TAC on SPCL:-
i. The sectors that are covered were divided into three groups. They are Mining, Plantations and remaining sectors. The total number of centres (78) was allocated among these in proportion of employment in each group to the total employment in the country as a whole. This was done mainly to ensure that the number of Mining and Plantation centres covered during the last survey is retained.
ii. The number of centres allocated to each sector was then distributed amongst States on the
basis of industrial employment in a State subject to a maximum of 5 centres being allotted to a State in a sector , so that the smaller States get at least one centre.
iii. The name and location of centres were then selected on the basis of centre-wise industrial
employment in consultation with the respective State Governments, wherein centres likely to be important in the coming years are also considered.
Table I reports the list of 78 centres and sector wise break-up thereof is as under: Factory (Other five sectors) centres = 60
Plantation centres = 10
Mining centres = 8
6.2 The IRC recommendations on Selection of Centres:
6.2.1 The Committee felt that there was no need for suggesting any change at this stage in the procedure for the selection of centres. However, it recommended that the number of centres to be covered in the next WCFIES should be reviewed by the Labour Bureau and the new upcoming centres may be added in the next survey. The Committee further recommended that considering the pace and pattern of development in individual States in the coming few years the number of centres to be covered under the new Working Class Family Income & Expenditure Survey need to be increased and the new emerging sectors of employment need to be adequately represented.
6.2.2 The Committee observed that the total population of industrial workers has increased due to the thrust of economic growth process in the direction of non-agricultural sectors to which the XIth Five Year Plan Document also refers. Though services sector is having a formidable share in GDP, yet manufacturing, an important sector of the economy in its own right, is likely to provide future thrust of India‟s economic growth. It is high time that the CPI for industrial workers should take cognizance of such future changes.
6.3 Proposed Centres:
6.3.1 The coverage of centres for the fresh WCFIES has been thoroughly reviewed on the basis of employment data furnished by the States/U.T‟s for different sectors covered in the States. Lists of centres having concentration of workers and total employment details in the State/U.T‟s relating to these sectors were obtained from various State Governments. Employment data pertaining to seven existing sectors have been used to work out the total

Indian Labour Journal, December 2013
1208
centres to be covered in the new series. The employment of industrial workers in these seven sectors has registered an increase of 15% since the last survey of 1999-2000 in which 78 centres were covered. On the basis of this increase the number of centres to be covered in the new series works out to 90 centres.
Description Mining Plantation Other Five
Sectors
All Seven
Sectors
Total employment @ the
time of last survey 820987 961983 9928701 11711671
Total employment as on
reference date for the
proposed survey
744946 1118227 11620548 13483721
Change in % -9 16 17 15
Centres Allotted in 2001
series 8 10 60 78
Total Centres for the proposed new series of CPI-IW on the basis of
total increase in employment in seven existing sectors 90
Proportionate allocation of
centres on the basis of sector
wise employment
5 7 78 90
Actual Unadjusted Allocation 8 12 70 90
6.3.2 Allocation/selection of centres has been done in the following manner:
i. The total no. of centres i.e. 90 has been allocated to (a) plantation (b) mining and (c) other five sectors (viz. factories, railways, port & docks, public motor transport undertakings electricity generating and distributing establishments) keeping in view the proportion of their respective employment in the country and sector-specific growth in employment since last survey. Since mining sector has registered a negative growth in employment, therefore the number of centres presently covered in the sector, i.e., 8 has been retained. Plantation has been allotted 12 centres after taking into account increase in employment & remaining centres i.e. 70 have been allocated to the other five sectors.
ii. The number of centres allocated to a particular sector among the States/UT‟s has been
distributed on the basis of their industrial employment subject to a maximum allotment of 5 centres per state in a sector so as to provide representation to the smaller States. Once a centre is selected, working class families belonging to all seven sectors are covered. Therefore, in cases of centres common to more than one sector in a State have been duly adjusted. Moreover, few centres have been merged as proposed by the respective State Government or as per existing practice. The adjusted allocation of centres amongst the sectors on the above lines is as follows:
Description Mining Plantation
Other
Five
Sectors
All Seven
Sectors
Actual adjusted Allocation 8 12 68* 88#(87+1)
*Two centres have been merged - Bangalore (R+U); Kolkata+24 North Parganas+24 South
Parganas.
# includes an additional centre given to the State of Maharashtra

Indian Labour Journal, December 2013
1209
iii. The actual selection of centres has been done on the basis of industrial importance of the centre as ascertained by the centre wise employment data. There are 65 common Centres & 23 new centres while 13 centres have been dropped. The proposed centres cover approximately 60% of total employment in the seven sectors. (Table II & III)
6.4 Mention needs to be made that as per established practice, the Labour Bureau had also sought the views of all the State Governments/ Union Territory Administrations on the centres proposed for the new series of CPI-IW. In this regard, the comments have been received from most of the States/Union Territories. The States/Union Territories have largely agreed to the centres proposed by the Labour Bureau. Recommendations, to replace/add some of the centres which the respective State/UT government considered to be of industrially more important &/or regionally more representative than the proposed one, have been duly incorporated. CONCLUSION: The twofold agenda points on determination of content and extent of coverage has been discussed in detail, on the lines as described in this paper, in the first meeting of STC held on 2
nd July 2013, and subsequently in the first meeting of the Group of Technical Advisory
Committee on Statistics of Prices and Cost of Living under the Chairmanship of Shri Vijay Kumar, DG & CEO, NSSO held on 22
nd October, 2013 in the Ministry of Statistics & PI. The
members were apprised about the issues likely to come up in covering Handloom & Construction sector. The STC & Group of TAC on SPCL appreciated the aforementioned operational difficulties and was in broad agreement with the views expressed by the Labour Bureau.
However, several members in the first STC meeting spoke in favor of exploring feasibility to expand the scope to the aforementioned additional sectors and finally, after deliberations held in the first meeting of Group of TAC on SPCL, it emerged that Labour Bureau shall cover both Construction and Handloom sectors on pilot/experimental basis. Two centres from each Handloom & Construction sector shall be covered separately without forming the part of all-India series. The expertise gained during the pilot exercise would facilitate decision making for inclusion of these two sectors in the subsequent series.
The STC broadly agreed on the detailed methodology followed for arriving at the no. of centres to be covered in the new series with some suggestions such as relaxing the norm of five centres per sector per State in case of Maharashtra because of large employment share and to hold further consultation for few a centre with respective State Governments, which has been duly acceded to. After incorporating the changes, as suggested by the STC, the Group of TAC on SPCL accorded its approval on the list of 88 centres for the new series as proposed by the Bureau (Table II). Thus, seven sectors & 88 centres determine the scope and coverage for the new centre wise/all India CPI (IW) series.
With regard to coverage of Construction and Handloom sectors on pilot/experimental
basis so as to facilitate decision on inclusion of these sectors for coverage in the subsequent series of CPI (IW) series, especially in the backdrop of limitations in their coverage as envisioned and spelled out in the preceding notes following centres in respect of each of the additional sector have been approved, as was proposed, based on some implicit criterion (Annexure I):
Sl.
No. Centre Sector Region
1 Guwahati Handloom Eastern India
2 Salem Handloom Southern India
3 Mumbai Construction Western India
4 Ghaziabad/G.B.Nagar Construction Northern India

Indian Labour Journal, December 2013
1210
Table-I
List of Selected Centres under Consumer Price Index for Industrial Workers (2001=100)
Andhra Pradesh Jharkhand Pondicherry
1. Hyderabad 25. Ranchi-Hatia 51. Pondicherry
2. Guntur 26. Jamshedpur Punjab
3. Visakhapatnam 27. * Bokaro 52. Amritsar
4. Warrangal 28. Jharia 53. Ludhiana
5. * Vijayawada 29. * Giridih 54. * Jalandhar
6. * Godavarikhani 30. Kodarma Rajasthan
Assam Jammu & Kashmir 55. Ajmer
7. Guwahati 31. Srinagar 56. Jaipur
8. Doom-Dooma-Tinsukia Karnataka 57. Bhilwara
9. Mariani-Jorhat 32. Bangalore Tamil Nadu
10. Rangapara-Tezpur 33. Hubli-Dharwar 58. Chennai
11. Labac-Silchar 34. Mysore* 59. Coimbatore
Bihar 35. Belgaum 60. Madurai
12. Monghyr-Jamalpur 36. Merccara 61. Tiruchirapally
Chattisgarh Kerala 62. Salem
13. Bhilai 37. Ernakulam/
Alwaye
63. Coonoor
Chandigarh 38. Quilon Tripura
14. Chandigarh 39. Mundakkayam 64. Tripura
Delhi Madhya Pradesh Uttar Pradesh 15. Delhi 40. Bhopal 65. Ghazibad
Goa 41. Jabalpur 66. Varanasi
16. Goa 42. Indore 67. Kanpur
Gujarat 43. Chindwara 68. Agra
17. Ahmedabad Maharashtra 69. * Lucknow
18. Vadodara 44. Mumbai West Bengal
19. Bhavnagar 45. Sholapur 70. Kolkata
20. Surat 46. Nasik 71. Howrah
21. Rajkot 47. Nagpur 72. Asansol
Haryana 48. Pune 73. Durgapur
22. Yamunanagar Orissa 74. Haldia
23. Faridabad 49. Rourkela 75. Raniganj
Himachal Pradesh 50. * Angul-Talchar 76. Darjeeling
24. Himachal Pradesh 77. Jalpaiguri
78. * Siliguri
* New Centres (9)
Common centres to 1981-82 and New Working Class Family Income & Expenditure
Survey (69 Centres)
Centre dropped in 1999-2000 from 1981-82 Survey;
1. Gudur 2.Noamundi 3. Trivandrum 4. Barbil 5. Saharanpur 6. Balaghat
7. Kothagudem

Indian Labour Journal, December 2013
1211
Table-II
Statement Showing List of Proposed Centres for Working Class Family Income and
Expenditure Survey 2013-14=100
Sl.
No
State/U.T Name of Centre Proposed
for New CPI-IW
New Centre Dropped Centre
1 2 3 4 5
1. ANDHRA
PRADESH
1. Hyderabad
2. Vishakhapatnam
3. Warrangal
4. Manchiryal(M)
5. Nellore
6. Guntur
1. Manchiryal(M)
2. Nellore
1. Godavarikhani
2. Vijaywada
2. ASSAM 7. Doom-Dooma-
Tinsukia(P)
8. Labac Silchar(P)
9. Sibsagar(P)
10. Numaligarh -
Golaghat(P)
11. Biswanath Chariali(P)
12. Guwahati
3. Sibsagar(P)
4. Numaligarh(P)
5. Biswanath
Chariali(P)
3. Mariani- Jorhat
4. Rangapara
3. BIHAR 13. Patna
14. Monghyr-Jamalpur
6. Patna
4. GOA 15. Goa
5. GUJARAT 16. Surat
17. Ahmedabad
18. Vadodara
19. Rajkot
20. Bhavnagar
6. HARYANA 21. Faridabad
22. Gurgaon
23. Yamunanagar
7. Gurgaon
7. HIMACHAL
PRADESH
24. Himachal Pradesh
8. KARNATAKA 25. Bangalore
26. Belgaum
27. Mysore
28. Hubli-Dharwad
29. Mercara- Kodagu(P)
30. Davanagere
31. Gulbarga(P)
8. Davanagere
9. Gulbarga(P)

Indian Labour Journal, December 2013
1212
9. KERALA 32. Idukki(P)
33. Kollam
34. Ernakulam/Alwaye
10. Idukki 5. Mundakyam-
Kottayam
10. MADHYA
PRADESH
35. Jabalpur
36. Indore
37. Bhopal
38. Chindwara(M)
11. MAHARASHTRA 39. Mumbai
40. Thane
41. Pune
42. Nagpur
43. Sholapur
44. Nasik
11. Thane
12. ORISSA 45. Cuttak
46. Keonjhar(M)
47. Angul-Tilcha
12. Cuttak
13. Keonjhar(M)
6. Rourkela
13. PONDICHERRY 48. Puducherry
14. PUNJAB 49. Amritsar
50. Ludhiana
51. Jallandhar
52. Sangrur
14. Sangrur
15. RAJASTHAN 53. Jaipur
54. Alwar
55. Bhilwara
15. Alwar
7. Ajmer
16. TAMIL NADU 56. Coimbatore
57. Salem
58. Virudhu Nagar
59. Chennai
60. Madurai
61. Triunelveli(M)
62. Conoor (P
16. Virudhu Nagar
17. Trirunelvelli
8. Tiruchirapally
17. TRIPURA 63. Tripura (P)
18. UTTAR
PRADESH
64. Ghaziabad/G.B.Nagar
65. Varanasi
66. Kanpur
67. Lucknow
68. Agra

Indian Labour Journal, December 2013
1213
19. WEST BENGAL 69. Kolkata
70. Haldia
71. Durgapur
72. Raniganj(M)
73. Jalpaiguri(P)
74. Darjeeling(P)
75. Howrah
9. Asansol
10. Siliguri
20. JHARKHAND 76. Bokaro
77. Dhanbad-Jharia(M)
78. Jamshedpur
79. Ramgarh(M)
18. Ramgarh
11. Giridih
12. Koderma
13. Ranchi-Hatia
21. CHATTISGARH 80. Raipur
81. Korba(M)
82. Bhilai
19. Raipur
20. Korba (M)
22. DELHI 83. Delhi
23. UTTRAKHAND 84. Udham Singh Nagar 21. Udham Singh
Nagar
24. DADRA &
NAGAR HAVELI
85. Dadra & Nagar Haveli 22. Dadra & Nagar
Haveli
25. CHANDIGARH 86. Chandigarh
26. MEGHALAYA 87. Shillong 23. Shillong
27. JAMMU &
KASHMIR
88. Jammu & Kashmir
Common Centres: 65
New Centres: 23
Dropped Centres: 13

Indian Labour Journal, December 2013
1214
Table-III
Statement Showing List of Proposed Centres for Working Class Family Income and Expenditure
Survey by Their Size of Employment
Sl.
No
State/U.T Name of Centre
Proposed for New
CPI-IW
EMPLOYMENT
Others Mining Plantation Total %
1 2 3 4 5 6 7 8 1 ANDHRA
PRADESH
1 Hyderabad 93204 93204
2 Vishakhapatnam 77917 77917 3 Warrangal 37995 37995
4 Manchiryal(M) -Adilabad
2813 28574 31387
5 Nellore 25901 4070 29971 6 Guntur 25196 1190 26386
263026 33834 0 296860 2.20 2 ASSAM 7 Doom-Dooma-
Tinsukia(P) 29047 149823 178870
8 Labac-Silchar(P) 10973 51338 62311 9 Sibsagar(P) 12834 75436 88270 10 Numaligarh-
Golaghat(P) 10305 62863 73168
11 Biswanath Chariali(P)
19371 55529 74900
12 Guwahati 57217 17805 75022 139747 0 412794 552541 4.10 3 BIHAR 13 Patna 86584 901 87485
14 Monghyr-Jamalpur 32425 232 32657
119009 1133 0 120142 0.89 4 GOA 15 Goa 53219 53219 0.39
5 GUJARAT 16 Surat 93044 93044
17 Ahmedabad 120786 120786
18 Vadodara 80770 80770
19 Rajkot 47821 47821
20 Bhavnagar 12394 12394 354815 354815 2.63 6 HARYANA 21 Faridabad 118690 118690
22 Gurgaon 118761 118761
23 Yamunanagar 47849 47849
285300 0 0 285300 2.12
7 HIMACHAL- PRADESH
24 Himachal Pradesh 108359 108359 0.80
8 KARNATAKA 25 Bangalore 772787 69 772856
26 Belgaum 65201 1900 67101
27 Mysore 78530 50 78580
28 Hubli-Dharwad 48026 600 48626

Indian Labour Journal, December 2013
1215
29 Mercara-Kodagu(P)
9580 30624 40204
30 Davanagere 30100 70 2810 32980
31 Gulbarga(P) 27287 13801 5947 47035
1031511 16490 39381 1087382 8.06 9 KERALA 32 Idukki(P) 1134 37531 38665
33 Kollam 128110 5215 133325
34 Ernakulam/Alwaye 13720 1500 15220
142964 0 44246 187210 1.39
10 MADHYA PRADESH
35 Jabalpur 76624 1928 78552
36 Indore 77247 77247
37 Bhopal 32644 32644
38 Chindwara (M) 17067 8694 25761
203582 10622 214204 1.59 11 MAHARASHTRA 39 Mumbai 421493 69 421562
40 Thane 221824 221824
41 Pune 345245 35 345280
42 Nagpur 119033 9209 128242
43 Nasik 78675 0 78675
44 Solapur 38786 38786
1225056 9313 1234369 9.15
12 ORISSA 45 Cuttak 27089 120 27209
46 Keonjhar(M) 10416 18850 29266
47 Angul 22348 8402 30750 59853 27372 0 87225 0.65
13 PONDICHERRY 48 Puducherry 71449 71449 0.53
14 PUNJAB 49 Amritsar 38046 38046 50 Ludhiana 194352 194352 51 Jallandhar 55207 55207 52 Sangrur 53542 53542
341147 0 0 341147 2.53 15 RAJASTHAN 53 Jaipur 110330 110330
54 Alwar 86278 86278
55 Bhilwara 42504 42504
239112 0 0 239112 1.77 16 TAMIL NADU 56 Coimbatore 233435 93 20040 253568
57 Salem 137605 12000 2129 151734 58 Virudhu Nagar 104980 3230 401 108611
59 Chennai 118097 0 530 118627
60 Madurai 61249 4200 355 65804
61 Triunelveli(M) 44357 23510 67867
61 Conoor(P) 14794 0 55169 69963
714517 43033 78624 836174 6.20 17 TRIPURA 63 Tripura (P) 40772 16892 57664 0.43

Indian Labour Journal, December 2013
1216
18 UTTAR PRADESH
64 Ghaziabad / G.B.Nagar
246331 246331
65 Varanasi 28328 28328
66 Kanpur 53125 53125
67 Lucknow 95713 95713
68 Agra 53220 53220
19 WEST BENGAL 69 Kolkatta 232811 3164 235975
70 Haldia 77677 94 77771
71 Durgapur 73906 73906
72 Raniganj(M) 28511 28511
73 Jalpaiguri(P) 22615 54 127166 149835 74 Darjeeling(P) 10414 434 71817 82665
75 Howrah 73563 73563 490986 32257 198983 722226 5.36
20 JHARKHAND 46 Bokaro 53769 17593 71362
77 Dhanbad(M) 2392 58941 61333
78 Jamshedpur 124833 56088 180921
79 Ramgarh (M) 7607 20048 27655
188601 152670 341271 2.53
21 CHATTISGARH 80 Raipur 77512 551 78063
81 Korba(M) 28351 13773 42124
82 Bhilai 37356 3411 40767
114938 21831 136769 1.01
22 DELHI 83 Delhi 173964 173964 1.29
23 UTTRAKHAND 84 Udham Singh Nagar
49548 49548 0.37
24 DADRA & NAGAR HAVELI
85 Dadra & Nagar Haveli
50000 50000 0.37
25 CHANDIGARH 86 Chandigarh 20590 20590 0.15
26 MEGHALAYA 87 Shillong 13863 13863 0.10
27 JAMMU &
KASHMIR
88 Jammu/Srinagar 38408 38408 0.28
8174713 60.63
13483721

Indian Labour Journal, December 2013
1217
Annexure –A
Methodology for Identification of Centres for experimental coverage:
As emerged in STC, two centres from each of the Handloom & Construction Sectors (in total four) may be covered on experimental basis in the new series.
For generating diversified experimental indices, one centre each may be allocated to East,
West, South & North India ensuring thereby broad regional representation. To facilitate comparison, two sets of weighting system may have to be generated – with
existing seven sectors & with all the sectors (existing seven sectors + Handloom &/or Construction sector). Therefore, the centres for experimental study may be selected from the 88 centres itself proposed for the new series. It is also obvious to have the centres having large employment share so that the generated weighting estimates are robust.
For Handloom sector, six centres have been recommended by the Office of the
Development Commissioner (Handloom), M/O Textiles as mentioned in the para 5.2 of the Agenda note. Out of these six centres, three centres namely, Guwahati, Salem & Varanasi have found place in the list of 88 centres each falling in Eastern, Southern & Northern part of India respectively. As Assam & Tamil Nadu have substantial employment share (both these states are second largest by the size of employment in their respective Eastern & Southern region after West Bengal and Karnataka), Guwahati & Salem may be selected as “centres for Handloom sector”. Thus, it exhausts the allocation of one centre each to Eastern & Southern India.
No single reliable source may be available for the centre wise data on construction
workers, therefore a logical proxy proposition – Industrialization may consequence of/cause urbanization, which would require/generate construction activity in the area - leads to the most populous/ urbanized metropolitans as possible centres for construction sector. As remaining centres for Construction sector are to be identified from the Western and Northern India, Mumbai is a natural selection for the centre of construction sector from the western India being the most populous/urbanized as per the latest population census 2011 and having maximum share of employment of Industrial workers. Ghaziabad/G.B.Nagar may be taken as second centre for construction sector from the Northern India being a prominent & upcoming industrial centre of Uttar Pradesh having significant construction activity. The centre is also adjacent to the Delhi centre & therefore may facilitate implicit comparison of two sets of weighting diagrams with the Delhi centre as well.
Therefore, four centres for generating experimental weighting system with expanded coverage to Handloom & Construction sectors are as follows:
Sl. No. Centre Sector Region
1 Guwahati Handloom Eastern India
2 Salem Handloom Southern India
3 Mumbai Construction Western India
4 Ghaziabad/G.B.Nagar Construction Northern India

Indian Labour Journal, December 2013
1218
LABOUR ACTIVITIES
LABOUR SITUATION
Information relating to Closures, Retrenchments and Lay-offs in respect of various
States/Union Territories in the country for the month of January to September 2013
(Provisional) received in the Bureau upto 31st October, 2013 is presented in the following
Tables:-
Table-I
State-wise Number of Permanent Closures and Workers Affected during January to September, 2013 (P)
States/Union Territories No. of Units No. of Workers Affected
1. Goa 3 151
2. Karnataka 1 36
3. Tripura
17
148
Total :State Sphere
Central Sphere
Grand Total
21
(-)
21
335
(-)
335
Table-II
Industry-wise Number of Permanent Closures and Workers Affected during January to September, 2013 (P)
Section
NIC-2008
Description No. of Units
No. of Workers
Affected
A Agriculture, Forestry and fishing
1 7
C Manufacturing 13 261
F Construction 1 36
G Wholesale and retail trade, Repair of motor vehicles and motorcycles
5 27
I Accommodation and Food
Service activities 1 4
Total : State Sphere Central Sphere Grand Total
21 (-) 21
335 (-)
335
(P): Provisional
- : Nil.
Note: Information within brackets relate to Central Sphere.

Indian Labour Journal, December 2013
1219
Table-III
State-wise Number of Units affecting Retrenchments and Workers Retrenched thereby during
January to September, 2013 (P)
State/Union Territory No. of Units No. of Workers affected
1. Goa 3 8
(13) (373)
2. Gujarat 1 109
(-) (-)
3. Karnataka 1 8
(-) (-)
4. Odisha - -
(1) (794)
Total : State Sphere 5 125
Central Sphere (14) (1167)
Grand Total 19 1292
Table-IV
Industry-wise Number of Units affecting Retrenchments and Workers Retrenched during
January to September, 2013 (P)
Section
NIC-2008
Description No. of Units No. of Workers
affected
B Mining and quarrying 3 8
(6) (225)
C Manufacturing 1 109
(1) (27)
H Transportation - -
(4) (58)
J Information and Communication
1 8
(-) (-)
M Professional, scientific and technical activities
- -
(2) (63)
.. .. - -
(1) (794)
Total: State Sphere 5 125
Central Sphere (14) (1167)
Grand Total 19 1292
(P): Provisional
- : Nil.
.. : Not available.
Note: Information within brackets relate to Central Sphere.

Indian Labour Journal, December 2013
1220
Table-V
State-wise Number of Units Affecting Lay-offs, Workers Laid-off and Mandays Lost during
January to September, 2013 (P)
States/Union Territories No. of Units No. of Workers Affected
Mandays Lost
1. Karnataka 2 (-)
191 (-)
1482 (-)
2. Kerala 4 (-)
119 (-)
10254 (-)
Total : State Sphere Central Sphere
Grand Total
6 (-) 6
310 (-) 310
11736 (-)
11736
Table- VI
Industry-wise Number of Units Affecting Lay-offs, Workers Laid-off and Mandays Lost during
January to September, 2013 (P)
Section NIC-2008
Description No. of Units
No. of Workers Affected
Mandays Lost
C Manufacturing 6 (-)
310 (-)
11736 (-)
Total : State Sphere Central Sphere Grand Total
6 (-) 6
310 (-)
310
11736 (-)
11736
Table-VII
Month-wise break-up of Mandays Lost due to Lay-off during January to September, 2013 (P)
Month Mandays Lost
January 1,805 (-)
February 3,925 (-)
March 2,737 (-)
April 2,975 (-)
May .. (..) June 294 (..) July .. (..) August .. (..) September .. (..)
Total: State Sphere Central Sphere Grand Total
11,736 (-)
11,736
(P): Provisional
- : Nil. .. : Not available.
Note: Information within brackets relate to Central Sphere.

Indian Labour Journal, December 2013
1221
Industrial Disputes during January to September, 2013 (Provisional)
The statistics of work-stoppages due to Industrial Disputes during January to September
2013 based on the returns received from different State Labour Departments / Regional Labour
Commissioners (Central) are presented in the following tables:
As per available information 137 Industrial Disputes resulting in work-stoppages were
reported during January to September, 2013 in which 716106 workers were involved and
2469039 mandays lost were reported. Besides, there were 11 disputes which occurred due to
reasons other than Industrial Disputes also. In the said disputes 6142 workers were involved and
1226088 mandays were lost.
Table VIII
Number of Mandays Lost on Account of Work-stoppages during January to September,
2012 and 2013
Number of Mandays Lost on Account of
Month Industrial Disputes Reasons Other Than Industrial Disputes
2012 (P) 2013 (P) 2012 (P) 2013 (P)
1 2 3 4 5
January 955165 179512 699286 148100
February 1326852 1241898 686937 143127
March 775455 158125 726032 147595
April 1119591 294861 699142 148605
May 1062006 167528 722845 141180
June 979933 239959 724445 162239
July 928402 109008 724813 168062
August 1599532 78148 699172 167180
September 972328 - 709664 -
Total 9719264 2469039 6392336 1226088
(P) = Provisional and based on the returns /clarifications received in the Bureau till 31st October,
2013.
- = Nil
N.B:- Figures for 2013 are not comparable with those for 2012 due to non-receipt of data from
various States / Union Territories.

Indian Labour Journal, December 2013
1222
Table IX
State-wise Major* Industrial Disputes in India including Industrial Disputes
Due to Reasons other than Industrial Disputes till September, 2013 (P)
Name of the State /
Union Territory /
Sphere / Sector /
Number of
Establishments affected
Strike/
Lockout
Cause No. of
Workers
involved
No. of
Mandays
lost
(in 000‟s)
Wages
lost
(Rs. In
Lakhs)
Production
loss
(Rs. in
Lakhs)
1 2 3 4 5 6 7
CENTRAL SPHERE NIL
STATE SPHERE
Andhra Pradesh
One Unit
(Private Sector)
Strike Personnel 600 156.0 508.00 731.90
One Unit
(Private Sector)
Strike Charter of Demands
728 120.8 250.92 502.04
Bihar
One Unit
(Private Sector)
Lockout Charter of Demands
227 407.9 .. ..
One Unit
(Private Sector)
Lockout Financial Stringency
160 321.8 .. ..
One Unit
(Private Sector)
Lockout Financial Stringency
70 142.5 .. ..
Rajasthan
One Unit
(Private Sector)
Strike Charter of Demands
300 73.2 .. ..
(P) = Provisional and based on the returns /clarifications received in the Bureau till 31st October,
2013
.. = Not reported
* = All disputes in which there was a time loss of 50,000 or more mandays during the period
under review or beginning of the disputes are classified as Major disputes

Indian Labour Journal, December 2013
1223
NEWS IN BRIEF
(a) INDIAN LABOUR The news items reported below have been gleaned from various official and unofficial
sources. Hence, the Labour Bureau is not in a position to vouchsafe the authenticity of the unofficial news items.
Job Creation by Corporate India Hits Three-Year Low - Job creation at Indian companies
has hit a three-year slump as economic gloom persists and a large number of development
projects remain stalled despite the government trying its best to get them moving again amid
efforts to drum up investment and get growth back on track. Employment growth slowed to
3.5% in FY13 from 5.7% in the year before and 6.4% in FY11, according to an ET Intelligence
Group analysis of close to 250 companies belonging to the S&P BSE 500 index that have
declared jobs data consistently over the past five years. Given the harsh environment, companies
are clearly holding off on recruitments as they pare costs to boost earnings. In absolute terms, the
total employee strength at the 250 companies was 36.47 lakh in FY13, up from the year-before
35.24 lakh and 33.33 lakh in FY11. This indicates that there were only 1.23 lakh net
recruitments in FY13 compared with 1.91 lakh in FY12 and 2.02 lakh in FY11. The decline in
hiring in FY13 was most marked in sectors such as automobiles, capital goods, tyres, shipping,
paper, construction, power generation and retail in FY13, in line with the manufacturing sector
being the worst hit by the slowdown and projects being stuck because various approvals have
not been received. A percentage point increase in GDP growth leads to the creation of nearly 7.5
lakh jobs, according to Balaji Ethirajan, managing director and chief executive officer at human
resource firm Randstand India. "Thus the drop in GDP (growth) from 9.53% in FY11 to 4.99%
in FY13 implies that almost 30 lakh jobs have not kicked off in the economy during this period,"
he said.
(The Economic Times, 04.10.2013)
The Invisible Workers - Household work has never been considered work in India. It has
always been the „duty‟ of the woman: wife, mother, daughter or sister to do the chores and
expect no pay. Any wonder then that the domestic worker is so blatantly underpaid. Cooking,
cleaning, caring for children, these are all skilled jobs but they fall under the unorganised sector,
with no law to protect rights, no health cover and no pension. The absence of a targeted law for
domestic workers also means that in the case of abuse or exploitation, they have no recourse to
justice. Some laws can be invoked for specific instances, such as the Sexual Harassment of
Women at Workplace Act, the Unorganised Workers‟ Social Security Act, 2008 and the Juvenile
Justice Act. But that‟s it. A National Policy on Domestic Workers has been formulated by the
Labour Ministry but is yet to be notified. Karnataka and Kerala have notified minimum wages
for domestic labour while Tamil Nadu includes domestic workers in the Manual Workers Act.
Some attempts were made to extend the Rashtriya Swasthya Bima Yojana to domestic workers
but they have fallen short of implementation. In 2011, the International Labour Organisation
(ILO) adopted the Domestic Workers Convention. India supports the Convention but is yet to
ratify it. Belonging to the unorganised sector means that in case of a dispute with the employer,
the worker cannot go to a labour court, as she is not technically recognised as a „worker‟. The
National Platform for Domestic Workers, which includes 20 organisations from 15 states,
recently submitted a petition demanding comprehensive legislation. They proposed an

Indian Labour Journal, December 2013
1224
autonomous statutory body or Tripartite Board, with compulsory registration of employer,
employee and agency.
(The Hindu, 13.10.2013)
30% Indian IT Engineers Lack Basic Skills, Says Report - Indian computer engineers are
highly sought after, but a new report has revealed that computer science (CS) and information
technology (IT) graduates are not up to the mark on programming. Around 30% of CS/IT
graduates did not have basic theoretical concepts used in computer programming, while more
than 50% did not understand the subtleties of programming concepts, and more than 80% were
unable to apply them to real-world situations. The report, surveyed 55,000 students from all
engineering backgrounds across 250 engineering colleges in the country and the analysis was
based on the computer-programming module of the Aspiring Minds Computer Adaptive Test, a
standardised employability test. “The rate of production of engineers in India is much greater
than any other nation,” the report noted in its conclusion. “But the quality with regards to their
programming ability is a matter of deep concern. The results obtained are eye-opening.” The test
looked at graduates‟ basic knowledge, conceptual understanding and application skills. The
survey was conducted by Aspiring Minds, an employability solutions company whose tests are
used by companies for recruitment purposes.
(Hindustan Times, 14.10.2013)
Karnataka Exempts IT from Labour Law for Another 5 Years - Karnataka will exempt
information technology companies from an onerous labour law for a further five years, lifting a
weight off software firms which have been campaigning against the legislation. Top industry
executives welcomed the decision of the cabinet. The IT sector in Karnataka was exempt from
the Industrial Employment (Standing Orders) Act, 1946 for the past 11 years. But the state
moved to bring the sector under the law this March, causing dread and despair among the
software companies, which were just slowly recovering from a global economic slump. "The
cabinet approved the extension (of the IT sector being exempted from the law) and it will
continue for probably another five years," said SR Patil, the state's minister for information
technology and biotechnology. The state's information technology and business process
outsourcing sector employs close to a million professionals and is expected to clock export
revenues of around 1.5 lakh crore in the year to March 2014. The decision to prolong the
exemption was welcomed by IT experts. They said the decision will free the sector from
potential headaches. The experts pointed out that the complex and outdated labour laws were
originally designed and more suited for manufacturing sector. Under the law, companies were
required to define conditions of employment and details such as working hours, wages,
attendance, grounds of termination and so on. The companies also had to make these known to
employees by displaying the terms on a display board near the main entrance. The terms also
had to be approved by labour unions. Most executives in the industry feared this requirement
will lead to unionisation of employees in the sector, which contributes to nearly a quarter of the
state's GDP.
(The Economic Times, 21.10.2013)
Workers at 5 Major Ports to Get Higher Wages - Workers at five major ports are set to
receive higher wages following a new settlement between trade unions and the Indian Ports
Association, the governing body of major ports. The settlement for the port and dock workers is
effective from January 1, 2012. T. Narendra Rao, General Secretary of the Water Transport
Workers Federation of India, said that according to the agreement it was decided to give 10.5 per

Indian Labour Journal, December 2013
1225
cent fitment on basic pay plus dearness allowance. Overall, the lowest-paid employee will get Rs
4,000 as additional wage. The maximum wage benefit will be Rs 8,000-9,000. Nearly 48,000
port and dock workers will gain, he said. For the first time, the agreement is for a five-year
period against the ten-year periodicity that is in force at several public sector enterprises. The
settlement was negotiated by the leaders representing the Water Transport Workers‟ Federation
of India, All India Port & Dock Workers‟ Federation, All India Port & Dock Workers‟
Federation (Workers), Indian National Port & Dock Workers‟ Federation, and Port, Dock &
Waterfront Workers‟ Federation of India. Paul Antony, Chairman of the bipartite wage
negotiating committee, represented the management of the major ports.
(The Hindu Business Line, 26.10.2013)
Insurance Cover for Expatriate Workers in Gulf on the Anvil - India is set to launch an
ambitious scheme that will provide insurance and financial cover to over a million blue-collar
expatriate workers residing in the Gulf countries. The scheme, billed as a major accomplishment
of the government, would be formally launched by Vayalar Ravi, the Minister of Overseas
Indian affairs. The Mahatma Gandhi Pravasi Suraksha Yojana is a pension and life insurance
fund that could benefit up to two million expatriate workers. Beefed up with a significant
government contribution, the scheme encourages expat employees to build up savings that they
can be used for their resettlement on their return to India. It would also contribute to their
pension and provide a life insurance cover against natural death during the period of coverage.
Overseas Indian workers between 18-50 years old who have Emigration Check Required status
stamped on their passport, and have migrated on employment or contract visa, are eligible to
enrol in the scheme. Enrolment is possible with the assistance of Service Providers appointed by
the Ministry of Overseas Indian Affairs. Subscribers then have to open a Non-Resident External
account that allows Non-Resident Indians to remit funds in any permitted foreign currency,
which is converted to Indian rupees and credited to their account. The participant‟s contribution
will be automatically deducted from this account and credited to the scheme. The Ministry has
devised an elaborate formula that governs the government‟s contribution to the holders of the
scheme. Under this arrangement, the government will make an annual contribution of Rs.1,000
for those who save between Rs.1,000-Rs.12,000 a year. Women workers are eligible for an
additional contribution of Rs. 1,000, which would be valid for a period of five years or the return
of the worker to India, whichever is earlier. Those who save more than Rs.4,000 a year are
eligible for an additional payment of Rs.900 by the government. It will be channelled to a corpus
to be used for resettlement at the time of return.
(The Hindu, 29.10.2013)
Industries/Services Declared/Granted Extension as Public Utility Services under the
Industrial Disputes Act, 1947– As per the information received in the Bureau, the Services in
Banking Industry has been declared Public Utility Services by the Central Government for a
period of six month with effect from 20th
October, 2013.

Indian Labour Journal, December 2013
1226
Consumer Price Index Numbers for Industrial Workers (CPI-IW) on base 2001=100 and Agricultural and Rural Labourers on base 1986-87=100 for the month October, 2013
Consumer Price Index Numbers for Industrial Workers- All-India CPI-IW for October,
2013 rose by 3 points and pegged at 241 (two hundred and forty one). On 1-month percentage
change, it increased by 1.26 per cent between September and October compared with 0.93 per
cent between the same two months a year ago. The largest upward pressure to the change in
current index came from Food group contributing 2.53 percentage points to the total change. At
item level, Rice, Wheat Atta, Fish Fresh, Goat Meat, Milk (Cow & Buffalo), Pure Ghee, Onion,
Vegetable items, Tea Readymade, Electricity Charges, etc. are responsible for the rise in index.
However, this was compensated to some extent by Groundnut Oil, Ginger, Petrol, putting
downward pressure on the index. The year-on-year inflation measured by monthly CPI-IW stood
at 11.06 per cent for October, 2013 as compared to 10.70 per cent for the previous month and
9.60 per cent during the corresponding month of the previous year. Similarly, the Food inflation
stood at 15.02 per cent against 13.36 per cent of the previous month and 9.91 per cent during the
corresponding month of the previous year. At centre level, Bhavnagar recorded the highest
increase of 9 points followed by Ahmedabad, Labac Silchar and Kodarma (8 points each) and
Vadodara and Surat (7 point each). Among others, 6 points rise was registered in 8 centres, 5
points in 10 centres, 4 points in 8 centres, 3 points in 9 centres, 2 points in 10 centres and 1 point
in 11 centres. On the contrary, Belgaum and Chhindwada centres reported a decline of 3 points
each followed by Mercara (2 points) and Salem, Hubli Dharwar and Puducherry (1 point each).
Rest of the 15 centres‟ indices remained stationary. The indices of 39 centres are above All-India
Index and other 39 centres‟ indices are below national average.
(Labour Bureau)
Consumer Price Index Numbers for Agricultural Labourers and Rural Labourers – All-
India Consumer Price Index Numbers for Agricultural Labourers and Rural Labourers (Base:
1986-87=100) for October, 2013 increased by 7 points each to stand at 766 ( Seven hundred
and sixty six) points. The rise/fall in index varied from State to State. In case of Agricultural
Labourers, it recorded an increase which varied between 2 to 17 points in 18 States and a
decrease of 1 and 4 points in 2 States. Haryana with 846 points topped the index table whereas
Himachal Pradesh with the index level of 616 points stood at the bottom. In case of Rural
Labourers, it recorded an increase between 2 to 16 points in 18 States, a decrease of 2 points in
one State and remained stationary in 1 State. Haryana with 840 points topped the index table
whereas Himachal Pradesh State with the index level of 651 points stood at the bottom.
Agricultural Labourers index for Tripura State registered the maximum increase of 17 points
while Rural Labourers index for Gujarat & Orissa States registered the maximum increase of 16
points each mainly due to increase in the prices of rice, wheat atta, fish fresh, onion, vegetables
& fruits and bus fare. On the other hand, Maharashtra State registered a decline of 4 and 2
points respectively for Agricultural and Rural Labourers mainly due to decrease in the prices of
wheat, jowar, bajra, groundnut oil and fish fresh. Point to point rate of inflation based on the
CPI-AL decreased from12.78% to 12.65% in October, 2013 while for CPI-RL increased from
12.44% to 12.48% in October, 2013. Inflation based on food index of CPI-AL and CPI-RL are
13.62% and 13.11 % respectively during October, 2013.
(Labour Bureau)

Indian Labour Journal, December 2013
1227
(b) FOREIGN LABOUR
ILO Director-General Calls on Countries to Boost Efforts to Fight Child Labour - ILO
Director-General, Guy Ryder, called on delegates to the third Global Conference on Child labour
at Brasilia to redouble their efforts so that the international community can reach the target it set
itself to eradicate the worst forms of child labour by 2016. The ILO‟s latest global estimates on
child labour, released in the run-up to the conference, show that since 2010, the number of child
labourers has dropped by one-third to 168 million. While the fall in numbers is good news, the
ILO chief warned that it is still a very large number - it is only 27 million fewer than the entire
population of Brazil. The ILO Director-General cautioned that the current rate of progress is not
fast enough. “Let us be clear. We will not meet the 2016 target and that is a collective policy
failure. We have to do better.” Ryder opened the conference alongside Brazilian President,
Dilma Rousseff, who said that “we owe all children a future without violence, without fear and
without exploitation.” Ryder stressed that child labour is not only a problem of poor or
developing economies but affects all countries. He urged participants to direct their efforts
towards policies and actions that have been successful. According to the latest global estimates,
child labour is predominant in agriculture, both formal and informal, and in other sectors of the
informal economy. The ILO chief highlighted the role of enterprises and trade unions that have
been taking up the challenges of the informal economy: trade unionism is growing among
informal economy workers and enterprises have been discussing with trade unions how to clean
up their value chains, protect and respect human rights at work and remedy the violations.
(ILO News, 08.10.2013)
Unions Continue to Put UN under Fire for Not Respecting Workers’ Rights - Recent
changes to how United Nations staff negotiate with management contradict the organisation‟s
own conventions and may jeopardise employees‟ security, unions warn. As of July this year
management must „consult‟ rather than enter mandatory negotiations with staff on issues such as
the distribution of budget cuts and rotation policy. The new rules replaced a prior agreement that
was introduced by secretary-general Ban Ki-moon in 2011. “There‟s no doubt that there was a
form of collective bargaining but it is now no longer in existence,” said Sharan Burrow, General
Secretary of the International Trade Union Confederation (ITUC). In an open letter to Ban,
General Secretary of the UK‟s Trades Union Congress (TUC), Frances O‟Grady noted the
International Labour Organisation – a UN agency – protects freedom of association and the right
to bargain collectively. Both rights are enshrined in the Declaration of Philadelphia, which
contains the aims and objectives of the ILO. In response, the UN‟s under-secretary-general for
management, Yukio Takasu, said it is the General Assembly that establishes workers‟ conditions
through the UN Staff Regulations, which do not include a right to collective bargaining. The
General Assembly voted in April to amend the rules on staff negotiations to reflect the less
stringent regulations.
(Equal Times, 15.10.2013)
New Global Index Exposes 'Modern Slavery' Worldwide – The Global Slavery Index 2013 says India
has the highest number of people living in conditions of slavery at 14 million. But Mauritania
has the highest proportional figure with about 4% of its population enslaved. The report's authors
hope it will help governments tackle what they call a "hidden crime". The index was compiled
by Australian-based rights organisation Walk Free Foundation using a definition of modern
slavery that includes debt bondage, forced marriage and human trafficking. "A lot of
governments won't like hearing what we have to say," WFF chief executive Nick Grono told.

Indian Labour Journal, December 2013
1228
"Those governments that want to engage with us, we will be very open to engaging and looking
at ways in which we can better measure the issue of modern slavery." The organisation's
estimate of 29.8 million slaves worldwide is higher than other attempts to quantify modern
slavery. The International Labour Organisation estimates that almost 21 million people are
victims of forced labour. India, China, Pakistan and Nigeria have the highest numbers of people
enslaved, the charity said. Together with five other countries, they account for three-quarters of
the total estimated number of people in modern slavery worldwide. The report said India's
ranking was mostly due to the exploitation of Indians citizens within the country itself. While the
highest proportion of slaves is in Mauritania, with many people inheriting slave status from their
ancestors, Haiti is second in the index and Pakistan is third. The new survey has the backing of
world figures including former US Secretary of State Hillary Clinton, ex-British Prime Minister
Tony Blair. Mrs Clinton said that although the index was not perfect, it provided a starting point,
according to the Associated Press.
(BBC News, 17.10.2013)
Spain Jobless Rate Down A Tad Despite Recovery - Spain‟s high jobless rate edged down
only modestly in the third quarter, to 26%, despite the country‟s emergence from a long
recession and a good tourism season. The unemployment rate for the July-September period fell
from 26.3% to 26.0%, leaving the total number of jobless at a rounded 5.9 million, the National
Statistics Institute said. Spain‟s rate often goes down during the summer tourism season, and the
country experienced a big tourism boost this year as travellers swarmed to the country.
Economists say it will take years to bring the jobless rate down to a more tolerable level.
(The Financial Express, 25.10.2013)
US Jobless Claims Fall Less Than Expected - The number of Americans filing new claims for
unemployment benefits fell less than expected as California continued to process a backlog of
applications caused by computer problems. Initial claims for state unemployment benefits fell
12,000 to a seasonally adjusted 350,000, the Labor Department said. Claims for the prior week
were revised to show 4,000 more applications filed than previously reported. Economists polled
by Reuters had expected first-time applications to fall to 340,000 last week. A Labour
Department analyst said claims from the backlog in California were still working their way
through the system. Technical problems as California converted to a new computer system have
distorted the claims data since September, making it difficult to get a clear read of labour market
conditions. A 16-day partial shutdown of the government also pushed up claims in recent weeks
as furloughed nonfederal workers applied for benefits. Claims filed by federal employees fell
25,939 in the week ended October 12. The four-week moving average for new claims,
considered a better measure of labour market trends, rose 10,750 to 348,250. The number of
people still receiving benefits under regular state programmes after an initial week of aid fell
8,000 to 2.87 million in the week ended October 12.
(The Financial Express, 25.10.2013)
Asia Failing to Protect Rights of Domestic Workers - The torture and abuse that the Vasant
Kunj domestic help was subjected to was not an exceptional case. About 40% of domestic
workers globally are employed in Asia, yet the region has been slow to enact reforms, the
International Domestic Workers Network (IDWN), the International Trade Union Confederation
(ITUC) and Human Rights Watch (HRW) said. The groups have documented many domestic

Indian Labour Journal, December 2013
1229
workers within Asia and those migrating to West Asia experience a wide range of abuses,
including unpaid wages, restrictions on leaving the households where they work, and excessive
work hours with no rest days. Some may face psychological, physical, or sexual abuse and can
get trapped in situations of forced labour, including trafficking. "Domestic workers from India,
Nepal, Sri Lanka, Indonesia, and Cambodia experience horrific abuses," said Nisha Varia, senior
women's rights researcher at HRW. The groups released a new report assessing progress since
the 2011 adoption of the Domestic Workers Convention that showed more than 25 countries
have improved legal protections for domestic workers with many of the strongest reforms in
Latin America. In Asia, the Philippines adopted comprehensive legislation protecting domestic
workers in January 2013, and is the only Asian country to have ratified the Domestic Workers
Convention. The most active dialogue is taking place in Indonesia, India, Nepal, Australia, and
New Zealand. India has brought two important policy changes, including extending the
Rashtriya Swasthya Bima Yojana (RSBY), or the health insurance scheme, to domestic workers
in May 2012 and including domestic workers under a new law prohibiting sexual harassment at
workplace this year. However, it does not provide protection like reasonable wages, work hours
and rest time. There are an estimated 53 million domestic workers worldwide - the majority of
them women and girls, and many of them migrants.
(The Times of India, 29.10.2013)
Latin American and Caribbean Unemployment Rate Could Fall to 6.2% in 2013 - The
Latin American and Caribbean region could end the year with an urban unemployment rate of
between 6.2% and 6.3%, which would be slightly lower than 6.4% recorded in 2012, according
to the latest projections from the Economic Commission for Latin America and the Caribbean
(ECLAC) and the International Labour Organization (ILO). According to the document the
employment situation in Latin America and the Caribbean - No. 9, “the first half of 2013 was not
plain sailing for Latin America and the Caribbean”, due to a sluggish world economy, increased
financial market volatility and weakened internal demand. In the first six months of the year, the
regional economy only grew by 2.5% compared with the same period in 2012. The slowdown in
the region‟s economic growth in the first half of 2013 resulted in lower demand for labour. More
specifically, this took the form of lower generation of wage employment. While the latter grew
by 3.1% at the regional level in 2012, in the first half of 2013 estimated growth is just 1.6%
(based on 10 countries with data available). Less buoyant job creation did not mean higher
unemployment, as the first six months of 2013 saw a reversal in the relatively strong increase in
the labour participation rate from 2012. In the 10 countries with information available, this rate
stopped growing in the first six months. In addition, the gaps between men and women in terms
of labour participation, employment and unemployment continued to narrow – although there
were differences among countries. In terms of real wages, most countries saw a continued rise
during the first half of the year, although rates were slower than the average for 2012.
(ILO News, 30.10.2013)

Indian Labour Journal, December 2013
1230
LABOUR DECISIONS
For seeking voluntary retirement as per regulation (12 b) three months notice is
mandatory - In this case, the petitioner, who was working with the erstwhile Indian Airlines
Limited, submitted an application on 7.11.94 seeking VRS w.e.f. 12.11.1994. Responding to the
said application, the petitioner was informed vide letter dated 11.11.1994 that he should continue
in service till the time decision is taken. The petitioner, however, did not attend the duty after
12.11.1994, instead joined the services of Blue Dart Ltd. and filed Writ Petition in the High
Court of Madras for issuance of a writ of mandamus directing the respondents to accept the
petitioner‟s application for voluntary retirement. During the pendency of the said petition, the
petitioner was informed by respondent that his application had been rejected. The petitioner
preferred another Writ Petition No. 21384 of 1994 challenging the order of the respondent as the
first writ petition filed by the petitioner had become infructuous. The learned Single Judge
dismissed the said writ petition vide order dated 12.3.2002. Aggrieved, the petitioner preferred
Writ Appeal No. 2415 of 2002 which has been dismissed vide impugned judgment and order.
Hence, these petitions. After hearing both the counsel appearing for the petitioner and
respondents and perused the record, the apex court noted that the High Court has examined all
the aspects of the matter. Admittedly, the petitioner did not ensure compliance of Regulation
12(b) of the Service Regulations which required a three months‟ notice as a condition for
applying for VRS. The stand taken by the petitioner that he had sufficient number of earned
leaves in his leave account which could be adjusted in lieu of three months‟ notice, had been
rightly rejected by the High Court as the fact that the respondents had adjusted the earned leave
in case of others that cannot be a ground for acceptance of VRS of the petitioner. More so, the
application is subject to approval of the Competent Authority, which the petitioner did not have.
In view of the above, the petitioner had voluntarily abandoned the services of the respondents.
Absence from duty in the beginning may be a misconduct but when absence is for a very long
period, it may amount to voluntarily abandonment of service and in that eventuality, the bonds
of service come to an end automatically without requiring any order to be passed by the
employer. In such a case, there is no need to hold an enquiry or to give any notice as it would
amount to useless formalities. Thus, in view thereof, the petitions are devoid of merits and
accordingly disposed of.
(Vijay S. Sathaye v. Indian Airlines Ltd. & Ors.; Current Labour Reports, November, 2013, pp.612-615)
Truth does not become more true by virtue of the fact that the entire
world agrees with it, nor less so even if the whole world disagrees with it.
-Maimonides

Indian Labour Journal, December 2013
1231
LABOUR LITERATURE
IMPORTANT ARTICLES OF LABOUR INTEREST PUBLISHED IN THE PERIODICALS AND NEWSPAPERS RECEIVED IN THE LABOUR BUREAU
EMPLOYMENT AND UNEMPLOYMENT
Keith A BENDER, Athina ECONOMOU and Ioannis THEODOSSIOU
The Temporary and Permanent Effects of Unemployment on Mortality in Europe; International Labour Review; Vol. 152, June, 2013; pp.275-286.
Abhishek shaw Employment Trends in India: An Overview of NSSO‟s 68
th Round; Economic & Political
Weekly, Vol. XLVIII, No.42, October 19, 2013; pp. 23-25.
P.Shivalingappa SHGs and Its Impact on Rural Employment Generation; Southern Economist, Vol.52, No.12, October 15, 2013; pp. 13-15.
Mahendra Nath Pandey MGNREGA: Role in Employment of Women; ibid. pp. 29-34.
INDUSTRIAL RELATIONS
Theodoros PAPADOPOULOS and Antonios ROUMPAKIS
The Meta-Regulation of European Industrial Relations: Power Shifts, Institutional Dynamics and the Emergence of Regulatory Competition; International Labour Review; Vol. 152, June, 2013; pp.255-274.
LABOUR MARKET
Simon STURN Are Corporatist Labour Markets Different? Labour Market Regimes and Unemployment in OECD Countries; International Labour Review; Vol. 152, June, 2013; pp. 237-254.
LEAVE HOURS AND WORK
Akio Sato Teleworking and Changing Workplaces; Japan Labor Review; Vol.10, No.3, Summer 2013; pp. 56-69.
MINIMUM WAGES
Neetha N Minimum Wages for Domestic Work: Mirroring Devalued Housework; Economic & Political Weekly, Vol. XLVIII, No.43, October 26, 2013; pp. 77-84.
MIGRATION
Shruti Mehra and Gian Singh Determinants and Factors Related to Migration of Labourers to Industries in Ludhiana, Punjab; Arthshastra: Indian Journal of Economics & Research, Vol.2, No.5, September- October, 2013; pp. 35-42.
D Jayaraj Family Migration in India: „Push‟ or „Pull‟ or Both or What? Economic & Political Weekly, Vol. XLVIII, No.42, October 19, 2013; pp. 44-52.-
A Kavitha Migration of Women Labour- An Empirical Study; Southern Economist, Vol.52, No.12, October 15, 2013; pp. 21-23.

Indian Labour Journal, December 2013
1232
Neha Wadhawan Living in Domestic-City: Women and Migration for Domestic Work from Jharkhand; Economic & Political Weekly, Vol. XLVIII, No.43, October 26, 2013; pp. 47-54.
SOCIAL SECURITY
Ashima Majumdar, Saundarjya Borbora Social Security System and the Informal Sector in India: A Review; Economic & Political Weekly, Vol. XLVIII, No.42, October 19, 2013; pp. 69-72.
WAGES
Neetha N Paid Domestic Work: Making Sense of the Jigsaw Puzzle; Economic & Political Weekly, Vol. XLVIII, No.43, October 26, 2013; pp. 35-38.
Karen Coelho, T Venkat, R. Chandrika Housing, Homes and Domestic Work: A Study of Paid Domestic Workers from a Resettlement Colony in Chennai; ibid. pp. 39-46.
Nilanjana Sengupta, Samita Sen Bargaining Over Wages: Part-time Domestic Workers in Kolkata; ibid. 55-62.
Kamala Sankaran Domestic Work, Unpaid Work and Wage Rates; ibid. pp. 85-89.
MISCELLANEOUS
Ikuko Mizushima Workplace Harassment, Mental Health, and the Law; Japan Labor Review; Vol.10, No.3, Summer 2013; pp. 40-55.
Kiran Moghe Organising Domestic Workers in Pune City; Economic & Political Weekly, Vol. XLVIII, No.43, October 26, 2013; pp. 63-68.
Roopa Patavardhan and D.S. Leelavathi Dynamics of Indian Rural Labour Supply: Causes and Consequences of Farm Labour Shortage on Agricultural Development; Arthshastra: Indian Journal of Economics & Research, Vol.2, No.5, September- October, 2013; pp. 43-49.
Sonia George Towards Recognition Through Professionalisation: Organising Domestic Workers in Kerala; ibid. pp. 69-76.
You must learn to be still in the midst of activity and to be
vibrantly alive in repose.
-Indira Gandhi

Indian Labour Journal, December 2013
1233
STATISTICS
Section A
MONTHLY STATISTICS
Pages
Notes 1235
1. Prices and Price Indices
1.1. Industrial Workers’ Consumer Price Index
Table A.1.1.1. Labour Bureau‟s Series of All-India Consumer Price Index Numbers
for Industrial Workers (Base : 2001=100)
1237
Table A.1.1.2. Labour Bureau‟s Series of Consumer Price Index Numbers for
Industrial Workers in respect of 78 constituent centres (Base:
2001=100)
1238
Table A.1.1.3. Average Monthly Consumer Prices of Selected Articles for
Industrial Workers
1246
1.2. Consumer Price Index Numbers for Agricultural and Rural
Labourers
Table A.1.2.1-
(a) and (b)
Labour Bureau‟s Series of All-India Average Consumer Price Index
Numbers for Agricultural and Rural Labourers (Base : 1986-
87=100) Group- wise and General
1256
Table A.1.2.2-
(a) and (b)
Average Monthly Consumer Prices of Selected Articles for
Agricultural and Rural Labourers (Base : 1986-87 =100)
1260
2. Wages and Earnings
Table A 2.1.-
(a) and (b)
Average Daily Wage Rates for Agricultural & Non-Agricultural
Occupations in Rural India
1267
3. Industrial Disputes
Table A 3.1.- Sector/Sphere-wise Number of Disputes, Workers Involved and
Mandays Lost due to Industrial Disputes
1275
Table A 3.2.- State-wise Industrial Disputes (All Strikes and Lockouts) 1276

Indian Labour Journal, December 2013
1234
Section B
SERIAL STATISTICS
Pages
Notes 1277
1. Prices and Price Indices
1.1. Industrial Workers Consumer Price Index
Table B.1.1.1 All India Average Consumer Price Index Numbers for Industrial
Workers (Base 2001=100)
1279
Table B.1.1.2 Labour Bureau‟s Series of Consumer Price Index Numbers for
Industrials Workers (Base : 2001=100)
1280
1.2. Agricultural Labourers Consumer Price Index
Table B. 1.2.1
(a) and (b)
All-India Average Consumer Price Index Numbers for
Agricultural Labourers (General & Food) (Base 1986-87=100)
1291
Table B.1.2.2
(a) and (b)
Labour Bureau‟s Series of Consumer Price Index Numbers for
Agricultural Labourers (General Index on Base : 1986-87=100)
1293
1.3. Urban Non-Manual Employees’ Consumer Price Index
Table B. 1.3. All India Consumer Price Index Numbers for Urban Non-Manual
Employees/ Consumer Price Index for Urban and Rural Areas
1299
1.4. Wholesale Price Index
Table B.1.4. All-India Index Numbers of Wholesale Prices- New Series 1300
2. Wages And Earnings
Table B.2.1. Earnings (Basic Wage and Dearness Allowances) of the Lowest-
Paid Workers/Operatives in Cotton Textile Mills
1303
3. Industrial Disputes
Table B. 3.1. Industrial Disputes (All Strikes and Lockouts) 1305

Indian Labour Journal, December 2013
1235
SECTION A
MONTHLY STATISTICS
N o t e s
1. Prices and Price Indices
1. 1. Industrial Workers Consumer Price Index
A.1.1.1. Labour Bureau’s Series of All India Consumer Price Index Numbers for Industrial Workers (Base: 2001=100) – The All-India Consumer Price Index Numbers for Industrial Workers on Base : 2001=100 General and Group-wise along with Linking Factors with previous base: 1982=100 are presented in Table A.1.1.1. The All India Index is a weighted average of 78 constituent centre Indices compiled by the Labour Bureau. The current series of the Index Numbers has been introduced with effect from January, 2006 index replacing the series on base: 1982=100. The All India General Index as well as Group Indices for previous series on base:1982=100 can be obtained by multiplying the current series indices by the respective Linking Factors. A note on the scope and methods of construction of these index numbers was published in April 2006 issue of the “Indian Labour Journal”. The All India Consumer Price Index Number for the month of September, 2013 increased by 1 point and stood at 238. A.1.1.2. Labour Bureau’s Series of Consumer Price Index Numbers for Industrial Workers in respect of 78 constituent centres on Base: 2001=100 – The Consumer Price Index Numbers for industrial workers on Base: 2001=100 for 78 centres compiled by the Labour Bureau are presented group wise in Table A.1.1.2 for the months of August, 2013 and September, 2013.
The Index Numbers measure the extent to which the overall levels of retail prices of goods and services consumed by Industrial Workers has changed when compared with the base period viz., 2001=100. As compared to the previous month the magnitude of rise/fall in the General Index varies from centre to centre. During September, 2013, the index recorded an increase of 9 points in Labac Silchar followed by Varanasi and Vishakhapathnam (7 points each), and Bhilwara, Tripura and Darjeeling (6 Points each). Among others, 3 centres have recorded rise of 5 points followed by 4 points in 2 centres, 3 points in 7 centres, 2 points in 14 centres, and 1 point in 15 centres. Goa centre reported a decline of 8 points, 7 points in Godavarikhani, 5 points in Bhavnagar, 4 points in Nagpur and Ahmedabad, 3 points in 2 centres, 2 points in 3 centres and 1 point in 6 centres. The remaining 15 centres‟ indices remained stationary. A 1.1.3. Average Monthly Consumer Prices of Selected Articles for Industrial Workers – The average monthly consumer prices of selected articles based on individual quotations obtained from the selected outlets which are utilised in the compilation of Consumer Price Index Numbers (Base: 2001=100) for Industrial Workers for 78 centres for the month of September, 2013 are set out in Table A.1.1.3. The prices reported in the table are averages of open markets prices of specified varieties of an item prevailing in the selected outlets in the selected market(s) in a given centre during the month in case of non-rationed items. So far as rationed items are concerned, the prices for the centres covered under informal rationing are the weighted average prices, the weights being the proportion of the quantity available through Public Distribution System and quantity procured from the open market in different centres in relation to base year requirements of an average family. In case of centres covered under Statutory Rationing the prices are average of the fair prices of variety (ies) of an item distributed through Fair Price Shops.
1.2 Consumer Price Index Numbers for Agricultural and Rural Labourers: A.1.2.1 (a) and (b) Labour Bureau’s Series of Consumer Price Index Numbers for Agricultural and Rural Labourers on Base: 1986-87=100 - All-India Consumer Price Index Numbers for Agricultural and Rural Labourers on Base: 1986-87=100 replacing the earlier series on base 1960-61=100 were released with effect from November, 1995. The all-India index is a weighted average of 20 constituent State indices compiled by the Labour Bureau for Agricultural and Rural Labourers separately. A detailed note on the scope and method of construction of these indices was published in February, 1996 issue of the Indian Labour Journal.

Indian Labour Journal, December 2013
1236
The Consumer Price Index Numbers (Base: 1986-87=100) for Agricultural and Rural Labourers for 20 States and All-India are presented group-wise in Tables A.1.2.1 (a) and (b) for the months of August, 2013 September, 2013. These index numbers measure the extent of change in the retail prices of goods and services consumed by Agricultural and Rural Labourers as compared with the base period viz., 1986-87. The All-India Consumer Price Index Numbers for Agricultural Labourers and Rural Labourers on base 1986-87=100 for September, 2013 increased by 5 points and 6 points respectively to stand at 759 (Seven hundred and fifty nine) points for both the series.
A.1.2.2 (a) and (b) Monthly Consumer Prices of Selected Articles for Agricultural and Rural Labourers – The monthly consumer prices of selected articles of index basket of agricultural and rural labourers utilised in the compilation of Consumer Price Index Numbers (Base: 1986-87=100) for 20 States separately for Agricultural and Rural Labourers for the month of September, 2013 are given in Tables A.1.2.2. (a) and (b). Though the spatial coverage and the individual sample village price quotations in both the series relating to the Agricultural and Rural Labourers are the same, the weighted prices of items at the State level will be slightly different from each other due to difference in the regional weights in each of the series.
2 Wages and Earnings A.2.1 (a) and (b) Average Daily Wage Rates for Agricultural and Non-agricultural Occupations - As a part of Rural Labour Enquiry, daily wage rates in respect of eighteen agricultural and non-agricultural occupations from a fixed set of 600 sample villages spread over 66 N.S.S. regions in 20 States are being collected alongwith rural retail price data in Schedule 3.01 (R) by the Field Operations Division of the National Sample Survey Organisation since 1986-87. On the recommendations of the Governing Council of the National Sample Survey Organisation in its 61
st
meeting, Labour Bureau started the compilation and analysis of Wage Rate Data w.e.f. April, 1998. State-wise and all-India average daily wage rates by occupation and sex for the month of September,2013 have been presented in Table A.2.1 (a) for agricultural occupations and Table A.2.1 (b) for non- agricultural occupations.
The average wage rates at all-India level are derived by dividing the sum total of wages of all the 20 States by the number of quotations. State-wise averages have been restricted only to those occupations where the number of quotations are five or more in order to avoid inconsistency in wages paid to different categories of workers on account of difference in number of quotations. However, for working out all-India averages all the quotations have been taken into account to arrive at total number of quotations at all-India level. At all-India level also, the number of quotations for working out occupation-wise averages have been restricted to five or more. 3 Industrial Dispute A.3.1. Sector / Sphere-wise Number of Disputes, Workers Involved and Mandays Lost due to Industrial Disputes during January to September 2013 – These statistics are received in the Bureau from the State Labour Departments and Regional Labour Commissioners (Central) in the prescribed format in the shape of monthly voluntary returns covering State and Central Spheres separately. Information on Strikes and Lockouts is collected by the concerned authorities and sent to the Bureau every month. Consolidated information for the year 2013 (As on 31-10-2013) is presented in Table A.3.1. A.3.2. Industrial Disputes (All Strikes and Lockouts) during January to September, 2013- State-wise scenario of Industrial Disputes during January to September, 2013 is presented in Table A.3.2..
NOTES -1. Labour Bureau takes every care to ensure correctness of the information presented in Sections A and B of the Journal. However, any error, if noticed, may kindly be brought to the notice of the Labour Bureau.
2. The indices given in Sections A and B measure the relative change in Consumer Prices over time at each Centre and as such these cannot be used for comparison of costliness among the different Centres.

Indian Labour Journal, December 2013
1237
1. PRICES AND PRICE INDICES
1.1. Industrial Workers Consumer Price Index
Table A.1.1.1. Labour Bureau‟s Series of All India Consumer Price Index Numbers for
Industrial Workers on base 2001=100 (Group-wise and General)
Index Linking Factor August, 2013 September, 2013
General 4.63 237 238
I-A Food 4.58 262 263
I-B Pan, Supari, Tobacco and
Intoxicants
6.16 249 250
II Fuel and Light 4.77 226 230
III Housing 6.18 255 255
IV Clothing, Bedding and
Footwear
3.22 180 181
V Miscellaneous 4.55 194 196
Linking Factor: The All-India General Index as well as Group Indices for previous series on
base: 1982=100 can be obtained by multiplying the current series indices by
the respective Linking Factors.
Think of all the beauty still left around you and be happy.
-Anne Frank

Indian Labour Journal, December 2013
1238
Table A.1.1.2 – Labour Bureau‟s Series of Consumer Price Index Numbers for Industrial
Sl.
No
State/Union
Territory/ Centre
Linking factor for
General Index with
previous base
1982=100
General Index Food Index
Aug,
2013
Sept.,
2013
Aug,
2013
Sept.,
2013
1 2 3 4 5 6 7
ANDHRA PRADESH
1 Godavarikhani N 250 243 275 261
2 Guntur 4.57 241 243 271 273
3 Hyderabad 4.79 211 211 260 257
4 Vijayawada N 239 239 277 278
5 Visakhapatnam 4.64 240 247 275 288
6 Warrangal 4.75 252 252 295 296
ASSAM
7 Doom-Dooma
Tinsukia
4.04 198 200 204 208
8 Guwahati 4.80 202 204 215 220
9 Labac-Silchar 3.65 216 225 230 244
10 Mariani-Jorhat 4.01 196 197 198 200
11 Rangapara-Tezpur 4.17 188 190 208 213
BIHAR
12 Monghyr-Jamalpur 4.30 242 244 253 257
CHANDIGARH
13 Chandigarh 5.26 236 239 260 265
CHHATTISGARH
14 Bhilai 4.20 274 272 279 274
DELHI
15 Delhi 5.60 215 216 243 245
GOA
16 Goa 5.59 255 247 302 285
GUJARAT
17 Ahmedabad 4.62 241 237 285 276
18 Bhavnagar 4.76 228 223 241 231
19 Rajkot 4.38 233 231 255 251
20 Surat 4.54 224 224 267 267
21 Vadodra 4.39 227 226 261 255

Indian Labour Journal, December 2013
1239
Workers (Group-wise & General 2001=100)
Pan. Supari,
Tobacco and
Intoxicants Index
Fuel & Light
Index
Housing Index Clothing, Bedding
& Footwear Index
Misc. Index
Aug,
2013
Sept.,
2013
Aug,
2013
Sept.,
2013
Aug,
2013
Sept.,
2013
Aug,
2013
Sept.,
2013
Aug,
2013
Sept.,
2013
8 9 10 11 12 13 14 15 16 17
191 191 169 169 370 370 188 186 183 183
302 305 243 261 185 185 180 180 190 191
256 256 147 157 184 184 147 147 179 181
290 290 157 157 214 214 220 220 191 192
230 231 152 166 320 320 220 223 183 185
225 225 158 158 260 260 170 170 210 211
209 209 164 165 184 184 177 177 198 198
211 208 191 190 187 187 192 198 194 194
208 218 182 182 176 176 183 183 201 199
220 220 249 249 125 125 164 164 215 216
146 146 154 154 101 101 239 239 200 193
269 255 255 265 285 285 186 186 213 213
236 237 206 209 297 297 199 199 158 160
266 270 203 203 510 510 156 157 193 194
225 225 220 223 192 192 192 190 183 188
194 195 185 186 245 245 209 210 210 211
263 365 163 163 203 203 171 171 214 215
189 189 154 154 250 250 193 194 200 200
275 260 158 158 248 248 158 158 201 200
314 317 149 149 202 202 154 154 195 196
292 294 165 166 227 227 134 134 203 207

Indian Labour Journal, December 2013
1240
Table A.1.1.2. Contd.
Sl.
No
State/Union Territory /
Centre
Linking factor for
General Index with
previous base
1982=100
General Index Food Index
Aug,
2013
Sept.,
2013
Aug,
2013
Sept.,
2013
1 2 3 4 5 6 7
HARYANA
22 Faridabad 4.79 217 218 258 260
23 Yamunanagar 4.34 230 231 266 267
HIMACHAL PRADESH
24 Himachal Pradesh 4.53 214 215 233 235
JAMMU & KASHMIR
25 Srinagar 5.62 205 208 213 218
JHARKHAND
26 Bokaro N 232 232 230 229
27 Giridih N 292 293 272 272
28 Jamshedpur 4.23 255 260 239 252
29 Jharia 3.72 267 269 254 257
30 Kodarma 3.89 270 270 259 258
31 Ranchi-Hatia 4.20 272 275 255 259
KARNATAKA
32 Bangalore 4.51 243 243 280 281
33 Belgaum 5.02 252 249 291 284
34 Hubli-Dharwar 4.71 256 255 274 270
35 Mercara 4.47 245 247 271 274
36 Mysore N 247 252 283 289
KERALA
37 Ernakulam 4.52 227 229 269 271
38 Mundakayam 4.37 258 255 286 281
39 Quilon 4.61 239 242 260 262

Indian Labour Journal, December 2013
1241
Pan, Supari,
Tobacco and
Intoxicants Index
Fuel & Light
Index
Housing Index Clothing, Bedding
& Footwear Index
Misc. Index
Aug,
2013
Sept.,
2013
Aug,
2013
Sept.,
2013
Aug,
2013
Sept.,
2013
Aug,
2013
Sept.,
2013
Aug,
2013
Sept.,
2013
8 9 10 11 12 13 14 15 16 17
267 267 192 192 230 230 168 168 140 140
284 288 191 191 246 246 188 188 168 170
264 264 217 217 193 193 211 212 182 182
318 318 255 255 169 169 238 238 184 185
199 199 341 341 321 321 211 211 185 187
163 163 735 737 367 367 240 240 203 204
241 241 253 256 436 436 183 183 180 182
269 269 353 354 482 482 230 233 211 212
227 227 447 447 354 354 204 204 210 210
229 229 249 254 486 486 197 199 212 214
231 239 176 177 215 215 147 144 237 240
243 241 198 199 228 228 161 163 215 216
239 242 198 202 322 322 148 151 222 223
219 217 346 352 102 102 172 171 234 235
268 271 192 195 254 254 158 159 203 209
231 229 158 161 199 199 177 179 212 216
294 285 397 401 124 124 195 195 210 210
268 274 247 247 227 227 173 169 205 210

Indian Labour Journal, December 2013
1242
Table A.1.1.2. Contd.
Sl.
No
State/Union Territory/
Centre Linking factor for
General Index
with previous
base 1982=100
General Index Food Index
Aug,
2013
Sept.,
2013
Aug,
2013
Sept.,
2013
1 2 3 4 5 6 7
MADHYA PRADESH
40 Bhopal 4.83 244 245 265 268
41 Chhindwara 4.03 250 251 286 287
42 Indore 4.73 227 227 266 261
43 Jabalpur 4.53 236 237 269 272
MAHARASHTRA
44 Mumbai 5.18 244 244 265 262
45 Nagpur 4.68 278 274 304 291
46 Nasik 4.94 248 247 269 262
47 Pune 4.96 244 242 288 282
48 Solapur 4.73 244 245 258 259
ORISSA
49 Angul-Talcher N 246 245 248 246
50 Rourkela 4.03 251 254 270 275
PUDUCHERRY
51 Pondicherry 4.88 243 243 304 305
PUNJAB
52 Amritsar 4.09 244 246 268 270
53 Jalandhar N 229 230 259 261
54 Ludhiana 4.12 227 228 266 269
RAJASTHAN
55 Ajmer 4.78 238 238 276 276
56 Bhilwara 4.62 240 246 278 289
57 Jaipur 4.25 233 232 256 255
TAMIL NADU
58 Chennai 4.95 221 221 259 256
59 Coimbatore 4.49 218 220 252 256

Indian Labour Journal, December 2013
1243
Pan, Supari,
Tobacco and
Intoxicants Index
Fuel & Light
Index
Housing Index Clothing, Bedding
& Footwear Index
Misc. Index
Aug,
2013
Sept.,
2013
Aug,
2013
Sept.,
2013
Aug,
2013
Sept.,
2013
Aug,
2013
Sept.,
2013
Aug,
2013
Sept.,
2013
8 9 10 11 12 13 14 15 16 17
274 274 218 218 290 290 155 155 198 201
268 268 346 346 212 212 156 163 191 192
266 266 229 228 177 177 154 154 211 218
295 295 224 225 295 295 124 124 192 193
259 261 254 270 228 228 189 190 217 218
286 286 217 230 374 374 181 181 198 199
237 238 210 221 320 320 174 174 187 191
261 261 207 222 211 211 211 211 216 217
271 271 221 230 266 266 207 207 208 208
265 264 246 246 359 359 188 188 191 193
202 202 203 202 353 353 194 194 175 178
244 241 241 241 154 154 169 169 207 208
246 246 220 220 295 295 185 187 182 183
221 232 234 234 225 225 180 181 195 196
240 240 205 205 182 182 218 218 193 193
295 295 232 237 253 253 184 184 189 191
284 284 273 275 189 189 160 162 187 188
244 244 208 206 224 224 182 182 212 214
286 286 181 182 188 188 165 172 195 196
246 249 183 183 184 184 167 167 200 200

Indian Labour Journal, December 2013
1244
Table A.1.1.2. Concld.
Sl.
No
State/Union Territory
Centre
Linking factor for
General Index
with previous
base 1982=100
General Index Food Index
Aug,
2013
Sept.,
2013
Aug,
2013
Sept.,
2013
1 2 3 4 5 6 7
60 Coonoor 4.58 226 228 243 245
61 Madurai 4.51 218 220 258 260
62 Salem 4.45 221 223 247 249
63 Tiruchirapally 5.01 237 236 275 273
TRIPURA
64 Tripura 4.17 197 203 207 216
UTTAR PRADESH
65 Agra 4.36 243 247 251 255
66 Ghaziabad 4.78 240 241 267 270
67 Kanpur 4.50 246 246 274 274
68 Lucknow N 229 233 259 265
69 Varanasi 4.96 235 242 269 280
WEST BENGAL
70 Asansol 4.37 265 265 262 262
71 Darjeeling 3.80 216 222 237 243
72 Durgapur 5.13 268 273 240 249
73 Haldia 5.64 233 236 237 242
74 Howrah 5.42 218 219 248 249
75 Jalpaiguri 3.96 230 230 247 248
76 Kolkata 5.12 228 230 260 263
77 Raniganj 4.02 217 220 246 246
78 Siliguri N 224 225 258 260

Indian Labour Journal, December 2013
1245
Pan, Supari,
Tobacco and
Intoxicants Index
Fuel & Light
Index
Housing Index Clothing, Bedding
& Footwear Index
Misc. Index
Aug,
2013
Sept.,
2013
Aug,
2013
Sept.,
2013
Aug,
2013
Sept.,
2013
Aug,
2013
Sept.,
2013
Aug,
2013
Sept.,
2013
8 9 10 11 12 13 14 15 16 17
241 241 229 232 299 299 156 156 182 183
290 291 174 173 150 150 179 182 196 197
310 310 178 178 151 151 159 159 206 206
282 277 180 180 262 262 154 154 179 179
275 274 242 248 123 123 156 156 186 186
260 270 225 228 364 364 178 185 180 183
256 256 216 216 262 262 204 204 197 198
247 248 223 223 341 341 189 189 173 174
246 246 218 222 303 303 183 193 160 161
219 222 249 245 290 290 159 162 175 183
234 234 404 402 392 392 203 203 187 188
174 183 279 294 107 107 185 191 177 180
251 257 237 237 654 654 194 197 185 189
270 270 216 219 295 295 155 155 157 162
286 287 252 254 200 200 176 176 156 157
223 223 314 315 104 104 186 186 189 189
279 280 239 240 190 190 209 209 176 180
172 176 251 250 191 191 172 187 158 163
164 164 267 267 103 103 156 156 171 171
N- New Centre in the New Series on base: 2001=100.
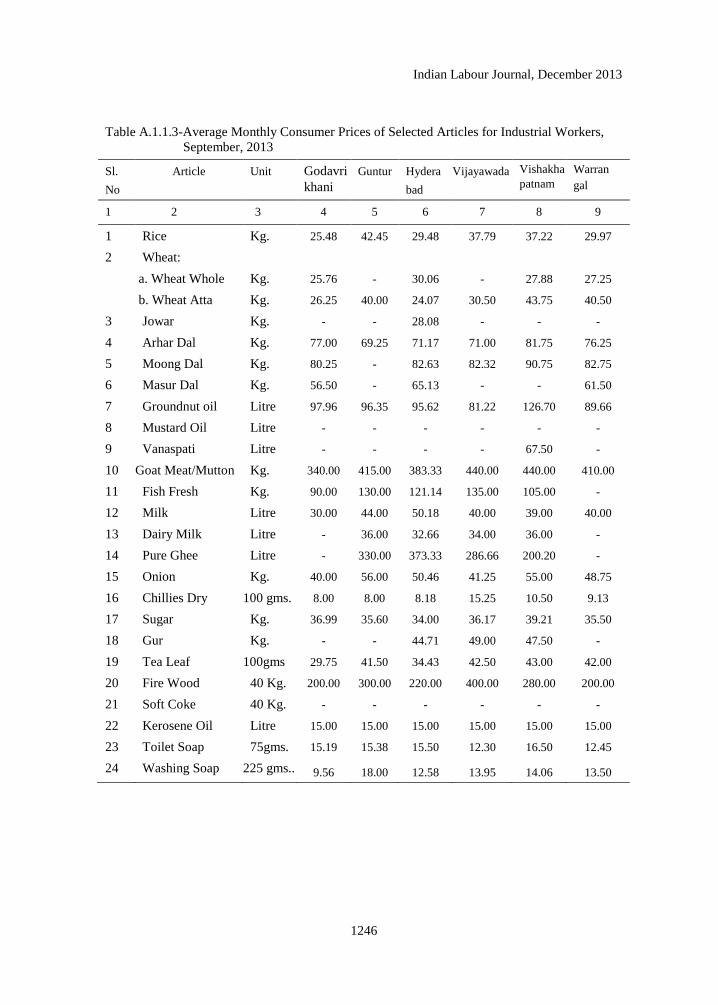
Indian Labour Journal, December 2013
1246
Table A.1.1.3-Average Monthly Consumer Prices of Selected Articles for Industrial Workers,
September, 2013
Sl.
No
Article Unit Godavri
khani
Guntur Hydera
bad
Vijayawada Vishakha
patnam
Warran
gal
1 2 3 4 5 6 7 8 9
1 Rice Kg. 25.48 42.45 29.48 37.79 37.22 29.97
2 Wheat:
a. Wheat Whole Kg. 25.76 - 30.06 - 27.88 27.25
b. Wheat Atta Kg. 26.25 40.00 24.07 30.50 43.75 40.50
3 Jowar Kg. - - 28.08 - - -
4 Arhar Dal Kg. 77.00 69.25 71.17 71.00 81.75 76.25
5 Moong Dal Kg. 80.25 - 82.63 82.32 90.75 82.75
6 Masur Dal Kg. 56.50 - 65.13 - - 61.50
7 Groundnut oil Litre 97.96 96.35 95.62 81.22 126.70 89.66
8 Mustard Oil Litre - - - - - -
9 Vanaspati Litre - - - - 67.50 -
10 Goat Meat/Mutton Kg. 340.00 415.00 383.33 440.00 440.00 410.00
11 Fish Fresh Kg. 90.00 130.00 121.14 135.00 105.00 -
12 Milk Litre 30.00 44.00 50.18 40.00 39.00 40.00
13 Dairy Milk Litre - 36.00 32.66 34.00 36.00 -
14 Pure Ghee Litre - 330.00 373.33 286.66 200.20 -
15 Onion Kg. 40.00 56.00 50.46 41.25 55.00 48.75
16 Chillies Dry 100 gms. 8.00 8.00 8.18 15.25 10.50 9.13
17 Sugar Kg. 36.99 35.60 34.00 36.17 39.21 35.50
18 Gur Kg. - - 44.71 49.00 47.50 -
19 Tea Leaf 100gms 29.75 41.50 34.43 42.50 43.00 42.00
20 Fire Wood 40 Kg. 200.00 300.00 220.00 400.00 280.00 200.00
21 Soft Coke 40 Kg. - - - - - -
22 Kerosene Oil Litre 15.00 15.00 15.00 15.00 15.00 15.00
23 Toilet Soap 75gms. 15.19 15.38 15.50 12.30 16.50 12.45
24 Washing Soap 225 gms.. 9.56 18.00 12.58 13.95 14.06 13.50

Indian Labour Journal, December 2013
1247
Doom
Dooma
Tinsukia
Guwa
hati
Labac
Silchar
Mariani
Jorhat
Rangapara
Tezpur
Monghyr
Jamalpur Chandigarh
Bhilai
10 11 12 13 14 15 16 17
14.23 24.28 13.41 13.43 13.78 27.89 30.00 21.43
0.00
- - - - - 16.96 - 22.38
5.05 28.42 4.79 4.60 4.31 20.00 22.00 22.00
- - - - - - - -
69.33 78.00 67.00 74.60 - 77.75 74.67 70.76
90.00 78.00 87.00 84.00 75.00 80.00 80.00 77.76
68.00 56.00 80.00 73.50 74.00 58.00 65.67 60.00
- - - - - - - 139.58
100.00 107.00 107.00 105.00 105.00 87.02 85.20 86.62
90.67 100.00 - 98.50 - 75.00 72.00 70.00
293.33 300.00 350.00 280.00 290.00 340.00 320.00 300.00
180.00 160.00 185.00 260.00 175.00 118.75 110.00 200.00
33.33 40.00 41.50 36.00 33.50 35.00 34.00 38.00
- - - - - - 35.00 -
- - - - - 325.00 325.00 310.00
66.07 60.63 65.00 61.33 65.00 60.00 68.00 60.63
10.67 15.00 17.00 10.60 12.00 25.00 26.67 15.50
40.00 38.00 39.57 40.00 40.00 36.00 35.33 31.86
60.00 - 62.50 - 50.00 40.00 44.67 44.25
16.00 22.00 23.00 21.00 30.00 33.20 34.00 32.00
113.34 160.00 150.00 150.00 120.00 360.00 - 260.00
- - - - - 480.00 - -
16.00 15.00 15.00 15.00 16.00 16.41 14.75 14.95
12.60 11.54 12.60 12.60 12.60 16.50 16.50 15.00
25.20 24.37 12.50 13.23 13.23 12.50 8.33 10.47

Indian Labour Journal, December 2013
1248
Table A.1.1.3 Contd.
Sl.
No
Article Unit Delhi Goa Ahmedabad Bhav-
nagar
Rajkot Surat
1 2 3 18 19 20 21 22 23
1 Rice Kg. 18.15 24.89 31.45 33.64 33.58 33.75
2 Wheat: 0.00 0.00 0.00 0.00 0.00
a. Wheat Whole Kg. 7.98 20.60 22.26 20.82 20.83 21.40
b. Wheat Atta Kg. 16.89 24.83 25.78 30.00 25.00 25.00
3 Jowar Kg. - 36.17 0.00 0.00 0.00 32.00
4 Arhar Dal Kg. 76.25 77.79 72.58 70.00 69.67 70.90
5 Moong Dal Kg. 79.76 88.67 70.26 80.00 70.00 74.20
6 Masur Dal Kg. 63.00 65.42 66.66 65.00 0.00 62.00
7 Groundnut oil Litre 160.00 170.00 99.99 98.00 116.67 111.48
8 Mustard Oil Litre 110.00 147.42 90.04 0.00 97.07 104.65
9 Vanaspati Litre 71.00 87.88 66.00 73.17 67.28 65.00
10 Goat Meat/Mutton Kg. 329.38 364.58 302.22 200.00 340.00 315.00
11 Fish Fresh Kg. 124.38 320.42 - 100.00 160.00 165.00
12 Milk Litre 36.75 39.67 39.30 35.00 38.00 43.60
13 Dairy Milk Litre 32.00 38.00 40.00 44.00 36.00 40.00
14 Pure Ghee Litre 311.09 325.00 310.00 320.01 289.60 315.00
15 Onion Kg. 65.19 57.40 66.75 60.00 60.00 62.00
16 Chillies Dry 100 gms. 25.00 22.13 23.95 25.00 20.00 24.00
17 Sugar Kg. 35.01 34.02 35.80 34.83 34.75 34.70
18 Gur Kg. 41.00 45.81 49.43 40.00 40.00 50.00
19 Tea Leaf 100gms 33.70 27.20 31.20 31.20 31.20 32.00
20 Fire Wood 40 Kg. 537.50 343.32 314.00 160.00 200.00 300.00
21 Soft Coke 40 Kg. - 0.00 - 0.00 0.00 -
22 Kerosene Oil Litre 14.94 15.65 14.00 14.45 14.51 14.05
23 Toilet Soap 75gms. 14.25 15.75 15.75 15.75 15.00 15.75
24 Washing Soap 225 gms. 13.00 25.20 10.47 23.40 8.14 22.50

Indian Labour Journal, December 2013
1249
Vadodara Himachal
Pradesh
Faridabad Yamuna
nagar
Srinagar Bokaro Giridih Jamshedpur
24 25 26 27 28 29 30 31
30.24 17.92 30.00 32.50 16.59 24.00 24.15 26.94
0.00
20.19 15.55 17.63 17.96 - 18.00 24.00 19.13
26.17 13.38 18.70 20.55 19.99 20.00 22.00 21.25
24.33 - - - - - - -
64.83 76.79 77.50 71.50 - 70.00 86.00 72.38
70.00 77.61 84.00 80.00 81.42 80.00 82.00 80.00
55.00 62.75 66.00 65.00 75.00 54.75 55.00 56.00
104.35 154.88 - - - - - 154.75
0.00 108.72 77.35 81.90 110.33 100.00 95.55 88.38
80.00 70.98 70.00 71.50 74.50 80.00 82.00 72.00
340.00 269.29 250.00 316.25 340.00 340.00 360.00 352.50
140.00 163.00 125.00 97.50 161.67 120.00 130.00 134.06
41.33 31.36 45.00 36.00 31.33 30.00 32.00 36.00
40.00 36.58 32.00 35.00 - 30.00 - 34.00
318.33 308.57 289.60 300.00 295.64 310.00 316.75 325.80
70.00 63.04 63.75 62.50 63.75 61.25 50.00 63.75
23.00 24.71 23.00 20.00 27.00 14.00 22.00 24.00
34.86 22.83 31.80 33.18 13.50 36.00 38.00 36.00
48.00 40.52 42.50 40.00 - 40.00 39.00 42.00
32.00 34.63 33.00 32.00 35.20 40.00 39.20 33.00
320.00 225.00 400.00 320.00 161.67 240.00 280.00 200.00
0.00 - - - 370.00 350.00 275.00 445.63
14.32 14.54 14.00 14.02 17.50 15.14 14.49 14.42
15.75 15.38 14.44 16.50 15.00 15.75 16.50 15.75
19.80 11.54 10.13 10.80 9.00 14.07 22.50 12.50

Indian Labour Journal, December 2013
1250
Table A.1.1.3 Contd.
Sl.
No
Article Unit Jharia Kodar-
ma
Ranchi
Hatia
Bangalore Belgaum Hubli
Dharwar
Mercara
1 2 3 32 33 34 35 36 37 38
1 Rice Kg. 25.57 19.98 22.64 38.67
33.55 34.78 28.48
2 Wheat:
a. Wheat Whole Kg. 19.00 16.00 24.08 27.08 25.11 27.45 28.82
b. Wheat Atta Kg. 20.20 20.00 21.75 25.17 0.00 0.00 40.75
3 Jowar Kg. - - - - 26.00 22.75 -
4 Arhar Dal Kg. 71.90 70.00 73.67 72.38 70.25 73.38 .81.88
5 Moong Dal Kg. 81.70 75.00 82.83 83.17 69.00 71.63 86.58
6 Masur Dal Kg. 60.00 55.00 61.22 .- 62.25 59.88 -
7 Groundnut oil Litre - - - 86.86 93.79 81.68 105.00
8 Mustard Oil Litre 80.37 81.90 95.00 - - - -
9 Vanaspati Litre 70.00 76.50 77.00 66.90 78.75 72.76 85.75
10 Goat Meat/ Mutton Kg. 352.00 300.00 321.00 381.17 352.50 332.50 327.50
11 Fish Fresh Kg. 123.90 130.00 148.67 139.25 105.00 84.38 196.50
12 Milk Litre 34.00 38.00 33.73 28.56 42.00 45.00 28.23
13 Dairy Milk Litre - - 30.00 28.00 28.00 28.84 -
14 Pure Ghee Litre 322.18 325.00 310.00 323.00 328.00 324.00 -
15 Onion Kg. 58.24 55.63 55.33 52.86 53.13 61.38 49.75
16 Chillies Dry 100 gms. 27.00 16.00 25.00 11.63 14.50 20.00 8.61
17 Sugar Kg. 36.00 36.00 37.67 34.39 32.49 33.20 35.82
18 Gur Kg. 43.44 42.00 46.20 54.58 40.00 41.38 45.13
19 Tea Leaf 100gms 34.00 27.60 40.00 33.00 30.00 25.00 32.00
20 Fire Wood 40 Kg. 200.00 260.00 331.67 208.28 248.00 280.00 160.00
21 Soft Coke 40 Kg. 200.00 383.75 352.17 - - - -
22 Kerosene Oil Litre 14.26 15.00 14.77 16.20 16.20 16.20 16.58
23 Toilet Soap 75gm 15.75 12.60 16.50 16.50 15.75 15.75 15.75
24 Washing Soap 225 gms. 22.50 22.50 8.04 14.40 14.40 7.97 14.40

Indian Labour Journal, December 2013
1251
Mysore Erna-
kulam
Munda-
kayam
Quilon Bhopal Chhind-
wara
Indore Jabalpur Mumbai
39 40 41 42 43 44 45 46 47
41.73 27.47 33.17 27.57 32.75 25.01 25.38 22.20 35.52
0.00 0.00 0.00 0.00 -
29.85 7.64 13.95 6.36 18.18 19.00 24.26 19.45 20.43
31.94 34.00 31.75 25.00 20.00 22.00 20.25 20.00 -
- - - - - - - - 33.97
80.00 78.00 80.00 50.50 70.00 70.00 71.12 67.60 80.42
80.50 77.50 83.21 74.25 76.00 80.00 81.00 82.48 84.98
62.07 - 66.17 58.00 53.00 61.76 55.40 65.20
124.75 116.00 145.00 168.50 111.76 152.00 139.77
- - - - 110.00 92.50 83.32 100.00 96.11
95.50 - - 67.00 78.00 70.25 70.00 102.20
340.00 400.00 410.00 440.00 340.00 280.00 351.25 292.00 358.44
80.00 125.00 105.83 135.00 206.67 100.00 178.33 144.40 577.34
31.00 35.00 34.33 36.00 45.00 41.00 34.00 44.72 53.03
29.00 35.00 35.00 38.00 32.00 36.00 36.00 32.00
324.00 345.00 320.00 307.70 320.00 322.18 320.00
58.75 63.00 58.83 58.75 56.67 50.00 53.44 58.20 60.25
11.50 9.25 10.00 10.50 15.00 15.00 15.88 15.00 21.34
34.87 34.00 34.47 34.75 32.69 35.00 32.10 34.52 37.67
54.38 49.75 50.88 54.63 45.00 34.00 43.88 39.20 57.83
31.10 29.50 22.33 27.00 35.20 32.80 34.40 32.80 38.29
220.00 80.00 216.00 176.00 300.00 240.00 240.00 182.00 -
- - - - - - - - -
16.20 16.50 16.83 15.50 15.51 16.56 15.19 15.30 15.05
16.13 17.25 12.60 18.00 16.50 15.75 15.00 15.75 17.50
16.20 13.95 16.90 14.06 24.30 9.00 23.40 25.20 23.18

Indian Labour Journal, December 2013
1252
Table A.1.1.3 Contd.
Sl.
No
Article Unit Nagpur Nasik Pune Sholapur Angul-
Talcher
Rourkela Puducherry
1 2 3 48 49 50 51 52 53 54
1 Rice Kg. 32.75 24.59 34.30 27.18 23.77 27.81 41.88
2 Wheat: 0.00 0.00 0.00 0.00
a. Wheat
Whole
Kg. 22.59 19.32 23.57 16.27 7.51 - 0.00
b. Wheat Atta Kg. 24.00 24.00 - 24.75 19.19 19.07 40.50
3 Jowar Kg. - 25.00 32.00 24.00 - - -
4 Arhar Dal Kg. 71.08 71.33 76.25 71.00 71.00 78.00 77.50
5 Moong Dal Kg. 80.00 80.00 86.33 79.00 80.00 86.00 82.00
6 Masur Dal Kg. 60.00 63.33 62.83 60.50 70.00 64.50 -
7 Groundnut oil Litre 100.10 111.48 136.98 94.64 120.00 - 81.90
8 Mustard Oil Litre 120.00 134.00 - - 90.00 85.54 -
9 Vanaspati Litre 84.00 66.60 81.84 90.00 80.00 90.00 74.25
10 Goat
Meat/Mutton
Kg. 380.00 350.00 360.00 340.00 375.00 320.00 420.00
11 Fish Fresh Kg. 200.00 573.33 641.67 142.50 160.00 150.00 700.00
12 Milk Litre 40.00 46.67 44.00 40.00 28.00 30.00 28.00
13 Dairy Milk Litre 33.00 34.00 30.00 32.00 - 26.00 26.00
14 Pure Ghee Litre 325.00 325.00 355.00 0.00 316.75 - 309.40
15 Onion Kg. 60.00 67.50 70.42 55.00 53.00 58.50 49.50
16 Chillies Dry 100
gms. 16.00 38.89 21.50 24.50 15.00 15.00 9.75
17 Sugar Kg. 34.42 33.89 32.65 30.83 39.00 37.25 33.47
18 Gur Kg. 50.00 48.00 47.92 40.00 42.00 - 52.50
19 Tea Leaf 100gms 38.78 36.00 27.70 22.23 44.80 30.00 40.38
20 Fire Wood 40 Kg. 300.00 240.00 293.32 280.00 240.00 240.00 240.00
21 Soft Coke 40 Kg. - - - - 200.00 - -
22 Kerosene Oil Litre 15.31 14.88 15.14 15.20 14.08 13.82 14.25
23 Toilet Soap 75gms 18.33 15.75 16.50 15.75 15.75 16.50 16.88
24 Washing Soap 225
gms. 22.50 18.00 7.50 25.20 22.50 18.00 13.73

Indian Labour Journal, December 2013
1253
Amritsar Jalandhar Ludhiana Ajmer Bhilwara Jaipur Chennai Coimba-
tore
Coonoor Madurai
55 56 57 58 59 60 61 62 63 64
22.00 25.00 25.00 34.10 35.19 38.50 26.56 22.17 `14.98 23.82
0.00 0.00
- 10.21 - 19.95 17.99 19.90 18.46 21.85 11.66 21.13
18.25 19.00 20.00 22.00 24.50 22.00 39.07 41.88 38.00 40.00
- - _ - - - - - - -
75.60 75.00 70.00 78.75 78.50 72.54 76.84 82.45 73.50 82.31
80.00 80.00 80.00 79.00 80.00 76.50 82.11 81.70 78.25 80.44
69.80 70.00 68.50 60.00 58.50 60.00 - - 68.75 -
- - - 150.00 147.50 157.50 101.50 104.42 118.22 108.60
98.80 105.00 102.50 110.00 120.00 108.54 - - -
70.00 70.00 67.00 70.00 - 65.75 75.54 - - 75.00
300.00 310.00 320.00 300.00 290.00 315.83 440.00 410.00 390.00 400.00
200.00 150.00 140.00 250.00 195.00 - 502.79 600.00 155.00 132.50
35.00 35.00 38.00 40.00 35.38 40.00 - 28.00 31.00 30.00
- 36.00 35.00 32.00 30.00 30.00 27.00 32.00 36.00 30.00
330.00 315.00 295.00 305.00 310.00 295.00 290.00 340.50 285.74 327.60
68.00 57.50 62.81 70.00 68.75 62.50 53.44 56.82 65.00 60.00
25.00 25.00 25.00 22.50 21.75 20.00 16.29 10.63 11.00 7.50
35.00 35.00 34.50 35.00 35.88 35.16 21.78 26.62 28.78 27.51
- - - 42.00 39.88 40.00 51.86 60.70 - 52.63
32.00 34.80 34.80 34.00 30.00 34.69 42.00 42.75 43.00 39.13
380.00 280.00 240.00 290.00 220.00 320.00 331.20 300.00 280.00 200.00
- - - - - - - - - -
14.65 14.90 14.31 15.25 17.25 15.25 13.70 13.90 14.10 14.00
13.50 14.25 15.75 16.50 16.50 16.50 16.69 16.97 17.44 16.60
11.25 11.25 13.50 12.15 10.29 10.80 13.90 22.50 14.07 24.30

Indian Labour Journal, December 2013
1254
Table A.1.1.3 Concld.
Sl.
No
Article Unit Salem Tiruchira
pally
Tripura Agra Ghaziabad Kanpur Lucknow
1 2 3 65 66 67 68 69 70 71
1 Rice Kg. 29.57 19.53 17.35 25.81 30.00 37.02 29.97
2 Wheat:
a. Wheat Whole Kg. 19.31 18.78 - 15.49 6.65 11.57 15.81
b. Wheat Atta Kg. 36.50 39.00 12.76 19.25 20.40 20.00 22.00
3 Jowar Kg. - - - - - - -
4 Arhar Dal Kg. 71.75 72.00 - 72.00 70.00 70.67 72.75
5 Moong Dal Kg. 78.60 78.75 79.00 79.00 80.00 81.92 80.00
6 Masur Dal Kg. - 66.50 79.08 60.00 70.00 60.00 60.00
7 Groundnut oil Litre 85.98 90.50 - - - - -
8 Mustard Oil Litre - - 95.00 68.71 90.00 78.91 90.00
9 Vanaspati Litre - - - 68.00 65.00 65.83 66.25
10 Goat Meat/Mutton Kg. 380.00 437.50 404.40 300.00 350.00 321.67 360.00
11 Fish Fresh Kg. 500.00 80.00 197.50 120.00 120.00 137.92 160.00
12 Milk Litre 30.00 35.00 36.49 36.00 42.00 39.67 40.00
13 Dairy Milk Litre 27.00 36.00 - 34.56 38.40 31.34 36.32
14 Pure Ghee Litre - 360.00 - 310.00 320.00 310.00 324.00
15 Onion Kg. 53.75 55.00 59.00 60.00 65.00 71.67 70.00
16 Chillies Dry 100 gms 10.25 9.05 23.20 25.00 24.00 16.00 26.00
17 Sugar Kg. 15.10 20.80 22.30 34.91 35.00 35.40 35.36
18 Gur Kg. - 60.75 51.38 40.00 40.00 40.00 44.81
19 Tea Leaf 100gms 42.00 42.50 20.00 34.80 34.00 32.40 34.80
20 Fire Wood 40 Kg. 144.00 160.00 121.00 280.00 320.00 379.79 320.00
21 Soft Coke 40 Kg. - - - - - 520.00 -
22 Kerosene Oil Litre 14.00 13.90 15.01 15.26 15.25 15.73 15.38
23 Toilet Soap 75gms 16.50 16.88 12.60 15.00 15.00 15.25 16.31
24 Washing Soap 225gms. 14.18 13.95 13.33 25.20 11.25 10.13 25.20
# Items do not feature in index basket of respective centres.
Notes 1. “The prices are average prices based on individual quotations obtained from
selected outlets in a given centre and are not comparable between centres as they
relate to different varieties of varying specifications”.

Indian Labour Journal, December 2013
1255
Varanasi Asansol Darjee-
ling
Durga-
pur
Haldia Howrah Jalpai
guri
Kolkata Rani-
ganj
Sili-
guri
72 73 74 75 76 77 78 79 80 81
30.99 29.04 19.04 27.68 31.88 28.73 20.86 28.49 30.89 18.05
17.71 8.48 14.12 6.73 6.86 6.75 11.62 6.73 - 12.67
20.00 22.39 2.30 15.76 10.87 15.95 2.82 18.76 16.91 4.68
- - - - - - - - - -
72.00 80.00 80.00 76.00 80.00 80.20 80.30 80.13 80.00 85.00
80.00 90.00 88.90 100.00 118.33 95.00 80.00 100.00 100.00 95.00
57.60 74.80 69.75 75.00 79.33 79.93 79.58 79.80 75.00 80.00
- - - - 131.33 - - - - -
81.90 91.00 87.13 85.54 86.45 90.39 91.00 91.00 86.45 95.55
70.80 90.00 77.50 90.00 - 90.00 86.50 90.00 90.00 95.00
300.00 374.00 300.00 360.00 380.00 383.33 382.50 402.00 340.00 400.00
160.00 197.50 157.50 280.00 200.00 220.00 205.00 215.88 206.67 200.00
41.00 32.00 25.00 30.00 30.00 30.00 35.00 30.00 30.00 34.00
40.00 26.00 - 19.00 26.00 26.00 - 26.00 - -
323.28 380.10 355.00 443.45 472.11 362.00 - 377.39 289.60 -
75.50 60.00 70.00 70.00 60.00 63.00 60.00 70.00 60.00 58.17
20.00 16.25 12.00 22.00 24.00 15.50 12.00 15.80 16.00 16.00
35.41 37.92 36.84 37.00 38.00 37.88 39.01 37.70 37.00 38.00
40.00 45.00 49.50 46.00 45.00 45.00 49.50 44.80 40.00 45.00
32.80 32.80 24.00 33.00 33.60 32.80 34.00 44.32 34.00 28.00
400.00 260.00 456.67 220.00 240.00 280.00 200.00 302.00 140.00 240.00
560.00 400.00 620.00 420.00 480.00 480.00 - 480.00 150.00 -
15.87 14.95 15.39 15.00 16.00 25.63 15.15 24.94 15.30 14.72
15.75 16.50 13.20 16.50 16.50 16.50 16.67 16.50 16.50 9.45
25.20 22.50 22.50 18.00 18.76 20.45 22.50 18.00 19.80 18.76
2. Besides these articles, retail prices of a large number of articles (including House Rent)
being paid by working class families and utilized in the compilation of CPI Nos. (on base:
2001=100) for industrial workers are not being published due to resource constraint.
3. The price data of the remaining articles for any particular centre can be made available to
the users on their specific demand.

Indian Labour Journal, December 2013
1256
1.2.Consumer Price Index Numbers for Agricultural and Rural Labourers
Table A.1.2.1 (a) – Labour Bureau‟s Series of Consumer Price Index Numbers for Agricultural
Sl.
No.
State
Linking factor
for General
Index a
General Index Food Index
Aug,
2013
Sept.,
2013
Aug,
2013
Sept.,
2013
1 2 3 4 5 6 7
1 Andhra Pradesh 4.84 812 819 833 838
2 Assam b 710 723 708 724
3 Bihar 6.22 661 671 620 629
4 Gujarat 5.34 769 778 799 806
5 Haryana * 817 836 861 883
6 Himachal Pradesh * 591 608 608 633
7 Jammu & Kashmir 5.98 708 721 743 749
8 Karnataka 5.81 838 832 875 865
9 Kerala 6.56 745 754 748 758
10 Madhya Pradesh 6.04 730 733 724 720
11 Maharashtra 5.85 808 809 843 843
12 Manipur * 687 697 601 611
13 Meghalaya * 740 752 736 755
14 Orissa 6.05 699 701 666 667
15 Punjab c 814 826 856 873
16 Rajasthan 6.15 807 814 797 806
17 Tamil Nadu 5.67 758 764 701 706
18 Tripura * 629 647 631 656
19 Uttar Pradesh 6.60 719 721 736 738
20 West Bengal 5.73 715 722 676 681
All-India 5.89 754 759 747 751
a = The indices for a given month of old base (1960-61) can be obtained by multiplying the
index number of new base (1986-87) of that month by the relevant linking factors which
are applicable to Agricultural Labourers only.

Indian Labour Journal, December 2013
1257
Labourers (Group-wise and General) (Base: 1986-87=100)
Pan, Supari, Tobacco
& Intoxicants Index
Fuel & Light Index Clothing, Bedding &
Footwear Index
Miscellaneous Index
Aug,
2013
Sept.,
2013
Aug,
2013
Sept.,
2013
Aug,
2013
Sept.,
2013
Aug,
2013
Sept.,
2013
8 9 10 11 12 13 14 15
1007 1017 816 815 743 764 701 709
920 911 710 713 704 711 582 582
804 813 913 926 813 823 668 672
1101 1109 604 633 612 624 701 709
811 813 1020 1042 738 748 576 590
992 1002 363 364 540 539 654 657
1155 1170 417 499 666 675 717 718
1086 1089 611 609 719 721 791 801
1197 1203 690 700 695 699 653 661
1022 1017 840 856 686 696 611 652
941 947 856 863 632 638 676 678
1002 1012 1447 1477 704 712 604 604
838 817 720 720 764 764 682 689
961 920 938 966 798 804 605 607
948 956 1129 1126 602 605 609 619
1176 1177 1051 1063 672 672 725 726
1239 1256 866 876 702 700 861 866
902 900 451 456 662 667 603 603
864 858 777 782 690 694 582 581
781 786 891 903 991 1026 758 762
1000 1004 827 837 719 728 689 696
b & c = To obtain linking factors for Assam and Punjab, please consult article in February, 1996
issue of the Indian Labour Journal.
* = Indices compiled and published for the first time w.e.f. November, 1995.

Indian Labour Journal, December 2013
1258
Table A.1.2.1 (b) – Labour Bureau‟s Series of Consumer Price Index Numbers for Rural
Sl.
No
State General Index Food Index Pan, Supari,
Tobacco &
Intoxicants Index
Aug,
2013
Sept.,
2013
Aug,
2013
Sept.,
2013
Aug,
2013
Sept.,
2013
1 2 3 4 5 6 7 8
1 Andhra Pradesh 809 815 832 837 1012 1022
2 Assam 716 728 717 734 914 905
3 Bihar 666 675 618 628 807 816
4 Gujarat 765 775 800 807 1092 1100
5 Haryana 811 830 866 889 838 840
6 Himachal Pradesh 625 640 636 657 1096 1096
7 Jammu & Kashmir 705 721 737 744 1232 1246
8 Karnataka 831 824 863 850 1088 1094
9 Kerala 742 751 740 750 1194 1200
10 Madhya Pradesh 739 745 725 719 1013 1008
11 Maharashtra 802 802 835 833 946 953
12 Manipur 690 700 601 611 1000 1010
13 Meghalaya 734 745 732 750 848 827
14 Orissa 699 702 666 667 956 918
15 Punjab 804 815 854 870 938 944
16 Rajasthan 793 800 786 796 1152 1154
17 Tamil Nadu 749 755 709 715 1255 1271
18 Tripura 624 643 622 647 905 903
19 Uttar Pradesh 718 720 739 742 863 859
20 West Bengal 722 731 679 684 784 789
All India 753 759 748 752 1009 1013

Indian Labour Journal, December 2013
1259
Labourers (Group wise and General) (Base: 1986-87=100)
Fuel & Light Index Clothing, Bedding &
Footwear Index
Miscellaneous Index
Aug,
2013
Sept.,
2013
Aug,
2013
Sept.,
2013
Aug,
2013
Sept.,
2013
9 10 11 12 13 14
809 809 734 750 703 711
705 709 716 722 574 574
916 928 822 829 671 678
605 634 617 631 697 708
1020 1043 704 713 572 588
374 374 625 631 652 657
413 499 663 678 699 703
614 611 699 699 830 841
687 698 706 710 670 679
837 854 761 801 623 668
847 854 688 694 672 674
1450 1481 714 723 594 594
719 719 670 670 683 690
935 963 795 801 605 607
1118 1115 663 666 608 617
1054 1066 693 695 696 696
859 869 656 655 776 781
449 453 660 665 598 597
779 784 714 719 549 548
923 933 936 992 769 782
824 834 725 737 683 691

Indian Labour Journal, December 2013
1260
Table A.1.2.2 (a) - State-wise monthly consumer prices of selected articles of Agricultural
Sl.
No.
Item Unit Andhra Pradesh Assam Bihar Gujarat
1 2 3 4 5 6 7
1. Rice Kg. 16.12 20.16 15.56 18.00
2. Wheat:
(a) Wheat whole Kg. - - 12.69 5.78
(b) Wheat Atta Kg. - 22.93 17.90 21.67
3. Jowar Kg. 22.65 - - -
4. Bajra:
(a) Bajra whole Kg. 19.32 - - 15.75
(b) Bajra Atta Kg. - - - 18.97
5. Maize:
(a) Maize whole Kg. - - 13.10 15.53
(b) Maize Atta Kg. - - - 19.12
6. Ragi Kg. 26.62 - - -
7. Arhar Dal Kg. 66.91 69.85 71.03 65.55
8. Groundnut Oil Litre 97.98 - - 119.70
9. Mustard Oil Litre - 109.86 91.55 -
10. Goat Meat/Mutton Kg. 369.74 291.21 309.65 290.50
11. Fish Fresh Kg. 139.23 239.07 133.84 87.42
12. Milk Litre 34.20 39.94 29.26 38.19
13. Onion Kg. 47.72 61.28 54.49 31.30
14. Chillies Dry 100Gms 10.04 17.19 10.37 12.57
15. Potato Kg. 20.85 17.40 12.27 18.52
16. Sugar Kg. 17.67 22.48 35.99 29.12
17. Gur Kg. 46.60 50.17 38.40 42.73
18. Tea Leaf 100Gms 38.46 20.56 27.19 22.60
19. Firewood 40 Kg. 144.38 125.02 211.10 70.52
20. Kerosene Oil Litre 15.00 16.31 16.81 14.38

Indian Labour Journal, December 2013
1261
Labourers for the month September, 2013 (Base: 1986-87=100)
Haryana Himachal
Pradesh
Jammu &
Kashmir
Karnataka Kerala Madhya Pradesh
8 9 10 11 12 13
24.88 18.86 22.11 8.78 22.60 17.61
- - - - 4.03 8.18
18.18 8.89 19.72 25.76 32.04 18.54
- - - 20.64 - 16.55
- - - - - -
- - - - - -
15.21 - - - - -
- - - - - -
9.00 - 15.91 - - 14.67
- 15.00 - - - -
- - - 21.67 - -
73.81 77.14 - 71.90 68.51 69.70
- - - 98.80 - 130.96
76.83 106.80 105.48 - - 81.71
295.59 255.56 293.93 328.13 409.66 285.90
95.00 148.00 174.17 277.08 72.34 118.47
37.82 31.56 27.64 27.88 34.09 28.88
56.15 60.56 54.69 47.79 62.15 56.51
13.82 14.67 20.02 10.70 9.40 10.50
16.36 17.22 19.10 19.09 22.57 14.85
30.01 13.50 21.41 23.08 30.13 15.67
38.36 40.56 42.02 42.70 52.77 37.04
21.28 29.22 33.34 30.10 24.75 20.14
242.40 N.A. 174.41 92.81 147.39 153.02
14.13 14.75 14.46 16.26 16.01 15.97

Indian Labour Journal, December 2013
1262
Table A.1.2.2 (a) concld.
Sl.
No.
Item Unit Maharashtra Manipur Meghalaya Orissa
1 2 3 14 15 16 17
1. Rice Kg. 12.89 15.19 16.31 17.21
2. Wheat:
(a) Wheat whole Kg. 8.28 - - -
(b) Wheat Atta Kg. - - 23.78 18.78
3. Jowar Kg. 18.55 - - -
4. Bajra:
(a) Bajra whole Kg. 17.63 - - -
(b) Bajra Atta Kg. - - - -
5. Maize:
(a) Maize whole Kg. - - - -
(b) Maize Atta Kg. - - - -
6. Ragi Kg. - - - 17.32
7. Arhar Dal Kg. 71.28 86.50 75.88 71.71
8. Groundnut Oil Litre 124.64 - - 85.53
9. Mustard Oil Litre - 112.22 99.78 96.94
10. Goat Meat/Mutton Kg. 328.22 - - 308.15
11. Fish Fresh Kg. 145.10 172.11 175.56 124.93
12. Milk Litre 37.29 39.78 36.11 21.87
13. Onion Kg. 50.34 42.11 58.67 51.91
14. Chillies Dry 100 gm. 10.66 15.78 16.44 11.04
15. Potato Kg. 20.19 23.00 17.56 11.37
16. Sugar Kg. 24.84 40.78 24.00 30.00
17. Gur Kg. 21.23 - - 41.00
18. Tea Leaf 100 gm. 21.62 17.88 23.38 28.74
19. Firewood 40. Kg. 163.63 246.67 140.56 130.92
20. Kerosene Oil Litre 15.73 21.17 32.22 15.79
- = Items do not feature in the Index Basket.
N.A. = Not Available.

Indian Labour Journal, December 2013
1263
Punjab Rajasthan Tamil
Nadu
Tripura Uttar
Pradesh
West Bengal
18 19 20 21 22 23
27.44 29.26 6.70 17.49 15.53 22.58
14.40 11.76 - - 7.22 -
18.05 19.16 34.45 24.67 16.66 10.68
- 21.69 22.24 - 19.83 -
- 14.60 21.30 - 13.98 -
- 14.07 - - 13.37 -
20.59 - - - - -
- - 25.55 - - -
- 72.01 72.53 - 71.35 71.63
- 130.97 105.14 - - -
94.92 84.01 - 109.44 81.57 88.81
301.59 297.60 396.91 394.44 295.84 352.47
- - 125.86 184.44 118.32 149.93
34.48 32.96 25.77 31.44 32.05 26.24
62.32 57.44 52.92 62.56 56.11 55.24
14.66 11.10 9.49 18.44 12.10 13.13
13.68 15.16 22.37 19.33 12.76 10.46
35.47 24.98 13.50 13.50 20.08 36.61
40.15 39.73 50.97 48.78 37.97 39.93
21.06 20.52 41.27 16.11 28.07 19.51
242.99 181.78 168.74 127.50 222.60 180.98
14.99 15.64 14.01 15.33 15.56 14.82
Note:- The prices are average prices based on individual quotations obtained from the selected
outlets of the sample villages of a given State and are not comparable with each other due
to their varying specifications. Besides, the prices of all the items utilised in compilation
of C.P.I. Numbers for Agricultural Labourers are not being published due to resource
constraints.

Indian Labour Journal, December 2013
1264
Table A.1.2.2 (b) - State-wise monthly consumer prices of selected articles of Rural Labourers
Sl.
No.
Item Unit Andhra
Pradesh
Assam Bihar Gujarat Haryana Himachal
Pradesh
1 2 3 4 5 6 7 8 9
1. Rice Kg. 16.11 20.45 15.60 18.14 24.89 19.99
2. Wheat:
(a) Wheat whole Kg. - - 12.68 5.78 - -
(b) Wheat Atta Kg. - 22.94 17.87 21.59 18.18 9.27
3. Jowar Kg. 22.65 - - - - -
4. Bajra:
(a) Bajra whole Kg. 19.35 - - 15.75 - -
(b) Bajra Atta Kg. - - - 18.92 14.44 -
5. Maize:
(a) Maize whole Kg. - - 13.10 15.53 9.00 -
(b) Maize Atta Kg. - - - 19.25 - 15.00
6. Ragi Kg. 26.62 - - - - -
7. Arhar Dal Kg. 67.00 69.78 71.15 65.56 73.86 77.14
8. Groundnut Oil Litre 97.89 - - 120.00 - -
9. Mustard Oil Litre - 109.81 91.52 98.28 76.95 106.80
10. Goat Meat/Mutton Kg. 369.80 289.04 311.37 289.52 295.97 255.56
11. Fish Fresh Kg. 139.62 240.99 133.85 87.37 95.00 148.00
12. Milk Litre 33.82 39.98 29.23 38.17 37.94 31.56
13. Onion Kg. 47.70 61.29 54.46 31.24 56.13 60.56
14. Chillies Dry 100Gms 10.03 17.20 10.37 12.57 13.81 14.67
15. Potato Kg. 20.91 17.44 12.28 18.48 16.47 17.22
16. Sugar Kg. 18.54 22.67 36.01 28.91 30.15 13.50
17. Gur Kg. 46.73 51.25 38.41 42.74 38.33 40.56
18. Tea Leaf 100gms. 38.30 20.55 27.23 22.52 21.28 29.22
19. Firewood 40. Kg. 144.47 123.83 212.54 70.15 242.40 N.A.
20. Kerosene Oil Litre 15.00 16.45 16.81 14.37 14.13 14.75

Indian Labour Journal, December 2013
1265
for the month of September, 2013 (Base: 1986-87=100)
Jammu &
Kashmir
Karnataka Kerala Madhya
Pradesh
Maha-
rashtra
Manipur Megha-
laya
Orissa Punjab
10 11 12 13 14 15 16 17 18
20.70 8.95 22.59 17.35 13.61 15.16 16.45 17.22 27.44
- - 3.99 8.40 8.70 - - - 14.40
19.65 25.81 31.80 18.54 - 23.78 18.82 18.05
- 20.63 - 16.51 18.39 - - - --
- - - - 17.76 - - - -
15.61 - - 14.64 - - - - -
- - - - - - - - 20.61
- 21.55 - - - - - 17.31 -
- 71.90 68.93 69.45 71.46 86.50 75.88 71.90 -
- 98.79 - 131.56 124.48 - - 85.46 -
105.23 - - 82.03 - 112.22 99.78 97.17 94.66
294.60 329.39 407.63 284.90 329.36 - - 310.28 301.90
174.17 279.23 72.51 118.66 145.11 172.11 175.56 124.94 -
27.53 27.87 34.11 28.96 38.02 39.78 36.11 21.87 34.33
54.99 47.90 62.25 56.14 50.34 42.11 58.67 51.92 62.35
19.53 10.74 9.39 10.48 10.56 15.78 16.44 11.04 14.66
19.04 19.11 22.51 14.86 20.21 23.00 17.56 11.42 13.68
21.54 23.72 30.37 15.95 25.60 40.78 24.00 29.85 35.46
41.82 42.70 52.77 37.01 21.26 - - 41.01 40.21
32.07 30.08 24.90 20.24 21.65 17.88 23.38 28.72 21.06
173.66 92.98 147.28 152.82 163.07 246.67 140.56 131.44 244.06
14.90 16.24 16.01 15.97 15.51 21.17 32.22 15.78 14.97
- = Items do not feature in the Index Basket.
N.A.= Not available

Indian Labour Journal, December 2013
1266
Table A.1.2.2 (b)-Concld.
Sl.
No.
Item Unit Rajasthan Tamil
Nadu
Tripura Uttar
Pradesh
West
Bengal
1 2 3 19 20 21 22 23
1. Rice Kg. 29.59 7.31 17.29 15.57 22.60
2. Wheat:
(a) Wheat whole Kg. 12.14 - - 7.57 -
(b) Wheat Atta Kg. 19.14 34.57 24.67 16.55 10.99
3. Jowar Kg. 21.71 21.88 - 19.59 -
4. Bajra:
(a) Bajra whole Kg. 14.83 21.30 - 13.96 -
(b) Bajra Atta Kg. - - - - -
5. Maize:
( a ) Maize whole Kg. 13.88 - - 13.37 -
(b) Maize Atta Kg. - - - - -
6. Ragi Kg. - 25.53 - - -
7. Arhar Dal Kg. 72.73 72.44 - 71.30 72.29
8. Groundnut Oil Litre 130.41 105.59 - - -
9. Mustard Oil Litre 84.69 - 109.44 81.59 88.78
10. Goat Meat/Mutton Kg. 296.57 398.37 394.44 295.80 353.14
11. Fish Fresh Kg. - 126.04 184.44 117.49 148.31
12. Milk Litre 32.98 25.77 31.44 32.26 26.33
13. Onion Kg. 57.40 52.92 62.56 55.81 55.27
14. Chillies Dry 100gm. 11.11 9.46 18.44 12.07 13.14
15. Potato Kg. 15.43 22.54 19.33 13.05 10.44
16. Sugar Kg. 27.89 13.63 13.50 19.03 36.58
17. Gur Kg. 39.78 50.93 48.78 37.95 39.96
18. Tea Leaf 100 gm. 20.55 41.21 16.11 27.83 19.54
19. Firewood 40. Kg. 181.43 168.58 127.50 223.72 182.22
20. Kerosene Oil Litre 15.66 14.01 15.33 15.50 14.82
Note:-The prices are average prices based on individual quotations obtained from the selected outlets of the
sample villages of a given State and are not comparable with each other due to their varying
specifications. Besides, the prices of all the items utilized in compilation of C.P.I. Numbers. for
Rural Labourers are not being published due to resource constraints.

Indian Labour Journal, December 2013
1267
2. WAGES AND EARNINGS
Table A.2.1 (a) - Average Daily Wage Rates for Agricultural Occupations in Rural India during
September, 2013 (By States and Sex).
( in Rupees)
Sl.
No
States Ploughing Sowing
Men Women Children Men Women Children
1 2 3 4 5 6 7 8
1 Andhra Pradesh 272.55 @ - 197.59 168.13 -
2 Assam 195.30 @ - 174.36 150.67 -
3 Bihar 196.84 - - 181.29 153.67 @
4 Gujarat 164.14 - - 142.17 119.38 -
5 Haryana 377.60 - - 296.67 @ -
6 Himachal Pradesh 317.50 - - 275.83 @ -
7 Jammu & Kashmir 280.56 - - 280.56 - -
8 Karnataka 251.61 @ - 206.04 139.58 @
9 Kerala 592.67 - - 511.60 @ -
10 Madhya Pradesh 146.67 @ - 133.90 108.33 -
11 Maharashtra 221.82 130.00 - 202.50 123.42 -
12 Manipur 240.00 @ - 228.33 @ -
13 Meghalaya @ @ - @ @ -
14 Orissa 143.33 - - 130.91 @ -
15 Punjab @ - - @ - -
16 Rajasthan 245.83 - - 208.00 @ -
17 Tamil Nadu 359.74 - - 253.21 173.33 -
18 Tripura 168.89 - - 168.89 - -
19 Uttar Pradesh 177.88 @ - 191.36 142.14 -
20 West Bengal 261.80 @ - 185.21 177.44 @
All India 228.99 138.77 - 197.02 153.76 @

Indian Labour Journal, December 2013
1268
Table A.2.1 (a) Contd.
Sl. No States Weeding Transplantng
Men Women Children Men Women Children
1 2 9 10 11 12 13 14
1 Andhra Pradesh 183.03 138.41 @ 193.81 158.65 -
2 Assam 167.92 @ - 167.56 165.56 -
3 Bihar 158.05 139.68 @ 172.50 146.16 @
4 Gujarat 128.04 121.35 - 122.00 117.00 -
5 Haryana 290.67 @ - 293.33 298.00 -
6 Himachal Pradesh @ @ - - - -
7 Jammu & Kashmir 326.67 - - 281.88 - -
8 Karnataka 196.40 137.79 @ 203.42 134.75 -
9 Kerala @ 341.96 - @ 320.85 -
10 Madhya Pradesh 124.20 109.36 @ 131.14 117.25 @
11 Maharashtra 176.00 125.13 @ 161.88 118.82 -
12 Manipur 225.00 @ - 231.43 216.00 -
13 Meghalaya 175.00 118.75 @ @ @ @
14 Orissa 155.93 132.33 - 169.12 143.59 -
15 Punjab @ - - - - -
16 Rajasthan 207.92 196.50 - @ @ -
17 Tamil Nadu @ 152.92 @ @ 163.49 @
18 Tripura 168.89 - - 168.89 - -
19 Uttar Pradesh 178.78 158.52 @ 164.57 146.19 @
20 West Bengal 185.96 177.58 @ 181.58 174.23 @
All India 175.43 151.42 112.81 179.42 160.30 114.23

Indian Labour Journal, December 2013
1269
Harvesting Winnowing Threshing
Men Women Children Men Women Children Men Women Children
15 16 17 18 19 20 21 22 23
217.44 143.84 - @ @ - @ @ -
182.50 155.00 - - - - @ @ -
169.99 158.12 @ 154.89 131.67 - 134.44 123.13 -
134.62 125.83 - 129.12 128.33 - 138.57 157.00 -
302.00 @ - @ @ - 312.00 @ -
275.83 @ - - - - - - -
286.50 - - @ - - @ - -
202.25 136.32 @ 205.00 148.57 - 188.57 138.57 -
366.19 325.00 - - @ - @ @ -
152.14 134.75 @ - - - 211.00 @ -
218.00 145.33 - @ @ - 208.33 115.00 -
238.33 210.00 - 226.00 @ - @ @ -
@ @ - - - - - - -
@ @ - @ @ - @ @ -
@ @ - - - - @ - -
214.58 196.36 - - - - @ @ -
240.48 149.96 @ 210.37 140.63 - 150.56 116.00 -
168.89 - - 168.89 - - - - -
190.31 148.93 @ 149.17 @ - @ @ -
187.61 173.34 @ 182.24 165.00 - 184.13 162.33 -
199.50 163.70 115.02 182.25 151.84 - 193.57 161.22 -
- = Indicates that the particular category of workers, i.e. men/women/children were not engaged
in that operation either because of their non-availability; or the activity connected with the
occupation was not undertaken in the State; or the activity was out of season in the State, etc.

Indian Labour Journal, December 2013
1270
Table A.2.1 (a) Concld.
Sl.
No
States Picking* Herdsman
Men Women Children Men Women Children
1 2 24 25 26 27 28 29
1 Andhra Pradesh @ 161.68 @ 137.95 - @
2 Assam - - - - - @
3 Bihar @ @ - 114.40 @ 81.77
4 Gujarat 147.27 142.73 - 129.44 @ -
5 Haryana 284.00 @ - @ - -
6 Himachal Pradesh @ @ - - - -
7 Jammu & Kashmir
- - - - - -
8 Karnataka @ @ - 204.00 @ -
9 Kerala - - - - - -
10 Madhya Pradesh - - @ 90.17 72.20 62.49
11 Maharashtra @ @ - 133.92 104.17 123.75
12 Manipur - - - 198.57 - -
13 Meghalaya @ @ - @ - -
14 Orissa 140.00 @ - 100.00 @ @
15 Punjab @ @ - - - -
16 Rajasthan - @ - 171.11 @ -
17 Tamil Nadu @ @ - - - -
18 Tripura - - - - - -
19 Uttar Pradesh @ @ - @ - -
20 West Bengal @ - - @ - 76.67
All India 181.58 162.00 @ 120.73 88.26 74.87
* = Picking includes picking of cotton bolls/seed pods, jute stalks and tea leaves etc.
@ = Number of quotations are less than five.

Indian Labour Journal, December 2013
1271
Well digging
Cane crushing
Men Women Children Men Women Children
30 31 32 33 34 35
@ - - @ @ -
@ - - - - -
197.12 @ @ 140.83 - -
184.00 @ - @ - -
@ - - @ - -
- - - - - -
- - - - - -
244.44 @ - 201.43 @ -
662.08 - - - - -
140.00 124.17 - - - -
286.82 @ - @ @ -
@ - - @ - -
- - - - - -
206.50 - - @ - -
- - - - - -
335.83 @ - - - -
316.78 @ - 233.57 @ -
- - - - - -
@ - - @ @ -
369.92 - - - - -
301.19 144.00 @ 188.91 131.11 -

Indian Labour Journal, December 2013
1272
A.2.1. (b) – Average Daily Wage Rates for Non-agricultural Occupations in Rural India during
Sl
No
States Carpenter Blacksmith Cobbler
Men Women Children Men Women Children Men Women Children
1 2 3 4 5 6 7 8 9 10 11
1 Andhra Pradesh 252.18 - - 201.07 - @ 144.02 - -
2 Assam 282.04 - - 226.54 - - 196.00 - -
3 Bihar 252.69 - - 214.31 - - 152.33 - -
4 Gujarat 279.44 - - 258.00 - - @ - -
5 Haryana 397.17 - - 325.11 - - @ - -
6 Himachal Pradesh 403.33 - - 358.57 - - - - -
7 Jammu&Kashmir 405.95 - - 392.27 - - - - -
8 Karnataka 266.72 - - 209.38 - - 164.03 - -
9 Kerala 641.67 - - 494.44 - - @ - -
10 Madhya Pradesh 176.25 - - 157.69 - - 129.13 - -
11 Maharashtra 257.98 - - 236.47 - - 172.20 - -
12 Manipur 288.89 - - 230.00 - - 221.25 - -
13 Meghalaya 221.11 - - 205.00 - - 144.29 - -
14 Orissa 260.89 - - 153.57 - - 130.00 - -
15 Punjab 407.07 - - @ - - - - -
16 Rajasthan 351.84 - - 270.00 - - 193.75 - -
17 Tamil Nadu 437.32 - - 315.34 - - 209.44 - -
18 Tripura 210.14 - - 150.00 - - 150.00 - -
19 Uttar Pradesh 307.84 - @ 263.38 - @ 181.67 - -
20 West Bengal 240.36 - - 166.87 - - 150.93 - -
All India 295.18 - @ 225.15 - @ 162.15 - -
- = Indicates that the particular category of workers, i.e. men/ women /children were not
engaged in that operation either because of their non-availability; or the activity connected
with the occupation was not undertaken in the State; or the activity was out of season in the
State, etc.

Indian Labour Journal, December 2013
1273
September, 2013 (By States and Sex)
( in Rupees)
Mason Tractor driver
Men Women Children Men Women Children
12 13 14 15 16 17
303.47 @ - 244.93 - -
292.41 - - 284.00 - -
293.55 - - 188.72 - -
345.40 - - 167.19 - -
411.33 - - 344.67 - -
403.33 - - @ - -
406.19 - - - - -
289.39 - - 213.37 - -
634.38 - - 585.00 - -
223.97 - - 182.80 - -
318.63 - - 248.48 - -
308.75 - - 328.89 - -
243.33 - - - - -
284.20 - - 212.95 - -
417.07 - - 321.00 - -
430.71 - - 283.06 - -
471.50 - - 366.82 - -
230.97 - - 242.08 - -
343.67 - - 216.90 - -
268.92 - - 263.23 - -
327.76 @ - 239.46 - -
@ = Number of quotations are less than five.

Indian Labour Journal, December 2013
1274
Table A.2.1 (b) Concld.
( in Rupees)
Sl
No States Sweeper Unskilled labourers
( Unspecified)
Men Women Children Men Women Children
1 2 18 19 20 21 22 23
1 Andhra Pradesh @ @ - 178.76 126.93 89.72
2 Assam - - - 175.19 145.33 102.86
3 Bihar 116.67 @ - 167.44 143.10 @
4 Gujarat @ @ - 127.80 124.38 -
5 Haryana 247.33 252.00 - 290.08 288.10 -
6 Himachal Pradesh - - - 256.11 266.00 -
7 Jammu & Kashmir - - - 335.53 - -
8 Karnataka 136.00 126.00 - 154.56 103.57 @
9 Kerala - @ - 498.68 349.00 -
10 Madhya Pradesh 124.00 109.29 - 114.49 104.09 74.63
11 Maharashtra 191.67 - - 153.37 107.89 110.00
12 Manipur - @ - 177.78 158.75 -
13 Meghalaya - - - 156.25 101.67 @
14 Orissa @ @ - 156.87 140.21 @
15 Punjab @ @ - 270.67 @ -
16 Rajasthan @ @ - 247.14 215.24 -
17 Tamil Nadu @ @ - 251.66 177.27 @
18 Tripura - - - 164.44 - -
19 Uttar Pradesh 164.29 125.54 @ 180.62 154.44 133.93
20 West Bengal - - - 179.99 162.81 120.95
All India 142.15 126.43 @ 190.49 146.03 99.23
Note:- The average daily wage rates at all-India level are derived by dividing the sum total of
wages by number of quotations of all the states taken together.

Indian Labour Journal, December 2013
1275
3. INDUSTRIAL DISPUTES
Table A.3.1 Sector/Sphere-wise Number of Disputes, Workers involved and Mandays Lost
due to Industrial Disputes during January to September, 2013 (P)
Sphere/
Item Public Sector Private Sector Total
Number of Number of Number of
Dis-
putes
Workers
Involved
Mandays
Lost
Dis-
putes
Workers
Involved
Mandays
Lost
Dis-
putes
Workers
Involved
Mandays
Lost
1 2 3 4 5 6 7 8 9 10
(i) Central Sphere
Strikes 64 509076 968853 5 22507 53554 69 531583 1022407
Lockouts - - - - - - - - -
Strikes &
Lockouts
(Total-i)
64 509076 968853 5 22507 53554 69 531583 1022407
(ii) State Sphere
Strikes 3 158951 265105 53 22170 660612 56 181121 925717
Lockouts - - - 12 3402 520915 12 3402 520915
Strikes &
Lockouts
(Total-ii)
3 158951 265105 65 25572 1181527 68 184523 1446632
Grand Total
(Total-i+ ii)
67 668027 1233958 70 48079 1235081 137 716106 2469039
(P) = Provisional and based on the returns /clarifications received in the Bureau till
31st October, 2013
- = Nil.

Indian Labour Journal, December 2013
1276
Table A.3.2- Industrial Disputes (All Strikes and Lockouts)
during January to September, 2013 (P)
State/Union Territory Number of
Disputes Workers
Involved
Mandays Lost
1 2 3 4
Andhra Pradesh 4 1416 270144 Arunachal Pradesh .. .. .. Assam - - - Bihar 2 20854 86754 Chhattisgarh 8 38463 38485 Goa 2 579 9554 Gujarat 17 50882 118515 Haryana 3 2084 247220 Himachal Pradesh .. .. .. Jammu & Kashmir .. .. .. Jharkhand .. .. .. Karnataka 14 63159 121779 Kerala 31 56543 349883 Madhya Pradesh 7 127898 255796 Maharashtra 5 30405 60810 Manipur - - - Meghalaya - - - Mizoram - - - Nagaland - - - Orissa .. .. .. Punjab 6 161251 340005 Rajasthan 10 56830 196935 Sikkim - - - Tamil Nadu 17 8775 179225 Tripura - - - Uttarakhand .. .. .. Uttar Pradesh 3 23553 47106 West Bengal 8 73414 146828 A & N Islands - - - Chandigarh - - - Dadra & Nagar Haveli - - - Delhi .. .. .. Daman & Diu - - - Lakshadweep .. .. .. Puducherry - - - All India 137 716106 2469039
(P) = Provisional and based on the returns /clarifications received in the Bureau till 31st October,
2013
- = Nil .. = Not reported

Indian Labour Journal, December 2013
1277
SECTION B
SERIAL STATISTICS
N O T E
1 Prices and Price Indices
1.1. Industrial Worker’s Consumer Price Index
B.1.1.1. All-India Consumer Price Index Numbers for Industrial Workers – The All India
Consumer Price Index Numbers (General and Food) on base 1982=100 were being published
since their first release with effect from October, 1988 index replacing the old series on base:
1960=100. The Labour Bureau has released the new series of Consumer Price Index Numbers
for Industrial Workers on base: 2001=100 with the index of January, 2006 which has replaced
the previous series on base: 1982=100. The indices for the old base (1960=100) series can be
derived by multiplying the 1982 series indices by the Linking Factors, which are 4.93 for the
general index and 4.98 for the food index. Similarly, the indices for 1982 series can be derived
by multiplying the 2001 series indices by the Linking factors, which are 4.63 and 4.58 for
General and Food group respectively. The Annual Average (Calendar year 1990 to 2011 as well
as Financial year 1990-91 to 2010-2011) and monthly All India Index Numbers (General&
Food) from September, 2012 to September, 2013 have been presented in Table B.1.1.1.
B.1.1.2. Labour Bureau’s Series of Consumer Price Index Numbers for Industrial Workers – Serial Statistics in respect of Consumer Price Index Numbers for Industrial Workers on base 1982=100 and new series on base: 2001=100 (General Index only) for 78 centres are set out in Table B.1.1.2.
1.2 Consumer Price Index Numbers for Agricultural Labourers B.1.2.1 (a) and (b). All-India Consumer Price Index Numbers for Agricultural and Rural
Labourers (Base: 1986-87=100) – Serial statistics relating to the All-India Consumer Price
Index Numbers (General and Food) for Agricultural and Rural Labourers on base 1986-87=100
separately for Agricultural Years from 1995-96 to 2010-11, Financial Years from 1995-96 to
2011-12 and Calendar Years from 1995 to 2011, alongwith month-wise indices and 12-monthly
moving averages from September, 2012 to September, 2013 are presented in Tables B.1.2.1 (a)
and (b) respectively
B.1.2.2 (a) and (b) Labour Bureau’s Series of Consumer Price Index Numbers for Agricultural
Labourers and Rural Labourers on Base: 1986-87=100 – Serial statistics in respect of
Consumer Price Index Numbers (General Index) for Agricultural Labourers and Rural Labourers
(Base: 1986-87=100) for 20 States are given in Tables B.1.2.2 (a) and (b) respectively

Indian Labour Journal, December 2013
1278
1.3. Urban Non-Manual Employees Consumer Price Index / Consumer Price Index for Urban and Rural Areas
B.1.3. Consumer Price Index Numbers for Urban Non-Manual Employees (Base:1984-85=100) and Consumer Price Index for Urban and Rural Areas on base: 2010=100
Consumer Price Index for Urban Non-Manual Employees on base: 1984-85=100 were compiled and published by the Central Statistical Organisation (CSO), New Delhi. The Price collection for CPI (UNME) was discontinued with effect from April, 2008. As decided by the National Statistical Commission, linked all-India CPI (UNME) numbers for the year 2008 to 2010 are given in Serial Statistics.
The Central Statistics Office (CSO) releases Consumer Price Indices (CPI) on base 2010=100 for all-India and States/UTs separately for rural, urban and combined every month with effect from January, 2011. Consumer Price Index for Urban and Rural areas for the period September, 2012 to September, 2013 have been presented in Table B.1.3.
1.4. Wholesale Price Index
B.1.4. All India Index Numbers of Wholesale prices (Base: 2004-05=100) – The current series of Index Numbers of Wholesale Prices in India on base 2004-05=100 was released w.e.f. September, 2010 by replacing the earlier series. These Index Numbers are compiled and published by the Office of the Economic Adviser, Ministry of Commerce & Industry, Govt. of India, New Delhi. The indices for the period 1991 to 2011 (Annual Averages) and September, 2012 to September, 2013 (Monthly Figures) are set out in Table B.1.4.
2. Wages and Earnings
B.2.1. Earnings(Basic Wage and Dearness Allowance) of the Lowest-paid Workers/Operatives in Cotton Textile Mills – The information concerning earnings of cotton producing Centres/States received from the State Governments, Employers‟ Associations and Individual Units is presented in Table B.2.1. The earnings of workers include minimum basic wage and dearness Allowance by whatever name called. The dearness allowance is linked to the Working Class Consumer Price Index Numbers of different Centres and varies from month to month according to the variation in the index.
3. Industrial Disputes
B.3.1. Industrial Disputes (All Strikes and Lockouts) – Industrial Disputes Statistics for the Years 2006 to 2013 are presented in Table B.3.1

Indian Labour Journal, December 2013
1279
1. PRICES AND PRICE INDICES
1.1 Industrial Workers’ Consumer Price Index
Table B.1.1.1 – All India Consumer Price Index Numbers for Industrial
Workers (General & Food)
Year/
Month
Annual Average Indices for
Calendar Year Twelve monthly
moving average
of General Index
Financial year
General
Index
Food
Index
Year General
Index
Food
Index
I- Base 1982=100 1991 212 222 - 1991-92 219 230 1992 237 251 - 1992-93 240 254 1993 252 265 - 1993-94 258 272 1994 278 296 - 1994-95 284 304 1995 306 331 - 1995-96 313 337 1996 334 359 - 1996-97 342 369 1997 358 380 - 1997-98 366 388 1998 405 437 - 1998-99 414 445 1999 424 444 - 1999-2000 428 446 2000 441 452 - 2000-01 444 453 2001 458 462 - 2001-02 463 466 2002 477 474 - 2002-03 482 477 2003 496 490 - 2003-04 500 495 2004 514 504 - 2004-05 520 506 2005
536 520 - 2005-06* 540 526 II- Base 2001=100
2006 123 122 2006-07 125 126 2007 131 134 2007-08 133 136
2008 142 149 2008-09 145 153
2009 157 169 2009-10 163 176 2010 176 190 2010-11 180 194
2011 192 204 2011-12 195 206
2012 Sept 215 232 204
Oct 217 233 206
Nov. 218 235 208
Dec 219 235 209
2013 Jan 221 235 211 Feb 223 238 213
Mar 224 240 215
Apr 226 245 217
May 228 248 219
June 231 255 221
July 235 259 223
Aug 237 262 225
Sept 238 263 226
*The Financial year average is based on 9 months from April, 2005 to Dec., 2005

Indian Labour Journal, December 2013
1280
Table B.1.1.2- Labour Bureau‟s Series of Consumer Price Index Numbers of Industrial Workers
(General Index)
Year/
month
Godavari
khani
Guntur Hyderabad Vijaya
wada
Vishakha-
pattanam
Warrangal DoomDooma
Tinsukia
Base Year 1960= 100 1960= 100 1960= 100
L. Factor 5.60 5.23 * * 4.05
1 2 3 4 5 6 7 8
I- Base-1982=100
1991 208 203 210 202 195
1992 239 227 238 237 216
1993 256 237 249 243 233
1994 281 258 264 274 255
1995 305 283 293 300 281
1996 332 308 319 324 309
1997 356 331 343 344 320
1998 394 377 388 399 362
1999 414 395 410 415 386
2000 431 419 436 440 389
2001 438 438 444 464 384
2002 473 468 469 501 398
2003 504 496 484 526 416
2004 510 512 501 530 430
2005 523 532 525 555 450
II. Base 2001=100
Linking Factor
with previous
base: 1982=100 * 4.57 4.79 * 4.64 4.75 4.04
2006 125 120 116 119 119 123 116
2007 135 126 123 126 126 133 125
2008 150 139 135 137 135 149 133
2009 169 161 152 161 153 172 147
2010 193 181 165 180 173 199 160
2011 200 194 174 188 192 204 170 2012 Sept 222 206 193 214 218 229 187
Oct 222 210 195 216 220 230 190 Nov 223 215 197 222 223 233 194 Dec 224 217 198 222 223 234 189
2013 Jan 233 219 199 223 223 239 191 Feb 235 218 200 229 226 239 191 Mar 237 223 200 228 225 238 191 Apr 233 223 202 230 227 239 189
May 235 227 206 234 231 245 189 June 240 235 210 240 236 251 190 July 249 236 210 239 237 250 193 Aug 250 241 211 239 240 252 198 Sept 243 243 211 239 247 252 200

Indian Labour Journal, December 2013
1281
Guwa
hati
Labac
Silchar
Mariani
Jorhat
Rangapara
Tezpur
Monghyr
Jamalpur
Chandigarh Bhilai
1960= 100 1960= 100 1960= 100 1960= 100 * 1966= 100
* 3.96 3.95 4.29 5.29 3.49 9 10 11 12 13 14 15
208 193 205 209 212 216 196 235 217 229 230 234 236 214 252 233 244 246 242 252 229 280 251 264 266 267 271 250 312 274 296 295 288 294 272 341 295 324 323 316 315 302 357 312 339 340 331 345 323 405 345 389 390 379 401 361 436 375 416 412 415 447 373 460 370 418 408 416 460 390 471 372 411 419 416 488 407 480 374 411 417 435 514 413 496 383 432 427 459 526 439 516 411 441 433 479 560 459 531 415 449 439 511 615 480
4.80 3.65 4.01 4.17 4.30 5.26 4.20
115 121 116 114 126 125 121
120 130 127 126 134 131 132
128 143 133 131 145 140 145
143 155 147 144 162 155 162
156 178 158 154 182 175 180
168 186 171 163 199 197 206
188 201 188 178 219 221 250
190 205 192 181 225 220 250
193 209 193 181 224 219 250
192 206 192 179 222 219 250
193 204 190 179 222 225 251
190 204 189 179 229 224 251
191 205 187 178 230 225 251
191 204 191 180 230 226 257
193 208 192 180 232 226 261
195 211 192 182 234 226 269
197 212 193 188 239 233 272
202 216 196 188 242 236 274
204 225 197 190 244 239 272

Indian Labour Journal, December 2013
1282
Table B.1.1.2 Contd.
Year/
month
Delhi Goa Ahmedabad
Bhavnagar Rajkot Surat Vadodra
Base Year 1960= 100 1966= 100 1960= 100 1960= 100
L. Factor 4.97 3.40 4.78 4.99 * * * 1 16 17 18 19 20 21 22
I- Base-1982=100 1991 218 223 218 220 215 229 218 1992 247 257 241 244 237 252 240 1993 272 285 250 259 246 260 252 1994 299 310 279 294 276 292 278 1995 327 339 303 318 296 320 303 1996 346 373 333 350 332 356 332 1997 380 416 357 373 350 373 350 1998 447 451 399 425 393 417 385 1999 480 482 422 447 409 432 405 2000 514 520 441 466 430 446 430 2001 529 555 460 483 433 474 453 2002 550 577 476 492 447 484 467 2003 570 592 488 504 457 490 470 2004 598 614 507 523 465 490 485 2005 648 634 519 537 496 505 500
II. Base 2001=100
Linking Factor
with previous
base: 1982=100 5.60 5.59 4.62 4.76 4.38 4.54 4.39
2006 122 121 120 119 118 118 120
2007 128 130 129 129 126 127 127
2008 137 144 138 135 132 134 133
2009 147 164 151 147 146 146 147
2010 163 188 171 174 174 162 167
2011 176 203 186 189 193 174 180
2012 Sept 197 230 214 211 222 199 203
Oct 198 227 213 211 225 199 203
Nov. 198 227 214 211 224 199 205
Dec 199 229 215 213 225 199 205
2013 Jan 200 237 220 213 227 207 208
Feb 202 241 222 214 227 207 209
Mar 204 244 222 217 229 207 210
Apr 206 247 226 219 230 211 210
May 200 251 227 218 230 212 215
June 203 252 232 219 232 217 215
July 210 260 240 223 232 226 223
Aug 215 255 241 228 233 224 227
Sept 216 247 237 223 231 224 226

Indian Labour Journal, December 2013
1283
Faridabad Yamuna-nagar
Himachal
Pradesh
Srinagar Bokaro Giridih Jamshedpur
1960= 100 1965= 100 1960= 100 1960= 100
* 5.53 3.75 5.47 4.68
23 24 25 26 27 28 29
201 201 205 202 204
224 218 226 231 226 244 235 244 252 239
268 259 268 271 260 295 292 292 303 280
326 315 314 321 321 359 335 340 347 340
426 378 386 414 385
435 392 407 471 397 443 412 430 480 405
469 428 447 520 419 480 443 454 547 431
499 462 466 574 456
532 486 488 599 479 550 521 510 632 508
4.79 4.34 4.53 5.62 * * 4.23
122 127 120 118 121 134 126
130 133 126 125 130 146 132
145 145 135 134 142 156 142
160 162 147 155 158 177 157
182 183 161 159 168 204 182
194 197 172 172 192 232 213
212 221 195 193 216 258 237
213 222 195 195 217 259 239 214 225 196 196 217 260 239
210 224 196 194 217 262 237 212 225 198 194 217 262 239
216 226 199 198 219 263 241
218 228 199 197 219 264 242
219 230 201 199 220 272 243
219 227 205 195 219 272 246
221 228 208 199 226 273 251
215 228 213 206 232 289 255
217 230 214 205 232 292 255
218 231 215 208 232 293 260

Indian Labour Journal, December 2013
1284
Table B.1.1.2 Contd.
Year/
month
Jharia Kodarma Ranchi Hatia Bangalore Belgaum Hubli Dharwar
Base Year 1960= 100 1960= 100 1960= 100
L. Factor 4.63 5.43 * 5.66 * * 1 30 31 32 33 34 35
I- Base-1982=100 1991 198 192 214 204 218 215 1992 218 215 233 230 243 246 1993 226 228 247 248 256 259 1994 244 248 269 272 285 280 1995 262 265 292 305 327 314 1996 286 290 320 331 353 337 1997 301 310 340 361 380 362 1998 353 359 402 391 423 409 1999 363 379 414 405 457 430 2000 363 368 418 425 473 434 2001 365 373 426 438 486 451 2002 374 388 433 452 514 471 2003 393 402 438 476 535 494 2004 414 426 470 501 563 520 2005 442 471 497 533 588 544
II. Base 2001=100 Linking. Factor
with previous base: 1982=100 3.72 3.89 4.20 4.51 5.02 4.71
2006 126 132 125 125 125 123
2007 136 140 133 136 133 132
2008 146 149 148 150 144 147
2009 161 169 170 167 162 164
2010 180 190 199 181 179 182
2011 198 215 220 194 200 200
2012 Sept 231 245 248 211 221 224
Oct 235 249 249 220 215 220
Nov. 239 249 249 220 220 224
Dec 237 247 249 219 222 234
2013 Jan 247 250 252 223 225 234
Feb 253 249 257 226 232 237
Mar 251 247 257 233 228 236
Apr 253 249 257 236 239 239
May 253 253 258 237 241 245
June 257 258 261 242 246 248
July 266 269 266 242 249 255
Aug 267 270 272 243 252 256
Sept 269 270 275 243 249 255

Indian Labour Journal, December 2013
1285
Mercara Mysore ErnakulamAluva
Mundakayam Quilon Bhopal
Chhindwara Indore
1960= 100 1960= 100 1960= 100 1966= 100 1960= 100
* 5.19 4.67 * 5.46 2.59 5.18 36 37 38 39 40 41 42 43
229 220 230 227 248 241 250 243 243 249 252 268 263 267 269 273 278 288 291 284 292 304 311 314 325 312 314 315 339 348 355 362 351 344 344 375 371 384 391 377 359 356 418 404 419 395 436 403 406 444 423 443 428 444 419 425 458 442 453 449 451 420 445 457 458 451 457 488 429 470 458 478 469 486 510 437 488
474 490 489 522 525 448 511 491 515 500 533 537 460 521 495 542 514 546 561 474 537
4.47 * 4.52 4.37 4.61 4.83 4.03 4.73
114 123 125 124 126 127 127 122
121 130 131 130 129 135 137 131
135 142 142 145 143 145 150 140
154 160 153 159 154 161 162 152
172 174 167 174 172 185 177 168
188 187 185 191 195 205 195 181
216 204 203 220 208 228 229 206
218 206 204 221 209 228 228 208
219 213 205 224 213 227 227 209
221 218 212 231 221 225 231 207
223 221 215 235 222 225 231 210
226 225 218 238 224 226 236 212
230 226 218 243 230 228 236 213
236 239 221 246 230 231 234 218
239 243 222 251 231 233 237 220
243 245 226 255 235 235 238 220
243 244 229 258 241 242 242 226
245 247 227 258 239 244 250 227
247 252 229 255 242 245 251 227

Indian Labour Journal, December 2013
1286
Table B.1.1.2 Contd.
Year/
month
Jabalpur Mumbai Nagpur Nasik Pune Solapur Angul Talcher
Base Year 1949= 100 1960= 100 1960= 100 1960= 100
L. Factor 6.41 5.12 4.99 * * 5.03 44 45 46 47 48 49 50 I- Base-1982=100
1991 232 226 223 228 217 224 1992 254 255 253 255 253 260 1993 272 273 268 270 266 264 1994 301 306 292 296 296 289 1995 315 339 314 322 330 327 1996 339 363 342 353 359 357 1997 356 400 370 377 388 371 1998 409 453 427 423 448 431 1999 435 468 438 432 466 450 2000 446 505 461 465 493 467 2001 458 528 483 498 516 471 2002 468 558 495 514 528 486 2003 488 583 503 532 554 501 2004 508 604 524 554 574 529 2005 540 611 554 576 589 539
II. Base 2001=100 Linking. Factor with previous base: 1982=100
4.53 5.18 4.68 4.94 4.96 4.73 *
2006 128 126 130 124 127 123 120
2007 135 134 140 130 136 139 128
2008 148 144 151 139 146 149 143
2009 159 159 174 157 162 160 160
2010 184 174 203 181 181 179 181
2011 198 192 220 204 200 199 200
2012 Sept 220 219 249 233 222 218 228
Oct 220 221 249 233 224 222 230
Nov. 220 222 247 235 224 225 229
Dec 219 223 246 234 225 223 229
2013 Jan 220 224 250 234 227 222 232
Feb 221 226 254 234 228 225 234
Mar 224 228 254 234 227 231 233
Apr 225 229 256 235 230 233 233
May 228 231 264 242 232 234 235
June 230 238 266 243 240 235 237
July 235 241 272 246 239 241 243
Aug 236 244 278 248 244 244 246
Sept 237 244 274 247 242 245 245

Indian Labour Journal, December 2013
1287
Table B.1.1.2 contd.
Rourkela Pondicherry Amritsar Jalandhar Ludhiana Ajmer Bhilwara Jaipur
1966= 100 1960= 100 1960= 100 1966=100 1960= 100
3.59 * 5.19 * 5.01 3.20 5.17
51 52 53 54 55 56 57 58
194 229 204 207 217 215 210 216 256 220 219 243 240 228 232 279 238 237 253 253 245 254 313 261 262 280 290 269 275 344 278 285 305 310 291 303 387 298 301 332 333 321 341 428 314 320 357 350 346 390 464 369 374 392 393 387 396 467 379 381 411 420 390 406 477 388 396 433 439 403 407 482 403 413 452 460 423 416 510 418 431 472 474 442 432 543 431 441 487 488 452 453 556 452 469 510 505 467 473 580 492 504 537 532 495
4.03 4.88 4.09 * 4.12 4.78 4.62 4.25
124 123 130 126 129 122 125 127
137 130 139 131 134 129 133 134
149 146 149 141 146 138 144 145
166 163 163 155 160 152 158 159
186 173 190 174 175 175 176 179
204 184 208 190 188 191 192 192
230 216 235 209 212 221 219 222
232 216 235 211 214 221 221 222
233 218 235 211 213 222 221 221
230 220 232 213 212 221 222 222
229 220 234 212 215 224 224 226
233 225 233 217 216 224 224 227
233 226 235 218 216 227 228 227
237 234 238 222 217 230 231 225
241 237 236 219 216 229 230 224
242 239 235 221 216 232 231 224
248 242 243 227 223 236 236 232
251 243 244 229 227 238 240 233
254 243 246 230 228 238 246 232

Indian Labour Journal, December 2013
1288
Table B.1.1.2 Contd.
Year/
month
Chennai
Coimbatore Coonoor
Madurai Salem Tiruchira-pally
Base Year 1960= 100 1960= 100 1960= 100 1960= 100 * *
L. Factor 5.05 5.35 4.80 5.27 59 60 61 62 63 64
I- Base-1982=100 1991 208 197 217 209 198 215
1992 238 228 245 240 223 240 1993 258 245 262 256 241 259
1994 287 272 291 281 287 295
1995 330 303 325 318 322 330 1996 356 330 348 346 348 364
1997 382 354 377 366 364 406 1998 425 383 404 401 394 435
1999 446 402 414 423 414 463 2000 475 432 433 440 432 481
2001 487 441 445 446 443 488
2002 513 472 473 459 464 533 2003 533 495 497 482 483 568
2004 549 500 501 496 482 544 2005 565 508 511 509 481 579
II. Base 2001=100 Linking. Factor with previous base 1982=100
4.95 4.49 4.58 4.51 4.45 5.01
2006 118 119 115 116 114 119
2007 124 127 122 121 122 126
2008 135 137 134 134 134 141
2009 149 151 148 147 151 156
2010 161 166 168 162 163 174
2011 171 176 182 174 172 184
2012 Sept 202 198 209 200 193 213
Oct 200 202 208 203 197 216
Nov. 203 207 211 207 201 221
Dec 206 209 212 209 200 218
2013 Jan 209 212 214 211 200 220
Feb 211 208 215 211 202 226
Mar 209 210 215 211 209 231
Apr 210 213 220 212 213 229
May 218 216 226 218 217 230
June 222 215 228 223 220 233
July 222 217 225 218 219 231
Aug 221 218 226 218 221 237
Sept 221 220 228 220 223 236
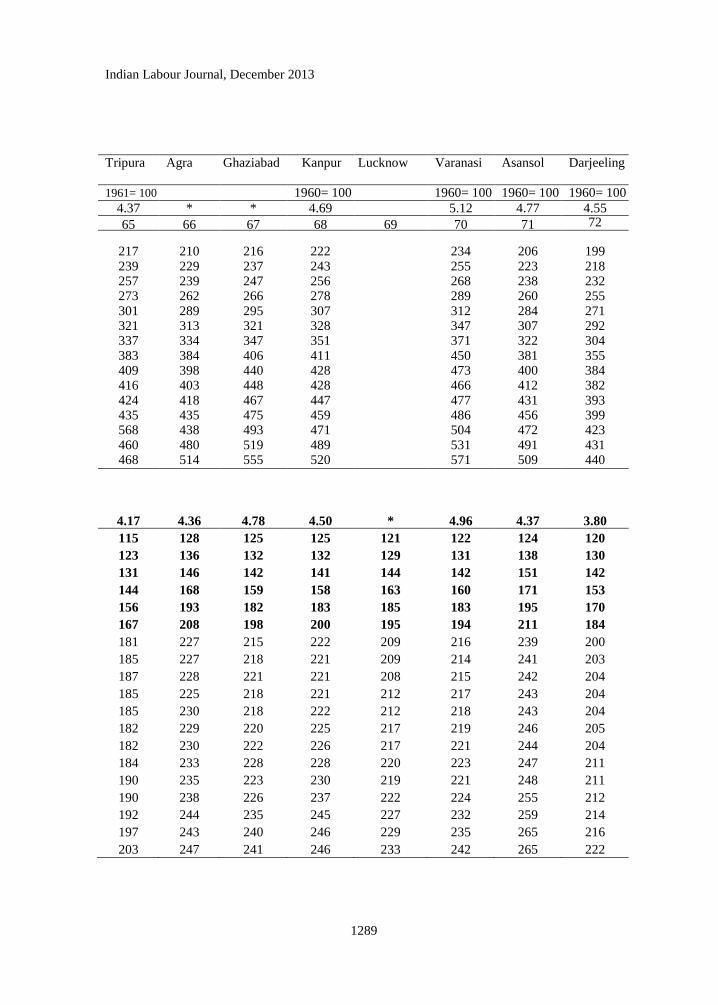
Indian Labour Journal, December 2013
1289
Tripura Agra Ghaziabad Kanpur Lucknow Varanasi Asansol
Darjeeling
1961= 100 1960= 100 1960= 100 1960= 100 1960= 100
4.37 * * 4.69 5.12 4.77 4.55
65 66 67 68 69 70 71 72
217 210 216 222 234 206 199 239 229 237 243 255 223 218 257 239 247 256 268 238 232 273 262 266 278 289 260 255 301 289 295 307 312 284 271 321 313 321 328 347 307 292 337 334 347 351 371 322 304 383 384 406 411 450 381 355 409 398 440 428 473 400 384 416 403 448 428 466 412 382 424 418 467 447 477 431 393 435 435 475 459 486 456 399 568 438 493 471 504 472 423 460 480 519 489 531 491 431 468 514 555 520 571 509 440
4.17 4.36 4.78 4.50 * 4.96 4.37 3.80
115 128 125 125 121 122 124 120
123 136 132 132 129 131 138 130
131 146 142 141 144 142 151 142
144 168 159 158 163 160 171 153
156 193 182 183 185 183 195 170
167 208 198 200 195 194 211 184
181 227 215 222 209 216 239 200
185 227 218 221 209 214 241 203
187 228 221 221 208 215 242 204
185 225 218 221 212 217 243 204
185 230 218 222 212 218 243 204
182 229 220 225 217 219 246 205
182 230 222 226 217 221 244 204
184 233 228 228 220 223 247 211
190 235 223 230 219 221 248 211
190 238 226 237 222 224 255 212
192 244 235 245 227 232 259 214
197 243 240 246 229 235 265 216
203 247 241 246 233 242 265 222

Indian Labour Journal, December 2013
1290
Table B.1.1.2 Concld.
Year/
month
Durgapur
Haldia Howrah Jalpaiguri Kolkata Raniganj Siliguri Base Year 1960= 100 1960= 100 1960= 100 1960=
100
L. Factor * * 4.12 4.16 4.74 4.40 73 74 75 76 77 78 79
I- Base-1982=100 1991 221 228 230 199 218 201 1992 242 248 253 221 238 218 1993 262 268 271 232 257 229 1994 286 288 293 252 280 249 1995 312 328 323 280 312 274 1996 346 359 346 299 340 298 1997 368 385 364 312 359 314 1998 430 433 439 379 416 357 1999 443 464 482 399 437 373 2000 472 481 499 400 451 380 2001 509 533 519 407 492 399 2002 553 582 542 417 530 416 2003 564 590 556 421 541 426 2004 581 608 587 440 565 450 2005 592 624 620 452 587 471
II. Base 2001=100
Linking. Factor with previous
base 1982=100 5.13 5.64 5.42 3.96 5.12 4.02 *
2006 121 116 121 117 121 124 124
2007 130 124 130 125 132 132 135
2008 140 131 139 136 142 140 144
2009 155 144 154 150 156 156 156
2010 178 161 171 167 172 169 173
2011 193 185 183 179 185 180 187
2012 Sept 226 217 206 200 205 201 201
Oct 228 219 207 204 207 203 207
Nov. 230 219 207 205 210 204 208
Dec 230 219 205 201 209 203 207
2013 Jan 248 223 205 205 208 203 207
Feb 247 223 207 205 209 203 203
Mar 252 224 206 206 210 204 207
Apr 255 226 212 212 214 207 208
May 256 228 213 212 218 211 208
June 257 230 214 219 220 212 215
July 267 231 214 223 222 216 217
Aug 268 233 218 230 228 217 224
Sept 273 236 219 230 230 220 225
* No Linking Factor as these centres were not covered in any of the earlier series Linking Factor - Figures on previous base : 1982=100 and 1960=100 (General Index) can be obtained by multiplying the index numbers of new base: 2001=100 by the respective linking factors given against each centre and rounding off the result to the nearest whole number.

Indian Labour Journal, December 2013
1291
1.2 Consumer Price Index Numbers for Agricultural and Rural Labourers
Table B.1.2.1 (a)-Year-wise All India Average Consumer Price Index Numbers for Agricultural
Labourers ( General & Food on Base:1986-87=100 ) Year/ Month
Annual Average Indices for Agricultural Year
Twelve Monthly moving average of General Index
Financial Year Calendar Year
General Index
Food Index
General Index
Food Index
Year General Index
Food Index
1 2 3 4 5 6 7 8 9 1995-96 240@ 242@ - 237
@@ 239 @@
1995 239$ 242$
1996-97 260 264 - 256 260 1996 249 253 1997-98 269 269 - 264 264 1997 262 262 1998-99 299 305 - 293 299 1998 287 293 1999-2000 309 314 - 306 312 1999 304 310 2000-2001 304 299 - 305 303 2000 307 307 2001-2002 311 304 - 309 302 2001 307 300 2002-2003 2003-2004
323 332
316 326
- -
318 331
312 325
2002 2003
315 328
308 322
2004-2005 342 335 - 340 333 2004 337 331 2005-2006 358 351 - 353 345 2005 348 341 2006-2007 388 384 - 380 376 2006 372 366 2007-2008 2008-2009
417 462
416 464
- -
409 450
406 452
2007 2008
402 439
400 440
2009-2010 530 540 - 513 522 2009 494 500 2010-2011 577 582 564 572 2010 553 562 2011-2012 622 610 611 602 2011 602 598 2012-2013 692 679 672 658 2012 652 638 2012-2013 September 673 663 636
October 680 668 641
November 685 672 647
December 688 674 652
January 694 679 659
February 700 686 665
March 704 689 672
April 711 695 678
May 719 704 685
June
2013-2014
729
718 692
July 740 732 699
August 754 747 706
September 759 751 714
Note: -(i) Agricultural Year ( July to June ). (ii) Financial Year ( April to March ). (iii) New series of Consumer Price Index Numbers for Agricultural Labourers on Base: 1986-
87=100 released w.e.f. November, 1995. To obtain indices on Base : 1960-61=100, the index figures need to be multiplied by the linking factor as below :-
General Index – 5.89 Food Index – 6.38 @ = Average based on 8 months i.e. Nov., 95 to June, 96 only. @@ = Average based on 5 months i.e. Nov., 95 to March, 96 only $ = Average based on 2 months i.e. Nov., 95 and Dec., 95 only.

Indian Labour Journal, December 2013
1292
Table B.1.2.1 ( b)-Year-wise All India Average Consumer Price Index Numbers or Rural Labourers ( General & Food on Base:1986-87=100 )
Year/
Month
Annual Average Indices for
Agricultural
Year
Twelve
Monthly
moving average
of General
Index
Financial Year Calendar Year
General
Index
Food
Index
General
Index
Food
Index
Year General
Index
Food
Index
1 2 3 4 5 6 7 8 9
1995-96 240@ 242@ - 238
@@
240
@@
1995 239$ 242$
1996-97 260 264 - 256 260 1996 250 253
1997-98 270 270 - 266 265 1997 263 263
1998-99 299 305 - 294 300 1998 288 293
1999-2000 310 313 - 307 311 1999 305 310
2000-2001 306 300 - 307 303 2000 308 307
2001-2002 313 305 - 311 303 2001 309 302
2002-2003 325 317 - 321 312 2002 318 309
2003-2004 335 327 - 333 326 2003 331 323
2004-2005 344 335 - 342 333 2004 340 332
2005-2006 360 352 - 355 346 2005 351 341
2006-2007
2007-2008
2008-2009
2009-2010
2010-2011
2011-2012
2012-2013
389
418
462
529
577
623
693
384
416
463
541
582
611
681
-
-
-
-
382
409
451
513
564
611
673
376
406
452
523
573
603
660
2006
2007
2008
2009
2010
2011
2012
373
403
440
494
552
602
654
366
399
440
500
563
599
640 2012-2013 September 673 663 636
October 680 668 641
November 685 672 647
December 688 674 652
January 694 679 659
February 700 686 665
March 704 689 672
April 711 695 678
May 719 704 685
June
2012-2013
730 720 693
July 741 734 700
August 753 748 707
September 759 752 714
Note: -(i) Agricultural Year ( July to June ). (ii) Financial Year (April to March).
(iii) New series of Consumer Price Index Numbers for Rural Labourers on Base: 1986-
87=100 was introduced for the first time w.e.f. November, 1995.
@ = Average based on 8 months i.e. Nov., 95 to June, 96 only.
@@ = Average based on 5 months i.e. Nov., 95 to March, 96 only
$ = Average based on 2 months i.e. Nov., 95 and Dec., 95 only.

Indian Labour Journal, December 2013
1293
Table B.1.2.2.(a)-State-wsie Labour Bureau‟s Series of Consumer Price Index Numbers for
Agricultural Labourers ( General Index on Base: 1986-87=100 )
Agricultural
Year/Month
Andhra
Pradesh
Assam Bihar Gujarat Haryana Himachal
Pradesh
Jammu &
Kashmir
Karnataka
Linking factor 4.84 b 6.22 5.34 * * 5.98 5.81
1 2 3 4 5 6 7 8 9
1995-96 @ 243 244 223 241 235 220 226 251
1996-97 268 259 250 254 265 240 252 266
1997-98 282 281 252 270 278 256 269 276
1998-99 309 311 285 297 306 283 303 306
1999-2000 318 323 300 310 312 294 323 316
2000-2001 317 322 282 314 313 292 326 302
2001-2002 328 320 290 320 322 298 331 309
2002-2003 342 330 299 332 329 308 344 325
2003-2004
2004-2005
347
357
343
347
311
324
339
350
341
359
321
325
345
348
341
340
2005-2006 371 362 347 369 376 343 359 341
2006-2007 401 388 384 403 403 367 392 367
2007-2008 430 417 411 424 447 376 413 406
2008-2009 484 451 446 459 498 406 453 458
2009-2010 552 520 500 538 588 455 524 535
2010-2011 603 580 532 583 642 484 568 595
2011-2012 668 622 552 627 690 513 608 665
2012-2013 733 682 617 694 765 555 671 750
2012-2013
September 703 674 603 676 757 555 654 713
October 710 681 609 677 756 556 660 725
November 718 682 611 683 759 559 665 739
December 725 681 610 683 763 556 669 746
January 734 688 619 691 765 554 676 758
February 749 691 627 698 773 556 682 765
March 752 688 634 707 775 555 688 767
April 758 686 640 718 784 557 689 775
May 771 692 629 726 788 560 694 792
June
2013-2014
789 691 636 735 792 566 695 808
July 793 702 649 749 802 583 701 822
August 812 710 661 769 817 591 708 838
September 819 723 671 778 836 608 721 832

Indian Labour Journal, December 2013
1294
Table B.1.2.2.(a)-Concld.
Agricultural
Year/Month
Kerala Madhya
Pradesh
Maharashtra Manipur Meghalaya Orissa
Linking factor 6.56 6.04 5.85 * * 6.05
1 10 11 12 13 14 15
1995-96 @ 259 237 248 244 252 236
1996-97 281 261 256 252 264 254
1997-98 292 273 266 268 282 262
1998-99 305 300 291 292 321 289
1999-2000 312 313 304 312 338 316
2000-2001 321 310 303 316 346 304
2001-2002 321 310 306 304 351 300
2002-2003 330 318 321 300 343 298
2003-2004
2004-2005
342
351
318
330
335
350
308
310
350
360
314
320
2005-2006 356 352 368 328 382 334
2006-2007 374 388 402 337 410 365
2007-2008 403 412 432 367 439 400
2008-2009 454 459 475 407 484 438
2009-2010 496 525 562 455 540 495
2010-2011 562 569 619 527 576 538
2011-2012 601 615 691 594 633 562
2012-2013 665 679 760 639 706 631
2012-2013
September 630 668 749 629 698 612
October 640 675 756 631 704 620
November 652 673 763 633 708 625
December 661 676 768 632 709 626
January 670 679 759 634 711 632
February 676 684 761 642 713 636
March 686 688 763 644 715 638
April 698 691 764 650 713 645
May 708 699 773 658 725 657
June
2013-2014
721 702 784 667 721 667
July 732 713 793 677 725 685
August 745 730 808 687 740 699
September 754 733 809 697 752 701
Note:- Agricultural Year ( July to June )
@ = Average based on 8 months i.e. from November, 1995 to June, 1996 only.

Indian Labour Journal, December 2013
1295
Punjab Rajasthan Tamil Nadu Tripura Uttar Pradesh West Bengal
c 6.15 5.67 * 6.60 5.73
16 17 18 19 20 21
244 238 246 220 232 230
263 261 261 240 264 247
278 268 264 263 268 259
306 290 291 312 298 308
314 310 302 331 307 303
316 311 299 324 301 292
326 309 311 322 312 303
331 325 344 325 323 305
343
355
323
346
349
347
326
337
331
343
321
333
380 377 355 351 371 342
417 413 371 383 408 365
448 439 403 407 433 395
501 490 455 433 469 432
586 573 514 466 535 504
624 608 565 514 566 561
685 668 605 548 595 592
756 749 686 587 672 655
743 728 653 581 672 641
749 734 662 590 674 647
752 739 666 589 671 651
749 746 681 588 667 652
755 758 686 587 671 660
760 765 696 583 676 658
765 768 709 591 677 658
772 773 722 592 681 663
775 776 733 597 684 682
785
780 765 601 699 690
793 788 751 619 714 703
814 807 758 629 719 715
826 814 764 647 721 722
* = Indices for the State compiled and published for the first time w.e.f. November, 1995.
b & c = To obtain linking factors for Assam and Punjab on Base 1986-87=100, please consult
article published in February, 1996 issue of the Indian Labour Journal.

Indian Labour Journal, December 2013
1296
Table B.1.2.2 (b).-State-wise Labour Bureau‟s Series of Consumer Price Index Numbers for
Rural Labourers ( General Index Base: 1986-87=100 )
Agricultural
Year/Month
Andhra
Pradesh_
Assam Bihar Gujarat Haryana Himachal
Pradesh
Jammu &
Kashmir
Karnataka
1 2 3 4 5 6 7 8 9
1995-96 @ 244 243 223 241 237 221 225 250
1996-97 269 258 250 254 266 240 250 266
1997-98 282 278 254 270 279 258 266 276
1998-99 309 310 287 298 306 284 297 306
1999-2000 318 321 302 311 312 295 316 316
2000-2001 318 321 284 315 314 294 319 304
2001-2002 328 320 292 322 323 304 324 311
2002-2003 343 330 301 333 330 314 337 326
2003-2004
2004-2005
348
357
344
348
313
326
341
351
342
361
326
331
340
344
341
340
2005-2006 371 364 348 371 378 350 359 341
2006-2007 401 390 384 403 404 377 393 367
2007-2008 429 419 412 425 445 388 413 407
2008-2009 482 454 447 460 495 420 451 459
2009-2010 550 524 500 538 583 474 521 534
2010-2011 599 583 532 583 638 503 564 594
2011-2012 665 625 555 626 685 535 602 665
2012-2013 732 686 620 692 759 582 668 747
2012-2013
September 702 677 606 675 750 577 649 712
October 709 685 612 676 750 580 655 723
November 717 687 614 681 753 586 660 736
December 724 685 612 682 757 582 666 744
January 733 693 622 690 759 578 674 754
February 747 695 630 697 768 581 681 763
March 751 692 637 706 769 582 687 765
April 757 690 643 715 779 587 687 772
May 769 696 633 723 781 592 692 789
June
2013-2014
787 696 641 733 785 601 693 804
July 791 708 654 745 796 619 700 818
August 809 716 666 765 811 625 705 831
September 815 728 675 775 830 640 721 824

Indian Labour Journal, December 2013
1297
Kerala Madhya
Pradesh
Maharashtra Manipur Meghalaya Orissa
10 11 12 13 14 15
260 239 247 245 250 236
284 262 256 253 263 254
294 274 266 268 281 262
306 300 291 293 319 289
314 314 303 312 336 315
324 313 303 317 343 304
324 314 307 304 348 300
332 323 321 301 340 299
343
352
324
336
336
350
309
311
349
358
314
320
359 358 368 328 379 335
378 392 400 338 408 366
404 415 428 368 436 400
456 463 470 407 481 439
502 532 557 456 535 496
566 576 613 529 572 538
604 622 683 596 629 563
668 688 754 641 701 631
634 676 743 630 692 612
644 684 750 632 698 621
655 682 757 634 702 626
664 687 762 633 702 627
673 689 754 636 706 632
679 693 756 644 707 636
689 696 758 646 710 639
697 699 759 652 708 646
707 709 768 660 720 658
720 712 780 669 716 668
730 722 789 679 719 685
742 739 802 690 734 699
751 745 802 700 745 702

Indian Labour Journal, December 2013
1298
Table B.1.2.2 (b) - Concld.
Agricultural
Year/Month
Punjab Rajasthan Tamil
Nadu
Tripura Uttar
Pradesh
West
Bengal
1 16 17 18 19 20 21
1995-96 @ 247 239 244 219 231 232
1996-97 265 262 260 237 262 248
1997-98 281 270 265 261 267 260
1998-99 309 292 290 308 297 309
1999-2000 317 310 301 328 307 304
2000-2001 320 312 299 318 303 293
2001-2002 330 311 311 316 316 305
2002-2003 336 326 343 318 326 308
2003-2004
2004-2005
347
359
323
345
348
348
318
329
335
346
324
336
2005-2006 384 375 355 344 372 346
2006-2007 419 412 370 373 409 368
2007-2008 449 438 402 399 434 398
2008-2009 501 486 452 429 469 435
2009-2010 585 567 509 462 532 506
2010-2011 622 600 559 512 563 564
2011-2012 681 661 603 547 597 597
2012-2013 749 740 683 586 672 662
2012-2013
September 736 723 652 581 671 647
October 742 727 661 591 673 654
November 745 733 664 591 670 658
December 743 738 678 589 666 659
January 748 749 683 587 671 666
February 753 755 693 581 675 665
March 757 758 704 587 676 664
April 763 760 716 589 681 669
May 768 764 727 592 684 689
June
2013-2014
778
768 737 597 698 697
July 785 776 744 616 712 710
August 804 793 749 624 718 722
September 815 800 755 643 720 731
Note: – Agricultural Year ( July to June )
@ = Average based on 8 months i.e. from November, 1995 to June, 1996 only.

Indian Labour Journal, December 2013
1299
1.3. Urban Non-Manual Employees’ Consumer Price Index
Table B.1.3. All India Consumer Price Index Numbers for Urban Non-Manual Employees
(Base: 1984-85=100)
Year/Month General Index
1 2
1990 156
1991 177
1992 199
1993 212
1994 231
1995 254
1996 276
1997 297
1998 330
1999 348
2000 366
2001 386
2002 402
2003 416
2004 432
2005 451
2006 478
2007 509
2008 548
2009 612
2010 687
Consumer Price Index for Rural and Urban Areas on base: 2010=100*
Year/Month Rural Urban
General Index General Index
2012 September 125.6 121.9
October 126.6 122.6
November 126.9 123.4
December 126.8 124
2013 January 127.3 124.9
February 128.1 125.8
March 128.3 126.5
April 128.7 127.4
May 129.8 128.4
June 132.1 130.5
July 133.8 132.1
August 135.4 133.6
September 137.8 134.0
* New series of CPI has been introduced w.e.f. Jan., 2011 in place of UNME.
Source: Central Statistical Organisation, New Delhi.

Indian Labour Journal, December 2013
1300
1.4. Wholesale Price Index
Table B.1.4 – Index Numbers of Wholesale Prices in India
Year/
Month
All
Commodities
I. Primary Articles II. Fuel Power
Light and
Lubricants All Food
Articles
Non-Food
Articles
Minerals
1 2 3 4 5 6 7
I Base 1981-1982=100
1991 201.4 210.0 230.3 221.8 112.1 193.3 1992 224.7 233.2 266.8 231.6 115.5 219.3 1993 242.1 245.3 281.8 238.5 128.5 254.3 1994 267.4 273.7 303.6 285.5 141.6 278.3 1995 292.4 301.4 331.1 322.1 151.5 284.1 1996 309.0 320.7 362.7 327.0 156.4 311.2 1997 325.6 335.5 384.3 335.1 160.9 355.8 1998 348.2 371.9 431.8 368.2 163.7 380.7 1999 360.3 388.1 454.3 378.9 168.8 403.0
II Base 1993-94=100
2000 152.8 161.5 170.0 144.6 110.2 196.0 2001 160.7 167.0 174.3 152.6 118.4 224.8 2002 164.7 171.7 178.6 158.6 119.4 234.9 2003 173.4 180.0 181.0 182.4 118.3 250.6 2004 184.9 187.5 185.1 190.7 223.8 273.5 2005 193.7 191.3 192.4 180.2 298.6 300.8 2006 203.0 203.4 205.6 182.6 397.4 322.2 2007 212.8 220.8 220.0 206.1 430.1 322.9 2008 232.2 243.0 234.6 234.4 616.4 354.5 2009 237.0 264.0 264.0 237.2 605.9 334.3
III Base: 2004-05 = 100
2010 140.1 175.9 174.6 155.9 244.0 144.2
2011 153.4 197.1 190.4 183.1 299.2 163.3
2012Sep. 168.8 221.6 213.1 203.2 352.2 188.5 Oct. 168.5 219.4 212.7 198.8 339.8 189.8
Nov. 168.8 221.1 213.8 201.4 344.7 188.7 Dec. 168.8 219.9 211.2 203.5 347.0 190.4 2013 Jan. 170.3 223.6 214.7 206.9 353.6 193.4
Feb 170.9 224.4 215.4 206.8 357.8 195.5
Mar 170.6 223.6 214.3 206.9 357.4 195.9
Apr 171.5 228.0 219.8 209.7 355.0 194.6
May 171.6 229.3 223.1 208.5 346.5 192.0 June 172.7 232.5 229.8 208.5 324.9 194.0 July 175.4 238.8 237.7 210.7 328.5 199.8 Aug 177.5 247.8 250.3 209.6 330.9 202.3
Sept. 179.7 251.6 252.3 213.7 352.1 207.5

Indian Labour Journal, December 2013
1301
III Manufactured Products
All Food
Products
Beverages
Tobacco &
Tobacco
Products
Textiles Wood &
Wood
Products
Paper &
Paper
Products
Leather &
leather
Products
Rubber
& Plastic
Products
8 9 10 11 12 13 14 15
198.1 201.1 258.1 183.4 159.5 251.1 234.9 167.9
220.8 221.1 288.7 198.4 273.8 301.0 227.4 183.3
238.0 240.1 302.4 212.7 366.3 324.5 240.1 189.2
261.7 264.4 332.4 246.9 414.6 330.8 256.7 195.3
288.8 278.4 367.9 287.9 438.3 362.3 274.7 228.3
301.9 289.5 387.3 303.0 445.5 377.4 280.6 242.5
314.2 316.4 430.7 307.8 474.8 371.6 287.1 245.5
328.7 340.0 471.5 318.6 598.2 382.7 296.8 247.4
336.6 344.8 501.4 321.2 622.3 395.1 312.2 245.5
140.2 147.2 177.1 118.6 185.1 159.5 151.8 125.3 144.2 144.9 190.7 120.5 172.5 174.1 144.0 125.8 146.6 150.8 202.7 120.0 178.8 172.9 131.0 130.6
154.0 163.0 205.0 128.3 179.2 173.8 142.3 134.4 164.3 173.5 212.8 137.5 179.5 173.7 152.4 135.1 170.6 176.2 223.8 129.7 187.5 177.1 166.0 137.4 176.3 180.7 238.6 131.6 204.7 188.0 162.0 145.4 185.5 186.9 262.9 132.2 215.5 193.6 166.2 156.0 201.2 205.2 287.5 135.8 229.3 200.3 167.2 165.4 205.9 233.6 305.5 143.3 236.8 204.3 166.7 168.6
128.1 140.9 143.1 115.3 147.5 123.1 127.6 123.2
137.5 149.1 159.4 128.8 157.7 130.8 128.3 132.9
148.0 167.3 176.0 131.8 171.0 136.3 134.5 137.7
147.9 166.7 177.2 131.8 171.2 136.5 134.3 137.7
148.0 166.6 176.9 132.2 172.9 137.0 133.1 137.8
148.0 166.7 177.1 132.5 173.5 137.7 135.1 138.6
148.5 166.6 178.4 132.2 173.9 139.4 134.5 139.2
148.6 166.7 178.5 132.8 173.4 139.4 134.1 139.3
148.4 164.9 178.1 132.7 173.5 140.0 134.3 139.4
148.7 165.8 181.2 133.6 174.0 140.0 135.1 139.5
149.1 167.1 181.9 135.0 174.3 140.7 136.1 139.7
149.3 167.7 181.4 135.3 175.3 140.5 138.1 142.4
150.2 168.9 181.8 136.4 175.8 140.5 142.5 144.4
150.0 167.7 181.6 137.3 177.2 140.3 142.3 144.4
151.0 170.0 181.2 138.3 178.4 140.8 145.1 145.8

Indian Labour Journal, December 2013
1302
Table B.1.4 Concld.
Year/ Month III Manufactured Products
Chemicals &
Chemical
Products
Non-metallic
Mineral
Products
Basic Metals
Alloys & Metal
Products
Machinery &
Machine tools
Transport
Equipment and
parts
1 16 17 18 19 20
I Base 1981-82=100
1991 162.4 208.7 231.8 200.4 197.1
1992 186.7 229.4 250.9 226.8 215.5
1993 204.8 248.3 270.8 235.8 222.1
1994 225.1 270.9 293.1 254.6 234.4
1995 246.7 305.4 324.4 280.2 250.5
1996 257.3 331.0 337.4 292.0 263.4
1997 267.3 341.3 346.6 299.4 272.7
1998 277.1 351.0 352.4 303.0 283.1
1999 289.9 369.0 357.6 307.6 295.4
II Base 1993-94=100
2000 161.9 128.4 139.1 120.2 141.1
2001 168.4 145.6 140.9 128.5 146.5
2002 172.0 142.6 143.2 130.0 147.9
2003 176.9 146.7 160.1 132.0 147.0
2004 180.1 154.9 195.5 137.7 152.1
2005 186.9 167.1 218.8 146.1 159.0
2006 192.5 186.4 225.0 152.7 161.8
2007 201.3 204.8 244.6 164.9 164.9
2008 218.2 215.5 285.5 173.4 174.4
2009 224.9 221.9 257.4 172.7 175.6
III Base: 2004-05 = 100 2010 122.1 143.6 137.3 120.3 119.4 2011 132.1 150.3 152.3 124.2 123.6
2012 Sept. 144.0 164.5 167.1 128.4 129.9 Oct. 144.2 164.0 166.6 128.6 130.3
Nov. 144.1 163.1 166.5 128.8 130.8 Dec. 144.5 162.4 165.4 128.9 131.2
2013 Jan. 145.6 164.8 165.3 129.3 131.4
Feb 145.8 165.6 165.1 129.3 132.0
Mar 145.5 167.7 164.8 129.5 132.3
Apr 145.8 166.6 164.3 129.6 132.4
May 146.1 164.8 163.8 130.1 132.1
June 146.0 166.6 163 130.4 132.7
July 147.6 166.4 162.3 131.5 133.2
Aug 147.6 164.3 162.7 130.8 133.7 Sept. 148.7 164.7 163.1 131.1 134.1
Note : Linking factor for deriving the General Indices on base: 1981-82=100 to Base 1993-94 is
2.478 and from base 1993-94=100 to base 2004-05 is for All commodities = 1.873, Primary
article =1.881, Fuel & Power = 2.802, Manufactured products = 1.663
Source: Office of the Economic Adviser, Ministry of Commerce and Industry, New Delhi.

Indian Labour Journal, December 2013
1303
2. WAGES AND EARNINGS
Table B.2.1 – Earnings (Basic Wage, Dearness Allowances) of the Lowest Paid Workers/
Operatives in Cotton Textile Mills for the month of September, 2013.
Year/ Month
Ahmedabad Bangalore Vadodara Mumbai Coimbatore & Chennai
1 2 3 4 5 6
1985 793.15 876.48 766.00 874.54 934.21
1990 1147.88 1379.74 1118.89 1313.78 1507.45
1995 1825.00 2397.19 1792.94 2237.85 2740.68
1996 1996.05 2591.10 1963.43 2389.95 2953.13
1997 2155.88 2840.36 2122.65 2622.11 3178.79
1998 2348.78 3073.17 2314.56 2958.08 3523.80
1999 2543.10 3199.73 2507.78 3084.01 3732.75
2000 2646.28 3353.44 2610.72 3294.36 3954.97
2001 2751.31 3451.66 2715.14 3455.99 4062.23
2002 2849.90 3567.03 2799.20 3642.14 4287.30
2003 2930.80 3749.72 2891.41 3811.69 4438.76
2004 3019.05 3944.89 2981.75 3941.44 4583.10
2005 3100.05 4191.63 3062.36 3996.49 4726.11
2006 3273.76 4447.32 3235.24 4227.16 4859.40
2007 3539.73 4821.78 3490.90 4472.78 5137.83
2008 3767.74 5275.10 3726.69 4799.79 5559.81
2009 4076.37 5903.63 4034.08 5267.03 6164.64
2010 4623.52 6431.40 4579.07 5782.10 6648.95
2011 5054.33 6880.72 5007.73 6369.27 7065.77
2012 5554.74 7469.64 5505.81 7023.55 8065.37
2012 Sept. 5703.03 7494.03 5653.88 7217.62 8353.45
Oct. 5812.03 7529.06 5761.57 7317.42 8395.10
Nov. 5865.92 7671.66 5815.42 7383.96 8311.80
Dec. 5838.98 7850.53 5788.49 7417.23 8436.75
2013 Jan. 5865.92 7814.26 5815.42 7450.49 8561.70
Feb. 5892.87 7956.86 5842.34 7483.76 8686.65
Mar. 6027.59 8064.43 5976.95 7550.30 8769.60
Apr. 6082.70 8135.73 6030.80 7616.84 8686.65
May 6082.70 8420.93 6030.80 7650.11 8728.30
June 6190.48 8457.51 6138.49 7716.64 9061.15
July 6217.42 8634.83 6165.41 7949.52 9227.75
Aug. 6352.14 8634.83 6300.03 8049.33 9227.75
Sept. 6568.92 8671.41 6515.41 8149.13 9186.10
N.B.- Yearly figures indicate average of twelve calendar months and the monthly figures relate
to a standard month of 26 days.

Indian Labour Journal, December 2013
1304
Table B.2.1 concld.
Year/ Month
Delhi Indore Kanpur Nagpur Solapur Kolkata
1 7 8 9 10 11 12
1985 734.12 755.14 824.70 658.96 723.32 814.33
1990 1070.33 1143.01 1232.60 956.25 1045.37 1195.16
1995 1739.63 1810.43 1949.70 1520.00 1744.67 1887.30
1996 1831.84 1970.78 2078.29 1638.04 1889.84 2099.53
1997 2013.39 2061.69 2243.55 1794.01 1981.08 2229.42
1998 2307.43 2256.09 2553.60 1988.73 2249.74 2452.04
1999 2524.99 2466.82 2743.61 2140.61 2399.14 2728.51
2000 2693.26 2540.94 2750.02 2195.02 2474.53 2796.11
2001 2775.73 2675.21 2839.01 2322.34 2489.57 2964.03
2002 2881.49 2792.85 2931.94 2383.55 2572.85 3292.82
2003 2981.47 2912.04 2995.84 2422.82 2636.12 3347.73
2004 3113.99 2986.63 3112.39 2496.74 2789.17 3478.77
2005 3350.68 3057.48 3279.56 2637.64 2841.65 3599.75
2006 3544.08 3255.16 3592.54 2338.85 2239.55 3797.02
2007 * 3474.05 3833.84 3097.41 * 4097.84
2008 * 3676.41 4062.10 3318.05 * 4420.66
2009 * 3939.07 4487.57 3726.56 * 4775.49
2010 * 4418.29 5238.85 4391.43 * 5362.25
2011 * 4748.82 5731.94 4800.80 * 5755.50
2012 * 5189.95 6104.54 5212.98 * 6134.40
2012 Sept * 5247.66 6261.81 5324.22 * 6286.02
Oct. * 5458.79 6403.56 5404.78 * 6286.02
Nov. * 5458.79 6431.91 5476.91 * 6454.29
Dec. * 5458.79 6403.56 5513.44 * 6454.29
2013 Jan. * 5546.99 6403.56 5513.44 * 6454.29
Feb. * 5546.99 6403.56 5491.90 * 6633.07
Mar. * 5546.99 6431.91 5499.39 * 6633.07
Apr. * 5644.02 6518.31 5549.98 * 6633.07
May * 5644.02 6546.66 5608.99 * 6643.58
June * 5644.02 6603.36 5652.09 * 6643.58
July * 5846.89 6660.06 5725.15 * 6643.58
Aug. * 5846.89 6859.86 5813.21 * 6906.46
Sept. * 5846.89 7088.01 5929.37 * 6906.49
New series on Consumer Price Index Numbers for Industrial Workers on base 2001=100 has been
introduced w.e.f. the index of January 2006.
Centre linking factor on base 2001=100 is: Ahmedabad (4.62), Bangalore (4.51), Vadodara (4.39), Mumbai
(5.18), Coimbatore / Chennai (4.95), Delhi(5.60), Indore(4.73),Kanpur(4.50), Nagpur (4.68), Sholapur
(4.73) and Kolkata (5.12)
* Earning of Delhi and Sholapur Centres have been discontinued due to closure of Textile Mills.
Source: Monthly returns received from the selected centres.
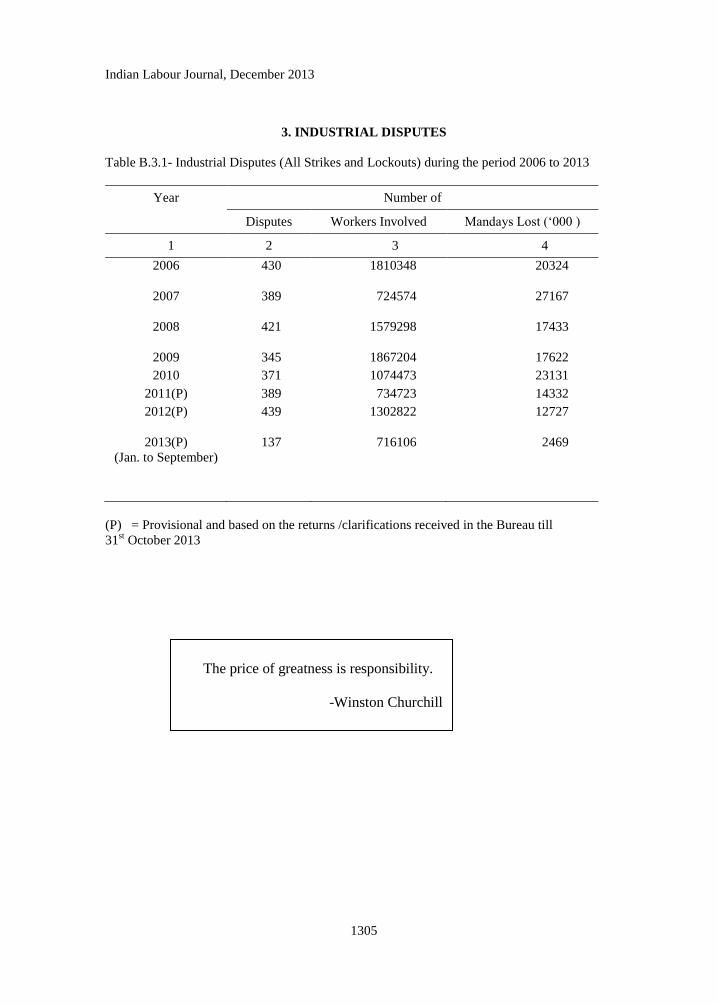
Indian Labour Journal, December 2013
1305
3. INDUSTRIAL DISPUTES
Table B.3.1- Industrial Disputes (All Strikes and Lockouts) during the period 2006 to 2013
Year Number of
Disputes Workers Involved Mandays Lost („000 )
1 2 3 4
2006
430 1810348 20324
2007
389 724574 27167
2008
421 1579298 17433
2009 345 1867204 17622
2010 371 1074473 23131
2011(P) 389 734723 14332
2012(P)
439 1302822 12727
2013(P)
(Jan. to September)
137 716106 2469
(P) = Provisional and based on the returns /clarifications received in the Bureau till
31st October 2013
The price of greatness is responsibility.
-Winston Churchill

Indian Labour Journal, December 2013
1306
Priced publications of the Labour Bureau
1. ANNUAL SURVEY OF INDUSTRIES 2008-09 (VOL. I)
Statistics on Employment and Labour Cost
Symbol: PDLB.649 (Vol.I) 120-2011 (DSK-II)
Price : Rs. 210.00
ANNUAL SURVEY OF INDUSTRIES 2008-09 (VOL. II)
Report on Absenteeism, Labour Turnover, Employment and Labour Cost
The report presents statistics on Absenteeism, Labour Turnover, Employment, Labour Cost and Earnings for the year 2008-09 and is based on Block-E of Part-I and Block-2 of Part-II of the ASI Schedule.
Symbol: PDLB. 649 ( Vol.II) 120-2011 (DSK-II)
Price : Rs. 100.00
ANNUAL SURVEY OF INDUSTRIES 2009-10 (VOL. I)
Statistics on Employment and Labour Cost
The publication presents statistics on Employment and Labour Cost for the year 2009-
10 and is based on Block-E of Part-I of the ASI Schedule.
Symbol: PDLB.653 (Vol.I) 120-2011 (DSK-II)
Price : Rs. 275.00
2 OCCUPATIONAL WAGE SURVEY, SIXTH ROUND, 2006
Report on Plantation Industries and Tea Processing Industry
The report presents statistics on occupation-wise Employment Structure, Wage Rates, Dearness Allowances and Average Daily Earnings.
Symbol: PDLB – 534 170-2006 (DSK-II)
Price : Rs. 50.00
Symbol: PDLB – 535 170-2006 (DSK-II)
Price : Rs. 45.00
3. OCCUPATIONAL WAGE SURVEY SIXTH ROUND 2009
(Report on Nine Engineering Industries)
The Sixth round of Occupational Wage Survey report on Nine Engineering Industries presents statistics on Employment Structure, Wage Rates, Darkness Allowance and Average Daily Earnings by Occupationa and Stratum. The report also makes an attempt to meet the statutory obligation pertaining to Article 8 or part-II (Average Earnings and Wage Stracture & Distributioon) of the ILO Covention No. 160 on labour Statistics. The data presented in this Report would prove useful to the users and the plicy makter.
Symbol: PDLB 640 176-2010 (DSK-II)
Price : Rs. 176.00
All the priced publications brought out by the Labour Bureau can be obtained from the Controller of
Publications, Civil Lines, Delhi-110054 by remitting the price in advance. Kindly quote the Symbol
number of the publication to facilitate its delivery.

Indian Labour Journal, December 2013
1307
4. REPORT ON THE SURVEY ON SOCIO ECONOMIC CONDITIONS OF LICENSED RAILWAY PORTERS AT FIVE SELECTED CENTRES, 2004
The report contains data on demographic particulars, earnings, expenditure, assets, consumption habits, indebtedness, health, availability of welfare facilities and industrial relations etc. in respect of Licensed Railway Porters working at the five selected centres. The data would be of immense use to the authorities entrusted with the task of ameliorating the lot of these workers.
Symbol: PDLB – 508 (E) 250-2004(DSK-II)
Price : Rs. 65.00
5. RURAL LABOUR ENQUIRY REPORT ON WAGES & EARNINGS OF RURAL LABOUR HOUSEHOLDS – 2004-2005
The report contains data on Wages & Earnings of Rural labour Households collected by
the national Sample Survey Organisation during its 61st round (2004-2005) of survey. It gives
information on Wages & Earnings of Rural as well as Agricultural labour Households by States and Categories of Households, in the country, for various agricultural occupations. The data is of immense use to the planners, researchers and policy framers.
Symbol: PDLB - 638 250-2010 (DSK-II)
Price : Rs. 105.00
6. RURAL LABOUR ENQUIRY REPORT ON GENERAL CHARACTERISTICS OF RURAL LABOUR HOUSEHOLDS – 2004-2005
The report contains data on general characteristics of rural labour households, viz.,
demographic structure of labour households; size of households; land holding pattern of households; and number of agricultural and non-agricultural households, etc. – a mine of information on the said subject, which would be of immense value to the researchers, economic planners and policy framers.
Symbol: PDLB – 652 200-2011 (DSK-II)
Price : Rs. 90.00
7. RURAL LABOUR ENQUIRY REPORT ON INDEBTEDNESS AMONG RURAL
LABOUR HOUSEHOLDS – 2004-2005
The report analyses the magnitude and incidence of indebtedness among labour
households in the country on the basis of the results of data collected by National Sample Survey Organisation during its 61
st round (2004-2005) of survey. The data is of immense use to the
planners, researchers and policy framers. Symbol: PDLB – 645 250-2010 (DSK-II)
Price : Rs. 143.00
8. RURAL LABOUR ENQUIRY REPORT ON CONSUMPTION EXPENDITURE OF RURAL LABOUR HOUSEHOLDS - 2004-2005
The report presents analysis of data on consumption expenditure of the rural labour
households collected by the National Sample Survey Organisation during the 61ST
round (2004-05) of the survey. It is hoped that the present publication will prove to be very useful for planning, administration and research purposes in the area.
Symbol: PDLB – 659 260-2012 (DSK-II)
Price : Rs. 140.00

Indian Labour Journal, December 2013
1308
9. RURAL LABOUR ENQUIRY REPORT ON EMPLOYMENT & UNEMPLOYMENT
OF RURAL LABOUR HOUSEHOLDS - 2004-2005
The report presents analysis of data on employment & unemployment of rural labour households on the basis of the results of data collected by National Sample Survey Organisation during its 61
st round (2004-05) of survey. This report has been brought out in two volumes. Vol.-
I presents the main findings whereas Vol.-II contains „appendices‟ in which detailed data have been presented. The data is of immense use to the planners, researchers and policy framers.
Symbol: PDLB – 631 250-2008 (DSK-II)
Price (per set) : Rs. 525.00
10. CONSUMER PRICE INDEX NUMBERS FOR AGRICULTURAL AND RURAL
LABOURERS 1986-87=100) Annual Report- 2010-2011 ( Agricultural Year)
This publication, 14th
in the series, contains detailed information on Consumer price Index Numbers for Agricultural and Rural Labourers ( Base: 1986-87=100) for the period July, 2010 to June, 2011. These index numbers, and especially the CPI (AL), play an important role in fixing/revising the minimum wages of agricultural workers
Symbol: PDL – 558 150-2011 (DSK-II)
Price: Rs. 70.00
11. CONSUMER PRICE INDEX NUMBERS
( For Industrial Workers) 2001=100 Annual Report- 2011
The publication presents serial statistics on Consumer Price Index Number for Industrial Workers with Base: 2001=100 for 78 industrial centres and also for all India. It also contains major group-wise (food, pan, supari, tobacco and intoxicants, fuel and light, housing, clothing, bedding and footwear and miscellaneous) and subgroups wise indices alongwith Linking Factors for conversion of the index to old base (1982=100)
Symbol: PDL – 559 300-2011 (DSK-II)
Price: Rs. 210.00
12. WAGE RATES IN RURAL INDIA
2011-2012 (Agricultural Year)
The publication, 15th
in the series, contains daily wage rate data in respect of 11 Agricultural and 7 Non-Agricultural Occupations for the period July, 2011 to June, 2012. The data on wage rates play an important role in the calculation of State/National Income, drawing up and implementation of wage policy as well as in fixation/revision of support prices of agricultural crops.
Symbol: PDLB – 660 200-2012 (DSK-II)
Price: Rs.90.00
13. NINTH DIGEST OF INDIAN LABOUR RESEARCH 2010
The publication present an annotated bibliography of research studies undertaken by
various Universities, Government Departmentsn (Central/State), Social Research Institutes, Employers‟ and Workers‟‟ organizations and individual researchers in the field of labour and labour related issues.
Symbol: PDLB – 644 100-2010 (DSK-II)
Price : Rs. 109.00

Indian Labour Journal, December 2013
1309
14. TRADE UNION IN INDIA 2008
Trade Unions in India is abiennial publication. It presents information in respect of Workers and Employers Unions, on Resigtered Trade Unions submitting returns by their sex-wise embership. Besides, it also present data of income and expenditure of Workers as well as Employers Unions.
Symbol: PDLB -655 150-2011(DSK)
Price : Rs. 71.00
15. STATISTICAL PROFILE ON WOMEN LABOUR 2009-2011
The publication provides comprehensive and recent most statistics on important aspects of Women Labour in India at one place and helps the researchers to study the gender variations in the population, employment, employment services and training, wages/earnings, participation in trade union movement, slcial sectrity.
Symbol: PDLB -661 150-2012 (DSK-II)
16. REPORT ON THE WORKING OF MINIMUM WAGES ACT, 1948 FOR THE YEAR 2010.
The report covers informationon employment added, employments in which the
Minimum Wages were fixed for the first time, the Minimum Wages in different scheduled employments prevalent during the year, the range of Minimum Wages, comparative Minimum Wage Rates prevailing in scheduled employments and number of Inspections. Etc.
Symbol: PDLB .16-2010 90-2012 (DSK-II)
Price : Rs. 173.00
17. REPORT ON EMPLOYMENT-UNEMPLOYMENT SURVEY 2009-10
The present Employment-Unemployment survey is the first such Household survey
undertaken by the Bureau at the National level. The survey was undertaken across 28 States and
UTs of the country.The report offers an assessment of the employment-unemployment situation
experienced by the economy over the years, defines the various concepts and terminologies used
in the survey, provides a range of demographic particulars of the population and significantly
provides various labour force estimates at state and overall level which have enormous
relevance.
Symbol: PDLB. 646 Price: 127.00
450-2010(DSK-II)

Indian Labour Journal, December 2013
1310
18. INDIAN LABOUR YEAR BOOK 2009 and 2010
The Indian Labour Year Book provides , in a compact volume, a general description of various topics, alongwith the latest available data in the field of labour such as Employment, Wages, Levels of Living and Consumer Price Index Numbers, Industrial Relation, Welfare, Housing, Health, Labour Legislation, Labour Administration etc., alongwith relevant supporting statistics and synopsis of Labour Bureau Publications.
Symbol: PDLB .19.2009-2010 (combined) 400-2011 (DSK-IIi)
Price : Rs. 175.00
19. INDIAN LABOUR STATISTICS 2009-10 (Bilingual)
A bilingual publication containing serial statistics relating to labour. It presents data on employment in Factories, Mines, Plantation, Railways, Employment Service and Training, Wages and Earnings, Price Indices, Trade Unions, Industrial Injuries, Absenteeism and Labour Turnover, Social Security, Industrial Disputes and International statistics pertaining to Labour
Symbol: PDLB – 30-2009-2010 (bilingual) 175-2011 (DSK-III)
Price: Rs. 90.00
20. POCKET BOOK OF LABOUR STATISTICS 2010-11 (Bilingual)
Pocket Book of Labour Statistics presents in a concise form serial statistical data in respect of various important aspects of Labour. These statistics cover Employment and Training, Wages Earning, Prices, Industrial Disputes, Accidents, Absenteeism, Social Security, etc. Key indicators for India and other countries have also been presented.
Symbol: PDLB – 163-2010-2011 (Bilingual) 250-2012 (DSK-III)
Price: Rs.80.00

Indian Labour Journal, December 2013
1311
INDIAN BOOK EXCHANGE
Registration No. “G 3/DL(N)-04/0008/2003-05”
Printed by the Printing Unit of Labour Bureau, Shimla
Editor I.S.Negi, Labour Bureau, Shimla and published by
Controller of Publications, Government of India,
Civil Lines, Delhi-110054