indian journal of - Indian Ecological Society
190
INDIAN JOURNAL OF Volume 48 Special Issue-16 August 2021 THE INDIAN ECOLOGICAL SOCIETY
-
Upload
khangminh22 -
Category
Documents
-
view
0 -
download
0
Transcript of indian journal of - Indian Ecological Society

INDIAN JOURNAL OF
Volume 48 Special Issue-16 August 2021
THE INDIAN ECOLOGICAL SOCIETY

Registered OfficeCollege of Agriculture, Punjab Agricultural University, Ludhiana – 141 004, Punjab, India
(e-mail : [email protected])
Advisory Board Kamal Vatta Chanda Siddo Atwal K.S. Verma Asha Dhawan
Executive CouncilPresident
A.K. Dhawan
Vice-Presidents R. Peshin S.K. Bal G.S. Bhullar
General SecretaryS.K. Chauhan
Joint Secretary-cum-TreasurerVaneet Inder Kaur
Councillors A.K. Sharma R.S. Chandel R. Banyal N.K. Thakur
Editorial BoardChief-Editor
Anil Sood
Associate Editor S.S. Walia K. Selvaraj
Editors Neeraj Gupta Sumedha Bhandari Maninder K. Walia Rajinder Kumar Subhra Mishra A.M. Tripathi Harsimran Gill Hasan S.A. Jawad
The Indian Journal of Ecology is an official organ of the Indian Ecological Society and is published bimonthly in February, April, June, August, October and December. Research papers in all fields of ecology are accepted for publication from the members. The annual and life membership fee is Rs (INR) 800 and Rs 8000, respectively within India and US $ 100 and 350 for overseas. The annual subscription for institutions is Rs 6000 and US $ 300 within India and overseas, respectively. All payments should be in favour of the Indian Ecological Society payable at Ludhiana. See details at web site. The manuscript registration is Rs 250. KEY LINKS WEBsite:http://indianecologicalsociety.comMembership:http://indianecologicalsociety.com/society/memebership/Manuscript submission:http://indianecologicalsociety.com/society/submit-manuscript/Status of research paper:http://indianecologicalsociety.com/society/paper-status-in-journal-2/Abstracts of research papers:http://indianecologicalsociety.com/society/indian-ecology-journals/
THE INDIAN ECOLOGICAL SOCIETY
(www.indianecologicalsociety.com)Past President: A.S. Atwal and G.S.Dhaliwal(Founded 1974, Registration No.: 30588-74)
See detailed regarding editorial board at web site

INDIAN JOURNAL OF
ECOLOGYSpecial Issue-16Volume 48 August 2021
Editors
A.K. DhawanSanjeev K. Chauhan
Vinod SharmaJeanne Poulose
The Indian Ecological Society, Ludhiana-141 004, India
(August 3, 2021)
ICBPO 2020Building Positive Organization


Agriculture 4.0 and Smart Farming: Imperatives of Scaling up Innovation and Farmer Capabilities for Sustainable Business
Manuscript Number: S-666NAAS Rating: 5.79
Abstract: Smart agriculture adoption during industry 4.0 is creating new scenarios to farmers across the world. Smart farming promotes not only an increase in the agricultural productivity and incomes, but also building resilience to climate change. Small business farmers had to look at all possible means to cope with the technology applications for implementation of agro-transformation agendas for improved production and business performance. Smart farmers have to make use of several technology applications like drones and satellites, IoT (Internet of Things) based sensors, block chain and big data, biotech, farm maintenance technology (optimising water usage, production, and innovation technology) for better agricultural practices. Though such aggrotech opportunities have demonstrated business improvements, how far such smart farming revolution is well received by the agribusiness owners are less researched into. Henceforth, the purpose of this research is to establish the relationship between aggrotech innovation capabilities and farmer's capabilities associated with agriculture firms and its contributions to business performance. Following cross-sectional descriptive study design, and purposive sampling, the study addressed 3 direct and 2 indirect relationships in the model, on 212 farmers. The data was collected from Selangor state of Malaysia. The study applied Smart PLS SEM to analyse the data. The results show that the innovation (technology) capability and farmer's (people) capability have a positive relationship on business performance. The study also shows the partial mediation effect of technology change on innovation capability and business performance as well as employee capability and business performance. The study is novel in its form by applying Resource Based View theory on Smart agriculture, extending possibilities of generalization agriculture sector.
Keywords: Innovation capability, Farmer's capability, Agriculture performance, Agriculture sector, Production, Business performance
Dileep Kumar M, Vinod Sharma , Normala S. Govindarajo and Rahmawati1 2 3
GNS University, India- 821305, 1CHRIST (Deemed to be University) Delhi NCR- 201 003, India2 3Xiamen University, Malaysia-43900 and Muhammadiyah University, Palapo, Indonesia-91922
E-mail: [email protected]
Indian Journal of Ecology (2021) 48 Special Issue (16): 1-8
Malaysian economy depend upon is agriculture sector
and states that the agriculture sector is the hird-highest GDP t
provider (7.1%, which is RM101.5 billion) to Malaysia, just
followed by mining and quarrying sector (Report of 2019).
The economic data available closely detail that the exports
improved from RM114.5 billion in 2018 to RM115.5 in 2019
(0.9% increase), and imports improved from RM93.3 billion in
2018 to RM93.5 billion in 2019 (0.2% increase). The trade
balance of agriculture sector upsurge by 4.1% from RM21.1
billion in 2018 to RM22.0 billion in 2019. The agriculture
sector is experiencing a revolution triggered by new
technologies, which appears encouraging very much since it
will permit this segment to lead towards performance,
productivity, and profitability (Saunila et al 2019).
Precision Agriculture, that specifically integrate several
technological inputs has turned to be the third wave of the
contemporary agriculture upheaval (Braun et al 2018), and
currently, being enriched with a development of agriculture
information systems due to the accessibility of real time
greater volumes of data. The role of emerging technologies
has well acknowledged by several industries across the
globe . (Freemantle 1999) Numerous innovations tools like
sensor equipment, machine learning, wire less
communication, and data visualization tools, have been
embraced to create value and increase productivity in the
farming sector (Braun et al 2018). Swift extension of
machines and tools with advanced technologies and IoT
applications in managing the production and services are
well acknowledged across industries. The industries can
make use of cutting-edge software and networked sensors to
schedule, forecast, adapt, and monitor business outcomes. It
is reported globally that agriculture which make use of
technology driven solutions with real time data has the
potential to save money, work and it will lead to an increased
production or a reduction of costs with more environmentally
friendly practices (Díez 2017).
The technology integration into agriculture sector invites
two-fold complexities. The primary one is innovation
capabilities, viz., the adaption of innovation technologies into
agriculture and the other one is farmer's skills and capability
to handle that know-how. Farmers have to adopt precision
agriculture or smart agriculture. Precision agriculture is
considered as the collection, storage, processing, and
sharing of real time that originated from several sources with
well-defined purposes (Lanucara et al 2020). On the other
hand smart agriculture comprises the use of software

systems with integrated digital mechanisms that maintain the
transformation of raw-data into valuable facts for agricultural
activity and approaches to work (Knierima et al 2019). Both
type of technology requires appropriate resources and
technical knowhow to perform the tasks associated with
agriculture smart operations. Hence forth resource adequacy
is an important aspect in dealing smart agriculture
complexities. Smart farming requires the people famer's
capability to assess the real time data for making
independent decisions. Some of the major threat raised up
among technology integrated agriculture practices in this
context include, coping with technology change, need of
innovation capabilities and worker capabilities and
subsequent prediction of business performance
opportunities. Though, several studies have conducted in the
large-scale industrial establishments, there are limited
number of studies focused on agriculture sector and smart
agriculture, exploring the intervening effect of technology
change in its relationship with innovation capability, farmers
capability and business performance. How far farmers are
facing constraints related to resources to make an effective
industrial 4.0 based technology transformation need
scientific analysis. Henceforth, purpose of this study is
therefore to explore the industrial 4.0 based technology
transformation challenges in agriculture sector need to be
contemporarily to be investigated into.
MATERIAL AND METHODS
The Resourced Based View theory delivers an exclusive
view on the efficacy of resource utilisation. Resource
amalgamation is a vital part of joining the inside and outside
an enterprise. When resources are exposed and efficiently
used by a firm, the value of it will appear (Fig. 1, 2).
Applying RBV theory in this research, the farmer's
capabilities and the innovation capabilities are linked to
technological innovation systems, with the changes initiated
by agriculture 4.0 to bring better production processes,
product quality and market orientation. It is argued in this
context that farmer's capabilities and the innovation
Industry 4.0
Resources
Capability
Competitive advantage
Business Performance
Conceptual Framework
Fig. 1. Resource based view theory (Barney 1991)
Innovation Capability
Production & Business
Performance
Agriculture Technology
change
H1
H5 H3
H4
H2
Farmer's capability
Fig. 2. Resource based view theory integrated into production and business performance
capabilities determine the control of resource adequacies
which would lead to better agriculture production
competence and performance.
Problem formulation: The fourth industrial revolution,
relates to agriculture-industrial 4.0, involves the application
of IT and communications technology with agricultural
production. Agriculture 4.0 is not only beneficial to agriculture
as well as the environment but also have proven track record
of in production and business performance. (Liao et al 2019).
The questions raised in this context is how far the agriculture
sector is ready to absorb agriculture-industrial revolution
which absorbs innovation capacities by making use of
automation, big data, internet-of-things etc. It is hypothesized
in this study that higher the technology change, higher will be
the competence depletion, leading to lower level of business
performance. A better innovation capability with modern
agriculture technologies and human skills can enhance the
competencies of farmer's and improve the production and
business performance. Current research applied quantitative
method with standardized instruments to analyse the
relationship between the innovation capabilities and farmer's
capabilities on business performance. The research site was
Kuala Langat region of the Selangor state of Malaysia. Study
finding provides better insight into the needs of innovation
capabili t ies and human resource competencies
preparedness towards agriculture 4.0 in its adaption to
agriculture sector for better business performance in the
Malaysian context.
Research Questions
RQ 1. Does innovation capability, farmer's capability, and
industry 4.0 agriculture technology change, influence the
agriculture business performance?
RQ 2. Do industry 4.0 agriculture technology changes
mediate the relationship between innovation capability and
farmer's capability on agriculture business performance?
Research design: The fundamental aim of research design
is to create a research design that will ensure the research
2 Dileep Kumar M, Vinod Sharma, Normala S. Govindarajo and Rahmawati

Variables No. of items Scale Cronbach's Alpha Authors
Employee(Farmers/agr i -entrepreneurs) Knowledge competence (capability)
9 5 0.79 Hosseini and Kamal (2012).
Innovation Capacity 23 7 0.80 Walkeret et al (1996), Lester et al (1998), Canfield and Miller (1998). Moorman and Miner (1999), Tang (1999), Freemantle (1999), Poolton and Ismail (2000)
Technology disruption 14 7 0.81 Ryan and Harrison (2001)
Production and business performance (adapted to agriculture sector)
6 5 0.80 Brewer and Selden (2000)
Table 1. Measurements
Measurement Items Item Cronbach's apha Rho_A Composite reliability
Average variance extracted (AVE)
Farmer's capability 14 0.801 0.912 0.914 0.800
Innovation capability 23 0.816 0.900 0.916 0.834
Technology change 9 0.799 0.923 0.946 0.780
Performance (Production and business) 6 0.804 0.945 0.922 0.777
Table 2. Cronbach's alphas ,rho_A, composite reliability, average variance extracted (AVE)
problem is solved, and research objectives are met as
unambiguously as possible. This study followed quantitative
research design by gathering primary data, to answer the
research questions posed in this research Bryman and Bell .
(2011) concluded that quantitative research method entails
deductive approach to the relationship between theory and
research.
Measurements: Most of the measurements utilized in this
current study were adapted from past-established
instruments. The questionnaire was divided into five
sections: technology change/disruption (Ryan and Harrison
2001), and dimensions (Kaufman 1974), innovation capacity
(Walker et al 1996, Tang 1999, Freemantle 1999, Poolton
and Ismail 2000), Hosseini and Kamal employee capability (
2012 Brewer and Selden ), and organizational performance (
2000), and all were evaluated with a five-point Likert scale,
where a higher score indicates stronger agreement.
Sampling: Malaysian agricultural production comprises of
tree crops (primarily for export), rice and livestock (primarily
for domestic consumption), and fruits and vegetables (both
export and domestic consumption). Leading export crops
comprise of oil palm, rubber, cocoa, pineapple, and pepper
and cover over 75% of cultivated land. This study focused
into main export crops which include oil palm, rubber, cocoa,
pineapple, and pepper which cover cultivated land, where
technology application is made for improved production and
business in the Selangor state of Malaysia. The area planted
to crops in Kuala Langat is 70,387.2 hectares. The types of
crops planted are industrial crops (palm oil, rubber, cocoa,
coffee); cash crop (tapioca, sweet potato, corn); and fruits, s
vegetables, and herbs. Those agri-entrepreneurs / farmers
who have at least 5 years of agriculture engagement in oil
palm, rubber, cocoa, pineapple, and pepper applied to some
extent technology integration into farming was considered for
the study. The study followed purposive sampling because,
unavailability of existing list of specific agriculture land and
crops and there is crossover of many . crops and land areas
The objective of such selection was to ensure that the
respondents can provide adequate information on the role of
technology adoption and change in the agriculture for better
production and business performance. The researcher
collected 221 questionnaires out of 286 set of questionnaires
distributed.
RESULTS AND DISCUSSION
Validity analysis: To measure the accuracy of the
instruments, the study followed validity analysis. Hair et al
(2014) suggested using the Average Variance Extracted
(AVE) and need to be much greater than 0.50 for determining
adequate convergent validity. All the merits of AVE were in
the acceptable range between 0.777 and 0.834 indicating an
adequate convergent validity (Table 2). Thus, the convergent
validity was confirmed in the study.
HTMT values for each construct are less than the
required critical values of 0.85 (Kline, 2011) and 0.90 (Gold et
al 2001). Besides, interval confidence levels also show
values lesser than 1 for each construct (Table 3). This means
that all the constructs meet the discriminant validity criteria
set (Henseleret al 2015).
Reliability: Based on the questionnaire the Cronbach's
3Agriculture 4.0 and Smart Farming

Parameter Technology change
Innovation capability
Employee capability
Employee capability
Innovation capability 0.798
Technology change 0.801 0.811
Performance (Production and business)
0.799 0.780 0.756
Table 3. Discriminant validity – Hetrotait Monotrait Ratio
Relationship Beta ( )β t-Value p-Value R Value2
Farmer's capability Production and BusinessPerformance 0.556
2.551 0.040 0.637
Innovation apabilityc Production and BusinessPerformance 0.631
2.386 0.032
Technology hangec Production and BusinessPerformance 0.661
2.792 0.034
Table 4. Results of direct hypothesis
Significant level= * <0.05, >1.65p t
Alpha for the technology disruption is 0.81, innovation
capability is .80 and capability is 0.79 and production farmer's
and business performance is .80 (Table 3). Overall scores
show that the Cronbach's Alpha exceeding 0.7 (Nunnaly
1970). Hence, it can be assumed that internal consistency for
this questionnaire is good.
Result of Structural Model
The results of the hypotheses testing using the
SmartPLS path model analysis resulted in three important
observations (Table 4): firstly, farmer's capability has a
positive and significant relationship with production and
business performance ( = 0.556; t = 2.551) and hence H1 is β
supported. Secondly, innovation capability has a positive and
significant relationship production and business
performance ( = 0.631; t = 2.386), hence H2 is supported. β
Besides that, technology change has positive and significant
relationship with production and business performance ( = β
Innovation Capability
Farmer’s
capability
Production and Business Performance
0.637
Technology change
0.456
0.421
0.3460.330
0.521
Fig. 3. Structural frame
0.661; = 2.792). The inclusion of farmer's capability, t
innovation capability and technology change into the
SmartPLS path model analysis contributes 63.7 per cent of
the change in the dependent variable.
Analysis of findings indicates the relationship between
the independent variables (farmer's capability, innovation
capability and technology change) and the dependent
variable ( ) is partially production and business performance
significant (Table 5). Chin (1998) suggests that the R-
squared values of 0.67, 0.33, and 0.19 in PLS-SEM can be
considered as substantial, moderate, and weak,
respectively. The relationship between farmer's capability,
innovation capability and technology change on production
and business performance is reduced but remains significant
as complimentary. Followed by the direct and indirect
hypothesis testing the study also applied Stone-Geisser's
test to get the predictive relevance to confirm through Q
square values, which are carried out as predetermined. The
Q² is a criterion to a measure how well a model predicts the
data of omitted cases (Chin 1998, Hair et al 2014).
Henseler and Fassott (2010) research model with Q2
statistic (s) greater than zero is considered to have predictive
relevance. Furthermore, a research model with higher
positive Q2 values suggests more predictive relevance. The
test results show that square values are between 0.341 and Q
0.389. The values are above the standard that is larger than
zero. Therefore, the findings generally support the predictive
relevance of the SmartPLS path model used in this study.
Finally, the effect of square size of the relationship between f
the variables (farmer's capability, innovation capability and
technology change) ranges from 0.356 to 0.437 (production
and business performance). These values are categorised
as small and medium-size effects as stated by Hair et al
(2017), the value of square = 0.02 is categorised as small, f
0.15 as moderate, and 0.35 as large.
Industrial revolution, which is closely knit with agriculture
4.0, has witnessed several technology changes at
organisational level. A new form of organisational
understanding is related to implanting personal capabilities,
structures, strategies, resources, and farming processes.
Nevertheless, such invasion of technology disruption, how
4 Dileep Kumar M, Vinod Sharma, Normala S. Govindarajo and Rahmawati

Relationships Direct effect β t- Value Significant(p>0.05)
Indirect effect β t- Value Significant(p>0.05)
Effect
FC→PBP 0.499 2.938 Yes(p = 0.000)
0.397 1.978 Yes(p =0.000)
Partial Mediation(Complimentary)
IC→PBP 0.501 2.899 Yes(p = 0.000)
0.312 1.755 Yes(p =0.000)
Partial Mediation(Complimentary)
Table 5. Results of indirect hypothesis
far related to innovation capabilities, farmer's capabilities and
production and business performance, is less researched
into. This research has investigated the influence of farmer's
capability, innovation capability and technology change on
organizational performance small and medium farmers,
especially focused into the agriculture sector, and the
moderating effect of technology change between innovation
capabilities, farmer's capabilities and production and
business performance. It is well established that there is
strong and positive relationship between farmer's capability,
innovation capability and technology change on production
and business performance. The moderation effect further
indicates partial moderation effect of technology change in its
relationship between novation capabilities, farmer's
capabilities on production and business performance.
Farmer's capability and production and business
performance: Agriculture 4.0 where several agriculture
entrepreneurs and small and medium farmers have started
their technology adoption to improve the production and
decision-making practices. The execution of new digital tools
and technical know-how is affecting both farmers working in
businesses as well as agriculture agencies. The challenge of
the competence to handle the change aspects involves a
three-factor approach, including the level of the company
management, the areas of the production methods and the
kinds of competencies (Errol et al 2016). Industry 4.0 has
given a redirection to all types of organisations where the
companies must focus into new generation skills and
competencies in tune with digitalisation. Better integration of
employee capabilities will pave better business performance
opportunities and is a vital indicator of any organization
success or failure (Sanders et al 2016). Agriculture
entrepreneurs and small business farmers can exploit the
business and effective production possibilities in the new
digital technologies to enter agri-developing markets,
leveraging the new industry 4.0 technologies. IoT-based
smart farming, also known as precision farming, supports the
agriculturalists to enhance water, nourishment and pesticide
inputs and improve crop yield, quality, and productivity by
supervising numerous aspects such as humidity,
temperature, soil conditions and fertiliser and pesticide levels
on their farms or with the support of sensors and
interconnectivity. Agri-entrepreneurs and small farmers can
improve the day-to-day agri-business operations, by creating
new business models with the support of real time data
generated from new digital technologies, through better
supply chain and channels. There are several strategies
before the small and medium scale farmers to be looked for
reducing the skills gap and improving the farm business
performance and one option is up-skilling and reskilling of the
existing farmers. They can develop technology-oriented
skills among the farmers or by retraining their existing
workforces to make ready individuals for new positions and
tasks. They also can adopt a hybrid method, by using a
skilled contract staffs to deliver short-term demands while
creating the required skills within the company.
The study indicates the relationship between employee
capabilities and business performance. Progress in the
technology application in agriculture sector has led to skill
obsolescence, where the degree to which specialists lack
updated information or skills essential to sustain adequate
performance in their existing or forthcoming work roles
(Kaufman 1974), or there is inconsistency between an
individual's performance and the essential capability level
(Chauhan and Chauhan 2009), due to which an upgrade of
required worker skill level and a shift in types of skills
required. In line with such established relationship, it is thus
deliberated that an increased use of technology in day-to-day
agri-operations offers a comfortable condition of appropriate
skills to manage such technologies in farming. The small and
medium scale agriculture sector currently needs to have a
major revamp in the skill sets, to cope with the changes in the
procedural and production process level.
Innovation capability and production and business
performance: The innovation capability is identified as the
company's capability to produce new technologies, methods,
and commodities (Gewe et al 2016). It is recognized as the
company's capacity to obtain, introduce, and develop new
understanding which tacitly permits the organisation to
accomplish the directed performance (Liao et al 2019). The
capabilities related to small and medium innovation farms,
which make use of advanced technology has obtained better
competitive advantages in the agriculture market. Starting
from the variances among traditional industry and
5Agriculture 4.0 and Smart Farming

agriculture, one can witness several changes. In agriculture,
the movement of products, information, and knowledge
among agricultural stakeholders (producers and consumers)
at each stage of the agricultural processes, marketing, and
consumption technology has paved better precision in
decision making and management. The application of recent
technologies associated to the digitalization era, such as
precision farming, that makes use of innovative positioning
technologies combined with the application of extra sensors
and the collected data, increasing the yield ( . Proagrica 2019)
The result shows the application and use of innovative
technologies in agriculture production and business
performance. The current research results clearly indicated
the relationship between innovation capabilities and
organisational performance. Innovation capability directs
firms and agencies to develop improvements continuously to
react the varying market situation and is rooted with all the
strategies, system and structures that upkeep innovation
(Gloe and Samson 2016). Beyond technical innovation
agriculture agencies and farmers should increasingly
develop their innovation capabilities to lead the farming
performance by providing attention to market requirements.
The innovation capacity extends comprehensive set of
capabilities of agriculture agencies that facilitate aligning
agencies tech-strategies for better organisational
performance.
Technology change and production and business
performance: The Agriculture 4.0 development occurs in
parallel with similar evolutions in the industrial sector
(Industry 4.0) grounded on an idea for upcoming
manufacturing. Agriculture 4.0, like to Industry 4.0, stands for
the joint internal and external intermingling of agri-business
operations, contributing digital data at all farm sectors and
processes. Even in agriculture, the 4.0 revolution signifies a
countless chance to reflect the inconsistency and
uncertainties especially that involve the agri-food production
chain ( Agencies become smarter, more Aravind et al 2017).
competent, safer, and more ecologically sustainable, due to
fleets of robots for environmentally safe pest control
(Gonzalez-de-Santos et al 2017, Roldán, et al 2017,
Gonzalez-de-Santos et al 2017, Tobe 2017) to the
incorporation of production technologies and devices,
information and communication systems, data, and services
in network infrastructures (Bogue, and Robots 2016, Reddy
2016, Shamshiri et al 2018). It is ideated that a smart farm
must make use of real time data that coming from various
sources for effective decision making in the completive
market ( ). Technology changes Siciliano and Khatib 2016
facilitate constant communication between market and
production, and within the business itself. Such changes at
technology level have been highly influencing the day-to-day
business processes and intern it is extremely affecting the
methodical use of physical forces through various forms of
technology. The availability of fine-tuned technology
determines the quality and quantity of agriculture
commodities produced and services delivered. According to
McKinsey, (2020), Industry 4.0 changes the structure,
method, or experience, from on-going as predictable or as
expected. Firms will have to rethink the way they do
agribusiness. Small and medium agriculture farms will have
to drive the digital transformation of their business to succeed
in the new environment. However, small and medium
agriculture farms generally invite uncontrollable risks.
Consequently, several actions and projects require huge
supplies of capital, know-how, and time to execute them.
Hence, it is assuming that projects cannot be carried out
purely due to a dearth of resources and capabilities and
technology adoption.
The research finding shows direct relationship between
technology change and production and business
performance. When a new technology abruptly supersedes
the old, a technology disruption occurs and the entire eco
system needs to readjust the environmental interaction
conditions to suite the new technology. Technology change
or disruption has necessitated small and medium agriculture
firms either to destroy the current competence or enhance
the capabilities existing in an industry for competitive
advantage. (Hill and Rothaermel 2003). To cope with the
dynamics of change, small and medium enterprises should
focus their attention towards improving their obsolete
machineries since it is necessary for better production
practices following latest standardized procedures and follow
the market expectations.
Moderating effect of technology change: The research
also shows partial moderating effect of technology change
between innovation capability and business performance.
This indicates that in comparison with technology change as
such, innovation capability, with technology change act as
moderator variable with its the effect on business
performance. Small and medium scale agro-farms are in
need to investigate current innovation capabilities and fine
tune their farm culture in accordance with the expected
technological change. Innovation capability is utmost vital
constituents for evolving adequate invention results within
the firm to permit the application of resources and incessant
transformation of knowledge and skills into product, process,
and system for the benefits of firms and stakeholders. The
small and medium agro-farms which entertain such
innovative culture, during technology changes remains
ahead of their contestants because such innovation
6 Dileep Kumar M, Vinod Sharma, Normala S. Govindarajo and Rahmawati

capabilities eventually contribute to production and business
performance.
Implications: Industry 4.0 has paved several trends of
automation, data exchange in service and production
technologies. SMEs are in a perplex mode to look at
technological change with all available resources and
capabilities. The study findings clearly establish the strong
relationship between the independent variables (employee
capability, innovation capability and technology change) and
dependent variables (organisational performance)
explaining the impact of technology disruption on
organisational performance of SMEs in Malaysia. When
referring to the RBV, most researchers focus on strategic
context, presenting resources and capabilities as essential to
gaining a sustained competitive advantage and superior
performance. The present study will represent the function of
agripreneurship in RBV by highlighting the importance of
innovative capabilities as a resource capability. The RBV
focuses on the importance of human resources, as reflected
in the competencies and capabilities, leading to
performance. Theoretical relevance of resource-based
views model is once again got better acceptance through this
research, facilitating advancement of knowledge. It is proved
that better innovation capabilities and farmer's resources can
lead to better agriculture production leaving to completive
advantage to agri-entrepreneurs and small farmers in
Malaysia. The study findings pave better practical
implications to the line managers and HR managers of SMEs
in their prominent role in workforce competence building as
well as developing innovation capabilities by ensuring
innovative and proactive strategic decisions. During the
technology disruption of industry 4.0 it is expected that the
SME entrepreneurs, should take initiatives in ensuring a
smart technology adoption which make use of innovation
capabilities of the people and organisation for better product
and process performance in agriculture. The study leaves
strategic obligations to the policy makers in drafting sound
industrial 4.0 policies for better business performance. The
evolution of Agriculture 4.0 is facilitating the manufactories to
look into the needs of modern farmers who make use of
agricultural technology equipment for smarter agriculture
practices which provide better production and business
performance.
CONCLUSION
Major focus of this empirical research was on the
establishment of relationship between innovation
capabilities, farmer's capabilities in production and business
performance during the era of technology change in
Malaysia. The study answered all the research questions
posed and have tested all hypotheses, leaving implications to
small and medium agri-business owners, agri-business
entrepreneurs and farmers. It is evident from the output that
Smart Farming technologies and tools are getting gradual
acceptance among small and medium agri-business owners,
entrepreneurs and farmers. Integration of technology thus
envisages appropriate resources in agri-farm operations. In
comparison with traditional mode of agriculture, the practice
of agriculture now required superior technology supported
and innovation and digital driven production processes for
better business performance. Based on the results it is thus
hypothesised that the application of digital and modern
technologies at the agriculture level, will intensify in the
coming years and Malaysian farmers should up-skill or reskill
for better and productive agrarian engagement. Looking at
the potential benefits to the agrarian farm operations, it is
thus suggested that the sector should focus on innovation
capabilities and farmer's capabilities for better competitive
advantage and business performance.
REFERENCESAravind KR, Raja, P and Pérez-Ruiz, M 2017. Task-based
agricultural mobile robots in arable farming: A review. Spanish Journal of Agriculture Research 15 : 1-16.
Barney 1991 J . Firm resources and sustained competitive advantage. : 99-120.Journal of Management 17
Bergerman M, Billingsley J, Reid J and van Henten E 2016. Robotics in Agriculture and Forestry. In Springer.
Bjurwill C 1993. Read and react: The football formula. Perceptual and Motor Skills 76 (3): 1383-1386.
Bogue R 2016. Robots poised to revolutionise agriculture. Industrial Robot 43 : 450-456.
Braun AT, Colangelo E and Steckel T 2018. Farming in the Era of Industry 4.0. , : 979- 984. Stockholm: Elsevier Procedia CIRP 72BV.
Brewer GA and Selden SC 2000. Why elephants gallop: Assessing and predicting organizational performance in federal agencies. Journal of Public Administration Research and Theory 10 : 685-711.
Bryman A and Bell E 2011. . 3rd ed. Business research methodsOxford University Press. USA. p. 188
Canfield J and Miller J 1998. Heart at Work: Stories and Strategies for Building Self-esteem and Re-awakening the Soul at Work, McGraw-Hill, Crawfordsville, IN. p. 105
Chin WW 1998. The Partial Least Squares Approach for Structural Equation Modelling. In GA Marcoulides (ed.), Modern Methods for Business Research, p. 295-336. Lawrence Erlbaum Associates, London).
Da Silva VL, Kovaleski JL and Pagani RN 2019. Technology transfer and human capital in the industrial 4.0 scenario: A theoretical study. : and Future Studies Research Journal Trends Strategies 11: 102-112.
Díez C 2017. Hacia una agricultura inteligente (Towards and intelligent Agriculture). : 4-11.Cuaderno de Campo 60
Erol S, Jäger A, Hold P, Ott K and Sihn W 2016. Tangible industry 4.0: A scenario-based approach to learning for the future of production. : 13-18.Procedia CIRP 54
Freemantle D 1999. What Customers Like About You; Adding Emotional Value, Nicholas Brealey Publishing, London. p. 42
7Agriculture 4.0 and Smart Farming

Gewe AM, Abebe BB, Azene DK and Bayu FG 2016. Local industry technological capability development using outsourcing opportunities. Strategic Outsourcing: An International Journal 9(3): 287-302.
Gloet and Samson 2016. Knowledge management and systematic innovation capability. International Journal of Knowledge Management 12(2): 54-72.
Gobeli DH and Brown WB 1994. Technological Innovation Strategies. (1): 17-23.Engineering Management Journal 6
Gold AH, Malhotra A and Segars AH 2001. Knowledge management: An organizational capabilities perspective. Journal Management Information System 18(1): 185-214.
Gonzalez-de-Santos P, Ribeiro A, Fernandez-Quintanilla C, Lopez-Granados F Brandstoetter, M, Tomic S, Pedrazzi S, Peruzzi A, Pajares G Kaplanis, G 2017. Fleets of robots for environmentally safe pest control in agriculture. Precision Agriculture 18 : 574-614.
Hair JF, Hult GTM, Ringle CM and Sarstedt M 2017. A primer on partial least squares structural equation modelling (PLS-SEM) (2nd ed.). Thousand Oaks, CA: Sage. p. 318
Hair JF, Sarstedt M, Hopkins L and Kuppelwieser V 2014. Partial Least Squares Structural Equation Modelling (PLS-SEM): An emerging tool for business research. European Business Review 26(2): 106-121.
Henseler J and Fassott G 2010. Testing Moderating Effects in PLS Path Models: An Illustration of Available Procedures. Springer. ISBN: 978-3-540-32825-4.
Henseler J, Ringle CM and Sarstedt M 2015. A new criterion for assessing discriminant validity in variance-based structural equation modelling, Journal of the Academy of Marketing Science, 43(1): 115-135.
Hill CWL and Rothaermel FT 2003. The performance of incumbent firms in the face of radical technological innovation, The Academy of Management Review 28(2): 257-274.
Hogan P and Schere B 2017. Agriculture 4.0 – Ensuring Connectivity of Agricultural Equipment, White Paper, pp. 1-12.
Hosseini Z and Kamal 2012. A survey on pre-service and in-service teacher's perceptions of technological pedagogical content knowledge (TPCK). The Malaysian Online Journal of Educational Technology 1(2): 1-7.
Kaufman HG 1974. Obsolescence and professional career development. AMACOM. ISBN 13: 9780814453445.
Kline RB 2011. Methodology in the Social Sciences. Principles and practice of structural equation modelling (3rd ed.). New York, NY, US: Guilford Press. p. 115.
Knierima A, Kerneckerb M, Erdlec K, Krausb K, Borgesb F and Wurbsb A 2019. Smart farming technology innovations-Insights and reflections from the German Smart-AKIS hub. NJAS Wagening Journal of Life Sciences 90-91 : 1–10.
Lanucara S, Oggioni A, Di Fazio S and Modica G 2020. A Prototype of Service Oriented Architecture for Precision Agriculture. In Book Innovative Biosystems Engineering for Sustainable Agriculture, Forestry and Food Production, Lecture Notes in Civil Engineering; Coppola A, Di Renzo GC Altieri G and D'Antonio P 2020. Eds.; Springer: Berlin/Heidelberg, Germany : 765-774.67
Lester RK, Piore MJ and Malek KM 1998. Interpretive management: What general managers can learn from design, Harvard Business Review 4 (5): 86-96.
Liao C, Wang HY, Chuang SH, Shih ML and Liu CC 2010. Enhancing knowledge management for R&D innovation and firm performance: An integrative view, African Journal of Business
Management 4 (14): 3026-3038.
McKinsey 2020. Building the vital skills for the future of work in o p e r a t i o n s . O n l i n e D o c u m e n t , U R L : https://www.mckinsey.com/business-functions/operations/our-insights/building-the-vital-skills-for-the-future-of-work-in-operations (Accessed on 20th March, 2021).
Moorman C and Miner AS 1998. The convergence of planning and execution: Improvisation in new product development. Journal of Marketing 66: 1-20.
Nunnally JC 1970. . New Introduction to psychological measurementYork: McGraw-Hill.
Poolton J and Ismail H 2000. New development in innovation, Journal of Managerial Psychology 15(8): 795-811.
Proagrica 2019. How Big Data Will Change Agriculture. Available online: https://proagrica.com/news/how-bigdata-will-change-agriculture/ (accessed on 21 November 2019).
Reddy N, Reddy A, and Kumar J 2016. A critical review on agricultural robots. International Journal of Mechanical Engineering Technology 7 (6): 1-7.
Roldán JJ, del Cerro J, Garzón-Ramos D, Garcia-Aunon P, Garzón M, de León J and Barrientos A 2017. Robots in Agriculture: State of Art and Practical Experiences. In Service Robots; Neves, A.J.R., Ed.; IntechOpen: Rijeka, Croatia.
Ryan S and Harrison D 2000. Considering social subsystem costs and benefits in information technology investment decisions: A view from the field on anticipated payoffs. Journal of Management Information Systems 16 (4): 11-40
Salisu Y and Bakar LJA 2018. Strategic alliance and the performance of SMEs in developing economies: The mediating role of innovation strategy. Asian Journal of Multidisciplinary Studies 6(2): 1-8.
Sanders K and Yang H 2016. The HRM process approach: the influence of employees' attribution to explain the HRM – performance relationship. : Human Resource Management 55201–217.
Saunila M, Ukko J, and Rantala T 2018. Sustainability as a driver of green innovation investment and exploitation. Journal of Cleaner Production 179 : 631-641.
Shamshiri RR, Weltzien C, Hameed, IA, Yule IJ, Grift TE, Balasundram, SK, Pitonakova L, Ahmad D and Chowdhary G 2018. Research and development in agricultural robotics: A perspective of digital farming. International Journal of Agriculture Biological Engineering 11 : 1-14.
Siciliano B, and Khatib O, 2016. . Springer Handbook of RoboticsHandbooks; Springer International Publishing: Cham, Switzerland, p. 1463–1492. ISBN 978-3-319-32552-1.
Slater SF, Hult TM and Olson EM 2010. Factors influencing the relative importance of marketing strategy creativity and marketing strategy implementation effectiveness, Industrial Marketing Management 39(4): 551-559.
Tang HK 1999. An Inventory of Organizational innovativeness, Technovation 19(1): 41-51.
Tobe F 2019. What's Slowing the Use of Robots in the Ag Industry? Available online: https://www.therobotreport.com/whats-slowing-the-use-of-robots-in-the-ag-industry/ (accessed on 21 November 2019).
Walker HM, Horner RH, Sugai G, Bullis M, Sprague JR, Bricker D and Kaufman MJ 1996. Integrated approaches to preventing antisocial behaviour patterns among school-age children and youth. (4): Journal of Emotional and Behavioural Disorders 4194-209.
Received 20 May, 2021; Accepted 28 June, 2021
8 Dileep Kumar M, Vinod Sharma, Normala S. Govindarajo and Rahmawati

Predicting Green Purchase Intention through Attitude and Social Norms: A Study of Eco-friendly Products
Manuscript Number: S-667NAAS Rating: 5.79
Abstract: Abstract: The use of environment friendly products has gained popularity as the level of awareness of the people is increasing which is shaping up the attitude. Further, social norms (SN) also play an important part in making the attitude favourable towards purchasing of environmental friendly products due to which it influences the green purchase intention (GPI). The present research was conducted to evaluate the effect of attitude and SN on GPI for which the eco-friendly products were considered, in general. The responses were collected from 200 people after which the data was assessed through multiple regression analysis. The influence of both attitude and SN on GPI was found significant.
Keywords: Attitude, Social norms, Green purchase intention, Eco-friendly products
Pranshuman Parashar, Garima Mathur and Yogesh UpadhyayDepartment of Management, Prestige Institute of Management, Gwalior-474 020, India
E-mail: [email protected]
Indian Journal of Ecology (2021) 48 Special Issue (16): 9-11
Globally, people are becoming aware about the use of
chemicals, insecticides and other harmful substances in
the food and its impact on the human health and the
environment. The high consumption of natural resources,
use of automobiles, polyethylene bags has depleted the
natural environment. Mehrad (2020) identified that
particulate matter was the most significant air pollutant. It
has become very important to use eco-friendly products for
the environmental protection. In this regard, the attitude of
the people plays an important role in their intention to buy
eco-friendly products. Further social norms also have its
part in making the people's intention towards using eco-
friendly products. Eco-friendly or green products are not
deleterious for the ecosystem while producing, using or
even disposing. Environment friendly products support in
energy conservation, reducing carbon footprints or in
minimizing the emission of greenhouse gases which keeps
a check on the environmental pollution. Green products are
also useful due to their characteristics of being recyclable,
compostable and biodegradable, because of which, they do
not create any ecological imbalance at the time of disposal.
The products that are made of recycled materials help in
minimizing the requirement for new raw materials and
therefore, the amount of waste in the landfills. Green
Purchase Intention is postulated as the readiness and
likelihood to prefer products with environment friendly
features other than regular products during purchase
deliberations (Rashid 2009). Mostafa (2007) observed that
attitude positively influenced green purchase intention.
Jaganath (2016) concluded that the impact of attitude on
green buying behaviour was positive. The influence of
environmental attitude was also positive on intention of
young consumers (Yadav and Pathak 2016). Anvar and
Venter (2014) observed positive impact of attitude on buying
behaviour which indicates that it is more probable that
consumers having favourable att itudes towards
environment friendly products would buy them. Jaiswal and
Kant (2018) also indicated significant effect of attitude on
GPI. Chen (2007) demonstrated that when norms were
positive, GPI was significantly augmented. Gangadhar
(2020) identified tribe using various indicators related to
animals, birds, water sources etc. to forecast the early
warning with respect to various environmental threats.
These social norms are followed by the members of the tribe
to adapt themselves with the climate change. Öhman (2011)
found that eco friendly products purchasing was influenced
by social norms. The present study was conducted to
evaluate the impact of attitude and social norms on green
purchase intention.
MATERIAL AND METHODS
An empirical study was performed in which the
population comprised the people who intend to purchase
environment friendly products. The responses were
collected from 200 respondents through non-probability
purposive sampling technique. The responses were
analyzed through statistical package PASW 18. The
proposed model is:

Social Norms
Attitude
Green Purchase Intention
Hypothesis:
H1: Attitude significantly and positively predicts Green
Purchase Intention
H2: Social Norms significantly and positively predicts Green
Purchase Intention
Measures: The items of constructs were adopted from
previous research. The attitude items were adopted from the
studies of Sopha and Klockner (2011) and Maichum et al
(2016) and SN items from the research of Klockner and
Friedrichsmeier (2011) and Haws et al (2014). The GPI items
were based on the studies of Sopha and Klockner (2011) and
Chu (2018). The alpha values were 0.776 for attitude 0.741
for social norms and 0 .779 for green purchase intention.
Analysis: The analysis was performed through statistical
package PASW 18. The assessment was conducted through
multiple regression analysis.
Demographic profile: The respondents includes 118 males
(59%) and 82 females (41%). There were two different age
groups viz. below 35 years (61%) and rest above 35 years.
RESULTS AND DISCUSSION
The R value was 0.757 which depicts good prediction.
The R value was 0.573 which specified that attitude and SN 2
explained 57.3% variance of GPI. However, the adjusted R 2
is to be interpreted for accurately reporting data in multiple
regressions. The Adjusted R e was 0.569 which depicts that 2
attitude and SN explain 56.9% variance of the GPI. The F-
ratio i.e. F = 132.445, p < .005 indicates that regression
model was good fit. The unstandardized coefficients value
indicates the dependent variable's variability with an
independent variable. The unstandardized coefficient, B, for
attitude was 0.344 and for SN was 0.440 and indicated that
with each one unit increase in attitude and SN, there would be
an increase of 0.344 units and 0.440 units in GPI
respectively. Further, the t-value for Attitude and SN were
6.581 and 7.117 respectively which were statistically
significant and indicates that both the hypotheses were
supported and there was significant effect of Attitude on GPI
and SN on GPI. The formation of attitude is done through
either direct experience or influence of others. It basically
depends upon cognition which is about knowing something
and its related impact on favourability or unfavourability with
respect to a person, object or situation. The other important
aspects of a person's attitude are the emotions and
behaviour. The social norms are related with right or wrong
behaviour. Individuals who identify with the group would
perform as per the specific behaviours prescribed by the
group. Individuals are becoming concerned about the
environment protection due to the favourable attitude and
strong social norms. Out of the two constructs, the effect of
SN on GPI was higher than attitude which indicates that SN
strongly predicted purchase intention for eco-friendly
products. The organizations which are into marketing of
environment friendly products should highlight the
differentiation between its products and the products of its
competitors as both attitude and SN predicted GPI positively.
The favourable attitude towards eco-friendly products and
strong social norms will provide an opportunity for the
companies to sell its eco-friendly products. The responses
were collected from a small region in Madhya Pradesh, India,
and small sample size was considered for this study which
could be extended in the future studies. Further, green
products, in general, were considered for the study and not
the specific green products. Also, the analysis could be
performed utilizing the demographic data. Future studies
could be performed taking other constructs from different
theories to obtain more comprehensive results.
CONCLUSION
The GPI was predicted by attitude and SN. The society
plays an important role in determining green purchase
intention of people. The people living in nearby area decide
about the cleanliness status, safeguarding environment and
other related issues which would certainly lead other people
to purchase green products. Further, the attitude is also one
of the prime measures in the prediction of intentions as even
if other people in the neighbourhood prefers green products,
the individual's preference may vary from them and the
person might not be interested in purchase of green
products. Hence, attitude also has an important and
independent role in predicting intentions to buy eco-friendly
products.
REFERENCESAnvar M and Venter M 2014. Attitudes and purchase behaviour of
green products among generation Y consumers in South Africa. Mediterranean Journal of Social Sciences (21): 183.5
Chen MF 2007. Consumer attitudes and purchase intentions in relation to organic foods in Taiwan: Moderating effects of food-related personality traits. (7): Food Quality and Preference 181008-1021.
10 Pranshuman Parashar, Garima Mathur and Yogesh Upadhyay

Chu KM 2018. Mediating influences of attitude on internal and external factors influencing consumers' intention to purchase organic foods in China (12): 4690.Sustainability 10
Gangadhar B 2020. Traditional ecological knowledge based early warning systems for adaptation to climate change. Indian Journal of Ecology 47(4): 1049-1053.
Haws KL, Winterich KP and Naylor RW 2014. Seeing the world through GREEN- tinted glasses: Green consumption values and responses to environmentally friendly products. Journal of Consumer Psychology 24(3): 336-354.
Jaganath R 2016. A study on green purchasing behaviour of young consumers in Mettupalayam (Coimbatore District). International Journal of Applied Research (3): 678-681.2
Jaiswal D and Kant R 2018. Green purchasing behaviour: A conceptual framework and empirical investigation of Indian consumers. : Journal of Retailing and Consumer Services 4160-69.
Klöckner CA and Friedrichsmeier T 2011. A multi-level approach to travel mode choice- How person characteristics and situation specific aspects determine car use in a student sample. Transportation Research Part F: Traffic Psychology and Behaviour 14(4): 261–277.
Maichum K, Parichatnon S and Peng KC 2016. Application of the
extended theory of planned behavior model to investigate purchase intention of green products among Thai consumers. Sustainability 8(10): 1077.
Mehrad AT 2020. Causes of air pollution in kabul and its effects on health. (4): 997-1002. Indian Journal of Ecology 47
Mostafa MM 2007. A hierarchical analysis of the green consciousness of the Egyptian consumer. Psychology and Marketing (5): 445-473.24
Öhman N 2011. Buying or lying - the role of social pressure and temporal disjunction of intention assessment and behavior on the predictive ability of good intentions. Journal of Retailing and Consumer Services (3): 194-199. 18
Rashid NA 2009. Awareness of eco-label in Malaysia's green marketing initiative. International Journal of Business and Management 4(8): 132-141.
Sopha BM and Klöckner CA 2011. Psychological factors in the diffusion of sustainable technology: A study of Norwegian households' adoption of wood pellet heating. Renewable and Sustainable Energy Reviews 15(6): 2756-2765.
Yadav R and Pathak GS 2016. Young consumers' intention towards buying green products in a developing nation: Extending the theory of planned behavior. : Journal of Cleaner Production 135732-739.
Received 15 January, 2021; Accepted 06 July, 2021
11Green Purchase Intention through Attitude and Social Norms

Green Consumerism and Environmental Sustainability: A Study of Attitude towards Environment Friendly Products
Manuscript Number: S-668NAAS Rating: 5.79
Abstract: Concerns regarding the conservation of the environment are increasingly becoming apparent in the conscious business environment. With the mounting concern for limited resources and increasing environmental cost, it has become necessary for the business organizations as well as for the consumers to reconsider their pattern of consumption. This study attempts to explore the factors affecting consumer attitude and perceptions regarding consumption of environment friendly products in India for developing effective environmental strategies to strengthen green consumerism. Primary data was collected from 200 respondents in the Delhi- NCR using Judgment and Convenience sampling technique. The study is descriptive in nature as it aims to determine the attitude, perceptions and motivation of the consumers towards environment friendly products. The consumers are still uncertain to shift their consumption to environment friendly products mainly because of lack of product information, unavailability of the products, increased price, lack of product choices, and assortments. The present study offer useful insights for academicians and practitioners for the formulation of marketing strategies for environmental sustainability.
Keywords: Customer attitude, Environment friendly products, Environmental sustainability, Green marketing, Green consumerism
Nitin Kumar SaxenaJaipuria School of Business, Ghaziabad-201 012, India
E-mail: [email protected]
Indian Journal of Ecology (2021) 48 Special Issue (16): 12-17
Pollution of the air, water, increasing landfills,
deteriorating green cover and forests and usage of chemicals
and synthetics in daily consumption of products has also
exposed man to a large number of diseases and chronic
ailments. People from all walks of life have gradually begun to
understand the gravity of the effects of their daily actions on
the environment and taken cognizance of the fact that a
strong action to protect their environment and adopting eco-
friendly alternatives is the answer of the day. Consumer
behavior has undergone a tremendous change over the
years. Today, consumption of goods is not limited to physical
features, attributes or the intangible aspects like brand alone.
There is enough evidence to show that consumers are today,
realizing the economic liabilities with such a process, ready to
pay more for such environmental products. Green marketing
is a significant answer to this issue. and is not only an
effective remedy towards preserving the natural environment
and its precious resources but also prove to be a source of
product differentiation to manufacturers and retailers.
Marketers viewed this event as business opportunities, and a
number of organizations formulated and implemented these
long-term, provident environmental and can be used to
effectively position their brands and product in the minds of
their customers and build a sustainable marketing strategy
for the same.
The consumer willingness and adoption of green
practices that protects their long-term interests has gained
precedence in recent times (Axsen et al 2012). Green
marketing is regarded as an all-inclusive strategic
management practice that accomplishes the consumers'
needs and without having any negative impact on nature and
human welfare. Akter (2012) has specified that businesses
should incorporate green benefits when strategizing their
marketing strategies. Organizations should not only trump to
be green, but they must also embrace the green concepts in
developing, promoting, pricing, and distributing green
products (Mohajan 2011).
Wu and Chen (2014) specified that the green consumer
is prejudiced by external factors (culture, family, and media)
and internal factors (psychological and demographic
variables). Kauffman et al (2012) have posited that media
and governments play a major role in creating awareness
about green concerns. The communication plank attempts to
enhance consumer awareness through different
media/platforms to communicate organizational commitment
to the environment (Pickett-Baker and Ozaki 2008). There is
an increasing demand for green products over chemical
products which are otherwise cheap and conveniently
available (Shukla and Saxena 2010). The concern for the
environment has led to a more eco- friendly consumption,
called 'Green Consumerism' (Moisander 2007). More and
more people have become conscious about their personal
consumption habits and have brought lifestyle changes to
reduce the adverse impact on the environment. The urban

Indian customers are very much aware about the green
products and they don't hesitate to pay some extra amount
while buying green products. The majority of customers
consider that package is the most important element of the
green products (Vernekar and Wadhwa 2011). Majority of the
consumers still lack 'green' knowledge and because of such
low awareness towards green products organizations are still
not pushing towards developing more green products nor are
they working hard on green packaging (Kaur 2015). Relevant
literature points out that since organic products are
commonly considered as healthy and encourage a
responsible l i festyle, health and environmental
consciousness affect attitude towards organic products
(Chryssohoidis and Krystallis 2005). Studies in health care
and wellness also indicate that appearance consciousness is
also an important factor in developing an attitude towards
environmental products (Marcoux 2000). This study is an
attempt to explore the influence of green marketing
awareness and green marketing efforts in consumers'
purchase intentions. The main aim was to identify the various
determinants influencing consumer's purchase decision for
environment friendly products, analyze the impact of the
Purchase Decision determinant and to explore the
relationship between awareness and purchase intention.
MATERIAL AND METHODS
Conceptual Model and Hypothesis: Based on the research
problem, following is the proposed conceptual model for the
study.
Based on the model, following hypothesis were
proposed
H :01 Green Marketing Efforts is positively associated with
Purchase Intention
H :02 Health Appearance and Consciousness is positively
associated with Purchase Intention
H :03 Interpersonal Influence is positively associated with
Purchase Intention
H :04 Eco Habits is positively associated with Purchase
Intention
H :05 Eco Literacy is positively associated with Purchase
Intention
H :06 Awareness is positively associated with Purchase
intention
Research instrument: The study focused on primary data to
study the consumer perception and attitude towards
environment friendly products, their trust in the claims of
green marketers and willingness to purchase green
products. Environmental consciousness is measured using a
fifteen- item scale taken from Dunlap (2000), health
consciousness, using an eleven-point scale from Oude
Ophius (1989) and appearance consciousness on a seven-
point scale adapted from Carr et al (2000). The second part
focused on understanding the level of literacy amongst
consumers with regard to environmental knowledge and also
investigated the impact of interpersonal influence on building
attitude and perception towards environmental products
using five item scale from Ellen et al (1997) and Bearden et al
(1989), respectively. The third part of the questionnaire has
evaluated the impact and influence of attitude towards
building purchase intention and buying behavior. The
responses were measured using a five–point Likert scale.
The last section of the questionnaire is intended to capture
the information related to demographic factors like age,
gender, education and income.
Method of data collection and sample : The responses
were collected from 207 respondents in the Delhi NCR using
Judgment and Convenience sampling technique.
Respondents were selected on the basis of their usage
patterns of environment friendly products. Initially 230
questionnaires were floated out of which 218 were received,
out of which only 207 were complete in every respect.
Tools and techniques used to analyze the data: Factor
analysis using Varimax Rotation, has been employed on
univariate variables to determine the factors influencing
consumer's purchase decision for environment friendly
products. The factorial design was conducted to understand
the association of consumer attitudes and behavior with the
purchase intention towards environment friendly products.
After identification of the factors, a correlation analysis was
done to study the relationship between variables. Finally,
multiple regression can be employed to analyze and make
predictions based on the relationship that exists between two
variables.
RESULT AND DISCUSSION
Demographic profile: The demographic profile of
respondent is given in Table 1.
Determinants influencing consumer's purchase
decision for environment friendly products: Exploratory
Environmental Awareness &
Consciousness
Purchase Intension
Health & Appearance Consciousness: Eco Literacy; Green Marketing
Efforts; International Influence; Eco Habits
Fig. 1. Conceptual model (Author compilation)
13Green Consumerism and Environmental Sustainability

Demographic variable Categories Number Contribution (%)
Age 20-30 Years 65 31.40
31-40 Years 88 42.51
40 Plus 54 26.09
Gender Male 91 43.96
Female 116 56.04
Education Undergraduate 62 29.95
Postgraduate 145 70.05
Income Less than 50k 56 27.05
50K to 1 Lakh 71 34.30
1 Lakh & Above 80 38.65
Table 1. Demographic profile of respondents
Kaiser-Meyer-Olkin measure of sampling adequacy 0.931
Bartlett's test of sphericity Approx. Chi-Square 6064.636
df 206
Sig. 0
Table 2. KMO and Bartlett's test
factor analysis (EFA) using the principal component analysis,
PCA) technique was run. The KMO and the Bartlett tests h
yielded desirable values to proceed further with factor
analysis.
The Consumer's purchase decision for green products
is shaped by 5 main determinant factors, namely green
marketing efforts, health appearance and consciousness,
interpersonal influence, eco habits and eco literacy. These 5
factors yield retention of 81.8% the total load. Green
marketing efforts of companies, government, policy makers,
educational campaigns, eco-friendly advertisements and
point- of - purchase marketing efforts and environmentalists
have definitely played an important role in creating
awareness and requisite knowledge about issues
confronting the environment and consumption behavior is
highly impacted by this awareness and consciousness.
Health and Consciousness factor emerged as the second
most important variable that influences the purchase of
environment friendly products. The respondents are
concerned about increasing pollution levels in atmosphere
and contamination in water and food particles generates a
sense of awareness to avoid further usage of chemicals in
daily lives and natural products was given precedence over
chemical laden products. Emergence of interpersonal
influence as a determinant reflects that the Opinion of family,
friends, celebrity endorsement influence the decision
towards green products. Product labeling, information
brochures and organized platforms were found to be
considered by respondents effective in building attitude. Eco
Habits influence consumer decisions for green products like
using cloth shopping bags instead of plastic, segregating dry
and wet waste, car pool, replacing conventional bulbs with
CFL and LED and comprehension of environmental activities
pertaining to recycling, reducing and reusing reflect a strong
conviction for adoption of green products. Eco- Literacy as
one of the determinants that influence consumer decision
towards green products signifies the sense of responsibility
towards environmental conservation, prevention of further
degradation and sentiments of collective stakeholders
through clarity of issues confronting the environment triggers
motivation for consumption of green products.
Impact of the Purchase Decision determinant
influencing the consumer's Purchase Intention for
environment friendly products: Linear Regression was
undertaken to understand the impact of independent
variables (environmental awareness, appearance and health
consciousness, price sensitivity on the dependent variables
of attitude and intention to purchase). The following summary
of the regression provides beta and significance value for
analysis and drawing conclusions
Dependent variable: Purchase intention: The adjusted
value of R is 0.611which indicate that 61.1% of samples are 2
closely fitted to the regression line. All the 5 purchase
decision determinant factors are positively associated with
purchase intention. Health appearance and consciousness
accounts for the maximum significant variance in consumer's
purchase intention, followed by green marketing efforts,
interpersonal influence, eco habits, and eco literacy.
Regression equation model can be drawn up as:
Y = a + b1x1 + b2x2 + b3x3
Y is dependent variable X1, x2, x3… are independent
variables or predictors
Purchase Intention = 3.806 + 0.523*Health Appearance
and Consciousness + 0.365* Green Marketing Efforts +
0.324* Interpersonal Influence + 0.287*Eco habits +
0.212*Eco Literacy
This sets the predictive relationship between the
purchase decision determinant factors with purchase
intention of consumers for green products. In this
perspective, we thereby accept the hypotheses for all the
purchase determinant factors as showing a positive
association with consumer's purchase Intention for green
products.
Awareness and purchase intention: This implies that a
high level of awareness and consciousness to prevent future
degradation has helped build attitude and sense of
responsibility towards ecology amongst respondents. This
emerged as a chief driver to use natural products that can
have a positive impact on the environment.
14 Nitin Kumar Saxena

Items Loading
Product demonstrations have influenced my purchase 0.779
Point-of- Purchase influenced and directed my purchase 0.755
Outdoor Media has attracted me towards purchasing green products 0.755
Eco- friendly advertising influences my purchase for it. 0.735
Educational campaigns created awareness and preference for it 0.709
Govt. Promotional Schemes has created an awareness and interest in green products 0.659
There are fewer brands that can be trusted with organic claims 0.518
Variance:39.665, Reliability (Cronbach Alpha)
I think [Prevents life threatening diseases like, hypertension, diabetes, cancer, etc] 0.885
I think [Is healthier and more nutritious than non- organic food products] 0.796
I think [Is clean and develops a healthy body and mind] 0.689
I think [Is preferred as animal life is safeguarded in its manufacturing process] 0.61
I think Is safe and pesticide free and releases beneficial antioxidants in body 0.527
Variance: 18.224, Reliability (Cronbach Alpha)=0.769
[Green brands add to status symbol] 0.771
[Green Products give me a sense of belonging] 0.659
Interpersonal Influence
[Products endorsed by celebrities bring confidence] 0.568
SI3 Express your level of agreement/ disagreement with the following statements 0.468
[I would like to recommend green products to others] 0.425
Variance: 11.659, Reliability (Cronbach Alpha)=0.912
As per my eco habits in general [I carry cloth or paper bags for shopping.] 0.725
As per my eco habits in general [I spend time and effort in understanding environmental activities, such as recycling and reuse] 0.689
As per my eco habits in general [I prefer carpool to avoid pollution] 0.611
As per my eco habits in general [I segregate wet and dry domestic waste into separate bins at home.] 0.582
As per my eco habits in general [I replace light bulbs with CFL / LED bulbs.] 0.469
Variance: 7.224, Reliability (Cronbach Alpha)= 0.853
I think [I can understand & comprehend the information on packaging] 0.635
I think [I can evaluate the alternatives through reviews on social media. 0.532
I think [It will reduce global warming/ climate change] 0.501
I think [I can opt for environmentally safe constituents (unlike conventional products)] 0.431
Variance: 5.0287, Reliability (Cronbach Alpha)= 0. 0.798
Table 3. Factor analysis for components and variation
R R square Adjusted R square Std. error of the estimate t Sig.
0.785 0.616 0.611 0.70358
Unstandardized coefficients Standardized coefficients
B Std. Error Beta
(Constant) 3.806 113.188 0
Green marketing efforts 0.365 0.033 0.443 10.189 0
Health appearance and consciousness 0.523 0.033 0.598 15.365 0
Interpersonal influence 0.324 0.033 0.236 7.215 0
Eco habits 0.287 0.033 0.241 7.365 0
Eco literacy 0.212 0.033 0.231 7.015 0
Table 4. Regression coefficient (purchase decision)
15Green Consumerism and Environmental Sustainability

Model R R2 Adjusted R e2 Std. error of the estimate
Aware 0.742 0.55 0.545 0.69855
Unaware 0.913 0.833 0.825 0.78589
Table 5. Regression of awareness
Parameter Unstandardized coefficients
Standardized coefficients Collinearity statistics
Aware B Std. Error Beta t Sig. Tolerance VIF
(Constant) 3.893 0.035 112.984 0 0.998
Green marketing efforts! 0.361 0.035 0.346 10.388 0 0.998
Health appearance and consciousness 0.553 0.035 0.528 15.836 0 0.999
Interpersonal influence 0.266 0.035 0.255 7.652 0 0.999
Eco habits 0.246 0.035 0.238 7.155 0 0.998
Eco literacy 0.264 0.035 0.248 7.425 0 ..996
Unaware B Std. Error Beta t Sig. Tolerance VIF
(Constant) 4.703 0.595 7.905 0.001
Green marketing efforts 0.181 0.371 0.144 0.605 0.643 0.535 1.685
Health appearance and consciousness 0.562 0.302 0.478 1.886 0.136 0.632 1.581
Interpersonal influence 0.351 0.324 0.325 1.082 0.352 0.458 2.158
Eco habits 1.481 0.478 0.777 2.48 0.073 0.501 2.658
Eco literacy 0.44 0.392 0.298 1.124 0.324 0.588 1.72
Table 6. Regression coefficient (Awareness)
CONCLUSIONS
The study reveals that despite growing awareness and
consciousness towards the environment, the decision to shift
consumption pattern still remains at bay. Consumers are still
not very convinced about organic products due to lack of
information, high prices and in some instances, sheer lack of
availability of certain brands at the usual outlets. This must be
considered by marketers to critically evaluate the factors that
can motivate green consumerism. Brands need to recognize
growing consumer concerns regarding usage of these
products and help dispel fears, uncertainties and myths
associated with organic products. Shifting from unorganized
to organized retailing will increase the brand consciousness
and the growing retail sector will accelerate the growth of the
adoption of environment friendly products. Other ways to
increase the awareness and adoption of the green products
is to introduce these products on all leading ecommerce
websites which will open all the pin codes of India for
delivering the same.
REFERENCESAkter J 2012. Consumer Attitude towards Green Marketing in
Bangladesh. (1): 157-166.ASA University Review 6
Arndt DS, Baringer MO and Johnson MR 2010. State of the climate in 2009. (7): Bulletin of the American Meteorological Society. 91122-131
Axsen J, TyreeHageman J and Lentz A 2012. Lifestyle practices and
pro environmental technology. (1): 64-Ecological Economics 8274
Bearden WO, Netemeyer RG and Teel JE 1989. Measurement of consumer susceptibility to interpersonal influence. Journal of Consumer Research 15 (4): 473-481.
Carr T, Harris D and James C 2000. The Derriford Appearance Scale (DAS-59): A new scale to measure individual responses to living with problems of appearance. British Journal of Health Psychology 5 (2): 201-215.
Cherian J and Jacob J 2012. A study of Green HR practices and its effective implementation in the organization: A review. International Journal of Business and Management 7 (1): 25-33.
Coddington Walter 1993. Environmental Marketing: Positive Strategies for Reaching the Green Consumer. McGraw-Hill Inc. New York, USA. p: 56
Dunlap RE 2008. The new environmental paradigm scale: From marginality to worldwide use. The Journal of Environmental Education 40 (1): 3-18.
Fishbein M, Jaccard J, Davidson AR, Ajzen, I and Loken B 1980. Predicting and understanding family planning behaviors. In Understanding attitudes and predicting social behavior. Prentice Hall. p. 80
Ishaswini N and Datta SK 2011. Pro-environmental concern influencing green buying: A study on Indian consumers. International Journal of Business and management 6 (6): 124-133.
Jacquelyn A 1992. Industry's response to green consumerism. Journal of Business Strategy 13 (4): 3-7.
Kaufmann R, Panni M and Orphanidou Y 2012. Factors affecting consumers' green purchasing behavior: An integrated conceptual framework. (31): 50-69.Amfiteatru Economic 15
Kaur R 2015. Green marketing: Consumer's Attitude towards eco-friendly products. (2): 128- Journal of Business Management 6136.
16 Nitin Kumar Saxena

Krystallis A and Chryssohoidis G 2005. Consumers' willingness to pay for organic food: Factors that affect it and variation per organic product type. (5): 320-343.British Food Journal 107
Laroche M, Bergeron J and Barbaro-Forleo G 2001. Targeting consumers who are willing to pay more for environmentally friendly products. (6): 503-Journal of Consumer Marketing 18520.
Mohajan H 2011. Green marketing is a sustainable marketing system in the twenty-first century. International Journal of Management and Transformation 6 (2): 23-39.
Mohr LA, Eroǧlu D and Ellen PS 1998. The development and testing of a measure of skepticism toward environmental claims in marketers' communications. (1): Journal of Consumer Affairs 3230-55.
Nicola M and Michael JP 1995. Using strategic alliances to develop credible green marketing. Journal of Consumer Marketing12(2): 4-18.
Ophuis PO 1989. Measuring health orientation and health consciousness as determinants of food choice behavior: Development and implementation of various attitudinal scale, pp. 1723-1725. GJ Avlonitis, NK Papavasiliou & AG In:Kouremenos (eds.), Proceedings of 18th Ann. Conf. Eur. Marketing Academy: Marketing thought and practice in the 1990's, EMAC, Athens.
Pickett-Baker J and Ozaki R 2008. Pro-environmental products: Marketing influence on consumer purchase decision. Journal of Consumer Marketing 25(5): 281-293.
Poortinga W, Steg L and Vlek C 2004. Values, environmental concern, and environmental behavior: A study into household energy use. (1): 70-93.Environment and Behavior 36
Pujari D, Wright G and Peattie K 2003. Green and competitive
influences on environmental new product development performance. (8): 657-671. Journal of Business Research 56
Roberts JA and Bacon DR 1997. Exploring the subtle relationships between environmental concern and ecologically conscious consumer behavior. (1): 79-Journal of Business Research 4089
Saxena NK and Shukla T 2018. Precursors of Green Marketing: An Exploratory Study, pp 247-255. In: Sarkwal L (eds). Management Research & Innovation. Bharti Publications, New Delhi, India
Shukla T and Saxena NK 2019. Impact of Demographic Variables on Green Marketing: Customer Awareness and Environmental Sustainability, p 131-143. In: Singh, S (eds). Business Sustainability in the 21st Century: Managing People, Planet and Profit. Bloomsbury Publication, New Delhi, India
Vernekar DS and Wadhwa P 2011. Green Consumption: An Empirical study of consumers' attitudes and perception regarding Eco-Friendly FMCG Products, with special reference to Delhi and NCR region (1): 64-74. 1
Vining J and Ebreo A 1990. What makes a recycler? A comparison of recyclers and non-recyclers. (1): Environment and Behavior 2255-73.
Wong V, Turner W and Stoneman P 1996. Marketing strategies and market prospects for environmentally-friendly consumer products. (3): 263-281. British Journal of Management 7
Wu SI and Chen YJ 2014. The impact of green marketing and perceived innovation on purchase intention for green products. International Journal of Marketing Studies 6 (5): 81-87.
Yeon Kim H and Chung J 2011. Consumer purchase intention for organic personal care products. Journal of Consumer Marketing 28 (1): 40-47.
Received 16 January, 2021; Accepted 05 May, 2021
17Green Consumerism and Environmental Sustainability

Antecedents of Organic Food Consumption in Delhi NCR
Manuscript Number: S-669NAAS Rating: 5.79
Abstract: The consumption of organic food in increasing rapidly in the country. It has a significant impact on the environment, individuals and public health. This is an attempt to understand the antecedents of organic food and try to re-establish the relationship between the attributes of organic food, the utilitarian and hedonic attitudes and consumer purchase intentions. The SOR model has been used to support the theoretical framework for conducting the research on organic food products. The nutritional values, sensory appeal, environmental concern price and natural content of organic food products have significant and positive relationship on utilitarian and hedonic attitudes of the consumer. Even utilitarian and hedonic attitudes have a positively strong relationship on consumer purchase intentions for organic food products.
Keywords: Organic food, Utilitarian attitude, Hedonic attitude, SOR model, Green marketing, Purchase intention
Sanjib Bhattacharjee Vinod Sharma *, and Priti Dubey1
LNCT University Bhopal-462 042, India1CHRIST (Deemed to be University), Delhi NCR-201 003, India
*E-mail: [email protected]
Indian Journal of Ecology (2021) 48 Special Issue (16): 18-22
The organic food industry is witnessing astounding
growth but one that is limited to the top of the pyramid
triggered by the fear for health. This needs to be tapped into
further to increase the market size. After the initial surge
unless the producers of organic food are able to overcome
the perceived barriers and reach at least the middle if not the
bottom of the pyramid, where most consumers consider the
use of organic food to be just a fad indicative of being
prosperous remaining sustainable would be a challenge
(Bhattacharjee et al 2021). Hence, this study looked at the
antecedents of consumer buying behavior for organic foods
and tried to establish the relationship between the
components that stimulate the consumer the most and its
influence on the perception and attitude of the consumer with
the SOR model as the underpinning theory. Exploratory
Factor Analysis, Confirmatory Factor Analysis and Structure
Equation Modeling confirmed that nutritional value, natural
values, sensory appeal, environmental concerns, has the
most influence on developing the attitude to purchase.
Equipped with this knowledge of current Indian consumers
the manufacturers can try and leverage this information
through their advertisements and other promotions to reach
out to more consumers in the same segment of affluent
consumers and new potential consumers who are loyal
conventional food consumers. Decades back, the problem of
India's increased dependence on food imports and the
subsequent outflow of funds found a solution in the green
revolution. But this solution in turn appears to have created
additional problems by way of destruction of the fragile eco
system and harm to both people and planet. While the
economic benefits of the use of pesticides are undeniable,
the costs seem to far outweigh these benefits. Studies
indicate that they contaminate the air, soil, water thereby
having a toxic influence on all living beings (Aktar et al 2009).
The health hazards including leukemia, lymphoma,
Parkinson's and other potential harmful effects on mental
health and reproduction have been studied (Ansari et al
2014). There have been if not an equal but a considerable
number of studies that have also made claims to the contrary.
These studies did not find any harmful influence of
conventional food on human health (Savage 2016).
But the fear is real for many and they appear to have
found a solution in 'jaivik' farming, the Indian term used to
denote organic farming. Organic implies that it is free from
toxins and that the entire value chain has also maintained
these organic considerations (ASSOCHAM and E&Y
2018).The potential of the organic market is tremendous as it
is expected to grow at a CAGR of over 23% by 2023
(Techsciresearch 2018).India has a long way to go though, as
the current market share of organic produce is less than 1%
(ASSOCHAM and E&Y 2018). There are numerous reasons
why the move to organic products is difficult, like the
inefficient current production process and lack of complete
information about the organic products. But one of the most
significant factors could be consumer perception about these
products. Organic products are yet to evolve from being
perceived as a product meant for classes alone to one that is
perceived to be accessible to the masses as well. This is
extremely important for accelerating the growth story. This
journey has several road blocks ranging from high prices of
organic products to lack of awareness among most of the
conventional food consumers. While it would be interesting to
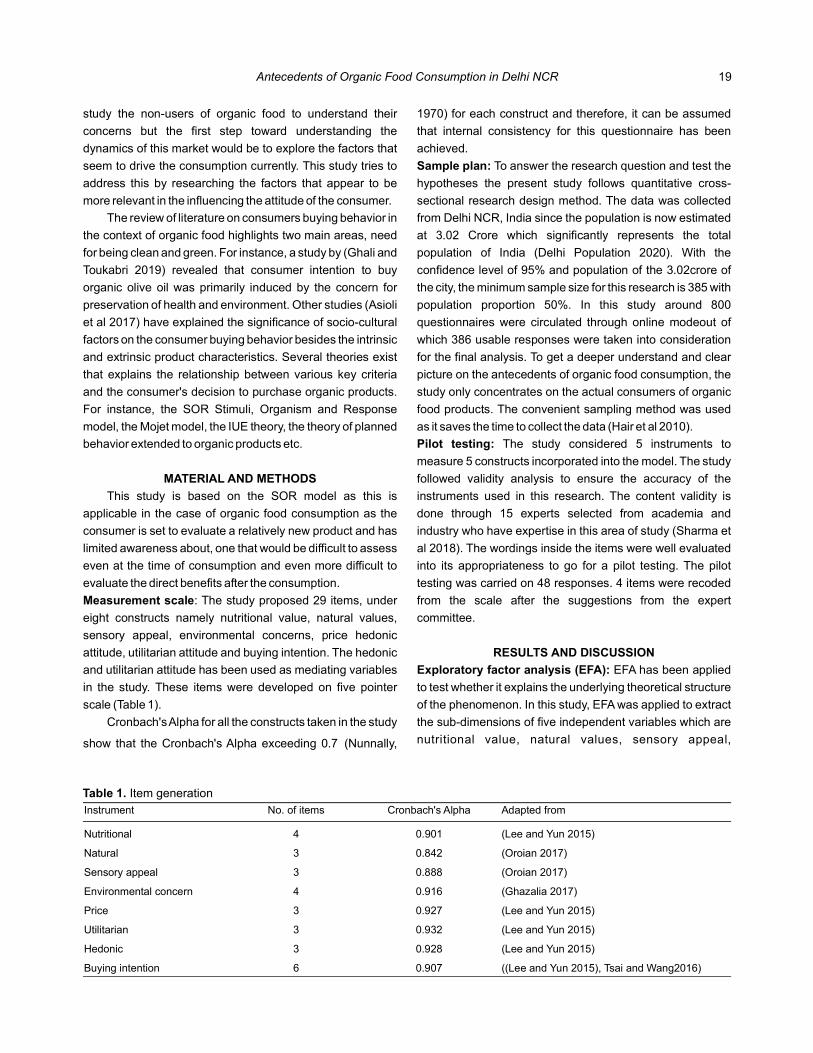
study the non-users of organic food to understand their
concerns but the first step toward understanding the
dynamics of this market would be to explore the factors that
seem to drive the consumption currently. This study tries to
address this by researching the factors that appear to be
more relevant in the influencing the attitude of the consumer.
The review of literature on consumers buying behavior in
the context of organic food highlights two main areas, need
for being clean and green. For instance, a study by (Ghali and
Toukabri 2019) revealed that consumer intention to buy
organic olive oil was primarily induced by the concern for
preservation of health and environment. Other studies (Asioli
et al 2017) have explained the significance of socio-cultural
factors on the consumer buying behavior besides the intrinsic
and extrinsic product characteristics. Several theories exist
that explains the relationship between various key criteria
and the consumer's decision to purchase organic products.
For instance, the SOR Stimuli, Organism and Response
model, the Mojet model, the IUE theory, the theory of planned
behavior extended to organic products etc.
MATERIAL AND METHODS
This study is based on the SOR model as this is
applicable in the case of organic food consumption as the
consumer is set to evaluate a relatively new product and has
limited awareness about, one that would be difficult to assess
even at the time of consumption and even more difficult to
evaluate the direct benefits after the consumption.
Measurement scale: The study proposed 29 items, under
eight constructs namely nutritional value, natural values,
sensory appeal, environmental concerns, price hedonic
attitude, utilitarian attitude and buying intention. The hedonic
and utilitarian attitude has been used as mediating variables
in the study. These items were developed on five pointer
scale (Table 1).
Cronbach's Alpha for all the constructs taken in the study
show that the Cronbach's Alpha exceeding 0.7 (Nunnally,
Instrument No of items. Cronbach's Alpha Adapted from
Nutritional 4 0.901 (Lee and Yun 2015)
Natural 3 0.842 (Oroian 2017)
Sensory appeal 3 0.888 (Oroian 2017)
Environmental concern 4 0.916 (Ghazalia 2017)
Price 3 0.927 (Lee and Yun 2015)
Utilitarian 3 0.932 (Lee and Yun 2015)
Hedonic 3 0.928 (Lee and Yun 2015)
Buying intention 6 0.907 ((Lee and Yun 2015), Tsai and Wang2016)
Table 1. Item enerationg
1970) for each construct and therefore, it can be assumed
that internal consistency for this questionnaire has been
achieved.
Sample plan: To answer the research question and test the
hypotheses the present study follows quantitative cross-
sectional research design method. The data was collected
from Delhi NCR, India since the population is now estimated
at 3.02 Crore which significantly represents the total
population of India . With the (Delhi Population 2020)
confidence level of 95% and population of the 3.02crore of
the city, the minimum sample size for this research is 385 with
population proportion 50%. In this study around 800
questionnaires were circulated through online modeout of
which 386 usable responses were taken into consideration
for the final analysis. To get a deeper understand and clear
picture on the antecedents of organic food consumption, the
study only concentrates on the actual consumers of organic
food products. The convenient sampling method was used
as it saves the time to collect the data . (Hair et al 2010)
Pilot testing: The study considered 5 instruments to
measure 5 constructs incorporated into the model. The study
followed validity analysis to ensure the accuracy of the
instruments used in this research. The content validity is
done through 15 experts selected from academia and
industry who have expertise in this area of study (Sharma et
al 2018). The wordings inside the items were well evaluated
into its appropriateness to go for a pilot testing. The pilot
testing was carried on 48 responses. 4 items were recoded
from the scale after the suggestions from the expert
committee.
RESULTS AND DISCUSSION
Exploratory factor analysis (EFA): EFA has been applied
to test whether it explains the underlying theoretical structure
of the phenomenon. In this study, EFA was applied to extract
the sub-dimensions of five independent variables which are
nutritional value, natural values, sensory appeal,
19Antecedents of Organic Food Consumption in Delhi NCR

Dimensions CR AVE MSV ASV
Nutritional 0.912 0.711 0.163 0.077
Natural 0.941 0.683 0.321 0.211
Sensory appeal 0.918 0.695 0.301 0.198
Environmental concern 0.909 0.659 0.298 0.199
Price 0.929 0.674 0.401 0.244
Utilitarian 0.911 0.599 0.398 0.278
Hedonic 0.923 0.696 0.399 0.275
Buying intention 0.909 0.659 0.400 0.302
Table 2. Convergent and discriminant validity
Measure to assess model fit Best-fit measure
CFA results
SEM results
Probability value (p-value) <0.05 0.000 0.016
Chi square (CMIN) 197.731 10.289
Degrees of freedom (DF) 97 3
CMIN/DF 1 to 5 2.059 3.430
Goodness of fit (GFI) > 0.9 0.941 0.993
Comparative fit index (CFI) > 0.9 0.933 0.995
Root mean square residual (RMR) < 0.05 0.044 0.021
Table 3. Model fitness indices
Fig. 1. Structural model
environmental concerns, and price and two mediating
variables such as hedonic attitude, utilitarian attitude. The
analysis of the data was done with SPSS 23 version.
Confirmatory factor analyses: Convergent and
discriminate validity were tested using confirmatory factor
analysis on the eight dimensions. The convergent validity
was confirmed through the values of Composite Reliability
(CR>0.7) and average variance (Bagozzi and Yi 1988)
explained (AVE>0.5) for each dimension.(Hair et al 2010)
The results confirm the same where the value of CR &
AVE is well within the fit limit. To measure the discriminate
validity the value of AVE shall be greater than the values of
Maximum Shared Variance (MSV) & Average Shared
Variance (ASV) . The test (Gefen et al 2000, Hair et al 2010)
results evidence to the discriminant validity (Table 2) for each
dimension where AVE is greater than MSV and ASV.
The AMOS 25 version was used to test the conceptual
framework and proposed hypotheses. The SEM results
confirm that the model is emerging out to be a good fit with the
value of CMIN/DF is 3.430 (Table 3).
The results of the hypotheses testing and confirm
previous workers ( , that Tirelli 2014 Rana and Paul 2017)
there is a significant relationship between nutritional value
and utilitarian attitude 510; t = 11.009) and hence H01 (β = 0.
is supported (Table 4). This finding is similar to (Tirelli
2014).The analysis indicates that sensory appeal has a
positive and significant relationship with utilitarian attitude (β
= 0.273; t = 6.119) and hence H02 is supported. This is in
confirmation with earlier studies , (Oroian 2017 Lee and Yun
2015).The result also confirms that environmental concern is
positively and significantly related to utilitarian attitude (β =
0.137; t = 3.865) and hence H03 is supported. This is in line
with results of studies conducted in the past , (Tirelli, 2014
Ghazalia et al, 2017 Basha et al 2015), . The natural values
have significant relationship with utilitarian attitude (β =
0.085; t = 2.685) and hence H04 is supported. This
hypothesis is similar to the previous studies conducted that
confirms that the , . The analysis (Tirelli 2014 Oroian 2017)
indicates that there is less relationship of price with utilitarian
attitude -0.052; t = -1.768) and therefore H05 is (β =
supported at 10% level.
The results confirm previous research by Tirelli (2014)
that There is a significant relationship between nutritional
value and hedonic attitude ( = 0.229; t = 3.652) and hence β
H06 is supported. The analysis indicates that sensory appeal
has a positive and significant relationship with hedonic
attitude ; t = 3.233) and hence H07 is supported. (β = 0.196
This is in confirmation with earlier studies . The (Tirelli 2014)
result also confirms that environmental concern is positively
and significantly related to hedonic attitude ( = 0.309; t = β
6.471) and hence H08 is supported. This is in line with earlier
studies , . The natural (Basha et al 2015, Ghazalia et al 2017 )
values have significant relationship with hedonic attitude (β =
0.177; t = 4.106) and hence H09 is supported. This
hypothesis is similar to the previous studies , (Tirelli 2014 Lee
and Yun 2015, Oroian 2017 ), . The analysis indicates that
there is significant and inverse relationship of price with
hedonic attitude ; t = -2.163) and therefore H010 is (β = -0.084
supported. The hypotheses H011 & H012 is also supported
where the utilitarian attitude ( = ; t = -6.849) and β 0.490
hedonic attitude ( = ; t = 11.815) is leading to buying β 0.692
20 Sanjib Bhattacharjee Vinod Sharma, and Priti Dubey

Relationship Beta (β) t-Value p-Value
Nutritional -> Utilitarian 0.510 11.009 0.000
Sensory appeal -> Utilitarian 0.273 6.119 0.000
Environmental concern -> Utilitarian 0.137 3.865 0.000
Natural -> Utilitarian 0.085 2.685 0.007
Price -> Utilitarian -0.052 -1.768 0.077
Nutritional -> Hedonic 0.229 3.652 0.000
Sensory appeal -> Hedonic 0.196 3.233 0.001
Environmental concern -> Hedonic 0.309 6.471 0.000
Natural -> Hedonic 0.177 4.106 0.000
Price -> Hedonic -0.084 -2.163 0.031
Utilitarian -> Buying Intention 0.490 6.849 0.000
Hedonic -> Buying Intention 0.692 11.815 0.000
Table 4. Hypotheses testing-Direct effect
Relationships Direct effect β t- Value Significant(p>0.05)
Indirect effect β
t- Value Significant(p>0.05)
Effect
Utilitarian attitude Buying →intention
0.490 6.849 Yes( = 0.000)p
0.334 4.104 Yes( =0.000)p
Partial mediation(Complimentary)
Hedonic attitude Buying intention→ 0.692 11.815 Yes( = 0.000)p
0.421 6.411 Yes( =0.000)p
Partial mediation(Complimentary)
Table 5. Hypothesis testing- Indirect effect
intentions for organic food product. The path analysis model
cumulatively contributes 71 per cent of the change in the
dependent variable that is buying intention of organic food
products. This is considered to be quite good as this is among
the very few studies in the country which tries to identify the
antecedents of organic food consumption amongst Indian
consumers.
The findings of hypotheses 13 and 14. indicate that the
indirect relationship between the independent variables
(utilitarian attitude and hedonic attitude) and the dependent
variable (buying intention), which is partially significant
(0.334, 0.421, . and ) (Table 5) The association between
utilitarian and hedonic attitude on buying intention is reduced
but remains significant as complimentary.
CONCLUSION
The hypotheses testing results indicate that all the
variables taken for the study having significant influence on
the consumer buying intention for organic food. However, it
reflects that customers are most concerned about the
nutritional ingredients when it comes to its functionality as an
aspect from the utility perspective for organic food products.
It implies the belief that compared to conventional products,
organic products are much highly perceived to carry
nutritional content as an interest of a consumer. Besides
nutritional content, sensory appeal has the second highest
level of significance when it comes to utilitarian perspective of
a customer. It reflects the fact that consumers are more
occupied towards the attractiveness of the product when it
comes to food especially about its taste, smell and texture.
From the perspective of SEC (Search-Experience-
Credence) attribute model, consumers consider the food
color, shape, size and even aroma in few cases referred to as
a search attributes helping in decision making.
Customers find environmental concern more as a
hedonic satisfaction than utility perspective. Consumers are
increasingly getting aware towards environmental hazards
due to various bad practices across the world. Price as a
factor seems to have negative influence in consumers'
purchase intention, but its effect is far lesser than all other
variables. In the Indian context, the current scenario reflects
that customers are fewer prices sensitive which implies the
fact that marketers have a huge potential to tap in when it
comes to targeting price sensitive customers.
From the conceptual framework, the mediating variables
like Utilitarian and Hedonic attitudes have positive and
significant influence on consumers' purchase intention. The
hedonic attitude has higher level of significance compared to
utilitarian attitude. This reflects that organic food consumers
are more likely to be emotional than rationalistic when it
comes to making a purchase decision. Tough, this study
represents the target population whose consumer behavior
21Antecedents of Organic Food Consumption in Delhi NCR

is related to people residing in metro cities since it is
conducted in Delhi, NCR region in India. However, the results
and its interpretation may not be applicable for pan India. This
study is only limited to those set of customers who are
consuming organic food products, but not for those who are
not availing it. Besides this, there is also scope to consider
many other variables like societal norms, trust, etc. as
moderating variable to see its influence on consumers'
purchase intention.
REFERENCESAktar M, Sengupta D and Chowdhury A 2009. Impact of pesticides
use in agriculture: Their benefits and hazards. Interdiscip Toxicology 2(1): 1-12.
Ansari M, Moraiet M and Ahmad S 2014. Insecticides: Impact on the environment and human health. Environmental Deterioration and Human Health 1: 99-123.
Asioli D, Aschemann-Witzel J, Caputo V, Vecchio R, Annunziata A, Næs T and Varela P2017. Making sense of the ''clean label'' trends: A review of consumer food choice and discussion of industry implications. (1): 58-Food Research International 9971.
ASSOCHAM and E&Y 2018. The Indian organic market: a new p a r a d i g m i n a g r i c u l t u r e . R e t r i v e d f r o m www.assocham.org/newsdetail.php?id=6835.
Bagozzi PR and Yi Y 1988. On the evaluation of structural equation models. . (1): Journal of the Academy of Marketing Science 1674-94.
Basha MB, Cordelia M, Mohd FS, Hafezali IH and Milad AS 2015. Consumers attitude towards organic food. Procedia Economics and Finance 31: 444-452.
Bhattacharjee S, Reddy KP and Sharma V 2021. Covid stimulating organic food consumption: Exploring factors of consumer buying behaviour. (14): 59-63. Indian Journal of Ecology 48
Delhi Population 2020. Retrieved from World Population Review. Retrived from https://worldpopulationreview.com/world-cities/delhi-population.
Gefen D, Starub D and Boudreau M 2000. Structural equation modeling and regression: Guidelines for research practice. Communications of AIS 7. (7): 1-78.
Ghali Z and Toukabri M 2019. The antecedents of the consumer purchase intention: Sensitivity to price and involvement in organic product: Moderating role of product regional identity. Trends in Food Science and Technology.90: 175-179.
Ghazalia E, Soon PC, Mutum DS and Nguyen B 2017. Health and cosmetics: Investigating consumers' values for buying organic personal care products. Journal of Retailing and Consumer Services 39. : 154-163.
HairJF, Black WC, Babin BJ and Anderson RE 2010. Multivariate Data Analysis: A Global Perspective (7th ed. ed.). New Jersey: Pearson Prentice Hall. p: 388
Lee HJ and Yun ZS 2015. Consumers' perceptions of organic food attributes and cognitive and affective attitudes as determinants of their purchase intentions toward organic food. Food Quality and Preference 39 : 259-267.
Nunnally JC 1970. . Introduction to psychological measurementMcGraw-Hill, New York.
Oroian CF 2017. Consumers' attitudes towards organic products and sustainable development: A case study of Romania. MDPI- Sustainability 9(9): 1559
Rana J and Paul J 2017. Consumer behavior and purchase intention for organic food: A review and research agenda. Journal of Retailing and Consumer Services 38: 157-165.
Savage S 2016. Why i don't buy organic, and why you might not want to either. Retrieved from https://www.forbes.com/.
Sharma V, Jeanne P, Mohanta S and Liza EA 2018. Influence of the dimensions of CSR activities on consumer purchase intention. Innovative Marketing 14(1): 23-32.
SharmaV, Joseph S and Poulose J 2018. Determinants of consumer retention strategies for telecom service industry in Central India. Problems and Perspectives in Management 16 (2): 306-320.
Sharma V, Sonwalkar J and Kapse M 2013. Consumer Purchase Behaviour for Green Products. International Journal of Economics & Business Administration 1(4): 50-65.
TechScirRsearch 2018. India organic food market by product type (organic beverages, organic cereal & food grains, organic meat, poultry & dairy, organic spices & pulses, organic processed food & others), Competition Forecast & Opportunities, 2013–2023. Retrieved from .https://www.techsciresearch.com
Tirelli C 2014. Influences of product attributes on sojourners' food purchase decisions. (2): 251-271.British Food Journal 116
Tsai CT and Wang YC 2016. Experiential value in branding food tourism. Journal of Destination Marketing and Management 6(1): 56-65.
Received 11 May, 2021; Accepted 28 June, 2021
22 Sanjib Bhattacharjee Vinod Sharma, and Priti Dubey

Analysis of Food Consumption Expenditure Patterns for Developing Sustainable Business Practices
Manuscript Number: S-670NAAS Rating: 5.79
Abstract: Food consumption patterns are said to be near ideal variable since it is one of the most important commodities that ensure human survival. The patterns within the consumption as well as between different types of food items to different levels of consumption varies with respect to the macroeconomic conditions. The consumption expenditure for cereals, pulses and pulse products, edible oil, milk and milk products, meat, fish and egg, vegetables and fruits, shows an increasing trend in India and in Karnataka. The income elasticity for all food categories are lesser in urban sectors of Karnataka than the rural sector which indicates that the income of the rural households is lesser and the increase in income is also lesser compared to that of the Urban-Karnataka. The business enterprises can aim at sustainable consumption practices through the pricing strategies, product design and distribution channels.
Keywords: Food consumption expenditure, Income elasticity, Sustainable business practices, Per-capita expenditure, Product diversification
Anita Grace Gopurathingal and Joshy Joseph KarakunnelDepartment of Economics, Christ (Deemed to be University), Bengaluru-560 029, India
E-mail: [email protected]
Indian Journal of Ecology (2021) 48 Special Issue (16): 23-28
Food being the foremost component in the consumption
basket and plays a key role in determining the human well-
being. Traditionally, the household consumption expenditure
deemed to be an important macroeconomic variable to study
the economic conditions. The consumption pattern varies
widely between the advanced economies and the emerging
economies. However, the consumption has improved more
than ever before and humanity is provided with more options
and opportunities to exercise their capabilities to attain
several functioning. Consumption signifies the behavior used
by the members of the society to determine the social status
as well as the position in the social hierarchy, which is built
over the shoulders of several criteria like power, wealth, class
and so on. With regard to India's consumption pattern, at the
time of independence the major challenge to the
policymakers was to rejuvenate the base of the economy, that
is the agricultural sector, and also to feed the poverty struck
population to prevent another round of famine and the
resulting deaths. The consumption pattern has changed over
time since independence due to various factors including the
initiatives by government to boost up the economy such as
green revolution, public distribution system, the New
Economic Policy of 1991 and the resulting liberalization,
privatization and globalization measures and so on. The
policy framework in India is multi-dimensional when it comes
to the programs and initiatives with respect to the production
and consumption of the food items. They are multi-
dimensional due to the fact that they aim at incentivizing the
agrarian community on one hand while ensuring the
availability of the consumables for the general public at
affordable prices on the other. It is significant to understand
the food-consumption expenditure pattern and changes in it
over time in order to evolve sustainable business practices.
Modern welfare states experience the evolutionary growth in
terms of the State functioning, including the eradication of
poverty and ensuring supply of basic amenities like food and
water to the people. In India, a major part of the public policy
targets the provision of affordable food, clean and hygienic
water to the general public which otherwise cannot avail or do
not have access to (Grace 2019). Thus, it is necessary to
estimate the patterns of consumption expenditure of various
food items comparing the national and state level trends.
Similarly, the calculation of income elasticity of food
consumption expenditure is useful for the enterprises to
evolve sustainable business practices in relation to
consumption and marketing. In Hubli-Dharwar in Karnataka
has shown the expenditure on liquid milk and the usage of
liquid milk for the impetus of drinking got larger with the rising
income of the family. Price was of paramount comparative
importance and brand was of minimal comparative
importance in the overall decisions pertaining to the purchase
of liquid milk (Shetti et al 2006). The monthly per capita cereal
consumption expenditure reduced from 13.5 Kgs to 10.73
Kgs in rural sector of Karnataka and declined from 10.87 Kgs
to 9.7 Kgs in urban sector and for pulses it has remained
stable over the years of study in both rural and urban areas.
The monthly per capita expenditure on food has risen from
Rs. 167 to Rs. 283 in rural areas and it has increased from Rs.

236 to Rs. 447 in urban areas (Pavitra et al 2009). An attempt
to forecast the food demand in India from 1998 to 2020 was
carried out and some alternate income growth scenarios
were used to predict the trends in the upcoming years that
along with a growth in the per capita income growth rate from
3.5 percent to 5.5 percent per annum and there will be
simultaneous expansion in the demand for various food items
(Bhalla and Hazell 1997). Over the time, the nutritional levels
of the rural poor have worsened over the span of time due to
this trend (Kumar et al 2007).
There are studies capturing the food expenditure
elasticities at international level. The research carried out in
Pakistan throws light on the consumption patterns of this
South Asian country, which is predominantly an agrarian
economy and several households live under poverty. The
findings of the study confirm the traditional approach using
Engel's law. However certain commodities were not adhering
to the Engels law. The household consumption patterns in
Bangladesh indicated that the levels of poverty in the
Bangladeshi community were so high that many poor
households had to spend a major-share of their total income
on expenditure food items. The study in Malawi showed the
overall income elasticity for food is high as .84 which
indicates a meekness in the food availability for the
population in the country (Ecker and Qaim 2008). The
income elasticity of food, calorie and nutrient intake in Africa
was studied by taking 148 countries out of which 54 countries
in Africa by using meta-analysis. The meta sample includes
1523 food income elasticities, 369 nutrient income
elasticities, and 123 calorie-income elasticities. The results
showed that the elementary food items show lower-income
elasticities while other food items show high elasticity of
income (Colen et al 2018). The core concern of the
sustainable development is inter and intergenerational equity
built upon three pillars which are economy, environment and
society. (Mensah 2019). Investigations are being done for
developing social marketing kind of approach to develop
sustainable consumption practices. (Bocken 2017) Macro
marketing strategies can be adopted as an effective
sustainable business practice method in the developed
countries and developing countries as well (Peterson and
Lunde 2016). The development of sustainable business
practices in relation to consumption and marketing is the
need of the hour. It is not all that easy with the studies
focusing more on the trends prevailing at the national level.
Coupled with a clear focus on food consumption expenditure
state level, the analysis of income elasticity of food
consumption can act as a catalyst to formulate suitable
business practices which in turn can be sustained in the long
run. The null hypothesis is stated as there is no significant
association between the income and food consumption
expenditure of the household.
MATERIAL AND METHODS
The study is quantitative in nature, built on secondary
data. The major source of data regarding the household food
consumption expenditure is various rounds of National
Sample Survey Organization (NSSO). The time period is
from 1991 to 2011 which signifies the post-reform period in
India. The trends of food consumption expenditure patterns
have been captured through the graphical methods. The
income elasticity of food consumption expenditure is
estimated using linear regression analysis.
Food consumption expenditure: The theoretical model
indicates that the consumption expenditure on food
increases as income increases. But the increase in food
consumption expenditure is less than proportionate to the
increase in income of the household. This relationship
between the increases in food consumption expenditure with
respect to income is explained through Engel's law. The log-
log model is used to estimate the relative change in the
consumption expenditure with respect to change in income of
the household. In this study, the total expenditure is taken as
the proxy variable for income of the household.
The model can be represented by, log Zi = a + b log Yi
Where Zi = expenditure, e on ith food item, a = slope
coefficient, b = intercept term, which is income elasticity of the
household, Yi = income of the household
RESULTS AND DISCUSSION
Trends in food consumption expenditure pattern in
Karnataka: The major food items included in the consumer
expenditure survey are cereals, pulses, edible oil, milk and
milk products, meat, fish and egg, vegetables and fruits. A
comparative analysis has been made on the trend in monthly
per-capita consumption expenditure (MPCE) on these seven
broad categories of food items between India and Karnataka.
The time period starts from year of New Economic Reforms,
1991 to 2011, which is from 47 round to 68 round of th th
consumer expenditure survey of NSSO.
Cereals: During the reference period from 1991 to 2011, the
consumption expenditure on cereals has increased in India
and in Karnataka. The pattern of consumption expenditure at
the national level and the state level has been showing a
similar scale during the reference period. It shows that for the
62 and 63 rounds, the consumption expenditure for nd rd
cereals is lesser in Karnataka compared to the national level.
The trend line equation for Karnataka shows that over the
years moving from one round to another the monthly per
capita consumption expenditure has been increased by
24 Anita Grace Gopurathingal and Joshy Joseph Karakunnel

8.013 percent for cereals and that of India is 8.64 percent.
Pulses and pulse products: The consumption expenditure
on pulses and pulse products in India and Karnataka is in
accordance with the data of NSSO about the pulse and pulse
products, it includes gram, tur and other pulses In general,
consumption expenditure on pulses and pulse products is
increasing over the years in India and Karnataka and in India
from the 47 round to 68 round of reference period. The high th th
consumption expenditure in Karnataka was on pulses and
pulse products than at the national level. The sudden
increase in the consumption expenditure occurred at both
national and state level during 55 round and then a stable th
growth in the consumption expenditure till the 63 round and rd
from 66 round onwards, a sudden hike in the consumption th
expenditure of the pulses. The trend line equation for
Karnataka shows that over the years from 47 to 68 rounds th th
of NSSO, the monthly per capita consumption expenditure
for pulses and pulse products are increased by 3.30 percent
as moving from one round to another.
Milk and milk products: The expenditure on milk and milk
products in India and in Karnataka is showing an increasing
trend in absolute terms over the reference period. The
increasing trend occurs both at the national and the state
level shows that the consumption expenditure on milk and
milk products is comparatively lesser in Karnataka with
respect to the consumption expenditure at the national level.
During the 63 survey round, a sudden increase in the rd
consumption expenditure can be seen in the consumption
expenditure at national and state level. The trend line
equation for Karnataka shows that over the years moving
from one round to another, the monthly per capita
consumption expenditure for milk and milk products are
increasing at a rate of 6.18 percent while that for India is 8.29
Round Cereals Pulses and pulse products Milk and milk products
Karnataka India Karnataka India Karnataka India
47th
53.1908100 56.57401 11.99532 10.8138 19.11147 25.58232
50th
63.6935978 67.17369 12.47807 11.51568 22.99483 31.21663
52nd
82.7169561 79.70440 16.27874 14.21229 25.76958 38.73473
53rd
82.1600421 87.26617 17.72175 15.62335 31.81635 45.19051
55th
107.154292 107.2002 25.43425 20.66101 41.57832 50.50703
56th
99.6572709 99.34203 22.6729 18.8995 40.36431 51.13698
59th
100.293058 99.56822 22.09861 19.49658 41.69703 53.62524
62nd
89.7856782 107.1241 22.33967 22.35669 42.51569 58.98275
63rd
98.2820912 115.7656 26.82703 25.75815 48.34494 66.21482
68th
164.055820 159.5288 56.88874 45.48056 100.2851 136.2238
Table 1. MPCE on cereals, pulses and pulse products, and milk and milk products
Source: Various rounds of NSSO (47 to 68 round)th th
percent which shows that the increase in consumption
expenditure for milk and milk products are lesser for
Karnataka when compared to that of India.
Edible oil: In absolute terms, the consumption expenditure on
edible oil is increasing over the years of reference period and
over the years the increasing trend is similar in nature for both
the national level and the state level. The sudden increase in
the consumption expenditure over edible oil in both India and
Karnataka occurred during the 63 round of the consumption rd
expenditure survey (Table 2). The trend line equation for
Karnataka shows that over the years of reference period,
moving from one period to another the monthly per capita
consumption expenditure on edible oil has been increasing at
a rate of 3.39 percent and that of India is 3.15 percent which
shows a similar trend at the national and the regional level.
Meat, fish and egg: The consumption expenditure on meat,
fish and egg is increasing over the years in Karnataka and in
India. A comparative analysis shows that during the 56 th
round, the consumption expenditure in Karnataka is more
than that of the national level and there after again from the
59 round the consumption expenditure in Karnataka is th
similar to that of national level. And from 63 round, it is rd
showing a sudden increase in the consumption expenditure
on meat, fish and egg in Karnataka and in India. The slope
coefficient of the trend line equation for Karnataka is 3.63
which shows that over the years of reference period moving
from one round to another there is an increase of 3.63
percent in the monthly per capita consumption expenditure
and that for India is 3.49 percent which is almost similar in
both the cases at national level and the state level.
Vegetables: The consumption expenditure on vegetables is
increasing over the survey period of 47 round to 68 round. th th
In Karnataka, the consumption expenditure on vegetables is
25Food Consumption Expenditure Patterns

Category Rural Urban Karnataka (Rural & urban)
Food grains 0.700 0.463 0.679
Non-food grains 0.629 0.545 0.618
Milk & milk products 0.711 0.446 0.695
Meat, fish and egg 0.846 0.522 0.814
Total food items 0.698 0.485 0.680
Table 3. Income elasticity of consumption expenditure in Karnataka
Source: Author calculation
lesser compared to that of national level throughout the years
of reference. For the 63 round, sudden increase in the rd
consumption expenditure on vegetables from that of the
previous reference period. The slope coefficient of the trend
line equation for Karnataka is 3.91 which indicates that over
the years moving from one round to another, there is an
increase of 3.91 percent in the monthly per capita
consumption expenditure and that for India is 4.77 percent.
Fruits: The consumption expenditure on fruits is increasing
in both Karnataka and in India. Karnataka is showing a higher
consumption expenditure on fruits than that of the national
level. Over the years of reference period, during the 63 rd
round, it's showing a sudden increase in the consumption
expenditure on fruits at both the national and the regional
level. The trend line equation for Karnataka indicates that as
its slope coefficient is 3.367, over the years of reference
period moving from one round to another, there is an increase
of 3.367 percent in the monthly per capita consumption
expenditure of the households of Karnataka and that of India
is 2.30 percent for fruits which is less than the state level.
The consumption expenditure for cereals, pulses and
pulse products, edible oil, milk and milk products, meat, fish
and egg, vegetables and fruits, shows an increasing trend in
India and in Karnataka. The major food crops that are
produced in Karnataka are cereals and pulses (Economic
Survey Report, Karnataka). The analysis of consumption
expenditure in the case of cereals from 1991 to 2011 shows
an increasing trend, however, from 59 round to 62 round, th nd
indicated a declining trend in comparison with the country
level data. The reasons can be the severe drought that
happened during 2003-04 in Karnataka which reduced the
overall agricultural production which had huge impact on the
consumption expenditure. The reduced supply and
Round Edible oil Meat, fish and egg Vegetables Fruits
Karnataka India Karnataka India Karnataka India Karnataka India
47th 12.56647 15.2173 9.8667 9.4758 10.5329 16.06098 7.519864 4.9720
50th 11.91207 14.3277 10.538 10.891 14.42323 18.99185 9.996002 6.6907
52nd 15.21286 17.9509 13.047 12.842 16.56785 23.66132 9.222622 6.947222
53rd 15.53606 17.8261 15.459 14.284 25.96045 33.47928 13.20792 8.469826
55th 19.24314 20.3350 21.580 18.812 15.72516 22.23201 18.01933 11.46243
56th 19.4316 18.8877 24.942 20.231 25.60438 32.36173 17.06293 11.54109
59th 24.42298 27.2312 19.417 20.280 29.33183 37.96281 17.19665 13.24348
62nd 25.85501 27.7236 24.002 26.194 30.44758 40.68229 20.83327 15.00698
63rd 29.78634 29.7086 25.602 26.708 32.14572 46.4042 20.9534 16.22442
68th 52.07035 52.6216 57.015 51.708 56.09959 67.45985 53.06716 33.65059
Table 2. MPCE on edible oil, meat, fish and egg, vegetables, and fruits
Source: From various rounds of NSSO (47 to 68 round)th th
increased food prices decreased the consumption especially
of the poorer section in the state. Another important finding
from 63 round for all the food items is the unforeseen rd
increase in the monthly per-capita consumption expenditure
which can be the impact of food inflation on Indian economy
that affected the global economy. The rise in food prices had
a larger impact on the poorer sections so that their monthly
per-capita consumption has shown increasing trend. For the
food items other than cereals and pulses which includes milk
and milk products, meat, fish and egg, vegetables and fruits
also show an increasing trend in consumption expenditure
over the years during the reference years. Thus, the results
reconfirm the findings of the literature available regarding the
pattern of the consumption expenditure of these items over
the years except during 2004-05 during which the state
experienced severe drought.
Income elasticity of food consumption expenditure: The
seven categories of food items are again classified into food
grains, non-food grains, milk and milk products, meat, fish
and egg.
The income elasticity for rural areas are higher than that
of urban areas for all categories of food items (Table 3). Since
26 Anita Grace Gopurathingal and Joshy Joseph Karakunnel

the Karnataka economy shows a wide disparity between the
rural and urban sectors, the percentage share of income paid
out for food expenditure also varies between the sectors. For
all four categories of food items, including food grains, non-
food grains, milk and milk products, meat, fish and egg the
income elasticity of food expenditure is greater for rural
Karnataka than its urban sector. The income elasticity for all
food categories are lesser in urban sectors of Karnataka than
the rural sector which indicates that the income of the rural
households is lesser and the increase in income is also lesser
compared to that of the Urban-Karnataka. Since food is the
basic necessity for human beings, the proportion of income
spent on food is more for the poorer section. The income
elasticity is maximum for the meat, fish and egg, then for milk
and milk products, followed by food grains and then for non-
food grains. For the Urban-Karnataka, the income elasticity is
higher for non-food grains followed by meat, fish and egg,
then for food-grains and the least for milk and milk products.
The results reconfirm the Engel's law in the context of
Karnataka, which states that as income increases the
expenditure on food consumption also increases but less
than proportionate to the increase in income. It implies that
along with increase in income, the income elasticity of food
consumption expenditure decreases. The urban population
consumes more conspicuous and luxurious food items than
the rural population. The key reasons would include the
social status attached to certain types of food items among
certain communities as well as the geographic proximity of
the consumers. Conspicuous items are often preferred by the
urban population due to their higher income levels and the
availability of such food items in the retail chains,
predominantly found in the urban spaces. Similarly,
processed and superior quality food items are readily
available and are preferred by the urban population than the
rural poor. The rural population tends to consume fewer dairy
products, meat and poultry. One of the reasons for this trend
lies in the fact that certain cultures prohibit the consumption
of certain food items. However, at a macro level this kind of
changes can be brought through several avenues.
Sustainable business practices in relation to
consumption: Sustainable consumption can be defined as
the consumption of goods and services that meets the basic
needs and brings an improvement in the quality of life while
minimizing the use of natural resources and poisonous
materials. It also implies the reduction of the emissions of
waste and pollutants over the life cycle of the service or the
product so as to conserve it for the future generations.
Business practices play a key role in promoting sustainable
consumption. In the light of the seven categories of food
items under consideration, the business enterprises can aim
at sustainable consumption practices through the pricing
strategies, product design and distribution channels.
Comparing the consumption expenditure pattern of rural
area with that of urban areas, shows that urban sector
includes more of milk and milk products and also for meat,
fish and egg as their income is higher compared to that of
rural sector. Food inflation is one of the major factors that
makes the rural people to withdraw or reduce the amount of
consumption of high value products in the consumption
bundle. As the technology expands, business enterprises
can produce more value-added products out of these food
items so as to reach out in the rural sector at relatively
affordable prices which ensures better consumption options
to the rural sector as well. Product diversification, as a
strategy, can help the manufacturers in keeping the
production cost effective. The government should ensure the
environment-friendly production of the commodities through
effective implementation of legal provisions. The government
can regulate the process of production in terms of the quality
and health standards.
Sustainable business practices in relation to marketing:
Meeting the required quality or standards is a crucial factor in
pricing the product. The details of the quality of the products
must reach to the customer base through adequate
marketing strategies. The fair pricing can be ensured by the
effective management of supply chain, uninterrupted supply
of raw materials, quality assurance techniques, proper use of
media etc. Quality can be improved by ensuring the use of
high-quality raw materials and the sustainable practices of
packaging and distribution which are eco-friendly in nature.
In this connection, the firms with global aspirations can
design their marketing strategy, keeping the challenges in
terms of quality of the product and competition from rivals.
The food items for which the income elasticity is higher
indicates the larger proportion of income spent on particular
items. Thus, special focus on the marketing of these items in
regions where these commodities are preferred, will fetch
more returns. Therefore, a relook into the marketing
strategies, both in urban and rural areas, based on the
consumption expenditure pattern and the preferences
towards certain food items will help in maximizing the
revenue of firms. It also points towards the need of
government intervention by creating a conducive business
environment in rural areas with special emphasis on start-
ups. This would be possible with the help of subsidies and
adequate credit facilities ensured by the government. The
support given to new entrepreneurs in rural areas can play a
crucial role in income and employment generation. Creation
of value-added and supplementary products from the
agricultural and farm products is another aspect to focus
27Food Consumption Expenditure Patterns

upon. In this context product diversification can be followed
as a route to ensure consistent growth in the market. Another
important dimension is the creation of more outlets which
may possibly increase the proximity to the variety products
available.
CONCLUSION
The study primarily focuses on the food consumption
expenditure patterns at a national level as well as at a
regional level for of Karnataka along with the income
elasticity of food consumption expenditure. The food
consumption expenditure pattern for Karnataka and India
follows a similar trend for most of the food items under the
purview of the study. The income elasticity of the food
consumption expenditure in rural areas of Karnataka is found
to be greater than that of urban area which is applicable for all
food items under the study. The findings are relevant from
policy perspectives as the food consumption expenditure
patterns are important for the formulation of social welfare
policies. Sine food security is the center stage of the policy-
making and no administrator can ignore its importance in a
welfare state the analysis of consumption expenditure is
inevitable.
REFERENCESBhalla GS and Hazell P 1997. Food grains demand in India to 2020: A
preliminary exercise (52): . Economic and Political Weekly 32150-154.
Bocken N 2017. Business-led sustainable consumption initiatives: impacts and lessons learned. Journal of Management
Development 81-96.
Colen L, Melo P, Abdul-Salam Y, Roberts D, Mary S and Gomez Y Paloma S 2018. Income elasticities for food, calories and nutrients across Africa: A meta-analysis. : 116-Food Policy 77132.
Chandra Deb N 1986. Consumption pattern in rural Bangladesh. The Bangladesh Development Studies 14 (1): 1-28.
Ecker O and Qaim M 2008. Income and price elasticities of food demand and nutrient consumption in Malawi, Proceedings of 2008 Annual Meeting, July 27-29, 2008, American Agricultural Economics Association, Orlando, Florida.
Grace A 2019. An empirical analysis of food consumption expenditure pattern in Karnataka. M.Phil Dissertation, CHRIST (Deemed to be University, Bangalore, India.
Gupta DB 1968. A comparison of consumption patterns in Uttar Pradesh and Madras: A study of inter-regional variations with reference to India. (2): 129-144. Indian Economic Review 3
Iyengar NS 1967. Some estimates of engel elasticities based on national sample survey data. Journal of the Royal Statistical Society. Series A (General) 130 (1): 84.
Kumar P, Mruthyunjaya and Dey MM 2007. Long-term changes in indian food basket and nutrition. Economic and Political Weekly42(35): 3567-3572.
Mensah J 2019. Sustainable development: Meaning, history, principles, pillars, and implications for human action: Literature review. (1) doi.org/10.1080/ Cogent Social Sciences 523311886.2019.1653531
Oldiges C 2012. Cereal consumption and per capita income in India. Economic and Political Weekly 47 (6): 63-71
Pavitra BS, Basavaraja H, Kiresur VR and Mahajanshetty SB 2009. An economic analysis of food consumption in Karnataka. Karnataka Journal of Agricultural Sciences 22 (4): 840-845.
Peterson M and Lunde M 2016. Turning to sustainable business practices: A macro marketing perspective. Marketing in and for a Sustainable Society (Review of Marketing Research, Vol. 13), Emerald Group Publishing Limited, Bingley, pp. 103-137.
Siddiqui R 1982. An analysis of consumption pattern in Pakistan. The Pakistan Development Review 21 (4): 275-296.
Received January, 2021; Accepted May, 202120 16
28 Anita Grace Gopurathingal and Joshy Joseph Karakunnel

Exploring Factors of Consumer Perception and Attitude towards Organic Food Consumption in India
Manuscript Number: S-671NAAS Rating: 5.79
Abstract: Organic food market is witnessing an exponential growth in India. However, contradictory to expectations consumption of organic foods as compared to conventional food is still at nascent stage and many empirical studies have indicated this trend. Many of the food retailers have started organic food business across the nation but consumption level has remained significantly low. Impetus for this study came from this contrarian trend and it is crucial to garner insights from awareness and attitude of consumers towards organic food products in terms of why there is gap between awareness and attitude and actual consumption. While there are many empirical studies, not many studies have been conducted in India context. This study is based on descriptive research design constituting a sample of 250 respondents and the data was collected by administering a questionnaire on Likert scale. Study revealed that there was significant gap between perception and attitude of consumers. Factors namely health benefits and concern for environment have higher influence Price sensitivity. Thus, this study helps to bring about an understanding regarding the awareness and attitude of consumers towards organic food products in terms of opportunities ahead and overcoming unaddressed issues.
Keywords: Organic food, Perception, Attitude, Retailers, Consumers behaviour
Vedha Balaji and A.S. Suresh CHRIST (Deemed to be University), Bangalore-560 029, India
E-mail: [email protected]
Indian Journal of Ecology (2021) 48 Special Issue (16): 29-33
India is one of the countries with the largest area under
organic cultivation along with Argentina, Brazil, China and
Uruguay. Local markets have taken off in many cities of south
and eastern part of Asia, and Delhi and Bangalore are some
of the Indian cities which are witnessing enhanced internal
consumption of organic products (Willer and Kilcher 2009,
Bhattacharjee et al 2021). Organic agriculture is a holistic
production management system which promotes and
enhances agro-ecosystem health, including biodiversity,
biological cycles, and soil biological activity. “Certified
Organic” is a term given to food products produced according
to a set of standards. Organic standards define a set of
practices for production and handling which must be followed
for the farmer's products to be labelled and sold as “Organic”.
Organic agriculture systems and products are not always
certified and are referred to as “Non-certified organic
agriculture or products". Production cost for organic food is
typically higher because of greater labour inputs per unit of
output. Marketing and distribution chain for organic products
is relatively inefficient and costs are higher because of
relatively small volumes. Ghosh et al (2018) studied that food
shopping is often a low-involvement activity where
consumers do not utilize every bit of their knowledge due to
time constraints. Ahuja (2017) stated that improving the
awareness of organic food production among potential
consumers is necessary and promote organic food as a
lifestyle product. Mukherjee et al (2018) in their study on
organic food businesses identified on the supply side, the
high charge of obtaining organic certification and a lack of
support on organic inputs in India. On the demand side,
consumers are ready to pay a high price due to progress in
awareness and health consciousness. The requirement for
investment in the supply chain and logistics infrastructure will
increase direct farmer-company linkages which will decrease
expenses by taking out mediators and will also enhance
farmers' income, ensure traceability and product ownership.
Pandurangaroa and Rao (2017) stated that the presence of
an effective marketing system is the necessity for growing
organic produce in India. Their study was based on organic
food market and the marketing efforts of companies based in
Mysore. It was concluded that organic food stores are
confined within city limits causing irregularity in their
availability. Kumar and Gulati (2017) based on their
experimental study identified that a majority of the Indian
population live in rural and tier 2 and tier 3 cities and are
hence the biggest untapped markets organic food products.
Running and Schrank (2018) studied that taste and
health were the primary motives of consumers towards
consumption of organic food products. Pandey and Khare
(2017) identified that there is there is a gap in consumer's
attitude towards the organic food products and their
consumption patterns. Ranaa and Paul (2017) explained that
health awareness was considered as the best predictor of
consumer perspective and practice towards organic food

products. Environmental concern was another significant
motivating constituent and the main reason for the
development of positive customer attitude towards organic
food. Despite the improved market, organic food generation
is not picking up steam due to the idea that producers lack
both the support and agricultural information required
towards crop security. The objectives of this study are to
understand the awareness among consumers of organic
food products and to identify the significance of health
benefits, price sensitivity and concern for environment on the
attitude and perception of organic food products. In addition
to identify major factors under health benefits, price
sensitivity and concern for environment that significantly
influences consumer attitude and perception towards
organic food.
MATERIAL AND METHODS
This research was undertaken to find out which among
the factors viz., health benefits, concern for environment and
price sensitivity is more predominant in preference for
organic food products (fruits and vegetables only) by Indian
consumers. This research is also to understand the
consumer's buying attitude and perception towards organic
food products.
Hypotheses
Hypothesis 1 (H ):1 Health benefits, price sensitivity and
concern for environment influence buying attitude of
consumers.
Hypothesis 2 (H ):2 Health benefits, price sensitivity and
concern for environment does influence buying perception of
consumers.
Hypothesis 3 (H ):3 Consumer preference towards organic
food products is significantly higher than conventional food
products.
Research design: Survey method was used to collect
primary data using structured questionnaires as the tool for
data collection. This survey was conducted in the city of
Bangalore between the months of November and February,
2020. The questionnaire so designed was administered
personally to each of the respondents with interventions from
the researcher, whenever necessary. Potential respondents
were approached while they were shopping in super markets
located in the city of Bangalore. Respondents were asked to
fill up the questionnaire and to return it to the researcher. For
the present study, questionnaires were distributed to around
500 respondents, from whom 250 correctly completed
questionnaires have been obtained, yielding a response rate
of 50 percent. 250 questionnaires were incomplete or
partially filled and hence could not be considered for analysis.
Questionnaires were distributed personally to all
respondents. Wherever required, the questionnaire was
explained by the researcher in vernacular language and was
filled personally.A pilot survey was done initially based on
which the sequence and language of questions were
changed for better understanding and also to make it easy for
the respondents to answer. Pilot survey of 30 respondents
was conducted. The sample was chosen on the basis of
convenience sampling method and was confined to
Bangalore. The respondents were approached personally.
The main objective was to generate additional information
i.e. items of interest to respondents and delete items that
were not considered to be relevant.
The sample included those respondents who had
purchased organic food products previously. 63 percent of
the sample respondents belonged to the age group of 18-25
years. The age group between 26-35 years constituted 28
percent respondents of the sample studied. 9 percent of the
respondents belonged to the above 35 years category. Male
respondents constituted 60 percent of the sample and female
respondents constituted the balance 40 percent. Almost an
equal ratio of respondents with annual income of < 2 lakhs/
annum (35%), 2-5 lakhs/ annum (34%) and 5-10 lakhs/
annum (27%) was the constitution of respondents for this
organic food study.
Data collected was analyzed using statistical tools and
factor analysis to determine the health benefits, price
sensitivity and concern for environment influencing the
purchase of organic food products. The Cronbach alpha
value is 0.777 indicating satisfactory internal consistency of
the scale used for this study.
RESULTS AND DISCUSSION
H -1 Health benefits, price sensitivity and concern for
environment have equal influences in buying attitude of
consumers' better chances for purchasing of organic foods.
Inference: The significance value of the factors should be
greater than 0.05 if the null hypothesis needs to be accepted.
But in this case, 'health consciousness' has 0.038
significance and 'price' has 0.017 significance which is less
than 0.05. Only 'concern for environment' factor is exhibiting
the value greater than 0.05.This implies to H and reject 1
conclude that the attitude of consumers towards
consumption of organic food products do not have equal
influences on health benefits, price sensitivity and concern
for environment.
H -2 Health benefits, price sensitivity and concern for
Cronbach's alpha Number of Items
0.777 20
Table 1. Reliability statistics
30 Vedha Balaji and A.S. Suresh

Factors of organic food products Mean value
Health for conventional 7.676
Health for organic 7.884
Price for conventional 7.428
Price for organic 7.952
Environment concern for conventional 5.916
Environment concern for organic 6.2
Table 2. Mean comparison between three factors for conventional and organic food
Kaiser-Meyer-Olkin measure of sampling adequacy .779
Bartlett's Test of Sphericity Approx. Chi-Square 2254.609
Df 231
Sig. .000
Table 3. KMO and Bartlett's Test
Fig. 1. Scree plot
environment have equal influences in buying perception of
consumers.
Inference: In this test, all the three factors have significance
value greater than 0.05. 'Health consciousness' has 0.534,
'concern for environment' has 0.851 and 'price sensitivity' has
0.807 significance. This indicates that the consumers have
the perception that all these three factors contribute with no
significant difference for consumption of organic food
products. This implies that hypothesis H 2 should be accepted
in this case.
H -3 Consumer preference towards organic food products is
significantly higher than conventional food products.
Inference: In this hypothesis, it can be observed that the
significance value of all the three factors for conventional and
organic food products remains greater than 0.05. This
determines that the consumer preference towards organic
food products is significantly higher than conventional food
products. To justify the higher value, Table 2 gives a better
clarity on the mean difference between the three factors of
conventional food products and of organic food products.
The mean value of all the three factors of organic factors
possesses higher value than the three factors of
conventional food products.
Hence, the hypothesis H3 will be accepted in this case
that proves the consumer preference of organic food
products in terms of health benefits, price sensitivity and
concern for environment has higher influence over
preference of conventional food products.
Factor analysis is a data reduction tool. The main
objective of using factor analysis is to determine the minimum
number of common factors that would satisfactorily produce
the correlations among the observed variables.
Bartlett's test of sphericity (Chi-Square = 2254.609, p <
0.05) thereby indicating that it has not generated identity
matrix and Kaiser-Meyer-Olkin (KMO) measure of sampling
adequacy is 0.779 which is greater than 0.5 showed
feasibility to undertake factor analysis of the 20 items in the
scale.
A principal component analysis was (PCA) was run on a
22-question questionnaire that measured desired
characteristics of organic food products from 250
respondents. The overall Kaiser-Meyer-Olkin (KMO)
measure was 0.779. Bartlett's test of sphericity was
statistically significant indicating that the data was
factorizable. Eigen values represent the total variance
explained by each factor. Varimax rotation was used to
measure the individual factor loadings and the results
suggest that the Eigen value, for the extracted 6 factors, was
greater than recommended level of 1 (Table 4). This reveals
that from the 22 items included in factor analysis, 6
dimensions were extracted and emerged with a cumulative
variance of 64.710 % of variance. The six-component
solution explained 64.710 % of the variance.
Principal component analysis and varimax rotations
have resulted in the formation of three factors (Table 4)
explaining a cummulative variance of 64.710 % with primary
loadings of all the items whose values are greater than 0.5 to
form the best possible factor structure.
Health consciousness has emerged as the most
important determinant of the factors affecting consumer
preference towards purchase of organic food products with a
total Eigen value of 2.376 and variance of 27.510. Major
variables constituting this factor include calcium, vitamins,
nutrients, proteins, potassium, minerals and carbohydrates.
Environment concern has emerged as the second most
important determinant of the factors affecting consumer
preference towards purchase of organic food products with a
total Eigen value of 6.052 and variance of 10.799. Major
31Organic Food Consumption in India
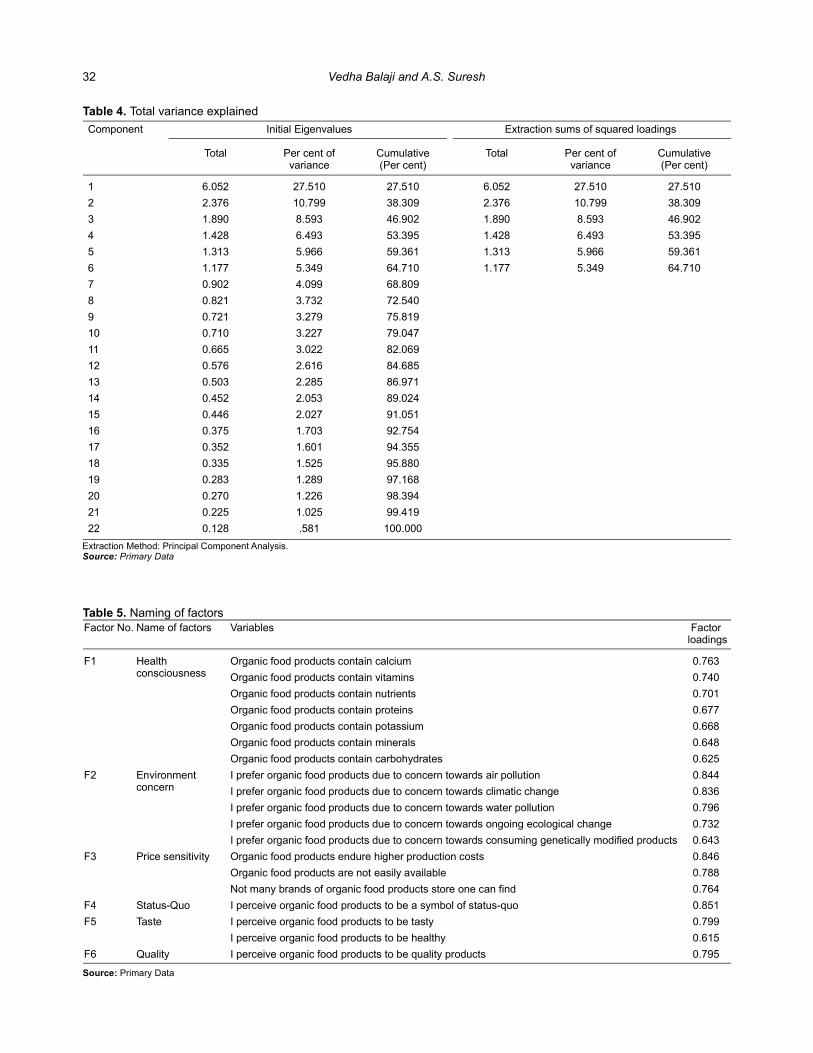
Component Initial Eigenvalues Extraction sums of squared loadings
Total Per cent of variance
Cumulative (Per cent)
Total Per cent of variance
Cumulative (Per cent)
1 6.052 27.510 27.510 6.052 27.510 27.510
2 2.376 10.799 38.309 2.376 10.799 38.309
3 1.890 8.593 46.902 1.890 8.593 46.902
4 1.428 6.493 53.395 1.428 6.493 53.395
5 1.313 5.966 59.361 1.313 5.966 59.361
6 1.177 5.349 64.710 1.177 5.349 64.710
7 0.902 4.099 68.809
8 0.821 3.732 72.540
9 0.721 3.279 75.819
10 0.710 3.227 79.047
11 0.665 3.022 82.069
12 0.576 2.616 84.685
13 0.503 2.285 86.971
14 0.452 2.053 89.024
15 0.446 2.027 91.051
16 0.375 1.703 92.754
17 0.352 1.601 94.355
18 0.335 1.525 95.880
19 0.283 1.289 97.168
20 0.270 1.226 98.394
21 0.225 1.025 99.419
22 0.128 .581 100.000
Table 4. Total variance explained
Extraction Method: Principal Component Analysis.Source: Primary Data
Factor No. Name of factors Variables Factor loadings
F1 Health consciousness
Organic food products contain calcium 0.763
Organic food products contain vitamins 0.740
Organic food products contain nutrients 0.701
Organic food products contain proteins 0.677
Organic food products contain potassium 0.668
Organic food products contain minerals 0.648
Organic food products contain carbohydrates 0.625
F2 Environment concern
I prefer organic food products due to concern towards air pollution 0.844
I prefer organic food products due to concern towards climatic change 0.836
I prefer organic food products due to concern towards water pollution 0.796
I prefer organic food products due to concern towards ongoing ecological change 0.732
I prefer organic food products due to concern towards consuming genetically modified products 0.643
F3 Price sensitivity Organic food products endure higher production costs 0.846
Organic food products are not easily available 0.788
Not many brands of organic food products store one can find 0.764
F4 Status-Quo I perceive organic food products to be a symbol of status-quo 0.851
F5 Taste I perceive organic food products to be tasty 0.799
I perceive organic food products to be healthy 0.615
F6 Quality I perceive organic food products to be quality products 0.795
Table 5. Naming of factors
Source: Primary Data
32 Vedha Balaji and A.S. Suresh

variables constituting this factor include concern for air
pollution, climatic change, water pollution, ecological change
and use of genetically modified organisms in the regular
cultivation of food products, Price sensitivity has emerged as
the third important determinant of the factors affecting
consumer preference towards purchase of organic food
products with a total Eigen value of 1.890 and variance of
8.593. Major variables constituting this factor include
production costs, availability of products and brand name of
store. Status Quo emerged as factor number four with a total
Eigen value of 1.428 and variance of 6.493 and constituted a
single variable. Taste emerged as the fifth factor with a total
Eigen value of 1.313 and variance of 5.966 containing two
variables namely taste and health. Quality of product
emerged as factor six with a total Eigen value of 1.177 and
variance of 5.349 and constituted a single variable.
CONCLUSIONS
Health consciousness, concern for environment and
price sensitivity as the major three factors that influences
consumers' perception towards organic food products. Some
other factors that are perceived as important towards
consumption of organic food products are status-quo, taste
and quality. There is significant difference between the
perception and attitude of consumers towards organic food
products. The attitude of consumers towards consumption of
organic food products do not have equal influences on health
benefits, price sensitivity and concern for environment.
Consumers perceive that health benefits, price sensitivity
and concern for environment have equal influences on
consumption of organic food products. Consumer preference
towards organic food products is significantly higher than
conventional food products.
REFERENCESAertsens J, Mondelaers K and Van Huylenbroeck G 2009.
Differences in retail strategies on the emerging organic market.
British Food Journal 111(2): 138-154.
Ahuja K 2017. Organic food-way ahead for Healthy Life and a Smarter Choice. IOSR Journal of Business and Management 19(9): 46-51.
Barik AK 2017. Organic Farming in India: Present Status, Challenges and Technological Break through. The Third International Conference on Bio-resource and Stress Management Jaipur. p. 101-110.
Bhattacharjee S, Reddy KP and Sharma V 2021. Covid stimulating organic food consumption: Exploring factors of consumer buying behaviour. (14): 59-63. Indian Journal of Ecology 48
Curvelo IG and Alberto E 2019. Purchase intention of organic food under the influence of attributes, consumer trust and perceived value. (3): 198-211Emerald Publishing Limited 26
Ghosh S, Barai P and Datta B 2018. Identify customer involvement during organic food purchase through FCB Gri. Journal of International Food & Agribusiness Marketing 31. (3): 237-254.
Huddleston P, Whipple J and Matt RN 2009. Customer satisfaction in food retailing: Comparing specialty and conventional grocery stores. International Journal of Retail & Distribution Management 37(1): 63-80.
Khare A and Pandey S 2017. Role of green self-identity and peer influence in fostering trust towards organic food retailers. International Journal of Retail & Distribution Management 45(9): 969-990.
Michaelidou N and Hassan LM 2007. The role of health consciousness, food safety concern and ethical identity on attitudes and intentions towards organic food. International Journal of Consumer Studies 32(2): 163-170.
Shireesh M and Rao CVS 2018. A study on urban consumer perception towards organic food products. Journal of Business and Management 20(6): 18-23
Mukherjee A, Kapoor A and Dutta S 2018. Organic food business in India: A survey of companies. Research in Economics and Management 3(2): 72-90.
Pandurangarao D, Chiranjeevi K and Rao D 2017. Factors affecting consumers to buy organic food products in Hyderabad and Secuderabad. International Journal of Business and Management Invention 6(3): 24-30.
Ranaa J and Paul J 2017. Consumer behavior and purchase intention for organic food: A review and research agenda. Journal of Retailing and Consumer Services 38: 157-165.
RunningK and Schrank Z 2016. Individualist and collectivist consumer motivations in local organic food markets. Journal of Consumer Culture 35(7): 1-18.
Saravanara M and Pillai S 2017. An analysis of the green product attributes that entice green purchasing: A study done in bangalore city. International Journal of Asian Social Science 7(3): 199-205.
Received January, 2021; Accepted May, 202119 16
33Organic Food Consumption in India

Pan-generation investigation of Sustainability Factors in Conjunction with Personality Aspects Influencing Consumer's
Perception towards Sustainable Marketing
Manuscript Number: S-672NAAS Rating: 5.79
Abstract: Sustainability has become the goal of governments and organizations worldwide since the 2030 agenda of the United Nations was declared. The large number of products has emerged in the market that claims to be green and sustainable or promise to serve a social cause. Even though numerous studies that claim are increasingly conscious of their choices and consumption behaviour there has been a consumersmarked gap between this awareness and the actual behaviour exhibited. In a quest to comprehend the curious gap between the attitude and behaviour of consumers, several studies have endeavored to find a plausible explanation. Marketing specialists have come up with several strategies in order to make sustainable marketing a success but inexplicably still fail to do so. This study proposes a conceptual framework that comprehensively explains the impact of external and internal drivers for a consumer's perception of products that claim to be sustainable in nature, which may eventually explain the attitude-behaviour gap. This has been constructed using well-established consumer behaviour and personality theories. Sample size was calculated using proportion to population method and was derived as 270. Judgment and convenience sampling were used to collect the data through a structured questionnaire. The study uncovered that age influences the attitudes of consumers and both Gen X (cohort born between 1965-79) and Y (cohort born between 1980-96) bear positive attitudes towards sustainable marketing. Pricing had a major influence as well, buyers who ranked high on the 'Conventional' and 'Realistic' interests of the RIASEC personality model had a more positive perception.
Keywords: Generation X and Y, Sustainable marketing, Green, social, Personality, Consumer attitude, Consumer perception
Soumya Singh, A.S. Suresh and Vinod SharmaCHRIST (Deemed to be University), Delhi NCR-201 003, India
E-mail: [email protected]
Indian Journal of Ecology (2021) 48 Special Issue (16): 34-39
The encouragement of sustainable marketing as a key
goal into existing marketing systems has become the most
pressing challenge that businesses and academic
institutions are trying to continuously address worldwide.
Sustainable marketing comprises of the key elements: green
marketing and social marketing. Green marketing is a means
of marketing that facilitates green and sustainable product
( market development through the Sharma et al 2013)
creation of awareness with regard to the nature of products
they are consuming. It also includes the introduction of
sustainable systems and processes into the business model.
Social marketing is a means of marketing that is meant to
prompt pro-social sustainable consumption behaviour
among consumers. This also includes 'cause-related
marketing' wherein the corporate social responsibility
activities of an organization are also utilized for their
marketing communications in order to create brand loyalty by
sharing the ethical values of the organization with
consumers. Given the fact that numerous surveys and
studies have yielded the results that consumers state they
would prefer to associate themselves with organizations that
care about the environment and society, one would believe
green and social marketing would be highly result-yielding
strategies for organizations. Most companies have started
offering environmentally friendly products and started
emphasizing their social activities. However, the
consumption patterns observed have been highly
inconsistent with these claims owing to perceptual barriers to
adoption of such products. (Johnstone and Tan 2015,
Sharma et al 2013). Thus, even though there is a growing
concern for sustainable consumption among consumers
their consumption patterns have been highly inconsistent
with these claims. A multitude of studies have been
conducted to analyze the efficacy of social and green
marketing strategies and activities, in order to determine if
they lead to a positive result in terms of consumer loyalty and
pro-social consumption behaviour. It has been realised that
there exists a wide gap between the attitude of consumers
towards such organizations and their products (Saxena et al
2015), when compared to their actual consumption
behaviour. Ethical and pro-environmental attitudes rarely
ever translate to the same kind of consumption. This
discrepancy has been analysed previously in the terms of
perceptual factors that affect consumers with respect to their
demographic and psychographic backgrounds. This study
proposes a conceptual framework that comprehensively

explains the impact of external and internal drivers for a
consumer's (specifically, Gen X, Gen Y and Generation Z)
perception of products that claim to be sustainable in nature,
which may eventually explain the attitude-behaviour gap.
Strauss–Howe (1991) proposed a generational theory in
which they argued that social generations are cohorts of
people born in the same date range and who share similar
cultural experiences. There are four major categories which
are in existence in the present times. First baby-boomer,
which refers to the cohort born between the end of World
War- II and the mid-1960s. Second, Gen X (cohort born
between 1965-79) and Y (cohort born between 1980-96) is
the age cohort born before the 1980s and after the Baby
Boomers. Third, Generation Y (also known as Gen Y or
Millennials) are the age cohort born between 1984 and 1996.
Fourth, Generation Z (Gen Z) are those people born after
1997.
MATERIAL AND METHODS
The gap between the attitude and behaviour of
consumers is a widely studied issue in consumer behaviour
and has strong implications upon social and green marketing
strategies. There are a large number of factors that affect the
consumer's socially responsible behaviour, which present as
repercussions upon the consumers' perception. In order to
design effective sustainable marketing strategies,
corporations must be aware of the factors that influence
consumers and the level of influence they bear upon socially
responsible consumer behaviour. The comprehension of
these factors will also lead to an enhanced understanding of
the attitude-behaviour gap and hence direct towards
achieving desired socially responsible consumer behaviour.
Hypotheses
Hypothesis 1 (H ):1 Personality bears an influence upon the
DriversDemographic factorsPsychographic factors
Pricing Perception of ConsumersEcolabelling Perceived Quality
Sustainability message elements Perceived TrustworthinessPolicies and Regulations Perceived Benefits to Society/Environment
Community Perceived benefits to Self (functionality)Corporate Social Responsibility
Green/Social AdvertisingGreenwashing
Personality (RIASEC model)RealisticInvestigativeArtisticSocialEnterprisingConventional
attitudes and perceptions of consumers in sustainable
marketing
Hypothesis 2 (H ):2 The generation to which a consumer
belongs has a relationship with their attitudes and
perceptions in sustainable marketing.
Measurement scale: The study aims at understanding why
consumers choose to behave in a manner against their own
professed beliefs and attitudes. Thus, the study adopted a
quantitative method of assessment for the responses
collected from subjects. The population chosen was in the
city of Bangalore (latest data suggests this population size is
129512000). The sampling method was chosen as random
and convenience sampling and the age group of respondents
varied between 16 to 60 years old. These were further
divided into subgroups to differentiate between the X, Y and Z
generations (Bresman and Rao2017, Sharma et al 2018) as
those born before 1980s as X-generation (i.e. Above 40
Years), those between 1980 and 1996 as Y-generation (i.e.
between 24-40 Years of age) and those born after 1997 as Z-
generation (i.e. Ages 23 or less).
The sample size was calculated by utilizing the following
equation:
Sample size = [(z * p (1 - p)) ÷ e ] ÷ [ 1 + ((z * p (1 - p)) ÷ 2 2 2
e N)]2
Where, e: (0.06) error percentage margin in decimal, N:
(129512000) population size, z: z-score (1.96), p = 0.05.
The error margin was taken as 6% and the confidence
level was taken as 95%. Thus, the sample size for this study
is 267. Rounded off, the sample collected was 270. The data
was collected through a questionnaire in the offline and
online mode.
RESULTS AND DISCUSSION
Factor analysis of psychographic drivers: The
Cronbach's Alpha value is .847 (greater than .5) which
indicates that all the statements are highly reliable for factor
analysis. Bartlett's test was conducted to analyse if there is a
correlation between the statements. The hypotheses for
Bartlett's test are as follows:
The value of significance for Bartlett's test was p = 0.000,
which is less than 0.05 (α value), and hence we can reject the
null hypothesis (H ). This implies that the correlation matrix is 0
not an identity matrix and the selected factors have a strong
Kaiser-Meyer-Olkin measure of sampling adequacy .820
Bartlett's Test of Sphericity
Approx. Chi-Square 2187.012
df 120
Sig. 0.000
Table 1. KMO and Bartlett's Tests results
35Consumer's Perception towards Sustainable Marketing

Statements Component 1
I think about the environmental and social impact of a product before making a purchase. .862
I prefer to purchase products that support causes I think are important. .829
I think social-cause supporting products suit my lifestyle aspirations. .817
I prefer to purchase products that support a social or environmental cause. .804
I think eco-friendly green products suit my lifestyle aspirations. .750
I think products that are eco-friendly are more preferable. .665
I think products should address and contribute towards social issues .606
I identify with the green/social brands that I associate myself with. .596
I believe purchase of sustainable products enables me to have better conversations with my peers and social circle.
.556
I think eco-friendly products are useful in representing an important cause .548
Components 2
I purchase a green/social product if I feel it will influence my prestige and image in my society. .853
I am influenced to purchase a green/social product if I feel it will make me feel admired by my social circle. .824
I only purchase a green/social product if I feel it has an impact on my social relationships and what others might think.
.785
I feel I should purchase a green/social product if I have heard of it from my social circle. .514
Component 3
The opinions of my friends and family matter to me when making purchase decisions .754
I feel my social circle has influence over my eco-friendly product choices .596
Table 2. Factor analysis
relationship. The KMO factor e is representative of how
appropriate and adequate the factors chosen for analysis
are. If it is greater than 0.5 it is considered acceptable. In this
case, we observe that the KMO factor value is 0.82. Thus, all
the selected factors are acceptable for analysis.
Three factors were identified with 10, 4 and 2 statements
respectively. The rotation sums of squared loadings indicate
that 61.27% of the data was captured in this analysis and the
first component contributes to this by 33.29%.
The first component can be named the factor of 'lifestyle
aspirations' as all the statements under it relate to the
aspirations of respondents to achieve a sustainable lifestyle.
The most important statement in this factor is 'I think about
the environmental and social impact of a product before
making a purchase' which has a factor loading of .862. This
indicates the importance of this statement. The second
component can be named 'Importance of self-image in
society' as each statement under this indicates the impact of
the respondents' society upon their self-image. The most
important statement in this factor is 'I purchase a green/social
product if I feel it will influence my prestige and image in my
society'. The third factor can be named 'community influence'
as the statements indicate the influence of friends and family
for the respondents when making purchase decisions
regarding sustainable products.
Factor analysis of company-controlled drivers: The
Reliability tests yielded the Cronbach's Alpha value as .797,
which indicates that all the statements are highly reliable for
factor analysis. Bartlett's test was conducted to analyse if
there is a correlation between the statements. The
hypotheses for Bartlett's test are as follows:
H (Null hypothesis):0 The correlation matrix of the company-
controlled driver statements is an identity matrix
H (Alternate hypothesis):a The correlation matrix of the
company-controlled driver statements is not an identity
matrix.
The value of significance for Bartlett's test is p = 0.000
(6), which is less than 0.05 (α value), and hence the null
hypothesis (H ) was rejected. This implies that the correlation 0
matrix is not an identity matrix and the selected factors have a
strong relationship.
The rotated components matrix table displays the factor
loadings assigned to each statement; component wise and
four factors were identified for corporation-controlled drivers.
The rotation sums of squared loadings indicates that 66.57%
Table 3. KMO and Bartlett's Tests results
Kaiser-Meyer-Olkin measure of sampling adequacy
.779
Bartlett's Test of Sphericity Approx. Chi-Square 1238.177
df 78
Sig. .000
36 Soumya Singh, A.S. Suresh and Vinod Sharma

Personality traits N Subset for alpha = 0.05
1 2
Investigative 74 1.89
Social 68 2.06
Artistic 29 2.10
Realistic 41 2.20
Enterprising 26 2.27
Conventional 32 2.72
Table . 5 Tukey's B utput: o Personality traits and perception
Personality traits N Subset for alpha = 0.05
1 2
37-40 Years 54 2.37
31-36 Years 54 2.41
Below 23 54 2.44
Above 40 years 54 2.94 2.94
24-30 Years 54 3.07
Table .6 Tukey's output: Benefits as claimed and age
of the data was captured in this analysis.
The first component was named as the factor
'communication to consumers' since it consists of statements
regarding communication of the corporation's activities to the
consumers. The most important statement in this factor is
'The information I have received from the corporation's
advertising for sustainable causes has motivated me to relate
with social and environmental causes' with a factor loading of
0.752. The second, third and fourth components were named
'unapproachability', 'simple advertising' and 'value-price
relationship' accordingly.
Relationship between personality types and consumer
perception:
H :o1 There is no significant impact of the personality traits on
the perception towards sustainable marketing drivers
H :o2 There is no significant impact of the age group on the
perception towards sustainable marketing drivers
To test the hypothesis, we used One-Way ANOVA and
found that the personality trait does influence the perception
towards sustainable marketing drivers. In order to further
understand whether there is any significant difference among
these personality traits influencing the perception therefore,
Tukey's B test was performed (Table 6).
The results indicate that investigative, social and artistic
personality types form one group and realistic, enterprising
and conventional types of personality form another group.
Hence, we can say that there is a significant personality
Statements Component 1
The information I have received from the corporation's advertising for sustainable causes has motivated me to relate with social and environmental causes.
.752
If advertisements for social products are simple and easy to understand I feel more inclined towards that brand .722
I check the ingredients of products claiming to be eco-friendly before purchase. .677
I pay attention to the packaging on a product to check if a product is social or eco-friendly. .676
The more impact my purchase could have upon the cause, the more I am inclined to make the purchase. .662
Products that advertise their commitment towards social issues influence my purchase decision .655
The knowledge of the company's CSR activities and its impact upon the society makes me inclined towards buying its products
.648
Green labels on products influence my purchase decision. .544
The appeal of the brand/product has made me feel strongly motivated about social and environmental causes. .542
Component 2
I believe truly eco-friendly products are not easily affordable. .702
I feel that the information about the product's sustainability message was too overwhelming and excessive. .595
Component 3
If advertisements for green and sustainable products are simple and easy to understand I feel more inclined towards that brand
-.663
Component 4
I relate high price with higher value offered by an environmentally friendly product. .686
Table .4 Factor analysis
bears an influence upon the attitudes and perceptions of
consumers in sustainable marketing. To test the influence of
age of the respondents on the perception towards
sustainable marketing drivers. The One-Way ANOVA was
applied and results confirm that there is significant impact of
37Consumer's Perception towards Sustainable Marketing

age groups. In order to understand which age groups were
influenced, a Tukey's B test was conducted. The Tukey's B
test results and it indicates that the age group 'Above 40
Years (which is representative of the Gen X) is the most
influenced by sustainable marketing drivers used by the
organization compared to other age groups (Table 7). This
indicates these age groups have a stronger and positive
attitude towards sustainable marketing drivers. The results
satisfy that the generation to which a consumer belongs H2
has a relationship with their attitudes and perceptions in
sustainable marketing.
CONCLUSION
Three factors. 'Lifestyle aspirations', 'Importance of self-
image in society' and 'Community influence' were identified
among psychographic drivers that have a major influence
upon consumers with respect to sustainable marketing. The,
four factors were identified among the drivers of corporation-
controlled factors which were identified as 'Communication
to ', 'Difficult to approach', 'Simple advertising' and consumers
'Value-Price relationship'. Majorly 'Above 40' to '24-30 Years'
bore a positive attitude and perception towards sustainable
marketing. The personality traits 'Conventional' and
'Realistic' had a more positive perception of sustainable
marketing, which is in line with personality traits of the both
generations. Both H and H were satisfied through these 1 2
results. The age groups are differently influenced by the
same set of sustainable marketing strategies and their
perception varies with their personalities as well. Thus,
corporations can utilise these findings to redesign existing
strategies and implement them more successfully. Further
studies can be performed to analyse the influence of different
personalities in each age group. The focus should be on the X
and Y generations as they have a more positive response
towards sustainable products and sustainable marketing
drivers.
REFERENCESBarr S 2003. Strategies for sustainability: Citizens and responsible
environmental behaviour. (3): 227-240.Area 35
Beckmann SC 2007. Consumers and corporate social responsibility: Matching the unmatchable? Australasian Marketing Journal15(1): 27-36.
Bhatia M and Jain A 2013. Green marketing: A study of consumer perception and preferences in India. Electronic Green Journal36(1): 1-19.
Borin N, Lindsey-Mullikin J and Krishnan R 2013. An analysis of consumer reactions to green strategies. Journal of Product & Brand Management (2): 118-128. 22
Boulstridge E and Carrigan M 2000. Do consumers really care about corporate responsibility? Highlighting the attitude-behaviour gap. . (4): 355-368.Journal of communication management 4
Boztepe A 2012. Green marketing and its impact on consumer buying behavior. European Journal of Economic & Political
Studies (1): 435-461. 5
Bresman H and Rao VD 2017. A Survey of 19 Countries Shows How Generations X, Y, and Z Aren't Different. Harvard Business Review. . Retrieved from hbr.org/2017/08/a-survey-of-19-8countries-shows-how-generations-x-y-and-z-are-and-arent-different
Chen TB and Chai LT 2010. Attitude towards the environment and green products: consumers' perspective. Management Science and Engineering (2): 27.4
Chen YS and Chang CH 2013. Greenwash and green trust: The mediation effects of green consumer confusion and green perceived risk. (3): 489-500.Journal of Business Ethics 114
Cherian J and Jacob J 2012. Green marketing: A study of consumers' attitude towards environment friendly products. Asían Social Science (12): 117.8
Davis I 2013. How (not) to market socially responsible products: A critical research evaluation. Journal of Marketing Communications (2): 136-150.19
D'Souza C, Taghian M, Lamb P and Peretiatkos R 2006. Green products and corporate strategy: An empirical investigation. Society and Business Review (2): 144-157.1
Durif F, Boivin C, Rajaobelina L and François-Lecompte A 2011. Socially responsible consumers: profile and implications for marketing strategy. International Review of Business Research Papers (6): 215-224.7
Ingenbleek PT, Meulenberg MT and Van Trijp HC 2015. Buyer social responsibility: A general concept and its implications for marketing management. Journal of Marketing Management31(13-14): 1428-1448.
Jayaraman V, Singh R and Anandnarayan A 2012. Impact of sustainable manufacturing practices on consumer perception and revenue growth: An emerging economy perspective. International Journal of Production Research (5): 1395-1410.50
Johnstone ML and Tan LP 2015.Exploring the gap between consumers' green rhetoric and purchasing behaviour. Journal of Business Ethics (2): 311-328.132
Lee J and Cho M 2019. New insights into socially responsible consumers: The role of personal values. International Journal of Consumer Studies (2): 123-133.43
McDonald S and Oates CJ 2006. Sustainability: Consumer perceptions and marketing strategies. Business Strategy and the Environment (3): 157-170.15
Moraes C, Carrigan M and Szmigin I 2012. The coherence of inconsistencies: Attitude–behaviour gaps and new consumption communities. Journal of Marketing Management28(1-2): 103-128.
Nyilasy G, Gangadharbatla H and Paladino A 2014. Perceived green washing: The interactive effects of green advertising and corporate environmental performance on consumer reactions. Journal of Business Ethics (4): 693-707.125
Ottman JA, Stafford ER and Hartman CL 2006. Avoiding green marketing myopia: Ways to improve consumer appeal for environmentally preferable products. Environment: Science and Policy for Sustainable Development (5): 22-36.48
Papaoikonomou E, Ryan G and Ginieis M 2011. Towards a holistic approach of the attitude behaviour gap in ethical consumer behaviours: Empirical evidence from Spain. International Advances in Economic Research (1): 77-88.17
Prothero A, Dobscha S, Freund J, Kilbourne WE, Luchs MG, Ozanne LK and Thøgersen J 2011. Sustainable consumption: Opportunities for consumer research and public policy. Journal of Public Policy & Marketing (1): 31-38.30
Saxena A, Sharma V, Rachuri S and Joshi H 2015. Climate change and business strategies: The case of automobile and associated ancillary sectors in Madhya Pradesh. IUP Journal of Business Strategy (3): 46-63. 12
Sharma V, Sonwalkar J and Kapse M 2013. Consumer purchase
38 Soumya Singh, A.S. Suresh and Vinod Sharma

behaviour for green products. International Journal of Economics & Business Administration (4): 50-65.1
Sharma V, Jeanne P, Mohanta S and Liza EA 2018. Influence of the dimensions of CSR activities on consumer purchase intention. Innovative Marketing (1): 23- 32.4
Straughan RD and Roberts JA 1999. Environmental segmentation alternatives: a look at green consumer behavior in the new millennium. (6): 558-575.Journal of Consumer Marketing 16
Strauss W and Howe N 1991. Generations: The History of America's Future, 1584–2069. New York: Harper.
Received 26 January, 2021; Accepted 16 June, 2021
39Consumer's Perception towards Sustainable Marketing

Ecological Financial Risk Modeling Analysis by the Scheduled Commercial Banks
Manuscript Number: S-673NAAS Rating: 5.79
Abstract: The purpose of this study isto introduce the various risk factors of commercial banks with the help of models and techniques which are used to calculate the probability of default and the minimum capital requirement for each stated financial institution. The paper explores the relationship between bank performance and their risk management capabilities. Various models such as Merton's Model is used to value credit risk, basic indicator and standardized approach is used to value operational risk and variance at risk is used to measure market risk. Along with micro factors, regulatory factors are also considered to analyse the effect of those factors on bank liquidity and solvency. The findings of the empirical study reveal that better risk management practices lead to minimum capital requirements and reduces probability of default and have positive effect on the movement of share price of the respective institution. The study indirectly demonstrates that underperforming banks have poor risk management capabilities. The study is not subjected to the Covid-19 scenario as the author focussed on the operation of the banks in the normal circumstances. This is since Covid-19 is not a cyclical threat to the operation of the bank.
Keywords: Risk management, Basel norms, Value at risk (VaR), Merton model, Basic indicator approach (BIA)
Deepak Tandon, Ekta Mittal and Neelam Tandon 1
International Management Institute New Delhi-110 016, India,1Jagannath International Management School, New Delhi-110 019, India
E-mail: [email protected]
Indian Journal of Ecology (2021) 48 Special Issue (16): 40-45
After the crucial era of stress post the financial crisis of
2008, the banks realised and recognised every advancement
of the risk management policies. Many studies have been
done to improve the scale of the measures taken for the
efficient risk management of the banks (Kalpataru
Bandopadhyay 2010). The crisis in banking system was due
to performing of banks on the loose ends and no institution or
government thought of the need for the better regulation of
the banks. So, it all came crashing down after the Lehman
brothers, the third biggest Investment bank of the America
and of the world declared bankruptcy (Arun Kumar 2006). But
the damage had already been done before and it had been
clear after the firm like Lehman brothers and Goldman Sachs
liquidated their positions in the mortgage-based securities
and thus the chain reaction started, leading to one of the
worst financial crises of the world(Brodsky Neil 2009).After-
math of the crisis has been devastating and the time arrived
to scrutinise the regulators and the government and thus, the
risk management of the banks came into the picture and
regulations revolving the risk management started
advancing. After the positive outcomes of LPG policy, the
Indian economy is moving from developing to the developed
economy (Goyal 2010), which had opened a new
methodology for financial conversion where the level of risk is
increasing day by day. The success of the bank is devised by
the capability to aggregate risk within manageable and
tolerable limits, as risk is the most important factor of
earnings. Risk is the basic element that constitutes the
behaviour of a financial entity (Duffie 2004). Without such
factors, the monetary system, could be very predictable and
thus prone to liquidation and bankruptcy. Be that as it may,
risk is ubiquitous and so budgetary institutions in this manner
ought to oversee the risk proficiently to outlive in this highly
dubious world. Long-term of banking industry depends upon
their risk administration capabilities.
Risk assessment is done from two aspects i.e.
qualitative and quantitative tools (Richard Wood 2019). Both
these aspects need to be evaluated for computation of risk
levels. Qualitative aspect refers to measuring risk based on
the judgement skills of the managers to determine the impact
and probability of risk. It is done by taking a holistic view of the
financial institution by examining portfolios, studying broad
policies and procedures, examining clients on basis of
historical data, deciding the lending limits and examining the
financial statements of corporate clients
Quantitative aspect refers to managing risks by using
qualitative tools and techniques by assigning a defined or
approximate number to a particular risk. Under this risk can
be categorized into absolute and relative terms. It can be
done through ratio analysis, cost – benefit analysis and
estimating expected returns Owing to various risk
assessment models complexity and validity to evaluate credit
risk in order to provide with a probability of default by the firm
(Van Tilburg 2008). The various risk assessment approaches

provide procedure for the operational risk measurement in
order to calculate minimum capital requirement (Zhou 2001).
Using variance at risk model to determine the market risk
probability at various confidence levels in order to take
appropriate measures. By complying with various regulatory
framework to determine the risk probability of commercial
banks under the guidelines given by Basel III Committee.
MATERIAL AND METHODS
On the basis of literature review, the given research
centres on the relationship between the performance of a
commercial bank and their risk management policies in order
to find out the likelihood of default and chance alongside the
calculation of least capital necessities. Along with this, it also
identify how to nullify the risk with the help of stringent
management policies which is determined with the help of
various models and approaches which are based on
indicators which are examined to be true measure for the risk,
so that appropriate steps could be taken thereon by the
banking firms. Again, establishing the fact, that the study
does not consider the impact of Covid-19 on the operation of
the banks. Because this impact is not cyclical.
Nature of the study: The practical study is a descriptive and
analytical research which helps in measuring the probability
of risk with a greater significance level using various
analytical tools such as R, Python and Excel.
Sampling design: Sample consists of five major banks
which includes AXIS bank, IDBI bank, HDFC bank, Bank of
India and Yes bank which are selected based on their current
market performances.
Data collection: The data type used to find the probability of
risk and capital requirement is secondary and historical in
nature. The literature is a paper model which is totally relied
on the research for which secondary resources include
online journals, books and publications.
Data analysis tool: In order to analyse data various models
including Merton's model and techniques such as Variance at
Risk and normalization are used.
Limitations: The purview of the model is limited to five
private banks and is highly dependent on historical data.
The pyramid highlights the core entities that constitutes
the risk management of the banks. However, there are many
other risks but the author focuses on these four factors
because it directly affects the performance of the banks and
could be tracked in real time.
RESULTS AND DISCUSSION
Credit risk assessment: Credit risk is the risk of decline in
the credit quality of counterparty in financial transactions
which is associated with the default risk that the counterparty
Credit Risk
Market Risk
RegulatoryRisk
OperationalRisk
may not fulfil its contractual obligations. Its assessment helps
banks not only to price their loans but also to diversify their
portfolios. It is of great significance as the extent of loss due to
credit default is considerably larger despite the fact that
default is a rare event with lower odds. All banks regardless of
their geographic regions internally allocate their majority of
resources to manage credit risk and build models to
anticipate possible default events. The measurement of the
credit risk is also undertaken by studying credit spreads and
credit rating. The following model is used to measure the
credit risk for the given banks.
Merton's model: Merton model (1947) is an analysis tool
that is used to calculate probability of default i.e. the credit
risk of a company's debt. The model is used to understand
how capable a firm is at meeting its financial obligations and
weighing general possibility of firm going into credit default.
Robert Merton proposed the model for assessing the
structural credit risk of a company by modelling company's
equity as call option on its assets. The model uses the Black-
Scholes-Merton option pricing methods and is structural as it
provides a relation between the default risk and the asset
structure of the firm.
Assumptions of Merton's Model
1. Overall value of firm is sum of market debt value (D ) at t
time t and market value of equity at time t (E ).T
2. For debt financing, firm issues the zero-coupon bonds
with single discounting factor and a face value of D and
maturity at time T, where debt (D) to paid after t years is
known and is constant and is termed as Dt. At
development, in case the esteem of firm exceeds its
value of debt, then firm will pay off its debt (D) and will
proceed to exist. On other hand, in case the firm esteem
41Financial Risk Modeling Analysis by the Scheduled Commercial Banks

V < D (Default)t t V > D (Non-Default)t t Payoff
Equity 0 V - Dt t max(V - D , 0)t t
Bond Vt Dt V - min(V - D , 0) ort t t
D – max(D – V , 0)t t t
Table 1. Merton's model and pay-out for bond and equity under non-default and default position
Source: Author's compilation
T
TrDtVt
Ind
)5.0(1
2
Tσd1d2
is less than esteem of obligation, at that point firm will
pay its debt to the level of firm's value and will file for
bankruptcy.
3. Firm pays no profits on the value offers issued with a
market value of E at time t.
4. Constant risk-free rate and volatility.
Modelling: The Merton model relates the value of market
equity and debt within an option pricing process. It assumes a
single liability D with maturity T. So, at the time T, the value of
the firm to the shareholders is equal to V - D .t t
V=E +D ……….. Eq. 1t t t
Where,
Vt is the overall value of the firm at time t
Et is the showcase value of value at time t
Dt is the value of obligation to be recovered at time t with
development T
Equation 1 shows that, occurrence of default takes place
when V falls below the esteem of the zero-coupon bond t
issued (D ) at time t. When, V < D , equity investors get zero t t t
and debt investors will only get V Whereas if, V >D then t. t t
equity investors get amount which is equal to V - D and debt t t
investors will get the whole amount (Table 1).
The value esteem (Et) is comparable to European call
alternative on the esteem of firm, with a development period
T and a strike cost comparable to zero coupon bond. Holding
the firm's bond is break even with to taking long position of
chance free resource and a brief position of put choice with a
strike cost (D). The value of the firm is at that point a vanilla
European call alternative on the resources of the firm with
development T and a strike cost of D. So, based on this
Merton choice estimating show to determine esteem of firm is
given as (modifying Eq. 1):
D(t, T) = V(t, T) – E(t, T) ….……….. Eq. 2
where
V (t, T) is the show esteem of risk-free rebate bond with
confront esteem of D at time t
E (t, T) is the show esteem of European put alternative
with strike cost of D at time t
D (t, T) is the display esteem of rebate bond with
development T at time t
Equation 2 appears that value of corporate bond is given
by subtracting the esteem of European put option with basic
resource of V from the value of risk-free rebate bond with D.
Since the value of risk-free rebate bond is decided, esteem of
the firm's bond at that point depends on the esteem of the put
alternative. In Merton's show, as hazard free rate is taken to
be steady and subsequently the esteem of put alternative can
be drawn from the “Black and Scholes Choice estimating
model” as takes after:
E = V N (d1) – D e N (d2) …………….. Eq. 3t t t -rT
where
r is the risk-free rate of interest
T is the maturity period
N is the normal distribution of cumulative standard
Equation 3 shows up the expected loss caused by given
default. So, by ceasing inside the value of put option decided
from condition 3 in condition 2, we are going recuperate the
taking after:
D (t, T) = V (t, T) – V N (d2) ….……….. Eq. 4t
Equation 4 highlights V (t, T) as the value of the firm's
discount bond without an occasion of default and is the value
of the firm's markdown bond with an occasion of default.
The Table 2 highlights credit risk probability of few
private banks with a squared error of 0.00%, found at a risk-
free rate of return of 10.370% which is the average of the
lending rates on fresh rupee loans sanctioned for the private
sector banks for a time horizon of 1 year (2019).
Market risk assessment: Market risk is characterized as the
plausibility of loss to bank caused by the changes in market
factors which is influenced by the developments in value and
interest rate markets, cash trade rates and product costs. It is
the risk to bank's profit and capital, due to changes within the
market level of over factors and by the instability in their
costs. This is based on fluctuation in the investment returns
through variance, beta, standard deviation and modified
duration. The markets being highly volatile is subjected to the
scenario where the market was less volatile compared to the
current scenario and the parameters of the normal scenario
were reflected on the current scenario in order to come up
with the stable values of the value at Risk. The following
technique is used to measure the market risk for the given
banks.
Value at Risk (VaR): It demonstrates how much a firm can
lose or make with a certain likelihood in each time skyline. It
summarizes the financial risk expectation in portfolios into a
basic number. It can be determined by taking the random
42 Deepak Tandon, Ekta Mittal and Neelam Tandon

loses L, and a confidence level as follows:
Var(L) = inf {I:F (I) >= } .……….. Eq. 5L
Where,
L is the random loss
is the probability of loss(confidence level)
The market risk probability of different private banks with
the help of returns from historical data of last 5 years share
price is mentioned in Table 3.
Yes Bank has the highest degree of Value at Risk. It was
led by the high number of NPAs, NBFC Crisis, the
governance issue, the excessive withdrawals from the
institutional investors and thus, the stock of Yes bank
performed so badly in 2019. Moreover, due to the exposure in
the ILFS, the bank's quality of assets worsened, and it came
under the scanner of the regulator. However, the main tipping
point came when all the high authorities of the bank resigned
leading to the more doubts to the governance of the bank.
Later, the bank was put under a 30-day moratorium. Now Yes
Bank suffered compared to the other banks in the list. But the
stock market was highly volatile in 2019. It led to the increase
in the standard deviation and hence the high volatility of the
stocks of the banks.
Operational risk assessment: Operational risk is the risk of
loss from insufficient or fizzled inside processes, individuals
Yes Bank IDBI Bank HDFC Bank Axis Bank Bank of India
Liabilities 3,18,83,57,700 26,40,24,44,00,000 1,23,17,44,86,00,000 7,44,21,15,100 26,40,24,44,00,000
Asset value 3,07,46,46,886 62,34,88,75,94,106 72,96,19,69,44,462 7,57,54,70,446 96,20,46,75,61,756
Asset volatility 0.09708 0.35759 4.329596 6.257902 0.440807
Equity value 241971599.8 3856193039218.36 7023526363812.21 7562965790 7240728239688.45
Equity volatility 0.951229 0.5770043 4.4107444 6.2631038 0.5854766
Probability of default 25.927% 0.597% 0.815% 1.906% 0.160%
Table 2. Probability of redit efault using Merton's model c d
Source: Author's ompilationc
Confidence level Yes Bank IDBI Bank HDFC Bank Axis Bank Bank of India
VaR at 95% -5.785% -4.804% -1.699% -3.053% -4.727%
VaR at 99% -8.168% -6.788% -2.397% -4.333% -6.651%
VaR at 99.90% -10.838% -9.011% -3.214% -5.769% -8.809%
Table . 3 Probability of market risk with VaR
Source: Author's Compilation
In RS crores Yes Bank IDBI Bank HDFC Bank Axis Bank Bank of India
Gross income 2017 20713.007 51357 132654.76 128334.95 45772.04
Gross income 2018 26396.813 47145 153330.48 128834.08 43638.39
Gross income 2019 37490.386 43857 190171.67 152532.83 45797.52
Minimum capital requirement 4230.0103 7117.95 23807.8455 20485.093 6760.3975
Table .4 Minimum capital requirement using BIA approach
Source: Author's Compilation
and frameworks or outside occasions. This chance is inborn
in all trade processes and subsequently ought to be a critical
component of the banks risk management frameworks. The
following approaches are used to measure the capital
adequacy for the operational risk for the given banks.
Basic indicator approach: Agreeing to Reserve Bank, at
the least level all banks in India ought to embrace this
approach whereas computing capital adequacy for
operational risk beneath Basel III. Beneath this approach
banks ought to hold a least capital for operational risk which is
break even with a settled rate (alpha) of a single marker
which is proposed to be “gross income”.
The following equation is used to numerically calculate
the capital charge under BIA:
where
K is the capital chargeBIA
GI is the annual gross income (positive), over the
previous three years
α is the economic capital against operational risk which
is set as 15%by the Basel III committee n is the number of
previous three years for which gross income is positive
The following Table 4 highlights the minimum capital
n
GIK BIA
)( q. 6
43Financial Risk Modeling Analysis by the Scheduled Commercial Banks
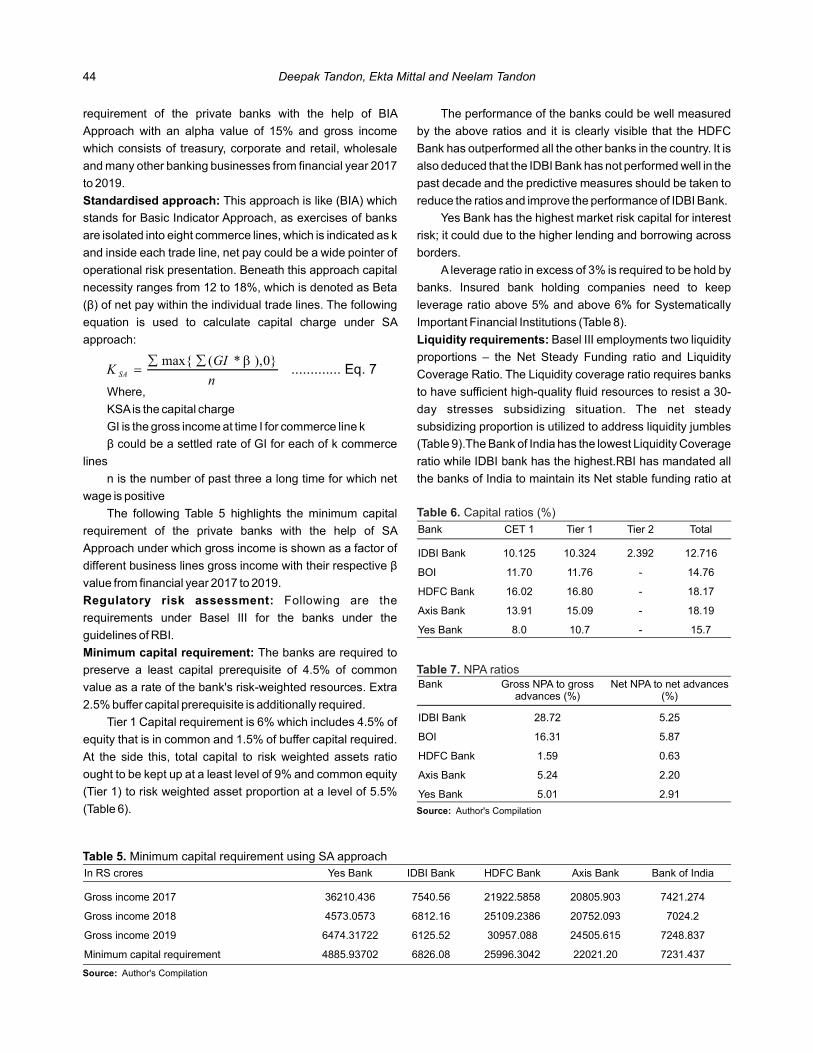
In RS crores Yes Bank IDBI Bank HDFC Bank Axis Bank Bank of India
Gross income 2017 36210.436 7540.56 21922.5858 20805.903 7421.274
Gross income 2018 4573.0573 6812.16 25109.2386 20752.093 7024.2
Gross income 2019 6474.31722 6125.52 30957.088 24505.615 7248.837
Minimum capital requirement 4885.93702 6826.08 25996.3042 22021.20 7231.437
Table . 5 Minimum capital requirement using SA pproacha
Source: Author's Compilation
Bank CET 1 Tier 1 Tier 2 Total
IDBI Bank 10.125 10.324 2.392 12.716
BOI 11.70 11.76 - 14.76
HDFC Bank 16.02 16.80 - 18.17
Axis Bank 13.91 15.09 - 18.19
Yes Bank 8.0 10.7 - 15.7
Table 6. Capital ratios (%)
Bank Gross NPA to gross advances (%)
Net NPA to net advances (%)
IDBI Bank 28.72 5.25
BOI 16.31 5.87
HDFC Bank 1.59 0.63
Axis Bank 5.24 2.20
Yes Bank 5.01 2.91
Table 7. NPA ratios
Source: Author's Compilation
requirement of the private banks with the help of BIA
Approach with an alpha value of 15% and gross income
which consists of treasury, corporate and retail, wholesale
and many other banking businesses from financial year 2017
to 2019.
Standardised approach: This approach is like (BIA) which
stands for Basic Indicator Approach, as exercises of banks
are isolated into eight commerce lines, which is indicated as k
and inside each trade line, net pay could be a wide pointer of
operational risk presentation. Beneath this approach capital
necessity ranges from 12 to 18%, which is denoted as Beta
( ) of net pay within the individual trade lines. The following β
equation is used to calculate capital charge under SA
approach:
Where,
KSA is the capital charge
GI is the gross income at time I for commerce line k
β could be a settled rate of GI for each of k commerce
lines
n is the number of past three a long time for which net
wage is positive
The following Table 5 highlights the minimum capital
requirement of the private banks with the help of SA
Approach under which gross income is shown as a factor of
different business lines gross income with their respective β
value from financial year 2017 to 2019.
Regulatory risk assessment: Following are the
requirements under Basel III for the banks under the
guidelines of RBI.
Minimum capital requirement: The banks are required to
preserve a least capital prerequisite of 4.5% of common
value as a rate of the bank's risk-weighted resources. Extra
2.5% buffer capital prerequisite is additionally required.
Tier 1 Capital requirement is 6% which includes 4.5% of
equity that is in common and 1.5% of buffer capital required.
At the side this, total capital to risk weighted assets ratio
ought to be kept up at a least level of 9% and common equity
(Tier 1) to risk weighted asset proportion at a level of 5.5%
(Table 6).
n
GIK SA
}0),*(max{ ............. Eq. 7
The performance of the banks could be well measured
by the above ratios and it is clearly visible that the HDFC
Bank has outperformed all the other banks in the country. It is
also deduced that the IDBI Bank has not performed well in the
past decade and the predictive measures should be taken to
reduce the ratios and improve the performance of IDBI Bank.
Yes Bank has the highest market risk capital for interest
risk; it could due to the higher lending and borrowing across
borders.
A leverage ratio in excess of 3% is required to be hold by
banks. Insured bank holding companies need to keep
leverage ratio above 5% and above 6% for Systematically
Important Financial Institutions (Table 8).
Liquidity requirements: Basel III employments two liquidity
proportions – the Net Steady Funding ratio and Liquidity
Coverage Ratio. The Liquidity coverage ratio requires banks
to have sufficient high-quality fluid resources to resist a 30-
day stresses subsidizing situation. The net steady
subsidizing proportion is utilized to address liquidity jumbles
(Table 9).The Bank of India has the lowest Liquidity Coverage
ratio while IDBI bank has the highest.RBI has mandated all
the banks of India to maintain its Net stable funding ratio at
44 Deepak Tandon, Ekta Mittal and Neelam Tandon
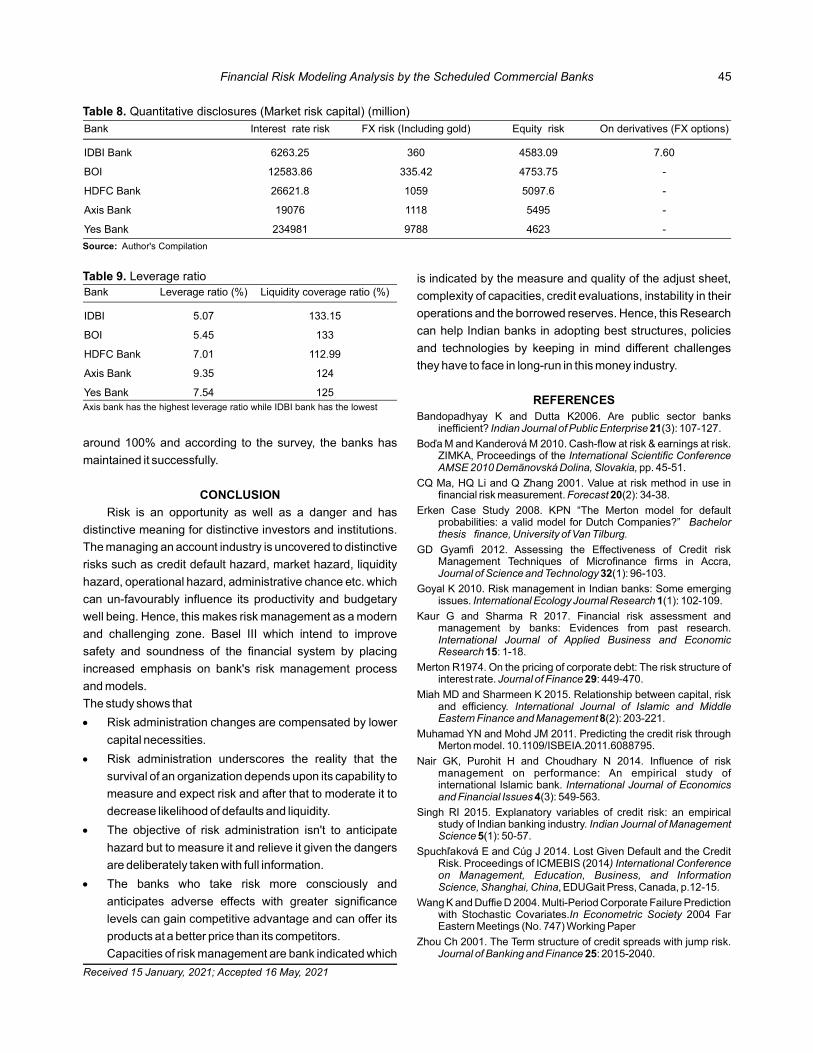
around 100% and according to the survey, the banks has
maintained it successfully.
CONCLUSION
Risk is an opportunity as well as a danger and has
distinctive meaning for distinctive investors and institutions.
The managing an account industry is uncovered to distinctive
risks such as credit default hazard, market hazard, liquidity
hazard, operational hazard, administrative chance etc. which
can un-favourably influence its productivity and budgetary
well being. Hence, this makes risk management as a modern
and challenging zone. Basel III which intend to improve
safety and soundness of the financial system by placing
increased emphasis on bank's risk management process
and models.
The study shows that
Risk administration changes are compensated by lower
capital necessities.
Risk administration underscores the reality that the
survival of an organization depends upon its capability to
measure and expect risk and after that to moderate it to
decrease likelihood of defaults and liquidity.
The objective of risk administration isn't to anticipate
hazard but to measure it and relieve it given the dangers
are deliberately taken with full information.
The banks who take risk more consciously and
anticipates adverse effects with greater significance
levels can gain competitive advantage and can offer its
products at a better price than its competitors.
Capacities of risk management are bank indicated which
Bank Interest rate risk FX risk (Including gold) Equity risk On derivatives (FX options)
IDBI Bank 6263.25 360 4583.09 7.60
BOI 12583.86 335.42 4753.75 -
HDFC Bank 26621.8 1059 5097.6 -
Axis Bank 19076 1118 5495 -
Yes Bank 234981 9788 4623 -
Table 8. Quantitative disclosures (Market risk capital) (million)
Source: Author's Compilation
Bank Leverage ratio (%) Liquidity coverage ratio (%)
IDBI 5.07 133.15
BOI 5.45 133
HDFC Bank 7.01 112.99
Axis Bank 9.35 124
Yes Bank 7.54 125
Table 9. Leverage ratio
Axis bank has the highest leverage ratio while IDBI bank has the lowest
is indicated by the measure and quality of the adjust sheet,
complexity of capacities, credit evaluations, instability in their
operations and the borrowed reserves. Hence, this Research
can help Indian banks in adopting best structures, policies
and technologies by keeping in mind different challenges
they have to face in long-run in this money industry.
REFERENCESBandopadhyay K and Dutta K2006. Are public sector banks
inefficient? (3): 107-127.Indian Journal of Public Enterprise 21
Boďa M and Kanderová M 2010. Cash-flow at risk & earnings at risk. ZIMKA, Proceedings of the International Scientific Conference AMSE 2010 Demänovská Dolina, Slovakia, pp. 45-51.
CQ Ma, HQ Li and Q Zhang 2001. Value at risk method in use in financial risk measurement. (2): 34-38.Forecast 20
Erken Case Study 2008. KPN “The Merton model for default probabilities: a valid model for Dutch Companies?” Bachelor thesis finance, University of Van Tilburg.
GD Gyamfi 2012. Assessing the Effectiveness of Credit risk Management Techniques of Microfinance firms in Accra, Journal of Science and Technology 32(1): 96-103.
Goyal K 2010. Risk management in Indian banks: Some emerging issues. (1): 102-109.International Ecology Journal Research 1
Kaur G and Sharma R 2017. Financial risk assessment and management by banks: Evidences from past research. International Journal of Applied Business and Economic Research 15: 1-18.
Merton R1974. On the pricing of corporate debt: The risk structure of interest rate. : 449-470.Journal of Finance 29
Miah MD and Sharmeen K 2015. Relationship between capital, risk and efficiency. International Journal of Islamic and Middle Eastern Finance and Management 8(2): 203-221.
Muhamad YN and Mohd JM 2011. Predicting the credit risk through Merton model. 10.1109/ISBEIA.2011.6088795.
Nair GK, Purohit H and Choudhary N 2014. Influence of risk management on performance: An empirical study of international Islamic bank. International Journal of Economics and Financial Issues 4(3): 549-563.
Singh RI 2015. Explanatory variables of credit risk: an empirical study of Indian banking industry. Indian Journal of Management Science 5(1): 50-57.
Spuchľaková E and Cúg J 2014. Lost Given Default and the Credit Risk. Proceedings of ICMEBIS (2014) International Conference on Management, Education, Business, and Information Science, Shanghai, China, EDUGait Press, Canada, p.12-15.
Wang K and Duffie D 2004. Multi-Period Corporate Failure Prediction with Stochastic Covariates. 2004 Far In Econometric SocietyEastern Meetings (No. 747) Working Paper
Zhou Ch 2001. The Term structure of credit spreads with jump risk. Journal of Banking and Finance 25: 2015-2040.
Received January, 2021; Accepted May, 202115 16
45Financial Risk Modeling Analysis by the Scheduled Commercial Banks

CSR as an Agent of Financial Stability: A Use Case of Banking Industry
Manuscript Number: S-674NAAS Rating: 5.79
Abstract: The study was undertaken to examine the importance of corporate social responsibility (CSR) as an agent to improve the firm's performance and financial stability by enhancing goodwill and competitive advantage in the Indian banking industry. In the study, it has been hypothesized that CSR expenses have a positive relationship with financial stability. A correlation study has also been undertaken to determine any relationship among these variables, followed by a dependency regression test to show the levels of dependency of financial stability on CSR expenses and the Granger Causality test to find their causal relationship. The study has revealed a significant relationship between the financial stability variables and CSR expenses, and the Granger Causality level supports the findings.
Keywords: Corporate social responsibility (CSR), Financial stability ratios, Banks
Salineeta Chaudhuri and Santosh Kumar
Department of Economics, Christ (Deemed to be University), Ghaziabad-201 003, India School of Management, GITAM (Deemed to be University), Visakhapatanam-530 045, India
E-mail: [email protected]
Indian Journal of Ecology (2021) 48 Special Issue (16): 46-50
The economic crisis has brought about striking penalties
for economies and overall human societies. The financial
crisis of 2009 had created a lot of debut among the
researchers about the responsibility of such a destructive
impact on society. Questions come forward about
responsibility for such a significant crisis: the accountability
for the adverse effects of the corporate houses' recession.
The corporate houses are responsible for their wealth
maximization and giving back to society as corporate social
responsibility (CSR). CSR has been adopted as part of the
mainstream business by many firms in the developed
economy. Undertaking CSR activities became mandatory
under clause 135 of the Companies Act, 2013 in 2% of the
firm's last three years average profit. CSR activities are
improving the quality of life in nearby societies, improving the
firm's performance, and creating financial stability in the long
run by enhancing goodwill and competitive advantage. To
analyze the linkage between CSR expenses and firms'
financial performance has attracted many researchers in
recent years. The findings of these studies are unconvincing
or ambiguous (Mishra and Suar 2010). Since, even though
the positive impact of CSR expenses on firm performance is
a leading concept in literature globally (Abu Bakar and Ameer
2011, Oeyono et al 2011), others concluded either negative
or no relation (Malcolm 2007, ACCA 2009). Galbreath and
Shum, 2012 have questioned the research methodology and
techniques used in most research to explore CSR's linkage
and the firm's performance. They argue that negative,
positive, or neutral relations ascertained by analyzing the
association between CSR expenses and firms' financial
performance cannot be 100% significant; several other
superseding variables may impact. The Reserve Bank of
India (2011) has stressed CSR's necessity, recommended all
banks to pay concentration towards the amalgamation of
business and social concerns in their day-to-day operations
to attain sustainable growth. RBI also suggested producing a
non-financial report (NFR), which will show the work and
expenses towards improving the economy, demography, and
society's environment. Even the accounting regulator, ICAI,
had issued guidelines to reveal CSR expenditure as a
separate head in P/L statements. These remarkable efforts
from the policymakers are acting as a catalyst for
improvement in the CSR expenditure from banks; Figure 1
below shows a growing trend yearly.
From the last few years, academic researchers have
given substantial attention to CSR in their literature. Despite
much-published literature on CSR, there is still no such
definition of CSR that is universally accepted (Scherer and
Palazzo 2007, Wood 2010). Wood (2010) argues that this is
why CSR is hard to conceptualize. Talaei and Nejati (2008)
also claimed that not having clear theoretical boundaries for
CSR has led to various definitions. In support of these
explanations, few researchers (Van Beurden and Gössling
2008, Lozano 2008) consider that the lack of clarity in
definition makes it tricky to perform a practical study on CSR.
Their studies, which are based on a review of 52 previous
surveys published to highlight the relationship between CSR
and firm performance, highlighted that companies with

0
500
1000
1500
2000
2500
3000
2014 2015 2016 2017 2018 2019
CSR TREND
Fig. 1. Trend in CSR expenses in (Rs Crores)
Bank's name Total assets (In Rs. crores)
Banking groups
State Bank Of India 3680914 Nationalized
HDFC Bank Ltd. 1244541 Private
ICICI Bank Limited 964459 Private
Axis Bank Limited 800997 Private
Bank Of Baroda 780987 Nationalized
Punjab National Bank 774949 Nationalized
Canara Bank 694767 Nationalized
Bank Of India 625223 Nationalized
Union Bank Of India 494039 Nationalized
Yes, Bank Ltd. 380826 Private
Central Bank Of India 330718 Nationalized
IDBI Bank Limited 320284 Private
Kotak Mahindra Bank Ltd. 312172 Private
Syndicate Bank 311279 Nationalized
Indian Bank 280065 Nationalized
Source: RBI Database
Table 1. Top banks on their asset values as of the financial year 2019
higher social responsibility had better financial results. Later,
Rettab et al (2009) study, based on survey data gathered
from 280 companies in UAE, concluded the positive impact of
CSR on the firm's financial performance and human
performance, and corporate integrity. Lin et al (2009) also
identified a positive association between CSR and a firm's
economic performance on the database of 1000 Taiwanese
companies. Keffas and Oulu-Briggs (2011) reported that
banks with better responsibility towards society have
superior capital adequacy, asset quality, and competence in
running their business.
Literature focused only on studying CSR's direct impact
on financial performance, while some researchers (Luo and
Bhattacharya, 2006, Galbreath and Shum 2012). Alafi and
Hasoneh (2012) argue that the study of CSR's direct
association with performance just ignores many significant
variables; thus, final results will be unreliable. Still, there is no
availability of such a universal method for measurement
CSR. The instruments discussed by Carroll (1979) were
afterward developed by Maignan and Ferrell (2000a, 2001b).
They reported that the arrangement integrates all four
dimensions of CSR; ethical, economic, discretionary, and
legal is the best fit. Sharma (2011) highlighted CSR expenses
by banking companies in education, health care, rural
development, environmental sustainability, eradication of
poverty, skill training, donations, and livelihood enhancement
to meet their obligations. As undertaking CSR activities
became mandatory under clause 135 of the Companies Act,
2013 in India. The bank has to disclose all expenses made
towards CSR, either direct or indirect, as a separate head in
P/L statements as per the accounting regulator's guideline,
ICAI. Such immediate disclosure will improve the business
performance, as a study by Branco and Rodrigues (2008) on
Portuguese banks found banks with higher visibility of CSR
have higher goodwill among consumers. Montiel (2008) and
Galberth, and Shum (2012), highlight the absence of a
universally accepted uniform method of CSR measurement.
The study is based on the Indian banking industry
because of its current expansion rate and its potential to be
the fifth-biggest global player by 2021 and the third biggest by
2025. The Indian banking industry consists of 22 private
sector banks, 18 public sector banks, 56 regional rural banks
(RRBs), 49 foreign banks,1562 urban cooperatives banks,
and nearly 95,000 schedule credit cooperatives. In the study,
data has been taken from the top 15 banks based on overall
asset value. The sample consists of 9 public sector banks
and six private sector banks, as these 15 banks contribute
70% (approx.) of the total business in the banking industry.
MATERIAL AND METHODS
Sample and data collection: The study is based on data
List of CSR activities under schedule VII
Promotion of education
Gender equity and women empowerment
Eradication of extreme hunger and poverty
Reducing child mortality and improving maternal health
Combating HIV-AIDS, malaria, and other diseases
Environmental sustainability
Employment enhancing vocational skills
Contribution to Prime Minister's relief fund and other such state and central funds
Social business projects
And such other matters as may be prescribed
Source: Companies Act 2013
Table 2. CSR activities as per schedule VII, 135 companies act 2013
47CSR as an Agent of Financial Stability

Name of banks ROA ROE CAR NPA CSR
State Bank Of India Mean 2.1 13.20 12.77 1.99 92.37
Max 2.47 15.72 13.86 2.57 149.21
Min 1.82 10.03 12.00 1.63 24.44
Bank Of Baroda Mean 1.85 17.23 13.62 0.99 7.88
Max 2.19 23.47 14.67 1.89 19.41
Min 1.44 8.96 12.28 1.63 0.85
Bank Of India Mean 1.68 11.72 11.46 1.85 3.88
Max 1.82 15.79 12.94 3.36 11.85
Min 1.26 5.57 9.97 0.91 0.75
Canara Bank Mean 1.69 15.14 12.69 1.74 16.35
Max 2.09 23.20 15.38 2.65 41.97
Min 1.34 8.79 10.56 1.06 3.00
Central Bank Of India Mean 1.24 5.98 11.42 2.45 1.54
Max 1.32 15.01 12.40 3.75 5.00
Min 1.16 -8.12 9.87 0.65 0.00
IDBI Bank Limited Mean 1.62 8.95 12.68 1.77 8.61
Max 1.78 13.35 14.58 2.88 26.29
Min 1.34 3.64 11.31 1.02 1.50
Oriental Bank Of Commerce Mean 1.94 10.51 12.32 2.08 3.12
Max 2.17 15.55 14.23 3.34 7.59
Min 1.75 3.65 11.01 0.87 0.80
Punjab National Bank Mean 2.42 16.69 12.61 2.03 2.06
Max 2.7 24.12 14.16 4.06 3.76
Min 2.07 8.17 11.52 0.53 0.75
Syndicate Bank Mean 1.66 16.02 12.09 1.20 1.09
Max 1.97 20.47 13.04 1.90 2.14
Min 1.44 12.23 10.54 0.76 0.65
UCO Bank Mean 1.81 13.51 13.05 2.47 1.17
Max 2.26 22.08 14.15 4.30 3.32
Min 1.37 6.76 12.17 1.17 0.48
Union Bank Of India Mean 1.88 14.16 11.63 1.73 3.64
Max 2.11 21.65 12.95 2.71 13.25
Min 1.57 9.32 10.22 0.81 0.00
Axis Bank Mean 3.06 18.75 14.54 0.37 61.69
Max 3.19 20.29 17.00 0.46 147.16
Min 2.81 17.43 12.07 0.27 14.01
HDFC Bank Mean 3.14 18.79 16.64 0.23 100.42
Max 3.22 21.28 17.44 0.31 245.92
Min 3.05 16.30 16.07 0.18 27.00
ICICI Bank Mean 2.66 11.75 18.49 1.22 103.27
Max 3.18 14.55 19.54 2.12 223.51
Min 2.32 7.96 17.02 0.73 25.00
Source: RBI database
Table 3. Descriptive statistics of all variables for the study period
48 Salineeta Chaudhuri and Santosh Kumar

ROA ROE CAR NPA CSR
ROA 1 0.6182979 0.80599831 0.16502641 0.6934638
ROE 0.6183 1 0.52198274 0.329167733 0.2975409
CAR 0.806 0.5219827 1 0.013318426 0.7269166
NPA 0.16503 0.3291677 0.01331843 1 -0.178047
CSR 0.69346 0.2975409 0.72691665 -0.17804741 1
Source: Compiled by researchers
Table 4. Correlation matrix of selected variables
Variable Coefficient Std. Error t-Statistic p-value
ROA 0.02031 0.003095 6.56256 0
ROE 0.115064 0.023318 4.93454 0
CAR 0.114976 0.020503 5.60765 0
NPA 0.009001 0.003189 2.822 0.006Source: Compiled by researcher
Table 5. Regression outcomes, financial stability variables as dependent and CSR as independent, as per equation
Null hypothesis F-statistic p-value
CSR does not Granger Cause CAR 5.35512 0.0066
CAR does not Granger Cause CSR 5.51094 0.0058
CSR does not Granger Cause ROA 0.08416 0.9194
ROA does not Granger Cause CSR 7.37357 0.0012
CSR does not Granger Cause ROE 0.78942 0.4577
ROE does not Granger Cause CSR 1.57133 0.2144
CSR does not Granger Cause NPA 2.48462 0.0900
NPA does not Granger Cause CSR 3.61132 0.0317
Source: Compiled by researcher
Table 6. Granger causality test, outcome
from the Indian banking sector, which consists of 20 private
sector banks, 26 public sector banks along with 61 regional
rural banks (RRBs), 43 foreign banks, and more than 95,000
schedule credit cooperatives banks. The top 15 banks were
based on the overall asset value for the sample banks (Table
1). The sample consists of 9 nationalized banks and 6
private sector banks as these15 banks contribute 70%
(approx.) of the total asset in the banking industry at the end
of the financial year 2019. Data for CSR expenses has been
collected from annual reports of respective banks in activities
identified under schedule VII of clause 135 Companies Act
2013 (Table 2).
Indicators for financial performance and stability are
being selected using a mixed accounting concept and market
value concept. The ratio analysis concept is one the most
used technique for firm financial stability. Bessel's Accord of
international banking has decided some mandatory ratios
and level of these ratios for sound banking operation, Return
of assets (ROA), Capital adequacy ratio (CAR),
Nonperforming asset ratio (NPA), and Return on equity
(ROE) ratio. All these suggested ratios have been used for
the study; the ratio values of respective banks are being
collected from the RBI database. The study has been done
on data for the last 5 years, from 2014 to 2019.
Statistical Techniques: The study is an attempt to establish
an empirical relationship between CSR expenses and
identified variables for a firm's financial performance, to test
the established Hypothesis:
H = CSR expenses impact the firm's financial 0
stability
Such direct impact can be established by using
Univariate Regression since all expenses made towards
CSR activities are clubbed in a single variable as CSR. The
identified indicators of a firm's financial performance are
dependent variable in the regression equation as:
Indicators of firm's performance = (CSR) + (eq. 1)α εt t t + β
A Correlation study has also been undertaken to
determine any relationship among these identified variables.
The Granger Causality test has been used to find any causal
relationship between CSR and indicators of a bank's financial
stability. The finding of the Granger Causality test should be
in line with the result from regression analysis. ICICI bank has
the highest mean CSR expanses of 103.27 crores, followed
by HDFC bank. The financial stability ratios of these banks
also reflect better numbers than others. SBI bank is leading at
the front in the PSU category. Indian Overseas Bank has not
been considered in a study due to CSR expenses'
unavailability in its annual report.
All financial stability variables except NPA have a
positive correlation with CSR. The negative correlation
between NPA and CSR supports the positive role of CSR on
financial stability. The negative growth in NPA value is
required for better financial results. The regression outcomes
for all financial variables as a dependent variable to CSR as
independent, as per equation 1, below. If p-value < , here α
0.05, passes the test of significances, it means null
hypothesis H =0 signifies no relationship between 0β
dependent and independent variables will be rejected. The
alternate hypothesis H ≠ 0 signifies a strong relationship 1β
49CSR as an Agent of Financial Stability

between the variables will be accepted (Table 5). The p-value
for all variables in regression is less than 0.05 indicate the
significance of the independent variable CSR, on all
dependent variables. The coefficient of NPA is minimal β
below 1%, indicate CSR has minimal impact on NPA in the
banks under study.
The Granger Causality outcome presents that if p-value
< , here 0.05, passes the test of significances, it means the α
null hypothesis of Variable' A' does not Granger cause other
variables 'B' be rejected. CSR Granger causes all the
dependent variables for financial stability except ROA (Table
6).
CONCLUSION
Despite many studies conducted to establish a relation
between CSR and its performance, none found a strong
connection. The study's findings make several contributions
to the CSR domain, mainly in terms of the banking industry.
CSR expenses have a direct impact on all the selected
financial stability indicators in the banking industry to improve
the financial return in terms of capital stability and return
enhancement in the banking industry. CSR expenses help
curtail nonperforming assets in the banking industry, as NPA
is neither showing direct relation nor Granger caused
relationship with CSR expenses. The study improves the
knowledge base of decision-makers in India's banking firms
about the importance of CSR strategy for getting tangible
benefits in terms of financial stability and other intangible
benefits like competitive advantages, reputation and
customer satisfaction, etc. In addition to knowledge
contribution, the study also provides a framework method to
find the impact of CSR on financial stability.
REFERENCESAbuBakar AS and Ameer R 2011. Readability of corporate social
responsibility communication in Malaysia. Corporate Social Responsibility and Environmental Management 18(1): 50-60.
ACCA 2009. The importance of corporate responsibility. Available at: www.accaglobal.com/ publicinterest/activities/library/ sustainability/accounting_sustainability/archive/2005/19/publications/2784968.
Alafi K and Hasoneh AB 2012. Corporate social responsibility
associated with customer satisfaction and financial performance a case study with Housing Banks in Jordan. International Journal of Humanities and Social Science 2 (15): 102-115.
Branco MC and Rodrigues 2008. Factor influencing social responsibility disclosure by Portuguese companies. Journal of Business Research 29 (1): 21-41.
Galbreath J and Shum P 2012. Do customer satisfaction and reputation mediate the CSR-FP Link? Evidence from Australia. Australian Journal of Management 37(2): 211-229.
Keffas G and OluluBriggs OV 2011. Corporate social responsibility: How does it affect the financial performance of banks? Empirical evidence from US, UK, and Japan. Journal of Management and Corporate Governance 3 (1): 8-26.
Lin C H, Yang HL and Liou DY 2009. The impact of corporate social responsibility on financial performance: Evidence from business in Taiwan. (1): 56-63.Technology in Society 31
Luo X and Bhattacharya CB 2006.Corporate social responsibility, customer satisfaction, and market value. Journal of Marketing 70(4): 1-18.
Lozano JM 2008. CSR or RSC? (beyond the Humpty Dumpty syndrome). (3): 191-206.Society and Business Review 3
Malcolm S, Khadijah Y and Ahmad Marzuki A 2007. Environmental disclosure and performance reporting in Malaysia. Asian Review of Accounting 15 (2): 185-199.
Mishra S and Suar D 2010. Does corporate social responsibility influence the firm performance of Indian companies. Journal of Business Ethics 95(4): 571-601.
Oeyono J, Samy M and Bampton R 2011. An examination of corporate social responsibility and financial performance: A study of the top 50 Indonesian listed corporations. Journal of Global Responsibility 2 (1): 100-112.
Rettab B, Brik A and Mellahi K 2009. A study of management perceptions of the impact of corporate social responsibility on organizational performance in emerging economies: Dubai's case. (3): 371-390.Journal of Business Ethics 89
Scherer AG and Palazzo G 2007. Toward a political conception of corporate responsibility: Business and society seen from a Habermasian perspective. Academy of Management Review32(4): 1096-1120.
Sharma N 2011. CSR practices and CSR reporting in the Indian banking sector. International Journal of Advanced Economic and Business Management 1 (2): 58-66.
Sharma R and Kumar S 2013. An Empirical Analysis Of Private Equity (PE) Flows In India. Indian Streams Research JournalIII(XI): 1-13
Talaei GH and Nejati M 2008. Corporate social responsibility in auto industry: An Iranian perspective. Lex et Scientia International Journal XV (1): 84-94.
Van Beurden P and Gössling T 2008. The worth of values: A literature review on the relation between corporate social and financial performance. (2): 407-424.Journal of Business Ethics 82
Wood DJ 2010. Measuring corporate social performance: A review. International Journal of Management Reviews 12 (1): 50-84.
Received 10 April, 2021; Accepted 06 July, 2021
50 Salineeta Chaudhuri and Santosh Kumar

Financial Inclusion of Rural Sector: Imperative for Sustainable Economic Growth of India
Manuscript Number: S-675NAAS Rating: 5.79
Abstract: This research paper aimed to take a look on the present status of financial inclusion in the Indian economy, especially in the rural sector. It also suggested few measures to be taken by the government and banking sector to enhance the inclusion of deprived sections of our country in the financial ecosystem. The data was collected from various secondary sources to depict the present level of financial inclusion, primarily after the implementation of various government policies. The suggested measures mainly included financial literacy and awareness campaign to be implemented at the grass root level along with a robust infrastructure to increase the telephone and internet connectivity in the rural sector. The researchers also analysed that the financial inclusion of the rural sector is imperative for the sustainable economic growth of an agricultural driven economy like India.
Keywords: Financial inclusion, Rural sector, Financial ecosystem, Financial literacy, Sustainable economic growth
Shalini Mittal and Shivani Chaudhry1
School of Business Studies, Sharda University, Greater Noida-201 306, India1Department of Management Studies, CHRIST (Deemed to be) University, Delhi NCR-201 003, India
E-mail: shalini.mitta @sharda.ac.in l
Indian Journal of Ecology (2021) 48 Special Issue (16): 51-55
The growth prospect of a developing economy like India
is very much dependent on the overall development of each
and every sector of the country. India being an agricultural
driven economy, the financial inclusion of the rural sector
becomes imperative for the uniform and comprehensive
economic growth. The term financial inclusion defined as
“The process of access to financial services, and timely and
adequate credit needed by vulnerable groups such as
weaker sections and low income groups at an affordable
cost” (Rangarajan 2008). Hence, the approachability of
financial system is very much required for generation of
resources and for allocating it appropriately for the weaker
and disadvantaged section of the society which are partially
deprived of such services. According to a report by RBI, the
financial exclusion of these sections results in decline of GDP
by one percent (Kumar 2011). The reasons may be many
folds from financial illiteracy to geographical location of banks
and gender inequality. This reiterates the importance of
financial inclusion of all the sections of our country for the
economic growth and development (Muteja 2020). As per the
World Bank report in 2018, out of the total population, 19
crore people were still unbanked in India. Findex (2017)
reported that of the total people who were unbanked in India,
56% were women and 44% were men. Most of the people
who were unbanked were illiterate or just had primary
education. The Government of India has introduced special
schemes like 'Pradhanmatri Jan Dhan Yogna' to include the
unbanked people under the banking purview. RBI has issued
instructions to banks to open one third of their branches in
semi urban and rural areas to expand coverage of banking
services in these areas. With constant efforts of the
government and RBI, approximately 80% of the population
had bank account in 2018.
Financial industry in developed countries especially
banks have played a major role in the economic development
of their respective country. A robust banking system becomes
the backbone of economy as the channelization of money is
done properly and efficiently. A strong banking system helps
in financing the needs of individuals and businesses by
evaluating the credit worthiness of the customer. They
provide a host of activities and products to choose from as
per the requirements of each client. Thus, the development of
every aspect of the society is taken care of which gives boost
to the economic development. The countries where there is
competition among the players in banking sector, more
competitive rates are given to the customers and therefore
the growth is increased by more lending (Hasan and Marton
2003). The economies that have not liberalized its markets
have less or no competition. Here the customers have to take
the prices as quotes by the banks and so the development of
businesses is hampered. Across the world Financial
Inclusion is looked upon as it can help in reducing poverty
and income inequality and can lead to greater stability in
economy and financially. (Allen 2017). Financial inclusion
can help poor, by channelizing their savings and helps them
to build assets. In addition, there is disparity among the

banking patterns of developed and developing countries,
males and females, educated uneducated, accessibility of
services, etc. Global Financial Inclusion (Global Findex).
Database provides that out of the 50% of the unbanked
population in the world, at least 35% reported barriers to use
formal accounts because of public policies. The most
commonly reported barriers are physical distance from
financial institution, lack of documentation to open account
and high cost to operate these accounts (Mittal 2016).
Financial Inclusion can bring many benefits to countries
and individuals specially the vulnerable groups like poor
farmers. These groups have high rate of financial exclusion
where lack of credit facilities from financial institutions affect
them adversely (Dev 2006). In countries like India, financial
inclusion can be one of the greatest tools to attain its
phenomenon of its growth (Dixit and Ghosh 2016).
Customer's requirement affects the strategies of the bank
and the apex authority to frame policies accordingly to
include all sects of people in financial inclusion. However,
India is a heterogeneous country having people from
different social, cultural and financial background but the
banks operating in India offers homogenous products and
services (Crocco 2010). Thus, making easy to frame policies
and their implementation.
RBI has always made an effort to include as many
people as possible in the financial structure of the country. In
the last five years, these efforts have increased
tremendously. RBI have directed all the universal banks to
open a minimum of one fourth of the branches in rural areas
and have also given banking licenses to differentiated banks
to increase the banking penetration. Competitions increases
the penetration in market with respect to financial services
and government can play an active role in managing the
same (Allen 2017).
Financial literacy will help people in understanding the
products of the bank and their ease of operations and
benefits to use such services. Classroom teaching cannot be
beneficial in this regard but only targeted education should be
provided to individual groups to make it more effective (Allen
2017). As financial inclusion is going to be the back bone of
inclusive economic growth of our country, in view of the given
scenario, this study has been planned to find out the present
status of India in accordance with the rural perspective
regarding the financial inclusion after the launch of many
government policies in this direction. The review of work
done in this direction with respect to financial inclusion and
the attempts made by the government to increase the reach
of financial sector in each and every part of the country has
led to decide the objectives of this study. These are to
analyse the extent of financial inclusion in the rural are and
suggest the ways and means to address the problem of
financial inclusion in rural sector.
MATERIAL AND METHODS
The persistent efforts made by the government and the
RBI helped include more people into the formal banking
system, the number of individuals who have bank accounts
grew to 80% in 2017 from 53% in 2014 (Times of India 2018).
As per the GFI Report in 2017 India's total unbanked
population was approximately twenty percent but given the
population that we have as a county, the actual unbanked
people in the country are in millions. In last decade the central
bank has increased its focus on the financial service
penetration in the country with most focus on the rural and
semi urban areas. Banks were given mandate to open twenty
five percent of their branches in rural and semi urban areas
so that the benefit of financial services can even be attained
in the remote areas. Though banks have made many efforts
to increase the penetration of financial services in the rural
areas but it is bank correspondents or bank mitras who have
helped to achieve the maximum target. These bank mitras
provide financial services to the rural people at their door step
and hence it becomes easier for them to avail the financial
services. This ease of doing the transactions has been a
major force behind financial inclusion in rural and semi urban
areas.
Banking network in the rural sector has been improved
considerably since 2010 driven by the financial inclusion
plans. The total number of branches/outlets rose to 5,69,547
in March 2018 from 67,694 in March 2010, which was
primarily driven by an exponential rise in banking
correspondents in the rural sector. Banking correspondents
dominate the banking services in the rural sector – the share
of banking correspondents in the total banking outlets in the
rural sector rose from 50.5% in March 2010 to 90.5% in
March 2018. This indicates that intermediaries, such as
business correspondents and business facilitators that were
allowed by RBI in 2006 to provide financial services to areas
where banks lack presence – have been quite successful.
KCC was launched under a scheme to offer sufficient credit,
comprising short-term loans for crops and others, to farmers
with shortened and flexible procedures in timely manner.
Commercial banks, regional rural banks and cooperative
banks implemented the scheme. The tremendous growth
shows popularity of the scheme among farmers. GCC have
also been accepted in the rural sector with both number of
cards and value of transactions witnessing considerable
growth between March 2010 and March 2018.
The increased network of ATMs has supported efforts
undertaken by RBI and banks to extend banking services to
52 Shalini Mittal and Shivani Chaudhry

foster financial inclusion. However, ATM network is more
concentrated in the metropolitan and urban centres, which
accounted for 56% of the total ATMs as of 31 March 2018.
ATM network of the public sector banks were relatively
evenly distributed across the four types of centres, while ATM
networks of the private and foreign banks were concentrated
in the urban and metropolitan centres on account of their
customer base and high commercial and industrial activity.
Nonetheless, banking penetration improved significantly
across regions and showed huge progress in population per
branch. The above data clearly depicts a sanguine view of
financial inclusion in the rural sector resulting from the
initiation and implementation of various government policies
in this direction. The achievement to this level was also
feasible only because of a number of initiatives taken by the
government in the form of Pradhan Matri Jan Dhan Yojana
(PMJDY), Digital India, Priority sector lending through
Pradhan Mantri Mudra Yojana (PMMY) and the financial
literacy programs run by RBI. According to a latest data
provided by ministry of finance the deposits in bank accounts
opened under PMJDY have crossed Rs.1 lakh crore mark i.e.
the total balance in over 141,593 crore in Pradhan Mantri Jan
Dhan Yojana (PMJDY) accounts as on March 31, 2021. The
opening of new branches along with the micro finance
institutions and self-help groups are institutional in the
progression of financial inclusion in our country as shown in
the above mentioned figures. In addition to these modes of
delivery, the banking correspondents have also contributed
tremendously towards deepening the financial penetration
beyond the brick and mortar model as shown above.
RESULTS AND DISCUSSION
The progress of implementation of the above mentioned
policies has to be analysed to suggest the road ahead in
terms of future policy framework. It is observed from the
analysis of the informal data that about 79% of adult Indians
have a registered bank account but still only 54% adults are
To customers To banks To government
Benefits of financial inclusion
Affordable financial services Increase in customer base Reaching out to unbanked population
Access to government benefits Increase in outreach Channelizing the savings of common people
Access to loans from organized sector Expansion in potential business base Inculcating savings habit among people
Release from local money lenders Improving market share Speeding economic growth
Channelizing the savings Low transactional/operational cost Reducing migration to urban cities
Improvement in financial status Low cost CASA deposits Far outreach of policies
Improvement in economic status Corporate Social Responsibility Reducing corruption by removing middlemen
Table 1. Benefits of financial inclusion to customers, banks and government
active users of their bank accounts, primarily female, living in
rural areas and have incomes below the $2.50/day poverty
line. However, it is also documented that only 13% adults are
financially literate in India as compared to 29% in Bangladesh
which is a very disheartening state of situation (Source: 2020
Financial Inclusion Insight). These figures indicate that still
there is a long way to go. Hence, there are few aspects which
should be considered by government and other
organisations to achieve our most desirable objective of
financial inclusion.
The growth of Indian economy, is agri economy, is very
much dependent on the active use of bank credits as well as
bank accounts by the rural sector adults which in turn are
predominantly dependent on their financial literacy. Hence,
the government in collaboration with RBI and other banking
agencies should create financial awareness programs for
this marginalised group especially in the rural sector, in order
to curb the financial exclusion which is still persisting in our
economy. In addition to this digital banking should be
promoted by crediting the subsidies in these schemes
directly in the bank account of the beneficiaries. This will not
only give them the incentive to actively use their bank
accounts but also eliminate the role of middlemen who
practically grab these subsidies before they reach the end
users. Eventually it will improve the saving- spending
quotient of the end users which in turn will enhance the fund
infusion in our financial system. Lack of proper infrastructure
is also an obstacle in this journey of financial inclusion
especially in our rural areas which should be taken care by
the government at the earliest. Another area of intervention is
the crop insurance, which should also be imposed
mandatorily on farmers above a certain income level to
enhance financial inclusion in this sector. There is one more
aspect to be dealt with utmost priority, which is the role of
banking/business correspondents. They are the link between
the banking organisations and the end users for increasing
the reach of financial benefits especially in the rural sector.
53Financial Inclusion of Rural Sector

19.8
20.1
30.0
50.0
51.1
60.3
63.1
65.5
69.2
78.7
China
India
Brazil
Bangladesh
Indonesia
Nigeria
Mexico
Phillippines
Vietnam
Pakistan
Source: Global Findex Report, World Bank, Times of India
Fig 1. . Top Countries with largest percentage of unbanked adults (2017)
33,378
50,860 50,805
Mar-10 Mar-17 Mar-18Year
Source: RBI, 2018
Fig. 2. Number of branches operated by banks in rural sector
67,694
5,98,093 5,69,547
Mar-10 Mar-17 Mar-18
Year
Source: RBI, 2018
Fig. 3. bTotal anking outlets in rural sector
34,174
5,43,472
5,15,317
8,390
1,05,402
1,00,802
25,784
4,38,070
4,14,515
Mar-10
Mar-17
Mar-18
Number of Banking Correspondents
Number of Banking Correspondents in Villages with <2,000 population
Number of Banking Correspondents in Villages with >2,000 population
Total Banking Correspondents in Villages
Source: RBI, 2018
Fig. 4. Number of banking correspondents operated by banks in rural sector
Fig. 5. Banking utlets in ural ector (Percentage share in total branches)o r s
Source: RBI, 2018
Fig. 6. Growth in Kisan Credit Card (KCC) and General Credit Card (GCC) in Rural SectorSource: RBI, 2018
54 Shalini Mittal and Shivani Chaudhry

29,62842,374 41,254 32,531
4,845
14,464 15,747 25,08917
17 172 733
Rural Semi-Urban Urban Metropolitan
Public Sector Banks Private Sector Banks Foreign Banks
34,490 56,855 57,173Total 58,353
Fig 7.. Breakdown of ATMs Opened by Banks (as of 31 March 2018)
Source: RBI, 2018
Therefore, it becomes imperative to provide a more lucrative
incentive structure as well as financial education/certification
to them so that they are motivated to increase the level of
financial inclusion especially in the rural sector. There should
also be a well-diversified bouquet of financial products
provided by them to the beneficiaries to enhance the ultimate
motive of financial reach at the rural level.
CONCLUSION
This study on financial inclusion shows that though the
situation has improved drastically from the previous stage as
a result of many government policies, still there are
impediments in the path of implementation of policies mostly
in the rural sector of our country which is the back bone of our
economy. The impediments include the lack of proper
infrastructure, low telephone and internet connectivity as well
as financial illiteracy especially in the rural area to count a few
among others. Thus, it is the need of the hour for the
government and other banking institutions to address these
bottlenecks at the earliest so that there is proper financial
inclusion of each and every strata in the Indian financial
ecosystem. This will play a significant role not only in poverty
alleviation but also in sustainable economic growth and
development of our country.
REFERENCESAoki M and Patrick H 1995. The Japanese main bank system: Its
relevance for developing and transforming economies. Oxford University Press.
Allen F, Demirguc-Kunt A, Klapper L and Peria MSM 2017. The foundations of financial inclusion: Understanding ownership and use of formal accounts. Journal of Financial Intermediation27: 1-30.
Besanko D and Thakor AV 1992. Banking deregulation: Allocational consequences of relaxing entry barriers. Journal of Banking &
Finance 16 (5): 909-932.
Crocco M, Figueiredo ATL and Santos FBT 2010. Differentiated banking strategies across the territory: An exploratory analysis. Journal of Post Keynesian Economics 33 (1): 127-150.
Das A, Nag A and Ray SC 2005. Liberalisation, ownership and efficiency in Indian banking: nonparametric analysis. AEconomic and Political Weekly: 1190-1197.
Dev SM 2006. Financial inclusion: Issues and challenges. Economic and Political Weekly: 4310-4313.
Diniz E, Birochi R and Pozzebon M 2012. Triggers and barriers to financial inclusion: The use of ICT-based branchless banking in an Amazon county. Electronic Commerce Research and Applications 11 (5): 484-494.
Dixit R and Ghosh M 2016. Financial inclusion for inclusive growth of India-A study of Indian states. International Journal of Business Management & Research (IJBMR) 3 (1): 147-156.
Economic Times 2020 https://economictimes.indiatimes. com/industry/banking/finance/banking/deposits-in-jan-dhan-accounts-cross-rs-1-lakh-crore/articleshow/70155469. cms?from=mdr (Accessed: 27 January 2020).
Gupta OK, Doshit Y and Chinubhai A 2008. Dynamics of productive efficiency of Indian banks. International Journal of Operations Research 5 (2): 78-90.
Hasan I and Marton K 2003. Development and efficiency of the banking sector in a transitional economy: Hungarian experience. (12): 2249-2271.Journal of Banking & Finance 27
Kumar R 2011. Treatmentof Valuables as Capital Formation in India: Some Issues and Perspectives. RBI Working Paper Series No 09: 1-48
Marshall JN 2004. Financial institutions in disadvantaged areas: a comparative analysis of policies encouraging financial inclusion in Britain and the United States. Environment and Planning A36(2): 241-261.
Mittal S 2016. . Financial Inclusion Financial Economics and Sustainability Issues in India: 105-115. Horizon Books. Banglore, India.
Moray R and Nargundkar N 2020. Factors Affecting Financial Decision of Lender on Indian P2P Platforms- An Empirical Analysis. (9): 8-13.Indian Journal of Ecology 47
Mutreja L 2020. Redefining Financial Inclusion- An Empirical Analysis of Demand Side Factors. Indian Journal of Ecology 47(9): 51-55.
Rangarajan C 2008. “Report of the Committee on Financial Inclusion” RBI Report : 1-178
Rastogi S, Sharma A and Panse C 2020. Open Banking and Inclusive Growth in India. (9): 75-Indian Journal of Ecology 4779.
Shamika R 2019. , Accelerating Financial Inclusion in IndiaBrookings India Report: 5-45
Sarma M 2008. Index of Financial Inclusion: A measure of financial sector inclusiveness. Berlin (GE): Berlin Working Papers on Money, Finance, Trade and development (Accessed: 5 July 2017).
Times of India 2018. 'India has second largest population in the world'. Available at https://t imesofindia.indiatimes. com/business/ india-has-second- largest -unbanked-populat ion- in-the-wor ld/art icleshow/64570254.cms (Accessed: 6 June 2019).
Received , 2021; Accepted 06 July, 202114 March
55Financial Inclusion of Rural Sector

Exploring Effect of Instagram Influencer Likeability and Personality Traits on Self-concept and Impact on Consumer
Buying Intention towards Cosmetic Products
Manuscript Number: S-676NAAS Rating: 5.79
Abstract: With the advent of visual platforms like Instagram the communication environment for businesses has certainly micro-bloggingundergone massive change. Over the years these platforms have evolved and brands have had to adapt themselves to gain visibility amongthe millennial audience by being available on the social media platforms. The disruptive force of these social media platforms has a great impact on the consumer decision making processes. As a result, consumers now rely more on recommendation from their peers. The sharing of views, experiences, opinions and expectations online by the users on various social media platforms have become a trusted source of information for the consumers. This had led to brands connecting to online celebrities known as Social media influencers” (SMI) to distribute “information and influence consumer's product perceptions i.e., the concept of influencer marketing. SMI's are referred to as online opinion leaders with large numbers of followers to drive messages through their promotional posts. A lot of research has been done to study the impact of celebrity endorsements but currently there is a gap in research pertaining to consumer's perspective towards the SMI's and SMI's effects on consumers. The online survey of self -concept and alters its buying intentions when an influencer posts promotional conducted in the studies how the likeability and personality traits of an influencer affects the consumer understanding posts on Instagram. Significant relationships were found for both, the likability traits and consumer self-concept and personality traits and consumer self-concept. Also using predictive analysis, the extent to which each of the consumer self-concept statements affected the buying intentions was determined. These results provide practical implications for brand managers who plan to invest in influencer marketing.
Keywords: Likeability Personality Traits, Self-concept, Self-congruity, Buying intentions, , Social media influencers
A. and Vedha BalajiS. SureshSchool of Business and Management, Christ University, Bangalore-560 029, India
E-mail: [email protected]
Indian Journal of Ecology (2021) 48 Special Issue (16): 56-63
In India, the cosmetics and personal care industry has
witnessed tremendous growth in the years post the millennium
year, thereby, acknowledging the strong potential for foreign
companies. Over the years, this sector has continued to show
strong growth in India. This can be attributed to the increasing
shelf space in the Indian retail stores and boutiques where
retailers are now comfortable with the idea of stocking high
price cosmetics from around the world. According to Redseer
Consulting, it is expected that by 2025 the Indian cosmetic
market will touch the $20 billion mark from the current level of
$6.5 billion. The industry has been growing at a CAGR of
16.72% over the 5-year period and is estimated to grow at a
rate 25% in the next 5 years. nline penetration of cosmetics O
in the retail channels is low in comparison to the other FMCG
category, based on the increase in the E-tailing platforms it is
expected that these statistics for online sales of cosmetics will
certainly change in the coming years to the rising trend of due
influencer marketing concept opted by brands to promote their
on various social media platforms like Facebook, Instagram,
Snapchat etc.
Instagram is one of the most trending social media
platforms in India. It is a platform that allows its users to share
only photographs or videos-based content. The users can
caption their content, add in hashtags and mentions (i.e.
tagging others in their posts). Unlike Facebook, the app here
uses the term “Followers” to refer to friends. Instagram was
launched in the year 2010, and it has evolved significantly
since then, and today it has more than 500 million users
( . Vignisdóttir 2017) Glucksman (2017) explains the impact of
Influencers in case Lifestyle branding with pedantic and
content analysis. Pedantic analysis was done to understand
the strategies that the influencers use while posting content.
And content analysis to understand how the influencers
engage with their audiences and the various techniques used
by them to advertise via YouTube Paço and Oliveira (2017)
identified the importance of influencer marketing in the field of
fashion and beauty blogs and observed influencer that
marketing fosters are genuine and true communications with
the customers which leads them to trust the “real information
and opinions of the blogs and their bloggers with whom they
identify”. Freberg (2011) identified the personality traits et al
related to social media influencers, by constructing a
psychological framework and the resemblance of character
traits strengthened the connect between influence theory

and the theory of influencers Grafström (2018) . et al
concluded that consumer attitudes are affected by influencer
marketing firstly, based on the extent of relevance and
involvement the consumer's experience with the brand and
the influencer posts.
Burke (2017) studied the effect of an Instagram based
SMI on the consumer perceptions by measuring social
comparison and self-congruity. The research identified that
there exists a strong correlation between self-congruity and
social comparison towards the SMI. It was identified that the
consumer's perception of a social media influencer affects
the product perception.
Martawilaga and Purwanegara, (2016) opine that in
case of e-WOM the source of the influence i.e. source
credibility affects the consumer buying intention. Have
(2017) conceptualizes the persona of a beauty vlogger with
the help of theories comprising of source credibility, para-
social action and Big Five personality model and identified
that the dimension of social attractiveness has the highest
influence on consumer buying intentions Nam and Dân .
(2018) identified 4 major factors that influence the consumer
purchase behavior. The factors are influencer credibility,
information quality, relationship between influencers and
products and consumer involvement. Linh (2018) identified
the causal relationship between the influencer
recommendations and consumer behavior. Rebelo (2017)
analyzed the perception of Instagram users towards the
influencers they follow on Instagram. Perceived
attractiveness and trustworthiness of the influencers
emerged as most important dimensions of credibility that
significantly explain the consumer's buying intention.
Influencer Likeability Attractiveness
Trustworthiness
Expertise
Engagement effectiveness
Credibility
Influencer Personality
traits
ConscientiousnessAgreeableness
NeuroticismOpenness to expression
Extraversion
Consumer Self concept
Actual self image
Ideal self image
Social self image
Ideal Social self image
Consumer buying intentions
Fig. 1. Conceptual framework
MATERIAL AND METHODS
Conceptual framework: literatureBased on the review of
variables actual self-image ideal self-congruity social self- , ,
image ideal social-image openness to, , experience,
conscientiousness, extroversion, and agreeableness
neuroticism to develop the conceptual have been identified
framework for the study as depicted below:
Measurement scale: descriptiveAs the research is in nature
the primary data was collected from consumers in a
probabilistic multi stage sampling process with the help of 5-
Point Likert Scale based questionnaire. Instagrammers were
mainly considered as influencers here and their followers or
respondents who use Instagram and purchase products
based on the influencer's recommendation. Secondary data
is used to understand the self- congruity theory and
understanding of various personality traits and also whether
previous literature can provide us with realization on the
feasibility of the study that was gathered through journals and
articles. population comprises of Indian individuals aged The
18 years old or over, who most likely have an account on
Instagram or have knowledge about Instagram app. Non-
probabilistic ing method was deployed convenience sampl
and the data collected online across India. Sample size
considered was 224 as it is adequate to represent the
segment of Instagram. Data used for analysis comprised of
217 respondents as the responses for the questions from
other respondents were either redundant or missing.
Statistical tools: ols The statistical to used were reliability
analysis, frequency analysis, descriptive statistics, chi-
square using SPSS, cluster analysis using r software and
predictive analysis using random forest tool
57Consumer Buying Intention towards Cosmetic Products

Independent variables Cronbach's alpha
Cronbach's alpha based on standardized
items
N of items
Attractiveness 0.911 0.911 5
Trustworthiness 0.945 0.946 5
Expertise 0.923 0.924 5
Engagement effectiveness 0.817 0.818 4
Source credibility 0.887 0.888 5
Agreeableness 0.85 0.85 3
Extraversion 0.884 0.884 4
Neuroticism 0.736 0.737 2
Openness to experience 0.705 0.706 3
Conscientiousness 0.831 0.831 4
Actual self-image 0.881 0.881 3
Ideal self-image 0.938 0.938 4
Ideal social self-image 0.924 0.923 3
Table 1. Reliability statistics
Source: Primary data
Frequency Percent Valid percent Cumulative percent
Female 148 68.2 68.2 68.2
Male 69 31.8 31.8 100
Total 217 100 100
Table 2. Gender frequency distribution
Source: Primary data
Frequency Percent Valid percent
Cumulative percent
I am just comfortable 95 43.8 43.8 43.8
I am maintaining 74 34.1 34.1 77.9
I am very comfortable 31 14.3 14.3 92.2
I am struggling 17 7.8 7.8 100
Total 217 100 100
Table 3. Financial situation frequency distribution
Source: Primary data
RESULTS AND DISCUSSION
The following are the different reliability charts for
individual independent variables:
From the reliability test conducted for the various
independent variables the data comes out to be highly
reliable with the Cronbach's alpha value more than 0.5 for all
the variables therefore these variables can be considered for
further analysis.
Descriptive Analysis
Frequency distribution charts of all factors: As each
independent factor has some variables associated with it and
each variable needs to be interpreted carefully in order to
understand the perception Thus used descriptive consumer .
analysis in order to understand the significance of each
variable and from these we will be able to identify most
significant variable.
The individual analysis of each of the independent
variables indicate that majority of the respondents were
females, i.e. 68.2% (Table ). This can be attributed to the 3
assumption that the female respondents would connect
better to the female influencer data used for the study.
The majority of our respondents are in comfortable
financial position i.e. 43.8% therefore can make an
assumption that the respondents might be interested to buy
products recommended by the influencer.
The majority of our respondents follow influencers
primarily because they “Provide credible information”
(27.30%) and secondly “Because they guide you about the
product” (22.60%).
Responses
N Percent
Provide credible information 117 27.30%
You find them attractive 71 16.60%
You trust them 50 11.70%
You like them 62 14.50%
Because they interact with you 32 7.50%
Because they guide you about the product 97 22.60%
Total 429 100.00%
Table 4. Reasons as to why respondents follow Influences
Source: Primary data
Parameters Age Total
<18 18-25 26-35 36 and above
Provide credible information
Count 3 92 20 2 117
% 1.40 43.00 9.30 0.90 54.70
You find them attractive
Count 1 61 9 0 71
% 0.50 28.50 4.20% 0.00 33.20
You trust them Count 2 42 4 2 50
% l 0.90% 19.60% 1.90% 0.90% 23.40%
You like them Count 0 52 10 0 62
% 0.00 24.30 4.70 0.00 29.00
Because they interact with you
Count 1 24 7 0 32
% 0.50 11.20 3.30 0.00 15.00
Because they guide you about the product
Count 1 76 16 4 97
% 0.50 35.50 7.50% 1.90 45.30
Total Count 3 171 34 6 214
% 1.40 79.90 15.90 2.80 100.00
Table 5. Impact of influencer on age cross tabulation
58 A. and Vedha BalajiS. Suresh

Despite belonging different age groups, the respondents
follow influencer because of the same major reasons i.e.
provide credible information and because they guide about
the product.
Irrespective of the gender, primary and secondary
reasons for following an influencer remains the same
reasons i.e. Provide credible information and because they
guide you about the product. But as a tertiary factor, males
prefer “Likeability” characteristic over “attractiveness” unlike
the females who prefer “attractiveness” over “Likeability”.
Since 65.4% of the respondents have already bought a
product recommended by an influencer, this implies that the
dataset is apt for studying the consumer buying intentions
based out of Instagram influencers.
Gender Total
Male Female
Provide credible information Count 36 81 117
% 53.70 55.10
You find them attractive Count 11 60 71
% 16.40% 40.80
You trust them Count 14 36 50
% 20.90 24.50
You like them Count 21 41 62
% 31.30 27.90
Because they interact with you Count 9 23 32
% 13.40 15.60
Because they guide you about the product
Count 25 72 97
% 37.30 49.00
Total Count 67 147 214
Table 6. Impact of influencer on *gender cross tabulation
Source: Primary data
Frequency Percent Valid percent
Cumulative percent
Yes 142 65.4 65.4 65.4
No 75 34.6 34.6 100
Total 217 100 100
Source: Primary data
Table 7. Respondents who ever bought a product recommended by an influencer
Since 65.4% of the respondents have un-followed an
influencer on Instagram that they are active this implies
Instagram users therefore depicting that the dataset is apt for
studying the consumer buying intentions based out of
Instagram influencers.
Since 67.5% of the females have bought products
recommended by Instagrammers therefore females are
more active followers or target audience of the
Instagrammers.
Chi-square test:
H :0 There is no relationship between the categorical variables
i.e. variables in the population are independent.
H :a There is a relationship between the categorical variables
i.e. variables in the population are not independent.
Frequency Percent Valid percent
Cumulative percent
Yes 142 65.4 65.4 65.4
No 75 34.6 34.6 100
Total 217 100 100Source: Primary data
Table 8. Respondents who ever un-followed an influencer
Value df Asymptotic significance
(2-sided)
Attractiveness_1 Pearson Chi-
Square
16.958 4 0.002
Attractiveness_2 14.536 4 0.006
Attractiveness_3 18.193 4 0.001
Attractiveness_4 10.934 4 0.027
Trustworthiness_1 11.342 4 0.023
Trustworthiness_2 13.694 4 0.008
Trustworthiness_3 16.062 4 0.003
Trustworthiness_4 25.4 4 0
Trustworthiness_5 12.929 4 0.012
Expertise_1 16.285 4 .003
Expertise_2 16.243 4 0.003
Expertise_3 11.537 4 .021
Engagement effectiveness_1 23.965 4 0
Engagement effectiveness_2 19.602 4 0.001
Engagement effectiveness_3 15.09 4 0.005
Engagement effectiveness_4 9.906 4 0.042
Souce credibility_1 11.29 4 0.023
Souce credibility_2 14.796 4 0.005
Souce credibility_3 18.389 4 0.001
Table 10. Chi-Square tests for variables * consumer buying intentions
Cont...
Gender Total
Male Female
Ever bought a product recommended by an influencer
No 27 48 75
Yes 42 100 142
Total 69 148 217
Source: Primary data
Table 9. Female respondents who ever bought a product recommended by an influencer * Gender Cross tabulation
59Consumer Buying Intention towards Cosmetic Products

Chi-square test performed for the various likeability was
characteristics, personality traits and customer self-concept
statements against the consumer buying intention
statements, statements statistically and the were found to be
significant. Since the value for Asymptotic significance for all
the above statements is less than or equal to 0.05, we reject
the Null hypothesis i.e. all the above variables have some
relationship with the consumer buying intentions. Similarly
Chi-square test was performed for consumer self-concept
which yielded results wherein personality and likeability traits
statements relation with the consumer self-concept exhibited
statements as the p-value for all mentioned statements is
less than 0.05. However, if statements with p-value =0 only
are considered it was as that of the highest significance then
found that engagement effectiveness, trustworthiness and
source credibility statements show the least p-value amongst
the various likeability traits statements. In case of personality
traits, openness to experience, conscientiousness and
Value df Asymptotic significance
(2-sided)
Souce credibility_4 11.586 4 0.021
Openness to experience_1 32.417 4 .000
Openness to experience_2 26.026 4 0
Conscientiousness_1 42.319 4 0
Conscientiousness_2 15.309 4 0.004
Conscientiousness_3 36.835 4 0
Conscientiousness_4 20.335 4 0
Agreeableness_1 17.965 4 0.001
Agreeableness_2 19.274 4 0.001
Agreeableness_3 17.453 4 0.002
Extraversion_1 25.15 4 0
Extraversion_2 23.382 4 0
Extraversion_3 26.517 4 0
Extraversion_4 23.382 4 .000
Neuroticism_2 14.985 4 0.005
Social self-image 14.985 4 .005
Actual self- image_2 14.985 4 .005
Actual self- image_3 14.985 4 .005
Actual self- image_4 69.332 4 .000
Ideal self-image_1 63.514 4 0
Ideal self-image_2 62.504 4 0
Ideal self-image_3 89.213 4 0
Ideal social self-image_1 102.724 4 0
Ideal social self-image_2 160.356 4 .000
Ideal social self-image_3 217 4 0
Table 10. Chi-Square tests for variables * consumer buying intentions
Source: Primary data
agreeableness statements show maximum significance with
p-value=0 or close to 0 for most of the statements.
Cluster analysis: Since, it is exploratory in nature it does not
make any distinction between the dependent and
independent variables. For the given data set clustering was
done using the R programming tool. 2 clusters were mainly
identified:
Out of the 141 respondents belonging to cluster 1,
26.95% of the respondents showed positive buying
intentions after viewing the Instagrammers post and video,
depicting that they were influenced by the Instagrammer. Of
the 76 respondents belonging to cluster 2, 30.2% of the
respondents showed positive buying intentions.
Predictive analysis using random forest tool: In the
random forest approach, a large number of decision trees are
created. Every observation is fed into every decision tree.
The most common outcome for each observation is used as
the final output. A new observation is fed into all the trees and
taking a majority vote for each classification model.
An error estimate is made for the cases which were not
used while building the tree. That is Out-of-bag error estimate
which is mentioned as a percentage.
The R package "random Forest" is used to create
random forests
! Output revealed that the OOB error estimate is 0.
This implies that all the 217 cases were used by the system to
create the model.
Confusion matrix: A confusion matrix is a table that is often
-5 0 5 10
Bivariate Cluster Plot
Fig. .2 Cluster plot
Count of ID Column labels (Clusters) Grand Total
1 2
Row labels (Buying intention)
Others 103 53 156
Positive intent 38 23 61
Grand total 141 76 217
Table 1 1. Pivot table
Source: Primary data
60 A. and Vedha BalajiS. Suresh

Actual No Actual Yes
Predicted No 32 0
Predicted Yes 1 34
Table 1 . 2 Confusion matrix
Source: Primary data
used to describe the performance of a classification model
(or "classifier") on a set of test data for which the true values
are known.
“Yes” depicts a positive buying intent “No” depicted
“other” i.e. a negative or may/may not buying intention.
Results indicate that out of the 32 times when the data
indicted “No” buying intent amongst respondents, only once
did the model predicted “Yes”. Also of the 34 cases where
respondents showed positive buying intention, the model
always predicted a positive buying intention. This shows that
the model is highly accurate (98.51%) in predicting the
results.
Mean decrease in GINI values: It is a measure of variable
importance for estimating a target variable. Mean Decrease
in Gini is the average (mean) of a variable's total decrease in
node impurity, weighted by the proportion of samples
reaching that node in each individual decision tree in the
random forest. This is effectively a measure of how important
a variable is for estimating the value of the target variable
across all of the trees that make up the forest. A higher Mean
Decrease in GINI indicates higher variable importance.
Mean decrease in GINI values is highest for openness to
experience_3, conscientiousness_3 and all the consumer
self-concept statements specifically the ideal social self -
congruity statements. This implies these statements have
the highest impact on the consumer buying intentions.
! revealedThe review of literature 5 common
Likeability traits, namely: attractiveness, source credibility,
engagement effectiveness, trustworthiness and expertise.
In case of personality traits, they were identified using
the Big 5 Factor model, comprising of traits like openness to
experience, agreeableness, conscientiousness, neuroticism
and extroversion. The consumer self-concept model
comprise of factors like actual self-image, ideal self-image,
social self-image, ideal social self-image.
Personal factors: People follow influencers in the cosmetic
products category because of their expertise i.e. their
knowledge about the various products and also because they
are considered as a credible source of information. It was
found that irrespective of the age groups and gender, the
reasons for following the influencers remains same amongst
the respondents. emale more avid followers of F are
Instagram influencers. On the contrary, canwhile it be
Attractiveness_l 0.26860892
Attract!veness_2 0.54323920
Attracti veness_3 0.57053436
Attracti veness_4 0.55302404
Attractiveness_5 0.42601673
Trustworthiness_l 0.46688107
Trustworthiness_2 0.37688237
Trustv/orthi ness_3 0.50519064
Trustworthiness_4 0.76842816
Trustv/orthi ness_5 0.40522525
Expertise_l 0.29169536
Expertise_2 0.42063056
Expertise_3 0.24839727
Expertise_4 0.45066759
Expertise_5 0.31465150
EngEffectiveness_l 0.74222196
EngEffecti veness_2 0.31552834
EngEffecti veness_3 0.43822176
EngEffecti veness_4 0.31624832
sourcecredibi 1ity_l 0.41616056
sourcecredibi 1ity_2 0.37836117
sourcecredibi 1ity_3 0.42044188
sourcecredibi 1ity_4 0.21674144
sourcecredibi 1ity_5 0.31019917
openessToExperience_l 0.91261061
openessToExperi ence_2 0.60361793
OpenessToExperi ence_3 1.32512022
conscientiousness_l 0.65381995
conscientiousness_2 0.19855402
conscientiousness_3 1.28558683
conscientiousness_4 0.33272623
Agreeableness_l 0.56475747
Agreeableness_2 0.41617645
Agreeableness_3 0.26942494
Extraversion_l 0.25194985
Extraversion_2 0.76404049
Extraversion_3 0.70751022
Extraversion_4 0.45948777
Neuroticism_l 0.33379188
Neuroticism_2 0.63356492
socialselfcongruity_l 1.13044902
Actualselfcongruity_2 1.10557416
Actualselfcongruity_3 3.24240391
Actualselfcongruity_4 2.05092565
idealselfcongruity_l 1.13926761
idealselfcongruity_2 1.38158627
ideal seifcongruity_3 3.72157378
idealselfcongruity_4 4.41766152
idealsocialselfcongruity_l 5.68137194
idealsocialselfcongruity_2 9.87650548
idealsocialselfcongruity_3 18.40722074
61Consumer Buying Intention towards Cosmetic Products

inferred that though men also follow influencer
recommendations but the extent of buying intentions
generated amongst men because of Influencers is relatively
subdued. Cluster analysis revealed that irrespective of the
fact that whether a person is financially stable or not he she or
does get influenced by the influencer recommendations.
Therefore a brand should not restrict its reach to customers
based on the income levels of the potential customers.
Instead the brands should make in efforts to support such
customers through various schemes and offers so that this
set of customers can also buy their products.
Likeability traits: The Asymptotic significance value, using
the Chi-square test were identified as significant i.e. p-
value<0.05, against all the consumer buying intentions
statements for all the Likeability traits. This states that the
Likeability traits had some effect on the consumer buying
intentions. The Asymptotic significance value, using the Chi-
square test were identified as significant i.e. p-value<0.05,
against most of the Consumer self-concept statements but
majorly for Engagement effectiveness and trustworthiness.
The extent of the impact of the likeability traits was two
checked using the Random forest tool, where the highest
GINI value for Engagement effectiveness statements was
.074 and for Trustworthiness it was found to be 0.768.
Personality traits: The Asymptotic significance value, using
the Chi-square test were identified as significant i.e. p-value
<0.05 against all consumer buying intentions statements for
all the Personality traits. This states that the Personality traits
had some effect on the consumer buying intentions. The
Asymptotic significance value, using the Chi-square test
were identified as significant i.e. p-value<0.05, against most
of the Consumer self-concept statements but majorly for
openness to experience, conscientiousness and
agreeableness statements show maximum significance with
p-value=0 or close to 0.
The extent of the impact of the 3 Personality traits was
checked using the Random-forest tool, where the highest
GINI value for openness to experience was found to be 1.32,
for conscientiousness- 1.28 and for agreeableness it was
found to be 0.564. The low GINI value for agreeableness in
comparison to other two traits might be attributed to the small
sample size or overlap in interpreting the statements given
for agreeableness in the question.
Consumer self-concept: The Asymptotic significance
value, using the Chi-square test were identified as significant
i.e. p-value <0.05 against all consumer buying intentions
statements for all the factors of consumer self-concept. This
states that the Personality traits had some effect on the
consumer buying intentions. The extent of the impact of each
of the consumer self-concept factor statements was checked
using the Random forest tool, where the highest GINI value
for Social self- congruity was found to be 1.13, for Actual self-
congruity- 3.24, for Ideal self'-congruity- 4.417 and for Ideal
Social self-congruity was found to be 18.407. Therefore we
can infer that consumers buying intentions are majorly based
on the fact how he would want others to view him in the
society.
CONCLUSION
The marketers should focus in incorporating factors of
Influencer likeability and Personality traits while selecting an
influencer to endorse there brand to attract more consumers.
Since the customers are more inclined towards identifying
themselves with the influencers and they aspire to look like
the influencers, the marketers should therefore make serious
attempts to create trust and connect with the consumers by
conveying the genuineness of the product through various
engagement initiatives. Besides the benefits, the consumers
are more inclined towards the functionality and attributes of
the products than that of the price. Hence marketers should
make sure that the influencer focuses on the functionality and
attributes of the product.
REFERENCESAV 2017. Customer engagement on instagram brand pages in the
make-up cosmetics industry. Reyjakiv University: Master thesis.p.1-66
Baker MJ 1997. The impact of physically attractive models on advertising evaluations. : 538-Journal of Marketing Research 14555.
Biel JI and Gatica-Perez D 2013. The YouTube lens: Crowd sourced personality impressions and audiovisual analysis of vlogs. IEEE Transactions on Multimedia 15 (1): 41-55.
Erdogan BB 2001. Selecting celebrity endorsers: The practitioners perspective. (3): 39-48.Journal of Advertising Research 41
Freberg K 2011. Who are the social media influencers? A study of public perceptions of personality. (1): Public Relations Review 3790-92.
Friedman HA 1979. Endorser effectiveness by product type. Journal of Advertising Research 2 (5): 63-71.
Fulgoni GM 2015. Digital word of mouth and its offline amplification. Journal of Advertising Research 55 : 18-21.
Garifova LF 2016. Realization of small businesses economic interests on instagram. Journal of Economics and Economic Education Research 17 (1): 133-139
Gillin P 2007. The new influencers: A marketer's guide to the new social media. . . p. The enthusiasts California: Quill Driver Books35-56
Glucksman M 2017. The rise of social media influencer marketing on lifestyle branding: A case study of Lucie Fink. Elon Journal of Undergraduate Research in Communications 8 (2): 77-87
Grafström J, Jakobsson L and Wiede P 2018. The Impact of Influencer Marketing on Consumer's Attitude. Sweden Jonkoping University: p.1-83.
Have CE 2017. Beauty vloggers and their influence on consumer-buying intentions: Master thesis, The case of the Netherlands. Erasmus University Rotterdam. p.1-64
Johar JS 1989. Positioning models in marketing: Toward a normative
62 A. and Vedha BalajiS. Suresh
integrated model. (4): Journal of Business and Psychology 3475-485.
John OP 1999. The Big Five Trait taxonomy: History, measurement, and theoretical perspectives. In L. P. John, Handbook of personality: Theory and research. New York: Guilford Press, p. 102-138
Klipfel JB 2014. Self-congruity: A determinant of brand personality. Journal of Marketing Development and Competitiveness 8 (3): 130-143.
Linh TT 2018. Influencers' Blogging Patterns and Their Power of Shaping Consumer Purchase Decision: An Analysis from the Consumer's Perspectives. Master thesis Aalto University School of Business p.1-72
Martawilaga AI and Purwanegara MS 2016. Information acceptance of electronic words of mouth (ewom) and purchase intention through haul videos YouTube. Journal of Business and Management 5 (5): 651-660.
Meredith MJ 2012. Strategic communication and social media: An MBA course from a business communication perspective.
Business and Professional Communication Quarterly 75 (1): 89-95.
Nam LG and Dân HT 2018. Impact of social media Influencer marketing on consumer at Ho Chi Minh City. The International Journal of Social Sciences and Humanities Invention 5(5): 4710-4714.
Ohanian R 1991. The impact of celebrity spokespersons; perceived image on consumers; intention to purchase. Journal of Advertising Research 31 (1): 46-54.
Paço A and Oliveira S 2017. Influence marketing in the fashion and beauty industry. (1): 119-136.Estudos and Communication 25
Schau H and Gilly M 2003. We are what we post? Self-presentation in personal web space. (3): Journal of Consumer Research 30385-404.
Sirgy J 1982. Self-concept in consumer behavior: A critical review. Journal of Consumer Research 9 (3): 287-300.
Zhang Y 2017. Modeling the role of message content and influencers in social media rebroadcasting. International Journal of Research in Marketing 34 (1): 100-119.
Received 18 February, 2021; Accepted 06 July, 2021
63Consumer Buying Intention towards Cosmetic Products

Stakeholders' Pedagogical Preferences for Teaching 'Marketing' in Management Education
Manuscript Number: S-677NAAS Rating: 5.79
Abstract: This study has been realized that there is a dire need for re-thinking, particularly obvious for matters of assessment and its relation to the current focus on teaching marketing. A descriptive design of the research was used where convenient sampling has been followed for data collection. In order to achieve the purpose, it was decided to collect independent opinions of students, teachers, and professionals. Analysis has been done through descriptive statistics and Spearman's rank correlation. As a result, a significant difference between the stakeholders' perceptions about the pedagogy for teaching marketing in management education was identified.
Keywords: Management education, Pedagogy, Teaching marketing, Effective teaching, Higher education
Chandan Maheshkar and Vinod Sharma*CHRIST (Deemed to be University), Delhi NCR-201 003, India
*E-mail: [email protected]
Indian Journal of Ecology (2021) 48 Special Issue (16): 64-68
Marketing is a value-creating component for a business.
Strategic orientation of marketing could contribute to the
success of a business. Teaching marketing in
management/business programs is not just a matter of
practicing a pre-decided set of practices, it is actively
distinctive at every level of teaching, learning, and practicing
(Sonwalkar and Maheshkar 2016, 2017, Maheshkar and
Sharma 2018). The, teaching marketing effectively is mainly
based on the teachers' understanding and selection of
pedagogies, students' attitudes towards learning, and
marketing professionals' actions influenced by the
understanding gained from earlier experiences and
associating it with their intuitions and theories in use (Stewart
et al.2009, Sonwalkar and Maheshkar 2017). In the last two
decades, the way business has been changed very swiftly.
Shifts in economic circumstances and strengthening global
competition have given an increasingly central role to
management education (Maheshkar 2019). As marketing
discipline is growing consistently, it is informative to identify
what changes have occurred and why they occurred in the
marketing practices. All these would give insight that what
pedagogical practices need to evolve. This is the area of
study which requires practical experience and exposure to
both, teachers to teach this subject effectively and students
to learn the intricacies of subject matter carefully. It is obvious
to teachers to teach subjects like marketing management,
they need to have good exposure to field requirements; that
means they must have some practical exposure to marketing
operations. Students are also expected to have as much
practical exposure as possible through various methods
such as live projects, case studies, experiential learning,
industry visits, exchange programs, and the likes.
Determination of relevant pedagogy is not to think in terms of
carefully pre-planned hierarchical concept-delivery
structures, but fairly understanding the complex organization
of stakeholder's interests and available practices have a high
probability of arising out of randomly behaving elements. To
put it differently, hierarchy is not the only conceivable form of
organization in educational environments. It is important that
stakeholders are aware of the academic elements and
vigorously contribute to determining and attaining the related
goals. Pedagogy must maintain a vision of what is needed to
allow students to be effective learners and will be forced to
adapt their capabilities to meet the change. The foundation
upon which to erect a set of perspectives and practices of
concerned learning should support students' efforts and their
interests. The intermediate stages of skill development and
attending newer knowledge focus on managerial skill
development as an ongoing process. Teachers should use
methods that are agreeable, attentive, and responsive;
because it has a positive impact on the perceived learning of
students. This perspective of teaching has inspired us to
align the possible pedagogical factors and evaluate a
common set of practices for teaching marketing
management with consideration of stakeholders' perceptual
influences and requested demands.
Based on the stated, the purpose of this study was to
discover the pedagogical elements that make instructional
practices effective to teach marketing in MBA Programs. It
has also been realized that there is a need to re-think in this
realm, particularly to the matters of assessment and its
relation to the current focus on teaching.

MATERIAL AND METHODS
A descriptive design of the research was used to study
the pedagogical factors significant to the effective teaching of
marketing management in management education. The
independent opinions of students, teachers, and
professionals were collected by a convenient sampling
method has been used, which followed three major criteria
i.e. students having marketing specialization, marketing
teachers from different B-schools, and marketing
professionals in contact and reach. A sample of size 300 was
analyzed which contains 100 students, 100 teachers, and
100 professionals. Data was collected through a structured
questionnaire contains a set of exclusive items based on
various teaching tools, pedagogical principles, and some
cognitive processes that significantly affect the teaching of
marketing in management education, directly or indirectly.
Pre-testing of the questionnaire was done on 5% of the
sample size, and necessary changes were made before final
implementation. Analysis has been done through descriptive
statistics and Spearman's rank correlation.
RESULTS AND DISCUSSION
Typically, management educators consider case study
method as a major teaching instrument in management
education; however, it also has many limitations. This study
advocates that there are different pedagogies and an
optimum blend of feasible and capable pedagogies can offer
an exceptional learning experience to the students. As
described in Figure 1, 77.5% students consider case study
method for teaching marketing management. 72.25%
students have agreed that industry intervention in curriculum
development and programme review is greatly helpful to
incorporate industry needs in marketing curriculum and keep
management education contextual. They are moderately
considering seminars and workshops (61%), engaging
industry in curriculum design and development (60.89%),
and role-playing (60%) for effective teaching of marketing in
classrooms. According to them, seminars and workshops,
engaging industry in curriculum design and development,
and role-playing are significant to make a pedagogical design
able to connect the content and the resultant learning visibly.
57.89% of students believed that live projects give clarity of a
real work-environment and factors influencing the overall
performance. Students like some component of
entertainment in teaching to make it more interactive, so the
use of movies/videos/commercial advertisements (58%) and
field-based lectures (55%) can be considered. It has also
been observed that students moderately like experiential
learning (51%) and classroom presentations (50%) on
assigned and/or self-selected subject/theme/context. It is
because nearly 50% of students intentionally don't want to
engage themselves in learning due to their lacunas or
ambiguity for their career.According to 78.67% marketing
educators, the case study method is the most influential
mechanism of teaching marketing management. Chalk and
Talk, a traditional classroom method that uses board and
marker, is a universal way of teaching. Statistically, 60% of
teachers believed that is a most fundamental Chalk and Talk
way of teaching, which is used in every discipline and at every
level of instructional practices in education. Teachers are
equally given stress over engaging the industry in the
process of curriculum design (58.70%) and experiential
learning (58.68%). Marketing educators thought live projects
(52%), student presentations (51%), and decision making
with imperfect information (51%) moderately develop
students. Nearly 45-50% of teachers are less likely to prefer
seminars and workshops, competency-based curricula, and
new method/content adoption. It is because it increases their
efforts and needs active engagement in teaching and
learning processes, and they don't want to be involved in it,
which is also a question of their commitment to their
profession. Marketing professionals were also thought that
the case study method (68%) is the best way to teach
marketing management effectively with different
perspectives and marketing situations (Sonwalkar &
Maheshkar 2017). More than 60% of professionals stressed
the incorporation of essential competencies into the
marketing curriculum offered in management/business
programs. Cross-culture compatibility (62%) and experiential
learning (62%) are equally important to be effective in the
marketing profession, thus pedagogical assemblage should
consider both of these (Maheshkar and Sharma, 2018).
According to marketing professionals, asking them to know
the skill needs of the profession and involving them in
curriculum designing and development can remarkably
improve the quality of management/business programs and
is significant because B-schools failed to supply the gray
workforce to the industry. Student presentations (decision-
making ability with imperfect information, use of research
findings, and new method/content adoption) have received
mediate attention (51.3 - 55.4%) towards pedagogical
choices for preparing future marketing professionals.
Spearman's rank correlation has revealed the proximity
between the pedagogical choices of stakeholders by
assigning the ranks to individual scores of each item
exclusively in each respective category of respondents
(Table 1). There is a positive relationship between the
pedagogical choices of students and teachers, which is poor
and not significant It is because students of university-led B-
schools and institutions offering management programs
65Stakeholders' Pedagogical Preferences for Teaching 'Marketing

0 10 20 30 40 50 60 70 80 90
Case Study Method
Industrial Visits
Seminars & Workshops related to practical
Industry involvement in curriculum design
Role Playing exercises in the classroom
Live Projects
Movies/commercial Films/Advertisement
Field based lectures
Experiential Learning method
Student Presentations
Number of Students (in %)
Fig. 1. Students' preferred methods of teaching marketing
0 10 20 30 40 50 60 70 80 90
Case Study Method
Lecture based instruction (chalk and talk)
Experiential Learning method
Industry involvement in curriculum design
Live Projects
Student Presentations
Decision making ability with imperfect information
New method/content adoption when needed
Competency based curricula
Seminars & Workshops related to practical topics
Number of Teachers (in %)
Fig. 2. Teachers' pedagogical preferences
0 10 20 30 40 50 60 70 80 90
Case Study Method
Competency based curricula
Experiential Learning method
Cross culture compatibility exercises
Live Projects
Industry involvement in curriculum design
Student Presentations
Decision making ability with imperfect information
Cutting edge research findings used in teaching
New method/content adoption when needed
Number of Professionals ( in %)
Fig. 3. Professionals' top pedagogical preferences
66 Chandan Maheshkar and Vinod Sharma

Fig . 4. Pedagogy for teaching marketing in MBA Programs
Source: Sonwalkar & Maheshkar 2017
Coefficient Students Teachers Professionals
Spearman's rho Students 1.000 0.316 0.143
Teachers 0.316 1.000 0.625**
Professionals 0.143 0.625** 1.000
Table 1. Spearman's correlation analysis
**Correlation is significant at the 0.05 level (1-tailed)
usually have dissatisfaction with teaching practices and
curriculum offered (Sonwalkar & Maheshkar, 2017). It has
already been claimed that teaching competencies and
suitability of program structure are requirements that must be
considered because of their direct impact on educational
quality (Maheshkar 2019).
There is a positive relationship between the pedagogical
choices of teachers and professionals, is significant
(r=0.623). Based on variance, nearly 35-40% of teachers of
marketing in management education have awareness of the
skill needs of the marketing profession, and they trying to
develop students with these skills.
There is a poor but positive relationship between the
pedagogical choices of students and professionals, in general,
professionals are much concerned with their practice,
whereas students are acquainted only with theoretical aspects
of their area(s) of study, which may be a reason for this poor
relationship. Pedagogy is a science of teaching that considers
a range of teaching tools and their resultant effects on student
learning in terms of students' academic achievements and the
way they interact with their environment (Maheshkar 2019). It
expands the teachers' competence to disseminate knowledge,
skills, and attitudes through the critical organization of teaching
and learning practices. A balance between theory and practice
of marketing in the curriculum is significant to teach students
applications of marketing concepts under realistic conditions
(Liu 2010). It makes them able to take responsibilities in their
future job roles. Ideally, teaching must facilitate not only the key
learning in classrooms but also simulate some elements of
realistic marketing situations (Singh & Sinha, 2006). In this
realm, Sonwalkar and Maheshkar (2017) have presented a
pedagogical scheme (Fig. 4).
This scheme holds three groups of pedagogies
categorized based on their significance in the teaching of
marketing (Fig. 4). Teachers can use these pedagogies in a
blended manner; however, they practicing only two or three
commonly used methods, they are comfortable with.
Basic: Students prefer pedagogies that are active and
concrete (Young et al 2003). They like interactive and
entertaining methods of teaching, which engage them in the
learning process. This group of basic pedagogies relevant to
entry-level to deliver fundamental concepts of marketing.
Median: These are the moderate pedagogical practices
compatible to develop higher-order marketing skills.
Comparatively, marketing students are interested in field-
based lectures. Making decisions with imperfect data is an
essential skill to the marketing profession, thus marketing
professionals have given greater stress on it. They also
suggested that and the 'student presentations use of 'cutting
edge research findings' for their possible inclusion in
pedagogy. It is because it allows students to learn
presentation skills and managing change.
Competent: This group of pedagogies refers to highly
competent teaching tools capable to develop students with
critical skills of the profession such as strategic thinking and
decision making. In this family of pedagogy, case study, live
projects, and experiential learning are significant teaching
methods.
The core pedagogy includes instruction-based lectures
(in general chalk & talk), pre-specified curricula, and
evaluation and review, which is a conventional framework of
delivering education. Teaching practices should be able to
connect students, teachers, and content, no matter which
method a teacher uses to teach students. Teachers' beliefs
guide their pedagogical choices based on contextual realities
and nuances inherent in their work (Sonwalkar & Maheshkar
2017). Despite what is being taught, how a course/subject is
taught is even more important (Jain & Kamal 2010), thus a
curriculum that satisfied the skill needs of the profession and
the way of teaching are significant.
CONCLUSION
Academic business/management programs prepare
students for their future managerial or entrepreneurial roles
and in this process, pedagogy plays a significant. Case study
67Stakeholders' Pedagogical Preferences for Teaching 'Marketing
and experiential learning are the most suited instruments of
teaching marketing students. Live projects, classroom
presentations by students on different areas of marketing,
decision-making exercises with imperfect data, seminars
and workshops, role-playing, and the use of different means
(e.g., movies/commercial films/advertisements, cutting edge
research findings, etc.) are capable enough to extend the
effectiveness of teaching with maximum learning outputs. In
the recent marketing practices, having a perception of actual
corporate practices and professionalism matter a lot to be
effective in the marketing profession, so these factors also be
considered while deciding the pedagogy. Teachers'
understanding of stated pedagogies and pedagogical
principles makes it easy for students to understand and learn
marketing skills. The given scheme of pedagogy makes
teachers able to apply a potent combination of teaching tools
in response to the demands of the profession.
REFERENCESJain KM and Kamal KK 2010. Reassessing the curriculum-
Competency alignment in MBA programs. Journal of Management and Strategy 1 (1): 68-75.
Liu SH 2011. Factors related to pedagogical beliefs of teachers and technology integration. : 1012-Computers & Education 561022.
Maheshkar C and Sharma V 2018. Perceptual Difference among Stakeholders for Teaching Marketing Management. Review of Research 8(1): 1-14.
Singh and Sinha 2006. An Exploratory Study of Factors affecting MBA Students' Attitude towards Learning via Case Study Pedagogy: Insights from Advertising Literature. IIM Ahmedabad, India: Research and Publication. Retrieved from www.i imahd.ernet . in/publ icat ions/data/2006-11-05-rsingh.pdf
Sonwalkar J and Maheshkar C 2016. Stakeholders' convictions and pedagogy for teaching marketing management. Journal of Management Research and Analysis 3 (2):88-94.
Sonwalkar J and Maheshkar C 2017. Pedagogical competence for effective teaching of management. Journal of Management Research and Analysis 4 (4):137-142.
Stewart D, Gregory B and Cummings S 2009. Teaching marketing management from a postmodern perspective. Paper presented at the Australia and New Zealand Marketing Academy Conference, Melbourne, Australia.
Maheshkar C 2019. A Study of Effectiveness of Competency Mapping Scales in Management Education. Doctoral Thesis. University of Indore, India.
Received February, 2021; Accepted 06 July, 202121
68 Chandan Maheshkar and Vinod Sharma

Classifying Voice-Based Customer Query Using Machine Learning Technique
Manuscript Number: S-678NAAS Rating: 5.79
Abstract: Timely attention to issues raised by customers is critical. It is imperative that the average handling time is lesser, which in turn contributes to productivity. It was found from the data from the banking industry in the US that, on average, a customer service call last for seven minutes. The first two minutes are for the call to get redirected to the respective team. This study investigates a method using machine learning to classify and redirect the customers into the respective department directly based on their initial voice response or voice message. It will substantially reduce the service time. CRISP-DM methodology is being used to design the process of the study. The most frequently occurring issues and the department to which they are associated are created through machine learning from the dataset that contained product reviews and metadata of different issues. The programming languages that are used in this study are Python, HTML and Java. An interface is created by using HTML, which makes it quite user-friendly. The study tests the effectiveness of converting voice to text and interprets which department the call should be transferred to address the issue. A support vector machine and a logistic regression model were used for the prediction, and it was found that the models provided an accuracy of 83 and 84 percent, respectively. The study proves that using ML and voice recognition reduces the average handling time.
Keywords: Voice recognition, Feature extraction, Tokenization, Vectorization, Stemming
Manohar Kapse, Arun Varghese Andrews Joy and Cen TomElangovan N., , 1 1
School of Business and Management, Christ (Deemed to be University) Bengaluru-560 029, India1St Joseph's College of Arts and Science (Autonomous), Bengaluru-660 027, India
E-mail: [email protected]
Indian Journal of Ecology (2021) 48 Special Issue (16): 69-72
Timely attention to customers' issues is a critical
success factor for any business. The modes of customer care
& support are constantly evolving. Making a customer wait in
line or sit on hold before the interaction can begin or diverting
calls from one desk to other creates frustration and affects
customer satisfaction. Companies that create a better
customer experience see an improvement of 30-50% on
repeat purchases, upselling, and recommend a product to
others (Masri et al 2015). Problem with the customer support
leading to poor customer experience can even stray the most
loyal customers, whereas good customer support can even
win over the most reluctant customers. One of the first steps
to serving customers with top-notch support is providing that
support within a reasonable amount of time. Web self-
service, website chat applications, chatbots, and social
media messaging apps over the phone are some
technologies that are available to consumers beyond regular
business hours. Babu et al (2016) stated that most digital
content is helpful only to a few who can read or understand
specific languages. Technology has to play a significant role
in connecting multilingual societies like India, which has
about 1652 dialects/native languages.
Despite the web-based technologies, most people
prefer to use the phone system because of the
interactiveness and quick resolution. However, the waiting
time in the call and the availability only during business hours
limit the phone system's usage. According to the customers'
themselves, the CMO Council report; The customer in
context, the most important attribute of good customer
service, is fast response time. It means that responding to the
customer's query quickly is meeting their expectations and
leads to satisfaction. On average, customer support is said to
be for seven minutes, out of which two minutes is used to
transfer the call through IVR. Average handling time (AHT) is
the “metric used by call centres to estimate the total average
call duration of an interaction between a call agent and a
customer regardless of the communication channel” (Call
Pageboy, n.d.).
The current study looks at developing a voice
recognition system, reducing the time taken for time
handling. Digital speech processing plays an essential role in
modern speech communication research and applications
(Mache et al 2015). The primary purpose of speech is
communication, the transmission of a message between
man and machine. Speech processing is performed for
several applications like cellular phones, security devices,
household appliances, computers and ATMs (Khilari and
Bhope 2015). Anusuya and Katti (2009) claimed that the
designing of speech recognition gadgets requires careful
attention tothe definition of various speech classes, speech

classifiers, speech representation, function extraction
techniques, database and overall performance evaluation.
There are three speech recognition approaches Acoustic
Phonetic Approach, Pattern Recognition Approach and
Artificial Intelligence Approach. Nassif et al (2019)
highlighted that current speech recognition systems
represent the sequential structure of speech signals using
Hidden Markov Models (HMMs), which are based upon
Gaussian Mixture Model (GMM). It is usual to extract a
particular set of features from the speech signal in an
automatic speech recognition system. A further process such
as classification is done on the extracted features rather than
the speech signals directly (Zhang, n.d.). Among the three
speech recognition systems, GMM-HMM, DNN-HMM and
DBN, the DBN-based speech recognition system was proved
to be better than the others (Zhang, n.d.). Further, one
important aspect of speech recognition is converting text to
speech. Converting written text input to spoken output is the
central idea behind Text-To-Speech (TTS) technology.
Kamble and Kagalkar (2014) showed that TTS text
processing and speech generation are two different
components. There are many ways to perform speech
synthesis: 1). Simple voice recording and playing it on
demand; 2). Splitting speech into 30-50 phonemes (basic
linguistic units) and their re-assembly in a fluent speech
pattern (Venkateswarlu et al 2016). Shetake et al (2014)
discussed that concatenated pieces of speech stored in the
database could be used to create a synthesized speech.
Chappell and Hansen (2002) examined different spectral
smoothing methods for segments sequencing of speech
synthesis. The author says improvements in spectral
smoothing can benefit speech synthesis, coding and voice
transformation. Raghavendra and Prahallad (2008) used the
screen reader software for speech synthesis, which speak
out the screen's contents. In this system, the author has uses
some sub-systems like text-extractor, text processing and
text speech system. The author also uses the Artificial Neural
network model for speech synthesis. Thus, the author
concluded that changing extracted text into system readable
and understandable form and building a small footprint
synthesizer for converting text into the spoken form.
Customer service is always a time-consuming job and is
getting expensive day by day. This problem can be solved by
integrating machine learning algorithms into the customer
service platform to enable efficient response systems,
reduce average handling time, and reduce customer service
costs. This paper tries to identify the important department
based on the previous data or queries received by the bank
and classifying the customer's queries received through text
message or phone call using Machine learning algorithms
with high accuracy
MATERIAL AND METHODS
Different project management methodologies are used
by different organizations such as CRISP-DM, SEMMA,
TDSP, etc.The CRISP-DM methodology is adopted. CRISP-
DM stands for a cross-industry process for data mining
(Chapman2000). The methodology provides a structured
approach to planning a project. It is a robust and well-proven
methodology and consists of the following phases: 1)
Business understanding, 2) Data understanding, 3) Data
preparation, 4) Modelling, 5) Evaluation and 6) Deployment.
The present study is conducted on a data set provided by one
of Bangalore's private sector bank. The bank wanted to
automate the queries they received through a phone call to a
specific department or the responsible person. The data
provided by the bank has seventeen variables, and nearly
seven lakh customers (Table 1).
Descriptive and exploratory data analysis techniques
are used for classification of the issues/departments,
identifying the query and tokanization. The analysis can be
classified into four-step as per the Figure 1. The tools used for
the analysis are: Python, HTML, Java, for programming,
Microsoft Azzure, Sublime and Google colab were also used
for analysis, interphase, and deployment.
Out of the total, 17 variables available in the data set, only
five variables were considered for the final study. The five
variables were'Product', 'Sub-product', 'Issue', 'Sub-issue', and
'customer issue narrative'.Data cleaning and standardization
were done using Pandas, and the NLTK package in python
and Tokenization was done to convert the querries to words. A
model was created using Support vector machine and logistic
regression to classify the new queries into the departments
based on the existing data. To apply machine learning
algorithms, vectorization techniques was used using the
sklearn package in python. Unigram and bigram techniques
were used for better results. Using pickle in Python,
serialization and deserialization of an object is done. This
Data Preparation Exploratory data analysis
Creation of an interface
Integration of voice and
converting to text
Fig. 1. Process model
70 Manohar Kapse, Arun Varghese Andrews Joy and Cen TomElangovan N., ,

PRIMARY PROTOTYPE
Submit Response
Student loanStart recognition
Click the voice recognition button, record your audio. Then click the submit response button to process your query
Assigned TeamSTUDENT LOAN SUPPORT TEAMAssigned team
Close
Source: As created by the researcher
Fig. 2. Prototype user interphase
model created will be recalled into Azure. To convert the voice
input into text, Microsoft azure was used. To integrate the voice
for capturing and classifying voice into text, an API key is
generated in Azureand is used for further processing. An HTML
interface is created using javascript, where the voice is input
into the system, which gets converted to text through Azure
API, through HTML interphase once clicked on the submit
button, the text output and model created using pickle are
processed in Azure which classifies the voice into one of the
departments that should be contacted for that particular voice.
RESULTS AND DISCUSSION
The eight departments are: can't repay my loan,
incorrect information on a credit report; cannot attempt to
collect debt not owed, taking threatening an illegal action,
disclosure verification of the debt, communication tactics,
dealing with my lender or servicer, improper contact or
sharing info, false statement or representation, credit
reporting company's investigation. Unigram and bigram was
used to identify the most single and two correlated words,
such as cant repay my loan, loans, afford, private loan are
correlated, which helped in classifying the eight department.
Support vector and Logistic regression models were used for
classification of text in one of these eight categories, where
both logistic and support vector machine gave accuracy of 83
and 84 percent.
Variable name Description
Date received The date on which the complaint received
Product Product for which complaint is raised
Sub-product Sub-Product for which complaint is raised
Issue The issue faced by the user
Sub-issue The more precise way of issue defined
Consumer complaint narrative
How the user-defined the issue
Company public response
Company's response to the issue
State State from which the complaint was raised
ZIP code Zip code of the area
Tags Designation of the customer
Submitted via A device used to submit the complaint
Date sent to the company
Date sent to the company
Company response to consumer
Company response to consume
Timely response? Whether the user received the response on the allotted time
Consumer disputed? If the consumer was satisfied or not
Complaint ID The unique number of the complaint
Table 1. perational definitions of the variables under study O
Source: Private bank database
All the services banking industry has also commoditized
itself because of the on-going competition. Everyone is
offering nearly the same products and services without much
room to compete on price. The experience customers have
with their existing banks is what gives it an advantage over
another bank. The current customer's positive experience
will give us more services than the new customers and is
more likely to recommend to others. The model's primary
objective was to build a user interface that redirects the
customer to the banking industry's respective department,
causing him trouble or delay work (Fig. 2). Rather than the
user wasting time for the customer's response about which
department he/ she needs to contact, it can now be done
directly in a fraction of a second, which saves nearly 2 to 14
minutes of customer time.
REFERENCESAnusuya MA and Katti SK 2009. Department of Computer Science
and Engineering. Sri Jaya chamarajendra College of Engineering Mysore, India. Speech Recognition by Machine: A Review.
Babu B, Pillai V, Shetty D and Lohiya S 2016. Voice based enquiry system using raspberry Pi. International Journal of Innovative Research in Science, Engineering and Technology 5(2): 1910-1913.
Berry LL, Zeithaml VA and Parasuraman A 1990. Five imperatives for improving service quality. (4): Sloan Management Review 3129-38.
CallPageboy n.d. . The Benefits of Reducing Average Handling TimeCall Page Boy. Retrieved February 11, 2020, from https://callpageboy.ie/the-benefits-of-reducing-average-handling-time/
Chapman P, Clinton J, Kerber R, Khabaz T, Reinartz T, Shearer C and Wirth R 2000. CRISP-DM 1.0: Step-by-step data mining guide. The CRISP-DM consortium. SPSS.
Chappell DT and Hansen JH 2002. A comparison of spectral smoothing methods for segment concatenation based speech synthesis. (3-4): 343-373.Speech Communication 36
https://colab.research.google.com/
https://www.customerthermometer.com/
Kamble K and Kagalkar R 2014. A review: translation of text to speech conversion for Hindi language. International Journal of Science and Research (IJSR) Volume 3, .
71Voice-Based Customer Query using Machine Learning Technique

Khilari P and Bhope V P 2015. A review on speech to text conversion methods. International Journal of Advanced Research in Computer Engineering & Technology 4 (IJARCET) (7): 3067-3068.
Mache SR, Bahet, MR and Mahender CN 2015. Review on Text-To-Speech Synthesizer. International Journal of Advanced Research in Computer and Communication Engineering 4(8): 54–59.
Masri M, Esber D, Sarrazin H and Singer M 2015. Your company should be helping customers on social. Harvard Business Review.
McIlroy A and Barnett S 2000. Building customer relationships: do discount cards work?, Managing Service Quality: An International Journal 10(6): 347-355.
Nassif AB, Shahin I, Attili I, Azzeh M and Shaalan K 2019. Speech recognition using deep neural networks: A systematic review. IEEE Access 7: 19143-19165.
Nwakanma, IC, Oluigbo I and Izunna O 2014. Text-To-Speech Synthesis (TTS) Text-To-Speech Synthesis (TTS) (March).
Raghavendra EV and Prahallad K 2010. A multilingual screen reader
in Indian languages. In 2010 National Conference On Communications (NCC) pp. 1-5. IEEE.
Saipol HFS, Shamsuddin NT, Cob ZC, Ghani N and Drus SM, 2019. Examination of significant factors influencing response time of customer complaint based on analytics method. International Journal of Engineering and Advanced Technology 9 (1): 3415-3418.
Shetake PS, Patil SA and Jadhav PM 2014. Review of text to speech conversion methods. International Journal of Industrial Electronics and Electrical Engineering 2(8): 29-35.
Technopedia (n.d.). What is Customer Support? - Definition from Techopedia. Retr ieved February 11, 2020, f rom https://www.techopedia.com/definition/4261/customer-support\
Venkateswarlu S, Kamesh DBK, Sastry JKR and Rani R 2016, Text to speech conversion. Indian Journal of Science and Technology 9(38): 1-3.
Zhang Y n.d. Speech Recognition Using Deep Learning Algorithms. http://cs229.stanford.edu/proj2013/zhang_Speech%20Recognition%20Using%20Deep%20Learning%20Algorithms.pdf
Received February, 2021; Accepted 06 July, 202117
72 Manohar Kapse, Arun Varghese Andrews Joy and Cen TomElangovan N., ,

Introspecting e-Commerce Platform for Arts and Crafts of Bengal
Manuscript Number: S-679NAAS Rating: 5.79
Abstract: Arts and crafts form an inevitable lineage of culture and tradition. The artisans and craftsmen of West Bengal, an eastern state of India, are highly skilled and their finesse of artwork is adored all over the world. This is envisaged by the huge demand for their creation in the Trade Fairs nationally and internationally. However, there is no comprehensive e-commerce platform that can provide an online marketplace and promote their artistry to the world in a digital environment. Hence the need for a sustainable marketplace for these artisans belonging to the weaker socio-economic strata of the society. The paper explores the feasibility of the same, the opportunities and challenges therein, the demand perspective, logistics, pricing, and promotion parameters. It tries to formulate a viable logistics model and tries to explore the business channels which can result in a seamless connection of the skilled yet unprivileged and unrepresented to those who have a good admiration and fascination for their creation. The study strives to find out the aggregator model which would be apt for putting the brilliant creations on the global platform.
Keywords: E-Commerce, Bottom of the pyramid, Online market Place, Sustainable marketing
Arunava Dalal and Subrata ChattopadhyayUniversity of Engineering and Management
University Area, New Town, Kolkata-700 160, IndiaE-mail: [email protected]
Indian Journal of Ecology (2021) 48 Special Issue (16): 73-79
Handicraft as the name suggests is a combination of two
words-hands and crafts. Thus it can be defined as an activity
in which people create things using their skills and make
something in a traditional way using primarily their hands with
very limited or no use of machines in a factory. Mainly these
objects which are not mass-produced as they involve manual
labor can be bifurcated into two major groups namely goods
that are useful and serves a specific purpose and goods
mainly used for decoration. The main characteristic of any
traditional craft consumer is one, where the crafts are made
using traditional processes each of which is unique and
reflects his/her creativity (Klamer 2012). India's handicraft
industry is varied, where each state has its share of unique
items for Indians as well as foreigners. This plays an
important role not only culturally, but also has its economic
implications. The aesthetics of each Indian state reflects
through their arts and crafts and West Bengal on the eastern
part of India is no different. Arts and architecture also play
their roles, which came out from regional surveys that were
conducted to gain an overview of cultures, history,
geography, norms, traditions, values, languages, literature,
and folklore of the people (Dhar 2011). The handicraft sector
provides low-cost livelihood opportunities to over 7 million
people. The sector is an economic lifeline where 50 percent
of the craft persons are women and a major proportion
belongs to religious minorities, scheduled tribes, and
scheduled castes as per the working group report on
handicrafts for the 12 Five Year Plan. Handicrafts comprise th
a pivotal division of the decentralized and unorganized sector
of the economy and its significance is being sensed when it is
evaluated that, it makes the provision of employment
opportunities to lacs of artisans all over the state and the
country. The employment opportunity is especially for the
ones who belong to the backward sections of the society
such as, scheduled tribes (ST), scheduled castes (SC), and
women. These individuals are involved in the manufacturing
of products that are valued at thousands of crores of rupees
per year (Jena 2007).
The craftsmen are poverty-stricken, deprived,
marginalized communities, and the individuals belonging to
the sections of the society which are socio-economically
backward have experienced various kinds of impediments in
the production of handicrafts and artworks. The presence of
middlemen in the sector (Kumari & Srivasatava 2016, Pathak
et al 2017, Tiwari & Dutta 2013, Venkataramanaiah & Kumar
2011) and the artisans being not aware of their customers
and potential markets (Banik 2017, Kumari & Srivasatava
2016) have been identified as major issues plaguing this
sector. To overcome these issues organizations like GoCoop
have been trying to bring the artisans and the end customers
together and removing the middlemen, by the use of the
internet. But the majority of the artisans are yet to get
benefitted from these, and also the representation of the
Bengal crafts in such ventures is rare. The increasing

opportunity for handicrafts in the world market is proved as
the Indian handicrafts exports increased from Rs.34.63
Billion in FY 2011 to Rs.128.35 Billion in FY 2019 (Statista
2019). The sector has the potential to increase its presence in
the domestic and international markets. The objective of the
study is to come out with an approach towards bringing e-
commerce and Bengal handicrafts together. The paper tries
to develop a possible sustainable model that can uplift the
economic condition of the Bengal artisans.
MATERIAL AND METHODS
Before a framework is designed for the Bengal
handicraft market, there is a need to identify the challenges
being faced by these artisans, as the model should endeavor
to overcome the challenges as far as possible. These
problems have been identified through unstructured
interviews conducted with artisans who participated in the
Handicraft fair organized by the West Bengal Government in
Kolkata, by the name of “Hasta Shilpa Mela” in December
2019. The qualitative content analysis which is considered a
good method to analyze text and image data (Flick 2014) has
been used in this study. The qualitative content analysis
considers mainly the language of communication and the
contextual interpretation of the text along with participants'
feelings, opinions and experiences (Corbin and Strauss
2008; Manias and McNamara 2016; Richardson 2012,
Tsushima 2015). The qualitative content analysis does a
Craft Count About the craft
Terracota/ clay dolls 4 “Terracotta” means 'baked earth' where clay is sun-dried or baked in the fire to produce different dolls and handicrafts. Its unique and intricately designed models stand out when used as a decorative piece in anyone's house. The terracotta Bankura (a district in West Bengal) horse is world-famous.
Solapith 4 Solapith is Indian cork which is a milky white-colored sponge-wood. It is carved into delicate and beautiful objects of art. In Bengal beautiful figurines of gods and goddesses, palanquins, peacock boats, and many other beautiful models are made of solapith
Dhokra 3 The Dhokra Kamar tribes are traditional metalsmiths from Bengal and have a unique technique of metal casting known as Dhokra. Objects are cast in metal using the lost-wax technique and the final objects are so intricately designed that they will look like a single wire wound around a piece of clay.
Patachitra 3 Patachitro is one of the old art forms of West Bengal where the word “pat” means patta in Sanskrit, i.e cloth. In this art form, the artists draw beautiful pictures in scrolled long cloth using natural colors extracted from nature namely trees, flowers, clay, and seeds.
Jute handicrafts 4 Jute handicraft is an exclusive product of Bengal. In today's world when we are all concerned about our environment, this product is being looked upon with renewed interest. Rugs, carpets, handbags, wallhangings, baskets, decorative items are only a few examples of their usage.
Handloom weavers 7 Weavers of handloom sarees and other dress materials.
Total 25
Table 1. Craft-wise breakup of the respondents
study of the contents of the text data and through a
methodical process identifies some patterns from the data
(Hsieh and Shannon 2005).
The present research is a combination of primary and
secondary research. Through convenience sampling,
twenty-five Bengal artisans hailing from different districts of
Bengal producing different handicrafts were contacted and
through an unstructured interview, issues being faced by
them were identified. The outcomes of the content analysis of
the narrations of the artisans are discussed in the next
section, which highlights the constraints being faced by the
artisans. Data was also collected from secondary sources
like journals, research papers, the internet, articles, and
published government reports to understand the handicraft
sector in India and for West Bengal in particular. This method
was considered to understand the opportunities and
challenges and present scenario of Bengal's handicraft
sector to suggest a viable model for selling arts and crafts
through an e-commerce platform. A brief profile of the
respondents are given in Table 1 and Table 2.
RESULTS AND DISCUSSION
On analyzing the narrations of the respondents who
were interviewed during the survey, the following concerns
have been identified that were raised by the artisans.
Changing taste of consumers: The lifestyle of consumers
is changing and so are their tastes. So, if the handicrafts are
Age (Yrs) Education level Years in the profession
20 to 30 30 to 40 >40 Illiterate Primary Secondary Graduation < 10 10 - 20 >20
15% 59% 26% 12% 52% 33% 3% 8% 54% 38%
Table 2. Demography of the respondents
74

not modified and adapted as per the requirements and liking
of the consumers, uptake of these products will be low. But
while changing the product designs, an important point to be
remembered is that handicrafts are the bearer of the local
tradition and this should get reflected in all the products that
are made by the craftsmen.
Poor market knowledge: This challenge can be said as an
extension of the above point. As this sector is unorganized
and is spread across the length and breadth of the state and
in furlong districts, the artisans tend to continue to create or
produce their wares based on their experience and learning
from their predecessors, oblivion of the fact that products
need to be modified to remain contemporary but having a
blend of tradition as handicrafts are meant to be so.
Gain is un-remunerative and exploitation by middlemen :
As a majority of these people, who are the torch bearers of
Bengal's tradition, comes from socio and economically
backward strata of the society, they are not good at money
matters. The middlemen take advantage of this weakness
and exploit the artisans. So, even though the end consumers
are paying handsomely for the handicrafts, the makers of
these products find themselves in economic hardships.
Irregularity in demand: The handicraft ecosystem lacks a
robust model, which has its effect on the demand and sale of
handicrafts which is erratic. Regular demand for handicrafts
could have ensured a regular source of income for the
crafters.
Lack of supply chain management: The efficient utilization
of resources for producing crafts could lead to cost-saving
and regular supply of quality raw materials. This would result
in quality products being supplied to domestic and
international consumers leading to high customer
satisfaction and possible repeat purchases. But lack of
infrastructural facilities is one of the major roadblocks for
making quality products by the craftsmen and availability of
the same.
Inadequate promotions and marketing: It's a proven fact
that a good concept becomes a successful product when
target customers are aware of the existence of the product;
see value in the product which leads to purchase intention
and the final purchase. So, promotions which is one of the
'Ps' of Marketing, are essential to generate awareness of
these products among the target segment through the right
communication and promotion to convert the awareness into
action i.e. actual sale.
Lack of knowledge of after-sales service: A sale does not
end with the completion of the transaction but is the
beginning of a new relationship with the purchaser. In today's
world, after-sales service is very important, as a satisfied
customer can bring in new customers and repeat purchases
whereas a dissatisfied one can hurt the business badly. The
handicraft sector is no different, and the craftsmen need to
understand the importance of hearing from their existing
customers and to take note of their inputs and suggestions to
thrive in this competitive world.
With the understanding of the constraints being faced by
the artisans, a few important attributes specific to this
industry were also identified. Firstly the “ roduct”, which is p
inimitable and differs from place to place due to non-
standardized raw materials and varying workmanship as the
skill level of each artisan differs. Within this multiplicity, the
final products are prepared where each piece carries the
stamp of its uniqueness and splendor. With the advent of
technological advancements and globalization, the whole
world is a marketplace, provided the product or service being
provided by the producers is unique and customers find value
in possessing a product or using a service. Added to this
there is a growing awareness in the developed and
developing nations for “green production”. Under such a
situation, e-commerce has opened up opportunities for
establishing a thriving economy, riding on the handicraft
sector. This will help in bettering the economic condition of
the craft communities and thus the society will benefit at
large. Thus it's important that “place” for handicrafts must
expand to tap all the available mediums including e-
commerce.
The “pricing” of handicrafts also plays an important part,
but setting the price of craft is a difficult proposition. Even
though the products may be from the same product line, but
still the production cost may be different due to differences in
the raw materials used, the individual skill sets of the
craftspeople and the man-hours invested for making the final
product. Handicrafts are characterized by special attributes
like their design, pattern, finesse, workmanship and these
cannot be standardized, thus arriving at a general selling
price is difficult. From the customers' point of view, the ceiling
price of any product will depend on the value that the
customer sees in that product. The problem becomes
manifold on the e-commerce platform as the potential
customers have nothing else to evaluate the value of the craft
except for the product image. The fourth P for handicrafts is
“promotion”. Its importance increases with the consideration
that through e-commerce the whole world is a potential
market, and all interested customers across the globe need
to be identified, informing them about the products,
convincing and reminding them regularly of the products'
relevance and usefulness in their life. Besides the above four
Ps, “preserve” is the fifth “P”. Handicrafts are the bearer of
culture and tradition of the place from where these products
get crafted. Thus even though the designs and structure of
75

the crafts may get modified as per the taste and liking of
present-day consumers, but one cannot ignore the history
associated with each of the crafts. So, the crafts have to be
made keeping in mind the potential customers and adequate
attention need to be given so that they remain traditional.
Before discussing the model of e-commerce for West
Bengal's handicrafts, a small insight into some of the online
sites which are in the business of Indian handicrafts would be
beneficial. Crafts bazaar is an e-commerce platform dealing
with a wide range of Indian handicrafts. Their business model
strikes out the middleman by directly sourcing the finished
goods from the artisans thus helping the artisans to earn
more. Gaatha is another e-commerce portal having a wide
array of products. The range includes paintings, apparels,
and stationery from Gujarat, Rajasthan, Madhya Pradesh,
and Kashmir, Festivya is an online platform for jewelry where
artisans showcase their product, GoCoop is a social
marketplace in the online platform catering to the community-
based enterprises and cooperatives with more than 70,000
weavers and artisans. A few sites from Bengal are
rangamaati.com, kopaipaar.com, bonghaat.com, nirjas.com,
and initiatives of the West Bengal government like
ruralcrafthub.com, biswabangla.com. West Bengal
Government's initiatives of promoting local handicrafts fairs
and exhibitions are worth mentioning, but the online sale of
handicrafts and a comprehensive e-commerce model is the
need of the hour as handicrafts provide huge opportunities
for both domestic and international customers.
The pillars of the proposed e-commerce model: Based on
the above insights, a suggested approach for the promotion of
the whole range of Bengal's craft to the world is proposed.
This model has a twofold objective, one to make available the
splendors of Bengal to the potential consumers in an efficient
and cost-effective way and secondly to improve the economic
conditions of the artisans who are spread across the state and
the majority of them are striving for financial independence.
A. Product
1. Firstly one needs to identify the broad category of
handicrafts that are in demand in India and abroad.
2. This process is vital and an important aspect for the
success of the model, adequate time needs to be
invested in this market research. Market survey,
competition analysis, demand and consumption
analysis of handicrafts are a few pointers.
3. Also, any latent need of customers needs to be identified
which can be addressed through any handicraft from
Bengal.
4. Once the products are identified, these need to be
mapped with the available crafts of West Bengal. After
this, a short listing of the product ranges along with the
locations from where these can be sourced, to be
shortlisted.
B. Sourcing and Supply Chain Management
1. The next important step is to develop the identified
locations from where the products will be sourced. This
will include ensuring a consistent flow of quality raw
materials, training of the craftspeople, if required so that
they can design and produce crafts as per the demand of
the market, and quality assurance of the finished product.
2. Creation of artisans body at each of the locations so that
all communications between the artisans and the
coordinators of the project is through the spokesperson of
the bodies.
3. The selection of the spokesperson is crucial as the person
needs to be someone who is respected and has the
approval of the other members. Also, the spokesperson
should have a minimum understanding of technology e.g.
computer as verbal communication may not always be
feasible or applicable if required, the spokesperson
needs to be trained. This person will be the conduit
between the customers and artisans, which will help the
artisans to have a better understanding of the customers'
requirements and deliver products accordingly with the
minimum knowledge gap, thus leading to enhanced
customer experience.
4. The sourcing of the raw materials needs to be monitored,
as the quality of finished products and continuous
availability of required products are two important
aspects of this pillar.
5. Depending on market conditions, artisans may have to
be re-skilled, up-skilled so that the creation and delivery
of goods take place as per market feedback and
requirement. Training programs being conducted by the
West Bengal government may be integrated with this.
6. One of the important parameters for having a robust
logistics plan is demand forecasting. If meticulous
product-wise forecasting is done, then implementation of
corresponding supply chain management would be
relatively simple, though operation surprises could not be
ruled out and need to be handled on a case-to-case
basis.
7. The next important link for this logistics planning would be
the location of the warehouse where all the finished
handicrafts across the state need to be stored. A hub and
spoke model will be appropriate, where the central
warehouse will receive the products from the regional
collection centers. A pre-defined beat plan for the
collection agents needs to be chalked out depending on
the consumption velocity of different handicrafts and the
production rate of the craftspeople.
76

C. Communication
1. The success of any venture requires communication
between the concerned parties without any barriers. In
this framework, the two parties being the artisans who
are producing the crafts and the customers who will be
consuming the produc ts . Thus, seamless
communication regarding the suggestions, feedback,
and grievances from the customers should reach the
other party so that action could be taken accordingly.
Similarly, the consumers need to be aware of new
product launches, designs, and status of their products
post placing an order.
2. The mode of communication between craftspeople and
consumers will be through the internet, i.e. through the
e-commerce website.
3. The communication between the artisans' bodies and
the people involved in this project can be through mobile
phones or emails. These communications will mainly be
regarding the procurement of raw materials or any
updates regarding the products which may be design-
related or pertaining to the supply of goods.
4. The diffusion of any important announcement or news to
the concerned artisans will be the responsibility of the
spokespersons identified for each location or cluster.
D. Pricing and revenue share
1. As discussed earlier in this paper, setting the selling
price of the crafts is both difficult and delicate. So, for
each of the items being procured from the artisans and
being displayed on the online website for sale, the
following details need to be captured;
a) Average raw material cost
b) Average man-hours required for producing one
unit
c) Transportation and other logistics charges for
getting the products to the warehouse. This
needs to be calculated based on the rate per
unit.
The sum of the above three costs will help to arrive at an
average cost price per unit for each product category.
2. A minimum base price to be fixed for each product
category, depending on the raw materials and man-
hours involved in producing the products. This price will
be paid to the artisans while procuring the items from
them.
3. The selling price will depend on the premium that can be
charged for each of the product categories. A few
indicators for calculating the premium could be based on
the selling of similar competitive products or substitutes,
the finesse and intricacy attached to the products,
uniqueness of the design or concept of the product, and
usefulness or decorative value of the craft.
4. On selling the product, a predetermined percentage of
profit will be shared with the artisans. This will ensure
that the artisans too are party to this venture and this
move is targeted towards the economic betterment of
the artisans.
5. The artisans will have all the information regarding the
transactions, through spokespersons of respective
artisans' bodies. An online portal providing all the details
of the transactions will be made available to the artisans'
bodies so that there is clarity and trust in the whole
process.
The settlement of the revenue share will be done at pre-
defined intervals for example monthly.
E. Designing the online portal
The main points that need to be considered for designing
the portal are discussed below;
1. The local names of the crafts, in which they are popular in
Bengal, might be unknown to the prospective customers
outside the state. To address this issue, the tabs will not
be based on products but basis the purpose for which
customers will be purchasing the goods.
The major groups will be further subdivided. An example
is given in Figure 1 considering three broad functions and
some sample product ranges.
2. The option of product customization will be available for
the customers, though the limit or extent of
customization could be predefined.
House Decoration Clothing Furniture
Dokra
(Lost wax casting)
Clay Dolls
Patachitra (paintings)
Classy Genres
Accessories
Wooden
Patched cloth embroidery (Kantha)
Baluchari (Silk material )
Jewellery
Hand Bag
Pottery
Terracota
Ceramic
Muslin (Finely woven light cotton fibre)
Handloom
Traditional Cotton Saree
Shantipuri
Dhaniakhali
Fig. 1. A sample flow diagram of the tabs to be available on the online portal
Cane
77

3. Bulk orders will not only fetch some extra benefits but
more customization options too.
4. For each purchase, customers will be encouraged to
provide their feedback and ratings. This will help in
boosting the artisans so that they can get that extra urge
to satisfy the customers further.
5. Loyalty programs for customers will be available
depending on the purchased amount over the
customers' lifetime.
6. A recommendation tool will be in place so that
depending on the profile of the customers, their
browsing pattern, buying history, frequency of site visit,
time spent on each product category, relevant products
and promotions can be pushed to the customer's home
page so that he/she has a better browsing experience.
7. As the products are traditional and each having its
history and exciting facts, under each product, a brief
outline regarding the product will be provided. This is
with the intention that the potential customers would be
able to appreciate the piece of work, the legacy
associated with it, and the hard work that went to give the
final form of the product and be proud to own such
products.
8. There will be a tab on the website for visitors to
contribute towards the upliftment of the gifted artisans of
Bengal through different means, but not limited to
monetary support only.
9. As “going green” and “green consumption” are being
discussed across the world, the site will try to portray the
different products in light of them being environment-
friendly. The site will highlight that the different
handicrafts available on the site are prepared from
biodegradable materials, considering that handicrafts
use natural resources, and by consuming these goods,
the consumers will also play an important part in saving
our Mother Earth. Studies conducted to understand the
impact of climate change have confirmed changes in the
form of rising temperature, reduction in rainfall,
increasing instances of drought, unpredictable monsoon
pattern to name a few, which is impacting mankind
(Khan and Arya 2017), Handicrafts due to its production
process is environmentally friendly and this need to be
highlighted among the target customers across all
communication channels.
10. Besides the normal features that are available on any e-
commerce site, as people from outside India too would
be targeted with Bengal's bouquet of crafts, the site
needs to have a few additional features like language
selection and option for payment other than in INR. The
shipping and logistics management should be capable
to cater to this customer segment as customer
satisfaction includes quality products and the service
aspects too.
11. Some of the basic features of the portal will be a secure
payment gateway, status updates of orders from
initiation to delivery, fast ordering process, options for
subscribing to newsletters, customer loyalty circle, and
special features associated with it. These are only
indicative and may get updated as per requirement
during final design and execution.
F. Online Marketing
1. The promotion of the website to the target audience is
an integral part of the planning to make Bengal's craft
popular in the world. In today's digital world, digital
marketing activities like Search Engine Optimization
(SEO), Search Engine Marketing (SEM), Social Media
Marketing, Email Marketing, and affiliate marketing
tools need to be effectively used to drive traffic to the
site.
2. Special promotional offers need to be planned and
executed from time to time depending on the responses,
traffics to the site, sales, and usage of marketing
analytics to make the e-commerce project a successful
venture. This will not only improve the visibility and sale
of Bengal's craft but will also improve the economic
conditions of the crafts-persons.
CONCLUSION
The handicraft industry of Bengal has the potential to
grow in size and generate revenue for the people involved in
the production of the products and the state's economy will
also benefit. But to make this happen, several steps need to
be taken. One of them is making popular Bengal crafts
among a large segment of the population so that the volume
of transactions increases and the mode considered to
achieve this is to take advantage of e-commerce. The
present paper has tried to create a framework for this
endeavor. The proposed framework tried to encompass all
the main components required to implement a successful
handicraft value chain start ing from sourcing,
communication, and pricing guidelines for the crafts, strategy
for online presence, and marketing The success of this
venture will have far-reaching implications including
preservation of age-old cultures and tradition, and
continuance of these customs through future generations as
they will look into this sector with renewed interest and will
carry forward Bengal's heritage.
REFERENCESBanik S 2017. A study on financial analysis of rural artisans in India:
78

Issues and challenges. International Journal of Creative Research Thoughts (IJCRT) 5 (4): 2294-2298
Corbin J and Strauss A 2008. London: Basics of qualitative research.Sage Publications Ltd, London.
Dhar PP 2011. DK Print Indian Art History: Changing Perspectives,world and National Museum Institute.
Flick U 2014. . Sage An introduction to qualitative research (5th ed.)Publications Ltd, London.
Hsieh HF and Shannon SE 2005. Three approaches to qualitative content analysis. (9): 1277-Qualitative Health Research 151288.
Jena PK 2007. Orissan Handicrafts in the age of globalization: Challenges and opportunities. (4): 16.Orissa Review 64
Khan AH and Arya D 2017. People perceptions of climate change and its Impacts on phyto-diversity and livelihood of the inhabitants of Almora Kumaun Himalaya, Uttarakhand (India). Indian Journal of Ecology 44(4): 735-740.
Klamer A 2012. Crafting culture: The importance of craftsmanship for the world of the arts and the economy at large. Erasmus University of Rot terdam . http: //www.klamer.n l/wp-content/uploads/2017/08/crafting.pdf.
Kumari G and Srivasatava AR 2016. Role of e-tailing in boostong the Indian handicraft. International Journal of Marketing & Financial Management 4 (4): 27-36.
Manias E and McNamara T 2016. Standard setting in specific-purpose language testing: What can a qualitative study add?
Language Testing 33(2): 235-249.
Pathak R, Sharma M and Sujatha R 2017. RC²@ Craftsvilla. Com craftsvilla is revolutionizing through co-creation: Creating value for stakeholders. Journal of Business and Retail Management Research 12 (1).
Richardson A J 2012. Paradigms, theory and management accounting practice: A comment on Parker (forthcoming) “Qualitative management accounting research: Assessing deliverables and relevance”. Critical Perspectives on Accounting 23(1): 83-88.
Statista 2019. India's handicrafts exports from FY 2011 to FY 2019. Retr ieved from https:/ /www.statista.com/stat ist ics/ 624202/export-value-of-handicrafts-india/
Tiwari A and Dutta B 2013. Indian Handicrafts Industry: Evaluating Inclusivity of Current Business Models retrieved from https://tejas.iimb.ac.in/articles/Tejas_September%20Edition_Article%202.pdf
Tsushima R 2015. Methodological diversity in language assessment research: The role of mixed methods in classroom-based language assessment studies. International Journal of Qualitative Methods 14 (2): 104-121.
Venkataramanaiah S and Kumar NG 2011. Building competitiveness: A case of handicrafts manufacturing cluster units. (2): 27-37.Indore Management Journal 3
Working group report on handicrafts for 12 five year plan 2011.th https://niti.gov.in/planningcommission.gov.in/docs/aboutus/committee/wrkgrp12/wg_handi1101.pdf
Received April, 2021; Accepted Ju , 202120 16 ne
79

Youngster's Perception Towards M-Wallet Service Quality: An Empirical Study
Manuscript Number: S-680NAAS Rating: 5.79
Abstract: India is continuously making efforts to become one of the major digital economies. Popularity of smart phones and use of internet in the country, has given a boost to cashless transaction and digital payments using Mobile wallets. Youngsters are very frequently using these apps nowadays and it would be interesting to know their perception towards these apps. Therefore, this paper aimed to identify the factors of M wallet service quality which influence the perception of youngsters. Further, a comparison has been done between the two popular M wallet; namely Paytm and Phonepe regarding the identified dimensions of service quality. The data was collected from total 242 respondents by using a self-structured questionnaire. The area of study was central India. Principal component analysis was used to find out the factors and independent t test was applied to compare these two apps on the basis of identified dimensions of service quality. As a result, eight factors were identified which influence youngster's perception for service quality of M wallet are User Friendliness, Security and Privacy, Rewards, Customization, convenience, Grievance Handling, Service Assistance and Data Synchronization of M-wallet. The study found that Paytm service quality is better in comparison to Phonepe with respect to four dimensions User Friendliness, Customization, Service Assistance and Data Synchronization. The study would not only help companies to plan their strategies to design their M-wallet but also facilitate banks to improve their e service quality.
Keywords: M Wallet, Youngsters, Service quality, Paytm, Phonepe
Minal Uprety and Murlidhar PangaPrestige Institute of Management and Research, Indore-452 010, India
E-mail: [email protected]
Indian Journal of Ecology (2021) 48 Special Issue (16): 80-84
India will be soon becoming a milestone in the regime of
cashless economy as it is moving fast towards adopting
digital payment system. Indian government has introduced
demonetization in the year 2016 (Mohan and Kar 2017). It
has given remarkable growth prospect for digital payment
and several digital wallet service providers to take the
advantage of this opportunity to expand their market share.
There were several attempts made from last few years to
promote the initiative taken for digital India. Not only
government but private companies have also contributed to
the growth of digital transactions by stimulating mobile
wallets through high internet connectivity and speed, digital
literacy mission for rural India and so on (Joseph et al
2017,Mukherjee et al 2019). There are many E-payment or
M-wallets apps available which can easily replace the
physical wallet and make cashless. One can use these E-
payment payment apps to send money or pay at shops. Now
a day's people are doing payment with the help of their mobile
phone instead of paying cash. They offer payment service
through which an individual or business can receive or send
money through their mobile phones. Government of India
and private sector companies such as Paytm, Phonepe,
Googlepe, Freecharge and Mobikwik had been aggressively
introduced several digital payment applications, including the
Aadhaar Payment app, the UPI app, and the National
Payments Corporation of India (NPCI) developed the Bharat
Interface for Money (BHIM) app. Various previous literature,
showed that because of life style, young people are more
inclined towards adopting M-wallets (Koenig-Lewis et al
2010, Howcroft et al 2002). Youngsters are very well-versed
with the technology and innovation and involved much in
stock market, online purchasing etc. thus become important
customers in future. It was observed that well educated and
economically well off people are the ideal to become
prospective users of M-banking services (Tiwari et al 2006).
The paper thrown light upon the youngster's perception
towards the service quality of two popular M-wallets namely;
Paytm and Phonepe. With increasing competition among
service providers in the area of mobile payment, it is
interesting to understand customer's requirement and
perception about the service quality towards mobile wallet. In
this paper, a study has been made to identify the factors
influencing customer's perception towards service quality of
M wallets.
MATERIAL AND METHODS
The proposed study was exploratory in nature. The
study targeted the youngsters who belong to age group of 16
to 30 years using M wallet. Convenient Sampling was used
for the sample selection. On the basis of previous literature, a

self-structured questionnaire was developed and consists of
30 variables on Likert scale (from 1 = Strongly Disagree; 5 =
Strongly Agree). Primary data were collected from
youngsters of Central India using self-structured
questionnaire. Total 242 duly filled questionnaire were
received out of 350 and most of the respondents were age
group of 18 to 26 years. Exploratory factor analysis was used
for the identification of factors which influence the
youngster's perception towards service quality of M wallet.
Cronbach's Alpha test was used to evaluate the reliability by
assessing the internal consistency of the items used for
measuring e-Service quality. After identifying factors, an
independent 't' test was also applied to make a comparison of
service quality between two popular M wallet apps that is
Paytm and Phonepe with respect to identified factors.
RESULTS AND DISCUSSION
The sample consists of 42.67% males and 57.33%
females. Most of the respondents' falls under the category of
age group 22-26 (62.67%) followed by age group of 18-22
years (34.67). In the study 40.49% were graduate, and rest
post graduate (Table 1).
Reliability test: Cronbach alpha was used to measure the
internal consistency and reliability of the measurement scale.
The alpha values of all variables were more than 0.70, which
implies that all variables are reliable and internally consistent.
No item deletion took place.
KMO and BARTLETT: KMO Measure of sampling adequacy
was 0.794 which is greater than 0.50 it means there is strong
relationship between variables. Bartlett's Test of Sphericity
tested and significance value is found 0.00.
Factor analysis: The factor analysis was used to identify the
factors that affect youngster's perception towards the service
quality of M wallets. After applying factor analysis, 8 factors
were extracted out of 30 variables. Total 60.287% variation
was explained by these eight factors. The various factors
identified are:
Hypothesis:
The following hypothesis were framed to compare the
identified factors of service quality between Phonepe and
Paytm.
H01: There is no significant difference in the perception of
Paytm and Phonepe users with respect to user friendliness.
H02: There is no significant difference in the perception of
Paytm and Phonepe users with respect to security and
privacy.
H03: There is no significant difference in the perception of
Paytm and Phonepe users with respect to rewards.
H04: There is no significant difference in the perception of
Paytm and Phonepe users with respect to customization.
Demographic variable
Category No. of respondents
Percentage
Gender Male 104 42.67%
Female 138 57.33%
Age Below 18 1 0.66%
18 – 22 84 34.67%
22 – 26 152 62.67%
26 – 30 5 2%
Education School 1 0.67%
Graduate 98 40.49%
Post Graduate 143 59%
Table 1. Demographic classification
Cronbach's alpha Cronbach's alpha based on standardized items
No. of items
0.887 0.891 30
Table 2. Reliability analysis
Kaiser-Meyer-Olkin measure of sampling adequacy 0.794
Bartlett's Test of Sphericity Approx. Chi-Square 1586.789
Table 3. KMO and Bartlett's Test
H05: No significant difference in the perception of Paytm and
Phonepe users with respect to Convenience.
H06: There is no significant difference in the perception of
Paytm and Phonepe users with respect to grievance
Handling.
H07: There is no significant difference in the perception of
Paytm and Phonepe users with respect to service
assistance.
H08: There is no significant difference in the perception of
Paytm and Phonepe users with respect to data
synchronization.
User friendliness is the major factor, which influence the
perception of youngsters. This feature of e wallet helps in
offering easy access to the app. The user prefers to use the
app, which provide them hassle free process with ease. All
the information on the app should be organized in such a way
that user can't find issues while using it. It allows the user to
perform the transactions easily and after using they will be
satisfied. Saleem and Rashid (2011) also observed that if any
technology is simple to understand and implement
customers always ready to use it. Security and privacy is
another important feature of M-wallet. Young customers
showed more satisfaction towards the M wallet, if it has
proper security and privacy features. Youngsters always
desire to keep their personal information as well financial
transaction confidential so the M wallet app must have
81Youngster's Perception Towards M-Wallet Service Quality

security features which ensure the privacy of user's data.
These apps are generally a soft target for hackers; mobile
wallet app developers must include a strong protection by
providing feature like fingerprints, QR code, OTP etc. Young
customers are cautious for their transaction security while
using M-banking services. It leads to the satisfaction the two
most important needs of customers (security and reliability)
(Saleem and Rashid 2011). Rewards also have meaningful
impact on youngster's perception towards service quality of
M wallet. Here rewards refer to some kind of tangible benefits
(cash back offer, discounts, coupons, free gifts vouchers
Factor Variables Item load Factor load
User friendliness App is well organized. 0.688 4.141
App makes it easy to find what I need. 0.677
App is simple to use. 0.668
Enables me to complete a transaction quickly. 0.611
App generates a digital receipt for every transaction. 0.517
Makes it easy to get anywhere on the app. 0.498
Satisfied every time I used this app. 0.482
Security and privacy Does not share my personal information with others. 0.714 2.881
App protects information about my debit/credit card and other bank details. 0.688
App is a password protected app with features like sending OTP, fingerprints or QR code. 0.56
App is more handy to easily add money and make transactions. 0.489
App enables me to do transactions on almost every e-commerce site. 0.43
Rewards Provides me different rewards like cashback and various vouchers to be used on different app.
0.863 2.138
Provides me different offers and discounts. 0.838
App allows me to do shopping and get discounts under the same platform. 0.437
Customization App has a budgeting tool that can be integrated into wallet, so as to allow me to monitor my spending, and plan my finances better.
0.825 2.498
App helps in quick and instant transfer of funds to anywhere in the world. 0.586
App enables me to retrieve my information like bank account no., credit/debit card details, important passwords on my phone anytime I want.
0.576
App allows me to find nearby people and can make a payment with just a tap on the user's name with the help of GPS.
0.511
Convenience App automatically takes backup of the files employed in every operation. 0.705 1.919
App has an interactive and smooth user interface. 0.66
This app charges minimum transaction fees and service fees. 0.554
Grievance handling App tells me what to do if my transaction failed. 0.826 1.528
In app, transaction can easily be refunded in case of default. 0.702
Service assistance It takes care of my problems promptly. 0.699 1.792
This app has 24x7 customer service representative available for help. 0.651
App enables you to perform the transactions anytime without a hassle. 0.442
Data synchronization Helps me to keep track of my transaction history. 0.698 1.346
App provides me the opportunity to interconnect the bank accounts, credit cards, mobile accounts, bills, etc. and better manage all my financial transactions.
0.648
Table 4. Results of factor analysis
etc.). This is extraneous motivation for customer which
applies to them to achieve specific outcome. Consumers
were observed to put their efforts in obtaining these
rewards/tangible incentives (Varnali et al 2012, Kim and Han
2014 ). This factor helps in attracting and engaging
customers effectively.
An effective M-wallet must have customization feature
which includes a budgeting tool that can be integrated into
wallet, so as to help the users to monitor their spending, and
plan their finances in a better way. The app must enable
users to retrieve their information like bank account no.,
82 Minal Uprety and Murlidhar Panga

credit/debit card details, important passwords on their phone
anytime they want and also allows to find nearby people and
make a payment with just a tap on the user's name with the
help of GPS. The customers want to avail services at their
own convenience and requirements (Lin and Hsieh 2006). To
use the app smoothly with no perplexity, the mobile wallet
app must be easy to use, and attractive. Subramanian (2010)
observed that the most of the respondents preferred
electronic banking products for their banking transactions
and the respondents prefer to use it because of the
convenience in electronic transactions. Young customer also
prefers to use the M wallet which has proper system of
grievance handling related with transaction. A quality M
wallet always helps its users to get refund if their transaction
failed or in case of default.
Another important factor which influences youngsters
was service assistance and data synchronization. The app
should always have a customer representative for help and
always take care of the problems of users promptly. Young
customers always recognize the efforts of banks that
understand and assist them in solving their problems. Tardivo
et al (2014) also made similar observation. The app should
always keep track of user's transaction history and should
provide the opportunity to interconnect all the information and
better manage all the transactions. Dave (2016) concluded
that record of transaction and its accessibility at any time, is a
major advantage of M wallet. The comparison was made
between the two popular players in M wallet services, Paytm
and Phonepe. From the analysis, it was concluded that all the
hypothesis was rejected except H02, H03 and H6. From the
analysis (Table 5), it was observed that Paytm was more User
Friendly in comparison to Phonepe. Youngsters have same
perception towards both the service provider regarding
security and privacy and rewards. In the factor customization,
Paytm was observed as more effective in comparison to
Phonepe. Young customers perceive Paytm services more
HypothesisThere is no significant difference between Paytm and Phonepe w. r. to)
P-value Decision Mean
H01: User friendliness 0.001< 0.05 Rejected 3.96>3.52
H02: Security and privacy 0.123 > 0.05 Accepted -
H03: Rewards 0.262 > 0.05 Accepted -
H04: Customization 0.001 < 0.05 Rejected 3.34>2.77
H05: Convenience 0.048 < 0.05 Rejected 3.75>3.44
H06: Grievance handling 0.112 > 0.05 Accepted -
H07: Service assistance 0.044 < 0.05 Rejected 3.56>3.25
H08: Data synchronization 0.007 < 0.05 Rejected 3.83>3.56
Table 5. Results of independent t-test
convenient than Phonepe. There is no significant difference
that means the service quality of both the app is same with
respect to grievance handling. Service assistance of Paytm
was more effective in comparison to Phonepe. Data
synchronization of Paytm was also better than Phonepe.
CONCLUSION
Eight factors were derived from the study which
influence the service quality of M wallets. The present study
has many implications to the banking industry and mobile
technology to establish new strategies for improving the
service quality of M wallets so as to attract and retain more
and more customers. The comparison made in the study
helps service providers to understand the customer's
expectations and priority so that they can improve their
service quality efforts. Marketer must take the benefits of
preferred features of M-wallet in promoting digital India.
REFERENCESDavis FD, Bagozzi RP and Warshaw PR 1992. Extrinsic and intrinsic
motivation to use computers in the workplace. Journal of Applied Social Psychology 22 (14): 1111.
Dave R 2016. Going cashless; is it good for you retrieved from Economic Times: http://economictimes.indiatimes.com/ w e a l t h / s p e n d / g o i n g - c a s h l e s s - i s - i t - g o o d - f o r you/articleshow/55908649.cms
Joseph N, Kar AK and Ilavarasan PV 2017. A model for prioritization and prediction of impact of digital literacy training programmes and validation. In Conference on e-Business, e-Services and e-Society November, p. 227–238, Springer, Cham.
Howcroft B, Hamilton R and Hewer P 2002. Consumer attitude and the usage and adoption of home-based banking in the United Kingdom. (3): 111-International Journal of Bank Marketing 20121.
Kim YJ and Han J 2014. Why smartphone advertising attracts customers: A model of web advertising, flow and personalization. : 256-269.Computers in Human Behavior 33
Koenig-Lewis N, Palmer A and Moll A 2010. Predicting young consumers take up of mobile banking services. International Journal of Bank Marketing 28 (5): 410-432.
Lin J and Hsieh P 2006. The role of technology readiness in customers' perception and adoption of self-service
83Youngster's Perception Towards M-Wallet Service Quality

technologies. International Journal of Service Industry Management 17 : 497- 517.
Mukherjee T, Ilavarasan PV and Kar AK 2019. Digital literacy training, impact and moderating role of perceived value among unemployed women in India. Proceedings of the Tenth International Conference on Information and Communication Technologies and Development, January, 1–4, 2019.
Mohan R and Kar AK 2017. Demonetization and its impact on the Indian economy–insights from social media analytics. In Conference on e-Business, e-Services and e-Society, November, p. 363–374, Springer, Cham.
Saleem Z and Rashid K 2011. Relationship between customer satisfaction and mobile banking adoption in Pakistan. International Journal of Trade, Economics and Finance 2 (6): 537-544.
Subramanian. S 2010. A study on marketing of e-banking of products with reference to credit cards in Thanjavur, Tamilnadu,
Unpublished Ph.D. Thesis, Tiruchirappalli, Bharathidasan . University, India, p. 276.
Tardivo G, Viassone M and Gola GL 2014. Young customers' perception of the quality of M-banking services. Universal Journal of Industrial and Business Management 2 (8): 200-209.
Tiwari R, Buse S and Herstatt C 2006. Mobile Banking as Business Strategy: Impact of Mobile Technologies on Consumer Behavior and Its Implications for Banks. Proceedings of the Portland International Conference on Management of Engineering and technology, Istanbul, July 8-1, 2006.
Van der Wal, RWE Pampallis A and Bond C 2002. Service quality in circular telecommunications company: A South-African experience. (5): 323-335.Managing Service Quality 12
Varnali K, Yilmaz C and Toker A 2012. Predictors of attitudinal and behavioral outcomes in mobile advertising: A field experiment. Electronic Commerce Research and Applications 11 (6): 570-581.
Received , 2021; Accepted 06 July, 202107 March
84 Minal Uprety and Murlidhar Panga

E-Governance: A Swift Development and Citizens' Adoption
Manuscript Number: S-681NAAS Rating: 5.79
Abstract: The objective of the research is to understand the model of e-Governance in Indian context. Various studies have been conducted in the area of e-Governance adoption and review of those studies has given a roadmap to conduct the present research. This study reviewed the digital government initiative adopted by other developed and developing countries and this supported to design a questionnaire to identify the factors that may contribute to the adoption of digital services offered by Government of Madhya Pradesh. The success of e-Initiatives depends upon the acceptability of the citizens. The study extracted 11 factors named as website quality, perceived ease to use, perceived usefulness, perceived risk, technology self-efficacy, vernacular language, familiarity, personalization, security, technology anxiety and intention to adopt the digital services. The finding suggests that incorporating these factors in the digitally offered government services may increase the usage rate & citizens engagement.
Keywords: e-Governance, Digital service, Technology, Adoption, Citizens
Nidhi Jhawar and Vivek S. KushwahaIPS Academy, IBMR, Indore- 452 012, India
E-mail: [email protected]
Indian Journal of Ecology (2021) 48 Special Issue (16): 85-91
Electronic governance is combining information and
communication technology in all the government processes
to enhance the ability of government in addressing the need
to its stakeholders. The aim behind the system is to simplify
process for all; government, businesses, employees and
citizens at local, state and national level. Effective
implementation of IT in government services provide hassle-
free government and citizens connect. ICTs play a vital role in
development and economic growth of the country. A
successful implementation of ICT in e-Governance system
endow with one stop solution to all the problems. Certainly,
integrally interlinked and knitted system is the need of current
digitalized era. ICT brings public and government closer and
also recognizes every probable requirement of the citizens to
provide optimum possible services and encourages the
citizens to participate actively (Sigdel 2007). Basically e-
Governance system is using internet for information transfer,
delivery of services, while ICT is a root that has a
communication device such as phone, computer, network
hardware satellite system that facilitate users to access,
store and transmit the information.
The system is backed by certain benefits such as low
cost of operation, enhanced service delivery, transparency
and close interaction between government and public (Sabri
et al 2012). The system benefits all the stakeholders and at
the same time a direct connects of government and public
helps in policy making and resolve the community problems
(Sarpoulaki et al 2008). ICT plays vital role in the
implementation of this system as citizens reach to the
government with the help of internet (Gajendra et al 2012).
To be modernized is an essential requirement for the
betterment of the society and economy. The system e-
Governance has potential to connect with people in an
innovative way. New technologies have been developed with
which just on one click connect between government and
public is possible (Sharma et al 2013). ICT is a remedy for
many of the issues related to citizen and government
connection and it is a key device to support the government
for becoming good governance, the information & services in
public sector to be defined in a way that more and more traffic
could be cater on this platform. Before introducing
Governments e-Services it is essential to understand factors
that influence the citizens of the country to avail the services
through these platforms. Putting all the components of e-
Governance model into one single framework that would
satisfied all the requirements of diversified users would be a
barrier to implementation because the heterogeneity exists in
form of cultural region, political structure, literacy, IT
infrastructure, languages, behavior and economic identities.
Kumar et al (2018) in his research concluded that auxiliary
facilities, corruption avoidance, transparency and fairness in
process, customer support and connectedness are the
explanation factors that enable citizens to adopt
government's digital services in India. Conceptual model
absolutely focuses on UN citizens' adoption of e-Governance
system explores that information privacy concern is the major
issue impacting on e-adoption (Liu and Carter 2018).
Jhawar and Kushawaha (2018) made a logical
conclusion from the analyzed data and the concluded factors
are product-based motivation, pragmatic motivation based
on convenience, time and efforts and informative, quality
service motivation, economic motivation, situational
motivation, demographic motivation and social and
exogenous motivation. In the dynamic technological
scenario, the policy makers shall focus upon the impact of
motivational aspects on online purchase of Government of
India's e-Initiatives. Keeping other factors aside it is
important to understand that internet is the medium with
which services reaches to the majority of the citizens.
Success of e-governance greatly depends upon to the extent
citizens are willing to adopt the modified and upgraded
system. Libya, where population is spread over a large
geographically area, the internet is the only possible system
to link and bring Libyan government and citizens to zero
proximity (Abied et al 2015). The study focused on eight
factors i.e. intention to use, perceived ease of use, perceived
usefulness, subjective norm, image, facilitating conditions,
trust of internet, computer self-efficacy along with
demographic variable. Perhaps only in this research-
intensive geographical study has been found. The ICT has
dismissed all painful traditional method by revolutionizing
through its technology and its potential use in all sectors
including private and public. In light to this Safeena and
Kammani (2013) developed conceptual competency
framework includes variables such as technological,
managerial, political, user and website quality. A study
conducted in Greece identified that along with technological
phenomena trust and risk with cognitive, social and intrinsic
factors also plays vital role in intention of use the
Governments' e-Initiatives (Zafiropoulos et al 2012). Results
clearly define that cognitive and intrinsic factor hold the key
concern for the government to increase behavioral intention
to use e-Government services.
Various researches have been conducted to understand
the impacting factors of adoption of Government's digital
services. Putting all the components of e-Governance model
into one single framework that would satisfy all the
requirements of diversified users would be difficult in
application since, the heterogeneity exists in form of cultural
region, political structure, literacy, IT infrastructure,
languages, behavior and economic identities. All the above
mention researches are different in respect with perspectives
of country, citizens, government and its environment. In the
era of innovation of new system a continuous or perceptual
actions and reaction exists on demand which further occurs
forever. Various factors have been considered in the studies
conducted in different countries in context with adoption of e-
Governance and review of the studies conclude that there is
no common accord to understand and determine which
factor adds more to the user acceptance to the system of
digitalization and this is considered as a gap for undertaking
this research. Based on the gap, the current research work
tries to identify the factors that increase the citizens'
participation in adopting the digital services offered by
government of Madhya Pradesh.
MATERIAL AND METHODS
The present research used primary as well as secondary
data for fulfilling the requirement of defined objectives. The
secondary data is collected from previous researches,
government websites and information available over internet
whereas primary data is collected by circulating a structured
questionnaire to the respondent. To collect the primary data
the questionnaire is circulated to the personal contacts as
well as contacts of personal and professional circle. The
research focuses on identifying the factors impacting on the
citizens' adoption of digital services offered by Government
of Madhya Pradesh. The questionnaire is divided into three
sections. The first section of the questionnaire aims at
collecting the demographic profile of the respondents, the
second section collects general information about the
awareness towards the digital services offered Government
of Madhya Pradesh and the third section has variety of
statements aiming at ascertaining and measuring various
factors which leads to citizens' adoption to use governments'
digital services. All the items of the questionnaire are
measured on seven point Likert scale; “7” as strongly agree
and “1” as strongly disagree. Before making it public or
sending it to the target group, pretest is conducted.
Pretesting helps in identifying errors that researcher
committed while preparing it. Pretesting make sure that
updated questionnaire will give you the data that you were
hoping to receive. In the present study pretesting was
conducted with experts such as government employees,
academicians and experts who had worked on e-
Governance projects. The suggestions and inputs have been
incorporated and the final draft is prepared. The target
population of this study is various parts of Madhya Pradesh.
The sampling frame is working population of Madhya
Pradesh. Convenience sampling method is used to conduct
this research The questionnaire is distributed over 720 .
respondents out of which 530 responses are collected
however 502 responses are found worth for the further
analysis of the study. The factor analysis with principal
component analysis and varimax rotation is conducted to
identify the component factors. Some items of the
questionnaire are eliminated in the final study due to lower
factor loading (< .5) and also the items with cross loading are
also removed in the final draft of the questionnaire. Total 47
items are extracted from the pilot study and 11 factors have
86Nidhi Jhawar and Vivek S. Kushwaha

been defined as per the results of factor analysis. Reliability
of the scale is measured by Cronbach's Alpha, sample
adequacy is checked by Kaiser--Meyer-Olkin (KMO) and
Bartlett's test of Sphericity and after that Factor Analysis is
conducted to identify the impacting factors. Standard
Statistical Package for Social Sciences (SPSS) version 20.0
software was used for analyzing the data.
RESULTS AND DISCUSSION
Description of sample of the study: The questionnaire was
distributed among 720 respondents out of which 530
responses are collected however 502 responses are found
worth for the further analysis of the study. According to
Babbie (1990) in social science researches response rate
below 50% should not be considered for the further analysis,
50% is considered an acceptable response rate, 60% is
classified as good response rate and above 70% is classified
as very good response rate. The response rate in this study
was 69.77% and is considered as good response rate.
Demographic profile of the respondents: The section
explains the demographic profile of the respondents who are
participated in the survey. The demographic variables are
measured on the basis of respondents gender, age,
education level and income category which are mentioned in
Table 1.
Gender: 502 responses are found appropriate for the further
analysis where 56.77% are male and 43.23% are female.
The male respondents are higher than the female
respondents.
Age: Majority of responses have come from 30-40 age group
(54.78%) followed by 23.5% respondents in 20-30 age group
and 10.76% in 40-50 age group.
Education qualification: The participants belong to five
educational groups. Majority of responses have come from
the respondents hold post graduate degree (49.40%)
followed by were graduate (31.87%). The 6.38%
respondents were Ph.D. holders.
Income: The participants divided into six income categories.
0.8% belongs to unemployed category, 34.27% belongs to
above 2 and upto 4 lakhs income category followed by
28.88% above 4 and upto 8 lakhs income category. Only
8.57% belongs to above 12 lakhs income category.
Citizens' intention to adopt government's digital
services: This section gives insight on frequency of users
and non-users of digital services offered by Government of
M.P (Table 3 and 4).
Frequency of users and non-users of government's
digital services: The 502 respondents (80.28%) are using
digital services offered by Government of M.P. and 19.72 %
are the non-users due to either of the factors such as not
Variable Category Frequency Percentage
Gender Male 281 56.4%
Female 217 43.6%
Total 502 100%
Age Below 20 13 2.59%
20-30 118 23.50%
30-40 275 54.78%
40-50 54 10.76%
50-60 22 4.38%
60 and above 20 3.99%
Total 502 100
Educational qualification
10th ---- ----
12th 62 12.35%
Graduate 160 31.87%
Post raduateg 248 49.40%
Ph.D. 32 6.38%
Total 502 100%
Income Unemployed 4 0.8%
Upto 2 akhl 67 13.34%
Above 2 pto 4 akhu l 172 34.27%
Above 4 pto 8 akhu l 145 28.88%
Above 8 pto 12 akhu l 71 14.14%
Above 12 akhl 43 8.57%
Total 502 100%
Table 1. Demographic profile of the respondents
Category Numbers of respondents Percentage
Non-users 99 19.72
Users 403 80.28
Total 502 100%
Table 2. Category-wise distribution of respondents
aware of the services, prefer intermediary, not familiar with
internet and not used yet personally (Table ). 2
List of available digital services offered by Government
of Madhya Pradesh: This includes many of the public utility
services offered by government of Madhya Pradesh (Table
3).
Kaiser-Meyer-Olkin (KMO) and Bartlett's test of
Sphericity: KMO value 0.00 to 0.49 is unacceptable, 0.50 to
0.59 is miserable, 0.60 to 0.69 is mediocre, 0.70 to 0.79 is
middling, 0.80 to 0.89 is meritorious and 0.90 to 1.00 is
marvelous. Bartlett's tests the hypothesis that your
correlation matrix is an identity matrix, which would indicate
that your variables are unrelated and therefore unsuitable for
structure detection. Small values (less than 0.05) of the
87 E-Governance: A Swift Development and Citizens' Adoption

Services Frequency Percentage
Yes No Total Yes No Total
Information search from M.P. Govt. website 206 296 502 41.0% 59.0% 100%
Paying bill electricity/ telephone 230 272 502 45.8% 54.2% 100%
Paying tax property/ water 174 328 502 34.7% 65.3% 100%
Filling of e-challan 51 451 502 10.2% 89.8% 100%
Insurance premium payment 220 282 502 43.8% 56.2% 100%
Building plan approval and verification from national repository 89 413 502 17.7% 82.3% 100%
Apply for certificates (Birth, Death, Caste, Income, Domicile, Marriage, Physical Disability Certificate)
64 438 502 12.7% 87.3% 100%
Obtaining government schemes 57 445 502 11.4% 88.6% 100%
Apply for driving license 79 423 502 15.7% 84.3% 100%
Land and property registration 59 443 502 11.8% 88.2% 100%
Online booking of bus tickets/tourism/donation 10 492 502 2% 98% 100%
DTE counseling and admission process 138 364 502 27.5% 72.5% 100%
Scholarship (Online application, verification and transfer of scholarship Amt.) 168 334 502 33.5% 66.5% 100%
Making queries via e-mail to government organizations 117 385 502 23.3% 76.7% 100%
Table 3. List of available digital services and its usage frequency
KMO and Bartlett's Test
Kaiser-Meyer-Olkin measure of sampling adequacy
.889
Bartlett's Test of Sphericity
Approx. Chi-Square 10750.726
df
10750.726
1126
Sign .000
Table 4. KMO and Bartlett's test of intention to adopt digital services offered by Government of M.P.
significance level indicate that a factor analysis may be useful
with your data. KMO and Bartlett's test and results show that
value of KMO is 0.870 which is considered as meritorious.
Bartlett test of Sphericity has the p-value of 0.000 which is
less than 0.05 and it states that the model is statistically
significant for conducting factor analysis.
Factor analysis and construct reliability: Factor analysis;
principal component analysis with varimax rotation is used
for and results (Table 5).
Eleven factors have been extracted from the collected
data and presence of these factors in the offered digital
services by Government of Madhya Pradesh would increase
the adoption rate.
Factor 1- Website quality: Research resulted that a well-
designed websites significantly affects the visitors' traffic. A
success of any website not only depends upon how it looks
but also on the kind of seamless experience it provides to the
visitors.
Factor 2- Perceived ease to use: Perceived ease to use
referred as the degree to which an individual believes that
using a particular system or technology would be free from
physical and mental effort. The usage of a particular website
will be increased due to its simplicity and adaptability. User
friendliness not only allows people to use a particular system
but it also derives satisfaction after adopting.
Factor 3- Perceived usefulness: Perceived usefulness
referred as the degree to which an individual believes that
using a particular system or technology will give solution to a
problem or enhance his or her working. Perceived ease to
use greatly influences perceived usefulness. Perceived ease
to use refers a state of mind where an individual feel that the
system is free from efforts whereas perceived usefulness
talks about the system is relevant and appropriate to perform
a particular task.
Factor 4- Perceived risk: Perceived Risk is a psychological
function, considered as a set of uncertainties in customer
mind while they render any service or buy any product. It is
consumer's thought process related to the outcome involved
and there is always a negative correlation between perceived
risk and adoption intention.
Factor 5- Technology self-efficacy: It is considered as an
individual's perception on their own capability to use a
technology for completion of a task which is entirely new or
the one which they were doing manually before. Self-efficacy
is one's own belief on their own abilities to meet the
challenges ahead, accomplish the task and bring the desired
results. Interaction and Factor 6- Vernacular language:
communication through internet will be meaningful when
88Nidhi Jhawar and Vivek S. Kushwaha

Analysis of factorial validity and construct reliability
Variables Measured item Factor loading Composite reliability
Variable 1: Website quality Websites load quickly 0.633 0.846
Websites does not crash 0.749
Websites are available all the time 0.77
Websites load its page faster. 0.671
Variable 2: Perceived ease to use Organization and structure easy to follow 0.797 0.891
Easy to get information 0.731
Easy to complete transaction 0.726
Easy to navigate 0.584
Easy to search information 0.648
Accomplish tasks more quick 0.636
Clear to me 0.59
Visually appealing 0.592
Well organized appearance 0.575
Quick and easy 0.568
Easy to use services 0.734
Information are well organized 0.622
Variable 3: Perceived usefulness Complete the transaction anytime 0.788 0.719
Useful for availing government services 0.537
Satisfactorily serves the need 0.59
Variable 4: Perceived risk Unsure about service delivery as promised 0.544 0.756
Transaction error and refund issue 0.775
Inconvenience in Payment 0.819
Sharing personal information is not safe 0.736
Sharing sensitive information is not safe 0.564
Variable 5: Technology self-efficacy Confidence in working over technology 0.512 0.78
Eliminate travelling time 0.865
Reduce queuing time and low transaction cost 0.752
Variable 6: Vernacular language Local language is easy to understand 0.841 0.76
Local language is easy to use or correspondence 0.789
Variable 7: Familiarity Familiar with the website 0.789 0.796
Familiar in conducting online transaction 0.826
Variable 8: Personalization Link to other websites 0.785 0.835
Various options for delivering services 0.731
Various payment methods 0.727
Variable 9: Security Confident of security 0.784 0.723
Websites keep all the information confidential 0.84
Do not share information with other website 0.779
Variable 10: Technology anxiety Uncomfortable in using computers 0.783 0.889
Worried when think of using computer 0.826
Computer makes uneasy 0.757
Variable 11: Intention to adopt digital services Organization and structure easy to follow 0.783 0.871
Easy to get information 0.73
Easy to complete transaction 0.727
Easy to navigate 0.693
Easy to search information 0.686
Accomplish tasks more quick 0.626
Clear to me 0.588
Table 5. Analysis of factorial validity and construct reliability
Note: Acceptable factor loading and reliabilities (guidelines used λ > 0.5 and reliability >0.5 respectively)
89 E-Governance: A Swift Development and Citizens' Adoption

every possible individual using it is able to understand it. It is
only possible if the designed system is in the local language
further it will increase the traffic on the website and also an
understanding about the facilities and services offered by the
Government digitally.
Factor 7- Familiarity: In a broad-spectrum it is considered
as feeling of comfort and closeness or knowing something
very well. When familiarity is considered in adoption of any
technology or system, can be defined as a process of human
mind to bring back the past occurrence or experience in the
present state of mind. In a situation when individual do not get
familiar and not keen to avail the services online, they come
in the contact of government agencies to get the work done
and this do not solve the purpose of digitalization.
Factor 8- Personalization: Personalization can be defined
as a way to connect your customer after understating their
needs and preferences. It is a predictive approach that aims
to create a strong user experience by anticipating customers
need. The absence of personalization may lead to citizens'
dissatisfaction.
Factor 9- Security: Security is considered as providing
protection to the users' information or personal details from
malpractice. A general perception exist among users of
internet that there is lack of security while conducting online
transaction.
Factor 10- Technology anxiety: The term technology
anxiety can be defined as an individual's nervousness when
they are supposed to interact with the new system or
technology. An individual experiences uneasiness at initial
stage because of not being habituated and feels
uncomfortable while entering into new system. The level of
anxiety may decreases after the usage.
Factor 11- Intention to adopt the digital services:
Focusing on intention to adopt the e-Governance or digital
services offered in public sector is identified in various ways.
Adoption can be considered as the intention of citizens to
engage in digital system to receive information and request
services from the government. So, the current research
considers both willingness to use or intention to use as one
dimension that measures adoption to digital services. The
factor loading above 0.50 has been considered to include the
item in the factor (Table 5).
The results of factor analysis resulted to 11 factors and
study's finding suggests that presence of defined factors
would increase the use of digitally offered services. Now in
the era of digitalization and easy availability of internet facility
citizens finds it easy to avail the e-Services. Availing services
digitally not only reduces time but also reduces corruption
and red tapes. Penetration of smart phones backed by
superior technology at affordable rates and availability of
internet even in remote areas encouraging government to
work more on e-Initiatives. Accessibility of ICT to far off place
will bring economic revolution, empower public and
government both. A system which is free from efforts is more
likely acceptable by the users. Government websites traffic
would automatically increase if the defined factors of the
study have been taken care.
CONCLUSION
This study attempts to get a bright glimpse about the
factors that facilitate adoption of digital services offered by
Government of M.P. from citizens' perspective. The study is
conducted keeping in the mind to understand the concept of
e-Governance and exploring the factors that can contribute
to the adoption of digitally offered Madhya Pradesh
Government services.
Finding of the study extracted 11 factors named as
website quality, perceived ease to use, perceived
usefulness, perceived risk, technology self-efficacy,
vernacular language, familiarity, personalization, security,
technology anxiety and intention to adopt the digital services.
The finding suggests that incorporating these factors in the
digitally offered government services may increase the
usage rate & citizens engagement. The identified major
factors for not adopting those services are most of the users
do not find themselves comfortable in availing the services
via modern method, lake of awareness, security and privacy
issues, internet connectivity problem in remote areas etc.
Government training programs will make the society
more participative. The major concern while conducting the
online transaction is safety & security of provided information
of an individual. These issues must be resolved for the
effective implementation of digitalization of government
system. Governments efforts in redressing these issues can
increase the citizens' interaction and participation in
digitalized system. Proactive role of government in policy
formation, forecasting on future challenges, grievance
handling and public private partnership can bring a long way
growth with e-Governance and an overall development. This
survey is conducted only one state of the gigantic country
India and that is the biggest limitation of the research. The
study conducted in M.P. and the findings cannot be applied to
rest part of country due heterogeneity in the demographic
profile of the respondents.
The data is collected from 502 respondents and the
results explain that users and non-users of M.P.
Government's digital services are 80.28 and 19.72%
respectively. However the percent of users is remarkable but
for the 100% implementation and adoption of digital services
offered by Government of M.P., m-Governance will be an
90Nidhi Jhawar and Vivek S. Kushwaha

effective move. Though, m-Governance is adopted by many
states and Kerala is at the leading positions. So, the similar
projects must have been introduced to eliminate the
middleman and increase the interaction of government with
its citizens.
The e-Initiatives of Government are hand holding to the
public to gradually accept the changes happening on around
in the economy and mould themselves according to the
requirement of dynamic world. The success of e-Governance
is fully dependent on the citizens' willingness to use the new
system. The powerful mechanism of ICT will create a
favorable impact on citizens to voluntary involve themselves
for utilizing the citizen centric services offered by the
government.
REFERENCESAbied AA, Shiratuddin MF and Wong KW 2015. Factors Affecting
Libyan Citizens in Adoption of E-Government Services: A Research Framework. In Proceedings of International Conference on Information Technology & Society, June 8-9, 2015, Kuala Lumpur, Malaysia. p. 117-125.
Gajendra S and Pokharel M 2012. The strategic role of information technology in e-Government: A case of Nepal. International Journal of E-business and E-government Studies 8 (1): 19-39.
Jhawar N and Kushwaha VS 2018. Citizens' view on digital initiatives and e-Readiness: A case study for AADHAR project in Madhya Pradesh. (1): 1-22.Pragati Journal of Indian Economy 5
Jhawar N and Kushwaha VS 2018. Motivational factors for online
purchase of e-Services provided by Government of India, In Proceedings of Nirma Management Conference on Management on “Societal and Organizational Transformation through Strategic and Technological Interventions” at Institute of Management, Jan 11-12, 2018, NIRMA University, Ahmadabad, India. p. 89-97
Kumar R, Sachan A and Mukherjee A 2018. Factors influencing e-government adoption in India: A qualitative approach. Digital Policy, Regulation and Governance 20 (5): 413-433.
Liu D and Carter L 2018. Impact of Citizens' Privacy Concerns on e-Government Adoption. In Proceedings of 19th Annual International Conference on “Digital Government Research: Governance in the Data Age”, May 30-June 1, 2018, Delft the Netherlands. p. 1-6
Sabri, A, Sabri O and Al-Shargabi B 2012. A cultural e-Government readiness model. : 212-Intelligent Information Management 4216.
Safeena R and Kammani A 2013. Conceptualization of electronic government adoption. International Journal of Managing Information Technology 5 (1): 13-22.
Sarpoulaki M, Eslami R and Saleknia A 2008. E-Government concept and spatial information: A case study in Islamic republic of Iran. International Archives of the photogrammetric. Remote Sensing and Spatial Information Sciences 37 (B 4): 19-24.
Sharma S, Alshihi H and Govindaluri SM 2013. Exploring quality of e-Government services in Oman. Education Business and Society Contemporary Middle Eastern Issues 6 (2): 87-100.
Sigdel S 2007. E-Government for Good Governance. Weekly English Spotlight Retrieved February 15, 2011 from ht tp : / /egovernancenepal .b logspo t . com/2007/04/e-governance.
Zafiropoulos K, Karavasilis I and Vrana V 2012. Assessing the adoption of e-Government services by teachers in Greece. Future Internet 4 (2): 528-544.
Received January, 2021; Accepted 06 July, 202119
91 E-Governance: A Swift Development and Citizens' Adoption

F actors Affecting Luxury Brand Consumption and its Impact onConsumer Purchase An Intentions: India Fashion Luxury
Goods Sector Perspective
Manuscript Number: S-682NAAS Rating: 5.79
Abstract: This study identifies and analyses the psychographic and demographic factors that influence luxury brand purchase intention in the Indian context. It discusses the existing knowledge pertaining to luxury brand consumption and a conceptual framework is developed based on the review of literature. India's favorable demographic profile, the growing middle class, high disposable income and young population, has helped the Indian luxury market witness a tremendous growth. The research identifies what drives the luxury brand purchase intention for the Indian consumers amidst this growth and analyses how it differs based on demographic variables such as age, gender and income. Based on the model thus created, the research seeks to segment the Indian luxury fashion brand consumers according to the significant demographic and psychographic variables thus identified. A questionnaire was administered to 250 respondents of different age, income on a Likert scaleand gender groups within the city of Bangalore. The data was then analyzed using correlation, regression, cluster and frequency analysis in SPSS. The functionality is the major value factors effecting purchase intention of Indian luxury fashion consumer. The other identified value factors are correlated to self and others directedness. Age and income also have a significant influence of purchase intention. It was also found that purchase intention varies between different age and income groups. Finally, it was found that Indian consumers can be segmented as Superficial Luxury seekers, Luxury-Indulgers, Luxury-Avoiders, Attention and approval seekers.
Keywords: Luxury brands, Conspicuousness, Uniqueness value, Utility value, Hedonic value, Self-directedness, Purchase Intention
A. and Vinod SharmaS. SureshSchool of Business and Management, Christ University, Bangalore-560 029, India
E-mail: [email protected]
Indian Journal of Ecology (2021) 48 Special Issue (16): 92-99
India is a growing and emerging economy where
aspirations and dreams seem to drive most of the luxury
industry. So is the case with the fashion luxury market in
India. For the super-rich and the aspirants, luxury seems to
be a form of escape, an indulgence or a way to stand out from
the ordinary. They buy luxury because it makes them feel a
certain way (Bain and company 2017). Since the past two
decades the global luxury market has seen a tremendous
growth. The overall luxury market grew by 5% to an
estimated €1.2 trillion globally in 2017. The core market of
personal goods reached an all-time high of €262 billion
boosted by Chinese luxury consumption. Emerging
economies such as China, Brazil and India will now drive the
luxury market with China taking the lead. The growth is
attributed to the changing socio-economic and demographic
factors globally. Shoes, jewelry and bags ranked as the three
fastest-growing categories this year, but apparel, beauty and
watches still account for the bulk of the market. Another key
growth factor for 2017 will help redefine the luxury market the
next decade and beyond is the Millennial State of Mind where
by 2025 Generation Z and Millennial will account for 45% of
the luxury market. In India, the aspirational and young middle
class and their growing 'brand consciousness' is driving the
growth of the luxury market. The Indian luxury market is
about $18.3 billion and is growing at a compounded annual
growth rate (CAGR) of about 25 percent. India's accounts for
1-2% of the global luxury market. However, what
distinguishes luxury from non-luxury products are the
psychological benefits. It is dependent on what runs in the
psyche of the consumer. Today luxury does not just mean
possession but is symbolic of class and status. In today's
times when people have more disposable income than ever,
consumers are willing to splurge money on what will make
them stand out. It evokes exclusivity for them and makes
them feel extraordinary.
Roy 2018) a model of luxury fashion et al ( validate
consumption that integrates the antecedents and
consequences of luxury buying in a developing nation
context. Vigneron and Johnson (2017) explore the factors
that contributes to the perception of luxury created by a
brand. The study argues that 5 underlying dimensions decide
the 'measure of luxury' in a brand. In this study a Brand
Development Index was used to measure the amount of
luxury. In the scale thus developed; uniqueness,
conspicuousness, quality, hedonic and extended-self were
used. Atwal and Williams (2017) talk about the importance of
experiential marketing in luxury brand consumption in
today's times. It states that in the postmodern era where

there is information, communications and branding
revolution, in order to capitalize on the opportunities brand
must use experiential marketing. It is no longer just about the
products but the entire shopping experience that comes with
it. Luxury brands especially must pay attention to these in
order to capitalize on these trends. Customers seek
pleasurable and emotional experiences, and more so when
they purchase luxury goods. Shayan 2017) explore the et al (
underlying motivations for bandwagon luxury brand
consumption among consumers of an emergent market. It
empirically investigates the effects of consumers'
interdependent and independent orientations on their
personality traits, such as conformity, need for uniqueness
and status consumption, which in turn affect their bandwagon
luxury brand consumption. With the growth in luxury
consumption globally, specifically in India, and the immense
business opportunity associated with it, this study is of all the
more relevance. It seeks to gain insights into the factors
leading to luxury brand consumption. Most the previous
research work done in this context ends with the identification
of factors that lead to purchase intention but not particularly in
the Indian context.
MATERIAL AND METHODS
The value factors affecting luxury consumption is an
extensively researched topic. However, value factors in the
Indian context and its relationship with demographics has not
been explored. Not many studies have been done trying to
segment the Indian luxury consumers as well. Based on the
relevant value factors identified, this paper further seeks to
classify the Indian luxury consumers into distinct clusters.
This will help brands to better segment the Indian luxury
consumer and offer a differential value proposition unique to
these segments.
Conceptual framework: This study draws extensively from
extant empirical studies and theories like PAD (Pleasure-
Arousal-Dominance) by Mehrabian (1996), and conspicuous
consumption model by ) for Mann and Sahni (2015
developing a conceptual framework to proposedestablish
relationship of factors such as Conspicuousness,
Uniqueness, Utilitarian, Hedonic, self-directed and others-
directed values to fashion luxury brand purchase intention of
Indian consumers as depicted below:
Hypotheses:
H1: Conspicuousness, Uniqueness, Utilitarian, Hedonic,
self-directed and others-directed has a significant
relationship with consumer's luxury purchase intention
H2: Conspicuousness, Uniqueness, Utilitarian, Hedonic,
self-directed and others-directed has a significant influence
consumer's luxury purchase intention
Fig. 1. Conceptual framework
H3: There is a significant difference in the luxury purchase
intention of consumers of different age groups.
H4: There is a significant difference in the luxury purchase
intention of consumers of different genders.
H5: There is a significant difference in the luxury purchase
intention of consumers of different income groups.
H6: Conspicuousness, Uniqueness, Utilitarian, Hedonic,
self-directed and others-directed are an appropriate criterion
for the segmentation on Indian fashion
Measurement scale: descriptiveAs the research is in nature
the primary data was collected from consumers in a
probabilistic multi stage sampling process with the help of 5-
Point Likert Scale based Questionnaire. Instagrammers
were mainly considered as influencers here and their
followers or respondents who use Instagram and purchase
products based on the influencer's recommendation.
Secondary data is used to understand the self- congruity
theory and understanding of various personality traits. Also,
whether previous literature can provide us with realization on
the feasibility of the study that was gathered through journals
and articles. population comprises of Indian individuals The
aged 18 years old or over, who most likely have an account
on Instagram or have knowledge about Instagram app. non-
probabilistic ing method was deployed convenience sampl
and the data collected online across India. Sample size
considered was 224 as it is adequate to represent the
segment of Instagram. Data used for analysis comprised of
217 respondents as the responses for the questions from
other respondents were either redundant or missing.
Statistical tools: asFactor analysis w used to identify what
value factors impact effect purchase intention and to effective
segment Indian luxury fashion consumers. Correlation and
regression to check the impact of the factors on were used
consumer purchase intention. The test of mean differences
between subgroups in the demographic variables were
tested using independent sample T-test. These tests were
conducted to determine whether or not the subgroups within
93Luxury Brand Consumption and its Impact on Intentions Consumer Purchase

PI=0.474F+0.283OD+0.175SD+0.117I-0.095A
each demographic variable are significantly different in terms
of their value perceptions.
RESULTS AND DISCUSSION
Reliability statistics: Reliability test i.e., the Cronbach's
alpha test for the entire 78 scale variables. was performed
The Cronbach's alpha value should be greater than 0.7, in
this case it is 0.9 which is considered as highly reliable. The
individual element alpha values were also considered. The
Cronbach's alpha for each of the scale variable considered is
above 0.7 hence we can conclude that test is reliable.
Demographic profile of respondents: n this study,I
respondents of varying demographic profiles have been
considered to establish the relationship with purchase
intention of luxury fashion apparel. Firstly, we take into
consideration the age of our respondents, and it can be seen
that majority of our respondents are in the age group of 25-35
(31%), followed by 18-25(28%). However, we have
respondents from all the age groups and hence have a good
representation. The gender distribution of the respondents is
equal from each gender. Similarly, around 47% respondents
were married and rest 53% were single. Majority of the
respondents that is around 50% were from the income group
of 20 Lk and above and rest where from above 10 lk The .
majority of respondents have attained graduation or post-
graduation with 42% and 46% respectively and 12%
respondents had doctorate.
Interrelationship of various factors identified and with
purchase intention using correlation: First the correlation
technique was applied to the different variables to analyze
their relationship with each other and with purchase intention
and the results are as follows:
All the variables under consideration, namely age and
income which are the demographic variables and hedonic,
rarity, conspicuous, functional, self-directedness and other-
directedness value factors which are the psychographic
variables are significantly correlated with the purchase
intention of a customer except gender. It has a significance
value of 0.110 which is greater than 0.05 which is our preset
significance level. All the values are correlation coefficient
are positive which indicates a positive correlation. t is I
observed that although the variables are significant,
variables such as hedonic, conspicuous and rarity values are
correlated with self-directedness and others-directedness.
Rarity value and hedonic value seem to be moderately
positive correlated with self-directedness and rarity and
conspicuous value seem to be moderately positively
correlated with others-directedness. Rarity value, hedonic
value and conspicuous value seem to be highly positively
correlated to each other. Demographic factor age seems to
be negatively correlated to purchase intention.
Psychographic factor functional value has the highest
positive correlation with purchase intention indicating that if
the consumer feels like the product is better functionally as in
quality, texture design than other products, then the purchase
intention increases. As the functional value perception
increases, the purchase intention increases. The other two
psychographic value factors which significantly correlate to
purchase intention are self-directedness and others-
directedness. The psychographic variable self-directedness
is in turn moderately positively correlated to hedonic and
rarity value factors. This indicates that as hedonic and rarity
values increase for the customer, self-directedness also
increases. The psychographic variable others-directedness
is in turn moderately positively correlated to rarity and
conspicuous value factors. Income is positively significantly
correlated to functional value and hedonic value factor.
Gender is not significantly correlated any factor indicating
that no value factor is gender specific. Age is positively
correlated to conspicuous value factor which indicates older
people would prefer more conspicuous products.
Impact of various identified factors on purchase
intention using regression analysis: From the model
summary table, it is seen that the R square value is 0.559,
which indicates that 55.9% of the variation in purchase
intention can be explained by the variables such as age,
income, gender (demographics) and functional, rarity,
conspicuous, hedonic, self-directedness and others-
directedness (psychographics). The significant variables are
age, income (demographics) and functional, self-
directedness, and others-directedness value factors
(psychographics). Functional value is the most significant
with the highest co-efficient value (0.474) indicating more
influence on purchase intention. The next biggest influential
variable is another directedness (0.283), followed by self-
directedness (0.175). Demographic factor income has a co-
efficient of 0.117 and age has a co-efficient of -0.095. The
entire variable except age has a positive influence indicating
as age increases PI decreases. With an increase in all other
significant variables, P increases.urchase intention
Thus, the regression equation becomes,
Where PI=Purchase intention, F=Functional value
factor, OD=Other-directedness, SD=Self-directedness,
I=Income, A=Age
Therefore, the model can be represented as follows:
Analysis of variations in purchase intention in different
age groups using ANOVA: In the first set, we are testing the
analysis of variation in purchase intention with the different
age groups. The results confirm that the variation in purchase
94 A. and Vinod SharmaS. Suresh

Fig. 2. Regression model
intention between different age groups is significant with a p-
value of 001. It is also identified that as age increases, the
purchase intention is decreasing. Hence, we reject null
hypothesis and accept alternate hypothesis that there is a
significant variation in the purchase intention between
different age groups.
Analysis of ariations in purchase intention between v
genders using ANOVA: In the second test we analyze the
variation in purchase intention between the two genders.
From the analysis we found that the variation is insignificant
as p-value is greater than 0.05. Hence, the null hypothesis
that no significant difference exist in the purchase intention
between different genders is accepted.
Analysis variation in purchase intention in different
income groups using: In the third test, we analyze the
variation in the purchase intention between different -income
groups. The results confirm that there is a significant
influence of income group and purchase intention as the p-
value is less than 0.05 and it is significant. Hence, the null
hypothesis can be rejected and alternate hypothesis can be
accepted that there was significant differen in the purchase ce
intention of people of different income groups.
Results from cluster analysis: descriptive and Cluster 1
has higher frequency of people who ranked hedonic and self-
directedness value high. To an extent they ranked
conspicuous and others-directedness value factors high too.
However, they rank low on the functional value factor. This
indicates that they do not purchase luxury purchase luxury
products because they perceive them as having higher
quality or functionality but maybe for their aesthetics. They
however exhibit the highest purchase intention amongst all
the four clusters. The second cluster has ranked hedonic and
rarity value factors very high. They rank high on self-
directedness and functionality as well. This indicates they are
more concerned about the superiority and rarity of the
product and the pleasure it gives them to possess such an
item. Owning the rare and superior product boosts their self-
image. They however rank only third in the purchase
intention. The third cluster consists of a group with a lowest
purchase intention. They rank low on all the value factors.
Luxury goods do not seem to impact their self-image or
social-image. The fourth cluster ranks high functional value
factor very high. It also ranks rarity and conspicuous value
factors high. Other-directedness is also high for this group of
people. This seems to indicate that owning a luxury product
that is superior functionally and is rare and conspicuous
boost their social-image.
Analysing using cluster analysis demographics : Cluster
1 seems have people from different age groups but more of to
the older population. They are mostly graduates staying in
metro or urban cities. They have mediocre incomes. Cluster
2 seems to consist of people from the youngest age groups,
who are well, educated (mostly post-graduates). They are
Cluster number of case Frequency Percent Valid percent Cumulative percent
1 Valid Female 21 44.7 44.7 44.7
Male 26 55.3 55.3 100.0
Total 47 100.0 100.0
2 Valid Female 34 44.7 44.7 44.7
Male 42 55.3 55.3 100.0
Total 76 100.0 100.0
3 Valid Female 26 60.5 60.5 60.5
Male 17 39.5 39.5 100.0
Total 43 100.0 100.0
4 Valid Female 43 51.2 51.2 51.2
Male 41 48.8 48.8 100.0
Total 84 100.0 100.0
Table 1. Analyzing demographic- Gender
95Luxury Brand Consumption and its Impact on Intentions Consumer Purchase

earning well and hence would have a better disposable
income. They are mostly single and live in the metro /urban
cities.
Cluster 3 seems to comprise on an older population with
lower incomes. They are mostly married and live in the
metro/urban cities. They are graduates or senior secondary
education holders. Cluster 4 seems to comprise of older and
well-to do married adults who are highly educated. They live
with their families in the semi-urban or urban cities.
Thus, the null hypothesis (H ) can be partially accepted 0
wherein functional, self-directedness and others-
directedness can be used as an appropriate criterion to
segment the clusters, where functional value factor, self-
directedness and others-directedness make appropriate
criteria for segmentation.
Functionality , self-directedness and others- value
directedness value factors and Income and Age
demographic factors are the factors affecting luxury
purchase Intention in the Indian context. ll the However, a
variable except age ha a positive influence indicating as s ve
age increases P I decreases. With an purchase intention
increase in all other significant variables, PI increases.
Psychographic factor functional value has the highest
positive correlation with purchase intention indicating that if
the consumer feels like the product is better functionally as in
quality, texture design than other products, then the purchase
intention increases. As the functional value perception
increases, the purchase intention increases. The other two
psychographic value factors which significantly correlate to
purchase intention, are self-directedness and others-
directedness. Thus, if the consumer feels like the product is
Cluster number of case Frequency Percent Valid percent Cumulative percent
1 Valid Single 25 53.2 53.2 53.2
Married 22 46.8 46.8 100.0
Total 47 100.0 100.0
2 Valid Single 42 55.3 55.3 55.3
Married 31 40.8 40.8 96.1
widow/widower 3 3.9 3.9 100.0
Total 76 100.0 100.0
3 Valid Single 16 37.2 37.2 37.2
Married 26 60.5 60.5 97.7
widow/widower 1 2.3 2.3 100.0
Total 43 100.0 100.0
4 Valid Single 45 53.6 54.2 54.2
Married 37 44.0 44.6 98.8
widow/widower 1 1.2 1.2 100.0
Total 83 98.8 100.0
Missing System 1 1.2
Total 84 100.0
Table 2. Analyzing demographic- Marital status
consistent with his/her self-image (self-directedness), the
purchase intention increases. If the consumer feels like the
products is consistent with his social image (other-
directedness), then also purchase intention increases.
The psychographic variable self-directedness is in turn
moderately positively correlated to hedonic and rarity value
factors. This indicates that as hedonic and rarity values
increase for the customer, self-directedness also increases.
Thus, if the consumer is thrilled to buy or own a luxury product
and collecting them gives him pleasure, his self-image also
increases. The psychographic variable others-directedness
is in turn moderately positively correlated to rarity and
conspicuous value factors. This indicates that as
conspicuous and rarity value increases, others-directedness
also increases. Thus, if a person likes owning a rare or an
obviously expensive or famous product, their other-
directedness value also increases.
Income is positively significantly correlated to functional
value and hedonic value factor. Thus, implies as income
increases more of functional and hedonic value influences
their purchase intention. Gender is not significantly
correlated any factor indicating that no value factor is gender
specific. Age is positively correlated to conspicuous value
factor which indicates older people would prefer more
conspicuous products. it can be rarity Hence, inferred that
and hedonic are positively correlated to self-directedness
and rarity and conspicuousness are positively correlated to
others-directedness. Income is positively correlated to
functional and hedonic factors while age is correlated to
conspicuous factor.
Managerial implications: The managerial implications in
96 A. and Vinod SharmaS. Suresh

Cluster number of case Frequency Percent Valid percent Cumulative percent
1 Valid 18-25 11 23.4 23.4 23.4
25-35 13 27.7 27.7 51.1
35-45 11 23.4 23.4 74.5
45-55 10 21.3 21.3 95.7
>55 2 4.3 4.3 100.0
Total 47 100.0 100.0
2 Valid 18-25 28 36.8 36.8 36.8
25-35 29 38.2 38.2 75.0
35-45 7 9.2 9.2 84.2
45-55 8 10.5 10.5 94.7
>55 4 5.3 5.3 100.0
Total 76 100.0 100.0
3 Valid 18-25 14 32.6 32.6 32.6
25-35 6 14.0 14.0 46.5
35-45 12 27.9 27.9 74.4
45-55 7 16.3 16.3 90.7
>55 4 9.3 9.3 100.0
Total 43 100.0 100.0
4 Valid 18-25 17 20.2 20.2 20.2
25-35 30 35.7 35.7 56.0
35-45 20 23.8 23.8 79.8
45-55 12 14.3 14.3 94.0
>55 5 6.0 6.0 100.0
Total 84 100.0 100.0
T able 3. Analyzing demographic- Age
Cluster number of case Frequency Percent Valid percent Cumulative percent
1 Valid senior secondary 2 4.3 4.3 4.3
Graduation 23 48.9 48.9 53.2
post-graduation 22 46.8 46.8 100.0
Total 47 100.0 100.0
2 Valid Secondary 1 1.3 1.3 1.3
senior secondary 3 3.9 3.9 5.3
Graduation 32 42.1 42.1 47.4
Post-graduation 39 51.3 51.3 98.7
Doctorate 1 1.3 1.3 100.0
Total 76 100.0 100.0
3 Valid Secondary 5 11.6 11.6 11.6
Senior secondary 6 14.0 14.0 25.6
Graduation 17 39.5 39.5 65.1
Post-graduation 13 30.2 30.2 95.3
Doctorate 2 4.7 4.7 100.0
Total 43 100.0 100.0
4 Valid Secondary 1 1.2 1.2 1.2
Senior secondary 3 3.6 3.6 4.8
Graduation 34 40.5 41.0 45.8
Post-graduation 40 47.6 48.2 94.0
Doctorate 5 6.0 6.0 100.0
Total 83 98.8 100.0
Missing System 1 1.2
Total 84 100.0
Table 4. Analyzing demographic- Education
97Luxury Brand Consumption and its Impact on Intentions Consumer Purchase

Cluster number of case Frequency Percent Valid percent Cumulative percent
1 Valid Metro 22 46.8 46.8 46.8
Urban 15 31.9 31.9 78.7
Semi-urban 5 10.6 10.6 89.4
Rural 5 10.6 10.6 100.0
Total 47 100.0 100.0
2 Valid Metro 31 40.8 40.8 40.8
Urban 34 44.7 44.7 85.5
Semi-urban 5 6.6 6.6 92.1
Rural 6 7.9 7.9 100.0
Total 76 100.0 100.0
3 Valid Metro 13 30.2 30.2 30.2
Urban 18 41.9 41.9 72.1
Semi-urban 7 16.3 16.3 88.4
Rural 5 11.6 11.6 100.0
Total 43 100.0 100.0
4 Valid Metro 28 33.3 33.7 33.7
Urban 37 44.0 44.6 78.3
Semi-urban 11 13.1 13.3 91.6
Rural 7 8.3 8.4 100.0
Total 83 98.8 100.0
Missing System 1 1.2
Total 84 100.0
Table 5. Analyzing demographic- Residence
Cluster number of case Frequency Percent Valid percent Cumulative percent
1 Valid <90000 11 23.4 23.4 23.4
90000-200000 9 19.1 19.1 42.6
200000-500000 9 19.1 19.1 61.7
500000-1000000 9 19.1 19.1 80.9
>1000000 9 19.1 19.1 100.0
Total 47 100.0 100.0
2 Valid <90000 16 21.1 21.1 21.1
90000-200000 11 14.5 14.5 35.5
200000-500000 19 25.0 25.0 60.5
500000-1000000 23 30.3 30.3 90.8
>1000000 7 9.2 9.2 100.0
Total 76 100.0 100.0
3 Valid <90000 18 41.9 41.9 41.9
90000-200000 5 11.6 11.6 53.5
200000-500000 8 18.6 18.6 72.1
500000-1000000 6 14.0 14.0 86.0
>1000000 6 14.0 14.0 100.0
Total 43 100.0 100.0
4 Valid <90000 17 20.2 20.2 20.2
90000-200000 13 15.5 15.5 35.7
200000-500000 23 27.4 27.4 63.1
500000-1000000 15 17.9 17.9 81.0
>1000000 16 19.0 19.0 100.0
Total 84 100.0 100.0
Table 6. Analyzing demographic- Income
98 A. and Vinod SharmaS. Suresh

this case are very high. Marketers for a better understanding
of their Indian consumers and offer a unique proposition that
appeals to them. From this study the gain a better marketers
understanding of the Indian luxury consumer which can be
aligned to their strategies. By targeting the younger
generation with more disposable incomes and offering
functionally superior products, they can have products that
appeal to the customers who provide them better margins.
They can also design specific products to appeal to each of
the segments identified in this study.
CONCLUSIONS
The study has given insights into the Indian luxury
fashion consumers and their purchase intention. Marketers
could focus on the younger more affluent population on India
and offer unique proposition to cater to their needs. They
shouldn't ignore either gender as the purchase intention
between males and females are not significantly different in
the study. The first, Second and Fourth clusters of consumers
identified in the study has unique characteristics and profiles
which can be used to developed offerings unique to each
cluster or segment. The second segment of consumers are
the most affluent of the lot but with low purchase intention.
This segment must be targeted by the marketers as it exhibits
greater potential.
REFERENCESAtwal G and Williams A 2017. Luxury brand marketing: The
experience is everything! Advances in Luxury Brand Management 6(3): 43-57.
Bian Q and Forsythe S 2012. Purchase intention for luxury brands: A cross cultural comparison. Journal of Business Research 65(10): 1443-1451.
Bothra N 2015. Luxury, luxury brand and luxury market in India: From class consumers to closet consumers. IOSR Journal of Business and Management (10): 18-27.15
Catry B 2003. The great pretenders: The magic of luxury goods. Business Strategy Review 14(3): 10-17.
Dubois B and Duquesne P 1993. The market for luxury goods: Income versus culture. (1): European Journal of Marketing 2735-44.
Dubois B and Czellar S 2002. Prestige brands or luxury brands? An exploratory inquiry on consumer perceptions. Archive ouverte UNIGE 06: 1-10.
Eng T and Bogaert J 2010. Psychological and cultural insights into consumption of luxury Western brands in India. Journal of Customer Behaviour 9(1): 55-75.
Fionda AM and Moore CM 2009. The anatomy of the luxury fashion brand. (5-6): 347-363. Journal of Brand Management 16
Godey B, Pederzoli D, Aiello G, Donvito R, Chan P, Oh H and Weitz B 2012. Brand and country-of-origin effect on consumers decision to purchase luxury products. Journal of Business Research 65(10): 1461-1470.
Han YJ, Nunes J and Dreze X 2010. First impressions: Status signaling using brand prominence. Dataset. www.yumpu.com.
p. 1-49 doi:10.1037/e621092012-184
Hung K, Chen AH, Peng N, Hackley C, Tiwsakul RA and Chou C 2011. Antecedents of luxury brand purchase intention. Journal of Product & Brand Management 20(6): 457-467.
Isaac C, Ian P, Calvin C and Anwar SS 2015. Antecedents and outcomes of brand prominence on willingness to buy luxury brands. (4): Journal of Fashion Marketing and Management 19402-415.
Kapferer J 2012. Abundant rarity: The key to luxury growth. Business Horizons 55(5): 453-462.
Kastanakis MN and Balabanis G 2012. Between the mass and the class: Antecedents of the “bandwagon” luxury consumption behavior. (10): 1399-1407. Journal of Business Research 65
Khare A 2014. How cosmopolitan are Indian consumers? A study on fashion clothing involvement. Journal of Fashion Marketing and Management 18 (4): 431-451.
Kim AJ and Ko E 2012. Do social media marketing activities enhance customer equity? An empirical study of luxury fashion brand. Journal of Business Research 65(10): 1480-1486.
Marie-Cécile C and Coudriet R 2013. Brand social power in luxury retail: Manifestations of brand dominance over clients in the store. International Journal of Retail and Distribution Management 41 (11/12): 869-884
Phau I and Prendergast G 2000. Consuming luxury brands: The relevance of the 'Rarity Principle'. Journal of Brand Management. 8(2): 122-138.
Roy S, Jain V and Matta N 2018. An integrated model of luxury fashion consumption: Perspective from a developing nation. Journal of Fashion Marketing and Management: An International Journal 22(1): 49-66.
Shayan S, Aneela M, Akram MS and Chakrabarti R 2017. Do luxury brands successfully entice consumers? The role of bandwagon effect. (4): 498-513, International Marketing Review 34
Shukla P 2011. Impact of interpersonal influences, brand origin and brand image on luxury purchase intentions: Measuring inter-functional interactions and a cross-national comparison. Journal of World Business 46(2): 242-252.
Shukla P and Purani K 2012. Comparing the importance of luxury value perceptions in cross-national contexts. Journal of Business Research 65(10): 1417-1424.
Truong Y, Mccoll R and Kitchen PJ 2009. New luxury brand positioning and the emergence of Masstige brands. Journal of Brand Management 16(5-6): 375-382.
Truong Y, Simmons G, Mccoll R and Kitchen PJ 2008. Status and conspicuousness: Are they related? Strategic marketing implications for luxury brands. Journal of Strategic Marketing 16(3): 189-203.
Tynan C, Mckechnie S and Chhuon C 2010. Co-creating value for luxury brands. (11): 1156-Journal of Business Research 631163.
Vigneron F and Johnson LW 1999. A review and conceptual framework of prestige seeking consumer behavior. Academy of Marketing Science Review 1 : 1-15.
Vigneron F and Johnson LW 2017. Measuring perceptions of brand luxury. 199-234. Advances in Luxury Brand Management : 1
Wiedmann K, Hennigs N and Siebels A 2009. Value-based segmentation of luxury consumption behavior. Psychology and Marketing 26(7): 625-651.
Wilcox K, Kim HM and Sen S 2009. Why do consumers buy counterfeit luxury brands? (2): Journal of Marketing Research 46247-259.
Wong NY and Ahuvia AC 1998. Personal taste and family face: Luxury consumption in confucian and western societies. Psychology and Marketing 15(5): 423-441.
Received February, 2021; Accepted 06 July, 202119
99Luxury Brand Consumption and its Impact on Intentions Consumer Purchase

Job Portals ersus Social Networking Sites: Job Seekers' VPerceptions
Manuscript Number: S-683NAAS Rating: 5.79
Abstract: The internet has now become one of the important platforms for business organizations for e-recruitment techniques. The development of online application forms within the web sites of the organizations has revolutionized the ways and means of traditional recruitment techniques. Apart from setting up of the online application forms on different organisations' web sites, different portals and social networking sites too have emerged with varied services. The findings were taken from major job portals and professional networking sites, all of which are immensely popular amongst the job seekers. Data was collected from 120 Indian youth. Exploratory factor analysis, regression analysis and chi-square tests were used to meet the objectives. Findings reveal that not only do different sites approach customers in different ways, through their web site content, navigational approaches and the nature of services, customers too change their approaches while browsing through different sites.
Keywords: Online consumer behaviour, Social networking sites, Perceptions, Web site navigations, Web site portals, e-recruitment
Anagha ShukreSymbiosis Centre for Management Studies, Noida-201 301, India
E-mail: [email protected]
Indian Journal of Ecology (2021) 48 Special Issue (16): 100-107
In today's changing times, the business organizations
use internet for e-recruitment techniques (Boydell 2002).
According to Capelli (2001), internet has radically changed
the recruitment processes. A survey amongst US companies
by Chapman and Webster's (2003) revealed that e-
recruitment was adopted to improve efficiency, reduce costs
and to increase the scope of applications. Several studies
have focused on the benefits of using internet and comparing
it to the traditional recruitment ways (Feldman et al 2002).
Recruitment is an integral fragment of human resource
development (Barber 1998). Both speed and accuracy
details are requisites for carrying out efficient and effective
recruitment processes (2013). Online recruitment has
boomed because both the organizations and job seekers are
using it extensively (Parry and Wilson 2008). Schreyer and
McCarter (1998) in their study found that the Indian agencies
considered the online recruitment processes both efficient
and effective in finding the 'right' candidates.
As the popularity and usage of internet grew amongst
business and non-business users alike, portals also swelled
in size, variety of information and content and in their
technology usage (Tong 2009). These portals came to be
regarded as the 'gateways to network accessible resources'
(Pin, Laorden, and Diez 2001). Zusman and Landis (2002)
throw light on the applicant's preferences for web-based job
advertisements. Cober et al mention the effect of display
features on a web site to gauge and increase the attention
span of the job seekers (2002). Many recruiters also use
social networking sites in the hiring processes (2013). The
emergence of job portals is a relatively new phenomenon,
and maybe because of this reason, limited information on
users' perceptions and preferences could be known in the
Indian context. Review of literature revealed variables which
would affect the users' perceptions for technology based
recruitment. According to Dave Chaffey (2006), the quality
and features on a web site are determined by its designs - a
user centric design or a marketing led design. The objectives
of these designs are different, as the users follow a different
path of navigation. It is important to understand the value
propositions of the portals to identify users' browsing habits
over different portals, which would help them in designing
their web sites.
Job portals create online confluence and a meeting
environment for candidates, employers and mediating
agencies who aim at filling different job openings. Almost all
job portals are free for jobseekers. A few of their services are
paid. Also, the various job portals tend to differentiate on
these services which may include ease of navigation on their
web sites, user friendliness, and ability to find the right
information which the users want through these services,
leading to their satisfaction (Chen 1999; Chen 2000; Lu
2001). What makes a job seeker choose from these job
portals? Many experts feel that professional networking sites
like LinkedIn have given strong competition to the portals like
Naukri.com, Monster.com, Timesjobs.Com and the like. Very
little literature could be identified that dealt with users'
perceptions and preferences for the job portals and the social
networking sites for job alerts.

Numerous studies have been conducted in the past that
have been able to identify certain features a web site/ portal
must possess in order to ease out a user's navigation across
that portal and help in providing information, the user looks
for. This study contributes to the domain knowledge by
showcasing that the nature of the information display on a
website also changes a consumer's navigation habits.
Secondly, with the emergence and extreme use of social
networking sites and job portals, the study aims to study
through consumers' perceptions the differentiating factors
each one offers to meet out their needs. We have been able
to identify very few studies in this area. Young job seekers are
highly technology-savvy, ambitious and aspiring. They are
more likely to consume services offered by job portals and
SNSs in their job aspirations and career growth plans.
Recruitments through the online mediums either directly
by the organisations or through third parties like job portals
require a constant up gradation and updation in their systems
to meet the needs of the job seekers(Ganesan et al 2018).
This study thus has three objectives – 1. To identify factors
which determine users' and job aspirants' perceptions about
job portals and social networking sites, 2. To understand the
value propositions of the portals to identify users' browsing
habits over different portals and 3. To analyse the role of
demographic factors particularly age and the background
study on the choice of users for job portals.
MATERIAL AND METHODS
The study follows an exploratory cum descriptive
research design and was organised and carried out in two
phases. The first phase of the study involved a
comprehensive review of existing literature on e-recruitment
practices along with web interactivity. This was done to
identify the various dimensions related to browsing habits on
different portals and social networking sites (SNS) and also
to understand the usefulness of these web sites to the job
seekers. From the literature review, a list of 17 antecedent
factors was put across for discussions to panel members.
The six-member panel constituted both from the field of
education and the industry. Based on their feedback, a few
minor changes in language were made and these 17
variables for the study were finalised. These variables were
put into statements. The statements, which were carefully
considered to gauge the perceptions of users towards both
job portals and social networking sites, were based on the
Likert scale, where “1” meant strongly disagree and “5”
strongly agree. The well-structured questionnaire was
divided into two parts – one part included questions about the
users' demographical profile while the second part contained
a list of the 17 scaled items. Pre-testing of the questionnaire
was carried out, which was found to be valid and reliable. The
study was conducted on the internet users who have an
account with any of the social networking sites and/or have
used/currently too are using a job portal. Thus, there are the
sample respondents.
The second phase, or descriptive stage, of the study
involved the collection of data from the desired sample, which
comprised of individuals above the age of 18 years, with
personal access to the internet. The questionnaire was
distributed to 120 individuals in Delhi/NCR, by using
convenience sampling technique. Before sharing the
questionnaire, it was confirmed that the respondent had
access to the internet. The sampling extent defined for the
study was any user who was registered on a job portal as well
as a social networking site. As specified by Bryant and
Yarnold (1995) and Hair et al( 2006) the number of cases
should be at least five times the number of variables
(attributes, items), if exploratory factor analysis is used. The
minimum sample size required for the study was 85, as
seventeen variables were included in the study. The sample
size for this study was taken at 120 to prevent shortcomings.
After data editing, 109 questionnaires were taken further for
analysis. A rank order scale was used to determine the type of
job portals and the social networking sites for the study from
an already available list.
Table 1 Items taken for the study.
RESULTS AND DISCUSSION
Demographic information was collected from the
respondents and was used to develop their profile by using
simple frequency (Table 2). The data related to perceptions of
the users about job portals as well as social networking sites'
use for recruitment was analysed with the help of data
reduction technique, factor analysis using SPSS. The
notable demographic features of the sample bear a close
resemblance to the population. The respondents chosen for
the study were young, techno-savvy and well aware of the
uses and benefits of portals and SNSes.
Factor analysis: After data cleaning and editing, 109
questionnaires were included for further analysis. The
calculated Cronbach Alpha at above 0.7 for 17 statements
shows data reliability. KMO measure of sampling adequacy
(MSA) at 0.627 (Hair et al 1995, Boyd et al 2002, Malhotra
2004), indicating that the sample is appropriate. The overall
significance tested with Bartlett test of Sphericity (approx.
Chi-square = 1910.82 significant d = 0.00) validates the
factor analysis of data set. Varimax rotation was made use of
for extracting factors. The factors that had Eigen values
greater than one were considered and all the other factors
were disregarded. The total variation for the study accounts
101Job Portals ersus Social Networking SitesV

Variables Literature description
1. Good reach EPS (1999), Lievens and Harris (2003), Galanaki (2002), Arthur (2001), Chapman and Webster (2003), Kerrin and Kettley (2004)
2. Eye-catching graphics on the web site Wolfinbarger and Gilly (2003)
3. Layout and design of a website Wolfinbarger and Gilly (2003)
4. Vast portfolio of products and services Szymanski and Hise (2000)
5. Information expanse Kim and Stoel (2004), Lievans and Harris (2003), Cober et al (2000), Falke (2003)
6. Expanse of information available Kim and Stoel (2004),Gillespie et al (1999)
7. Usability of the website Aren et al (2013); Kim and Stoel (2004)
8. Portal with faster navigation (speed) Aren et al (2013)
9. Effectiveness of search process (accurate) Aren et al (2013)
10. Easy access to the portal 24*7(download speed and visibility) Aren et al (2013), EPS (1999)
11. Saves cost EPS (1999),Casper (1985), Lievens and Harris (2003), Cober et al (2000), Falke (2003), Hays (1999), Galanki (2002),Cappelli (2001), Arthur (2001),Bartram (2000)
12. Saves time EPS (1999),Casper (1985),Lievens and harris (2003),Cober et al (2000), Falke (2003), Hays (1999),Galanki (2002),Cappelli (2001), Arthur (2001), Bartram (2000)
13. Convenience Arthur (2001)
14. Company's Image Galanki (2002), Greengard (2012)
15. Technology with services Jobvite (2012),Singh and Finn (2003)
16. Continued intention to use Huang,Pan,Hsieh (2012)
17. Satisfaction Szymanski and Hise (2000), Lin et al (2004), Anderson and Srinivasan (2003)
Table 1. Variables identified from literature survey
at 66.37% which is a good extraction as it was able to reduce
seventeen items to four factors. The remaining 33.63%
information content for choice variables was lost.
It can be inferred from the factor loadings for each
variable (greater than 0.5, Nunnaly, 1974) and cross loadings
less than 0.4 (Hair et al 2010) that all the variables were well
explained by derived factors (Table 3). Communalities for the
variables which were higher than 0.5 were taken up for
further analysis. Variable V11 (communalitiy.499) (Online job
sites provide more satisfaction than offline services, as
provisions can be accommodated, for example to withdraw
the resume from the applied jobs) and variable V10
(communality .498) (Online job sites are easy to use because
they facilitate job search using keywords, specialization and
location) were dropped from further analysis. The variables
with similar and overlapping measurement characteristics
were grouped together. Thus, four important factors, namely
- technical features of job portals, personalized and
customized products and services, responsiveness, saves
time and cost emerged from the study (Table 3).
Factor 1- Technical features of the job portal: This factor
includes variables namely online job sites show quick results
because of quality of information displayed and the scope of
information displayed. Online job sites have a vast portfolio
of products and services. Online job sites provide more
satisfaction than offline services, as provisions can be
accommodated, e.g. (to withdraw the resume from the
applied jobs) and have eye catching graphics and display
content with neatness and clarity. Online job sites have a
crystal clear web site design and layout. Online job sites have
quality job listings, thus bettering their image.
Factor 2- Personalized and customised products and
services: This factor comprises of customized feedback and
updates on submitted applications. The portals provide easy
access to companies and are convenient to use, as they help
to locate the desired job. Online job sites serve technology
with services like resume building, have provision to view
status of jobs one has applied to etc. Value-added services
such as tips for writing cover letters, designing resume, and
"do's and don'ts" of interviews catch the attention of
jobseekers and hence are included by many job portals in
their product attributes. “User friendliness, information
provision, and website usability are amongst the most
prevalent factors influencing perceptions of job seekers in an
online environment”, (Cober, Brown, Levy, and Keeping
2003, Derous et al 2004, Sylva and Mol 2009).
102 Anagha Shukre

Attribute Interval slabs Frequency
Age 16-25 54
26-30 38
31-35 13
More than 35 4
Total 109
Gender Men 57
Women 52
Total 109
Occupation Self-Employed (own business) 4
Government employee 8
Unemployed 47
Employed in a Private firm 50
Total 109
Annual Household Income
Less than 3 lakhs 41
3.1-5 lakhs 21
5.1-7 lakhs 32
Above 7 lakhs 15
Total 109
Educational Background(Graduating Stream)
Science (including pharmacy) 7
Management and Media 64
Engineering (including architecture) 29
Others (commerce, CA, law) 9
Total 109
Using Services
Paid 70
Unpaid 39
Total 109
Table 2. Demographic profile of the respondents
Factor 3- Responsiveness: This factor includes variables
namely – online job sites show a neat customised and
personalized services like email alerts, as per the needs.
When compared to offline, online searches have a higher
continued intention to use, and one gets a company
response very fast when using job sites for the search
process at the convenience of the user.
Factor 4- Saves time and cost: This factor includes items
like – searching for a job online is an effective way of saving
costs, time and has a high penetration level in job market.
Regression analysis: To identify the most preferred type of
job sites (whether a portal or a SNS) and also to find the most
important search options when browsing on these sites, six
items namely job title, eligibility criterion, location, name of
the company, experience needed and salary range were
taken into consideration. These items were obtained, after
the discussion with the panel members (Table 4, 5).
For job portal 1: The attention of an individual towards the
following key items on this portal are job title (0.07%) , name
of the company (6.0% 0, requisite experience (13.1%) and
attention to salary (39.7%). Sparse attention is paid to the
skills required and to the job location.
For Job portal 2: The aspirant's attention includes job title
(8.5%), requisite experience (4.5%) and attention to salary
(26.8%).
In contrast to the browsing behaviour of the candidates
on portal 1, the job seekers on portal 2 pay less attention to
skills required, location and name of the company.
For job portal 3: The behaviour is different. The user's
attention on this portal to name of the company (17.7%) and
salary (1.5%).
Seemingly, less attention is given to job title, skills
required, job location and requisite experience. However,
there is a wide contrast between browsing of jobs on SNSes
and portals. Browsing habits through the social networking
site (SNS1) are different from a job portal. This social
networking site was taken up for the study because of its peer
recommendations, popularity and huge fan following. The
visitors pay less attention to location and salary (Table 5).
An individual, looking for a job on SNS1 the aspirant's
attention include job title (24.2 %), skills requested (15.9%),
name of the company (22.5%) and requisite experience (0.9)
On SNS2, another networking site, the attention drawn
is on desired skills (9.5%) and company's name (22%)
The users pay limited attention to job title, location,
required experience and salary offered. Thus, we observe
that users to shift their attention to different features, while
browsing through different portals as well as different social
networking sites. Is it done on purpose by web site designers,
who aim to highlight certain basic differentiators on the
websites as an integrated communication tool, as is
proposed by the organisations? Chi Square Tests: Chi-
square tests were performed between graduation stream
and the number of career opportunities received from the
portal to pinpoint the role of education on the choice for job
portals.
H0: The graduating stream is not dependent on the number
of career opportunities received from the portal.
H1: The graduating stream is dependent on the number of
career opportunities received from the portal.
The chi-square at 95% significance level is 16.919 which
is greater than the calculated value of 6.037. Thus, Null
hypothesis (H0) is not rejected. It can be interpreted that the
golden opportunities presented by portals to the users are not
dependent on their graduating streams. Also, 68%
respondents agree that they were contacted by the listed
organisations through portals notwithstanding their
educational backgrounds.
103Job Portals ersus Social Networking SitesV

Variables Components
Factor 1 Technical features
Factor 2 Personalized and customised
products and services
Factor 3 Responsiveness
Factor 4Saves time and cost
Variance explained and eigen values 24.521, 2.452 19.318, 1.932 13.046, 1.305 11.452, 1.14
V1-Searching for a job online is cost effective. .756
V2-Online job search saves time. .809
V3- Online job sites have a high reach. .516
V4-Online job sites show prompt and quick results because of quality of information displayed.
.675
V5-Online job sites are reliable and trustworthy because of scope of information displayed.
.794
V6-Online job sites have a vast portfolio of products and services.
.749
V7-Online job sites provide easy access to companies.
.681
V8-Online job sites are convenient as they help to locate the desired job.
.636
V9-Online job sites serve technology with services like resume building, have provision to view status of jobs one has applied to etc.
.808
V12-Online job sites have eye catching graphics and display content with neatness and clarity.
.766
V13-Online job sites have a crystal clear web site design and layout.
.815
V14-Online job sites have quality job listings, thus bettering their image.
.642
V15-Online job sites show a neat customised and personalized services like email alerts, as per the needs.
.566
V16-When compared to offline, online searches have a higher continued intention to use.
.857
V17-One gets a company response very fast when using the job sites for the search process.
.763
Table 3. Factor analysis rotated component matrix
Intercept Job Portal 1 Job Portal 2 Job Portal 3
Coefficients Standard error Coefficients Standard error Coefficients Standard error
.809 .378 2.163 .321 2.822 0.303
Job title .0007 .111 0.085 0.094 -0.011 0.089
Eligibility criterion -0.103 .147 -0.068 .124 -0.115 0.117
Preference for location -0.116 .103 -0.177 .087 -0.122 0.082
Name of the company 0.060 .123 -0.056 .105 0.177 0.099
Experience required 0.131 .096 0.045 0.081 -0.094 0.076
Salary range 0.397 .116 0.268 0.098 0.115 0.093
Table 4. Regression table for job portals
In order to understand whether age of an aspirant has
any influence on the number of these job sites, chi-square
tests were performed.
H0: Age is not dependent on the number of job sites, a
candidate uses.
H1: Age is dependent of the number of job sites, a candidate
uses.
The tabulated value of chi-square at 95% significance
level is 15.507 which is smaller than the calculated value of
18.65. Thus, Null hypothesis (H0) is rejected. It can be
104 Anagha Shukre

SNS 1 SNS 2
Intercept Coefficients Standard error Coefficients Standard error
1.835 0.402 4.539 0.453
Job title 0.242 0.118 -0.002 0.133
Eligibility criterion 0.159 0.156 0.094 0.176
Preference for location -0.155 0.109 -0.062 0.123
Name of the company 0.225 0.131 0.240 0.148
Experience required 0.008 0.101 -0.045 0.115
Salary range -0.043 0.123 -0.552 0.139
Table 5. Regression table for SNS (social networking sites)
interpreted that the possibilities of a person using a specific
number of sites for seeking jobs largely depends on his/her
age. The survey reveals that 67% of the respondents use 2 to
5 such websites and 62% of the respondents who use 2 to 5
websites lie in the age group of 21-30 years.
There seems to be no gender difference of opting for
using paid and not using paid services. Also, the expectations
were met in almost 63.5% of respondents using paid services
with respect to job procurements, while only 51.2% of
respondents not availing paid services were able to meet
their expectations.
Internet, is a faster tool for carrying out recruitment
processes than print advertisements (Muduli and Trivedi
2020). It is evident from the study that different sites attempt
to grab the attention of its visitors in different and unique
ways. The five sites taken for the study have dissimilar
methods of controlling the user interface. Job portal 1 is
distinctive in offering a clean, well-organised and clear
communicative site. It offers services in resume building. The
portal seeks information about the income levels of the
candidates and their co-workers. Portal 2 sieves job offers on
the details of the candidates and proffers resources like
designing a professional resume, drafting a covering letter,
listing down various options available to a candidate through
real-time modes of career counselling and so on. Portal 3
tries to seek differentiation by reaching its target audience
through value-added services on mobile phones, like text
messages. The portals charge the aspirants a suitable
amount may be in the form of membership fees for the add-
on-services rendered to them. The social networking sites,
belong to a different genre by offering colossal opportunities
in increasing the users' awareness through content-rich
discussions, making them aware about the skills required for
their specific industry type and job profile, development
programmes, and competencies, through effective word of
mouth and referral recommendations.
The findings reveal that the job portals cater to the needs
of individuals, at all education levels. In other words, the
number of offers is not dependent on the individual's
educational background. Also, it is seen that young users,
mostly fresh graduates or users with 1-2 years of experience,
tend to use job portals more than users who are aged 35
years and above, and with good relevant experience. A
young aspirant with little or no experience is likely to access
more than two job portals. The present study helps us to
understand the use of job portals influences the perceptions
of job seekers as it helps them to determine their career
prospects. The information accessibility about education,
skills required and special emerging fields allows the job
seekers in getting an exposure of the available opportunities
– job offerings, types of jobs available, preferred locations
and other career related decisions. The four factors affecting
the users' perceptions include - technical features of the
portals, personalized and customized products and services,
responsiveness and their ability to save time and cost.
The dynamism in Internet usage has resulted in affecting
job seekers' decisions to use certain sites and to discard
others. It is imperative for the organisations to attempt
different approaches for online recruitments as users'
decisions will greatly be affected by service attributes
(Koong, 2002, Grönross 2007). The job portals must
refurbish their web sites by -
1. Removing the filled-in vacancies and /or expired ones
from their web pages
2. Adding attractive GUI (Graphic User Interface) to
increase user friendliness and to ease out navigation on
their web sites.
3. Verifying information about the organizations listed on
their portals as well as the prospective candidates to
increase authenticity and reliability.
4. Giving and sharing of the feedback with the candidates
in case of rejection or when their CVs are not shortlisted,
within a pre-fixed time frame.
5. Ascerting control on fake job posts by organisations and
job consultants, who append their databanks.
6. Making specific, authentic relevant information about
105Job Portals ersus Social Networking SitesV

the job descriptions, job profile and remunerations
available to the job seekers on a personalized/
customised front.
7. Gaining insights in their technical features,
responsiveness and offerings like personalised services
to add convenience to the users and save costs for the
hirers. This study is in congruence with the interactivity
elements, identified by Heeter (1989). These elements
inc lude select iv i ty, access to informat ion,
responsiveness, and facilitation of interpersonal
communication. As the approach of the users is different
for each web site, through regular monitoring and the
clickstream behaviour of the users, organisations can
focus on these elements, while designing their web
sites. Also, many young adults use smartphones for their
internet access. So, firms who wish to tap these adults
need to improvise their e-recruitment services to match
compatibility with the platform.
This research is exploratory cum a descriptive study,
conducted for a few selected job portals and social
networking sites in Delhi/NCR. The same can be expanded
to other geographical areas, where it can be identified
whether the browsing habits of portal users differ. Also, in the
study, we have taken education and age as demographic
factors. The scope of the study can be extended by using
other factors like gender and income. The sample size is
small with respect to the total population of the region but
meets statistical criterion. The websites differ largely in their
compositions and the nature of content displayed in different
geographic markets can also vary. Small widgets and
microsites can be designed for single-markets by
understanding the differences that arise due to demographic
parameters - age, gender, income, occupation and
educational qualifications. Such a study would aid
professionals and practitioners in laying out segment specific
strategies.
CONCLUSION
Job portals and social networking sites are strong e-
recruitment platforms for both the employers as well as the
job seekers. With the popularity, usage of the social
networking sites and the tremendous exchange of peer
interactions over these sites, an understanding of the factors
affecting their usage and perceptions cannot be ignored. The
study highlighted a comparative study of job portals and
professional networking sites. Both the types of sites are
used with different approaches, depending largely on the
design and layout of the web site. During the early decades of
post globalised era, centralized clearing-houses for selected
entry-level jobs were set up to cater to the employment
demands of the people, but now with new modern e-
recruiting services, the processes are fast, convenient, cost
saving while also maintaining the good impressions the users
have of the organisations.
REFERENCESAnderson RE and Srinivasan SS 2002. E-satisfaction and e-loyalty:
A contingency framework. (2): Psychology and Marketing 20123-138.
Annonymous 2013. Recruitment goes virtual. Human Resource Management International Digest 21 (3): 19-21.
Aren S, Güzel M, Kabadayi E and Alpkan L 2013. Factors affecting repurchase intention to shop at the same website. Procedia-Social and Behavioral Sciences 99 : 536-544.
Arthur D 2001. Electronic Recruitment, The employee recruitment and Retention handbook. . p. 114Amacon, New York, NY
Barber AE 1998. Recruiting Employees. . Sage, Thousand Oaks, CAp. 158
Bartram 2000. Internet recruitment and Selection: Kissing frogs to find princes. International Journal of Selection and Assessment8(4): 261–274.
Bingham B, Ilg S and Davidson N 2002. Great candidates fast: Online Job application and electronic processing: Washington State's new internet application system. Public Personnel Management 31 (1): 53-64.
Boyd MD and Ellison BN 2008. Social network sites: Definition, history, and scholarship. Journal of Computer-Mediated Communication 13 (1): 210-230.
Boydell M 2002. Internet recruitment helps HR careers. Canadian HR Reporter 11 (20): 5.
Bryant FB and Yarnold PR 1995. Principal-components analysis and exploratory and confirmatory component analysis. In L. G. Grimm and P. R. Yarnold (Eds.), Reading and understanding multivariate statistics. p.99-136. Washington, DC: American Psychological Association.
Capelli 2001. Making the most of online recruiting. Harvard Business Review March 2001: 139-146.
Casper R 1985. Online recruitment. (5): 50-55.Personnel Journal 64
Chapman D and Webster J 2003. The use of technologies in recruiting, screening and selection processes for job candidates. International Journal of Selection and Assessment11(2/3): 113-20.
Chaffey D, Chadwick FE and Johnston MR 2006 Internet MarketingThird Edition Pearson Publications. p. 94
Chen D 1999. A Study on the service quality and satisfaction of recruitment sites. Master's Thesis, Soochow University, Dept. of Business Administration, p. 105
Chen RC 2000. Service functions of the third-party recruitment sites in Taiwan. Master's Thesis, Da-Yeh University, Dept. of Information Management, Taiwan. p. 35
Chen TC 2001. A Study on the Factors of Organization, User and Service Quality of Recruitment Sites. Master's Thesis, National Chengchi University, Dept. of Psychology, Taiwan. p. 77.
Cober R, Brown D, Keeping L and Levy P 2004. Recruitment on the net: how do organizational website characteristics influence applicant attraction? (5): 623-646.Journal of Management 30
Derous E, Born M and Witte DK 2004. How applicants want and expect to be treated: Applicants' selection treatment beliefs and the development of social process questionnaire on selection. International Journal of Selection and Assessment 12 (1/2): 99-119.
Doherty R 2010. Getting social with recruitment. Strategic HR Review 9 (6): 11-15.
Emma Parry and Hugh Wilson 2009. Factors influencing the
106 Anagha Shukre

adoption of online recruitment. (6): 655-Personnel Review 38673.
EPS 1999. The Online Recruitment marketplace, Electronic Publishing Services, New York, NY available at www.epsltd.com.
Falke S 2003. Winners and Losers in online recruitment. IMI Insights, Sheffield, July.
Galanaki E 2002. The decision to recruit online: A descriptive study. Career Development International 7 (4): 243-51
Ganesan, Antony and George EP 2018. Dimensions of job advertisement as signals for achieving job seeker's application intention. (5): 425-438Journal of Management Development 37
Gillespie A, Krishnan M, Oliver C, Olsen K and Thiel M 1999. Online Behaviour Stickiness. (3): 52-56.Journal of Marketing 12
Greengard S 2012. Picking and keeping-the cream of the crop:Smart strategies are needed for both recruitment for both recruitment and retention of talent. Human Resource Management International Digest 20 (3): 26-29.
Grönross 2007. Service management and marketing: Customer management in service competition. West Sussex: John Wiley and Sons Ltd. p. 15
Güzel Aren S, M Kabadayi E and Alpkan L 2013. Factors affecting repurchase intention to shop at the same website, Procedia-Social and Behavioral Sciences 99 : 536-544.
Hair JF, Black WC, Babin BJ and Anderson RE 2010. Multivariate data analysis (7th ed.). Upper Saddle River, NJ: Prentice Hall. p. 358
Hays A 1999. Hiring on the web. (18): 76-82.Workforce 78
Heeter C 2010. Implications of new Interactive Technologies for Conceptualizing Communication, in JL Salvaggio and J Bryant (eds), Media use in the Information age: Emerging patterns of adoption and Computer use, Lawrence Erlbaum Associates, Hillsdale, NJ. p. 217-35.
Huang HY and Chan PHYM 2012. Factors influencing the user behaviour intention of online recruitment websites. International Journal of Business and Commerce 1 (9): 107-126.
Jobvite 2012. Eyes on the Prize: 5 ways to take the sourcing frontline in the war on talent. R etrieved from http://recruiting.jobvite.com/resources/
Jobvite 2012. So etrieved from. Rcial job seeker Survey ht tp : / /www.s l ideshare .net /e leanora44/ jobv i te- job -seekerfinal2012.
Kerrin M and Kettley K 2003. e-recruitment:Is it delivering? Institute of Employment Studies, report. p.402.
Kim S and O'Connor JG 2009. Assessing electronic recruitment implementation in state governments: Issues and challenges. Public Personnel Management 38 (1): 47-66.
Koong KS 2002. An identification of internet job board attributes. Human System Management 2 (2): 129-135.
Lin CS, Wu S and Tasi RJ 2004. Integrating perceived playfulness into expectation-confirmation model for web portal context. Information and Management 42 : 683-693.
Lu Y 2001. The characteristics and needs of jobseekers using internet for job search. Master's Thesis, National Sun Yat-sen University, Dept. of Human Resource Management, Taiwan. p. 12.
Madia SA 2011. Best Practices for using social media as a recruitment strategy. (6): 19-24.Strategic HR Review 10
Malhotra N 2004. (4th Marketing Research-An applied OrientationEd). New Delhi: Pearson Education. p. 19
Muduli and Trivedi 2020. Recruitment methods, recruitment outcomes and information credibility and sufficiency, Benchmarking: An International Journal 27 (4):1615-1631
Parry and Wilson 2008. An analysis of the use and success of e-recruitment methods in the UK. Human Resources Management Journal 18 (3): 257-274.
Pin JR, Laorden M and Diez IS 2001. Internet recruiting power: Opportunities and effectiveness, International Research Centre on Organization. p.1-65.
Schreyer R and McCarter J 1998. Future face of recruiting. HR Focus75(14): 73-76.
Singh P and Finn D 2003. The effect of information technology on recruitment, (3): 395-408.Journal of Labour Research 24
Szymanski DM and Hise TR 2002. e-satisfaction: An initial examination. (3): 310-322.Journal of Retailing 76
Wolfinbarger M and Gilly MCEQ 2003. Dimensionalizing, measuring and predicting quality. : 183-198.Journal of Retailing 79
Zusman Landis 2002. Applicant preferences for web-based versus traditional job postings. : Computers in Human Behaviour 18285-296.
Received January, 2021; Accepted May, 202126 16
107Job Portals ersus Social Networking SitesV

Flourishing and Work Flow among Working Adults: A Positive Investigation from India
Manuscript Number: S-684NAAS Rating: 5.79
Abstract: The demands in today's organizations are only growing at peaking high levels where turnover and burnout sets out to be major factors that challenge productivity. This is supported by previous findings which have identified turnover and burnout as a consequence of job demands. In today's demanding era of workforce, capacity to work effectively is a key component of employee's health, well-being and growth. Positive emotional and mental state of employees is a predictor of positive organization which will result in high performance, wellbeing and a conducive environment to flourish. Present study deals with workflow and its relationship with employee`s flourishing. This paper aims to explore the relationship between flourishing and experiences of work flow among working adults (n=105). Relationship among variables was analyzed through correlation and regression analysis. Results indicate that there is significant positive correlation between flourishing and experience of work flow (r (105) = 0.49, p<.01) and experience of work flow predicts the flourishing among employees.
Keywords: Flow, Subjective well being, Flourishing, Working adults, Positive organization
K. Rastogi and A. BelaniDepartment of Psychology, CHRIST (Deemed to be University), Delhi NCR- 201 003, India
E-mail: [email protected]
Indian Journal of Ecology (2021) 48 Special Issue (16): 108-112
Organizations are increasingly moving towards
capitalizing on human strengths and positive qualities that
can be ''measured, developed, and effectively managed for
performance improvement in today's workplace” (Luthans
2002). In order to raise efficiency levels in an organization,
new studies are being conducted to develop different
modules which primarily looks at human potential and how to
flourish employees (Seligman and Csikszentmihalyi 2000).
The concept of flow is used in the work domain and has
been linked with employee's optimal functioning in the last
decade. Flow is a state of intrinsic motivation that leads a
person to be fully immersed and dedicated to what he or she
is doing for the sake of activity (Csikszentmihalyi 1990,
2000). The state of flow is characterized by a merging of
action and awareness, sense of control, high concentration,
loss of self-consciousness, and transformation of time
(Csikszentmihalyi 2000, Nakamura and Csikszentmihalyi,
2002). which leads to one's wellbeing. Csikszentmihalyi
emphasized on autotelic nature as a component of the flow
experience. Behind the autotelic nature is the idea that
people are motivated primarily by the experience itself rather
than by the possible extrinsic Bakker (2008) specifically
found that flow was important for other measures of
performance.
It is found that the individuals who experience flow do
experience absorption, enjoyment and intrinsic motivation. It
could also mean that these individuals would experience
greater self-perceived success as the themes of relationship
building, self-esteem, purpose and optimism would be
exercised as the individuals would be intrinsically motivated
to do more and achieve more. The study aims to study the
same through the following dimensions:
Experience of work flow: The concept of flow describes a
set of conditions that allow a person to engage in optimal
experience in the course of working towards achieving a goal
or a set of goals. For the purpose of the study, the experience
of flow will comprise of three elements which are absorption,
intrinsic motivation and enjoyment.
Absorption- According to Csikszenmihalyi (1994) flow is
defined as the ability where an individual is completely
immersed in their work, the immersion takes place to the
extent where nothing seems to matter; time loses its
meaning as total investment of resources takes place. It is
a state where one is very engrossed in what they are
doing and are solely focused on getting goals
accomplished (Csikszentmihalyi 1990).
Intrinsic motivation- Intrinsic motivation purely talks about
the innately felt motivation that an individual experience.
The experience of flow is said to be intrinsically rewarding
that is autotelic in nature. This prescribes that work itself
turns into a reward which helps one to keep actively
contributing towards it (Nakamura and Csikszentmihalyi
2002).
Enjoyment- Csikszentmihalyi (2002 extended his studies
to the subjective experience of positive work relationships
and its role in the organizational setup. The enjoyment

concept mainly talks about the fun element which makes
an activity more fruitful and therefore provides more
stimulation to an individual. Since the work itself turns into
a reward (autotelic in nature) it helps an individual to enjoy
contributing actively, provides a better platform for
interpersonal work dynamics and ultimately leads to more
organizational commitment (Snow 2010).
Flourishing: Flourishing aims to understand the essence of
psychological well-being in an individual by looking at well-
being through the lens of healthy functioning in an individual.
This encompasses feelings of engagement and interest,
meaning and purpose as well as optimism (Seligman 2002,
Peterson & Seligman 2004). These are seen as core
elements to bring about the experience of flourishing in one's
life. In summary, it can be said that flourishing explores how
an individual evaluates and self-reports about their own life in
the areas of relationships, self-esteem, purpose and
optimism.
Csikszentmihalyi's concept of "optimal experience
draws two important aspects to it. The ability to engage in
meaningful, creative expression as well as the ability to have
significant relationships, self-acceptance and therefore
higher self-esteem, optimism and present awareness which
all also correlate to the concept of "mindful living" (Siegel
2007). Where attending to the richness of one's own
experiences is said to create an enriching impression right
from the area of physiology and mental functions to
interpersonal relationships, these are two of the main
constructs that capture previously unexplored elements
through flourishing. There is increasing evidence through
studies that suggest the relationship between organizational
performance and flourishing (Cameron et al 2003). Positive
psychological traits such as self-esteem, optimism, and life
satisfaction are known as significant predictors of job
performance (Wright and Cropanzano 2000, Judge and
Bono 2001, Kluemper et al. 2009,). Indeed, individuals with a
positive view of themselves are more likely to accept their
identities and to make more favorable inferences about
themselves and this subsequently translates into better
performance.
The concept of flourishing is given by Seligman'(2011)
“notion of flourishing” which explains that flourishing builds
on the positive affect one feels which leads to more
happiness in a person. It could be probably stated that the
areas of relationship, self-esteem, purpose and optimism will
also be experienced by the person experiencing flow. This
personal experience of flow is said to help one feel connected
to themselves intrinsically in a spiritual sense and drive them
to do more and to do better (Berlitzand Lundstrom 1998).
However, even though considerable studies exist, there is a
gap existing as far as self-perceived success is concerned.
Present study was conducted to bridge this gap. The
objectives of study include assessing experience of flow
among working adults and too studying the relationship
between flourishing and experience of work flow among
working adults.
MATERIAL AND METHODS
Participants: Sample of present study comprises 105
working adults with age range 25-40 years. Participants are
permanent employees and full-time workers in their
respective organizations. They are employed in Business
Management, Consulting and Service Sectors. Data for the
study was collected through an online survey. The criteria of
the participants include employees that are working
seasonally / part time and retired or discontinuing job for any
reason.
Tools
1. Work-related Flow inventory (WOLF) measures flow at
work, defined as a short-term peak experience
characterized by absorption, work enjoyment, and
intrinsic work motivation. On the Cronbach alpha values
test, these three components of flow - absorption, work
enjoyment, and intrinsic work motivation were seen to
correlate moderately high with each other. The
correlations range between .44 for absorption and
intrinsic work motivation to .82 for work enjoyment and
intrinsic work motivation. The reliability of the three flow
dimensions is good, namely: 0.59 –0.79 for absorption,
0.51–0.57 for work enjoyment and 0.52–0.56 for intrinsic
motivation. (Bakker 2008). Cronbach's alpha was high
for work enjoyment (on average around 0.90),
acceptable for absorption (around 0.80) and satisfactory
for intrinsic work motivation (around 0.75). The only
exception is the intrinsic work motivation scale; here
Cronbach's alpha is .63. An overall reliability coefficient
of 0.93 was obtained for the entire scale. The absorption
factor obtained a reliability of α = 0.74, work enjoyment
obtained α = 0.90 and intrinsic work motivation obtained
α = 0.79. It can hence be drawn from this data that
satisfactory reliability coefficients are shown across
various studies. The WOLF is a 14 item Likert type scale
which measures flow at any work setting. The responses
range from 1 to 7 where 1= Never 2= Almost Never 3=
Sometimes 4=Regularly 5=Often 6=Very Often
7=Always.
2. Flourishing Scale developed by Diener et al 2009) aims
to measure self-perceived success in an individual in
important areas of life such as relationships, purpose
and optimism. Diener and his colleagues theorized
109Flourishing and Work Flow among Working Adults

flourishing from a psychosocial prosperity perspective
where the fulfilment of the needs of competence,
relatedness and self- acceptance is prescribed along
with psychological capital such as flow. The scale covers
the dimensions of social relationships, having a
purposeful and meaningful life and gives a consolidated
score of Flourishing. The FS is a 7-point Likert scale with
8 items (from strong disagreement to strong agreement)
which are; 1= Strongly disagree, 2= Disagree, 3= Slightly
disagree, 4= Mixed or neither agree nor disagree, 5=
Slightly agree, 6= Agree, 7= Strongly agree. The sum of
these scores ranges from the lowest 8 to the highest 56.
One sample item of the FS is “My social relationships are
supportive and rewarding.” The Cronbach alpha for FS is
0.88.
The objective of the current study was to study the
relationship between experience of flow and flourishing
among working adults. Both the scales were converted into a
google form so that data from 105 working adults was
collected through convenience sampling. Present study is
ex-post correlational research design. The normality of data
was tested and since the data fell in the normal range,
Pearson Coefficient Correlation was calculated. Regression
analysis was thereby performed on the data to compute
whether flourishing contributes to flow experience or not. The
data was analyzed with the help of Statistical Package for
Social Sciences (SPSS) software after collecting data.
RESULTS AND DISCUSSION
The Pearson coefficient (n=105) suggests that key
components of flow i.e. absorption (r=0.342, p<.01), work
Work njoymente Intrinsic otivationm Overall xperience of lowe f Flourishing
Absorption .372** .477** .710** .342**
Work njoymente .677** .854** .509**
Intrinsic otivationm .892** .361**
Flow at work .494**
Table 2. Correlation between experience of flow at work, its dimensions and flourishing (n=105)
* p<.05, ** p<.01
Variables and dimensions Mean Std. deviation
Absorption 15.819 4.7612
Work enjoyment 17.790 6.0139
Intrinsic motivation 18.752 6.1406
Flow at work 52.362 13.9905
Flourishing 37.324 7.7441
Table 1. Experience of work flow, its dimensions and flourishing (Mean and standard deviation)
enjoyment (r=0.509, p<.01) and intrinsic motivation (r=0.361,
p<.01) correlate positively with the flourishing with work
enjoyment (r=0.509, p<.01) demonstrating a strong
correlation with flourishing which suggests that employees
consider the work enjoyment as an important and
recognizable aspect of the flow experience, therefore it infers
that these dimensions affects flourishing strongly. The
overall values of work-related flow for the participants bear
strong positive correlation (r=0.494, p<.01) with flourishing
indicating that the respondent's experience of flow affects his
well-being in general. Engagement in work produces positive
psychological responses and impacts mental health
positively.
In order to predict the effect of components of work-
related flow i.e., absorption, work enjoyment and intrinsic
motivation on the flourishing through the inputs obtained by
the participants a linear regression analysis was performed
with flourishing as a dependent variable and work flow
components as an independent variable. The results indicate
that the absorption and work-enjoyment emerged out to be
the significant independent variable (p<0.05). The above
said model was able to explain around 28.7% of variance
(R =0.287) with work enjoyment contributing to the 2
significant amount of variation in the prediction of flourishing
( =0.471).β
It indicates that individuals are driven by the sense of
enjoyment that they get from work and the higher degree of
work satisfaction leads to higher degree of flourishing in
them. Organizations should focus on factors which affect
their work enjoyment in order to have a flourishing
environment at the workplace. Also, one might have
expected that the absorption should have also contributed
significantly to flourishing but results do not show that and
hence it needs to be tested with a greater sample in order to
draw conclusive evidence. These results also throw a
peculiar insight that intrinsic motivation may not always
contribute positively to the flourish which goes against the
logical general construct and therefore needs to be tested
with a greater sample of the population in order to draw
conclusive evidence.
In order to predict the effect of experience of flow at work
on the flourishing through the inputs obtained by the
110 K. Rastogi and A. Belani

Dependent variable R R2 ΔR2 F Predictors Beta t
Flourishing .536 .287 .266 13.558 Absorption .190 1.984
Work enjoyment .471 4.114
Intrinsic motivation -.049 -.402
Table 3. Predictor of flourishing: by dimensional components (n=105)
Dependent variable R R2 ΔR2 F Predictors Beta t
Flourishing otalt .494 .244 .236 33.162 Experience of flow at work
.494 5.759
Table 4. Predictor of flourishing: by overall experience of flow at work (n=105)
participants a linear regression analysis was performed with
flourishing as dependent variable and experience of flow as
independent variable. The results indicate that the flow
emerged out to be a significant independent variable
(p<0.05). The above said model was able to explain around
24.4% of variance (R =0.244). The standardized B-2
coefficient of 0.494 explains a positive effect of 49.4% on
Flourishing upon positive increments in the conditions of
experience of flow. This means that the conditions of flow
affect the flourishing in individuals and they tend to have
more positive psychological effects and positive mental
health when conditions of flow are positively impacted by the
organizations. Flourishing individuals have higher enjoyment
and motivation to work which helps them in performing well in
the organization. This success results in higher satisfaction
and reinforces Frederickson's Broaden and Build model, for
more positive adults reap more benefits and are more
positive, which creates an upward spiral. Since, social
relationship forms an inherent component in measurement of
flow therefore it affects flourishing directly.
CONCLUSION
Findings of present study can be implemented in various
organizational setups to maintain and sustain positivity
among employees. Study indicates flourishing among
employees is linked as the predictor of the experience of flow
at work place. Employees who experience flow at work place
will experience competence, relatedness and self-
acceptance too. The intensity and frequency of these
experiences indicates the optimism and well-being of
individual employees which ultimately leads to sustainable
positive organizations. Present study limits in terms of
showing cross sectional comparison between work flow
among employees in various organizational setups and
organizational cultures. Inferences on the basis of nature of
job, personality traits, psychological factors and emotional
states of employees could also be analyzed and correlated
along with the present variables. Comparison on the basis of
demographic details of participants will also be a good add on
for work flow and flourishing research in future. Other positive
variables like vigor, psychological capital, optimism can also
be paired with the present variables in future studies to
develop an overall positivity and wellbeing model for
employees.
REFERENCESAlessandri G, Borgogni L, Schaufeli WB, Caprara GV and Consiglio
C 2014. From positive orientation to job performance: The role of work engagement and self-efficacy beliefs. Journal of Happiness Studies 16(3): 767-788.
Bakker AB 2007. The work-related flow inventory: Construction and initial validation of the WOLF. Journal of Vocational Behaviour 72(3): 400-414.
Barisenkoff K 2019. Exploring team cohesion and engagement in long-term care teams. Dissertations, Royal Roads University, Canada.
Burkewitz J 2014. Coming to the studio, going with the flow: A study on artmaking to enhance flourishing. Dissertation, The Florida State University, Tallahassee, Florida.
Cameron KS and Dutton JE 2009. Positive Organizational Scholarship: Foundations of a New Discipline. Berrett-Koehler Publishers, Oakland, CA, United States
Chu, L and Lee C 2012. Exploring the impact of flow experience on job performance. The Journal of Global Business Management 8(2): 150-158.
Csikszentmihalyi M and LeFevre J 1989. Optimal experience in work and leisure. Journal of Personality and Social Psychology 56(5): 815-822.
Hogaboam AM 2010. Flow at work among part-time municipal recreation staff. Dissertations, California State University, Long Beach, California, USA.
Ilies R, Wagner D, Wilson K, Ceja L, Johnson M, Derue S and Ilgen D 2016. Flow at work and basic psychological needs: Effects on well-being. (1): 3-24.Applied Psychology 66
Judge TA and Bono JE 2001. Relationship of core self-evaluations traits-self-esteem, generalized self-efficacy, locus of control, and emotional stability-with job satisfaction and job performance: A meta-analysis. Journal of Applied Psychology 86(1): 80-92.
LeFevre Judith 1988 Flow and the quality of experience during work and leisure, pp 307–318. In: M. Csikszentmihalyi & I. S. Csikszentmihalyi (eds). Optimal experience: Psychological studies of flow in consciousness. Cambridge University Press.
Manton LN and van Es JC 1985. Why do extension agents resign? Journal of Extension 23(3): 27-30.
Nakamura J and Csikszentmihalyi M 2002. The Concept of Flow, p 89-105. In: C. Snyder, & S. Lopez (eds). Handbook of Positive Psychology. New York: University Press.
111Flourishing and Work Flow among Working Adults

Seligman MEP 2002. Authentic happiness: Using the new positive psychology to realize your potential for lasting fulfillment. New York: Free Press, p 2.
Siegel DJ 2007. The Mindful Brain in Human Development- Reflection and Attunement in the Cultivation of Well-Being, W. W. Norton &Company, Manhattan, New York p 234.
Snow KY 2010. Work relationships that flow: Examining the interpersonal flow experience, knowledge sharing, and
organizational commitment. Dissertation, The Claremont Graduate University, California, USA.
Tong KK, and Wang YY 2017. Validation of the flourishing scale and scale of positive and negative experience in a Chinese community sample. (8): 1-10.PLOS ONE 12
Wright TA and Cropanzano R 2000. Psychological well-being and job satisfaction as predictors of job performance. Journal of Occupational Health Psychology 5(1): 84-94.
Received April, 2021; Accepted 06 July, 202112
112 K. Rastogi and A. Belani

Professional Quality of Life of Nurses with 6-8 Years of Work Experience
Manuscript Number: S-685NAAS Rating: 5.79
Abstract: The current research investigation was undertaken to understand the relationship of professional quality of life of nurses with self-efficacy, empathy and aggression. “Professional quality of life is the quality one feels in relation to their work as a helper” (Stamm 2010). It includes the positive component of compassion satisfaction and two negative components of burnout and secondary traumatic stress. Nursing professionals with 6-8 years of work experience and employed in Punjab, India were taken for the purpose of the study. Fantasy seeking was found to be a positive predictor of compassion satisfaction explaining 4% of variance. Self-efficacy and empathic concern were found to be negative predictors while verbal aggression was found to be a positive predictor of burnout. Together the three predictors accounted for 17% of variance in burnout. Personal distress was a positive predictor of secondary traumatic stress explaining 8% of variance. Implications are discussed with in light of professional quality of life of nurses who hold a considerable amount of work experience in the nursing profession.
Keywords: Aggression, Empathy, Nurses, Self-efficacy, Professional quality of life
Harguneet KaurCHRIST (Deemed to be University), Delhi NCR-201 003, India
E-mail: [email protected]
Indian Journal of Ecology (2021) 48 Special Issue (16): 113-118
Nursing is considered as the most trusted vocation
marked by high standards of professionalism and ethical
conduct (Olshansky 2011). Nursing profession is both
physically and mentally taxing. Globally, shortage of nurses
has become a cause of concern (Drury et al 2009). McSteen
(2010) explained that the emotional demands inherent in a
helping profession can make the professional overwhelmed
leaving him/her with no choice but to quit his profession.
According to World Health Organization, the nurse to
physician ratio in India is also not satisfactory (WHO 2005).
Robins et al (2009) highlighted that there might exist a
“culture of silence” where health providers are reluctant to
acknowledge the signs and symptoms of secondary
traumatic stress when afflicted with it, considering it as a sign
of professional weakness. Since nurses are the immediate
formal caregivers of patients/traumatized victims, they
perform an integral role in the patient's recovery and healing.
This makes it meaningful to study their professional quality of
life so that timely interventions in the form of training
programs to ensure high standards of caregiving can be
initiated for them. Nurses are stereotyped as helpers of the
needy but it is time that the needs of the helpers are also
studied. Otherwise, nurses will continue to suffer silently,
without even realizing the adverse short term and long-term
impact of caregiving on their emotional and physical well-
being. Clinical profession demands helping professionals
who are in good physical and mental health rather than ones
who are themselves victims of burnout and compassion
fatigue (Killian 2008). Amin et al (2015) surveyed the
professional quality of life of 129 nurses from nine neonatal
intensive care units from six cities of Gujarat. High
compassion satisfaction was found in only 19.4 % of the
sample.
The review for the present research investigation
revealed that when examining the relationship between
professional quality of life and empathy, comparatively fewer
researchers have studied the multidimensional model of
empathy and largely focused on the unidimensional model of
empathy. Very few studies have focused on the association
between professional quality of life and aggression (Kaur
2015 and Bhandari and Kaur 2015). Kaur and Bhandari
(2018) highlighted dearth of studies on professional quality of
life of health professionals in India. Impact of compassion
fatigue on hospice nurses also lacks clarity (Abendroth and
Flannery 2006). Therefore, the present study was designed
to study professional quality of life in association with self-
efficacy, empathy and aggression.
MATERIAL AND METHODS
Participants: Hundred female nurses in the age range of 26-
35 years with work experience ranging from 6 to 8 years
formed the sample of the study. The participants were
selected from a universe of around 400 female nurses. The
nurses were employed in urban multispecialty private
hospitals in Punjab. The sampling technique employed was
purposive sampling. Documented evidence highlights
differences in structure and work scenario of government and
private hospitals (Sprang, Clark and Whitt-Woosley 2007).

Therefore, only private hospitals remained the focus of the
present study. Studies also reveal significant differences in
the severity of secondary traumatic stress symptoms
(Meldrum et al 2002) and burnout (Sprang et al 2007) in
urban and rural health professionals. Sprang et al (2007)
have argued that restricted resources, geographical
isolation, limited coworker support and highly demanding
caseloads are risk factors of burnout among rural clinicians.
This explains exclusion of nurses working in the rural areas in
the present research work.
Hypotheses: Based on the review of literature it was
hypothesized that:
1) Compassion satisfaction is positively related to self-
efficacy while burnout and secondary traumatic
stress are negatively related to self-efficacy.
2) Compassion satisfaction is positively related to
perspective taking, fantasy seeking and empathic
concern but negatively related to personal distress.
Burnout and secondary traumatic stress are
negatively related to perspective taking and
empathic concern but positively related to fantasy
seeking and personal distress.
3) Compassion satisfaction is negatively to all factors
of aggression while burnout and secondary
traumatic stress are positively related to them
Tests and Tools
Professional quality of life scale (Stamm 2010): It consists
of thirty items with ten items under each subscale of
compassion satisfaction, burnout and secondary traumatic
stress. The items are rated on a five-point Likert scale with
response alternatives ranging from: 1 = never to 5 = very
often. The scores on each subscale range from 0 to 50 points.
The scale has satisfactory reliability and has been used in
India (Bhutani et al 2012, Amin et al 2015, Rohit et al 2016,
Bhandari and Kaur 2016, 2017).
General self-efficacy scale (Schwarzer and Jerusalem
1995): It is made up of ten items which were rated on a four-
point Likert scale with response alternatives ranging from 1=
not at all true to 4=exactly true. The scores range from 10 to
40 points. Internal reliability was computed by taking samples
from 23 nations and was found ranging between 0.76 and
0.90 (Schwarzer and Jerusalem 1995). The scale has been
used widely across India.
Interpersonal reactivity index (Davis 1980): It consists of
twenty-eight items with seven items under the four subscales
of perspective taking, empathic concern, fantasy seeking
and personal distress. Items are rated on a five-point Likert
scale with response alternatives ranging from A= does not
describe me well to E= describes me very well. The scores on
each subscale range from 0 to 28 points. The internal
reliability coefficients for the subscales were computed for
both males and females. For fantasy seeking subscale it
came out to be 0.78 for males and 0.75 for females, for
perspective taking subscale it came out to be 0.75 for males
and 0.78 for females, for empathic concern subscale it was
0.72 for males and 0.70 for females and for personal distress
it came out to be 0.78 for both males and females (Davis
1980). Acceptable concurrent validity of perspective taking,
empathic concern and personal distress was reported by
Fernandez, Dufey and Kramp (2011). The scale has been
used in India by Bhandari and Parthi (1998) and Singh et al
(2015).
Aggression questionnaire short form (Bryant amd Smith
2001): It is made up of 12 items with three items under each
subscale viz., physical aggression, verbal aggression, anger
and hostility. The items are rated on a six-point Likert scale
with the response alternatives ranging from 1=extremely
uncharacteristic of me to 6 = extremely characteristic of me.
The scores on each subscale range from 3 to 18. Cronbach
alpha reliabilities were reported to be 0.79 for physical
aggression,0.83 for verbal aggression,0.76 for anger and
0.75 for hostility. The construct validity of this scale is as good
as or better than the construct validity of the Buss and Perry
Aggression Questionnaire, from which this test has been
constructed (Bryant and Smith 2001). This scale has been
used by Bhandari and Kaur (2015) and Kaur (2015) in India.
Procedure: Permission was taken from the head of
administration of each hospital to collect data from nurses.
Informed consent was obtained from the nurses. The
respondents were assured of the confidentiality of the
responses given by them. Each participant was given the
freedom to withdraw from the study at any stage. SPSS
version 21 was used to compute the results.
RESULTS AND DISCUSSION
Professional quality of life and self-efficacy: Hypothesis 1
was confirmed from the results obtained on the relationship
between professional quality of life and self-efficacy.
Compassion satisfaction in nurses was seen to be positively
correlated to self-efficacy. However, regression analysis
revealed self-efficacy to be an insignificant predictor of
compassion satisfaction. Sprang et al (2007) reported health
professionals with specialized trauma training to have
greater compassion satisfaction. According to the
researchers, training taught them more sophisticated
methods of diagnosis and interventions which impacted their
self-efficacy beliefs. A positive relationship between
compassion satisfaction and self-efficacy had earlier been
reported in health professionals working in Italy (Cicognani et
al 2009, Prati et al 2010, Pietrantoni and Prati 2008). Burnout
114 Harguneet Kaur

Variables Frequency /Percentage
1. Age
26-29 years 67
30-35 years 33
2. Qualifications
ANM 01
GNM 85
BSc Nursing 11
Post Basic BSc Nursing 02
Msc Nursing 01
3. Marital Status
Married 47
Unmarried 53
4. Current Unit/Ward
Blood Bank 01
CCU 10
Dialysis 04
ECHS 01
Emergency 12
Gynaecology 05
HDU 02
ICU 28
Medicine 01
Neurology 01
NICU 07
OPD 07
Orthopaedic 01
Paediatrics 03
Radiology 01
SICU 03
Surgery 04
Ward 09
5. Length of Time Working in Current Unit/Ward
<1 year 10
1-4 years 32
4-8 years 58
6. Nature of Shifts
Day Shift Worker 15
Working All Three Shifts 85
7. Expected Time to Work in Nursing Profession
Have Not Decided Yet 02
Few Years 21
Lifetime 77
8. Religious Beliefs
Yes 92
Table 1. Demographic Characteristics of nurses (N=100)
Note: ANM=Auxiliary Nurse Midwifery, GNM=General Nursing and Midwifery, CCU=Cardiac Care Unit, ECHS=Ex Servicemen Contributory Health Scheme, HDU=High Dependency Unit, ICU=Intensive Care Unit, NICU=Neonatal Intensive Care Unit, OPD=Out Patient Department, SICU=Surgical Intensive Care Unit
showed a negative relationship with self-efficacy, also self-
efficacy emerged to be a negative predictor of burnout
explaining 8% of variance in it. Pisanti et al (2015) did a cross-
sectional survey of nurses from nine hospitals. High
occupational coping self-efficacy beliefs was reported to be
related to low emotional exhaustion and depersonalization
and high personal accomplishment among nurses.
Secondary traumatic stress was found to be negatively
correlated with self-efficacy. Cieslak et al (2013) conducted
two well designed studies to understand the relationship of
secondary traumatic stress with “secondary trauma self-
efficacy”. In study 1 health care professionals providing
services to traumatized soldiers in USA were selected as the
sample. Study 2 included helping professionals taking care of
traumatized civilians living in Poland. The participants in the
second study were assessed on Time 1 and again after six
months on Time 2. Results revealed a negative relationship
of “secondary trauma self-efficacy” with secondary traumatic
stress. Similar results have interestingly also been observed
in school counsellors (Bozgeyikli 2011 and Rumsey 2017).
Professional quality of life and empathy: Hypothesis 2
was partially proven true for all components of professional
quality of life. Compassion satisfaction was found to be
positively related to perspective taking and fantasy seeking,
also fantasy seeking emerged to be a significant positive
predictor of the criterion variable. Robins et al (2009) had also
observed compassion satisfaction to be related to both
cognitive and affective empathy in healthcare professionals.
Thomas and Otis (2010) examined the relationship of
compassion satisfaction with different dimensions of
empathy, i.e., perspective taking, fantasy seeking, empathic
concern and personal distress in clinical social workers. A
positive relationship between compassion satisfaction and
perspective taking suggested that ability to adopt the
viewpoint of clients was linked to high compassion
satisfaction in social workers. A negative relationship was
obtained between compassion satisfaction and personal
distress dimension of empathy. Empathic concern emerged
to be a significant positive predictor, while, personal distress
emerged to be a negative predictor of compassion
satisfaction. According to Thomas and Otis (2010),
compassion satisfaction which is a sense of purpose and
accomplishment is linked to greater empathic concern for
victims and low self-oriented feelings of distress in these
professionals. Gleichgerrcht and Decety (2013) carried out a
study on another category of helping professionals i.e.,
physicians. High perspective taking, high empathic concern
and low personal distress were associated with high level of
compassion satisfaction in the sample. Compassion
satisfaction was also found to be positively associated with
115Professional Quality of Life of Nurses

Predictors R Beta coefficient t R2 R change2 F-value
Compassion satisfaction Fantasy seeking 0.48 0.20 2.24* 0.23 0.04 14.37**
Burnout Self-efficacy 0.63 -0.32 -3.70** 0.39 0.08 31.12**
Burnout Empathic concern 0.67 -0.25 -3.30** 0.45 0.06 26.48**
Burnout Verbal aggression 0.69 0.17 2.21* 0.48 0.03 21.89**
Secondary traumatic stress Personal distress 0.50 0.30 3.38** 0.25 0.08 16.50**
Table 3. Predictors of professional quality of life
CS B STS SE PT FS EC PD PA VA A H
M 45.05 23.59 23.70 33.58 19.44 12.74 21.38 10.18 5.32 9.30 8.62 7.49
S.D. 4.47 6.15 6.68 4.34 3.72 5.18 4.48 4.93 3.06 3.44 3.57 4.04
CS 1 -.52** -.19 .24* .23* .20* .19 -.06 -.23* -.10 -.08 -.26**
B 1 .41** -.47** -.32** .05 -.33** .30** .30** .29** .36** .47**
STS 1 -.20* -.15 .14 -.14 .38** .14 .13 .26** .33**
Table 2. Means, standard deviations and correlations
Note: *Correlation is significant at the 0.05 level**Correlation is significant at the 0.01 levelCS=Compassion Satisfaction, B=Burnout, STS=Secondary Traumatic Stress, SE=Self-Efficacy, PT=Perspective Taking, FS=Fantasy Seeking, EC=Empathic Concern, PD=Personal Distress, PA=Physical Aggression, VA= Verbal Aggression, A=Anger, H=Hostility
empathy in school counsellors (Rumsey 2017). Burnout was
found to be negatively related to perspective taking and
empathic concern and positively correlated with personal
distress. Also, empathic concern emerged to be a negative
predictor of burnout accounting for 6% of variance in it.
Robins et al (2009) studied caregivers working in a children's
hospital. Perspective taking was found to be negatively
associated with burnout. Thomas and Otis (2010) found
burnout to be negatively related to perspective taking but
positively related to fantasy seeking and personal distress in
clinical social workers. Interestingly, emotional separation
emerged to be a strong negative predictor of burnout. The
researchers remarked that perhaps it is not empathy, but the
professional's inability to adequately separate from the client
at the emotional level which makes him/her vulnerable to
burnout. In a study conducted on physicians, high feelings of
concern for others and high personal distress were found to
be associated with high level of burnout (Gleichgerrcht and
Decety 2013). Abendroth and Flannery (2006) opined that
self-sacrificing behaviour and overly empathetic nature is
unhealthy and can make nurses vulnerable to compassion
fatigue. Badger et al (2007) explained that “emotional
separation” may be a protective factor against secondary
traumatic stress, however, it may cause a reduction in
feelings of compassion and empathy in the helping
professional. The researchers clarified that it is important that
the caregiver should judiciously and rationally, establish and
maintain, an appropriate balance of empathy and emotional
separation with the patient/client. Thomas and Otis (2010)
also advocated the development of a healthy balance
between empathy and emotional separation in a therapeutic
alliance. According to them, there should be a deliberate
attempt on the part of the professional to regulate his/her
internal emotional state. Benoit et al (2007) did a focus group
study in which empathic responses were given by helping
professionals in the following ways: a) repeated emotional
investments in the victims b) personal distress caused when
care provided goes unacknowledged or when professionals
regret not being able to fully meet the expectations of patients
and c) counter transference. These empathic responses
were reported to be risk factors for the development of
compassion fatigue in the care providers. Thomas (2013)
reported a positive association between personal distress
and compassion fatigue in social workers. Wagaman et al
(2015) found cognitive elements of empathy such as self-
other awareness and emotional regulation to be negatively
related with secondary traumatic stress in social workers.
The researchers concluded that empathy is a skill that could
buffer the hazardous effect of secondary traumatic stress
increasing the longevity of the individual as a helping
professional.
Professional quality of life and aggression: Hypothesis 3
was proven true for burnout and partially true for the other two
components of professional quality of life. Compassion
satisfaction was found to be negatively correlated to physical
aggression and hostility. Earlier, Kaur (2015) had reported
compassion satisfaction to be negatively related to hostility in
female nurses. Burnout was found to be positively correlated
116 Harguneet Kaur

with all the components of aggression. Verbal aggression,
also emerged to be a positive predictor of burnout. In 2006,
Muscatello et al advocated use of anger management
strategies in interventions targeting reduction of burnout in
health professionals. Fiksenbaum et al (2007) found high
emotional exhaustion linked to greater level of state anger in
nurses working in Canada. Laschinger et al (2009) reported
emotional exhaustion and cynicism to be positively related to
co-worker incivility in nurses. Similar results were obtained
by Fida et al (2018) in in Canada and Oyeleye et al (2013) in
USA. Joung and Park (2016) stated verbal abuse to be
related to greater levels of burnout in nurses. Secondary
traumatic stress was found to be positively correlated with
anger and hostility. Relationship between aggression and
secondary traumatic stress has been propounded by Figley
(2002) and confirmed by Kaur (2015) in an Indian study.
Source of funding: The study has been funded by
University Grants Commission of India.
CONCLUSION
All the elements of professional quality of life were found
related to self-efficacy. Nurses who fantasized were found to
be high on compassion satisfaction. Perhaps over the years,
nurses experience caring emotions that lead to high
involvement in the sufferings of their patients. Therefore, they
tend to respond with greater compassion to the negative
emotional states of pain and distress of these patients. It
becomes important to identify at what length of service,
nurses become vulnerable to the deleterious effects of
burnout and secondary traumatic stress, so that ameliorative
measures are initiated well in time that would help to
minimize the attrition rates in nurses. The present study was
conducted only on female nurses. It would be interesting to
compare the professional quality of life of male and female
nurses in Punjab. Further research can also explore the
relationship of professional quality of life with other
characteristics of psychological capital viz., optimism, hope
and resiliency.
REFERENCESAbendroth M and Flannery J 2006. Predicting the risk of compassion
fatigue: A study of hospice nurses. Journal of Hospice and Palliative Nursing 8 (6): 346-356
Amin AA, Vankar JR, Nimbalkar SM and Phatak AG 2015. Perceived stress and professional quality of life in neonatal intensive care unit nurses in Gujarat, India. The Indian Journal of Pediatrics82(11): 1001-1005
Badger K, Royse D and Craig C 2007. Hospital social workers and indirect trauma exposure: An exploratory study of contributing factors. (1): 63-70 Health and Social Work 33
Benoit LG, Veach PM and LeRoy BS 2007. When you care enough to do your very best: Genetic counselor experiences of compassion fatigue. (3): 299-Journal of Genetic Counseling 16312
Bhandari A and Kaur H 2015. A study of professional quality of life, aggression and empathy in private sector nurses. Paper presented at the 2 International and 4 Indian Psychological nd th
Science Congress, Chandigarh, India.
Bhandari A and Kaur H 2016. Professional quality of life of nurses in relation to depression, self-efficacy and coping. Indian Journal of Psychological Science 7(2): 153-159
Bhandari A and Kaur H 2017. Predictors of professional quality of life of nurses working in private hospitals. Indian Journal of Psychological Science 9(1): 1-10.
Bhandari A and Parthi K 2016 Empathy: Its neural basis and role in therapy, pp 215-226. In: Kumar G Vand Sharma N (eds.). Experiential applied psychology. Global Vision Publishing House, New Delhi, India.
Bhutani J, Bhutani S, Balhara YPS and Kalra S 2012. Compassion fatigue and burnout amongst clinicians: A medical exploratory study. (4): 333-337Indian Journal of Psychological Medicine 34
Bozgeyikli H 2011. Self-efficacy as a predictor of compassion satisfaction, burnout, compassion fatigue: A study on psychological counselors. African Journal of Business Management 6 (2): 646-651
Bryant FB and Smith BD 2001. Refining the architecture of aggression: A measurement model for the Buss-Perry Aggression Questionnaire. Journal of Research in Personality 35(2): 138-167
Chakraborty R, Chatterjee A and Chaudhury S 2012. Internal predictors of burnout in psychiatric nurses: An Indian study. Industrial Psychiatry Journal 21 (2): 119-124
Cicognani E, Pietrantoni L, Palestini L and Prati G 2009. Emergency workers' quality of life: The protective role of sense of community, efficacy beliefs and coping strategies. Social Indicators Research: An International and Interdisciplinary Journal for Quality-of-Life Measurement 94 (3): 449-463
Cieslak R, Luszczynska A, Rogala A, Shoji K, Taylor S and Benight CC 2013. Secondary trauma self-efficacy: Concept and its measurement. (3): 917-928Psychological Assessment 25
Davis MH 1980. A multidimensional approach to individual differences in empathy. JSAS Catalog of Selected Documents in Psychology 10 : 85-104
Davis MH 1983. Measuring individual differences in empathy: Evidence for a multidimensional approach. Journal of Personality and Social Psychology 44(1): 113-126.
Day HI and Chambers J 1991. Empathy and burnout in rehabilitation counsellors. (1): 33-44 Canadian Journal of Rehabilitation 5
Decety J 2010. The neurodevelopment of empathy in humans. Developmental Neuroscience 32 (4): 257-267
Drury V, Francis K and Chapman Y 2009. Where have all the young ones gone: Implications for the nursing workforce. Online Journal of Issues in Nursing (1): 1-1214
Fernandez AM, Dufey M and Kramp U 2011. Testing the psychometric properties of the Interpersonal Reactivity Index (IRI) in Chile. . European Journal of Psychological Assessmentdoi: 10.1027/1015-5759/a000065
Fida R, Laschinger HKS and Leiter MP 2018. The protective role of self-efficacy against workplace incivility and burnout in nursing: A time-lagged study. (1): Health Care Management Review 4321-29
Figley CR 2002. Compassion fatigue: psychotherapists' chronic lack of self-care. (11): 1433-1441 Journal of Clinical Psychology 58
Fiksenbaum L, Marjanovic Z, Greenglass ER and Coffey S 2007. Emotional exhaustion and state anger in nurses who worked during the SARS outbreak: The role of perceived threat and organizational support. Canadian Journal of Community Mental Health 25 (2): 89-103
Gleichgerrcht E and Decety J 2013. Empathy in clinical practice: How individual dispositions, gender and experience moderate empathic concern, burnout and emotional distress in
117Professional Quality of Life of Nurses

physicians. (4): e61526. PloS One 8
Goleman D 2007. Three kinds of empathy: Cognitive, emotional and compassionate, Retrieved from http://www.danielgoleman. in fo / t h ree -k inds -o f -empa thy-cogni t i ve -emo t iona l -compassionate/
Grant AM and Berry JW 2011. The necessity of others is the mother of invention: Intrinsic and prosocial motivations, perspective taking and creativity. (1): Academy of Management Journal 5473-96
Joung SA and Park KY 2016. Influence of experiencing verbal abuse, job stress and burnout on nurses' turnover intention in hemodialysis units. Journal of Korean Academy of Nursing Administration 22 (2): 189-198
Kaur H 2015. Does nursing care affect professional quality of life, aggression and empathy in private sector nurses? preliminary results from a structured study. Paper presented at the 3 World rd
Congress on Excellence, Chandigarh, India.
Kaur H and Bhandari A 2018. Care of professional caregivers: A review. (5): International Journal of Social Sciences Review 6968-971
Killian KD 2008. Helping till it hurts? A multimethod study of compassion fatigue, burnout, and self-care in clinicians working with trauma survivors. (2): 32-44Traumatology 14
Laschinger HKS, Leiter M, Day A and Gilin D 2009. Workplace empowerment, incivility, and burnout: Impact on staff nurse recruitment and retention outcomes. Journal of Nursing Management 17, (3): 302-311
McSteen KL 2010. Compassion fatigue in oncology nursing: a witness to suffering. 18-22. Retrieved Oncology Nurse Advisorfrom https://scholar.google.co.in /scholar? hl=en&as_ sdt=0%2C5&q= McSteen%2 C+K.+L.+ %282010%29.+ Compassion+ fatigue+ in+ oncology+ nursing% 3A+a+ witness+ to+ suffering.+ Oncology+ Nurse+ Advisor%2C+18-22.&btnG=
Meldrum L, King R and Spooner D 2002. Secondary traumatic stress in case managers working in community mental health services, pp 85-106. In: Figley C R (ed.). Treating compassion fatigue. Brunner-Routledge, New York, USA.
Muscatello MRA, Bruno A, Carroccio C, Cedro C, La Torre D, Di Rosa AE ... and Angelone AM 2006. Association between burnout and anger in oncology versus ophthalmology health care professionals. (2): 641-650Psychological Reports 99
Olshansky E 2011. Nursing as the most trusted profession: Why this is important. (4): 193-194Journal of Professional Nursing 27
Oyeleye O, Hanson P, O'Connor N and Dunn D 2013. Relationship of workplace incivility, stress and burnout on nurses' turnover intentions and psychological empowerment. Journal of Nursing Administration 43 (10): 536-542
Pietrantoni L and Prati G 2008. Resilience among first responders. African Health Sciences 8 (3): 14-20
Pisanti R, van der Doef M, Maes S, Lombardo C, Lazzari D and
Violani C 2015. Occupational coping self-efficacy explains distress and well-being in nurses beyond psychosocial job characteristics. . doi: 10.3389/fpsyg. Frontiers in Psychology 62015.01143
Prati G, Pietrantoni L and Cicognani E 2010. Self-efficacy moderates the relationship between stress appraisal and quality of life among rescue workers. (4): 463-Anxiety, Stress and Coping 23470
Robins PM, Meltzer L and Zelikovsky N 2009. The experience of secondary traumatic stress upon care providers working within a children's Hospital. Journal of Pediatric Nursing: Nursing Care of Children and Families 24 (4): 270-279
Rohit R, Yerraguntla K, Gunjawate DR, Guddattu V and Bellur R 2016. Professional quality of life in audiologists and speech language pathologists working in India. Journal of Workplace Behavioral Health 31 (3): 162-172
Rumsey AD 2017. School counselors and secondary exposure to trauma: exploring the relationships between empathy, self-efficacy, burnout, secondary traumatic stress and compassion satisfaction, Ph.D. dissertation, Georgia State University, Atlanta, Georgia.
Schwarzer R and Jerusalem M 1995 Generalized Self-Efficacy Scale, pp 35-37. In: Weinman J, Wright S and Johnston M (eds.). Measures in health psychology: A user's portfolio. Causal and control beliefs Nfer-Nelson, Windsor, UK..
Singh S, Modi S, Goyal S, Kaur P, Singh N, Bhatia T ... and Khushu S 2015. Functional and structural abnormalities associated with empathy in patients with schizophrenia: An fMRI and VBM study. (2): 355-364Journal of Biosciences 40
Sprang G, Clark JJ and Whitt-Woosley A 2007. Compassion fatigue, compassion satisfaction and burnout: Factors impacting a professional's quality of life. (3): Journal of Loss and Trauma 12259-280
Stamm BH 2010. , 2 Ed. Pocatello, The Concise ProQOL Manual nd
ID: ProQOL.org
Thomas J 2013. Association of personal distress with burnout, compassion fatigue, and compassion satisfaction among clinical social workers [Abstract]. Journal of Social Service Research 39 (3): 365-379
Thomas JT and Otis MD 2010. Intrapsychic correlates of professional quality of life: Mindfulness, empathy and emotional separation. Journal of the Society for Social Work and Research 1 (2): 83-98
Wagaman MA, Geiger JM, Shockley C and Segal EA 2015. The role of empathy in burnout, compassion satisfaction and secondary traumatic stress among social workers. (3): 201-Social Work 60209
World Health Organization 2005. 2005, World World health statisticsHealth Organization, Geneva.
Yoder EA 2010. Compassion fatigue in nurses. Applied Nursing Research 23 (4): 191-197
Received , 2021; Accepted June, 202121 March 16
118 Harguneet Kaur

Study of the Personal Factors Influencing Voluntary Turnover amongst Women
Manuscript Number: S-686NAAS Rating: 5.79
Abstract: In a country where the economic and social independence of a woman is dependent on the way households are structured and organised, the rise in their education and decline in their workforce participation rate is an indication of their paradoxical situation. In this study we evaluate the direct effect of the factors in the personal domain of women on her career break decision. The data from 402 Indian women was analysed using Exploratory Factor Analysis and Confirmatory Factor Analysis, which was then followed by Structural Equation Modelling to check the conceptual model developed through literature review. In present study support personal predictors to turnover intention outcome model, confirming the influence of role conflict, role expectation, role perception, stress, financial soundness, role overload and guilt. Role perception and expectation of women were most significant factors influencing turnover intention of women, implying that the most important change needed is for a change in their own mindset and those around them to arrest their exit from the workforce.
Keywords: Voluntary turnover, Female labour force Participation, Role perception, Role expectation
Jeanne Poulose, Vinod Sharma and Priti Dubey1
LNCT University Bhopal-462 042, India CHRIST (Deemed to be University), Delhi NCR-201 003, India
E-mail: [email protected]
Indian Journal of Ecology (2021) 48 Special Issue (16): 119-122
India has one of the world's lowest female workforce
participation rates, this in spite of the tag of the world's
fastest-growing economy. The implications become even
more stark and obvious when faced with the statistic that
India ranks 120 among the 131 countries in the FLPR, female
labour participation rate (Growth 2018). Even if half of the
73% of the female population that is currently out of the
workforce started working, their contribution to the country's
GDP would accelerate the growth of the economy even
further. A study conducted jointly by the World Bank in
collaboration with the National Sample Survey Organisation
revealed that almost 20 million Indian women quit their jobs
between 2004-2012 and around 65-70% of women who quit
never returned to work at all (https://economictimes.
indiatimes.com 2018). The importance of woman at
workplace cannot be undermined. McKinsey (2017) showed
the benefits of having enough women representation in the
workforce, which include the existence of a strong correlation
between presence of women in top management and the
company's financial performance, women leaders were seen
to display 5 out of 9 of the essential leadership behaviours
more often than men leaders.
The detailed review of the literature indicates that there
are numerous 'pushes' and 'pull' factors that influence the
woman's decision to opt out of the workforce (Zimmerman
and Clark 2016, Poulose et al 2021). The pull factors are
present outside the work zone and in her personal life that
pulls her away from her role in the organisation. This includes
role conflict (Cahusac and Kanji 2013), role overload (Boyar
et al 2003), stress (Armstrong et al 2007), financial
soundness , stereotypical role perceptions (Barghini, 2012)
and expectations (Collins and Abhichandani 2016). Kok and
Van der Westhuizen (2003) revealed that stress experienced
by women could not only impact their decision to quit but also
their decision to re-enter. The financial soundness of the
family is yet another significant factor (McClelland et al 2014).
The push factors are those that are present within the work
environment that tends to push her away from her work,
including the nature of the work, the management attitude,
lack of challenges, pay disparity etc. (Hewlett and Luce
2005). This model conclude that people leave their jobs for a
variety of reasons and especially women who leave due to
family related problems need not necessarily be dissatisfied
with their job leading to the specific career decision . Faced
with pressures from home and family, a woman whose role
perception varies from that of a working man will quit
irrespective of her level of satisfaction with the job she holds.
On the basis of the literature review a conceptual framework,
which needed to be validated was developed that explored
the relationship between personal factors and a woman's
decision to take a career break.
MATERIAL AND METHODS
The cross-sectional research design has been used in
this study to answer the research questions and the data has
been analysed through Structural Equation Modelling (SEM).

The measurement scale has been adapted from the various
sources (Table 1). The study finally proposed 30 items, fewer
than eight constructs namely role overload, role perception,
role conflict, role expectation, stress, guilt, financial
soundness and career break. The five-pointer scale was
used in this study for each construct.
The overall scores show that the Cronbach's Alpha
exceeding 0.7 for each construct and therefore, it can be
assumed that internal consistency for this questionnaire has
been achieved (Table 1).
Sample plan: The population of the study was women
working in six major metro cities (Delhi, Mumbai, Bengaluru,
Chennai, Hyderabad, and Kolkata) of India. Since maximum
number of multinational companies function out of these
cities and they account for more than 40% of women
workforce in the country these were chosen. With the
confidence level of 95% and population of the 8.63 crore of
these six major metro cities, the minimum sample size for this
research is 385 with population proportion 50%. In this study
around 1000 questionnaire were circulated and 402 usable
responses were taken into consideration for the final
analysis. The study only concentrates on women who have
quit or re-joined from their job after marriage, therefore
judgmental sampling techniques was applied as it allows
researcher to investigate and qualify the respondents before
the actual data collection (Hair et al 2010).
Pilot testing: The study considered 8 instruments to
measure 8 constructs incorporated into the model. It followed
validity analysis to ensure the accuracy of the instruments
used in this research. The content validity is done through 12
experts selected from academia and industry who have
expert in this area of study (Sharma et al 2018). The wordings
inside the items were well evaluated into its appropriateness
to go for a pilot testing. The pilot testing was carried on 56
responses. 3 items were recorded and 2 items were replaced
from the scale after the suggestions from the expert
committee.
Instrument No of questions Cronbach's Alpha Adapted from
Role overload 4 0.889 Reilly's (1982) role overload scale
Role perception 4 0.878 Bharat (1995)
Role conflict 3 0.912 Voydanoff 1988)
Role expectation 3 0.904 Amatea et al( 1986)
Stress 4 0.871 Coverman (1989)
Guilt 5 0.929 Martínez et al ( 2006)
Financial soundness 4 0.909 Self-administered
Turnover intention (Career break) 3 0.899 Bothma and Roodt ( 2013)
Table 1. Measurement scale
Exploratory factor analysis (EFA) : EFA was applied to test
whether it explains the underlying theoretical structure of the
phenomenon. EFA was executed to extract the sub-
dimensions of role overload, role perception, role conflict,
role expectation, stress, guilt, financial soundness and
career break. The analysis of the data was done with SPSS
23 version and AMOS 25 version.
RESULTS AND DISCUSSION
Confirmatory factor analysis (CFA): Convergent and
discriminate validity were tested using confirmatory factor
analysis on the nine dimensions and they coming out to be
significant. The convergent validity was confirmed through
the values of Composite Reliability (CR>0.7) (Bagozzi and
Yi, 1988) and Average Variance for each dimension
(AVE>0.5) (Hair et al 2010).
The results confirm the same where the value of CR and
AVE found to be well within the fit limit (Table 2). To measure
the discriminate validity the value of AVE shall be greater than
the values of Maximum Shared Variance (MSV) and Average
Shared Variance (ASV) (Gefen et al 2000, Hair et al 2010).
The test results evidence to the discriminant validity for each
dimension where AVE is greater than MSV and ASV.The
structure equation modeling through AMOS was used to test
whether the conceptual framework is similar to the proposed
one. The SEM results confirm that the model is emerging out
to be a good fit with the value of CMIN/DF is 2.107 (Table 3).
The results confirm with previous research (Martinez et
al 2011) and indicate significant relationship between guilt
and career break ( = -0.232; t = -5.311) and hence H01 is β
supported. The analysis indicates that role expectation has a
positive and significant relationship with career break ( = β
0.250; t = 8.378) and hence H02 is supported. This is in
confirmation with earlier studies (Hippel et al 2010) that role
expectations and stereotype threat influences (O'Brien 2019)
work attitudes and the intention to quit the workforce. The
result also confirms that financial soundness is positively and
120 Jeanne Poulose, Vinod Sharma and Priti Dubey

Dimensions CR AVE MSV ASV
Role overload 0.921 0.781 0.166 0.070
Role perception 0.976 0.654 0.350 0.205
Role conflict 0.942 0.677 0.279 0.200
Role expectation 0.902 0.569 0.283 0.188
Stress 0.914 0.688 0.532 0.244
Guilt 0.929 0.598 0.499 0.253
Financial soundness 0.937 0.687 0.376 0.226
Turnover intention 0.911 0.642 0.321 0.202
Table 2. Convergent and discriminant validity
Measure to assess model fit Best-fit measure
CFA results
SEM results
Probability value <0.05 0.000 0.000
Chi Square (CMIN) 188.442 12.641
Degrees of freedom (DF) 95 6
CMIN/DF 1 to 5 1.983 2.107
Goodness of Fit (GFI) > 0.9 0.922 0.956
Comparative fit index (CFI) > 0.9 0.916 0.945
Root mean square residual (RMSEA) < 0.06 0.066 0.051
Table 3. Model fitness indicators
Fig. 1. Structural model
significantly related to career break ( = 0.171; t = 5.514) and β
hence H03 is supported. This is in line with results of studies
conducted in the past . (Sudarshan and Bhattacharya 2009)
This confirms and explains the findings in earlier studies
which revealed that married women entered the workforce
when there was a fall in family income . (Cunningham 2001)
The perception has significant relationship with career break
( = -0.114; t = 3.595) and hence H04 is supported. This β
hypothesis is similar to the previous studies conducted that
confirms that the stereotype beliefs of women themselves
i.e., their own perceptions might lead them to this decision
(Bhatnagar and Rajadhyaksha 2001). Similarly, the analysis
indicates that there is significant relationship of role conflict
with career break ( = 0.213; t = 7.311) and therefore H05 is β
supported. The analysis indicates that there is significant
relationship of role overload with career break ( = 0.113; t = β
3.766) and therefore H06 is also supported and are in
confirmation with the previous studies .(Etzion 2019)
The result indicates that there is positive and significant
relationship between stress and career break ( = 0.374; t = β
10.966) and hence H07 is supported. The study indicated
that the decision to quit was an emotional response to stress.
The role of a parent can be a great source of stress for a
working woman. The path analysis model cumulatively
contributes 87.1 per cent of the change in the dependent
variable that is career break. This is considered to be quite
Relationship Beta (β) t-Value p-Value
Guilt -> CB -0.232 -5.311 0.000
Role expectation -> CB 0. 250 8.378 0.000
Financial soundness -> CB 0.171 5.514 0.000
Role perceptions -> CB 1.114 3.595 0.000
Role conflict -> CB 0.213 7.311 0.000
Role overload -> CB 0.113 3.766 0.000
Stress -> CB 0.374 10.966 0.000
Table 4. Hypotheses testing
Significant level= *p<0.05, t>1.64
good as this is among the very few studies in the country
which tries to capture the personal factors leading to career
break decision.
CONCLUSION
This study is enormously relevant since most studies on
career break are based on samples from the west and scanty
in India - a country where presently over 70% of women are
out of the workforce. The findings of this study support all the
initially proposed relationships among the constructs,
suggesting that the problems women face remains the same
on both sides of the hemisphere.
The role expectation and perception are the most
significant predictors of turnover intention have considerable
implications. The strain on a woman's resources driven by
family, self and society's expectations from multiple roles
experiences must be pulling her away from work.
Additionally, the role perception indicates that woman herself
is largely to be blamed for her predicament. This is evidenced
by the result that majority of the respondents perceived
121Personal Factors Influencing Voluntary Turnover amongst Women

themselves primarily as caregivers and 65% of the
respondents were contributing to less than 40% of the family
income This could be attributed to the culturally deep-rooted
gender stereotyped beliefs and the patriarchal mind-set
woven into the socio-economic fabric of the nation. Since two
thirds of the respondents were women with children the
findings pertaining to guilt, stress and role overload was not
surprising. This study has certain limitations. The sample
studied is inadequate to generalise the findings to all women
in India. From a research standpoint is imperative to extend
this study to check for the indirect influence of the predictors
mediated through work and life attitudes on the turnover
intention.
Summing up all the findings, we may conclude that
larger and concerted effort from all including woman herself
is needed to break the barriers of role perceptions and
expectations found impeding her progress. Woman must
change first before she can witness change all around.
REFERENCESAmatea ES, Cross G, Clark JE, and LC 1986. Assessing the work
and family role expectations of career-oriented men and women: The life role salience scales. Journal of Marriage and Family 48(4): 831-838.
Armstrong DJ, Riemenschneider CK, Allen MW and Reid MF 2007. Advancement, voluntary turnover and women in IT: A cognitive study of work-family conflict. Information and Management44(2): 142-153.
Bagozzi, RP and Yi Y 1988. On the evaluation of structural equation models. (1): 74-Journal of the Academy of Marketing Science 1694.
Barghini T 2012. Educated women quit work as spouses earn more. Retrieved from www.reuters.com.
Barnett RC and Baruch GK 1985. Women's involvement in multiple roles and psychological distress. Journal of Pereonality and Social Psychology 49(1): 135-145.
Bharat S 1995. Attitudes and sex-role perceptions among working couples in India. (3): Journal of Comparative Family Studies 26371-388.
Bhatnagar D and Rajadhyaksha U 2001. Attitudes towards work and family roles and their implications for career growth of women: A report from India. (7/8): 549-565.Sex Roles 45
Bothma CF and Roodt G 2013. The validation of the turnover intention scale. . SA Journal of Human Resource Management11(1): 12.
Boyar S, Maertz Jr C, Pearson A and Keough S 2003. Work-family conflict: A model of linkages between work and family domain variables and turnover intentions. Journal of Managerial Issues15(2): 175-190.
Cahusac E and Kanji S 2013. Giving up: How gendered organizational cultures push mothers out. Gender Work & Organisation 21(1): 57-70.
Collins JC and Abhichandani Y 2016. Change in the face of resistance: Positioning hope for women returnees to the indian workforce. (1): Advances in Developing Human Resources 1811-25.
Coverman S 1989. Role overload, role conflict, and stress: Addressing consequences of multiple role demands. Social Forces 67(4): 965-982.
Cunningham W 2001. Breadwinner or Caregiver? How Household Role Affects Labor Choices in Mexico. World Bank Policy Research working paper No 2743. World Bank, Washington, DC.
Elvin-Nowak Y and Thomsson H 2001. Motherhood as idea and practice: A discursive understanding of employed mothers in Sweden. (3): 407-428.Gender and Society. 15
Etzion D 2019. Work, vacation and well-being A Psychological P e r s p e c t i v e . s t R o u t l e d g e . ( 1 e d . ) : 2 8 2 . https://doi.org/10.4324/9781315890029.
Gefen D, Starub D and Boudreau M 2000. Structural equation modeling and regression: Guidelines for research practice. Communications of AIS 7(7): 1-78.
Growth WI 2018. Opportunities and Challenges? Empowering Women and Girls in India for the fourth Industrial Revolution. Retrieved from https://www2.deloitte.com. p 14.
Hair JF, Black WC, Babin BJ and Anderson RE 2010. Multivariate Data Analysis: A Global Perspective th (7 ed.). New Jersey: Pearson Prentice Hall, USA. P. 388
Hewlett SA and Luce CB 2005, March. Off-Ramps and On-Ramps: Keeping Talented Women on the Road to Success. Harvard Business Review.
Hippel CV, Issa M, Ma R and Stokes A 2010. Stereotype threat: Antecedents and consequences for working women. European Journal of Social Psychology 41(2): 151-161.
Kok M and Van der Westhuizen PC 2003. Problems experienced by women re-entering the education profession: A south african case study. (1): 65-70.South African Journal of Education 23
Lee TW and Mitchell TR 1994. An alternative approach: The unfolding model of voluntary employee Turnove. Academy of Management Review 19(1): 51-89.
Martínez P, Carrasco MJ, Aza G, Blanco A and Espinar I 2011. Family gender role and guilt in spanish dual-earner families. . Springer65: 813-826. https://doi.org/10.1007/s11199-011-0031-4
McClelland R, Mok S and Pierce K 2014. Labor Force Participation Elasticities of Women and Secondary Earners within Married Couples. Washington DC. Congressional Budget Office. The Internal Revenue Services, USA: p 1-36.
Mckinsey & Co 2017. Women matter - Time to accelerate. Mckinsey & Co: p 19.
Nunnally JC 1970. Introduction to psychological measurement. McGraw-Hill 125, New York. : p. 125
O'Brien S 2019. How to Recruit More Women to Your Company. www.hbr.org. 28/11/2019.
Parasuraman S and Alutto JA 1984. Sources and outcomes of stress in organizational settings: Toward the development of a structural model. (2): The Academy of Management Journal 27330-350.
Poulose J, Reddy KP and Sharma V 2021. Influence of career re-entry enablers on job search outcomes: COVID strengthening the disparity virus? (14): 80-84. Indian Journal of Ecology 48
Reilly MD 1982. Working wives and convenience consumption. Journal of Consumer Research (4): 407-418.8
Sharma V, Joseph S and Poulose J 2018. Determinants of consumer retention strategies for telecom service industry in Central India. Problems and Perspectives in Management 16(2): 306-320.
Sudarshan RM and Bhattacharya S 2009. Through the magnifying glass: Women's work and labour force participation in urban Delhi. (48): 59-66.Economic and Political Weekly 44
Voydanoff P 1988. Work role characteristics, family structure demands, and work/family conflict. Journal of Marriage and Family 50(3): 749-761
Zimmerman L and Clark M 2016. Opting-out and opting-in: a review and agenda for future research. Career Development International 21(6): 603-633.
Received February, 2021; Accepted 06 July, 202108
122 Jeanne Poulose, Vinod Sharma and Priti Dubey

B-school Teachers' Competencies owards Excellent Learning TOutcomes in Business Education
Manuscript Number: S-687NAAS Rating: 5.79
Abstract: To a B-school, evaluation of its teachers' competence and commitments is a significant step towards achieving professional excellence in management/business education. B-school teachers need a well-specified teaching philosophy, high level of pedagogical skills, emotional intelligence, and attitude relevant to promote the holistic development of students. Through a competency-based framework, B-schools can develop their teachers and create a competitive advantage in delivering business skills. This review study experienced the need to ascertain different competencies along with possible dispositions of each ascertained competency. It would inspire teachers to recognize their level of competence actually needed, so they can develop themselves.
Keywords: B-school, Business education, Competency, Competency mapping, Faculty development, HRD, Higher education development
Chandan Maheshkar and Jayant SonwalkarM.P. Bhoj (Open) University, Bhopal-462 016, India
E-mail: [email protected]
Indian Journal of Ecology (2021) 48 Special Issue (16): 123-128
Every individual inherits some resources like
knowledge, skills, and attitude to perform different activities
involved in job role(s) and needs to add these resources to
make a persuasive combination and experiment with the
different combinations of these to achieve potential
outcomes. The development of B-school teachers should
focus on enhancing their competencies instead of preparing
them for moving to the profession. The development of
competent business/management teachers is very critical to
B-schools in a way to address the needs of both business the
and the society (Maheshkar 2019, Sonwalkar and
Maheshkar 2017a, 2017b). This issue has notified the need
to ascertain different competencies along with possible
dispositions of each ascertained competency and develop a
competency framework for assuring the effectiveness of
business education. If a competency framework developed
conducive to business education, it would make education
delivery contextual and effective. The role of competencies
is to enable organizations to build their competitive
advantage by providing a framework for the human resource
function to focus its efforts in developing the capacity of
employees. Core competency is rooted at the individual level
and well connected with institutional competitiveness. Its
concept, factors, and contexts affect employee selection and
development, institutional development, and competency
management functions. Professional competence consists
of being able to combine personal resources (i.e.,
knowledge, abilities, experiences, emotions, attitude, etc.) to
produce competent action (Lustri et al 2007). Competency
mapping of B-school teachers doesn't only help the
university-affiliated B-schools in India by providing them a
“ ” for their entire behavioral scope that formulates Blue-print
excellent performance, but also can provide an important and
useful tool to develop and execute teacher development
programs (Sonwalkar and Maheshkar 2017b). The issue of
competency has been raised over a century for all walks of
life. The need for competence is also seriously understood
for B-school teachers because they not only shape the future
of students but also help in shaping business practices and
society. It has a cascading effect on social norms, life
practices, and consumerism (Sonwalkar and Maheshkar
2017a, Maheshkar 2015). Looking at the importance of B-
school teachers' competence in the effectiveness of
business/management education, a comprehensive review
of the subject has been done in the subsequent sections.
Competency: Meaning and Significance
The contextual use of needed competency and
institutional needs both reflect the meaning of the
terminology (Sonwalkar and Maheshkar 2017b). In the most
generalized way, competency can be conceptualized as a
cross-functional combination of knowledge, skills, and
attitude that could be found in different individuals in different
extents. David McClelland (1973) proposed, it is a term used
to challenge traditional criteria of assessment, which had
emphasized intelligence evaluation (Vathanophas and Thai-
nagam 2007, Mustafa and Surbhi 2014). Mansfield (2004)
has presented a broader view of competency, and mentioned
that competent people were those who followed rules and
procedures without question-competency meant
compliance” that stressed the need for personnel to take

more responsibility and adaptability (Lavanya 2011, Kavua
and Ngugi 2014). Personal characteristics may be
mental/intellectual/cognitive, social/ emotional/attitudinal,
and physical/ psychometric attributes necessary to perform
the job . Thus, competencies become performance
standards to support an institution's vision, mission,
strategies, and goals by adding considerable value to it. In
reality, the term competency varies due to the underlying use
of epistemological assumptions. In general, there are two
approaches, the behaviorist approach (rationalist
perspective) and constructivist approach (subjectivist
perspective) (Boon and Klink 2001). A rationalist perspective
suggests competency as a specific set of attributes used in
performing a job (Sandberg 2000), where competence has
been defined in two ways: work oriented approach and task-
oriented approach and the subjectivist approach considers
the worker and the work as a single entity because of the lived
experience of work, which focuses on the interaction
between the individual and job.
In terms of teaching, competent teachers are usually
creative 0) and always trying to find new ways to improve
their teaching and student learning (Simplicio 2005).
Maheshker (2019) has most described the relevance of
competencies to B-school teachers in doctoral work. These
are the characteristics of a B-school teacher that lead his/her
teaching practices; mainly, demonstration of knowledge of
his/her related area of study, selection of teaching tools,
setting-up a learning culture, and value-based development
of compulsory skills and attitude in students. B-schools are
expected to supply the gray workforce to industry and keep
management/business education relevant to the business
world. The quality of B-school teachers is primary to the
quality of management education. Many teachers are highly
qualified and ranked high in excellence, but are either
ineffective in education delivery or not in students'
accessibility. Kallapur (2016) mentioned unfortunately, due
to lack of encouragement for academics and research over
the years, educational institutions have not been able to
attract and retain talented research-driven teaching staff.
Thus, there is a strong need to re-evaluate the profile of the B-
school teaching profession for introducing a rational and
sustainably resourced system for selection, recruitment, and
professional development of teachers based on a clearly
defined blend of competencies required that ultimately
contribute to the effectiveness as well as the quality of
business education (European Commission 2012).
Present Scenario of Indian B-schools Teachers
Continuous increase in the global as well as domestic
competitiveness of business practices enforcing B-schools
to be more competent in the supply of quality graduates and
postgraduates. As the most important resource, teachers
play a critical role to produce skilled graduates as well as
simultaneously in the establishment of education standards
(Santiago and Francisco 2009). Creating an academic
landmark in terms of institutional efficiency, effectiveness and
commitment largely depends on highly skilled and
resourceful teachers. En route for the same, it is essential to
identify the configuration of competencies required to be a
competent B-school teacher and the dimensions of individual
performance that could be extended. Globalization and ICT
advancements have affected the fundamental design of
management/business education (Gill and Lashine 2013)
and the role of a business educator and ultimately the role of
B-schools. An educator playing a significant role in the
educational development of a country, no matter he/she
approaches his/her responsibilities actively or passively. The
quality, the competence, and the character of teachers are
among most significant factors which influence the quality of
education and its contribution to national development and
for improving the B-schools' institutional competence and
quality, highly-skilled, well-resourced, and motivated
teachers are needed (OECD 2009, Maheshkar 2019). A
management/business educator is necessarily recognized
as a person of higher intellect (Basu and Basu 2011). The
teaching competence of a teacher can be seen as an
integration of competencies, where related knowledge and
attitude are conditionally associated with teaching
performance and make teachers able to function effectively
(Mulder 2009). Management/business teachers need a
strong foundation in their area of specialization and the
knowledge of possible dimensions of teaching and learning
practices to make their teaching contextual and unique (Frost
and Fukami 1997). It is crucial, what students gain from the
collegiate studies that make them feasible for future work
roles (Hartman et al 2015). In this context, teachers' teaching
competencies are responsible to fabricate their students
according to the skill needs of the industry.
Indian B-schools have completely been turned into
business prepositions excluding a few; all are successfully
producing postgraduates in quantity instead of quality. B-
schools are only focusing on theory and quantitative
analysis, instead of developing interpersonal excellence and
qualitative thinking in their students. An imbalance between
the competencies of B-school teachers and the competency-
based teaching practices needs to be resolved to develop
students for their on-the-job role (Jainand Kamal 2010).
Thus, there is a strong need to re-evaluate the profile of the B-
school teaching profession for introducing a rational and
sustainably resourced system for recruitment, selection, and
professional development of B-school teachers based on a
124 Chandan Maheshkar and Jayant Sonwalkar

clearly defined blend of competencies required by the B-
school teaching profession that ultimately contribute to the
effectiveness as well as the quality of academics (European
Commission 2012). Looking to the importance of the impact
of competencies of B-school teachers on the educational
quality of students and the institutes, a comprehensive
analysis of competencies is required (Sonwalkar and
Maheshkar 2017a, 2017b, Maheshkar 2019) that must be
focused on competencies (knowledge, skills, and attitudes)
needed by the profession; how these can be understood,
explained and organized with the intention of competency-
orientation of teachers as well as to align B-school curriculum
with the industrial demand of competencies; and how to map
competencies and decide the ways develop these
competencies (European Commission, 2013). Therefore,
understanding a range of teaching competencies associated
with management/business teaching, and preparing a
conceptual framework for mapping these competencies is a
key challenge.
Academic Competencies for Effective Business
Education
Every job/profession needs related knowledge as well
as relevant behavior that contribute to the profession. B-
school teaching is not just following a cluster of pre-specified
practices. Essentially, teaching is the course of delivering
knowledge, skills, and attitude along with significant values.
In the present time, academicians usually struggling with the
overlapping and sometimes competing for demands of the
real world, managing courses, generating funds, providing
pastoral care to students, and teaching students in a way that
develops competencies necessary to start a career in the
corporate. Teachers are responsible to reconcile and meet
the demands of key constituencies even at the same time
driving advanced knowledge and understanding. Here,
acquisition of knowledge is not the major concern of
education, but the utility of acquired knowledge is prior
(Maheshkar 2019, 2015, Sonwalkar and Maheshkar 2017a,
2017b). In the present context, understanding the human
side of B-school teaching, the relationship dynamics at the
workplace and channelizing the talent towards the
achievement of the profession's objectives is a very
challenging job. This review has recognized that mapping
and development of competencies are foremost to answer
the stated issues towards the professional development of B-
school teachers.
It is a key challenge to identify and understand the
complex range of b-school teaching competencies. Gould
and Miller (2004) based on qualifications and competencies
of workplace trainers, itemized the trainer competencies.
Guntuku and Meesala (2013) observed that these
competencies are similar to business/management teachers
and are deciding goals and objectives for the institute,
programs, and course; lesson planning; contextual;
assessing needs; guidance and counseling; provide support
and cooperation; able to mix various teaching tools; develop
and promote participation; promote learning in groups;
respect individual differences; evaluation of teaching and
learning; assessment of teaching and learning materials;
developing instructional design; maintaining trustworthiness;
demonstrate and promote effective communication; aligning
content and targeted skills; presentation skills; response to
feedback in a positive manner; performance evaluation;
effective instructional del ivery; research skil ls;
understanding of development needs; and relationship
building.
Voss et al (2010) have identified approachability,
empathy, enthusiasm, expertise, fairness, friendliness,
helpfulness, openness, reliability, and teaching skills as
teacher qualities. However, these teaching qualities have
significance, but only when these are liable to produce some
definite learning outcomes. The following are proposed
learning outcomes that desired from B-schools (Moskal et al
2008) include problem solving via analytical and statistical
skills, communication skills, content specific knowledge (e.g.
concepts, theories, and their applications in real-time
situations),critical thinking skills, ethical understanding and
consideration, environmental awareness, inspirational and
leadership skills, understanding and respect for diversity
(e.g. demographic and cultural differences), leadership and
organizational skills, applications of information and
communication technology and ability to understand
individual and group dynamics.
Through the reference of the competency framework of
the , Department of Education and Training Western Australia
(2004), B-school teachers are expected to have the following
proficiencies:
Engaging students in purposeful learning experiences;
Using exemplary teaching strategies and techniques
that meet the needs of individual students as well as
classes of students in a highly responsive and inclusive
manner;
Apply an inclusive system of assessment and reporting
in student learning;
Reflect critically upon professional experiences in order
to enhance self as well as institutions' professional
effectiveness;
Participate actively in curriculum development, and
quality improvement and maintenance activities;
Practicing highly responsive and inclusive assessment
125Teacher Competencies in Business Education

and reporting strategies relevant to the expected
learning outcome of teaching;
Engaging in a variety of learning activities to promote the
development of the learning community;
To offer leadership by assuming a key role in the
development processes of B-school including
curriculum planning and policy development.
Bakhru (2014) has identified the 15 teacher
competencies, which are categorized into three levels. The
level-1 competencies are-Emotion Handling and
Persistence, Knowledge and Information Orientation,
Communication Skills, Concern for Standard and
Achievement, and Mental Skills. The level-2 holds
Knowledge and Information Orientation, Communication
Skills, Interpersonal Management, Planning and Organizing,
and Occupational Attachment and Organizational Setting.
And level-3 competencies are- Occupational Attachment and
Organizational Setting, Impact and Influence, Knowledge
and Information Orientation, Communication Skills, and
Discipline and Delegation. There is a significant effect of B-
school's category/type on teaching competence of teachers,
mainly on their communication skills, conceptual thinking,
knowledge orientation, mental skills, and concern for
standards and achievement.
In the most recent doctoral work academic
competencies, behavioral competencies, management
competencies, and teaching philosophy to be effective in
their academic role. He has ascertained 17 academic
competencies, B-schools need in their teachers: knowledge
of subject matter; optimum pedagogy; classroom
management; managing student learning; student
evaluation and feedback; guidance and counseling;
grievance redressal; research and theory building; digital
scholarship; art of inquiry; information management; content
command; curriculum design, development and deployment;
academic communication; experimentation in teaching and
learning; collaboration with knowledge community; and
academic writing. Faculty development programs are also
reduced to the level of formal certification for promotion
purposes. Even top management institutes who pioneered
the efforts of FDP like IIMs also have not been able to
contribute to the development of standardized faculty
development techniques and have not been able to come to a
common conception on the competencies required for being
an effective teacher in management education Most of the
FDPs copy the western model for FDP syllabi and pedagogy.
Skillset/competencies and the methods to develop them
have not been finalized yet.
Need for Competency Mapping
Competency mapping is continuously gaining attention
as the economic and business competition is continuously
i nc reas ing . In th i s compet i t i ve en v i ronment ,
institutions/organizations are concerned about taking
competitive advantage, so that they are putting notable
efforts to acquire competent employees who are proficient in
their offered roles and committed to their role-specific
responsibilities. Competency mapping gives a truthful
analysis of one's capabilities, skill gaps, and possibilities for
needed development. Since, business competition and
economic growth have inverse association i.e. increasing
competition slowing down the economy, which has created a
war among organizations for acquiring potential resources
and their optimum utilization (Maheshkar 2019). In today's
uncertain business settings, it is crucial for organizations to
perform an assessment of their employees' role-specific
competencies as well as organizational competence as a
whole, keep monitor changes required, and have the
courage to accommodate those changes promptly. In this
realm, the responsibility of B-schools has increased and
automated a demand for teachers with relevant
competencies . Evaluation of competencies will thus play a
key role in providing information as to where the particular
teacher is and where he/she wishes to reach. The
information on competencies will also help teachers to be
perfect in their academic role. Indian B-schools do not reward
their faculty members with most of the honors like US B-
schools doing (Sonwalkar and Maheshkar 2017a, 2017b).
Teachers are expected to perform in all the direction of work
like teaching, in community and social responsibility, and also
in research and consultancy. It must be ensured that the
overall development of the teacher in the journey from
lecturer to the reader and the professor, adequate
opportunities be provided to him to get developed in the
overall teacher. Neither institutions nor most of the teachers
are aware of the competencies required to be a complete
teacher.
Indian B-schools have seldom tried to develop a
standardized framework, specifically for B-school teachers.
By and large, they have relied on western studies in this
respect. Scant efforts conducted on an individual basis did
not result in creating any substantial knowledge base for
standardization of educational quality in the country. The
regulatory bodies like AICTE/ UGC also did not pay any
attention to creating and nurturing these competencies. The
requirement for becoming a B-school faculty was restricted to
doing a Ph.D. only. It was assumed that by doing a doctoral
degree, one is qualified to become B-school faculty which is a
big misnomer. Most of the time a good researcher does not
prove to be an effective teacher and/or vice versa. With the
growth of several B-schools in India, the demand for teachers
126 Chandan Maheshkar and Jayant Sonwalkar

also rose many times, but there was no effort from any
stakeholder to develop a framework or a system to make
competent teachers (Sonwalkar and Maheshkar 2017a,
2017b, Maheshkar 2019). Apart from developing a
framework of competencies required to be a B-school
teacher, few new practices are also required to be adopted by
the Indian B-schools to not only expose the faculty members
to the field realities but also, to make them effective teachers.
Some of the actions proposed below will help in developing
B-school teachers to deliver expected results to develop
future managers (Sonwalkar and Maheshkar 2017a, 2017b).
Internship of faculty in business houses: It is required for
giving experience to faculty members in their area of
operation which shall result in effective teaching and
enhancement of knowledge about the industry and their field
of specialization.
Improving research skills: This will greatly help improve
the research output and get recognized by the academic
fraternity in and out of India and their class performance will
also improve.
Teach them how to teach: Because of many reasons B-
school faculty get scant opportunities to learn about “How to
teach” and hence even with sincere efforts most of them lack
effective delivery and have poor output management. If they
are given honest training on how to handle the class it will not
be left to the try and error for them to learn how to teach
effectively that will save many precious years for them and
also help students get appropriate environment,
encouragement, and enhanced learning.
CONCLUSION
Every institution wants to become a leader in its
functional domain. They should identify the area in which
they wish to gain supremacy and then in a planned manner
they should develop these areas of knowledge. To do this
effectively, they need to define jobs, job titles, roles, and
competencies needed for acquiring the expected level of
academic as well as administrative excellence. There is no
harm in evaluating and assessing the teachers on specific
scales developed for the purpose and providing them
feedback to make up the gaps for developing them to the
expected level. In the existing practice, it is left to the
individual faculty member to develop and prove him/herself in
the area of his/her expertise. The vision of the institution can
always be synchronized with the individual goals to not only
develop the expert area also develop creativity and
innovation in the research. There is an urgent need to have a
common consensus on the minimum number of
competencies required to B-school faculty and then to
propagate the development of such competencies amongst
existing and future B-school teachers. These efforts can be
initiated and implemented by the regulatory authorities and
other stakeholders. This need has been so far neglected
which has resulted in the poor placements and poor
acceptance of B-school graduates in the industry.
REFERENCESBakhru KM 2014. Competencies for Effective Management
Teaching - Perception of Teachers and Administrators of Indian B-Schools. Doctoral Thesis. Jaypee Business School, Noida, India.
Barr AS 1948. Measurement and prediction of teaching efficiency: A summary of investigations. Journal of Experimental Education16(4): 203-283.
Basu S and Basu R 2011. Competency Factors of B-school Teachers in Kolkata. In Proceedings 10 National Conference of Pioneer th
Institute of Professional Studies.
Boon J and van der Klink M 2002. Competencies: The triumph of a fuzzy concept. In proceedings of Academy of Human Resource Development Annual Conference (27 February - 3 March,), Honolulu, HA, 1:327-334.
Brown JS and Duguid P 2000. . Boston, The Social Life of InformationMA: Harvard Business School Press.
Commonwealth Report 1974. Teacher education in changing society. Commonwealth Conference on Teacher Education. London: Commonwealth Secretariat.
DoE 2004. Competency Framework for Teachers. Department of Education, Govt. of Western Australia. Retrieved on June 15, 2019. http://det.wa.edu.au/policies/detcms/policy-planning-and-accountability/policies-framework/guidelines/competency -framework-for-teachers.en?cat-id=3457997
Ellstrom PE 1997. The many meanings of occupational competence and qualification. Journal of European Industrial Training21(6/7): 266-273.
European Commission 2012. Rethinking Education: Investing in skills for better socio-economic outcomes.
European Commission 2013. Supporting Teacher Competence Development. Retrieved January 10, 2020. https://ec.europa. eu/assets/eac/education/experts-groups/2011-2013/teacher/ teachercomp_en.pdf
Frost PJ and Fukami CV 1997. Teaching effectiveness in the organizational sciences: Recognizing and enhancing scholarship of teaching. Academy of Management Journal40(6): 1271-1281.
Gill A and Lashine S 2003. Business education: A Strategic market-oriented focus. International Journal of Educational Management (5): 188-194. 17
Gould D and Miller P 2004. Qualifications and competencies held by effective workplace trainers. Journal of European Industrial Training (1): 8-22.28
Guntuku R and Meesala A 2013. Developing a management teacher competency scale for indian context. TRANS Asian Journal of Marketing & Management Research (5): 14-26. 2
Hartman F Z, Bann C, Barton B and Pearce K 2015. Making a Difference: Faculty Development in Competency-based Education.
Hersey GL, Gargeya VB and Eatman J 1996. Are business doctoral graduates prepared to teach? (1): 17-26.Selections 13
Jain KK and Kamal KK 2010. Reassessing the curriculum-competency alignment in MBA programs. Journal of Management and Strategy (1): 68-75. 1
Jubb R and Robotham D 1997. Competencies in management development: challenging the myths. Journal of European Industrial Training (5): 171-175.21
Kallapur S 2016. In Sinha A, The Dimming Guiding Light at B-
127Teacher Competencies in Business Education

s c h o o l s . R e t r i e v e d o n D e c e m b e r 1 7 , 2 0 1 6 . http://www.greatlakes.edu.in/sites/default/files/The_Dimming_Guiding_Light_At_B-Schools.pdf
Kandula SR 2013. Competency-Based Human Resource Management. Delhi, India: PHI Learning.
Kavua BK and Ngugi K 2014. Determinants of procurement performance of rural electrification projects. European Journal of Business Management (11): 361-377. 1
Lahti RK 1999. Identifying and integrating individual level and organizational level core competencies. Journal of Business and Psychology (1): 59-75.14
Lavanya BL 2011. A study on individual competencies: An Empirical study. (3): 162-172.Asian Economic and Financial Review 1
Lustri D, Miura I and Takahashi S 2007. Knowledge Management Model: Practical application for competency development. The Learning Organization :186-202.14
MacNamara M, Meyler M and Arnold A 1990. Management education and the challenge of action learning. Higher Education (4): 419-433.19
Maheshkar C 2015. Need for competency mapping scale to map the competencies of university teaching personnel. Journal of Management Research and Analysis (4): 273-276. 2
Maheshkar C 2019. A Study of Evaluation of Competency Mapping Scales in Management Doctoral Thesis Education. . Institute of Management Studies, Devi Ahilya University, Indore, India.
Mansfield B 2004. Competence in transition. Journal of European Industrial Training : 296-309. 28
McClelland DC 1973. Testing for competence rather than for intelligence. : 1-14.American Psychologist 28
Moskal P, Ellis T and Keon T 2008. Summary of assessment in higher education and the management of student learning data. Academy of Management Learning and Education (2): 269-7279.
Mulder M, Gulikers J, Biemans H and Wesselink R 2009. The new competence concept in higher education: Error or enrichment. Journal of European Industrial Training (8/9): 755-770.33
Munro A and Andrews B 1994. Competence: Dialogue without a Plot? : 12-15Executive Development 7
Mustafa and Surbhi 2014. Competency mapping: A drive for HR excellence in IT industry. (4): 1343-1351.IJABER 12
OECD 2009. Teacher evaluation: A conceptual framework and
examples of country practices. OECD-Mexico Workshop towards a Teacher Evaluation Framework in Mexico: International Practices, Criteria and Mechanisms, Mexico.
Olivar P 1972. (2nd ed.). Scranton, The Secondary School TodayPennsylvania: International Textbooks.
Pillai L and Vallathurai L 2003. Total Quality Management for Higher Education . Bangalore, India: NAAC.
Raven J 1984. . Dinwiddie Grieve: Competence in Modern SocietyEdinburgh.
Rifkin K, Fineman M and Ruhnke C 1999. Developing technical managers: First you need a competency model. Research Technology Management (2): 53-57.42
Sandberg J 2000. Competence the basis for a smart workforce. In R. Gerber & C. Lankshear (Eds.) . Training for a Smart WorkforceLondon: Routledge.
Santiago P and Benavides F 2009. Teacher Evaluation: A Conceptual Framework and examples of Country Practices. OECD. Retrieved Aug. 16, 2015. http://www.oecd.org /edu/school/44568106.pdf
Sonwalkar J and Maheshkar C 2017a. Business/Management Teaching Competencies: A Holistic Outlook of Indian B-school Teachers. In Arora S, Chowdhary R, Phatak Y and Sharma R K (Eds.), Global Competitiveness - Developing Competencies and Skills. New Delhi, India: Excel India Publishers. p. 237-245.
Sonwalkar J and Maheshkar C 2017b. Need for competency mapping of b-school teachers? TKM International Journal for Research in Management (1): 40-47. 2
Sugumar VR 2009. Competency Mapping of Teachers in Tertiary Education.
Travers RMW 1973. . Second Handbook of Research on TeachingChicago: Rand McNally Publishing.
Tripathi P and Ranjan J 2010. A Competency mapping for educational institution: Expert system approach. International Journal of Computer and Communication Technology (1): 75-293.
Vathanophas V and Thai-nagam J 2007. Competency requirements for effective job performance in the thai public sector. Contemporary Management Research (1): 45-70. 3
Voss R, Gruber T and Reppel A 2010. Which classroom encounters make students happy or unhappy? Insights from an online CIT study. (7): International Journal of Educational Management 24615-636.
Received 21 March, 2021; Accepted 06 July, 2021
128 Chandan Maheshkar and Jayant Sonwalkar

Perceived Organizational Support, Employee Engagement and Organizational Citizenship Behaviour among Knowledge
Workers of R&D Organization
Manuscript Number: S-688NAAS Rating: 5.79
Abstract: The reflections of professional life hold an imperative value for an employee. The I/O relationship depends upon myriads of factors. For the sustainability of individual and organization, the internal organization in which the employee operates should provide nurturance and growth to the employee. This study examined perceived organizational support as an antecedent of employee engagement and organizational citizenship behaviour as it`s consequence. The present study employs an ex-post facto research design. 300 knowledge workers (scientists) were assessed on work and organizational engagement, perceived organizational support and organizational citizenship behaviour. Results indicated that perceived organizational support emerged as a significant predictor of work and organizational engagement and organizational citizenship behaviour emerged as a significant consequence of employee engagement. For mediation analysis Baron and Kenny`s (1986) framework was employed and observed that employee engagement partially mediated the relationship between perceived organizational support and organizational citizenship behaviour.
Keywords: Employee engagement, Work engagement, Organizational engagement, Perceived organizational support, Organizational citizenship behaviour
Akancha SrivastavaDepartment of Psychology, CHRIST (Deemed to be University), Delhi NCR-201 003, India
E-mail: [email protected]
Indian Journal of Ecology (2021) 48 Special Issue (16): 129-134
The reflections of professional life hold an imperative
value for an employee. The I/O relationship depends upon
myriads of factors. For the sustainability of individual and
organization, the internal organization in which the employee
operates should provide nurturance and growth to the
employee. Since professional are spending quality time with
our work, organizations have become our “second home”. If
the work place is not cordial, it could have devastating
consequences on employee as well as on organizations. At
workplace an employee invests psychological and cognitive
resources and subsequently other spheres of life get
affected. Work places which are full of negativity, effects our
performance, health and well-being.
Positive organizations are those organizations which
work upon the employee's strength rather than fixing their
weakness. They move from complexity to simplicity without
losing the essence of committed work. The positive
organization becomes the centre of excellence for
employees and provides nurturance to the employees by
accepting their failures and celebrating their achievements.
Caprino (2013) states that positive organizations are the
places where, there are abundant resources, talents, abilities
and strengths within and around you in your organization, if
you are attuned to them, and know how to bring them to the
forefront. Positive organizations can make employees
engaged in their work as they provide fulfilling experiences
for the employees. Positive organizations enable employees.
The prevailing environmental condition is based on the
concept of knowledge-based economy. For creating
sustainable competitive advantage organizations have
realized that they need to engage their knowledge workers.
In R and D organizations knowledge workers are designated
in capacity of scientists, engineers, data analyst etc. Patil
and Biswas (2014) maintained the fact that Rand D is an
imperative activity for the economy of country as it ensures
sustainable development and serves as a tool for
organizations to accomplish potential intensification. It
enables organizations to create innovative and novel product
and technologies. Exploration, analysis, and enquiry serve
integral activities for research and development In order to
understand the dynamics of engagement in R and D
organization the current study proposes to identify the
predictors and consequences of engagement. Keeping this
framework, it was felt that an understanding of the inter play
between engagement and its predictors is a vital factor for
organizational effectiveness. However, to date there is
dearth of research that has explored engagement within the
R and D. The development of the concept of Perceived
Organizational Support (POS) can be traced back to
Organizational support theory (Eisenberger et al 1986).
Based on the reciprocity norm POS would generate a felt
obligation to care about the organizations welfare and help

the organization to reach its objectives (Rhoadeset al 2001).
Saks, (2006) opined that that POS might lead to positive
outcomes is through employee engagement and predicted
both job and organizational engagement. Cohen and
Higgins (2007) reviewed related research and after
combining it with observation and experience they concluded
that engaged employees are more likely to give discretionary
effort above contractual obligations (i.e. work additional
time). Various researches have examined employee
engagement as mediator variable. A mediator is a state,
which is a temporary condition of mentality or mood,
transitory level of arousal or drive, and currently evoked
activities, behaviour, or process (Wu and Zumbo 2008).
Biswas and Bhatnagar (2013) have assessed the mediating
role of employee engagement between perceived
organizational support (POS) and person job (P-O) fit as
antecedents and organizational commitment and job
satisfaction as the consequences. The findings suggested
that there is a direct effect of P-O fit and POS, which affects
employee engagement and leads to variance in
organizational commitment and job satisfaction.
MATERIAL AND METHODS
Participants: Participants included 300 scientists of Delhi
based government Defence R&D organization. These
scientists serve as knowledge workers. The current study
utilized primary data. Data was collected from the entire Delhi
based research laboratory.
Design : The present study employs ex post facto research
design. Ex post fact study or after-the-fact research is a
category of research design in which the investigation starts
after the fact has occurred without interference from the
researcher. The majority of social research, in contexts in
which it is not possible or acceptable to manipulate the
characteristics of human participants, is based on ex post
facto research designs.
Measures: Demographic information: Organizational
profiles of the respondent were taken out by reporting some
of their organization related details. These included age,
gender, education, rank, length of service in current
organization, number of training and development programs,
number of organizations previously worked in, tenure of
working in previous organization, and pay band.
Employee engagement: Two scales were used to measure
employee engagement. Utrecht Work Engagement Scale
(UWES) Schaufeli and Bakker (2003). It is a 17 item scale
constituting three aspects of work engagement: vigour,
dedication and absorption.
Organizational engagement: Scale is a six-item scale by
(Saks 2006). The Cronbach alpha in previous study is .90
(Saks, 2006). For this study Cronbach alpha value is .74.
Organization citizenship behaviour (OCB): Lee and Allen
(2002) shorter version of OCB scale was used. The scale
consists of 16 items, eight items reflecting OCBI and OCBO.
It`s a 7-point rating scales (1 never, 7 always), Reliabilities
were .83 (OCBI) and .88 (OCBO). ( LeeandAllen 2002). The
Cronbach alpha of this scale, in this study is .88
Perceived organizational support: The 16 items were
taken from the longer version of the POS survey developed
by Eisenberger Huntington, Hutchinson, and Sowa, 1986.
It`s a six-point rating scale ranging from strongly agree to
strongly disagree. Cronbach's alpha this scale was α = 0.95,
with item-total correlations ranging from 0.50 to 0. 86. The
Cronbach alpha of this scale, in this study is .90
Statistical analysis: Descriptive statistics, Cronbach alpha,
correlation and regression were done by using Statistical
Package for Social Sciences (SPSS) version 16. Means and
standard deviations were computed. In order to examine the
internal consistency of various scales alpha values were
calculated. Pearson correlation was carried out to assess the
strength of the relationship between the predictors and the
dependent variable. Regression was used to evaluate the
relationship between of independent variable and the
dependent variable, controlling for or taking into account the
impact of a different set of (demographic variables) on the
dependent variable.
Hypothesis: Perceived Organizational Support (POS) will
positively predict work and organizational engagement
Hypothesis: Work and organizational engagement will
positively predict organizational citizenship behaviour
(OCB).
RESULTS AND DISCUSSION
Descriptive statistics of the study variable: The mean
value of work engagement is 69.06 (14.25) and
organizational engagement is 20.89 (3.93). The mean value
of POS is 70.48(14.24) in case of OCB it is 83.08(14.02
(Table 1). Skewness and kurtosis were also examined to
check the normality of the data. It was found that the
skewness value for work engagement was (-.06),
organizational engagement (-.74), POS (-.28), OCB (-.51).
The value of kurtosis for work engagement was (-.35),
organizational engagement (.93), POS (.02), OCB (.62)
Statistically, skewness and kurtosis both should fall in the
range from +2 to –2 if data are normally distributed (Cameron
2004).
Correlational analysis: Cronbach alpha was computed to
assess the internal consistency of the scales. Reliability
value of each variable has also been given. The values
ranged from (.75) to (.93). Cronbach alpha indicated that
130 Akancha Srivastava

internal consistency reliabilities were all above .70 (Nunnally
1978). This shows adequate reliability values of the scale.
Data indicated significant positive correlation between all the
predictor variables and the dependent variable. A positive
significant correlation was found between POS and with WE
r=0.34, as well as with organizational engagement r=0.45. A
positive significant correlation was also found between OCB
and WE r=0.45as well as with organizational engagement
r=0.38.
Regression analysis was obtained in two stages (Table
3). In the first stage all control variables were entered into the
equation. In the second stage all five predictor variables were
entered. In each step of the analysis the predictor and control
variable were regressed on work engagement accordingly.
Although none of the control variables were significant and
are creating very low level of variance and that is not to a level
of significance. The data also indicated that when control
variables were entered in the equation together with predictor
variable in the second model the value of R secured more 2
variance. This indicated that with the addition of predictor
variable the change in R (R =0. 18). The beta value showed 2 2
that POS ( = .13, t=2.25, 95% CI [.08, 29] emerged as β
significant predictors of work engagement control variables
were significant it means that they are creating very low level
of variance and that is not to a level of significance and when
control variables were entered in the equation together with
predictor variable in the second model the value of R 2
secured more variance. This indicated that with the addition
of predictor variable the change in R (R =0. 18). The beta 2 2
value showed that POS ( = .13, t=2.25, 95% CI [.08, 29] β
emerged as significant predictors of work engagement
Dependent variable: Organizational Engagement;
**p<.01LOS- length of service; POS-Perceived
organizational support. In the first stage all control variables
were entered into the equation. In the second stage predictor
variable were entered (Table 2). In each step of the analysis
the predictor and control variable were regressed on
organizational engagement accordingly. The amount of
variance created by both the model was 29% percent. The
beta value showed that POS ( = .17, t=2.92, 95% CI [.01 .07] β
emerged as significant predictors of organizational
engagement
Regression analysis for predicting the consequence of
work engagement
Dependent Variable: Organizational Citizenship
behaviour
LOS- length of service; WE-Work engagement
OCB from work engagement: Control variables were
entered in to the model, but none of them came to be
significant. The table shows that work engagement predicted
Study variables Mean Std. deviation Skewness Kurtosis
WE 69.06 14.26 -0.6 -.35
OE 20.92 3.93 -0.74 .93
POS 70.48 14.24 -.28 .02
OCB 83.08 14.02 -.51 .62
Table 1. Descriptive statistics of the study variable
WE- Work engagement; OE- Organizational engagement; POS – Perceived organizational support; OCB- Organizational citizenship behaviour
Variables 1 2 3 4
WE (.93)
OE .49** (.75)
POS .34** .45** (.90)
OCB .45** .38** .36** (.88)
Table 2. Correlation coefficients and reliability of all the variables
**p<.01 level, See Table 1 for details
organizational citizenship behaviour (OCB) (b=.44, t= 8.60,
95% CI [.33, .54], p<. thereby explaining 20% of the variance
in the model
Regression analysis for predicting the consequences of
organizational engagement:
Dependent Variable: OCB Organizational Citizenship
behaviour
LOS- length of service; OE-Organizational engagement
The regression Organizational citizenship behaviour
emerged as a significant consequence (b=.39, t= 7.36, 95%
CI [1.02, 1.77of organizational engagement thereby
explaining 16.5% of the variance in the model (Table 3). For
mediation analysis Barron and Kenny (1986), three
conditions mediation analysis approaches were followed. To
perform the mediation analysis, this study utilized Baron and
Kenny`s Mediator analysis approach.
Baron and Kenny Mediator analysis: Baron and Kenny
(1986) gave certain premises for establishing the mediator
variable. To test for mediation, suggested that mediation is
tested through three regression models:
1. Regressing the mediator on the independent variable.
2. Regressing the dependent variable on the independent
variable
3. Regressing the dependent variable on both the
independent variable and on the mediator.
These models test the four conditions of mediation:
1. The independent variable must affect the mediator in the
first equation;
2. The independent variable must be shown to affect the
dependent variable in the second equation;
3. The mediator must affect the dependent variable in the
131Behaviour among Knowledge Workers of R&D Organization

third equation.
4. If these conditions all hold in the predicted direction, then
the effect of the independent variable on the dependent
variable must be less in the third equation than in the
second.
For this study mediation of both the facets of employee
engagement was examined between all the antecedents and
consequences. For this study all three conditions have been
tested. The results are as follows
Perceived organization support (POS) predicting
organizational citizenship behaviour (OCB) through
work engagement (WE)
1. The predictor variable (POS) significantly predicts the
mediator (WE) in model 1 b =.( = .13, t=2.25,95% CI β
[.08, 29
2. The predictor variable (POS) significantly predicts the
outcome variable (OCB) in model1, b =.33, 95%CI [0.22,
0.44], t=6.09.
3. The mediator (WE) significantly predicts the outcome
variable (OCB) in model 3; b =. (b=.44, t= 8.60, 95% CI
[.33, .54], The predictor variable (POS) predicts the
outcome variable (OCB) less strongly in model 3 than in,
model 2,b =.20, 95%CI [0.09, 0.31], t=3.79
Variable Work engagement Organizational engagement
Citizenship behaviour Control Organizational citizenship behaviour
∆R² β ∆R² β ∆R² β ∆R² β ∆R² β
Step 1
Control .013 .009 .009 .011 .011
Age .04 .19 .19 -.19 -.19
LOS .07 -.13 -.13 .25 .25
Step 2
Predictor .153 .153
POSTotal R²=.18
.13** .17** .17** .39** .39**
.165** .165**
Table 3. Regression analyses for predicting the antecedent of various variables
Dependent ariable: Work ngagement; **p<.05v eLOS- length of service; POS-Perceived organizational support
Perceived organization support (POS) predicting
organizational citizenship behaviour (OCB) through
organizational engagement (OE) :
1. The predictor variable (POS) significantly predicts the
mediator (OE) in model 1 ( = .17, t=2.92,95% CI [.01 β
.07]
2. The predictor variable (POS) significantly predicts the
outcome variable (OCB) in model2, b =.33, 95%CI [0.22,
0.44], t=6.09
The mediator (OE) significantly predicts the outcome
variable (OCB) in model 3; (b=.39, t= 7.36, 95% CI [1.02,
1.77], p<.01).The predictor variable (POS) predicts the
outcome variable (OCB) less strongly in model 3 than in
model 2,b =.19, 95%CI [0.07, 0.30], t=3.24. The result of the
study finds support for the hypothesis which stated that
Perceived Organizational Support (POS) will positively
predict work and organizational engagement The result of .
the study finds support for the hypothesis which stated that
Perceived Organizational Support (POS) will positively
predict work and organizational engagement.
The results of the study indicated that POS predicted
both work and organizational engagement. Drawing from
Organizational support theory which states that to determine
ba
b=.44, p<.001
c`
b=.20, , p<.001
POS (X)
WE (M)
OCB (Y)
b=.13, p<.05
c
b=.33, p<.001
Diagrammatic representation of model
X=Predictor (POS), Y=Outcome (OCB), M= Mediator (WE)
Diagrammatic representation of model
b
a
b=.39, p<.001
1.
c b̀=.19, , p<.001
POS (X)
OE (M)
OCB (Y)
b=.17, p<.05
c
b=33., p<.001
X=Predictor (POS), Y=Outcome (OCB), M= Mediator (WE)
132 Akancha Srivastava

the organization's readiness to reward increased work effort
and to meet socioemotional needs, employees develop
global beliefs concerning the extent to which the organization
values their contributions and cares about their well-being. In
other words, organization provides reward to make the
employees feel that they value their employees. This reward
is in the form of organizational support. In the present
context, this organizational support is in the form of
allowances which comes under Government of India, like
travel reimbursements are also provided. Playschool
facilities for kids are also provided within the campus so that
working couples can drop their children there. For women
employee the provision of child care leave etc. are also
admissible. It appears that these factors are contributing in,
making the employees engaged in their organization.
Drawing from the framework of Social Exchange Theory, he
opined that POS generates an obligation on the part of
employees to care about the organization's welfare and to aid
the organization to reach its objectives (Rhoades et al2001).
In addition to this, when employees trust that their
organization is concerned about them and cares about their
well-being, they reciprocate their obligations to the
organization by becoming more engaged. In the context of
work, employees are provided with support in terms of
receiving many training and development activities.
Scientists are encouraged to participate in conferences and
workshops and as result the become aware and updated in
their concerned discipline. This support helps the employees
to be updated and advanced in their area of interest and as a
result they become engaged in their work. Therefore,
perceived organizational support predicted work
engagement.
Subsequently the results of the study also found support
for the hypothesis Work and organizational engagement will
positively predict organizational citizenship behaviour
(OCB). Bakker and Demerouti, (2008) explained the fact that
engaged employees frequently experience positive
emotions, including happiness, joy, and enthusiasm;
experience better health; create their own job and personal
resources; and transfer their engagement to others. In many
organizations, performance is the outcome of the combined
effort of individual employees. It is therefore believable that
the crossover of engagement among members of the same
work team increases performance.
In R and D environment scientist are engaged in their
work. Since the work is perceived positive by them, they
become stimulated and energetic in their work. In working on
projects, they devote ample of time and effort for the work
which they found meaningful. As a result of doing this process
they experience a positive emotion of contentment,
happiness and satisfaction. They create a positive work and
organizational culture and pass on their happiness to others.
With reference to Organ`s definition of organizational
citizenship behaviour (OCB) which he describes as a
discretionary behaviour directed at individuals or at the
organization as whole, which goes beyond existing role
expectations and benefits or is intended to benefit the
organization. Since the scientists are happy and satisfied in
their work and organizational role, they very eagerly try to
help other with their responsibility even though it is not in their
formal duties. For example, as the work is divided in different
division interdivisional help is generally solicited at time of
need.
Work and organizational engagement will mediate
between antecedent and consequences was also supported.
The result of the present study is consistent with previous
researches (Saks 2006, Biswas and Bhatnagar 2013). This
study contributed to show that employee engagement
emerged as an important partial mediator between the
Perceived Organizational Support (POS) and Organizational
Citizenship Behaviour (OCB).
REFERENCESBakker AB and Evangelia D 2008. Towards a model of work
engagement. (3): 209-Career Development International 13223.
Baron, RM and David AK 1986. The moderator-mediator variable distinction in social psychological research: Conceptual, strategic, and statistical considerations. Journal of Personality and Social Psychology 51: 1173-1182.
Biswas S and Bhatnagar J 2013. Mediator Analysis of Employee Engagement: Role of perceived organizational support, P-O Fit, organizational commitment and Job Satisfaction. Vikalpa. The Journal for Decision Makers 38:27-40.
Cameron AC 2004. The SAGE Encyclopedia of Social Science Research Methods. Thousand Oaks: 1-3.Sage Publications
Caprino K 2013. 6 Essential Ways to Build a Positive Organization. Forbes.
Cohen G and Higgins NJ 2007. Employee engagement: The secret of highly performing organizations. Journal of Applied Human Capital Management 1(1): 43-56.
Eisenberger R, Robin H, Steven H and Sowa D 1986. Perceived organizational support. : 500-Journal of Applied Psychology 71507.
Harter JK Schmidt FL and Hayes TL 2002. Business-unit-level ,relationship between employee satisfaction, employee engagement, and business outcomes: A meta-analysis. Journal of Applied Psychology 87(2): 268-279
Lee K and Allen NJ 2002. Organizational citizenship behaviour and workplace deviance: The role of affect and cognitions. Journal of Applied Psychology 87(1): 131-142.
Levinson H 1965. Reciprocation: The relationship between man and organization. : 370-390.Administrative Science Quarterly 9
Maslach C and Leiter M 2008. Early predictors of job burnout and engagement. : 498-512.Journal of Applied Psychology 93
Nunnally JC 1978. (2nd ed.). New York: Psychometric theoryMcGraw-Hill.
Organ DW 1988. Organizational Citizenship Behaviour: The Good Soldier Syndrome.
133Behaviour among Knowledge Workers of R&D Organization

Patil A and Biswas S 2014. Opportunities and challenges for sustainable R and D in India. International Journal of Research and Development - A Management Review 1 .(3): 1-5
Rhoades L, Eisenberger R, and Armeli S 2001. Affective commitment to the organization: The contribution of perceived organizational support. : 825-836.Journal of Applied Psychology 86
Rothbard NP 2001. Enriching or depleting, the dynamics of engagement in work and family roles. Administrative Science Quarterly 46 : 655-684.
Saks AM 2006. Antecedents and consequences of employee engagement. : 600-619.Journal of Managerial Psychology 21
Wellins RS, Bernthal P and Phelps M 2005. Employee engagement: The key to realizing competitive advantage, Development Dimensions International 1-30.
Wilmar S and Arnold B 2003. Utrecht Work Engagement Scale: preliminary manual. Utrecht: Occupational Health Psychology Unit, Utrecht University.
Wilmar S, Salanova M, Gonzalez-Romá V and Bakker AB 2002. The measurement of engagement and burnout: A confirmative analytic approach. : 71-92.Journal of Happiness Studies 3
Wu A and Zumbo B 2008. Understanding and using mediators and moderators. : 367-392.Social Indica 87
Received March, 2021; Accepted 06 Ju , 202114 ne
134 Akancha Srivastava

Self-esteem, Eudemonic Well-being and Flow at Work among Managers in Banking Sector
Manuscript Number: S-689NAAS Rating: 5.79
Abstract: The present research tries to establish a link among well-being, flow at work and self-esteem among managers working in banking sector. The present study aimed to investigate the gender differences in self-esteem eudemonic well-being and flow at work among managers in banking sector, and ascertain the role of self-esteem and eudemonic well-being in predicting flow at work. The present study employs an ex-post facto research design and uses purposive sampling technique to select the respondents (N=100 male and 100 female managers working in the private banks). The data was first checked for normality and then t- test and stepwise multiple regression analysis was used to analyze it. There are significant gender differences on self-esteem, employee well-being and flow at work. Different set of predictors emerged for flow at work for males and females. Studying self-esteem, eudemonic well-being and flow at work has implications not only for the individual but also for the organizations as well, as employees with better well-being and having high self-esteem will eventually help the organization to achieve its goals and objectives.
Keywords: Self-esteem, Eudemonic well-being, Flow at work, Managers
Ridhima ShuklaDepartment of Psychology, CHRIST (Deemed to be University), Delhi N ndiaCR-201 003, I
E-mail: [email protected]
Indian Journal of Ecology (2021) 48 Special Issue (16): 135-141
With the upsurge of researches in the area of positive
psychology, even organizational psychologists have shifted
their focus on the concepts of experiencing flow, quality of
life, self-esteem, well-being, etc. of individuals at the
workplace. Well-being in the workplace is an important issue
and therefore, should be researched more among
employees of an organization (Deci and Ryan 2008, Biswas-
Diener et al 2009, Huta and Waterman 2014). Eudemonic
well-being, and not hedonic well-being, is more apt to be
studied in organizations because eudemonic well-being
focuses on living an authentic life and having an attitude and
orientation of growth and development. There is enough
evidence that positive emotions at work are linked with job
characteristics and experience of flow at work (Zito, Claudio
and Colombo 2019). Czerw (2017) presented a model of
eudemonic well-being at the workplace which has four
dimensions, namely, positive organization, fit and
development, positive relations with coworkers, and
contribution to the organization. Flow at work has been
defined as a state of an individual in which the individual is
exceptionally involved in the work to the extent of losing track
of time with complete focus on the activity at hand, is said to
be the state of flow (Csikszentmihalyi 2000). In the present
study, flow at work has been operationalized according to the
model given by Bakker (2008). Therefore, another variable of
the study is self-esteem, defined as feelings of worth by
Rosenberg (1965). With this background, the objectives to
assess the level and ascertain gender differences self-
esteem, eudemonic well-being, and flow at work of the male
and female managers working in the banking sector and to
find out the role of self-esteem and eudemonic well-being in
predicting flow at work among male and female managers
working in the banking sector.
MATERIAL AND METHODS
Research design: The ex-post facto research design was
employed in the present study as the objectives of the study
were to assess the already established levels of self-esteem,
well-being, and flow at work of the respondents.
Sample profile: The sample of the present study comprised
of 200 managers (100 males and 100 females) working in the
private sector banks for at least 5 years. The age of male
managers ranged from 40 to 48 years with the mean age
being 46.38 and a standard deviation of 2.49. The age of
female bank managers ranged from 41 to 48 years with the
mean age being 45.6 years with a standard deviation of 2.56.
All the respondents resided in the urban area and 76% of the
males lived in nuclear families whereas 83% of the females
lived in nuclear families. The respondents were married.
Sampling technique: The purposive sampling technique
was used in the present research to select the participants of
the study. Following inclusion and exclusion criteria were
established for selection of the respondents. Inclusion
criteria include males and females in the age range of 40-48
years was to for at least 5 – 7 years in private sector banks.
Exclusion working criteria was to not select newly recruited

managers with less than 5 years of experience and
managers working in rural areas
Tools used
1. Demographic data sheet- Personal data sheet was used
to find out the demographic details of the respondents. It
contained details about the age, gender, years of
service, marital status, type of family, place of work.
2. Self-esteem scale- For assessing the level of self-
esteem of the respondents, Rosenberg's Self Esteem
Scale (1965) was used for the present study. The scale
consists of 10 items which have to be rated on a 4 point
Likert Scale ranging from 0 (strongly disagree) to 3
(strongly agree). Internal consistency (Cronbach's
alpha) was found to be 0.92.
3. Employee wellbeing- To assess the level of eudemonic
well-being of the respondents, Eudemonic Well Being at
the Workplace Questionnaire developed by Czerw
(2017) was used. The scale consists of 43 items which
were to be rated on a seven-point Likert rating scale
ranging from 1 (Totally Disagree) to 7 (Totally Agree).
The scale has four dimensions, namely, positive
organization (12 items), fit and development (10 items),
positive relations with coworkers (13 items), and
contribution to the organization (8 items). Internal
consistency ranged from 0.91 to 0.93 in the present
sample.
4. Flow at work- For ascertaining the flow at work, Work-
related Flow Inventory developed by Bakker (2008) was
used. The sale comprises 13 items and has three sub-
dimensions, namely, absorption (4 items), intrinsic work
motivation (5 items), and work enjoyment (4 items). The
items have to be rated on a 1 (never) to 7 (always) Likert
rating scale. The Cronbach's alpha of the scale is found
to be 0.80 for absorption, 0.75 for intrinsic work
motivation, and 0.90 for work enjoyment.
Procedure: After finalizing the tools for collecting data, the
respondents were approached and their permission to be a
part of the study was sought. Once the respondents decided
they were asked to give their written consent for participating
in the study. They were debriefed about the purpose of the
study and were assured that their data will be kept strictly
confidential and will be used only for research purposes.
Once the respondents were satisfied with the whole process
and purpose of the research, they were given tools to which
they responded. The respondents had complete freedom to
withdraw from the study at any point if they felt
uncomfortable. The anonymity of the respondents was also
maintained. The data was analyzed using SPSS.
RESULTS AND DISCUSSION
The assumption of normality was tested for the
composite scores of each variable, namely, self-esteem,
well-being at the workplace, and flow at work and all three
variables are normally distributed (Table 1). The male and
female managers differ significantly from each other on their
level of self-esteem, perception of well-being, and flow at
work (Table 2).
Self-esteem was significantly different among males
and females (t= 7.54; p<.01) where males were lower than
females. For eudemonic well-being, significant gender
differences have emerged on the positive organization (t=
4.696; p<.01), contribution to the organization (t= 3.495;
p<.01), and overall eudemonic well-being at the workplace
(t=2.05; p<.01) where males were higher on all the said
dimensions. Females have more positive relations with their
coworkers (t= 2.45; p<.01) than their male counterparts. Flow
at work is also experienced differently by both genders. Male
managers were less absorbed (t= 3.39; p<.01), do not enjoy
work much (t= 4.76; p<.01), and experience comparatively
less flow at work (t= 4.66; p<.01) in comparison to female
managers. The females perceive themselves to be more
worthy than males and indicate that females are more task-
oriented and seem stimulated to maintain a positive self-
perception (Pierce & Gardner 2004). The working woman,
Gender Kolmogorov-Smirnov a Shapiro-Wilk
Statistic df Sig. Statistic df Sig.
Males Self-esteem .069 100 .129 .979 100 .114
Eudemonic well-being at workplace .071 100 .136 .975 100 .110
Flow at work .078 100 .137 .985 100 .310
Females Self-esteem .059 100 .125 .979 100 .114
Eudemonic well-being at workplace .020 100 .165 .974 100 .110
Flow at work .077 100 .137 .984 100 .335
a. Lilliefors Significance Correction
Table 1. Tests of normality
136 Ridhima Shukla

Gender N Mean Std. Deviation t
Self-esteem Males 100 15.966 5.477 7.547**
Females 100 20.843 3.428
Positive organization Males 100 57.180 8.545 4.696**
Females 100 45.380 6.953
Fit and development Males 100 40.620 2.054 .669
Females 100 39.470 3.419
Positive relations with coworkers Males 100 44.980 3.070 2.455**
Females 100 52.820 2.075
Contribution to organization Males 100 37.570 7.907 3.495**
Females 100 33.170 9.795
Eudemonic well-being at the workplace Males 100 180.350 3.914 2.005**
Females 100 170.840 3.965
Absorption Males 100 16.730 5.249 3.399**
Females 100 19.220 5.137
Intrinsic work motivation Males 100 20.800 5.769 .049
Females 100 20.000 5.761
Work enjoyment Males 100 16.800 5.858 4.476**
Females 100 20.200 4.834
Flow at work Males 100 54.370 8.796 4.663**
Females 100 60.220 8.944
Table 2. Descriptive statistics and gender differences on self-esteem, eudemonic well-being and flow at work
*p<.05 level of significance, **p<.01 level of significance
females in the present study consider themselves to be more
capable, important, and worthy than males. Robins and
Trzesniewski (2005) and Trzesniewski et al (2013)
concluded that men have higher self-esteem than women
which are contradicting the findings of the present research.
The findings can be explained with the help of a socio-cultural
perspective which speculates that differences in self-esteem
are more governed by social influences which tend to vary in
different contexts (Orth and Robins 2014).
Despite having higher self-esteem than males, females
are found to be low in their perceptions of well-being at work.
This indicates that male managers generally feel more
important and effective when faced with demanding and
challenging workplace situations. On all the dimensions of
well-being, except for positive relations with coworkers,
females are significantly low than males. The male managers
of the study perceived that their contribution to the
organization is more noteworthy and positive than their
female counterparts. Females, on the contrary, perceived a
higher level of well-being if they have more positive relations
with their coworkers. These findings are substantiated by a
study by Peterson (2004), where men were value more pay
and benefits, authority, power and recognition than females
who focused more on friends and relationships with
coworkers. The females are found to be more absorbed and
enjoying their work in comparison to males. This indicates
that female managers perceive their jobs to be more fulfilling
and experience flow at work because working females view
this as an opportunity to prove their worthiness and efficiency
(Waterman et al 2008, Mao et al 2016b).
The self-esteem among males is found to be positively
significantly associated with positive relations with coworkers
(r= .261). Positive relations with coworkers, the dimension of
well-being, is significantly positively correlated with intrinsic
work motivation, the dimension of flow at work, (r= .353) and
overall flow at work (r= .213). The males feel that they
contribute to the organization have higher levels of intrinsic
work motivation (r-= .516) and experience more flow at work
(r=.197) (Table 3). The females perceive their organizations
to be positive and therefore, experience more absorption in
the work at hand (r= .239). The females have more positive
relations with their coworkers and are more intrinsically
motivated (r=.220). The overall eudemonic well-being among
females is significantly positively correlated with their
experience of flow at work (r= .205). The association among
the variables of the study, for both the genders, is positive
137Self-esteem, Eudemonic Well-being and Flow at Work

1 2 3 4 5 6 7 8 9 10
1 1.00 0.073 0.112 .261** 0.176 .129 .083 .032 .103 .002
2 .281** .224* 0.081 .737** .122 .046 .018 .031
3 0.08 0.171 .494** .007 .005 .002 .038
4 .272** .725** .103 .353** .064 .213*
5 .054 .073 .516** .146 .197*
6 111 .154 .083 .090
7 .196 .076 .418**
8 .018 .527**
9 .609**
10 1.00
Table 3. Product moment correlation among variable (N= 100 males)
1. Self-esteem, 2. Positive organization, 3. Fit and development, 4. Positive relations with coworkers, 5. Contribution to organization, 6. Eudemonic well-being at workplace, 7. Absorption, 8. Intrinsic work motivation, 9. Work enjoyment, 10. Flow at work *p<.05 level of significance (2 tailed), **p<.01 level of significance (2 tailed)
1 2 3 4 5 6 7 8 9 10
1 1 .138 .051 .071 .077 .029 .159 .165 .097 .145
2 1 .118 .035 .061 .589** .239* .016 .029 .133
3 1 .098 .041 .409** .176 .048 .007 .074
4 1 .154 .606** .099 .220* .154 .168
5 1 .256* .159 .158 .081 .054
6 1 .181 .097 .072 .205*
7 1 0.032 .163 .466**
8 1 .126 .694**
9 1 .528**
10 1
Table 4. Product moment correlation among variables (N=100 females)
See Table 3 for details
indicating that feelings of worth, well-being, and flow
experiences are positively related to each other. All the
variables of the study are positive and determine the abilities
of an individual (Table 4).
The stepwise multiple regression analysis indicates no
significant predictors emerged for absorption among males
(Table 5). The significant regression equation was (F (1, 98) =
5.95, p<.01), with an R of .239, R of .057, and adjusted R of 2 2
.048 in which positive organization emerged as a significant
predictor of absorption among females. The positive
organization is predicting a 23.9% variance in absorption and
is found to be positively correlated with absorption. The
significant regression equations emerged for the intrinsic
work motivation among males (F (1, 98) = 22.34, with an R of
.562, R of .315 and adjusted R of .301) and females (F (1, 98) 2 2
= 4.971, with an R of .220, R of .048 and adjusted R of .039). 2 2
Contribution to organization (beta= .454; t= 5.199) and
positive relations with coworkers (beta= .230; t= 2.634)
emerged as predictors of intrinsic work motivation among
males. For females, positive relations with coworkers (beta=
.220; t= 2.302) surfaced as a significant predictor. For work
enjoyment, the dimension of flow at work, no significant
predictor emerged for any of the genders. The different set of
predictors emerged for flow at work among males (F (1, 98) =
4.657), with an R of .213, R of .045 and adjusted R of.036 2 2
and females (F (1, 98) = 4.292,), with an R of .205, R of .315 2
and adjusted R of .032. Overall, flow at work among males is 2
predicted by positive relations with coworkers (beta= .213; t=
2.158) and overall eudemonic well-being at workplace (beta=
.205; t= 2.073).
The results of regression analysis, indicate that if
females view their organizations as positive, that is, the
functioning of their organization is effective than females.
This also reflects that when females are aware of the
138 Ridhima Shukla

Gender Dependent variable Predictor variable (s) β t Sig
Males Absorption None
Females Absorption Positive organization 0.239 2.44 0.01
Males Intrinsic work motivation Contribution to organization 0.454 5.199 0.01
Positive relations with coworkers 0.23 2.634 0.05
Females Intrinsic work motivation Positive relations with coworkers 0.22 2.302 0.05
Males Work enjoyment None
Females
Males Flow at work Positive relations with coworkers 0.213 2.158 0.05
Females Flow at work Eudemonic well-being at the workplace 0.205 2.073 0.05
Table 5. Stepwise multiple regression analysis for determining predictors of Flow at Work
strengths of their workplace and tend to immerse in the work
at hand. This is beneficial at both the individual as well as
organizational levels. At the individual level, the person
experiences flow at work and at the organizational level the
task gets done and such an employee is an asset to the
organization (Barrett et al 2016). Gille and Houy (2014)and
Croom (2015) observed positive relationship between well-
being and flow at work indicating that optimal organizational
support, in terms of, positive organization, fit and
development is functional to initiate a feeling of flow at work
among the employees. Nakamura and Csikszentmihalyi
(2003) also concluded that well-being is related to flow at
work.
The role of eudemonic well-being of managers is pivotal
in predicting the experience of flow at work. The various
dimensions of well-being are contributing to their experience
of flow at work and perception of the organization as positive
enhances the absorption among female managers. This
indicates that the perception of being important in the
organization is pertinent in generating posit ive
consequences by being more absorbed at work. The more
the feelings of connectedness with the organization the more
pronounced absorption at work is among female managers
(Demerouti et al 2012, Zito et al 2016).The present study
also indicate that intrinsic work motivation is predicted by
contribution to the organization and positive relations with
coworkers among males and positive relations with
coworkers among female bank managers. This indicates that
when the male managers believe that they are positively and
effectively contributing towards the development of the
organization and feel more intrinsically motivated to work.
The employees when perceive themselves to be valuable to
the organization are expected to engrossed in the work
(Bakker 2008, Zito et al 2019). Similarly, employees feel
more intrinsically motivated, when they share a healthy and
positive relations with coworkers (Page and Vella-Brodrick
2009). Managers' report that they feel motivated to work in
their organization if they can rely on their coworkers when
facing any difficulties at work. This indicates that a healthy
and good workforce is not only an asset to the organization
but also enriches the workplace experiences of the
employees at large.
Male managers experience flow at work when they
perceive that they share their goals with their colleagues and
they want to work with each other. The organizations which
have a welcoming atmosphere encourage their employees to
feel energized to work for their organization even if they
receive a little less pay. This also indicates that a healthy and
trusting relationship which employees share is also one of the
important determinants of experiencing flow at work
(Xanthopoulou et al 2013). Female managers experience
flow at work when they believe that they are liked and
accepted and think that they are provided opportunities to
develop and hone their skills at their organizations. In many
earlier studies flow at work is significantly positively related to
energy, passion for work, positive affective state, intrinsic
motivation, task-oriented behavior, and a definite reduction in
the experience of exhaustion (Rogatko 2007, Chiang et al
2011, Houlfort et al 2015, Smith and Hollinger-Smith 2015).
Despite significant gender differences in self-esteem,
self-esteem has not emerged as a predictor of flow at work.
There are mixed findings on the role of self-esteem in
predicting flow at work. The different predictors emerged for
the criterion variable indicating that the mechanisms which
underlie the functioning of different genders are separate
from each other. The self-esteem does not predict flow at
work. Theoretically, self-esteem is said to have effects on job
performance and also on well-being, empirically such effects
are non-existent and highly inconsistent. Being a manager in
the private sector bank entails them to manage and motivate
a multi-generational workforce, respond to the needs of the
subordinate, being responsible and responsive to the
139Self-esteem, Eudemonic Well-being and Flow at Work

demands of always-on work culture, and retain talented
employees in a highly competitive job market. An individual's
experiences and emotions, emanating from work or other
than work, affect their functioning at all levels. The individuals
spend more than one-third of their waking hours at their jobs,
so employees with lower levels of well-being may not be very
productive, make irrational decisions, are more prone to take
leaves, and cannot be considered as an asset to the
organization. The results of study are in sync with the
previous studies suggesting that well-being predicts flow at
work (Seligman and Csikszentmihalyi 2000, Nakamura and
Csikszentmihalyi 2009, Seligman 2011, Nakamura and
Csikszentmihalyi 2014, Setti Zito et al 2018). Overall, it may
be concluded that significant gender differences exist on self-
esteem, well-being, and flow at work among male and female
bank managers. The results also indicate that eudemonic
well-being is a significant predictor of flow at work.
CONCLUSIONS
There were certain limitations of the study. Due to
certain constraints, the probability sampling method could
not be employed for data collection. The study could not
make a comparison between public and private sector bank
managers and also managers working in rural areas. Despite
certain limitations, this study brings to fore the relevance of
having a workforce that is high on well-being and is immersed
in the work, is intrinsically motivated, and enjoys their job.
Thus, maintaining high levels of well-being, through regular
training and workshops, is imperative for recognizing and
activating the resources of employees which in turn initiates
experiences of flow at work. This is beneficial for both the
employees as well as the organizations.
REFERENCESBakker AB 2008. The work-related flow inventory: Construction and
initial validation of the WOLF. : Journal of Vocational Behavior 72400-414.
Barrett-Cheetham E, Williams LA and Bednall TC 2016. A differentiated approach to the link between positive emotion, motivation, and eudaimonic well-being. Journal of Positive Psychology 11: 595-608.
Biswas-Diener R, Kashdan T and King L 2009. Two traditions of happiness research, not two distinct types of happiness. The Journal of Positive Psychology 4(3): 208-211.
Chiang YT, Lin, SS, Cheng CY and Liu EZF 2011. Exploring online game players' flow experiences and positive affect. Turkish Online Journal of Educational Technology 10(1): 106-114.
Croom AM 2015. Music practice and participation for psychological well-being: A review of how music influences positive emotion, engagement, relationships, meaning, and accomplishment. Musicae Scientiae 19(1): 44-64.
Csikszentmihalyi M 1998. Finding flow: The psychology of engagement with everyday life, Harper Collins, New York.
Csikszentmihalyi M 2000. Beyond boredom and anxiety: Experiencing flow in work and play, CA: Jossey-Bass, San
Francisco.
Czerw A 2017. Diagnosing well-being in work context–Eudemonic well-being in the workplace questionnaire. Current Psychology38(2): 331-346.
Danna K and Griffin RW 1999. Health and well-being in the workplace: A review and synthesis of the literature. Journal of Management 25(3): 357-384.
Deci EL and Ryan RM 2008. Hedonia, eudaimonia, and well-being: An introduction. (1): 1-11.Journal of Happiness Studies 9
Demerouti E, Bakker AB, Sonnentag S and Fullagar CJ 2012. Work related flow and energy at work and at home: A study on the role of daily recovery. r (2): 276-Journal of Organizational Behavio 33295.
Gille L and Houy T 2014. The future of health care demand in developed countries: From the “right to treatment” to the “duty to stay healthy.” : 23-32.Futures 61
Houlfort N, Fernet C, Vallerand RJ, Laframboise A, Guay F and Koestner R 2015. The role of passion for work and need satisfaction in psychological adjustment to retirement. Journal of Vocational Behavior 88: 84-94.
Huta V and Waterman AS 2014. Eudaimonia and its distinction from hedonia: Developing a classification and terminology for understanding conceptual and operational definition. Journal of Happiness Studies 15(6): 1425-1456.
Kling KC, Hyde JS, Showers CJ and Buswell BN 1999. Gender differences in self-esteem: A meta-analysis. Psychological Bulletin 125: 470-500.
Mao Y, Roberts S, Pagliaro S, Csikszentmihalyi M and Bonaiuto M 2016b. Optimal experience and optimal identity: A multinational study of the associations between flow and social identity. Frontiers in Psychology 7(67).
Nakamura J and Csikszentmihalyi M 2003. The construction of meaning through vital engagement, p.83-104. In: Keyes CLMand Haidt J (eds). . APA, Washington, DC.Flourishing
Nakamura J and Csikszentmihalyi M 2009. Flow theory and research Oxford , p 195-206. In: Snyder CR andLopez SJ (eds.).handbook of positive psychology, Oxford, New York.
Nakamura J and Csikszentmihalyi M 2014. , p. The concept of flow239-263. In: Csikszentmihalyi M and Larson R (eds.).Flow and the foundations of positive psychology, Springer, Dordrecht, Netherlands.
Orth U and Robins RW 2014. The development of self-esteem. Current Directions in Psychological Science 23: 381–387.
Peterson M 2004. What men and women value at work: Implications for workplace health. (2): 106-124.Gender Medicine 1
Page KM and Vella-Brodrick DA 2009. The "what", "why" and "how" of well-being: A new model. (3): 441-Social Indicators Research 90458.
Pierce JL and Gardner DG 2004. Self-esteem within the work and organizational context: A review of the organizational-based self-esteem literature. (5): 591-522. Journal of Management 30
Price RH and HooijbergR1992. Organizational exit pressures and role stress: Impact on mental health. Journal of Organizational Behavior 13(7): 641-651.
Robins RW and Trzesniewski KH 2005. Self-esteem development across the lifespan. Current Directions in Psychological Science14: 158-162.
Rogatko TP 2007. The influence of flow on positive affect in college students. (2): 133-148.Journal of Happiness Studies 10
Rosenberg M 1965. , Society and the adolescent self-imagePrinceton University Press, New Jersey.
Ryff C and Keyes DCL 1995. The structure of psychological well-being revisited. Journal of Personality and Social Psychology 69(4): 719-727.
SabikNJ2015. Ageism and body esteem: Associations with psychological well-being among late middle-aged African
140 Ridhima Shukla

American and European American women. The Journals of Gerontology Series B: Psychological Sciences and Social Sciences 70(2): 191-201.
Seligman ME and Csikszentmihalyi M 2000. Positive psychology: An introduction 55(1): 5.
Seligman MEP 2011. Flourish: A visionary new understanding of happiness and wellbeing, Free Press, New York.
Setti I, ZitoM, Colombo L, Cortese CG, Ghislieri C and Argentero P 2018. Well-being and affective commitment among ambulance volunteers: A mediational model of job burnout. Journal of Social Service Research 44: 236-248.
Smith JL and Hollinger-Smith L 2015. Savoring, resilience, and psychological wellbeing in older adults. Aging & Mental Health 19(3): 192-200.
Trzesniewski K, Donnellan B and Robins RW 2013. Development of
self-esteem, pp 60-79. In: Zeigler-Hill V (ed.), , Self-esteemPsychology Press, New York.
Waterman AS, Schwartz SJ and Conti R 2008. The implications of two concept of happiness for the understanding of intrinsic motivation. : 41-79. Journal of Happiness Studies 9
Xanthopoulou D, Bakker AB and Fischbach A 2013. Work engagement among employees facing emotional demands: The role of personal resources. Journal of Personnel Psychology 12(2): 74-84.
ZitoM, Claudio, GC and Colombo L 2019. The Role of Resources and Flow at Work in Well-Being. , https://doi.org/ Sage Open10.1177/2158244019849732
Zito M, Cortese CG and Colombo L 2016. Nurses' exhaustion: The role of flow at work between job demands and job resources. Journal of Nursing Management 4(1): 12-22.
Received March, 2021; Accepted 06 Ju , 202109 ne
141Self-esteem, Eudemonic Well-being and Flow at Work

Executive Functions and Psychological Flourishing in Public Sector Employees
Manuscript Number: S-690NAAS Rating: 5.79
Abstract: The present study examined the relationship between executive functions and psychological flourishing. Executive functions are based on three broad brain capacities namely: inhibitory control, working memory and cognitive flexibility. The participants for the study comprised 99 executives working in public sector organizations in India. Correlational analysis was computed to examine the relationship between executive functions and psychological flourishing. Multiple regression was used to find out if executive functions predicted psychological flourishing. The association of psychological flourishing with self-restraint, working memory, emotional significant positive control, focus, task initiation, planning/prioritization, organization, time management, defining and achieving goals, flexibility and observation was observed. The results of the multiple regression indicated that working memory, focus and observation predicted psychological flourishing.
Keywords: Cognitive flexibility, Executive functions, Psychological flourishing, Working memory
Subhashini Pasupuleti and Surekha Chukkali1
Department of Psychology, GSHS, GITAM University, Hyderabad-502 329, India1CHRIST (Deemed to be University) Delhi-NCR-201 003, India
E-mail: [email protected]
Indian Journal of Ecology (2021) 48 Special Issue (16): 142-146
Executive functions refer to cognitive processes that
involve inhibitory control, working memory and cognitive
flexibility. They govern "goal-directed action and adaptive
responses to novel, complex, or ambiguous situations"
(Hughes, 2013). Executive functions are known to contribute
towards better academic performance (Bull et al 2008) and
enhanced social functioning among children (Benavides-
Nieto et al 2017) and adolescents. Executive functions are
better predictors of school readiness (Blair and Razza, 2007)
and school success (Borella et al., 2010) more than even IQ.
Research has shown that children with autism spectrum
disorder, conduct disorder (Fairchild et al 2009) and ADHD
have impaired executive functions.
Despite the popularity of executive functions in clinical
and academic settings, they did not attract enough attention
from researchers in the domain of wellbeing. With intentional
activities falling under the realm of cognition, emotion, and
motivation, it might be interesting to examine the role of
inhibitory control, working memory and cognitive flexibility on
the deliberate choices people make to experience
psychological flourishing. The wellbeing models highlight the
importance of engagement and accomplishment, which are
closely associated with executive functions.
Executive functions help individuals focus and attend to
important stimuli and sieve out others that are less important
thereby leading to goal attainment. They play an important
role in the performance of complex cognitive tasks. Executive
functions, in particular, inhibition control has been found to
partially improve the ability to apply decision rules and
engage in cognitive reflection (Missier et al 2011) thereby
aiding decision making. In addition to cognitive benefits,
executive functions also improve job success (Bailey 2007)
and lead to a better quality of life (Brown and Landgraf 2010).
During the past few years, attempts have been made to
examine the role of executive functions on emotional
regulation, which is closely associated with psychological
flourishing. Empirical evidence has suggested a possible
association between poor emotional regulation and
excessive worry, anxiety (Kashdan et al 2008) and
depression (Joormann and Gotlib 2010). Meanwhile,
individuals who exhibit greater emotional regulation show
better psychological wellbeing. Inhibitory control, which is
one of the dimensions of executive functions, has been found
to improve the ability to regulate emotions (Tabibnia et al
2011). Similar effect has been noticed concerning working
memory, another dimension of executive functions. Further,
cognitive flexibility is known to help individuals cope with daily
pressures and stress, leading to improved psychological
functioning. Individuals with impaired cognitive flexibility
show signs of depression (Hou et al 2016, Gabrys et al 2018),
which thwarts their ability to handle stressful situations.
Stress has become the new norm for working
executives. Working executives are expected to show
tremendous passion and grit in meeting work targets/goals
without getting perturbed by external circumstances and/or
organizational anomalies. Workplace stress adversely

affects job performance, job satisfaction, job involvement,
and organizational commitment. To minimize the ill-effects of
stress and achieve salubrious outcomes, Fortune 500
companies provide employee assistance programs to
employees and their families.
Working memory, an important dimension of executive
functions facilitates cognitive reappraisal (McRae et al 2012)
and improves the ability to adopt neutral and non-emotional
appraisals leading to better emotional regulation and healthy
coping. Executive functions contribute to better
psychological functioning. They lead to satisfaction with life
and positive affect (Toh et al 2019). The present research
examines the relationship between executive functions and
psychological flourishing in public sector employees.
MATERIAL AND METHODS
The participants for the study comprised 99 executives
working in public sector organizations in India. The age of the
participants ranged from 30 to 58 years. The participants
comprised 94 men and 5 women working in junior and
middle-level management positions. The designations of the
participants ranged from senior manager to general
manager. The total work experience of the participants
ranged from 5 years to 36 years. The participants were
randomly chosen for the study. They were part of the training
programs conducted at the Administrative Staff College of
India.
The materials for the study included demographic
profile, executive skills profile developed by Martin et al
(2007) and Flourishing Scale developed by Diener et al
(2009). The Demographic Profile included six items: name,
gender, age, marital status, designation and work
experience.
Executive Skills Profile is a 60-item instrument that
provides a measure of twelve executive functions namely:
self-restraint, working memory, emotion control, focus, task
initiation, planning/prioritizing, organization, time
management, defining and achieving goals, flexibility,
observation, and stress tolerance (Martin et al 2007). The
instrument uses a 5-point Likert Scale with scores ranging
from strongly disagree to strongly agree. Each of the twelve
executive functions is assessed through twelve subscales
with five items each. The executive skills profile was found to
be a reliable measure of executive functions with an internal
consistency of 0.88.
Flourishing Scale is a brief 8-item scale that provides a
single score on psychological flourishing. It measures
dimensions such as self-esteem, feelings of competence,
purpose in life, optimism, and relationships (Diener et al
2009) It uses a 7-point Likert scale with scores indicating the
extent to which the respondents strongly disagree to strongly
agree with scale items. The scores range from 8 to 56. A high
score on the scale indicates that the individual has many
psychological resources and strengths. The scale is
considered a reliable and valid instrument and is strongly
associated with other scales that measure psychological
wellbeing.
The study was conducted in the city of Hyderabad. The
participants of the study were administered with the
demographic profile, executive skills profile, and flourishing
scale. They were given clear instructions on how to fill the
questionnaires. The participants were assured that the data
obtained would be kept confidential and used only for
research purposes. The participants were given sufficient
time to return the filled in questionnaires. After the
participants filled in the questionnaires, the data was entered
into SPSS software for statistical analysis.
RESULTS AND DISCUSSION
The descriptive statistics including mean and standard
deviation for the variables given in 1,Table
Correlation analysis involving psychological flourishing
and dimensions of executive functions showed several
significant relationships amongst the study variables ( Table
2). Psychological flourishing measured by brief flourishing
scale gave a single overall scale whereas the executive
profile scale yielded scores over twelve dimensions. There
were significant positive associations between psychological
flourishing and self-restraint ( = 0.319), working memory ( = r r
0.392,), emotional control ( = 0.289), focus ( = 0.487), task r r
initiation ( = 0.240), planning/prioritization ( = 0.467), r r
organization ( = 0.324), time management ( = 0.298,), r r
defining and achieving goals ( = 0.362), flexibility ( = 0.399) r r
and observation ( = 0.434).r
The multiple regression analysis was conducted in order
to explore if the dimensions of executive functions predict
psychological flourishing ( 3). Working memory ( = Table β
.21), focus ( = .24) and observation ( = .27) scales of β β
executive functions significantly predicted psychological
flourishing. The functions of self-restraint, emotional control,
task initiation, planning/prioritization, organization, time
management, defining and achieving goals and flexibility
though showed significant correlations did not predict
flourishing. The overall regression model was significant and
was explained by the executive functions of working memory,
focus and observation (R=.60, R =.36). The f is .57 and 2 2
denotes large effect.
The results of the study showed a positive association
between working memory and psychological flourishing.
Working memory is considered as an ability to retain
143Executive Functions and Psychological Flourishing in Public Sector Employees

information which is necessary for instantaneous task
achievement and problem solving. It is best understood in the
context of short-term memory. While short term memory
stores information which is easily and speedily available over
a brief period of time, working memory regulates the content
of short-term memory. If an individual is able to pursue a task
and not lose track of his/her other responsibilities and
obligations, then they tend to have a stronger working
memory capacity. Stronger working memory capacity also
would mean greater reliability which in turn would lead to
smooth everyday functioning and less distress. Research on
Predictor 1 2 3 4 5 6 7 8 9 10 11 12 13
1. Age
2. SR .109
3.WM -.042 .339**
4.EC .254* .411** .155
5.Fo -.022 .379** .505** .284**
6.TI -.079 .211* .328** .248* .460**
7.Pl -.100 .303** .487** .192 .624** .420**
8.Org .132 .387** .474** .310** .608** .250* .530**
9.TM -.038 .278** .456** .205* .582** .460** .655** .541**
10.DAG -.191 .251* .438** .268** .436** .496** .623** .350** .543**
11.Fl .060 .354** .313** .486** .377** .265** .491** .277** .441** .521**
12.Ob -.040 .386** .365** .314** .457** .462** .551** .340** .528** .609** .604**
13.ST -.050 .112 .151 .013 .315** .151 .406** .145 .314** .303** .357** .424**
14.Flg .059 .319** .392** .289** .487** .240* .467** .324** .298** .362** .399** .434** .156
Table 2. Correlation analysis
*Indicates significance at 0.05 level, **Indicates significance at 0.01 level
Predictor Mean SD
Age 47.45 6.57
Self- restraint 19.81 2.98
Working memory 20.07 2.74
Emotion control 18.66 3.80
Focus 20.61 3.73
Task initiation 18.93 3.59
Planning/Prioritising 21.26 2.89
Organisation 20.52 3.33
Time management 21.14 3.03
Defining and achieving Goals 19.55 3.87
Flexibility 20.61 2.51
Observation 20.16 2.75
Stress tolerance 18.87 3.12
Flourishing scale 47.82 4.15
Table 1. Descriptive statistics
working memory capacity and psychological flourishing is
relatively scanty. However, there exists evidence from
cognitive research on the role of working memory capacity in
resisting distractions while performing cognitive tasks. This
indicates that higher working memory capacity leads to better
regulation, which could be one of the pathways to flourishing.
The result of the present study gathers support from few of
the previous studies. Working memory is associated with
positive mood and leads to better self-regulation. Volokhov
and Demeree (2010) observed that working memory
capacity was play a vital role in enhancing emotional
regulation and concluded that working memory capacity
enabled better regulation of emotional expressions and
experiences. Evidence from past research suggests the
importance of self-regulation, positive mood state and
emotional health in acting as building blocks of psychological
flourishing. People having a greater capacity for focus or
sustained attention experienced higher levels of
psychological flourishing. Individuals with high focus would
be able to avoid distractions as much as possible and stick to
the task requirements with ease whether at work or in other
life domains. In case of unavoidable interruptions, people
with high levels of focus would be able to shift their attention
back to the task as soon as possible. People with low focus
have trouble concentrating on tasks and find it extremely
difficult to complete them and often find themselves moving
from one task to another, dampening the possibility of task
completion. This eventually leads to low performance and
psychological distress. The focus leads to the experience of
positive feelings and greater efficiency. Attentional
deployment is considered a versatile regulatory process and
144 Subhashini Pasupuleti and Surekha Chukkali
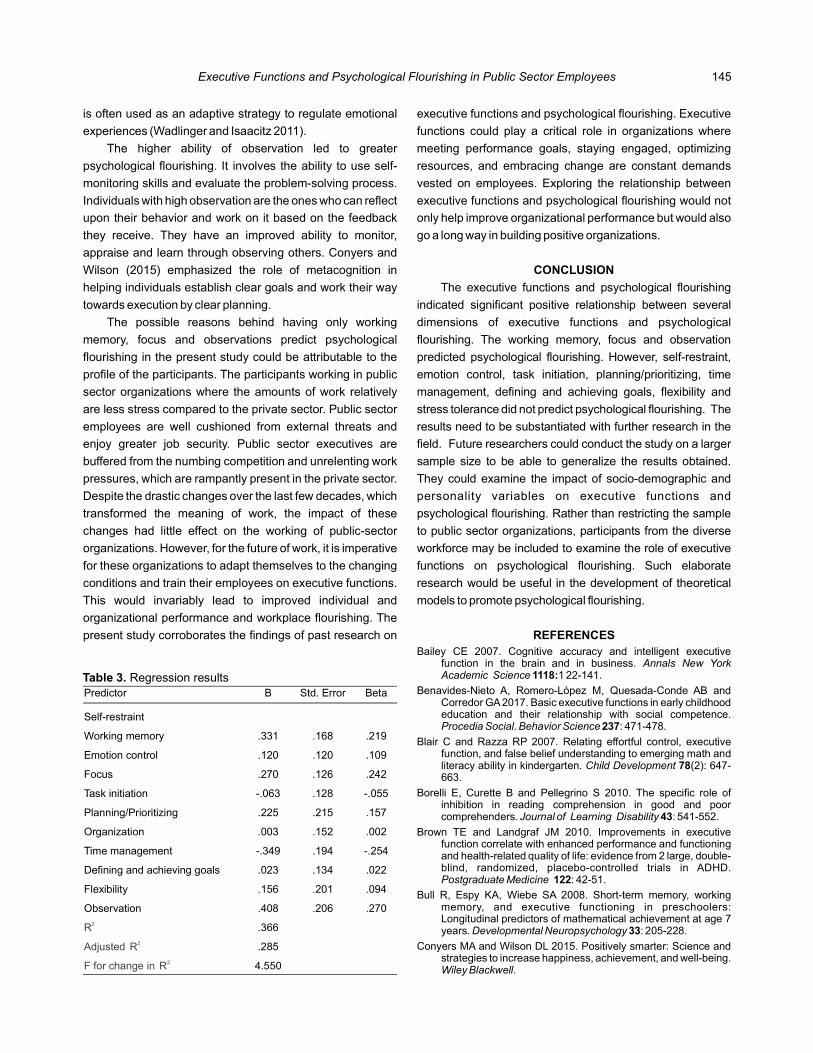
Predictor B Std. Error Beta
Self-restraint
Working memory .331 .168 .219
Emotion control .120 .120 .109
Focus .270 .126 .242
Task initiation -.063 .128 -.055
Planning/Prioritizing .225 .215 .157
Organization .003 .152 .002
Time management -.349 .194 -.254
Defining and achieving goals .023 .134 .022
Flexibility .156 .201 .094
Observation .408 .206 .270
R2 .366
Adjusted R 2 .285
F for change in R 2 4.550
Table 3. Regression results
is often used as an adaptive strategy to regulate emotional
experiences (Wadlinger and Isaacitz 2011).
The higher ability of observation led to greater
psychological flourishing. It involves the ability to use self-
monitoring skills and evaluate the problem-solving process.
Individuals with high observation are the ones who can reflect
upon their behavior and work on it based on the feedback
they receive. They have an improved ability to monitor,
appraise and learn through observing others. Conyers and
Wilson (2015) emphasized the role of metacognition in
helping individuals establish clear goals and work their way
towards execution by clear planning.
The possible reasons behind having only working
memory, focus and observations predict psychological
flourishing in the present study could be attributable to the
profile of the participants. The participants working in public
sector organizations where the amounts of work relatively
are less stress compared to the private sector. Public sector
employees are well cushioned from external threats and
enjoy greater job security. Public sector executives are
buffered from the numbing competition and unrelenting work
pressures, which are rampantly present in the private sector.
Despite the drastic changes over the last few decades, which
transformed the meaning of work, the impact of these
changes had little effect on the working of public-sector
organizations. However, for the future of work, it is imperative
for these organizations to adapt themselves to the changing
conditions and train their employees on executive functions.
This would invariably lead to improved individual and
organizational performance and workplace flourishing. The
present study corroborates the findings of past research on
executive functions and psychological flourishing. Executive
functions could play a critical role in organizations where
meeting performance goals, staying engaged, optimizing
resources, and embracing change are constant demands
vested on employees. Exploring the relationship between
executive functions and psychological flourishing would not
only help improve organizational performance but would also
go a long way in building positive organizations.
CONCLUSION
The executive functions and psychological flourishing
indicated significant positive relationship between several
dimensions of executive functions and psychological
flourishing. The working memory, focus and observation
predicted psychological flourishing. However, self-restraint,
emotion control, task initiation, planning/prioritizing, time
management, defining and achieving goals, flexibility and
stress tolerance did not predict psychological flourishing. The
results need to be substantiated with further research in the
field. Future researchers could conduct the study on a larger
sample size to be able to generalize the results obtained.
They could examine the impact of socio-demographic and
personality variables on executive functions and
psychological flourishing. Rather than restricting the sample
to public sector organizations, participants from the diverse
workforce may be included to examine the role of executive
functions on psychological flourishing. Such elaborate
research would be useful in the development of theoretical
models to promote psychological flourishing.
REFERENCESBailey CE 2007. Cognitive accuracy and intelligent executive
function in the brain and in business. Annals New York Academic Science 1118: - 1 22 141.
Benavides-Nieto A, Romero-López M, Quesada-Conde AB and Corredor GA 2017. Basic executive functions in early childhood education and their relationship with social competence. Procedia Social. Behavior Science 237 - : 471 478.
Blair C and Razza RP 2007. Relating effortful control, executive function, and false belief understanding to emerging math and literacy ability in kindergarten. (2): 647Child Development 78 -663.
Borelli E, Curette B and Pellegrino S 2010. The specific role of inhibition in reading comprehension in good and poor comprehenders : 541 552. . Journal of Learning Disability 43 -
Brown TE and Landgraf JM 2010. Improvements in executive function correlate with enhanced performance and functioning and health-related quality of life: evidence from 2 large, double-blind, randomized, placebo-controlled trials in ADHD. Postgraduate Medicine 122 - : 42 51.
Bull R, Espy KA, Wiebe SA 2008. Short-term memory, working memory, and executive functioning in preschoolers: Longitudinal predictors of mathematical achievement at age 7 years. : 205 228.Developmental Neuropsychology 33 -
Conyers MA and Wilson DL 2015. Positively smarter: Science and strategies to increase happiness, achievement, and well-being. Wiley Blackwell.
145Executive Functions and Psychological Flourishing in Public Sector Employees

Côté S, Gyurak A and Levenson RW 2010. The ability to regulate emotion is associated with greater well-being, income, and socioeconomic status. (6): Emotion (Washington, D.C.) 10923–933.
Diener E, Wirtz D, Tov W, Kim-Prieto C, Choi D, Oishi S and Biswas DR 2009. New measures of well-being: Flourishing and positive and negative feelings. 247-266.Social Indicators Research 39:
Fairchild G, Goozen SH, Stollery SJ, Aitken MR and Savage J 2009. Decision making and executive function in male adolescents with early-onset or adolescence-onset conduct disorder and control subjects. : 162 68.Biology Psychiatry 66 -1
Gabrys RL, Tabri N, Anisman H and Matheson K 2018. Cognitive Control and Flexibility in the Context of Stress and Depressive Symptoms: The Cognitive Control and Flexibil ity Questionnaire. , 2219. Frontiers in Psychology 9
Hou Z, Sui Y, Song X and Yuan Y 2016. Disrupted Interhemispheric synchrony in default mode network underlying the impairment of cognitive flexibility in late-onset depression. Frontiers in Aging Neuroscience 8 , 230.
Hughes C 2013. Executive Function: Development, Individual Differences, and Clinical Insights. In John L.R. Rubenstein, Pasko Rakic (Eds.), Neural Circuit Development and Function in the Brain (pp. 429-445). Waltham, MA: Elsevier Books.
Joormann J and Gotlib IH 2010. Emotion regulation in depression: R Cognition and Emotion 24elation to cognitive inhibition. (2): 281–298.
Kashdan TB, Zvolensky MJ and McLeish AC 2008. Anxiety sensitivity and affect regulatory strategies: ndividual and Iinteractive risk factors for anxiety-related symptoms. Journal of Anxiety Disorders 22 - (3): 429 440.
Martin C, Dawson P and Guare R 2007. Smarts: Are we hardwired for success? Prentice Hall of India.
McRae K, Gross JJ, Weber J, Robertson ER, Sokol HP, Ray RD, Gabrieli JD and Ochsner KN 2012. The development of emotion regulation: n fMRI study of cognitive reappraisal in Achildren, adolescents and young adults. Social Cognitive and Affective Neuroscience 7 - (1):11 22.
Missier DF, Timo M and Waendi BD 2011. Decision making -Competence, Executive Functioning, and General Cognitive Abilities : 331-351.. 25Journal of Behavioral Decision Making
Tabibnia G, Monterosso JR, Baicy K, Aron AR, Poldrack RA, Chakrapani S and London ED 2011. Different forms of self-control share a neurocognitive substrate. J Neuroscience31 -(13): 4805 4810.
Toh WX, Hwajin Y and Andree H 2019. Executive function and subjective well-being in middle and late adulthood. Journals of Gerontology Series B 1-9.
Volokhov R and Demaree H 2010. Spontaneous emotion regulation to positive and negative stimuli. : 1-6. Brain and Cognition 73
Wadlinger HA and Isaacowitz DM. 2011. Fixing our focus: Training attention to regulate emotion. Personality and Social Psychology Review 15 (1): 75-102.
Received 09 January, 2021; Accepted 25 April, 2021
146 Subhashini Pasupuleti and Surekha Chukkali

Decoding HERO: Predicting Psychological Capital with Subjective Well-Being
Manuscript Number: S-691NAAS Rating: 5.79
Abstract: The positive psychology movement has gained momentum in recent years and organizations have ascribed great importance to employee well-being in light of the favorable outcomes associated with it. The widely researched Psychological Capital (PsyCap) has been consistently linked to well-being across a variety of contexts but a gap still exists in literature about what lies to the 'left' of psychological capital. The present study attempts to fill this gap by examining subjective well being components- positive and negative affect and life satisfaction, as potential antecedents of PsyCap. The Academic PsyCap questionnaire, the Positive and Negative Affect Schedule (PANAS) and the Satisfaction with Life Scale (SWLS) were administered to participants. Results confirmed the expected associations between affect and PsyCap-positive affect positively predicted PsyCap and its four constituents whereas negative affect emerged as a negative predictor of PsyCap and its dimensions. Life satisfaction positively predicted only individuals' total hope scores. Thus, highlighting the role of subjective well-being components as antecedents of PsyCap, these findings suggest that promoting higher positive affect and lower negative affect can do more than just make individuals feel good, rather, it can bolster their reservoirs of crucial psychological resources as well.
Keywords: Psychological capital, Positive affect, Negative affect, Life satisfaction, HERO, Subjective well-being
Sanjna Shukla, Sneha Saha* and Ridhima ShuklaDepartment of Psychology, CHRIST (Deemed to be) University, Delhi NCR-201 003, India
*E-mail: [email protected]
Indian Journal of Ecology (2021) 48 Special Issue (14): 147-152
Among the most well-known moments in the history of
positive psychology came as a call to action to redirect focus
of psychology from its prevailing emphasis on mental illness,
something that had dominated its subject matter for the
previous half century (Seligman and Csikszentmihalyi 2000).
Given such a paradigm shift in recent times, it is but fitting that
this shift in perspective reaches the organizational sector as
well and it is hard for researchers with a positive psychology
orientation not to be attracted to the area of well-being.
People who are higher on well-being or its components also
benefit in other avenues of life such as better health and
longevity (Diener and Chan 2011). Lying at the heart of much
of the positive psychology literature, an individual's
evaluations of their lives, both cognitive judgments as well as
emotional reactions to events, comprise subjective well-
being and it includes not only high levels of life satisfaction
and pleasant moods and emotions but also low levels of
negative moods and emotions (Diener et al 2009). When
attempting to build positive organizations, focus on the well-
being of the units of an organization, its employees, also goes
a long way. Issues related to mental health are common in
workers and working populations and laying emphasis on the
employees' well-being is a crucial task for organizations to
effectively deal with such issues (Page and Vella-Brodrick
2013). A construct which has taken the world of
organizational behavior by storm, and has spilled into other
areas since, psychological capital, comprises four capacities
which include hope, efficacy, resilience and optimism
(Luthans et al 2004). Luthans et al (2007) defined this
construct: “an individual's positive psychological state of
development characterized by: (1) having confidence (self-
efficacy) to take on and put in the necessary effort to succeed
at challenging tasks; (2) making a positive attribution
(optimism) about succeeding now and in the future; (3)
persevering toward the goals, and when necessary,
redirecting paths to goals (hope) in order to succeed; and (4)
when beset by problems and adversity, sustaining and
bouncing back and even beyond (resilience) to attain
success.
Psychological Capital (PsyCap), additionally, is more
than the sum of its components and has been shown to be a
higher order core construct (Luthans et al 2007a). Studies
have found positive associations between both, individual
components of PsyCap as well as PsyCap as a whole, and
components of subjective well-being (Khan and Husain 2010,
Andrews et al 2014, Nielsen et al 2017, Datu and Valdez
2016, Datu and Valdez 2019 and Zhang et al 2019). Avey et al
(2008) showed that PsyCap predicts positive emotions. Even
measured over time, PsyCap relates positively to
(psychological) well-being (Avey et al 2010). But, despite all
the attention that PsyCap has warranted, there has been
some silence regarding the antecedents of psychological
capital (Avey 2014). On the one hand, individual differences
have been found to be predictors of PsyCap (Avey 2014) and

on the other, a recent study by Chen et al (2019) has found
well-being and growth mindset to be predictors as well.
Understanding some cognitions associated with PsyCap and
its components then puts researchers in a better position to
unearth possible predictors. In light of the evidence reviewed,
the case can be made to pay greater attention to what lies on
the 'left side' of PsyCap, what actually contributes to and
predicts this vital resource. The objectives of the study were
to identify potential predictors for academic PsyCap among
college students, from among affective and cognitive
components of subjective well-being, namely, positive affect,
negative affect and life satisfaction.
MATERIAL AND METHODS
The present study was conducted to enhance
knowledge regarding antecedents of psychological capital,
focusing specifically on affective and cognitive components
of subjective well-being. To gather data and conduct the
present research, college students (prospective workforce)
from colleges and universities in and around Delhi-NCR were
surveyed (N=152) and asked to complete an online self-
report survey comprising measures of academic
psychological capital, positive and negative affect and life
satisfaction. Subjective well-being was measured as positive
affect, negative affect and life satisfaction. Academic
psychological capital was measured using a combined score
for the four components as well as for PsyCap over all,
summed up along schoolwork and overall life domains. Data
analysis was done using SPSS. Pearson correlation and
regression analyses were undertaken for analysis and
subsequent interpretation. The measures used in the present
research are as follows:
Academic psychological capital questionnaire: This tool
is a self-report questionnaire containing 24-items and was
adapted for use with college students by Luthans et al 2012.
This tool measures psychological capital overall as well as
each of its four constituents (Hope, Efficacy, Resilience and
Optimism (HERO)) for an individual's 'overall life' as well as
for the 'schoolwork' domain (Luthans et al 2012). The
Cronbach's alpha reliability for the scale as reported by
Luthans et al (2012) was .90. The total scores for the HERO
dimensions and psychological capital scores are taken upon
combination of the schoolwork and overall life domains.
Positive and negative affect schedule (PANAS): The
PANAS is a 20 item measure which contains two scales of 10
items each to measure positive and negative affect (Watson
et al 1988). The coefficient alpha was .88 and .87 for the PA
and NA scale respectively (time instructions used were
'general'). Respondents answer according to a 5 point scale
with the minimum and maximum scores for each scale
ranging from 10-50.
Satisfaction with life scale: The tool is a 5-item scale
designed by Diener et al (1985) to measure the global or
overall life-satisfaction, as the cognitive component of SWB.
The authors have reported high internal consistency,
Cronbach's = .87. The tool gives a total life satisfaction α
score by summing the scores of individual responses on a 7-
point Likert scale.
RESULTS AND DISCUSSION
Descriptive statistics: The descriptive profile is presented
in Table 1. Results for correlation and regression are reported
in table 2 and table 3 respectively.
For PsyCap and its components, people higher on
positive affect also show higher levels of total PsyCap, total
hope, total efficacy, total resilience and total optimism.
Individuals having higher negative affect tend to show lower
levels of total PsyCap, total hope, total efficacy, total
resilience and total optimism. Those individuals who exhibit
higher life satisfaction levels also show higher total PsyCap,
total hope and total efficacy (Table 2). The promotion of
positive affect and job satisfaction among employees by
means of organizational culture and policies would likely be
associated with higher levels of psychological capital and its
components in young job seekers.
For total PsyCap, the regression equation (F(2,151) =
33.710, p<.01) with an R of .312 was significant. Total PsyCap 2
Variable Mean Std. deviation
Positive affect 37.33 6.251
Negative affect 24.48 6.820
Life satisfaction 22.68 5.477
Total PsyCap 216.78 16.927
Total hope 56.36 6.110
Total efficacy 55.92 6.247
Total resilience 52.91 4.916
Total optimism 51.59 7.059
Table 1. Descriptive statistics for variables
Psychological capital
Subjective well-being
Positive affect Negative affect
Satisfaction with life
Total PsyCap .441** -.392** .218**
Total hope .443** -.247** .276**
Total efficacy .335** -.246** .202*
Total resilience .211** -.199* -.072
Total optimism .229** -.369** .154
Table 2. Correlations among variables
* p<.05, ** p<.01
148 Sanjna Shukla, Sneha Saha and Ridhima Shukla

Dependent variable R R2 ΔR2 F Predictors Beta t
Total PsyCap .558 .312 .302 33.710** PA .400 5.843**
NA -.345 -5.042**
Total hope .507 .257 .242 17.045** PA .383 5.213**
NA -.180 -2.505*
SWL .154 2.082*
Total efficacy .395 .156 .144 13.733** PA .310 4.093**
NA -.210 -2.769*
Total resilience .275 .075 .063 6.080* PA .190 2.398*
NA -.177 -2.232*
Total optimism .414 .171 .160 15.421** PA .188 2.510*
NA -.347 -4.625**
Table 3. Results of regression analysis for variables
Note: PA=positive affect, NA=negative affect, SWL=Satisfaction with life; * p<.05, ** p<.01
is significantly predicted by positive affect ( =.400) and β
negative affect ( =-.345) for the whole population. In line with β
expectations, positive affect emerged as a positive predictor of
total PsyCap and negative affect negatively predicted total
PsyCap (Table 3). Turning to the HERO components, for total
hope, the regression equation with an R of .257 was 2
significant. Total hope is significantly predicted by positive
affect ( =.383), negative affect ( =-.180) and life satisfaction β β
( =.154) for the whole population. Positive affect and life β
satisfaction were both significant positive predictors of total
hope whereas negative affect negatively predicted total hope.
For total efficacy, the regression equation with an R of .156 2
was significant. Total efficacy is significantly predicted by
positive affect ( =.310) and negative affect ( =-.210) for the β β
whole population. Positive affect positively predicted total
efficacy and negative affect predicted it negatively. For total
resilience, the regression equation with an R of .075 was 2
significant. Total resilience is significantly predicted by positive
affect ( =.190) and negative affect ( =-.177) for the whole β β
population. Resilience was positively predicted by positive
affect and conversely, negative affect emerged as a negative
predictor. For total optimism, the regression equation with an
R of .171 was significant. Total optimism is significantly 2
predicted by positive affect ( =.188) and negative affect ( =-β β
.347) for the whole population. Positive affect emerged as a
positive predictor of total optimism and negative affect
negatively predicted total optimism. The present study was
geared towards identifying components of subjective well-
being as potential predictors of positive psychological capital
and its components. The affective components emerged as
the most frequently implicated predictors of the components of
PsyCap. These findings are important for students and
provide a basis to explore and replicate these findings with the
working population as well.
Hope: The present study found positive affect and life
satisfaction to be significant positive predictors of total hope.
Total hope was also negatively predicted by negative affect.
Positive affect as a predictor: Higher positive affect
predicts higher hope for individuals. This finding makes
sense on a conceptual as well as empirical level. Hope
(agency and pathways thinking) is understandably linked to
positive emotion. Broadened mindsets, brought about by
positive emotions perform a vital function, that is, they build
an individual's enduring personal resources (Fredrickson
2001). The role of positive emotions in facilitating cognitive
flexibility has been studied (Wang et al 2017) and since
coming up with alternative ways to deal with problems is also
a part of cognitive flexibility (Dennis and Vander Wal 2010), it
is likely that owing to increased flexibility stemming from
positive emotions, individuals find more flexible strategies
made available to them to pursue their goals. Logically,
people experiencing greater positive affect are likely to have
enhanced thought-action repertoires and this would likely
give them more ways of reaching desired goals. Similar
findings were reported by Rego et al (2014), that is, positive
affect predicting hope. Aspinwall and Leaf (2002) suggested
that effects of positive emotion on decision making might
impact how information relevant to one's goals is processed
as well as a consideration of alternate strategies and goals.
Snyder (2002) also highlighted the fact that an individual high
on hope should also be characterized by positive emotions
along with affective zest pertaining to goal-pursuit. The
present findings may thus help fill in some blanks vis-a-vis
positive affect and hope.
Negative affect as a predictor: Consistent with Snyder's
(2002) characterization of the low-hope individual as having
negative emotions and affective lethargy with respect to goal
pursuit, negative affect was a significant negative predictor
149Psychological Capital and Subjective Well-Being

for total hope. According to Fredrickson (2001), the way
positive affect 'broadens' cognition, it appears that negative
affect lends itself more to specific action tendencies and
narrower thought-action repertoires, possibly impacting the
agencies and pathways thinking components of hope.
Life satisfaction as a predictor: Total hope is positively
predicted by life satisfaction. It is likely that individuals who
are satisfied with life are hopeful that they will continue to be
so, or owing to the present conditions of their lives, they might
experience more positive emotions which further lead to
increased hope. Thus, from an organizational behavior
perspective, since life satisfaction has emerged as a
predictor of PsyCap, movements geared at keeping workers
satisfied, at least in the work domain, should be prioritized.
For the work domain then, job satisfaction may be a useful
starting point and organizations may look into factors which
have been associated with it such as ethical leadership
(Joseph et al 2020).
Efficacy: Findings indicate that positive and negative affect
have emerged as significant positive and negative predictors
of total self-efficacy, respectively. This would indicate that
people with higher levels of positive affect or those with lower
negative affect can expect higher self-efficacy in their lives.
Positive affect as a predictor: Similar to how the present
study found positive affect to positively predict self efficacy,
Schutte (2014) reported that a change in positive affect (by
means of an intervention) was associated with a change in
self-efficacy as well. It is possible that people higher in the
affective component of subjective well-being provide more
favorable reports of themselves. Another potential
explanation may be that a broadening of thought and action
may allow people to think of various ways in which a goal can
be achieved, this may lead to them rating themselves as
more efficacious. They may be able to conceive of several
ways of doing or being that bring them closer to their goals.
Indeed, a finding which lends support to this assumption
comes from Fredrickson et al (2008) who reported that
changing positive affect experimentally was linked to
enhancements in mastery of the environment. Possibly,
those high on positive affect may remember more frequent
instances of goals successfully achieved in the past. These
could include a variety of academic, work-based or life goals
and would cause them to rate themselves highly on this
aspect. If positive emotions broaden cognition (Fredrickson
2001), such individuals would also experience outcomes of
said broadening (flexibility, creativity etc) and as a result
perceive themselves as highly efficacious in carrying out a
task assigned to them.
Negative affect as a predictor: The same way, negative
affect would likely constrict cognition (Fredrickson 2001) and
instead the various facets of negative affect such as
irritability, fear, hostility etc. (measured by the PANAS in the
present study) would predispose individuals to perceive their
capabilities in a manner consistent with these negative
feelings. It is also possible that higher negative affect leads to
less favorable reports of efficacy and positive affect would
similarly lead to reports to higher efficacy.
Resilience: Total resilience was positively predicted by
positive affect and negatively predicted by negative affect, as
expected. Thus, it would follow that individuals with higher
positive affect and those with lower negative affect would be
more resilient.
Positive affect as a predictor: Similar findings have been
obtained previously (Cohn et al 2009), the authors found
positive emotions to build ego resilience. Fredrickson (2001)
suggests that, in accordance with the broaden and build
theory, positive emotions may play a role in helping more
resilient people 'bounce back' to baseline cardiovascular
activity after an experience of negative emotions. Another
way in which positive affect builds resilience can be due to the
flexibility which is often linked to resilience (Genet and
Siemer 2011). Since positive emotions have been linked to
cognitive flexibility (Wang et al 2017), it appears that these
emotions can give rise to flexible ways of thinking which may
then play a role in enhancing resilience.
Negative affect as a predictor: Where positive emotions
can make more coping resources available to individuals
(thereby increasing resilience), negative emotions would
likely restrict the range of such resources (Fredrickson 2001)
which would effectively hamper resilience.
Optimism: Results from the present study about the
predictors of optimism also follow the trend as with most of
the other dimensions of PsyCap. Specifically, positive affect
and negative affect emerged, respectively, as significant
positive and negative predictors for total optimism. This
would imply that people who report higher levels of positive
affect (or lower levels of negative affect) would find
themselves having increased optimism in their overall lives.
Positive affect as a predictor: With positive emotions
contributing towards enduring personal resources
(Fredrickson 2001), it is possible that more of such resources
make optimistic expectations of outcomes more likely. Thus,
flowing from positive emotions, people would look towards
the future in expectation of better outcomes. People with
increased positive affect would likely experience an
enhancement of their thought-action repertoires as well as
personal resources in tackling problems. This could
contribute to them feeling more optimistic about their lives in
a variety of domains.
Negative affect as a predictor: Negative emotions allow for
150Sanjna Shukla, Sneha Saha and Ridhima Shukla

a focus on a relatively narrow set of options (Fredrickson
2001). Indeed, negative emotions, by their action on higher
cognition, hamper achievement (Blair 2002). Since negative
emotions lead to outcomes such as these, It can be
hypothesised that people with higher levels of negative affect
suffer performance deficits in different avenues in relation to
their high positive affect counterparts and such experiences
color their view of what the future might hold for them. For
organizations and employers then, keeping tabs on
workplace emotion and affect becomes important.
Psychological capital: For total psychological capital,
positive and negative affect were significant positive and
negative predictors respectively. This would indicate that
individuals displaying high positive affect or low negative
affect would experience higher levels of PsyCap. These
findings are expected in consideration of how the
components of PsyCap were similarly predicted. However, it
is important to reiterate that psychological capital is not
merely a sum of these four components but is a higher order
core construct (Luthans et al 2007). Therefore, the impact of
affect on PsyCap is not merely additive but a relevant finding
in its own right. Additionally, similar to Avey's (2014) study,
present findings lend initial support for the role of individual
differences (in terms of propensity to experience positive or
negative emotions) as antecedents of PsyCap. Positive
emotions facilitate the building up of personal resources by
broadening an individual's thought-action repertoire
(Fredrickson 2001), which, in this case may help explain how
an increase in positive emotions predicts enhanced PsyCap.
Similarly, experience of negative emotions would likely have
the opposite effect of the 'broadening' and would negatively
impact the building of such personal resources. Furthermore.
Youssef-Morgan and Luthans (2015) draw a parallel
between well-being and PsyCap, highlighting that appraisals
(both cognitive and affective) of life events form a core
component of both. Understanding such intricacies serves a
crucial function in the discussion about predictors of PsyCap
and the role of affect.
CONCLUSION
Findings from the present study indicate positive affect
and negative affect to be predictors of PsyCap as well as its
four constituents, namely, hope, efficacy, resilience and
efficacy. Life satisfaction, however, was a significant
predictor for only hope. Flowing from these findings,
universities and workplaces can lay more emphasis on
promoting positive emotions and minimizing negative
emotions while designing student or worker friendly
environments to improve the likelihood of a greater reservoir
of positive psychological resources within individuals. This
study needs to be considered in light of its limitations.
Conclusions must be cautiously drawn owing to a relatively
small sample size drawn using incidental sampling. On
account of using cross-sectional data, causal inferences
cannot be made. Additionally, the findings from an academic
context cannot reliably be applied directly to workplace
settings due to both the state-like nature of PsyCap as well as
its academic variant studied here. Future research, in
addition to addressing these limitations, can include
additional predictor variables to obtain a better picture of the
'left side' of psychological capital.
REFERENCESAndrews DM, Burns LR and Dueling JK 2014. Positive
Perfectionism: Seeking the healthy “Should”, or should we? Open Journal of Social Sciences 02 (08): 27-34.
Aspinwall LG and Leaf SL 2002. In search of the unique aspects of hope: Pinning our hopes on positive emotions, future-oriented thinking, hard times, and other people. Psychological Inquiry13(4): 276-288.
Avey JB 2014. The left side of psychological capital: New evidence on the antecedents of PsyCap. Journal of Leadership & Organizational Studies 21 (2): 141-149.
Avey JB, Luthans F, Smith RM and Palmer NF 2010. Impact of positive psychological capital on employee well-being over time. (1): 17-28.Journal of Occupational Health Psychology 15
Avey JB, Wernsing TS and Luthans F 2008. Can positive employees help positive organizational change? Impact of psychological capital and emotions on relevant attitudes and behaviors. The journal of applied behavioral science 44 (1): 48-70.
Blair C 2002. School readiness: Integrating cognition and emotion in a neurobiological conceptualization of children's functioning at school entry. (2): 111-127.American psychologist 57
Chen X, Zeng G, Chang EC and Cheung HY 2019. What Are the Potential Predictors of Psychological Capital for Chinese Primary School Teachers. 50.Frontiers in Education : 4
Cohn MA, Fredrickson BL, Brown SL, Mikels JA and Conway AM 2009. Happiness unpacked: Positive emotions increase life satisfaction by building resilience. (3): 361-368.Emotion 9
Datu JAD and Valdez JPM 2016. Psychological capital predicts academic engagement and well-being in Filipino high school students. (3): 399-The Asia-Pacific Education Researcher 25405.
Datu JAD and Valdez JPM 2019. Psychological capital is associated with higher levels of life satisfaction and school belongingness. School Psychology International 40 (4): 331-346.
Dennis JP and Vander Wal JS 2010. The cognitive flexibility inventory: Instrument development and estimates of reliability and validity. (3): 241-253.Cognitive Therapy and Research 34
Diener E and Chan MY 2011. Happy people live longer: Subjective well being contributes to health and longevity. ‐ Applied Psychology: Health and Well Being‐ 3 (1): 1-43.
Diener ED, Emmons RA, Larsen RJ and Griffin S 1985. The satisfaction with life scale. Journal of personality assessment49(1): 71-75.
Diener E, Oishi S and Lucas RE 2009. Subjective Well-Being: The Science of Happiness and Life Satisfaction, pp 186–194. In: Lopez SJ and Snyder CR (eds). The Oxford Handbook of Positive Psychology. Oxford University Press.
Fredrickson BL 2001. The role of positive emotions in positive psychology: The broaden-and-build theory of positive emotions. (3): 218-226.American psychologist 56
Fredrickson BL, Cohn MA, Coffey KA, Pek J and Finkel SM 2008.
151Psychological Capital and Subjective Well-Being

Open hearts build lives: positive emotions, induced through loving-kindness meditation, build consequential personal resources. (5): Journal of Personality and Social Psychology 951045-1062.
Genet JJ and Siemer M 2011. Flexible control in processing affective and non-affective material predicts individual differences in trait resilience. (2): 380-388.Cognition and emotion 25
Joseph S, Jadhav A and Nagendra A 2020. An Empirical Study of the Impact of Ethical Leadership on Employee Job Satisfaction (Study of MSMEs in India). (9): 1-Indian Journal of Ecology 477.
Khan A and Husain A 2010. Social support as a moderator of positive psychological strengths and subjective well-being. Psychological Reports 106 (2): 534-538.
Luthans F, Avolio BJ, Avey JB and Norman SM 2007. Positive psychological capital: Measurement and relationship with performance and satisfaction. (3): Personnel psychology 60541-572.
Luthans BC, Luthans KW and Jensen SM 2012. The impact of business school students' psychological capital on academic performance. (5): 253-Journal of Education for Business 87259.
Luthans F, Luthans KW and Luthans BC 2004. Positive psychological capital: Beyond human and social capital. Business Horizons 47 (1): 45–50.
Luthans F, Youssef CM and Avolio BJ 2007. Psychological capital: Developing the human competitive edge, Oxford University Press, New York, USA, p 3.
Nielsen I, Newman A, Smyth R, Hirst G and Heilemann B 2017. The influence of instructor support, family support and
psychological capital on the well-being of postgraduate students: A moderated mediation model. Studies in Higher Education 42 (11): 2099-2115.
Page KM and Vella-Brodrick DA 2013. The working for wellness program: RCT of an employee well-being intervention. Journal of Happiness Studies 14 (3): 1007-1031.
Rego A, Sousa F, Marques C and Cunha MP 2014. Hope and positive affect mediating the authentic leadership and creativity relationship. (2): 200-210.Journal of Business research 67
Schutte NS 2014. The broaden and build process: Positive affect, ratio of positive to negative affect and general self-efficacy. The Journal of Positive Psychology 9 (1): 66-74.
Seligman MEP and Csikszentmihalyi M 2000. Positive psychology: An introduction. (1): 5-14.American Psychologist 55
Snyder CR 2002. Hope theory: Rainbows in the Mind. Psychological Inquiry 13 (4): 249-275.
Wang Y, Chen J and Yue Z 2017. Positive Emotion Facilitates Cognitive Flexibility: An fMRI Study. Frontiers in Psychology 8:1832.
Watson D, Clark LA and Tellegen A 1988. Development and validation of brief measures of positive and negative affect: the PANAS scales. Journal of personality and social psychology54(6): 1063-1070.
Youssef-Morgan CM and Luthans F 2015. Psychological Capital and Well-being: Psychological Capital and Well-being. Stress and Health 31 (3): 180-188.
Zhang R, Ewalds-Kvist BM, Li D and Jiang J 2019. Chinese Students' satisfaction with life relative to psychological capital and mediated by purpose in life. (1): Current Psychology 38260-271.
Received 0 April, 2021; Accepted 6 Ju , 20212 1 ne
152 Sanjna Shukla, Sneha Saha and Ridhima Shukla

Creative Behavior as Predictor of Positive Psychological Capital among Trans Gender People
Manuscript Number: S-692NAAS Rating: 5.79
Abstract: The present study aims to investigate whether creative behavior is a predictor of positive psychological capital (Psy Cap) among 80 transgender people. Using regression analysis it was confirmed that creative behavior is not a significant predictor of psychological capital among the transgender people. Thus, the transgender people who are high in creativity are found with a low positive psychological capital.
Keywords: Psychological capital, Creative behavior, Transgender people
Sangita Goswami and Anupama SrivastavaAmity Institute of Behavioral and Allied Sciences, Amity University, Gurugram 122 051, India-
E-mail: [email protected]
Indian Journal of Ecology (2021) 48 Special Issue (16): 153-155
While the majority of psychological research on
transgender-identified individuals has centered on adverse
consequences or vulnerabilities, transgender identity may
provide unique opportunities for positive identity growth and
finding meaning. This article shed light on the life of
transgender people who, after witnessing traumatic,
negative, and toxic interactions, continue to form new values
through engaging in various cognitive processing through
their imagination simultaneously encouraging well-being and
flourishing. Psychological capital is presented as a vital
subset of this research. A persistent belief that individuals'
psychological resources accumulated through optimism and
hope are more likely to improve their positive emotions in
regular living. There may be two explanations for this. To
begin, the componential theory of creativity states that any
creative thinking includes four components: three within the
individual – domain related abilities, creativity-relevant
processes, and intrinsic task motivation-and one outside the
individual-the social atmosphere in which the individual is
involved. (Amabile 2013). As a result, people who are
motivated by hope and happiness will feel more positive
emotions. Second, people with high self-efficacy are more
likely to understand and believe in the mechanism and
consequences of using one's personal strengths to achieve
positive outcomes. Fedai (2018) Recent conceptual
frameworks about has been expanded only in organizational
settings and strongly demonstrates that psychological capital
and its components serve as a predictor of creative
performance. Luthans (2013) Transgender people in India
are often forced to live on the opposite shore; but coming
from marginalized minority group, their experiences are also
associated with a lot of positive attribution. This paper is
intended to as a modest contribution to conceptualizing their
innovative thought, which could serve as a predictor of their
psychological resources. Although research on the origins of
creativity in the transgender community is in its preliminary
phase. Little is documented about transgender people's
potential to generate positive psychological resources in the
face of adversity and long-term stress. Previous studies
investigating the positive aspects of lesbian and gay male
and bisexual, a number of concepts have been defined like
parental support Ryan et al (2010). The current study
extended this research to transgender-identified individuals
only. The current study broadened this research to include
transgender people. Such studies are necessary if
practitioners are to have the knowledge base required to
facilitate the positive identity development of transgender
clients.
MATERIAL AND METHODS
Measuring tools: This study comprised of 80 male-to-
females self-identified as transgender people (18-65 years)
of West Bengal. The population was selected utilizing
incidental sampling Psychological Capital (PsyCap) was
measured using 24 item psychological capital questionnaires
(PCQ) which is validated by Luthans (2007) and show a
strong psychometric properties in a growing number of
studies. PCQ consist six items for each of the four
components adapted from published measures .Items were
measured on a 6 point likert scale. The reliability for the PCQ
was 0.93. An overall PsyCap score was calculated by adding
all the obtained raw scores from each item. It included
reverse scoring of items 13, 22 and 23.
Procedure: The survey was distributed in form of

Model R R2 Adjusted R 2 Std. error of the estimate
1 .087 0.007 .005 10.12686
Table 1. Model summary explaining regression analysis of creative behavior and psychological capital
Predictors (Constant), Crebhv
Model Sum of squares Df Mean square F Sig.
Regression 60.391 1 60.391 0.589 0.445
Residual 7999.159 78 102.553
Total 8059.550 79
Table 2. Creative behavior and psychological capital
a .Predictors (Constant), Crebhv, b .Dependent cariable: Psycap
questionnaires following by a small exercise of creative
behavior. Every transgender was interacted personally. First
they were asked about themselves which included their
demographic details, then few brief lines were said about the
entire exercise. Taking their consent, the psychological
capital questionnaire was filled in which the questions were
translated according to their convenience. Creative behavior
was measured by an exercise that was used in organizational
behavior creativity research by Harrison (2003). The
exercise named as “the unusual uses” which focuses on the
ideation of component of creativity. For this exercise,
participants had maximum 30 seconds to derive the most
number of uses for common house hold items. Consistent
with the work by Harrison (2003),items which were used are
shoelace, belt , mug and hanger. In consistent with the other
researches using this exercise, the number of used given by
the participants was counted as an index of creative
performance.
The regression analysis indicated creative behavior is
not a significant predictor of psychological capital as, = R
0.087. The result also shows that there has been no
significance difference in the modal between psychological
capital and creative behavior among the transgender people.
The independent variable, creative behavior does not have
any effect on psychological capital, dependent variable. The
obtained significance value 0.445. Thus, the assumed
hypothesis creative behavior is a predictor of psychological
capital (Psycap) among the transgender people has been
rejected. The objective of the study was to understand
whether creative behavior is the predictor of psychological
capital among the transgender people, but the results have
rejected the stated hypothesis. The obtain results are not
consistent with the previous study done with 899 working
adults by Luthans (2010) stating psychological capital and its
components as predictor of creative performance. Two main
theories Information processing theory (IPT) and Brain
development by Afshar-Jalili and Khamseh (2019) were
introduced. In IPT the childhood maladaptive schemas that
have derived from the toxic or the adverse experiences
influences the persons adulthood behavior, which in turn
results in lowering of the psychological capital, Similarly the
Nolen-Hoeksema et al (2008) theorized that attention focus
on negative stimuli such as negative memories or negative
thoughts derive from schemas lead in decrease of
psychological resources that can be used for problem-solving
.Hence these adverse experiences directs the attention from
positive aspects to negative ones. In brain development
theory, all the childhood toxic and stress is associated with a
high amount of stress and cortisol which brings hormonal
imbalance in our brain. When a person is in a stressful
situation, the person need to rely on his/her psychological
capital to face the circumstances, the developed brain
architecture which is already influenced by high amount of
cortisol due to the experienced may hinder him, and thus
result to low psychological capital. Performing artist with high
adverse childhood experience are also engrossed in positive
creative performance. Childhood adversity is identified as
any exposure to abuse, neglect or family dysfunction.
Struggling with increased shame and anxiety, coupled with
managing more exposure to adult traumatic experiences,
adds to the stress of a performing arts career (Thomson and
Jaque 2017). Nearly all the transgender people in India face
extreme situations in their lifetime. Few of the adverse
experiences happen in childhood which affects them.
Transgender individuals have frequent experiences of
trauma, often related to societal prejudice, hatred, or
intolerance, because of their gender identity. Thus the
findings imply that transgender people are able to channel
their negative experiences into inspiration for their work,
possibly they use creativity as a coping strategy for dealing
with hardship. Creative expression offers therapeutic benefits
to transgender people because they increase engagement,
catharsis, positive emotion and even distraction.
REFERENCESAfshar Y and Khamseh A 2019. Why childhood toxic experiences
and early maladaptive schemas affect negatively one's psychological capital? Journal of Psychology & Psychotherapy 09(04): 1-8
Amabile T and Pillemer 2015. Creativity. Wiley Encyclopedia of Management : 1-4.11
Ellen D et al 2008. The positive aspects of being a lesbian or gay man. (2): Professional Psychology: Research and Practice 39210-217.
Fedai M and Gökçen A 2018. Psychological capital: Definition, components and effects. British Journal of Education, Society & Behavioural Science (3): 244-2555
Luthans F 2012. Measuring implicit psychological constructs in organizational behavior: An example using psychological capital. (4): 589-594.Journal of Organizational Behavior 33
Nolen-Hoeksema S, Wisco BE and Lyubomirsky S 2008. Rethinking
154 Sangita Goswami and Anupama Srivastava

rumination. (5): 400-Perspectives on Psychological Science 3424
Ryan C et al 2010. Family acceptance in adolescence and the health of LGBT young adults. Journal of Child and Adolescent
Psychiatric Nursing 23: 205-213.
Thomson P and Jaque S 2018. Childhood adversity and the creative experience in adult professional performing artists. Frontiers in Psychology : 1119
Received January, 2021; Accepted May, 202124 16
155Creative Behavior among Trans Gender People

An xploratory tudy on Decision Making in Creating Positive E SOrganisational Culture: An insight from Indigenous ractice P
and Wisdom Tradition
Manuscript Number: S-693NAAS Rating: 5.79
Abstract: The paper explores the challenges faced by the modern corporates due to globalisation. Drawing rich insights and experiences from wisdom tradition and practices, the study attempts to understand the conflict of corporate world. It intends to understand the institutional strength and capacity to deliver, the parameters for negotiation in order to resolve conflict, consent and agreement, consent in political conception, procedure and implementation, structure and competency, and commonality on which employees look towards their future. To this effort, an open-ended survey was conducted among senior business executives, activists, political and religious leaders. A robust literature survey including canonical texts was drawn to derive insights from spiritual tradition and folk's culture. Also, hermeneutical understanding of 'caring the neighbour,' how people identify with the others, relational building and theological exposition on Imago Dei and Logos is incorporated to build the concept of truthful speech, truth-telling; a basis for creating positive work culture. The paper argues towards the importance of dialogue as a collective group, a dialogue towards action that transforms, an action stirred by the thoughtful idea, and a thoughtful idea mediated by meaningful dialogue.
Keywords: Logos, Imago Dei, Wisdom tradition, Canonical text, Positive psychology
Guangpuanang KahmeiFaculty of Management Studies (FMS), University of Delhi, Delhi-110 007, India
E-mail: [email protected]
Indian Journal of Ecology (2021) 48 Special Issue (16): 156-160
According to Work Institute Report (2019) more than 27
out of every 100 U.S. employees quit in 2018. This trend is
upshot since 2007-10 from 8.3 to 8.8% which is estimated to
hit 35% by 2023 if the trend continues. In 2018 in US alone,
41.4 million workers voluntarily left job with the turnover
exceeding 27%. Likewise, in India according to Statista
Research Department Report (2019) 18.5% voluntarily left
job in retail sector alone in 2018. This comes with a heavy
price to corporation. As per the Bureau of Labour Statistics
(U.S.) the turnover can cost 33% of employee's total
compensation to company which include wages and other
benefits (Smith and Smith Quality, 2009). Matthew O'Connell
et al (2007) estimated that the average replacement costs
come about $13,996 per employee which is 6 to 9 months'
salary on average. Furthermore, apart from financial lost, it
also “adversely affects employee morale” which has strong
adverse impact on performance (Smith and Smith Quality
2009). For instance, insurance claimed due to employees'
grief and other related mental illness, and reduction of
productivity cost to company upwards 75 billion dollars
annually (Zaslow 2002). However, more than 3 in 4
employees who quit could have been retained by employers
and that could have saved billions of dollars annually
(Retention report 2019, DailyPay 2019). This abnormality
employees' turnover is hugely contributed by “poor
management” (Smith and Smith Quality 2009). Work
retention report has revealed, 11 out of 100 who quit is due to
poor manager behaviour (Retention report 2019, p. 7e).
Consequence is not only wasted valuable resources but
produce enormous hurt which has serious implications both
in term of performance and overall organizational
achievement. It produces “a variety of psychological,
physiological, and interpersonal outcomes such as a
diminished sense of self-worth, weakened immune system,
and a workplace sabotage” (Frost, 2003, Ryff and Singer
2001). Mackey and Sisodia (2014) state this are the shadow
of crony capitalism and adulterate socialism which widely
portray as “greedy, selfish, exploitative, and untrustworthy.”
They further argued that the low level of consciousness has
push businesspeople to engage in “trade-off thinking” that
causes harmful consequences and indicate the urgency to
rise above such mentality. The consequences are that,
business loses money, valuable resources depleted,
environment become polluted, workers are dehumanize and
so on. This is evident from continuous case of harassment,
incivility, fraud, and different kind of abuse at workplace.
Therefore, a core human affection, care, love, compassion,
empathy shredded, and meaningful relationship got broken
and meaningful work become redundant. Thus, wide social
engagement and fellowship disappear, human intercourse

diminishes, and tendencies of self-isolation arise. However
can also regain by consciously creating positive
organizational culture and make our workspace for healing
this wound. This is the effort of the paper.
MATERIAL AND METHODS
The study is the combination of ethnography,
hermeneutical and robust literature survey. The primary data
compose of interviews, group discussion and dialogue
organize especially in Delhi and also, in Imphal, Tamenglong,
Noney of Manipur, and Kohima in Nagaland. Secondary data
consist of hermeneutical study on canonical text, published
research articles, and books. To develop greater
understanding of the concept, an insight is drawn from
indigenous practices through storytelling session with elders
from village council; conduct an interview with various social
activists and religious leaders including local priest, pastor
and missionaries. For the purpose of understanding the
Gam Shimray (SG, AIPP)
Neigulo Krome (SG, NPMHR)
Dr Ngully (Senior Psychiatrist)
Gaidon Kamei (Presiden, UNC)
Kapudai (Village Chairman)
Rev. M. Pamei Kadi (Senior Pastor)
Digak Pame (Senior lecturer, ETS)
Dr Lorin (Principal, Tetso College)
Management Model (conceptual framework)
Motivation
The potential for human being to be the co-creator with God, our action to transform the world drive us to be in dialogue with somebody. Such drive us to give our best.
Work with the people.
Focus on purpose Keeping my mindset positive, shared responsibility.
Loving the people and working for their development.
Act of Christian, to be right in God and diligently obey His command.
Demonstrating the highest form of ethic s through action.
Respect one another, motivate one another and stay true to the vision with clarity.
Decision Model
Dialogue and truth.
Consult and decide collectively.
In Our tradition (Naga), people respected the decision taken by the elders.
Collective representation.
Council elders will take decision depending on circumstances and nature of the case.
Obedient to the calling of God and follow even things which are difficult.
Integrity, honesty, bravery, sincerity, decency, faithfulness, courageous and boldness
Feedback and continuous improvement.
Political conception
Political order which is consensual in nature, system that is truly representative.
Base on university declaration of human right.
Enter a Covenant with nature and the people. Mithun head is the political representation.
Common aspiration of the people and self-determination.
This is deeply rooted in our tradition.
Care for neighbour
Chakhuang exhibit in words, work and every walk of life.
Strive for excellence
Institutional strength
Recognise employees are the transformation force
Voluntarism The culture of solidarity.
Sacrificial nature of people for common good.
Command the respect of everyone.
Rely not in human's strength but God.
Family Team work
Control
The basis for us to rescue ourselves from the situation is with truth telling.
Dedication and self-commitment for the collective aspiration of the people.
Greed is a disease which infected the society. in our tradition we have a system to control this greed through practice of 'feast of merit'
Mutual respect.
In our Zeliangrong customary system, there is duty and responsibility depending on their age and status.
Loving the neighbour and concern for the poor is what Jesus taught us.
Chakhuang bind the Zeliangrong society together. It is fundamental practices of Zeliangrong people and taught in Morung; ethics. and moral principle, the key for a social living.
Provide freedom for experimentation.
Table 1. Results from nterviewsi
157Decision Making in Creating Positive Organisational Culture

intricacies of a business culture, an open survey was
conducted in Delhi NCR among business executives and
employees. The large part of this study is deriving from a
Morung dialogue series organized under NPMHR, Delhi in
2019. This is an exploratory study purely base on qualitative
method.
RESULTS AND DISCUSSION
Beginning from first industrial revolution, business
organizations are in pursuit of efficiency and effectiveness.
The success of this quest brings us enormous wealth, no
doubt economic prosperity. However, little to say human
happiness and their well-being. Such ideal of profit
maximization and little of social prosperity resulted extreme
tension, burnout which cost not only money and employee
productivity but also tarnish the image of workplace as a
whole. Workplace today stand in the shadow of bully,
incivility, abuse, with little sign of joy. In such environment
Dutton (2003) argues “compassion” is something any
organization cannot afford not to have. However, the
Personal bonding Compassion Free peechs Clarity of vision Recognition Voluntarism
Motivate, give comfort to each other
Support from colleagues
Create an environment of dialogue.
Clarity of role and mission
Recognizing colleague's effort and appreciation.
Voluntary participation
Exemplary demonstration
Care and love Freedom to express the ideas and opinions.
Focus on purpose rather than task.
Acknowledging others' work
Make members participate in activities
Care for others Giving opportunities and platform
Truth telling Provide political vision based, historical truth, shared future
Fair appraisal Ownership of the given task
Keep our mindset positive
Acknowledging colleague problem
Encourage questions and discussions.
Shared responsibility. Give credit where it due
Sense of ownership
Be true to oneself Treat with dignity Allow free debate in matter that affect them.
Shared goal, objectives of what they are doing.
Appreciating effort. Decision making which is consensus in nature
Encouragement Create comfort environment
Engrossed with own work
Approach of inclusiveness in decision making
Provide adequate time for fellowship
Considerations, one another.
Shared knowledge Picture success.
Support among colleagues
Giving them chances Open suggestions. Debate, discuss, and vision
Enhancing good relationship
Help in time of trouble
Free debate in important issue
Part of organisations goals
Informal conversation Casual workplace, interaction
Respect for diversity Create conducive environment
Normal interaction, playing together
Spirit of accommodation despite weaknesses
Sharing good thoughts.
Table 2. Summary of the survey on positive work culture
question is 'how many organizations truly practice
compassion in their dealing as their core principle?' In one
interview with the senior executive, he commented on
present business model that “we are too less compassionate
and too little respect for individual ” Today, workplace inherits .
the legacy of globalization, where diverse background
interacts. And each have a way of looking at the world. This
worldview is term as “entity” by this article is left undefine
within the group also in any organizational levels. Because of
this there can be a serious misunderstanding emerge and
pose a threat to positive organizational process. This
challenge is acknowledged and reflected on two important
ground in this research firstly, a model of decision making
which is conscientious in nature, and secondly, a political
conception which give clarity, precision base on compassion,
empathy, care, and acknowledgement of pain in the system.
The first and foremost element identify for creating positive
organizational culture is the model of decision making. Gam
Shimray remarks that organization today lacks a system that
is truly representative and is truly inclusive at the
158 Guangpuanang Kahmei

fundamental level (Table 1). Therefore, the whole aspect of
diversity, a culture of diversity is missing. Respecting
diversity must be affirmed. Without respecting diversity
cannot achieve this kind of decision-making process which is
truly representative. However, this is indigenous practices
and customary law. The law in itself, which enable protection
and promotion of the good ways a community live and. taken
as behaviour not the voice of power. The law principal
sources are the custom which is the expression of the
community. The development of social space through mutual
consent operated in daily lives, a relationship develops out of
deep social engagement between individual. Therefore, the
law however, weak and based on consent and uphold in
truest spirit because they are rooted deeply on mutual
consent. Likewise, the whole structure of democracy is
based on this idea of consent. Ultimately, dialogue and truth
searching also attend when we are in agreement. This is
deeply reflected in indigenous practices though it is at the
village level. The second element we find is 'right political
conception.' Garfield et al (2018) observed that even small
egalitarian hunter-gathers society is maintaining an active
political structure so as every workspace is an active political
unit, and is constantly reshaping by the kind of political
engagement they have, the model of decision making, and
the acceptability of such decision is influenced by such
political conception. Political conception is strongly in tie with
personal values, it could be endemic to region, culture,
training or faith etc. The other aspect is, common
misconception which adding stress to the system is not only
terminology but also defect in institutional design and
institutional capacity to deliver. This is the challenged, which
is difficult to overcome more so, priorly, if organization is run
by authoritarian leader (Maslow 1998). However, indigenous
management practice offers a rich experience that modern
management can draw insight from.
CONCLUSION
The world has been witnessing the success of scientific
endeavour in productivity. However, the dynamic of world
happiness diminishes resulting in widespread suffering. The
study identifies the prevalent work culture, the insane
demanding culture has adverse impact on psychological,
emotional, and spiritual health, accelerating conflict and
mistrust which requires immediate attention. The study also
acknowledges the culture of mass production that beaten-
down workers life into a mechanical process and such culture
needs redeeming because such technological civilization,
without being grounded on fundamentals of human values,
merely push for socialization is just the counterfeit to the real
solution. Organizations that follow such approaches may
command expertise but if machine culture is not corrected,
there will be no deeper social engagement and will continue
to inhibit all kinds of meaningful relationships. Consequently,
making little sense of the organization noble mission to the
larger section of people. Therefore, the study offers two
critical pillars through which corporate can recreate positive
work culture: firstly, a model of decision-making which is truly
representative and inclusive at the fundamental level, basing
on indigenous governing systems. Secondly, the right
political conception is truly empowering. The study also
indicates that creating positive work culture essentially
requires every bit to be pluralistic, rooted in deeper human
intercourse. The aggressive economic pursuit of an
organization has bypassed every sense of care for others;
killing the prime ingredients of meaningful work resulting in
an adverse impact on culture. Such negativity has driven
home, inflicts hurt. Therefore, the paper suggests "truthful
speech" as the basis to rescue from such a situation. Through
this process, the genius of human kindness comes into flesh.
This is significant because transform action is oriented by
thoughtful ideas, and every thoughtful idea is always
mediated by dialogue; a dialogue that seeks truth. However,
such a level of engagement is possible only when there is a
deep respect for others in all senses. It means to value every
human being as intrinsically equal irrespective of their skills
and contributions but to view them as a person who is
endowed with transcendental value. On this ground, true
inclusiveness, pluralistic, and a positive organizational
culture are built; a culture that valued human value above all
else. For management, it means recognizing the human
agent as a transformative force and for workers, it means
empowerment; a new space is created to be a co-creator.
Further research is needed to provide clarity and precision for
proper implementation.
REFERENCESAshforth B 1994. Petty tyranny in organizations. Human Relations
47: 755-778.
Cooperrider DL, Goodwin LN 2012. Positive organization Development: innovation-inspired change in an economy and ecology of strengths. DOI: 10.1093/oxfordhb/978019973 4610.013.0056.
DailyPay 2019. . Guide to Understanding Employee Turnover
Dutton EJ 2003. San Francisco, CA: Energize your workplace.Jossey-Bass.
Dutton JE and Spreitzer GM 2014. How to be a positive leader: Insights from leading thinkers on Positive Organizations (eds.). San Francisco. Berrett-Koehler Publishers, Inc.
Dutton JE, Roberts LM and Bednar J 2009. Positive Identities and Organizations: An Introduction and Invitation (eds.). , New York, NY
Fletcher J 1996. A relational approach to the protean worker, in D.T. Hall and associations (eds.). The career is dead- long live the career, San Franscisco, CA: Jossey-Bass.
159Decision Making in Creating Positive Organisational Culture

Frost PJ 2003. Toxic emotions at work: How compassionate managers handle pain and conflict. Boston: Harvard Business School Press.
Frost PJ 1999. Why compassion count. Journal of Management Inquiry 8(2): 127-133.
Garfield ZH, Rueden C and Hagen E 2018. The evolutionary anthropology of political leadership. p. The leadership quarterly.59-80.
Kahn WA 1993. Caring for the caregiver: patterns of organizational caregiving. Administrative Science Quarterly .38(4): 539-563
Lerner M 2006. The Left Hand of God: Healing America's Political and Spiritual Crisis (1 .ed). st New York, NY: Harper San Francisco.
Mackey J and Sisodia R 2014. Conscious Capitalism: Liberating the Heroic Spirit of Business, Harvard Business Review Press, Boston, Massachusetts, USA.
Malik C 1987. A Christian Critique of the University (2 .eds.). nd
Ontario, North Waterloo Academic Press.
Maslow A 1998. Canada. Wiley & Sons, Maslow on Management.Inc.
Mirvis PH 1980. The art of assessing the quality of work life, in E. Lawler, D. Nadler and C. Camman. (eds.). Organizational Assessment, New York: Wiley Interscience.
Mirvis PH 1997. Crossroads- “Soul Work” in organizations. Organization Science 8(2): 192-206.
Mrazek PJ and Haggerty RJ 1994. Reducing risks for mental disorders, (Eds.). Washington, DC: National Academy Press.
Pearson CM and Porath CL 2009. The cost of bad behaviour: How incivility damages your business and what you can do about it. New York, NY: Portfolio Penguin.
Pearson CM, Andersson LM and Wegner JW 2001. When workers flout convention: A study of workplace incivility. Human Relations 54 : 1387-1419.
Ramachandra V 2005. The scandal of Jesus: Christ in a Pluralist World . MHS, Norway.. Karl Reichelt Lecture
Rosling H, Rosling O and Ronnlund AR 2018. The factfulness: ten reasons we're wrong about the world and why things are better than you think”. Great Britain, London:Sceptre.
Ryff C and Singer B 2001. Emotion, social relationships, and health, (eds.). Oxford, UK: Oxford University Press.
Smith JL 2009. 12 reasons employees leave organizations. Jim Smith Quality. Peoria.
Spreitzer GM and Porath C 2014. Enable Thriving at workplace (eds.). San Francisco. Berrett-Koehler Publishers, Inc.
Statista Research Department 2019. Share of voluntary staff turnover in Indian companies-by industry 2018, Sept.23, 2019.
Tepper BJ 2007.Abusive supervision in work organizations: Review, synthesis, and research agenda. : Journal of Management 33261-289.
Work Institute 2019. . Retention report
Zaslow J 2002. New index aims to calculate the annual cost of despair. , November 20, 2002. D1-D12.Wall Street Journal
Zenoff DB 2013. The soul of the organization: How to ignite employee engagement and productivity. New York, NY:
Received January, 2021; Accepted 5 May, 202104 1
160 Guangpuanang Kahmei

Technology Impact and its Infrastructure in Different Territories
Manuscript Number: S-694NAAS Rating: 5.79
Abstract: The paper's prime objective is to inquire about the effects of technology and its support in different territories in the world. It aims to study the main trends in technology, owing to which fast growth experience occurs in various countries. The paper also explores the SDGs Sustainable development goals (SDGs) related to technology that has been adopted by 193 countries in the world to reset the direction of the territories. The study employed qualitative research by using an in-depth interview for collecting data and content analysis for data analysis. The countries with the highest technology penetrations worldwide are Japan, USA, South Korea, Germany, China, India, England, Canada, Sweden, Australia, Finland, Russia, Israel, France, and Singapore The list is transforming the world's 2030 plan for sustainable development. .Internet usage has displayed a tremendous leap of around 370 million and growth in many regions-a massive jump of about 370 million internet users in many areas. The same is useful for the Government in the delivery of smart services in their countries. The findings show the countries with various trends and growth of their technology usage. The paper explains the study on the impact of technology in countries as they contribute to industry innovation and infrastructure, one of the Sustainable Development Goals of UN Agenda 2030. The research incorporates 17 countries' technology infrastructure and draws the trends of growth of technology infrastructure across countries. The insights will be helpful for the researchers in the detailed study and the practitioners in their businesses.
Keywords: Technology, Development, Internet, Infrastructure
Surabhi SinghInstitute of Management Studies, Ghaziabad-201 009, India
E-mail: [email protected]
Indian Journal of Ecology (2021) 48 Special Issue (16): 161-170
Information technology is key component of one of
sustainable development goals to build on existing initiatives
to develop sustainable development measurements that
complement the gross domestic product and support
statistical capacity-building in developing countries.
Technology and its infrastructure in different territories are
essential for competitiveness in the world. The regions are
administrative divisions, usually the area that is under the
jurisdiction of a state. Presently, all dependent territories are
either overseas territories or non-sovereign associated
states. The four countries currently possess dependent
territories: the United Kingdom, New Zealand, Norway, and
the United States. IT s are components infrastructure the
required to operate and manage enterprise IT environments.
The impressive growth of numbers in the South East Asia
region was in all segments. The expansion of technology and
its infrastructure was visible in 2018. The internet and mobile
growth in Southeast Asia are includes internet penetration
(58%), social media penetration: (55%) and mobile
connectivity (141% (https://aseanup.com/southeast-asia-)
digital-social-mobile).
North-East Asia includes China, Japan, South Korea,
Singapore and India and in West Asia Israel have the highest
technology usage rate. The top-performing countries in
terms of internet penetration in Europe are England,
Sweden, Russia, and Finland. The USA and Canada in
North America show the highest performance in terms of
technology usage. Israel in the Middle East also offers high
optimal performance in technology. The internet penetrations
in other Middle East countries are not higher. Technology and
its infrastructure have shown considerably higher growth in
the Middle East (https://www.internetworldstats.
com/stats.htm).
Asia has the highest population percentage and the
penetration rate of the internet as per the population is 49%
(Table 2). In contrast, the community of North America is
4.8% of the world, and the penetration rate of the internet is
highest, i.e., 95% as per population. This indicates need for
an increase in technology and its infrastructure in Asian
Countries. The penetration of technology and its support is
low in Asia, owing to its vast population. The continent,
Europe has around 10.8% globally; internet penetration is
about 85%. However, Asia has the highest users of the
Internet in the world.
Territories should be built with ethical considerations in
mind (Gagliardi 2017). Technology and its platforms are an
integral part of any country, but the population size also
impacts the usage rate. The Government in Asian and African
countries is attempting to increase the penetration rate, and
the growth is evident in these areas (www.oecd.org). Latin
America, Australia, and the Middle East have less population.
The internet's penetration rate is around 60%; it implies that
the initiatives happen in these continents to improve
technology (www.deloitte.com). Jabbouri et al (2016) found
Countries Indonesia Philippines Thailand Singapore Malaysia Vietnam
Population (Millions) 265.4 105.7 69.11 5.75 31.83 96.02
Internet users (Millions) 132.7 67.0 57.00 4.83 25.08 64.00
Social media users (in millions) 130.0 67.0 51.00 4.80 24.00 55.00
Mobile users (in millions) 177.9 61.0 55.56 4.71 1.62 70.03
Table 1 . Internet and mobile technology user's growth in South East Asian Countries (2018)
Source: https://aseanup.com/southeast-asia-digital-social-mobile/
Continent Population (2018) Population (% of world) Penetration rate (% population)
Internet users (%)
Africa 1,287,914,329 16.9 36.1 11.0
Asia 4,207,588,157 55.1 49.0 49.0 %
Europe 827,650,849 10.8 85.2 16.8
Latin America / Caribbean 652,047,996 8.5 67.2 10.4
Middle East 254,438,981 3.3 64.5 3.9
North America 363,844,662 4.8 95.0 8.2
Oceania / Australia 41,273,454 0.6 68.9 0.7
Table 2. Internet usage in continents (2018)
Source: https://www.internetworldstats.com/stats.htm
that IT Infrastructure has an impact on Innovation
performance as a critical issue. The territory can be
understood as a 'political technology' (Elden 2010) mirrored
in studies of large socio-technical systems. A multiplicity of
theoretical perspectives has foregrounded the diverse
agencies involved in infrastructure networks' construction
and functioning (Anderson et al 2012).
The growth of internet penetration is relatively low in
Africa as per its small population percentage. The population
of Africa and Europe are the same. The population
percentage is 16%, and in Europe is 11%. The internet
penetration in Europe is much higher than in Africa. The focus
of flexibility is on IT infrastructure flexibility as the
technological factors (Saaksjarvi 2000, Chung et al 2003,
Chung et al 2005). The ongoing technological revolution
impacts society and the Economy and leads to investigation
for managing its risks and dangers (Lee 2002). Technology
districts are areas where activities to create and enhance
knowledge for practical uses cluster and constitute a
significant source of value-added stimulus to the Local
Economic (Smelser and Baltes 2001). Technology plays a
significant role in increasing economic growth in a few
countries globally and helps to address the problems on a
grander scale and speed than other countries. By improving
the speed of transactions, creating trust and transparency,
facilitating payments, and giving market access to the world,
the technology-enabled economies are now plugged into the
global Economy faster than ever before. The following is the
impact of the Internet on a few countries in the world.
China has the highest internet users; the second-highest
internet users are India and third in the USA. The growth of
internet usage is highest in China and India. The internet
users in China are 772,000,000, India has 462,124,989 users.
The countries in terms of high internet users are Indonesia,
Japan, Russia, Germany, Philippines, Vietnam, UK, France,
and Thailand. The countries show the highest penetration in
terms of technology usage. Egypt in the Middle East also has
high internet usage (www.internetworldstats. com). The study
focused on the potential effect of technology adoption, and its
overall productivity by including sectors and firms (McKinsey
2019). The research conducted in the past has formed the
basis of the rationale for the current study. The prime objective
is to inquire about the effects of technology and its support in
different territories and to study the main trends in technology,
owing to which fast growth experience takes place in the
countries. The paper also explores the SDGs Sustainable
development goals (SDGs) related to technology.
MATERIAL AND METHODS
The paper employed the use of qualitative research and
the data collection tool of the in-depth interview. The
interview with a representative of IT implementation from the
countries. The countries were chosen based on their highest
internet penetration and some industry innovations in the
world with good ICT. The interview sheet that was used in the
study consisted of open-ended questions. The questions
included various inputs like technology penetration, IT
opportunities available in multiple sectors, IT spending
162 Surabhi Singh

Country Population Internet users Internet growth (%)
China 1,415,045,928 772,000,000 3,331
India 1,354,051,854 462,124,989 9,142
United States 326,766,748 312,322,257 227
Brazil 210,867,954 149,057,635 2,881
Indonesia 266,794,980 143,260,000 7,063
Japan 127,185,332 118,626,672 152
Russia 143,964,709 109,552,842 3,434
Nigeria 195,875,237 98,391,456 49,095
Mexico 130,759,074 85,000,000 3,033
Bangladesh 166,368,149 80,483,000 80,383
Germany 82,293,457 79,127,551 229
Philippines 106,512,074 67,000,000 3,250
Vietnam 96,491,146 64,000,000 31,900
United Kingdom 66,573,504 63,061,419 309
France 65,233,271 60,421,689 610
Thailand 69,183,173 57,000,000 2,378
Iran 82,011,735 56,700,000 22,580
Turkey 81,916,871 56,000,000 2,700
Italy 59,290,969 54,798,299 315
Egypt 99,375,741 48,211,493 1051
Table 3. Twenty countries in the world with internet growth (2018)
Source: www.internetlivestats.com
budget, various dimensions of technology effectiveness. The
interview was conducted via skype. The time taken was 30
minutes with each expert, and it took around five days to
complete the data collection. The experts from 17 countries
were involved in the data collection process; the sample size
was 17. The interview was concluded by the action plan that
the interviewing expert envisioned. The secondary data was
taken from other websites. The responses were analyzed
using Content Analysis.
RESULTS AND DISCUSSION
Technology as sustainable development goal: The
seventeen Sustainable Development Goals compiled by the
United Nations General Assembly in 2015 were based on the
UN list of 2030. The objectives of these are to build on the
Millennium Development Goals and complete what these did
not achieve. They ensure human rights for all and to achieve
gender equality. They are integrated and indivisible and
balance the three dimensions of sustainable development:
economic, social, and environmental. The chapter has
addressed the ninth SDG viz. industry innovation and
infrastructure. The industry innovations without technology
and its support are incomplete (https://sustainable
development.un.org).
Personal Benefit
Personal Insecurity
Job Improvement
Job Stress
Organization Factors-
Task, Role, Relationships, Culture, Decision Making, Communication
Training, Participation,
Commitment,
Risk Taking
Fig. 1. Impact of Technology (Levi et al 1992)
163Technology Impact and its Infrastructure in Different Territories

Impact of technology and its infrastructure: The model on
technological change impact was used to review the
workforce to execute new technology (Levi et al 1992). The
figure given below indicates the significant factors involved in
the technological change process. The first factor consists of
the organization's features, which are influenced by the
change in technology. The second factor consists of how the
change gets processed. The last element is the perceived
change in employees. The internet and mobile telecom have
grown increasingly in the previous twenty years in global
platforms. Technology has made transitions in terms of
Mobile, Telecommunications, and the Internet. For the
delivery of smart government services, the citizen-centric
approach is essential (Obedait et al 2019).
The increasing mobile phone users in the countries
create an active site to download, purchase, and use mobile
applications. The internet environment has enabled
companies to generate value from understanding search
habits and mobile consumer behavior. Southeast Asia is an
emerging and mature market (www.nielsen.com). The
countries of this part of the continent convert the problems
into business opportunities. The World Bank reports that
people are to these countries, and for space, housing,
energy, food, water get solved by the new technologies. The
study on technology penetration in countries is essential
before the discussion on industry innovations.
The responses are analyzed in the following ways-
Indonesia: Indonesia has 53.7 % internet usage
penetration. Individual consumers use online marketplaces
to find goods, accommodation rentals, financial loans, crowd
sourcing, and car-sharing. Early-adopter companies are the
first to facilitate the connection as exceptionally well while
also promoting entrepreneurship and reducing
intermediaries' role. In big cities like Jakarta, Indonesians
now regularly use online platforms such as ride-hailing apps
Grab, Go-Jek, and Uber or Airbnb to find online
accommodation. In the survey conducted by Nielsen in 2014,
87 percent of Indonesians use products from others in a
shared community when compared with the world
population. The spread of existing technology and
infrastructure, namely Internet users in Indonesia, is 132.7
million, 52 percent of the total population. Another
transformation is cashless payment via technology. The
central bank of Indonesia, Bank Indonesia, has been
promoting the so-called cashless society since 2014. This
encourages the public to use the non-cash payment
instrument. For banks and retailers, having more people
making cashless transactions means more sales. The
convergence of secure payment technologies with the often
insecure currency systems in many developing countries will
Countries Experts and Industry
Indonesia Software& Director
Philippines Vice President-Retail
Thailand General Manager-Food
Singapore VP-Services
Malaysia Director-Retail
Japan Senior Manager-Retail
Israel Director-Services
Finland Director-Education
USA VP-Services
China General Manager-E commerce
Canada Manager-Retail
Russia Manager-Hospital
South Korea Director-ITES
India Director-Consumer Durable
Sweden VP-Services
England Manager-Services
Vietnam Manager-Pharmaceutical
Table 4. Responses of 17 countries representatives
likely drive a massive upsurge of cashless payment
technology and usage. In Indonesia, the developers have
used language processors to power the Chatbots that speak
and understand the native language to improve customer
engagement. The use of AI and advanced analytics has
increased the unique customer insights based on the user's
behavior.
Philippines: The internet usage penetration percentage in
the Philippines is 62.9%. The opulent opportunities available
in financial, telecommunications, health IT sectors, and
business process management, the technology industry is
expected to grow in the Philippines. The growth is owing to
increased consumer spending and SME modernization. The
total IT spending was $ 4.4. Billion with an 8.3 percent
increase from 2015. The annual growth rates have reached
10.6 percent and reach US$6.6 billion in total expenditures in
2020. The financial industry is expected to influence
technology in the Philippines better and more secure
customer service. The production of Business Process
Management employed 1.3 million people and generated
US$25 million in 2016. The BPM industry has led to the
growth of hardware, software, services, and cloud
opportunities. The SMEs in the Philippines prefer cloud
services as a lower-cost option to more expensive software
licenses. The cloud infrastructure is considered useful in the
Philippines as it gives IT solutions as affordable and
available. The sectors with higher IT spending are retail,
consumer goods, and health. IT spending in healthcare will
164 Surabhi Singh

reach $60 million in 2019 in the Philippines. The largest
investor in IT is Healthcare organizations like hospitals. The
divisions are healthcare IT (88%) and hardware (79%).
The focus of ASEAN countries is upgrading IT
infrastructure. However, IDC Philippines commented that
there is a clear distinction between the private and public
sectors in healthcare I.T. Privately-owned hospitals are
aggressive in IT adoption to drive medical tourism growth.
The hospitals in public areas are still focused on developing
essential healthcare services by making them accessible.
The IT cell in DST Office launched the Free Wi-Fi Internet
Access with a budget of US$66 million. Wireless
Technology, TV white spaces are used for last-mile
connectivity in areas that lack broadband infrastructure. The
only nonprofit and funded internet exchange point used is
PHOpenIX. Filipinos are productive users of social media.
Active social media users are 48 Million in the Philippines.
Facebook has 42.1 million, 13 million on Twitter, and 3.5
million on LinkedIn. The Philippine telecommunications
industry remains very robust and is a significant contributor to
the country's economy. The consistent capital expenditure
for the upgrade of communications equipment contributes to
the growth of the ICT industry. The growth projections for the
telecommunications industry conclude that subscribers were
116.8 million in 2015, and its penetration rate is 116%. BMI
forecasts a 119.8 percent penetration by 2020 and there is a
high growth potential for broadband with wireless
subscriber's accounts to 80. Smartphone ownership is
growing as it becomes more affordable, along with the
growing high-speed Internet access. Smartphone
penetration is estimated to be about 40 percent. BMI
forecasts 16.5 million broadband subscriptions by 2020.
The Philippines' challenge is to upgrade its telecom
infrastructure to keep up with the growing demand for
broadband. The average internet speed in the Philippines is
3.2 MBPS, and it is the second slowest in the Asia Pacific.
Fixed-line penetration is around four percent, with an
estimated four million subscribers. Globe Telecom and
PLDT are the two major telecommunication carriers in the
country. PLDT has a 70% share in the mobile market, and
Globe Telecom has 30 percent. The current Philippine
cellular infrastructure is the Global System for Mobile
Communications (GSM). The mobile service, namely 3G,
was launched in 2006. 4G was made available in 2010. More
recently, SMART and Globe launched long-term evolution
(LTE) networks in 2012.
Countries Responses
Indonesia Online marketplaces are used to find goods, accommodation rentals, financial loans, crowd sourcing, and car-sharing. Few companies are early adopters.
Philippines Growth of hardware, software, services, and cloud opportunities. The SMEs in the Philippines prefer cloud services as lower-cost options. The cloud infrastructure is considered useful as it gives IT solutions as affordable and available.
Thailand IT projects in Thailand steer towards agricultural technology and food technology.
Singapore Effects of technology on wage growth are more pronounced in the services sector.
Malaysia Country proves to be ready for Industry 4.0. Internet penetration has grown higher, and the new generation shows many dependencies on the Internet.
Japan AI, robotics, 5G are the latest technology innovations in Japan.
Israel Technology and its infrastructure are secure for the development of products and processes. The cost of acquisition of technology is low.
Finland Leading country in social innovations. The businesses of Finland are pioneers in using new technologies.
USA IoT ranges from household thermostats, and security systems to Smart City transportation systems are also coming on the market.
China Internet creates benefits to society by connecting individuals with learning tools and extensive information The Internet . enables the Government also to deliver public services efficiently. Internet technology has significant differences in different regions for employment in China.
Canada Business technologies like cloud and IoT are more widely available with security networks, applications, and endpoint devices
Russia Growth in IT is occurring in Technology companies, and mobile and cloud technologies are also expanding.
South Korea South Korea becomes the leader in the world in patent activity and ICT.
India Information technology and business process outsourcing sector of India register a growth
Sweden Technology-focus areas are eMobility, smart cities, clean technologies, space, and aeronautics.
England Contribution of innovation, research, and technology sector is fairly good the UK economy
Vietnam One of the areas where Vietnam lacks in addressing increasingly automated production processes is workers' skill levels.
Table 5. Selected esponses nalysisr a
165Technology Impact and its Infrastructure in Different Territories

Thailand: Thailand has 82.4% internet penetration and
played a vital role as a leading food exporter. The
inventiveness, food manufacturing, investment in
agriculture, food, and technology has made Thailand the
kitchen of the world. Thailand has shown a transformation in
its food industry in the last 60 years. The technology transfer
and government support in improving credit access for
farmers. The execution of international standards in
production and packaging ensures the highest safety and
quality across the food chain. The IT projects in Thailand
steer towards agricultural technology and food technology.
The companies in Thailand's belief in improving agriculture
are yield and quality. The efforts will strengthen the entire
industry by cultivating collaboration between farmers, the
public sector, and private companies. The Government aims
to incubate big projects run by AgriTech, Thai institutions
investing in the future of FoodTech. The country progresses
with its Thailand 4.0 plan, the economic model designed to
transform the economy through digital technology and
innovation investments. The Thai Government continues
with initiatives to push technology, innovation, research, and
development.
Singapore: Singapore has 74.2% penetration of the
Internet. Technological advances have been vital in raising
sustainable income levels over the longer-term. Still, their
potential adverse distributional effects on wage growth and
employment prospects can cause concern. In Singapore's
case, this study shows that more excellent information and
communication technology (ICT) adoption led to real
productivity growth and higher wages and effects of
technology on wage growth are more pronounced in the
services sector.
Meanwhile, higher-skilled workers benefitted more from
higher ICT utilization, but it is less evident for low-skilled
workers. At Foodpanda, one of Singapore's online food
delivery services, machine learning algorithms does the
humanly impossible. Technology is an area where Singapore
has an advantage, as it is a compact city with high-quality
infrastructure and tech-savvy people who support initiatives
that bring improvements www.internetworldstats.com/
asia.htm). The Government has set up a Smart Nation
Programme Office. Digital Government Blueprint (DGB) is a
statement of the Government's ambition to harness data and
new technologies and drive broader efforts to build a digital
economy and digital society to support Smart Nation.
Malaysia: Malaysia has 78% internet penetration.
Technology shows innovations, and the old Economy is
taken over by a new environment where traditional jobs get
r e p l a c e d b y t e c h n o l o g y - o r i e n t e d j o b s . T h e
commercialization of 3D printing and advances in
biotechnology lead to manual tasks becoming obsolete.
Malaysia is out of the Malthusian trap as new technology has
forced them to develop new things and new skills. Take the
case of the US's agricultural sector earlier; the Agriculture
used to take up 90 percent of employees at the start of the
19th Century. The agriculture now uses only two percent of
the workforce, and the political economy is also not
hampered The game-changer I phone, which was launched .
by Apple, has changed the economy drastically. Apple
provided a collaborative platform for developers so that they
create applications for the iPhone. Geek's Economy is the
result of such growth and development. Uberatisation and
Grabisation change the transportation, logistic, and services
industries. Companies like Alibaba and Instagram are
convenient platforms for the sharing economy. The terms
blockchain and bitcoin are bringing the transitions in the
Malaysian Economy.
Technology has set forth challenges for the Malaysian
Government. The trends are being made using technology,
and the states are making significant attempts to adapt to the
Greek Economy. The country proves to be ready for Industry
4.0. Internet penetration has grown higher, and the new
generation shows many dependencies on the Internet. The
usage of WhatsApp, Facebook, and Instagram are more
elevated in Malaysia. The recently launched Digital Free
Trade Zone is the shared platform that can be exploited to
promote new jobs and services.
Vietnam: Vietnam has 68% internet penetration. The country
began its current growth and industrialization period in 1986
when Hanoi started economic reforms called "Doi Moi." The
state, Vietnam, tripled its per capita GDP between 2000 and
2010. The shift in workers from agriculture to industry and
services is visible. By 2016, Vietnam had witnessed a GDP
growth of 6.2%. Rising wages in China, coupled with
Chinese workers' higher demands for better working
conditions, helped Vietnam in a more competitive offshore
manufacturing hub. Recent data bear this out: 2016 saw FDI
inflows to Vietnam hit a record high. Vietnam absorbs lower-
skilled manufacturing jobs as China moves up the value
chain, continuing its development and high economic growth
rates. The expectation follows a growth model that may soon
be outdated with the rise of automation. It indicates that if
Vietnam continues to follow its current growth model and
prioritizes absorbing low-skill, low-wage manufacturing, then
it may endanger its long-term development for short-term
gain. One of the areas where Vietnam lacks in addressing
increasingly automated production processes is workers'
skill levels.
Japan: Japan has 93.3 % penetration in internet usage. The
shift in the technology paradigm has shown new sets of
166 Surabhi Singh

innovations. The development of changes leads to the
initiation, diffusion of new technologies. Japan is the country
meant for its economic success and technological
leadership. The growth in Japan is attributed to technology.
Japan is a competent infrastructure in Robotics, AI, 5G, and
digital marketing. The considerable success owes to
consumer electronics, robotics, and automobiles. Japan is
among the highest and developed nations (Karan 2010).
Technology has a central place, which is called the Internet of
Things. The new program of the Government was in Japan
with Society 5.0 (CEBIT 2017). It is meant to move Japan
ahead of its digital development counterparts, namely
Germany, the US, South Korea, and China (Lewis, 2017).
Israel: Israel has less population in the Middle East, but
internet penetration is higher than in other Middle East
countries. The gap is as created between the adult and
school environment as per Israel's educational system. The
maintenance of an advanced technological level needs
scientific know-how and familiarity. Technology and its
infrastructure are secure for the development of products and
processes. The costs are low in the acquisition of software
and hardware required for production. The force of labor
needed is small and needs to educate the workers.
Finland: Finland had 94.3% internet penetration in 2018.
The country focuses on promoting innovation via channels
and strategies such as a national innovation strategy,
technology programs, and science and technology parks.
Finland has higher R&D spending per capita. It is a leading
country in social innovations. The businesses of Finland are
pioneers in using new technologies. The engineers and
scientists of this country have won international recognition in
diverse fields and products. These include numerous
products of forestry, engineering, and information and
communications technology.
The USA: The extensive usages of digital platforms are
present in small as well as big enterprises in the USA. 11% of
Americans still do not use the Internet as per the Pew
Research report in 2018. The ongoing government and
social service programs encourage no adopters in
underserved areas. There are important reasons for the non-
adoption of the Internet by Americans. One of the reasons is
financial condition. IoT ranges from household thermostats,
and security systems to Smart City transportation systems
are also coming on the market.
China: Countries like Europe and the US have always led TO
scientific development. China has also emerged as a new
science and technology powerhouse. The impact on GDP
and productivity has been made possible because of the
Internet, which gives convenience and generates consumer
surplus. The reduction in price takes place owing to
enhanced transparency and competition and may increase
the quality of goods, and the savings are available for
additional consumption. The Internet creates benefits to
society by connecting individuals with learning tools and
extensive information The Internet enables the Government .
also to deliver public services efficiently. Internet technology
has significant differences in different regions for
employment in China. The imbalance of economic
development and internet technology on jobs in various
areas has different effects. With a high level of economic
Fig. 2. Technology infrastructure word cloud
167Technology Impact and its Infrastructure in Different Territories

growth in eastern China, Internet technology is significantly
higher than that in the other regions. Therefore, the
compensation of Internet technology on employment is more
evident than that in other areas (Li 2017).
Russia: Russia has 76.1% internet penetration. The political
and economic challenges are there in Russia, but it has
emerged as a technology-enabled economy. The growth in IT
is occurring in Technology companies, and mobile and cloud
technologies are also expanding. The development of digital
and telemedicine gives Russians easy access to medical
consultations with highly qualified and foreign specialists.
The Artificial intelligence-driven clinical decision support
systems may bring modern medicine to Russians and protect
the patients.
South Korea: South Korea has around 92.6 internet
penetration. South Korea sectors show higher labor
productivity than North Korea, ranging from 5.1 times in
construction to 33.4 times in manufacturing. Trade-in South
Korea leads 150 times more than that in North Korea in 2015
(Warwick 2017). South Korea is prominent in an economic
heavyweight, with substantial applied resources to research
and development. South Korea has become the leader in the
world in patent activity and ICT. The country has the highest
broadband penetration globally at 97 percent and has a
speed of 50 megabits per second. South Korea has World
Cyber Games, the world's largest video game competition,
and has three television channels dedicated to eSports
featuring professional gamers.
Canada: Canada has 89.9% of internet penetration. The
cloud and IoT will drive agility and facilitates faster decisions
in Canada. The organizations follow the bring-your-own-
device (BYOD) trend. The business technologies like cloud
and IoT are more widely available with security networks,
applications, and endpoint devices. The resultant data gets
generated and stored.
England: The UK has 94.7% internet penetration. The
contribution of innovation, research, and technology sector to
the UK economy is noteworthy as per the Oxford Research.
The supply chain, catalytic impacts, and induced employee
spending impacts are essential. Adopting technology-
supported and enhanced human contribution allowed people
to extend their roles instead of entirely removing them from
the process. The execution of an automated dispensing
system in a single UK hospital positively impacted in-house
pharmacists, reducing the amount of time they had to stay in
the dispensary and allowing them to become more active
inpatient wards.
Sweden: Sweden has 97% penetration of internet usage.
Internet usage has shown growth in Sweden (Statista.com).
The country is considered technology-enabled owing to
global brands like IKEA, Spotify, Skype, Ericsson, H&M,
Electrolux, and Volvo. The Joint Innovation Partnership
between Sweden and India puts mobility and smart cities as
two main collaboration areas. The technology-focus areas
are eMobility, smart cities, clean technologies, space, and
aeronautics.
India: India is one of the leaders in offshore destinations for
delivering engineering research and development services
and has around 40% penetration on the Internet. The market
in India is expected to grow to US$ 42 billion by 2020. The
information technology and business process outsourcing
sector of India are expected to register a growth of 11 percent
and revenue of US$ 75 billion-US$ 77 billion as per
NASSCOM. The technology sector in India has a significant
impact on the Indian Economy.
Technological progress is an essential key to finding
lasting solutions to sustainable development, UN SDG
agenda 2030. The study found that promoting sustainable
industries in technology-enabled countries is a crucial way to
facilitate sustainable development. The main trends of
technology facilitate the industry innovations and
infrastructure in the countries reviewed. While 5G
technologies are still in its early stages of evolution, it will lead
to ultra-fast speeds. These have lower latency than 4G and
provide the network infrastructure required for the next line of
products and services over the next decade, which needs
connections to work everywhere all the time. There are full
applications like M2M, such as smart devices in houses, and
healthcare monitoring; however, the possibilities are almost
endless as technology and networks advance. The impact of
technological change on telecommunication towers, the safe
operation of autonomous cars, and a connection to a network
with a traffic management system. This type of response time
is evident in the specification for 5G networks. 5G is expected
to support the demand increase for wireless data through
2030-35. Since the 1980s, approximately once a decade, the
world sees a "generational" evolution in the wireless sector, a
trend that will likely continue as technology continues to
advance and demand wireless globally continues to grow.
Countries like Vietnam and Malaysia are working to
improve digital literacy. The broad expansion of Artificial
Intelligence is present in forward-looking organizations in the
developed and developing economies. A.I./machine learning
and blockchain are the main features of technology
development in the growing countries. The need for
information about the data and machine learning tools is
present to address that problem. The emerging technologies
may prove to be an asset for countries in the automation of
their work and increase productivity. The increase in usage of
digital technology and industry 4.0 has shown
168 Surabhi Singh

transformations in the developing and developed economies.
The efficient processes developed may foster industrial
growth and change the competitiveness of the world. The
insights will be helpful for the researchers in the detailed
study and the practitioners in their businesses. The study was
limited to 17 countries only owing to paucity of time and
budget. Further studies can be carried out to know the extent
of technology expansion in other countries of the world.
REFERENCESAsia Statistics 2018. https://www.internetworldstats.com/asia.htm.
Accessed September 15, 2018.
Anderson B, Kearnes, MMcFarlane C and Swanton D 2012. On assemblages and geography. Dialogues in Human Geography2(2): 171-189.
CEBIT 2017. Society 5.0: Japan's digitization. online: https://www. cebit.de/en/news-trends/news/society-5-0-japans-digitization-779. Accessed on November 15, 2018.
Chung SK, Rainer RK and Lewis BR 2003. The impact of information technology infrastructure flexibility on strategic alignment and application implementations. Communications of the Association for Information Technology 11 (11).
Countries with the highest technology in the world 2018. https://www.41studio.com/blog/2018/15-countries-with-higest-technology-in-the-world/. Accessed November 15, 2018
Digital Role Economic Growth 2017. https://www2.deloitte.com/ insights/us/en/economy/voice-of-asia/may-2017/digital-role-economic-growth.html. Accessed November 20, 2018.
Digital Technology Will Move Russia Forward 2018. https://themoscowtimes.com/articles/going-digital-60395. Accessed September 15, 2018.
Digital Government Blueprint. https://www.tech.gov.sg/digital-government-blueprint/. Accessed September 20, 2018.
Europe Statistics 2018. https://www.internetworldstats. com/europe.htm. Accessed September 25, 2018.
Embracing Industry 4.0 2018. Retrieved from https://www.bcg. com/en-in/capabilities/operations/embracing-industry-4.0-rediscovering-growth.aspx.
Elden S 2013. . University of Chicago Press.The birth of territory
Examining the impact technology of small businesses. https://www.uschamber.com/report/examining-the-impact-technology-small-business. Accessed November 15, 2018.
Gagliardi Mario 2017. Analyzing the digital transformations, territories, frames and uses. 20(1): S4197-The Design JournalS4212, DOI: 10.1080/14606925.2017.1352919
Internet World Statistics 2018. https://www.internetworldstats. com/stats.htm. Accessed October 15, 2019.
Internet Live Statistics 2018. http://www.internetlivestats.com/ internet-users-by-country.Accessed October 20, 2018.
Impact of innovation research and technology 2013. https://www.oxfordeconomics.com/recent-releases/the-impact-of-the-innovation-research-and-technology-sector-on-the-uk-economy. mber 15, 201Accessed Septe 9.
Jabbouri NI, Siron R, Zahari I and Khalid M 2016. Impact of information technology infrastructure on innovation performance: an empirical study on private universities in Iraq. Procedia Economics and Finance : 861-869.39
North America Statistics 2018. https://www.internetworldstats. com/stats14.htm. Accessed October 15, 2018.
Karan PP 2010. Japan in the 21st Century: Environment, Economy, and Society. University Press of Kentucky. https://www-dawsoneracom.ludwig.lub.lu.se/readonline/9780813127637.Accessed September 15, 2019.
Levi D, Slem C and Young A 1992. The human impact of technological change: A study of the attitudes and beliefs of employees of manufacturing companies. International Journal of Computer Integrated Manufacturing 5 : 132-142.
Lewis L 2017. Financial Times. Internet of things tops Shinzo Abe's list of priorities. https://www.ft.com/content/7e574d8e-96c9-11e7-8c5c-c8d8fa6961bb. Accessed September 15, 2018.
Lee KR 2002. Impacts of Information Technology on Society in the new Century. (6): 46-55.Business and Management 5
Li Liangshan 2017. Empirical Analysis of the Impact of Internet Technology on Employment in China. Revista de la Facultad de Ingeniería U.C.V 32. : 353-357.
McKibbin Warwick J, Lee Jong Wha, Liu Weifeng and Song Cheol Jong 2017. Modelling the Economic Impacts of Korean Unification. Accessed September 25, 2019
Middle East Statistics 2018. https://www.internetworldstats. com/middleeast.htm. Accessed September 15, 20189.
Neil J, Smelser, Paul B, Baltes 2001. International Encyclopedia of the Social & Behavioral Sciences, Pergamon. p. 15521-15522.
Stever HG and Muroyama H 1988. 'Overview' National Research Council. Globalization of Technology: International Perspectives. Washington, DC: The National Academies Press. doi: 10.17226/1101.
Obedait A A, Youssef M, and Ljepava N 2019. Citizen-Centric Approach in Delivery of Smart Government Services, in Smart Technologies and Innovation for a Sustainable Future, Springer, p. 73-80.
Penetrated internet user penetration rate in Sweden 2018. https://www.statista.com/statistics/567607/predicted-internet-user-penetration-rate-in-sweden/. Accessed September 15, 2019.
Report. 2019. https://www.nielsen.com/in/en.html. Accessed September 15, 2019
Reports. 2019. https://www.worldbank.org/. Accessed September 15, 2019
Report. 2019. https://www.idc.com/. Accessed November 15, 2019
Report.http://www.finland.lv/public/default.aspx?nodeid=44905&contentlan=2&culture=en-US#innovations. Accessed September 15, 2019.
Report.https://www.mckinsey.com/~/media/mckinsey/business%20functions/mckinsey%20digital/our%20insights/digital%20india%20technology%20to%20transform%20a%20connected%20nation/digital-india-technology-to-transform-a-connected-nation-full-report.ashx. Accessed in January 2020.
Report 2018. http://www.doingbusiness.org/content/dam/doing Business/media/Annual-Reports/English/DB2018-Full-Report.pdf. Accessed October 15, 2018.
Saaksjarvi M 2000. The roles of corporate IT infrastructure and their impacts on IS effectiveness. Proceedings of the 8th European Conference on Information Systems Vienna, Austria 1 , 2000. : 1-10.
Some Americans don't use the Internet; who are they. http://www.pewresearch.org/fact-tank/2018/03/05/some-americans-dont-use-the-internet-who-are-they/. Accessed September 15, 2018.
Southeast Asia Digital Social Mobile 2018. https://aseanup.com/ southeast-asia-digital-social-mobile/. Accessed October 15, 2018.
SA EO 2018 . h t t ps : / / www.oecd . o rg / dev /S AEO2018_ Preliminary_version.pdf. Accessed November 15, 2019
Technology Trends 2014. https://techvibes.com/2014/12/26/ technology-trends-2014-12-26. Accessed October 15, 2019.
Sweden and India in technology collaboration (2018) https://www.computerweekly.com/news/252442194/Sweden-and-India-in-technology-collaboration. Accessed September 15, 2019.
Southeast Asia is keeping pace with AI 2016.https://www.
169Technology Impact and its Infrastructure in Different Territories

computerweekly.com/feature/How-Southeast-Asia-is-keeping-pace-with-AI. Accessed September 20, 2019.
Sweden is Tech Superstar from North 2016. https://techcrunch. com/2016/01/26/sweden-is-a-tech-superstar-from-the-north/. Accessed September 20, 2019.
Sustainable Development Goals 2018. https://sustainable development.un.org/?menu=1300. Accessed on November 15, 2019.
Technology D isrupt ions and Geek Economy 2017. https://www.nst.com.my/opinion/columnists/2017/09/284505/technology-disruptions-and-geek-economy. Accessed September 15, 2018.
Top 20 2018. https://www.internetworldstats.com/top20.htm. Accessed September 15, 2018.
Urbanova M 2018. Japan's Legacy of Technology in the Digital Era a Mixed Methods Analysis of the Competitive Advantage of the IoT sector in Japan.
What's next in Technology in South East Asia 2017. https://seasia.co/2017/09/10/what-s-next-in-technology-in-southeast-asia. Accessed September 15, 2018.
Why South Korea will be the next global hub for tech startups 2014. https://www.forbes.com/sites/alanmcglade/2014/02/06/why-south-korea-wi l l -be - the -nex t -g loba l -hub- for - tech-startups/#5de765e92670. Accessed September 25, 2018.
Received February, 2021; Accepted , 202127 15 June
170 Surabhi Singh

Pollution Forecast of United States using Holt-winter Exponential Method
Manuscript Number: S-695NAAS Rating: 5.79
Abstract: The United States is the world's most developed country and one of the top ten most air polluted countries in the world. Though the population is not very dense as in India or China, people face immense health problems. The US government is taking a lot of initiatives than any other government globally. However, it still faces issues. This paper mainly focuses on developing a forecasting model of the top four pollutants like SO , NO , CO, O3 that will help the country take necessary actions for the near future. This paper involves the secondary data of 2 2
the daily pollution collected and merged for all states from 2007 to 2017. The forecast will throw the better output at the pollutants for the next four years, until 2021. The findings revealed that despite the increased GDP, the country had controlled the pollution level. NO has decreased 2
to a better level. O and CO are also decreasing but has slight fluctuations. It will take some time to stabilize. SO2 had an increased level till 3 2
2017 and has started reducing afterwards.
Keywords: Time series, Forecast, United States, Pollution
Joe Justin K., Manohar Kapse, Elangovan N. and Vinod SharmaSchool of Business and Management, Christ University, Bengaluru-560 029, India
E-mail: [email protected]
Indian Journal of Ecology (2021) 48 Special Issue (16): 171-177
Pollution is one of the biggest threats to any country. Air
pollution is responsible for more than 65% of human deaths
(Mehrad 2020). Emerging techniques like big data, Analytics
can be used to managing pollution and helping people in the
country lead a healthy life. Some of the developed countries
like China, Russia, started using this technique. The United
States is one of the most air-polluted countries in the world
after China. There were 41.9 million deaths from 1999 to
2015 in the USA, with 18.4 million deaths alone due to
cardiorespiratory diseases (Bennett et al 2019). There may
be strong evidence of an association with air pollution. Some
articles also say that the life expectancy of the US people is
decreasing every year (Wamsley 2021).
Air pollution is hurtful to the environmental framework
and the ordinary states of human presence and
advancement when a few substances in the environment
surpass a certain focus (Seinfeld and Pandis 2016). Air
pollutants upset a plant's water balance, causing stomatal
closure and increasing the number of pollutants entering a
leaf's mesophyll (Robinson et al 1998). Measuring air
pollution has been of fundamental significance for taking
viable pollution control measures. The exact anticipating of
air pollution has become a significant assignment among
researchers.
There was a strong association between chronic
bronchitis of women and firewood compared to other
biomass fuel types. Cooking indoors using biomass fuels,
age of women, and their education level were the main risk
factors for chronic bronchitis prevalent in 10.7% of the
women involved in the study (Musafiri et al 2018). This article
aims to study the association between pregnant women
being exposed to air pollution and low birth weight in children
up to 6 years of age. The levels of SO has high association 2
with the risk of low birth weight and birth weight varied with
maternal age, education level, pregnancy order, pregnancy
season and the infant's gender (Dorj et al 2014).
Civerolo et al (2007) indicated that the ozone
concentration in the summertime in the future decades 2020,
2050 and 2080 will increase by 2.7, 4.2 and 5.0 ppb,
respectively, compared to the summers of 1990. The regional
climate changes were the most important contributor to
simulated concentration changes, followed by increased
anthropogenic emissions and increased boundary
conditions. Recent studies about nitrogen dioxide pollution
and particulate pollution raise ethical issues about protecting
human and animal health. It is a worldwide problem, and in
many cases, diesel engines are to be blamed. There is a
need to choose the least harmful alternative, i.e., renewable
energy powered automobiles, to reduce the frequency and
intensity of natural disasters and healthy life for humans
(Attfield 2019).
Understanding the trends in air pollution helps in making
policies to manage pollution. Also, a predictive model can
help to forecast the future pollution level and can provide an
alert. The study's objective is to analyze air pollution data for
various locations in the United States of America and identify

the spike patterns in levels of NO2, CO, SO2, O3. Further,
explore the possibility of developing a predictive model for
the key pollutants.
MATERIAL AND METHODS
For the present study, time series analysis is used. The
data collected consists of the pollution details of the most
important 32 states of the United States of America. US is
being considered for the study because it has the highest
GDP in the world. The data is collected from the United
States Environmental Protection Agency's official website.
Daily data of the air constituents for all the USA cities for the
past 30 years was available from the website. The present
study concentrates on the four major pollutants, namely,
nitrogen dioxide, sulphur dioxide, carbon monoxide, and
ozone that affect humans and the environment to a larger
extent. Since the data is large, the pollution detail of every
month's starting, mid and end were only taken for the
analysis, i.e. 1 , 15 and 30 were taken.st th th
According to a 2009 report of EPA (Environmental
Protection Agency, US), around 60 percent of Americans live
in areas where air pollution has reached unhealthy levels
(Fig. 1). The pollution in the United States has decreased in
the last decade, with pollutants such as nitrogen dioxide
decreasing and this change is due to better regulations,
economic shifts, and technological innovations (Nierenberg
2009).
Time series is a technique used for forecasting and used
for estimating the future aspects of the undergoing current
events. This forecasting method helps the user translate the
past data to estimate or forecast future events (Armstrong
2001). The univariate time series analysis was used in the
present study since there is no dependent and independent
variable in this analysis. Holt winter exponential smoothing is
Source: Secondary data
Fig. 1. The trend of pollution of US (2007 - 2017)
used for the prediction and understanding of the level of
pollutants. And to find the trend, seasonality and cycling
behaviour in the data. Since the data has zero values,
additive modelling can only be done. The top four pollutants
of NO , CO, SO , and O were used. Day by day, the pollution 2 2 3
intensity has been increased, leading to a serious impact on
the environment.
RESULTS AND DISCUSSION
Time-series analysis of nitrogen dioxide (NO ):2 Nitrogen
dioxide is a nasty smelling gas naturally formed due to
lightning and produced by plants, soil, and water. Some of the
other major contributors are the burning of fossil fuels such as
coal, oil, and gas. The emission of automobiles contributes
80%. The main industries that account for this pollution are
petrol and refining, electricity generation and coal-fired
power stations. The level of NO is found to decrease slowly 2
between 2007 and 2017 (Fig. 2). It may be due to the
reduction of the smoke by the vehicles. It is considered that
about 20% of total pollution is due to nitrogen dioxide.
There is no seasonality in pollution, and the trend
indicates that the pollutant intensity has been decreased over
some time (Fig. 3). The smoothing parameters are calculated
using the holt-winter exponential smoothening methods in R
under the time series package. It is estimated that Alpha =
0.3877093, Beta = 0.001351311, and Gamma = 0.06358947.
These are three important parameters in exponential
smoothing, where alpha indicates the smoothing constant for
the level of series. The value may range from 0 to 1. Usually,
the value between 0.1 to 0.4 is used for the analysis. The
value is 0.38, which indicates that the model is predicted
correctly. As the value gets nearer to 1, more and more
weights are given for the recent observations. Beta
smoothing constant refers to the trend factor. The limit of beta
is from 0 to 1. The value of beta in this model is 0.00135,
indicating no trend in this model. Being logical, pollution
doesn't have any trend to be followed. Gamma smoothing
constant refers to seasonal factors, and the limit is from 0 to 1.
Since gamma's value in this model is 0.0635, it indicates no
seasonality in this model. Logically pollution has no
seasonality since pollution occurs every day in a year.
NO has been forecasted for the next four years with the 2
lowest mean absolute error of about 5.6304, which shows
that the model is good. The output can be interpreted as well
have a point forecast. The results indicated that on this basis
can predict that in June 2020, the point forecast is 4.185 with
a 95% prediction level having the pollution level from 36.74 to
43.032 parts per million. The result also indicates a steady
increase in the pollution range initially, but as time moves on,
the fluctuation decreases, leading to the narrow end. This
172 Joe Justin K., Manohar Kapse, Elangovan N. and Vinod Sharma

Fig. 2. Time series of NO2
Fig. 3. Decomposition of the NO2
reveals that after a certain point in time, the pollution may
become stabilized, after which there will be no increase in
pollution due to nitrogen dioxide.
Time-series analysis of Ozone (O ): 3 The Ozone has been
present in the atmosphere at a constant rate of 0.15 to 0.4
parts per million. There is a decrease in ozone pollution
during the year 2013 to 2014 (Fig. 4). The regulation changes
during that period play a major role in this reduction, after
which there is also an increase in ozone ground level.
Ground-level ozone depletion is very harmful to the
environment, which causes immense diseases to humans
and wildlife and crop losses (WMO 2018).
Ozone pollution does not have any seasonality (Fig. 5).
The time series analysis implies a trend of immense
decrease in Ozone pollution during 2013- 2014. Unlike other
pollutants like nitrogen dioxide, sulphur dioxide, and carbon
monoxide, Ozone pollution is very less, but its impact on
human health is very high.
Ritchie and Roser (2020) concluded that over a few
decades, automakers in the United States may cut 90% of
the Ozone produced from vehicles and around 31% of the
ozone concentration has been reduced from 1980 to 2014.
Still, a large population is at risk due to this dangerous
exposure to ozone concentration. From the holt winter
exponential smoothing analysis, the smoothing parameters
are found as alpha= 0.5389916, beta = 0.001088859, and
gamma = 0.04092881. The value of alpha (0.538) indicates
that the model is predicted correctly. The value of beta
(0.00108) indicates that there is no trend in this model. The
gamma smoothing constant (0.040) indicates that there is no
seasonality in this model. Ozone has been forecasted for the
next four years with the lowest mean absolute error of about
0.0794, which shows that the model is good. The output can
be interpreted as they will have a point forecast and the
results of which indicated are with the confidence level of 80
and 95% with the lower and higher level. For example, if we
173Pollution Forecast of United States using Holt-winter Exponential Method

Fig. 4. Time series of O3
Fig. 5. Decomposition of the O3
for June 2021, the point forecast is 0.0495, with a 95%
prediction level having the pollution level from 0.106 to 0.135
parts per million.
Time-series analysis of Sulphur Dioxide (SO ): 2 Sulfur
dioxide (SO ), a colourless, bad-smelling, toxic gas, is part of 2
a larger group of chemicals called sulfur oxides. These
gases, especially SO , are emitted by burning fossil fuels, 2
coal, oil, and diesel or other materials containing sulfur.
Sources include power plants, metals processing, and
smelting facilities, and vehicles. Diesel vehicles and
equipment have long been a major source of sulfur dioxide.
Like nitrogen dioxide, sulfur dioxide can create secondary
pollutants once released into the air. Sulfur dioxide is very low
initially and eventually increases with respect to time (Fig. 6).
The United States government has taken the necessary
steps to reduce sulphur dioxide emissions after 2016 and
2017. The increase is due to an increase in the industrial
process like chemical preparation, refining and pulp-making,
and solvent extraction. After which government imposed
regulations to reduce the sulphur dioxide in 2017. The trend
of sulphur dioxide is minimal at the beginning of 2007 but
keeps on fluctuating at a higher rate after 2013 (Fig. 6). This
increase in sulphur dioxide is due to industrial processes and
domestic sources.
One of the important reasons for the increase from 2007
to 2017 is the volcanic eruption. Since it is a natural calamity,
nothing can be done to prevent these volcanic eruptions. This
activity is mainly due to the change in global climatic
conditions. Some of these pollutants' health issues are
asthma and short time exposure, leading to chest tightness
and cough and wheezing. Continuous exposure leads to lung
disease and cardiovascular disease in human beings. It also
has a higher environmental impact. It combines with water to
form sulphuric acid, which is very concentrated and falls in-
ground as acid rains in lakes, and other water streams,
making it undesirable to live, killing all the water living
organisms.
After using holt-winter exponential smoothing, the
174 Joe Justin K., Manohar Kapse, Elangovan N. and Vinod Sharma

Fig. 7. Decomposition of the SO2
Fig. 6. Time series of SO2
smoothing parameters obtained are alpha = 0.2814417, beta
= 0.00120487, and gamma = 0.01438443. The alfa value
indicates that the model is predicted correctly. The beta in
this model indicates that there is no trend. Being logical,
pollution doesn't have any trend to be followed. Since
gamma's value in this model is 0.0140, it is noted that there is
no seasonality in this model. Logically pollution has no
seasonality since pollution occurs every day in a year.
Sulphur dioxide has been forecasted for the next four
years with the lowest mean absolute error of about 1.7481,
which shows that the model is good. The output can be
interpreted as they will have a point forecast and the results of
which indicated are with the confidence level of 80 and 95%
with the lower and higher level. For example, if we for June
2020, the point forecast is 1.7090 with a 95% prediction level
having the pollution level from 9.356 to 13.405 parts per
million.
Time-series analysis of carbon monoxide (CO): CO is
carbon monoxide which is a very harmful pollutant that
creates health issues for human beings. CO rate has been
decreasing over the period, which is a good sign for the
country (Fig. 8). Carbon monoxide is released in the air when
something is burnt, like plastics, gas etc., in a very large
quantity. It has been noted that the increase in Carbon
monoxide during the period 2008 to 2011 has resulted in
higher death rates.
There is no seasonality in pollution due to carbon
monoxide (Fig. 9). The trend indicates that carbon monoxide
is very large at the initial state, which is very harmful to human
health and environmental issues. This gas is mainly
produced due to vehicles' domestic and personal uses and
burning of unvented kerosene, gas space heaters, leaking
chimneys, and furnaces. CO is one of the poisonous gas
which, when inhaled at a higher concentration, leads to
health problems in the heart and brain. One of the critical
issues of these emissions is that they will lower the oxygen
level to be inhaled, which creates a severe health problem
and causes several types of heart disease. Around 1000
175Pollution Forecast of United States using Holt-winter Exponential Method

Fig. 8. Time series of CO
Fig. 9. Decomposition of the CO
deaths are recorded annually by this carbon monoxide
poisoning in the United States.
After applying the holt-winter smoothening method, the
smoothing parameters are alpha = 0.4346031; beta =
0.001300278 and gamma = 0.04592409. The value of alpha
here is 0.4346, which indicates that the model is predicted
correctly. The value of beta in this model is 0.0013, indicating
no trend in this model. Since the gamma value in this model
noted that there is no seasonality in this model. Logically
pollution has no trend and seasonality since pollution occurs
every day in a year.
Carbon monoxide has been forecasted for the next four
years with the lowest mean absolute error of about 1.8165,
which shows that the model is good. The output can be
interpreted as they will have a point forecast and the results of
which indicated are with the confidence level of 80 and 95%
with the lower and higher level. For example, if for June 2020,
the point forecast is 0.367 with a 95% prediction level having
the pollution level from 1.48 to 2.06 parts per million.
CONCLUSIONS
The United States has proved that despite being a
developed nation, they increased the GDPande decreased
the pollution level. NO is decreasing at a good rate due to the 2
usage of more electric vehicles for domestic purposes.
Ozone and CO are also decreasing, whereas there may be 2
slight fluctuations in the rate of reductions, but they will attain
a stable rate over time. SO is the only gas that seems to be 2
increasing over time and reduced at the end of 2017, a good
sign.
Vehicle density in the United States plays a major role in
this pollution. Pollutants like NO , CO are very harmful to the 2
human and environment. Therefore, people must
concentrate on cleaner commute like carpool usage, public
transportation, cycle or walk for the nearby work, which will
also help lead a healthier life. Vehicles must be properly
serviced and tuned. Repair vehicle may result in white and
black smoke, which emits lots of chemical compounds that
are very harmful to the environment. Gasoline covers must
176 Joe Justin K., Manohar Kapse, Elangovan N. and Vinod Sharma

be tightened well enough after refueling, decreasing gasoline
or fuel evaporation in the air contaminating them. Domestic
usage is the next major source of pollution. Only dry and
seasoned wood must be burnt instead of greenwood, which
would produce a large amount of smoke contaminating the
atmospheric oxygen. Usage of all pollutants to certain
standards determined by the Government of the United
States must be followed.
REFERENCESArmstrong JS (Ed.) 2001. Principles of forecasting: A handbook for
researchers and practitioners. Springer Science & Business Media 30 : 15-30.
Attfield R 2019. Air pollution, health and ethics. American Journal of Biomedical Science & Research 3 (1): 60-63.
Bennett JE, Tamura-Wicks H, Parks RM, Burnett RT, Pope III CA, Bechle MJ and Ezzati M 2019. Particulate matter air pollution and national and county life expectancy loss in the USA: A spatiotemporal analysis. (7): e1002856. PLoS Medicine 16
Civerolo K, Hogrefe C, Lynn B, Rosenthal J, Ku JY, Solecki W and Kinney P 2007. Estimating the effects of increased urbanization on surface meteorology and ozone concentrations in the New York City metropolitan region. . (9): Atmospheric Environment 411803-1818.
Dorj G, Dayan A, Nanjid K, Lkhagvaa U and chir C 2014. Is air О
pollution a risk factor for low birth weight in Ulaanbaatar, Mongolia? : e885. Open Access Library Journal 1
Mehrad AT 2020. Causes of air pollution in Kabul and its effects on health. (4): 997-1002. Indian Journal of Ecology 47
Musafiri S, Masaisa F, Bavuma MC, Kalisa UL and Rutayisire PC 2018. Indoor air pollution from cooking with biomass fuels is a major cause of chronic bronchitis among women in a rural district of Rwanda. African Journal of Respiratory Medicine14(1): 16-19.
Nierenberg C 2009. Top Polluted U.S. Cities with the Worst Air. ABC Ne ws . h t tp s : / / ab cne ws . go . c om/H ea l t h / A l l e rg i es News/story?id=7449100&page=1
Ritchie H and Roser M 2018. Ozone Layer. Published online at Our World In Data.org. Retrieved from: 'https://ourworldindata. org/ozone-layer.
Robinson M, Heath J and Mansfield T 1998. Disturbances in stomatal behaviour caused by air pollutants. Journal of Experimental Botany 49 (Special): 461-469.
Seinfeld JH and Pandis SN 2016. Atmospheric chemistry and physics: From air pollution to climate change. Hoboken (NJ): John Wiley & Sons. p: 56
Wamsley L 2021. American Life Expectancy Dropped By A Full Year In 1st Half Of 2020. https://www.npr.org/2021/02/18/ NPR.968791431/american-life-expectancy-dropped-by-a-full-year-in-the-first-half-of-2020
WMO 2018. Scientific Assessment of Ozone Depletion: 2018, Global Ozone Research and Monitoring Project–Report Geneva, . Switzerland: World Meteorological Organization : 213. 58
Received February, 2021; Accepted 06 , 202125 June
177Pollution Forecast of United States using Holt-winter Exponential Method

Economic Prosperity and Environmental Sustainability: Role of Infrastructure Development
Manuscript Number: S-696NAAS Rating: 5.79
Abstract: This pragmatic investigation strives to divulge the relationship between infrastructure expansion and environmental defilement in the Indian outlook by realistically exerting panel data of 10 Indian states, which contributes 70 per cent of the total national population. The precise outcome of investigation demonstrates that some proxies of infrastructure improvement such as electric capacity, railways network, road network and telecommunication have linkage with the air quality index in India. The outcome uncovers that telecommunication development and road construction do not have any substantial influence on air contamination in India. Finally, empirical outcomes unearth that per kilometre railways network impacts the air quality disparagingly, however installed power capacity has a favourable impact on the air quality (PM ) in India. 10
Keywords: Air pollution, Environmental sustainability, India, Infrastructure development
Amritkant Mishra, Merlyn Sharma, Sumit Kumar , Reeta Tomar1
Akhilesh Tiwari, Amit Guleria2
CHRIST (Deemed to be University), Bengaluru-560 029, India1SRM University AP Amravati-522 502, India
2Punjab Agricultural University, Ludhiana-141 004, India E-mail: [email protected]
Indian Journal of Ecology (2021) 48 Special Issue (16): 178-183
The moto of continuous enhancement for living
standards forces human beings to the excessive exploration
of natural resources. The continuous transformation of
economic prosperity through the development, innovation
and discoveries have effectively enhanced the eminence of
human beings. In 1962, Carson's words in the “Silent Spring”
aware public who were immersed in the dark quest of
economic development facilitated them instigate to
comprehend the irresponsibility of environmental
contamination. The boon of infrastructure advancement has
now turned into misery for human beings. The grave
diminution of natural resources due to infrastructure
development has created a blockage in the development of
certain industries. Many economically sound and developed
countries face environmental degradation due to many
reasons, like smoke emission from industries and motor
vehicles. The relationship between infrastructure
development and environmental degradation has crushed
economic growth. Some regions are also affected by
transboundary smoke haze from land and forest, affecting
the environmental change, stagnating the developed
economic growth. Many countries are falling back on the
World Health Organization Air Quality Guidelines (WHO
AQGs), which are internationally recognised and very
meticulous in their approach. The issue related to economic
development and environmental degradation attracts many
researchers for empirical analysis. Economic development
with environmental parity has become one of the prominent
issues globally. Hence there are many empirical analyses
that strive to investigate the issue related to economic
prosperity and environmental degradation from multiple
points of view. (Chen et al 2019a) studies the applicability of
Environmental Kuznets Curve (EKC) in context of Singapore.
The outcome of analysis gives the confirmation of
Environmental Kuznets Curve in Singapore perspective. The
current lockdown due to pandemic lead to fall in the level of
pollutants such as PM , SO NO in Telangana (Varalakshmi et 10
al 2021). The studies rely on Carbon emissions as a
component of environmental degradation. Furthermore, the
result also reveals that the post-industrial development of
Singapore may have added to the transmission of pollution in
the province. (Kong et al 2019) probe the core energy uses
among the 29 countries with a specific component by
Environmental Kuznets Curve hypothesis (EKC), from 1977
to 2014. The investigation applies Generalized Method of
Moments (GMM) regression model for the analysis. The
outcome of analysis confirms Environmental Kuznets Curve
hypothesis on these analysed countries. Furthermore, based
on panel data of 30 provinces and cities in China during
2006–2015, (Liang et al 2018) unearth the evidence of
environmental Kuznets reversed U curve between economic
growth and ecological contamination, as well as between
suburbanisation and ecological pollution in China. (Barnes
2019) investigates the impact of economic and technological

development on plastic pollution. The result unearths that
investment in scientific and technological research could be a
boon for curbing plastic pollution. Additionally, (Halati et al
2019) scrutinises the connection of the ecological and
economic aspiration of sustainable enlargement creativities
of a local firm, which is involved in the primary sector of
production. There is well documented empirical analysis that
unearths the positive impact of green infrastructure on
environment in many ways, such as reduced circulatory
disease, obesity, asthma and other atopic conditions, by
improving longevity of senior citizens and immune function
(Hartig et al 2014, Sanders et al 2015, Gascon et al 2016,
Han et al 2016 , Lambert et al 2017). The high concentrations
of heavy metals due to traffic and road infrastructure is a
major source of heavy metals that are toxic to the
environment (Bemmansour et al 2021). Even though of such
significance in the policy execution, there is dearth of such
empirical analysis, specifically analysing the impact of
various components of infrastructure development on
environmental degradation. Such specific analysis has been
widely uncultivated in academic writings. Particulate matter
(PM), nitrogen dioxide (NO) and sulphur dioxide (SO) seem
greatest serious air pollutants in Kabul (Mehrad 2020). The
above research papers indicate that deliberations
concerning infrastructure development and environmental
consequences are conventionally inclined towards the
developed nations and European Union. However, few
research articles, which dissected the above issue on the
Asian perspective only focus on Chinese outlook. "Long-term
exposure to outdoor and household air pollution contributed
to over 1.67 million annual deaths from stroke, heart attack,
diabetes, lung cancer, chronic lung diseases, and neonatal
diseases, in India in 2019 alone. On the other hand, the
Global Burden of Disease (2017) reveals that every three
minutes, a child deceases in India because of inhaling toxic
pollutants in the air. In most of the Indian states, which we
have studied, the average PM level always will be higher 10
than the safety level, as stated by World Health Organization.
There is dearth of analysis in Indian outlook about the current
issue. Hence, the current pragmatic research intends to
widen the prevailing perception of the above emerging
context in two ways. First of all, by reconnoitering the impact
of economic development on environmental consequences
simultaneously, this has not been done in previous literature
of our knowledge. Moreover, this examination also strives to
gradually augment the comprehensive analysis by
expanding it almost to 70 per cent of the geographical
location of India by constructing the panel data. On the other
hand, extensive amount of preceding investigation, in this
perspective, is persuaded towards western and European
nations, specifically with application cross-sectional data in
their approach. Researchers are very sanguine about the
outcome of exploration in terms of policymaking, not only
from an Indian perspective but other Asian countries as well.
MATERIAL AND METHODS
Description of the study area: This investigation
accumulates information about the PM from the ENVIS 10
Centre on Control of Pollution Water, Air and Noise, which is
headed by the Central Pollution Control Board (CPCB), that
further sponsored by the Ministry of Environment and
Forests, Government of India. This investigation
accumulates the information about the PM from the ENVIS 10
Centre on Control of Pollution Water, Air and Noise, which is
headed by the Central Pollution Control Board (CPCB), that
further sponsored by Ministry of Environment and Forests,
Government of India. The data of air pollution include the
information from 306 different places of all selected states,
Fig. 1. GPS Location of pollution data centre
179Economic Prosperity and Environmental Sustainability

which includes Bihar (5 locations), Gujrat (22 locations),
Karnataka (27 locations), Madhya Pradesh (34 locations),
Maharashtra (67 locations), Odisha (31 locations),
Rajasthan (21 locations), Tamil Nadu (31 locations), Uttar
Pradesh (53 locations) and West Bengal (15 locations). The
current investigation collects all respective data of air
pol lu t ion f rom h t tp: / /www.cpcbenv is .n ic . in/a i r_
quality_data.html#.
To achieve the objective of present empirical analysis,
by considering the heterogeneity among the variables,
current studies construct a panel data, which includes five
variables such as telecommunication development (Tele),
railways network (Rail), road construction (Road), installed
power capacity (Power) and particle matter ten (PM ). The 10
total observation in data becomes 400, which is sufficient to
run the panel data model.
Data and sampling: Current investigation strives to affirm
the impact of economic development on environmental
pollution. This investigation ponders various indicators of
economic development based on previous empirical analysis
for the period of 8 years from 2011 to 2018. In order to study
the pollution level, the current examination takes average
PM of the various Indian states as done by much previous 10
empirical analysis (Heal et al 2012). To calibrate the
economic development in India, current analysis considers
four variables such as telecommunication development,
railways network, road construction and installed power
capacity (Chotia and Rao 2016, Mishra and Agarwal 2019,
Mishra 2020). To represent the entire geographical location
of India, present investigation shortlists 10 Indian states
according to their level of population, and these states
include Bihar, Gujrat, Karnataka, Madhya Pradesh,
Maharashtra, Odisha, Rajasthan, Tamil Nadu, Uttar Pradesh
and West Bengal. The total population of these Indian states
contributes around 73 per cent of total Indian population. All
the concerning data related to infrastructure development
has been gathered from the Reserve Bank of India (RBI)
database https://m.rbi.org.in/Scripts/AnnualPublications.
aspx?head=Handbook+of+Statistics+on+Indian+States# .
Econometric Model
To assess the impact of economic development on
ecological contamination, based on the recent empirical
investigations, the following econometric model has been
proposed.
pm10 = f (Tele, Rail, Road, Power)
Were pm indicates the air pollution in India, impacted 10
by the Tele, telecommunication development, Rail, railways
network, Road, road construction and Power, installed power
capacity. The Probable causes of pollutants linked with
railways contain diesel consumption and other pertinent
factors as pointed out by various studies (Levengood et
al2015,Cheng and Yan 2011).
Pooled regression analysis
pm Tele + Rail + Road + Power + 10it 0 1 it 2 it 3 it 4 it = β + β β β β
e (1)it The above-pooled regression documents that PM is an 10
independent variable while Tele, Rail, Road and Power are
independent variables. is the intercept term of the model β0
and other are the coefficient of the stimulus variable. β1….4
While represent the error terms of the model. In the above-eit
pooled regression model,it can be realised that beta
coefficients do not contain subscripts with , demonstrating i
that it does not consider heterogeneity impact among the
cross-sectional element, which is a significant problem of the
pooled regression model and hence other relevant models
came into existence.
Fixed effect model
pm Tele + Rail + Road + Power + e (2)10it 0i 1i it 2i it 3i it 4i it it = β + β β β β This investigation also documents that pooled
regression analysis does not consider heterogeneity impact
among the cross-sectional element, which is pertinent
among the cross-sectional variables and can be solved with
the fixed-effect model. In the equation (2), An subscript has i
been added to each of the subscripts, implying that ( ) β β β0 1 2
can be different for each individual. A prevalent explanation is
one where the intercepts are dissimilar for different β0i
individuals but the slope coefficients and are β β β β1 2 3 4
expected to be constant for all individuals, which has shown
below
pm Tele + Rail + oad + Power + e (3)10it 0i 1 it 2 it 3i it 4 it it = β + β β β β In the above transformation, all behavioural differences
between individuals, referred to as individual heterogeneity,
are assumed to be captured by the intercept.
Random effect model
pm Tele + Rail + oad + Power +u +e (4)10it 0i 1 it 2 it 3i it 4 it i it = β + β β β β
The model in equation 2 and 3 take the consideration of
the heterogeneity among the cross-sectional elements; on
the other hand, it assumes that Individual intercepts are
included to ''control'' for individual-specific, time-invariant
characteristics. The time-invariant assumption is very crucial
for the fixed-effect model; however, in reality, it seems
impractical and hence the random effect model solves the
time-invariant assumption of fixed-effect model. Equation 4
reveals that it has two components of error term. One for the
individual which is and for the entire regression model u dei it
itself. An error within the variables. The fundamental ui
assumption of random effects is that there is no significant
correlation among the entity's error term and predictors,
which countenances for time-invariant random variables to
play a role as stimulus variables.
180 Amritkant Mishra, Merlyn Sharma, Sumit Kumar, Reeta Tomar, Akhilesh Tiwari, Amit Guleria

RESULT AND DISCUSSION
Pooled regression: The result postulates that all the
variables such as telecommunication, rail network, road
construction have a significant impact on air pollution in India
except for installed power capacity. The outcome reveals that
on an average per 100 additional phone network users leads
to falling in PM level by 0.47 point, while on an average 1 10
kilometre railways construction, 1 Megawatt installed power
capacity leads to 0.015-point increase and 0.00053-point fall
in PM level in India (Table 1). Based on the pooled 10
regression, it can be surmised that railways development
impacts air quality negatively, which reveals that, for railway
development, we need to make it environment friendly. Now
a day, Indian railways are taking many steps to combat
pollution, especially air pollution, which includes
electrification of diesel routes, green disposal, cleanliness as
well as efficiency in operation. These steps need to be
implemented impeccably. On the contrary, the result also
exhibits that road construction does not significantly impact
the PM in India. Despite having the above outcome, it is 10
essential to think beyond the pooled regression because of
its major limitation. This analysis conducts the Langrang test
to ascertain the random effect on the constructed panel data.
The result of Langrange test reveals that the Chi-Square
statistics is highly significant at one per cent level of
significance. The highly significant Chi-Square statistics
reveals the presence of random effect on the constructed
panel data, and therefore it is desirable to run the panel data
model for robust conclusion.
Fixed-effect analysis: The result of the fixed-effect analysis
Variables Coefficient t Statistics P value
Constant 112.40 5.34** 0.000
Tele -0.470 -2.04* 0.046
Rail 0.015 7.48** 0.000
Road -0.00053 0.02 0.983
Power -0.0017 -3.11** 0.003
R2
Adj R2
F- Statistics
0.667
0.646
32.49** 0.000
Table 1. Result of pooled regression analysis
Variables Variance Standard deviation
PM10 1662.64 40.77
E 281.06 16.76
U 524.11 22.89
Chi Square 41.75
P – value 0.000
Note: ** and * indicates the level of significance at 1% and 5%, respectively.Source: Author's calculation
shows that none of the development indicators, such as
telecommunication development, railways construction,
road construction and power development, do have
significant impact on the air quality of selected Indian states.
The outcome of fixed effect is contrasting with the outcome of
pooled regression. The coefficient of development is not
significant from zero and all the coefficients are almost equal
as well. Seventy-five per cent of the variance is due to
differences across panels, which is indicated by the value of
Rho (Table 2). The outcome of fixed effect seems logically
unconvincing and this may be because of its various
limitations. Hausman test is applied to detect the best model
between random and fixed effect analysis. The null
hypothesis under Hausman test claims the efficiency of
random effect analysis over fixed effect. The outcome of
Hausman test reveals that Chi-square statistics are not
significant at 5 % level of significance and hence efficiency of
random effect analysis over fixed effect cannot be rejected
(Table 3).
Random effect analysis: The Wald statistics are highly
significant, which justifies the long-run association between
the development indicators and environmental pollution in
India. The significance of Wald statistics further supports the
robustness of the analysis which is essential for such type of
investigation. The outcome unearths that telecommunication
development and road construction do not significantly
impact the environmental pollution in India. Road
construction does not contract the air quality in India. Such
circumstances indicate the recent technological
advancement in the road construction process reduced the
particle that usually leads to falling in the air quality. The
concept of green roads and minimum cutting of trees for road
construction in India enhance the quality of environment. The
Variables Coefficient t Statistics P value
Constant 116.86 0.65 0.520
Tele -0.209 -0.50 0.622
Rail 0.0106 0.271 0.788
Road -0.00053 -1.31 0.195
Power -0.000101 -0.01 0.993
R withing2
R between2
F- Statistics
0.0832
0.505
1.27 0.2924
sigma_u
sigma_e
rho
F test that all U =0:i
29.143124
16.765116
0.75135227
8.90**
0.000
Table 2. Result of fixed effect analysis
Note: ** and * indicates the level of significance at 1% and 5%, respectively.: Author's calculationSource
181Economic Prosperity and Environmental Sustainability

Variables Coefficient t Statistics P value
Constant 99.33 2.82** 0.005
Tele -0.339 -0.97 0.331
Rail 0.0152 3.14** 0.002
Road -0.0003 -0.64 0.52
Power -0.008 -0.94* 0.047
R withing2
R between2
Wald- Statistics
0.0670
0.717
20.63** 0.0004
Sigma_u
Sigma_e
Rho
22.893
16.765
0.650
Table 4. Result of random effect analysis
** and * indicates the level of significance at 1% and 5%, respectively.: Author's calculationSource
increment per 100 telephone users in India also does not
have any nexus with the air quality in the selected Indian
states. The outcome is following the theory and the previous
empirical analysis. Based on the analysis researcher opine
that per kilometre railways network has significant effect on
the air quality in India. Our results reveal that expansion of
one-kilometre railways networks leads to surge in PM level 10
by 0.0152 points (Table 4). The Indian railways need to look
into the issue, why the expansion of railways network is
deteriorating the air quality in India. In India, Indian railways
recently developed unique oxygen parlours to reduce
pollution, provide clean air at stations. Finally, current
investigation also reveals the favourable impact of installed
power capacity on the air quality in India. The result
documents that increase in one additional Mega Watt power
capacity reduces the PM level marginally by 0.008 points. 10
This further justifies that increase in installed power capacity
might occur due to conventional sources of energy. It is sign
of India's global initiatives for the expansion of solar energy
capacity in the coming period. India now at the 5th global
position for overall installed renewable energy capacity. In
preceding five years India has improved its solar capability
about 2.6 Gigawatt to more than 34 Gigawatt and now
renewable energy has a portion of 23.39% in the total fitted
Variables Fixed effect Random effect Difference Square of difference
Tele -0.209 -0.339 0.1294 0.2387
Rail 0.0106 0.015 -0.0046 0.0389
Road -0.0001 -0.000037 -0.000065 0.000519
Power -0.00001 -0.00083 0.00085 0.000735
Chi-Square 4.13
P-value 0.388
Table 3. Result of Hausman test
generation capability in the country i.e. 368.98 Gigawatt (up
to 29th February 2020), about 19 times higher. The solar
pumps installed between 2014-19, 2.25 lakh versus up to
2014 11,626 (Ministry of New & Renewable Energy -
Government of India). Our investigation proves the
favourable impact of all such initiatives on the air quality in
India, and it further suggests, in continuation with such policy
initiatives.
CONCLUSIONS
The pertinent pragmatic discernments from this
investigation can be encapsulated as follows. At the outset,
band on the result of panel co-integration analysis, it can be
inferred that some proxies of economic development, such
as electric capacity, railways network, road network and
telecommunication, have nexus with the air quality index in
India. Moreover, the pragmatic result also validates that the
Wald statistics are highly significant which justifies the long-
run association among the development indicators and
environmental pollution in India. The outcome uncovers the
telecommunication development, and the road construction
is not significantly impacting the environmental pollution in
India. Additionally, our result further documents that per
kilometre railways network impacts the air quality in India
unfavourably. Finally, based on empirical analysis, it can be
concluded that installed power capacity has favorable impact
on the air quality (PM ) in India, which further justifies the 10
Indian government's strong initiative towards solar energy
from thermal energy. In the perspective of policy insinuations,
the eventual outcome moderately advocates that few
indicators of development such as railways networks and
installed power capacity have relevant impact on the
environmental pollution especially the air quality index of
I n d i a n s t a te s , wh i l e ro ad c ons t ru c t i o n a nd
telecommunication advancement does have any substantial
influence on air quality index in India. It is found that railways
network is unfavourably impacting the air quality; hence, if
the Indian government genuinely wants to maintain air
quality, representatives should pay attention to the
182 Amritkant Mishra, Merlyn Sharma, Sumit Kumar, Reeta Tomar, Akhilesh Tiwari, Amit Guleria

technological advancement of rail networks. Indian railways
should focus urgently on the electrification of all the rail
networks.
REFERENCESBarnes SJ 2019. Understanding plastics pollution: The role of
economic development and technological research. Environmental Pollution 249 (June): 812-821.
Bemmansour EH, Bouyakoub ZA, Harrache D and Bemmansour N 2021. Detection of air pollution of road origin by a bio-accumulating plant species and evaluation of the Pinus halepensis concentrations of heavy metals in western Algeria, Indian Journal of Ecology 48 (2): 472-477.
Chen X, Huang B and Lin CT 2019a. Environmental awareness and environmental Kuznets curve. : 2-11.Econ Model 77
Cheng YH and Yan JW 2011. Comparisons of particulate matter, CO, and CO2 levels in underground and ground-level stations in the Taipei mass rapid transit system. Atmospheric Environment45(28): 4882-4891.
Chotia V and Rao NMV 2016. An empirical investigation of the link between infrastructure development and poverty reduction: The case of India. (12): International Journal of Social Economics 441906-1918.
Gascon M, Triguero-Mas M, Martínez D, Dadvand P, Rojas-Rueda D, Plasència A and Nieuwenhuijsen MJ 2016. Residential green spaces and mortality: a systematic review. Environment International 86 (January): 60-67.
Halati A and He Y 2018. Intersection of economic and environmental goals of sustainable development initiatives. Journal of Cleaner Production 189 (July): 813-829.
Han JW, Choi H, Jeon YH, Yoon CH, Woo JM and Kim W 2016. The effects of forest therapy on coping with chronic widespread pain: Physiological and psychological differences between participants in a forest therapy program and a control group. International Journal of Environmental Research and Public Health 13 (3): 255.
Hartig T, Mitchell R, De Vries S and Frumkin H 2014. Nature and
health. : 207-228.Annual Review of Public Health 35
Heal MR, Kumar P and Harrison RM 2012. Particles, air quality, policy and health. (19): 6606-Chemical Society Reviews 416630.
Kong Y and Khan R 2019. To examine environmental pollution by economic growth and their impact in an environmental Kuznets curve (EKC) among developed and developing countries. PLoS ONE 14 (1): e0209532.
Lambert KA, Bowatte G, Tham R, Lodge C, Prendergast L, Heinrich J and Erbas B 2017. Residential greenness and allergic respiratory diseases in children and adolescents: A systematic review and meta-analysis. Environmental Research 159 (November): 212-221.
Levengood JM, Heske EJ, Wilkins PM and Scott JW 2015. Polyaromatic hydrocarbons and elements in sediments associated with a suburban railway. Environmental Monitoring and Assessment 187 (8): 534-545.
Liang W and Yang M 2018. Urbanization, economic growth and environmental pollution: Evidence from China. Sustainable Computing: Informatics and Systems 21 : 1-9.
Mehrad AT 2020. Causes of air pollution in Kabul and its effects on health. (4): 997-1002Indian Journal of Ecology 47
Mishra A and Agarwal A 2019. Do infrastructure development and urbanisation lead to rural-urban income inequality? Evidence from some Asian countries. International Journal of Sustainable Economy 11 (2): 167-183.
Mishra A 2019. Quest of nexus between inflation and economic development: Evidence from Asian countries. International Journal of Happiness and Development 6 (2): 95-112
Sanders T, Feng X, Fahey PP, Lonsdale C and Astell-Burt T 2015. Greener neighbourhoods, slimmer children? Evidence from 4423 participants aged 6 to 13 years in the longitudinal study of Australian children. (8): International Journal of Obesity 391224-1229.
Varalakshmi V, Rupendraand D, Nanditha M 2021. Comparative study of air pollution in Telangana State before and after the lockdown due to COVID-19. Indian Journal of Ecology 48Special Issue(14): 27-33.
Received May, 2021; Accepted June, 202124 06
183Economic Prosperity and Environmental Sustainability


S-688 Perceived Organizational Support, Employee Engagement and Organizational Citizenship Behaviour among Knowledge orkers of R & D organizationW Akancha Srivastava
129
S-689 Self-esteem, Eudemonic Well-being and Flow at Work among Managers in Banking SectorRidhima Shukla
135
S-690 Executive Functions and Psychological Flourishing in Public Sector EmployeesSubhashini Pasupuleti and Surekha Chukkali
142
S-691 Decoding HERO : Predicting Psychological Capital with Subjective Well-BeingSanjna Shukla, Sneha Saha and Ridhima Shukla
147
S-692 Creative Behavior as Predictor of Positive Psychological Capital among Trans gender People Sangita Goswami and Anupama Srivastava
153
S-693 An exploratory Study on Decision Making in Creating Positive Organisational Culture: An nsight from IIndigenous ractice and Wisdom TraditionP Guangpuanang Kahmei
156
S-694 Technology Impact and its Infrastructure in Different TerritoriesSurabhi Singh
161
S-695 Pollution orecast of United State using olt-winter xponential ethodF H E MJoe Justin K., Manohar Kapse, Elangovan N. and Vinod Sharma
171
S-696 Economic Prosperity and Environmental Sustainability: Role of Infrastructure Development Amritkant Mishra, Merlyn Sharma, Sumit Kumar, Reeta Tomar Akhilesh Tiwari Amit Guleria, and
178

1Indian Journalof Ecology
CONTENTS
Date of Publication 10.08.2021
Indian Journal of Ecology (2021) 48 Special Issue (16)
S-666 Agriculture 4.0 and Smart Farming: Imperatives of Scaling up Innovation and Farmer Capabilities for Sustainable BusinessDileep Kumar M, Vinod Sharma, Normala S. Govindarajo and Rahmawati
1
S-667 Predicting Green Purchase Intention through Attitude and Social Norms: A Study of Eco-friendly ProductsPranshuman Parashar, Garima Mathur and Yogesh Upadhyay
9
S-668 Green Consumerism and Environmental Sustainability: A Study of Attitude Towards Environment Friendly ProductsNitin Kumar Saxena
12
S-669 Antecedents of Organic Food Consumption in Delhi NCRSanjib Bhattacharjee , Vinod Sharma and Priti Dubey
18
S-670 Analysis of Food Consumption Expenditure Pattern for Developing Sustainable Business practicesAnita G Gopurathingal and Joshy Joseph Karakunnelrace
23
S-671 Exploring Factors of Consumer Perception and Attitude Towards Organic Food Consumption in IndiaVedha Balaji and A.S. Suresh
29
S-672 Pan-generation Investigation of Sustainability Factors in Conjunction with Personality Aspects Influencing Consumer's Perception Towards Sustainable MarketingSoumya Singh, A.S. Suresh and Vinod Sharma
34
S-673 Ecological Financial Risk Modeling Analysis by the Scheduled Commercial Banks Deepak Tandon, Ekta Mittal and Neelam Tandon
40
S-674 CSR as an Agent of Financial stability: A Use Case of Banking IndustrySalineeta Chaudhuri and Santosh Kumar
46
S-675 Financial Inclusion of Rural Sector: Imperative for Sustainable Economic Growth of IndiaShalini Mittal and Shivani Chaudhry
51
S-676 Exploring Effect of Instagram Influencer Likeability and Personality Traits on Self-Concept and its Impact on Consumer Buying Intention Towards Cosmetic ProductsA.S. Suresh and VedhaBalaji
56
S-677 Stakeholders' Pedagogical Preferences for Teaching 'Marketing' in Management EducationChandan Maheshkar and Vinod Sharma
64
S-678 Classifying Voice-Based Customer Query using Machine Learning TechniqueManohar Kapse, Elangovan N., Arun Varghese, Andrews Joy and Cen Tom
69
S-679 Introspecting e-Commerce Platform for Arts and Crafts of BengalArunava Dalal and Subrata Chattopadhyay
73
S-680 Youngster's Perception Towards M-wallet Service Quality: A Empirical Study of nMinal Uprety and Murlidhar Panga
80
S-681 E-Governance: A Swift Development and Citizens' AdoptionNidhi Jhawar and Vivek S. Kushwaha
85
S-682 Factors ffecting uxury rand onsumption and ts mpact on onsumer urchase ntentions: A India A L B C I I C P IF L G S Pashion uxury oods ector erspectiveA.S. Suresh and Vinod Sharma
92
S-683 Job Portals versus Social Networking Sites: Job Seekers' PerceptionsAnagha Shukre
100
S-684 Flourishing and Work Flow among Working Adults: A Positive Investigation from IndiaK. Rastogi and A. Belani
108
S-685 Professional Quality of Life of Nurses with 6-8 Years of Work ExperienceHarguneet Kaur
113
S-686 Study of the Personal Factors Influencing Voluntary Turnover amongst Women Jeanne Poulose Vinod Sharma, and Priti Dubey
119
S-687 B-school Teachers' Competencies towards Excellent Learning Outcomes in Business EducationChandan Maheshkar and Jayant Sonwalkar
123