indian ecological society - IUFRO
256
Volume 38 Special Issue March 2011
-
Upload
khangminh22 -
Category
Documents
-
view
0 -
download
0
Transcript of indian ecological society - IUFRO

Volume 38 Special Issue March 2011

INDIAN ECOLOGICAL SOCIETYFounder President : A.S. Atwal
(Founded 1974, Registration No.: 30588-74)
Registered OfficeCollege of Agriculture, Punjab Agricultural University, Ludhiana – 141004, Punjab, India
(e-mail : [email protected])
Advisory BoardDeepak Bhatnagar (USA) T.N. Ananthakrishnan (India) N.T. Yaduraju (India)
C.M. Smith (USA) Opender Koul (India) T.P. Rajendran (India)
S. Nagarajan (India) C. Devkumar (India) Bijay Singh (India)
Executive CouncilPresident
G.S. Dhaliwal
Vice-PresidentsS. Ignacimuthu G.T. Gujar
General Secretary-cum-Managing EditorA.K. Dhawan
Joint Secretary-cum-TreasurerK.K. Shukla
CouncillorsVeena Khanna Rajinder Peshin R. Jayakumar
Editorial BoardS.S. Kukal Ramesh Arora Vikas Jindal
U.S. Walia Asha Dhawan Sanjeev Chauhan
S.S. Mukhopadhyay Kiran Bains Kamaldeep Singh
The Indian Journal of Ecology is an official organ of the Indian Ecological Society and is
published six-monthly in June and December. Research papers in all fields of ecology are accepted
for publication from the members. In case of joint papers, all the authors must be members. The
annual and life membership fee is Rs 500 and Rs 4,000, respectively, payable by demand draft drawn
in favour of the Indian Ecological Society (Add Rs. 50/- as postage charges extra). The copies
are available from General Secretary, Indian Ecological Society, College of Agriculture, Punjab
Agricultural University, Ludhiana–141004, India @ Rs 2000/- (US $ 125) per volume.

Volume 38 Special Issue March 2011
CONTRIBUTING PAPERS
IUFRO Symposiumon
Short Rotation Forestry: Synergies for Wood Production and Environmental Amelioration(February 10-12, 2011)
Organized by Department of Forestry and Natural Resources,
Punjab Agricultural University, Ludhiana – 141 004 (India)
In collaboration with Indian Ecological Society,
Punjab Agricultural University, Ludhiana – 141 004 (India)
Sponsored by European Commission under Benwood Project, IUFRO and ICFRE
Editors
Sanjeev K. ChauhanRajni Sharma
Rakesh K. Garg Kamaldeep Singh
H. S. Saralch

FOREWORD
India is blessed with almost all types of resources but the nation today faces a near crisis situation, both economic aswell as environmental. This is particularly the outcome of overuse and abuse of the various natural resources under the
inflating population pressure. The degradation is visible in all the renewable and non-renewable resources yet the forestwealth in particular has met the colossal depletion. Despite framing the national policies and enacting new acts in postindependence period, it has not been possible to conserve and enhance the forest cover. Our forest wealth has witnessed
colossal depletion and a significant portion of the total land area (approximately 50 %) has been turned into waste. Countryon one hand is faced with shortage of forest based products in rural area (timber, fuel, fodder, fibre etc.) and urban/industrial sector (wood and wood products), and on the other hand drought, floods, soil erosion, air/water pollution, etc.
have attained frightening dimensions. Moreover, the forests of the country are neither uniformly stocked nor equitablydistributed. The productivity as well as the growing stock position is also not encouraging. To meet the challenges ofextending area under plantations, we have to save and improve the existing forest species as well as raise large scale
plantations on the depleted forest/ private/ community lands by using preferably indigenous/ exotic multipurpose fastgrowing species. Tree plantations are the answer to many global problems and plantations can achieve many of thethings that people expect of them. They reduce deforestation, restore degraded land, fight climate change, improve
livelihood, create employment, etc. Therefore, the plantations are mixture of opportunities.
We are please to collaborate with the Department of Forestry and Natural Resources, Punjab Agricultural University,in organizing an International Symposium on “Short Rotation Forestry (SRF): Synergies for Wood Production and
Environmental Amelioration”, during February 10-12, 2011 to celebrate International year of Forests at Punjab AgriculturalUniversity, Ludhiana (India). The financial and technical support of the European Commission under BENWOOD project,IUFRO and ICFRE was key to the success of the symposium. I know, the national as well as international delegates
addressed diverse issues related to the short rotation forestry to further the cause of plantations in terms of area andproductivity. The symposium provided an opportunity for stakeholders to share their experiences and vision on SRF tomeet the increasing demand for wood and address the cause of environment.
I am sure that this voluminous special issue of the Indian Journal of Ecology on Short Rotation Forestry with variedrelated issues will be useful for the readers in persuing the practical cause of SRF. Editors have made appreciable effortsin bringing out the proceedings of the IUFRO Symposium on Short Rotation Forestry: Synergies for Wood Production and
Environmental Amelioration in the present format and I am sure this issue will become an important resource for thereaders on SRF. The views expressed in the publication are those of the author (s) and Indian Ecological Society acknowledgetheir support and cooperation.
Dr A.K. DhawanGeneral Secretary,
Indian Ecological Society

1
Forests are the planet’s largest and most important
terrestrial ecosystem. They have a profound influence onthe structure and function of the human habitat locally andglobally (WCFSD, 1999). The total forest area of the World
is just over 4 billion ha, which represents nearly 31 per centof the Earth’s land mass (FAO, 2010). The five most forest-rich countries (The Russian Federation, Brazil, Canada,
the United States of America and China) account for morethan half of the total forest area.
The net change in forest area in the period 2000–2010
is estimated at -5.2 million ha per year (an area about thesize of Costa Rica), down from -8.3 million hectares peryear in the period 1990–2000. Forests and trees are planted
for many purposes and make up an estimated 7 per cent ofthe total forest area, or 264 million ha. Between 2000 and2010, the area of planted forest increased by about 5 million
ha per year (FAO, 2010). More than a billion people relyheavily on forests for their livelihoods. More than two billionpeople, a third of the World’s population, use biomass fuels,
mainly fire wood, to cook and to heat their homes. Hundredsof people rely on traditional medicines harvested fromforests (UN). In 2003, the international trade in sawn wood,
pulp, paper and boards amounted to about USD 150 billion,or over just 2 per cent of world trade. In many developingcountries forest based enterprises provide at least one-
Contribution of Trees Outside Forests Toward Wood Production andEnvironmental Amelioration
A. S. DograIreo Water Front, Ludhiana - 141 001, India
E-mail:[email protected]
Abstract: Trees outside the forest (TOF) are located, both in rural and urban areas. A large number of TOF consist of trees planted onshort rotations and include trees in agroforestry systems, orchards or small woodlots. Globally, nearly half the agricultural land,approximately 1 billion ha, has a tree cover exceeding 10 per cent while 600 million ha has a tree cover of more than 20 per cent. In India,the growing stock of TOF has been estimated as 1599 million m3 against the forest growing stock of 4499 million m3. Most trees within TOFhave been planted on short rotations and contribute more than half the nation’s wood supply. According to another estimate, TOF produce80 per cent of industrial round wood and 75 per cent of the fuelwood. In recent years, clonal plantations of fast growing species, mainlyeucalypts and poplar have been taken up by the farmers and the private sector companies. In 2006, Punjab prepared an inventory of TOFwith the assistance of Forest Survey of India. The estimated number of stems was 61.2 million with estimated wood volume of 19.85million m3 and most of the TOF were recorded in rural areas (94 per cent). Short rotation forestry has the potential to augment farmers’income substantially. The Green India programme envisages a forest and tree cover of 33 per cent or about 100 million ha. Most of theadditional area would have to come from the private sector, mainly agroforestry. We therefore need a national policy to promote TOF. Theyalso help to reduce deforestation and forest degradation while simultaneously enhancing the carbon stock. Our estimates show thateucalyptus and poplar respectively sequester carbon at the rate of 0.45 and 0.47 times their oven dry weights. Unfortunately, TOF areexcluded from current climate mitigation discussions. As compared to schemes involving forest-based emissions mitigation (REDD),Reducing Emissions from All Land Uses (REALU), using full accounting scheme for Agriculture, Forestry and Land Use (AFOLU), appearsto be more effective, efficient and equitable.
Key Words: Trees outside forests, Agroforestry, Carbon sequestration, REDD
third of all rural non-farm employment and generate income
through sale of wood products. The value of trade in non-
timber forest products has been estimated at US$ 11 billion.
These products include pharmaceutical plants,
mushrooms, nuts, syrups and cork (World Bank, 2006).
Roughly 275 million poor rural people in India (27 % of the
total population) depend on forests for at least part of their
subsistence and cash livelihoods, which they earn from
fuelwood, fodder, poles, and a range of non-timber forest
products such as fruits, flowers, and medicinal plants. Half
of India’s 89 million tribal people live in forest fringe areas,
and have close cultural and economic links with the forest.
The increasing human population and rapid economic
growth have put immense pressure on forests and other
natural resources (World Bank, 2006). About 41 per cent of
the forest cover in the country has already been degraded
and dense forests are losing their crown density and
productivity continuously. At present 70 per cent of forests
have no natural regeneration and 55 per cent are prone to
fire. It is estimated that 1.7 billion tonnes of carbon are
released annually due to land use change, mainly through
deforestation. This represents about 20 per cent current
global carbon emissions, which is greater than the
percentage emitted by the global transport sector with its
intensive use of fossil fuels.
Indian J. Ecol. (2011) 38 (Special Issue) : 1-5Indian Journal
of Ecology

2
Short Rotation Forestry
FAO considers fast-growing species as those capableof a mean annual increment of at least 10 m³ ha-1 under
favourable site conditions and providing appropriatetechniques are used in ground preparation and forestablishment, care and tending of plantations (FAO Staff,
1965). Compared with the above figures, mean annualincrements of more than 60 m³ ha-1 per year have beenreported for some eucalyptus plantations in South America
and Africa over short rotations of 5-8 years. For quickergrowing pines grown for timber this figure would be 12-17m³ ha-1 per year, while broad-leaved timber species, such
as teak, would seldom achieve more than 10 m³ ha-1 peryear. With such rates of growth, plantations of quick-growingspecies can produce saw logs of acceptable size in
substantial quantities at age 20 onward, and pulpwood in5-8 years. Thus, exotics have been planted because of theirquicker rate of growth and are managed on short rotations
to meet the demand for pulpwood, fuelwood and smalltimber.
Economics and environmental concerns are two
powerful forces driving the trend towards tree planting.Promising economic returns on tree planting have beenrealized especially in tropical and sub tropical areas of South
America, Asia and Africa, where biological growth rates arehigh. Many planted forests are on land that was previouslyin low-productivity agricultural uses. The economic returns
on planted forests, especially high-yielding intensivelymanaged forests are sufficient to continue to inducesubstantial investments in plantation forestry (Sedjo, 1999).
Trees Outside Forests
‘Trees outside forests’ (TOF) refers to trees found onlands that are not categorized as ‘forest’ nor as ‘otherwooded land’ (FAO, 2010a). They include trees (isolated,
linear and groups or stands of trees and tree systems)found in rural landscapes (e.g. on farms, in fields, pasturesand various forms of horticulture and agroforestry systems,
in hedges, along roads and streams) and in urban settings(e.g. on private or public lands and along streets). Treeshave been part of local land use systems for millennia. The
products derived from them, such as food, medicine,cooking fuel, animal fodder and construction materials, arecritical for the subsistence of hundreds of millions of people.
Trees in rural landscapes also have protective functions atfarm, landscape and global levels. They maintain soil fertility,allow more efficient water and nutrient resource use, control
water erosion, and contribute to microclimate moderation.The ecosystem services they provide at a global level incarbon sequestration and biodiversity conservation are also
significant. Trees in human settlements are no lessimportant: in addition to their various products, they provide
services, such as microclimate moderation and a ‘green’environment conducive to good health.
New estimates from analysis of remote sensed images
(Zomer et al., 2009) show that globally, in terms ofagricultural land area, 46 per cent or 1 billion ha has atleast 10 per cent tree cover, about 600 million ha (27 % of
agricultural land) have more than 20 per cent tree cover andonly 167 million ha have more than 50 per cent tree cover.Agroforestry with more than 10 per cent tree cover is
particularly prevalent in SE Asia and Central and SouthAmerica. The author estimated that 558 million people(31%) live in landscapes with more than 10 per cent tree
cover and that there are at least 100 million people living inlandscapes with more than 10 per cent trees in each ofsub-Saharan Africa, South Asia and South East Asia.
The contribution of trees outside forests to people’slivelihoods and national economies is expected todramatically increase in the current context of climate
change, financial crisis and food insecurity.
Wood Production and TOF in India
Forest Survey of India has calculated the total
production of wood from estimates of consumption and
expert judgement (FSI, 2009). Woodfuel production was
estimated to be 261 million m3 in 2005. Most of the woodfuel
is produced outside the forests from trees growing on farm
lands, homesteads, common lands and along roads and
canal sides (Pandey, 2010). The growing stock of TOF has
been estimated as 1590 million m3 against the forest
growing stock of 4499 million m3 (FSI, 2008). The forest
and tree cover in the country has been assessed as 23.4
per cent of the total geographical area. The tree cover was
estimated as 9.17 million ha which constitutes about 2.8
per cent of the geographical area. Recent estimates place
the woody volume of forest trees at 5129 million m3 and of
TOF at 1620 million m3 (Pandey, 2010). Countrywide, the
most important agroforestry tree was mango, followed by
neem and coconut.
TOF contribute about 25 per cent of India’s woodygrowing stock and are estimated to produce about 80 percent of industrial round wood and 75 per cent of woodfuel
(FSI, 2009). While burning fossil fuels releases CO2 thathas been locked up for millions of years, burning biomasssimply returns to atmosphere CO2 that was absorbed as
plants grew. Under sustainable management, this CO2 isrecaptured by the growing forest/trees, and there is noleakage of CO2. Hooda et al. (2007) conducted a study in
A. S. Dogra

3
Uttarakhand to assess the carbon mitigation potential ofeucalyptus in agroforestry systems. Comparisons of six-
year rotation eucalyptus for bio-energy with ten-yeareucalyptus grown as carbon sink shows that carbonabatement is higher in the former.
The overarching objective of India’s new flagshipprogramme, the Green India Mission is to increase forest/tree cover in 5 million ha of forest/non-forest lands and
improve quality of forest cover in another 5 million ha (atotal of 10 million ha) over a ten-year period. This includesbringing 0.20 million ha of urban/peri-urban lands under
forest and tree cover and agroforestry/social forestry over3.0 million ha. The mission observes that productivity oftree crops on agricultural lands is much lower than that in
Brazil and Indonesia (MoEF, 2010a). There is considerablepotential in many parts of India to achieve similar levels ofproductivity in agroforestry systems. As a matter of fact typical
yields from plantations of fast growing species likeeucalyptus and poplar are in the region of 30-50m3ha-1yr-1
(Lal, 2003,2004). The potential area for agroforestry in the
country is as high as 165 million ha but there is absence ofa strategic plan for development of agroforestry. Thefollowing well known problems relating to this sub-sector
are.
• Lack of strategic directions (supply–demand forecasts)
for agro-forestry linking potential production with market
demand;
• Matching species with the site and access to high-
quality planting material of proven suitability, especially
at the initial tree-planting phase;
• Over-regulation often restricting the access to markets
for farmer-grown timber and tree products, partly
because of rules intended to curb illegal logging from
natural forests or government plantations; and
• Marketing and price support system to ensure right
prices and smoothen market fluctuations.
TOF provide a great opportunity to mitigate climate
change and conserve biodiversity through indirect reductionin pressure on forest resources. However, the opportunitycan be fully exploited only if we address the above stated
problems.
TOF in Punjab
Punjab was the first State to document its tree wealthoutside forests in 2006 with the help of Forest Survey of
India. The salient findings were:
• The total estimated stems were 61.2 million out of
which 57.8 million were in rural areas. This works out
to 14.3 stems per ha.
• The total estimated stem volume of wood was 19.86
million m3 with a volume per ha of 4.3 m3.
• The dominant species were Eucalyptus spp. (23.7 5),
Populus spp. (21.0 %), Melia azedarach (10.8 %),
Dalbergia sissoo (10.4 %), Mangifera indica (4.5 %)
and Acacia arabica (4.2 % ).
• The most preferred species in rural areas are
Eucalyptus spp. Followed by Populus spp. and
Dalbergia sissoo. For urban areas, the preferred
species are Eucalyptus spp. followed by Melia
azedarach and Populus spp.
• Populus spp. are preferred in block plantations while
Eucalyptus spp. are preferred in linear plantations.
• The State has vast potential for increasing its tree cover,
as 92.7 per cent of its total geographical area is
culturable non-forest area.
Being the two most common agroforestry tree species
accounting for nearly 45 per cent of tree cover in Punjab, weestimated the carbon content of poplar and eucalyptus trees.The values obtained were 0.47 and 0.45 times their
respective oven dry weights. The estimates are in line withthe IPCC’s default values of 0.43 for twigs/small wood and0.47 for logs. Using the estimated values, we have developed
regression equations to estimate carbon sequestered by atree according to its diameter and height (Tables 1 and 2).
Table 1. Amount of carbon sequestered (kg) in Eucalyptus trees
Diameter Tree height (m)at breastheight (cm) 15 17 20 22 24
12 26.6 29.4 33.7 36.3 39.1
15 41.2 45.6 52.2 56.5 60.7
17 52.6 58.4 66.7 72.2 77.6
20 72.4 80.3 91.8 99.4 106.8
25 112.2 124.5 142.4 154.0 165.5
30 160.6 178.1 203.7 220.3 236.8
Note: An additional amount of 20-25 per cent is sequestered andfixed in the soil through root biomass.
Table 2. Amount of carbon sequestered (kg) in Poplar trees
Diameter Tree height (m)at breastheight (cm) 16 18 20 22 24
16 28.42 30.34 32.19 * *
18 32.41 34.66 36.82 38.91 *
20 36.56 39.14 41.63 44.04 46.37
22 40.84 43.78 46.60 49.34 51.98
24 45.26 48.55 51.73 54.79 57.76
* Trees normally not available in these categories. An additionalamount approximately 20-25 per cent is sequestered and fixed inthe soil through root biomass.
Trees Outside Forests for Wood Production

4
REDD-plus
REDD (Reducing Emissions from Deforestation andForest Degradation) is the global endeavour to create an
incentive for developing countries to protect, better manageand save their forest resources (MoEF, 2010b). REDD+ goesbeyond merely deforestation and forest degradation and
its scope includes:
• Reducing emissions from deforestation;
• Reducing emissions from forest degradation;
• Conservation of forest carbon stocks; and
• Enhancement of forest carbon stocks.
It is generally thought that enhancement of forest carbon
stocks refers to afforestation, reforestation and restorationactivities on deforested and degraded lands; though it mayalso include the sequestration of carbon in healthy standing
forests(REDD-NET, 2010). REDD+ was one area whereprogress was made at Copenhagen. Counties that arealready protecting their forests can benefit under REDD+. It
is estimated that India could provide capture of more than 1billion tonnes of additional CO2 over the next three decadesand provide more than USD 3 billion as carbon service
incentives under REDD+ (MoEF, 2010b). India also plans toimplement REDD+ by utilizing public funds rather thandepending on carbon markets (MoEF, 2010c). India’s GHG
emissions for 2007 was released in May 2010 by INCCA; itindicates that India is now ranked fifth after the United States,China, The European Union and the Russian Federation in
global GHG emissions of around 1.7 billion tonnes of CO2
equivalent and the forests of India sequestered 67.8 milliontonnes of CO2 in 2007 (MoEF, 2010c). The overall objective
of REDD+ is to create net emission reductions. REDD+
brings a new logic to what is being paid for, with revenuesderived from keeping trees standing rather than cutting them
down and that payments for emission reductions will beperformance- based. However, there are concerns thatREDD+ will be like another CDM with rules that are too
complex for many developing countries to benefit from.
Land use is a significant (20-30 %) contributor of global
emissions. However, the current policy is focused on the
institutionally defined (government) forest and reducing
emissions within the institutional forest category. Trees on
agricultural landscapes represent a globally important
carbon stock. Trees outside forests, woody vegetation
outside of institutionally defined ‘forest’ and peat lands
contain large amounts of carbon stocks that are excluded
from current mitigation discussions. The ASB Partnership
for Tropical Margins has compiled evidence to suggest that
promoting high carbon stock uses and reducing emissions
from all land uses remains the best way to achieve globalclimate goals (Van Noordwijk et al., 2009). Their key findings
are reproduced below:
• “Compared to schemes currently under discussion for
forest based emissions mitigation, Reducing
Emissions from All Land Uses (REALU), using full
accounting scheme for Agriculture, Forestry and Land
Use (AFOLU), will be more:
• Effective, in bringing major ‘leakage’ concerns into
accounting rules and allowing increased land use
intensity outside forests as a contributor to net
emissions reduction.
• Efficient, by providing many cost-effective options for
emission reduction, including tropical peat lands and
smallholder agroforestry.
• Equitable, by applying the same accounting rules for
Annex-I and non-Annex-I countries, and embracing low-
forest-cover countries on a proportionate basis and
rewarding the poor.
• The absence of a globally agreed definition of ‘Forest’
will impede implementation of REDD or REDD+
schemes.
• Trees outside forests, woody vegetation outside of
institutionally defined “forest’ and peat lands contain
large carbon stocks that are excluded from current
mitigation discussions”.
As stated earlier, there is considerable scope forenhancement of tree cover in India. Even if 10 per cent ofthe estimated potential area of 165 million ha, is brought
under agroforestry/tree cover, India’s tree cover would jumpfrom the current area of 9.17 to 16.5 million ha. This in itselfwould be a substantial increase and this tree wealth could
sequester in close to 300 million tonnes of carbon instanding biomass over two decades. Promoting TOFtherefore has the potential to improve rural livelihoods,
increase food security and contribute to climate changemitigation while at the same time taking pressure off theremaining natural forests.
CONCLUSION
In India, trees outside forests are already making asignificant contribution to the supply of industrial round woodand woodfuel. There is considerable scope for expansion
of this sub-sector and its inclusion in REDD+ schemeswould be a win-win situation. Additionally adopting a whole-landscape approach to reducing emissions by including
among others, agroforestry, while proposing full accountingscheme for Agriculture, Forestry and Land Use (AFOLU)will be equally effective.
A. S. Dogra
5
REFERENCESFAO. (2010) Global Forest Resources Assessment, 2010. FAO
Forestry Paper 163. Food and Agriculture Organization of theUnited Nations, Rome, 2010.
FAO. (2010a) Forests and Climate Change Working Paper 7.Forests and Climate Change in Asia-Pacific Region. Food andAgriculture Organization of the United Nations. Rome, 2010.
FAO Staff.(1965) Fast-growing tree species for industrialplantations in developing countries. Unasylva No. 79.
FSI. (2008) State of Forest Report 2005. Dehradun, India, Ministryof Environment and Forests. Ministry of Environment andForests.
FSI. (2009) Country report: India for FAO Global Forest ResourceAssessment 2010. Dehradun, India, Ministry of Environmentand Forests. (Unpublished).
Hooda, N., Gera, M., Andrasko, K., Sathaye, J.A., Gupta, M.K.,Vasistha, H.B., Chandran, M. and Rassaily, S.S. (2007)Community and farm forestry climate mitigation projects: casestudies from Uttaranchal, India. Mitigation and AdaptationStrategies for Global Change 12(6) 1099-1130.
Lal, P. (2003) Clonal eucalyptus plantations in India. In: J.W. Turnbull(ed) Eucalyptus in Asia. Proceedings of an internationalconference held at Zhanjiang, China, April 7-11, 2003.
Lal, P. (2004) Integrated development of farm-forestry plantationsand wood based industries. Ind. For. 130(1): 71-78.
MoEF. (2010a) National mission for a Green India. Ministry ofEnvironment & Forests, Government of India. Draft missiondocument, Available at http://envfor.nic.in/.
MoEF. (2010b) Ministry of Environment & Forests, Government ofIndia. India’s Forests and REDD+. Available at http://envfor.nic.in/.
MoEF. (2010c) Ministry of Environment & Forests Government ofIndia. India: greenhouse gas emissions 2007. MoEF,Government of India.
Pandey, D. (2010) Woodfuel development and climate changemitigation in India. In Forests and Climate Change Working Paper6. Woodfuel and climate change mitigation. Case studies fromBrazil, India and Mexico. Food and Agriculture Organization ofthe United Nations. Rome, 2010.
REDD-NET. (2010) Networking for equity in forest climate policy.REDD-NET COP15 BRIEFING. Available at www.redd-net.org.
Sedjo, R.A. (1999) The potential of high-yield plantation forestry formeeting timber needs. New Forests 17: 339-359.
Van Noordwijk, Minang, P.A., Dewi, S., Hall, J. and Rantala, S.(2009) Reducing Emissions from All Land Uses (REALU): TheCase for a whole landscape approach. ASB Policy Brief 13.ASB partnership for the Tropical Forest margins, Nairobi,Kenya.
WCFSD. (1999) Our Forests, Our Future. Report of the WorldCommission on Forests and Sustainable Development.Cambridge University Press, United Kingdom. 205 p.
World Bank. (2006) India: Unlocking Opportunities for Forest-dependent People. Agriculture and Rural Development SectorUnit, South Asia Region. The World Bank. Oxford UniversityPress, New Delhi, 96p.
Zomer, R.J., Trabucco, A., Coe, R. and Place, F. (2009) Trees onFarm: Analysis of Global and Geographical Patterns ofAgroforestry. World Agroforestry Centre Working paper no.89. World Agroforestry Centre, Nairobi, Kenya.
Trees Outside Forests for Wood Production

Trees are reverend in our mythological scriptures andfarmers have been maintaining sporadic trees of usefullocal species in their farm lands and around their farm
houses since ages. National needs of timber, industrialround wood for processing and to a large extent fuel-woodhave been traditionally met from forest resources. However,
with the economic development of our country, demand fortimber and wood based products has been growingcontinuously while sustainable supply of wood from forests
has declined because of low growing stock, poor annualincrement and degradation of nearly 42 per cent of 69.09million ha of our country’s forest cover. (Anonymous, 2009)
As per national forestry action programme timberrequirements of India during 2006 were 82 million m3,whereas, the domestic availability was just 27 million m3.
Timber and wood based products worth US$ 2.75 billionwere imported into India during 2006. Estimated domesticwood supply deficit in India will exceed 90 million m3 by
2020 - a substantial increase from the round wood deficit of21 million m3 in 1999 (Midgley et al., 2007). Growingshortages of industrial round wood have hampered
modernization and growth of wood based industries.
As our Government owned forests cannot meet growing
requirements of industrial round-wood, national forest policy
1988 suggests that wood based industries should source
their future wood supplies through persuading farmers to
raise agroforestry plantations. Substantial improvement in
productivity of forest resources on sustainable basis and
promotion of large scale agroforestry plantations are most
essential for meeting the national needs for fuel-wood,
timber & wood products on sustainable basis and
Clonal Agroforestry Plantations in India
Piare LalPragati Biotechnologies, Hoshiarpur, Punjab, India
E-mail: [email protected]
Abstract: Our forests cannot meet national needs of timber, industrial round wood and fuel wood because of low growing stock, poorannual increment and degradation of large areas of forest resources. We spend huge amount of foreign exchange on import of timber andwood based products and import bill is growing year after year. Declining supplies from forests and growing market demand for woodcombined with development and deployment of genetically improved clones have made agroforestry an attractive alternate land useoption for the farmers. Bulk of the requirement of veneer and ply logs and pulpwood demand of paper mills are met through agroforestryplantations that also make very significant contribution to country’s green cover, carbon sequestration, amelioration of environment andemployment generation. Yet there are very serious constraints hampering development of agro-forestry and limiting exploitation of its fullpotential. These constraints need to be addressed by Government urgently through innovative policy changes. Specific suggestions foraddressing the constraints and strengthening of research and extension services for holistic development of agro-forestry have beengiven for consideration of the Central and State Governments.
Key Words: Clones, Agroforestry, Poplars, Eucalyptus, Productivity, Constraints, Policy support
conservation of the forest resources. Productivity and netreturns from seed based agroforestry plantations have beengenerally very low mainly because of extremely poor genetic
quality of seed most often used and non availability ofadequate quantities of genetically improved planting stock.
Development and large scale deployment of tested
genetically superior clones of eucalypts and poplarssupplemented with improved scientific package of practiceshave redefined productivity standards making agro-forestry
plantations an attractive land use option with net returnssignificantly higher than those from traditional crops.Average productivity of commercial poplar and eucalyptus
clones is 20-25 m3 ha-1 yr-1. However, many farmers haveachieved trend setting high productivity of 50 m3 ha-1 yr-1
both for poplars and clonal eucalypt plantations.
Sustainable harvest of timber from trees outside forests inPunjab is 1.5 million m3 per year (93 % of total) compared to0.12 million m3 from government owned forests. Likewise
in Haryana state, harvest of timber from community andfarm lands is 2.8 million m3 per year (94 % of total) comparedto 0.19 million m3 from forests.
Clonal Poplar Plantations
Trials of various species and cultivars of exotic poplarswere initiated by Forest Research Institute, Dehradun andUttar Pradesh Forest Department during 1960s and Populusdeltoides clone IC confirmed commercial potential ofpoplars in Terai areas provided tested, superior andadaptable clones are deployed. Genetically improved, field
tested and fast growing Populus deltoides clones like G3and G48 supported with long term bank loans and improvedpackage of practices since 1984 played crucial role in this
Indian J. Ecol. (2011) 38 (Special Issue) : 6-10Indian Journal
of Ecology
7
success story. Assured supply of superior clonal plantingstock, supplemented with excellent technical extension
services and buy back guarantees provided by Wimcoseedling Limited laid very solid foundations of an extremelysuccessful poplars based agro-forestry project (Jones &
Lal, 1989). Enterprising farmers adopted scientific improvedpackage of practices for poplar plantations in a big way totake advantage of the growing market demand for high
quality logs for manufacture of match splints, plywood andflush doors (Lal, 1991). By the year 1989-90, the planting ofpoplars on private farmlands covered 4,000 ha with 2 million
poplar plants per annum. By the year 1999-2000 planting ofpoplars under agroforestry system on private farm landsincreased to 15 million plants covering nearly 30000 ha
annually. Though, it is desirable to retain poplar plantationsfor 8 years to achieve high mean annual increment andgood girth of logs, yet most of the farmers prefer to follow
5-6 years rotation to get early cash inflows. Poplar logs areused by the safety match, veneer and plywood, sports goodsand packing cases industries, etc. Centre cores and veneer
waste generated during plywood manufacture and smallsized wood are used for manufacture of pulp and as fuel-wood.
Poplars require assured irrigation and distinct winterseason for good growth. Plantations of poplars underagroforestry system are concentrated in northern districts
of Punjab, Haryana, north-western Uttar Pradesh and plainsof Uttarakhand. As the availability of farm grown poplar logsimproved steadily, plywood industry saw an opportunity to
set up poplar based veneer and plywood units. That furtherspurred demand for poplar logs and in turn more and morefarmers adopted poplar planting because of high productivity
and attractive economic returns. There are now more than1100 members of the Northern India Plywood ManufacturesAssociation having veneer and plywood units in aforesaid
four states based almost entirely on farm grown poplarsand eucalypts. Largest concentration of plywood and veneerindustry is in and around Yamunanagar in Haryana state.
Unfortunately, farmers lost heavily to the extent of 18000million Indian rupees during 2001- 05 because ofcontinuous decline in prices of poplar logs from Rs 4500/-
per tonne in 2001 to less than Rs 1000/- per tonne by 2004-05, engineered primarily by the plywood industry. Majority ofthe small farmers resorted to distress sales and uprooted
immature poplar plantations to reconvert their small landholdings to agricultural crops (Lal, 2006). Central and StateGovernments did not intervene suitably to safeguard the
legitimate interests of thousands of farmers. With thestabilization of prices of poplar logs after resolution of issuesrelated to licensing of wood based industries since 2005
and further improvement of prices to current level of Rs.11000/ tonne, there is increasing trend of planting poplars
once again.
Clonal Eucalyptus Plantations
Even though large scale seed based Eucalyptusplantations have been raised on degraded forest and
marginal lands and along railway tracks/road strips, canalsand drainage channels in India, yet most of these pastplantations have low productivity ranging from 4-10 m3
ha-1 yr-1 and large genetic variation because of poor geneticquality of seed used. ITC Bhadrachalam PaperboardsLimited launched an ambitious programme in 1989 for
development, testing and commercial scale deployment offast growing, high yielding and disease resistant clones ofeucalypts in Andhra Pradesh state (Lal, 2001). Productivity
and profitability of eucalypt plantations has beenrevolutionized with the deployment of genetically improvedclonal planting stock of Eucalypts since 1992. Average
productivity of commercial eucalyptus clones is around 20to 25 m3 ha-1 yr-1 and many farmers have achieved recordgrowth rates of 50 m3 ha-1 yr-1 even under rain-fed conditions
making clonal Eucalyptus plantations an economicallyattractive land use option both for reforestation projects andagro forestry plantations (Lal, 2003).
Eucalyptus clones have been adopted by manyintegrated pulp and paper mills in India for promoting agro-forestry plantations around their mills. Current planting level
of clonal eucalypt plantations in India during 2010, mostlyunder agro-forestry system, is estimated to be around 55 to60 million plants covering 22000–24000 ha area annually.
Andhra Pradesh still leads in clonal eucalypt plantations.Wood based pulp and paper mills in Orissa, Karnataka,Tamil Nadu, Madhya Pradesh, Gujarat and Maharashtra
are also promoting clonal Eucalyptus plantations. PragatiBiotechnologies promotes clonal Eucalyptus and poplarplantations on large scale in the states of Punjab, Haryana,
Uttar Pradesh and Uttarakhand. Amongst the Governmentagencies, Andhra Pradesh Forest DevelopmentCorporation and Haryana Forest Department are followed
by a few other State Forest Departments in raising/promoting clonal eucalypt plantations.
In north India, clonal eucalyptus plantations are raised
under agroforestry system by farmers mostly for productionof timber and ply logs with rotation of 8-10 years. However,in south and central India, most farmers grow clonal
eucalypts for production of poles and pulpwood underagroforestry system combined with intercrops during firstyear as most of these plantations are rainfed. Even though
peak mean annual increment is not reached, most of these
Clonal Agroforestry Plantations in India

8
plantations are harvested prematurely at 4-5 years age.Farmers take one or two coppice crops from their eucalyptus
plantations.
Significant improvements in quality of produce andreduction in per unit production costs have also been
possible with the use of true to type, uniform and geneticallyimproved clonal planting stock. A series of successful clonaldemonstration plots, high genetic quality of clonal planting
stock, excellent technical extension services and buy backguarantees provided to farmers combined with bumperyields and high economic returns have been the key factors
leading to the success story of technology based clonaleucalypt plantations in many states of India. There is amplepotential for significant further growth because of growing
shortages of industrial round wood and pulpwood.
Other Species
Genetically superior and fast growing clones ofCasuarinas and Leucaena have also been developed and
deployed on a small scale. Genetically improved clonalplanting stock of Acacias has been developed and deployedby Mysore Paper Mills and West Coast paper Mills for the
high rainfall areas of Karnataka after selections fromnaturally occurring hybrids between Acacia mangium andA. auriculiformis (Lal, 2010) ICFRE institutes and some of
the State Forest Departments are in the process ofdeveloping and testing clones of many other importantcommonly planted species including teak (Tectona grandis),
shisham (Dalbergia sissoo), gamhar (Gmelina arborea),etc. Very high priority and greater focus are required forspeeding up such research so that we can test and deploy
superior clones of most of the important tree speciesamenable to cost effective vegetative propagation.
Research and Development Support
Very strong research and development support is
required for success of any large scale clonal plantationsprogramme. As all plants of each clone have same geneticmake up, there is utmost need to ensure wide genetic base
and diversity of deployed clones to guard against any futureepidemic insect pest or disease attack (Lal, 2007). Epidemicattack of hitherto unknown Leptocybe invasa wasp causing
serious problem of leaf galls on Eucalyptus nurseries andplantations since last few years is an example that hasnecessitated deployment of tolerant clones and biological
control measures through parasitoids. Some of theimportant areas requiring major R & D support oncontinuous basis are as follows:
• Sound breeding strategies for genetic improvement of
seed sources.
• Long term breeding support for development, testing
and deployment of new superior clones on continuous
basis.
• Improved silvicultural practices including matching of
most adapted clones to problematic soils,
management of soil fertility and nutrient deficiencies
on sustainable basis.
• Integrated management and control of root fungi and
leaf spot diseases and insect pests like eucalyptus
leaf gall wasp.
• Improving net returns from intercrops including testing
and development of shade tolerant crop varieties.
• Processing and utilization of short rotation farm grown
timbers including seasoning and preservative
treatment, etc.
It will be nice if ICAR, ICFRE, agricultural universitiesand wood based industries could join hands and pool theirresources for coordinated research initiatives to support
clonal plantations programmes.
Constraints Hampering Agroforestry Development
Even though very significant progress has been madeand agroforestry plantations are already providing bulk of
the industrial round wood to processing industries and fuelwood for the rural masses, our country has not been able toharness fully the tremendous potential of agroforestry. If we
can restore part of our degraded forest lands to highproductivity through technology based plantation and exploitfull potential of agro-forestry plantations, we can achieve
self sufficiency in timber and wood based products in duecourse and also realise our declared goal of 33 per centgood tree cover. Government should take innovative policy
initiatives to address major constraints listed below thathamper growth and development of agroforestry:
• Market uncertainties in respect of long term demand
and market prices of timber and absence of regulated
timber markets for transparent trading of farm grown
timber.
• Restrictive regime in respect of felling of farm grown
trees and cumbersome transit permits in many states.
• No system in place for registration of nurseries and
certification of forest seed and clonal planting stock.
• Inadequate focus on tree improvement, R & D support
and very poor extension services for agroforestry.
• Small fragmented land holdings and very low ceilings
on agricultural land holdings even for waste lands.
• Obsession with subsidized or low cost seedlings of
poor genetic quality making scarce land resources
under productive.
Piare Lal

9
• Unrestricted import of logs/timber and ban on export of
logs including farm grown timber.
• Restrictions on licensing new wood based industries
and expansion of existing units.
• Difficulties in getting long term bank loans and
insurance of plantations.
• Limited choice of profitable agroforestry models.
Policy Support for Development of Agroforestry
Large scale integrated development of agro-forestryplantations and wood based industries is a win-win situation
for all sections of society with following major benefits:
• Diversification of agriculture in many states.
• Domestic value addition through processing of farm
grown timber.
• Enhanced revenues from excise duty and tax on
processed wood products.
• Savings in foreign exchange otherwise required for
import of timber, pulp and other wood products.
• Generation of large scale employment opportunities
for the rural poor.
• Amelioration of environment and conservation of
biodiversity rich natural forests, etc.
Hence Central and State Governments must address
various constraints hampering growth of agroforestrythrough innovative policy changes. There is urgent need forreview of policies and rules that restrict growth of
agroforestry plantations Following suggestions are madefor the kind consideration of Central and State Governmentsfor holistic development of agroforestry, which will play key
role in securing future supplies of timber, industrial roundwood and fuel-wood for meeting our national needs andindustrial requirements on sustainable basis as well as
achieving the desirable goal of 33 per cent effective treecover in the country:
• Plan for promotion of integrated development of
agroforestry plantations and establishment of new
wood based industries and modernization/ expansion
of existing units.
• State Governments should free farm grown timber
species from hassles of securing felling permits and
timber transit permits in all states.
• Regulated timber market yards should be established
in major timber trading towns to promote transparent
trade in timber and prevent exploitation of growers.
• Strengthening of research and extension services
related to agroforestry development should be given
high priority by ICFRE, ICAR, Agricultural Universities
and wood based industries.
• Suitable arrangements should be made for registration
of nurseries and certification of planting stock and
genetically improved clones to prevent duping of
farmers by unscrupulous traders.
• Government should promote investments for
agroforestry development through innovative policies,
fiscal incentives and tax benefits.
• National Bank for Agriculture and Rural Development
and commercial banks should simplify procedures and
facilitate flow of long term credit for funding agroforestry
plantations.
• Agroforestry plantations enhance country’s tree cover
and make significant contributions to carbon
sequestration. Govt. should facilitate flow of
international funding support to farmers for these
carbon sinks.
• Government should consider liberalizing of ceilings on
agricultural land holdings at least for waste lands to
promote their reclamation for agroforestry plantations.
• Import of only specified species of hardwoods should
be permitted and export of value added wood products
including furniture made from farm grown timber
should be allowed.
• State Forest Departments should stop production and
supply of cheap subsidized seedlings of poor genetic
quality that make scarce land resources under-
productive.
Central and State Governments should consider thesesuggestions positively and initiate suitable action soonestpossible.
CONCLUSION
Just as the foundations of green revolution in
agriculture were laid by the new improved crop varieties,
genetically improved clonal planting stock has
revolutionized productivity and improved net returns very
significantly leading to growth and development of
agroforestry plantations. However, there is tremendous
scope for further growth of agroforestry if major constraints
still hampering same can be addressed. Implementation
of innovative policy changes and positive action on the
suggestions given above will go a long way for holistic
development of agroforestry plantations in our country with
major benefits to all sections of our society.
The only way to achieve our declared objective to have33 per cent good tree cover is through planned developmentof agroforestry plantations and restoration of degraded
Clonal Agroforestry Plantations in India

10
forest lands. Otherwise, this will remain an unfulfilled dreamon paper and we will continue to be burdened with huge
foreign exchange outflow on import of timber and woodbased products year after year. Subtropical to tropical warmclimate, ample sunshine, good land and water resources,
large labour force and scientific community endow ourcountry with the comparative advantage in timber andbiomass production. Therefore, we should speed up all
those measures that will facilitate exploitation of our fullpotential in this area and achieve self sufficiency in timberand wood based products soonest possible. That will also
give our country tremendous benefits of ecological andenvironmental amelioration with excellent tree cover.
REFERENCES Anonymous. (2009) India State of Forest Report, 2009. Forest
Survey of India. (Ministry of Environment & Forests,Government of India) Dehradun.
Jones, N. and Lal, P. (1989) Commercial Poplar Planting in Indiaunder Agro-forestry System. Commonwealth For.Rev. 68(1):19-26.
Midgley Stephen., Lal, P., Bhojvaid, P. and Brown, A. (2007) A strategy
for developing market opportunities for Australian forest
products in India. Report submitted to the Forest Industries
Branch, Department of Agriculture, Fisheries and Forestry,
Govt. of Australia. Salwood Asia Pacific Pty Ltd. Farrer ACT
2607, Australia.
Lal, P. (1991) Improved package of practices for poplars under
agroforestry. Indian For. 117(3): 168-177.
Lal, P. (2001) Private sector forestry research: a success story
from India. Bois Et Forets Des Tropiques 267(1) : 33-48.
Lal, P. (2003) Clonal eucalyptus plantations in India. In: Eucalypts in
Asia. Ed. J.W.Turnbull, Proceedings of an internationalconference held at Zhanjiang, China from April 7 to 11, 2003,
ACIAR Proceedings No.111,Canberra.
Lal, P. (2006) Licensing of wood based Industries- Why punish
farmers greening the country? Letter to the Honorary Editor.
Indian For. 132(8):1071-1074.
Lal, P. (2007) R & D Priorities for clonal eucalyptus plantations.
Indian For. 133(12) :1581-1589.
Lal, P. (2010) Clonal forestry in India. Indian For. 136(1) :17-37.
Piare Lal

11
Development of Poplar Based Agroforestry System
J.P. Chandra306, Awas Vikas, Rudrapur-263 153 Uttrakhand (India)
E-mail: [email protected]
Abstract: Uttar Pradesh Forest Department started research work on poplars in 1950, by importing fast growing clones from Europe andChina. As clones imported were from higher latitude, they did not perform well in foot hills and tarai, where, deep, fertile and irrigated siteswere available for its cultivation. Success in agroforestry was achieved by introducing Australian clones of American origin. Farmersadopted it as commercial crop due to its fast growth, deciduous nature, clean and straight bole, etc. Removal of restriction on felling andtransport by State Governments encouraged farmers to adopt poplar on large scale. Development of local markets and higher demand byindustries, helped poplar cultivation in yielding much higher return than field crop. Poplar cultivation activity has generated huge employmentin rural sector and has over all improved rural economy. As such, it is going to stay and expand. To maintain better and higher productionof poplar wood, selection of new clones is necessary. Key of success of agroforestry programme is source identified planting materialat proper time of proper site.
Key Words: Poplar, Agroforestry, Adoption, Productivity, Employment.
Indian J. Ecol. (2011) 38 (Special Issue) : 11-14Indian Journal
of Ecology
In human life wood has significant place and it hasspecial importance from time immemorial. Today, when
science has made available iron, cement, plastic,petroleum products and fossil fuels as alternatives of wood,even then, there is no reduction in wood consumption.
Rather it is increasing day by day. Many new uses of woodhave emerged with development of civilization. Availabilityof fossil fuels is expected to reduce gradually, but, in case
of wood, continuous production and availability is possible.Present days problem is that, land for wood production isgetting reduced day by day, mainly due to pressure of
population. It is expected, that for a long time wide gapbetween supply and demand of wood will continue, as such,it is essential that maximum wood is produced out of
available sites. It is also necessary that, fast growing treespecies are grown even on lands outside forests. So far,farmers have accepted two tree species, mainly eucalyptus
and poplars for field planting. But, poor eucalyptus hassuffered badly due to unwanted and unscientific propagandaagainst it. Luckily poplars have escaped such bad
propaganda and hence there are enormous possibilitiesfor its cultivation on large scale.
Poplar grows fast and its improved clones become
harvestable in less than eight years time. Being a deciduoustree, it suits most for agro-forestry. In addition, it acts assaving bank for farmer in which interest is added every year
and can be encashed whenever required. Consideringthese qualities, Uttar Pradesh Forest Department startedconducting research work on poplar cultivation immediately
after independence. After 1965, poplar plantations wereraised on forest lands of Tarai and after 1980, farmers ofTarai adopted it. During last 33 years, poplar planting activity
on private land expanded extensively and apart from Tarai,vast area of plains of Punjab, Haryana and Uttar Pradesh
were brought under poplar plantation. In U.P., during 1950,poplar clones were imported from Europe. Another importwas done during 1960 again from Europe, But, all of them
failed to perform well mainly due to higher temperature andseasonal rainfall in the locality. Success of poplar cultivationwas achieved when clones of American poplars which were
from warm locations and were adopted in Austraila andSouth Africa were imported. Subsequently, clones developedby Dr. D.T. Cooper at Stoneville (USA) helped a lot on account
of their fast growth and hardy nature. Dr. L.D. Pryor fromAustralia helped us by supplying planting material of clonesdeveloped at Grafton. His rust resistant clones failed in
India, but, two clones namely G-3 and G-48 which performedpoorer than Italian clones at Tumut (Australia) became backbone of poplar cultivation in India.
Nursery and cultivation practices of poplars wereperfected by Sri D. N. Lohani in late seventies of last centurywhen he was working as Conservator of Forests, R&D of
Uttar Pradesh Forest Department. Selection of local clonesstarted during 1982, when Sri A. N. Chaturvedi was CF, R &D and later Dr. Pratap Singh, Entomologist, FRI, Dehradun
observed flowering of poplars in Gadgadia block of TaraiCentral Forest Division, Haldwani. Out of 1982 seedlingpopulation, many good clones were developed ; Udai,
Kranti,Bahar, L-34 and L-49 are outstanding products ofthat population, one clone ( L-30), which was outstandingfor sawn wood is not seen now, trunk of L-30 was more
close to a square than a circle, there by producing higherswan wood than other clones. Today, we have clones, whichproduce twice than what earlier clones were yielding.

12
Hybrids of G-3 and St-121(D-121) are prominent in themand ranked 1 & 2 for higher productivity.
Planting Material
Planting material of poplar is of great significance inraising plantations. Only source identified planting materialshould be used. This is because, poplars are raised
clonally and there are several thousand clones in cultivation.They are site specific and locality specific. Their wooddensity is also variable. They are specific to particular day
length of light and temperature. It is not easy to identify aclone at nursery stage, unless, one inspects them almostdaily and records their characters. Moreover, juvenile growth
cannot be taken as an indicator for field performance. InIndia, we plant entire transplant with some roots. Growth ofnursery plants depends much on fertility of nursery and soil
working. Very tall plants are undesirable for warmer climatelike ours. Because, they take long time to sprout andgenerally sprout from bottom. The apical bud of nursery
plants is highly cutinised, as such, it opens only when,suitable temperature is there to melt wax. Hence, it isadvocated to remove apical 30-40 cm length of nursery
plant over a healthy bud prior to planting out, by giving cleancircular cut. Circular cut has advantage of minimum cutsurface and smaller area for healing. A plant between 3 to
4m in height is the best plant to plant out. The height -diameter ratio at collar point be closest to 100, i.e., thediameter should be between 3 to 4 cm corresponding to
height. Long distance transport and exposure to sun beavoided. It is better to plant out within 48 hours of uprootingfrom nursery and prior to planting out, plant may be emersed
in fresh, clean and cold water (if possible in running water)for 12 to 24 hours, so that, whole body of plant is fullyenriched with moisture. In planting out, care must be taken
that plant stands at right angle to field and is well compacted,so that, it does not lean due to heavy irrigation/rainfall/wind.Plant which leans, never reaches to rotation age.
Rejuvenation
Since poplars are planted clonally that too by rootage,influence of stionic effect degenerates planting materialconsiderably. Any clone remains in commercial cultivation
till it is replaced by better growing and hardy clone or invadedby pests, as such, to obtain vigorous and upright plantingmaterial regularly, it is necessary to rejuvenate planting
material after every 3 to 4 years. In fact, for a commercialnursery, this activity is continuous, so that, quality plantingmaterial is available regularly. The vigrous planting material
is obtained either from roots or water shoots. It is followedby co-leaders. Side branches should never be used for
nursery productions, because, they are physiologically olderthan one year and have poor apical dominance. Because
poplar is strong light demander, suppression once set in,lasts forever. Cuttings of same size (length and thickness)be planted in the same bed, so that, during nursery life
influence of side shade is avoided. Dipping of cuttings for24 h in cold and fresh water helps in uniform, early andbetter sprouting. Moreover, planting density influences plant
height, thickness and taper, which are directly responsiblefor survival and growth.
Intercropping
Agroforestry plays a vital role in improving rural economy
by increasing per unit area production and generating ruralemployment for unskilled and semiskilled persons.Moreover, trees grown, act as saving bank for farmers. For
intercropping with poplars, density of plantation is veryimportant. Wider spacing permits enough sunlight for cropproduction and provide space for proper soil working. It is
worthwhile to mention here that poplar responds more todeep and frequent soil working than application of plantnutrients. It is a surface feeder, as such, does not like weeds
around it. At the same time, root of poplar need lot of oxygenfor better development. Generally poplar is planted at 5m x4m, 5m x 5m, 7m x 3.5m, 8x2.5m spacing, which permit
tractor working.
Sugarcane is the best associate of poplar during first
two years of its age, because of deep soil working, fertilizer
application and frequent summer irrigation followed by soil
working. Moreover, coverage by sugarcane of lower 3 to 4 m
plant height avoids branches on lower portion of stem.
During third year (2nd ratoon), production of sugarcane
drops due to shade caused by poplar. Paddy is most
unsuitable crop with poplar as it cuts oxygen movement in
the soil, at the same time, due to excessive moisture, root
development is poor in poplars resulting into leaning and
uprooting of trees. Shade of poplar induces tendency of
false grains in paddy, thereby, poor grain yield. Onion and
garlic are also bad associates of poplar, because, they are
prone to cercospora blight, which spreads on older leaves
of poplar quickly. Crops which can be produced along with
poplar till the end of rotation are wheat, pipli, cape
gooseberry, strawberry, turmeric, ginger, pitchauli, black
gram, green gram, rape seed, lentil, coriander, tomato,
cabbage, radish, sugar-beat, elephant foot, spinach, celery,
brinjal, potato, fenugreek, knoll-khol, turnip, etc. Some crops
like sweet pea, chilly, berseem, chickpea and gram can be
grown with poplar for 4 years. Maize, mentha, sorgham and
soyabean can be grown only during initial two years.
J.P. Chandra

13
Intercropping does not only hold good for improvingincome from agricultural crops, but, it is quite beneficial to
the poplar plants. Improved aeration from frequent soilworking for agricultural crops and inputs, like irrigation,fertilizer application and soil working are beneficial to trees.
Thus, poplar plantation with intercrops have better growththan those without intercrop. A study conducted by Gill andSingh (2007) on intercropping of medicinal plants at PAU,
Ludhiana during the years 2004-2006 indicated that herbyield of mentha reduced drastically under two years oldpoplar plantation. In 2 years old poplar, the yield reduction
of lemongrass and marigold was minimum i.e. 6.5 and 7.5per cent, respectively. They further observed that underpoplar, turmeric be planted around 20th May, which yields
higher than earlier planting. At the same time, ridge plantingof it yielded better than flat planting. It also responded toclose planting and farmyard manure application. Singh
(1998) recorded that bhindi, lobia, palak, methi, dhaniya,cucumbers, muli, gajar, aloo, mirch, baigan, tamatar,sakarkand, matar, foolgobhi, patgobhi, adark and haldi can
be cultivated during first two years of plantation age with 8to 18 per cent reduction in yield. Tiwari (2002) advocatedwider spacing of poplars to have better yield from intercrops.
He advocated regular pruning of poplar trees and selectionof shade loving crops like frenchbean, bhindi, adrak, haldi,jamikand, patgobhi, foolgobhi, aloo and tomato. He further
advocated line planting at 10m x 4m spacing on east-westdirection and keeping lower half bole of tree clean duringtwo to three years age, after which, two third of lower bole
be maintained branch free.
Influence of locality
Latitute influences height growth of poplar treessignificantly. In our country, height of trees at Amritsar and
Gurdaspur districts of Punjab, which are located above300 N reaches to 36-37m thereby, producing more volumeper tree. At Yamunangar and Ambala of Haryana and
adjoining locations of Uttar Pradesh, which are locatedaround 29 0N latitude, the height growth of poplar treesremains around 30-32m. Whereas at Rudrapur, Rampur
and Bijnor area of Uttar Pradesh, the tree height declinesto 28 to 30m. These places are located at 28 0N latitude.Places which are at 27 0N latitude, height of tree restricts
to 25 to 27m and out turn is lower. Hence, trees ofLakhimpur-Kheri, Sitapur, Badaun etc fetch much lowerprice than of Punjab and Haryana. It is not only higher
taper which reduce yield but, presence of more brancheson the stem makes timber inferior.
Temperature is another important factor. It was noticed
that American clones which are originally from warmer
locations remain leafless for much shorter duration thanEuropean clones. Temperature and light govern phenology
of poplar trees. Temperature above 35 0C is infurious topoplars and higher temperature than 40 0C for prolongedperiod develops cracks on southern and western aspect of
bark. This further develops cankar and bacterial infectionresulting into decay of stem. Temperature between 15 & 250C is most suitable for growth of poplars. Apart from these,
the tree is very sensitive to light. This tendency is right fromseed germination stage. At warmer and relatively frost freelocation, period of dormancy of poplar trees reduces
drastically. Even artificial light also helps to retain leaves forlonger duration.
Employment Generation
Bist and Panse (2008) conducted detailed study on
employment potential of agroforestry at Yamunanagar(Haryana), which has emerged as largest market for woodproduced by farmers under agroforestry. Apart from Haryana,
this market attracts wood from Punjab, Himachal Pradesh,Uttarakhand and Uttar Pradesh. For the year 2003, theyrecorded average daily arrival of wood 1000 loads (96 %
trolleys, 3.5 % trucks and 0.5 % carts) containing 75,00tonnes of wood with a value of Rs 12.5 million. They recorded796 agroforestry based units at Yamunanagar, engaging
4,075 persons per day. In addition, 671 industries subsidiaryto agroforestry providing employment to 6068 persons perday. It is estimated that around 2000 persons are daily
engaged in felling of trees in command area ofYamunanagar market. Overall, it was estimated that woodbased industries of Yamunanagar generate about 35
million mandays work yielding Rs 3,000 million every year.Farmers engaged in growing of trees are not covered inthis study. Earlier Chandra (2001) estimated that in 8 years,
production of one tree on farm land generates half a mandays work. Roughly 10m saplings are planted by North Indiafarmers every year, generating 5m mandays work each year.
Price Factor
It is most important factor to encourage poplar as agro-
forestry tree. To start with in early eighties the price assured
was Rs 150/- per tree of 30 cm DBH. This was promised for
saplings planted during 1984-85 i.e. trees to be harvested
after 1990. During this period plywood factories of Eastern
hills were closed due to ban on felling of natural forests.
This forced establishment of plywood units in indo-gangatic
plains and development of markets for poplar. Shortage of
raw material created price competition and plywood started
consuming almost 90 per cent poplars planted under
agroforestry system. The average price of poplar wood
Poplar Based Agroforestry System

14
during last 25 years ranged as under:
Table 1. Prices of poplar
Year of harvesting Price per m3 of logs (Rs)
1986 760
1990 24001994 3600
1998 4300
2002 15002004 5000
2008 6500
2010 7600
There was a dip in cost of poplar wood due to severalconditions created by farmers as well as industries, thisreduced planting of saplings for 2-3 years resulting poor
production and higher price. Now, several medium sectorindustries for plywood and medium density fiber board arein the market, which has stabilized wood price during last
3-4 years. Present day situation is that, farmers are gettingapproximately Rs 85,000 to 90,000 per ha per annum frompoplar trees. Since no agricultural crop yields this much,
hence, poplar is the first choice of farmers of Indo-gangeticplains. As sale of this tree is quite easy i.e. standing treescan be sold, logs can be disposed by volume as well as by
weight at the site itself and at any time. Hence, farmers feelcomfortable with this tree.
Keep Poplar Vibrant
Considering immense benefits and scope of this
species in contributing to eradication of wood shortage,the poplar based agroforestry system should be kept aliveand vibrant. Poplar cultivation depends on clonal
propagules capable to produce trees of desired form andgrowth performance. However, clonal cultivation andparticularly mono-clonal cultivation invites risks of pests. It
is therefore necessary that new clones are continuouslyselected and tested to replace the old one.
To ensure the productive continuity of poplars, breeding
new clones is a must. The superior performing new clonesbe selected on the basis of growth rate, desirable tree form,rootability of cuttings and disease resistance. Till 1999,
following indigenous half sib clones of G-48 were testedfor seven years and most of them performed better thancommercial clone of the day i.e., G-48.
Table 2.Testing of new clones.
Clone Ht (m) Mean DBH (cm) Mean Total volume(SD) CV (%) (SD) CV (%) (ob) m 3/tree
G-48 27.0(2.9)11 25.7(3.8)15 0.500
WSL-64 27.8(1.5)05 25.6(4.5)18 0.510
WSL-68 27.4(1.3)05 26.1(4.8)19 0.520
WSL-78 28.4(2.2008 25.9(5.2)20 0.530
WSL-24 27.0(2.7)10 26.6(2.4)09 0.534
WSL-54 27.1(1.6)06 27.0(4.5)17 0.550
WSL-37 25.6(1.0)04 27.8(3.8)13 0.552
WSL-1 27.8(1.1)04 27.6(2.1)08 0.589
WSL-28 27.9(1.5)06 28.5(2.9)10 0.598
WSL-26 26.0(1.2)05 29.0(4.1)14 0.600
WSL-39 24.5(2.4)10 31.4(5.4)17 0.667
WSL-49 27.4(1.6)06 30.6(2.9)10 0.700
WSL-22 30.2(2.0)06 29.0(4.0)14 0.700
WSL-27 30.9(3.0)10 29.0(1.5)05 0.716
WSL-32 31.9(1.1)03 31.9(2.8)09 0.887
All the 14 clones performed better than G-48, whichwas commercial and mother clone. Clones selected ongrowth and form need testing for rootability of cuttings, pest
resistance and locality trails, so that, farmers are able to getbetter clone in future and continue to grow poplars to enrichtheir economy and solve problem of shortage of wood inthe country.
REFERENCES
Bist, N.S. and Panse, S.S. (2008) Employment potential of agrorestry:A case study from Yamunangar, Haryana. Ind. J. Agrofor.10(1):19-23.
Chandra,J.P.(1998) Poplar Se Mera Parichay. Proc. of workshop onSamajik Vanikaran Aur Gramya Vikas me Poplar Ka Yogdan.G.K.,V.S.Haldwani, pp 9-14,
Chandra,J.P.(2001) Scope of poplar cultivation. Indian For.127(1):51-59.
Gill, B.S. and Singh, A. (2007) Studies on intercropping of medicinal,aromatic and spice crops in farm forestry (Poplar). AnnualReport, Deptt. of Agronomy, Agromet. and Forestry, PAU,Ludhiana.
Singh, N. (1998) Poplar Ke Beech Udyan Faslen. Proc.of Workshipon Samajik Vanikaran Aur Gramya Vikas me Poplar Ka Yogdan.G.K.V.S. Haldwani. pp 33-38.
Tiwari, S.(2002) Baybharik Poplar Utpadan. Publication Division ofG.B. Pant University of Agriculture & Technology, Pantnagar.
J.P. Chandra

15
Global warming and associated climate change is animportant environmental issue that has captured theworld’s attention during the recent past. Among the Green
House Gases(GHGs) contributing to global warming, CO2
is believed to be the most prominent one (Lorenz and Lal,2010) accounting for 60% of the total greenhouse effect.
The mitigation of global warming entails reducing theatmospheric concentrations of GHGs, particularly CO2. Oneof the approaches for reducing CO2 concentration in the
atmosphere is carbon (C) sequestration, the process ofremoving C from the atmosphere and depositing it in areservoir. In response to this reality, many countries have
initiated massive AR programmes (afforestation-reforestation programmes) as part of CDM mechanisms tomitigate climate change. In this scenario, tropical fast
growing multipurpose trees (MPTs) assume greaterimportance on account of their enormous potential toproduce biomass and sequester atmospheric C (Kumar,
2003). Moreover, forest biomass can be used for energypurposes and thereby reduce the use of fossil fuel or cansubstitute for other materials such as aluminium or steel
constructions whose production consume large quantitiesof fossil fuels.Finally, increasing the standing stock of forestbiomass in many ecosystems may give several
environmental benefits other than carbon sequestration.
Despite the growing concerns over the climate changeand related issue and the role of trees in mitigating it, limited
data is available on biomass and carbon sequestrationpotential of tropical fast growing multipurpose trees (MPTs)especially in the South Gujarat condition. Many of these
Short Rotation Forestry as a Viable Option for GHG Mitigation
Sreedevi Madhusudanan*, N. S. Patil, Suman Jha and S. Aneesh1
Aspee College of Horticulture and Forestry, Navsari Agricultural University, Navsari1College of Forestry, Kerala Agricultural University, Kerala
*E-mail: [email protected]
Abstract: Global warming and associated Climate change is an important environmental issue that has captured the world’s attentionduring the recent past. The mitigation of global warming entails reducing the atmospheric concentrations of GHGs, particularly the CO2. TheLand Use, Land Use Change and Forestry (LULUCF), an approach that became popular in the context of the Kyoto Protocol to the UnitedNations Framework Convention on Climate Change (UNFCCC) allows the use of C sequestration through afforestation and reforestationas a form of GHG-offset activities. Tropical fast growing MPTs in this regard assume greater importance on account of their enormouspotential to produce biomass and sequester atmospheric C. An investigation was conducted to evaluate biomass production and carbonsequestration potential of four fast growing multipurpose tree species viz, Albizia procera, Casuarina equisetifolia, Eucalyptus tereticornisand Gmelina arborea at 20 years stand age. Above ground C sequestration potential, of the four MPTs studied showed wide variation.Among the four species studied, A. procera and Casuarina equisetifolia recorded higher C sequestration potential, which was 189.93Mg/ha and 185.85 Mg/ha, respectively. Except Gmelina all the tree species recorded high C sequestration, which is comparable to the earlierrecorded values for tropical forests. Enhanced soil-C storage (0-30 cm) was also found under trees compared to treeless open.
Key Words: SRF, Carbon sequestration, Casuarina, Gmelina, Albizia, Eucalyptus
tree species play significant role in tropical agroforestrysystems. In this context, a field study was taken up with theprimary objective of assessing and comparing the
aboveground biomass and C-sequestration potential ofselected fast growing tree species and to develop allometricequation linking biomass with measurable growth
variables. The extent of soil C-sequestration contributed byvarious MPTs was also evaluated.
MATERIAL AND METHODS
The present investigation was conducted during August
2008 to March 2010 at the Instructional farm, ASPEE Collegeof Horticulture and Forestry, Navsari Agricultural University,Navsari, situated at an altitude of about 12 meters above
mean sea level, at 200– 58’ North latitude and 720-54’ Eastlongitude. The site experience typical tropical climatecharacterized by hot summer, moderately cold winter and
humid warm monsoon with an average annual rainfall of1,355 mm, the bulk of which is received from second weekof June to first week of October. The soil type of the
experimental site was placed under Jabalpur series havinggreat group chromuster, sub order upstart and order vertisolas per seventh approximation. The soil is clay in texture
(63% clay), high moisture retention capacity (40.50%), andlow in organic carbon content (0.26%), medium in availablephosphorus (30.39%) and nitrogen content (110.12 kg
ha-1). There was no problem of sodicity as pH (7.86) andEC (1.75 dSm-1) were below the critical limit. The studyinvolved the assessment of biomass and carbon
sequestration potential in the above ground components
Indian J. Ecol. (2011) 38 (Special Issue) : 15-19Indian Journal
of Ecology

16
of four multipurpose tree species (MPTs) of 20- year-standage viz., Casuarina equisetifolia, Eucalyptus tereticornis,
Gmelina arborea and Albizia procera. The trees wereestablished at 2.5x 2.5 m spacing in a randomized blockdesign with four replications.
Estimation of Tree Biomass
For estimating the aboveground biomass and Csequestration, 12 trees were destructively sampled fromeach tree species such that there were three trees from
each replication (3x4=12). After recording the total heightand diameter at breast height, the trees were felled at groundlevel by using power saw. The bole length and total length
were recorded and the aboveground portions wereseparated into stemwood, branchwood, twigs and foliage.Fresh weight of the entire tree component was separately
recorded immediately after felling using spring balance.Representative foliage, twigs, branch wood and stemwoodsamples of each species were collected for moisture
estimation. The samples were immediately transferred tothe laboratory in double-sealed polythene bags. Afterrecording the fresh weights, they were dried to constant
weights at 700C. Estimates of dry weight of different biomasswere obtained from the fresh weights of various treecomponents (stem disc, branches, twigs and leaves) and
their corresponding moisture contents worked out. Theaverage oven dry biomass of component parts weresummed to obtain the total aboveground biomass per tree.
It was then multiplied by the number of trees per hectareand converted to aboveground biomass on hectare basis.For assessment of the effective number of trees per ha, the
actual number per plot (average of 4 plots) were extrapolatedto get number of trees per ha.
Carbon sequestrated per tree is assessed by
considering 50 per cent dry weight as reasonable limit ofelemental carbon content. This was also computed onhectare basis as mentioned before. For estimating the
sequestered soil carbon, the soil organic carbon wasanalyzed following wet digestion method (Jackson, 1958).Triplicate soil samples were collected from 0-30cm soil
depth for carbon estimation.Soil bulk density was estimatedseparately for the above soil depth after removing the gravels.Soil mass at 0-30 cm soil depth was computed from the
corresponding bulk density and soil C-sequestration wascalculated for the soil depth by multiplying soil mass withsoil organic C-content (%). Saha et al. (2010) was followed
to calculate C storage on ha basis.
The biomass and volume data obtained from all thesampled trees were pooled and used to develop the
allometric equations. Simple linear and quadratic equations
were developed for predicting the total abovegroundbiomass and total mean tree volume using tree height and
dbh as predictor variables.
The experimental data were subjected to the statisticalanalysis by using variance technique. The method of
analysis of variance for RBD (Randomized Block Design)was used. The treatment differences were tested by ‘F’ testof significance based on null hypothesis. The appropriate
standard error (S.Em.±) was calculated in each case andcritical difference (C.D) at 5 per cent level of probability wasworked out to compare the treatment means, where the
treatment effects were significant.
RESULTS AND DISCUSSION
Above Ground Biomass
Biomass accumulation is primarily a speciesdependent factor which may be influenced by factors like
growth habit, density, age of tree and environmentalcondition in which tree is grown (Landsberg et al., 1995).The data (Table 1) revealed that the mean tree aboveground
biomass and stand biomass per hectare was highest forAlbizia procera (339.16 kg and 379.86 Mgha-1), which wasat par with Casuarina equisetifolia (331.81 kg and 371.70
Mgha-1) followed by Eucalyptus tereticornis (204.23 kg and228.73Mgha-1).Gmelina arborea invariably recorded theleast aboveground biomass both on per tree basis and
stand basis (34.37 Kg and 38.49Mgha-1). All the threespecies produced fairly high above ground biomass at 20years of stand age compared to reports from elsewhere.
For instance, Rai et al. (2009) in a similar study at Jhansireported that out of the eight tree species, highest biomassproduction was for Albizia procera (99.91 Mg ha-1) followed
by Eucalyptus tereticornis (87.74 Mg ha-1). Reports atyounger stand ages also recorded higher biomassaccretion rates for Albizia procera. Chadurvedi and Das
(2002) reported higher aboveground biomass (57.4 kg/tree)for A. procera at 5 years of stand age among the 8 MPTstested at north Bihar.
Table1. Above ground biomass of a 20-year-old MPTs
Species Mean tree Total aboveground
biomass biomass
(kg) (Mg ha-1)
Albizia procera 339.16a 379.86a
Casuarina equisetifolia 331.81a 371.70a
Eucalyptus tereticornis 204.23b 228.73b
Gmelina arborea 34.37c 38.49c
Mean 227.405 254.69
LSD at 1% 88.72 99.37
CV % 24.39 24.39
Sreedevi Madhusudanan, N.S.Patil, Suman Jha and S. Aneesh

17
Carbon Sequestration Potential of MPTS
The present study also shows the enormous carbonsequestration potential of the MPTs under study. High carbon
sequestration potential is an important consideration in alltropical tree planting programmes. This is particularlysignificant in view of the rising CO2 levels and the growing
need to sequester it. The carbon storage is intricately linkedwith site quality, nature of land use, choice of species,silvicultural and other crop management practices adopted
(Swamy et al., 2003). Present study (Table 2) showed ahigh carbon sequestration by Albizia procera, Casuarinaequisetifolia and Eucalyptus tereticornis (189.93Mg ha-1,
185.85 Mg ha-1, 114.36 Mg ha-1 respectively). This is inconformity with the earlier recorded values for tropicalforests, which varies from 132-174 Mg ha-1(Dixon et al.,1994). Lugo et al. (1990) reported carbon storage for 5-16year Eucalyptus plantation to the tune of 4.5-14 Mg C ha-1
yr-1. Gmelina arborea recorded minimum carbon
sequestration both at mean tree (17.184 kg) and per hectarebasis (19.25Mg ha-1). Lower carbon concentration ofGmelina in the present study can be attributable to poor
site-species suitability. Similar results were reported by Puriet al. (2002), where lower carbon concentration in Gmelinaarborea stand is attributed to poor site quality and low soil
nutrient status.
Soil C-Sequestration
While reforestation and afforestation are beingconsidered as mechanisms to reduce C emission penalties
(UNFCCC 1997), it is important to recognize that, from asoil C sequestration standpoint, tree species differ in theireffects. The total amount of soil organic carbon (SOC) within
30 cm soil profile varied significantly among differenttreatments (Table 3). It was highest under Casuarinaequisetifolia followed by Albizia procera, Eucalyptustereticornis and Gmelina arborea, while lowest under opencondition. In the absence of a time-sequence study involvinglong time intervals, the C stock data were considered as an
indicator of the carbon sequestration potential of thesystems. Present study revealed greater carbon
sequestration potential by N-fixers to non N-fixing trees.Resh et al. (2002) had also reported a higher soil carbon
sequestration under N- fixing trees compared to Eucalyptusspecies.
It is only natural that soil under multipurpose trees
characterized by high amounts of litterfall and root activitycontain higher SOC compared to an open land. Incorporationof trees into treeless systems is reported to increase the
belowground C stock in a number of situations; for example,a study in Karnal (India) indicated that raising tree on alkalisoil increased SOC from 0.12 per cent to a maximum of
0.58% in 20 years (Singh and Singh, 1993).
Allometric Equation
Biomass prediction models are considered to be anon-destructive method for the estimation of biomass of
tree stands. Since total estimation of the tree stand is usuallyimpracticable, the biomass estimation from easilymeasurable tree growth variables is commonly used for
prediction. Allometric relationships attempted in the presentstudy linking above ground tree biomass with DBH and/ortotal height of the trees gave reasonably good predictions
(Fig. 1).
The results reveal that dbh alone as independentvariable explained a very high proportion of the variation in
biomass. Including height as independent variable did notresult to a much better explanation of the variation inbiomass. Although there was little improvement in the
performance of the model by including height data in themodel, the improvement was marginal. Considering thehuge time invested in obtaining height data in the field, the
associated measurement error and the fact that theinclusion of height did not significantly improve theperformance of the model, the inclusion of height data in
biomass models in the study area is of little significance.Several researchers have concluded that tree biomass isprimarily a function of dbh and is relatively insensitive to
Table 2. Carbon sequestration potential of 20-year-old MPTs
Species Mean tree (kg) Per ha (Mg ha-1)
Albizia procera 169.58a 189.93a
Casuarina equisetifolia 165.94a 185.85a
Eucalyptus tereticornis 102.10b 114.36b
Gmelinaarborea 17.19c 19.25c
Mean 113.70 127.35
LSD at 1% 44.36 49.68
CV % 24.39 24.39
Table 3. Soil carbon sequestration contribution by 20-year-oldMPTs
Species Organic Soil organic
carbon (%) carbon (Mg ha-1)
Albizia procera 1.35b 54.87b
Casuarina equisetifolia 1.79a 69.54a
Eucalyptus tereticornis 1.12c 41.69c
Gmelina arborea 0.68d 29.85d
Control 0.46e 21.87e
Mean 1.07 43.56
LSD at 1% 0.031 0.844
CV % 1.9 1.26
Short Rotation Forestry for Green House Gases Mitigation

18
tree height and consequently have incorporated only dbhas independent variable in their biomass models (Rapp etal., 1999 and Kadeba, 1991).
The results of the present study enhance ourknowledge on species selection for reforestation and
afforestation in South Gujarat and in other regions withsimilar ecological features.Moreover, such informationhelped to attain more clarity on the functional role of tropical
plantations in respect of diverse economic, social andecological functions that may ultimately help reduceatmospheric CO2 accumulation. Among the 4 MPTs
Casuarina and Albizia were found to sequester morecarbon in the biomass. Present study explicitly revealed
that trees can substantially improve soil C sequestration inwooded systems.
REFERENCESChadurvedi, O.P. and Das, D.K. (2002) Studies on rooting pattern of
five year old important agroforestry tree species in North Bihar,India. Forests, Trees and Livelihood 12:329-339.
Dixon, R.K., Brown, S., Houghton, R.A., Soloman, A.M., Trexler,M.C. and Wisniewski, J. (1994) Carbon pools and flux of globalforest ecosystems. Science 263: 185–190.
Jackson, M.L. (1958) Soil Chemical Analysis. Asia publishing House,New Delhi, India. pp. 498.
Kadeba, O. (1991) Above-ground biomass production and nutrientaccumulation in an age sequence of Pinus caribaea stands.For. Ecol. Manag. 41:237–48.
Fig. 1. Prediction models for Total aboveground biomass of Albizia procera, Casuarina equisetifolia, Eucalyptus tereticornisandGmelina arborea at 20-year-old stand
Sreedevi Madhusudanan, N.S.Patil, Suman Jha and S. Aneesh

19
Kumar, B.M. (2003) Impact of climate change on Indian agriculturaland natural resources scenarios. Workshop Proceedings onNatural Resource Management: Changing Scenarios andShifting Paradigms. Kerala Agricultural University Thrissur(February 21-24, 2003), pp. 66-76.
Landsberg, J.J., Linder, S. and Mc Murtrie, R.E. (1995) Effects ofglobal change on managed forests. A strategic plan forresearch on managed forest ecosystems in a globally changingenvironment. Global Change and Terrestrial Ecosystems. CoreProject of the IGBP, Canberra, pp: 1-17.
Lorenz, K. and Lal, R. (2010) Carbon Sequestration in ForestEcosystems. Springer, Dordrecht, The Netherlands.
Lugo, A., Wang, D. and Bormann, H. (1990) A comparative analysisof biomass production in five tree species. For. Ecol. Manag.31: 153-166.
Puri, S., Swamy, S.L. and Jaiswal, A.K. (2002) Evaluation of Populusdeltoides clones under nursery, field and agriculture systemin sub-tropics of Central India. New Forests. 23:45-61.
Rai, P., Ajit, P.O., Chaturvedi, R., Singh and Singh, U.P. (2009) Biomassproduction in multipurpose tree species in natural grasslandunder semiarid condition. J. Trop. For. 25:11-17.
Rapp, M., Regina, I.S., Rico, M. and Gallego, H.A. (1999) Biomass,
nutrient content, litter fall and nutrient return to the soil inMediterranean oak forests. For. Ecol. Manag. 119: 39-49.
Resh, S.C., Binkley, D. and Parrotta, J.A. (2002) Greater soil carbonsequestration under nitrogen-fixing trees compared withEucalyptus species. Ecosystems 5(3): 217-231.
Saha, S., Nair, P. K. R., Nair, V. D. and Kumar, B.M. (2010) Carbonstorage in relation to soil size-fractions under some tropicaltree-based land-use systems. Plant and Soil 328: 433–446.
Singh, G. and Singh, N.T. (1993) Mesquite for vegetation of Salt-affected Soils Central Soil Salinity Research Institute, Karnal.(Research Bulletin No.18).
Singh, R.S., Thakur, T. and Prajapati (2006) Growth and biomassproduction in chrono sequence of MPTs in pure and mixedplantations in limestone overburden of Chattisgarh. Environ.and Ecol. 245(special): 147-151.
Swamy, S.L., Mishra, Y.A. and Puri, S. (2003) Biomass productionand root distribution of Gmelina arborea under anagrisilviculture system in sub humid tropics of Central India.New Forests. 26: 167–186.
UNFCCC (1997) Report on Conference of the Parties, Third Session,(1997) Kyoto Protocol to the United Nations FrameworkConvention on Climate Change.
Short Rotation Forestry for Green House Gases Mitigation

Agroforestry is an age-old practice. Trees and shrubsare important in the traditional farming systems of thetropics, where woody species form a major component of
the bush fallow system and are also widely grown in croppedland. Trees and shrubs benefit the farmer in three mainareas of direct agricultural benefits (plant stakes, mulching
materials, green manure, animal fodder, etc.), environmentalbenefits (shade, soil erosion control, nutrient recycling,carbon sequestration, etc.) and socioeconomic benefits
(saleable commodities, employment, etc).
Agroforestry has not only benefited farmers, it alsosupplies raw material to wood industry, generate
employment of various kinds thus benefiting millions inrelated economic activities like transportation, wholesale,retailing etc. It help consumers with an affordable supply of
wood and contributes to import substitution for timber andtimber related products, which India imports worththousands of crores of rupees a year. Also, agroforestry is
as good, if not better, than degraded forests forenvironmental improvement, pollution control, etc,especially as it can be initiated in farmers’ holdings in
villages and nearer to urban conglomerations. It is a win-win situation for all.
Agroforestry systems for pulpwood production consist
of growing of “commercial trees for wood industry onagricultural fields” with irrigation, fertilizers, plantmanagement technology, etc., in a harvest cycle of 4-7 years.
Making Short Rotation Plantation Forestry a Viable Land Use Option
K. Srinivas* and D. S. N. RajuSri Kiran Biotech, Village Gopalpuram, Mandal Thirumlaypalem, Khammam,
Andhra Pradesh-507163, India*E-mail: [email protected]
Abstract: In India, vast areas forested land has turned bare as a result of indiscriminate felling and exploitation. The problem has arisenwhen demand far exceeded the capacity of forest to supply wood without damage to the natural balance. It is not only the large foreststhat have been affected, small groves near villages, which helped meet needs of firewood and fodder, too have vanished. A growing ruralpopulation with limited income opportunities and the related widespread rural poverty due to shrinking resource base have led toencroachment of forestlands. Diversion of forestland to non-forest uses (of the order of 150,000 ha annually) has also led to large-scaledestruction of forests. It is estimated that of the 130 million ha of barren land in the country, 70 - 80 million ha is under private ownership.The success of agroforestry depends to a large extent on opportunities being taken up by large and small investors. There is a greatdemand of forest products for a diversity of uses and, the forest plantations, mainly established with eucalypts, are managed in rotationsof different extent, being shorter for energy and pulp and much longer to obtain sawn wood. And to supplement this demand, forestcompanies and farmers have been stimulated to cultivate eucalypts. The lands when developed carefully with various site-specific treespecies for firewood, pulp and timber for various industries will return the green cover and can help change the picture completely in afew years. It seems reasonable to claim that, by providing the basis for a revolution in plantation economics, research-based clonalpropagation has created new horizons for eucalypts in India. It will be most interesting to see if continued progress permits to attaingreater levels of self-sufficiency in industrial raw material supplies.
Key Words: Clonal plantation agroforestry, Eucalyptus, Raw material, Adoption
Crops growing underneath form a small part of the grossincome. Selective shade-loving or shade-tolerant crops aregrown to complement timber production and cash flow.
As the trees have to be grown on a quick rotation, the
species selected should not only be fast growing, but also
suitable for combing with agriculture to maintain regular
returns for farmers till harvest of the trees. Diversification of
agriculture should receive very high priority as water
resources are depleting and we are unable to arrange
proper storage and distribution of huge stocks of food
grains. However, tangible results can be achieved only if
farmers are offered practical, viable and economically
attractive alternative land use options. Technology based
farm-forestry plantations with genetically improved, high
yielding and fast growing clonal planting stock of species
like Eucalypts have tremendous potential for diversification
of agriculture and meeting growing shortages of industrial
timber on sustainable basis.
Eucalyptus as an Agroforestry Tree Species
The Eucalyptus L’Herit, a native of Australia is the
second dominant hardwood planted species after Pines inan area of 10 to 15 million ha throughout the world (Turnbull,1999; Neilson, 2000). It is estimated that there will be more
than 20 million ha of eucalypt plantations outside Australiaby the year 2010 (Doughty and Doughty, 2000). Togetherwith longer-established demand for fuel, demand for
Indian J. Ecol. (2011) 38 (Special Issue) : 20-26Indian Journal
of Ecology

21
eucalypt fibre has promoted establishment of a globalplantation estate now likely to exceed 20 million hectares.
Eucalypts immigrated to India soon after Europeansettlement in Australia. One report suggests it may havebeen as early as 1790, It is claimed seed of 16 species
were received from the then infant colony at Sydney Cove.Perhaps as many as 170 species have been introducedsince. However, given the seasonal aridity of much of the
country, it is not surprising that the “Eucalypts” are now sostrongly dominant.
Shifts in public policy and the private sector’s insatiable
wood demands resulted in a turbulent environment for theforest sector in the past. In particular, in the 1980s, Indiaexperienced what was perhaps the most strident of anti-
eucalypt campaigns. Analysis of that situation - by Indiansand foreigners alike - seems to permit the conclusion thatthe fault lay not with the eucalypts per se, but rather with the
strategic and methodological framework within which theirplanting was promoted. Certainly, in the currentenvironment, agitation against the eucalypts appears to have
subsided.
The National Forest Policy, promulgated in 1988, notonly imposes remarkably severe limitations on wood
harvests within public forests, but also “enjoins wood-basedindustrial units to meet their future raw material requirementsthrough developing partnerships with farmers”. A strong
incentive for farmer – industry collaboration to conform isthe fact that India has statutory limitations on the size ofagricultural land-holdings.
It is difficult to escape the impression that, without clonal
propagation, there would have been no prospects for
success in this new approach to expanding the plantation
sector in India. Only clones appear able to achieve the
growth rates necessary to provide sufficient incentive to
farmers to participate in these partnerships. According to
Lal and Kulkarni (1992), the “average productivity of
commercial clones is about 20-25m3ha-1yr-1 and many
farmers have achieved 50m3ha-1yr-1”. Unstated here is the
probability that higher growth rates require irrigated sites.
Most of the myths associated with Eucalyptus like
depletion of under ground water resources, deterioration ofsoils and allelopathic effects on agricultural crops are notbased on scientific facts. On the contrary, soil and water
resources are better conserved under any trees includingEucalyptus compared to keeping large tracts of land barrenor even under grass cover. The study showed that
Eucalyptus consumed 0.48 liters of water to produce a gramof wood, compared to 0.55, 0.77, 0.50 and 0.88 liter pergram for Siris, Shisham, Jamun and Pongamia, respectively
(Prabhakar, 1998). Chaturvedi et al. (1988) reported that often species tested for water consumption, E. tereticorniswas found to be the most efficient in biomass productionper litre of water consumed.
Demand for nutrients by Eucalyptus is less than others,
principally because heartwood begins to form atapproximately four years. After this point, a significantproportion of nutrients in wood is recycled to other parts of
the tree or soil, and the quantities that are immobilized arekept to a minimum. Eucalyptus also contributes to the intensedeposition of organic matter on the soil - through leaves,
bark and roots - estimated at seven tones per hectare peryear (Carpanezzi, 1980; Poggiani, 1985; Lima, 1987), thuscontributing to the soil fertility improvement.
Eucalyptus is the most popular choice to be plantedalong the edges, or bunds, of agricultural fields, andappears to be well incorporated and accepted in agro-
forestry in India. Silvicultural properties includingstraightness, narrow crown, self-pruning, high growth rates,adaptability to a wide range of soils and climates, coppicing
ability, a tendency not to spread as a weed and wide utility ofwood are some of the main features of Eucalyptus clonesmaking it popular among the farmers for raising as block
plantations. Eucalyptus has more than 600 species, amongwhich two species, Eucalyptus camaldulensis Dehnh andE. tereticornis Smith are cultivated more among the farming
community in tropical areas of our country, as beingsufficiently drought tolerant while also capable ofwithstanding, under irrigation and saturation, very hot
summer temperatures and suitable for a wide range ofsites.
Role of Private Sector in Promotion of Agroforestryand Farm Forestry
In agroforestry or farm forestry programs where
intensive cropping of forest species is undertaken,vegetative propagation of desired clones assumes stillgreater economic importance. Great benefits have accrued
from clonal selection and breeding of eucalypts and frommore intensive management practices, in which privatesector has led the way in India. Fast growing, high yielding
and disease resistant clones of Eucalyptus popularly calledas “Bhadrachalam Clones” have productivity of 3 to 4 timeshigher compared to the productivity of normal seed based
plantations (Lal, 2000). Clonal Eucalyptus plantations,promoted, are the first successful example in India ofcommercial scale clonal plantations of any forestry species
traditionally propagated through seedlings.
Eucalyptus plantations promoted by the privatecompanies receive generous incentives such as technical
Short Rotation Plantation and Land Use Option
22
know-how for establishing the trees on the farmer’s landand contracts with the farmer to buy some or all of the first
harvest for an agreed upon price at the time of harvesting,sales tax exemptions on the pulp wood, procurement thoughAgricultural Market Committees, no middle man involvement
hence farmer can sell his produces directly to the end usersand various tax holidays / exemptions for extended periodsapart from element of subsidies on the Eucalyptus clones
are given by the company. These incentives put Eucalyptusat an advantage compared to other agricultural crops(including perennials), which receive no such promotion.
Cultivation Practices of Eucalyptus Clones
Plantations can be established for afforestation and/orreforestation by using seedling, seed and/or coppicing.Eucalyptus is also an important species for bioenergy
plantation because of its propagation ability throughcoppicing, and short rotation age. Establishment starts withplanting, and the stand is harvested every 6 years and
regenerated by coppicing. The production cycle ofEucalyptus comprises establishment (soil preparation,planting and fertilization), management operations,
harvesting and transportation to the end.
Apart from superior genetic quality of the planting stock,site quality of the land, adaptability of the clones to specific
sites, implementation of improved package of practices andeffective protection of plantations from damage by pests,diseases and cattle are important factors, which determine
the overall productivity of the plantations. Therefore, theCompany developed improved package of practices forraising and maintenance of clonal Eucalyptus plantations
and demonstrated benefits of the same to the farmers.These plantations are harvested in 4 - 5 years cycle, oneamong the shortest maturity cycle in the world. Because
the Eucalyptus tree coppices after felling, it is possible toobtain more than one harvest from a single tree. Study ofsoil profiles and analysis of soil samples is carried out to
match adaptable clones to the planting sites.
Deep ploughing of the soil with disc plough or mould-bold plough in both directions is recommended for preparing
the fields for transplanting of clonal saplings. Spacing of 3x 1.5 m is recommended for production of poles andpulpwood, and larger spacing is desirable for production of
timber from clonal Eucalyptus plantations. Transplantingin 30 x 30 x 30 cms. pits is carried out after the onset of themonsoon rains so that plants establish and grow well
benefiting from the good moisture availability throughoutthe monsoon rains. Soil in and around the planting pit istreated with 2 ml of chloropyriphos in 1 litre of water to prevent
damage to the young clonal saplings by termites during thecritical establishment stage. Cultural practices
recommended include timely weeding and soil working,protection against damage by insect pests and cattle andraising of leguminous or any shallow rooted crops in
between the 3 meter wide planting rows. As Eucalyptus isheavy feeder of nutrients like N, P, K and Ca and most of thesoils in India are deficient in nitrogen and phosphorus,
application of fertilizers to supplement availability of thesedeficient plant nutrients is recommended. Based on thesoil test reports application of P and Ca has to be given as
per requirement. Soil and water conservation measureslike raised field boundaries and staggered trenches arerecommended in well-drained planting sites for holding
the rainwater. For block plantation the distance betweenthe trees 3 meters and with in rows 1.5 m which hold 2222plants per ha and allows raising of intercrops in first two
years in the cycle of 4 year rotation period. Intercrops suchas chilies, cotton, tobacco, black gram, green gram arewidely grown with Eucalyptus during the initial years.
Biomass Production of Clones
Eucalyptus plants have a lot of variation that resultsinto lower biomass productivity. It has been found that inseedling plantations, 67 per cent inferior trees produce 33per cent of the total volume, while 33 per cent superior treescontribute 67 per cent of the volume. The clonal plants havehigher productivity due to better genetic quality anduniformity. In Congo, Brazil and Papua New Guinea, clonalplantations of Eucalyptus have produced 70-90m3 ha-1 yr-1.The productivity of clonal plantations raised under rain fedconditions has given yields varying from 20 to 44m3 ha-1
yr-1 compared to 6-10m3 ha-1 yr-1 of seed route plantations.Comparative growth data of various clones, in one of theclonal testing area, is given in Table 1.
Major gains in productivity of Eucalyptus plantations
have been achieved in a short time span of 15 years through
applications of vegetative propagation and cloning
techniques for gainful exploitation of existing useful variation.
Development and commercial scale deployment of locality
specific, high yielding, fast growing and disease resistant
clones of Eucalyptus, traditionally propagated through seed,
has been successfully achieved by the Company. The
productivity of clonal plantations raised under rain fed
conditions has given yields varying from 20 to 44 m3 ha-1
yr-1 compared to 6-10m3 ha-1 yr-1 of seed route plantations
(Lal and Kulkarni, 1992). However, many farmers have
redefined productivity standards by achieving unprece-
dented record yield of 50 m3 ha-1 yr-1 (Table 2).
K. Srinivas and D. S. N. Raju

23
Table 1. Growth data of eight years clones at Bhadrachalam
S.No. Clone GBH (cm) Height (m) Vol/ha UB m3 CAI Vol/ha (UB,m3) MAI Vol/ha (UB,m3)
1 288 58 21 334.1 55.9 41.8
2 6 60 20 321.0 40.3 40.1
3 286 57 20 313.2 40.9 39.1
4 284 54 20 278.3 35.2 34.8
5 285 54 19 262.2 28.8 32.8
6 277 53 17 234.2 25.2 29.3
7 275 51 19 235.1 28.0 29.4
8 3 50 19 227.9 26.0 28.5
9 274 47 19 204.0 23.3 25.5
10 269 49 17 193.0 21.8 24.1
11 276 49 18 188.9 15.5 23.6
12 271 47 18 185.3 22.8 23.2
13 283 46 17 164.1 31.9 20.5
14 268 47 17 165.3 19.0 20.7
15 270 41 16 130.1 8.3 16.3
16 SC 36 14 53.1 0.0 6.6
1. Volume in cubic meters (without bark) calculated based Regression Equation V = 0.00258 + 0.0281 G2H; 2. Spacing 3M x 2M ; 3. No.of saplings planted per treatment 9 with 3 replications; 9. GBH = Girth at Breast Height; CAI = Current Annual Increment; MAI = MeanAnnual Increment; Vol. = Volume;
Economics of Eucalyptus Based AgroforestrySystems
The combination of agricultural crops with Eucalyptustrees for pulpwood production can bring a higher profit thanpure plantings of either. The profitability of Eucalyptusplanting by individual farmers varies with the farm gate pricesand yields of the trees, which in turn depend on the qualityof the soil, the spacing, and the technology of production.
The opportunity cost of the land is an important factoraffecting the net return to the planters. Under the base case,we have used the net return of inter- crops like chilies, cotton,
Green gram, black gram, upland rice on land with fairlypoor soil. Cost of cultivation of 1 ha of Eucalyptus clonalplantation is presented in Table 3,4,5 & 6. For calculating
the estimated returns of the Eucalyptus based agroforestrysystems the average yields of the crops (chilies, cotton,black/green gram and paddy) of the Bhadrachalam area of
Khammam district of Andhra Pradesh were taken. Similarlythe average Eucalyptus yields of the region were taken forcalculation of gross and net returns. The prevailing labour
and material costs as of June, 2009 were taken forcalculations.
High yields combined with better quality of produce
and lower per unit production costs have improvedprofitability of clonal Eucalyptus plantations substantially.Because of better soils, adequate irrigation facilities and
more progressive farmers, productivity of clonal Eucalyptusplantations is likely to establish new records. Farmers can
expect on an average net returns upto Rs.3, 00,000/ ha-1 at4 years rotation from irrigated clonal Eucalyptus plantationsassuming yield of 150 tonnes and current farm gate price
of Rs.2000 per tonne for Eucalyptus logs. No wonder thatclonal farm forestry plantations of Eucalyptus are emergingas an attractive alternative land use option offering
tremendous opportunities for diversification of agriculture.
Based on cost structure, yields, and farm gate prices, itwas found that larger-scale planters are likely to receive a
higher profit than the smaller-scale planters. While large-scale planters make a healthy profit of Rs 0.2 million peryear ha-1, small-scale planters with low-cost credit from the
agricultural banks, just break even. Our findings supportthe general belief that tree planting is usually a businessfor relatively wealthy farmers, who have large enough land
holdings and the capital to diversify their farming activityand experiment with new crops. Small farmers find it difficultto adopt tree growing because of the tree’s lengthy
production period and the high initial establishment cost.The lack of capital and small land holdings make it difficultfor small farmers to diversify their cropping patterns. Larger
holdings, more farm assets, higher off-farm income, andaccess to low-cost credit allow larger planters a betterchance to accept the risk of adopting new crops with a
relatively long gestation. To over come the financial burdenof small farmers, they can adopt agroforestry models whichallow growing of intercrops along with the trees crops which
can fetch some immediate returns in the first two years.
Short Rotation Plantation and Land Use Option

24
Tab
le 2
. P
rodu
ctiv
ity o
f E
ucal
yptu
s cl
onal
pla
ntat
ions
in
agro
fore
stry
S.N
oN
ame
of t
he f
arm
ers
Vill
ag
eD
istr
ict
Ag
eS
oil t
ype
IRR
/RF
Clo
neS
urv
iva
lS
paci
ngV
ol h
a-1C
AI
MA
I
(Mo
nth
s)no
.%
(M)
(UB
,CU
M)
1.S
esha
iah
Ling
amgu
ntla
PKM
63S
andy
IRR
1096
3.0
x 1.
52
17
.76
38.9
641
.48
2.S
itara
mai
ah A
Gul
lapa
llyPK
M51
Bla
ckR
F12
898
3.0
x 1.
51
70
.53
42.9
340
.12
3.R
eddy
D.C
HN
elat
uru
PKM
50R
edIR
R3
993.
0 x
2.0
15
0.0
035
.50
36.0
0
4.R
eddy
D.C
HV
ara
ga
ni
GN
T53
B. C
otto
nIR
R10
,52,
7192
3.0
x 2.
01
25
.79
58.2
228
.48
5.R
anga
Rao
VY
anam
adal
aG
NT
41R
edR
F3
673.
0 x
2.0
14
5.5
160
.11
42.5
9
6.S
amba
siva
Rao
PU
nnav
aG
NT
42B
. Cot
ton
IRR
3,6,
7,12
8,13
096
3.0
x 1.
51
34
.47
77.8
138
.42
7.V
enka
ta R
eddy
DN
imm
alag
udem
WG
42S
andy
Loa
mIR
R3
953.
0 x
1.5
12
0.7
444
.84
34.5
0
8.La
xman
Rao
Jang
ared
dygu
dem
WG
48S
andy
RF
3,7,
10,2
798
3.0
x 1.
51
29
.21
54.5
632
.30
9.K
otes
war
a R
ao S
Pot
huru
GN
T40
B.C
otto
nR
F13
0,83
3.0
x 2.
01
33
.23
98.2
339
.79
10.
Kot
esw
ara
Rao
Ch
Pal
apad
uG
NT
41R
edIR
R13
052
3.0
x 2.
01
61
.04
10
7.4
447
.13
11.
Bal
akris
hna
MV
ee
rab
ha
dra
vara
mW
G24
Red
IRR
3,10
983.
0 x
1.5
83.7
931
.84
41.8
6
12.
Ram
akris
hna
TB
itrag
unta
NLR
27R
edR
F3,
523.
0 x
1.5
71.4
121
.31
31.7
4
13.
Rag
hava
Red
dy G
Ling
ampa
lliN
LR27
Red
IRR
1098
3.0
x 1.
564
.83
30.6
328
.81
14.
Moh
an R
eddy
Legu
ntap
adu
NLR
22B
lack
RF
3,7,
130
100
3.0
x 1.
554
.16
36.2
029
.54
15.
Sril
aksh
mi C
hTe
nam
adal
aG
NT
15R
edIR
R1
05
,13
099
3.0
x 2.
032
.53
32.5
326
.02
16.
Kris
hnav
eni
KS
anta
vellu
ruN
LR12
Red
IRR
3,10
,130
993.
0 x
1.5
30.8
330
.83
30.8
3
17.
Mad
husu
dhan
Rao
Ch
Nel
lipak
aK
MM
27B
.Cot
ton
IRR
3,10
,130
943.
0 x
2.5
52.3
330
.53
23.2
6
18.
Ram
araj
u G
Poc
hava
ram
KM
M40
B.C
otto
nR
F12
8,3,
7,15
,899
3.0
x 2.
01
00
.47
44.7
230
.14
19B
utch
iram
aiah
MV
Nan
diga
ma
KM
M64
B.C
otto
nR
F6,
10,3
,887
3.0
x 2.
01
68
.83
70.6
831
.66
20.
Cha
ndra
sekh
ara
Rao
TV
Ve
nka
tare
dd
ype
taK
MM
40A
lluvi
alR
F12
8,11
6,3,
6,7,
130
983.
0 x
2.5
10
3.1
863
.72
30.9
6
21.
Bha
skar
Rao
TP
ocha
vara
mK
MM
52B
.Cot
ton
IRR
3,10
993.
0 x
2.0
14
6.0
173
.76
33.6
9
22.
Bha
skar
Rao
TP
ocha
vara
mK
MM
40B
.Cot
ton
IRR
3,7,
130
973.
0 x
2.0
13
2.5
278
.52
39.7
6
23.
Sub
ba R
aju
GP
ocha
vara
mK
MM
29B
.Cot
ton
IRR
3,7
993.
0 x
2.0
67.3
143
.31
PK
M –
PR
AK
AS
HA
M; K
MM
– K
HA
MM
AM
; NLR
– N
ELL
OR
E; G
NT
– G
UN
TU
R; W
G –
WE
ST
GO
DA
VA
RI
K. Srinivas and D. S. N. Raju

25
Table 3. Economics of Eucalyptus based agro forestry systems with chillies as intercrop (ha-1)
Crop First year Second year Third year Fourth year Total
(chillies) (black gram/ green gram)
Chillies (irrigated)
Cost of cultivation 70625 70978 71333 71690 284626
Gross returns 90000 90450 90902 91357 362709
Net returns 19375 19472 19569 19667 78083
Chillies with Eucalyptus (irrigated)
Cost of cultivation 83779 17117 12697 12933 126526
Gross returns 75000 11306 — 300000 386306
Net returns -8779 -5811 -12697 287067 259780
Eucalyptus (irrigated)
Cost of cultivation 32154 12469 12697 12933 70253
Gross returns — — — 300000 300000
Net returns -32154 -12469 -12697 287067 229747
Table 4. Economics of Eucalyptus based agro forestry systems with black gram/green gram as intercrop (ha-1)
Crop First year Second year Third year Fourth year Total
(black gram/green gram) (black gram/ green gram)
Blackgram /green gram (rainfed)
Cost of cultivation 9625 9673 9721 9770 38790
Gross returns 11250 11306 11363 11420 45339
Net returns 1625 1633 1641 1649 6549
Black gram/Green gram with Eucalyptus (rainfed)
Cost of cultivation 33029 10836 6384 6589 56838
Gross returns 11250 11250 — 200000 222500
Net returns -21779 414 -6384 193411 165662
Eucalyptus (rainfed)
Cost of cultivation 25904 6188 6384 6589 45065
Gross returns —- — — 200000 200000
Net returns -25904 -6188 -6384 193411 154935
Table 5. Economics of Eucalyptus based agroforestry systems with cotton as intercrop (ha-1)
Crop First year Second year Third year Fourth year Total
Cotton (rainfed)
Cost of cultivation 26250 26381 26513 26646 105790
Gross returns 30000 30150 30301 30452 120903
Net returns 3750 3769 3788 3807 15113
Cotton with Eucalyptus (rainfed)
Cost of cultivation 46654 9203 6384 6589 68830
Gross returns 30000 11250 — 200000 241250
Net returns -16654 2048 -6384 193411 172420
Eucalyptus (rainfed)
Cost of cultivation 25904 6188 6384 6589 45065
Gross returns - - - 200000 200000
Net returns -25904 -6188 -6384 193411 154935
Short Rotation Plantation and Land Use Option

26
As the Government of India has already launched amassive program of watershed development, linkage of
agroforestry as an integral part of this program will not onlyprovide an opportunity to enhance biomass production, butalso improve the profitability. Through soil and water
conservation, green manuring, agroforestry and integratedcrop protection, the yields of inter- crops can be substantiallyhigh, till the inter crops are affected by the shade. Such tree
based farming systems have been highly effective inpreventing migration of rural families and supportinglivestock husbandry to enhance their income by 35-40 percent. Each hectare of clonal plantation with productivity of
20 m3 ha-1 yr-1. can produce enough fuel wood and smalltimber to conserve 20 ha natural forests. Reforestation ofdegraded forest lands, devoid of tree cover, with high yielding
clonal plantations can restore this timber of localcommunities. This will help minimizing biotic pressure onthe natural forest and conserve the rich biodiversity.
REFRENCESCarpanezzi, A.A. (1980) Decomposicao de material organico e
nutrientes em uma floresta natural e em uma plantacao deeucalipto no interior do Estado de Sao Paulo. Tese De Ms.Esalq-Usp, Piracicaba, SP.
Chaturvedi, A.N., Sharma, S.C. and Srivastava, R. (1988) WaterConsumption and Biomass Production of Some Forest TreeSpecies. Commonwealth For. Rev. 63 (3) :217-223.
Doughty, R.W. and Doughty, R.W. (2000) The Eucalyptus: A Naturaland Commercial History of the Gum Tree. Clarendon Press,Oxford pp 228.
Lal, P (2000) National Forest Policy and Raw Material Supplies forWood Based Industries in India. Ind. For. 126 (4): 351-366.
Lal, P. and Kulkarni, H.D. (1992) Sustainable development throughapplication of clonal technology in forestry/agroforestry.Biodiversity: implications for global food security: 205-213.
Lima, W.P. (1987) O reflorestamento com Eucalyptus e seusimpactos ambientais. Artpress, Sao Paulo.
Neilson, D. (2000) The global Eucalyptus resource and somesolidwood-panel product development issues. In: IUFROConference, Launceston, Australia.
Poggiani, F. (1985) Ciclagem de nutrientes em ecossistemas deplantacoes florestais de Eucalyptus e Pinus. Implicacoessilviculturais. Tese de livre-docencia. ESALQ-USP, Piracicaba,SP.
Prabhakar, V.K. (1998): Social and Community Forestry. SatishGarg, New Delhi,
Turnbull, I.W. (1999) Euclapt plantations. New Forests 17: 37-52.
Table 6. Economics of Eucalyptus based agroforestry systems with paddy as intercrop (ha-1)
Crop First year Second year Third year Fourth year Total
Upland paddy (rainfed)
Cost of cultivation 8100 8141 8181 8222 32644
Gross returns 18000 18090 18180 18271 72542
Net returns 9900 9950 9999 10049 39898
Upland paddy with Eucalyptus (rainfed)
Cost of cultivation 28404 8680 4869 5066 47019
Gross returns 9900 9950 — 200000 219850
Net returns -18504 1270 -4869 194934 172831
Eucalyptus (rainfed)
Cost of cultivation 25904 6188 6384 6589 45065
Gross returns — — — 200000 200000
Net returns -25904 -6188 -6384 193411 154935
K. Srinivas and D. S. N. Raju

Wood based industry (WBI) has traditionally beendeveloped with the subsidized and committed supplies ofwood from government forests. Timber harvest and its
supply to the industry were almost curtailed during the lasttwo decades when many states stopped green felling fromgovernment forests. Some units facing acute shortage of
wood for their manufacturing facilities towards the end 21st
century, started promoting plantation activities includingR&D on SRF species as a long term strategy for sustained
availability of raw material. Wimco in the north and ITC inthe south started their forestry programs four and twodecades back, respectively, whereas, many others
especially paper and pulp industry emulating the successstories of these two companies started their own forestryprograms later on. In a short span of less than two decades
many of the private sector(PS) players, having wood as themain raw material, have created reasonable plantationresources in and around their catchments to augment
Private Sector in Short Rotation Forestry: Opportunities andChallenges
R. C. DhimanWimco Ltd. (Wimco Seedlings Division)
Post Box No. 4, Kashipur Road, Bagwala, Rudrapur, U.S. Nagar, Uttrakhand 263153, IndiaE-mail: [email protected]
Abstarct: Forestry, unlike agriculture sector in India, has traditionally been associated with the government sector. Forest resourcesincluding approximately 22% geographic area & vegetation associated therewith; professional & technical workforce- one of the largestin the world, and the forest operations for conservation & controlled harvest of forest produce are strictly regulated by numerous centraland state laws enacted from time to time. Of late, the private sector (PS) has emerged as a leading player in promoting short rotationforestry (SRF) outside government controlled forests in different parts of the country. The efforts of WBI (wood based industry), infacilitating growing of high yielding plantations of fast growing trees (FGTs) with the help of farming community leading to significantincrease in tree culture outside government forests & the increased wood availability produced therefrom, are largely recognized andappreciated. Increased engagement of wood based industry in this new endeavor is a dire need to sustain their business by securingraw material on drying the traditional raw material sources and a couple of them have been successful in their endeavors. A few of themlook it as an opportunity of corporate social responsibility (CSR), whereas, in a limited cases, it has developed as an independentbusiness. Promotion of plantation schemes through public money during 1980’s and 90’s, purely a business opportunity, vanished thesame pace of expansion, on tightening the regulations. The presence of private sector in SRF is limited to the production and supply ofplanting stock of genetically improved clones for their growing by the farming community, R&D on developing new clones of FGTs & theirintegration with the planting stock production & supply systems, and in public private partnerships (PPP) for procuring the wood producedtherefrom. Inability of private sector to hold land for raising plantations, under the land ceiling limits which are not even at par withhorticulture sector, has been the most limiting factor for its direct engagement in plantation activity. Tense competition in wood basedindustry to secure raw material from other’s promoted plantations calls for wood based industry to develop their catchments on thepattern of sugarcane industry and resolve this issue. Tree culture on farm land is purely an adhoc opportunity and arrangement,farmerscontinue to grow trees so long they get remunerative wood prices better than other land use production options. Government laws andregulations on land, labour, tree harvest & transit, and imports & exports of farm grown wood need a fresh look for creating a favorableenvironment for long term stability in this surging sector. The government sector also needs to create a healthy environment for FSC(Forest Stewardship Council) certification of farm grown forests- a unique opportunity for both the industry & the farming community, andalso the need for finalization of the procedures for registration of tree clones under the Protection of Plant Varieties and Farmers Right Act2005. The role of this sector in indirect carbon emission reduction through production and substitution of firewood for fossil fuel, lockingof carbon in wood products need national and international recognitions.
Key Words: Poplar, Agroforestry, Adoption, Private sector, Planting stock, Employment
much needed wood raw material for their manufacturingunits. Public Sector now supplies major share of the plantingstock of some of the fast growing species like poplar,
eucalypts, su-babul, casuarina and a few others. This isdespite the fact that the government is by far the mostdominant player in the forestry sector and directly own and
manage about 97 per cent of all forests, whereas, morethan 90 per cent of India’s wood based products aremanufactured in private sector.
Demand and Supply of Wood and Wood Articles
Till recently, the government forests were the mainsource of wood raw material for meeting the requirement ofwood based industries (WBI) and also that for domestic
and governmental projects like railways, construction, etc.The government sector now discourages use of timber evenin the construction industry and is substituting it with other
alternatives like steel, aluminum etc. WBI cannot survive
Indian J. Ecol. (2011) 38 (Special Issue) : 27-34Indian Journal
of Ecology

28
without wood which is the basic raw material for theiroperations. The gap between its demand and supply is
widening and the scenario is fast changing with increasedwood requirement and reduced supply from the existingsources. FAO’s reports (The state of World’s Forests) on
consumption of wood and wood related products, indicatesthat in a decade period from 1999 to 2009, its consumptionhas constantly increased. Maximum increase is seen in
wood based panels, and pulp and paper during this period.
National Forestry Action Program indicates a negativewood balance of 599.6 Mm3 by 2015. Other estimates and
documentations also reveal a similar trend. Rai andChakrabarti (1996) reported timber production of 43 Mm3
(12 Mm3 from forests and 31 Mm3 from farm land) and 199
Mt firewood(101 Mt from forests and 98 Mt from farm land).Total wood production from the governmental forests of 23states and UTs is reported as 1.873 Mm3 roundwood and
2.094 Mm3 firewood (ICFRE, 2003). The annual officialtimber/log trade through forest corporations is estimated tobe 0.6 to 1.0 Mm3 by Behera (2005). This is against a
fuelwood consumption of 306.352 Mm3, industrial wood as27.231 Mm3, sawn wood as 14.943 Mm3, wood basedpanels as 2.758 Mm3, pulp and paper as 4.550 Mt and
paper and paper board as 5.301 Mt (FAO, 2009).
Imports have now become one of the essential sourcefor meeting the raw material needs of the WBI. Timber (in
log or sawn form) and pulp have been placed under OpenGeneral License (OGL). Imports are in the form of logs,chips, wood pulp, waste paper and other wood related
products. Import of unfinished timber is encouraged andthere are higher tariff rates on finished and semi-finishedvalue added wood products. Imported timber is mostly used
by the building and construction industry, plywood industryand by a few other sectors. The imported timber has alsobenefited a large number of saw mills, particularly in urban
centers and in the vicinity of sea ports. Presently, theimported wood is comparatively cheaper than locally growntimber and is being imported from numerous countries
around the world. Imports of wood and wood products areincreasing with increase in the domestic consumption ofwood and its inadequate availability in the country.
Import of wood and wood related articles in quantityand value terms is available in the official website ofMinistry of Commerce, GoI. (MoC n.s.) which shows that
the imports of all the wood and wood articles exceptfirewood are increasing at a fast rate. Maximum increase isseen in import of industrial wood and paper products. The
author while visiting Kandla port in Gujarat, one of the mainport for the import of wood, observed that this port alone isreceiving around 0.1 Mm3 wood each month, which is further
being dispatched throughout the country for industrial anddomestic consumption. The import of radiata pine in Kandla
port alone constitutes around 75 per cent (of the importedwood) mainly from New Zealand and Australia.
Private Sector in Short Rotation Forestry
Private sector is now delicately engaged in promoting
SRF on farm land. Private sector (PS) is unable to raise itsown plantations for raw material production since the landlaws do not permit holding of land over certain limits, which
are different in different states and extremely low not evenat par with other horticultural trees and other plantationspecies like tea, coffee, etc. In Uttar Pradesh and Uttrakhand,
a farmer can hold 12.5 acre land for the practice ofagroforestry under the ceiling laws, whereas, this limit is40 acres for horticultural orchards. Agroforestry, therefore,
needed to be treated at par with atleast horticulturalorchards under land ceiling laws. PS is therefore engagingin indirect activity of promoting SRF by (1) producing quality
planting stock, (2) conduct R&D on tree improvement,nursery production, and (3) provide technical know how togrow field plantations and also in developing agriculture
crops in association with tree species.
A major share of the planting stock of poplar, eucalyptsand a few other species planted by farmers and even a little
by the government institutes is now made available by theprivate sector. More than 50 M seedlings were being plantedby just 12 PS companies (Saigal et al., 2002). Pande and
Pandey (2004) further reported planting of around 75 Msaplings by 13 PS companies. This figure appears to haveincreased now since Wimco now grow 5 M poplar saplings
and 2 M plants of other tree species in comparison to just2.7 M poplar saplings shown in their report of 2002 and2004. Further, some other companies not included in their
list have also started supplying planting stock in and aroundtheir command areas. Unorganized sector that includesindividuals on separation from plantation companies,
farmers and even small private companies have now
started significant contribution in planting stock production
and their supply to the tree growers. Many of them started
this activity as a business opportunity for them in remote
villages where employment opportunities are very limited.
For example, Ex- Wimcoites (including many workers) on
separation from the company took up the business of
growing and selling poplar saplings and their contribution
is more than that of the organized sector including Wimco.
Government sector including State Forest Departments,
State Agriculture Department, State Agricultural Universities
and Forest Rsearch Institutes hardly grow poplar nurseries
for supply to the farmers and these collectively have
R. C. Dhiman

29
insignificant contribution in the total production and supplyof poplar saplings to the tree growers.
The share of planting stock supplied by the privatesector and the plantations promoted thereof are increasingsince tree growers have now started better appreciating
the quality of the planting stock supplied by the private sectorfrom which they are able to realize better returns on harvestand sale. Wimco has become a brand name for poplar
clones and their planting stock and ITC for eucalypts clonalplanting stock. Numerous growers recognize Wimco aspoplar company since the company has been associated
with the farming community for the last four decades andestablished poplar on these new territories. In India,eucalypts is one of the main species planted on the farm
lands and its planting especially that of clonal stock isincreasing in many states especially after the heavy infectionof gall insect throughout its growing locations. Eucalyptustereticornis and E. cameldulensis are largely plantedeucalypts with seed origin planting stock in India which getheavily infested with gall insect. Plantations of some
eucalypts clones have shown fairly good tolerance to thispest and their plantations are increasing post-gallinfestation. In Andhra Pradesh alone, approximately 40 M
clonal eucalypts is planted each year. In Anand, Mehsanaand some other districts of Gujarat where planting of treeson boundaries of fields is the main form of agroforestry, the
density of trees per unit area is increasing as a result ofcreation of more boundaries on division of land.
India with 3.92 million ha eucalypts plantations
(Dhiman et al., 2010) and 50 per cent of the global poplarbased agroforestry (Ball et al., 2005) leads the world atleastin the culture of these two trees mainly on farm land. Private
sector has played a significant role in this achievement.Wimco and ITC have individually created 0.1 Mha poplarand eucalypts plantations, respectively, through supply of
quality planting stock from their nurseries till date. The majorclonal planting stock of eucalypts now grown in the countryis from ITC’s clones and poplar from Wimco’s clones. These
two companies are undisputed leaders in R&D, clonedevelopment and in the production and supply of qualityplanting stock of eucalypts and poplar. Many private sector
companies especially that of paper and pulp, state forestdepartments, other government institutions like universitiesand research institutes also contributes in R&D on
eucalypts and a few other species, whereas, Wimco is theonly private sector player baking the poplar program throughits R&D and extension units.
SRF, in India, is now redefining the production forestry,some tree species like Leucaena leucocephala beingharvested at a very short rotation of two years for pulp wood,
whereas, some others like Populus deltoides at less than4 years for timber production in some locations. Some tree
species like poplar, kadam (Anthocephalus cadamba), drek(Melia azedarach), etc are being better produced onagricultural holdings than that on forest land. Cultural
operations in agricultural crops help these trees grow veryfast. It is possible to harvest very high wood yields on goodsoil sites with better drainage and frequent earth working.
The maximum wood production that has ever beenrecorded in India has been reported from the farm grownpoplar, eucalypts, Leucaena, Casuarina, etc. The production
forestry is therefore now shifting from the governmentforests to non- forest areas especially commercialagroforests. Eucalypts in the Tarai Region of Uttranchal
has been reported to yield true volume upto 66.75 m3/ha/year at 10 years rotation when grown on farm land (Dhiman,2007), whereas, poplar under similar conditions in Punjab
has been reported to yield timber upto 58.39 m3/ha/year at5 years rotation (291.98 m3 or 248.324 t/ha in five years)(Dhanda and Verma, 2005). Poplar and eucalypts planted
in agroforestry are producing around 20-30 m3 timber/ha/year on farm lands, which is very high productivity incomparison to 0.5 m3/ha/yr from the government forests. A
very high productivity of agroforestry plantations is amotivating factor for making it economical remunerative toits growers.
Plantations of FGTs on farm fields now constitute animportant wood resource and has significantly increasedthe wood availability for the industry and local people. Paper
and pulp industry which was largely dependent for its rawmaterial procurement on government forests till recentlywas procuring around 76 per cent (approximately 35.85 Mt
in 2004-05) from farm forestry sector as against aprocurement of 11.32 Mt pulp wood from government forestsduring 2005-6. This balance has now further tilted towards
wood supplies from farm land. ITC has procured 99.41 per
cent of its wood requirement from farm forestry during 2009-
10 (ITC, 2011). Wicmo and other poplar based industry in
the North India are already based on farm grown poplar.
Veneer, plywood, match and many other wood based
industries which once dependent on the government
supplies are also fully supported with raw material from
farm grown trees. In Kerala, almost all the wood supply
comes from non- forest sources. While in 1965, 75 per
cent of all wood supply came from forests, by 1993-94, the
picture has completely changed and as much as 94.1 per
cent of the wood came from the non forest sources. Home
gardens contributed 83.1 per cent of wood, estates 8.2 per
cent and imports 2.8 per cent. In case of the industrial wood,
home garden provided 47 per cent, estates 29.7 per cent,
Private Sector in Short Rotation Forestry

30
imports 13.7 per cent and government forests only 8.7 percent (Saxena, 1998). FSI (2009) documented 5508.456 M
number of trees outside forests (ToFs) holding 1599.57Mm3 wood volume as against 11909.8379 M number oftrees with 4498.66 Mm3 wood volume in forest land. It is
evident from these figures that the ToFs hold around onethird of the total wood volume held in trees inside forests.Further, TOFs are in the fast mode of production and harvest
than that of trees inside forests, which are mostly underconservation plans. Based on the calculations of TOFsbeing harvested on short rotation, it is inferred that these
are meeting over 93% of requirement of the industrial woodand almost major part of domestic wood requirement.
The impact of private sector in promoting SRF is visible
all around. The industry procures wood from the plantationgrown in the respective command areas of the factories.Their extension staff is located near the farming sites to
provide technical knowhow to the growers. R&D in manycases is well integrated and synchronized with farmoperation on farmer’s fields. The results of such testing are
realistic since they are grown with the actual agronomicalinputs given by the farmers to their normal crops and theseenhance the acceptability of the field research. Dedicated
and responsible human resources engaged by the privatesector plays a key role in the success. This makes themain difference in the extension approach in PS when
compared with that of government departments in whichcase tree growers still show inhibition for free and faredialogue with the government staff. Wimco was the first
private sector company that created an extension wing in
1977 to promote poplar plantations in North India, the
company still maintains fairly large extension human
resource through out the poplar growing region and
elsewhere for the promotion of tree culture on farm land.
Many other PS companies have now created similar wings
for developing similar interface with the farming community.
Some low volume units in North India have started taking
land on lease and growing trees mainly poplar for their own
consumption since their wood requirement is small and
they can meet it this way. In some other locations like
Mehsana and Anand districts of Gujarat the saw mill owners
are believed to contribute money for growing planting stock
procured from the forest department which is than supplied
to the farming community at subsidized or low prices.
CHALLENGES
The role of some private sectors in developing SRF forwood procurement is widely recognized and appreciated.
PS has ably demonstrated that public private partnership
(PPP) is also possible for long gestation crops like trees.Deshpande (2005) while reviewing the Wimco-NABARD
poplar scheme on PPP mentioned that the satisfaction levelof the farmers participating in the scheme was better thanthe expectations. Despite, there remains many challenges
for the long term sustainability of wood from this highlysensitive venture of growing trees on farmers fields. Theseare briefly discussed below.
Sustenance of wood availability. The majority of woodbased industries in different states had undergone difficulttimes 2002 onward when many units were suddenly made
to shut down pending development of procedure for theirregularization. The industry was allowed to establish andoperate without registration as the existing laws were
interpreted during their establishment that way. CentralEmpowered Committee (CEC) under the supervision ofthe Hon’ble Supreme Court of India is closely monitoring
the industry and has now finalized the procedure forconfirming the fresh registration of new units and that of theunregistered old units based on the documented additional
wood availability. An undertaking is also taken from the newunits that they will make their own arrangement of wood ofselected tree species for their product manufacturing and
will not demand any wood from the state governments.
This mode of wood production through farmers hasbeen reasonably successful for both the wood based
industries and growers with some exceptions. WBI is nowcompletely relying on the farming community for providingwood from their farm land. Import of industrial wood, though
constantly rising, this mean is meeting a small portion oftotal requirement. Both these means appear to be adhocarrangements. Farmers grow trees on their farm land, if
market conditions favour remunerative returns- atleast betterthan that from the traditional agricultural crops. The presentlevel of farm land use favors tree culture because of very
good market prices of wood produced thereon. Betterappreciation in returns associated with agricultural cropson developing scarcity of food or on introduction of high
value crops or decline on wood prices lead to decline intree culture. This affects wood availability and could have adirect impact on functioning of wood based industry. The
present low costs of imported wood in comparison to locallygrown wood, and also that of finished and semi-finishedwood products could also affect the present activity of wood
production leading to long term negative impact on woodbased industries.
Import and export barriers. Poplar- a major raw
material for panel industry, is considered as agriculturalproduce in India. Poplar wood import and exports therefore
R. C. Dhiman

31
are viewed as agriculture produce and is not readily allowed.The prices of poplar wood have already recorded all time
high rates in all the local wood markets. Recently, someindustrial units closed down their operations, high costs oflocally available wood were making their business
uncompetitive and unsustainable. The free trade in poplarwood similar to other tree species could have allowed theindustry to get import of this low value wood available in
many other countries to sustain wood based industrybusiness in India. Similarly, when the prices of poplar woodwere very low during 2002-2005, the farmers were not
getting its prices even at par with that from agricultural crops.Export of its wood during that period could have madefarmers to realize value for their tree produce and to keep
them tempted to remain in its culture. The present crisis ofnon-availability of its wood as a result of very low plantingduring 2003-2006 could have been avoided. The policy on
import and export on farm grown timbers thus needs to berevisited periodically to balance and readjust the gapbetween demand and supply of wood.
The import of fresh wood also carries insects andpathogens and therefore is a carrier for such invasivespecies. Wood reaching Indian ports needs to be free from
insects and pathogens and thus requires its fumigationand a quarantine certificate attached therewith. The facilityof fumigating wood is not available in many wood exporting
destinations around the world and there have been someinstances when the wood without quarantine certificate wasnot accepted in Indian ports. Fumigation of wood in ships
and containers before unloading at ports is very costly onaccount of treatments and halting charges of ships. Thepresent fumigation measures appear to provide superficial
treatments and the wood born pathogens and insectsespecially in fresh wood are difficult to eradicate with thesetreatments. These barriers have started affecting the easy
wood imports that existed a couple of years back.
Shifting of wood based industries towards woodsources. Abundant poplar wood availability in northwestern
Indian states encouraged panel industry to shift and expandtheir manufacturing base in this region (Dhiman, 2004) aftertheir businesses were adversely affected as a result of
Supreme Court ruling in Goda Varman v/s. Union of Indiamatter. This shift has though provided good opportunity forthese new locations to develop plantations and panel
industry base, it uprooted most of the wood based industriesfrom northeastern states. Northeastern region has goodrainfall and deep soil conditions with excellent tree growing
conditions. The wood based industries could have madeto develop raw material for their industrial units in those
locations rather than getting uprooted and shifted theirmanufacturing facility elsewhere. Poor wood raw material
availability and its ever escalating costs in North India arenow making this industry unviable in domestic andinternational trade. Imported wood, semi- finished and
finished wood products are already reaching in the panelmanufacturing base in northwestern India. The low costimports of timber in Indian ports also facilitating expansion
of wood based industry near those destinations. Thisapproach of wood imports could be a serious threat for theestablished industry in the long run. Availability of wood for
such industry even at port locations could be affected in thefuture on environmental regulations for cutting trees gettingupper hand in countries exporting the wood. It is in the
interest of wood based industry to draw a long term strategyfor their operations and businesses.
Regional imbalances in wood production and usage.Wood being the main and costly raw material, its availabilityin the surrounding locations has been one of the decidingfactor in the establishment and expansion of wood based
industries. Traditionally, this industry developed near thewood availability around the government forests. Withdepletion of the committed wood supplies from the
government forests and its increased availability on the farmland, WBI developed and expanded in clusters in manylocations. For example, Yamunanagar in Haryana and
Udham Singh Nagar in Uttrakhand have now developedlarge clusters for panel industry. These clusters not onlyreceive wood from other locations within the states but are
surviving on the wood receipts from the adjoining states.Escalating wood prices across the country and the stateinitiatives to develop their own WBI, are encouraging states
to create barriers for movement of the wood to other states.There is increased demand from the local WBI for low costwood. Presently, Haryana and Uttrakhand WBI cannot
survive on the wood resources available within these statesand their survival will be seriously affected if the inter-statemovement of the wood is restricted. Uttar Pradesh, a major
contributor to the wood supplies to both Haryana andUttrakhand, has started raising voices for such barriers.CEC under the supervision of the Hon’ble Supreme Court
has been reviewing each case of establishing new WBIbased on the documented additional wood in that state.
Research and development limitations. R&D initiatives
in PS on tree species are now four decades old. Wimcowas the first company to initiate organized research on foresttree species outside government sector to develop poplar,
euclaypts and other tree species of industrial and socialimportance. Later on, ITC-PSPD initiated eucalypts R&D
Private Sector in Short Rotation Forestry

32
program which is also widely acknowledged as asuccessful initiative in developing new clones and their
domestication. Further, some other WBI’s especially papercompanies started encompassing R&D in their forestryprograms. Research on trees and plantations demand
heavily on time, land and human resources. R&D incorporate houses is seriously affected for the want of landresources. New clones developed by the PS with limited
resources have now entrenched in the farming systems.Some of the R&D inputs especially that on ecological,silvicultural and biotechnological aspects need large areas
for experimentation. PS needs to provide special initiativesto hold increased land area for such experimentation.Premature release of tissue cultured poplar during 1990’s,
without proper field testing, performed much below thetraditionally propagated poplar (Dhiman and Gandhi, 2010;Pande and Dhiman, 2010) and its culture has already
caused loss of around Rs. 3000 crores to the growers.
Organizational support. There is no dedicatedorganization to provide developmental and research support
to the tree culture on farm land. The activity is presentlysand-witched and overlaps between agriculture and forestrysector with no clear cut mandate for either of them. Tree
culture on farm land is not the same as is on forest land. Ithas been amply demonstrated that the productivity of poplarand eucalypts is much higher on farm land in association
with agriculture crops than their sole growing on forest land.Tree harvest, marketing and trade for farm grown trees isnow day to day activity. Many wood based industries
purchase their wood requirement on daily basis. Evenplanting of some trees like eucalypts by the growers isstaggered during the greater period of the year. The inventory
of trees on the farmland and wood availability thereon ischanging on day-to-day basis. Some unusual happeningsometimes significantly disturb this continuum of wood
production and harvest. For example, onemisunderstanding on scope of the wood trade that wascreated on the closure of the WBI during 2002-2005 resulted
in sharp decline in tree culture. The impact of low plantingduring that period on wood availability is continued to persisttill date.
There is no organization to maintain and documenttree inventory and capture the change. The only authenticdatabase on tree inventory on forest and non forest land is
monitored and developed by the Forest Survey of India. Thelatest FSI Status of Foress Report 2009 is based on 2006imagery data (FSI, 2009). This database is inadequate to
address the actual status after half a decade ago basedinventory. Further, there is a lot of overlapping of inventory offarm grown trees with that of forest lands. For example, the
FSI picks up all the areas (over 0.5ha) having inventory oftrees (more than 10 per cent crown cover and 5m in height)
as forest cover irrespective of the location in forest or non -forest land. Some of the planted trees on farm land quicklyattains the crown cover of 10 per cent required to be picked
up as forest. Poplar block plantations with around 500 treesper hectare attains 10 per cent crown cover in the first yearitself (Dhiman, 2009) and qualifies for being picked up as
forest. Thus, there appears to be a lot of overlapping causingvariation in the actual tree cover on farm land than presentedin the FSI report. It has also been realized that growers are
not aware of many aspects of growing and trading treesincluding technical know how. The information barriersremain major issues in adoption of tree culture. An
organization fully dedicated to ToFs could only handle theseaspects effectively.
Felling and transit regulations. Felling and transit
regulations on trees grown by the farmers have been oneof extremely important constraints in the sale of farm growntree produce. The issue has been widely discussed and
debated numerous times. Ministry of Environment andForests, GoI has understood to have issued the directionsduring 2004 to states for relaxing such regulations on certain
tree species grown by the farming communities. This is astate matter and some state governments have relaxedfelling and transit regulations on selected tree species
grown by the farmers. However, situation has not improvedin some states. The felling and transit regulations are stillimposed on timber of such species, which are grown by
the farmers but these do not exist in government forestsand are not even grown on forest land. Felling permissionis more complicated if the species is not listed in those
notified either transit free or those requiring transitpermission. For example, kadam which is grown bynumerous farmers in North India is not listed in the state
lists. Permission for felling and transit of this category ofthe tree is provided after these are verified by the Revenue,Forest and sometimes also from the marketing boards in
Uttar Pradesh and Uttrakhand. Transit regulations are littlemore complicated in Uttar Pradesh. Similarly, felling ofkadam in West Bengal requires approval from the District
Magistrate based on a recommendation from a committee
constituted for this purpose in the forest department. The
committee comprising of forest official, pradhan of the area
and a few other members recommend harvesting of the
plantation raised on the farm land based on which District
Magistrate provides the approval thereof. Government of
Assam has notified rules for controlling, felling and removal
of trees from non-forest areas in 2002 wherein tree growers
are required to register their plantations of some species
R. C. Dhiman
33
with the State Forest Department (GoA, 2002). The process
of obtaining felling permission in West Bengal takes
approximately 3 to 4 months under normal conditions. The
entire process of procuring this permission is tiring,
frustrating, time consuming and also financially taxes the
permission seekers.
Emerging international and national trade barriers.Business in wood related products is getting influenced by
the international and national trade barriers. Many europeanand western countries are now demanding ForestStewardship Council (FSC) certificate for import of forest
based products to ensure that the timber used formanufacturing such products was not obtained byharvesting wood from the natural forests. This is being
followed to ensure that the sustainability of the forests ismaintained by using the wood from only the plantationsmeant for this purpose. Wood based industry in India has
already started actively involvement in this venture. Thereare already 132 FSC (mostly CoC-chain of custody and afew on CW-Controlled Wood) certificates for 162 sites
available till now and many more are in the pipeline. FSCcertificates are available in different categories varying fromCoC to CW to Management certificates. Most of the
certificates available till date are those in CoC and CWcategories. The procedure for getting FSC certification arecomplicated and are based on numerous conditions
prevailed in other countries than that exist in India. OurGovernment needs to develop Indian system andprocedures required for such FSC certification to provide
some relief on this emerging aspect.
Forest plantations are considered as a potential meanfor carbon sequestration. India has already shown its
presence in A&R projects under CDM mechanism byregistering three projects, first of which was initiated by thePS-ITC. A&R projects need land resources to grow forest
plantations and conserve the carbon in wood and soil.Unfortunately these procedures developed for land surpluscountries have limited scope in India since land for this
purpose is hardly available. Principals and proceduresdeveloped for A&R projects in surplus land countries areinadequately addressing the significant contribution of SRF
plantations raised in India. The role of SRF atleast ingenerating huge quantity of firewood and as a mean ofoffsetting use of fossil fuel that will help in carbon emission
reduction needs recognition by developing synergies withenergy projects. India would be in disadvantage to keep itscarbon emission reductions under check as per the
international commitments once the rural population, amajor user of firewood, start using energy efficient fossilfuels on their getting better rising standards with improved
economical conditions. The present annual consumptionof firewood is 302 m tones/annum in India. Firewood
accounts from 20-30% of all the energy used in India and90% of its is in the domestic sector. Therefore, firewood ismore than just a commodity being consumed, supplied
and processed and traded.
Inadequate efforts. Wood based industries is workingon cut throat competition because of very high costs of wood
that being the main raw material. Inadequate availability ofit in many units compels them to explore its procurementfrom locations wherever it is available. Many units are
encroaching the wood resources promoted by others in faraway locations. In the recent past, wood has moved fromnorth to south and east states since there was acute
shortage in selected locations. In many locations, there ishardly any effort by numerous wood users and they merelyencourage procurement of wood to their units from sources
promoted and developed by others. For example, None ofthe major poplar based units in North India has directcontribution in developing poplar plantations and they use
its wood promoted by mainly Wimco. The share of poplarwood use in Wimco is between 0.5-1 % of its availability inthe entire poplar growing region and around 80% of it is
used by the plywood industry without making anycontribution in its plantations. Some of the new units havebeen given conditional registration that they will use only
poplar and eucalypts wood in their units. Monitoringagencies need to prevail upon such units for having theirdirect involvement in plantation programs and also to
recognize and appreciate those who are developingplantations for themselves and others.
The past experience of PS engaging in promoting tree
plantation through public money has not been good. During
1980’s and 90’s, around 1000 companies mobilized
between Rs. 100 billion to Rs. 250 billion from 2.7 to 15
million investors with an understanding of multiplying
returns through growing trees (Saigal et al., 2002). Most of
these companies lacked in forestry base, wrongly convinced
the investors regarding the better returns on their
investment. There was no organization to guide the individual
investors and growers against such unscrupulous activities
and many unsuitable tree species were planted which
ultimately resulted in their failure. There was also no
regulatory mechanism for such companies and except for
a couple of genuine corporate houses which kept their
promise to the investors all others collected the investor’s
money and disappeared over night. Planting stock of
numerous unsuitable tree species is still being supplied
by some of the greedy nursery growers for making quick
Private Sector in Short Rotation Forestry
34
money out of this business and farmers only realize the
mistake in venturing such activity after many years when
they do not get the expected growth/returns from their planted
trees.
The demand for registration of cultivars of forest trees
has been rising for some time (Dhiman, 2006) under theprovisions of The Plant Variety and Farmer’s Right (2002)Act which is in place for nine years now. Varieties of
agricultural crops are now being registered under this act,whereas, procedures are yet to be developed for forest treespecies. ICFRE has started registration of the cultivars,
which though does not have legal backing but is andocumented acknowledgement of the efforts of thebreeders. Registration of cultivars in ICFRE may help in
their registration with the Plant Variety Authority. Yet, the PSand also the breeders in the government institutions needsto push up this issue to protect their rights as well.
CONCLUSION
There is a huge gap between demand and availabilityof wood in the country. The extremely high wood prices oflocal timber, increasing imports of timber, semi finished
and finished products thereof and long term non-commitment on sustained availability of wood from anydefined sources make this sector highly sensitive to these
international and national trade barriers. PS endeavors increating forest plantations with the help of farmingcommunity is a favorable development to bridge this
widening gap. Further, opportunities to remain it engaged
in this new adventure are enormous and based on the
realistic need to secure raw material for their manufacturing
facilities, corporate social responsibility, and business
requirement. Private Sector pleads for creating an enabling
environment by removing the barriers, engage with those
Wood based Industries which still enjoys the fruits of wood
availability created by others, establish an organization for
making inventory and support system for tree culture on
farm land, develop information base on tree culture for the
benefit of the growers and industry and develop new Wood
based Industries clusters to meet the increased demand
of products. Such efforts will certainly help in further
development of SRF for the benefit of the farming community,
private sector and the country.
REFERENCESBall, J., Carle, J. and del Lungo, A. (2005) Contribution of poplars
and willows to sustainable forestry and rural development.Unasylva 56(2): 3-9.
Behera, P. (2005) Timber calculations. Ind. For. 131(11): 1513-1514.
Deshpande, C. S. (2005) The Wimco poplar programme. Contactfarming as a mean of value added agriculture. NABARD. DEAROccasional Paper 42. NABARD, Mumbai.
Dhanda, R. S. and Verma, R. K. (1995) Growth performance ofPopulus deltoides Bartr.in agroforestry plantations in Punjab.In: Poplars in India: Recent research trends. Proceedings ofthe Consultative Meetings held at Dr. Y. S. Parmar Universityof Horticulture and forestry, Nauni (Solan) on Poplar cultureand improvement in India. IDRC, New Delhi-UHF, Nauni solan.PP. 41-56.
Dhiman, R. C. (2004) Poplar wood availability – A boon for plywoodindustry. Ply Gazette. pp. 64-72.
Dhiman, R. C. (2006) Forester- The challenges ahead. In: SS Negi,R J K Srivastava, Manisha Thapliyal, Ombir Singh(Eds)proceedings of the XIIth Silviculture Conference). Pp. 115-124. FRI, Dehradun.
Dhiman, R. C. (2007) Important stimulators in the success ofcommercial agroforestry. In: Jagdish Singh et al. (Eds)Proceedings Status and Procedure of Agroforesty in NorthWestern Himalayas. Himalayan Forest ResearchInstitute(ICFRE), Shimla. 14-16 Nov., 2006. pp. 123-131.
Dhiman, R. C. (2009) Carbon footprint of planted poplar in India2009. ENVIS 9(2):70-81.
Dhiman, R. C. and Gandhi, J. N. (2010) Field performance oftraditionally propagated vis-à-vis tissue cultured poplar. AnnalsFor. 18(2): 223-230.
Dhiman, R. C., Kulkarni, H. D. and Gandhi, J. N.( 2010) Spreadinginfestation of gall wasp (Leptocybe invasa gen. & sp. N.) oneucalypts in North India. Ind. For. 136(6):791-803.
FAO (2009). State of the World’s Forests Food and AgricultureOrganisation, Rome, Italy.
FSI (2009) State of Forest Report (2009) Forest Survey of India,Dehradun.
GoA (2002) Assam (Control of felling and removal of trees fromnon-forest lands) Rules, 2002. Notification No. FRM.88/2001/77 dated 7th May, 2002, Forest Department, Government ofAssam.
ICFRE. (2003) Forest Statistics 2003. Indian Council of ForestryResearch and Education Dehradun, Uttrakhand.
ITC (2011) Tree-farming yields bumper yields. Express News231(March 18, 2011).
MoCn.s. Ministry of Commerce, website: http://commerce.nic.in.eidb/com2.asp.
Pande, P. K. and Dhiman, R.C. (2010) Variation in wood traits inmicro and macro propagated plantation woods of Populusdeltoides Bartr. ex Marsh. Advances in Biosciences andBiotechnology Published online October 2010.
Pande, S. K. and Pandey, D. (2004) Impact of incentives on thedevelopment of forest plantation resource in India. In: ThomasEnters and Patrick B. Durst(Eds).What does it take? The roleof incentives in forest plantation development in Asia and thePacific
Rai, S. N. and Chakrabarti, S. K.( 1996) Demand and supply offuelwood, timber and fodder in India. Dehradun, Forest Surveyof India, Ministry of Environment and Forests.
Saxena, N. C. (1998) Leasing of degraded forest lands. Report ofworking group appointed by the Planning Commission, GoI.
Saigal, S., Arora, H. and Rizvi, S. S. ( 2002) The New Foresters-The role of private enterprise in the Indian Forestry. EcotechServices, (India) Pvt. Ltd. (ETS) New Delhi and IIED.
R. C. Dhiman
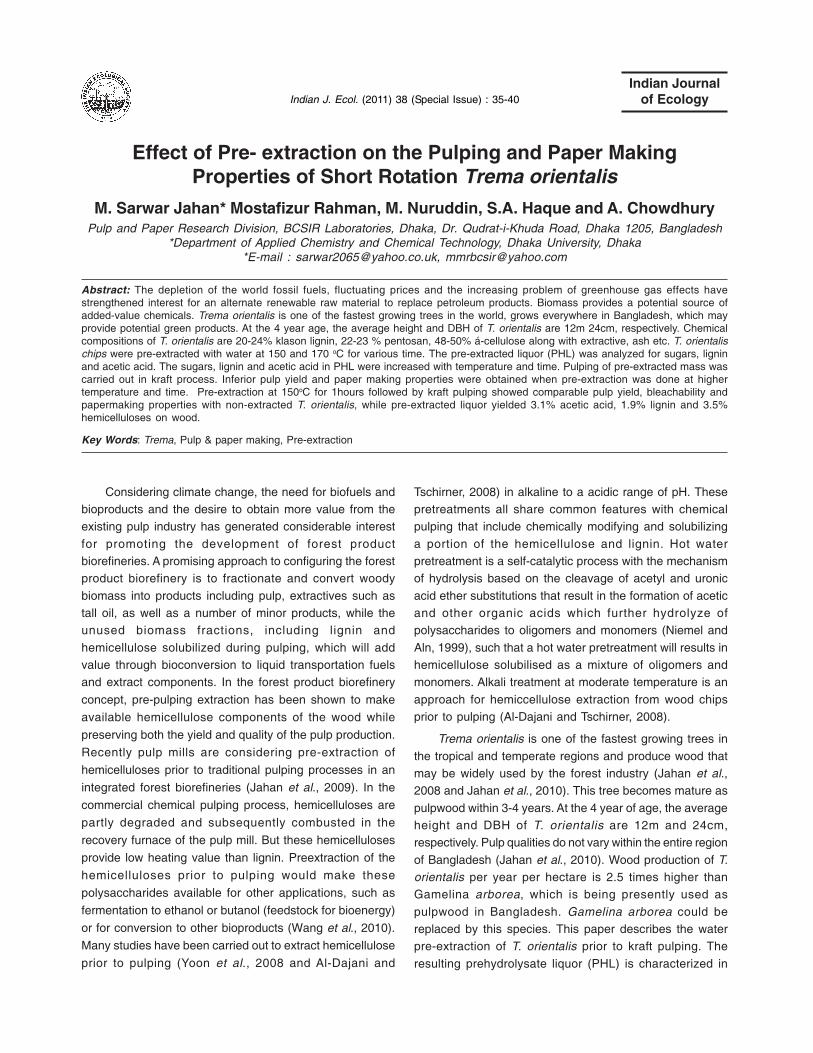
Indian J. Ecol. (2011) 38 (Special Issue) : 35-40Indian Journal
of Ecology
Considering climate change, the need for biofuels andbioproducts and the desire to obtain more value from theexisting pulp industry has generated considerable interest
for promoting the development of forest productbiorefineries. A promising approach to configuring the forestproduct biorefinery is to fractionate and convert woody
biomass into products including pulp, extractives such astall oil, as well as a number of minor products, while theunused biomass fractions, including lignin and
hemicellulose solubilized during pulping, which will addvalue through bioconversion to liquid transportation fuelsand extract components. In the forest product biorefinery
concept, pre-pulping extraction has been shown to make
available hemicellulose components of the wood while
preserving both the yield and quality of the pulp production.
Recently pulp mills are considering pre-extraction of
hemicelluloses prior to traditional pulping processes in an
integrated forest biorefineries (Jahan et al., 2009). In the
commercial chemical pulping process, hemicelluloses are
partly degraded and subsequently combusted in the
recovery furnace of the pulp mill. But these hemicelluloses
provide low heating value than lignin. Preextraction of the
hemicelluloses prior to pulping would make these
polysaccharides available for other applications, such as
fermentation to ethanol or butanol (feedstock for bioenergy)
or for conversion to other bioproducts (Wang et al., 2010).
Many studies have been carried out to extract hemicellulose
prior to pulping (Yoon et al., 2008 and Al-Dajani and
Effect of Pre- extraction on the Pulping and Paper MakingProperties of Short Rotation Trema orientalis
M. Sarwar Jahan* Mostafizur Rahman, M. Nuruddin, S.A. Haque and A. ChowdhuryPulp and Paper Research Division, BCSIR Laboratories, Dhaka, Dr. Qudrat-i-Khuda Road, Dhaka 1205, Bangladesh
*Department of Applied Chemistry and Chemical Technology, Dhaka University, Dhaka*E-mail : [email protected], [email protected]
Abstract: The depletion of the world fossil fuels, fluctuating prices and the increasing problem of greenhouse gas effects havestrengthened interest for an alternate renewable raw material to replace petroleum products. Biomass provides a potential source ofadded-value chemicals. Trema orientalis is one of the fastest growing trees in the world, grows everywhere in Bangladesh, which mayprovide potential green products. At the 4 year age, the average height and DBH of T. orientalis are 12m 24cm, respectively. Chemicalcompositions of T. orientalis are 20-24% klason lignin, 22-23 % pentosan, 48-50% á-cellulose along with extractive, ash etc. T. orientalischips were pre-extracted with water at 150 and 170 oC for various time. The pre-extracted liquor (PHL) was analyzed for sugars, ligninand acetic acid. The sugars, lignin and acetic acid in PHL were increased with temperature and time. Pulping of pre-extracted mass wascarried out in kraft process. Inferior pulp yield and paper making properties were obtained when pre-extraction was done at highertemperature and time. Pre-extraction at 150oC for 1hours followed by kraft pulping showed comparable pulp yield, bleachability andpapermaking properties with non-extracted T. orientalis, while pre-extracted liquor yielded 3.1% acetic acid, 1.9% lignin and 3.5%hemicelluloses on wood.
Key Words: Trema, Pulp & paper making, Pre-extraction
Tschirner, 2008) in alkaline to a acidic range of pH. Thesepretreatments all share common features with chemicalpulping that include chemically modifying and solubilizing
a portion of the hemicellulose and lignin. Hot waterpretreatment is a self-catalytic process with the mechanismof hydrolysis based on the cleavage of acetyl and uronic
acid ether substitutions that result in the formation of aceticand other organic acids which further hydrolyze ofpolysaccharides to oligomers and monomers (Niemel and
Aln, 1999), such that a hot water pretreatment will results inhemicellulose solubilised as a mixture of oligomers andmonomers. Alkali treatment at moderate temperature is an
approach for hemiccellulose extraction from wood chipsprior to pulping (Al-Dajani and Tschirner, 2008).
Trema orientalis is one of the fastest growing trees in
the tropical and temperate regions and produce wood thatmay be widely used by the forest industry (Jahan et al.,2008 and Jahan et al., 2010). This tree becomes mature as
pulpwood within 3-4 years. At the 4 year of age, the averageheight and DBH of T. orientalis are 12m and 24cm,respectively. Pulp qualities do not vary within the entire region
of Bangladesh (Jahan et al., 2010). Wood production of T.orientalis per year per hectare is 2.5 times higher thanGamelina arborea, which is being presently used as
pulpwood in Bangladesh. Gamelina arborea could bereplaced by this species. This paper describes the waterpre-extraction of T. orientalis prior to kraft pulping. The
resulting prehydrolysate liquor (PHL) is characterized in

36
order to find suitability of value added products and theeffect of pre-extraction on the pulping and papermaking
potential have been evaluated.
MATERIAL AND METHODS
Three 4 years old trees of T. orientalis were selectedfor this experiment. Two feet from top and bottom from the
stem and 1 ft from terminal part of branch of these treeswas discarded, remaining portion was debarked andchipped to 0.5 x 0.5 x 2 cm size for pre-hydrolysed pulping.
Prehydrolysis. The prehydrolysis was carried out inan electrically heated 20 litre capacity digester. Waterprehydrolysis was done at 150 oC and 170 oC for different
time. The wood to liquor ratio was 1: 4. The time required toraise maximum temperature was 50 min. After completingpre-extraction, digester was cooled by circulating in cold
water and the liquor was drained for sugar analysis, ligninand acetic acid. The percentage of dissolved woodcomponents were measured gravimetrically.
Lignin analysis. The dissolved lignin in theprehydrolysate was measured based on the UV/Visspectrometric method at wavelength 205 nm (TAPPI UM
250) or 280 nm. At 280 nm furfural and HMF adsorptionstrongly interfere with the lignin absorption because theirspecific adsorption coefficients are more than tenfold higher
than for lignin. At 205 nm wavelength furfural and HMFadsorption play only a minor role, therefore, the ligninconcentration was measured at this wavelength.
Acetic acid. Acetic acid in the PHL was dehydrated byanhydrous sodium sulphate. 1 µL was injected into GC.Pure glacial acetic acid (GAA) was used as reference
standard. Analysis of GAA was carried out on GasChromatograph model 14B, Shimadzu, Japan loaded withsoftware Class GC-10 (version-20). The GC was equipped
with Flame Ionization Detector (FID) and Capillary Column,FAMEWAX, dimension 15mX 0.25mm RESTEC. Beforeinjection the column was conditioned at 180oC for about 2h
for attaining thermal stability before use. The temperatureof the column oven, injection port and detector were 180oC,240oC and 250oC, respectively.
Solid and ash contents. The total solid content in thePHL was determined by drying at 105oC till to constant weight.
Sugar Analysis. The sugars in the pre-hydrolysate
(PHL) and the acid hydrolysis liquor were determined byIon Chromatography unit equipped with CarboPac TM PA1column (Dionex-300, Dionex cooperation, Canada and
pulsed amperometric detector (PAD). Acid hydrolysis of PHLwith 4% sulphuric acid was carried out at 121oC in an oil
bath (Neslab Instruments, Inc., Portsmouth, N.H., USA) toconvert oligosaccharide to monosaccharide. The PAD
settings were E1 = 0.1 V, E2 = 0.6 V and E3 = -0.8 V. De-ionized distilled water was used as eluant with a flow rateof 1ml/min where as 0.2 N and 0.5 N NaOH were the column
regenerant and post column detector’s supportingelectrolyte respectively with 1 ml/min flow rate. The additionof 0.5 N NaOH is necessary to maintain optimum detector
sensitivity and minimize baseline drift for an isocraticseparation.
Pulping. Pulping was carried out in same digester of
pre-hydrolysis and pre-hydrolysed T. orientalis mass andnon-extracted chips of 1500 g of oven dried (o.d.) wascooked. Pulping conditions of kraft were as follows:
- Active alkali was 18 per cent on oven-dry (o.d) rawmaterial as Na2O
- Sulphidity was 25 per cent
- Cooking time was 120 min at maximum temperature(170 oC). 90 min was required to raise maximumtemperature (170 oC) from room temperature.
- Liquor to material ratio was 4.
After digestion, pulp was washed till free from residualchemicals, and screened by flat vibratory screener (Yasuda,
Japan). The screened pulp yield, total pulp yield andscreened reject were determined gravimetrically aspercentage of o.d. raw material. The kappa number (T 236
om-99) of the resulting pulp was determined in accordancewith Tappi Test Methods.
Evaluation of pulps. Pulps were beaten in a PFI mill at
different revolutions and handsheets of about 60g/m2 were
made in a Rapid Kothen Sheet Making Machine. The sheets
were tested for tensile (T 494 om-96), burst (T 403 om-97)
and tear strength (T 414 om-98) according to TAPPI Standard
Test Methods.
DEpD bleaching. Pulps were bleached by DEpD
bleaching sequences (where D represents chlorine dioxide
and Ep represents peroxide reinforced alkaline extraction).
In the first stage (D) of DEpD bleaching sequences was 3
per cent. The temperature was 70 oC in Do stage for 60
min. Pulp consistency was 5 per cent. The pH was adjusted
to 2.5 by adding dilute H2SO4. In the first alkaline extraction
stage, temperature was 70oC for 60 min in a water solution
of 2 per cent NaOH and 0.2% H2O2- (on od pulp) Pulp
consistency was 10 %. In the D1, pH was adjusted to 4. The
ClO2 charge in the D1 was 1.5 per cent. The brightness
(T525 om 92) of the bleached pulp were determined in
accordance with Tappi Test Methods.
M. Sarwar Jahan, Mostafizur Rahman, M. Nuruddin, S.A. Haque and A. Chowdhury

37
RESULTS AND DISCUSSIONPrehydrolysis
Forest products companies may increase revenue by
producing biofuels and chemicals in addition to pulpproducts in an Integrated Forest Biorefinery (IFBR). In suchbiorefinery, hemicelluloses are extracted prior to pulping
and used for the production of hemicellulose basedbiomaterial, fuel, acetic acid, etc. Trema orientalis was water-prehydrolysed prior to pulping in order to remove partial
hemicelluloses from wood. Fig. 1 represents the yields ofwood residue after pre-extraction at 150 and 170oC fordifferent time interval. It is clearly shown from the figure that
both time and temperature had strong impact on thedissolution of wood components. The dissolution rate ofwood components is high at the first stage followed by slow
stage associated with the dissolution of branchedhemicelluloses. Similar observation was found in the auto-hydrolysis birch wood (Testova et al., 2009). Subsequently
detail pre-hydrolysis was carried out 150oC for 1 h and 170oCfor 1.5h. The pre-hydrolysis at 150oC dissolved 9.9 per centwood component, of which 2.1 per cent acetic acid and 1.9
per cent lignin and remaining part is hemicelluloses. Themechanism of hot water extraction depended in part on thecleavage of O-acetyl and uronic acid substitutions thatresulted in formation of acetic and other organic acids.
These acids catalyze the hydrolysis of the hemicellulosesto soluble oligomer and monomers (Liu, 2008). Increasedamounts of hemicelluloses were removed from the wood
with the increase of prehydrolysis intensity (Table 1). Forpaper pulp, complete removal of hemicelluloses isunnecessary because they play an important role in
formation of sheets. It is better to remove the
Fig. 1. Effect of time and temperature on the loss of woodcomponents
hemicelluloses that dissolved during pulping processes.Acetic acid in the PHL was also increased with the increase
of prehydrolysis intensity. Garrote et al. (2001) reported thatthe amount of free acetic acid in the hydrolyzate dependson the amount of residual xylan in the wood and xylan
converted into high and low molecular weightoligosaccharide or xylose. The acetic acid was generatedfrom the direct deacetylation of the xylan in the wood (Garrote
et al., 2001).
Mass Balance
The wood residue after pre-hydrolysis and solid contentin the PHL was close to 99% in both prehydrolysis
conditions. This 1% loss in the mass balance is due to thedegradation in unknown products. This concurs with thefinding of Leschinnsky et al. (2009). The lignin, acetic acid
and total sugars in PHL was 92.7 per cent and 91.7 percent of solid content at 150 for 1h and 170oC for 1.5h,respectively. This less than 100% balance can be explained
by the formation of furfural, and other xylose degradationproducts, which was not quantified in this study. The xyloseand oligoxylose content in the PHL was increased from 4.6
per cent to 7.9 per cent with the increase of pre-hydrolysisintensity (150oC for 1h vs 170oC for 1.5h). Testova et al.(2009) also found that xylose and oligoxylan content in the
PHL increased with the increase of temperature at same p-factor. Total sugars in the PHL was 49 per cent on solidcontent at 150oC for 1h, which decreased to 43 per cent at
170oC for 1.5h. This implies that the drastic pre-hydrolysisconditions is not suitable for the isolation of hemicelluloses.It increased xylan degradation products, lignin dissolution
etc in the PHL (Testova et al., 2009). Xylose/xylan can beconverted into xylitol, yeast, furfural and others by chemicalor enzymatic processes.
The lignin content in the PHL was 18-21 per cent of thesolid content. Lignin content in the PHL was also increasedfrom 1.9 per cent to 3.3 per cent with pre-hydrolysis
increased. Yoon et al. (2008) extracted loblolly pine in hotwater prior to pulping and obtained 5.11 per cent lignin inthe prehydrolysate. The lignin content in hot-water extract of
sugar maple was 3.27 per cent (Amidon and Liu, 2009).Lignin can be the starting material for high value-addedapplications in renewable polymeric materials development
(Satheesh et al., 2009). The value added applications oflignin not only helps to boost the economic viability of thebiorefinery but also serves as a source of renewable
materials.
Pulping
Pulping of residues after pre-hydrolysis were carried
Pulp and Paper Making Properties of Trema orientalis

38
out in kraft process under identical cooking conditions andcompared with non-extracted pulp. Pulp with similar degree
of delignification was obtained without significant loss ofpulp yield when pre-hydrolysis was done at 150oC for 1 h.With the increase of pre-hydrolysis severity, pulp yield
decreased by 2.6 per cent, kappa number also reduced to16.7 from 18.2. During pre-extraction with water, somehemicelluloses and lignin were removed, thus wood chips
become open resulted improved reaction activity lignin withcooking chemical. Therefore, the delignification was fasterfor the pulping of extracted T. orientalis. This result complies
with earlier findings of pre-extracted wood and nonwood(Lei et al., 2010). From this result, it can be concluded thatmild pre-hydrolysis is suitable for T. orientalis pulping to get
a good pulp yield.
Paper Making Properties
The effect of PFI refining on the drainage resistance(oSR) of pulps obtained from water pre-hydrolysed kraft cook
and conventional kraft cook is shown in Fig. 2. As expecteddrainage resistance increased as PFI revolution increasedin all types of pulps. Refining resistance increased with the
increase of severity of pre-hydrolysis condition. Pre-extracted pulp at 150oC for 1h needed 4250 revolution toreach SR number 40, which was 2500 revolution lower as
compared with the control pulp. This is attributed to thelower amount of hemicelluloses in pulp. Pulps with lowerhemicelluloses are very resistance to refining and have
poor strength properties, while pulps with highhemicelluloses content are easier to refine and producestronger sheets (Casey, 1980). Similar results were
observed in water pre-extracted kraft pulps from loblolly pine.Drainage resistance of pulp obtained from pre-extracted at170oC for 1.5h did not reach 40. It has been reported that
pulp with 99% á-cellulose could not refine at all and wouldnot make satisfactory paper as fibers do not swell.
Fig. 3 shows the effect of pre-extraction on the tensile
strength of kraft pulp obtained from T. orientalis. Tensilestrength decreased with the increase of severity of pre-hydrolysis conditions. At SR number 30, tensile index was
43 N.m/g and 30.5N.m/g for pulp obtained with pre-hydrolysis at 150oC for 1 h and at 170oC for 1.5 h,respectively, which were 31 per cent and 51 per cent lower
than the pulp obtained without pre-hydrolysis. Similar resultswere obtained for burst index as shown in Fig. 4. Thenegative effects of pre-extraction on the tensile and burst
strength could be explained by low interfiber bonding abilityof hemicelluloses deficient pulp.We observed no significantdifference in tear resistance at SR number 30 between pulps
obtained without pre-hydrolysis and pre-hydrolysis at 150oC
Tab
le 1
. C
hem
ical
com
posi
tion
of p
re-h
ydro
lysi
s liq
uor
of T
. or
ient
alis
.
Pre
hydr
olys
is c
ondi
tion
Yie
ldS
olid
Sug
ars
(% o
n w
ood)
(%)
con
ten
tLi
gnin
Ace
tic
Xyl
ose
glu
cose
ara
bin
ose
Rha
mno
seTo
tal
(%)
acid
mon
ool
igo
mon
ool
igo
mon
ool
igo
mon
ool
igo
sug
ars
1h a
t 150
o C89
.19.
31.
932.
11.
12.
30.
100.
450.
260.
210.
090.
084.
59
1.5h
at 1
70o C
80.2
18.5
3.26
5.8
2.9
3.2
0.27
0.56
0.31
0.36
0.13
0.17
7.90
M. Sarwar Jahan, Mostafizur Rahman, M. Nuruddin, S.A. Haque and A. Chowdhury

39
for 1h (Fig. 5). But pulp obtained with pre-hydrolysis at 170oCfor 1.5 h severely lost tear resistance. Tearing resistance
depends on total number of fibers participating in the sheetrupture, fiber length and strength of fiber to fiber bonds(Casey, 1980). Thus an acceptable tear strength of
handsheets is obtained if pre-hydrolysis is properly control.
Bleaching
Pre-extraction of hemicelluloses may changebleaching potential of the produced pulp. So unbleached
pulps obtained with and without pre-hydrolysis weresubjected to a conventional ECF bleaching (DoEpD1) in orderto assess the bleachability. The brightness and opacity were
almost same in all pulps using same bleaching chemicals.
Fig. 2. Effect of pre-hydrolysis on the drainage resistance ofproduced pulp from T. orientalis.
Fig. 3. Effect of pre-hydrolysis on the tensile index of producedpulp from T. orientalis.
Fig. 4. Effect of pre-hydrolysis on the burst index of producedpulp from T. orientalis.
Fig. 5. Effect of pre-hydrolysis on the tear index of producedpulp from T. orientalis.
This indicated that pre-extraction had no impact on pulpbleaching. For evaluating papermaking properties, bleached
pulps were beaten in a PFI mill in different revolution andhandsheets were prepared. The physical properties at oSR35 were obtained from the extrapolation. The number of PFI
revolution required to reach target oSR 35 was 2150revolution for pulp without pre-hydrolysis, while pulp pre-hydrolysed at 150oC for 1h and at 170oC for 1.5h required
3500 and 5860 revolution, respectively. (Table 2). Afterbleaching, the papermaking properties of pulp obtainedfrom pre-hydrolysis at 150oC for 1h were almost similar to
control pulp. From the bleaching results, it may be concludedthat the pre-extraction of T. orientalis at 150oC for 1hproduced pulp of almost similar optical and physical
Pulp and Paper Making Properties of Trema orientalis

40
properties to control pulp.
CONCLUSIONS
The pre-hydrolysis intensity increased wood
components dissolution in the PHL. The acetic acid, ligninand sugars content in PHL were increased with the increaseof pre-hydrolysis intensity. Mild pre-hydrolysis conditions
(150oC for 1h) produced almost similar pulp yield and kappanumber to non-hydrolysed T. orientalis. Drastic pre-hydrolysed conditions (170oC for 1.5h) produced pulp with
lower yield and inferior strength properties. Theprehydrolysed pulp was very difficult to beat due to the lossof hemicelluloses. After bleaching, the optical and
papermaking properties of pulp obtained from pre-hydrolysisat 150oC for 1h were almost similar to control pulp. The pre-hydrolysis at 170oC for 1.5h is suitable for producing
dissolving grade pulp.
REFERENCESAmidon, T. E. and Liu, S. (2009) Water-based woody biorefinery.
Biotechnology Advances 27(5): 542-550.
Al-Dajani ,W. W. and Tschirner, U. W.(2008) Pre-extraction ofhemicelluloses and subsequent kraft pulping Part I: Alkalineextraction. Tappi J. 7: 3-8.
Casey, J. P. (1980) Pulp and Paper Chemistry and Technology.Interscience Publisher, Inc.
Garrote, G., Domý´nguez, H. and Parajo, J. C. (2001) Kinetic modellingof corncob autohydrolysis, Process Biochem. 36: 571-578.
Jahan, M. S., Ahsan, L., Noori, A., and Quaiyyum, M. A. (2008)Process for the production of dissolving pulp from Tremaorientalis (nalita) by prehydrolysis kraft and soda-ethylenediamine (EDA) process, Bio Res. 3(3): 816-828.
Jahan, M.S.,Saeed, A., Ni, Y. and He, Z. (2009) Pre-Extraction andits Impact on the Alkaline Pulping of Bagasse. J. BiobasedMaterials and Bioenergy. 3: 380–385.
Jahan, M. S., Chowdhury, D.A.N. and Ni, Y. (2010) Effect of differentlocations on the morphological, chemical, pulping andpapermaking properties of Trema orientalis (Nalita).Bioresource Technology 101: 1892–1898.
Leschinnsky, M., Sixta, H. and Patt, R. (2009) Detailed massbalances of the autohydrolysis of Eucalyptus globulus at170oC. BioRes. 4(2): 687-703.
Lei,Y., Liu, S., Li, J. and Sun, R. (2010) Effect of hot-water extractionon alkaline pulping of bagasse. Biotechnology Advances 28(5):609-612.
Liu, S.J. (2008) A kinetic model on autocatalytic reactions i‘n woodybiomass hydrolysis. J. Biobased Materials and Bioerengy 2:135-47.
Niemelä, K. and Alén, R. (1999) Characterization of pulping liquors.In: Sjöström, E., Alén, R. (Eds.), Analytical Methods in WoodChemistry, Pulping, and Papermaking. Springer-Verlag, Berlin,pp. 193–232.
Satheesh, M.N. K., Mohanty, A.K., Erickson, L. and Misra, M. (2009)Lignin and its applications with polymers. J. Biobased Materialsand Bioenergy 3(1): 1-24.
Simonson, R. (1965) The hemicellulose in the sulfate pulpingprocess, part 3: the isolation of hemicellulose fractions frombirch sulfate cooking liquors. Sven.Papperstidn. 68: 275–280.
Testova, L., Vilonen, K., Pynnönen, H., Tenkanen, M. and Sixta, H.(2009) Isolation of hemicelluloses from birch wood: distributionof wood components and preliminary trial in dehydration ofhemicelluloses. Lenzinger Berichte 87: 58-65.
Wang, H., Ni, Y., Jahan, M.S., Liu, Z. and Schafer, (2010) T. stabilityof cross-linked acetic acid lignin-containing polyurethane. J.Thermal and Colorometry (online).
Yoon, S.H., MacEwan, K. and van Heiningen, A. (2008) Hot-waterpre-extraction from loblolly pine (Pinus taeda) in an integratedforest products biorefinery. Tappi J. 7: 27-31.
Table 2. Effects of pre-hydrolysis on the pulp bleaching
Properties Without pre-hydrolysis Prehydrolysis 150oC 1h Prehydrolysis 170oC 1.5h
Brightness (%) 86.4 86.0 85.6
Opacity (%) 91.1 91.1 91.1
PFI Rev to reach 35 oSR 2150 3500 5860
Tensile index (N.m/g) 56.3 54.9 30.4
Burst index (kPa.m2/g) 5.0 5.1 3.0
Tear index (mN.m2/g) 10.9 9.5 7.3
M. Sarwar Jahan, Mostafizur Rahman, M. Nuruddin, S.A. Haque and A. Chowdhury

The biological diversity of forests and their ecologicalfunctions are the heritage of mankind. These forests aremost important and remarkable natural resources, which
play a significant role in the economic prosperity andecological stability of the country. The forests of India areshrinking under acute socio-economic pressure and the
foresters are at the cross roads. India’s forests till recentlyare being denuded at an alarming rate of 1.5 million ha peryear and fortunately deforestation has come down rapidly
with the enactment of the Forest Conservation Act (1980).Currently, the forest area in the country is around 23.84 percent and in the state of Tamil Nadu, it is around 17.5 per
cent, which is much low against the mandated requirementof 33 per cent. Not only is the forest wealth of the country ispoor but also its productivity in terms of mean annual
increment (MAI) is also one of the lowest (0.5 – 0.7 cu.m perha per year compared to the global average of 2.1 cu.m perha per year). The less forest area coupled with the low
productivity of Indian forest has ushered in a total mismatchbetween the demand and supply of both domestic andindustrial wood requirement (Parthiban and Govinda Rao,
2008).
Designing and Augmenting Pulpwood Supply Chain throughContract Tree Farming
K.T. Parthiban*, R. Seenivasan1, S. Vennila, P.V. Anbu, P. Kumar, V. Saravanan, S.Umesh Kanna, P. Rajendran, V. Subbulakshmi and P. Durairasu
Forest College and Research Institute, Tamil Nadu Agricultural University, Mettupalayam – 641301, India1Tamil Nadu Newsprints and Papers Ltd (TNPL), Karur
*E-mail:[email protected]
Abstract: The success of industrial wood plantation schemes and the related plantation establishment is widely questioned. The reasonsfor the failure are numerous; but the key reasons are non-involvement of local people, lack of assured buy back and minimal support price.Besides, the middlemen and local contractors in the existing marketing system play a major role and in most cases they decide theharvesting time and also price fixation. Absence of efficient production to consumption system coupled with price incentives and assuredbuy back is a major constraint faced by the tree growing farmers. This constraint on industrial agroforestry can be overcome throughaugmenting the existing supply chain system by linking the farmers directly with industries. This augmented supply chain system willassure strong buy back system with a minimum support price. The precise information on marketability of industrial raw materials grownin farmlands is also equally important to assure profitable income to the grower. Against this backdrop, a value chain on industrialagroforestry in Tamil Nadu has been introduced and implemented through National Agricultural Innovation Project of ICAR. Through thisproject tri-and quad-partite models have been designed and successfully adapted across the state. This contract tree farming modelinvolved four partners viz., research institutes for supply of potential genetic resources of pulp wood species and industries for massmultiplication of the potential genotypes through clonal technology and supply them at subsidized rate to the farmers. The other twopartners in this model are farmers for growing pulpwood trees in their farm and financial institutions to provide credit facilities to the treegrowing farmers. This quad partite model has been successfully implemented and demonstrated in 200 ha covering 207 farmersdistributed in 5 districts of the state. This model gained significant momentum both within and outside the project site resulting in horizontalexpansion of industrial agroforestry model in more than 11,284 ha benefitting 4389 farmers located in 24 districts of the Tamil Nadu state.This model provided and augmented the multipartite supply chain into a tri partite and quad partite model and given enough scope foradaption by any wood based industry.
Key Words: Pulpwood supply chain, Contract farming, Tri and Quad-partite model
India, due to burgeoning population is undertremendous pressure to meet the ever growing multifariousdemands for wood and wood products. The demand for
pulp and paper is one such thing. Today, there are about600 paper mills in India with 34 in the large scale sector.During 1990’s, the per capita consumption of paper was
3.3 kg, which has now escalated to 5 kg, but still lowercompared to the global average 47.7 kg. The currentproduction of raw material for pulp and paper production is
2.7 million tones as against the demand of 5.04 milliontones. The shortfall is as high as 45 per cent. The projecteddemand in 2015 is 7.98 million tones, which are still more
staggering (Srivastava, 2005).
Under such circumstances, the National Forest Policy1988 directed the wood based industries not to depend on
forest department supply for meeting the raw materialdemand. In fact, the policy has given clear guidelines to theindustries that they should meet their raw material demand
by establishing direct linkages with farmers by providingquality planting material, lending credit facilities and alsowith assured minimum support price (Anon, 1988). However,
these activities are gaining slow momentum for want of
Indian J. Ecol. (2011) 38 (Special Issue) : 41-47Indian Journal
of Ecology

42
suitable institutional mechanism to augment the traditionalmulti-partite supply chain system. Against this back drop a
value chain model has been designed for industrialagroforestry involving paper industries, farmers, researchinstitutes and financial institutions where in the existing
multi-partite supply chain has been transformed into a valuechain model as per the concept developed and popularizedby Porter (1985) and also as evidenced in other value chain
models of Feller et al. (2006). This paper elaborates themissing links in the traditional supply chain system and theinterventions made for value additions to augment the
profitability of the production to consumption system.
Constraints and Interventions of Industrial WoodValue Chain
The industrial wood raw material requirement istraditionally met from the plantations of forest department
till the recent past by the wood based industries. But due toexpansion of industrial paper production, diminishingsupply from the unimproved plantation and uncertain
availability are the major bottle neck in the current supplychain. The major constraints and the interventions throughthe current value chain are depicted in Fig. 1.
Non-Availability of Adequate and Quality RawMaterial
The biggest challenge faced by the wood basedindustries is the spectare of raw material unavailability. Theavailable raw materials are not only certain but also with
varying degree of quality which resulted in erratic pulprecovery. Hence, promotion of farmer’s linked clone basedagroforestry activities in marginal agricultural lands will help
to augment the quality raw material availability in a shorterperiod of 3 years compared to existing 5 years of rotation(Karmarker and Haque, 2008 and Parthiban et al., 2009).
Against this back drop, the current study has been designedto develop institute-industry-farmers linked nursery andplantation planning process through demonstration in a
decentralized approach.
Lack of Quality Planting Material and ProductivePlantations
Traditionally plantations are raised by the farmersthrough unimproved and unknown seed sources, which
recorded the yields of 5 and 7 cum per ha per year. Suchpoor yields with small and scattered plantations coupledwith all logistics problem and escalated cost in felling and
transportation are the stumbling blocks for the wood basedindustry particularly the pulp and paper industries to be
economically viable and internationally competitive.Intensively managed plantations based on genetically
improved planting stocks can achieve the productivity levelsof 15 – 30 cum per ha per year even on marginal lands.Hence, the current project intervened strongly by introducing
improved genetic resources of pulp wood species and theirpopularization across the farm lands of the state. Thisprocess acted as a basis for productivity improvements
coupled with profitability, income and employmentgeneration through various decentralized forest basednursery and plantation activities.
Poor Understanding on Value Addition Process
The productivity and profitability of the plantations aredirectly linked to the time and type of harvesting systemcoupled with suitable post harvest management system in
order to reduce the logging impact and to augment theproductivity. Traditionally, plantation operations in the countryare done manually and the plantation residues are not
properly utilized. Rather the plantation residues are left inthe field without any utilization. The current study intervenedthrough introduction of mechanization in harvesting
operation and established value addition process ofplantation residues through Briquetting technology. Theplantation and industrial wood processing activities
accounts for 20 – 30 per cent of residues which are eitherunutilized or underutilized for want of suitable recyclingtechnology and the associated supply chain system. The
current study resolved this issue by introducing valueaddition process and designing new supply chain.
Unorganized Supply Chain and Trade
The success of Industrial wood plantation schemes
and the related plantation established is widely questioned.The reasons for the failures are numerous; but the keyreasons are non involvement of local people, lack of assured
buy back and minimal support price. Above all, the supplychain was multipartite as indicated in Fig. 2. To augment(Eaton, 1988 and Gahukar, 2007) chain system and to
transform them as value chain system, the research grouphas designed a Quad-Partite Model Contract farmingsystem through efficiently linking the growers, industries,
research institutes and financial institutions. Currently theprice information pattern of pulp wood species is not knownto growers due to lack of price information system and its
dissemination. This project strongly resolved this issue byestablishing a separate website to periodically disseminatethe pricing pattern of industrial wood species through
regular updating system.
K.T. Parthiban and Co-authors

43
Fig
. 1.
A v
alue
cha
in o
n in
dust
rial a
grof
ores
try
in T
amil
Nad
u
Pulpwood Supply Chain and Contract Farming

44
Fig.2. Status of Supply Chain – Multi – Partite
Fig. 3. Existing supply chain of pulp wood.
Fig. 4. Quad-Partite Model
Existing Supply Chain
Currently there exist two supply chain systems, viz.,Forest department supply and farmer’s supply. The major
raw material supply comes from the Tamil Nadu ForestPlantation Corporation (TAFCORN), which accounts fornearly 1.5 lakh tonnes of wood pulp supply. The remaining
raw material comes from the farm lands through the traders.The supply chain of farm forestry is depicted in Fig. 3.
In the existing supply chain, growers sell the wholeplantation on the acreage basis not taking into consideration
the actual volume of the growing stock, which resulted inminimal returns to the growers. The local contractor’s buythe plantations, fell them and classify them into poles,
pulpwood and firewood. Only the wood size of 1 to 2 inchesalone is supplied to the industries and other sizes are soldfor pole purpose by the traders, which resulted in uncertain
and erratic pulp recovery and quality. This necessitateddevelopment of strong supply chain with a successfulcontract farming model.
Contract Farming Model
To meet the above needs and increase the area underpulp wood plantation through farm forestry, the two paperindustries in association with Tamil Nadu Agricultural
University has developed a tri-partite and quad-partite modelfor promotion of pulp wood based contract farming system.Through the system, it is intended to produce quality and
sustained raw material through a strong supply chain.
Tri-partite Model
This model incorporates industry, growers and financialinstitutions. Under this system, the industry supplies quality
planting material at subsidized rate and assures minimum
support price of Rs. 2000 per tonnes or the prevailingmarket price which ever is higher. The financial institutions
viz., Indian Bank, State Bank of India and Syndicate Bankprovide credit facilities to the growers at the rate of Rs. 15000to 20000 per acre in three installments. For credit facilities,
a simple interest rate at 8. 5 per cent is followed and therepayment starts after felling. The contract farming systemextends no collateral security for loan amount up to Rs.1,
00,000/- per farmer.
Designing and Adaptation of Quad-Partite ValueChain Model
This model (Fig. 4) incorporates research institutes,industries, growers and financial institutions. The research
institutions played significant role in advising site specificclones (coupled with the technical advice on pre and post-plantations activities), which helped both the growers and
Plantation Supervisors posted by the industries. Theindustries mass multiply the potential genetic materialsidentified by the research institutions in a decentralized
manner and supply them at subsidized costs to the growers.The industry also facilitates felling of trees and transportationof material at their own costs, which resulted in strong
linkage between industry and the growers. The FinancialInstitutions provide credit facilities to the Tree Growers. Thegrowers should supply the pulp wood on maturity as per
the agreement. This model has benefited small andmedium farmers. The industry also helps to repay the loanafter feeling of trees thereby help the financial institutions in
timely repayment of loan, which results in strong institutionalmechanism for sustainability of the contract tree farmingsystem in the state. This quad-partite model proved to be
lucrative in terms of technological adoptions and profitabilityof plantations.
Technology Development and Adoption
The Forest College and Research Institute (FC&RI)
has developed high yielding and short rotation clones
K.T. Parthiban and Co-authors
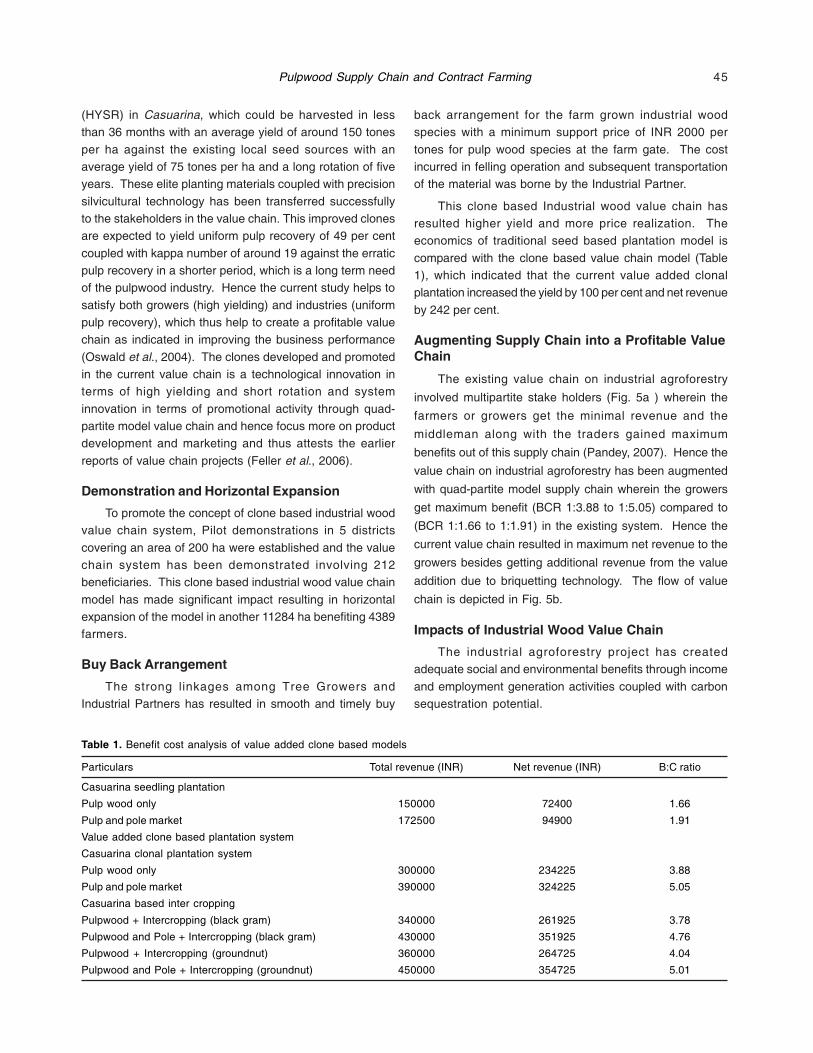
45
(HYSR) in Casuarina, which could be harvested in lessthan 36 months with an average yield of around 150 tones
per ha against the existing local seed sources with anaverage yield of 75 tones per ha and a long rotation of fiveyears. These elite planting materials coupled with precision
silvicultural technology has been transferred successfullyto the stakeholders in the value chain. This improved clonesare expected to yield uniform pulp recovery of 49 per cent
coupled with kappa number of around 19 against the erraticpulp recovery in a shorter period, which is a long term needof the pulpwood industry. Hence the current study helps to
satisfy both growers (high yielding) and industries (uniformpulp recovery), which thus help to create a profitable valuechain as indicated in improving the business performance
(Oswald et al., 2004). The clones developed and promotedin the current value chain is a technological innovation interms of high yielding and short rotation and system
innovation in terms of promotional activity through quad-partite model value chain and hence focus more on productdevelopment and marketing and thus attests the earlier
reports of value chain projects (Feller et al., 2006).
Demonstration and Horizontal Expansion
To promote the concept of clone based industrial woodvalue chain system, Pilot demonstrations in 5 districts
covering an area of 200 ha were established and the valuechain system has been demonstrated involving 212beneficiaries. This clone based industrial wood value chain
model has made significant impact resulting in horizontalexpansion of the model in another 11284 ha benefiting 4389farmers.
Buy Back Arrangement
The strong linkages among Tree Growers andIndustrial Partners has resulted in smooth and timely buy
back arrangement for the farm grown industrial woodspecies with a minimum support price of INR 2000 per
tones for pulp wood species at the farm gate. The costincurred in felling operation and subsequent transportationof the material was borne by the Industrial Partner.
This clone based Industrial wood value chain hasresulted higher yield and more price realization. Theeconomics of traditional seed based plantation model is
compared with the clone based value chain model (Table1), which indicated that the current value added clonalplantation increased the yield by 100 per cent and net revenue
by 242 per cent.
Augmenting Supply Chain into a Profitable ValueChain
The existing value chain on industrial agroforestry
involved multipartite stake holders (Fig. 5a ) wherein the
farmers or growers get the minimal revenue and the
middleman along with the traders gained maximum
benefits out of this supply chain (Pandey, 2007). Hence the
value chain on industrial agroforestry has been augmented
with quad-partite model supply chain wherein the growers
get maximum benefit (BCR 1:3.88 to 1:5.05) compared to
(BCR 1:1.66 to 1:1.91) in the existing system. Hence the
current value chain resulted in maximum net revenue to the
growers besides getting additional revenue from the value
addition due to briquetting technology. The flow of value
chain is depicted in Fig. 5b.
Impacts of Industrial Wood Value Chain
The industrial agroforestry project has createdadequate social and environmental benefits through income
and employment generation activities coupled with carbonsequestration potential.
Table 1. Benefit cost analysis of value added clone based models
Particulars Total revenue (INR) Net revenue (INR) B:C ratio
Casuarina seedling plantation
Pulp wood only 150000 72400 1.66
Pulp and pole market 172500 94900 1.91
Value added clone based plantation system
Casuarina clonal plantation system
Pulp wood only 300000 234225 3.88
Pulp and pole market 390000 324225 5.05
Casuarina based inter cropping
Pulpwood + Intercropping (black gram) 340000 261925 3.78
Pulpwood and Pole + Intercropping (black gram) 430000 351925 4.76
Pulpwood + Intercropping (groundnut) 360000 264725 4.04
Pulpwood and Pole + Intercropping (groundnut) 450000 354725 5.01
Pulpwood Supply Chain and Contract Farming
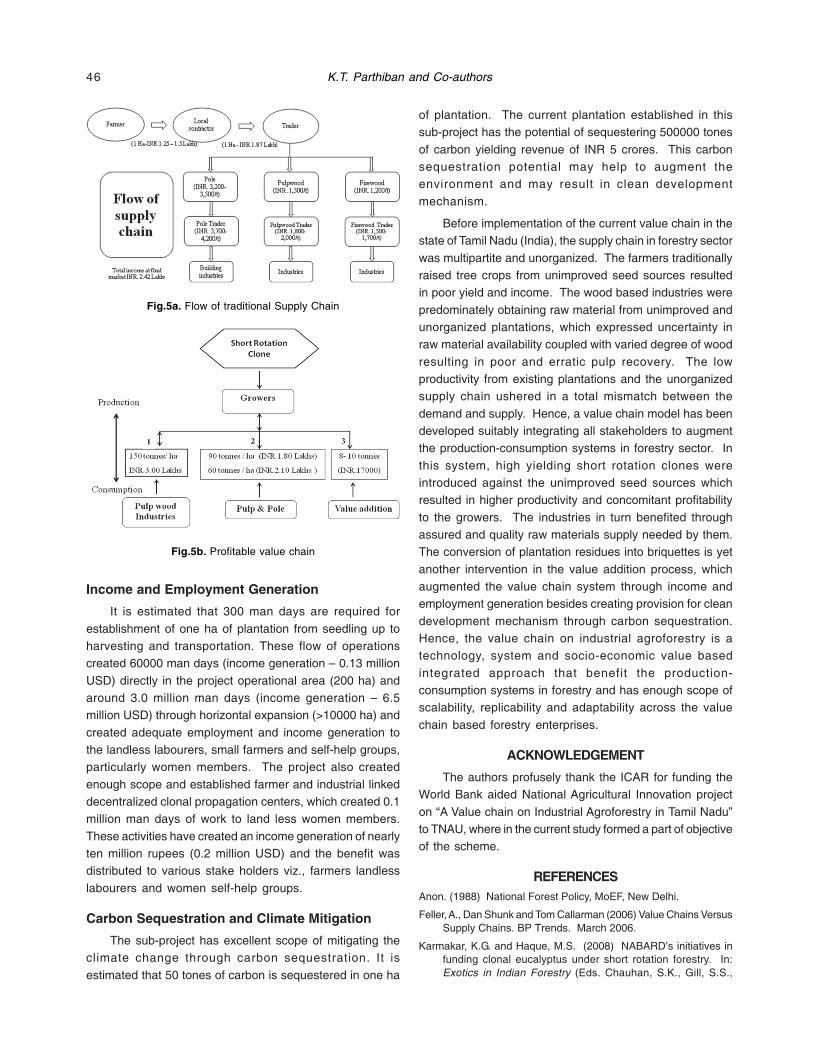
46
Fig.5b. Profitable value chain
Fig.5a. Flow of traditional Supply Chain
Income and Employment Generation
It is estimated that 300 man days are required for
establishment of one ha of plantation from seedling up toharvesting and transportation. These flow of operationscreated 60000 man days (income generation – 0.13 million
USD) directly in the project operational area (200 ha) andaround 3.0 million man days (income generation – 6.5million USD) through horizontal expansion (>10000 ha) and
created adequate employment and income generation tothe landless labourers, small farmers and self-help groups,particularly women members. The project also created
enough scope and established farmer and industrial linkeddecentralized clonal propagation centers, which created 0.1million man days of work to land less women members.
These activities have created an income generation of nearlyten million rupees (0.2 million USD) and the benefit wasdistributed to various stake holders viz., farmers landless
labourers and women self-help groups.
Carbon Sequestration and Climate Mitigation
The sub-project has excellent scope of mitigating theclimate change through carbon sequestration. It is
estimated that 50 tones of carbon is sequestered in one ha
of plantation. The current plantation established in thissub-project has the potential of sequestering 500000 tones
of carbon yielding revenue of INR 5 crores. This carbonsequestration potential may help to augment theenvironment and may result in clean development
mechanism.
Before implementation of the current value chain in thestate of Tamil Nadu (India), the supply chain in forestry sector
was multipartite and unorganized. The farmers traditionallyraised tree crops from unimproved seed sources resultedin poor yield and income. The wood based industries were
predominately obtaining raw material from unimproved andunorganized plantations, which expressed uncertainty inraw material availability coupled with varied degree of wood
resulting in poor and erratic pulp recovery. The lowproductivity from existing plantations and the unorganizedsupply chain ushered in a total mismatch between the
demand and supply. Hence, a value chain model has beendeveloped suitably integrating all stakeholders to augmentthe production-consumption systems in forestry sector. In
this system, high yielding short rotation clones wereintroduced against the unimproved seed sources whichresulted in higher productivity and concomitant profitability
to the growers. The industries in turn benefited throughassured and quality raw materials supply needed by them.The conversion of plantation residues into briquettes is yet
another intervention in the value addition process, whichaugmented the value chain system through income andemployment generation besides creating provision for clean
development mechanism through carbon sequestration.Hence, the value chain on industrial agroforestry is atechnology, system and socio-economic value based
integrated approach that benefit the production-consumption systems in forestry and has enough scope ofscalability, replicability and adaptability across the value
chain based forestry enterprises.
ACKNOWLEDGEMENT
The authors profusely thank the ICAR for funding theWorld Bank aided National Agricultural Innovation project
on “A Value chain on Industrial Agroforestry in Tamil Nadu”to TNAU, where in the current study formed a part of objectiveof the scheme.
REFERENCESAnon. (1988) National Forest Policy, MoEF, New Delhi.
Feller, A., Dan Shunk and Tom Callarman (2006) Value Chains VersusSupply Chains. BP Trends. March 2006.
Karmakar, K.G. and Haque, M.S. (2008) NABARD’s initiatives infunding clonal eucalyptus under short rotation forestry. In:Exotics in Indian Forestry (Eds. Chauhan, S.K., Gill, S.S.,
K.T. Parthiban and Co-authors

47
Sharma S.C. and Chauhan,R.). Agrotech. Public. Acad.Udaipur. 246-254 pp.
Oswald, A., Mascarenhas, Ram Kesavan, Michael Bernacchi (2004)Customer value chain involvement for co-creating customerdelight. The Journal of Consumer Marketing 21(7):486-496.
Pandey, D.N. (2007) Multifunctional Agroforestry systems in India.Curr. Sci. 92(4): 455-463.
Parthiban, K.T. and Govinda Rao, M. (2008) Pulp wood basedIndustrial Agroforestry in Tamil Nadu – Case Study. Ind. For.134(2) : 155-163.
Parthiban, K.T., Vennila, S., Seenivasan, R., Saravanan, G.P. andGovinda Rao, M. (2009) Industrial Agroforestry throughContract Farming. In: Agroforestry: Natural ResourceSustainability, Livelihood and Climate Moderation (Eds.O.P.Chaturvedi and co-authors (2009). Satish Serial PublishingHouse, New Delhi. Pp.277-288.
Porter, M. (1985) Competitive Advantage, Creating and SustainingSuperior Performance. The Free Press, New York.
Srivastava, M.B. (2005). Timber industries and non-timber forestproducts. CBS Publication, New Delhi, 518 p.
Pulpwood Supply Chain and Contract Farming

Effluents, the water that carries wastes from homes,businesses and industries, usually contains 98 per centwater and 2 per cent dissolved or suspended solids.
Globally, large quantities of effluents are being used foragriculture irrigation, industrial reuse and groundwaterrecharge. Municipal effluents are also being used in
hydroponics and constructed wetlands in France, Greece,Israel, Spain, Portugal, India and China (DPI, 2000). Forecological sustainability, effluents must be disposed off in
an environmental-friendly way to avoid groundwatercontamination, eutrophication of water bodies anddegradation of soil (DPI, 1991) and to minimize health
hazard to aquatic fauna through direct disposal in to riversand oceans (Gardner, 1995; Myers et al., 1996; CSIRO,2000).
Industrial and municipal effluents are used for landirrigation. This option is better than the hazardous and costlyoptions of direct disposal in rivers or tertiary treatments,
respectively. In developed countries effluents are irrigatedin dedicated plantations, play grounds, parks, golf courses,and race courses. However, in developing countries, most
of the industrial and municipal effluents are un-treated.These un-characterised and un-managed effluents are oftendisposed in either rivers or agriculture fields. Raising
plantations with effluent irrigation is a known, economicallysuitable, practically easy, logically feasible and vastlyreplicable practice. The use of trees has been popular
because of their reported fast growth (Stewart and Flinn,1984), high water use, and socio-economic benefits (Myerset al., 1994). The attractiveness of effluent reuse may
Symbiosis among Effluents Utilisation, Irrigated Plantation andEnergy Production
Ajay SharmaUNDP/ GEF – MNRE Biomass Power Project Management Cell, Ministry of New and Renewable Energy,
Block # 14, CGO Complex, Lodi Road, New Delhi - 110 003, IndiaE-mail: [email protected]
Abstract: Collectively, the Department of Primary Industry and Forestry (DPI&F), Central Queensland University (CQU), Livingstone ShireCouncil (Yeppoon, Qld, Australia) raised models of effluents disposal through dedicated plantations to identify efficient plantation to utilisemunicipal effluent. These plantations included both, the monoculture as well as agroforestry plantations of pangola grass, flooded gum(eucalypts) and Ma bamboo. Although flooded gum (monoculture) was found consistently efficient in utilizing effluents, other agroforestryplantations were good for utilising effluents as well as providing additional short term commercial crops. Data showed a decline in wateruse with the age of plantations as well as the absorption of hazardous element like sodium. To avoid accumulation of hazardous elementsin the soil, renewal of crops is essential, which necessitates early harvest of tree crops. Young tree crops (2 – 3 yrs) often produce polecrop that may be preferably removed to produce biomass power rather than feeding paper mills or scaffolding industries.
Key Words: Dendro-remediation, Short rotation forestry, Bioenergy
increase further by growing pulpwood, energy crop orscaffolding-poles. However, effluents, a nutrient rich,biochemical and microbial source, also initiates many biotic
processes the consequences of which are yet to beunderstood. Due to lack of sufficient information about thefate of water, nutrients, salts, biochemicals and toxins, many
effluent-irrigated plantations could have caused short aswell as long-term degradation of soils and water resources(Myers et al., 1998). Thus, land disposal of effluents has
introduced scepticisms which need to be addressed toidentify suitable best practices. Research was conductedin plant growth, water-use, nutrient cycling, and microbial
growth under different plantations to identify bestmanagement practices for effluents irrigated plantations.This present paper deals with the synergic model of effluent
disposal to raise short-term forestry plantations. Thisresearch has been mentioned only to build logic, thus,several scientific details have been omitted.
MATERIAL AND METHODS
Seven agroforestry (AF) systems consisting of pangola
grass (Digitaria decumbens; P), ma bamboo
(Dendrocalamus latiflorus; B) and flooded gum (Eucalyptus
grandis; E) were irrigated with municipal effluents at
Yeppoon, Queensland, Australia (23° 07.703´S and 150°
42.361´E at an elevation of 59 masl). The agroforestry
systems were either monoculture or mixed cropping system
i.e., pangola grass alone (P), flooded gum alone (E), ma
bamboo alone (B), BP, EP, BE and BEP (Sharma et al.,
2010).
Indian J. Ecol. (2011) 38 (Special Issue) : 48-53Indian Journal
of Ecology

49
The plantations were irrigated with treated municipaleffluent at a rate of 1.8 ML yr-1 over 1.26 ha (143 mm ha-1).
This irrigation rate was determined for this site using theMEDLI (Model for Effluent Disposal using Land Irrigation) -specialised model software for this purpose. Periodically
drawn soil samples from the irrigated plots, water samplesfrom on-site piezometers, near-by ponds and effluents usedwere analysed for microbial populations, as well as nutrient
status. Plant growth and changes in soil properties weremonitored every six months until two years age (by thenmost of the plantations had closed their canopies; and
started shedding leaves)1.
RESULTS AND DISCUSSION
Conservative Irrigation Suits Effluents PlantationSites
Based on the soil hydrology, soil nitrogen, soilphosphorus and biomass production potential in the site,
the MEDLI predicted the optimum irrigation rate of 1.43 MLha-1 yr-1. At this rate, soil evaporation was highest and runoffand drainage were lowest. MEDLI also predicted that an
irrigation rate in excess of 1.43 ML ha-1 yr-1 (optimum rateaccording to MEDLI) would result in higher runoff or
drainage threatening groundwater and near by water bodies.The crop would suffer or fail due to waterlogging and a rise
in salinity. Thus, overlooking these parameters could initiateenvironmental degradation.
Changes in water-table observed in the on-site
piezometers proved that the MEDLI forecasts were befitting.
It was observed that the water table in the study site was
initially being influenced by rainfall (Fig. 1). When the
irrigation rate was increased from 1.8 ML yr-1 (for 1.26 ha
site) to 3.3 ML yr-1 during April 2004, the watertable rose in
spite of the prolonged dry season and the absence of rain.
Furthermore, the water table receded in September 2004
within a week of changing the irrigation rate to original level
(Fig. 1). The watertable kept declining though out the second
year of plantation (April 2003 – April 2005) although sporadic
rains were received during this period. This reduction was
attributed to rapid water use by the plantations. During the
third year, the plantations could not utilise as much water
as they did in second year and hence the watertable rose
even in a relatively dry season. The rise and fall in watertable
was linked to irrigation, thus confirming the MEDLI
predictions. Although the amount of water drained could
not be quantified, but it can be inferred from these data that
Fig. 1. Changes in ground watertable in response to the increased irrigation rate during April – September 04
Effluents Utilisation in Plantation for Energy Production

50
the drainage was likely to have increased at higher irrigationrates.
Success of establishing effluent irrigated plantationsdepend on the level of water treatment, local hydrology,irrigation management and scheduling, crop management,
soil type, regional rainfall and adequate plantationmanagement (Stevens et al., 2003). Overloaded effluentsreuse plantations may only be propagating ecological
threats, and lose sustainability (Gardner et al., 1993;Gardner et al., 1997). Gradually, groundwater chloride andnitrate-nitrogen concentrations rise (Nutter et al., 1996),
microbial populations build up (Al-Nakshabandi et al.,1997), soil compaction and salinisation occurs (Shahalamet al., 1998), and sodicity reaches hazardous levels
(Surapaneni et al., 1996; Balks et al., 1998). Carefulirrigation management including irrigation management,especially during the first 12 – 18 months, or until the canopy
closure occurs, determine the success of establishingeffluent irrigated plantations (Beaver, 1993; 1996). The citedliterature and current research revealed that all effluents
irrigation sites have a ‘utility life span’. Un-monitoredeffluents irrigation cannot continue in-definitely. Build-up ofnutrients, salts, sodium and hazardous elements has to
be maintained at the minimum by using a phytoremediationsystem (plantation). However, plants cannot consume allthe nutrients, salts and chemicals provided via effluents
irrigation. To maximise the nutrient removal, the effluentsplantations needs to be removed before the leaf shedding(nutrient cycling to soil) starts (usually at canopy closure).
Rapid Nutrient Removal Essential
After applying 3.8 ML (over 1.26 ha) effluents in twoyears (too meagre; equivalent to two days production by theYeppoon sewage treatment plant), it was observed that the
flooded gum plantations could utilise up to six times morenitrogen and four times more phosphorus than that being
added via effluent irrigation (Table 1). However, theplantations could not utilise the sodium that was contributed
in abundance by the effluent. Ma bamboo and Pangolagrass were more in-efficient in taking up the soil degradingand environmentally hazardous sodium (Van de Graaff and
Patterson, 2001). A failure to remove these chemicals maydegrade soil and contaminate groundwater, eventuallydegrading water bodies.
Irrespective of the agroforestry systems, the ESPincreased from 13 to approx. 20 within first two years ofeffluents irrigation (Fig. 2). The proportion of unused sodium
and rise in ESP may threaten the soil environment. A soilwith an ESP of >15 is classified as sodic and any furtherincrease in ESP would restrict plant growth.
The plantations could utilise all the major-nutrients,except S, but were selective about micro-nutrients and Na.Plantations act as an efficient but temporary storage of
nutrients (leaf shedding bring nutrients back to soil – nutrientcycling) Thus, for sustainable nutrient management, theplantations should be harvested before the nutrients are
recycled back into the soil.
Maximise Plantation Water Use
Sapflow monitored in the two-year old agroforestry
plantations and the adjacent four-year old different spaced
flooded gum plantations using thermal dissipation
technology (Granier, 1987) revealed that the two-year old
flooded gum in the current trial was taking up more water
than the 3 m x 3 m spaced flooded gum plantation. The
flooded gum plantation spaced at 2.5 m x 2.5 m (1600 trees
ha-1) used 8481 to 25348 kg d-1 ha-1 water (5086 m3 yr-1 ha-1)
in a year (Table 2) having at least 330 days of sunny
conditions.
The number of surviving stems influences water-use
Table 1. Total plant nutrient contents (ha-1) in various plantations
Nutrient Supplied Nutrient uptake in kg
through (including ground flora)
effluent Ma bamboo Flooded Pangola
(kg)* gum
Nitrogen 109.8 220.4 725.1 242.4
Phosphorus 28.4 39.2 90.3 42.04
Potassium 40.9 304.5 396.3 361.8
Sodium 385.3 21.7 325.4 32.5
Calcium 66.4 44.1 371.7 70.74
Magnesium 28.8 27.4 116.7 33.4
Iron 0.42 1.8 5.5 1.9
*Total of 3.8 ML effluent was irrigated in two years over an areaof 1.26 ha.
Fig. 2. Soil ESP changed over two years of effluent-irrigation.The values are averages of three soil depths and seven
agroforestry systems.
Ajay Sharma

51
of that plantation. Tree water use reduces with the age(Chhabra and Thakur, 1998) and with decline in tree survival
percentage. This would ultimately forfeit the very purpose ofeffluent irrigation. Thus, consideration should be given tomaintaining high survival percentage and harvesting of the
plantations at and early age than allowing them to producetimber. Effluents irrigated plantations should be valued morefor their environmental impacts rather than timber
production, or aesthetic value. It is therefore moreappreciable to maintain an efficient effluent consumingplantation (young plantation) rather than producing timber
(long term plantation) at the cost of environmentaldegradation.
Biomass Production
Effluent irrigation resulted in mean annual increment
(MAI) of 25m3 ha-1 yr-1 and a potential biomass production of200 m3 in a monoculture flooded gum plantation at eightyears (DPI, 2003). The two-year old agroforestry plantations,
under study, also produced substantial biomass. Thebiomass data (Table 3) showed that non-woodycomponents make substantial contribution even in tree
plantations. The leaf and twig biomass are liable to slashingor senescence. If this biomass is not removed in a plannedmanner, part of the biomass will be added (via senescence
or slashing) to soil pool. Later, this loss in biomass willreduce water uptake and increase nutrient cycling in theplantations. Thus, the traditional practice of raising long
term plantation for timber will threaten the purpose of raising
effluent irrigated plantations. Thus, an early harvest isessential for maintaining efficiency of effluent irrigated
plantations. Furthermore, the traditional biomass market(timber/pole/mulch/pulp) may not use the non-woodycomponent. To facilitate early harvest, specialised marketing
strategies need to be adopted.
Although industries as well as municipal bodies usetheir effluents, mainly farmers have the opportunity to use
effluents for raising agricultural, horticultural or forestrycrops. In Australia, growing an effluent irrigated tree cropfor 3-4 years and then selling that for $20 – 23 tonne-1 was
not an economical business (ANU, 2003). Thus Australianfound that tree crop becomes economical once the cropyields 200 m3 biomass comprising of 100 m3 wood per ha
(ANU, 2003). In India also, Eucalyptus, Casuarina andLeucenea pulpwood plantations are consideredeconomically attractive at a productivity level of 30 m3 ha-1
yr-1 (dry wt) only, which is the productivity of pulpwoodplantations in coastal Andhra Pradesh and Tamilnadu(APPM, 2000, 2006).
All effluent irrigated plantations, essentially a short
rotation forestry crop, shall yield wood suitable for different
end uses. Invariably there will be some over grown stems
that shall attract premium price from scaffolding or plywood
industries. Remaining material will be useful to paper,
particle board, brick kilns (fuelwood) and bioenergy
industries. In presence of several restrictions on felling as
well as transportation, and in absence of formal biomass
market (supply chain agencies), most of the short rotation
tree crops are either sold illegally or at very poor price (low
income to farmers). In spite of presence of poplar and
eucalypts in vast areas of North India, these species are
traded usually through in-formal wood traders. Rapid growth
of private casuarina and subabul plantations in Andhra
Pradesh, that made the State a major pulpwood
procurement region, could be possible once eucalypts,
Table 2. Seasonal sapflow (g h-1) in a four-year old flooded gum plantation.
Plantation spacing Avg. Flow Trees Annual sapflow*
(m3 ha-1)
Dec 03 July 04 Planted Survival Dec 03 July 04
1m x 1m flooded gum 80 10000 95 % 6019.2
3m x 1m flooded gum 248 135 3333 93 % 6088.3 3314.2
3m x 3m flooded gum 429 176 1111 91 % 3435.1 1409.3
Flooded gum, 2yr old, AF 401.35 1600 100 % 5085.9
Ma bamboo, 2yr old, AF 152.41 3200 100 % 3862.6
Pangola grass (herbaceous)** 7899.2
* A year of 330 sunny days (having normal transpiration); ** Estimation based on mass balance and is not comparable with othermonitored value; Dec 03 was a summer and the trees were 3.5 years old and July 04 was winter and the trees were 4 years old.
Table 3. Biomass yield (tonne) in two-year old agroforestryplantations.
Ground Non- Woody Total
flora woody yield
Flooded gum 6.35 39.2 26.0 71.6
Ma bamboo 7.69 2.31 4.2 14.2
Pangola grass 14.05 - - 14.1
Effluents Utilisation in Plantation for Energy Production

52
casuarina, and subabul were completely freed from anyrestrictions and were declared ‘farm crops’. Likewise, the
bioenergy plantations also shall have to be spared from allrestrictions, and biomass markets have to be formalised(bank and insurance sector should support biomass trade
as well as biomass traders, including crop residue traders).
CONCLUSION
Land irrigation will continue to be a preferred option formunicipal effluent disposal. Conventional methods of
managing plantations may defeat the purpose of raisingeffluent plantations, as they will reduce the waterconsumption and cease nutrient uptake after canop closure.
Results of this study reveal that strict control of irrigationapplication rate is essential for maintaining ecologicalsustainability of effluent irrigated plantations. To maintain
high rate of water and nutrients uptake, it is essential thatthe tree crops be harvested in short rotation instead ofallowing the trees to produce timber. The biomass produced
from the trees in short rotations will have to be utilisedthrough non-conventional markets. Decentralised bioenergyproduction may utilise the biomass produced from
thousands of hectares of plantations annually, and provideregional biomass market for the produce obtained throughthe effluent irrigated plantations. Additional policy inputs are
needed to increase use of effluents for wood productionunder short term forestry; formalise wood as well asbiomass trade by facilitating institutions like banks,
insurance companies, informal traders as well as farmerco-operatives; and increase macro as well as micro leveldecentralised biomass energy production.
REFERENCEAl-Nakshabandi, G. A., Saqqar, M.M., Shatanawi, M. R., Fayyad,
M. and Al-Horani, H. (1997) Some environmental problemsassociated with the use of treated effluents for irrigation inJordan. Agricultural Water Management 34: 81 -94.
ANU (2003) Stumpage trends in Western Australia, ANU ForestryMarket Report #25 (September 2003), School of Resources,Environment and Society, The Australian National University,Canberra ACT, accessed on 14 September 2004, web: http://sres.anu.edu.au/associated/marketreport/report25.pdf.
APPM (2000) Guidelines to raise casuarina plantations, AndhraPradesh Paper Mills, Sriram Nagar, Rajamundry, A.P.- 533105,18pp.
APPM (2006) An introduction to cultivation of subabul, AndhraPradesh Paper Mills, Sriram Nagar, Rajamundry, A.P.- 533105,16pp.
Balks, M. R., Bond, W.J. and Smith. C.J. (1998) Effects of sodiumaccumulation on soils properties under an effluent irigatedplantation. Australian J. Soil Research 36(5)821-830.
Beaver, P. D. (1993) Planning and site evaluation: The key to improvedon-site effluents disposal. Proc. Weekend RegionalConference 1993,. Water Conservation and Reuse: Grey
Issues, Clear Solutions, Caloundra, Qld, Friday 12th - Sunday14 November 1993, Australian Water & Effluents Association(Queensland Branch), Australia, pp 11.
Beaver, P. D. (1996) Interim guidelines for the reuse of reclaimedeffluents in Queensland, Department of Natural Resources,,Brisbane, Qld, Australia.
Chhabra, R. and Thakur, N.P. (1998) Lysimeter study on the use ofbiodrainage to control waterlogging and secondary salinizationin (canal) irrigated arid/semi-arid environment. Irrigation &Drainage Systems 12 (3): 265-288.
CSIRO (2000) Today’s Water Recycling uses for Queensland,Queensland Water Recycling Strategy, Department of NaturalResources, GPO box 2454, Brisbane, Qld - 4001, 48p.
DPI (1991) Review of Effluent Disposal Practices, WaterManagement Series No. 20, Australian Water ResourcesCouncil, Department of Primary Industries, AustralianGovernment Publishing Service, GPO Box - 84, Canberra 2601.
DPI (2000) Agricultural Water Recycling Background Study, StudyReport - 2: Queensland Water Recycling Strategy, June 2000,Department of Primary Industries, Department of NatralResources, GPO box 2454, Brisbane 4001 Qld, Australia, 64p.
DPI (2003) Using recycled water to irrigate hardwood plantationsin Queensland, Department of Primary Industries, GPO Box46, Brisbane, Qld - 4001, Australia, 13pp.
Gardner, T. (1995) Concepts and practices for the reuse of effluentusing irrigation. Proc. Effluents 1995, 31 October 1995, HyattKingsgate Sydney.
Gardner, T., Bryan, A., Hu, X., Gordon, I. and Beavers, P. (1993)Land disposal of sewage effluent in Queensland: A survey ofcurrent practices and future opportunities. Proc. WeekendRegional Conference 1993,Water Conservation and Reuse:Grey Issues, Clear Solutions, Caloundra, Qld, Friday 12th -Sunday 14 November 1993, Australian Water & EffluentsAssociation (Queensland Branch), Australia, pp 18.
Gardner, T., Geary , P. and Gordon, I. (1997) Ecological sustainabilityand on-site effluent treatment systems’, Australian J.Environmental Management 4(1):144-156.
Granier, A. (1987) Evaluation of transpiration in a Douglas-fir standby means of sap flow measurements. Tree Physiology 3(4):309-320.
Myers, B. J., Bond, W.J., Falkiner, R.A., O’Brien, N.D., Polglase,P.J., Smith, C.J. and Theiveyanthanthan, S. (1994) WaggaWagga Plantaion project, CSIRO Division of Forestry,Technical Report, User Series - 17, 123pp.
Myers, B. J., Benyon, R.G., Bond, W.J., Falkiner, R.A., O’Brien,N.D., Polglase, P.J., Smith, C.J., Snow. V.O. andTheiveyanathan, S. (1996) Forest plantations for land treatmentof sewage effluent. Proc. Riverine Environment ResearchForum, 28-29 October, Murray Darling Basin Commission,Brisbane, pp 18.
Myers, B. J., Benyon, R. G., Falkiner, R. A., Polglase, P. J.,Theiveyanthanthan, S., Bond, W. J., Smith, C., Snow, V.O.and O’Brien, N. D. (1998) Environmentally sound managementof waste and nutrients in Australian effluent-irrigatedplantations, Proc. 6th NSW Recycled Water Seminar, Sydney,November 1998, AWWA - WRCC, NSW, pp 45-52.
Nutter, W. L., Philpott, L. and Morris, L. A. (1996) Long termenvironmental impacts of municipal effluents irrigation to forestsat Clayton County, Georgia, USA. Polglase, P J & Tunningley,W.M. (eds) Proc. Land Application of Wastes in Australiaand New Zealand: Research and Practice, NZ Land Treatment
Ajay Sharma

53
Collective Annual Conference,, CSIRO Canberra, 29September-5 October 1996, pp 166-168.
Shahalam, A., Zahra, B. M. A. and Jardat, A.(1998) Effluents irrigationeffect on soil, crop and environment: A pilot scale study atIRBID, Jordan. Water, Air and Soil Pollution 106(3-4):425-445.
Sharma, A., Harrower, K., Ashwath, N. and Midmore, D. (2010)Policy interventions needed to manage bacterial build-up inmunicipal effluent irrigated agroforestry plantations. Int. J.Environmental Technology and Management 13(¾): 253-268.
Stevens, D., Kelly, J., Biswas, T. K. and Guang-Guo, Y. (2003)Assessing the sustainability of schemes that reclaim waterand nutrients from effluent for irrigation in Australia. Proc.Water Recycling Australia, 2nd National conference, 1-3September 2003, Brisbane, Australian Water Association, POBox 388, Artarmon, NSW 1570, Australia, pp 68-69.
Stewart, H. T. L. and Flinn, D. W. (1984) Establishment and earlygrowth of trees irrigated with effluents at four sites in Victoria’,Forest Ecology and Management 8:243-256.
Surapaneni, A., Wrigley, R. J., Olsson, K. A., Garrett B. K. andHeuperman A.(1996) Sodicity - A potential long termenvironmental problem for effluent application on land, Proc.Land Application of Wastes in Australia and New Zealand:Research and Practice, NZ Land Treatment Collective AnnualConference, Eds. P.J Polglase and W.M. Tunningley. CSIROCanberra, 29 September-5 October 1996, pp 201-211.
van de Graaff, R. and Patterson, R. A. (2001) Explaining themysteries of Salinity, Sodicity SAR and ESP in on-site practice.Proc. On-site’01 Conference: Advancing on-site Effluentssystems, University of New England, Lanfax Laboratories,Armidale, NSW 2350, Australia, pp 361-368.
Effluents Utilisation in Plantation for Energy Production

There is a need to shift from first generation biofuels tosecond generation biofuels for energy production. First
generation biofuels use feedstock like soybean and maizefor production of biodiesel and ethanol, respectively. Thesefeedstocks have other competing use as food for humanconsumption. Hence, their use as fuel has to be restricted.
Lignocelullosic biomass is considered to be a secondgeneration biomass feedstock for use as fuel for generationof power and energy. Lignocellulosic biomass like woody
biomass from trees is an example of second generationbiofuel. Second generation fuels are also moreenvironmental friendly. Various nations have set up different
standards for quanlifying a fuel as a second generationfuel based on environmental considerations. For example,renewable fuels standards in the USA mandate that the
second generation fuels must save at least 50 % greenhouse gases (GHG).
This paper will focus on the lignocellulosic biomass
technologies that are relevant to the developing countriesand have the potential to be adopted in the near future.Gasification is one such prominent technology and hence
will be in focus for sustainable power generation from shortrotation forestry (SRF) biomass (Ravindranath et al., 1990).
Biomass Based Renewable Energy Processes
The broad areas for the conversion of biomass to
biofuels, with particular emphasis on lignocellulosicbiomass have been presented in Fig. 1. There are two maintypes of processes viz., thermochemical and biochemical
for the conversion of lignocellulosic biomass to biofuels. In
Short Rotation Forestry for Sustainable Power Production
Rajesh SoniSchool of Energy Studies for Agriculture, Punjab Agricultural University, Ludhiana -141 004, India
*E-mail: [email protected]
Abstract: Severe shortage of energy has led to search for alternative sources of energy. Energy from biomass is one attractive optionas it is a renewable resource. Currently the focus is on obtaining power from lingocellulosic biomass like agricultural residues which areavailable in large quantities and are not required for human consumption. The drawback of agricultural residue for power generation is itslow bulk density and seasonal availability, which increases its transportation and storage cost for continuous power generation. Thesefactors limit the scale of power generation, raising serious concerns about the economic viability of lignocellulosic biomass based powergeneration systems. Biomass from short rotation forestry (SRF) is an attractive source for sustainable production of power from biomass.Biomass from SRF can be harvested year round and its higher bulk density allows for a concentrated source of energy for powergeneration. These factors allow for power generation on a higher scale, thereby improving the sustainability of the power generationsystem. This paper provides an overview of existing commercial technologies and the role of SRF in sustainable power production fromlignocellulosic biomass.
Key Words: Bioenergy, Lignocellulosic biomass, Gasification
general, the biochemical processes are employed for wetbiomass, while the thermo-chemical processes are
employed for the dry biomass. Another important criteria forthe choice of conversion process pertains to the amount oflignin in the biomass. As lignin does not degrade easily bybiochemical means, the biomass with higher lignin content
are converted to fuels via the thermochemical route.
SRF in Perspective
In developing countries, agriculture remains thepredominant land use category. Traditional forestry is
another important land use category. Forests have a veryimportant role to play in protecting the environment. Theyare also a renewable source of a wide variety of useful
industrial products. Most developing countries need toprotect these forests and enhance their forest cover. Forexample, in India the total forest and tree cover is only
23.84% as against the recommended forest cover of 33 %(FSI 2009). Due to growth in population, land is also beingdiverted to infrastructure and related activities. Therefore,
due to intense pressure on land for various competing usesthe scope for increasing area under SRF is limited indeveloping world.
Estimating biomass availability from SRF indeveloping countries. In developing countries, most of thefarmers have limited land holdings. As such, most farmers
need to put their land under conventional farming to have aregular source of income. SRF activities block the moneyfor a few years and this is beyond the reach of most farmers.
However, farmer with large land holdings are able to put
Indian J. Ecol. (2011) 38 (Special Issue) : 54-59Indian Journal
of Ecology

55
some of their land under SRF plantation. In India, farmer’s
SRF plantations are generally small as compared to thosein the developing countries. Most SRF plantations are lessthat 50 ha. Taking a sustainable productivity of 20 dry tons/
ha/yr for a six year short rotation forestry with Eucalyptusclones, the maximum biomass production available with afarmer with 50 ha under SRF comes to be 1000 dry tons/
year. This figure is towards the higher side for individualfarmers SRF plantations. Although there is no reliable wayto estimate the amount of biomass that can be made
available through SRF for power production at onedecentralized location, an assumption is made here thatabout ten times the above amount can be made available
at one decentralized location at price ranging between Rs3.50-4.00/kg. We will see later in this paper that restrictingthe price of wood to this level is important for the economic
viability of the electricity generation process from SRF wood.
Overview of Power Production Technologies withSRF Biomass in Developing Countries
Now we look into the possible conversion routes forpower production from this SRF biomass. Biochemical
conversion processes like fermentation require an order ofmagnitude more biomass than indicated above forsustainable and economic operation. Hence these
processes are absolutely not sustainable with SRF indeveloping countries. Even in developed countries, at currentlevel of development, the biochemical processes are costlier
than the thermo-chemical conversion processes. Thermo-
chemical processes like combustion and gasification,
which can be operated at medium to small scale, are morerelevant for SRF based biomass. Pyrolysis process arestill in the developmental stage and have not been
commercially exploited for lignocellulosic biomass.
At the level of 10,000 dry tons/year biomass from SRF,
the combustion based processes are also not sustainable.
This is because combustion processes employ high
pressures for power generation. This necessitates careful
handling and thus trained technical personnel are required.
This in turn increases the cost of production of electricity. In
developing countries, biomass from SRF is used only to
supplement agricultural residues and other wastes in
electricity production in decentralized ways using
combustion based processes. The range of electricity
generation in this case generally ranges from 5 MWe to 20
MWe and may extend even higher in certain cases.
In contrast, gasification based processes are muchsimpler since these can be carried out near atmospheric
pressure. On very small scale (<50 kWe), they can be evenhandled by 1-2 semi-skilled workers and all operationscan be carried out manually. For small scale gasification
(up to 500 kWe), some operations are automated but theoperations still much simpler and safer than combustionbased processes. However for electricity production at this
level and its distribution to end users, the services of fewtechnical persons is required. Hence Gasification processis best suited for SRF biomass in developing countries.
Fig. 1. Routes for conversion of biomass to various fuels
Short Rotation Forestry for Power Production

56
Introduction to Gasification of Biomass
Gasification is a thermal conversion process in whicha solid fuel is converted into heat and a combustible product
gas. The process may be carried out by direct or indirectheating. For the purpose of power production at small scalein a decentralized way in, the simpler method of gasification
by direct heating is employed. In direct gasification, thebiomass is partially oxidized using air as the gasifyingmedium to provide a mixture of gases commonly referred
to as producer gas. The overall reaction in biomassgasification can be represented as
CH1.4O0.6 + n (0.21 O2+0.79 N2) → [CO + H2 + CO2 + H2O
(Biomass) (Air) (Producer Gas)
+ CmH2m+2 + Tars] + Char + Ash
Here CH1.4O0.6 is the generalized formula of biomass.The producer gas contains Carbon Monoxide and Hydrogen
as the main combustible gases. Small amounts of methaneand higher hydrocarbons may also be present dependingupon the type of gasifier and the reaction conditions. Since
air contains 79 % Nitrogen as inert matter, the producergas obtained by using air as gasifying medium is alsodiluted by the nitrogen content. This producer gas has a
calorific value in the range of 4-6 MJ/Nm3. The gas alsocontains various contaminants like tar, solid particulatematter, organic acids, compounds of N, Cl, S and alkali
metals. Depending on the end use of producer gas, thegas needs to be cleaned to various degrees.
Different processes and operations occurring in the
gasifier reactor are mainly in four reaction zones viz.oxidation, reduction, pyrolysis and drying. The sequence ofreaction zones in a gasifier depends on the type of gasifier
and direction of flow of fuel and air or gas.
The oxidation zone is also referred to as combustionzone. In the oxidation zone, carbon and hydrogen of the
biomass are oxidized to carbon dioxide and water vapor inaccordance with the following reactions.
C + O2 → CO2 + 393.8 MJ kg-mol-1 (1)
H2 + 1/2 O2 → H2O (g) + 241.5 MJ kg-mol-1 (2)
Almost all the oxygen required in gasification processis used up in the oxidation zone. The temperature in theoxidation zone range from 800 to 1300 °C, depending upon
the type of the gasifier and fuel. Carbon dioxide and watervapor at high temperature move into the reduction zone.
In reduction zone, carbon dioxide and water vapors are
reduced to carbon monoxide, hydrogen and methane inaccordance with the following reactions.
Water gas reaction:H2O + C → CO + H2 - 122.6 MJ kg-mol-1 (3)
Boudauard reaction:
CO2 + C → 2CO - 172.6 MJ kg-mol-1 (4)
Water gas shift reaction:
CO2 + H2 → CO + HO - 41.2 MJ kg-mol-1 (5)
Methane formation reaction:
C + 2H2 → CH4 + 75.0 MJ kg-mol-1 (6)
Reactions 3 to 6 are the main reduction reactions andare reversible. For reaction 3, the equilibrium temperature
is about 900°C. The equilibrium temperature for reaction 4is about 1100oC. Equilibrium temperature for reactions 5and 6 is 700 to 600°C. It indicates that the higher reactor
temperature during gasification process favors higherconcentration of CO and H2 in the producer gas. The lowreactor temperature leads to higher methane in producer
gas.
In pyrolysis zone, the volatile matter in biomass getsvaporized due to the available heat in the reactor. The
pyrolysis of volatile matter takes place between 200 and600oC.
In drying zone, the moisture in the biomass is reduced
due to the available heat. Temperature in this zone are lessthan 200oC. (Higher temperatures lead to pyrolysis asindicated above).
Gasifiers Suitable for SRF Biomass in DevelopingCountries
Three types of gasifiers are generally employed for
conversion of coal or biomass to gaseous products. These
are generally referred to as fixed bed, fluidized bed and
entrained bed gasifiers. For small scale applications with
biomass as the solid fuel, fixed bed gasifiers are more
appropriate because of the simplicity of their design and
ease of operation. The availability of wood from SRF is
limited and gasifier operation with this type of wood will be
essentially on a small scale. Hence for biomass conversion
processes using SRF based wood in developing countries,
the fixed bed type gasifier will be employed. The fixed bed
gasifiers of interest are the updraft and downdraft gasifiers.
The main features of updraft and downdraft gasifiersare briefly explained below. The details of these gasifiertypes are readily available in standard text books dealing
with renewable energy as well as specific books/handbookdealing with gasification technology (Anon., 1979; Kauppand Goss, 1984; Reed and Das, 1988). Here the key
Rajesh Soni

57
Fig. 4. Schematic of downdraft throatless type gasifieroperation
features of these gasifiers relevant to power production arebeing discussed.
1. Updraft gasifiers.The schematic representation of this
type of gasifier is shown in figure 2. In this type of
gasifiers, the air is introduced from the bottom and the
producer gas is taken from the top. This gasifier has
better thermal efficiency than the downdraft gasifier.
However, the gas quality is poor and the gas needs to
be extensively cleaned for engine and electric power
applications. The updraft gasifiers have been mainly
used for close coupled thermal applications. There are
also a few instances of large scale applications of
updraft gasifiers for electric power generation in
developing countries.
2. Downdraft Gasifiers
These type of gasifiers come in two broad categories,the imbert type, which have a throat or constriction and the
throatless type. These are discussed below
a) Imbert (with throat) gasifiers. This type of gasifier
requires fuel of uniform size with good flow properties.
The producer gas obtained from this type of gasifier
contains the least amount of tar of all the types of
gasifiers. Woody biomass (including SRF biomass) is
the best feedstock for this type of gasifier if the producer
gas is to be used for engine applications (Fig. 3).
b) Throatless gasifiers. The schematic diagram of this
type of gasifier is shown in figure 4. This type of gasifieris also referred to as stratified or open core gasifier.Thistype of gasifier is designed basically for fuels with flow
problems e.g. rice husk. This gasifier canaccommodate a wider variety of fuels and can be easilyupscaled. The tar content of producer gas from this
gasifier is more than that obtained from the downdraft
Fig. 2. Schematic diagram of updraft gasifier
gasifiers having throat.
This type of gasifier is more suitable for thermal
applications. It is also been used for electric power
production from agricultural residues, particularly rice
husk.
Applications of Producer Gas Obtained fromBiomass Gasification
Producer gas is currently being employed commerciallyfor mainly two types of applications
Thermal power applications. There are variousapplications for thermal power like hot water/steam andhot air requirement in Industry. Mainly updraft gasifiers are
Fig. 3. Schematic diagram of downdraft Imbert type gasifier
Short Rotation Forestry for Power Production

58
employed for this purpose. Roughly 4 kg of sun dried woodcan substitute for one litre of furnace oil or diesel. This
results in reducing the running cost of the furnaces byatleast 40 per cent in India. Combustion based furnacesare being retrofitted with fixed bed gasifiers (mainly updraft)
in significant numbers. Same is true for other applications(hot air/water, etc). Hence, the technology is alreadysustainable with all kinds of biomass including biomass
from SRF. Most low grade solid fuels like cow dung, biomassbriquettes, etc., which are usually available at prices lowerthan the woody biomass can also be used in updraft
gasifiers for thermal applications.
Mechanical power through engine (and electricitygeneration). Biomass gasification on small scale for engine
applications is carried out with downdraft gasifiers becausethese type of gasifiers produce a cleaner gas which is bettersuited for engine applications. The technology for production
of producer gas through the downdraft gasifiers have beenestablished for a variety of biomass based substrates.Schematic of a throatless downdraft gasifier for electric
power generation is shown in figure 5 to provide an overviewof the electricity generation process with rice/paddy huskas a fuel. In this process, a series of gas cleaning steps
are placed for cleaning the gas before it is introduced intothe compression ignition engine. At a power output of 10kWe from such a system run in dual fuel mode, 25 % of the
energy in engine is obtained for diesel fuel (used mainly forstarting the ignition process) and the rest is obtained fromproducer gas.
However, the field application of use of gasifiers forengine application on small scale has had limited success.There are various reasons for this. A few important reasons
are listed below.
a) For engine applications, the gas needs to be cleaned
There are a variety of contaminants in the producer
gas. The tar and the solid particulate matter are the
more critical contaminants. The Ministry of New and
Renewable Energy (MNRE) in India sets a maximum
limit for the tar and solid particulate matter in the
producer gas as 100 and 50 mg/Nm3, respectively for
engine applications. For obtaining a gas clean enough
for engine applications, a series of gas cleaning steps
are introduced after the gasifier. These add to the cost
of the system and also create a pressure drop in the
system, which has to be overcome by the engine.
b) The gas quality from gasifier deteriorates rapidly with
deviation from the rated output of the gasifier.
The gasifier must be run near it’s rated/design capacity
for its proper utilization in engine (Note that this is not
critical for thermal applications). So the gasifier has
been used in the past for constant load applications
like water lifting for irrigation at farmers’ fields. Activities
like irrigation are seasonal, therefore utilization remains
low, hence the benefits of gasification are not fully
realized and returns are low.
c) There is an additional fixed cost of engine and alternator
for electricity generation activities
All these factors add to complexity of systems used for
engine applications over those used for thermal applicationsof gasifiers. Hence gasifier systems in lower power range,even though economical, are not being used widely.
However, engine application is a more efficient andversatile energy conversion process for power generationthan the thermal power route. The short rotation forestry
Fig. 5. Schematic of throat less gasifier engine system for electricity production
Rajesh Soni

59
All dimesnions are in mm
Fig. 6. Schematic diagram of a 20 kWe Imbert type biomassgasifier
biomass is also well suited for electricity production, sinceit can be used as a fuel in the imbert type gasifiers thereby
producing a clean gas. This aspect is discussed belowwith reference to the sustainability of electricity production
Gasification technology for sustainable electricpower production from SRF biomass. Gasificationtechnology has been demonstrated with woody biomassfor electricity power production. The School of Energy Studies
for Agriculture at Punjab Agricultural University, Ludhianahas demonstrated the use of Imbert type downdraft gasifiersfor electricity power production at 20 kWe level. The
schematic diagram of one such gasifier is shown in figure6. An economic analysis of this gasifier is considered undertwo level of operation of the gasifier viz., 1000 and 3000
hours per year. The gasifier is operated under dual fuelmode with about 70 per cent of the energy coming fromproducer gas and the rest coming from diesel. The following
realistic assumptions are made:
Assumptions for calculating economics of 20 kWeImbert Gasifier system:
1. Cost of gasifier system Rs. 1,30,000
2. Cost of diesel genset, 25 kWe Rs 3,20,000
3. Operating hours per year a) 1000 b) 3000
4. Wood consumption 1.2 kg/kWh
5. Diesel consumption(duel fuel) 0.08 l/kWh
6. Cost of wood Rs. 4000/t
7. Cost of diesel Rs. 38/l
8. Interest on fixed cost @12% PA
9. Maintenance @ 10% of fixed cost
With the above assumptions, the cost of electricitygeneration, Rs/kWh for both the systems under a)1000 andb) 3000 hours of operation is given below
— Dual fuel mode (with gasifier) a) 12.54 b) 8.94— Diesel engine generator a) 15.68 b) 13.33
Based on these figures, the payback period of the
gasifier come out to be 2.0 years and 0.5 years, respectively.Thus, it can be seen that the technology of biomassgasification with SRF biomass is economically favorable
and sustainable.
CONCLUSION
SRF biomass can provide a sustainable source offeedstock for electricity production. The gasification
technology with SRF biomass has been successfullydemonstrated at a number of places in the India and othercountries of the developing world. It has been used by the
farmers for individual use at their farms. Several privateentrepreneurs have also set up units in the 100 kWe scalefor distribution of electric power. However, this has been
restricted to areas with poor grid electricity supplies. In thisaspect, SRF plantations can play a big role in makingsubstantial amounts of woody biomass available at a
reasonable price for the wide scale adaptation of thegasification technology for electricity power generation. Thiswill make a significant contribution in ameliorating the
power shortages in the developing world.
REFERENCESAnonymous (1979) Generator gas, the Swedish experience from
1935 to 1945. Solar Energy research Institute, Golden,Colorado, USA (1979), SERI/SP-33-140.
FSI (2009) India State of Forest Report 2009. Forest Survey ofIndia, Dehradun, 199p.
Kaupp, A. and Goss, J.R. (1984) Small scale gas producerengine system. GATE/GTZ, Germany Public., 1984.
Ravindranath N.H., Dattaprasad, H.L. and Somashekar, H.I. (1999)A rural energy system based on energy forest and woodgasifier. Curr. Sci. 59(11): 557-560.
Reed, T.B. and Das, A. (1988). Handbook of doundraff gasifierengine system. Solat Technical Information Program, SolarEnergy Research Institute, Golden, Colorado, USA, SERI/SP-271-3922.
Short Rotation Forestry for Power Production
The global energy crisis is profoundly affecting thedeveloping countries, which contain three quarters of theworld population. Experiences of Asian countries show
that biomass energy plantation projects are not appropriatefor achieving the social objective of poverty alleviation. SriLanka is gaining popularity in organic tea production as a
health beverage. The environmental and economic benefitsof using Dendro-thermal energy (DTE) in organic teaproduction have not been investigated in Sri Lanka. Further
development of renewable energy sources has become anational priority in Sri Lanka and in many other Asiancountries for energy security. The global energy crisis is
profoundly affecting the developing countries, which containthree quarters of the world population. The importance of apolicy to facilitate (DTE) generation using biomass for
sustainability and decentralization has emerged(Ranasingha, 2006). Experiences of Asian countries showthat a biomass energy plantation projects are not
appropriate for achieving the social objective of povertyalleviation (Ranasinghe et al., 2007). Some factors thatincreasingly work against biomass production are the higher
cost of land caused by increased population pressure ofland for food, other purposes and the price of oil, which isstill declining in real terms. Hence, supply of biomass fuels
should be based on byproducts of agro products andmultiple use trees and other trees intercropped with other
Economic and Environmental Sustainability of using Dendro-energyin Organic Tea Industry in Srilanka
S. Thiruchelvam*, V.M.B. Athula Priyantha1 and Narayansuwamy SomokanthanDepartment of Agricultural Economics and Business Management, Faculty of Agriculture, Postgraduate Institute of
Agriculture, University of Peradeniya, Peradeniya, Sri Lanka; 1Norway Development Fund, Kand, Sri Lanka*E-mail: [email protected]
Abstract: The global energy crisis is profoundly affecting the developing countries, which contain three quarters of the world population.Experiences of Asian countries show that biomass energy plantation projects are not appropriate for achieving the social objective ofpoverty alleviation. Sri Lanka is gaining popularity in organic tea production as a health beverage. The environmental and economicbenefits of using Dendro-thermal energy in organic tea production have not been investigated in Sri Lanka. This study was designed toassess the economic and environmental sustainability of dendro-thermal energy for curing of tea in organic tea production. The data wascollected from an organic tea producing factory and 33 randomly selected fuel wood suppliers in the Badulla District in 2008. Extendedbenefit cost analysis was carried out to evaluate the economic and environmental sustainability of dendro-energy use in drying tea Benefittransfer method was employed to value the environmental sustainability such as reforestation, biodiversity, soil erosion and soil fertility.Thestudy revealed that the annual economical gain of using dendro-power for tea dry was Rs. 7,548,000 with other social and environmentalbenefits. The economic analysis results showed that the dendro-thermal had an overall benefit. Sensitivity analysis suggests that nouncertainties exist in transferring fossil fuel to dendro-thermal energy use in organic tea curing. Most farmers who supply bio mass hadpositive perception on continued supply. Since land size of each farm is limited, organizing contract farming with large groups is importantto meet the fuel wood demand. These results also show that there is a good level of increase in soil conservation and soil fertility byconserving bio diversity with the dendro-thermal fuel wood supply. Immediate economic benefits and the protection of soil and water cango hand in hand especially when enhanced by collective action.
Key Words: Organic tea, Dendro-thermal energy, Extended benefit-cost analysis
crops for conservation purposes and soil enrichmentpurposes (FAO, 2000). However, the present oil prices arezooming up. Since Sri Lanka introduced organic tea to the
world market in early 1990’s, it is gaining popularity,especially as a health beverage. While hundreds of
thousands farmers in the developing countries practice
organic agriculture, the potential gain in organic tea
production is in a dilemma of how to overcome this problem
of mainly being non attractive to the local suppliers of
biomass as a renewable energy. According to IAFN (2007)
usage of fossil fuel must be limited up to 40 per cent in
energy usage in tea estate which are certified under Forest
Garden Product Inspection Service (FGPIS). Hence supply
of biomass fuels should be based on by products of agro
products and multiple use trees and other trees
intercropped with other crops for conservation purposes
and soil enrichment purposes.
Against the above discussed background, this study
was designed to assess the economic and environmental
sustainability of DTE for curing of tea in organic tea
production to generate much needed foreign exchange for
Sri Lanka. The specifically objectives of the study were to
carry out an extended benefit cost analysis and to find out
the feasibility of establishing a dendro-power unit in tea factories
of Sri Lanka.
Indian J. Ecol. (2011) 38 (Special Issue) : 60-62Indian Journal
of Ecology

61
MATERIAL AND METHODS
The study was carried out in Thotatagala and otherorganic certified factories tea factories, in Haputale and
Haldummulla divisional secretariat divisions in Badulla.Due to high reputation, Thotatagala tea factory waspurposely selected for economic investigation for organic
tea production. From the two divisional secretariat divisions,11 organically certified tea small holder farmers, 12
organically certified spices farmers and 10 organic spices
farmers were randomly selected. Thus, the fuel wood
suppliers were restricted to 33 farmers. Data on biomass
production, labour use, cost and returns in fuel wood supply,
soil and water conservation, soil erosion, biodiversity, micro
climatic change etc., were collected during June and July in
2008 by using a pre-tested interview schedule. In addition,
data was collected from 4 Gliricidia collectors who collect
Gliricidia from farmers and supply to the tea factory. Supply
base from Thotatagala estate and other organically certified
farms were also analyzed. Supply base from Thotatagala
estate and other organically certified farms were also
analyzed. Extended benefit cost analysis was carried out to
evaluate the eco-friendly nature and economic and
environmental sustainability of DTE use in drying tea.
Benefit transfer method was employed to value the
environmental losses avoided such as deforestation,
biodiversity losses, vulnerability of landslides, soil erosion
and soil fertility losses. The calculation of the environmental
valuation in this study was adopted from Gunatillake and
Thiruchelvam (2003). Sensitivity analysis was carried out
at 6, 10 and 18 per cent discount rates. Cost increase by 10
and 20 per cent were also tested. In transferring market
price into economic price, shadow price and conversion
factors such as labour 0.92, energy 0.92 and material cost
0.88 were used. In order to investigate the problems faced
by fuel wood suppliers, a Likert-scale with ranking the
problems was employed. Farmers’ perception on
contribution of Gliricidia in fulfilling the international organic
standards was estimated by using ranking method.
RESULTS AND DISCUSSION
Economic analysis showed that for the drying of onekg of tea required 0.8 kg of Dendro fuel and the cost of
drying using Dendro fuel was 7.45/kg of tea. The cost ofdrying with diesel was US $ 0.351/kg. The cost of Dendrofuel was US $ 0.546/ kg. Hence annual saving from usage
of dendro fuel was US $ 68,618.18 for the company havingthe capacity of 240,000 kg of made tea. Annual dendro fuelrequirement for Dendro power plant was 300,000 kg and
out of which potential company owned farms’ supply basewas 160,000 kg which was 53 per cent of the requirementdendro fuel (Table 1). Hence 140,000 kg have to be supplied
from outside the company owned farms. Production ofdendro fuel in organically certified tea gardens and spicegardens under company out grower system was 1,050,000
kg which was over 4.5 times of the requirement. In additionto that 320,000 kg green manure and 19,200 kg wood ashwere produced from dendo fuel within company owned
farms as by products which will be a support to fertilitymanagement of organically certified lands. Both financialand socio-economic analyses show validity of the supplying
fuel wood on an environmentally friendly basis. About 90per cent of the farming population owns sufficient mixedspice gardens and tea gardens with Gliricidia plants for the
supply of dendro fuel and the storage of Dendro fuel aremade possible by the arrangements made by the factories.
A farmer earned US $ 161.9 from fuel wood supply in
addition to his primary income from farming. This incomewas obtained from spending 35 working days annually toprepare dendro-fuel. Further, farmers became convinced
of other major advantages, such as reduced soil erosion,moisture conservation, and retention of soil fertility andproductivity. Advantages are clearly visible when comparing
their fields with those practicing inorganic or conventionalfarming. It was found that Gliricidia can replace 50 per centrequired fertility for pepper cultivation that is saving of 700
kg of fertilizer per 0.4 ha. Thus pepper cultivators can supplythe total requirement of Gliricidia. Replacement cost offertilizer revealed that US $ 181.82/ha could be saved
S. Thiruchelvam, V.M.B. Athula Priyantha and Narayansuwamy Somokanthan
Table 1. Potential production base and supply of Gliricida stick company owned and received from out growers of mixed spicegarden and tea
Source of Gliricidia Amount kg/year for % of total requirement % of actual
dendro dryer for dendro dryer supply
Annual requirement for dryer 300,000 100
1 Total from company owned lands 160000 53 62
2 Small scale organic tea farmers 92500 31 -
3 Koswattha estate 60000 20 20
4 Organic mixed spices farmers 1050000 450 18
Total potential production 1522500 507 100

62
from Gliricidia inter-cropping. Likert scaling analysis
revealed that most farmers’ perception was high in
continuing supply of fuel wood. Regarding farmers’ degree
of satisfaction in drying, storing and transport of sticks, price
received for fuel wood, contractual arrangement, it was found
that organizing better contractual arrangements with large
groups would meet the fuel wood demand. Financial cost
and benefits were 3.82 and 2.24 for dendro-energy and
fossil fuel energy respectively. These values at 6 per cent
discount rate in the economic analysis were 2.65 and 1.46
for dendro-energy and fossil fuel respectively (Table 2). The
results of sensitivity analysis revealed that the relative less
sensitivity to the benefits and cost changes. The effect was
less in the long run. This was mainly due to more
environmental benefits gained from the biomass production
and use of fuel wood in curing tea. These incremental
benefits from environment give many promises for the other
factories to follow the use of DTE with the better institutional
arrangement with the suppliers. When cost increased by
20 per cent fossil fuel energy use become non economical
while dendro-energy use continue to be above BCR of 2.4.
Table 2. Result of extended benefit cost analysis for Dendro-plant and diesel pant for a five year production period
Items Discount rates (%)
6 10 18
Dendro-plant
NPV US $. Mil 2.34 2.23 2.53
EBCR 2.65 2.65 2.65
Diesel plant
NPV US $. Mil 1.04 0.95 0.80
EBCR 1.47 1.47 1.45
The study revealed that the annual economical gain ofusing dendro-power for tea dry was US $ 68618.18 withother social and environmental benefits. The economic
analysis results showed that the dendro-thermal had anoverall benefit. Sensitivity analysis suggests that no
uncertainties exist in transferring fossil fuel to dendro thermalenergy use in organic tea curing. Most farmers who supply
biomass had positive perception on continued supply. Sinceland size of each farm is limited, organizing contract farmingwith large groups is important to meet the fuel wood demand
these results also show that there is a good level of increasein soil conservation and soil fertility by conserving biodiversity with the dendro- thermal fuel wood supply.
Immediate economic benefits and the protection of soil andwater can go hand in hand especially when enhanced bycollective action.
ACKNOWLEDGMENT
The authors wish to acknowledge the cooperation
extended by Thotatagala Tea Factory, Green Field Bio
Plantation Limited, other organically certified spice farmers
and tea small holders in Haputtale and Haldummulla
Divisional Secretariat areas for their support in providing
data.
REFERENCES
FAO (2000) Options for Dendro power in Asia. Report on theexport consultation regional wood energy developmentprogram in Asia GCP/RAS/154/net 1-18.
Gunathillake, P.M.P.C. and Thiruchelvam, S. (2003) An evaluationof small-scale hydropower development project in Sri Lanka:A case study in Sripadagama. Trop. Agric. Res. 15: 288-298.
IAFN (2007) Forest Gardens Products Standards. InternationalAnalogy Forestry Network.
Ranasingha, D.M.S.H.K. (2006) Asia socio economic study on thedendro power project at Kumalgamuwa, Walapane AsiaProecp Program.
Ranasingha, D.M.S.H.K., Vanniarachi, A., Jayarartne, T. andAmarasena, S. (2007) Potential and socio-economics ofusing dendro energy in Sri Lanka - a case study of the Dendroplant in Kumalgamuwa, Walapane. Proc. Int. Forestry andEnvir. Sympo. 2007, Univ. Sri Jayawardenapura, Sri Lanka53.
Dendro-energy in Organic Tea Industry

The genus Acacia comprises of about 1,200 speciesthat are distributed worldwide spread but with a large numberin Australia. Among these, A. auriculiformis and Acaciamangium are recognized for its ability to grow on poor soils.Both A. auriculiformis and A. mangium have been plantedin many countries such as Indonesia, Thailand, Myanmar,
India and Malaysia as wood source especially for pulpmaking industry. Acacia hybrid is a new taxon, which is aputative hybrid between the A. auriculiformis and A. mangiumfound in Sabah, Malaysia and such Acacia hybrids are alsorecorded in captive pulpwood plantations of Mysore paperMill, Bhadrvati, India (Amanulla et al., 2004).These hybrids
are relatively fast growing and has shown more superiorcharacteristics than the parental species and due to its fastgrowth and wood production, is gaining prominence as a
source of wood fibre for the paper industry (Choong et al.,2005). Inter-specific hybrids have a major role in marginalsites as they perform better than the pure species in such
problematic areas. The high degree of genetic variationprevalent in the new taxon provides ample scope for treeimprovement and clonal propagation and selection/clonal
propagation is essential to capture the heterosis.
Capture and storage of CO2 from the atmosphere isgaining attraction as means to deal with climate change.
Role of forests in the global carbon cycle is well-documented (Kirschbaum, 2001) and forest plantation playan important role in carbon dynamics in atmosphere.
Synergies of Wood Production and Carbon Sequestration throughAcacia Hybrid Clones
S. Vijaykumar*, R. Hegde, N. M. Poonacha, Ashok Kumar Chaudhary1 and M. R. KarkiCollege of Forestry, Ponnampet, University of Agricultural Sciences, Bangalore-571216, India
1Research Wing, Karnataka Forest Department, Bangalore, Karnataka, India*E-mail: [email protected]
Abstract: Acacia hybrid is a new taxon which is a putative hybrid between the A auriculiformis and A. mangium. The new taxon isrelatively fast growing and in order to capture the heterosis, the taxon is propagated vegetatively. After six years of planting, growth andyield attributes of different clones were assessed. Existence of variation in growth performance of different clones was evident in thestudy. Considerable variation was also observed in the above ground biomass production of different clones. Out of the 12 clonesstudied, four clones allocated 50 per cent of the total biomass to bole wood production. Most of the clones had more than 10 per cent oftheir biomass as clone HD-12. Biomass allocated for bark production was less than 10 per cent of the total above ground biomass in mostof the clones and around 15 per cent of the above ground biomass was distributed in for branch wood production in all the clones exceptclone H-10. Estimated volume of different clones varied from 8.99 m3/ha to 37.36 m3/ha with mean annual increment of 1.05 m3/ha to 6.23m3/ha,whereas, above ground biomass varied from 10.20 t/ha to 40.07 t/ha with a mean of 22.85 t/ha. Above ground carbon stock indifferent clones varied from 5.10 t/ha to 20.03 t/ha with a mean annual above ground carbon sequestration of 0.85 t/ha/yr to 3.34 t/ha/yr.
Key Words: Acacia hybrid clones, Biomass partioning, Carbon sequestration
Establishment of plantations to mitigate increased CO2 inthe atmosphere is one of the key options in reducing globalwarming. A thorough literature survey revealed that little effort
has been made quantification of carbon capture by differentgenotypes in plantations. Present study envisaged toassess the biomass production of different clones,
understand the yield and carbon stock in different clones ofAcacia hybrid in Mysore.
MATERIAL AND METHODS
The present study was carried out in clonal plantations
of Acacia hybrid located at Forest Research Station,Madahally near Mysore in Karnataka (Latitude N 120 15’13.2", E 760 30’ 54.9" longitude and altitude of 808 m above
MSL). The area has red laterite soil with gentle slope withpH 6.3. Mean annual rain fall in the area is 771.86 mm andmean temperature is 35.6o C.
Acacia hybrid clones, which were identified andreleased by Mysore Paper Mills Limited, Bhadravati (MPM)were planted by the research wing of Karnataka Forest
Department. In all, 12 clones were field planted with identityin different blocks of 260 trees.After six years of plantingobservation on growth parameters like Total height of the
tree (H), equivalent diameter (the diameter, correspondingto the total cross-sectional area of multiple stems at breastheight) were measured and volume of individual tree was
estimated by using formula.
Indian J. Ecol. (2011) 38 (Special Issue) : 63-67Indian Journal
of Ecology

64
Volume (V) = 3.142 X (EQDBH)2X H X f.f /40,000Where
EQDBH- Equivalent diameter in centimeter,H- Total height in meter andf.f.- Form factor (0.40) for the species.
Representative trees (3 trees/clone) were selectedfrom each clone and were harvested at the ground level.Above ground portions of the felled tree were separated
into bole wood, branch wood and foliage. Fresh weight ofbole wood, branch wood, and foliage were recordedimmediately after felling using spring balance. Immediately
bole was debarked and fresh bark weight was recorded. Aknown quantity (1 Kg) of representative foliage, bark, bolewood and branch wood samples were collected. All the
samples were transferred to the laboratory and dried toconstant weight at 70oC for leaves and 100o C for bark,branch wood and bole wood. Dry weights of different
samples were obtained. Dry: wet ratio for leaves, bark,branch wood and bole wood was computed, which wasused to estimate the biomass of different components of
the felled trees for determination of field weights per treebasis. In order to estimate the wood basic density (DEN),three representative wood samples from each clone were
collected and volume of each wood disc was measuredwith identity. Oven dried weight of respective wood disc wasestimated. Basic density of wood (DEN) was determined
by DEN=Mass of wood disc (g)/volume of wood disc (cc).Bole weight of each tree was estimated by Bole woodweight= Wood volume X DEN. Total above ground tree
biomass of individual tree was estimated by summation ofbole weight, bark weight, branch weight and leaf weight of
particular tree. Expansion ratio was obtained by dividingtotal above ground tree biomass with bole wood weight toaccount for non- stem biomass such as branches, leaf and
bark.
Carbon stock in each tree was estimated by multiplyingthe total above ground biomass of individual tree with carbon
fraction 0.5 (Dixon et al., 1994). Mean Annual Increment i.e.MAI (m3/ha), productivity (t/ha/yr) and rate of carbonsequestration were determined by dividing volume (m3/ha),
biomass (t/ha) and carbon stock (t/ha) by age respectively.
RESULTS AND DISCUSSION
Significant difference in certain growth attributes ofdifferent clones were evident in the present study (Table 1).
Among the different growth traits the height of different clonesdid not differ significantly. Among the different clonesplanted, normal clone had relatively higher value (8.27 m)
followed by H-10 (8.23 m) and the least was observed in B-5 (6.60 m). Average equivalent diameter at breast height(EQDBH) of different clones varied significantly and clone
H-4 (10.08 cm) recorded significantly higher value, whichwas at par with all other clones except K-26. Estimatedvolume of individual tree of different clones varied
significantly (Table 1). Among the different clones, normalclone recorded significantly higher volume (0.025 m3) whichwas at par with H-10 (0.024 m3) and H-4 (0.024 m3). The
least mean volume was recorded by K-26 (0.011 m3), which
Table 1. Average growth and biomass attributes of Acacia hybrid clones
Clone Height EQDBH Volume Wood Leaf Bark Branch Bole Total Expansion
(m) (cm) (m3)/tree basic weight weight weight weight biomass ratio
density (Kg) (Kg) (Kg) (kg) (Kg)
(g/cc)
H-4 7.50a 10.08b 0.024b 0.43ab 5.73b 1.99ab 6.98b 11.12ab 25.82b 2.32b
H-10 8.23a 9.55b 0.024b 0.40ab 2.97a 1.91ab 2.51a 14.06b 21.45b 1.53a
B-5 6.60a 7.85ab 0.013a 0.43ab 2.55a 1.17a 3.42ab 9.37ab 16.51ab 1.76ab
B-10 6.73a 8.06ab 0.014ab 0.47ab 2.25a 1.33a 5.28b 8.22ab 17.08ab 2.08b
HD-12 8.10a 8.40ab 0.018ab 0.43ab 1.83a 2.20b 3.48ab 10.69ab 18.20ab 1.70ab
H-12 7.63a 8.27ab 0.017ab 0.47ab 2.84a 1.53ab 3.38ab 11.00ab 18.74ab 1.70ab
HD-16 6.97a 9.97b 0.022b 0.43ab 2.71a 2.38b 5.46b 13.57b 24.11b 1.78ab
HD-20 7.37a 9.76b 0.023b 0.37a 3.23ab 1.97ab 3.46ab 12.18b 20.85ab 1.71ab
K-23 6.77a 7.85ab 0.013a 0.57b 2.08a 1.50ab 3.20ab 8.32ab 15.10a 1.81ab
K-26 6.83a 7.21a 0.011a 0.57b 3.14a 1.34a 4.93ab 7.07a 16.48ab 2.33b
K-40 7.07a 8.70b 0.017ab 0.50b 5.14b 1.33a 4.03ab 8.92ab 19.41ab 2.18b
Normal 8.27a 9.76b 0.025b 0.43ab 5.25b 1.80ab 3.99ab 11.01ab 22.05b 2.00ab
Grand Mean 7.34 8.79 0.018 0.45 3.31 1.71 4.18 10.46 19.65 1.88
S Ed (+) 0.82 0.69 0.005 0.06 0.94 0.40 1.24 2.35 2.90 0.26
L SD (0.05) NS 1.43 0.009 0.13 1.96 0.83 2.56 4.87 6.01 0.54
S. Vijaykumar, R. Hegde, N. M. Poonacha, Ashok Kumar Chaudhary and M. R. Karki

65
was at par with clones B-5 (0.013 m3), K-23 (0.013 m3), B-10 (0.014 m3), H-12 (0.017 m3), K-40 (0.017 m3) and HD-12
(0.018 m3).
Existence of significant differences in growth and yieldattributes confirms the presence of inter-clonal variation in
the clones. Overall growth of plantations could be ascribedto the genotype, environment and possible interactionbetween the genotype and environment. In a given
environment, the differences in growth attributes of theclones are manifested primarily by the genotype,environment and interaction between genotype and
environment. Existence of significant differences in thegrowth performance of clones of Acacia hybrid have alsobeen reported by Amanulla (2007). Identification and
selection of planting material, which produces maximumpulp wood in a given period is of paramount importance forpulp wood captive plantations. Wood basic density of
different clones varied significantly and the values were from0.37 g/cc to 0.57 g/cc with a grand mean of 0.45 g/cc (Table1). Significant difference in the wood density of different
clones could be due to genotypic effect.
Among 12 clones, clone H-10 was found significantlysuperior over other clones followed by HD-16 and HD-20. It
is an indication that the clones are best suited for largescale planting programme in the area. However, selectionof only two to three clones could bring narrow genetic base
of the planting material. Mass selection, further cloningfollowed by testing is must to have broader genetic base toovercome the problems associated with narrow genetic
base.
Allocation of photosynthates to different componentsof the plant systems is important and biomass allocation
strategies of plants need to be understood for an effectiveshort rotation captive plantation programme. A genotype,which allocates relatively more biomass to bole wood, is
desirable for pulp wood production. In the present study,most of the clones allocated 50 per cent or more of the totalbiomass for bole wood production except clones H-4, B-
10, K-26 and K-40 (Fig.1). Interestingly, biomass allocatedfor the bark production was in the range of 7-12 per cent.The amount of biomass allocated for foliage production is
also important in understanding the biomass allocationpattern of different clones and it was observed that thebiomass allocated for foliage production ranged from
10–26 per cent of the total biomass. Biomass allocated forbranch wood production would also play a crucial role inover all pulp wood production in Acacia hybrid clones and
in the present study the biomass allocated for branch woodproduction ranged from 12–31 per cent of the total aboveground biomass. Thus, biomass allocation strategy of the
species could play a crucial role in short rotation forestry forwood production.
Expansion ratio of different clone ranged from 1.53 to
2.33 with a grand mean of 1.88 (Table 1). Among the differentclones, K-26 (2.33) recorded the highest expansion ratiofollowed by H-4 (2.32) and the least expansion ratio was
observed in H-10 (1.53), which was at par with B-5, HD-12,H-12, HD-16, HD-20, K-23 and normal clone. Expansionratio is very important for calculation of total biomass from
the bole weight, which would be applied to account the
Fig. 1. Biomass allocation pattern of different clones of Acacia hybrid
Wood Production and Carbon Sequestration through Acacia

66
non- bole biomass such as branch wood, bark and foliagebiomass. The expansion ratio found in this study is relatively
higher than the values reported for hard woods under Indianconditions (Lal and Singh, 2003).Multiple linear regressionequation developed to predict total biomass and bole wood
biomass based on the easily measurable growthparameters such as EQDBH and height could be used inquantifying the biomass using diameter and height
measurements (Table 2).
Table 2. Multiple Linear Regression equation to estimate biomassof trees of Acacia hybrid clones
Response Predictive model Trees
variable sampled
Bole biomass = 1.96 EQDBH + 0.52 H - 6.47 36
Total biomass = 1.84 EQDBH + 1.34 H -10.9 36
Note: H = Height in m. and EQDBH = Equivalent diameter at breastheight
Productivity and carbon stock. Estimated wood
volume per ha, mean annual increment (MAI), total aboveground biomass per ha., mean annual biomass production,carbon stock and mean annual carbon sequestration of
different clones are presented in Table 3. Among the differentclones, clone H-4 produced significantly higher volume of37.36 m3 ha-1 with MAI of 6.23 m3 ha-1 yr-1 followed by normal
clone (32.81 m3 ha-1) and HD-12 (26.21 m3 ha-1). Clone K-23 produced the least volume (8.99 m3 ha-1) with MAI of 1.50m3 ha-1 yr-1 and was at par with K-26, K-40 and B-5.
The total biomass for different Acacia hybrid clones
varied significantly from 10.20 t ha-1 (K-23) to 40.07 t ha-1
(H-4) with grand mean of 22.85 t ha-1. However, H-4 could
record significantly higher carbon stock of 20.03 t ha-1 with
mean annual carbon sequestration of 3.34 t ha-1 yr-1 followed
by normal clone (14.22 t ha-1) and HD-12 (13.34 t ha-1). The
lowest amount of carbon stock was recorded for the clone
K-23 (5.10 t ha-1) with mean annual carbon sequestration
of 0.85 t ha-1 yr-1 followed by K-26 (Table 3). The observed
productivity of different clones varied significantly and values
ranged from 1.70 t ha-1 yr-1 to 6.68 t ha-1 yr-1 with a grand
mean of 3.81 t ha-1 yr-1 (Table 3). Among the different clones,
H-4 (6.68 t ha-1 yr-1) recorded significantly higher productivity
followed by HD-12 (4.45 t ha-1 yr-1) and the least productivity
was observed in K-23 (1.70 t ha-1 yr-1), which was at par with
K-26 and K-40.One hectare plantation of H-4 could produce
404.55% more yield from the clonal plantations of K-23.
However,MAI in the present study is much less than the
values reported for the clones of Acacia hybrid at Vietnam
(Martin, 2004). Also,carbon stock in these clonal plantations
are found to be lower than the carbon mitigation potential
(74.75 t ha-1) of degraded forestlands in India (Lal and Singh,
2003). However, these short rotation plantations of fast
growing clones could be of immense use in increasing the
productivity of pulp wood plantations as well as mitigating
global warming through higher rate of carbon sequestration.
Table 3. Estimated stand volume, biomass, carbon stock, MAI, productivity and rate of carbon sequestration of Acacia hybrid clones
Clone Stand volume Biomass Carbon stock MAI Productivity Carbon
(m3 ha-1) (t ha-1) (t ha-1) (m3 ha-1 yr-1) (t ha-1 yr-1) sequestration
(t ha-1 yr-1)
H-4 37.36c 40.07d 20.03d 6.23c 6.68d 3.34d
H-10 23.76bc 21.29bc 10.64bc 3.96bc 3.55bc 1.77bc
B-5 17.92ab 23.02bc 11.51bc 2.99ab 3.84bc 1.92bc
B-10 20.24b 24.54bc 12.27bc 3.37b 4.09bc 2.05bc
HD-12 26.21bc 26.67c 13.34c 4.37bc 4.45c 2.22c
H-12 23.00bc 26.12c 13.06c 3.83bc 4.35c 2.18c
HD-16 19.97b 22.18bc 11.09bc 3.33b 3.70bc 1.85bc
HD-20 19.72b 17.98b 8.99b 3.29b 3.00b 1.50b
K-23 8.99a 10.20a 5.10a 1.50a 1.70a 0.85a
K-26 11.23ab 16.10ab 8.05ab 1.87ab 2.68ab 1.34ab
K-40 15.76ab 17.57ab 8.79ab 2.63ab 2.93ab 1.46ab
NORMAL 32.81c 28.44c 14.22c 5.47c 4.74c 2.37c
Grand Mean 21.41 22.85 11.42 3.57 3.81 1.90
S Ed (+) 4.93 3.64 1.82 0.82 0.61 0.30
LSD (0.05) 10.23 7.55 3.77 1.71 1.26 0.63
S. Vijaykumar, R. Hegde, N. M. Poonacha, Ashok Kumar Chaudhary and M. R. Karki

67
REFERENCESAmanulla, B. M. K. (2007) Studies on growth and wood traits in
clones of Acacia hybrid, Eucalyptus urophylla S. T. Blake.,and Eucalyptus pellita F. Muell. Ph.D. Thesis submitted toForest Research Institute (Deemed University), Dehra Dun(India).
Amanulla, B.K.M., Jayakumar, M.N. and Torvi, R.K. (2004) Growthand productivity of Acacia hybrids on degraded forestlandsand other waste lands in western Ghat regions of Karnataka.Indian For. 130(5): 537-550.
Choong, C. Y., Yong, S. Y. C., Chiang, P. L., Pang, S. L., Harikrishna,J. A., Mohd Noormat I. S. A. and Wickneshwari, R. (2005)Analyses of ESTs generated from inner bark tissue of Acaciahybrid. Acacia research in Malaysia; Proc. Seminar on currentupdate on Acacia Genomics and breeding: Acacia Researchin Malaysia. (eds.), Wickneswari, R.J.A., Harikrishna andChoong, C.Y. 56p.
Dixon, R. K., Brown, S., Solomon, R. A., Trexler, M. C. andWisniewski, J. (1994) Carbon pools and flux of global forestecosystem. Sci. 263: 185-190.
Kirschbaum, M. U. F. (2001) The role of forest in global carboncycle. In: R. J. Raison, A. G. Brown and D. W. Flinn (Eds.)Criteria and Indicators for Sustainable Forest Management,CAB International. pp. 311-339.
Lal, A. K. and Singh, P. P. (2003) Economics worth of carbon inabove ground biomass of India’s forests. Indian For. 129(7):874-880.
Martin Van Bueren (2004) Acacia hybrids in Vietnam, ACIAR ProjectFST/1986/030, Centre for International Economics, Canberraand Sydney, Impact Assessment Series Report No. 27. pp: 1-44.
Varghese, M., Harwood, C.E., Hegde, R. and Ravi, N. (2008)Evaluation of provenances of Eucalyptus camaldulensis andclones of E. camaldulensis and E. tereticornis at contrastingsites in southern India. Silv. Genet. 57(3): 170-179.
Wood Production and Carbon Sequestration through Acacia
Soils are the largest carbon reservoirs in the terrestrialcarbon cycle. Altogether 3.5% of the earth’s carbon reserves
are stored in soils, compared with 1.7% in the atmosphere,8.9% in fossil fuels, 1.0% in biota and 84.9% in the oceans.Soils thus play a key role in the global carbon budget and
can have large impact on carbon release under a climatechange scenario (Lal et al., 1995). To assess the qualityand productivity of soils, it is important to know the amount
and quality of soil organic carbon in the soil. About 40% ofthe total SOC stock of the global soils resides in forestecosystem (Eswaran et al., 1999). The Himalayan zones,
with dense forest vegetation, cover nearly 19% of India andcontain 33% of SOC reserves of the country (Bhattacharyyaet al., 2008). These forests are recognized for their unique
conservation value and richness of economically importantbiodiversity. Managing these forests may be usefultechnique to increase soil carbon status because the
presence of trees affects carbon dynamics directly orindirectly. Thus study was under taken to understand theeffect of altitude and depth on soil organic carbon potential,
comparative soil organic carbon sequestration potentialdifferences between the forest types.
MATERIAL AND METHOD
The present study was carried out in two forest types
i.e., oak (Quercus leucotrichophora) in temperate regionand pine (Pinus roxburghii) in sub-tropical region. Both thestudy sites were located in the District Pauri Garhwal, where
oak forest were located between 30o 07’ 09.9" to 30o 7’ 12.3"N latitude and 78o 47’46.5" to 78o 47’42.5" E longitude at anelevation of 1700m, 1800m and 1900m above sea level.
Forest Composition and Soil Carbon Stock in Oak and Pine Forestsalong Altitudinal Gradients
Harpal Singh, Munesh Kumar*, Mehraj A. Sheikh and Jahangir Ahmad BhatDepartment of Forest Products, Dr. Y.S. Parmar University of Horticulture and Forestry, Nauni, Solan (H.P.), India
*Department of Forestry, HNB Garhwal University, Srinagar Garhwal, Uttarakhand. India*E-mail: [email protected]
Abstract: The present study was focused on two forest types Quercus leucotrichophora (oak) and Pinus roxburghii (pine) in GarhwalHimalaya, for vegetation analysis and soil carbon stock along altitudinal gradient and soil depth. The soil carbon was assessed in eachforest type by collecting soil samples from three different altitudes and depths. In both the forest types, soil carbon has positive relationwith leaf litter production, density and basal cover of the forests which decreased significantly with increasing altitude and soil depth. Theresults indicate that a change in vegetation type and a shift of vegetation belts as expected in most climate change scenario might havea profound impact on SOC in the Himalayas. Between the forests; oak forest soil has more capacity to sequester carbon compared to pineforest, therefore, to enhance carbon sequestration potential the existed forest should be maintained and promote more regeneration forhigh density and basal cover within oak forest and where oak is invading in pine forest to mitigate future carbon level.
Key Words: Soil organic carbon, Altitudinal gradient, Oak-pine forests
However, pine forest were between 30o 12’ 51.2" to 30o 12"51.0" N latitude and 78o 48’ 25.2" to 78o 49’ 02.2" E longitude
at an elevation of 700, 800 and 900m above sea level. Theclimate of the study area is of monsoon type and can bedivisible in three different seasons i.e., summer, winter and
rainy. The snow fall occurs in the oak forest during winterseason and the mean annual temperature ranges between1.3oC to 30oC with annual rainfall of 218cm. In pine forest
the mean annual minimum and maximum temperature was16.45oC and 26.80oC with annual rainfall of 252 cm.
In both forest types, each forest type was selected for
three representative sample stands (each approx. of 0.5
ha) at different elevation were identified for vegetation study.
Ten (10 x 10 m) quadrats for tree were placed at random in
each stand. Numbers of individuals of each species were
recorded in all quadrats. The circumference at breast height
at 1.37m for tree was recorded. The analytical features of
vegetation were computed following Saxena and Singh
(1982). Litter production of each forest type at different
altitudes was done with the sampling of three replicates.
The litter traps were established in the forest of a size 1 x 1
m2 and 15 cm high.
In both the forest types, each forest type has three
different altitudes and within altitude the soil sampling wasdone by nested plot design method. In each site, a plot of100 × 20 m size was laid, and six sampling points were
selected in each plot by the standard method (Hairiah et al.,2001).Three soil samples were collected at each samplingpoint at three depths (0–20, 20–40, 40–60 cm). A total of
108 soil samples (18 from each altitude) were collected by
Indian J. Ecol. (2011) 38 (Special Issue) : 68-71Indian Journal
of Ecology

69
digging soil pits. The soil samples were air dried and sieved(>2 mm diameter) before analysis. Soil organic carbon
(SOC) was determined by partial oxidation method (Walkleyand Black, 1934). Soil samples from each depth wereanalysed, however to express the total SOC stock data in
0– 20, 20–40 and 40–60 cm, the weighted mean averagewere considered. The total SOC stock was estimated bymultiplying the values of SOC g kg-1 by a factor of 8 million,
based in the assumption that a layer of soil 60 cm deepcovering an area of 1 ha weighs 8 million kg (Day, 2005).
RESULTS AND DISCUSSION
In oak and pine forests, the density and total basal
cover of trees decreased with increasing altitudes (Table1). The total density and total basal cover of oak forest was1100 trees ha-1 and 58.86 m2 ha-1 (1700m), 1040 trees
ha-1and 55.64 m2 ha-1 (1800 m) 960 trees ha-1 and 40.88 m2
ha-1 (1900m), respectively. The similar pattern of densityand total basal cover was also reported in pine forest as
560 trees ha-1, 56.94 m2 ha-1 and (700m), 540 trees ha-1,53.26 m2 ha-1 (800m), 500 trees ha-1, 26.79 m2 ha-1 (1000m)respectively. In oak forests, Quercus leucotrichophora was
the dominant species at each altitude and the associatedspecies were Myrica esculenta, Rhododendron arboreumand Pinus roxburghii. In Quercus leucotrichophora, density
and basal cover decreased with increasing altitudes. Inpine forest, each altitude was dominated by Pinus roxburghiiwhich reduced their density and basal cover with altitude.
The changes in climate along altitudinal gradients influence
the composition and productivity of vegetation and
consequently, affect the quantity and turnover of SOM
(Quideau et al., 2001). Altitude also influences SOM by
influencing soil water balance, soil erosion and geological
deposition processes (Tan et al., 2004). The decrease in
density and basal cover at higher altitudes could be due to
eco-physiological constraints and low temperature result
in low productivity (Wang et al., 2004), thus less
accumulation of litter and low input of organic carbon in
soils with increasing altitude. Altitude has also a significant
effect on species richness, which declines with increasing
altitude as well as the species composition can also be
significantly affected with altitude (Markus et al., 2007). Inboth the forest types, litter production decreased with
increasing altitude. In the oak forest litter production of forestfloor was highest at 1700m altitude (221.14 gm-2) followedby 1800m (199.30 gm-2) and 1900m (95.29 gm-2). In pine
forest, litter production was 98.09, 96.82 and 96.64 gm-2 ataltitudes of 700m, 800m and 1000m, respectively (Table2). The Carbon stock in oak forest was 72 t ha-1 (1700m)
followed by 70.4 t ha-1 (1800m) and 64 t ha-1 (1900m) and inpine forest, 60 t ha-1 (700m), 50.4 t ha-1 (800m) and 49.6 tha-1 (1000m). The carbon stock and litter production showed
a positive correlation, both decreasing with increasingaltitudes. In humid climates, both production anddecomposition of litter increase with temperature, but the
relative increases in decomposition are greater(Schlesinger, 1977; Oades, 1988). Litter constitutes animportant flux of soil organic carbon. In a study carried in
China, the leaf litter production in mixed plantations washigher than that in pure Chinese fir plantation, whichincreased their surface soil organic carbon concentrations
(Wang et al., 2007; 2008). Mo et al. (2002) suggested thatthe changes in the carbon stocks of the top soil in differentforest types might reflect the differences in the quantity and
quality of litter input, litter C decomposition, and litter biomassC. The conifer litter compared to broadleaved forests,contains more components, that are difficult to decompose,
resulting in litter accumulation in the forest floor and lesscarbon incorporation into the mineral soil (Berg, 2000).
Soil Carbon Stock with Altitude and Depths
The SOC of oak and pine forest at different altitudes
and depths is shown in Table 2. In oak forest, the highestSOC (13.0±0.7 g kg-1) was in the upper layer (0-20 cm) ofsoils at 1700m altitude, followed by the middle layer
(10.5±1.6 g kg-1) and lowest layer (3.6±0.8 g kg-1). At analtitude of 1800m, the SOC decreased as 14±2.7 g kg-1
(0-20cm), 9±0.3 g kg-1 (20-40cm) and 3.5±1.1 g kg-1 (40-
60cm). At 1900m, the SOC was also again highest (13.0±0.6g kg-1) in top layer and lowest (2.1±0.7 g kg-1) at the bottom.The SOC at each altitude decreased with increasing soil
depth. In pine forest, at 700m altitude the SOC was highest(10.2±0.3 g kg-1) in the top layer followed by the middle
Table 1. SOC stock, leaf litter production, density and TBC in oak and pine forests
Forest type Elevation (amsl) SOC(t C ha-1) Leaf litter (g m-2) Density (tree ha-1) TBC (m2 ha-1)
Q. leucotrichophora 1700 m 72 221.14 1100 58.86
1800 m 70.4 199.3 1040 55.64
1900 m 64 95.29 960 40.88
P. roxburghii 700 m 60 98.09 560 56.94
800 m 50.4 96.82 540 53.26
1000 m 49.6 96.64 500 26.79
Soil Carbon Stock along Altitudinal Gradients

70
(8.0±0.8 g kg-1) and lowest (4.2±0.3 g kg-1) layers. The SOCat 800m decreased in order of 10.7±1.5 (0-20cm), 5.3±0.7(20-40 cm) and 2.8±0.4 (40-60 cm). Similarly at 1000m, the
maximum (11.2±0.7 g kg-1) and minimum (2.5±1.1 g kg-1)SOC was in the uppermost and lowermost depthsrespectively. The SOC decreased with increasing altitude
and soil depth. Both the forests followed similar trend ofSOC, which decreased with increasing altitude. Thedifference is clearly linked to the vegetation type. A variety of
studies showed that the vertical distribution of SOC differdepending on vegetation change (Esteban and Jackson2000). Higher accumulation of SOC in Maquis vegetation
compared to coniferous forests was also recorded (Markuset al., 2007). The litter input (Lal, 1989) and the proliferatedroot system (Blevines and Frye, 1993) of the growing plants
probably influenced the carbon storage in the soil,suggesting a positive correlation of SOC with the quantity oflitter fall (Singh, 2005).
CONCLUSION
Altitude played an important role in the forest density,basal cover, which are the main component for litterproduction and results in the soil carbon stock in the forest
floor. In both forest types, SOC decreased with increasingaltitude. SOC was also having positive relation with litter
production, density and basal cover of trees. Thus, thestudy could be conceded that conservation and
maintenance of higher density and basal cover of trees canbe used to enhance carbon stock in the Himalayas forestfor further environmental security.
REFERENCESBerg, B. (2000) Litter decomposition and organic matter turnover in
northern forest soil. For. Ecol. Mgmt. 133:13-22.
Bhattacharyya, T., Pal, D. K., Chandran P., Ray, S.K., Mandal, C. andTelpande, B. (2008) Soil carbon storage capacity as a tool toprioritize areas for carbon sequestration. Curr. Sci. 95:482-494.
Blevines, R.L. and Frye, W.W. (1993) Conservation tillage: Anecological approach in soil management. Adv. Agron. 51:33-78.
Dey, S.K.A. (2005) Preliminary estimation of carbon stocksequestrated through rubber (Hevea brasiliensis) plantationin North Eastern regional of India. Indian For. 105: 1429-1435.
Esteban, G.J. and Jackson, R.B. (2000) The vertical distribution ofsoil organic carbon and its relation to climate and vegetation.Ecological Applications 10(2):423-436.
Eswaran, H., Reich, P.F., Kimble, J.M., Beinroth, F.H., Padmanabhan,E. and Moncharoen, P. (1999) Global Climate Change andPedogenic Carbonates Edited by: Lal R, et al. Lewis Publishers,Fl, USA, 15-25.
Hairiah, K., Sitompul, V.S., Noordwijk, M. and Palm, C. (2001)Methodology for sampling carbon stocks above and belowground. ASB Lecture Notes 4B. International Centre forResearch in Agro forestry, Indonesia, Published in Dec., [http://www.icraf.cgiar.org/sea].
Lal, R., Kimble, J.M., Levines, E. and Whiteman, C. (1995) World soiland greenhouse effect. SSSA Special Publication NumberMadison, WI, 57:51-65.
Lal, R. (1989) Conservation tillage for sustainable agriculture: tropicsvs. temperate environment. Adv. Agron. 42: 186-197.
Markus, E., Ladina, A., Aldo, M., Salvatore, R., Markus, N. and Rene,V. (2007) Effect of climate and vegetation on soil organiccarbon, humus fractions, allophones, imogolite, kaolinite andoxyhydroxides in volcanic soils of Etna (Sicily). Soil Sci. 172:673-691.
Sheikh, M.A., Munesh Kumar and Bussmann, R.W. (2009) Altitudinalvariation in soil organic carbon stock in coniferous subtropicaland broadleaf temperate forests in Garhwal Himalaya. CarbonBalance and Management 4:6 doi:10.1186/1750-0680-4-6.
Mo, J., Sandra, B., Peng, S., Kong, G., Zhang, D. and Zhang, Y.(2002) Role of under story plants on nutrient cycling of arestoring degraded pine forest in a MAB reserved ofsubtropical China. Acta Ecological Sinica 22: 1407-1413.
Oades, J.M. (1988) The retention of organic matter in soils.Biogeochemistry 5(1): 35–70.
Paul, E.A. (1984) Dynamics of soil organic matter. Plant and Soil76: 275-285.
Post, W.M., Izaurralde, R.C., Mann, L.K. and Bliss, N. (2001)Monitoring and verifying changes of organic carbon in soil.Climate Change 51:73-99.
Table 2. SOC at different depths in oak and pine forests
Forest type Altitude Soil depth SOC
(m) (cm) (g kg-1)
Q. leucotrichophora 1700 0-20 13.0±0.7
20-40 10.5±1.6
40-60 3.6±0.8
1800 0-20 14.0±2.7
20-40 9.0±0.3
40-60 3.5±1.1
1900 0-20 13±0.6
20-40 8.9±0.7
40-60 2.1±0.7
P. roxburghii 700 0-20 10.2±0.3
20-40 8.0±0.8
40-60 4.2±0.3
800 0-20 10.7±1.5
20-40 5.3±0.7
40-60 2.8±0.4
1000 0-20 11.2±0.7
20-40 5.0±1.2
40-60 2.5±1.1
Harpal Singh, Munesh Kumar, Mehraj A. Sheikh and Jahangir Ahmad Bhat

71
Quideau, S.A., Chadwick, Q.A., Benesi, A., Graham, R.C. andAnderson, M.A. (2001) A direct link between forest vegetationtype and soil organic matter composition. Geoderma 104:41-60.
Ramachandran, A., Jayakumar, S., Haroon, R.M., Bhaskaran A. andArockiasamy D.I. (2007) Carbon sequestration: estimation ofcarbon stock in natural forests using geospatial technology inthe Eastern Ghats of Tamil Nadu, India. Curr. Sci. 92 (3): 323-331.
Rasse, D.P., Rumpel, C. and Dignac, M.F. (2005) Is soil carbonmostly root carbon? mechanisms for a specific stabilization.Plant and Soil 269:341-356.
Saxana, A.K. and Singh, J.S. (1982) A phytosociological analysisof woody species in forest communities of a part of KumaunHimalaya. Vegetation 50:3-32.
Schlesinger, W.H. (1977) Carbon balance in terrestrial detritus. Ann.Rev. Ecol. Syst. 8:51-81.
Singh, G. (2005) Carbon sequestration under an agri-silviculturalsystem in the Arid region. Indian For. 131: 543-552.
Tan, Z.X., Lal, R., Smeck, N.E. and Calhoun, F.G. (2004) Relationshipsbetween surface soil organic carbon pool and site variables.Geoderma 21:185-187.
Walkley, A. and Black, I.A.(1934) An examination of the digestionmethod for determining soil organic matter and proposedmodification of the chromic acid titration method. Soil Science63:29-38.
Wang, Q., Wang, S., Fan, B. and Yu, X. (2007) Litter production,leaf litter decomposition and nutrient return in Cunninghamialanceolata plantations in south China effect of planting coniferswith broadleaved species. Plant and Soil 297: 201-211.
Wang, Q., Wang, S. and Huang, Y. (2008) Comparisons of litter fall,litter decomposition and nutrient return in a monocultureCunninghamia lanceolata and a mixed stand in southern China.For. Ecol. Mgmt. 255:1210-1218.
Wang, S., Huang, M., Shao, X., Mickler, A.R., Li, K.and Ji, J. (2004)Vertical distribution of soil organic carbon in China. Env. Mgt.33: 200-209.
Soil Carbon Stock along Altitudinal Gradients

Plantation forestry is expanding worldwide, especiallyin the tropics and subtropics. This expansion is driven byfactors, which include the urgent need to meet local and
global demand for wood from plantation forests communitypressure to diminish dependence on native forests for woodharvests, and the increasing opportunity to integrate
plantation forests with other land uses to ameliorate landdegradation. Large-scale plantings using short-rotationsilviculture, intensive management and exotic species with
potential for rapid growth are relatively new developmentsin plantation forestry. However, the opportunities forincreasing production over the long term and the potential
problems in sustaining yields are poorly understood.Productivity of tropical plantations varies widely, dependingon site resources and species. Tropical forest plantations
are among the most productive ecosystems in the world.The productivity of tropical plantations is highly dynamic,showing substantial changes with plantation age, site
fertility, stand density and species. A fundamentalunderstanding of stand growth and the factors that influenceit are vital to achieving and sustaining high rates of
production. Doubts have been expressed about thesustainability of tropical plantations both in terms ofbiological productivity and their potential impact on the
environment.
Nutrient dynamics is very important for theunderstanding of ecosystem functioning and ecological
status. Nutrient uptake, their retention and release are the
Harvest Related Nutrient Export from Fast Growing MultipurposeTrees (MPTS): A Case Study from South Gujarat
Sreedevi Madhusudanan*, N. S. Patil, S. Aneesh1 and Vishnu K. SolankiAspee College of Horticulture and Forestry, Navsari Agricultural University, Navsari (Gujarat),
1College of Forestry, Kerala Agricultural University, Kerala.*E-mail: [email protected]
Abstract: Nutrient accumulation and export from the site have become an important consideration in short-rotation, high-yielding plantationsystems, where nutrients removed through frequent harvests may exceed the natural rates of nutrient inputs such as mineral weathering,atmospheric inputs and biological fixation.The extensive export of nutrients related to intensive biomass extraction has raised the concernfor long term fertility of the system. A study on the biomass nutrient content and the harvest related nutrient export from the site forselected MPTs viz. Albizia procera, Casuarina equisetifolia, Eucalyptus tereticornis and Gmelina arborea at 20-years-stand age.Results showed considerable variation in nutrient concentration among aboveground tissue fractions, which increased in the order stemwood< branch wood< twigs< leaves. However, the nutrient accumulation in the aboveground biomass components was maximum forstemwood primarily on account of higher biomass contribution. Among the nutrients nitrogen content in the biomass was highest followedby potassium and phosphorus. Since foliage represented sizable share of the aboveground nutrient accumulation, it is suggested thatsimple stand management practices such as leaving foliage and twigs in the plantation field can reduce the harvest related nutrient exportfrom the site.
Key Words: SRF, Nutrients, Growth, Biomass, Gujarat
three components of nutrient dynamics in forest ecosystem.More uptake and less return to the soil leads to deteriorationof land and ultimately lowering of productivity. Fast growing
tropical tree plantations incorporate considerable amountsof nutrients in their biomass over a relatively short period oftime and the nutrient concentration in various biomass
components varies significantly with tree species. This canlead to site fertility declines, which can limit sustainedplantation forestry in tropical regions. Soil fertility can
decrease through excessive removal of living biomass,particularly if nutrients in tree crowns are lost through harvestor site preparation. The extensive export of nutrients related
to intensive biomass extraction has raised the concern for
the long term fertility of the system among forest ecologists
(Blanco et al., 2005). The nutrient cost of biomass removal
is partly dependent on the nutrient characteristics of the
parts of the tree removed (Kumar et al., 1998).High
concentrations of nutrients in small branches, twigs, and
leaves compared to stem are the main reason for this
nutrient drain.Very intensive harvesting has also been
claimed to have a negative influence on the organic matter
content in forest soils due to reduced inputs of dead biomass
(Jandl et al., 2007).The ratio of nutrient export to the nutrient
store is a key measure of long-term ecosystem stability. In
this back drop, a study was taken up with the primary
objective of estimating biomass nutrient content and the
harvest related nutrient export from the site for different
selected MPTs.
Indian J. Ecol. (2011) 38 (Special Issue) : 72-75Indian Journal
of Ecology

73
MATERIAL AND METHODS
The present investigation was conducted during August2008 to March 2010 at the Instructional farm, ASPEE College
of Horticulture and Forestry, Navsari Agricultural University,Navsari, situated at an altitude of about 12 meters abovemean sea level, at 200 58’ North latitude and 720 54’ East
longitude. The site experience typical tropical climatecharacterized by hot summer, moderately cold winter andhumid warm monsoon with an average annual rainfall of
1,355 mm, the bulk of which is received from second weekof June to first week of October. The soil type of theexperimental site was placed under Jabalpur series having
great group chromuster, sub order upstart and order vertisolas per seventh approximation. The soil is clay in texture(63% clay), high moisture retention capacity (40.50%), low
in organic carbon content (0.26%), medium in availablephosphorus (30.39%) and nitrogen content (110.12 kgha-1). It is not having any problem of sodicity as pH (7.86)
and EC (1.75 dSm-1) were below the critical limit. The studyinvolved the biomass nutrient content and the nutrientaccumulationin the above ground components of four
multipurpose tree species (MPTs) of 20- year-stand ageviz. Casuarina equisetifolia, Eucalyptus tereticornis, Gmelinaarborea and Albizia procera. The trees were established
at 2.5x 2.5 m spacing in a randomized block design withfour replications.
For estimating the nutrient concentration and
accumulation, 12 trees were destructively sampled fromeach tree species such that there were three trees fromeach replication.Triplicate samples (component wise for
each species) of plant samples were analysed for N, P andK (three sub-samples were drawn from the tissue samplesfor this purpose). Nitrogen was estimated following the
micro-Kjeldahl distillation method. Phosphorus andpotassium were estimated after digesting the samples intriple acid mixture (HNO3, H2SO4 and HClO4 in 10:1:3 ratios).
Phosphorus was determined following the vanado-molybdophosphoric yellow colour method and potassium by flamephotometry (Jackson, 1958). Nutrient accumulation for each
tissue type for each species was calculated by multiplyingthe mean component biomass (dry weight) by thecorresponding nutrient concentrations. Total for the whole
trees were obtained by summing results for componentparts and average nutrient accumulation per tree wasmultiplied by the effective number of trees per hectare to get
the nutrient accumulation per ha.
RESULTS AND DISCUSSION
Nutrient concentration (N, P and K) in the various plantcomponents for different tree species has been depicted in
Fig. 1, 2 and 3. Nutrient concentrations were found to varymarkedly among the species and tissue types studied. In
general, leaf had the highest concentration of all nutrients,followed by twig, branch and bole. Higher nutrientconcentration in leaves were also reported for many species
(Wang et al., 1991 and Mohsin et al., 2005). Leaf being thecentre of maximum photosynthetic activity; it is logical thatthe highest nutrient concentration was always found in
leaves as compared to other components(Sreemannarayanan et al., 1994). For instance Albiziaprocera recorded the highest leaf Nitrogen (1.96%) and
potassium concentration(0.670%), while G. arborearegistered the highest foliage P content (0.120%). Amongthe nutrients nitrogen concentration was highest, followed
by potassium and phosphorus among all components ofthe tree. This trend is supported by many studies. Higherconcentration of N (2.32 %) was reported in 5-year-old
Acacia auriculiformis followed by K (1.08 %) and P (0.08 %)(George, 1993). Similar observation has been reported inA. auriculiformis, Ailanthus triphysa, Artocarpusheterophyllus, Artocarpus hirsutus, C. equisetifolia, Emblicaoffcinalis, Leucaena leucocephala, Paraserianthesfalcataria and Pterocarpus marsupium (Kumar et al., 1998)
and in Acacia mangium (Kunhamu et al., 2005).
Nutrient accumulation and export from the site havebecome an important consideration in short rotation
plantations, where nutrient removed through frequentharvest may exceed the natural rate of nutrient input suchas mineral weathering, atmospheric inputs and biological
fixation (Kumar et al., 1998). The key factors that control thenutrient accumulation in the various biomass componentsis the rate of biomass production and the nutrient
concentration in the respective components. In the presentstudy, maximum accumulation of N, P and K was found in
the bole fraction in all the tree species (Table 1). In general,
nutrient accumulation in tissue types decreased in theorder:
bole>branch>foliage>twig. Nitrogen accumulation followed
a varied pattern as branch> bole>twig>foliage in Gmelina.
Similarly available pattern was observed for potassium and
phosphorus accumulation in Eucalyptus and Gmelina viz.
bole>branch> twig>leaf. Maximum accumulation of N, P
and K in the bole fraction in the present study indicated that
huge quantity of nutrients could be lost from the systems
through harvest. Such heavy losses in the subsequent
rotations can bring substantial reduction in the soil nutrient
base in the long run. Similar trend has been reported in A.auriculiformis, A. triphysa, A. heterophyllus, A. hirsutus, C.equisetifolia, E. offcinalis, L. leucocephala, P. falcataria andP. marsupium (Kumar et al., 1998) in Dalbergia sissoo (Das
and Chaturvedi, 2003), in G. arborea (Swamy and Puri, 2005)
Nutrient Export through Tree Harvesting

74
Fig.1. Nitrogen concentration of 20 year old MPT’s
Fig.2. Phosphorus concentration of 20 year old MPT’s
Fig. 3. Potassium concentration of 20 year old MPT’s
and in A. mangium (Kunhamu et al., 2005).Despite the lowernutrient concentrations, the higher total nutrient content in
the bole was primarily on account of the wide gap betweenthe biomass productions compared to foliage and twigs.Leaves, on the other hand, despite their higher nutrient
concentration could accumulate less nutrients mainly dueto lower leaf biomass production. However, it is importantto observe that leaf biomass can bring substantial nutrient
turnover to the soil through litter route. Hence, consideringthe potential nutrient loss on account of harvests, effortshould be made to see that maximum foliage and harvest
left over lops and tops are returned to the site.
In planning sustainable short-rotation, intensivecultural systems, site nutrient removal must be considered.
Present study explicitly revealed the high nutrient export fromthe site following whole tree harvest. Nutrient exports fromthe site are strongly influenced by species, stand age and
the tree management practices adopted. Tropical MPTsshow considerable variability in this respect. Bole fraction,in general accounted for about 50% of the total nutrient
export. A slight reduction in the tree parts removed from thesite would definitely alter the rate of nutrient export. Therefore,returning leaves and small twigs to the site at the time of
harvest may be a worthwhile option to restrain nutrient export
Sreedevi Madhusudanan, N. S. Patil, S. Aneesh and Vishnu K. Solanki

75
from the site.
REFERENCESBlanco, J.A., Zavala, M.A.Imbert, J.B. and Castillo, F.J.(2005)
Sustainability of forest management practices: Evaluationthrough a simulation model of nutrient cycling. For. Ecol. andManage. 71: 760–762.
Das, D.K. and Chaturvedi, O.P. (2003) Biomass production andnutrient distribution in an age series of Dalbergia sissoo Roxb.Plantations. Range Mgmt. and Agrofor. 24(1): 27-30.
George, S.J. (1993) Biomass production and resource partitioningin silvi-pastoral systems.M.Sc.Thesis, Kerala AgriculturalUniversity, Vellanikkara, Kerala. pp.139.
Jackson, M.L. (1958) Soil Chemical Analysis. Asia publishing House,New Delhi, India, pp. 498.
Jandl, R, Lindner, M., Vesterdal, L., Bauwens, B., Baritz, R.,Hagedorn, F., Johnson, D.W.,Minkkinen, K. and Byrne, K.A.(2007) How strongly can forest management influence soilcarbon sequestration? Geoderma 137: 253–268.
Kumar, B.M., George, S.J., Jamaludheen, V. and Suresh, T.K. (1998)Comparison of biomass production, tree allometry and nutrientuse efficiency of multipurpose trees grown under three ageseries in Kerala, India. For. Ecol. Manage.112: 145-163.
Kunhamu, T.K., Kumar, B.M. and Syam, V. (2005) Tree allometry,volume and aboveground biomass yield in a seven-year-oldAcacia mangium.willd stand at Thiruvazhamkunnu, India.Proceeding of the International Conference on MultipurpuseTrees in The tropics: Assessment, Growth and Management.Arid Zone Forest Research Institute, Jodhpur, 22- 25November, 2004. Multipurpuse trees in the Tropics:Management and improvement strategies.2006. Scientificpublishers, Jodhpur. pp.415-421.
Mohsin, F., Singh, R.P. and Singh, K. (2005) Nutrient uptake ofpoplar plantation at various ages of growth in isolated andintercropped stands under agroforestry system. Indian For.131: 681-693.
Sreemannarayanan, B.,Girirao, L.G. and Joseph, B. (1994)Nutrientstatus of different parts of multi-purpose tree species. J. TreeSci. 13(1): 21-26.
Swamy, S.L. and Puri, S. (2005) Biomass production and C-sequestration of Gmelina arborea in plantation andagroforestry system in India. Agrof. Syst. 64: 181-195.
Wang, D., Bormann, H.F., Lugo, A.E. and Bowden, R.D. (1991)Comparison of nutrient-use efficiency and biomass productionin five tropical tree taxa. For. Ecol. Manage. 46: 1-21.
Tab
le 1
. N
itrog
en,
phos
phor
us a
nd p
otas
sium
acc
umul
atio
n in
the
abo
vegr
ound
bio
mas
s co
mpo
nent
s fo
r th
e va
rious
MP
Ts a
t 20
-yea
rs-s
tand
age
at,
Inst
ruct
iona
l fa
rm,
NA
U
Sp
eci
es
Nitr
ogen
(kg
ha
-1)
Pho
spho
rus
(kg
ha -1
)P
otas
sium
(kg
ha
-1)
Bol
eB
ran
chT
wig
Le
af
Bol
eB
ran
chT
wig
Le
af
Bol
eB
ran
chT
wig
Le
af
Alb
izia
pro
cera
49
3.4
3a
34
6.2
4a
37.4
71
23
.43
a2
7.1
0a
18
.40
a2.
17b
3.92
b2
48
.22a
119.
90a
14.9
54
1.7
0a
Cas
uari
na e
quis
etifo
lia4
17
.96
a1
65
.25
b40
.56
17
8.4
3a
11.3
7b
10
.28
b3.
18a
10
.02
a1
35
.10
b5
5.5
0b
14.1
54
3.7
5a
Euc
alyp
tus
tere
ticor
nis
36
6.6
0a
13
7.2
5b
37.4
25
6.2
0c
20
.14
a9.
10b
3.98
a3.
25b
16
2.9
3b
73
.57
b21
.57
20
.85
b
Gm
elin
a ar
bore
a98
.45b
117.
10b
34.4
79
.46
c2
.59
c1
.53
c1.
67b
0.7
7c
54
.97
c5
0.6
0b
16.2
83
.61
c
Mea
n3
44
.11
19
1.4
537
.47
91.8
815
.29
10.0
52.
754.
491
50
.29
74.8
616
.74
27.4
8
S.E
m.±
45
.45
4
1.3
6
6.61
1
8.4
9
2.40
2.
44
0.49
0.
78
20.9
916
.61
3.09
5.99
LSD
at
1% 1
45.3
813
2.31
N
S59
.16
7.6
7 7
.80
1.5
72.
4667
.14
NS
NS
19.1
6
CV
%26
.41
24.3
225
.41
31.0
126
.33
31.3
3 2
4.69
23.2
927
.93
30.3
826
.88
23.5
8
Fig
ure
with
sam
e al
phab
et d
id n
ot d
iffer
sig
nific
antly
Nutrient Export through Tree Harvesting

Teak is one of the most favoured timber all over theworld, since it has been used for many centuries for a rangeof products and services. Kerala has 74872 ha of teak
plantations and on an average 1000 ha. is being felled andreplanted every year (Prabhu, 2003). But continuouscropping of the same species over such long gestation
period make huge demand on the site and soil especiallyon sloping terrain. Jose and Koshy (1972) reported soilcompaction and fertility decline in teak, Alexander et al. (1980)
observed site quality deterioration in second and thirdrotation teak while Balagopalan and Jose (1982) andBalagopalan and Chacko (2001) reported decrease in soil
organic carbon and nitrogen in second rotation plantation.Thomas et al. (1997) quantified soil erosion from youngteak plantation to the extent of 4-15 metric tons/ha.
Forestry, being low input as against agriculture, soiland nutrient enrichment by way of high inputs are notfeasible. Rotation with tree legumes, though not attempted
till now, has been considered an ideal choice to amelioratethe harm done through continuous monoculture. KeralaForest Department has raised experimental plots of Acaciaauriculiformis, Acacia mangium and Tectona grandis inclear felled teak plantation sites at Nilambur and Thrissur.A. mangium and A. auriculiformis are fast-growing legume
trees belonging to the sub-family Mimosoidae. They are
Tree Legume Rotation in Teak Silviculture: Suitability of Acaciaspecies
K. K. Sreejesh*, T. P. Thomas, K. M. Prasanth, P. K. Kripa, M. Seema Josephand V. K. Sutheesh
Kerala Forest Research Institute, Peechi, Thrissur, Kerala, India*E-mail: [email protected]
Abstract: The paper describes interim results of soil improvement due to planting of Acacia species in degraded teak plantation sites.Acacia auriculiformis and Acacia mangium were raised along with Tectona grandis in clear felled teak plantation sites at Nilambur andThrissur by the Forest Department. Soil amelioration due to legume tree rotation was assessed in these five year old plots by studying theimprovement in soil physical, chemical and biological properties. Litter dynamics of the two species of Acacia was also compared withthat of the prime species of teak. Soil structure and its water stability were found to be influenced by the species. Both the Acacia specieswere found to be capable of retaining more soil moisture than teak which can be attributed to its canopy characteristics and the slowdecomposing litter accumulation combined with the deciduous nature of teak. No significant difference between species could berecorded in soil pH and organic carbon though a slightly higher value of calcium was observed in teak soil. Root nodulation was found tobe more in A. mangium as compared to A. auriculiformis. Litter fall, litter decomposition and nutrient release from the fallen litter werestudied. Preliminary results indicate that litter fall was highest in A. mangium followed by A. auriculiformis and T. grandis. Litterdecomposition on the contrary was faster in the case of T. grandis, which was followed by A. auriculiformis and A. mangium. All the litterof T. grandis got decomposed in 9 months time, while 93 per cent of A. auriculiformis and 83 per cent of A. mangium litter decomposedin an year’s time. Nutrient release was found to follow the pattern of litter decomposition.
Key Words: Short rotation tree legumes, Soil amelioration, Litter dynamics, Acacia auriculiformis, Acacia mangium, Tectona grandis
tropical rainforest species, which originated from Australia.Rhizobium spontaneously infect the acacia root system andform root nodules that have the capacity of directly fixing
atmospheric nitrogen like most legumes, thus allowingthese species to grow on N deficient soils (Brockwell et al.,2005). Acacia has also been reported to improve soil
(Swamy, 1989). They are also widely grown multipurposetrees in the tropics suitable for firewood, charcoal and paperpulp production and light construction wood. Rotation with
tree legumes can improve the soil and reverse deterioration
to a certain extent. Yang et al. (2009) reported that A.auriculiformis and A. mangium has the ability to fix nitrogen
and A. mangium has greater facilitating effects due to
greater temperature buffering and nutrient amelioration.
Sankaran et al. (1993) reported 9.3-12 t ha-1 annual litter
production in A. auriculiformis plantation in Kerala, which is
considered higher than those reported for other major
plantation species. He had also found VAM and rhizhobial
association with the roots of the species. Balasundaram etal. (2000) had observed that root nodulation in A.auriculiformis was affected by soil properties; less fertile
soil inducing more nodulation. The present study was
carried out in the experimental plots laid out to understand
the influence of A. auriculiformis and A. mangium in site
improvement of teak at Cheppilakkode, Thrissur.
Indian J. Ecol. (2011) 38 (Special Issue) : 76-79Indian Journal
of Ecology

77
MATERIAL AND METHODS
The study was carried out in the established researchplots of Kerala Forest Department at Chepppilakode,
Thrissur (10°30’N and 76°20' E). Plots of 20x20m of Tectonagrandis, Acacia auriculiformis and Acacia mangium hadbeen established in 2005 with a spacement of 2x2m and
with 4 replications. The site received a rainfall of 2885 mmand temperature varied from 14 to 37oC. The soils in generalare well drained reddish-yellow oxisols.
Soil samples were collected from the surface upto adepth of 20cm. Three soil samples were taken from eachof the 12 plots. Core samples were collected separately for
bulk density and big clods for aggregate stability estimation.Soil samples were air dried, passed through 2 mm sieveand subjected to analyses following procedures given in
ASA Monograph (1965) and Jackson (1973). Sand, silt andclay (0.02-2, 0.002-.02 and < 0.002mm) were determinedby hydrometer and particle density (PD) by using standard
flask. Water stable aggregates were quantified using a Yodertype wet sieving apparatus; pH in 20:40 soil: watersuspension and organic carbon (OC) by potassium
dichromate-sulphuric acid wet digestion. Exchange acidity(EA) was determined by 0.5 N barium acetate andexchangeable bases by 0.1 N hydrochloric acid. Nitrogen
(N) and Phosphorus (P) were estimated by autoanalyser,potassium (K) by colorimeter and calcium (Ca) andmagnesium (Mg) by atomic absorption spectrometry. Mean
Weight Diameter (MWD) was calculated using the formulaMWD = ΣΣΣΣΣxiwi; where xi is the mean diameter of a particularsize class and wi is the weight in that range as a fraction of
the total sample weight.
In each plot, 5 litter traps of 1m diameter bamboo
baskets were kept and litter samples collected at monthly
interval and quantified. Litter bag technique (Swift and
Anderson, 1989) was used to study the pattern and rate of
litter decomposition and nutrient release of the three
species. Fifty grams of oven-dried leaf litter of T. grandis, A.
auriculiformis and A. mangium were kept in 0.5 cm mesh
litter bag of size 35 cm × 35 cm and laid in the respective
plots. Thirty six litter bags were laid randomly in each plot
so that 3 bags could be retrieved every month. The bags
were carefully taken to the laboratory, the contents emptied
and extraneous materials such as soil, visible animals and
fine roots were removed. The sample was oven-dried at 70o C to constant weight and analysed for N, P, K, Ca and Mg
contents.The exponential model of Olson (1963), X/X0= e-kt
was used to estimate the annual decomposition rate oflitter, where ‘X’ is the weight of litter remaining after time‘t’,
‘X0’ is the initial weight of litter, ‘e’ is the base of natural
logarithm and ‘k’ is the decomposition rate constant. Thismodel was also used to calculate the half life of litter
decomposition. Statistical analysis of data was carried outby SPSS package.
RESULTS AND DISCUSSION
Data gathered on litter fall and litter decomposition and
consequent nutrient release are given in Table 1. Theinfluence of acacia species on soil properties was bothpositive and negative. Aggregate stability analysis has
brought out some positive influence of acacias. Biggeraggregates were formed in acacia plots compared to teakplots. Among the species, A. auriculiformis was found to
exert greater influence. Mean weight diameter, the index ofaggregate stability was higher in acacia plots. This mightbe due to higher amounts of finer roots that press the
particles on the one hand, the differential pressure exertedby these roots during moisture absorption and theircontribution towards humus on senescence. Bulk density
(g cc-1) was slightly less and porosity slightly more in acaciaplots compared to teak. Proportionately higher contents ofbigger aggregates would have helped in reducing the bulk
density though the effect was not significant. Thus, it can beseen that both A. auriculiformis and A. mangium wereinstrumental in improving the soil structure and its stability.
Soil acidity was found to be increased by acacia species aswas seen in the pH values of 5.25 and 5.3 compared to 5.8in teak plots and this difference was significant. Similar
results were reported by Sankaran et al. (1993). Organiccarbon contents were significantly higher in acacia plotswith values 16.8 g kg-1 in A. auriculiformis and 14.2 g kg-1 in
A. mangium as compared to lower accumulation of 12.6 gkg-1 in T. grandis plots. Exchange acidity was more in acaciaplots (64 cmol kg-1 in the case of A. auriculiformis and 66
cmol kg-1 in the case of A. mangium) as compared to 62cmol kg-1 in T. grandis, while exchangeable bases weremore in T. grandis (54 cmol kg-1) compared to A.auriculiformis (46 cmol kg-1) and A.mangium (48 cmol kg-1)
Table 1. Litter fall (kg ha-1)
Species Jan. Feb. Mar. Apr. May Jun. Jul. Aug. Sep. Oct. Nov. Dec.
Tectona grandis 357±19 337±28 224±21 220±19 240±35 280±19 264±31 310±27 250±30 237±31 342±25 420±19
Acacia auriculiformis 700±40 524±38 206±31 154±32 162±32 237±33 240±29 230±21 251±28 247±25 416±17 815±20
Acacia mangium 574±32 552±30 240±34 235 ±29 210±31 355±22 346±30 284±31 242±21 250±29 376±22 634±15
Tree Legume Rotation in Teak Silviculture

78
plots. Higher litter fall (Table. 2) might have compensatedfor the lower decomposition rate cumulatively over the years.
Table 2. Decomposition rate constant k and half life T 1/2
decomposition of dry matter litter
Species Acacia Acacia Tectona
auriculiformis mangium grandis
k 0.02 0.05 1.2
T(0.5) 270 250 200
There was significant influence of Acacia species inimproving the nitrogen status of soil. Nitrogen contents werefound to be 124 mg kg-1 in T. grandis while that in A.auriculiformis and A. mangium were 140 and 138 mgkg-1 respectively. Phosphorus was low with around 4-5 mgkg-1 and the values did not differ between species.
Potassium also was not much influenced by the species;the mean values were around 130 mg kg-1. T. grandis exertedsignificant effect in the calcium content of soil with 325 mg
kg-1 as compared to 214 mg kg-1 in the case of A.auriculiformis and 207 mg kg-1 in the case of A. mangium.Magnesium content on the contrary was greater in acacia
plots (240 mg kg-1 in A. auriculiformis and 237 mg kg-1 in A.mangium) compared to T. grandis with 215 mg kg-1 ofmagnesium.
Litter Fall and Decomposition
Litter fall pattern varied between species and monthsof the year. Maximum amount of litter fell during Decemberand January months (Table 3). It decreased gradually from
February to May and registered slightly higher values fromJune to November. Total litter in the study year was highestin A. mangium plots with 4298 kg ha-1 followed by A.auriculiformis with 4182 kg ha-1 and T. grandis contributing3481 kg ha-1 litter. Litter of A. auriculiformis consisted of 67per cent leaf, 6 per cent inflorescence, 14 per cent twig and
13 per cent pod while the respective percentages in A.mangium was 70, 5,13 and 12 per cent and in the case of T.
grandis 90 per cent of litter mass was contributed by leafand 10 per cent by twigs. Decomposition of litter was found
to be more during the wet months starting July and leastduring the dry summer months of February to May. In anyear’s time all the litter of T. grandis got decomposed while
93 per cent of A. auriculiformis and 83 per cent of A. mangiumgot decomposed during the same period. Release ofnitrogen through decomposition of litters of T. grandis was
seen to be 100 per cent in 11 months’ time while it was96% in the case of A. auriculiformis and 90 per cent in thecase of A.mangium in 12 months’ time. Decomposition
rate constant (k) was lowest in the case of A. auriculiformis(0.02), slightly higher in the case of A. mangium (0.05) andmuch greater in T. grandis (1.2). Time required for half the
litter to decompose, T (0.5) was found to be 270 days for A.auriculiformis, 250 days for A.mangium and 200 days for T.grandis. Plants are capable of taking up maximum nutrients
during the wet months and utilizing them for biomassproduction. As the soil starts drying up, the trees startshedding its foliage to balance the transpiration demand
as also reduces the evaporation losses from both foliageand the soil surface. Low rate of decomposition of acacialitter was reported by others also (Swamy, 1989 and Byju,
1989). Teak being an indigenous species has co-evolvedwith the local climate and the soil organisms and thus itslitter is easily decomposible. Acacia species that are exotics
may not have this advantage. Litters with greater nitrogencontent are known to decompose rapidly (Singh and Gupta,1977; Meentemeyer, 1978). Though Acacia litter has this
advantage, the decay rate remained low. This can beattributed to the high content of crude fibres in the phyllodesand the presence of thick cuticle (Widjaja, 1980 and Byju,
1989). The lignin content of acacia leaf litter is also morethan that of teak (Kumar and Deepu, 1992). It is also reportedthat decomposition of lignin of nitrogen rich litters is
significantly lower than those with poor nitrogen content(Berg et al., 1992).
Table 3. Litter decomposition pattern (%)
Species Jan. Feb. Mar. Apr. May Jun. Jul. Aug. Sep. Oct. Nov. Dec.
Tectona grandis 10 19 21 25 29 35 51 68 82 93 98 100
Acacia auriculiformis 10 18 20 24 27 32 45 56 63 68 78 93
Acacia mangium 18 28 34 38 39 41 49 56 58 64 75 83
Table 4. Nutrient release (%)
Species Jan. Feb. Mar. Apr. May Jun. Jul. Aug. Sep. Oct. Nov. Dec.
Tectona grandis 21 28 33 41 48 56 66 73 88 99 100
Acacia auriculiformis 16 30 34 39 48 53 63 65 71 74 88 96
Acacia mangium 16 27 33 40 46 51 54 60 65 70 88 90
K. K. Sreejesh, T. P. Thomas, K. M. Prasanth, P. K. Kripa, M. Seema Joseph and V. K. Sutheesh

79
Nutrient release pattern (Table. 4) calculated based onlitter decomposition revealed that 100 per cent release could
occur in 11 months time in the case of teak, while releasefrom A. auriculiformis was 96 per cent and that from A.mangium 90 per cent in an year’s time. Decomposition
rate constant, k, which gives an indication of thedecomposability of litter ranges from 4 for climax tropicalAfrican forest to 0.25 for pine forest of south eastern United
States to still lower values of 0.0625 for Minnesota pinedown to 0.0094 for lodge pole pine at 3000 m altitude (Jennyet al.,1949) . The values of 0.02 for A. auriculiformis and
0.05 for A. mangium can thus be seen to be in the lowerrange of pine forests with low decomposition rate while kvalue of 1.2 in the case of teak is definitely indicative of
faster decomposition (Table 2).Thus, it can be concludedfrom the limited period observation of the present study thatboth the species of acacia, namely A. auriculiformis and A.mangium has both positive and negative influence on soiland its properties. It has a positive effect in soil aggregationand nitrogen enrichment while the negative influence
results from the acidifying nature and the slow rate ofdecomposition. Litter fall was highest in A. mangiumfollowed by A. auriculiformis and T. grandis while litter
decomposition was faster in T.grandis followed by A.auriculiformis and A. mangium.
ACKNOWLEDGEMENTS
The study was made possible with the generous
support of the Kerala Forest Department both administrativeand financial. We are extremely grateful to all the concernedofficers and field staff especially Dr. K.P Ouseph, CCF
(Development) and Sri. B.P. Varghese DCF Research(North). Our sincere gratitude extends to Dr. K.V. Sankaran,Director, Kerala Forest Research Institute for all the support
and encouragement.
REFERENCESAlexander, T.G., Balagopalan, M., Thomas, T.P., and Mary,M.V.(1980)
Properties of soil under teak. KFRI Research Report 7, KeralaForest Research Institute, Peechi, 13p.
A.S.A. (1965) Methods of soil analysis. Parts 1 and 2. In: Black,C.A. and coauthors (eds.). American Society of Agronomy,Madison, Wisconsin, USA, 1972 p.
Balagopalan, M. and Jose, A.I. (1982) Dynamics of organic carbonand different forms of nitrogen under first and second rotationteak plantations of Kerala. Agric. Res. J. Kerala 20: 92-97.
Balagopalan, M. and Chacko, K.C. (2001) Growth of teak insuccessive rotations in relation to soil conditions. KFRIResearch Report 201. 26p. Kerala Forest Research Institute,Peechi.
Balasundaram,M., Thomas,T.P., Sujatha, M.P. and Sankaran, K.V.(2000) Effect of soil properties on the status of root nodulation
of Acacia auriculiformis in acidic soils. Indian J. Forestry23(2):212-216.
Berg,B., Wersen,B. and Ekbohm, G. (1992) Nitrogen level anddecomposition in scotspine needle litter. Oikos 38: 291-296.
Brockwell, J., Searle, S.D., Jeavons, A.C. and Waayers, M. (2005)Nitrogen fixation in Acacias: An untapped resource forsustainable plantations, farm forestry and land reclamation.ACIAR Monograph No 115, 132 p.
Byju, G. (1989) Impact of Eucalyptus and Acacia plantations on soilproperties in different pedogonic environments in Kerala. M.Sc.(Ag.) dissertation, Kerala Agricultural University, Vellayani,Kerala, 160 p.
Jackson, M.L. (1973) Soil Chemical Analysis. Prentice Hall, NewDelhi, 498 p.
Jenny,H., Gesse1, S.P. and Bingham, F.T. (1949) Comparative studyof decomposition rates of organic matter in temperate andtropical regions. Soil Sci. 68: 419-432.
Jose, A.I. and Koshy, M.M.(1972) A study of the morphological,physical and chemical characteristics of soil as influenced byteak vegetation. Indian For. 98:338-348.
Kumar, B.M. and Deepu, J.K. (1992) Litter production anddecomposition dynamics in moist deciduous forests of theWestern Ghats of Peninsular India. For. Ecol. Mgmt. 50 :181-201.
Meentemeyer, V. (1978) Macroclimate and lignin control of litterdecomposition rates. Ecol. 59: 465-472.
Olson, J.S. (1963) Energy storage and balance of producers anddecomposers in ecological systems. Ecol. 44: 322-331.
Prabhu,N. (2003). Teak in Kerala: Past, Present and Future. In:Quality Timber Products of Teak from Sustainable ForestManagement, Proceedings of the International TeakConference, Kerala Forest Research Institute, Peechi, India,2-5 December, 2003.
Sankaran, K.V., Balasundaran, M., Thomas, T.P. and Sujatha, M.P.(1993) Litter dynamics, microbial associations and soil studiesin Acacia auriculiformis plantations in Kerala. KFRI ResearchReport No.91.
Singh, J.S. and Gupta, S.R. (1977). Plant decomposition and soilrespiration in terrestrial ecosystems. Bot. Rev. 43: 449-528.
Swamy, R.H. (1989) Study of organic productivity, nutrient cyclingand small watershed hydrology in natural forests and inmonoculture plantations in Chikmagalur District, Karnataka.J.C.B.M. College, Karnataka. Final Report submitted to Govt.of India. 261 p.
Swift M. J. and Anderson J. M. (1989) Decomposition. In TropicalRainforest Ecosystems. Ecosystems of the World. (H. Liethand M. S. A. Weryer, ed Elsevier, Amsterdam.), pp. 547–569.
Thomas, T.P., Sankar, S. and Sujatha, M.P. (1997) Quantification ofsoil water loss from teak and eucalypt plantations. KFRIResearch Report No.126. Kerala Forest Research Institute,Peechi. 35p.
Widjaja, M.C. (1980) Results of decomposition research atUbrugforest, Jatiluhur, Indonesia. Thesis. Biology Dept.,Pedjadjain Univ. Bandug, Indonesia.
Yang, L., Liu, N., Ren, H. and Wang, J. (2009) Facilitation by twoexotic Acacia: Acacia auriculiformis and Acacia mangium asnurse plants in South China. For. Ecol. and Mgmt. 257(8):1786-1793.
Tree Legume Rotation in Teak Silviculture

Due to their fast growth, poplar cultivars are grownwidely in plantations mostly in the temperate zone. There
are about 10 million ha of poplar plantations world-wide.Many trials have been laid out to find the factors influencingbiomass production. These trials show that N fertilization
regularly has little or no effect ( Coleman et al., 2004;DesRochers et al., 2006; Heilman and Xie, 1993; Jug et al.,1999; Liesebach et al., 1999; Mao et al., 2010). In FACE
experiments, it was shown that higher CO2 levels wouldrequire higher levels of soil-N availability. However, poplarwas able to increase biomass production under elevated
CO2 without additional N (Pregitzer et al., 2000; Luo et al.,2006). Also, no yield response curves and few detailedfertilizer recommendations exist for poplar or willow.
Poplar (Populus sp.) and willow (Salix sp.) speciesare early-successional trees with rapid growth, deep roots,and the ability to grow fast, even in nutrient-poor
environments. Studies of poplars growing on rocks andgravel in their native riparian habitat were found to havesufficient amounts of N in their tissues, a finding, which
was difficult to explain (Coleman et al., 1994, Lawrence etal., 1997). The explanation for the indifference of poplartowards soil N availability has been found recently, which
this paper will focus on.
Diazotrophic Bacteria
It is well established that a large endophytic communityresides in the stem tissue of poplar and willow species,
the function of which is still mostly unknown. Ulrich et al.(2008a) found a total of 53 taxa at the genus level thatincluded Proteobacteria, Actinobacteria, Firmicutes and
Bacteroidetes. In poplar and willow grown in contaminatedsoil, Taghavi et al. (2009) identified 78 endophytic strains,the majority of which (71%) belonged to Gammaproteo-
Evidence for Nitrogen Fixation in the Salicaceae Family
Georg von WuehlischJohann Heinrich von Thuenen-Institute, Institute for Forest Genetics, Sieker Landstrasse 2,
22927 Grosshansdorf, GermanyE-mail: [email protected]
Abstract: It was shown frequently that poplars and willows are able to produce high amounts of biomass even at low soil nutrient levelsand that the application of N fertilizers resulted regularly in little or no increase in growth. Poplars growing on rocks and gravel in theirnative riparian habitat were found to be well supplied with N. In different poplar and willow individuals, e.g. of P. trichocarpa, a P. albahybrid, and Salix sitchensis diverse endophytic bacteria were identified, among them diazotrophic species in which N fixation could beverified. Most fast growing Populus and Salix species can be expected to fix N. These findings throw new light on the Salicaceae Familywith respect to sustainability of biomass production at low-input energy levels.
Key Words: Populus, Salix, Nitrogen-fixation, Endophytic bacteria, Diazotrophic bacteria
bacteria, with Serratia spp., Rahnella spp. Pseudomonasspp. and Enterobacter spp. Among these endophytes
several diazotrophic bacteria were identified. They remainedundiscovered because of their inconspicuous occurrencein the living tissues of the stem and branches and not in
nodules on the roots like in the legume family (Fabaceae).
Legumes form a symbiosis with Rhizobia, a genus ofsoil bacteria capable of biological N fixation, where the plant
trades its sugars from photosynthesis for the combined Nfrom its root nodule inhabitants. In this process, atmosphericN (N2) becomes accessible to the plant by the conversion
into ammonia (NH3). This conversion requires a highamount of energy in the form of adenosine triphosphate(ATP). Through a particular interaction, a specific bacterium
associates with a specific legume, resulting in the familiarroot nodules, in which N fixation occurs. In addition to thelegumes, there are woody plant species of nine Families
(Betulaceae Cannabaceae, Casuarinaceae, Coriariaceae,Datiscaceae, Elaeagnaceae, Myricaceae, Rhamnaceae,and Rosaceae) known to associate with other N fixing
microbes, among them Frankia and these too live inspecialized root nodules. Well known is Alnus of theBetulaceae.
Verification of N Fixation in Salicaceae
In poplars however, endophytic bacteria were confirmedto be growing inside the living tissue of the stems. Theseendophytes were not causing disease by living inside the
plant but rather were beneficial to the host by providinghormones, peptide antibiotics, enzymes etc. and thusbelonging to the plant-growth promoting bacteria (Doty etal., 2005, 2009; Doty, 2010; Scherling et al., 2009; Ulrich etal., 2008a). Among this array of growth-promotingsubstances, ammonia is also present as in a number of
Indian J. Ecol. (2011) 38 (Special Issue) : 80-83Indian Journal
of Ecology

81
other plant species without root nodules like sugar cane,rice, coffee, and sweet potato (Reinhold-Hurek and Hurek,
1998; Xin et al., 2009). Thus, the belief that if a plant specieshad no root nodules, it would not be associated with Nfixing bacteria has shown to be wrong.
Plant-growth promoting bacteria were found in severalpoplar and willow species (Table 1) representing differentSections, Populus trichocarpa, P. tremula, P. × wettsteinii,[Populus alba × (Populus davidiana + Populus simonii) ×Populus tomentosa], P. × canadensis, P. × generosa andalso in Salix sitchensis and S. gooddingii. It is not clear, if
diazotrophic bacteria are present in all Salicaceae species.It can be expected that fast growing poplar and willowspecies adapted to riparian habitats with sandy soils, poor
in N availability are able to fix N. However, with respect topotential uses of plant-growth promoting bacteria it wouldbe important to better quantify possible differences in growth
enhancement due to the symbiotic interaction of a certainpoplar or willow genotypes with certain bacterial strains.
Growth on Nitrogen Free Medium and OtherVerification Methods
In order to definitely verify the ability to fix N, Xin et al.(2009) employed a method in which the incorporation ofthe rare isotope 15N2 instead of the common 14N2 is analyzed.They could show that a strain of the endophytic bacteria
Burkholderia vietnamensis isolated from a wild-grownPopulus trichocarpa tree was able to fix 15N2 by a twentyfoldhigher concentration of this isotope as compared to normal
air. This experiment can be accepted as a proof of N fixationof an endophyte associated with poplar.
This endophyte was then inoculated onto Kentucky
bluegrass (Poa pratensis L.) cultured on an N-free medium.After 50 days the inoculated plants gained 42 per cent in
weight and 37 % in N as compared to the uninoculatedcontrol plants. These results show that inoculation of N-
fixing endophytes may enhance the growth of other plantsunder N-limiting conditions. It must be added that thisparticular B. vietnamensis strain is also able to provide IAA,
a growth promoting hormone to the hosting plant, whichmay also have played a role in the biomass gain.
Another example of growth enhancement was shown
by Ulrich et al. (2008b) using an endophytic strain P22 ofPaenibacillus humicus isolated from poplar. It caused apronounced increase in root number and root length in
poplar compared to uninoculated control plants. The sameeffect was found when rooting macro-cuttings of this poplarclone (Ulrich et al., 2010). An analysis of the metabolites
produced by the inoculated poplar showed that the poplarreacted pronouncedly to the presence of this endophyte byproducing much higher amounts of asparagines and plant
accessible urea (CH4N2O) but reduced amounts of organicacids of the tricarboxylic acid cycle. This effect on themetabolite profiles reflects remarkable changes in N
assimilation in the plant (Scherling et al., 2009).
Opportunities for Practical Use
The technical fixation process of plant accessibleammonia from molecular N2 requires an energy-input of
946 Kilojoules per mole and is thus highly energyconsumptive. For this reason, plants favored for renewableenergy crops are those able to produce high amounts of
biomass with low requirements for synthetic fertilizer. Abovethat, negative influences of excessive N on the environment(groundwater leaching, emission of detrimental N2O, etc.)
can be avoided, when growing N fixing plants.
The energy source for the biological N fixation is ATP ofwhich an equivalent of 16 moles is hydrolyzed in the process.
Table 1. Hosting tree species, bacteria isolated from these, and proof of nitrogen fixation
Tree species Bacterial strain Method of verification Reference
Populus trichocarpa Rhizobium tropici culture on N-free medium Doty et al. (2005)
× P. deltoides
[Populus alba × Paenibacillus metabolite analysis (urea) Scherling et al. (2009)
(P. davidiana + P. simonii) humicus Strain P22
× P.tomentosa]
P. trichocarpa Salix Burkholderia, Rahnella, culture on N-free medium Doty et al. (2009)
sitchensis Enterobacter, Acinetobacter, PCR with nifH primeracetylene
reduction assay
P. trichocarpa Burkholderia vietnamensis culture on N-free mediumPCR Xin et al. (2009)
with nifH primeracetylene
reduction assay15N2 incorporation
assayinoculation on other organism
Evidence for Nitrogen Fixation in the Salicaceae Family

82
Biological N fixation is more energy efficient then theinorganic process as it is enzyme supported and the N is
produced to the required amount and in the place where itis required. N fixing plant species have therefore receivedmuch attention both for soil improvement and saving of
expenses for fertilizer. Also, methods have been sought toinitiate N fixation in crop species by inoculation ofdiazotrophic endophytes (Cocking, 2005).
Because N fixation is an energy intensive process, N
fixing plants make ready use of freely available N in the soil.
They can therefore be used to sequester surplus N in N-
rich sites. For example, poplars and willows are being used
to sequester N from sewage sludge (Dimitriou and
Aronsson, 2004), however, there might be other plant
species able to sequester higher amounts of N.
In agro forestry systems poplar is being grown admixed
with numerous crop plants (Yadava, 2010). These systems
have become common in many places yielding good crops
and high monetary returns both in the poplars as well as
the crop plants (Bangarwa and von Wuehlisch, 2009).
Poplars have been grown in agro forestry system with N-
fixing plants, e.g. (Mao et al., 2010). Although the soil N
increased, there was no biomass increase in the poplars
grown in this system. This unexpected result is easily
explainable when considering the N-fixing ability of poplar.
Implications for Tree Improvement
Analyses of endophytic bacteria in poplar and willow
individuals showed that the bacterial communities differed
considerably between trees (Ulrich et al., 2008a, b; Scherling
et al., 2009). Obviously the tree and bacteria interact in such
a way that a certain bacteria community evolves within a
particular tree genotype. The tree can thus acquire
supplementary characteristics, which are not encoded by
its genes. This may offset predicted gene expressions, e.g.
in marker assisted selections. The success of artificial
inoculations with growth promoting bacteria depends on
the harmony of the bacterial strain and the genotype of the
hosting tree.
It would be of practical importance to know, if species
or genotypes of the Salicaceae family vary in their ability to
fix N. The special spectrum of bacteria found in different
host genotypes may suggest this assumption. There may
even be species not able to fix N. This could apply to species
having evolved on sites where N was not at minimum. A
screening method needs to be developed, which permits
testing of large numbers of genotypes.
REFERENCESBangarwa, K. S. and von Wuehlisch, G. (2009) Using exotic poplar
in northern India for higher returns in agroforestry. Asia-PacificAgrofor. New. 35: 3-5.
Cocking, E.C. (2005) Intracellular colonization of cereals and othercrop plants by nitrogen-fixing bacteria for reduced inputs ofsynthetic nitrogen fertilizers. In vitro Cellular and Develop.Biol.-Plant 41: 369–373.
Coleman, G.D., Banados, M.P. and Chen, T.H.H. (1994) Poplar barkstorage protein and a related wound-induced gene aredifferentially induced by nitrogen. Plant Physiol. 106: 211-215.
Coleman, M. D., Friend, A. L. and Kern, C. C. (2004) Carbon allocationand nitrogen acquisition in a developing Populus deltoidesplantation. Tree Physiol. 24:1347-1357.
DesRochers, A., van den Driessche, R. and Thomas, B. R. (2006)NPK fertilization at planting of three hybrid poplar clones in theboreal region of Alberta. For. Ecol. Mmgt. 232: 216–225.
Dimitriou, I. and Aronsson, P. (2004) Nitrogen leaching from short-rotation willow coppice after intensive irrigation withwastewater. Biomass and Bioenergy 26: 433–441.
Doty, S. L. (2010) Nitrogen-fixing endophytic bacteria for improvedplant growth. In: Bacteria in Agrobiology. D. K. Maheshwari,editor. (Springer Germany, in press).
Doty, S. L., Oakley, B., Xin, G., Kang, J. W., Singleton, G., Khan, Z.,Vajzovic, A., and Staley, J. T. (2009) Diazotrophic endophytesof native black cottonwood and willow. Symbiosis 47:27-33.
Doty, S. L., Dosher, M. R., Singleton, G. L., Moore, A. L., Van Aken,B., Stettler, R. F., Strand, S. E. and Gordon, M. P. ( 2005) Identification of an endophytic Rhizobium in stems of Populus. Symbiosis 39(1):27-36.
Heilman, P.E. and Xie, F. (1993) Influence of nitrogen on growth andproductivity of short-rotation Populus trichocarpa x Populusdeltoids hybrids. Can. J. For. Res. 23: 1863-1869.
Jug, A., Hofmann-Schielle, C., Makeschin, F. and Rehfuess, K.E.(1999) Short rotation plantations of balsam poplars, aspenand willows on former arable land in the Federal Republic ofGermany. II. Nutritional status and bioelement export by harvestof shoot axes. For. Ecol. Mgmt. 121: 67-83.
Lawrence, S.D., Greenwood, J.S., Korhnak, T.E., and Davis, J.M.(1997) A vegetative storage protein homolog is expressed inthe growing shoot apex of hybrid poplar. Planta 203: 237-244.
Liesebach, M., von Wuehlisch, G. and Muhs, H.J. (1999) Aspen forshort-rotation coppice plantations on agricultural sites inGermany: Effects of spacing and rotation time on growth andbiomass production of aspen progenies. For. Ecol. Mgmt.121:25-39.
Luo, Z.B., Calfapietra, C., Loo, M. L., Scarascia-Mugnozza, G. andPolle, A. (2006) Carbon partitioning to mobile and structuralfractions in poplar wood under elevated CO2 (EUROFACE)and N fertilization. Global Change Biology 12: 272–283.
Mao, R., Zeng, D.H., Ai, G.Y., Yang D., Li, L.J. and Liu, Y.X. (2010)Soil microbiological and chemical effects of a nitrogen-fixingshrub in poplar plantations in semi-arid region of NortheastChina. European J. Soil Biol. 46: 325-329.
Pregitzer, K.S., Zak, D.R., Maziaasz, J., DeForest, J., Curtis, P.S.and Lussenhop, J. (2000) Interactive effects of atmosphericCO2 and soil-N availability on fine roots of Populus tremuloides.Ecological Applic. 10: 18-33.
Georg von Wuehlisch

83
Reinhold-Hurek B and Hurek T. (1998) Life in grasses: diazotrophic
endophytes. Trends in Microbiology 6: 139-144.
Scherling, C., Ulrich, K., Ewald, D. and Weckwerth, W. (2009) A
metabolic signature of the beneficial interaction of the
endophyte Paenibacillus sp. isolate and in vitro-grown poplar
plants revealed by metabolomics. Molecular Plant Microbe
Interactions 22: 1032-1037.
Taghavi, S., Garafola, C., Monchy, S., Newman, L., Hoffman, A.,
Weyens, N., Barac, T., Vangronsveld, J., and van der, Lelie D.
(2009) Genome survey and characterization of endophytic
bacteria exhibiting a beneficial effect on growth and
development of poplar trees. Appl. Environ. Microbiol. 75:748–
757.
Ulrich, K., Ulrich, A., and Ewald, D. (2008a). Diversity of endophyticbacterial communities in poplar grown under field conditions.FEMS Microbiol. Ecol. 63:169-180.
Ulrich, K., Stauber, T., and Ewald, D. (2008b). Paenibacillus—apredominant endophytic bacterium colonising tissue culturesof woody plants. Plant Cell Tissue Org. Cult. 93:347-351.
Ulrich, K.,Scherling, C., Weckwerth, W. and Ewald, D.( 2010) KleineHelfer – großer Nutzen. Holz Zbtralblatt 136: p.386.
Xin, G., Zhang, G., Kang, J. W., Staley, J. T., and Doty, S. L.( 2009) Adiazotrophic, indole-3-acetic acid-producing endophyte fromwild cottonwood. Biol. Fertil. Soils DOI 10.1007/s00374-009-0377-8.
Yadava, A. K. (2010) Carbon Sequestration: underexploitedenvironmental benefits of Tarai agroforestry Systems. Reportand Opinion 2: 35-41.
Evidence for Nitrogen Fixation in the Salicaceae Family

The extent and diversity of the world’s forests aredeclining and the demand for wood worldwide is on therise. Much of the world’s timber supply is harvested from
natural forests, while plantations contribute only 7-10 percent of the current world industrial wood production(Gauthier, 1991). Coupled with this increasing demand for
wood and wood products, there has been a shift in theemphasis from utilization of the often complex naturalforests to plantation of species relatively easy to manage
and capable of producing large quantities of wood per unitarea.
The supply of industrial wood raw material from
forest area has been dwindling after the enunciation of 1988forest policy which guided the wood based industries in thecountry to raise their own raw material without depending
on forest department supplies (GOI, 1988).There are about660 pulp and paper industries and more than 30 per cent ofthese industries depend on wood, with 34 in the large scale
sector and 560 in the medium and small scale sector(Srivastava, 2005). The demand for industrial wood rawmaterial is also on the ascendancy due to expansion of
various paper mills. Considering the widening gap betweendemand and supply, almost all industries in the country arein the process of establishment of industrial wood plantation
Pulpwood Characterization and Screening Short RotationEucalyptus Clones
S. Vennila*, K. T. Parthiban, R. Seenivasan, V. Saravanan, P. V. Anbu,S. Umesh Kanna and P. Durairasu
Forest College and Research Institute, Tamil Nadu Agricultural University, Mettupalayam – 641 301 (India)*E-mail: [email protected]
Abstract: In India, the pulp and paper industry is segmented as wood, agro and waste paper based accounting 43, 28 and 29 per cent,respectively of the total installed capacity. The demand for raw material is on the ascendancy due to industrial expansion. Considering thewidening gap between demand and supply, almost all industries in the country are in the process of establishment of industrial woodplantation. However, due to low productivity and erratic pulp recovery, the achievements on this front are dismally modest. Against thisbackdrop, the current study was planned to screen and identify superior genetic resources of Eucalyptus for higher pulp yield and woodvolume. Twenty seven clones in three Eucalyptus species viz., Eucalyptus camaldulensis, Eucalyptus tereticornis and E. urophyllawere subjected for pulp quality analysis. All clones expressed moderate to high range of physical properties. The proximate analysisindicated the variability among the clones. The lignin content was moderate (23% – 27.8%) for all the clones. The clones differedsignificantly for holo-cellulose, which ranged between 68.5 – 74.6 per cent. The pulp yield (40.17- 48.38%) and kappa number (19.30-23.40) indicated significant differences among clones. The strength properties of various clones indicated significant difference amongclones viz., tensile index (35 - 54 Nm g-1), burst index (1.9 - 3.3 K Pa m2 g-1) and tear index (3.8 -5.6 m Nm2 g-1). All the identified clones werefound to be suitable for pulp quality and hence all were included for productivity evaluation. Three clones viz., EC MTP 48, EC MTP 47 andEC MTP 41 recorded superiority in terms of growth characteristics viz., height, diameter and volume. The phenotypic and genotypiccoefficient of variance estimates were low to high in range and volume index recorded the highest PCV and GCV. The heritability valueswere high for all the traits. Considering the pulp quality and productivity conjointly, the clone EC MTP 48 proved superior and this studyrecommends the suitability of EC MTP 48 for pulpwood plantation programme.
Key Words: Eucalyptus, Clonal evaluation, EC MTP 48, Superior SRC
(Lal, 2000). However, the low productivity of industrial woodplantations due to non- availability of site specific andgenetically improved planting stock is the major concern
faced by wood based industries. Hence, there is a need toidentify and screen superior short rotation clone forpulpwood, which has the potential for high pulp recovery
coupled with high productivity.
MATERIAL AND METHODS
The materials used in the present study consisted of
twenty seven clones of three Eucalyptus species viz.,
Eucalyptus camaldulensis, E. tereticornis and E. urophyllaselected from the existing seed source evaluation
experiments established at Forest College and Research
Institute, Mettupalayam and one seed source as control.
From each species, a billet of each 1 m length and 50-60
cm girth were collected, debarked and chipped separately
and screened. The screened chips were used for pulping
experiments. Some chips were converted into dust for
proximate chemical analysis. Based on the initial screening
study in the laboratory, the wood samples were subjected
to analysis of physical and chemical properties. The pulping
experiments were also carried out to find out its suitability
for papermaking.
Indian J. Ecol. (2011) 38 (Special Issue) : 84-90Indian Journal
of Ecology

85
The physical characteristics such as bulk density, basic
density and moisture content of wood chips are estimated.
For the chemical properties analysis, the billets of individual
tree species were chipped in pilot chipper; air-dried and
converted into wood meal. The wood dust passing through
40 mesh but retained over 60 mesh was subjected to
analysis for moisture, ash, hot water soluble, one per cent
NaoH soluble, AB extractive, acid insoluble lignin,
pentosans, hollocellulose as per TAPPI methods (TAPPI,
1980). The strength properties such as pulping, identification
of kappa number, pulp brightness, paper sheet preparation,
paper strength measurement, tensile strength, tearing
strength, bursting strength measurement, black liquor
analysis were analyzed as per standard method (TAPPI,
1980).
Twenty seven Eucalyptus clones were multiplied at theclonal complex using a coppice shoot cuttings obtained
from selected clones. The existing seed source of
Eucalyptus hybrid was raised through seeds and used forcomparison. The clones and seed source were established
in the field in a randomized block design with threereplications. In each replication nine ramets/seedlings wereused for the experiments. The data on height, diameter and
volume index were periodically measured and analysedand the analysis of variance, ANOVA table alone withassociated t test were conducted following the methods of
Panse and Sukhatme (1978).
RESULTS AND DISCUSSION
Pulp Wood Characterization of Eucalyptus ClonesPhysical properties of wood chips. The results of the
study indicated that the moisture contents of wood sample
of all the clones were found to be ranged between 9.76 (ECMTP 47) and 10.90 (EU MTP 8). The bulk density (284 kg m-3)and basic density (542 kg m-3) were found highest in clone
EC MTP 48 and lowest in clone EC MTP 41 (Table 1). It
Table 1. Physical characteristics of different Eucalyptus clones
S. Clones Moisture Bulk density Basic density Chips classification (%)
No. content (OD basis) (OD basis) + 45 mm + 8 mm +7 mm + 3 mm -3 mm
(%) (kg m-3) (kg m-3) (over thick) (accept ) (pin chips) (dust)
1 EU MTP 1 10.49 260 499 Nil 6.1 80.1 13.2 0.6
2 EU MTP 2 10.76 270 510 Nil 5.9 78.5 14.8 0.8
3 EU MTP 5 10.02 224 461 Nil 7.1 81.2 11.3 0.4
4 EU MTP 8 10.90 230 455 Nil 5.7 80.4 13.5 0.4
5 EU MTP 9 10.10 235 473 Nil 6.4 75.3 17.6 0.7
6 ET MTP 13 11.20 230 455 Nil 5.5 76.8 17.2 0.5
7 ET MTP 14 10.61 249 469 Nil 6.2 77.8 15.4 0.6
8 ET MTP 24 10.34 210 477 Nil 8.3 79.6 11.8 0.3
9 ET MTP 29 10.47 236 452 Nil 5.2 80.9 13.5 0.4
10 ET MTP 31 10.91 238 484 Nil 4.6 81.5 13.4 0.5
11 EC MTP 41 10.22 234 446 Nil 6.5 82.6 10.1 0.8
12 EC MTP 44 9.93 224 480 Nil 5.1 78.6 15.7 0.6
13 EC MTP 45 10.12 246 460 Nil 4.9 79.2 15.2 0.7
14 EC MTP 47 9.76 270 510 Nil 4.4 82.8 12.4 0.4
15 EC MTP 48 9.98 284 542 Nil 6.5 81.8 11.3 0.4
16 EC MTP 50 10.97 245 540 Nil 7.2 79.9 12.1 0.8
17 EC MTP 53 10.49 240 540 Nil 5.8 81.5 12.3 0.4
18 EC MTP 56 10.61 212 468 Nil 5.1 82.7 11.6 0.6
19 EC MTP 57 9.73 210 484 Nil 6.7 72.6 20.2 0.5
20 EC MTP 58 10.64 214 456 Nil 4.6 72.6 22.3 0.5
21 FC RI 3 10.53 238 475 Nil 6.8 78.9 13.5 0.8
22 FC RI 53 10.09 217 470 Nil 9.7 76.8 12.9 0.6
23 FC RI 56 10.88 242 455 Nil 8.9 78.4 11.9 0.8
24 FCRI 103 10.03 210 454 Nil 5.8 82.7 11.0 0.5
25 C 106 11.78 240 484 Nil 8.6 79.0 12.1 0.3
26 C 413 10.82 220 510 Nil 9.4 71.1 19.0 0.5
27 C 283 9.89 206 425 Nil 6.7 75.3 17.5 0.5
28 seedling (Control) 10.29 220 455 Nil 8.3 78.6 12.8 0.3
Pulpwood Characterization of Eucalyptus Clones

86
showed that increased density to be strongly linked to
favourable strength, stiffness, hardness and working
properties of sawn timbers, as well as pulp yield and paper
making quality. The wood density of Eucalyptus pulp wood
is possibly one of the most influential factors controlling the
strength and several other physical characteristics of the
paper sheet. It is relatively simple and inexpensive property
to determine, even in unsophisticated environments. The
bulk density exhibited wide variation and the maximum
density was recorded by the clone EC MTP 48. This variation
among tested clones and seed source may be due to the
differences between early and late wood, which could have
created variation between and within trees. Similarly
significant difference was observed among Eucalyptusspecies in basic density, which ranged between 446 kg m-
3 (EC MTP 41) and 542 kg m-3 (EC MTP 48).The wood density
properties are of major importance for the production of
quality pulp and paper. The amount of wood needed toproduce one tone of air dried pulp is calculated from the
density and pulp yield (Storebraten, 1990). Persson (1975)found that differences in diameter growth have major impacton basic density of wood. Basic density is again highly
correlated with late wood content (Bergstedt and Olsen,2000). Similarly, the variability exhibited in most physicalproperties studied among different Eucalyptus clones in
the current study also attests the results of earlier findings.But it is important to understand the exact relationshipbetween wood density and other fibre characteristics of the
test clones that have an effect on pulp and paper quality.
Chemical properties of wood chips. The proximatechemical analysis give an idea of potentiality of raw material
for paper making. The chemical analysis in terms of ashcontent ranged between 0.32 (EC MTP 48) and 0.71 (EUMTP 1) (Table 2). The chemical investigation carried out in
Table 2. Proximate chemical composition of different Eucalyptus clones
S. Clones Ash Solubility in Alcohol Acid Pentosans Holocellulose
No. content Hot 1% benzene insoluble (ash (%)
(%) water NaOH extractive lignin corrected)
(%) (%) (%) (%) (%)
1 EU MTP 1 0.54 3.0 12.9 1.1 24.3 13.4 73.1
2 EU MTP 2 0.45 2.9 12.2 1.1 24.9 13.7 73.1
3 EU MTP 5 0.63 3.3 11.9 1.8 26.0 15.8 68.5
4 EU MTP 8 0.53 2.8 12.5 1.2 24.6 13.2 73.3
5 EU MTP 9 0.50 3.9 12.2 2.7 25.5 15.2 69.8
6 ET MTP 13 0.68 3.5 13.1 2.0 27.8 16.5 68.9
7 ET MTP 14 0.43 2.8 12.8 1.4 24.2 13.8 73.7
8 ET MTP 24 0.55 3.5 14.7 1.8 26.7 14.1 71.4
9 ET MTP 29 0.34 2.7 14.3 1.1 24.3 13.9 73.4
10 ET MTP 31 0.36 3.2 13.9 2.0 25.3 15.1 70.3
11 EC MTP 41 0.43 2.9 13.5 1.2 24.5 13.3 74.6
12 EC MTP 44 0.71 4.1 13.7 1.3 25.4 16.7 71.1
13 EC MTP 45 0.63 3.5 13.6 2.7 27.1 14.8 69.7
14 EC MTP 47 0.46 3.4 12.2 1.4 23.0 13.0 74.8
15 EC MTP 48 0.32 2.7 12.9 1.4 23.2 14.4 75.2
16 EC MTP 50 0.53 3.7 13.8 1.3 24.4 14.8 73.2
17 EC MTP 53 0.48 2.7 12.7 1.3 24.3 14.6 73.2
18 EC MTP 56 0.37 3.3 13.1 1.6 27.6 16.8 72.9
19 EC MTP 57 0.37 3.6 14.2 1.5 26.7 16.2 73.7
20 EC MTP 58 0.48 3.4 12.8 2.4 26.8 15.8 72.3
21 FC RI 3 0.36 3.2 12.5 1.6 27.7 15.2 71.1
22 FC RI 53 0.36 3.6 13.7 2.2 27.8 17.2 70.6
23 FC RI 56 0.63 3.7 14.7 2.1 26.4 17.5 72.8
24 FCRI 103 0.34 3.8 12.2 1.9 26.9 17.2 72.8
25 C 106 0.35 3.4 13.2 1.8 27.3 17.4 72.4
26 C 413 0.31 3.8 12.3 1.6 27.7 14.1 73.3
27 C 283 0.46 3.9 14.5 2.2 27.2 14.2 72.9
28 Seedling (Control) 0.38 3.6 14.0 1.2 25.7 18.5 71.6
S. Vennila, K. T. Parthiban, R. Seenivasan, V. Saravanan, P. V. Anbu, S. Umesh Kanna and P. Durairasu
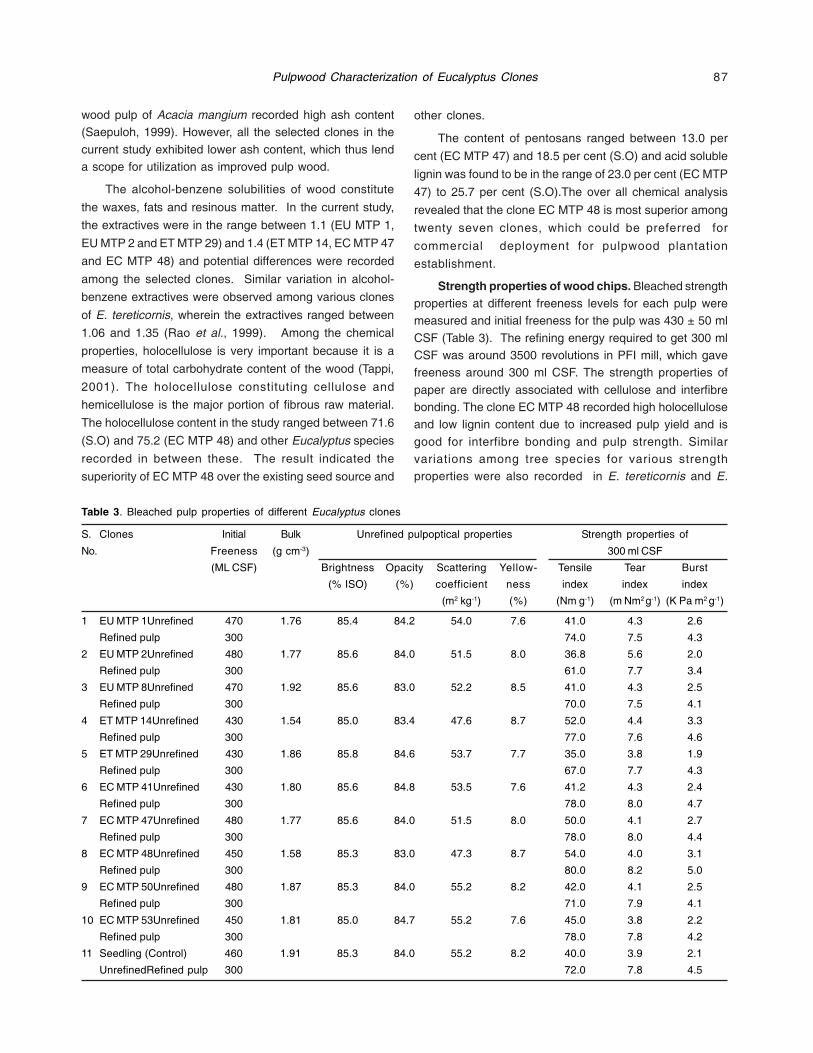
87
wood pulp of Acacia mangium recorded high ash content(Saepuloh, 1999). However, all the selected clones in the
current study exhibited lower ash content, which thus lenda scope for utilization as improved pulp wood.
The alcohol-benzene solubilities of wood constitute
the waxes, fats and resinous matter. In the current study,
the extractives were in the range between 1.1 (EU MTP 1,
EU MTP 2 and ET MTP 29) and 1.4 (ET MTP 14, EC MTP 47
and EC MTP 48) and potential differences were recorded
among the selected clones. Similar variation in alcohol-
benzene extractives were observed among various clones
of E. tereticornis, wherein the extractives ranged between
1.06 and 1.35 (Rao et al., 1999). Among the chemical
properties, holocellulose is very important because it is a
measure of total carbohydrate content of the wood (Tappi,
2001). The holocellulose constituting cellulose and
hemicellulose is the major portion of fibrous raw material.
The holocellulose content in the study ranged between 71.6
(S.O) and 75.2 (EC MTP 48) and other Eucalyptus species
recorded in between these. The result indicated the
superiority of EC MTP 48 over the existing seed source and
other clones.
The content of pentosans ranged between 13.0 per
cent (EC MTP 47) and 18.5 per cent (S.O) and acid soluble
lignin was found to be in the range of 23.0 per cent (EC MTP
47) to 25.7 per cent (S.O).The over all chemical analysis
revealed that the clone EC MTP 48 is most superior among
twenty seven clones, which could be preferred for
commercial deployment for pulpwood plantation
establishment.
Strength properties of wood chips. Bleached strengthproperties at different freeness levels for each pulp weremeasured and initial freeness for the pulp was 430 ± 50 ml
CSF (Table 3). The refining energy required to get 300 mlCSF was around 3500 revolutions in PFI mill, which gavefreeness around 300 ml CSF. The strength properties of
paper are directly associated with cellulose and interfibrebonding. The clone EC MTP 48 recorded high holocelluloseand low lignin content due to increased pulp yield and is
good for interfibre bonding and pulp strength. Similarvariations among tree species for various strengthproperties were also recorded in E. tereticornis and E.
Table 3. Bleached pulp properties of different Eucalyptus clones
S. Clones Initial Bulk Unrefined pulpoptical properties Strength properties of
No. Freeness (g cm-3) 300 ml CSF
(ML CSF) Brightness Opacity Scattering Yellow- Tensile Tear Burst
(% ISO) (%) coefficient ness index index index
(m2 kg-1) (%) (Nm g-1) (m Nm2 g-1) (K Pa m2 g-1)
1 EU MTP 1Unrefined 470 1.76 85.4 84.2 54.0 7.6 41.0 4.3 2.6
Refined pulp 300 74.0 7.5 4.3
2 EU MTP 2Unrefined 480 1.77 85.6 84.0 51.5 8.0 36.8 5.6 2.0
Refined pulp 300 61.0 7.7 3.4
3 EU MTP 8Unrefined 470 1.92 85.6 83.0 52.2 8.5 41.0 4.3 2.5
Refined pulp 300 70.0 7.5 4.1
4 ET MTP 14Unrefined 430 1.54 85.0 83.4 47.6 8.7 52.0 4.4 3.3
Refined pulp 300 77.0 7.6 4.6
5 ET MTP 29Unrefined 430 1.86 85.8 84.6 53.7 7.7 35.0 3.8 1.9
Refined pulp 300 67.0 7.7 4.3
6 EC MTP 41Unrefined 430 1.80 85.6 84.8 53.5 7.6 41.2 4.3 2.4
Refined pulp 300 78.0 8.0 4.7
7 EC MTP 47Unrefined 480 1.77 85.6 84.0 51.5 8.0 50.0 4.1 2.7
Refined pulp 300 78.0 8.0 4.4
8 EC MTP 48Unrefined 450 1.58 85.3 83.0 47.3 8.7 54.0 4.0 3.1
Refined pulp 300 80.0 8.2 5.0
9 EC MTP 50Unrefined 480 1.87 85.3 84.0 55.2 8.2 42.0 4.1 2.5
Refined pulp 300 71.0 7.9 4.1
10 EC MTP 53Unrefined 450 1.81 85.0 84.7 55.2 7.6 45.0 3.8 2.2
Refined pulp 300 78.0 7.8 4.2
11 Seedling (Control) 460 1.91 85.3 84.0 55.2 8.2 40.0 3.9 2.1
UnrefinedRefined pulp 300 72.0 7.8 4.5
Pulpwood Characterization of Eucalyptus Clones

88
grandis (Patil et al., 1997). Within the species, the strengthproperties varied due to age but in the current study variation
occurred among clones of same age which indicated thevariation might be due togenetic differences. In the currentstudy, satisfactory levels of strength properties was
achieved even in five years of growth, which indicated thatthe clones tested in the current study could be harvestedeven in five years as against seven years of current practice
by the state forest department.
The comparison of pulping results for yield and strengthproperties of clones of all the species revealed that EC
MTP 48 is most superior compared to Control (S.O) . Amongthe three species under test, E. camaldulensis recordedhigher strength properties compared to other two species.
The strength properties viz., tensile index, tear index, burstindex and specific coefficient were recorded superior valuesin EC MTP 48, EC MTP 47 and EC MTP 41. This might be
due to superior fibre characteristic of these geno types.This besides, the chemical requirement to achieve 20 kappanumber in this species is only 17 per cent with normal
chemical requirement and good bleaching response mightalso contributed for improved strength properties.
Among the strength properties, tearing strength
depends upon fibre length, width etc. Hence, the maximumtearing strength, burst index and tear index in EC MTP 48,EC MTP 47 and EC MTP 41 must be due to superior fibre
characteristics. Strength properties are best obtained withEC MTP 48, EC MTP 47 and EC MTP 41, which might bedue to higher freeness and optimized kappa number (<20)
recorded by the clones. The wood and wood properties are
very important not only for production of paper but also theproperties of paper (Storebraten, 1990). The pulp and paper
property are highly dependent on fibre morphology andsheet forming processes. Wood with different propertiesgive different pulp and paper qualities (Kibblewhite,
1989).However, in the current study, only dominated treeswere selected which expressed wide variability. Thisindicated the genetic differences among clones of different
Eucalyptus species.
Considering all physical, chemical and strengthproperties, all the trees subjected for analysis were found
suitable as a source of pulpwood. However, consideringthe pulp yield and kappa number coupled with strengthproperties (Table 4), the superiority of the EC MTP 48, EC
MTP 47 and EC MTP 41 as a source of pulpwood wasevident and hence the above three clones are recommendedfor clonal deployment towards establishment of industrial
wood pulpwood plantations.
However, the variation in physical, chemical andstrength properties observed among the clones of three
Eucalyptus species suggest that further improvement couldbe made via selection, breeding and further clonaldeployment of outstanding individuals.
Productivity Studies
Genetically improved and fast growing clonal plantingstock has revolutionized productivity and profitability ofplantation of many species amenable to vegetative
propagation (Lal, 2005). Clonal planting stock is true totype uniform and with all the superior desirable properties
Table 4. Comparison of different Eucalyptus clones with respect to yield and strength
Source Chemical Unbleached Kappa Strength properties at 300 ml CSF
charge for pulp yield number Tear index Tensile index Burst index
20 kappa (%) (m Nm2 g-1) (Nm g-1) (K Pa m2 g-1)
EU MTP 1 17 45.06 20.56 7.5 74.0 4.3
EU MTP 2 17 46.84 20.30 7.7 61.0 3.4
EU MTP 8 17 44.65 20.26 7.5 70.0 4.1
ET MTP 14 17 44.28 20.38 7.6 77.0 4.6
ET MTP 29 17 46.51 20.80 7.7 67.0 4.3
EC MTP 41 17 47.35 20.30 8.0 78.0 4.7
EC MTP 47 17 47.38 20.48 8.0 78.0 4.4
EC MTP 48 17 48.38 19.30 8.2 80.0 5.0
EC MTP 50 17 47.02 20.64 7.9 71.0 4.1
EC MTP 53 17 46.91 20.90 7.8 78.0 4.2
S.O (Control) 17 44.00 24.30 7.8 72.0 4.5
S. Vennila, K. T. Parthiban, R. Seenivasan, V. Saravanan, P. V. Anbu, S. Umesh Kanna and P. Durairasu

89
Table 5. Mean performance of Eucalyptus clones (8 months after planting)
Clones plant height(cm) Basal Diameter (cm) number of branches volume index(cm3)
EU MTP 1 184.63** 1.61** 15.37** 480.93**
EU MTP 2 192.30** 1.68** 16.63** 482.03**
EU MTP 5 164.04** 1.34** 7.48** 298.80**
EU MTP 8 178.30** 1.17** 8.56** 245.76**
EU MTP 9 169.70** 1.07** 6.48 194.75*
ET MTP 13 165.19** 1.16** 5.78 222.26**
ET MTP 14 186.07** 1.26** 7.44* 296.88**
ET MTP 24 170.26** 1.34** 8.63** 308.18**
ET MTP 29 176.19** 1.22** 8.15** 262.51**
ET MTP 31 162.30** 0.89 5.52 128.62
EC MTP 41 193.96** 1.65** 10.52** 530.62**
EC MTP 44 162.41** 1.27** 6.89 262.37**
EC MTP 45 154.93** 1.08** 7.48** 182.56
EC MTP 47 196.67** 1.62** 8.63** 540.34**
EC MTP 48 224.93** 1.81** 13.81** 740.65**
EC MTP 50 182.59** 1.13** 9.44** 254.38**
EC MTP 53 175.04** 1.09** 13.15** 209.50*
EC MTP 56 172.81** 1.17** 9.48** 241.78**
EC MTP 57 166.48** 1.18** 9.44** 237.54**
EC MTP 58 161.74** 1.09** 8.85** 191.81*
FC RI 3 164.15** 1.06** 12.74** 186.12
FC RI 53 162.56** 1.19** 10.85** 234.02**
FC RI 56 170.37** 1.27** 9.15** 277.68**
FCRI 103 182.41** 1.08** 8.81** 214.20*
C 106 170.63** 1.11** 8.41** 211.90*
C 413 176.19** 1.15** 8.81** 236.34**
C 283 176.11** 1.07** 10.52** 201.99*
Seedling (Control) 143.85 0.85 5.81 105.65
Mean 174.53 1.24 9.39 285.00
SEd 2.27 0.05 0.62 41.99
CD (0.05) 4.56 0.09 1.25 84.19
CD (0.01) 6.07 0.12 1.67 112.20
*Significant better than seedling (control) source at 5%.
** Significant better than seedling (control) source at 1%.
of the elite mother tree (Parthiban et al., 2004). It is absolutely
necessary to ensure a wide genetic base of clones to
safeguard against possible epidemics and to provide
continuous superior genetic resources to meet the
demands of wood based industries. The existing genetic
superiority of elite trees should be evaluated through
comparative trial in order to screen site specific clones with
superior wood traits. Genetic improvement of the planting
stock through clonal evaluation can play a very significant
role in improving productivity, yields, quality of produce and
profitability. Against this backdrop, clonal evaluation trial was
carried out using twenty seven clones and one seed source
as control. The clones differed significantly under field
conditions during 2, 4, 6 and 8 MAP for various growth
parameters such as plant height, basal diameter, numberof branches and volume index (Table 5).
The clonal evaluation trial indicated that one clone viz.,EC MTP 48 expressed superiority in all four charactersinvestigated followed by EC MTP 47 and EC MTP 41.
Similarly, in E. tereticornis four clones viz., ET12, ET9, ET1
and ET6 expressed superiority out of sixteen clones tested(Sasikumar, 2003). Similar results were also reported in
the clonal evaluation trials of E. grandis (Lambeth et al.,1994). Their study involving sixteen clones and seedlingchecks indicated that the clones had better yield,
straightness and all other growth parameters compared tocheck lots of seed origin and also significant differencesbetween clones. Vegetative propagation is excellent
Pulpwood Characterization of Eucalyptus Clones

90
approach for development of clonal forestry programme(Vivekanandhan et al., 1997) and it helps to exploit non
additive characteristics (Zobel and Ikemori, 1983). Similargenetic gain by exploiting clonal forestry approaches wasalso done in the hybrids clones of E. grandis and E.urophylla. The hybrid vigour was exploited through clonalforestry (Chopra, 2004), which thus lend support to thecurrent investigation. The superiority of few clones in the
current study might be due to the genetic that inherited fromthe selected mother trees. Hence, the three clones viz., ECMTP 48, EC MTP 47 and EC MTP 41, which expressed early
superiority could be incorporated in the industrial woodplantation programme.
Considering the wood quality traits coupled with growth
attributes the current study recommends three Eucalyptusclones viz., EC MTP 48, EC MTP 47 and EC MTP 41, forincorporation in the ongoing plantation programme and
also in the future breeding programme.
ACKNOWLDGEMENT
The authors profusely thank the ICAR for funding theWorld Bank aided National Agricultural Innovation project
on “A Value chain on Industrial Agroforestry in Tamil Nadu”to TNAU, where in the current study formed a part of objectiveof the scheme.
REFERENCESBergstedt, A. and Olesen, P.O. (2000) Models for predicting dry
matter content of Norway spruce. Scand J. Forest Res. 15:633-644.
Chopra, R.K. (2004) Tree improvement through clonal forestry-Thewest coast paper mill experience.In:K.T.Parthiban,M.Paramathma, K.S. Neelakantan (Eds.), Compendium on clonalforestry NATP-FCRI Publication, Coimbatore. p. 250.
Gauthier, H. (1991) Plantation wood in world trade. In: TheEmergence of New Forest Potentials in the world, AFOCEL,Paris. pp. 9-19.
Government of India (1988) National Forest Policy, MoEF, New Delhi.
Kibblewhite, R.P.(1989) New Zealand radiate pine market kraft pulpqualities. PAPRO New Zealand Technical Brochure.
Lal, P. (2000) National forest policy and raw material supplies forwood based industries in India. Indian For. 126(4): 351-365.
Lal, P. (2005) Integrated development of agroforestry plantationsand wood based industries. In: S. K. Chauhan, S.S. Gill, S.C.Sharma and Rajni Chauhan (Eds.). Agroforestry in 21st century,Agrotech Publishing Academy, Udaipur. pp. 296-303.
Lambeth, C.C., Endo, M. and Wright, J. (1994) Genetic analysis ofsixteen clonal trials of E. grandis and comparisons with seedlingchecks. For. Sci. 40(3): 397-411.
Panse, V.G. and. Sukhatme, P.V. (1978) Statistical Methods forAgricultural Workers. ICAR Publication, New Delhi.
Patil, J.V., Deshmukh, R.B.. Jambhale, N.D., Patil S.C and Kunjir, N.T.(1997) Correlation and path analysis in Eucalyptus. Indian J.For. 22(2): 132-135.
Persson, A. (1975) Wood and pulp of Norway spruce and Scotspine at various spacings. Department of Forest Yield Research,Research Notes 37, Royal College of Forestry, Stockholm,Sweden. p. 145.
Rao, R.V., Kothiyal, V., Sreevani, P., Shashikala, S., Naithani, S. andSingh, S.V. (1999) Yield and strength properties of pulp ofsome clones of Eucalyptus tereticornis. Indian For. 125(11):1145-1151.
Sasikumar, K. (2003) Clonal evaluation of Eucalyptus tereticornisSm. and Acacia hybrids and interspecific hybridizationbetween A. auriculiformis A. Cunn. ex. Benth. and A. mangiumwilld. Ph.D. Thesis, Tamil Nadu Agricultural University,Coimbatore.
Srivastava, M.B. (2005) Timber Industries and Non-timber ForestProducts. CBS Publication, New Delhi. p. 518.
Storebraten, S. (1990) Sulfatfabrikken – virkesforsyningenssoppelplass Foredrag i PTF, Masseteknisk gruppe, 9 Oktober,Oslo, Norway. p. 25.
Tappi. (1980) Standard and suggested methods. Technicalassociation of pulp and paper industry, New York. pp. 200-265.
Vivekanandhan, K., Gurumurthi, K. and Jayaraj, R.S.C. (1997) Clonalmultiplication of Eucalyptus. Institute of Forest Genetic andTree Breeding, Coimbatore.
Zobel, B.J. and Ikemori, Y.K. (1983) Vegetative propagation inEucalyptus. In: Proc. 9th meeting, Canadian Tree ImprovementAssociation.
S. Vennila, K. T. Parthiban, R. Seenivasan, V. Saravanan, P. V. Anbu, S. Umesh Kanna and P. Durairasu

The strategic interest of every country is to increase the
level of its energy independence. The only path towardsachieving this goal is to test the possibilities of usingalternative energy sources. Among alternative energy
sources, the so-called renewable energy sources and theiradvantages in terms of environment protection andsustainable development attract particular attention. By
signing certain agreements (e.g. the Kyoto Protocol), themajority of European countries have committed themselvesto taking concrete steps in increasing the share of
renewable energy sources in the total energy balance.
Biomass is a renewable energy source with the highestpotential in Croatia. The national BIOEN programme
(Domac et al., 1998, 2001) was initiated with the aim ofpromoting the use of bioenergy for energy purposes. BothEurope and Croatia are faced with the problems of
agricultural production of low profitability on marginal andabandoned soils. More recently, such production hasadditionally been aggravated by adverse climatic changes,
soil and water pollution, lack of energy and depopulation inareas with dominant extensive agricultural production. SRF(Short Rotation Forestry) and biomass production follow
world trends and aim to put renewable energy sources tobetter use without generating additional quantities of CO2,otherwise largely present in fossil fuels.
Selection and Breeding of Willows (Salix spp.) for Short RotationForestry
Davorin Kajba* and Ida KatièiæFaculty of Forestry University of Zagreb, 10 000 Zagreb, Croatia
*E-mail: [email protected]
Abstract: The clonal tests of the arborescent willows in Croatia include the autochthonous white willow (Salix alba), interracial hybridsof the autochthonous white willow and the English ‘cricket’ willow (S. alba var. calva), interspecies hybrids (S. matsudana × S. alba), aswell as multispecies hybrids of willows. Selection for this purpose is done in natural populations of white willow, white willow hybridfamilies, and hybrid families of white willow interspecies hybrids with other species. These are mainly the Chinese willow (Salix alba ×S. matsudana) of the Fl and F2 generation, as well as backcrosses. Special attention has been paid to the selection of the plus variants onthe basis of transgression variability. Testing of arborescent willows continued aiming at identification of clones with greatest productionpotential, particularly on so called marginal sites i.e. abandoned agricultural soils and/or sites that are not suitable for growing morevaluable tree species. Clonal tests were established with clones originated to white willow (Salix alba) and from different crossingcombinations of white willow and Chinese willow (S. matsudana). In one clonal test, on the heavy clay type of soils, in two-year rotation,mean biomass production of all studied clones (more than 30) was 9.3 t DM ha-1. The highest biomass production of white willow (Salixalba) was performed by clones ‘B44’, ‘V093’ i ‘V052’ (17.5, 13.7 and 12.2 t DM ha-1, respectively). Above mentioned clones have shownspecific adaptedness on tested conditions through survival and sprouting ability. In other two clonal tests with hybrids of white willow andChinese willow (more than 50 clones), mean biomass production vary from 10.7 to 28.8 t DM ha-1 a-1 at the first and second two yearrotation period. At one of these experimental plots, with regular agrotechnical treatments, the highest biomass production as well as thebest adaptedness and phenotypic stability on testing sites was shown by two clones (‘V 374’, ‘V 461’, 25,8 – 27,6 t DM ha-1 a-1) originatedfrom backcross hybrid S. matsudana × (S. matsudana × S. alba) and by one S. alba clone (‘V 95’, 28,8 t DM ha-1 a-1). These resultsindicated significant potential of Chinese willow for further breeding aimed at biomass production in short rotations.
Key Words: Biomass production, Salix clones, SRC, Croatia
Biomass of forest tree species can also be produced
by intensive cultivation of fast-growing species in SRF. The
basic function is the production of biomass as a renewable
and ecologically acceptable energy source. However, these
species can also be an alternative “agro” culture (in poorer
sites), or they can act as agricultural soil diversifiers, as
well as provide the possibility of ecologically more
acceptable methods of waste water and soil cleaning
(phytoremediation). In addition, they sequester increased
quantities of atmospheric carbon dioxide (carbon
sequestration) as cited by Verwijst (2003).
In recent research, clones of arborescent willows
manifested the highest biomass production potential in
short rotations of up to five years on marginal (clay type of
soil, reed habitat), but particularly on optimal soils
(Komlenoviæ et al., 1996; Kajba et al., 1998, 2004; Kajba
1999a, 1999b; Bogdan et al., 2006). Tests of different
arborescent willow clones continued with the purpose of
identifying those with the highest biomass production
potential, especially on so-called marginal soils, i.e.
abandoned soils with no agricultural production that are
not attractive for the cultivation of more valuable forest tree
species (Volk et al., 2004; Smart et al., 2005).
Indian J. Ecol. (2011) 38 (Special Issue) : 91-94Indian Journal
of Ecology

92
MATERIAL AND METHODS
A test with 14 white willow (Salix alba) clones wasestablished with cuttings in the area of Darda Forest Office,
in the eastern part of Croatia (FT1) on the poor site (reedhabitat). At ramet age 2/3, 2/5 and 2/7 years, breastdiameters were measured, survival was determined and
the number of shoots per tree stump was identified.
Two clonal tests with 25 clones obtained by differentcrossing combinations of white willow (Salix alba L.) and
Chinese willow (Salix matsudana Koidz.) were establishedin the area of Èazma Forest Office (north-western Croatian,FT2 and FT3) on clay type of soil (Table 1).
One experimental test was established with a total of
ten clones on a more optimal site within the nursery (FT4)
in the area of Valpovo Forest Office.
The tests were established according to the
randomized block system design with an equal number of
repetitions. Each clone is represented with at least 30
ramets planted in 1.3 x 0.8 m spacing. The offshoots were
cut, biomass was measured and evaluated on two-year-
old sprouts, and the survival of the tested clones was
determined. In the year of test establishment, as well as
after the first cutting, weed vegetation was mechanically
regulated.
In all the four clonal tests, all two-year-old shoots fromthe same stump were cut in one repetition and their massin fresh condition was measured. Mass samples of 0.5 kg
were collected randomly from the cut shoots, separately foreach clone. The samples were dried at 105°C until constantmass was achieved. The ratio between fresh and dried
sample mass was used to determine the average sharesof moisture in the wood of each clone. These were thenused to assess dry biomass of cut shoots. Breast diameters
and dry biomass of cut shoots were equalized by means of
Table 1. Studied willow clones in four clonal tests (FT1, FT2, FT3 and FT4)
Taxon Clone
Salix alba ‘107/65/1’, ‘107/65/6’, ‘107/65/7’, ‘107/65/9’, ‘V 158’, ‘B 44’, ‘B 72’, ‘B 84’, ’73/64/8', ‘V 161’, ‘V 160’, ‘V 111’, ‘V 83’, ‘V 95’
S. alba var. calva × S. alba ‘V 052’, ‘V 0240’
(S. alba × S. alba var. vit.) × S. alba ‘V 093’
Salix ×savensis (S. alba × S. fragilis × S. caprea) ‘V 221’
S. matsudana × S. alba ‘V 277’, ‘V 278’, ‘V 279’,
S. matsudana × [(S. m. f. tortuosa × S. alba ) × ‘V 369’
(S. m. f. tortuosa × S. alba)]
S. matsudana × (S. matsudana × S. alba) ‘V 373’, ‘V 374’, ‘V 375’, ‘V 458’, ‘V 459’, ‘V 460’, ‘V 461’,
(S. matsudana × S. alba) × unknown ‘V 462’, ‘V 571’, ‘V 572’
S. matsudana × unknown ‘V 573’, ‘V 574’, ‘V 575’, ‘V 576’, ‘V 577’, ‘V 578’, ‘V 580’
clonal tests on marginal sites (FT1, FT2, FT3)
a non-linear regression method. Then, using the obtainedregression models (for each clone separately) and the
previously measured breast diameters, dry biomass of eachparticular shoot in the tests was assessed. The productionof clone biomass per hectare was assessed in relation to
the value of dry biomass of mean shoot, survival, distancebetween the ramets and the average number of shoots perroot.
The data obtained from the measurements wereprocessed by means of descriptive statistical analysis todetermine the average, minimal, and maximal values, as
well as standard deviations for the investigated properties.Non-linear regression analysis was used to assess drybiomass of particular shoots according to the following
equation (Telenius and Verwijst, 1995):
W = a + bD1.3c; where:
W – dry biomass of shoots
D1.3 – breast diameter of shootsa, b, c – parameters assessed on the basis of the
shoot sample cut in one repetition.
RESULTS AND DISCUSSION
Fig. 1 shows total biomass production per surface unitof the investigated clones of arborescent willows in theDarda test (FT1) in three successive two-year rotations.
Biomass production of all the investigated clones shows arising trend in proportion with the test age, except in clones‘V 158’ and ‘V 160’, in which, after the initial increase, a
decrease in the production was recorded between thesecond and the third rotation. In the first year of research(age 2/3 years), the mean biomass production amounted
to 4.0 t ha-1, with values ranging from 2.8 (clone ‘107/65/1’)to 6.4 t ha-1 (clone ‘V 052’). In the following rotation (age2/5 years), the mean production was 6.5 t ha-1 and ranged
from 2.4 (clone ‘107/65/1’) to 10.2 t ha-1 (clone ‘B 44’). At
Davorin Kajba and Ida Katièiæ

93
ramet age of 2/7 years, the mean biomass productionamounted to 9.3 t ha-1 and ranged from 5.0 (clone ‘V 158’) to17.5 t ha-1 (clone ‘B 44’).
Among all the studied clones, the clones ‘B44’ and‘V093’ are singled out in terms of their excellent adaptednessto the habitat (reed habitat) and to developmental conditions.
In addition, they display above-average values of dry massof the mean shoot, or total biomass production, as well assprouting ability. The clones ‘V052’ and ‘V160’ also manifest
good adaptedness to the tested conditions through survivaland sprouting ability, although biomass values of the meanshoot are average.
Fig. 2 shows biomass production of the studied willowclones in the Èazma test (FT2), in the first two-year rotationat ramet age 2/3 years. The mean biomass production of
the 23 tested clones was 11.8 t ha-1 and ranged fromminimal 1.1 (clone ‘V 463’) to maximal 23.2 t ha-1 (clone ‘V580’).The highest biomass production in the type of heavy
clay soil was exhibited by the clones originating fromcrossing the Chinese willow and an unknown parent(clones ‘V 580’ and ‘V 573’), and by the white willow clone ‘V
95’. Fig. 3 presents the production of all the 25 tested clonesand their production in two successive two-year rotations.Mean production of the tested clones amounted to 10.1 t
ha-1 at age 2/3 years, and 13.8 t ha-1 at age 2/5 years. Cloneproduction ranged between 4.0 and 19.0 t ha-1 in the first
rotation, and between 4.7 and 23.0 t ha-1 in the second two-year rotation.
In these experiments and in three rotations, the best
phenotypic stability and steady production were manifestedby two clones, ‘V 374’ and ‘V 461’, originated from backcrosshybrids S. matsudana × (S. matsudana ×S .alba), and by ‘V
95’, a white willow clone (S. alba). With their averageproduction in two-year rotations varying between 12.4 and19.8 t ha-1, they manifested considerable potential for drywood biomass production on these heavy clay soils.
In the clonal test established in the nursery area (ValpovoForest Office), the already mentioned clones of backcrosshybrids S. matsudana × (S. matsudana × S. alba), the clones
‘V 374’ and ‘V 461’, as well as the white willow clone (‘V 95’)manifested the highest production of 25.8 - 28.8 t/ DM ha-1
(Fig. 4). These clones, with regard to the partial application
of agrotechnical measures in the test and to the fact thatthey were raised on a better quality site than the previousclones, achieved exceptional production and represent
phenotypically highly unstable clones of high productivitywith specific adaptability to optimal sites.
Fig. 2. Biomass production of the studied willow clones inÈazma test (FT2) at age 2/3 years
Fig 1 Biomass production of the studied willow clones in Dardatest (FT1) in three successive two-year rotations (2/3, 2/5 and
2/7 years).Fig. 3 Biomass production of the studied willow clones in theÈazma test (FT3) in two successive two-year rotations (2/3
and 2/5 years)
Fig. 4. Biomass production of studied willow clones in Valpovotest (FT4) at the age 2/3 yrs
Selection and Breeding of Willows

94
CONCLUSIONS
Experimental cultures of short rotation coppices withclones of arborescent willows were established on so-
called marginal sites, i.e. on abandoned agricultural soilsor soils not suitable for the cultivation of more valuable foresttree species (FT1, FT2, FT3). No nutrition or pest control
measures were applied (a practice otherwise widely usedin intensive cultivation system), while weed vegetation wasregulated only at the earliest age. Despite this, the results
showed relatively high biomass production of the studiedclones. Mean dry biomass production of the studied clonesin the Darda test (FT1) at age 2/7 years amounted to 9.3
tons per hectare in the third two-year rotation. The highestproduction was manifested by the clones ‘B 44’, ‘V 093’and ‘V 052’ (17.5, 13.7 and 12.2 t ha-1). In the Èazma clonal
tests (FT2, FT3), research was conducted in the first andsecond two-year rotation at ages 2/3 and 2/5 years. Thetested clones taxonomically belonged to different crossing
combinations of Chinese and white willow. Mean massproduction varied between 10.1 and 13.8 t ha-1, whileperspective and phenotypically more unstable clones
showed mean production of 12.4 to 19.8 t ha-1 (‘V 374’, ‘V461’ and ‘V 95’).
With the application of minimal agrotechnical
measures on a more optimal site (FT4) the same clones,the backcross hybrids S. matsudana × (S. matsudana × S.alba) and one white willow clone (S. alba), had the highest
production potential of 25.8 - 28.8 t DM ha-1 a-1 (‘V 374’, ‘V461’ and ‘V 95’). In order to increase clone production,silvicultural measures should be applied so as to reduce
the number of shoots to one to two per stump, whileproduction on marginal sites could be considerablyincreased with the application of intensive silvicultural and
agrotechnical measures.
REFERENCESBogdan, S., Kajba, D. and Katièiæ, I. (2006) Produkcija biomase u
klonskim testovima stablastih vrba na marginalnim staništima uHrvatskoj. Glas. šum. pokuse, pos. izd. 5, 261-275.
Domac, J., Beronja, M., Dobrièeviæ, N., Ðikiæ, M., Grbeša, D.,Jelaviæ, V., Juriæ, • . , Krièka, T., Matiæ, S., Oršaniæ, M.,Pavièiæ, N., Pliestiæ, S., Salopek, D., Stanièiæ, L., Tomiæ, F.,Tomši, •. and Vuèiæ, V. (1998) Bioen Program korištenjabiomase i otpada: Prethodni rezultati i buduæe aktivnosti.Energetski institut ‘’Hrvoje Po•ar’’. Zagreb. 180 str.
Domac, J., Beronja, M., Fijan, S., Jelaviæ, B., Jelaviæ, V., Krajnc, N.,Kajba, D., Krièka, T., Krstuloviæ, V., Petriæ, H., Raguzin, I.,Risoviæ, S., Stanièi, L. and Šunjiæ, H. (2001) Bioen Programkorištenja energije biomase i otpada. Nove spoznaje i provedba.144 str.
Kajba, D. (1999 a) Short Rotation Crops in Croatia. U: Christersson,L. & S. Ledin (ur.) Proceeding of the first meeting of IEA,Bioenergy Task 17. June 4-6 1998. Uppsala. Sweden. SLU.str. 37-40.
Kajba, D.(1999b) Arborescent willow biomass production in shortrotations. In: Overend, R.P. & E. Chornet (eds.) Proc. of thefourth Biomass Conference of the Americas. August 29 -September 2. Oakland. California. USA. str. 55-60.
Kajba D., Krstiniæ, A. and Komlenoviæ, N.(1998) Proizvodnjabiomase stablastih vrba u kratkim ophodnjama. Šumarski list3-4: 139-145.
Kajba, D., Bogdan, S. and Katièiæ-Trupèeviæ, I. (2004) Produkcijabiomase bijele vrbe u klonskom testu Dravica (Šumarija Darda).Šumarski list 9-10: 509-515. [White willow biomass productionin a short rotation clonal test in Croatia. Šumarski list 9-10:509-515. Zagreb. (In Croatian with English summary).]
Komlenoviæ, N., Krstiniæ, A. and Kajba, D. (1996) Selection ofarborescent willow clones suitable for biomass production inCroatia. Proceedings. Budapest. IPC/FAO Vol. I. Str. 297-308.
Smart, L.B., Volk, T.A., Lin, J., Kopp, R.F., Phillips, I.S., Cameron, K.D., White, E.H. and Abrahamson, L.P. (2005) Geneticimprovement of shrub willow (Salix spp.) crops for bioenergyand environmental applications in the United States. Unasylva221(56):51-55.
Telenius, B. and Verwijst, T. (1995) The influence of allometricvariation, vertical biomass distribution and sampling procedureon biomass estimates in commercial short-rotation forests.Bioresource Technology 51:247-253.
Verwijst, T.(2003) Short rotation crops in the world. U: Nicholas, I.D. (ur.) IEA Bioenergy Task 30 Proceedings of the Conference:The role of short rotation crops in the energy market. December1-5, 2003. Mount Maunganui, Tauranga, New Zealand. Str. 1-10.
Volk, T. A.,Verwijst, T., Tharakan, P.J., Abrahamson, L.P. and White,E.H. (2004) Growing fuel: a sutainability assessment of willowbiomass crops. Ecol. Environ. 2(8):411-418.
Davorin Kajba and Ida Katièiæ

It is necessary to replace fossil fuels by renewable
energy sources. The production of biomass by fast-growingtree species can be an important alternative in the futureenergy-mix. Grünewald et al. (2009) showed that, compared
with poplar (Populus ssp.), willow (Salix ssp.), or any annualcrop, black locust (Robinia pseudoacacia L.) is the bestsuitable species to produce large quantities of biomass
under water-limited conditions in Germany. In a post-mininglandscape of NE-Germany (Jänschwalde, Brandenburg),the annual production of black locust was between 6.9 and
7.6 t DM ha-1, whereas, poplar (Hybrid 275) produced 2.6 - 4t DM ha-1 and willow (Carmen) 1 – 2.9 t DM ha-1. In face ofpredicted climate change with rising temperatures, the area
with low water availability in Brandenburg will probablyincrease (Gerstengarbe et al., 2003). Black locust isundemanding with a high drought tolerance and the wood
has a high specific gravity. The ability to fix atmosphericnitrogen and its readily biodegradable litter results inamelioration of the soil (Berthold and Vor, 2003).
To make short rotation coppice plantation economic, athreshold annualized yield of 10-12 t DM ha-1 is required(Foster, 1992). Up to now several varieties of black locust
have been selected for production of high-quality wood,nectar or biomass for animal feeding (Liesebach et al.,2004), but there is no established variety for short rotation
coppices. Improving of growth-performance and droughttolerance is required for future short-rotation cultivation indrier regions of Germany. For this purpose, seedlings of 45
Improving Growth Performance and Drought Tolerance of Robiniapseudoacacia L. – Analysis of Seedlings of European Progenies
Thomas Guse*, Volker Schneck, Mirko Liesebach1 and Georg von Wuehlisch1
Johann Heinrich von Thünen-Institut, Institute for Forest Genetics,Eberswalder Chaussee 3a, 15377 Waldsieversdorf, Germany
1Sieker Landstrasse 2, 22927 Grosshansdorf, Germany*E-mail: [email protected]
Abstract: Both, the adaptation of climate change and the increasing demand for woody biomass as renewable energy source hasfocussed attention to improving plant material of black locust (Robinia pseudoacacia L.) for short rotation coppices. Its drought toleranceand many other favourable characteristics make it a promising species for biomass production in regions with low water availability inGermany. Samples of 45 progenies of European black locust seed stands from Bulgaria, Germany, Greece, Hungary, Italy, Romania andSlovakia were screened for growth performance after one season inside a greenhouse. Dehydration was measured by chlorophyllfluorescence during a controlled drought treatment of 21 days. The first results show a clear tree-to-tree differentiation as well asdifferences between progenies. Positive correlations between drought tolerance and biomass production of single genotypes make thisapproach a promising procedure for the selection of adapted plant material. After further investigation of potential progenies under fieldconditions, suitable plus trees may be micro-propagated and used directly as clones or for the establishment of seed orchards for theproduction of improved seed.
Key Words: Black locust, Chlorophyll fluorescence, Greenhouse experiment, Seedling, Short rotation coppice
progenies of European sources were screened during their
first year of growth. At the end of the vegetation period plantgrowth and biomass yields were determined as well as theintensity of photosynthesis during a three week period of
controlled dehydration. These data allow for the selectionof suitable seed sources and individuals being able toproduce higher biomass and being drought tolerant at the
same time.
MATERIAL AND METHODS
The experiment used seed samples from black locustseed stands of sevenEuropean countries: [Seven Bulgarian
(Hasskovo, Dobrich, Varna (I, II), Plovdiv, Nessebar, StaraZagora), twelve German (Meyenburg, Wriezen, Kusel, Göritz(I, II), Altbrandsleben, Hasenholz, Buckow, Waldsieversdorf
(I, II, III, IV)), one Greek (Arnaia Xalkiaikis), three Hungarian(Pustztavacs, Nyirsegi, Kiskunsagi), three Italian (Rifreddo,Corsagna, Poggio Rosso), seventeen Romanian (Baciu,
Viisoara, Cuci, Arginesti, Carlogani, Vidra, Mihaiesti,Topoloveni, Gugesti, Focsani, Calafat, Poiana Mare (I, II, III),Sacueni, Berzeasca, Comana), and two Slovakian (Levice,
Sobrance)]. Seven of the German progenies were collectedin natural stands, the other samples are commerciallyavailable.
Percussion scarification combined with hot waterscarification was used to break seed dormancy (Khadduriet al., 2001). During April 2010, 72 seeds per progeny were
seeded in 24-Qickpots, filled with commercial germination
Indian J. Ecol. (2011) 38 (Special Issue) : 95-98Indian Journal
of Ecology

96
substrate and were kept inside a greenhouse. Theseedlings received sufficient water and were kept at 15 to
25°C. After four weeks all plants were inoculated by differentRhizobia strains, ensuring a natural symbiosis with N-fixingbacteria. During June 2010, 20 seedlings per progeny were
randomly selected for the growth performance and droughttolerance screening. These plants were transplanted intolarger pots of 2 l volume for this purpose.
Determination of drought Tolerance. For the drought
tolerance screening (mid-September to mid-October 2010),
one half of the plants (n=419) were not watered during a
period of three weeks, while the other half of the plants
(n=418) were watered for control. Chlorophyll fluorescence
(analysis of the maximum quantum yield of photosystem II:
PS II) was analysed on dark-adapted plants (90 minutes
after sunset) using a portable fluorescence spectrometer
(PAM-2100, Walz). At weekly intervals each plant was
measured, resulting in four periodic times at days 0, 7, 14,
and 21. On each plant three readings on different leaflets of
two leaves were taken. At each of the periodic times the
same leaves and leaflets were measured. Drought
tolerance was assessed by reduction in the Fv/Fm ratio
only, because the Fv/Fm ratio is the most frequently used
index as a measure for plant vitality and early diagnosis of
dehydration stress (Genty et al., 1989).
Determination of growth performance. At the end of
the drought experiment plant height and root-collar diameter
(RCD) 5 cm above ground were recorded on each plant.
The fresh above ground biomass of the stem (SFW) and
leaves (LFW) was determined separately. After drying at
103°C for 48 h, biomass of stem (SDW) and leaves (LDW)
were recorded again.
Statistical analysis. Descriptive and multivariateanalysis were used to describe respectively growth-
performance of progenies and dehydration on chlorophyll
fluorescence using R version 2.9.1 program. Because asignificant effect of dehydration was recorded, the program
was restricted to analyze treatment effects. Differencesbetween treatment means were determined by the Mann–Whitney U test at P < 0.05. The data recorded on the growth-
performance parameters were subjected to two-way ANOVA.Means were compared by using Tukey´s test at significancelevel P < 0.05.
RESULTS AND DISCUSSION
Germination rate of progenies was between 7 per cent(Göritz II) and 100 per cent (Dobrich) with a total average of84.5 per cent. These rates are similar to the 90 per cent
reported by Khadduri et al. (2001), who used the samescarification method. Unfortunately two complete Germanprogenies (Göritz II, Hasenholz) and 23 plants of other
progenies dropped out until September and could not beused for the screening. The two lost progenies also hadthe lowest germination rate (< 10 %) and poor growth
characteristics, probably because of low seed quality. Sogrowth and yield was determined on a total of 837 plants of43 progenies. These growth and biomass characters were
closely correlated among each other. They showedsignificant differences among the progenies (data notshown). The progeny with the greatest average in height
had also the greatest values of RCD, SFW, SDW, LFW andLDW. The smallest progeny had the least values of RCD,SFW, SDW and LDW. Both progenies originated from
German stands. A summary with percentage of average isshown on Table 1.
By progeny selection the woody biomass production
could improve by 197 per cent. But there are high intra-progeny differences in growth, probably caused by thediversity of genotypes. If only the best clones were selected,
the growth-performance after a six month vegetation periodcould improve by about 200 per cent and the biomass
Table. 1. Summary of mean values with standard deviation and range (min - max) of growth characters for all, the worst and the bestprogeny (RCD: root-collar diameter, LDW: leaf dry weight, SDW: shoot dry weight).
all progenies range worst progeny best progeny
(n=837) (n=837) (n=20) (n=20)
Height [cm] 66.2 (±22.3) 8 - 131 54.7 (±16.1) 94.5 (±16.9)
Percentage of average [%] 12 - 198 83 143
Root-Collar diameter [cm] 0.45 (±0.12) 0.12 - 0.8 0.36 (±0.09) 0.61 (±0.12)
Percentage of average [%] 27 - 178 80 136
LDW [g] 2.86 (±1.79) 0.03 - 10.78 1.62 (±0.12) 4.31 (±2.05)
Percentage of average [%] 1 - 377 57 151
Biomass of Stem [g] 2.48 (±1.74) 0.3 - 8.93 1.27 (±0.92) 4.88 (±2.02)
percentage of average [%] 12 - 360 51 197
Thomas Guse, Volker Schneck, Mirko Liesebach, Georg von Wuehlisch

97
production by more than 350 per cent. From family selectionalone, biomass productivity of black locust can be increased
by more than 50 per cent (Bongarten et al., 1992). In theirstudy one year old seedlings of different American progenieswere established and weighed after one (0.31kg ±0.832),
two (1.84kg ±0.868) and three (3.63kg ±0.569) fieldseasons. Addlestone et al. (1999) showed that black locustwith a starting height of 72cm and a RCD of 6.1mm growths
up to 253cm with a diameter of 26.3mm in the second yearsattained height.
Chlorophyll Fluorescence
Values of the maximum quantum yield are around 0.8
in sound and unstressed plants (Percival and Sheriffs,2002), at values below 0.7 a physiological disturbance orstress is signalled (Bolhár-Nordenkampf and Götzl, 1992).
At the beginning of the treatment, the values for the plants ofthe drought treatment (0.76 (±0.03) and those of the control(0.76 ±0.04) did not differ (Fig. 1). After seven days without
water, the value dropped already significantly (0.72 ±0.09),remained however above the threshold value of 0.7. At thistime the plants obviously still had sufficient amounts of water
in the soil. After 14 days of drought the quantum yield valuedropped to 0.5 (±0.29) and averaged after 21 days only 0.18(±0.26). Also in the control plants a distinct drop of this value
was observed, especially after 21 days. The cause for thisis most probably due to the seasonal change middle of
October towards autumn induced by increasingly shorterday lengths. Nevertheless, distinct differences due to thedrought treatment were ascertained. Photochemical
efficiency (Fv/Fm) of detached leaves of 30 woody plants invitro following a 24 h of dehydration was between 0.801(Quercus ilex) and 0.421 (Spiraea japonica ´Shirobana´)
(Percival & Sheriffs, 2002).
After the dehydration period the water content of leaveswas 46.5% and differs clearly from the control (63.5%). In
contrast the water content of shoots was nearly similarbetween the treatment (drought: 56%, control: 57.3%). Withthe retention of water in the shoots, the loss over the leaves
will decrease (drought adaption).
Selection of plants with good growth performanceand high drought tolerance. Drought tolerant plants were
selected if after a drought period of 21 days their quantumyield value was above the threshold value of 0.7, whichmeans that these plants show no signs of drought stress.
However, larger plants, due to their higher waterrequirement, suffer earlier from water deficit (Fig. 2). In total,17 out of 419 plants showed no drought stress symptoms
after 21 days of controlled drought. Only one individual of aGerman progeny (Göritz II) reached a height of 96 cm andmet the criteria fast growing and drought tolerance. Six
plants from five progenies (Waldsieversdorf I, CarloganiPlovdiv (2), Stara Zagora, Rifreddo) with a quantum yieldover 0.7 were between 45 and 90 cm high. Ten plants
Fig. 1. Quantum yields of PS II in black locust by droughttreatment (left (“E”), n=419) and control (right (“K”), n=418) atdifferent periods of treatment (“_0”: start of experience, “_7”:
after one week, “_14”: after two weeks, “_21”: after threeweeks). The straight line in the upper half marks the thresholdvalue of 0.7 under which drought stress of the plant can be
assumed. The letters show differences between test intervalsof treatments (Mann-Whitney U test, P < 0.05).
Fig. 2: Quantum yields of PS II of black locust of different heightclasses (small: 0-45cm (n=185), middle: >45-90cm (n=529),
large: >90cm (n=123)) after controlled drought of 21 days. Thehorizontal line in the upper half marks the threshold value of
0.7.
Growth and Drought Tolerance of Robinia

98
(Kiskunsagi (2), Wriezen, Buckow (2), Topoloveni, Gugesti,Stara Zagora, Rifreddo, Poggio Rosso) were smaller than
45 cm. Per se there is no especially drought tolerant progenyor country identifiable and therefore, individual selection isnecessary.
CONCLUSIONS
These observations focus only on the performance of
seedlings under optimal conditions. Also the present
selection of drought tolerance focussed only on one
parameter. The physiological analysis needs expansion by
additional methods and higher plant numbers. Also the
observation of growth performance needs to be extended
over a longer period to get verified results. So far only
European seed sources were analysed. This will be
expanded to seed sources from the natural range in America
and one Asian seed source. It remains to be seen how the
progenies perform under natural conditions where
additional factors may act as stressors. For this purpose a
total of 50,000 plants of the different seed sources were
reared in the nursery. From this stock, suitable plants shall
be selected after sufficient time under field testing and
compared with the present results. Nevertheless, the first
results are promising for successful selection of adapted
and improved plant material. Suitable plus trees may be
micro-propagated and used either directly as clones or for
the establishment of clonal seed orchards for the production
of seed for short rotation coppice plantations.
REFERENCESAddlesstone, B.J., Mueller, J.P. and Luginbuhl, J.M. (1999) The
establishment and early growth of three leguminous treespecies for use in silvopastoral systems of the southeasternUSA. Agrofor. Syst. 44: 253-265.
Berthold, D. and Vor, T. (2003) Robinie – Fluch oder Segen für denWaldboden? DVFFA-Jahrestagung: BiologischeRationalisierung im Waldbau, ETH Zürich: 55-61.
Bolhár-Nordenkampf, H.R. and Götzl, M. (1992)Chlorophyllfluoreszenz als Indikator der mit der Seehöhezunehmenden Stressbelastung von Fichtennadeln. FBVA-Berichte: Schriftenreihe der ForstlichenBundesversuchsanstalt Wien, 67: 119-132.
Bongarten, B.C., Huber, D.A. and Apsley, D.K. (1992) Environmentaland genetic influences on short-rotation biomass productionof black locust in the Georgia Piedmont. For. Ecol. Manage.55: 315-331.
Foster, C. (1992) Wood fuel production from short rotation coppice.Vegetation management in forestry, amenity and conservationareas. Asp Appl. Biol. 29: 233-239.
Gentry, B., Briantais, J.-M., and Baker, N.R. (1989) The relationshipbetween the quantum yield of photosynthetic electrontransport and quenching of chlorophyll flourescence.Biochem. Biophys. Acta 990: 87-92.
Gerstengarbe, F., Badeck, F., Hattermann, F., Krysanova, V., Lahmer,W. and Lasch, P. (2003) Studie zur klimatischen Entwicklungim Land Brandenburg bis 2055 und deren Auswirkungen aufden Wasserhaushalt, die Forst- und Landwirtschaft sowiedie Ableitung erster Perspektiven. PIK report no. 83, PotsdamInstitute for Climate Impact Research.
Grünewald, H., Böhm, C., Qinkenstein, A. ,Grundmann, P., Eberts,J., and Wühlisch, G. V. (2009) Robinia pseudoacacia L.: Alesser known tree species for biomass production. Bioenerg.Res. 2:123-133.
Khadduri, N.Y., Harrington, J.T., Rosner, L.S., and Dreesen, D.R.(2001): Percussion as an Alternative Scarification for NewMexico Locust and Black Locust Seeds. In: Dumroese, R.K.,Riley, L.E. and Landis, T.D.( technical coordinators) NationalProceedings: Forest and Conservation Nursery Associations-1999, 2000, 2001. Proceedings RMRS-P-24. Ogden: 309-316.
Liesebach, H., Yang, M.S. and Schneck, V. (2004) Genetic diversityand differentiation in a black locust progeny test. ForestGenetics 11 (2): 151-161.
Percival, G.C. and Sheriffs, N. (2002) Identification of drought-tolerant woody perennials using chlorophyll fluorescence. J.Arboric. 28 (5): 215-223.
Thomas Guse, Volker Schneck, Mirko Liesebach, Georg von Wuehlisch

The willows belong to the genus Salix (Salicaceae) isone of the most important taxonomic entities of the worldbecause of the large number of species and varieties. There
are about 330-500 species world wide (Argus, 1997)occurring mostly in the arctic region and north-temperatezone, but few species in the southern hemisphere covering
tropical and subtropical zones. In India, about 33 speciesof Salix are reported from temperate regions of the Indiaexcept S. tetrasperma and S. acmophylla, which are found
in tropical and sub-tropical riparian areas of the entire country(Anonymous, 1972). Few introduced species have beensporadically cultivated in the foot hills and inner valleys of
Himachal Pradesh, Jammu and Kashmir, Uttarakhand andthe northeastern regions of India for many years. Amongthem, the most popular is cricket bat willow Salix alba var.
Caerulea cv culva, is a female cultivar of hybrid originbetween S. alba and S. fragilis, which was introduced bythe Britishers in Jammu and Kashmir state in the beginning
of the 20th century. S. fragilis, S. caprea, S. babylonica, S.matsudana, S. amygdaloides, S. purpurea, S. viminalis, S.triandra and S. phylisifolia were the other Salix species that
were introduced in Jammu and Kashmir during that period(Anonymous, 2000).
The need for precise information about the reproductive
and phenological behaviour of the forest tree species cameto be appreciated with the gradual development of sciencein forestry. It helps the breeders in collecting plants at
Phenological Behaviour and Reproductive Biology of Important FastGrowing Salix Species
Punit Choudhary1*, N. B. Singh, I. K. Thakur, J. P. Sharma, Avinesh Sharma andArchana Verma
1KVK, Rajouri, Sher-e-Kashmir University of Agricultural Sciences and Technology-JammuUniversity of Horticulture and Forestry, Nauni, Solan - 173 230, Himachal Pradesh
*E-mail: [email protected]
Abstract: The study on the reproductive biology of nine important tree willows (Salix spp.) procured from different countries wereconducted to observe the different aspects of their phenological stages and floral biology. Salix tetrasperma, S. jessonensis, S.gracilistyla and S. acmophylla were among early flowering species, whereas, S. udensis flowered in staggered manner from last weekof January to last week of March. S alba, S. matsudana and S. babylonica flowered between 1st and 3rd week of March. S. nigra floweredbetween last week of March and 1st week of April and was last in flowering among all the species. The male flower buds bursted earlierthan the vegetative bud, whereas, female flower buds bursted after the leaves started to emerge in all the species. Although most of thespecies remained leafless from 1st week of December to last week of February, S. tetrasperma became leaf less from 1st week ofNovember. S. matsudana remained leafless till 2nd week of March. S. tetrasperma and S. babylonica fruit took maximum and minimum time,respectively for its development. Seed dispersal was in order of S. acmophylla, S. tetrasperma, S. jessonensis and S. babylonicadispersing their seeds in last week of March followed by S. alba and S. matsudana in 2nd week of April. S. nigra dispersed its seeds inlast week of April.
Key Words: Salix, Phenology, Reproductive biology, Catkin length, Flowering behaviour
different stages of development and enables them todetermine the optimum time for various cultural practicesand to develop appropriate breeding strategy in an
hybridization programme. Accurate and detailed descriptionof plant growth phenostages is necessary for comparisonsbetween different species and taxa (Margaret and Kuzovkina,
2010). The knowledge of flowering time and mode ofpollination in forest trees species is of vital importance for aforest tree breeder. The studies on various aspects viz.,
blooming period, pollen anthesis, stigma receptivity, pollenviability, pollen germination and its storage are essential toinitiate a successful breeding (hybridization) programme.
Therefore the knowledge on various aspect of reproductivebiology is pre-requisite for development of successfulhybrids and harnessing the hybrid vigour.
In species like willows, long traditions of cultivationhave resulted in greater understanding of their biology.However, no detailed information of different reproductive
and phenological stages of different species/hybrids/cultivars of willows has been reported. This study wasundertaken to characterize the various reproductive and
phenological events among six staminate and sevenpistillate species introduced from different countries.
MATERIAL AND METHODS
The present investigations were carried out at Nauni,
Solan (H.P.) during 2008-2010. The study included six
Indian J. Ecol. (2011) 38 (Special Issue) : 99-106Indian Journal
of Ecology

100
staminate and seven pistillate species of genus Salixnamely Salix alba Linn, S. tetrasperma Roxb., S. matsudanaKoidz., S. jessoensis Seeman., S. udensis Trautv., S. nigraMarsh., S. babylonica Linn., S. acmophylla Boiss. and S.gracilistyla Miq. imported from different countries viz., Italy,
New Zealand, USA, Japan, UK including India. Forinvestigations on the phenological behaviour andreproductive biology three competitive trees approximately
of the same age and diameter were selected in the field in2008. On each tree, five branches were tagged with metallictags and numbered from 1-5 and observations on different
phenological and reproductive characters were recordedfor two successive years (2008-2009 and 2009-2010) andanalyzed separately for pistillate and staminate species.
RESULTS AND DISCUSSION
Analysis of variance revealed significant variation for
phenological and reproductive characters for both
staminate and pistillate species respectively. Similarly
significant variation was revealed for characters viz., fruiting
and seed dispersal between different pistillate species in
both the years.
Phenological Behaviour
A close appraisal at the Tables 1 and 2 clearly showedthat S. tetrasperma was pioneer in initiation of vegetativebud swelling during 2nd week of January followed by S. alba
and S. gracilistyla in 1st week of February and last week ofFebruary and 1st week of March in 2009 & 2010, respectively.
Bud swell continued for 247.40 and 246.40 days for S. albain 2009 and 2010, respectively, which was maximum amongdifferent staminate species. Among pistillate species, S.alba initiated bud swelling in 3rd week of January followedby S. tetrasperma and S. jessonensis (Table 3). Bud swellingwas late in S. nigra (3rd week of February) in 2009 and 2010.
S. alba continued bud swelling for maximum period of time.Pistillate S. tetrasperma was 1st to initiate bursting of budsfrom 1st and 2nd week of February in 2009 and 2010.
Vegetative bud bursting started first in S. babylonicaand was very closely followed by S. tetrasperma in 2009,whereas, in the year 2010, S. tetrasperma pioneered in bud
bursting followed by S. babylonica. Duration of bud burstingcontinued for 227.53 mean number of days in S. babylonicawhich was found maximum among the staminate species
in 2009 (Table 4). In S. gracilistyla, bud bursting continuedfor minimum duration (199.20 and 198.40 mean number ofdays) in both the consecutive year i.e., 2009 and 2010.
Similarly maximum duration of vegetative bud bursting(237.07 and 237.33) was recorded in pistillate S.jessonensis for 2009 and 2010, respectively whereas, S.nigra recorded minimum 193.40 and 187.67 mean daysfor bud bursting among the pistillate species in both theconsecutive years. Both staminate and pistillate S.tetrasperma and S. alba started shedding-off their leaves
Table 1. First and last date of important vegetative characters of different staminate Salix species
Vegetative characters
Species Bud swell Bud burst Leaf fall Leafing
2009 2010 2009 2010 2008-2009 2009-2010 2009 2010
S. tetrasperma 10-01-2009 15-01-2010 25-02-2009 21-02-2010 17-11-2008 16-11-2009 25-02-2009 21-02-2010
to to to to to to to to
10-09-2009 15-09-2010 17-09-2009 10-09-2010 25-02-2009 21-02-2010 16-11-2009 02-11-2010
S. alba 01-02-2009 05-02-2010 08-03-2009 12-03-2010 25-11-2008 16-11-2009 08-03-2009 12-03-2010
to to to to to to to to
18-10-2009 12-10-2010 21-10-2009 25-10-2010 08-03-2009 12-03-2010 16-11-2009 18-11-2010
S. babylonica 16-02-2009 19-02-2010 24-02-2009 26-02-2010 17-11-2008 03-12-2009 24-02-2009 26-02-2010
to to to to to to to to
06-10-2009 03-10-2010 19-10-2009 09-10-2010 24-02-2009 26-02-2010 18-11-2009 05-12-2010
S. matsudana 15-02-2009 15-02-2010 15-03-2009 20-03-2010 27-12-2008 20-12-2009 15-03-2009 20-03-2010
to to to to to to to to
10-10-2009 11-10-2010 13-10-2009 23-10-2010 15-03-2009 20-03-2010 20-12-2009 25-12-2020
S. gracilistyla 26-02-2009 01-03-2010 11-03-2009 15-03-2010 15-12-2008 10-12-2009 11-03-2009 15-03-2010
to to to to to to to to
23-09-2009 20-09-2010 29-09-2009 01-10-2010 11-03-2009 15-03-2010 10-12-2009 26-11-2010
S. udensis 21-02-2009 27-02-2010 21-03-2009 26-03-2010 18-12-2008 12-12-2009 21-03-2009 26-03-2010
to to to to to to to to
04-10-2009 10-10-2010 24-10-2009 30-10-2010 21-03-2009 26-03-2010 12-12-2009 05-12-2010
Punit Choudhary, N. B. Singh, I. K. Thakur, J. P. Sharma, Avinesh Sharma and Archana Verma

101
earlier than other species.
Both bud swelling and bud bursting advanced by at
least one week in all the species in 2009 as compared to
2010. This may be attributed to the fact that the mean
maximum temperature was more during January and
February in the year 2009. With early increase in threshold
temperature (temperature required for swelling and
bursting), the buds started to break early. The present
investigations are in agreement with Krammer (1996) who
reported that a 3oC increase in temperature would advance
bud bursting in Fagus sylvatica by 11 days. Tsarouhas
(2002) attributed the variation in time of bud flushing to the
adaptive response of the particular species in the given
environment. The climate variables such as wind, rain, air,
humidity, temperature and light intensity are the important
factors determining the time and duration of different
phonological events in the life history of species. The
present findings concur with the earlier studies of Orlandi
et al. (2007) on winter deciduous species including Salixacutifolia and S. smithiana in which annual timing of different
phonological events were affected to a great extent by
temperature. In the beginning of the growing season
(January–March), leaf bud development and unfolding
should reflect the thermal regime while leaf fall in autumn
is more complex process, which is also induced by lack of
light and low temperatures (Chmielewski, 2003;
Lennartsson, 2003 and Post et al., 2008).
Reproductive Characters
Wide variation for reproductive characters was observed
among different staminate and pistillate species (Tables 5,6, 7 and 8). Data presented in Table 5 and 6 showed thatbud swelling among staminate species initiated with S.tetrasperma, which was closely followed by S. udensis inboth years. S. udensis continued bud swelling and bursting
for maximum duration in two consecutive years. Similartrend was observed for bud swelling and bud bursting
among pistillate species (Table 7 and 8). Bud swelling andbursting initiated first in S. tetrasperma closely followed byS. acmophylla. Bud swelling and bursting continued for
maximum period (45.53 and 46.67 mean days) and (56.60and 56.93 mean days) in staminate S. udensis in 2009 and2010, respectively.
The delay in bud swelling and its bursting may beattributed to the climatic factors as such as temperatureand rainfall. During 2009, the occurrence of comparativelycooler winter along with less precipitation may have delayed
the phonological events. The observations are in line withNienstaedt (1974) on genetic variation in some phenologicalcharacteristics of forest trees, Orlandi et al. (2007) on
phenological investigation of different winter deciduousspecies and Lennartsson (2003) on differences intemperature requirements for bud bursting among Salixclones.
Flowering among willows were delayed by a week in2010 as compared to 2009. The strong seasonal
differences observed between willows suggested thatflowering phenology may be an important promoting barrierto inter-specific pollination and potential gene flow. The
present investigation supports the findings of Mosseler andPapadopol (1989) where seasonal isolation was reportedas reproductive barrier among four sympatric Salix species.
An average length of 6-10 days and 8-13 days of floweringperiod was reported by him in two successive years. EarlierKarrenberg et al. (2002) also reported flowering period of 7,
30, 32 and 36 days during studies on inflorescencemorphology in S. daphnoides, S. elaeagnos, S. triandra andS.alba. Dickmann and Kujovkina (2008) also reported that
sequence of flowering and development of shoots may varyamong willow species. Delayed flowering in 2010 among
Table 2. Variation in time taken (mean number of days) for important vegetative characters among different staminate Salix species
Vegetative characters (mean number of days)
Species Bud swell Bud burst Leaf fall Leafing
2009 2010 2009 2010 2008-2009 2009-2010 2009 2010
S. tetrasperma 241.00 240.67 201.67 199.40 97.13 95.87 260.33 251.47
S. alba 247.40 246.40 223.07 225.13 101.00 114.67 249.40 250.13
S. babylonica 230.47 224.40 227.53 222.73 95.67 83.93 264.73 270.53
S. matsudana 243.73 236.73 210.20 215.27 75.33 86.93 278.20 278.80
S. gracilistyla 207.13 200.87 199.20 198.40 84.87 94.73 271.87 254.80
S. udensis 222.53 223.80 215.53 198.67 91.47 101.93 263.80 253.67
Mean 232.04 228.01 212.86 209.93 90.91 96.34 264.72 259.90
SE±m 0.31 0.29 0.32 0.34 0.31 0.32 0.35 0.41
CD 0.05 0.61 0.59 0.64 0.70 0.63 0.65 0.71 0.82
Phenological and Reproductive Behaviour of Salix

102
Table 3. First and last date of important vegetative characters of different pistillate Salix species
Vegetative characters
Species Bud swell Bud burst Leafall Leafing
2009 2010 2009 2010 2008-2009 2009-2010 2009 2010
S. tetrasperma 23-01-2009 26-01-2010 03-02-2009 09-02-2010 17-11-2008 10-11-2009 03-02-2009 09-02-2010
to to to to to to to to
19-09-2009 12-09-2010 27-09-2009 18-09-2010 03-02-2009 09-02-2010 10-11-2009 15-11-2010
S. alba 18-01-2009 20-01-2010 01-03-2009 28-02-2010 19-11-2008 13-11-2009 01-03-2009 28-02-2010
to to to to to to to to
05-10-2009 29-09-2010 19-10-2009 09-10-2010 01-03-2009 28-02-2010 10-11-2009 19-11-2010
S. babylonica 09-02-2009 14-02-2010 17-02-2009 22-02-2010 24-11-2008 26-11-2009 17-02-2009 22-02-2010
to to to to to to to to
15-10-2009 12-10-2010 14-10-2009 11-10-2010 17-02-2009 22-02-2010 26-11-2009 05-12-2010
S. matsudana 13-02-2009 18-02-2010 03-03-2009 10-03-2010 18-12-2008 22-12-2009 03-03-2009 10-03-2010
to to to to to to to to
19-10-2009 14-10-2010 24-10-2009 12-10-2010 03-03-2009 10-03-2010 22-12-2009 20-12-2010
S. jessonensis 23-01-2009 27-01-2010 08-02-2009 09-02-2010 19-11-2008 21-11-2009 08-02-2009 09-02-2010
to to to to to to to to
25-09-2009 25-09-2010 02-10-2009 05-10-2010 08-02-2009 09-02-2009 25-11-2009 26-11-2010
S. nigra 21-02-2009 26-02-2010 10-03-2009 12-03-2010 08-12-2008 15-12-2009 10-03-2009 12-03-2010
to to to to to to to to
18-09-2009 08-09-2010 15-12-2009 20-09-2009 16-09-2010 10-03-2009 12-03-2010 10-12-2010
S. acmophylla 04-02-2009 07-02-2010 10-02-2009 14-02-2010 29-11-2008 25-11-2009 10-02-2009 14-02-2010
to to to to to to to to
20-09-2009 13-09-2010 28-09-2009 02-10-2010 10-02-2009 14-02-2010 25-11-2009 20-11-2010
Table 4.Variation in time taken (mean number of days) for important vegetative characters among different pistillate Salix species
Vegetative characters (Mean number of days)
Species Bud swell Bud burst Leaf fall Leafing
2009 2010 2009 2010 2008-2009 2009-2010 2009 2010
S. tetrasperma 237.20 227.13 233.40 220.67 75.93 89.67 278.27 277.93
S. alba 258.27 250.47 231.20 222.6 100.80 103.70 252.73 262.87
S. babylonica 245.33 239.40 236.93 232.33 82.60 87.00 280.53 283.30
S. matsudana 246.60 236.27 233.53 216.13 74.67 75.93 292.67 282.80
S. jessonensis 242.47 239.33 237.07 237.33 75.13 73.93 288.80 288.00
S. nigra 208.07 194.73 193.40 187.67 88.93 83.93 278.33 271.47
S. acmophylla 226.40 217.00 220.80 225.4 72.80 75.40 285.13 277.80
Mean 237.80 229.19 226.62 230.30 81.55 84.21 279.50 277.80
SE±m 0.36 0.28 0.34 0.34 0.35 0.32 0.42 0.37
CD 0.05 0.72 0.57 0.67 0.67 0.71 0.64 0.84 0.75
willow species suggested that willow flowering
demonstrated a strong thermal control, which occur inresponse to heat pulse and may be delayed by cold spellduring January and February 2010 as exhibited by
meteorological data of 2008-2010.
Maximum pollen anthesis period was observed for S.udensis (18.00 and 16.93 mean days) in 2009 and 2010
and minimum was noticed for S. babylonica (4.53 mean
days) in 2009. Anthesis started first in S. tetrasperma in
both the successive years. Mosseler and Papadopol (1989)observed similar pattern of pollen anthesis amongsympatric Salix species. A critical observation on the timing
of pollen anthesis revealed that maximum pollen anthesisin different species took place between 9.00 am to 10.30 am.
Maximum fruit development period, 28.60 and 28.87
mean days was observed for S. tetrasperma in 2009 and
Punit Choudhary, N. B. Singh, I. K. Thakur, J. P. Sharma, Avinesh Sharma and Archana Verma

103
Table 5. First and last date of important reproductive characters of different staminate Salix species
Reproductive characters
Species Bud swell Bud burst Flowering Anthesis
2009 2010 2009 2010 2009 2010 2009 2010
S.tetrasperma 02-01-2009 08-01-2010 20-01-2009 26-01-2010 29-01-2009 04-02-2010 01-02-2009 08-02-2010
to to to to to to to to
25-01-2009 01-02-2010 11-02-2009 16-02-2010 15-02-2009 23-02-2010 13-02-2009 19-02-2010
S. alba 22-01-2009 29-01-2010 16-02-2009 23-02-2010 22-02-2009 02-03-2010 26-02-2009 07-03-2010
to to to to to to to to
20-02-2009 28-02-2010 09-03-2009 16-03-2010 12-03-2009 20-03-2010 09-03-2009 17-03-2010
S. babylonica - 11-02-2010 - 21-02-2010 - 25-02-2010 - 28-02-2010
to to to to
25-02-2010 02-03-2010 05-03-2010 04-03-2010
S. matsudana - 03-02-2010 - 28-02-2010 - 10-03-2010 - 15-03-2010
to to to to
06-03-2010 13-03-2010 25-03-2010 20-03-2010
S. gracilystica 12-01-2009 19-01-2010 02-02-2009 06-02-2010 07-02-2009 14-02-2010 14-02-2009 18-02-2010
to to to to to to to to
13-02-2009 21-02-2010 28-02-2009 04-03-2010 02-03-2009 07-03-2010 27-02-2009 03-03-2010
S.udensis 18-01-2010 20-01-2010 22-01-2009 27-01-2010 27-01-2009 02-02-2010 14-02-2009 18-02-2010
to to to to to to to to
05-03-2010 08-03-2010 20-03-2009 25-03-2010 23-03-2009 26-03-2010 04-03-2009 07-03-2010
- Not flowered in 2009
Table 6. Variation in time taken (mean number of days) for important reproductive characters among different staminate Salix species
Reproductive characters (Mean number of days)
Species Bud swell Bud burst Flowering Anthesis
2009 2010 2009 2010 2009 2010 2009 2010
S. tetrasperma 22.73 23.13 18.33 18.87 16.67 17.33 11.73 10.67
S. alba 29.07 29.20 20.40 20.93 17.87 18.07 11.13 9.87
S. babylonica - 14.27 - 9.53 - 8.47 - 4.53
S. matsudana - 30.20 - 12.53 - 13.93 - 4.87
S. gracilistyla 31.93 32.33 23.87 24.07 20.33 19.53 13.27 13.40
S.udensis 45.53 45.67 56.60 56.93 52.80 53.93 18.00 16.93
Mean 32.31 29.13 29.80 23.81 29.91 21.87 13.53 10.04
SE±m 0.31 0.32 0.40 0.38 0.42 0.32 0.26 0.31
CD 0.05 0.62 0.66 0.81 0.78 0.85 0.65 0.53 0.62
- Not flowered in 2009
2010, respectively. S. nigra was the last species to initiate
fruit development in 2010. The present findings lend supportto the results of Karrenberg et al. (2002), who reported timeperiod of approximately four week for fruit development in
Salix species. Similar period for fruit development (three tofour weeks) was reported by Yan et al. (2007) in S. gordejevii.Earlier Kuzovkina et al. (2008) also reported three to eight
weeks fruiting period in willows. Fruit in general maturedearlier in 2009 as compared to 2010, which again may beattributed to early initiation of first phenological event in 2009.
Seed of Salix are minute with silky hair and seed
dispersal is generally affected by wind and running wateramong Salix species. All the pistillate species variedsignificantly with respect to the duration of seed dispersal.
Seed dispersal period spaned over a period of one weekwith S. tetrasperma recording maximum mean number ofdays for seed dispersal in two consecutive years. In the
present studies, the seed matured and dispersed in lastweek of April and first week of May (three to four weeks afterpollination). Yan et al. (2007) also reported similar seed
Phenological and Reproductive Behaviour of Salix

104
Tab
le 7
. F
irst
and
last
dat
e of
im
port
ant
repr
oduc
tive
char
acte
rs o
f di
ffere
nt p
istil
late
Sal
ix s
peci
es
Rep
rodu
ctiv
e ch
arac
ters
Sp
eci
es
Bu
d s
we
llB
ud b
urst
Flo
we
rin
gF
ruiti
ngS
eed
disp
ersa
l
2009
2010
2009
2010
2009
2010
2009
2010
2009
2010
S.
tetr
aspe
rma
19
-01
-20
09
27
-01
-20
10
08
-02
-20
09
15
-02
-20
10
14
-02
-20
09
19
-02
-20
10
24
-02
-20
09
02
-03
-20
10
25
-03
-20
09
31
-03
-20
10
toto
toto
toto
toto
toto
17
-02
-20
09
24
-02
-20
10
22
-02
-20
09
01
-03
-20
10
24
-02
-20
09
02
-03
-20
10
25
-03
-20
09
31
-03
-20
10
02
-04
-20
09
07
-04
-20
10
S.
alba
-0
6-0
2-2
01
0-
28
-02
-20
10
-0
7-0
3-2
01
0-
22
-03
-20
10
-1
2-0
4-2
01
0
toto
toto
to
10
-03
-20
10
19
-03
-20
10
22
-03
-20
10
12
-04
-20
10
18
-04
-20
10
S.
baby
loni
ca1
3-0
2-2
00
91
8-0
2-2
01
02
0-0
2-2
00
92
4-0
2-2
01
02
8-0
2-2
00
90
2-0
3-2
01
00
6-0
3-2
00
911
-03
-20
10
22
-03
-20
09
27
-03
-20
10
toto
toto
toto
toto
toto
26
-02
-20
09
03
-03
-20
10
03
-03
-20
09
08
-03
-20
10
06
-03
-20
09
11-0
3-2
01
02
2-0
3-2
00
92
7-0
3-2
01
02
8-0
3-2
00
92
1-0
4-2
01
0
S.
mat
suda
na-
12
-02
-20
10
-1
2-0
3-2
01
0-
16
-03
-20
10
-2
9-0
3-2
01
0-
14
-04
-20
10
toto
toto
to
16
-03
-20
10
24
-03
-20
10
29
-03
-20
10
14
-04
-20
10
21
-04
-20
10
S.
jess
onen
sis
-2
9-0
1-2
01
0-
11-0
2-2
01
0-
17
-02
-20
10
-2
8-0
2-2
01
0-
27
-03
-20
10
toto
toto
to
17
-02
-20
10
25
-02
-20
10
28
-02
-20
10
27
-03
-20
10
02
-04
-20
10
S.
nigr
a-
07
-03
-20
10
-1
4-0
3-2
01
0-
21
-03
-20
10
-3
1-0
3-2
01
0-
24
-04
-20
10
toto
toto
to
20
-03
-20
10
25
-03
-20
10
31
-03
-20
10
24
-04
-20
10
01
-05
-20
10
S.
acm
ophy
lla2
1-0
1-2
00
92
8-0
1-2
01
00
5-0
2-2
00
90
7-0
2-2
01
01
3-0
2-2
00
91
2-0
2-2
01
02
3-0
2-2
00
92
5-0
2-2
01
0-
-
toto
toto
toto
toto
08
-02
-20
09
15
-02
-20
10
19
-02
-20
09
21
-02
-20
10
23
-02
-20
09
25
-02
-20
10
21
-03
-20
09
23
-03
-20
10
- N
ot f
low
ered
in 2
009
Punit Choudhary, N. B. Singh, I. K. Thakur, J. P. Sharma, Avinesh Sharma and Archana Verma

105
dispersal period (before rainy season) in Salix gordejevii.Seeds in S. gordajevii started to mature on first May anddispersal lasted from 8th to 20th May.
Flowering Behaviour
Based on the timing of flowering, different Salix species
were grouped into three categories (Table 9) supports thefindings of Mosseler and Papadopol (1989). Based on thetiming of flowering, they grouped different Salix species
into early flowering and late flowering species. The modeof flowering is another important feature, which determinessuccess of breeding programme. After critical observations
on the mode of flowering different species were groupedinto precocious, sub-precocious and coetaneous floweringspecies. The placement of different species accordingly is
in agreement with the reports of Zhenfu et al. (1999),Skrovtsov (1999) on classification of Salicaceae, Kuzokvinaet al. (2008) and Dickmann and Kuzokvina (2008) on poplars
and willows in the world. They classified different Salix
species into four basic categories viz., precocious, sub-
precocious, coetaneous and seritnous.
REFERENCESAnonymous (1972) Wealth of India: A dictionary of Indian raw
material and industrial products. 9:471+XIV.
Anonymous (2000) A handbook of forest statistics. Forest StatisticDivision. Jammu and Kashmir. 172p.
Argus, G. W. (1997) Intrageneric classification of Salix (Salicaceae)in the New World. Systematic botany monographs 52 TheAmerican Society of Plant Taxonomists, USA.
Chmielewski, F. M. (2003) Phenology and agriculture. In: Phenology:An Integrative Environmental Science (Ed. Schwartz, M. D.and Boston, M. A.) USA. Kluwer Acedemic Publishers, pp505–522.
Dickmann, D. and Kuzovkina, Y. (2008) Poplars and willows of theworld. In: FAO/IPC Poplar and Willow in the World: Meeting theNeeds of Society and the Environment. URL http://www.fao.org/forestry/media/16385/0/0/.
Karrenberg, S., Kollmann, J. and Edwards, P. J. (2002) Pollen vectorsand inflorescence morphology in four species of Salix. PlantSyst. Evol. 235: 181-188.
Table 8. Variation in time taken (mean number of days) for important reproductive characters among different pistillate Salix species
Reproductive characters (Mean number of days)
Species Bud Swell Bud burst Flowering Fruiting Seed dispersal
2009 2010 2009 2010 2009 2010 2009 2010 2009 2010
S. tetrasperma 28.73 28.87 14.07 14.27 10.07 10.13 28.60 28.87 7.80 7.27
S. alba - 30.73 - 18.60 - 14.13 - 20.53 - 6.20
S. babylonica 12.33 12.87 11.93 11.87 7.20 8.67 15.53 15.67 5.80 5.93
S. matsudana - 31.60 - 12.00 - 12.80 - 16.07 - 7.13
S. jessonensis - 18.73 - 13.73 - 10.67 - 25.33 - 5.93
S. nigra - 12.33 - 10.93 - 9.80 - 24.27 - 7.13
S. acmophylla 17.73 18.07 12.13 12.20 8.67 13.20 25.87 26.20 5.87 6.07
Mean 19.60 21.90 12.74 13.37 8.64 11.34 23.30 22.40 6.49 6.52
SE±m 0.27 0.29 0.26 0.31 0.24 0.28 0.35 0.31 0.26 0.25
CD 0.05 0.54 0.60 0.53 0.63 0.50 0.58 0.71 0.63 0.52 0.51
- Not flowered in 2009
Table 9. Flowering behaviour of different Salix species
Time of Flowering Early flowering(last week of January S. acmophylla, S. udensis, S. tetrasperma, S. jessonensisand 2nd week of February) and S. gracilistyla
Mid Flowering(between last week of S. babylonica and S. albaFebruary and 1st week of March)
Late flowering S. matsudana and S. nigra(2nd and 4th week of March.)
Mode of Flowering Precocious S. udensis and S. gracilistyla
Sub-precocious Staminate S. tetrasperma
Coetaneous Staminate and pistillate S. alba, S. babylonica, S. matsudana andPistillate S. jessonensis, S. acmophylla, S. tetrasperma and S.nigra
Pattern of Flowering Synchronous S. alba , S. babylonica, S. matsudana S. jessonensis,S. acmophylla, S. tetrasperma and S. nigra
Staggered S. udensis and S. gracilistyla
Phenological and Reproductive Behaviour of Salix

106
Kuzovkina, Y. A., Weih, M., Romero, M. A., Charles, J., Hurst, S.,Mclover, I., Karp, A., Trubush, S., Labrecque, M., Teodorescu,T., Singh, N. B., Smart, L. B. and Volk, T. A. (2008) Salix:Botany and Global Horticulture. Hort. Rev. 34: 447-448.
Lennartsson, M. (2003) Cold hardening and dehardening in Salix.Doctoral thesis. Silvestria 279. ISSN 1401-6230, ISBN 91-576-6513-3.
Margaret, M. S. and Kuzovkina, Y. A. (2010) Phenological stages ofwillow (Salix). Ann. Appl. Biol. 431–437.
Mosseler, A. and Papadopol, C. S. (1989) Seasonal isolation as areproductive barrier among sympatric Salix species. CanadianJ. Bot. 67: 2563-2570.
Nienstaedt, H. (1974) Genetic variation in some phenologicalcharacteristics of forest trees. In: Phenology and Seasonalitymodeling. Ed. Lieth H. Springer-Verlag New York,pp.389-401.
Orlandi, F., Tommaso, B., Luigia, R., Carlo, S., Bruno, R. and Marco,F. (2007) Phenological investigations of different winter-
deciduous species growing under Mediterranean conditions.Ann. For. Sci. 64: 557-568.
Post, E. S., Pedersen, C., Wilmers, C. C. and Forchhammer, M. C.(2008) Phenological sequences reveal aggregate life historyResponse to climatic warming. Ecol. 89(2): 363-370.
Skvortsov, A. K. (1999) Willows of Russia and adjacent countries:taxonomical and geographical revision. Joensuu University,Joensuu.
Tsarouhas, V. (2002) Genome mapping of quantatitative trait loci inSalix with an emphasis on freezing resistance. Doctoral thesis.Swedish University of Agricultural Sciences Uppsala, Sweden.
Yan, Q., Liu, Z., Junling, M. A. and Jiang, D. (2007) The role ofreproductive phenology, seedling emergence andestablishment of perennial Salix gordejevii in active sand dunefields. Ann. Bot. 99: 19–28.
Zhenfu, F., Shidong, Z. and Skvortsov, A. (1999) Salicaceae In: W.Zhengnys and P. H. Reven (Eds.), Flora of China. MissouriBot. Garden press, St. Louisa Mo, pp. 139-274.
Punit Choudhary, N. B. Singh, I. K. Thakur, J. P. Sharma, Avinesh Sharma and Archana Verma

Establishing plantations of fast-growing tree speciesis currently being advanced around the world as a means
to meet the timber needs of the wood based industry aswell as realising goals of sequestering carbon (Sedjo, 1999;
McKenney et al., 2004). Populus deltoides Bartr. ex Marsh.
from the USA is economically the most important poplar
species being grown under agroforestry plantations in
Punjab, Haryana, Uttar Pradesh, Himachal Pradesh and
Bihar states of India (Land and Singh, 1996). Plantation
forestry in India has been dominated by this taxonomic group
in the past three decades. In India about 225 clones of
various poplars were introduced and some of them
performed well (Chauhan et al., 2008). The species was
introduced in India to enhance the productivity and to
maintain the ecological balance and to cater the increasing
demand of paper and plywood industry. Recently poplarhas got much attention because of its preference by theplywood and paper industry.
Six species of poplars (Populus ciliata, P. euphratica,P. gamblei, P. glauca, P. alba and P. suaveolens) areindigenous to India, representing five sections of Populus(Khurana, 1998). Substantiating the importance of thespecies, India in 1965 became the member of theInternational Poplar Commission and constituted the
National Poplar Commission with the basic objective ofcultivating poplars extensively to meet the requirements oftimber for industrial as well as packaging cases and match
box splinters. It is a well established fact that limitednumbers of clones always bears the risk of disease/pestoutbreak and further continuous vegetative propagation also
deteriorate the quality of clones. Due to large scale
Growth Performance of Twelve New Clones of Poplar In Punjab,India
R. K. Luna, N. S. Thakur1* and Vijay Kumar2
Punjab Forest Department, Forest Complex Mohali, Punjab, India1ASPEE College of Horticulture and Forestry, Navsari Agricultural University, Navsari, Gujarat –396 450, India
2Research Circle, Hoshiarpur, Punjab Forest Department, Punjab, India*E-mail: [email protected]
Abstract: Height, diameter growth and volume production of 12 clones of poplar were evaluated at Kharkan Research Station, Hoshiarpur(Punjab) at the age of 3 years. The clone WSL - 39 achieved the best growth and maximum volume, attaining diameter of 14.74 cm; height14.42 m and volume 0.1040 m3/tree. This clone out performed the clones for growth and volume since the beginning. The volumeproduction of clone Udai was at par with WSL – 39 at 2 and 3 years of age. On the basis of present results, WSL-39 and Udai clones canbe included for plantation to broaden the genetic base and more importantly for productivity enhancement.
Key Words: Poplars, Height, Diameter growth, Volume, Mean annual increment.
plantations and consequent demand for entire transplants
(ETPs), clonal material got mixed, which affects the
productivity and hence low returns. Therefore, for sustaining
supplies in the future, the new clones are continuously
introduced and old ones are replaced by the new ones to
broaden the genetic base and obtain higher productivity
(Chauhan et al., 2008). However, in the last two decades
large scale block, boundary and agroforestry plantations
done by farmers in most of the states of north western in
India have depended on narrow genetic base consisting of
only a few best performing clones (Dhillon et al., 2010). The
study and evaluation of growth performance of new poplar
clones is of great importance in order to ensure high wood
production and hence more economic returns. The
evaluation of new clones would be helpful in selecting the
locality specific clones. This article reports the performance
of 12 new poplar clones in Punjab.
MATERIAL AND METHODS
The study was conducted at Kharkan Research StationHoshiarpur, Research Circle Hoshiarpur, Punjab ForestDepartment. The site is located between 310 31’ 03.58" N
latitudes and 760 03’ 07.696" E longitudes at an elevation of303.40 above msl. The area experiences rain ranging from945.4 mm to 1242 mm annually, which falls mostly during
July to September. The soil is sandy loam and well drained.The surface soil is low in organic carbon (0.15-0.30%) aswell as in available nitrogen (150-160 kg ha-1), phosphorus
(3-6 kg ha-1) and potassium (40-60 kg ha-1) and neutral inreaction (pH 7.0).
Indian J. Ecol. (2011) 38 (Special Issue) : 107-109Indian Journal
of Ecology

108
Table 1. Details of clones used in the study
S. Clone Country/ Province of origin
No.
1 G48 Canberra (Australia)
2 Udai India (Seedlings raised from open pollinatednaturalized clones) WIMCO Pvt. Ltd.
3 S7C15 Stoneville Mississippii (USA)
4 WSL-26 India (Seedlings raised from open pollinatednaturalized clones) WIMCO Pvt. Ltd.
5 WSL-49 India (Seedlings raised from open pollinatednaturalized clones) WIMCO Pvt. Ltd.
6 WSL-22 India (Seedlings raised from open pollinatednaturalized clones) WIMCO Pvt. Ltd.
7 WSL-32 India (Seedlings raised from open pollinatednaturalized clones) WIMCO Pvt. Ltd.
8 WSL-39 India (Seedlings raised from open pollinatednaturalized clones) WIMCO Pvt. Ltd.
9 S7C8 Stoneville Mississippii (USA)
10 Kranti Selections of WIMCO Pvt. Ltd.
11 Bahar Selections of WIMCO Pvt. Ltd.
12 WSL-27 India (Seedlings raised from open pollinatednaturalized clones) WIMCO Pvt. Ltd.
The details of 12 clones used in the study are presented
in the Table 1. The one year old and about 5 m tall bare rootplants were transported to the experimental site during thefirst week of February, 2005. The plants were planted at a
spacing of 5m x 4 m in pits of 1 m depth and 20 cm diameterdug with planting augur. The recommended silviculturalpractices (Chauhan and Mahey, 2008) were followed
throughout the investigations. The experiment wasconducted using randomised block design with clones astreatments replicated four times. The data on tree height
and diameter at breast height (DBH, 1.37 m from groundlevel) were recorded every year in the last week of February.
Volume of individual tree of each clone and replication wasestimated by using the equation developed for central plain
region of Punjab by Dhanda and Verma (2001). The dataobtained were subjected to statistical analysis as per theprocedure suggested by Gomez and Gomez (1984).
Wherever the effects exhibited significance at 5 per centlevel of probability, the critical difference (CD) was calculated.(on computer using the package “STATISTICS”).
RESULTS AND DISCUSSION
The data revealed significant differences amongst the
clones for diameter and height growth at all ages i.e., 1st,
2nd and 3rd year (Table 2). The clones WSL-39 and S7 C8
showed higher diameter in the 1st and 2nd year, whereas, in
the 3rd year former outperformed for diameter growth. An
increment of 6.42 cm and 2.90 cm was registered in
diameter over the 1st and 2nd year, respectively. The clone
WSL-39 outperformed significantly at all ages with an
increment of 4.61 m and 3.49 m over the 1st and 2nd year.
This superiority may be ascribed to the difference in the
genetic potential among the clones as the treatment given
to all clones was the same.
The study revealed significant differences in volume
per tree among the clones (Table 3). The clone WSL – 39
gave maximum volume 0.013, 0.0556 and 0.104 m3 at the
age of 1, 2 and 3 years, respectively. Though the volume of
clones S7 C8 and clone Udai was at par with WSL-39 at the
age of 2 years, only Udai remained at par with clone WSL-
39 at 3 years. Clone Kranti had minimum volume at the age
of 1 year; however, G-48 gave minimum volume at the age
of 2 and 3 years.
Table 2. Diameter and height growth of poplar clones at various ages.
Clone DBH (cm) Height (m)
1 year 2 year 3 year 1 year 2 year 3 year
G-48 4.46 9.57 11.58 5.91 9.53 13.50
Udai 4.57 11.75 14.44 5.28 10.44 13.71
S7-C15 4.64 11.01 13.15 5.30 10.24 14.04
WSL-26 4.47 10.22 11.75 5.68 10.11 13.80
WSL-49 4.41 10.31 13.26 5.52 10.04 13.90
WSL-22 5.07 10.99 12.76 6.00 10.32 13.92
WSL-32 4.42 11.62 13.91 5.70 10.53 14.10
WSL-39 5.42 11.84 14.74 6.32 10.93 14.42
S7 C
85.23 11.67 13.87 6.30 10.69 14.11
Kranti 3.64 10.40 13.19 4.24 9.99 13.25
Bahar 3.90 10.68 12.30 4.59 9.93 13.19
WSL-27 4.35 9.70 12.09 5.43 10.04 14.13
CD (P=0.05) 0.32 0.23 0.28 0.35 0.23 0.18
R. K. Luna, N. S. Thakur and Vijay Kumar

109
Table 3. Volume (m3 /tree) of poplar clones at various ages
Clone Volume (over bark) m3/tree
1 year 2 years 3 years
G-48 0.0108 0.0352 0.0653
Udai 0.0106 0.0542 0.1030
S7-C15 0.0107 0.0471 0.0853
WSL-26 0.0107 0.0410 0.0685
WSL-49 0.0105 0.0414 0.0858
WSL-22 0.0120 0.0472 0.0800
WSL-32 0.0106 0.0528 0.0949
WSL-39 0.0130 0.0556 0.1040
S7 C
80.0126 0.0539 0.0945
Kranti 0.0089 0.0419 0.0813
Bahar 0.0093 0.0435 0.0714
WSL-27 0.0103 0.0374 0.0735
CD (P=0.05) 0.00063 0.0018 0.0034
The higher volume of clones WSL – 39 and Udai, may
be attributed to their genetic potential. Field performance ofthe clones of WSL series have been found better in theIndo-Gangetic plains with volume production up to 0.132
m3 at the age of 3 years (Sidhu and Dhillon, 2007). Highclonal variation in many clones of Populus species wasalso recorded by Dunlop et al. (1994), Singh et al.(2001), Chauhan et al. (2008) and Dhillon et al. (2010).
The current and mean annual increment of differentclones, being the function of growth parameters exhibited
similar results as were obtained for diameter, height andvolume. CAI and MAI was maximum for the clones WSL–39and Udai, whereas, it was minimum for G-48.
The present study evinced that out of the twelve newclones tested in the field, WSL-39 and Udai [(India(Seedlings raised from open pollinated naturalized clones)
WIMCO Pvt. Ltd.)], out performed in the field giving highervolume per tree. Thus, results on growth performance andvolume production of tested clones put forth scope for the
deployment and will provide opportunity for maximum
production as well as broaden the shrinking genetic baseof poplar plantations.
REFERENCESChauhan, S.K., Chauhan, R. and Saralch, H.S. (2008) Diversity of
poplar (Populus deltoides) clones in India. In: S.S. Kundu,O.P. Chaturvedi, J.C. Dagar and S.K. Sirohi (eds.) Environment,Agroforestry and Livestock Management. International BookDistributors Ltd., Lucknow. pp.175-188.
Chauhan, S.K. and Mahey, R.K. (2008) Poplar Cultivation (RevisedEdition). Punjab Agricultural University, Ludhiana, 36 p.
Dhanda, R.S., and Verma, R.K. (2001) Timber volume and weighttables of farm grown poplar (Populus deltoides Bartr. ExMarsh) in Punjab (India). Indian For. 127(1): 115-130.
Dhillon, G.P.S., Singh, A. and Sidhu, D.S. (2010) Variation, inheritanceand correlation of growth characteristics of Populus deltoidesBartr. at various ages in the central plain region of Punjab,India. For. Stud. China 12(3): 126-130.
Dunlop, J.M., Heilman, P.E. and Stetteler, R.F. (1994) Genetic variationand productivity of Populus trichorapa and its hybrids VII Twoyear survival and growth of native cottonwood clones fromfour river valleys in Wshington. Canadian J. For. Res. 24:1539-1549.
Gomez, K.A. and Gomez, A.A. (1984) Statistical Procedures forAgricultural Research. (2nd eds) John Wiley and Sons. Inc.,New York. 680 p.
Khurana, D.K. (1998) Genetic diversity in poplars for sustainabledevelopment. In: R. Baba and P.K. Khosla (Eds.) Biodiversityof Forest Species, ISTS, Solan, pp.197-206.
Land, S.B. Jr. and Singh, N.B. (1996) Populus tree improvement innorthern India. Report approved for publication as JournalArticle No. FA077-0597 of the Forest and Wildlife ResearchCenter, Mississippi State University.
McKenney, D.W., Yemshanov, D., Fox, G. and Ramla, l. E. (2004)Cost estimates for carbon sequestration from fast growingpoplar plantations in Canada. For. Policy Econ. 6:345–358
Sedjo, R.A. (1999) The potential of high-yield plantation forestry formeeting timber needs. New For. 17: 339–359.
Sidhu, D.S. and Dhillon, G.P.S. (2007) Field performance of tenclones and two sizes of planting stock of Populus deltoideson the Indo-gangetic plains of India. New For. 34:115-122.
Singh, N.B., Kumar, D., Rawat, G.S., Gupta, R.K., Singh, K. andNegi, S.S. (2001) Clonal cultivation of poplar (Populus deltoidesBartr.) in eastern Uttar Pradesh II Estimation of geneticparameters in field testing. Ind. For. 127(2):163-172
Comparative Growth of Poplar Clones

Genetically improved, high yielding clones of poplars
and Eucalypts with a production potential of 50 m3/ha/yrand large domestic demand for timber, have made farmforestry plantations an economically attractive land use
option. National Forest Policy (1988) also directed the woodbased industrial units to meet their future raw materialrequirements through developing partnerships with
farmers. Therefore, most of the veneer/plywood mills, safetymatch industries and wood based pulp/paper mills currentlymeet the bulk of their raw material requirements from farm
grown fast growing trees. India has tremendous potentialto expand the farm forestry plantations and wood basedindustries because of its comparative advantage of a huge
domestic market, a large land mass, good rainfall and waterresources, tropical climate, ample sunshine for rapid growthof trees and sufficient labour.
Eucalyptus tereticornis is widely planted in farm forestrysystem throughout the world and more particularly in India.It is highly productive and well adapted to dry, infertile sites
and is productive user of degraded land no longer suitablefor agriculture. Keeping in view the wide range ofgeographical distribution of the species and the variation
that exists, the species provides ample scope for geneticimprovement. Clonal propagation of this tree species offersvast possibilities of taking advantage of the natural variation
for immediate gains in productivity. Cloning is the ultimatemeans of capturing useful genetic variation because thereis no recombination or segregation of genes. But there is a
Genotype ××××× Envionment Interaction among Different Clones ofEucalyptus tereticornis Smith
Rakesh Kumar* and K. S. Bangarwa1
Department of Forestry and Natural Resources, Punjab Agricultural University, Ludhiana-141 004, India1Department of Forestry, CCSHAU, Hissar-125 004, India
*E-mail:[email protected]
Abstract: Due to predominantly out-crossing in nature, Eucalyptus tereticornis shows high degree of individual heterozygosity. Mostplantations have low productivity and large genetic variation. Clonal propagation of this tree species offers vast possibilities of takingadvantage of the natural variation for immediate gains in productivity. But there is a need to screen large number of trees to identify cloneswith superior traits. In the present study, a set of twenty similar clones were evaluated at two sites to determine the magnitude of cloneX site interaction, which revealed that clones interacted significantly with the environments. Clone number 132 ranked first for total height,diameter at breast height, clear bole height and unforked height followed by clone number 71 at site 1, whereas, at site 2, clone number6 recorded the maximum total height, clear bole height and unforked height. Clone number 147 performed best in environment 2 fordiameter at breast height. A simultaneous consideration of mean performance and regression revealed the superiority of clone number 71and 7 indicating their better suitability for superior environment, whereas, clone number 132 and 130 were found superior for diameter atbreast height for their above average response (bi>1.0). These results indicate the scope of genetic improvement through selection ofsuperior clones.
KeyWords: Eucalyptus tereticornis, Clone, Growth, G X E interaction
need to screen large number of trees to identify clones with
superior traits. Highest productivity potential of each clonecan be achieved through careful matching of clones mostadaptable to each category of soils within the climatic
regions suitable for the species (Lal, 2003). To do so, it isindispensable that competitive tests with clones be carriedout in different sites (Campinhos, 1999). Through genotype
and environment tests, selection can be made to obtain
clones that are well adapted to specific conditions and
others that are well adapted to a range of environmental
conditions (Campinhos et al., 1992). Knowledge of the extent
of rank changes among clones across various sites is
necessary to efficiently deploy clonal material. In spite of its
self evident importance in practical utility and great potential
as a short rotation valuable species for farm forestry
plantations of vast geographical areas, actually very limited
work has been done on clonal testing. Therefore, the present
study in Eucalyptus tereticornis was planned to determine
the magnitude of clone x site interaction among different
clones of Eucalyptus tereticornis.
MATERIAL AND METHODS
Twenty clones of Eucalyptus tereticornis planted by StateForest Department at two sites, Seonthi in Distt. Kurukshetra(Latitude 29°59´ N, longitude 76°50´ E and altitude 258 m
above mean sea level) and Bithmara in Distt. Hisar (Latitude29°10´ N, longitude 75°46´ E and altitude 215.2 m abovemean sea level) in August 1997 at a uniform spacing of 4 x
Indian J. Ecol. (2011) 38 (Special Issue) : 110-112Indian Journal
of Ecology

111
4 m were laid out in randomized block design. Observationson total height, diameter at breast height, clear bole height
and unforked height were recorded at the age of 5 ½ yearsand 6 ½ years. The texture of the soil at Bithmara was loamysand (10-30cm depth) and sandy loam (30-120cm depth),
whereas, at Seonthi texture of soil was loam at all soildepths. The pH varied from 8.0 to 8.4 at Bithmara whichshows alkaline nature of the soil whereas at Seonthi the
soil was sodic in nature. The sodic soil and high solublesalt concentration (EC 0.5-0.9 mmhos cm-1) at site 2 isconsidered detrimental to plant growth. The range of organic
carbon was low to medium. The replicated data for allcharacters recorded for clone x site interaction wereanalysed statistically.
RESULTS AND DISCUSSION
The mean values of clones for all the charactersrevealed enough variability among clones. The meansquares due to environments (sites) were significant for all
the characters which suggested that the environments(sites) were variable. Genotype x environment interactionwere significant for all the characters, which revealed that
clones were unable to maintain the consistent performanceunder different environments (sites) for total height,
diameter at breast height, clearbole height and unforkedheight. Mean performance of various clones of Eucalyptustereticornis under different environments along withregression coefficient in respect of all the characters understudy viz., total height, diameter at breast height, clearbole
height and unforked height are presented in Table 1 & 2.The mean values of total height, diameter at breast height,clearbole height and unforked height were observed higher
in environment 1 (Bithmara) than in environment 2 (Seonthi).The performance of clone number 132 was foundextraordinarily superior with the highest values for total
height and unforked height on the basis of meanperformance of two environments. This clone was alsofound superior for diameter at breast height, clearbole
height. The clone number 71 was found superior for totalheight and diameter at breast height. The clone numbers 3and 6 were found superior for clearbole height and unforked
height. Besides, the clone number 147 was foundsignificantly superior than general mean for total height andunforked height in both the environments. Simultaneous
consideration of mean performance and regressioncoefficient (bi) revealed the superiority of clone number 132in better environment with high mean performance and high
value of regression for total height and unforked height.
Table 1. Performance of various Eucalyptus tereticornis clones for plant height (m) and diameter at breast height (cm) in differentenvironments
Plant height DBH
Clone Bithmara Seonthi Mean bi Bithmara Seonthi Mean bi
1 18.33 15.03 16.68 0.68 18.13 14.12 16.13 0.72
3 19.61 16.18 17.90 0.71 17.81 12.04 14.92 1.04
4 17.50 13.63 15.57 0.80 19.11 13.34 16.23 1.03
6 20.67 16.49 18.58 0.86 18.31 11.79 15.05 1.17
7 22.32 16.34 19.33 1.24 18.37 13.03 15.70 0.96
8 20.07 15.89 17.98 0.86 17.17 12.35 14.76 0.86
9 20.32 16.17 18.25 0.86 18.08 12.51 15.30 1.00
71 23.27 16.10 19.69 1.48 20.46 14.58 17.52 1.06
83 20.83 15.48 18.16 1.11 19.25 13.12 16.18 1.10
99 22.00 15.46 18.73 1.35 18.98 12.37 15.68 1.18
105 19.27 14.95 17.11 0.89 19.40 14.17 16.79 0.94
115 18.32 15.29 16.81 0.63 16.25 12.23 14.24 0.72
119 19.41 15.53 17.47 0.80 17.30 13.41 15.36 0.70
130 20.58 16.43 18.51 0.86 20.01 13.47 16.74 1.17
132 24.25 15.17 19.71 1.88 21.60 12.84 17.22 1.34
142 21.28 14.91 18.10 1.32 19.29 12.96 16.12 1.13
147 21.75 16.18 18.97 1.15 19.40 14.76 17.08 0.83
157 21.51 15.96 18.74 1.15 17.09 11.48 14.29 1.01
271 19.65 15.27 17.46 0.91 18.53 13.78 16.16 0.85
277 17.65 15.09 16.37 0.53 19.35 13.97 16.66 0.97
Mean 20.43 15.58 18.01 18.69 13.12 15.90
C.D.(5%) 0.27 0.21 0.76 0.54
Genotype × Environment Response of Eucalyptus Clones

112
Table 2. Performance of various Eucalyptus tereticornis clones for clearbole height (m) and unforked height (cm) in differentenvironments
Clearbole height Unforked height
Clone Bithmara Seonthi Mean bi Bithmara Seonthi Mean bi
1 13.83 7.21 10.52 2.31 18.25 12.89 15.57 2.20
3 16.83 12.79 14.81 1.41 19.33 15.48 17.41 1.58
4 10.58 7.63 9.11 1.03 15.17 13.63 14.40 0.63
6 13.50 14.52 14.01 -0.36 17.08 16.49 16.79 0.24
7 12.57 10.45 11.51 0.74 15.25 14.38 14.82 0.36
8 11.00 9.49 10.25 0.53 13.25 15.89 14.57 -1.08
9 12.28 11.76 12.02 0.18 16.61 16.17 16.39 0.18
71 12.38 8.58 10.48 1.32 15.83 12.20 14.02 1.49
83 12.94 9.00 10.97 1.37 15.89 14.82 15.36 0.44
99 14.67 8.04 11.36 2.31 16.75 14.80 15.78 0.80
105 11.83 9.89 10.86 0.68 15.00 12.40 13.70 1.07
115 9.17 8.60 8.89 0.20 13.53 9.26 11.40 1.75
119 16.25 8.43 12.34 2.73 19.22 13.37 16.30 1.95
130 10.00 9.48 9.74 0.18 15.00 11.55 13.28 1.41
132 17.25 8.45 12.85 3.07 20.75 14.12 17.44 2.72
142 10.72 8.96 9.84 0.61 15.61 12.41 14.01 1.31
147 12.17 9.05 10.61 1.09 16.75 16.18 16.47 0.23
157 13.25 7.90 10.58 1.86 15.50 13.58 14.54 0.79
271 7.42 7.08 7.25 0.12 11.42 10.48 10.95 0.39
277 11.92 7.66 9.79 1.49 15.33 12.27 13.80 1.25
Mean 12.53 9.25 10.89 16.08 13.63 14.86
C.D.(5%) 0.19 0.12 0.40 0.17
Clone number 3 was found superior in better environment
for clearbole height. Clone number 71 was also found to
have higher ranks for better environment for total height,
diameter at breast height. Clone number 6 was found
superior for poor environment with high mean performance
and below average response of regression coefficient for
total height, clearbole height and unforked height. Clone
number 147 was also found superior for poor environment
for diameter at breast height. The clone number 3 was found
most promising for both environments as it was evident
from high mean values and near unit values of regression
coefficient (bi) for clearbole height and unforked height.
Clone number 71 was found superior in both environments
for diameter at breast height. The joint regression of
environments under which the genotype grew can provide
a base for better understanding of physical limits of
environments (Breese, 1969). The results obtained from
the present investigation indicated that a suitable breeding
programme could be designed for desired type of
responsiveness. The desired genotypes should have above
average performance (Yi>Y) and above average response
(bi>1). When both environmental variables are operating
simultaneously, the desired genotype would seem to be
one having a general level of interaction such that genotypes
can be selected which combine low level of interaction withuncontrollable variables. For such a situation, the genotypewith high mean performance (Yi>Y) and unit regression
(b=1) would be preferred. In the present study, clone number7 for total height, 71 for diameter at breast height and 3 forclearbole height and unforked height had the high mean
and about unit regression.
REFERENCESBreese, E.L. (1969) The measurement and significance of
genotype-environment interaction in grasses. Heredit 24:27-44.
Campinhos, E. Jr. (1999) Sustainable plantations of high-yieldEucalyptus trees for production of fibre: The Aracruz case.New Forests 17: 129-143.
Campinhos, E., La Torraca, S.M., Laranjeiro, A.J. and Penchel, R.M.(1992) The use/place of clonal multiplication in tree breedingand propagation programmes Pre-requisite for success andreasons for failures. Aracruz Cellulose,Rio de Janeiro.
Gomes, F. and Correia, C. (1995) Clonal selection and evaluation ofgenotype x environment interactions of Eucalyptus globulusclones. Silva-Lusitana. 3: 145-162.
Lal, P. (2003) Clonal Eucalyptus plantations in India. In: Proceedingsof International Conference on Eucalypts in Asia. ACIARProceedings no. 111, pp. 16-21.
Rakesh Kumar and K. S. Bangarwa
Native to Central America, the species Leucaenaluecocephala was introduced to India during 19th century
(NAS, 1980). It grows in an annual rainfall of 500 to 300 mmand up to an altitude of 500 m though adapted to a widearray of environments; it has limitations of intolerance to
salinity (Benge, 1982) and limited tolerance to acidic soils(Halliday and Somasegaran, 1982). The nearly 100 varietiesthat comprise the species differ markedly in size and form
and have been classified into three broad types, theSalvador, the Peru and the Hawaiian. Though the plant hasa strong appeal for a multitude of uses, its primary reputation
is as forage and feed. But Salvador types like K8, K28 andK67 referred to as Hawaiian giants are suitable for woodproduction. The tree is admirably suited for paper and pulp
manufacture. For fuel production, the species is raised at aespacement of 1 x 1 m to 2 x 2 m and felled at the end of 3to 5 years. Total yields at this rotation averages 100 tonnes
per ha. and it coppices prolifically (Pathak and Patil, 1982).A tree legume, it has been credited with high fixation ratesof up to 1000 kg Nitrogen per ha (Dykman, 1950). This
property of nitrogen fixation made this species to be usefulin soil restoration (Vanlauwe et al., 1998; Sharma et al.,1998).
The conventional softwoods and hardwoods used as
raw material by pulp, paper and cellulose based industries
Investigations on Pulp and Biomass Production of Subabul GeneticResources (Leucaena leucocephala (Lam.) de Wit.)
S. Umesh Kanna*, S. B. Chavan, A. K. Bharathi, K. T. Parthiban, S. Vennila, P. V. Anbu,P. Kumar, V. Saravanan and P. Durairasu
Forest College and Research Institute, Tamil Nadu Agricultural University, Mettupalayam – 641 301, India*E-mail:[email protected]
Abstract: Studies were conducted to assess the suitability of Leucaena leucocephala for pulp and energy purposes. The studyindicated that L. leucocephala could be a good pulpable species, which expressed superior characters for all the pulp qualities assessed.The species exhibited an average screened pulp yield of 49.5 per cent coupled with the kappa number of 20.7, which indicated that thespecies is suitable for pulping quality and exhibited superiority over the eucalyptus based pulpwood. Similarly the species expressedholo-cellulose content of 70.2 per cent, pentosans 18.3 per cent, acid insoluable lignin 26.7 per cent and ash content of 0.5. The strengthproperties of the species also exhibited comparable pulp qualities and recorded the tensile index of 27.3 and 72 Nm g-1, respectively forunrefined and refined pulp at 300 ml CSF. The strength property also indicated the tear index of 5.14 and 8.50 mNm2 g-1 and burst index of1.20 and 4.70 K Pa m2 g-1, respectively for unrefined and refined pulp at 300 ml CSF. Similarly the the species has the calorific value of morethan 4250 K. Cal indicating the suitability for energy purpose. A tree improvement programme has been initiated by selecting 15 superiorgenetic resources and evaluated at nursery and field conditions. The seedling growth attributes and total dry matter production studiesin the nursery at 12 months after sowing indicated that the progenies differed significantly. Among the 15 genotypes, the genotype FCRILL 9 exhibited superiority in term of seedling growth (shoot length – 125.1 cm; root length – 43.5 cm collar diameter – 9.94 mm) and totaldry matter (total Fresh weight – 38.3 g; total dry weight – 21.6 g) followed by the genotype FCRI LL 15, In toto, the genotypes FCRI LL 9and FCRI LL 15 out performed over the mean performance of other genotypes to the magnitude of 118 per cent and 120 per cent,respectively, with respect to seedling growth attributes and dry matter production. The progeny evaluation trial in the field also indicatedthe superiority of genotype FCRI LL 9.
Key Words: Leucaena leucocephala, Pulp and energy, Short rotation forestry
are depleting day by day and the wood imports are drainingcountry’s foreign exchange. Short rotation industrial
farmforestry plantations with the fast growing tree speciesare potential sources to fill this gap and to make the nationself reliance in pulpwood supply. In India, of the 660 paper
mills, 26 are wood based and faced challenges with thesupply of forest based raw material. Many pulp mills arefinding it difficult to gain access to private lands, and wood
resources from natural forests (Puri and Nair, 2004). Of the
6.8 million ton of wood producing 1.9 million pulp annually,
nearly 20 per cent of wood is procured from forests through
Government sources and the remaining 80 per cent comes
from private sector (Kulkarni, 2008). The National Forest
Commission emphasized that since forest alone cannot
meet the increasing wood demand, agroforestry in private
and community lands has to be promoted to bridge the
short fall (Kirpal et al., 2006). Under such circumstances,
many paper industries in the country have promoted
Eucalyptus, Casuarina, Bamboos, Populus, and Leucaena,etc. as pulpwood species. Many species are well accepted
by the farmers and are integrated in the existing land usesystem. However, the promotion of L. luecocephala as asource of pulp fiber is not evidenced in the state of Tamil
Nadu for want of suitable varieties adapted to varied agroclimatic zones. Against this backdrop, the current study was
Indian J. Ecol. (2011) 38 (Special Issue) : 113-118Indian Journal
of Ecology

114
designed to assess the pulp and fiber qualities of L.leucocephala and to establish tree improvement strategies
through selection and evaluation of the available geneticresources in the country.
MATERIAL AND METHODS
The experimental material to the present study
consisted of logs collected from Eucalyptus tereticornis,Casuarina equisetifolia and Leucaena leucocephala grownat Mettupalayam range of Coimbatore division. From each
species, a billet of each 1 m length and 50-60 cm girth werecollected. The billets were debarked and chipped separatelyand screened. The screened chips were used for pulping
experiments. Few wood chips were converted into dust forproximate chemical analysis. The wood samples weresubjected to analysis of physical and chemical properties
at the Research and development laboratory of TamilnaduNewsprint and Paper Ltd. (TNPL), Kagithapuram, Karur.The pulping experiments were also carried out to find out
its suitability for papermaking.The procedure followed byVennila and co-workers (2011) for physical and chemicalproperties was adopted in present study also.
The predominant subabul growing areas of South Indiawere identified and candidate plus trees were selectedbased on the following morphological characters viz., height,
diameter at breast height (DBH), canopy height, canopywidth and canopy length. From the selected 15 candidateplus trees, which represents three states (Andra Pradesh,
Maharashtra and Tamil Nadu), seeds were collected fromthe crown and accession numbers were given. The freshseeds collected from the 15 Candidate Plus Trees were
sown at the Nursery Complex of Department of TreeBreeding, Forest College and Research Institute,Mettupalayam by adopting Randomized Block Design with
five replications. Necessary after care silvicultural practiceswere scrupulously followed for the proper growth andestablishment.
The following growth attributes viz., shoot length,r ootlength, shoot fresh weight, root fresh weight, shoot dryweight, root dry weight and root shoot ratio were recorded
on ten seedlings of each genotypes. The mean values ofthe morphometric traits were transformed into uncorrelatedstandardized values for statistical analysis.
RESULTS AND DISCUSSION
Screening of Alternate Pulpwood Species
Wood properties are known to vary between species,genotypes and within genotypes. In intensively managedplantations where the raw material is highly heterogeneous,
it is important to assess the wood properties of the wholetree. Against this back drop, studies were conducted and
the results on physical, chemical and strength propertiesproved the suitability of L. leucocephala as pulpwood. Theresults of the physical properties indicated that the bulk
density and basic density are significantly superior to thetraditional pulpwood species viz., Eucalyptus hybrid followedby C. equisetifolia. The L. leucocephala recorded basic
density of 546 kg per m3, which is 1.1 per cent superior toEucalyptus hybrid and 25.51 per cent superior to C.equisetifolia indicating the superiority of L. leucocephalaas pulpwood (Table 1). The wood density properties are ofmajor importance for production of quality pulp and paper.The amount of wood needed to produce one ton of air dried
pulp is calculated from the density and pulp yield(Storebraten, 1990). Similarly, the chemical analysis of L.leucocephala wood samples indicated that the ash content
(0.5 %), solubility in hot water (4.40 %), acid insoluble lignin(26.7 %) and pentosons (14.53 %) were marginally higherthan the Eucalyptus hybrid pulp. The holocellulose content
of L. leucocephala is marginally lower (70.20 %) comparedto Eucalyptus hybrid (70.90 %) and C. equisetifolia (71.60%). Considering all chemical properties into account, the
superiority of L. leucocephala over Eucalyptus hybrid wasevident (Table 1). The quantity of hot water and 1 per centNaoH soluble and Alcohol Benzene Extractives showed
similar values when compared with wood materials. Theholocellulose content in L. leucocephala was recorded at70.90 per cent, which indicated the superiority of the variety.
Lower lignin values suggests that Leucaena may requirelow pulping time and chemical charge compared to theEucalyptus.The pulp properties viz., screened yield and
kappa number are the most significant factor which decidesthe pulp recovery and the chemical charge required.Considering these two parameters, L. leucocephalarecorded 49.40 per cent screened yield, which is 12.01 percent more compared to Eucalyptus hybrid and 2.70 per centhigher compared to C. equisetifolia. The kappa number
indicated that L. leucocephala recorded 20.70, which is (-)3.38 per cent superior over the Eucalyptus hybrid pulp (Table2).
The strength properties viz., tear, tensile and burstfactor coupled with the brightness and opacity are the majorindicators for pulp quality at 3000 PFI revolutions.
Considering tensile (74 Nm per g), tear (8.25 mN m2 g) andburst index (5.00 k Pa m2 per g) of L. leucocephala woodpulp, it is evidenced that the pulp obtained from this species
has superior strength properties compared to the traditionalfiber yielding tree Eucalyptus hybrid (Table 3; Fig. 1). Similarresults was earlier reported in tensile and burst indices of
S. Umesh Kanna and Co-authors

115
Table 3. Strength properties of bleached pulp at different freeness level
S. Parameters PFI revolutions
No. Eucalyptus hybrid Casuarina equisetifolia Leucaena leucocephala
0 2000 3000 4000 0 2000 3000 0 2000 3000 4000
1 Freeness (ml CSF) 530 370 310 260 665 430 300 580 440 330 270
2 Bulk (g cm-3) 2.06 1.87 1.75 1.68 2.06 1.61 1.39 1.99 1.60 1.56 1.46
3 Tensile index (Nm g-1) 38.50 66.90 74.00 77.00 17.90 47.50 63.50 35.40 63.00 74.00 78.00
4 Breaking length (m) 3927 6824 7548 7854 1800 4800 6400 3611 6426 7548 7956
5 Tear index (mN.m2 g) 5.78 7.80 8.10 8.20 3.20 6.00 8.20 6.20 7.83 8.25 8.30
6 Tear factor 59.00 79.60 82.60 83.60 32.00 60.00 82 63.20 79.90 84.20 84.70
7 Burst index (kPa.m2 g-1) 2.30 4.00 4.40 4.60 0.70 3.90 5.00 1.94 4.20 5.00 5.20
8 Burst factor 23.50 40.80 44.90 46.90 7.00 39.00 50 19.80 42.80 51.00 53.00
9 Brightness (% ISO) 82.30 81.70 81.00 80.60 79.00 78.20 77.50 81.80 80.40 79.10 78.80
10 Opacity (%) 85.20 83.70 82.00 81.30 78.20 77.70 76.50 83.20 78.80 78.40 78.60
11 Scattering coefficient (m2 kg-1) 54.70 48.10 45.00 41.70 54.20 49.70 46.50 43.40 35.20 34.80 33.60
12 Yellowness (%) 10.20 10.60 10.70 10.70 7.60 7.90 8.10 9.70 9.80 10.00 10.10
Table 1. Physical and chemical characteristics of Leucaena leucocephala in comparison to Eucalyptus and Casuarina
S. Parameters Eucalyptus Casuarina Leucaena General SEd CD (0.05) CD (0.01)
No. hybrid equisetifolia leucocephala mean
1 Moisture (%) as received 11.25 8.67 11.01 10.31 1.27 03.11 04.70
2 Bulk density (OD basis) (kg m-3) 240.00 191.00 250.00 227.00 8.16 19.97 30.27
3 Basic density (OD basis) (kg m-3) 540.00 435.00 546.00 507.00 8.16 19.97 30.27
Chips classification (%)
1 + 45 mm Nil Nil Nil
2 + 8mm (over thick) 12.60 5.90 5.10
3 + 7 mm (accepts) 81.00 80.40 77.80
4 + 3 mm (pin chips) 6.00 13.20 16.60
5 - 3mm (dust) 0.40 0.50 0.50
Chemical composition
1 Ash 0.35 0.38 0.50 0.41 0.08 0.19 0.30
2 Solubility in Hot water 3.80 3.60 4.40 3.93 0.82 1.99 3.03
3 Solubility in 1% NaOH 13.30 14.00 10.70 13.00 0.82 1.99 3.03
4 Alcohol benzene 3.50 1.20 2.90 2.53 0.48 1.15 1.75
5 Acid insoluble lignin 25.80 25.70 26.70 26.07 1.16 2.83 4.29
6 Pentosans (ash corrected) 6.80 18.50 18.30 14.53 1.16 2.83 4.29
7 Hollo cellulose (ash corrected) 70.90 71.60 70.20 70.90 1.33 3.26 4.95
Table 2. Pulping results of Leucaena leucocephala in comparison to Eucalyptus and Casuarina
S. Parameters Eucalyptus hybrid Casuarina Leucaena
No. equisetifolia leucocephala
1 Chemical charge as Na2O (%) 16.00 15.00 16.00
2 Unbleached pulp yield (%) 44.20 48.5 49.50
3 Screen rejects (%) 0.12 0.40 0.10
4 Screened yield (%) 44.10 48.10 49.40
5 Kappa number 21.40 16.50 20.70
Black liquor
7 pH 11.80 13.00 12.20
8 Total solid (gpl) 233.00 241.00 228.00
9 TTA * as Na2O 30.40 32.11 30.00
10 RAA* as Na2O 3.85 8.90 6.20
Pulp and Biomass Production of Subabul

116
Fig. 1. Strength properties of Leucaena leucocephala bleached pulp at different freeness level
paper obtained from one year old L. leucocephala (Lopezet al., 2008).
In a holistic perspective, considering pulp yield
(49.50 %) and kappa number (20.70) the superiority of L.leucocephala was evident over the Eucalyptus hybrid.Similarly, the L. leucocephala wood pulp exhibited
acceptable and in certain cases superior strength propertiesas furnished in Table 4 and the study the suitability of L.
leucocephala genetic resources as a source of superiorpulp.
Screening of Short Rotation Genotypes
Based on the superiority of Leucaena leucocephala as
pulpwood, improvement programmes were carried out
through selection and evaluation. Accordingly, fifteen
progenies were selected from three dominant L.
Table 4. Comparison of Leucaena leucocephala with Eucalyptus and Casuarina in respect of pulp yield and strength properties
S. Parameters Eucalyptus Casuarina Leucaena General SEd CD CD
No. hybrid equisetifolia leucocephala mean (0.05) (0.01)
1 Pulp yield (%) 44.20 48.50 49.50 47.40 0.82 1.99 3.03
2 Kappa number 21.40 16.50 20.70 19.53 0.67 1.63 2.48
3 Tear Index at 3000 PFI Revolutions 8.10 8.20 8.25 8.18 0.47 1.16 1.76
4 Tensile Index at 3000 PFI Revolutions 74.00 63.50 74.00 70.50 2.54 6.21 9.41
5 Burst Index at 3000 PFI Revolutions 4.40 5.00 5.00 4.80 0.69 1.69 2.57
S. Umesh Kanna and Co-authors

117
leucocephala growing states viz., Maharashtra, Andhra
Pradesh and Tamil Nadu. The progenies were evaluated
and the study indicated that the progenies differed
significantly due to growth attributes. Considering shoot
length, the progeny MTP LL 9 recorded significantly higher
shoot length and the increase was 31.60 per cent than the
general mean of the population. Similarly root length differed
significantly due to progenies which ranged between 21.12
cm (MTP LL 2) and 42.34 cm (MTP LL 9). The progeny MTP
LL 9 exhibited 55.72 per cent superiority over the general
mean. The collar diameter also exhibited the same trend,
which ranged between 6.76 mm (MTP LL 3) (Table 5) and
10.52 mm (MTP LL 9). Considering all the parameters in
the form of volume index, the superiority of MTP LL 9 was
established through higher volume index (123.16 cm3). This
overall volume index increase was 38.75 per cent over theaverage value of the population.
Progenies also differed significantly due to fresh and
dry weights of shoot and root weight. Higher fresh weightbiomass was evidenced both for shoot (34.67 g) and root(16.23 g) and the increase was 56.95 and 58.81 per cent
higher than the general mean. Similar trend was alsoobserved for shoot (18.81 g) and root (7.76 g) dry weights(Table 5). Among various species of Leucaena evaluated,
the highest total dry biomass recorded in L. leucocephala(Diaz et al., 2007), which lends support to the current
investigation. However, no significant differences were found
among the various species of Leucaena for total biomass
production (Lopez et al., 2008). During the first year study
however, significantly different results were recorded during
second year, which indicated the superiority of L.
leucocephala in total dry biomass yield compared to other
species. The superiority of one variety MTP LL 9 in the current
investigation lends support to the earlier findings.
In an overall perspective, the progeny MTP LL 9 proved
significantly superior in terms of biomass productivity and
pulp recovery, therefore,it can be focused for further
improvement programme.
ACKNOWLEDGEMENT
The authors profusely thank the ICAR for funding the
World Bank aided National Agricultural Innovation projecton “A Value chain on Industrial Agroforestry in Tamil Nadu”to TNAU, where in the current study formed a part of objective
of the scheme.
REFERENCESBenge, M.D. (1982) The miracle tree: Reality or Myth. In: Leucaena
research in the Asian – Pacific Region. Proc. Workshop,Singapore, Nov. 23-26, NFTA & IDRC.
Bergstedt, A. and Olesen, P.O. (2000) Models for predicting drymatter content of Norway spruce. Scand J. Forest Res. 15:633-644.
Table 5. Performance of Leucaena leucocephala genotypes six months after sowing at nursery condition
Genetic Shoot Root Collar Volume Fresh weight Dry weight Root
resources length length diameter index Shoot root Shoot root shoot
(cm) (cm) (cm) (cm3) weight weight weight weight ratio
(g) (g) (g) (g)
MTP LL 1 109.20 21.98 7.55 61.93 19.47 8.78 9.61 3.65 0.37
MTP LL 2 116.68 21.12 8.92 96.01 24.95 12.95 12.68 4.76 0.37
MTP LL 3 125.08 29.38 6.76 62.16 19.73 6.11 10.48 3.04 0.30
MTP LL 4 121.20 30.60 7.93 77.32 17.91 5.23 9.04 2.56 0.29
MTP LL 5 120.92 29.20 8.46 87.38 20.78 12.09 10.63 4.83 0.46
MTP LL 6 107.36 30.70 9.52 103.04 19.51 9.54 10.00 4.43 0.51
MTP LL 7 114.74 23.76 8.68 93.17 23.43 9.65 13.42 4.98 0.35
MTP LL 8 98.70 25.60 7.28 52.68 15.78 7.50 8.26 3.29 0.40
MTP LL 9 139.00 42.34 10.52 153.83 34.67 16.23 18.81 7.76 0.43
MTP LL 10 85.74 27.76 7.86 73.25 26.04 10.30 13.10 5.09 0.44
MTP LL 11 95.46 21.40 8.88 83.94 23.74 9.99 12.13 5.38 0.47
MTP LL 12 79.82 23.20 9.40 72.42 17.79 12.33 9.44 6.50 0.81
MTP LL 13 83.94 22.30 9.94 83.04 29.11 15.03 14.12 7.51 0.55
MTP LL 14 78.94 29.32 7.97 51.96 11.63 6.46 6.36 2.98 0.47
MTP LL 15 107.54 29.24 8.10 75.40 26.85 11.12 14.62 5.15 0.34
General Mean 105.62 27.19 8.52 79.15 22.09 10.22 11.51 4.79 0.44
SEd 12.14 5.65 0.92 21.97 5.46 3.24 3.03 1.41 0.14
CD (0.05) 24.33 11.29 1.84 44.01 10.92 6.48 6.06 2.81 0.29
CD (0.01) 32.39 15.03 2.44 58.59 14.52 8.62 8.05 3.74 0.38
Pulp and Biomass Production of Subabul
118
Diaz, M.J., Garcia, M.M.,Eugenio, M.E., Tapias, R., Fernandez, M.and Lopez, F.(2007) Variations in fiber length and some pulpchemical properties of Leucaena varieties. Industrial Cropsand Products 26:142-150.
Dykman, M.J. (1950) Leucaena: A promising soil erosion controlplant. Econ. Bot. 4: 337-349.
Halliday, J. and Somasegaran, P. (1982) Nodulation, nitrogen fixationand rhizobium strain affinities in the genus Leucaena. In:Leucaena Research in the Asian – Pacific Region. Proc.Workshop, Singapore, Nov. 23-26, NFTA & IDRC.
Kirpal, J.N., Kala, J.C., Singh, J.S, Bhatt, C.P, Ranjitsingh, M.K.,Muthuswamy, A.P, and Prasad, G.K.(2006) Report of theNatiional Forest Commission, Ministry of Environment andForests, Government of India, New Delhi. 420p.
Kulkarni, H.D. (2008) Private Farmer and private industrypartnerships for industrial wood production. A case study.International Forestry Review 10: 147-155.
Lopez, F., Garcia, M.M.,Yanez R., Tapias, R., Fernandez, M. andDiaz, M.J.(2007) Leucaena species variation for biomass andpaper production in 1 and 2 year harvest. BiresourceTechnology 99: 4846-4853.
NAS. (1980) Fire Wood Crops: Shrubs and tree species for energyproduction, National Acad. Sci., Washington, D.C., USA.
Pathak, P.S and Patil, B.D. (1982) Leucaena Research at the IGFRI.In: Leucaena research in the Asian – Pacific Region. Proc.Workshop, Singapore, Nov. 23-26, NFTA & IDRC.
Sharma, N.K., Singh, P.N, Tyagi, P.C, Mohan, S.C.(1998) Effect ofLeucaena mulch on soil-water use and wheat yield. Agric.Water Manage. 35(3): 191-200.
Storebraten, S. (1990) Sulfatfabrikken -– virkesforsyningenssoppelplass Foredrag i PTF, Masseteknisk gruppe, 9 October,Oslo, Norway. p.25.
Vanlauwe, B., Sanginga, N and Merckx, R. (1998) Recovery ofLeucaena and Dactyladenia residue 15 N in alley croppingsystems. Soil Sci. American J. 62: 454–460.
Vennila, S. (2009) Pulpwood traits, genetic and molecularcharacterization of Eucalyptus genetic resources. Ph.D Thesis.Tamil Nadu Agricultural University, Coimbatore.
Vannila,S., Parthiban,K.T., Seerivasan,R., Saravanan, V., Anbu, P.V.,Umesh Kanna, S. and Durairasu (2011) Puplwoodcharacteristics and screening short rotation eucalyptus clones.Indian J. Ecol.(current issue).
S. Umesh Kanna and Co-authors

Variation in Oil Content among the Genotypes of Pongamiapinnata Linn.
Anee Bora*, Nafeesh Ahmed, Shivani Dobhal, M. K. Singh and Ashok KumarDivision of Genetics and Tree Propagation, Forest Research Institute, Dehradun 248 195, Uttarakhand
*E-mail:[email protected]
Abstract: Pongamia pinnata Linn. is an indigenous tree to the Indian sub-continent, which fixes atmospheric nitrogen fixing tree to helpits establishment in poor and marginal lands. The use of vegetable oil from P. pinnata has been in great demand due to its potential in theproduction of bio-fuel. The bio-fuel is an environmental friendly alternate of fossil-fuel with reduced engine emissions. It contributessignificant in fuel feed-stock as the seeds contain around 30–40% of oil. The species has rich medicinal properties for the treatment of skintroubles, particularly of cancer. In India, though millions of seedlings of bio-fuel species are planted every year under various schemes butthe productivity did not commensurate with expected yield potential basically due to poor genetic quality of the planting stock. Though thespecies has number of promising attributes, few of the drawbacks such as low productivity for pods, seeds and oil content can easilybe solved by judicious application of different tools of genetics and tree breeding. The understanding of natural variation and geneticcontrol of important traits is essential for conservation, genetic improvement and breeding. The genetic parameters could be very usefultools in predicting the amount of gain to be expected progeny trials. The variation among progenies is commonly used as an estimate oftotal genetic variation and to calculate degree of genetic control to the particular trait(s). Though the selection of plus trees is carried withhigh selection intensity, genetic superiority par se needs to be estimated using analytical tools like heritability and genetic advances.Genetic divergence would be essential to determine the genetic distance among the selected genotypes. The plus trees of the Pongamiapinnata were therefore selected in different geographical locations during 2009 to utilize the existing genetic variability for the improvementof the species, particularly the oil yield. The oil content was assessed by utilizing soluble property of oils with petroleum ether usingSoxhlet Apparatus. Once the petroleum ether evaporated, the weight of solvent free oil was determined, which varied from 25.4 %(Phagwara, Jalandhar, Punjab) to 37.87 % (Barnawa, Meerut, Uttar Pradesh). The study on nature and degree of variation for oil yieldamong the genotypes will be helpful in selecting potential lines to be recommended for commercial deployment and further improvementprogramme.
Key Words: Pongamia pinnata Linn., Plus trees, Oil content, Genetic variability, Divergence
Indian J. Ecol. (2011) 38 (Special Issue) : 119-123Indian Journal
of Ecology
Pongamia pinnata (Linn.) belongs to the familyLeguminoceae and sub-family of Papilionoideae,commonly known as Indian-beech, poonga-oil-tree,
pongam tree, karanja tree, karum and kanji. This medium-sized tree is indigenous to Indian subcontinent (Allen andAllen, 1981) which has been introduced to humid tropical
lowlands in Philippines, Malaysia, Australia, Seychelles,United States and Indonesia (Hooda et al., 2009). Thespecies is endowed with high degree of climatic adaptability.
It is one of the nitrogen fixing trees which fix atmosphericnitrogen to help its establishment in poor and marginallands. It is also drought resistant tree known to withstand
water logging and mild frost, with high tolerance to salinity(Anon, 1985). It is a medium sized tree that generally attainsa height of 8 m and a trunk diameter of more than 50 cm.
The trunk is generally short with thick branches spreadinginto a dense hemispherical crown of dark green leaves.The natural distribution is reported along coasts and river
banks in lands and is also cultivated along roadsides, canalbanks and open farm lands. It is preferred species forcontrolling soil erosion and binding sand dunes because
of its dense network of lateral roots (Hooda et al., 2009).
P. pinnata is an excellent multi-purpose tree with variousparts of the tree is used in different end uses. The green
leaves of the trees are used as fodder, especially in arid
regions and also as a green manure and dried leaves are
used as insects repellent in grain storage. Various parts of
plants are utilized for preparing soaps, candles, lubricants,
medicines, pesticides, green manure, strings and ropes
(Dhillon et al., 2009). The tree has substantially been used
for medicinal uses as flowers are used to treat diabetes;
roots for cleaning gums, teeth, ulcers and bark for bleeding
piles (Duke, 1983). The wood is used for cabinet making,
cartwheels, posts and fuel. The wood ash is used in dyeing
(Allen and Allen, 1981). The seedcake is used as cattle and
poultry feed and biogas production and the waste pulp is
an excellent source of organic fertilizer (Shrinivas, 2001).
The most important use of this species is the seeds which
contain 30-40% oil (Natanam et al., 1989; Nagaraj and
Mukta, 2004). Pongam oil is a potential source of bio-fuel in
countries where the resources to import fossil fuel are poor.
It could serve as a substitute for energy storage in future
world. The bio-fuel is an environmental friendly alternate of
fossil-fuel with reduced engine emissions considering the
importance of the species, a study was carried out to
estimate oil content variation in P. pinnata seeds collected
from the different locations and altitudes of Northern India.
120
A wild germplasm exploration survey was conductedto identify high yielding candidate plus trees of P. pinnata at
fruiting stage from different predominant naturalizedlocations in Northern India. The selection was made onphenotypic assessment of economic interest characters
adopting index method of selection (Cotterill and Dean,1990). A total of sixty eight plus tree were screened on thebasis of phenotypic characters. In the months of May and
June 2009, matured pods were collected from plus treesselected from the states of Punjab, Haryana, Uttar Pradeshand Uttarakhand. An experiment was also conducted with
selected seeds from plus trees for analyses of oil yieldadopting randomised block design with three replications.To estimate the oil content, the seeds were cleaned and
the seed coats were removed and grinded to make finepowder before placing in soxhlet apparatus. The mainprinciple of this extraction method is to utilize soluble
property of oil. The seeds were extracted with non-polarsolvent such as petroleum ether using soxhlet apparatus.The solvent was thereafter evaporated and weight of solvent
free oil was determined. In the present study, by followingthe above mentioned principle, oil content of differentgenotype was estimated. Around 5 g of powdered
Pongamia seeds were weighed and placed in the filter paperfolded to a sample wise individually. Sample packets wereplaced for extraction in soxhlet apparatus after placing some
absorbent cotton at the bottom so that sample powder doesnot fall in the soxlet flask. Around 150 ml of petroleum etherwas taken in the soxhlet flask of 250ml capacity which was
set on heating mantle and its condenser was connectedwith running tap water. The seed meal was extracted at 60degree Celsius for 6-8 hrs. The oil was extracted with
petroleum ether was collected in the flask. After theextraction was completed, soxhlet flask was removed andwas evaporated on a hot plate under a fuming hood. After
cooling the flask was weighed and repeated the heatingprocess until constant weight was recorded. Then the oilcontent was calculated by using the following formula:
Weight of oil (gm)Oil per cent = —————————————— x100
Weight of sample (gm)
In the present study, oil content was determined in theseeds collected from 68 plus trees of Haryana, Punjab,
Uttar Pradesh and Uttarakhand (Table 1). The oil contentfor all the trees was ranging from 25.40 to 37.87 per cent(32.12 + 2.45) with maximum of 37.87% (226, originated
from Barnawa, Uttar Pradesh) followed by 37.47 % (245,Meerut, Uttar Pradesh), 36.33 per cent (233, Meerut, UttarPradesh), 35.53 per cent (191, Hapur, Uttar Pradesh and
in 298, Phagwara, Punjab), and 35 per cent (109, Fatehabad,
Haryana and 276, Saharanpur, Uttar Pradesh). Theminimum oil content (25.40%) was recorded in a plus tree
selected at Phagwara, Punjab (25.40%). Out of 68genotypes studied for oil production, 50 per cent (34)genotypes yielded more oil than average oil content
(32.12%) and rest 50 per cent genotypes yielded less thanaverage value of oil content. Of the 50 per cent genotypeswith more oil content than average, majority of them were
from different locations of Uttar Pradesh (15 genotypes)followed by Punjab (12 genotypes), Haryana (6 genotypes)and Uttarakhand (1 genotype). The results revealed that
the oil content for the plus trees selected from Uttar Pradeshshowed maximum oil content and minimum was ingenotypes selected from the state of Punjab.
While studying the genetic improvement of Jatrophacursas, Heller (1996) reported that not many systematicstudies have been carried out in the species, it seems that
the same case is with Pongamia pinnata where hardly anyliterature is available on the genetic improvement.Nonetheless, while studying seed source variation for oil
content in Jatropha curcus in the states of HimachalPradesh, Punjab and Jammu and Kashmir, Luna et al.(2008) collected seeds from different locations and found
that seeds collected from Dunera and Dhar location ofPunjab had maximum oil content and Sahura Kandi andJahan Khelan locations of the same state reported with
minimum oil content. Adaptive trials on Jatropha curcus andJatropha gossypiifolia were established at Hissar,Bangalore and Sardar Krushinagar. The evaluation of five
cultivars revealed a good degree of variation for plant height,branches per plant and seed yield per plot at Hissar. One ofthe cultivars produced high seed yield of 1,733 kg per ha
(Heller, 1996). However, no morphological differences werereported between 42 clones of Jatropha curcus originatingfrom different locations in Thailand (Sukarin et al., 1987).
Ginwal et al. (2004) evaluated ten seed sources collectedfrom the states of Madhya Pradesh and Maharashtra forgenetic variation from nursery (3 months) to field stage (2
years). The oil content ranged from 33.02 to 39.12 per centin whole seed and 47.08 to 58.12 per cent in kernel. Theperformance of Kundam (MP), Jabalpur (MP), Bicha (MP),
Niwas (M.P) and Nasik (Mah.) sources was found to besatisfactory for oil yield. Ginwal et al. (2005) reportedsignificant seed source variation in seed morphology, seed
germination and other seedling growth parameters. Thephenotypic and genotypic variance, coefficient of variabilityand broad sense heritability also showed sizable variation.
Luna and Sharma (2006) studied variation in seedmorphology and fatty oil content among 25 sources ofJatropha curcus and found significant differences for various
Anee Bora, Nafeesh Ahmed, Shivani Dobhal, M. K. Singh and Ashok Kumar

121
Table 1. Details of collection sites of plus trees and the oil percentage
S. No. State Tree No. Latitude Longitude Oil content (%)
1 Punjab Jalandhar-4 31°23’35.6" 77°31’42.3" 31.27
2 Punjab Jalandhar-5 31°23’50.4" 77°31’44.0" 33.27
3 Punjab Jalandhar-6 31°28’14.4" 75°23’57.5" 32.87
4 Punjab Jalandhar-9 31°29’48.4" 75°17’48.0" 33.27
5 Punjab Hoshiarpur-19 31°20’16.1" 75°38’11.8" 32.53
6 Punjab Hoshiarpur-24 31°23’26.8" 75°39’52.4" 33.73
7 Punjab Hoshiarpur-33 31°24’56.2" 75°41’20.3" 31.73
8 Punjab Hoshiarpur-34 31°24’36.0" 75°41’41.11" 29.67
9 Punjab Ludhiana-40 30°56’56.2" 75°51’46.7" 31.73
10 Haryana Phagwara-54 31°14’28.6" 75°45’21.4" 28.53
11 Haryana Phagwara-63 31°7’27.5" 75°26’57.6" 32.00
12 Punjab Jalandhar-67 31°7’27.9" 75°25’51.4" 28.53
13 Punjab Jalandhar-68 31°7’27.6" 75°25’50.2" 31.27
14 Haryana Fatehabad-81 29°31’7.6" 75°31’25.2" 32.13
15 Haryana Fatehabad-90 29°31’22.8" 75°31’50" 29.93
16 Haryana Fatehabad-95 29°31’19.2" 75°31’19.3" 30.80
17 Haryana Fatehabad-102 29°31’9.4" 75°31’26.4" 32.67
18 Haryana Fatehabad-109 29°31’14.4" 75°31’19.2" 35.00
19 Haryana Fatehabad-115 29°31’18.8" 75°31’27.8" 34.00
20 Haryana Fatehabad-117 29°31’12.8" 75°31’26.4" 33.60
21 Haryana Hissar-125 29°18’50.8" 76°38’0.4" 31.40
22 Haryana Hissar-126 29°18’52.2" 76°38’1.8" 31.67
23 Haryana Hissar-127 29°18’52.2" 76°38’2.9" 34.07
24 Uttar Pradesh Baraut-152 29°9’23.4" 77°16’19.1" 28.07
25 Uttar Pradesh Sardhana-157 29°04’43.8" 77°37’14.3" 34.40
26 Uttar Pradesh Sardhana-162 29°02’24.8" 77°39’51.8" 32.40
27 Uttar Pradesh Sardhana-164 29°02’23.4" 77°39’53.5" 34.80
28 Uttar Pradesh Sardhana-166 29°02’22.6" 77°39’54.2" 31.87
29 Uttar Pradesh Hapur-173 28°44’36.8" 77°46’6.4" 33.33
30 Uttar Pradesh Hapur-176 28°45’9" 77°46’7.2" 30.20
31 Uttar Pradesh Hapur-184 28°46’28.3" 77°45’46.9" 30.40
32 Uttar Pradesh Hapur-191 28°47’32.6" 77°45’38.9" 35.53
33 Uttarakhand Rourkee-196 30°2’24.8" 77°44’28.4" 32.67
34 Uttar Pradesh Chutmalpur-200 30°4’17.2" 77°45’11.8" 31.40
35 Uttar Pradesh Baghpat-226 29°05’57.5" 77°31’50.2" 37.87
36 Uttar Pradesh Baghpat-230 29°05’57.8" 77°31’50.2" 32.73
37 Uttar Pradesh Meerut-231 29°05’56.4" 77°31’50.2" 31.60
38 Uttar Pradesh Meerut-233 28°57’45.9" 77°31’50.2" 36.33
39 Uttar Pradesh Meerut-245 29°05’54.8" 77°54’19.8" 37.47
40 Uttar Pradesh Meerut-246 29°05’54.7" 77°54’19.2" 34.93
41 Uttar Pradesh Saharanpur-260 29°58’40.8" 77°36’8.6" 30.87
42 Uttar Pradesh Saharanpur-262 30°7’8.6" 77°50’46.7" 33.47
43 Uttar Pradesh Saharanpur-264 30°6’31.1" 77°50’10.9" 32.27
44 Uttar Pradesh Saharanpur-265 30°4’43.6" 77°47’41.1" 29.40
Oil Content Variation among Pongamia genotypes
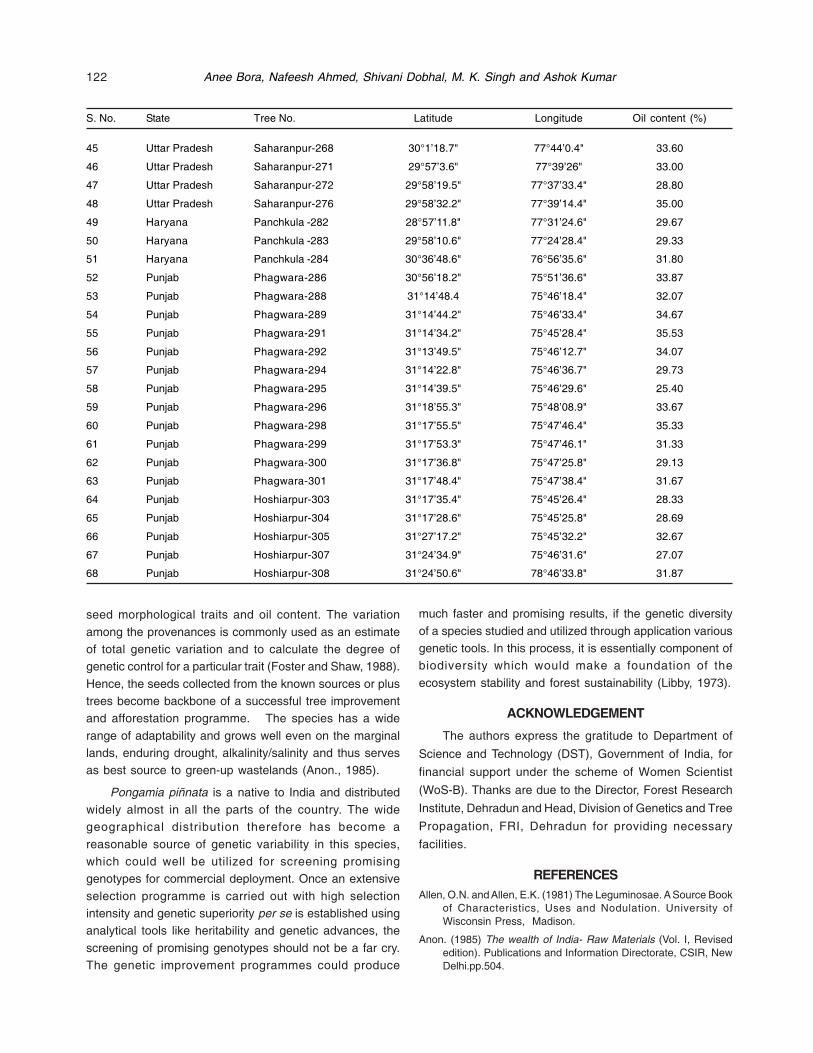
122
45 Uttar Pradesh Saharanpur-268 30°1’18.7" 77°44’0.4" 33.60
46 Uttar Pradesh Saharanpur-271 29°57’3.6" 77°39’26" 33.00
47 Uttar Pradesh Saharanpur-272 29°58’19.5" 77°37’33.4" 28.80
48 Uttar Pradesh Saharanpur-276 29°58’32.2" 77°39’14.4" 35.00
49 Haryana Panchkula -282 28°57’11.8" 77°31’24.6" 29.67
50 Haryana Panchkula -283 29°58’10.6" 77°24’28.4" 29.33
51 Haryana Panchkula -284 30°36’48.6" 76°56’35.6" 31.80
52 Punjab Phagwara-286 30°56’18.2" 75°51’36.6" 33.87
53 Punjab Phagwara-288 31°14’48.4 75°46’18.4" 32.07
54 Punjab Phagwara-289 31°14’44.2" 75°46’33.4" 34.67
55 Punjab Phagwara-291 31°14’34.2" 75°45’28.4" 35.53
56 Punjab Phagwara-292 31°13’49.5" 75°46’12.7" 34.07
57 Punjab Phagwara-294 31°14’22.8" 75°46’36.7" 29.73
58 Punjab Phagwara-295 31°14’39.5" 75°46’29.6" 25.40
59 Punjab Phagwara-296 31°18’55.3" 75°48’08.9" 33.67
60 Punjab Phagwara-298 31°17’55.5" 75°47’46.4" 35.33
61 Punjab Phagwara-299 31°17’53.3" 75°47’46.1" 31.33
62 Punjab Phagwara-300 31°17’36.8" 75°47’25.8" 29.13
63 Punjab Phagwara-301 31°17’48.4" 75°47’38.4" 31.67
64 Punjab Hoshiarpur-303 31°17’35.4" 75°45’26.4" 28.33
65 Punjab Hoshiarpur-304 31°17’28.6" 75°45’25.8" 28.69
66 Punjab Hoshiarpur-305 31°27’17.2" 75°45’32.2" 32.67
67 Punjab Hoshiarpur-307 31°24’34.9" 75°46’31.6" 27.07
68 Punjab Hoshiarpur-308 31°24’50.6" 78°46’33.8" 31.87
S. No. State Tree No. Latitude Longitude Oil content (%)
seed morphological traits and oil content. The variation
among the provenances is commonly used as an estimateof total genetic variation and to calculate the degree ofgenetic control for a particular trait (Foster and Shaw, 1988).
Hence, the seeds collected from the known sources or plustrees become backbone of a successful tree improvementand afforestation programme. The species has a wide
range of adaptability and grows well even on the marginallands, enduring drought, alkalinity/salinity and thus servesas best source to green-up wastelands (Anon., 1985).
Pongamia piñnata is a native to India and distributedwidely almost in all the parts of the country. The widegeographical distribution therefore has become a
reasonable source of genetic variability in this species,which could well be utilized for screening promisinggenotypes for commercial deployment. Once an extensive
selection programme is carried out with high selectionintensity and genetic superiority per se is established usinganalytical tools like heritability and genetic advances, the
screening of promising genotypes should not be a far cry.The genetic improvement programmes could produce
much faster and promising results, if the genetic diversity
of a species studied and utilized through application variousgenetic tools. In this process, it is essentially component ofbiodiversity which would make a foundation of the
ecosystem stability and forest sustainability (Libby, 1973).
ACKNOWLEDGEMENT
The authors express the gratitude to Department of
Science and Technology (DST), Government of India, for
financial support under the scheme of Women Scientist
(WoS-B). Thanks are due to the Director, Forest Research
Institute, Dehradun and Head, Division of Genetics and Tree
Propagation, FRI, Dehradun for providing necessary
facilities.
REFERENCESAllen, O.N. and Allen, E.K. (1981) The Leguminosae. A Source Book
of Characteristics, Uses and Nodulation. University ofWisconsin Press, Madison.
Anon. (1985) The wealth of India- Raw Materials (Vol. I, Revisededition). Publications and Information Directorate, CSIR, NewDelhi.pp.504.
Anee Bora, Nafeesh Ahmed, Shivani Dobhal, M. K. Singh and Ashok Kumar

123
Cotterill, P.P. and Dean, C.A. (1990) Successful tree breeding withindex selection. pp79 CSIRO, Melbourne.
Dhillon, R.S., Hooda, M.S., Ahlawat, K.S. and Kumari, S. (2009)Floral Biology and Breeding Behaviour in Karanj ( Pongamiapinnata L. Pierre). Indian Forester 135(5):618-628.
Duke, J. (1983) Handbook of Energy Crops. Unpublished.
Foster, G.S. and Shaw, D.V. (1988) Using clonal replicates to exploregenetic variation in a perennial plant species. Theor. Appl.Genet. 76: 788-794.
Ginwal, H.S., Phartyal, S. S., Rawat. P.S. and Srivastava, R.L.(2005) Seed source variation in morphology, germination andseedling growth of Jatropha curcus (Linn.) in central India.Silvae Genetica 54 (2): 76-80.
Ginwal, H.S., Rawat, P.S., and Srivastava, R.L. (2004) Seed sourcevariation in growth performance and oil yield of Jatrophacurcus (Linn.) in Central India. Silvae Genetica 53 (4):186-192.
Heller, J. (1996) Physic nut Jatropha curcus (L.). Promoting theconservation and use of underutilized and neglected crops.1. Institute of Plant Genetics and Crop Plant Research,Gatersleben- IPGRI, Rome, 66pp.
Hooda, M.S., Dhillon R.S., Dhanda, S. and Kumari, S.(2009) Geneticdivergence studies in plus trees of Pongamia pinnata(Karanj).Indian Forester 135(8): 1069-1078.
Libby (1973) Domestication strategies for forest trees. Can. J. For.Res. 3:265-276.
Luna, R. K. and Sharma, S. C. (2006) Seed source variation inmorphological characters and oil content of Jatropha curcus(Linn.) in North-West India. J. NTFP 13 (3): 221-225.
Luna, R.K., Kumar A., Nautiyal R. and Kumar V. (2008) Seed sourcevariation in morphological traits of seed and oil content inJatropha curcus (Linn.). Annals of Forestry 16(2): 284-294.
Nagaraj, G. and Mukta, N. (2004) Seed composition and fatty acidprofile of some tree borne oilseeds. Journal of OilseedsResearch 21: 117-120.
Natanam, R., Kadirvel, R. and Chandrasekaran, D. (1989) Chemicalcomposition of karanja (Pongamia glabra Vent ) kernel andcake as animal feed. Indian Journal of Animal Nutrition 6:270-273.
Shrinivas, U. (2001) A viable substitute for diesel in rural India.Current Science 80:1483-1484.
Sukarin, W., Yamada,Sukarin, W., Yamada, Y. and Sakaguchi, S.(1987) Characteristics of physic nut , Jatropha curcus (L.) asa new biomass crop in the tropics. Jpn. Agric. Res. Quar. 20(4):302-304.
Oil Content Variation among Pongamia genotypes

There is increasing interest in improving plant wateruse efficiency, since water is increasingly scarce, especiallyin regions where precipitation is low, it is, therefore,
necessary to carry out studies on improving plant-wateruse efficiency. In all types of vegetation, the ability ofindividual to grow and reproduce depends on its success
in capturing resources from its environment, often incompetition with neighbours. When there is only onespecies in a stand with a uniform genetic base, resources
appear to be shared equitably. In stands with more thanone species, competition for limited resources is inevitable,both above and below ground. During the initial periods,
the trees occupy low volume and the vacant space betweenthe trees can be effectively utilized for intercroppingagriculture crops or fruit trees. This interface not only
ensures reasonable income to growers from land duringinitial period, but also helps in maintaining soil health bypreventing soil deterioration. The interaction between the
components viz., trees, fruit crops and agriculture crops arecomplex to comprehend. Broadly, such interactions can beclassified as aboveground and belowground interactions.
The interaction involves several bio-physical factors suchas light, space, water, nutrients, etc. The complementaritiesamong these factors are the key for success of an agro-
forestry model. As an association of woody and herbaceousplant communities, agro-forestry systems are deliberatelydesigned to optimize the use of spatial, temporal, and
physical resources, by maximizing positive interactions
Microclimatic Amelioration and Yield Potential in Horti-silvicultureSystem
W.S. Dhillon*, Sanjeev K. Chauhan1 and Nighat JabeenDepartment of Horticulture, 1Department of Forestry and Natural Resources
Punjab Agricultural University, Ludhiana- 141 004, India*E-mail : [email protected].
Abstract: Trees on the farm exhibit a potential to optimize the microclimatic conditions for intercrops. The deterioration or amelioration ofmicroclimatic conditions in agroforestry with the passage of time should be expected because of altered interaction patterns betweensunrays and tree canopy resulting from changing solar elevation and angle of sunrays. The present paper studies the micro-climaticinteraction and resultant effect on physiology and yield of horticultural trees (peach, kinnow and guava) grown under four year old poplartree canopy. The stomatal conductance was found to decrease with increasing atmospheric temperature and decreasing relativehumidity (RH). The transpiration rate (E) was minimum under shade conditions irrespective of the fruit species used in the experimentleading to more water use efficiency in the shade conditions than in open. Maximum carboxylation efficiency of peach indicated its higherproductivity potential over the other fruit crops. Photosynthetic efficiency have been found to be positively correlated with stomatalconductance and water use efficiency indicating the usefulness of these traits for selecting plant genotypes for higher productivity undershade conditions. Fruit yield parameters viz, length, breadth and weight of all the fruits studied was found on higher side in open thanunder shade except total soluble salts which increased more uniformly in shade than in open condition. However, the additional incomefrom timber trees surpass sole fruit economics.
Key Words : Horti-silviculture, Microclimate, Stomatal conductance, Growth
(facilitation) and minimizing negative ones (competition)among the components (Jose et al., 2000). Trees may actas windbreaks, decrease potential evaporation and
increase water use efficiency of wheat. The primary effect oftrees on crop energy balance is through the interception ofradiation and the reduction of wind speed. The specific
elements that may be affected by modifying the crop energybalance are: radiation and photosynthesis and its rate andduration; temperature and plant development; transpiration
and its consequences on soil water use and water useefficiency. This article evaluates the under storey micro-climate, and fruit production potential in a horti-silviculture
system.
MATERIAL AND METHODS
The study was conducted in the experimental area ofDepartment of Horticulture, Punjab Agricultural University,
Ludhiana located at 30o 45 N latitude and 75 o 18 Elongitudes at an elevation of 247m above mean sea level.The climate is sub-tropical with dry season from late
September to early June. The area receives annual rainfallof 704mm. The experiments involve two planting geometryand two ages of plantations of poplar and pear(i) One
experiment was taken up as pear plantation (6m X 6mspacing) where poplar was planted as filler tree betweenfour plants of pear during January, 2005 (ii) The other
plantation taken up in January, 2006 involving 4 fruit treesspecies (Kinnow, guava, peach and plum at 6m X 6m
Indian J. Ecol. (2011) 38 (Special Issue) : 124-128Indian Journal
of Ecology

125
spacing) and poplar trees (6m X 6m, N-S direction) grownalternatively. The variables measured include photosynthetic
active radiation (PAR), stomatal conductance and inter-cellular CO2, transpiration rate with portable photosynthesissystem (CID 340, CID Inc., USA). The diurnal variation in
these parameters was also measured at 9 am, 12 noonand 4 pm. The canopy characteristics such as the lightinterception and leaf area index of poplar trees was
measured using digital lux meter and canopy analyzer (CID310, CID Inc, USA), respectively. The per cent light interceptedby trees was calculated as the reduction in the average
light intensity under tree cover over control. The datagenerated was suitably analysed in statistical packageCPCS1 of PAU.
RESULTS AND DISCUSSION
Micro-Environmental Modifications under TreeCanopy
Radiation received below the tree canopy is highly
variable and consists of irregular alternate patches of light
and shade and keep on changing over time. Such spatial
as well as temporal variation also depends on spacing,
geometry of planting and age of the trees. The presence of
trees modifies site micro-climate in terms of temperature,
water vapor content and wind speed, among other factors.
Serving as windbreak, trees slow the movement of air and
thus in general reduce evaporative stress. Wind speed was
substantially reduced under a radiata pine (Pinus radiata)silvo-pastoral system due to increased tree stocking
(Hawke and Wedderburn, 1994). The variations intemperature and relative humidity under four and five year
old poplar plantations for the period of April to September,2009 were studied. The RH increased under the poplarcanopy as the age progressed. The difference of open and
under canopy was more marked in the initial years of cropplanting in the month of April to June; however this gapbecame narrow in the more humid months August and
September. The maximum RH of 80.57 per cent wasrecorded in the month of August under five year old poplarcanopy. Temperature showed an increase with age of
canopy in the month of April but it showed reverse trend fornext months till October (Fig. 1). The difference betweenopen and shade conditions for both parameters increased
with increase in canopy age and modification in micro-climate became more pronounced. Windbreaks are knownto improve the distribution and utilization of irrigation water,
reduce evapo-transpiration, and improve crop water useefficiency (Davis and Norman, 1988). Planting windbreaksor shelterbelts in crop fields provides wind protection as
well as changes in micro-climate; improved crop qualityand yield within the sheltered area (10 to 15H, where H isthe height of the windbreak) have also been reported earlier
(Brandle et al., 2000).
Relationship Between Radiation Flux and FruitYield Parameters under Poplar Based AgroforestrySystem
Diurnal variation in photosynthesis of fruit plants. Thediurnal variations in eco-physiological parameters recorded
Fig. 1. Micro-climatic modification under poplar tree canopy
Microclimatic Changes and Yield Potential of Agroforestry Systems

126
in fruit plants inter-planted with three year poplar wererecorded (Fig. 2). Various parameters like photosynthetic
active radiation (PAR), transpiration rate, photosynthetic rateand stomatal conductance was on higher side in control.The PAR was highest during afternoon with an average of
about 1113.48 (µmolm-2s-1), 1216.03 (µmolm-2s-1) and1123.03 (µmolm-2s-1) in open and 370.13 (µmolm-2s-1),245.94 (µmolm-2s-1) and 452.60 (µmolm-2s-1) in shade for
guava, kinnow and peach, respectively. The least PAR was
recorded during evening (4 pm) with 458.53 (µmolm-2s-1)
and 727.78 (µmolm-2s-1) for guava and peach and during
morning 589.52 (µmolm-2s-1) for kinnow in open and for fruit
trees inter-planted with poplar. The value of PAR was least
during morning hours in guava (145.70 mmolm-2s-1) and
peach (154.46 mmolm-2s-1) and during evening hours in
kinnow (144.38 mmolm-2s-1). The transpiration rate was also
highest during morning in guava (4.90 mmolm-2s-1), kinnow
(3.91 mmolm-2s-1) and peach in control conditions (7.58mmolm-2s-1) and kinnow (1.45 mmolm-2s-1) and peach (4.05
mmolm-2s-1) under shade conditions except guava whereits value (3.22 mmolm-2 s-1) was higher during eveninghours. The photosynthesis rate was highest during morning
hours in guava (12.47 µmolm-2s-1), Kinnow (5.48 µmolm-2s-
1) and peach (12.32 µmol m-2s-1) in open plot and 6.65 (µmolm-2s-1) for guava in evening, 5.16 (µmol m-2s-1) for Kinnow
and 9.27 (µmol m-2s-1) for peach in morning hours undershade conditions. The lowest rate of photosynthesis wasrecorded during afternoon in all fruit crops under both
conditions except peach where it was least during evening
hours under poplar canopy. Photosynthesis is a
physiological process that is affected by the environmental
factors. The fruit trees in general show daily changes in
photosynthetic rate and a mid day depression of
photosynthesis depending upon prevailing weather
W.S. Dhillon, Sanjeev K. Chauhan and Nighat Jabeen
1 Guava; 2 Guava control; 3 Kinnow;4 Kinnow control; 5 peach; 6 Peach control
Fig. 2. Diurnal variation in photosynthesis of fruit trees in different treatments

127
conditions during their growth period. Among the three fruit
trees, peach recorded highest stomatal conductance, net
photosynthesis and transpiration. At mid-day with the stress
of high temperature and intense irradiation, net
photosynthesis rate may decrease almost near to zero. It is
primarily due to the reduction in the stomatal conductance,
which leads to short supply of CO2. The stomatal
conductance was found to decrease with increasing
atmospheric temperature and decreasing relative humidity
(RH). The transpiration (E) rate was lowest under shade
conditions irrespective of the fruit species used in the
experiment leading to more water use efficiency in the shade
conditions than in open. Indeed, higher stomatal
conductance and higher CO2 assimilation rates were
observed in shaded plants, during both winter and summer.
Medinaa et al. (2002) also reported that during bothseasons, integrated daily net CO2 uptake was approximately20 per cent higher in shaded plants, mainly as a
consequence of increased leaf conductances. Higherstomatal conductance and CO2 assimilation rates underreduced radiation have also been observed in other cases,
as in Macadamia integrifolia and Litchi chinensis (Medinaaet al., 2002).
Maximum carboxylation efficiency of peach indicated
its higher productivity potential over the other fruit crops.Photosynthetic rate is positively correlated with stomatalconductance and water use efficiency indicating the
usefulness of these traits for selecting plant genotypes forhigher productivity under shade conditions.
Fruit productivity studies of guava, peach and plumin open and under partial canopy. Fruit plants like guavaand peach were incorporated in the poplar plantation (6 mx 6 m) so that distance between fruit plant to fruit plant
remain 6x6m. Uniform branches around the tree weretagged for recording the observations. In peach, date of fullbloom was delayed by one week, whereas, in guava there
was delay by 4 days under canopy than in open. Fruit lengthand breadth followed almost similar trend in open andshade conditions in peach with a pronounced rate of fruit
length growth than breadth near the maturity in shadeconditions. Fruit weight increased gradually in both openand shade conditions, whereas, TSS increased more
uniformly in shade than in open. Jifon and Syvertsen (2001)reported that juice and TSS yields in grape fruit increasedunder shade as compared in control. Acidity reached its
peak almost in the middle of season, thereafter, it declinedto almost same values in both the conditions. In guavafruits, rate of growth in terms of breadth was more in open
conditions than the length of fruit. There was moreconcurrence of rate of growth of length and breadth in shade
than in open. TSS remained almost static near 50-60 daysafter full bloom in both the cases with the more steep growth
in open conditions than shade. Rate of growth was almostsimilar till 80 days after full bloom in both the cases withmore steep increase in open than in shade. Acidity declined
continuously in both the cases with little fluctuation in thestart of growth of fruit. Though, in shade, there was moregradual decline than in open. Average yield of guava under
shade and open conditions was 7.12 kg/tree and 9.53 kg/tree, respectively and that of peach was 5.24 kg/tree and6.78 kg/tree under shade and open conditions, respectively.
In plum, growth pattern for fruit length, breadth and weightwas almost similar under both condition and there wasgradual increase in values of these parameters. Increase
in acidity for one month after full bloom was sharper inshade conditions as compared to open conditions and
afterwards the trend remained same. There was continuous
increase in total soluble solids in both conditions. While
considering fruit parameters (peach, guava and plum) at
full maturity under different experiments like filler, windbreak
and intercropping. In peach, different parameters viz, fruit
weight, length, breadth and juice acidity were found to differ
significantly with highest value in plants raised as control
for fruit weight, length and breadth and TSS and acidity. In
plum, only fruit breadth was found to be significantly different
among other parameters with highest value in plants of
control experiment. In case of guava, all the parameters
were found to be statically at par with each other. Fruit
parameters like fruit length was found greater in peach,
likewise fruit breadth was higher in guava but was at par
with peach. Total soluble solids were found higher in plum
followed by peach, the same trend was found in fruit juiceacidity. Fruit yield (kg/tree) was found higher in guava
followed by peach. Filler treatment was found best as far asfruit weight, fruit breadth and fruit yield (kg/ tree) wasconsidered, whereas, total soluble solids and acidity was
found higher with windbreaks.
Longer term moderate shade can increase total fruit
yield and juice content of fruit trees. The stomatal
conductance was found to decrease with increasing
atmospheric temperature and decreasing relative humidity
(RH). The transpiration (E) rate was lowest under shade
conditions irrespective of the fruit species used in the
experiment leading to more water use efficiency in the shade
conditions than in open. Maximum carboxylation efficiency
of peach indicates its higher productivity potential over the
other fruit crops. Pn/Ci is positively correlated with stomatal
conductance and water use efficiency indicating the
usefulness of these traits for selecting plant genotypes for
higher productivity under shade conditions.

128
REFERENCESBrandle, J.R., Hodges, L. and Wight, B. (2000) Windbreak practices.
In: Garrett HE; Rietveld WJ. and Fisher RF(Eds) Agroforestry:An Integrated Science and Practice. North American, ASAInc., Madison, WI, USA. pp. 79–118.
Davis, J.E. and Norman, J.M. (1988) Effects of shelter on plantwater use. Agriculture, Ecosystems and Environment 22/23:393–402.
Hawke, M.F. and Wedderburn, M.E. (1994) Microclimate changesunder Pinus radiata agroforestry regimes in New Zealand.Agriculture and Forest Meteorology 71: 133–145.
Jifon, J.L. and Jyversten, J.P. (2001) Effects of moderate shade oncitrus leaf gas exchange, fruit yield and quality. Proceedingsof the Florida State Horticultural Society 114:177-181.
Jose, S., Gillespie, A.R., Seifert, J.R. and Biehle, D.J. (2000) Defining
competition vectors in a temperate alley cropping system in
the mid-western USA. 2. Competition for water. Agrof. Syst.48:41–59.
Medinaa, C.L., Souzab, R.P., Machado, E.C., Ribeiroc, R.V., Jose,
A.B. and Silvaa. (2002) Photosynthetic response of citrus
grown under reflective aluminized polypropylene shading nets.
Scientia Horticulturae 1821: 1–11.
Messing, I. and Noureddine, A. (1991) Effects of wind breaks on
wind velocity, evapotranspiration and yield of irrigated crops
in the arid zone In: Sidi Bouzid (ed.) Rural DevelopmentStudies. number 30. Central Tunisia, 40 p.

Landuse options that increase livelihood security andreduce vulnerability to climate and environmental changeare necessary. Traditional resource management
adaptations such as agroforestry systems, may potentiallyprovide options for improvement in livelihood throughsimultaneous production of food, fodder and firewood aswell as mitigation of the impact of climate change (Pandey,
2007). The adverse impact of climate change may be moreseverely felt by the poor, who are more vulnerable than therich. Appropriate policy responses combining
agroecosystems as key assets can strengthen adaptationand help build the resilience of communities andhouseholds to local and global change. Tree-growing in
combination with agriculture (agroforestry systems) as wellas numerous vegetation management regimes in culturallandscape (ethnoforestry systems), including individual
farms, watersheds and re-gional landscape can beintegrated to take advantage of the services provided byadjacent natural, semi-natural or restored ecosystems.
Agroforestry systems include trees on farms, communityforestry and a variety of local forest management andethnoforestry practices. These systems have been
presented as a solution to rising fuelwood prices in Indiaresulting from increase in demand and decrease in supplyof fuel-wood due to forest degradation (Bowonder et al.,1988). In India, a lot of work has been done in all the agro-climatic zones and a number of traditional agroforestrysystems have been identified and documented. From the
Himalayan region, which is one zone of India, a number of
Agroforestry Systems of Lahaul and Spiti District of HimachalPradesh, Western Himalaya
Poonam, D. Nayak*, Rajan Bawa and Tara GuptaDepartment of Tree Improvement and Genetic Resources
Dr Y.S. Parmar University of Horticulture and Forestry, Nauni, Solan-173 230, India*ASPEE College of Horticulture and Forestry, NAU, Navsari, Gujarat – 396 450, India
*E-mail:[email protected]
Abstract: Land-use options that increase resilience and reduce vulnerability of contemporary societies are fundamental to livelihoodimprovement and adaptation to environmental change. Agroforestry as a traditional land-use adaptation may potentially support livelihoodimprovement through simultaneous production of food, fodder and firewood as well as mitigation of the impact of climate change.Agroforestry systems in India contribute variously to ecological, social and economic functions, but they are only complementary – andnot as an alternative – to natural ecosystems. But, different agroforestry systems prevalent in Lahaul and Spiti area have beencategorised into five different types. These identified agroforestry systems are agri-horticultural, agri-silvicultural, agri-silvi-pastoral, silvi-pastora and horti-pastoral.Major tree species of the area arewillow, poplar and apple. These agroforestry systems can play a pivotal rolein the era of global warming and climate change in the cold desert of Western India.
Key Words: Agroforestry systems, Lahaul and Spiti, Cold desert
traditional agroforestry systems have been documentedfrom Himachal Pradesh and Uttarakhand. Atul et al. (1990)have identified three most extensively practiced agroforestry
systems in H.P. (agri-silviculture, agri-horticulture and agri-horti-silviculture). Kumari et al. (2008) also reported fivemost extensively used agroforestry systems in dry zone ofLahaul and Kinaur district of Himachal Pradesh.Similarly,
Dadhwal et al. (1989), Toky and Khosla (1989), Singh andSingh (1987) and Singh et al. (1980) identified the followingagroforestry system in Himalayan region along with the
major benefits, (1) Fruit trees in combination with agriculturalcrops and fodder trees for fruit and fodder production, (2)Fodder trees with pasture for fodder production, (3) Trees
and grasses for soil conservation, fuel, timber and fodder.Singh and Dagar (1990) have identified agri-silviculturesystems, agri-horticultural system, agri-hortisilviculture
system, silvi-pastoral system and homesteads inMussoorie hills in the Western Himalayas. Hence, effortswere made to identify the current tree-based models and
their uses in District Lahaul and Spiti (cold deserts) ofHimachal Pradesh.
MATERIAL AND METHODS
The work was conducted in the year 2010 in Lahaul
area of Lahaul and Spiti District, which lies between latitudes32° 8' and 32° 59' North and longitudes 76° 43' and 77° 47'East in the Western Himalayas. Within study area, five
villages were randomly selected for the purpose of study. Ineach village, again 10 per cent sampling was done for
Indian J. Ecol. (2011) 38 (Special Issue) : 129-131Indian Journal
of Ecology

130
collecting the information from the households and theinformation was collected by questionnaire method, informal
interviews, transact walk along with the farmers andpersonal observations.
RESULTS AND DISCUSSION
Agroforestry systems in India include trees on farms,
community forestry and a variety of local forest managementand ethnoforestry practices. A wider definition of agroforestryencompasses a variety of practices, including trees on farm
boundaries, trees grown in close association with villagerainwater collection ponds, crop-fallow rotations, and avariety of agroforests, silvopastoral systems, and trees
within settlements. These systems have been presentedas a solution to rising fuelwood prices, resulting fromincrease in demand and decrease in supply of fuel-wood
due to forest degradation. Agroforestry systems in the areaare practiced by the farmers in order to meet their diverseneeds from the same unit area. Systems identified are
discussed hereunder.
The current tree based agroforestry models in Lahaularea have been presented in Table 1, which reveals that
maximum area (7.15 bigha) was found under agri-
silvicultural system and crops grown were peas/potato/rajmash/cauliflower/hops + salix, followed by pastoral-
silviculture (1.03 bigha) and crops grown were grasses +salix/eucalyptus. Area under agri-horticulture system was0.24 bighas with crop combinations of peas/potato + apple,
area under agri-silivi-pastoral was 0.37 bigha and cropsgrown were peas+salix+grasses, under pastoral-horticulture system area was 0.23 bigha and the crops
grown were grasses+apple. Generally five agroforestrymodels i.e. agri-horticulture, agri-silvi culture, agri-silvi-pastoral, pastoral-silviculture and pastoral-horticulture were
prevalent in the area.
Trees have a special role in the ethos of the people ofIndia. There are several sacred trees and sacred groves
valued by the people. India also has a long historicaltradition of tree-growing on farms and around homes. Suchtraditions and indigenous ethics had and continue to have
an impact and implications for tree-growing and ecological,economic and social well-being of the people. Sacredelements and traditional practices in cultural landscape of
India also have a substantial livelihood and conservationvalue. Besides these benefits trees have also multipurposeuses. The multifaceted benefits of the tree based
Table 1: Current tree based model in Lahaul and Spiti district*
Name of Agri-horticulture Agri-silviculture Agri-silvi-pastoral Pastoral-silviculture Pastoral- horticulture
villages Area Crops/ Area Crops/ Area Crops/ Area Crops/ Area Crops/(bighas) tree (bighas) tree (bighas) tree (bighas) tree (bighas) tree
Goshal 0.5 Peas/ 11.4 Peas/ 0.20 Peas+ 0.22 Grasses+ 0.35 Grasses+
Potato+ Potato/ Salix+ Salix + Apple
Apple Rajmash + Grasses Eucalyptusz
Salix
Jhalma 0.4 Peas+ 6.7 Peas/ 0.4 Peas+ 0.7 Grasses + Salix 0.6 Grasses +
Apple Potato/ Salix+ Apple
Rajmash + Grasses
Salix
Gondla 0.9 Peas/ 8.5 Peas/ 0.6 Peas+ 0.4 Grasses+ 0.7 Grasses +
Potato + Potato/ Salix+ Salix Apple
Apple Rajmash+ Grasses
Salix
Tandi 0.6 Peas+ 5.8 Salix 0.40 Peas+ 1.2 Grasses + 0.6 Grasses +
Apple Peas/ Salix+ Salix Apple
Potato/ Grasses
Rajmash+
Salix
Tholang 0.7 Peas+ 7.4 Peas/ 0.35 Peas+ 0.8 Grasses+ 0.15 Grasses+
Apple Potato/ Salix+ Salix Apple
Rajmash+ Grasses
Salix
Average 0.62 Do 7.96 do 0.39 do 0.664 do 0.48 do
*1ha = 12.5 bighas
Poonam, D. Nayak, Rajan Bawa and Tara Gupta

131
Table 2. Benefits of tree based model in Lahaul and Spiti district
Benefts Goshal Jhalma Gondla Tandi Tholang Total Average
Score Ranks Score Ranks Score Ranks Score Ranks Score Ranks Score Ranks
Fuel wood 43 I 40 I 39 II 41 I 43 I 206 41.2 I
Fodder 32 II 33 II 41 I 35 II 31 II 172 34.4 II
Small timber 22 III 34 III 31 II 27 III 24 III 138 27.6 III
Thatching material 12 IV 11 IV 8 V 16 IV 8 V 55 11 IV
Fruits 7 V 9 V 13 IV 7 V 13 IV 49 9.8 V
agroforestry models found in the region are described below(Table 2). Ranking system was used for analyzing the
benefits. On an average, maximum benefits (41.2) weretaken as fuel wood, followed by fodder (34.4), small timber(27.6), while minimum (11) benefits were taken as thatching
material. The benefit of fruit growing is lowest (9.8), whichshows that maximum potential areas can be covered underhorticulture tree crops but have not properly been exploited.
Natural ecosystems are often diverse in their speciescomposition and efficient in conservation of site resources.The traditional agroforestry practices to some extent have
helped people in meeting some of their diverse needs i.e.,food, fodder, fuelwood and timber but the farmers with smallland holdings and due to water scarcity, results in low yield
of food, fodder and fuelwood from the unit area.
REFERENCESAtul,Punam and Khosla, P.K. (1990) Classification of traditional
agroforestry systems. Proc. IUFRO, 19th World ForestryCongress, Montreal, pp. 24-27.
Bowonder, B., Prasad, S.S.R. and Unni, N.V.M. (1988) Dynamics offuelwood prices in India: Policy implications. World Dev. 16:1213-1229.
Dadhwal, K.S., Narain, P. and Dhyani, S.K. (1989) Agroforestrysystems in the Garhwal Himalayas of India. Agrof. Syst. 7:213-225.
Kumari, A., Sehgal, R.N. and Kumar, S. (2008) Traditionalagroforestry systems practiced in Lahaul and Kinnaur districtsof Himachal Pradesh. Indian For. 134(8): 1003-1010.
Pandey, D. N. (2007) Multifunctional agroforestry systems in India,Curr. Sci. 92(4):455-463.
Singh, K.A., Rao, R.N., Pitiram and Bhutia, D.T. (1980) Largecardamom plantations: an age old agroforestry System inEastern Himalayas. Agrof. Syst. 9: 241-257.
Singh, R. and Singh, S.P.(1987) Alternative farming systems fordryland of semi-arid tropics of India. Paper Presented at Nat.Symp. on Alternative Farming Systems. IARI, New Delhi, Feb.
Singh, V.P. and Dagar, J.C. (1990) Agroforestry systems formussoorie hills in western himalayas. Indian For. 115 (7):610-614.
Toky, O.P. and Khosla, P.K. (1989) Structure and function of traditionalagroforestry systems in the western Himalayas-I. Biomassand Productivity. Agrof. Syst. 9: 241-257.
Agroforestry in Cold Deserts of Himachal Pradesh

India with the largest cattle population in the world hasinsufficient milk production to meet the regular
requirements. Inadequacy of feed resources is the keyconstraint in meeting the increased demand, whichnecessitates the usage of concentrates and tree forage. A
number of indigenous as well as exotic multipurpose treegenera including Bauhinia, Prosopis, Grewia, Celtis,Robinia, Albizia, Leucaena, etc., have gained significance
for fodder. Leucaena (subabul) is one of the potentialspecies, gaining popularity for its adoption under silvi-pastoral systems due to its multipurpose uses, fast growth,
coppicing ability, nutritive value, nitrogen fixing ability, wideadaptability, etc. Tree is native to Mexico and Central Americaand has been found highly acceptable with excellent
performance in south-east Asian countries. Foliage of
Leucaena is highly palatable, nutritious and relished by
cattle, goat and wildlife but it cannot be used as sole feed
because of presence of non-protein amino acid, mimosine
[â{N-3hydroxy-4(H) pyridone} amino propionic acid]. Toxicity
of sole Leucaena feeding has been observed in sheep,
goat and cattle (Jones, 1979; Hegarthy et al., 1976; Meulen
and El-Harith, 1983; Norton et al., 1995; Mahanta et al.,2002; Solanki, 2003). Thus, it is important to mix Leucaenaleaves with other forage crops for feeding to animals.
Punjab is one of the leading agriculture states and
represents 3rd position in milk production. Scarcity of greenfodder in the state is the major reason for low animalproductivity. Since, the cattle have an important role in the
state’s farming systems, therefore, agroforestry systems
Evaluation of Nutritive Value of Leucaena Supplemented Fodder
Sanjeev K. Chauhan*, S.S. Sikka1, Rajni Chauhan and Ateet Pal SinghDepartment of Forestry and Natural Resources, PAU- Ludhiana-141 004, India
1Department of Animal Nutrition, GADVASU – Ludhiana-141 004, India*E-mail: [email protected]
Abstract: Leucaena is an important component of tree based farming system for providing complementary beneficial effects on yield ofinter-cultivated crops. High protein content makes it very suitable feed source, however, the toxic non-protein amino acid, mimosine limitsits use in the feed of farm animals. An attempt has been made to assess the feed quality of Leucaena supplemented forage by mixingdifferent proportions of inter-cultivated forage crops. In the present study significant variation in nutritive value of K-8, K-156 and K-743Awas recorded. More quantitative data has been generated on Leucaena as protein supplemental feed. The contents of all the biochemicalsby mixing Leucaena leaves in traditional forage were diluted significantly with the increase in proportion of inter-cultivated forages. It isimportant to notice that utilization of Leucaena leaves besides protein supplement dilutes the mimosine as the proportion of the otherforages increase. The ratio of mixing of Leucaena and all the forage crops i.e., maize+cowpea, ryegrass+berseem and napier bajrahybrid followed the same trend. The intercropped fodders played the role of dilution factor in the anti-quality parameters like mimosine andtannins but still the lower mimosine mixture will not be the perfect combination, as K-743A had lower productivity than K-8. Leucaenasources K-8 with high protein content (24.05%) and relatively higher productivity (27.6 and 31 per cent more than K-156 and K-743A,respectively) supplemented in ratio of 1:2 was found a very suitable feed source in terms of quantity and quality fodder.
Key Words: Leucaena, Subabul, Silvi-pastoral system, Cultivated forage, Supplemented feed
designed to improve forage production are expected to makea significant contribution to farm productivity. Leucaena has
already been recommended for cultivation in Punjab owingto its multipurpose uses but restricted its use as fodderdue to its anti-quality properties (mimosine and tannin
contents). However, Leucaena species contains highconcentration of protein (ranging from 20 to 35 per cent inthe dry matter) thus making it a valuable protein supplement
to low quality forage diet. Therefore, a study was conductedto workout the appropriate proportion of mixing Leucaenain other forages to supplement nutrition to domestic
animals.
MATERIAL AND METHODS
Three diverse sources viz. K-8 (Leucaenaleucocephala), K-156 (Leucaena diversifolia) and K-743A
(Leucaena leucocephala x Leucaena diversifolia) selectedon the basis of their mimosine content were raised in fourreplications with 12 plants per replication at 4x2m spacing
in the experimental area of Fodder Section, PunjabAgricultural University, Ludhiana. The analysis of theirnutritive values with inter-cultivated fodders i.e., Napier bajra
hybrid (PBN-233), maize (J-1006) + cowpea (Cowpea-88)followed by berseem (BL-10) + rye grass (Rye grass No.1)was done in the Laboratory of Animal Nutrition Department,
Guru Angad Dev Veterinary and Animal Sciences University,Ludhiana.
Leucaena leaf samples taken at random from each
Leucaena source at different maturity stages were mixed,
Indian J. Ecol. (2011) 38 (Special Issue) : 132-136Indian Journal
of Ecology

133
dried and ground to powder, which were mixed with theabove mentioned inter-cultivated fodder crops in the
proportion of 1:1, 1:2 and 1:3. The nutritional analysis forproteins, carbohydrates, total ash, mimosine and tanninsfrom these dried powder fodder samples was done as per
the standard procedures. Crude protein, tannins and ashcontent were estimated as per the procedure of AOAC(1970); carbohydrates by following Dubois et al. (1956)
and mimosine by rapid calorimetric method of Mastsumotoand Sherman (1951). The data generated on different qualityparameters was suitably analyzed after following the
standard procedure of Gomez and Gomez (1984).
RESULTS AND DISCUSSION
Leucaena leaves were mixed with forage crops i.e.,ryegrass + berseem, maize + cowpea and napier bajra
hybrid in the ratio of 1:1, 1:2 and 1:3 to evaluate the qualitativeparameters to neutralize the anti-quality factors (mimosineand tannins). Protein and mimosine are two important
components among the studied parameters in the feed.Protein is important per se but it has a bearing on mimosinecontent also, which is an anti-quality factor. The nutritive
values of pure Leucaena sources presented in Table 1,indicated that the anti-quality bio-chemicals (mimosine andtannins) were comparatively less in K-743A than K-156 and
K-8, whereas, other important biochemicals crude proteinexhibited reverse trend. There are ample evidences for
variation in different bio-chemicals in different species of
Leucaena and within Leucaena leucocephala (Hauad &
Foroughbakch, 1991; Gupta et al., 1991; Norton et al., 1995;
Khajuria et al., 1997). Though the results from different
authors differ widely in absolute terms, yet it is not known
how much of apparent variation within species is genetic in
nature. In terms of green leaf biomass, all the three
Leucaena sources differed significantly. K-8 was more
productive in terms of leaf biomass followed by K-156 and
K-743A i.e., 3.26, 2.36 and 2.25 kg/plant, respectively at the
age of four years.
The data on qualitative parameters of Leucaena mixed
with ryegrass + berseem, maize + cowpea and napier bajrahybrid in different proportion have been presented in Table2-4. The differences in values with respect to different
Leucaena sources, the proportion of mixing and theirinteraction were significant in almost all the parameters.
The anti-quality parameters were found in the order of K-743A<K-156<K-8 at all mixture levels. Lahene et al. (1987)and Norton et al. (1995) also reported the similar trend.
It is evident from the table 2 that the mixing of ryegrass+ berseem in different proportion had significant influenceon all the fodder qualitative parameters (crude protein,
carbohydrates, ash, mimosine and tannin content).Irrespective of the Leucaena source, the value of protein,carbohydrate, mimosine and tannins decreased, while the
ash content increased with the increase in proportion ofryegrass + berseem fodder. The reduction in thecarbohydrate, mimosine and tannin content was drastic
(75.08, 69.23 and 74.49 per cent, respectively) but slight inprotein (4.28 per cent) when the proportion of ryegrass +berseem in Leucaena was increased from 1:1 to 1:3 ratio.
The ash content, however, increased by 5.44 per cent. Thereduction in values was due to lower quality roughage ofinter-cultivated fodder crops.
The mixing of ryegrass + berseem with Leucaena (K-743A) in the ratio of 1:3 registered the minimum value formimosine, however, the content decreased in other
Leucaena sources also but values were significantly higher.The data on different fodder quality parameters on mixingof Leucaena and maize + cowpea and napier bajra hybrid
in different proportions also followed the same trend as for
ryegrass + berseem (Table 3 & 4). The values of protein,
carbohydrate, tannin and mimosine decreased with
increase in proportion of maize + cowpea and napier bajra
hybrid from 1:1 to 1:3, while the ash content increased with
increase in proportion. The overall reduction in
carbohydrate, mimosine, tannin and protein content was
almost same in both the combinations. The reduction in
the carbohydrate, mimosine, tannin and protein contents
were 75.5, 70.2, 76.2 and 16.76 per cent, respectively when
the proportion of napier bajra hybrid in Leucaena was
increased from 1:1 to 1:3. The ash content, however,
increased by 5.6 per cent. Similarly, the reduction was in
the order of 75.08, 71.13, 74.54 and 14.19 per cent,
respectively in Leucaena supplemented in maize+cowpea
Table 1. Quality parameters of different Leucaena sources
Leucaena source Crude protein Carbohydrate Ash Mimosine Tannins
(%) (%) (%) (%) (%)
K-8 (Leucaena leucocephala) 24.05 12.50 8.14 2.30 3.76
K-156 (L. diversifolia) 25.20 12.68 7.97 1.87 3.53
K-743A (L. leucocephala x L.diversifolia) 24.20 14.77 7.99 1.40 3.35
CD 5% 0.09 0.06 0.16 0.04 0.14
Nutritive Value of Leucaena Fodder

134
Tab
le 2
.
Nut
ritio
nal
valu
e of
Leu
caen
a :
ryeg
rass
+ b
erse
em i
n di
ffere
nt p
ropo
rtio
ns
Leuc
aena
Cru
de p
rote
in (
%)
Car
bohy
drat
e (%
)A
sh (
%)
Mim
osin
e (%
)Ta
nnin
s (%
)
sou
rce
1:1
1:2
1:3
Mea
n1:
11:
21:
3M
ean
1:1
1:2
1:3
Mea
n1:
11:
21:
3M
ean
1:1
1:2
1:3
Mea
n
K-8
20.6
320
.08
19.8
120
.17
5.70
2.85
1.42
3.32
9.07
9.38
9.53
9.32
1.16
0.55
0.38
0.69
1.80
0.90
0.40
1.03
K-1
5621
.50
20.6
020
.25
20.7
85.
962.
981.
473.
478.
989.
329.
499.
260.
900.
440.
270.
532.
201.
100.
501.
26
K-7
43
A20
.92
20.2
820
.29
20.4
96.
063.
031.
513.
538.
999.
329.
509.
270.
700.
330.
190.
401.
600.
800.
300.
90
Mea
n21
.01
20.3
220
.11
5.90
2.95
1.47
9.01
9.34
9.50
0.91
0.44
0.28
1.86
0.93
0.40
C.D
. at 5
% le
vel
So
urc
e0.
250.
060.
080.
040.
08
Rat
io0.
240.
07N
.S.
0.04
0.06
Sou
rce
x R
atio
N.S
.0.
10N
.S.
0.06
0.13
Tab
le 3
. N
utrit
iona
l va
lue
of L
euca
ena
: m
aize
+ c
owpe
a in
diff
eren
t pr
opor
tions
Leuc
aena
Cru
de p
rote
in (
%)
Car
bohy
drat
e (%
)A
sh (
%)
Mim
osin
e (%
)Ta
nnin
s (%
)
sou
rce
1:1
1:2
1:3
Mea
n1:
11:
21:
3M
ean
1:1
1:2
1:3
Mea
n1:
11:
21:
3M
ean
1:1
1:2
1:3
Mea
n
K-8
19.5
218
.01
16.3
117
.88
6.05
3.03
1.51
3.53
8.57
8.85
8.89
8.77
1.20
0.60
0.40
0.73
1.60
0.81
0.42
0.94
K-1
5620
.31
18.5
417
.65
18.8
36.
273.
131.
563.
658.
488.
888.
878.
740.
930.
460.
240.
541.
690.
840.
410.
98
K-7
43
A19
.78
18.1
817
.39
18.4
57.
063.
531.
764.
118.
508.
838.
888.
730.
800.
420.
220.
481.
660.
830.
400.
96
Mea
n19
.87
18.2
417
.05
6.46
3.23
1.61
8.51
8.85
8.88
0.97
0.49
0.28
1.65
0.82
0.42
C.D
. at 5
% le
vel
So
urc
eN
.S.
0.17
N.S
.0.
140.
09
Rat
io1.
700.
17N
.S.
0.14
0.09
Sou
rce
x R
atio
N.S
.0.
29N
.S.
N.S
.0.
16
Sanjeev K. Chauhan, S.S. Sikka, Rajni Chauhan and Ateet Pal Singh

135
Tab
le 4
.
Nut
ritio
nal
valu
e of
Le
ucae
na :
nap
ier
bajra
hyb
rid
in d
iffer
ent
prop
ortio
ns
Leuc
aena
Cru
de p
rote
in (
%)
Car
bohy
drat
e (%
)A
sh (
%)
Mim
osin
e (%
)Ta
nnin
s (%
)
So
urc
e1:
11:
21:
3M
ean
1:1
1:2
1:3
Mea
n1:
11:
21:
3M
ean
1:1
1:2
1:3
Mea
n1:
11:
21:
3M
ean
K-8
18.0
216
.04
15.3
416
.46
6.12
3.06
1.53
3.57
9.70
10.0
410
.20
9.98
1.30
0.65
0.40
0.78
1.72
0.86
0.43
1.00
K-1
5618
.81
16.5
415
.40
16.9
16.
483.
071.
543.
699.
439.
829.
969.
740.
920.
480.
260.
551.
820.
910.
451.
06
K-7
43
A18
.28
16.1
815
.14
16.5
36.
903.
451.
724.
029.
459.
7810
.00
9.74
0.82
0.44
0.24
0.50
1.66
0.83
0.40
0.96
Mea
n18
.37
16.2
515
.29
-6.
503.
191.
59-
9.53
9.88
10.0
5-
1.01
0.52
0.30
-1.
770.
860.
42-
C.D
. at 5
% le
vel
So
urc
eN
.S.
0.29
N.S
.0.
150.
62
Rat
io1.
430.
30N
.S.
0.15
0.62
Sou
rce
x R
atio
N.S
.N
.S.
N.S
.N
.S.
N.S
fodder from 1:1 to 1:3 ratio.
The objective of mixing as mentioned above was mainly
to reduce the anti-quality parameters i.e. mimosine and
tannins, it lowered down the quality parameter also,
however, the reduction in protein was slight but high in
carbohydrate contents. The carbohydrates can be
supplemented through other alternative sources but
reduction in the mimosine through the mixing of other green
fodder in Leucaena will provide a viable option for the
success of this silvi-pastoral model among the farmers
with high productivity. The reduction in both the anti-quality
parameters had been drastically high by mixing of Leucaena
and other fodder crops in the ratio of 1:3. Kaur and Gupta
(2003) observed very low concentration of mimosine and
tannins in blended fodders of berseem + shaftal : subabul
foliage in the ratio of 40:60 and 60:40, which were quite
below the toxic level. The level of protein and carbohydrates
in blended fodder were also found to be in accordance with
the recommended standards. The feeding of Leucaena
with other forages to minimize the anti-quality factors also
find the support of Devendra (1982), where 50 per cent
amount of Leucaena forage in diet has been recommended.
Norton (1994) emphasized 30-50 per cent Leucaena in the
diet for optimum performance of cattle, sheep and goats.
Leucaena leaves have also been used successfully to
increase the protein content and nutritive value of the silages
(Tandraatmadja et al., 1993). Neeru et al. (1992) did not
observe any ill effects on rumen microbial activity rather it
had positive effects by substituting dietary dry matter with
20% sun dried Leucaena leucocephala leaves in the diet of
buffalo calves. Waipanya and Srichoo (1994) reported
reduced cost of milk production by utilizing Leucaena leaves
as protein supplement and farmers earned more income.
Using a high proportion of K-743A with other fodder
crops (1:3) would give lower mimosine and tannin levels,
but would also mean lower protein and biomass. Leucaena
source K-743A was comparatively less productive than K-
156 and K-8. Therefore, this ratio may not be acceptable
depending on the lower biomass and quality parameters.
Leucaena leucocephala has great value as a supplement
to low quality fodder. The use of most productive source (K-
8) at 1:2 ratio will be optimum in terms of quality and quantity.
Recently the use of subabul in paper industry has
encouraged the farmers for its adoption under farm forestry/
agroforestry. The adoption of subabul based silvi-pastoral
system in Punjab and adjoining states will also provide the
high level of quality fodder output, stabilize the agro-
ecosystem and provide employment to rural people.
Nutritive Value of Leucaena Fodder

136
REFERENCESAOAC (1970) Official methods of analysis. Association of Official
Analytical Chemists, Washington, D.C.
Brewbaker, J. L. and Kaye, S. (1981) Mimosine variations inspecies of the genus Leucaena. Leucaena Res. Rep. 2 : 66-68.
Bray, R. A., Cooksley, D.G., Hall, T.J. and Ratcliff, D. (1988)Performance of fourteen Leucaena lines at five sites inQueensland. Australian J. Expt. Agri. 28: 69-76.
Davendra, C. (1982) The nutritive value of Leucaena leucocephalacv. Peru in balance and growth studies with goats and sheep.Mardi Research Bull. 10: 138-150.
Dubois, M., Gilles, K.A., Hamilton, J.K., Rebers, P.A. and Smith, F.(1986) Colorimetric method for determination of sugars andrelated substances. Analytical Chemistry 28: 350-356.
Gomez, K. A. and Gomez, A.A. (1984) Statistical procedures foragricultural research (2nd Ed.). John Wiley & Sons Inc., NewYork. 680 p.
Gupta, B. K., Ahuja, A.K. and Khajuria, H.N. (1991) Fodder analysisof new Leucaena varieties. Leucaena Res. Rep. 12: 40-41.
Hauad, M. L. A. and Foroughbakhch, R. (1991) Variation in mimosinecontent among three species of Leucaena in eastern NuevoLeon, Mexico. Leucaena Res. Rep. 12: 63-65.
Hegarthy, M. P., Court, R.D. and Christie, G.S. (1976) Mimosine inruminants. Aust. Vet. J. 52: 40.
Jones, R. J. (1979) The value of Leucaena leucocephala as a feedfor ruminants in the tropics. World Animal Review 31: 13-23.
Kaur, R. and Gupta, B. K. (2003) Development of fodder basedcomplete ration using locally available feed ingradients fordairy animals. SARAS J. Livestock Poultry Production 19(1/2): 73-78.
Khajuria, H. N. (1991) Fodder analysis of new Leucaena varieties.Leucaena Res. Rep. 12: 40-41.
Khajuria, H. N., Bajwa, B.S. and Gupta, B.K. (1997) Evaluation ofLeucaena for growth and fodder quality. J. Res. Punjab Agric.Univ. 34(1): 27-30.
Lahene, B. N., Relwani, L.L., Raina, A.K. and Gadekar, H.L. (1987)Initial evaluation of Leucaena leucocephala cultivars for fodderproduction. Leucaena Res. Rep. 8: 29-30.
Mahanta, S. K., Singh, U.P.and Pachauri, V.C. (2002) Scope offeeding subabul (Leucaena leucocephala) forage in livestock– A review. Forage Res. 28(3): 124-129.
Mastsumoto, H. and Sherman, G.D. (1951) A rapid colorimetricmethod for the determination of mimosine. Archive ofBiochemistry Biophysics 53: 195-197.
Meulen, U. and EL-Harith, E.A. (1983) Mimosine a factor limiting theuse of Leucaena leucocephala as animal feed. Phillipines J.Veterinary and Animal Sciences 1-4: 297.
Neeru, V.K.Green and Singh, S. (1992) Effect of feeding Leucaenaon ruminal microbial activity in buffalo calves. Leucaena Res.Rep. 13: 37-39.
Norton, B. W. (1994) Tree legumes as dietary supplements forruminants. Forage Tree Legumes in Tropical Agriculture(Gutteridge, R. C. and Shelton, H. M. Eds.). CAB International,Wallingford, Oxford, U K, pp.192-201.
Norton, B. W., Lowry, B. and McSweeney, C. (1995) The nutritivevalue of Leucaena species. Proc. of workshop on Leucaena-Opportunities and Limitations (eds. H.M. Shelton, C.M. Pigginand J.L. Brewbaker) held at Bogor, Indonesia (24-29 January1994). ACIAR Proceedings No.57, ACIAR Canberra Australia.pp.103-111.
Pathak, P. S. (1988) Ecology and potential of subabul in agroforestrysystems. Pasture and Forage Crop Research – A State ofKnowledge Report (Ed. P Singh). Range Management Societyof India, Jhansi.
Relwani, L. L. (1983) Kubabul (Leucaena leucocephala) – Arenewable source of fuel, timber and pulp. Leucaenaleucocephala in India (Eds. R.N. Kaul, M.G. Gogate and N.K.Mathur). Vangaurd Press, Dehradun.
Saunders, J.A., Qakes, A.J. and Wiser, W.J. (1987) The relationshipof mimosine and protein content in Leucaena leucocephala.Leucaena Res. Rep. 8:68-74.
Solanki, K.R. (2003) Forage production through agroforestry. ForageRes. 29:1-9.
Tjandraatmadja, M., Macral, I.C. and Norton, B.W. (1993) Effect ofthe inclusion of tropical tree legumes, Gliricidia sepium andLeucaena leucocephala on the nutritive value of silagesprepared from tropical grasses. J. Agricultural Sciences 120:397-406.
Waipanya, S. and Srichoo, C. (1995) Utilization of Leucaenaleucocephala as dry season protein supplement for dairycattle in Southern Thailand. International Workshop onLeucaena: Opportunities and Limitations, (eds. H.M. Shelton,C.M. Piggin and J.L. Brewbaker) held at Bogor, Indonesia (24-29 January 1994). ACIAR Proceedings No.57, ACIAR CanberraAustralia, pp.149-152.
Sanjeev K. Chauhan, S.S. Sikka, Rajni Chauhan and Ateet Pal Singh

The developing world is today encountered with nearcrisis situation, both economic and environmental. This
region with barely 56% of the land area has to supportaround 77% of the total population at the global level. Thepolicy makers are therefore finding it very difficult to formulatestrategies that would work under the present situation of
escalating population on the one hand and diminishingresources on the other. India, which is known as developedamong the developing nations, is no exception in this
regard. As from the last few decades, the country iswitnessing a serious depletion of its resources as well asvarious concomitant environmental disasters. The impacts
of degradation are though visible in all the renewable andnon-renewable resources, yet the forest and the land, whichare very initial for the sustenance, are perilously affected.
To over come this situation, increasing productivity ofexisting forest stands, restocking low density areas,afforestation of village, wastelands under social forestry
and integration of trees in agricultural/horticultural cropsseems to be very visible options. The integration of trees onfarm lands (recently coined as agroforestry), however, needs
to the given a special preference as this would enable thepeople to be self sufficient for their basic needs and therebyhelp directly and indirectly in conserving and improving the
public forest land.
Agroforestry land use pattern are biologically morecomplex and diverse than other farming practices prevalent
throughout the world. Such system though hold promisingpotential to address the various basic issue of the farmingcommunities, yet they have not been given due scientific
attention. In fact, vary little information is available on the
Effect of Grewia optiva Pollarded at Different Heights on BiomassProduction of Agroforestry Systems in Mid-Hills of Himachal
Pradesh of India
H. K. Deshmukh*, V. K. Mishra1, A. J. Deshmukh and Y. B.Taide*College of Forestry, Dr Panjabrao Deshmukh Krishi Vidyapeth, Akola
1Dr YS Parmar University of Horticulture and Forestry, Nauni, Solan 173 230, India*E-mail: [email protected].
Abstract: The experiments on tree-crop interaction was carried out during Rabi and Kharif were laid out in replicated factorial randomisedblock design comprising 18 treatments combination. The study revealed that the yield of both wheat and soybean responded negativelyto increasing pollarding heights from 1.5 m to 4.5m and positively to increasing distance of crop from tree rows (1 to 3 m), besides boththe crops performed better in southern aspects as compared to the northern. Biomass production of Grewia optiva (leaf and branch)increased with increasing pollarding heights from 1.5 to 4.5 m.
Key Words: Agroforestry, Biomass production, Pollarding heights, Interaction
tree-crop combinations and various interaction involvedthere in as well as different tree management practice,
which is properly applied shall help to minimize the negativeeffect of trees on accompanying crops. Keeping in the viewthe significance of problem, the present study was initiatedon effect of Grewia optiva pollarded at different heights on
biomass production.
MATERIAL AND METHODS
The experiment of tree crop interaction was carried out
during winter–wheat and summer-soybean in association
with6 year old Grewia optiva pollarded at different heights
(1.5m, 3m and 4.5m). The experimental site falls in the mid
hill zone of H.P. at an elevation of 1250m above mean sea
level. The climate of the area is transitional between sub
humid sub- tropical to sub temperate. There is in general
consideration variation in the seasonal and diurnal
temperatures (May and June are the hottest months
whereas, December and January are the coldest and
experience severe frost). The annual temperature ranges
from 30 C to 31.20C, the area receives on an average annual
rain fall of 1200-1300mm, most of which is concentrated in
the monsoon period mid June- August winter shower are
usually mild. The soils of the experimental site are gravelly
loam in texture and have granular in structure. The fertility
status of these soils reveals that they are medium in
available N and high in available K2O and P2O5. Experiments
are laid out in replicated factorial randomised block design
with three replications and comprising 18 treatment
combination with three pollarding heights (P1- 1.5m, P2 –
3.0m and P3 – 4.5m), three distances of crop from tree row
Indian J. Ecol. (2011) 38 (Special Issue) : 137-140Indian Journal
of Ecology

138
(D1 – 1.0m, D2 – 2.0m and D3 – 3.0m) and two directionsof crop from tree row (S1 – north aspect of tree row and S2
– south aspect of tree row). G. optiva has been planted at8mx2.5m along east-west direction.During experimentplantation was 6 yrs old. Net sown area of both the crops
(wheat and soybean) was same i.e. 9400 sq.m Thepackage of practices were followed as recommended bythe state department of agriculture, Himachal Pradesh for
raising Rabi (winter) and Kharif (summer) crops (Rabi –wheat and Kharif- soybean). Likewise, grain yield per hectareand straw yield per ha were recorded.
Branchwood and leaf biomass of G. optiva was recordedin October. The branches were lopped completely andseparated from leaves and their individual fresh weight was
recorded in the field. Branch and leaf samples were driedat 85° to calculate dry weight. Leaf and branchwoodbiomass was expressed in kg per plant.
The cost of cultivation of different field crop was workedout on the basis of net cropped area. The yield of differentfield crop and fodder tree was converted into gross returns
in rupees per hectare, based on prevailing localmarketprices. Net return in both the season was calculated bydeducting the total cost from gross returns. The data
obtained from the present investigation were subjected tostatistical analysis and analysed for proper interpretation.
RESULTS AND DISCUSSION
Grewia optiva – Wheat (Triticum aestivum)Combination: Wheat Yield
The grain as well as straw yields showed significant
effect due to interaction between pollarding heights (P) xcrop distance (D) x crop direction (S) (Table 1). Among theinteractions the highest grain and straw yield were
registered at P3D3S1 (15.03) and P2D3S2 (20.61),respectively. The lowest grain and straw yield were recorded
at P3D1S1 (5.57) and P2D1S1 (8.63) respectively.
Khan and Aslam (1974) observed yield reduction in
crops in tree- crop intercropping system. The depressionwas highest near the tree line and decreased withincreasing distance. Yamaoh et al. (1988) and Dugma etal. (1988), Khybri et al. (1992) in wheat- Grewia, wheat –Morus and wheat – Eucalyptus intercropping systemsobserved 39 per cent yield reduction up 1m, 33 per cent
from 2m, 25 per cent from 2 to 3m and 12 per cent from 3 to5 m from tree row. The crop raised in the southern aspect ofthe tree row registered significant increase of 9.36 per cent
in grains and 23.23 in straw as compared to that raised innorthern aspect.
G. optiva- Soybean Combination: Soybean Yield.
The grain as well as straw yield tended to depreciation
with increase in pollarding height, yet the variation wasrecorded to be statistically non-significant. The yield (bothgrain and straw) in response to distance as well as direction
of crop showed a significant effect, wherein it enhancedremarkably with increase in crop distance and was seen tobe higher in southern aspect compared to northern (Table 2).
The grain yield improved by 16.55 and 9.86 per cent
whereas, straw yield increased by 26.9 and 7.96 per cent
from D1 to D2 and D2 to D3, respectively. The crop raised in
southern aspect yielded out more than in northern aspect
by 15.2 per cent in grain yield and 16.39 per cent in straw
yield (Table 3). Sheikh and Haq (1978) and Kumar (1996)
have also reported better performance of crop on southern
than in northern aspect.The interaction effects of pollarding
height, distance of crop from tree rows revealed non-
significant variation on yield of the crop.
The gain of N, P and K in soil can be attributed to
inclusion of legume as crop, residual effect of N, P and Kapplied at the time of wheat and partially, presence of tree
Table 1. Interaction of pollarding height x crop distance x crop direction on grain and straw yield(q/ha) of wheat (P x D x S)
Pollarding Crop distance
Height D1 D2 D3
Crop direction Crop direction Crop direction
S1 S2 S1 S2 S2 S2
Grain Straw Grain Straw Grain Straw Grain Straw Grain Straw Grain Straw
P1 9.42 12.90 12.17 15.81 10.98 17.03 12.06 19.35 10.92 17.00 12.08 18.62
P2 9.27 8.63 10.92 12.14 9.69 10.45 11.05 13.26 8.75 11.04 10.25 20.61
P3 5.57 12.30 9.78 13.30 7.86 12.27 9.05 13.86 15.03 11.51 7.16 12.43
Effect Grain Straw
—————————————— ——————————————
SE (diff.) CD (p=0.05) SE (diff.) CD (p=0.05)
PxDxS 0.06 1.22 0.97 1.9
H. K. Deshmukh, V. K. Mishra, A. J. Deshmukh and Y. B.Taide

139
component in the system (Table 4). The results are in linewith Nair (1984) and Kang and Juo (1986) who reported
efficient cycling under tree based systems than many othersystems. Kumar (1996) also reported that higher net gainof available N, P and K in soil in Morus- soybean than Morus– wheat combination due to more release of nutrients and
cycling by Morus – soybean combination than Morus- wheat.
Effect of Pollarding Height on Biomass (leaf andbranches) Production of Grewia optiva
Analysis of the data in Table 5 reveals that leaf biomassenhanced with the increase in pollarding height, yet the
difference between P2 and P3 remained statistically non-
Table 3: Effect of direction of crop from tree row on yield ofsoybean
Crop direction Yield (qtl/ha)
Grain Straw
S1 (North aspect) 20.06 31.60
S2 (South aspect) 21.11 36.18
SE (diff.) 1.19 2.39
CD 0.005 2.43 4.86
Table 4: Amount of available N, P and K in soil before sowing and after harvest as well as their gain/depletion of associated crops viz.,wheat and soybean
Events Wheat Soybean
Available N Available P Available K Available N Available P Available K(kg ha-1) (kg ha-1) (kg ha-1) (kg ha-1) (kg ha-1) (kg ha-1)
Before sowing of crop 387.1 30.96 304.2 377.4 27.06 299.5
After harvest of crop 377.4 27.06 299.5 388.9 31.04 310.1
Gain (-) / Depletion (+) - - - + + +
significant. There was a gain of 67.66 % from P1 to P2 andP3 to P2.
The overall results shows that Leaf and branchbiomass were influenced significantly due to pollardingheight. The data for branch wood biomass (Table 5) shows
that P2 (pollarding at 3m) recorded the maximum biomassfollowed by P3 and P1(pollarding at 4.5 and 1.5mrespectively) . It is increased by 32.41 per cent from P1 to P2
and declined by 11.93 per cent with increase in pollardingheight from P2 to P3.
From the present studies, it can be concluded that that
the yield of both wheat and soybean responded negativelyto increasing pollarding heights from 1.5m to 4.5m andpositively to increasing distance of crop from tree rows (1m
to 3m). Besides both the crops performed better on southernaspects as compared to the northern. Leaf and branchbiomass were influenced significantly due to pollarding
height and were found to be recorded maximum at P2
followed by P3, however P2 and P3 were at par. This showsthat pollarding at 3m is relatively better height for pollarding
to form more sprouts and their growth.
REFERENCESDugma, B., Kang, B.T. and Akali, D.U.U. (1988) Effect of pruning
intensities of three woody leguminous species grown in alleycropping with maize and cowpea on an alfisol. Agrofor.Systems 6: 19-35.
Kang, B.T. and Juo, A.S.R.(1986) Effect of land clearing on soilchemical properties and crop performance. In: Lal, R., Sanchez,P.A. and Cummings Jr. R.W. (Eds.). Land Clearing andDevelopment in the Tropics. p. 383–394.
Khan, G.S. and Aslam, R.M. (1974) Extent of damage of wheat(Triticum vulgare) by shisham (Dalbergia sissoo).
Table 5. Effect of pollarding height on leaf and branchwood biomass production of Grewia optiva
Pollarding Leaf biomass Branchwood Total biomass
height (kg per tree) biomass (kg per tree) (kg per tree)
P1 3.37 13.42 16.78
P2 5.73 17.77 23.50
P3 5.65 15.65 21.30
SE ( diff.) 0.56 1.78 2.06
CD (p=0.05 1.25 3.96 5.03
Table 2. Effect of distance of crop from tree row on yield ofsoybean (q/ha)
Crop distance Yield q ha-1
Grain Straw
D1 (1m) 18.79 28.10
D2 (2m) 21.90 35.66
D3 (3m) 24.06 38.50
SE (diff) 1.46 2.93
CD (p=0.05) 2.99 5.96
Pollarding and Biomass in Grewia optiva

140
Proceedings of the Pakistan Forestry Conference (Nov. 4-8). Pakistan Forest Institute, Peshawar, pp.37–40.
Khybri, M.L., Gupta, R.K., Sewa Ram and Tomar, H.P.S. (1992)Crop yield of rice and wheat grown in rotation as intercropswith three tree species in the outer hills of Western Himalaya.Agrof. Syst. 17: 193–204.
Kumar, M. (1996) Bioeconomic appraisal of agroforestry land usesystems. M.Sc. Thesis, Dr. Y.S.Parmar University of Horticultureand Forestry, Solan, Himachal Pradesh.
Nair, P.K.R. (1984) Soil Productivity Aspects of Agroforestry. ICRAF,Nairobi, Kenya, 85 p.
Sheikh, M.I. and Haq, R. (1978) Effect of shade of Acacia nilotica(kikar/babul) and Dalbergia sissoo (shisham) on the yield ofwheat. Pakistan J. Forestry 28(2): 184– 185.
Yamoah, C.F., Agboola, A.A. and Wilson, G.F. (1986) Nutrientcontribution and maize performance in alley cropping systems.Agrof. Syst. 4:247– 254.
H. K. Deshmukh, V. K. Mishra, A. J. Deshmukh and Y. B.Taide

There is a major role of trees in meeting the basic
needs of the people and maintaining the ecological balance.Because of increasing demand of timber for wood basedindustries and dwindling supplies from forest areas, the
poor quality sites are required to be brought under treecover. Trees have the capacity to grow under stressfulenvironment conditions where crops cannot be grown
successfully. There lies a lot of opportunities to increaseproductive potential of poor quality lands by planting trees,which will help to sequester carbon in the woody biomass
in addition to increasing the soil organic carbon status andamelioration of sites. Therefore, the afforestationprogrammes should bring more and more wastelands,
degraded lands and other unusable lands under treeplantations.
Trees offer a significant potential to sequester
substantial quantities of atmospheric carbon, thus, formingan important option for mitigating change in climate.Deforestation is thought to be a source of 1.6 Pg C yr-1 but
the land not undergoing deforestation has large mitigationopportunity to stabilize greenhouse gases in the atmosphere(2 to 4 Pg C yr-1) (Scholes and Noble, 2001). Carbon is
stored in the foliage, stem, root system and soil under thetrees.Forest soil is one of the main sinks of carbon on earth.In India, the maximum soil organic carbon under different
forest species in 30 cm soil depth has been estimated inArunachal Pradesh (1702.08 million tonnes), whereas,Punjab ranks on the lower side (9.42 million tonnes) (Jha
Tree Growth, Organic Carbon and Nutrient Content of Soil underVarious Multipurpose Tree Species
Baljit Singh* and R. I. S. GillDepartment of Forestry and Natural Resources, Punjab Agricultural University, Ludhiana-141 004, India
*E-mail : [email protected]
Abstract: The effect of pure stands of seven tree species was studied on soil organic carbon (OC) and macronutrient (N, P and K)content of soil in Punjab. Tree plantations of 13-year-old Eucalyptus tereticornis (eucalyptus), Azadirachta indica (neem), Melia azedarach(dek), Dalbergia sissoo (shisham), Albizia lebbeck (siris), Leucaena leucocephala (subabul) and Acacia nilotica (kikar) spaced at 6 x3 m and adjoining open (control) area were selected for this study. Depthwise (0-15, 15-30, 30-45 and 45-60 cm) soil samples were takenrandomly from each plantation as well as control and analysed for soil OC and available macronutrients (N, P and K). After 13 years ofgrowth, eucalyptus, subabul and siris recorded higher diameter at breast height and height than the other tree species. The effects oflitterfall addition were significantly higher in the surface layer (0-15 cm) than the lower soil depths. The soil OC and nutrient contentdecreased with increase in depth irrespective of the tree species. In the surface soil depth, the OC increased by 90.4% under sirisfollowed by kikar (84.6%), shisham (82.2%) and subabul (80.9%) over control (8.53 Mg/ha). The OC content in the 0-60 cm soil profileunder the tree species varied from 30.0 Mg/ha under eucalyptus to 39.2 Mg/ha under kikar. The available nitrogen was higher underleguminous tree species subabul, siris, shisham and kikar (N: 167.6, 162.2, 158.6 and 155.9 kg/ha, respectively in surface layer) than theother tree species and control (120.1 kg/ha).
Key Words: Available nutrients, Growth parameters, Organic carbon, Soil depths
et al., 2003). The planting of trees on poor quality sites
(highly alkaline) have lead to production of wood and theiramelioration through the build of organic matter and therecycling of nutrients (Gill et al., 1987; Singh et al., 1997).
The effects of organic matter accumulation are higher onsurface than subsurface horizons. The quantity and qualityof litter produced by trees depend on the species, age of
trees and spacing ( Mohsin et al., 1996; Singh and Sharma,2007). Rate of decomposition of litter is directly related tothe soil moisture availability, soil micro-organisms and
physico-chemical properties.
Generally higher soil organic carbon and nutrientcontent under the trees have been observed than the
adjacent open sites in different states of the country underdifferent tree species such as Acacia auriculiformis,Eucalyptus tereticornis, Casuarina equisetifolia, Leucaenaleucocephala, Acacia nilotica, Bauhinia variegata, Albizialebbeck, Acacia catechu and Dalbergia sissoo (Gupta etal., 1991; Mathew et al., 1997; Kumar et al., 1998). However,
such studies are lacking in Punjab. The present study wastherefore conducted to study the effect of pure stands ofdifferent tree species on sequestration of carbon and
nutrient content in soils of Punjab.
MATERIAL AND METHODS
The study was carried out at Regional Station (RS) ofPunjab Agricultural University (PAU) at Bathinda, located in
the Indo-Gangetic alluvial plains in the south-western region
Indian J. Ecol. (2011) 38 (Special Issue) : 141-144Indian Journal
of Ecology

142
of Punjab at 30° 14" N latitude and 74° 57" E longitude. Theclimate of site is mainly characterized by a very hot summer,
a short rainy season and a very cold winter; it is arid withhigh variation between summer and winter temperatures.Summer season starts in March and continues till June,
the summer temperature can be as high as 47°C. Winterseason starts from November and extends till February andwinter temperature is as low as 0°C. The weather is
generally dry, but is humid from mid-May to the end of August.Rainfall is primarily from the south-west monsoons and isconcentrated in the period July to mid-September. The
average rainfall in the area is about 410 mm.
Tree plantations of 13 years old Eucalyptus tereticornis(eucalyptus), Azadirachta indica (neem), Melia azedarach(dek), Dalbergia sissoo (shisham), Albizia lebbeck (siris),Leucaena leucocephala (subabul) and Acacia nilotica(kikar) spaced at 6 x 3 m were investigated. The adjoining
open area without trees was taken as control site forcomparison of properties. These species were plantedduring July 1995 in monsoon season and gap filling was
done during July 1996 in almost all the species. The plantswere irrigated during summers of first year and secondyear and thereafter no irrigation or other management
practices were applied to the plantation. Growth parameters(tree height and DBH) of twenty five trees of each specieswere measured in the month of August 2008.
Depthwise (0-15, 0-60 cm) soil samples were takenrandomly from six points in each replications in each treespecies as well as from control. The samples were air
dried and ground to pass through a 2 mm sieve. Thesamples were analysed for soil organic carbon OC andavailable macronutrients (N, P and K)by following standard
methods. The data of different species were subjected tostatistical analysis using ANOVA technique in split plotdesign (SPD) by taking tree species (including control) in
main plots and soil depths in sub plots. Mean separationwas done with the least significant difference test at 5%level of significance.
RESULTS AND DISCUSSION
The growth parameters of trees recorded after 13 yearsof planting varied considerably (Table 1). Among the seventree species, DBH (cm) was heighest in eucalyptus (26.05)
followed by siris (25.03) and subabul (21.91). Shisham andkikar attained the lowest DBH growth (18.63 and 20.12,respectively). Similarly, eucalyptus attained the heighest
(23.6m) height followed by subabul (15.0m) and siris(14.7m) after 13 years of planting. Among the different treespecies, the species ranking was eucalyptus>siris>
subabul>neem>dek>kikar>shisham for DBH and
eucalyptus>subabul>siris>kikar>neem> shisham>dek forheight. The variation in growth characteristics of the treespecies might be due to different genetic makeup and thus
their variable growth potential as the environmentalconditions were similar for all the species in the study.
The soil organic carbon (OC) content decreased with
increase in depth irrespective of the tree species. The effectsof litterfall addition were highly pronounced in the surfacelayer (0-15 cm). In the surface soil depth, the highest
increase in OC status was under siris followed by kikar,shisham and subabul over control (8.53 Mg ha-1), whereasunder eucalyptus, the increase over control was the lowest
(Table 2). The total sequestration of organic carbon in the0-60 cm soil profile under the tree species varied from 30.0Mg ha-1 (33.7% in surface layer) under eucalyptus to 39.2
Mg ha-1 (40.2% in surface layer) under kikar and this contentwas significantly higher than OC in control treatment (27.1Mg ha-1) (Table 2). In a span of 13 years, the carbon
sequestration in 0-60 cm profile by trees varied from 2.9 Mgha-1 under eucalyptus to 12.2 Mg ha-1 in kikar over the control.
Available N content under tree species was higher than
the nearby site without trees (control) in all the soil depths.Amongst the various tree species, the N content was thehighest under subabul followed by siris and the lowest
content was present in eucalyptus followed by control insurface soil depth. The N content in 0-60 cm soil profilewas higher by 56.4 per cent under subabul, 55.8 per cent in
siris and 53.9 per cent in shisham over control (310 kg/ha)(Table 2). The increase was the lowest under eucalyptus(22.6%). As a whole, the N content was higher under the
leguminous tree species (subabul, siris, shisham andkikar) than other species when compared to control. Amongthe tree species the available P content was higher by 60.1
per cent under siris followed by 57.0 per cent under kikarand the lowest increase was observed under eucalyptus(23.9%) over control (20.0 kg/ha) in the surface soil depth.
The P content in 0-60 cm soil depth revealed significantlyhigher values under kikar, subabul, shisham and siris (99.3,95.7, 92.3 and 89.8 kg ha-1, respectively) as compared to
other tree species and control (Table 2). The available K
Table 1. Growth parameters of tree species after 13 years.
Tree species DBH (cm) Height (m)
Eucalyptus tereticornis 26.05±5.6 23.6±2.8
Azadirachta indica 21.21±4.8 11.3±1.1
Melia azedarach 20.96±3.9 10.0±1.5
Dalbergia sissoo 18.63±3.4 10.8±1.3
Albizia lebbeck 25.03±7.7 14.7±1.5
Leucaena leucocephala 21.91±3.8 15.0±0.9
Acacia nilotica 20.12±3.8 12.4±1.6
Baljit Singh and R. I. S. Gill

143
content was very high in control as well as under differenttree species than other nutrients; however, the available K
content under trees was significantly higher than control. Inthe surface soil depth, the available K content was thehighest under subabul and siris and the lowest content
was under eucalypt. But this was significantly higher thancontrol. Similarly, the increase in K content in all the soildepths (0-60 cm) varied by 4.06 (eucalyptus) to 9.52 per
cent (subabul) over control (1796 kg ha-1).
Soil under trees is a major store house of organiccarbon in comparison to other land use systems becauseof continuous addition of litterfall by trees.The higher build-
up of organic carbon on surface layers of soils under thevarious tree species may be attributed to the regularaccumulation of litterfall of tree species on soil surface and
fine roots turnover throughout the increasing age of trees.The subsequent decomposition of litterfall and itsincorporation into the soil with time might have helped in
raising the organic matter status of soil. Differentialbehaviour of the tree species in raising organic carboncontent may be ascribed to the addition of variable amount
of litterfall and fine roots and varying rates of decompositionof organic matter added through these tree species. Higherbuild up in organic carbon status under kikar, siris, shisham
and subabul may be due to the deciduous nature of thesespecies which shed whole of its leaves in winter seasonwhereas eucalyptus is an evergreen tree species. In
addition to that, eucalyptus has thick and leathery leavesand high polyphenol content, thus, its incorporation into thesoil may not be as quick as of above leguminous tree
species. Higher build-up of available nutrients (N, P and K)on surface layers under tree species is attributed toaccumulation and decomposition of litterfall on the soil
surface as well as its incorporation in the soil surface layers.It leads to mineralization of organic N and P from the litter
and its release into the soil. Higher availability of K at surfacelayers under trees is attributed to liberation of K by
decomposition process of litterfall as well as solubilizationof insoluble forms of K present in soil due to organicdecomposition products. Contractor and Badanur (1996);
Mathew et al. (1997) and Kumar et al. (1998) observed thatavailability of N, P and K was higher on surface layers thansubsurface horizons under different tree species and it
decreased gradually with depth. Ohta (1990) observed anenhanced capacity of inorganic N and P supply even inyoung tree plantations in spite of the decrease of the total Ncontent compared with the grassland soil in 0-5 and 5-10
cm soil layers. This was associated with the addition offresh organic matter rich in readily mineralizable N, whichleads to the increased activity of soil fauna at the same
time. The differences in available nutrient content underdifferent tree species might be due to variation in nutrientconcentration of litter, total litter production and varying rates
of mineralization in these species. The leguminous speciesat this site (shisham, siris, subabul and kikar) had higher Ncontent in the soil under these tree species as compared
to non-leguminous (eucalyptus, dek) tree species. The Pand K content under these species was also higher thanthe other. Their leaves decompose at a faster rate than
eucalypt and have higher N content than eucalypt. Gill et al.(1987) and Patel and Singh (2000) reported lower N contentunder eucalyptus as compared to other species.
The poor quality sites can be used for wood productionby planting trees because the demand of wood and woodproducts is increasing and their supplies are decreasing.
In addition, trees ameliorate these sites and mitigate theclimate change through sequestration of carbon in the soil-biomass system. The addition of litterfall and roots of the
tree species improve the soil organic carbon and nutrientstatus, thus improving the site properties which can be
Table 2. Soil OC and nutrients (0-15 and 0-60 cm soil depths) under different tree species after 13 years of plantation
Tree species Organic carbon Available nutrients (kg ha-1)
(Mg ha-1)
N P K
0-15 0-60 0-15 0-60 0-15 0-60 0-15 0-60
Eucalyptus tereticornis 10.10 30.0 124 380 24.8 79.2 543 1869
Azadiracta indica 11.72 33.6 133 392 27.2 80.6 572 1915
Melia azedarach 12.81 33.4 140 406 25.1 78.8 566 1915
Dalbergia sissoo 15.54 38.9 159 477 29.5 92.3 588 1950
Albizia lebbeck 16.24 39.1 162 483 32.0 89.8 593 1959
Leucaena leucocephala 15.43 38.5 168 485 29.7 95.7 599 1967
Acacia nilotica 15.74 39.2 156 456 31.4 99.3 585 1945
Control 8.53 27.1 102 310 20.0 68.6 505 1796
CD (P=0.05) 2.01 2.48 13.3 29.3 3.72 6.66 26.8 50.2
Multipurpose Tree and Soil Properties

144
utilized further for production of crops after harvesting oftrees.
REFERENCES
Contractor, R.M. and Badanur, V.P. (1996) Effect of forest vegetationon properties of a vertisol. J. Indian Soc. Soil Sci. 44: 510-511.
Gill, H.S., Abrol, I.P. and Samra, J.S. (1987) Nutrient recycling throughlitter production in young plantations of Acacia nilotica andEucalyptus tereticornis in a highly alkaline soil. For. Ecol.Manag. 22: 57-69.
Gupta, M.K., Jha, M.N. and Singh, R.P. (1991) Organic carbon statusin silver fir and spruce forest soil under different silviculturalsystems. J. Indian Soc. Soil Sci. 39: 435-440.
Jha, M.N., Gupta, M.K., Saxena, A. and Kumar, R. (2003) Soil organiccarbon store in different forests of India. Indian For. 129:714-724.
Kumar, R., Kumar, A. and Dhillon, R.S. (1998) Morphological andphysico-chemical characteristics of soils under differentplantations in arid ecosystem. Indian J. For. 21: 248-252.
Mathew, T., Suresh Babu, K.V., Maheswaran, K.V. and Kumar,B.M. (1997) Chemical properties, soil moisture status and litterproduction influenced by the growth of MPTs. Indian J. For.20: 251-258.
Mohsin, F., Singh, R.P. and Singh, K. (1996) Nutrient cycling ofpoplar plantation in relation to stand age in agroforestry system.Indian J. For. 19: 302-310.
Ohta, S. (1990) Initial soil changes associated with afforestationwith Acacia auriculiformis and Pinus kesiya on denudedgrasslands of the Pantabangan area, Central Luzon, thePhilippines. Soil Sci. Pl. Nutr. 36: 633-643.
Patel, N.L. and Singh, S.P. (2000) Effect of different tree species onsite amelioration. Indian J. For. 23: 192-196.
Scholes, R.J. and Noble, I.R. (2001) Storing carbon on land. Sci.294: 1012-1014.
Singh, B. and Sharma, K.N. (2007) Tree growth and nutrient statusof soil in a poplar (Populus deltoides Bartr.)-based agroforestrysystem in Punjab, India. Agrof. Syst. 70: 125-134.
Singh, G., Singh, N.T., Dagar, J.C., Singh, H. and Sharma, V.P. (1997)An evaluation of agriculture, forestry and agroforestrypractices in a moderately alkali soil in northwestern India. Agrof.Syst. 37: 279-295.
Baljit Singh and R. I. S. Gill

145
The government of Andhra Pradesh and Tamilnadujointly constructed one irrigation project called TeluguGanga Irrigation Project with a view to provide 15 TMC ofdrinking water to Chennai city besides irrigating about 5.75
lakhs ha in drought effected districts of Rayalaseema.During the course of construction of reservoirs and canalsabout 3921.40 ha reserve forest area in Nellore district is
diverted and government has transferred 9758 ha of non-forest area for compensatory afforestation. During theperiod from 1990-95 the forest department has planted
around 49 tree species which included some of the primaryand secondary tasar food plants such as Terminalia arjuna,T. elata, T. bellerica, Syzygium cuminii, etc. to the extent of
6930 ha. In most of the plantations, species are planted inintimate mixtures. During 2005-06, Regional TasarResearch Station (RTRS), Warangal with a view to provide
additional income to VSS members conducted studies ontasar rearing on trial basis.
Indian Tasar silk industry has two major components
viz., tropical and temperature tasar. Tasar culture activitiesas whole is grouped into sectors – pre and post cocoonsectors. The precocoon sector mainly involves the tasar
silk worm rearing on foliage of T. arjuna (arjun), T. tomentosa(asan) and Shorea robusta (sal) to produce cocoons.Culturing of Tasar silkworm commercial races, Daba and
Sukinda, is mainly done by 1.28 lakh tribal families all overIndia. More than 0.03 lakh families are benefited withaverage net income of Rs. 2,950/- and gainful employment
of 30 man days (per season) in Andhra Pradesh (Yadav et
Terminalia arjuna – A Fast Growing Forest Species and a Source ofLivelihood to Vana Samrakshana Samithi Members
P. Jaya Prakash, R.S. Jaikishan Singh, B.V.Sanjeeva Rao, M.Vijay KumarRegional Tasar Research Station, Central Silk Board, Warangal, Andhra Pradesh, India
*E-mail : [email protected]
Abstract: Studies confirm that out of 10 forest flora raised under Telugu Ganga compensatory afforestation scheme in Nellore district ofAndhra Pradesh, Pterocarpus santalinus, Emblica officinalis, and Terminalia arjuna attained the maximum plant height (m) as 8.21, 7.54and 6.75 after six years of plantation, respectively. T. arjuna topped the list of species studied in attaining girth at breast height (GBH) (35cm). One hectare economic block plantation of arjuna raised at the expense of Rs. 17,575/- can be exploited for 450 dfls rearing of tasarsilkworm after 4 years of gestation period. Silkworm rearing is an eco-friendly activity that consumes 11.25 MT leaf biomass out of totalproduction 14.50MT/ha and ejects 5.63 MT of litter, which replenishes nutrients and improve edaphic conditions of soil. Under TeluguGanga afforestation programme the forest department has raised different species of forest plantation to the extent of 6930 ha and T.arjuna was predominant as monoculture and mixed plantation. The plantations are maintained by 100 Vana Samrakshana Samithis (VSS).Trial rearing of tasar silkworm A. mylitta D. on T. arjuna plantations revealed that 12800 to 14500 cocoons are produced/ha/season andthe income per Vana Samrakshana Samithi member ranges between Rs 2500 to Rs 3000/- in a period of one month. On site training andtechnology dissemination with sound extension backup will double the income of VSS members through tasar culture.
Key Words: Terminalia arjuna, T. tomentosa, Tasar silkworm, VSS, Technology, GBH
al., 1998). During 2006-07, Andhra Pradesh stood fifth
among traditional states in tasar raw silk production byrecording 15.50 MT against total country production 350MT.
The plantations of tasar host flora, arjun and asan are
mainly raised through seeds and to a limited extent through
vegetative propagation i.e. air layering, cuttings, saplings
etc. Natural regeneration of this flora is difficult as bark and
seed of this species are being utilized as medicines. Further
due to hard pericarp, germination is slow (25-35%) and
erratic in case of asan and arjun under natural conditions.
Artificial regeneration are carried out through standardized
nursery techniques, which can improve the quick and
uniform germination to the tune of 80-90 per cent (Sinha et
al., 2007).
Basically Tasar silkworm rearing has been practiced
in natural forest areas dating back to decades. But due to
tremendous pressure on land and shrinking of forest area,
the green wealth of arjun and asan is vanished gradually
near the dwellings of arboringalls. Even tasar silk growers
hardly found any forest patch with enough plant density for
profitable tasar silkworm rearing. Further they face many
hardships in rearing on forest patches with scanty and
unmanageable heights of tasar host flora. It is on this back
drop the concept of raising economic plantation has come
into picture. Raising of block plantation with asan and arjun
is carried through nurseries. The present study was
conducted to study the rate of success of seed germination
Indian J. Ecol. (2011) 38 (Special Issue) : 145-148Indian Journal
of Ecology

146
and establishment of species and the relative growth leafand branches biomass production of Terminalia spp. in
Warangal and Nellore districts.
MATERIAL AND METHODS
The experiments were conducted at nursery of RegionalTasar Research Station, Warangal in Andhra Pradesh. The
climate is semi arid and monosoonic. The mean maximumand minimum daily temperature of the study month (June-July, 2006) were 33.5° and 23.5° C respectively. The average
rainfall was recorded 900mm during the investigation. Arjunand asan seeds were collected from four districts duringApril month. 50 bigger size trees of each species were
selected from each district. Seed parameters namely seedweight, length, diameter, wing width, germination, periodfor germination and survival were recorded. The seed
samples of each species collected location wise werestored at the onset of monsoon (June-July). The seedsamples of arjun and asan soaked in water for duration of
96 and 48 hrs, respectively and after soaking, the seedswere heaped sample wise under tree shade. The heapswere covered with wet gunny cloth and watered till
germination. The germinated seeds were sorted out dailyand sown individually at a depth of 3-4 cm in polybags of 25cm x 11 cm filled with rooting media (FYM:Soil:Sand 3:2:1).
Watering was carried out regularly once in a day.Observations on seedling survival (%) were recorded 120days after germination.
One hundred trees of each species were taken forrecording observations on plant height (m), crown diameter(cm), collar diameter (cm), diameter at breast height – DBH
(cm), per cent survival at the age of 5th, 6th and 7th year oftransplantation. After 7 years planting in 4x4’ and 6’x6’ plots,
10 trees of each species were harvested for total biomassproduction consisting of dry yield of branches and foliage.Foliage and branches biomass (kg/tree) harvested was
converted into per hectare production.
RESULTS AND DISCUSSION
Observation on seed morphology of arjun and asanwere presented in Table 1. Seeds of arjuna were 2.75-4.89
cm long with 5-8 narrow wings, which were 0.55-1.32 cmbroad. Seed weight was 2.05-3.27 gm. Asan seed length,wing width and weight was measured as 3.60-6.63cm, 1.25-
1.95cm and 1.75-2.40 gms, respectively. Seed germinationinitiated on 12th day of soaking and lasted for 30.00 dayswith mean period of 17.00 days.
The overall germination per cent in arjun seeds varied
from 39.36-85.60 per cent with an average of 67.66 per cent
(Table 1). Maximum arjun seed germination (85.60%) and
seedling survival (89.90%) were recorded from seed sample
weighed for 3.27 gms. Almost similar trends were also
observed in asan. In case of asan, the germination per cent
was comparatively low 30.75-60.75 per cent with an average
of 43.51 per cent. Asan seedling survivability too recorded
very low 24.50-76.30 per cent with mean of 47.53 per cent.
The data on growth indices viz. plant height, DBH, collar
and crown (canopy) diameter of asan and arjun recorded
on 5th, 6th and 7th year of establishment are given in Table 2.
A maximum plant height was recorded in arjun (4.08m)
followed by asan (3.62m) at the age of 7th year. An steep
P. Jaya Prakash, R.S. Jaikishan Singh, B.V.Sanjeeva Rao, M.Vijay Kumar
Table 1. Details of seed parameters of Terminalia spp. collected from different locations
Tree species Location Seed Seed Seed Wing Seed Period for Survival(District) weight length diameter width germination germination (%)
(gm) (cm) (cm) (cm) (%) (days)
Terminalia Chinnoor 2.05 4.00 6.38 0.65 76.92 27.50 78.90arjuna (arjun) (Adilabad distt.)
Mahadevpur 3.27 4.89 7.41 1.32 85.60 12.00 89.90(Karimnagar dist.)Jakaram 2.15 2.76 6.48 0.59 39.36 30.00 47.00(Warangal dist.)Rapur 2.91 4.10 6.85 0.55 68.75 14.00 90.00(Nellore dist)
Mean 2.56 3.94 6.78 0.78 67.66 20.87 76.50Terminalia Chinnoor 1.95 6.63 7.17 1.36 60.75 13.00 76.30tomentosa (asan) (Adilabad dist.)
Mahadevpur 2.35 3.60 9.18 1.95 42.35 15.00 58.99(Karimnagar dist)Jakaram 1.75 4.75 10.60 1.25 30.75 19.00 30.15(Warangal dist)Rapur 2.40 6.10 8.15 1.63 40-00 21.00 24.50(Nellore Dist.)
Mean 2.08 5.27 8.18 1.55 43.51 17.00 47.53

147
Table 2. Relative growth performance of Terminalia spp. in Warangal district
Growth parameter Arjun Asan
Fifth year Sixth year Seventh year Fifth year Sixth year Seventh year
Plant height (cm) 290 325.19 408.95 264.38 308.00 362.66(121-383) (177-400) (219-516) (90-327) (191-386) (133-433)
DBH (cm) 4.00 5.59 7.96 5.73 6.85 8.10(2.31-5.90) (3.00-7.70) (2.80-13.00) (4.80-7.00) (6.00-9.85) (6.75-9.50)
Collar diameter(cm) 09.38 8.43 9.44 09.22 8.76 11.43(8.10-10.65) (7.60-9.10) (5.66-9.83) (7.80-10.30) (4.51-12.00) (5.81-12.00)
Crown diameter(cm) 49.36 63.22 79.57 53.00 57.86 67.46(20.00-90.70) (33.70-101.00) (66.15-112.10) (22.17-87.00) (38.16-79.66) (49.29-101.76)
Survival (%) 93.45 89.00 87.73 67.77 65.75 65.77
* Figures in parenthesis indicate range
Table 3. Details of biomass production/ha in arjun and asan plantations (7th year)
Biomass Arjun Asan
4x4’ 6x6’ 4x4’ 6x6’
Kg/tree MT ha-1 Kg/tree MT ha-1 Kg/tree MT ha-1 Kg/tree MT ha-1
Leaf 2.80 19.00 3.00 9.15 2.40 16.75 3.56 10.75Branches 5.75 38.66 9.00 27.22 7.50 49.75 11.75 35.55Total 8.55 57.60 12.00 36.30 9.90 66.50 15.32 46.30
Terminalia arjuna for Livelihood Security
rise in plant height was observed in arjuna plantation. Collardiameter was recorded as in case of asan (11.43 cm) and
arjun 9.44 cm at 7 years age of plantation. Canopy (crown)spread was maximum in case of arjun (79.57 cm) with arange of 66.15-112.00 cm. Natural tendency of arjun caused
more canopy spread than asan. Diameter at breast height(DBH) is not much varied among species studied.
Survival percentage recorded at 7 years age of
plantation was substantially high (87.73%) in arjun and thanin asan (65.77%). Similar observation of survival percentagewere recorded in plantations of 5th and 6th years age. Poor
survival of asan was mainly due to inherent geneticalcharacters and abiotic stress.
Data on biomass production (leaf and branches)
presented in Table 3 revealed that the total biomass
production was obtained more in arjun and asan plantation
at 4x4’ spacing, when compared to 6x6’ plantation. This
may be due to availability of more no. of plants in one ha at
4x4’ spacing. Hence raising of block plantation at 4x4’ is
more economical in terms of leaf production for tasar
silkworm rearing. Wider spacing was found uneconomical
as leaf yield per unit area is greatly reduced due to
accommodation of less no. of plants. However, asan at
6x6’ spacing reported ideal for economic plantation. Ojha
and Pandey (2004) observed that arjun and asan foliage is
highly palatable feed to tasar silkworm races. It is estimated
that 39-61 per cent of biomass intake is ejected as litter by
Daba and Sukinda tasar eco-races, the highest of 61 per
cent in case of arjun and lowest of 39 per cent in sal. 300
dfls of tasar silkworm rearing would consume 11.25 MT of
leaf biomass, eject 5.63 MT of litter and in turn produce
15,000 cocoons weighing 240 kgs.
Arjuna plantation in 138 ha can effectively be utilized for62,100 dfls of tasar silkworm rearing with anticipated cocoon
production of 24.850 lakhs in one season in Nellore district.The total tasar raw silk production can be anticipated around2.55 MT per season. It is advised to take every alternate
crop in a hectare providing gap for regeneration of leaf.
Participatory Training Through Trial TasarRearing
Regional Tasar Research Station, Warangal had
conducted trial rearing with 2650 dfls by involving 16 VSS
members as stake holders. Besides forest officials were
also made well versed with recent techniques of tasar silk
worm rearing during 2005-06, 2006-07 and 2007-08 in
Nellore district (Table 4). Integrated package of rearing
technology (IPR) evolved by CTR&TI, Ranchi had been
disseminated in field i.e., spray of 1.5 per cent urea solution
of foliage for quality leaf improvement, spray of sodium
hypochlorite (0.01%) on worms to prevent spread of disease
and spray of leaf surface microbe solution for viral and
bacterial disease of silkworm.
Tasar cocoon yield per 100 dfl rearing was recorded inthe range of 2650-4267 with an average of 3030. Each
member fetched net income of Rs 3350-00 with range ofRs 2550/- to Rs. 4389/-. The B:C ratio has been arrived at7.50 to 8.75 net income was estimated higher (Rs 4389/-)

148
even though the cocoon yield recorded lower. The reason
may be due to higher prices offered by bidders for quality ofcocoons. Silkworm rearing with IPR technology may improve
cocoon yield up to 10-15 dfl over the yield of traditional
rearing, which in turn fetches more income of Rs 2,300/-
per season. Employment generated was 52 man days in
case of 200 dfl rearing from one ha area. An investment of
about Rs 200/- can bring a return of about Rs. 1750/- with in
35 days of silkworm rearing in natural forest (Anonymous,
2005), whereas, silkworm rearing with 450 dfls in economic
block plantation can fetch Rs 12,425/- to Rs. 14,950/- per
ha.
It is on this back drop, the tasar silk rearing can be
undertaken since it proved profitable and source of gainful
employment in Nellore district.
REFERENCESAnonymous (2005) Production, economics and Marketing. In:
Monograph on Tropical Tasar Silkworm (eds.) N.Suryanarayana and A.K.Serivastava), pp. 96-110.
Ojha, N.G. and Pandey, P.N. 2004. Silk Production (Role of Feed onTasar Silk and EggProduction), APH Publishing Corporation,Ansari Road, Darya Ganj, New Delhi -110 002, India.
Yadav, G.S., Reddy, K.J., Roy, G.C., Singh, B.M.K. and Sinha, B.R.R.P.(1998) Tasar silk industry in Vidarbha. Indian Silk 36(10):13-18.
Table 4. Tasar silkworm rearing and economical performance in Nellore district, AP
Year VSS Dfl(s) Effective Cocoons Cocoon Total (Rs.) Income per
members reared rate of harvested yield/100 gross 100 dfls
covered (Nos.) rearing (Nos.) dfl income (Rs.)
2005-06 03 300 46.00 12,80 4267 9890 3000
2006-07 03 350 51.00 14,50 4145 10150 2850
2007-08 10 2000 39.75 53,00 2650 48790 4389
Total 16 2650 — 80,30 3030 68830 3350
P. Jaya Prakash, R.S. Jaikishan Singh, B.V.Sanjeeva Rao, M.Vijay Kumar
Approximately 2.4 billion people currently use woodand other forms of biomass for cooking and heating. The
demand for fuel wood is leading to deforestation, which willspeed up global warming. Although this crisis seems to beuncontrollable but there are number of ways to control and
stop fuel crisis. One of the methods is to make more fuelwood available by planting fast growing fuel wood trees.Tree species with high coppicing ability are very useful as
they keep producing new wood every time they are cut. Ifplanned carefully and wisely plantation of trees in wastelands provide a variety of products that may be used by
farmers or sold (Nandeshwar et al., 2006). The initial stepfor reclamation of waste lands is to identify the suitableplant species, which can grow on such land (Das et al.,2007). The reclamation of waste land faces problems asmicrobial deficiency creates problems in establishmentsof the plants. The use of biofertilizers for reclamation leads
to achieve the fertility of barren dumps in very short time(Dubey et al., 2006). VAM fungi benefits growth of plantsspecifically for the nutrient supply for the roots of the
colonizing plants (Marschner and Dell, 1994; Smith andRead, 1997). VAM are much more wide spread and canform association with most herbaceous and many woody
species (Neeraj, 1982). Mycorrhizal strains and hostspecies interact to determine the amount of infection andthe level of colonization. Strains giving good growth
responses with one plant species are generally effectivewith others but differ in potentiality and tolerance to stresses.Therefore, inoculation with a suitable VAM fungal strain to
Screening and Selection of VAM Fungi for Fast Growing FuelWood Trees
Reena Kulshrestha and Shama Afroze Baig* Rungta Dental College, Kohka-Kurud, Bhilai, Chhatisgarh, India
*Govt.Eklavya Mahavidyalaya, Doundi-Lohara, Durg, Chhatisgarh, India*E-mail: [email protected]
Abstract: The consumption of fuel wood is very high in India, but the production of fuel wood has not been able to keep pace withrequirements, the prices of fuel wood during last 40 years have shown an abnormally high increase. Because of the escalating prices ofpetroleum products and the rising demands, a stage has reached where fuel woods can be economically farmed with inputs of selectedspecies and varieties of plants and biofertilizers. Programmes of reclamation of wastelands are in progress but success is low due tovarious reasons. Vesicular arbuscular mycorrhizae enable the plants to grow and survive better under stress conditions. Selection ofefficient VAM fungi can help in enhancing the ‘P’ supply as well as other micronutrients. A pot experiment was designed to screen andselect the suitable VAM inoculants for fuel wood trees i.e., Acacia arabica, Cassia fistula and Leucaena leucocephala for whichseedlings were raised in sterilized soil inoculated with 11 different VAM fungi belonging to Acaulospora, Glomus and Sclerocystis. After150 days of growth three consecutive best inoculants were selected for each plant on the basis of their better effect on plant height, drybiomass and root colonization as compared to control.
Key Words: Fuel wood, VAM fungi, Biofertilizers, Wasteland, Reclamation, Dry biomass
improve the growth and survival of seedlings in aforestationprogrammes is very essential (Reena and Bagyaraj, 1990;
Jamalluddin et al., 2001). The role of VAM fungi in improvingthe quality and survival of plant seedlings after plantationhas been well recognized (Kaushik et al., 1992; Khan and
Uniyal, 1999). Bearing all this in mind, the present studywas undertaken to determine the effect of VAM fungi on thegrowth performance of three multipurpose fast growing fuel
woods trees, Acacia catechu, Cassia fistula and Leucaenaleucocephala.
MATERIAL AND METHODS
A pot experiment was done under sterilized soil
condition to evaluate the effect of VAM fungi, which was purecultured and mass multiplied in lab for screening its effecton fast growing fuel wood trees i.e., Acacia catechu, Cassiafistula and Leucaena leucocephala in nursery conditions.Polybags of 2kg capacity were used for the study and filledwith sterilized black cotton soil : compost: sand mix (8:1:1)
autoclaved at 15 lbs, 1210 C, 3 h. Each VAM inoculants (175–200 spores 100gm-1 soil) were added by placing it just 3cm below the seed sowing level. The uninoculated control
set was also treated in the same way without any inoculums.The mature and dried seeds of similar weight of the threehost species were surface sterilized with HgCl2 (0.01%)
and 5 seeds/pot were sown in each of 10 replicates. Aftergermination, single seedlings were maintained for betterperformance. Plants at the age of 150 days of growth were
harvested and observations were recorded for shoot height,
Indian J. Ecol. (2011) 38 (Special Issue) : 149-151Indian Journal
of Ecology

150
dry biomass, VAM infection, per cent root colonization and
spore count. Simple biological norms were considered for
studying the Plant height. Dry weight of plant samples was
determined after drying it at 600 C up to the level of constancy.
VAM infection was assessed by Root Clearing & Staining
Technique (Phillips and Hayman, 1970) and per cent root
colonization was determined by Kormanik and Mc Graw
Side Method (1982). VAM spores were isolated by ‘Wet
Sieving and Decantation Technique” (Gerdermann and
Nicholas, 1963) and estimation was done by method of
Gaur and Adholeya (1994). Data observed were and analysed
statistically.
To determine the effect of these inoculants as isolated
from respective trees following inoculants were used for
three hosts:
1. Acacia catechu - Acaulospora dilatata, Acaulosporalaevis, Glomus aggregatum, Glomus fassiculatum andSclerocystis microcarpus.
2. Cassia fistula – Glomus macrocarpus, Glomusmosseae, Acaulospora laevis, Acaulospora longulaand Glomus hoi.
3. Leucaena leucocephala- Glomus macrocarpus,Glomus mosseae, Glomus geosporum andSclerocystis sinuosa
RESULTS AND DISCUSSION
Three genera of VAM fungi, i.e. Acaulospora, Glomus &Sclerocystis isolated and purified from the rhizosphere of
Acacia catechu, Cassia fistula and Leucaena leucocephalawere screened for growth parameters in the respective hostplants.
The success of VAM inoculation was exhibited by thepresence of vesicular-arbuscular structures within the rootsystem in all the host plants experimented, though a visible
difference was found in their root colonization pattern.Increase in VAM spore numbers was found in accordanceto percent root colonization in all the three host plants as
shown in Table 1, 2 and 3. The results of the response of A.catechu inoculated with 5 different VAM fungi is shown inTable 1. It is evident from the table that the Glomusaggregatum showed a maximum significant increase inheight (74.00 ± 4.16) as compared to uninoculated control,Dry biomass of shoot was enhanced maximally over control
when inoculated with G. aggregatum (15.19±1.62) followedby A. laevis and G. fassiculatum, respectively. The effect ofVAM inoculantion after 150 days on C. fistula is shown in
Table 2. A. laevis showed a maximum significant increasein height (57.00±2.64) and shoot dry mass (19.33±1.50) ascompared to the other VAM fungi and uninoculated control,
G. macrocarpum and G. hoi also showed increase in plant
Table 1. Effect of VAM fungi on per cent root colonization, spore count, growth and biomass in Acacia catechu
S.No. VAM fungi % Root Spore count Shoot height Dry shoot biomass
colonization per 100g soil (cm) (gm)
1 Uninoculated control 00 00 53.50 ± 4.18b 11.66 ± 0.43 b
2 Acaulospora dilatata 74 121 63.10± 3.46ab 13.11 ± 1.62 ab
3 Acaulospora laevis 84 167 68.20± 1.48 ab 14.48 ± 0.43 ab
4 Glomus aggregatum, 93 185 74.00± 4.16 a 15.19 ±1.62 a
5 Glomus fassiculatum 80 172 65.40± 2.02 ab 13.54 ± 1.01 ab
6 Sclerocystis microcorpus 62 97 59.70± 2.14 b 12.71 ± 0.64 b
(Values without common letters differs significantly at P= 0.01, Duncan;s Multiple Range Test)
Table 2. Effect of VAM fungi on per cent root colonization, spore count, growth and biomass in Cassia fistula
S.No. VAM fungi % Root Spore count Shoot height Dry shoot biomass
colonization per 100g soil (cm) (gm)
1 Uninoculated control 00 00 39.33 ± 1.31c 10.66 ± 1.15 c
2 Acaulospora laevis 97 154 57.00± 2.64a 19.33 ± 1.52 a
3 Acaulospora longula 69 109 46.19±1.82 abc 13.12 ± 1.00 abc
4 Glomus macrocarpum 81 182 53.48± 1.15 ab 15.33 ±3.51 ab
5 Glomus mosseae 67 87 47.36±0.67 abc 14.00 ± 3.46 abc
6 Glomus hoi 73 106 51.33± 1.73 bc 16.33 ± 3.78 bc
(Values without common letters differs significantly at P= 0.01, Duncan;s Multiple Range Test)
Reena Kulshrestha and Shama Afroze Baig

151
height and shoot dry biomass respectively over control.Result of 4 VAM inoculants on L. leucocephala are shownin Table 3. It showed a maximum signifant increase in shoot
height (60.30±4.16) and shoot dry mass (17.55±0.53) ascompared to control followed by S. sinuosa and G. mosseae.Present findings are also in according with earlier reports
suggesting the importance of VAM fungi in producing qualityseedlings positive growth effect and nutrient uptake byplants in different soils (Abdel-Hanej and Abdel-Monsief,
2006; Al Zalzaleh et al., 2009). Very little is known of thecompetitive ability of the strains because they are hard toidentify & cannot be grown in culture. At the moment,
competitive strains are selected empirically on the basis ofplant growth response to inoculations. If the plants respondsthe strain is considered competitive & is selected (Reena
and Bagyaraj, 1990 and Jamaluddin et al., 2006). It hasalso been reported in the study that the different VAM fungiincreases growth of plants to different extent.
All the inoculations have a significant marked effect onthe growth of Acacia catechu, Cassia fistula and Leucaenaleucocephala seedlings compared to the control
uninoculated in which a very small growth effect wasobserved. On the basis of plant height and dry biomass G.aggregatum, A. laevis, G. macrocarpum were selected as
the best VAM fungi for the inoculation of Acacia catechu, C.fistula and L. leucocephala respectively. It is evident fromresults that Glomus strains have given better performance
in all the three trees species. Since this experiment wasdone at nursery level, selection of three VAM inoculantswould be of immense imporatance for the development of
biofertilizer package for the fuel wood tree species in future.
REFERENCESAbdel–Hanej, A.A.A. and Abdel- Monsief, R.A.(2006) Effect of VAM
inoculation on growth yield and nutrient content of Cantaloupand cucumber under different water regimes. Res. J. Agric.and Biol. Sci. 2: 503-508.
Al-Zalzaleh,H.A., Al-Zalzaleh, M.A. and Mathew,A.R. (2009) VAMinoculation for selected ornamental plants in Bioremediated
and agricultural soils. European J. Scientific Res. 25: 556-559.
Das D.K., Chaturvedi, O.P., Mandal, M.P. and Kumar, R. (2007)Reclamation of degraded soil through tree plantation- litter andfertility change. Indian For. 133(5): 647-654.
Dubey, K. Singh V.K., Mishra, C.M. and Kumar, A. (2006) Use ofBiofertilizer for reclamation of silica mining area. In: (ed. R.I.Barnhisel) Proc. Billings Land Reclamation Symposium, June4-8, Lexington, pp. 176-181.
Gerdemann, G. W. and Nicolson, T. H. (1963) Spores of myc-orrhizalendogone species extracted from soil by wet sieving anddecanting. Transaction British Mycol. Soc.y 46: 235- 224.
Gaur, A. and Adholeya, A. (1994) Estimation of VAMF spores in soil:a modified method. Mycorrhiza News 6 (1): 10-11.
Jamaluddin, A. Chandra, K.K. and Goswami, M.G. (2001)Effectiveness of various types of VAM inocula on growth andbiomass of Bambusa nutans. Mycorrhiza News 12: 15-17.
Kaushik, A., Dixon, R.K. and Mukerji, K.G. (1992) Vesicular-arbuscular mycorrhizal relationships of Prosopis juliflora andZizipus jujuba.Phytomorphology 42:133-147.
Khan, S.N. and Uniyal, K. (1999) Growth response of two speciesto VAM and Rhizobium inoculations. Indian For. 125: 1125-1128.
Kormanik, P.P. and McGraw, A.C. (1982) Quantifica-tion of vesicular-arbuscular mycorrhizae in plant roots. In: Methods andPrinciples of Mycorrhizal Re-search, Ed. by N. C. Shenck,Ame. Phytopathol Soc.37-45.
Marschner, H. and Dell, B. (1994) Nutrient Uptake in mycorrhizalsymbiosis. Plant and Soil 159:89-102.
Nandeshwar, D.L., Vijayraghavan, A. and Mamta Meshram (2006)Performance of different multipurpose tree species indegraded land of Satpura region of Madhya Pradesh. IndianFor. 132: 205-210.
Neeraj (1992) Better uptake of nutrients in transplantation crops byinoculums of endomycorrhizal and potential biological fixingorganisms. Ph.D. Thesis, pp. 29-30.
Phillips, J. N. and Hayman, D. S. (1970) Improved procedures forclearing roots and staining parasitic & vesicular arbuscularmycorrhizal fungs for rapid assessment of infection. Trans.Brmycol. Soc. 55:158-161.
Reena, J. and Bagyaraj, D.J. (1990) Response of Acacia niloticaand Calliandra calothyrus to different VA mycorrhizal fungi.Arid Soil Research and Rehabilitation 4: 261-268.
Smith, S. E. and Read, D.J. (1997) Mycorrhizal Symbiosis, AcademicPress , San Diego, USA.
Table 3: Effect of VAM fungi on per cent root colonization, spore count, growth and biomass in Leucaena leucocephala
S.No. VAM Fungi % Root Spore Count Shoot height Dry shoot biomass
colonization per 100g soil (cm) (gm)
1 Uninoculated control 00 00 46.70 ± 3.12b 13.70 ± 2.03 b
2 Glomus geosporum 58 91 52.10± 4.18b 15.73 ± 0.02 b
3 Glomus macrocarpum 98 187 60.30± 4.16 b 17.85 ± 0.53 a
4 Glomus mosseae 63 116 54.50± 1.48 ab 16.37 ±0.20 ab
5 Sclerocystis sinuosa 72 132 55.40± 3.46 ab 17.61 ± 3.46 ab
(Values without common letters differs significantly at P= 0.01; Duncan’s Multiple Range Test)
VAM Fungi for Fast Growing Fuel Wood Trees

Dalbergia sissoo (shisham), is one of the most
important commercial tree species in Indian sub-continent
and known for high valued timber. Due to massive
exploitation in the past decades and large scale mortality in
the recent past of shisham, its supplies have dwindled to
great extent. To counter the threat to its survival, intensive
efforts are required to afforest large areas under this tree
species. Production and supply of high quality planting
stock on a sustainable basis is an essential requirement
for the successful implementation of afforestation
programmes. Supply of mineral nutrition to the seedlings
in the nurseries has an important role for enhancing growth
rate and achieving plantable size in the shortest possible
time. Excessive use of inorganic fertilizers results not only
in soil pollution but also soil deterioration. Biofertilizers have
been reported to meet the nutrients demand of plants and
play a synergistic role with inorganic fertilizers. Rhizobium
is helpful in fixing atmospheric nitrogen and vesicular
arbiscular mycorrhiza (VAM) absorbs phosphorus from the
soil. This paper describes the individual and combined effect
of VAM, Rhizobium and inorganic fertilizers on growth of
this important species.
MATERIAL AND METHODS
The present experiment was carried out in polythenebags of 30x25 cm size. Uniform quantity of 3.25 kg of sieved
soil was filled in each polythene bag. Soil of pH 7.3 of thestudy site was analyzed for important physico-chemicalcharacteristics. The soil was silty loam in texture with
Enhancement of Leaf and Shoot Growth in Dalbergia sissooSeedlings by Application of VAM, Rhizobium and Inorganic
Fertilizers
Amanpreet Kaur* and Rakesh KumarDepartment of Forestry and Natural Resources, Punjab Agricultural University, Ludhiana-141004, India
*E-mail: [email protected]
Abstract: Studies were conducted to determine the influence of inorganic and biofertilizers on seedling growth in Dalbergia sissoo.Significantly higher number of leaves and internodal length were achieved in dual inoculated plants as compared to single inoculation withVAM or Rhizobium or uninoculated control. Number of leaves and internodal length significantly increased with application of 30kg Nha-1. However, higher doses of nitrogen proved detrimental to the vegetative growth. Nitrogen x phosphorus, nitrogen x biofertilizers,phosphorus x biofertilizers and nitrogen x phosphorus x biofertilizers interactions also increased number of leaves and internodal lengthsignificantly. Among all treatment combinations, maximum growth was achieved with dual inoculation (VAM+ Rhizobium) combined withapplication of 30 kg N ha-1 and 75 kg P2O5 ha-1
.
Key Words: Dalbergia sissoo, Biofertilizers, VAM, Rhizobium
electrical conductivity of 0.55 mmhos/cm and 0.48 per centorganic carbon. The treatments consisted of three levels ofnitrogen (N0 -No application of nitrogen; N1- 30 kg N ha-1
and N2- 60 kg N ha-1), three levels of phosphorus (P0- Noapplication of phosphorus; P1- 75 kg P2O5 ha-1; P2-150 kgand P2O5 ha-1) and four levels of biofertilizers (Bo -No
application of biofertilizers; B1 -VAM; B2 - Rhizobium; B3 -Dual application i.e. VAM +Rhizobium). Experiment waslaid out in split plot design with three replications. Nitrogen
X phosphorus levels (nine combinations) were taken asmain plot treatments and four levels of biofertilizers weretaken as sub- plot treatments.
Nitrogen was applied in the form of urea in three splits,first as basal dose, before filling of polybags and remainingtwo doses were applied after one and two months of
completion of seed germination. A total of 94.5 mg and 188.9mg urea per polybag was applied under the nitrogen levelof 30 kg N ha-1 and 60 kg N ha-1, respectively after preparing
the aqueous solution by dissolving the desired quantity ofurea in water. The full dose of phosphorus was applied asbasal dose before filling of polybags in the form of single
super phosphate. A total of 690 mg and 1380 mg singlesuper phosphate per polybag was added for 75 kg P2O5
ha-1 and 150 kg P2O5 ha-1, respectively.
Rhizobium culture (Bradyrhizobium spp cowpea) wasobtained from the Department of Microbiology, PunjabAgricultural University, Ludhiana. The seeds were inoculated
with Rhizobium culture and dried in shade for few minutesbefore sowing to avoid stickiness. Inoculation with vesicular
Indian J. Ecol. (2011) 38 (Special Issue) : 152-154Indian Journal
of Ecology

153
arbuscular mycorrhiza (VAM) fungi was done by placing thesoil based inoculum containing 60 spores/polybag of soil
at 2-3 cm depth. Healthy pods of Dalbergia sissoo werecollected from a phenotypically superior single tree. Podswere dried and broken into single seed segments. The
seed segments were soaked in water for 24 hours beforesowing and two seeds were sown in each polythene bag.Irrigation, weeding and hoeing were applied as and when
required. The data on number of leaves per plant andintermodal length were recorded five months after sowingof seeds. Estimation of VAM spores in soil was made
following the method suggested by Gaur and Adholeya(1994). The data generated from the present investigationwere analyzed statistically as per the procedure suggested
by Gomez and Gomez (1984).
RESULTS AND DISCUSSION
Mean performance of plants for number of leaves andinternodal length as influenced by nitrogen, phosphorus
and biofertilizers application and their interactions ispresented in Table 1 and 2, respectively. Perusal of datarevealed significant differences among different doses of
nitrogen, phosphorus and biofertilizers for number of leavesper plant and intermodal length. Among different biofertilizerlevels, dual inoculation of Rhizobium and VAM recorded
significantly higher number of leaves (80.94) per plant and
intermodal length (4.33cm) as compared to VAM andRhizobium alone and uninoculated control. Single
inoculation of VAM and Rhizobium also resulted insignificantly higher number of leaves and intermodal lengthover control (49.0). VAM was found to be superior over
Rhizobium in increasing the average number of leaveswhereas for intermodal length, rhizobium proved to be moreefficacious. Sengupta and Chaudhary (1995) also recorded
higher number of leaflets in Sesbania grandiflorainoculated with Rhizobium and VAM, alone or incombination, in comparison with control. Inoculation of VAM
resulted in higher number of leaves as compared touninoculated control in Dalbergia latifolia (Sumana andBagyaraj 1998). Data also depicted that nitrogen and
phosphorus application, singly or in combination hadsignificant influence in increasing the number of leaves.Number of leaves (77.22) and intermodal length (3.65cm)
were significantly higher in plants with application of 30 kgN ha-1 as compared to those with no nitrogen application.The increase in number of leaves is due to increased
nitrogen availability as it is a constituent of protein,component of protoplasm and also increase the chlorophyllcontents in leaves. All these factors contributed to cell
multiplication, cell enlargement and differentiation, whichhas resulted into better photosynthesis and ultimately inrespective growth. The results are supported by Deol and
Table 1. Effect of biofertilizers application on number of leaves of Dalbergia sissoo at different nitrogen and phosphorus levels
N P2O5 Biofertilizers Overall
(kg ha-1(kg ha-1) (kg ha-1) Control VAM Rhizobium VAM + Rhizobium mean
0 0 34.64 38.64 36.10 40.54 37.48
75 50.54 61.16 56.91 68.71 59.33
150 39.52 67.33 45.27 68.78 55.22
Mean 41.56 55.71 46.09 59.34 50.67
30 0 52.21 57.90 60.44 62.78 58.33
75 59.46 99.00 78.61 117.20 88.56
150 59.47 90.13 80.23 106.44 84.09
Mean 57.04 82.34 73.09 95.47 77.22
60 0 41.75 45.72 75.62 77.25 60.08
75 58.84 87.84 79.45 107.04 83.29
150 44.58 66.04 51.80 79.90 60.58
Mean 48.39 66.53 68.95 88.06 67.97
Overall mean 49.00 68.19 63.03 80.94
P x B – 0 42.87 47.42 57.39 60.19 51.96
75 56.28 82.67 71.66 97.65 77.00
150 47.86 74.50 59.10 85.04 66.86
CD for N = 0.66 B = 0.73
P = 0.66 N x B = 1.26
N x P = 1.14 P x B = 1.26
N x P x B = 2.18
Enhancement of Leaf and Shoot Growth in Dalbergia sissoo

154
Khosla (1983) who found significant increase in internodal
length with application of 60 kg N ha-1 in Populus ciliata.
Higher doses of nitrogen (60 kg N ha-1) decreased
intermodal length(3.13cm). Application of 75 P2O5 kg ha-1
significantly increased the number of leaves (77.00) and
intermodal length (3.42cm) as compared to 150 kg P2O5
ha-1 and control. Significant interaction was observed
between nitrogen and phosphorus in increasing the
number of leaves. The interaction effect between nitrogen x
biofertilizer and phosphorus x biofertilizer were also
significant. Aguiar et al (2004) reported enhanced number
of leaves in Prosopis spp. with application of 50 kg P2O5 ha-
1 along with VAM inoculation as compared to control. Nitrogen
x phosphorus x biofertilizer interaction showed significant
effect in enhancing the number of leaves and intermodal
length. Dual inoculation of Rhizobium + VAM combined with
application of 30 kg N ha-1 and 75 kg P2O5 ha-1 produced
significantly higher number of leaves (117.20) and
intermodal length (4.98cm).
Table 2. Effect of biofertilizers application on internodal length (cm) of Dalbergia sissoo at different nitrogen and phosphorus levels
N P2O5 Biofertilizers Overall
(kg ha-1) (kg ha-1) Control VAM Rhizobium VAM + Rhizobium mean
0 0 2.78 2.95 2.87 3.07 2.91
75 2.88 3.33 3.27 4.09 3.39
150 2.59 2.69 2.99 4.27 3.14
Mean 2.75 2.99 3.04 3.81 3.15
30 0 3.01 3.56 3.83 4.26 3.66
75 3.03 3.24 3.71 4.98 3.74
150 2.98 3.24 3.24 4.78 3.54
Mean 3.00 3.34 3.59 4.67 3.65
60 0 2.09 3.11 3.16 4.35 3.17
75 2.60 2.92 2.90 4.16 3.14
150 2.54 2.90 2.80 4.00 3.06
Mean 2.41 2.97 2.95 4.17 3.13
Overall mean 2.71 3.10 3.19 4.22
P x B = 0 2.63 3.21 3.29 3.89 3.25
75 2.84 3.16 3.29 4.41 3.42
150 2.70 2.94 3.01 4.68 3.33
CD for N = 0.05 B = 0.06
P = 0.05 N x B = 0.10
N x P = 0.09 P x B = 0.10
N x P x B = 0.16
ACKNOWLEDGEMENT
Authors are grateful to Department of Microbiology and
Department of Soils, Punjab Agricultural University, Ludhianafor providing laboratory facilities
REFERENCESAguiar, R. L. F. de; Maria, L. C.; Salcedo, I. H. and Samparo, E. V. de
S. B. (2004) Interaction between arbuscular mycorrhizal fungiand phosphorus on growth of Prosopis juliflora (SW) DC.Revista Arvore 28(4): 589-598.
Deol, G. S. and Khosla, P. K. (1983) Provenance related growthresponse of Populus ciliata Wall Ex Royle to nitrogenfertilization. Ind. For. 109: 33-40.
Gaur, A. and Adholeya, A. (1994) Estimation of UAMF spore in soil:a modified method. Mycorrhiza News 6(1): 10-11.
Gomez, K. A. and Gomez, A. A. (1984). Statistical procedures foragricultural research (2nd ed.). John Wiley and Sons Inc., NewYork pp 680.
Sengupta, A. and Chaudhuri, S. (1995) Effect of dual inoculation ofRhizobium and mycorrhiza on growth response of Sesbaniagrandiflora in coastal saline sand dune soil. Indian J. For.18(1): 35-37.
Sumana, D. and Bagyaraj, D. J. (1998) Selection of efficient VAmycorrhizal fungi for Dalbergia latifolia Roxb. Annals For.6(2): 186-90.
Amanpreet Kaur and Rakesh Kumar

The exploration and exploitation of mineral wealthbrings in complete destruction of forest and formation ofnew wastelands in the form of barren dumps of mine
overburdens resulting in ecological disturbances andhazards. Open cast mining destroys microbial communities,disrupts ecosystems, cannot support biomass
development. In India, gradual increase in such landscapesdue to intensive mining activity endangers the forestproductivity (Saxena and Chatterji, 1988a, 1988b). 20.16
per cent of total geographical area of India is occupied bythe degraded lands (Kiran et al., 2009). The revegetation ofthe mine wastelands of the country is not achieving success
due to various factors, such as high rate of mortality andslow growth of planted species, nutrient deficiency, lowmoisture retention and lack of biological activities (Dubey
et al., 2006). The use of bio-fertilizers for reclamation leadsto achieve the fertility of barren dumps in a very short time.There are several evidences that the disturbed sites may
be revegetated when the seedlings be pre-inoculated withmicrobial inoculants (Williams et al., 1974; Daft andHacskaylo, 1976; Adholeya et al., 1997). Besides rhizobia,
endomycorrhizae improve the quality of seedlings in treenurseries (Kormanic, 1980). Data from earlier studies showthat when root systems are tailored in nursery with VAM
fungi prior to planting, tree survival and growth improvessignificantly (Behl, 1990; Verma et al., 1994). Role ofmycorrhiza in re-establishment of vegetation in the coal
mines spoil has been well emphasized by several workers(Daft and Hacskaylo, 1977; Jasper et al., 1988; Johnsonand McGraw,1988). Similarly, use of VAM fungi in reclamation
Study of Reforestation of Mine Wastelands using Indigenous VAMFungi through Nursery Technology for Acacia nilotica
Shama Afroze Baig*, Reena Kulshrestha1 and Kiran JainGovt.Eklavya Mahavidyalaya, Doundi-Lohara, Durg, Chhatisgarh, India
1Rungta Dental College, Kohka-Kurud, Bhilai, Chhatisgarh, India*E-mail: [email protected]
Abstract: VAM fungi and nursery technology have a great deal to contribute in improving the productivity and profitability of stress lands.The importance of VAM fungi in regeneration of different types of mining sites has been studied and positive results have been reported.An approach has been made to evaluate the growth of plants by application of indigenous VAM fungi for mine wastelands (Bauxite) ofMainpat, Sarguja District,C.G. A pot experiment was designed to screen and select the suitable VAM fungi for reclamation of minewastelands with fast growing fuel wood tree, Acacia nilotica. Soil of mine wastelands was sterilized and inoculated with 11 differentVAM fungi belonging to genus Acaulospora, Glomus, Sclerocystis in triplicates and seedlings of Acacia nilotica were raised in them.After 150 days of growth period, 2 consecutive best VAM fungi were selected on basis of growth parameters, dry biomass, and rootcolonization as compared to control (i.e., without VAM fungi). Thus, the use of these indigenous fungi in nursery to raise the seedlings ofAcacia nilotica for reforestration of mine wastelands may ensure successful reclamation of mine areas.
Key Words: Acacia nilotica, VAM fungi, Mine wastelands, Nursery, Reforestration, Biomass
of iron and chromite mine wastes have given positiveresponse (Mishra, 1992). VAM fungi have received lessattention and poorly explored, but may be helpful in the
development of low cost nursery technology to rehabilitatethe wastelands and increase productivity.
Acacia nilotica (L.) commonly known as babul, kikar
has been recognized as a multipurpose tree. It is relatively
fast growing species of wastelands, drought resistant
multipurpose legume with the ability of nitrogen fixation
(Bowen, 1973). A. nilotica form symbiotic associations with
naturally occurring soil fungi called VAM (Kaushik & Mandal,
2005). Though not host specific, recent studies have
indicated host preferences of mycorrhizal fungi, thus
suggesting the need for selecting efficient VA mycorrhizal
fungi for a particular host (Baig and Gupta, 1998). Keeping
all these factors in mind, present study was done to explore
the possibility of application of indigenous VAM fungi in
association with A. nilotica for reclamation of Bauxite mine
wastelands around Mainpat area.
MATERIAL AND METHODS
To evaluate the growth of Acacia nilotica forreforestration of mine wastelands of Mainpat, Sarguja
District, (C.G.) by application of indigenous VAM fungi a potexperiment was set using the soil surrounding minewasteland. Indigenous VAM fungi were isolated by “ Wet
Sieving & Decantation Technique” (Gerdemann andNicolson, 1963) purified and maintained following themethods of Menge and Timmer (1982). Morphological
Indian J. Ecol. (2011) 38 (Special Issue) : 155-158Indian Journal
of Ecology

156
characterization and Identification of VAM spores was donefollowing INVAM Guidelines. 11 different indigenous VAM
fungi belonging to genus Acaulospora, Glomus andSclerocystis were used for evaluation. The soil surroundingmines area was collected in bags, pH was recorded at the
site as well as when brought to laboratory. Soil was sterilizedby fumigating with 4 per cent formalin for 48 h. Afterfumigation, soil was kept under open air to remove excess
fumes of formalin, saturated with water before the additionof inoculants and seed sowing. Each VAM inoculants (sporeload 200-250 spores/100g soil) was added in each pot
separately just 2" below the seed sowing level, two seedswere sown and covered with soil. In control sets, noinoculums was added. Only three replications were
prepared and daily watering was done as per therequirement of host plants. After 30 days observations wererecorded for mycorrhizal colonization. Final observations
were recorded after 150 days on seedling shoot length,root length, shoot fresh and dry weight and per cent rootcolonization, spore count and ‘P’ content of seedlings. VAM
infection was assessed by Root Clearing and Stainingtechnique (Phillips and Hayman, 1970) and percent rootcolonization was determined by Kormanik & McGraw Slide
Method, 1982. Estimation of VAMF spores done by methodof Gaur and Adholeya (1994). ‘P’ content was determinedby Vanadomolybdate phosphoric yellow colour method
(Jackson, 1973). Data were compared with the control andanalyzed statistically by the analysis of variance.
RESULTS AND DISCUSSION
Soil of the mines wasteland collected for
experimentations showed a pH ranging between 5.2-5.9.Colour of the soil was Red and soil ‘P’ content was 0.63ppm available P (extracted with 0.002 N H2SO4). Three
genera of VAM fungi, i.e. Acaulospora, Glomus andSclerocystis have been isolated from the rhizosphere offorest plants of Mainpat area from five different sites. Glomussp.(6) were present in abundance followed by Acaulospora(3) & Sclerocystis (2). The VAM fungi present were identifiedas A. dilatata, A. laevis, A. longula, G. aggregatum, G.fasciculatum, G. geosporum, G. hoi, G. macrocarpum , G.mosseae, S. microcarpus and S. sinuosa. Altogether, 11VAM fungi were found to be infective after 30 days as both
vesicles and arbuscles had been observed in rootsshowing positive response for host plant A. nilotica. Theeffect of different inoculants after 150 days on host plant
Acacia nilotica is shown in Table 1, 2 and 3. The highestper cent root VAM colonization and spore count wasobserved in Glomus macrocarpum (93, 132%), followed
by G. fasciculatum (87, 116) (Table 1). A wide range of root
colonization (55-93%) showed generalized and high levelof susceptibility in A. nilotica for VAM symbionts. Estimation
and analysis of ‘P’ content in plant tissues have shownincreased level with mycorrhization as compared touninoculated control. The maximum P content in shoots
and root tissues was obtained in plants inoculated with G.macrocarpum (7.27 & 7.67 µg-1) followed by A. laevis (5.52& 7.32 µg-1) as compared to control and other inoculants
(Table-3). It is evident from the results that all the inoculationshad a higher P content of shoots and roots than the control.P content of roots was higher than that of shoots in all
inoculated seedlings of A. nilotica. It was revealed that G.macrocarpum showed a maximum significant increase inshoot height(44.00cm) and root length (29.33cm) as
compared to control and other inoculants followed by A.laevis (42.00cm & 27.00cm). The maximum fresh and dryshoot biomass was recorded in plants inoculated with G.macrocarpum (28.28 and 24.10 g) followed by A. laevis(27.71 and 23.96 g) as compared to control and otherinoculants in which all the above mentioned parameters
were low (Table 2).
Table 1. Effect of VAM inoculants on per cent root colonization,spore count and per cent in Acacia nilotica
S.No. VAM fungi Per cent Root Spore
colonization count/
100g soil
1. Acaulospora dilatata 62 92
2. Acaulospora laevis 82 108
3. Acaulospora longula 55 55
4. Glomus aggregatum 70 97
5. Glomus fasciculatum 87 116
6. Glomus geosporum 71 62
7. Glomus hoi 55 85
8. Glomus macrocarpum 93 132
9. Glomus mosseae 75 89
10. Sclerocystis microcarpus 80 102
11. Sclerocystis sinuosa 65 96
12 Control 0 0
There are many reports that suggest the importance ofVAM fungi in successful reclamation of mine wastelands
(Daft and Hacskaylo,1976, 1977; Mishra, 1992; Adholeya etal.,1997). Reports on the positive effect and nutrient uptakeby plants through VAM in both forestation and agricultural
crops are well documented (Rani et al.,1999; Gill and Singh,2002). In the present study, the better growth responseswere seen in host plant A. nilotica when inoculated with
different indigenous VAM inoculants. Results revealed thatdifferent VAM fungi differed in the extent to which theyincreased growth, biomass and ‘P’ uptake, thus indicating
the need for selecting efficient VAM fungi for A. nilotica which
Shama Afroze Baig, Reena Kulshrestha and Kiran Jain

157
are in accordance with many workers (Rani et al, 1999,Jamaluddin et al., 2001; Kaushik and Mandal, 2005). The
increased rate of P uptake and inflow in roots has beenregarded as the major contribution of VAM infection (Mosse,1973). Inoculated seedlings with the entire test VAM fungi
increased the P content of roots and shoots as comparedto the control in this study and similar results were alsoreported (Kumar et al., 2002).
All the 11 indigenous VAM fungi tested showed positivemycorrhization for host plant A. nilotica. All the inoculationtreatment have a marked effect on the growth, biomass
and ‘P’ content of A. nilotica seedlings as compared to thecontrol. Based on these parameters, the best two VAMinoculants G. macrocarpum and A. laevis were selected for
nursery development of A. nilotica for reclamation of Mainpatmines wasteland. The above study reveals that inoculation
of VAM fungi enable the plant species to become morestress tolerant by ensuring continuous supplies of nutrients
during their early stages of growth. Therefore, reclamationwith VAM fungi through nursery technology seems to becost-effective and promising for revegetating the mines
wasteland, however field trial is awaited for financial andtechnical support.
REFERENCESAdholeya, A., Sharma, M.P., Bhatia, N. P. and Tyagi, C. (1997)
Mycorrhizal biofertilizers: a tool for reclamation and biofertilizer.In: Proc. of the Nat. Symp. On Microbial Technology inEnvironmental and Resource Recovery. New Delhi (October1-2, 1997), pp. 1-2.
Baig, S. A. and Gupta, N. (1998) Selection of VAM inoculants forrice var. Basmati. In: Proc.Nat. Symp. Frontiers in Appl.Environ. Microbiol, CUSAT, Cochin (11-13 Dec. 1995), pp.145-147.
Table 2. Effect of VAM inoculants on growth response and biomass in Acacia nilotica
S.No. VAM fungi Root length Shoot height Fresh shoot biomass Dry shoot biomass
(cm) (cm) (g) (g)
1. Uninoculated control 10.66±1.15d 24.66 ± 6.02de 20.14 ± 4.33defg 16.39 ± 1.57bc
2. Acaulospora dilatata 20.66±3.21abc 32.00 ± 5.00abcde 21.14 ± 4.01 cdef 18.25 ± 5.16 b
3. Acaulospora laevis 27.00±6.24a 42.00 ± 3.00ab 27.71 ± 2.69 a 23.96 ± 2.81 a
4. Acaulospora longula 17.33±1.52bcd 31.33 ± 3.98bcde 21.00 ± 4.47 cdef 18.25 ± 1.96 b
5. Glomus aggregatum 21.33±4.93abc 34.00 ± 9.54abcde 22.28 ± 3.35 bcde 18.96 ± 1.11 ab
6. Glomus fasciculatum 25.33±3.51ab 38.33 ± 5.50abc 26.14 ± 1.57 ab 19.67 ± 1.11 ab
7. Glomus geosporum 22.66±3.05abc 34.33 ± 3.50abcde 22.42 ± 2.14 bcde 19.10 ± 5.81 ab
8. Glomus hoi 16.33±3.78cd 25.85 ± 3.41cde 20.28 ± 1.11 defg 17.10 ± 7.86 bc
9. Glomus macrocarpum 29.33±1.52a 44.00 ± 3.60a 28.28 ± 5.82 a 24.10 ± 3.28 a
10. Glomus mosseae 23.00±1.00abc 36.00 ± 2.64abcd 23.14 ± 2.03 bcd 19.25 ± 2.16 ab
11. Sclerocystis microcarpus 24.00±3.46abc 36.33 ± 8.00abcd 24.57 ± 3.77 abc 19.39 ± 7.26 ab
12. Sclerocystis sinuosa 21.00±4.35abc 32.33 ± 3.50abcde 21.14 ± 2.73 defg 18.67 ± 9.50 ab
(Values without common letters differ significantly at P=0.01, Duncan’s Multiple Range Test).
Table 3. Effect of VAM inoculants on the ‘P’ content of Acacia nilotica.
S.No. VAM fungi ‘P’ content in Roots ‘P’ content in Shoots
(µg g-1 tissue) (µg g-1 tissue)
1. Uninoculated control 5.01 ± 0.06gh 2.19 ± 0.03 gh
2. Acaulospora dilatata 5.87 ± 0.06ef 3.20 ± 0.00 ef
3. Acaulospora laevis 7.32 ± 0.06ab 5.52 ± 0.27 b
4. Acaulospora longula 5.61 ± 0.06fg 2.47 ± 0.03 gh
5. Glomus aggregatum 6.21 ± 0.06de 3.80 ± 0.03 de
6. Glomus fasciculatum 7.28 ± 0.00ab 5.40 ± 0.02 c
7. Glomus geosporum 6.25 ± 0.00de 4.01 ± 0.00 d
8. Glomus hoi 5.57 ± 0.00fg 2.41 ± 0.00 gh
9. Glomus macrocarpum 7.67 ± 0.06a 7.27 ± 0.04 a
10. Glomus mosseae 6.47 ± 0.06cd 4.26 ± 0.08 c
11. Sclerocystis microcarpus 6.94 ± 0.00bc 5.37 ± 0.10 b
12. Sclerocystis sinuosa 6.08 ± 0.00def 3.66 ± 0.59de
(Values without common letters differ significantly at P=0.01, Duncan’s Multiple Range Test).
Reforestation of Mine Wastelands using Indigenous VAM Fungi

158
Behl, H.M. (1990) Role of endomycorrhiza in fuel wood plantationnurseries for alkaline soil sites. In:Current Trends inMycorrhizal Research, Proceedings of the Nat. conf. onMycorrhiza(eds. Jalali, B.H. and Chand, H.), HaryanaAgricultural Research University, Hisar, pp. 137-138.
Bowen,G.D.(1973) Mineral nutrition in ectomycorrhizae. In:Ectomycorrhizae:Their ecology and Physiology. G.C. Marksand T.T. Kozlowaski (eds.) Academic Press, New York, pp.161-205.
Daft, M. J. and Hacskaylo, E. (1976) Arbuscular mycorrhizae in theanthracite and bituminous coal wastes of Pennsylvania. J.Appl. Ecol. 13: 523-531.
Daft, M. J. and Hacskaylo, E. (1977) Growth of endomycorrhizaland non-mycorrhizal red maple seedlings in sand andanthracite soil. For. Sci. 23: 207-216.
Dubey, K., Singh V.K., Mishra, C.M. and Kumar, A. (2006) Use ofbiofertilizer for reclamation of silica mining area. In: (ed. R.I.Barnhisel) Proc. Billings Land Reclamation Symposium, June4-8, Lexington, pp. 176-181.
Gerdemann, G. W. and Nicolson, T. H. (1963) Spores of myc-orrhizalendogone species extracted from soil by wet sieving anddecanting. Transaction British Mycology Soc. 46: 235- 224.
Gill, T.S. and Singh, R.S., (2002) Effect of Glomus fasciculatumand Rhizobium inoculation on VA mycorrhizal colonizationand plant growth of chickpea. J. Mycol. Plant Pathol. 32: 162-167.
Gaur, A. and Adholeya, A. (1994) Estimation of VAMF spores in soil:a modified method. Mycorrhiza News 6 (1): 10-11.
Jackson, M.L.(1973) Soil Chemcial Analysis. New Delhi, PrenticeHall, India. 485p.
Jamaluddin, A. Chandra, K.K. and Goswami, M.G. (2001)Effectiveness of various types of VAM inocula on growth andbiomass of Bambusa nutans. Mycorrhiza News 12: 15-17.
Jasper, D.A., Robson, A.D. and Abbott, L.K. (1988) Revegetation inan iron-ore mine nutrient for plant growth and the potentialrole of vesicular arbuscular(VA) mycorrhizal fungi. AustralianJ. Soil Res. 26: 497-507.
Johnson, N.C. and McGraw, A.C. (1988) Vesicular-arbuscularmycorrhizae in taconite tailings, II, Effects of reclamationpractices Agri. Ecosyst. Environ. 21: 143-152.
Kaushik,J.C. and Mandal,B.S.(2005) The role of mycorrhiza in treemanagement for seedling growth of Dalbergia sissoo andAcacia nilotica. Bull of the NIE, 15: 133-137.
Kiran, Kudesia, R., Rani, M. and Pal, A. (2009) Reclaming degradedland in India through the cultivation of Medicinal plants. Bot.Res. Int. 2(3): 174-181.
Kormanik, P.P. (1980) Effects of nursery practices on VAMdevelopment and hard wood seedling production. In:Proceedings of Tree Nursery Conference, 2-4 September,Lake Barkley,USA.
Kormanik, P.P. and McGraw, A. C. (1982) Quantifica-tion ofvesicular-arbuscular mycorrhizae in plant roots. In: N. C.Shenck (Ed.) Methods and Principles of MycorrhizalRe-search, American Phytopathol Soc. 5: 37-45.
Kumar, R., Jalali, B.L. and Chand, H. (2002) Influence of vesiculararbuscular mycorrhizal fungi on growth and nutrient uptake inchickpea. Journal of Mycology and Plant Pathology 32: 11-15.
Menge,J.A. and Timmer, L.W. (1982) Procedures for inoculation ofplants with Vesicular-arbuscular-Mycorrhizae in theLaboratory, Greenhouse, and field. In: N. C. Shenck (ed.)Methods and Principles of Mycorrhizal Re-search, Ame.Phytopathol Soc. 5: 59-63.
Mishra, A.K. (1992) Strategies for reclamation of mine wasteareas through help of selected microbes: problems andprospects, In: Proceedings of the symposium on strategiesfor Ecosystem Conservation, ISCA, Indore, pp: 64.
Mosse, B. (1973) Advance in the study of vesicular-arbuscularmycorrhizae. Ann. Rev. Phytopath., 72: 1125-1132.
Phillips, J. N. and Hayman, D. S. (1970) Improved procedures forclearing roots and staining parasitic & vesicular arbuscularmycorrhizal fungs for rapid assessment of infection. Trans.Br. Mycol. Soc., 55: 158-161.
Rani,P., Aggarwal,A. and Mehrotra, R.S. (1999) Growth responsesin Acacia nilotica inoculated with VAM fungus (Glomusmosseae), Rhizobium sp. and Trichoderma harzianum.Indian Phytopath. 52 :151-153.
Saxena, S. K. and Chatterji, P.C. (1988a) Ecological imbalance causedby mining, in Rajasthan and their Restoration. In: Joshi andBhattacharya(Ed.) Mining and Environment in India. HRGPublication Series, Nainital, India, 223-241.
Saxena, S. K. and Chatterji, P.C. (1988b) Mining activity and creationof wasteland in western Rajasthan. In: K.A. Shankaranarayan(ed.) Wasteland development and their utilization. ScientificPublisher, Jodhpur, 41-61.
Verma, R.K., Jamaluddin and Gupta, B.N. (1994) Effect of inoculationof VAM fungi and Rhizobium on growth and biomassproduction in Acacia nilotica in nursery. Indian For. 120: 1089-1094.
Williams, S. E., Wollum, A. G.and Aldon, E. F. (1974) Growth ofAtriplex canescens (Pursh) Nutt. improved by formation ofvesicular-arbuscular mycorrhizae. Proc. Soil Sci. America38: 962-965.
Shama Afroze Baig, Reena Kulshrestha and Kiran Jain

159
The increasing human population, the more
consequent accelerating demands and intensity of humanactivities on the land have various degrees of impact on allof the material and natural resources in the world. Human
population pressures have accelerated the increases ofland value and the diversity of land use. Land is becomingscarce so that the more fragile upland areas are looked
upon as the last frontier for the expansion of agriculture andother land uses. As a result, numerous problems have nowbeen threatening the ecological stability of much upland
(Cruz, 1990).
At the moment, there is a trend to make use of the landfor the economic interests, which could increase the
income. One of the favourite and higheconomic-value plantsin this area is oil palm. Another problem in BesitangWatershed that seems to be a major one is land conversion
to oil palm plantation and fish pond in the mangrove forestsby the surrounding community have decreased the size ofthe available area. According to Ekanayake and Dayawansa
(2003), land as resource cannot be measured by the surfacearea alone; hence the types of soil which is critical forproductivity, underlying geology, topography, hydrology and
plants/animal population also have to be considered. Theseattributes limit the extent of land available for variouspurposes. The growing population, industrialization and
misuse and overexploitation of land resources have in factincreased the demand for land.
Changes in the use of land occurring at various spatial
levels and periods can have either beneficial or detrimental
Application of Analytical Hierarchy Process for Land Use Allocation
RahmawatyDepartment of Forestry, Faculty of Agriculture, Universitas Sumatera Utara, Jl. Tri Dharma Ujung No. 1,Kampus USU,
Medan, 20155, North Sumatra, IndonesiaE-mail:[email protected]
Abstract:This study was conducted to develop a framework for participatory and improved land use decision-making in BesitangWatershed, Langkat, North Sumatra, Indonesia. It aimed to determine the best land use allocation using AHP. Socio-economic informationand physical data were derived from interviews and field survey. Collective opinion was derived from the workshop with stakeholders.Alternative for forestry in Besitang Watershed based on integrated approach has very high suitability (63%). Agriculture use has high(63%) to very high (37%) suitability. Settlement area has low (23%) to moderate (77%) suitability. Fishery use has low (47%), moderate(18%), and high (35%) suitability. Industry has very low suitability in all decision zones. Based on allocation for multiple-use, BesitangWatershed has very high potential suitability for forestry (63%) and agriculture (37%) land uses. The most significant contributions of thisstudy in facilitating land use decision-making were: as a tool for land use allocation and policy formulation, as well as for scientificinvestigations. This approach provides participatory involvement of stakeholders in land use allocation. This approach is efficient andreliable land use allocation for watershed management, since it involves the physical components as well as participation of stakeholdersto ensure sustainability.
Key Words: Land use allocation, AHP, Besitang watershed
effects. The latter is the main concern of decision-makers
because of its effect on the population and the environment.The goal of managing land use and its change is to developthe land resources in ways that capitalize on the local
potential and suitability, avoid negative impacts and respondto present and future societal demand within the limits ofthe carrying capacity of the natural environment (FAO, 1995).
Decision support system has been identified as a criticalcomponent to identify and solve problems, provideinformation and current scientific knowledge in watershed
management decision making process.
Based on the Besitang Watershed’s condition, some
thoughts on good steps or actions are needed to overcome
these problems. Rehabilitation of watersheds is also
needed so that it can support and enhance other
environmental functions. At present, researches on land
use and land use planning have been carried out in the
area but these have not fully looked into the driving forces of
land use as influenced by renovation policies. There is a
need of an approach that can involve the participation of
stakeholders so that land use management planning can
be effectively and efficiently done in accordance with
Republic of Indonesia Law Number 26 (2007) about Spatial
Management. The research about land use allocation with
stakeholder participation and collaboration that is crucial
for successful and sustainable watershed management
has never been conducted previously in the area. For this
reason, it is essential that research in this area be
conducted. Therefore, This study generally aimed to develop
Indian J. Ecol. (2011) 38 (Special Issue) : 159-165Indian Journal
of Ecology

160
a framework of participatory and improved land usedecision-making in Besitang Watershed, Langkat, North
Sumatra, Indonesia. Specifically, the study aimed todetermine the current and potential land use suitability inthe area with stakeholder participation and to develop a
spatial participatory land use allocation for the area.
MATERIAL AND METHODS
The study was conducted in the Besitang Watershed,from April to August 2008. Administratively, the study area
lies in the Langkat Regency, North Sumatra Province,Indonesia. It consists of five sub-districts, namely: Besitang,Barandan Barat, Padang Tualang, Pangkalan Susu and
Sei Lepan.
Besitang Watershed has an area of 100,035 ha
excluding the islands. In the border of Malaka Strait in the
East, there are islands that have an area of 5,089 ha.
Geographically, it is located between 97o 50’ 00" to 98o 20’
00" east longitude and 03o 45’ 00" to 04o 15’ 20" north latitude.
It is bordered by the Province of Nangroe Aceh Darussalam
in the North, Sei Lepan Watershed in the South, Malaka
Strait in the East, and the Province of Nangroe Aceh
Darussalam in the West.
Collective Opinion Information
Information for collective opinion was gathered fromprimary data (interviews during field survey and during theworkshop). The workshop was conducted to determine land
use suitability allocation based on public opinion fromstakeholder using AHP. The study largely relied on the useof questionnaire and key stakeholder (local officers,
extension workers, teachers, researchers, and people) whoknew the study sites well at provincial, regional, sub-regional,
and village level. Key stakeholders provided qualitative in-depth information about physical and socio-economic
conditions of the study area. Secondary data were collectedfrom offices, which are related to the study.
Potential Land Use Suitability Classification andLand Use Allocation
The collective opinion was used based on AHP as a
tool and used expert choice as software. The AHP utilizesthe system approach to decision making. Therecommended procedure to solve a problem using the AHP
method based on the AHP principles is as follow:
Structuring the problem into a hierarchy. In this study,generating the integrated measure (the first step in the AHP)
was to define the hierarchy, each representing a level in thesystem. Three identified levels of hierarchy in the area areshown in Fig. 1.
Comparing the hierarchy elements on a pairwisebase. Based on the hierarchy levels, then the questionnairewas developed and the respondents were filled during the
workshop. Preference is denoted by a vector of weightsfollowing and AHP scale of relative importance ranging from1 to 9 (Saaty, 1980). The pairwise comparison matrix (PCM)
is a reciprocal matrix in which elements under its maindiagonal are inverses of the upper elements. If there are“n” elements to be compared, which form an n x n PCM,
then there was n(n-1)/2 pairwise comparisons in a PCM.In this study, there were four elements for objectives andfive elements for alternatives to be compared, then there
were six pairwise comparisons for objective and tenpairwise comparisons for alternatives in a PCM.
In this study, in order to make informed and valid
assessments, the area was divided into zone with relatively
Fig. 1. Hierarchical levels for decision-making in AHP model
Rahmawaty

161
homogenous characteristics. The analysis was precededby conducting a pairwise comparison of the objectives. Each
decision maker was asked independently to establish therelationship among the objectives using the ratio scale ofmeasurement. For each decision maker, therefore, a
square objectives matrix was generated, then, the matriceswere normalized. This was processed in Expert ChoiceProgram. Central to AHP is a measure of consistency in
human judgments. According to Malczewski (1999), ifconsistency ratio (CR) is less than 0.1, there is a reasonablelevel of consistency in the pair-wise comparisons. If CR is
more than or equal 0.1, the values of the ratio areinconsistent. In the latter case, the original value in the pairwise comparison matrix should be revised. Consistency
measurement was done by using Expert Choice Program.
Aggregating all priority vectors. The final step was toaggregate the priority (weight) vectors of each level obtained
in the second step, to produce overall weights. This wasprocessed in Expert Choice Program.
The land use allocation was derived from the results of
the potential land use suitability based on integratedapproach. In this study, land use allocation was adoptedfrom Bantayan (2006). The classification procedure puts
the alternatives in classes signifying the degree of suitabilityof a particular alternative to the land units. The land usesuitability classification in this study was categorized as:
very high suitability (S1), high suitability (S2), moderate (S3),low suitability (S4), and very low suitability (S5). These wereexpressed as relative weight of alternatives by decision
zone. Based on these priorities, the degrees of preferencefor the major land use groups can be expressed as degreesof land use suitability for each decision zone.
In this study, land use allocation used two kinds of landuse allocation that was adopted from Bantayan (2006),namely: allocation for single use and allocation for multiple-
use. Land use allocation for single use, the process ofallocation depends on whether or not the results of the landuse suitability classification are regarded in absolute terms.
A process of exclusion is implemented where only thealternative that receives the highest suitability is chosen forallocation and the rest are excluded in regard to the land
units in question. Land use allocation for multiple-use, analternative approach is to recognise the gradation in thesuitability classification. It can be accomplished by
concurrent and continuous use of several natural resourceproducts obtainable on a particular land unit requiring theproduction of several goods and services from the same
area.
RESULTS AND DISCUSSION
Land system is based on Regional Physical PlanningProgramme for Transmigration survey in 1980 and still
being used. Basic concept of land system is to divide thelandscape into areas meaningful for development planning.The land concept is based on ecological principles and
presumes closely interdependent links between rock types,hydroclimatology, land form, soils and organism. The sameland system is recognized wherever the same combination
of such ecological or environmental factors occurs. A landsystem therefore, is not unique to one locality only, butconsiders all areas having the same environmental
properties. Furthermore, because a land system consistsalways of the same combination of rocks, soil andtopography, it has the same potential, and limitation,
wherever it occurs.
In Besitang Watershed, there are eight land systems.Majority land system in Besitang Watershed is Teweh (50%),
followed by Maput (16%), Bukit Pandan (13%), Kajapah(13%), Mantalat (3%), Kahayan (2%), and Pendreh (3.%).Only 0.02% is Air Hitam Kanan. The land system is used
as a basis to determine decision zone (DZ) in this study.Decision Zone 1 is located in Bukit Pandan and Air HitamKanan Land Systems, Decision Zone 2 is located in
Pendreh Land System, Decision Zones 3, 5, and 10 arelocated in Maput Land System, Decision Zones 4, 6, and 11are located in Teweh Land System, Decision Zones 7 and
8 are located in Mantalat Land System, Decision Zone 9 islocated in Kahayan Land System, and Decision Zone 12 islocated in Kajapah Land System. Based on the explanation
above, look that the decision zones areas were differentfrom each others and have broad scale. Hence, for detailedinformation and assessment (planning), need to rearrange
the area of decision zone by stakeholder participationconsidering the interaction among land uses (ecologicalinteraction).
Potential Land Use Suitability Classification andLand Use Allocation
Primary data were collected from interviews during fieldsurvey and during the workshop. Secondary data werecollected from offices, which are related to the study. Data
and thematic layers needed as supporting data and asguide for stakeholders to fill the questionnaire during theworkshop.
A workshop with the stakeholders was conducted forAHP on July 31, 2008 in University of Sumatera Utara,Medan, North Sumatra, Indonesia. The participant is the
Analytical Hierarchy Process for Land Use Allocation

162
stakeholder from provincial level, regional level, sub-regional level, and village level. The participants came from
different occupations and institutions. Before conductingthe workshop, interviewed with some stakeholders that wereselected from 100 respondents during gathered data for
socio-economic was done to determine several choicesfor objectives and alternatives. Then, the stakeholders wereinvited in the workshop as an expert in the area. The group
agreed with four of objectives and five of alternatives forpotential land use allocation in Besitang Watershed, duringthe workshop. The objectives were: i) Environment and
conservation, ii) Education and research, iii) Employment,iv) Socio-economic development and the alternatives were:i) Forestry, ii) Agriculture, iii) Settlement, iv) Industry, and v)
Fishery. Supporting data such as: socio-economic, soilerosion, land classification, and secondary data (Langkatadministrative map, watershed boundary map, land system
map, soil depth, and soil erosion map) were shown torespondents during the workshop.
Based on interviews with stakeholders and discussion
during the workshop, there were some reasons why theychoose the objectives and alternatives. The reason forchoosing the environment and conservation is because in
this area there are protected areas. As mentioned earlier, ithas the main function of sustaining the biodiversityecosystem services, cultural heritage, and geologic
monument among others for sustainable development.Besides, there are buffer areas between the LeuserEcosystem (KEL) and the Gunung Leuser National Park
(TNGL) and Besitang Watershed as one of the Priority IIwatersheds in Indonesia (it means that it is in a moderatelyto severely damaged class). Hence, the areas need special
management to maintain the watersheds ecosystem. Inrelation to land use changes assessment, this area hasthe large portion of forest change from 1990 to 2006.
Decrease of forest area will affect the environment in thisarea. As we know that forest is a system that has somefunctions, such as: nutrient cycles, water or hydrologic
cycles, succession and forest regeneration, wildlife-habitatinteractions, photosynthesis,etc. If any one of these systemsbreaks down, the forest will not function as it should.
According to Perschel et al. (2007), forest has an importantrole in mitigating climate change by naturally taking carbonout of the atmosphere. Forest preservation maintains
carbon storage and forest management that increasescarbon sequestration can augment forests’ natural carbonstorage capacity in working forest. In addition, based on
estimates of soil erosion and analysis of land capabilityand suitability, conservation is needed to reduce soilerosion to ensure sustainability in this area.
This area has very good potential for research andeducation activities because in this area there is natural
reserve forest. The area was also a potential to employmentespecially in agriculture because in this area there are bigareas for agriculture and plantation. Also, majority of the
people are involved in farming, therefore,socio-economicdevelopment is important to achieve human welfare in thisarea.
In terms of potential land use suitability in BesitangWatershed, the area was classified by five alternative landuses, namely:
i) Forestry. The area that is suitable for forestry and will
be used for forestry activities, such as: protected forest,
nature reserve, limited production forest, and
production forest.
ii) Agriculture. The area that is suitable for agriculture
and will be used for agriculture activities area, such as:
plantation, dry land agriculture, and wetland agriculture.
iii) Settlement. The area that is suitable for settlement
and will be used for settlement area. This area has the
main agricultural activities including the management
of natural resources with the order of the area as a
function of the rural settlement, services, government
services, social services, and economic activities.
iv) Industry. The area that is suitable for industry and will
be used for industrial activities, such as: agriculture
and fishery based industry activity.
v) Fishery. The area that is suitable for fishery and will be
used for fishery activities area, such as: fish pond,
prawn pond, salting, etc.
The reason for choosing forestry as one of the
alternatives for potential land use allocation in this areabecause of Republic of Indonesia Law Number 26 (2007)about Spatial Management (Chapter 17) that minimum 30
per cent of watershed area must be covered by forest area.The reason for choosing agriculture as one of thealternatives for potential land use allocation in this area is
because majority of the people are involved in farming. Thereason for choosing the settlement as one of the alternativesfor potential land use allocation in this area is because in
Besitang Watershed there are 30 villages and they live intheir watershed for a long time. Moreover, as mentionedearlier, in this area the main agricultural activities include
the management of natural resources with the order of thearea as a function of the rural settlement, services,government services, social services and economic
activities. The reason for choosing the industry as one ofthe alternatives for potential land use allocation in this area
Rahmawaty

163
is because ofease of accessibility. This area connects twoprovinces (NAD and North Sumatra) and there are road
accesses from the land even from the sea. The reason forchoosing the fishery as one of the alternatives for potentialland use allocation in this area is because of the location of
Besitang Watershed especially in low stream sub-watershed bordered by sea and river.
In this study, the workshop was conducted only because
of time and budget constraints. Some stakeholders broughttheir laptop during the workshop, so they could fill the AHPquestionnaire in Expert Choice Program and the
consistency could directly be determined. The stakeholderswho did not bring the laptop filled the questionnairemanually. Hence, test of consistency was conducted after
the workshop was finished. In the end, sixteen sets of datawere generated from stakeholders in the workshop.
The 16 sets of data were generated from the workshop
processed using Expert Choice Program to determinepriority of objective for each stakeholder. Furthermore, mixedaggregation of objective used geometric average was
derived to represent group judgment. Based on mixedaggregation, the priority objective for all decision zonesusing mixed aggregation was determined (Table 1). These
values are used to establish the priority of alternative for alldecision zones (Table 2). The values show high for thepriorities in view of environment and conservation in this
area, followed by education and research, employment, andsocial-economic development.
Table 1. Priority of objective for all decision zones using mixed aggregation
Objective Decision zone
1 2 3 4 5 6 7 8 9 10 11 12
Environment and 0.590 0.566 0.581 0.575 0.581 0.486 0.399 0.383 0.293 0.286 0.184 0.434
conservation
Education and research 0.262 0.275 0.270 0.271 0.274 0.268 0.243 0.233 0.257 0.296 0.271 0.272
Employment 0.087 0.095 0.085 0.089 0.086 0.147 0.217 0.218 0.245 0.225 0.292 0.161
Socio-economic 0.061 0.065 0.064 0.065 0.059 0.099 0.140 0.165 0.205 0.193 0.253 0.132
development
Total 1.00 1.00 1.00 1.00 1.00 1.00 1.00 1.00 1.00 1.00 1.00 1.00
Table 2. Priority of alternative for all decision zones using mixed aggregation
Potential land use Decision zone
1 2 3 4 5 6 7 8 9 10 11 12
Forestry 0.622 0.615 0.613 0.613 0.606 0.528 0.393 0.326 0.246 0.203 0.188 0.345
Agriculture 0.126 0.130 0.129 0.135 0.131 0.187 0.244 0.262 0.253 0.258 0.270 0.215
Settlement 0.085 0.086 0.089 0.085 0.090 0.105 0.126 0.138 0.160 0.182 0.189 0.139
Industry 0.077 0.081 0.080 0.078 0.082 0.086 0.104 0.117 0.126 0.148 0.157 0.107
Fishery 0.089 0.088 0.089 0.089 0.091 0.094 0.132 0.157 0.214 0.208 0.196 0.194
Total 1.00 1.00 1.00 1.00 1.00 1.00 1.00 1.00 1.00 1.00 1.00 1.00
Based on the result, the first objective in DZ 1 to 9 andDZ 12 was environment and conservation, followed by
education and research, employment, and socio-economicdevelopment. It means that to achieve the best land useallocation in Besitang Watershed (DZ 1 to 9 and DZ 12), the
first priority of objective should be environment andconservation. For DZ 10, the first priority objective to achievethe best land use was education and research, followed by
environment and conservation, employment, and socio-economic development. For DZ 11, the first priority objectiveto achieve the best land use was employment, followed by
education and research, socio-economic development, andenvironment/conservation.
The priority of alternative for each stakeholder was
processing using Expert Choice Program in integratedapproach. Mixed aggregation of alternative used geometricaverage. Furthermore, the priority of alternative for all
decision zones using mixed aggregation was determined(Table 2).
Based on these priorities, the degrees of preference
for alternative potential land use in this area can beexpressed as degrees of land use suitability for eachdecision zone. This study is in agreement with Bantayan
(1996). The land use suitability classification in this studywas categories as following: very high suitability (S1), highsuitability (S2), moderate (S3), low suitability (S4), and very
low suitability (S5). Moreover, the relative weight of thealternatives (forestry, agriculture, settlement, industry, and
Analytical Hierarchy Process for Land Use Allocation

164
fishery) as shown in Table 3, then is transformed to show
the suitability in the context of integrated approach (Fig. 2).
Based on Table 3, alternative for forestry indicated withthe very high suitability (62,814 ha) except for DZ 9 (2,250
ha) (high), DZ 10 (4,757 ha) (moderate), and DZ 11 (30,214ha) (low). Majority for agriculture is high suitability (63%)and for DZ 9, 10, and 11 is very high suitability (37,220 ha).
Settlement is moderate suitability (76,873 ha) in DZ 1 to 6and DZ 11 and low suitability (23,162 ha) in DZ 7 to 10 andDZ 12. Fishery is high suitability (34,970 ha) in DZ 10 and
11, moderate suitability (18,405 ha) in DZ 7, 8, 9, and 12and low suitability (46,659 ha) in DZ 1 to 6. In this area,industry indicated with the very low suitability in all decision
zones (100,035 ha).
Land allocation in this area is based on Table 3 usingthe single use concept that was adopted from Bantayan
(2006). The decision zone that receives the highestsuitability shall be allocated to the land systems in thatparticular decision zone. Hence, based on the potential land
use suitability classification as is shown in Table 3, themajority land allocation in Besitang Watershed is allocatedto the forestry (63%) potential land use (DZ 1 to 8 and DZ
Table 3. Land suitability classification per decision zone based on priority of alternative for integrated approach
Potential Land Use Decision Zone
1 2 3 4 5 6 7 8 9 10 11 12
Forestry S1 S1 S1 S1 S1 S1 S1 S1 S2 S3 S4 S1
Agriculture S2 S2 S2 S2 S2 S2 S2 S2 S1 S1 S1 S2
Settlement S3 S3 S3 S3 S3 S3 S4 S4 S4 S4 S3 S4
Industry S5 S5 S5 S5 S5 S5 S5 S5 S5 S5 S5 S5
Fishery S4 S4 S4 S4 S4 S4 S3 S3 S3 S2 S2 S3
Fig 2: Map of potential land use suitability based on integrated approach in Besitang Watershed
12) followed by agriculture (37%) potential land use (DZ 9,
10, and 11). Another concept of land use allocation is basedon allocation for multiple-use. As explained earlier, analternative approach is to recognise the gradation in the
suitability classification. Such an approach follows themultiple-use concept for land use allocation.
According to Bantayan (2006), the objective of multiple-
use management is to manage the natural resources in amanner that maximises the benefits which can be derived.Land use allocation for multiple-uses can be accomplished
by concurrent and continuous use of several naturalresource products obtainable on a particular land unitrequiring the production of several goods and services from
the same area. As shown in Table 3, Besitang Watershedhas very high potential suitability for forestry (63%) andagriculture (37%) land uses.
As alternative for forestry, potential land use suitabilityclassification in Besitang Watershed based on integratedapproach indicated that most areas have very high suitability.
Majority of agriculture area has high to very high suitability.Settlement area has low to moderate suitability. Fisheryarea has low to high suitability. In this area, industry has
Rahmawaty

165
very low suitability in all decision zones. Land allocation in
Besitang Watershed using the single use concept indicated
that the majority of land is allocated to the forestry potential
land use followed by agriculture potential land use. Based
on allocation for multiple-use, Besitang Watershed has high
potential suitability for forestry and agriculture land use.
ACKNOWLEDGMENTS
We are grateful to The Southeast Asian Regional Center
for Graduate Study and Research in Agriculture (SEARCA)
and German Academic Exchange Service (DAAD), for
providing financial assistance and professional advice. The
University of Sumatera Utara (USU), Medan, Indonesia, for
financial assistance and support for this research; and the
College of Forestry and Natural Resources and the School
of Environmental Science and Management, UPLB, for
providing professional assistance.
REFERENCESBantayan, N.C. (1996) Participatory Decision Support Systems:
The Case of the Makiling Forest Reserve, Philippines. Ph.D.Dissertation. Department of Geomatics, the University ofMelbourne. 196p.
Bantayan, N.C. (2006) GIS in The Philippines Principles andApplications in Forestry and Natural Resources. PARRFI andAKECU, Los Banos. 173p.
Cruz, R.V.O. (1990) Land Use Suitability Assessment and LandCapability Classification in Ibulao Watershed, Philippines. Ph.D.Dissertation. University of Arizona, USA.
Food and Agriculture Organization (FAO) (1995) Planning forSustainable Use of Land Resources. FAO Land and WaterBulletin 2. Rome: Food and Agriculture Organization of UnitedNations.
Malczewski, J. (1999) GIS and Multi-criteria Decision Analysis.John Wiley and Sons, Inc, New York. 408pp.
Regional Development Planning Board of Langkat Regency(Bappeda) (2002) Langkat Spatial Management PlanningRelated to Regional Land Uses) (RTRWK) 2002-2011 (PeraturanDaerah Kabupaten Langkat No. 15 Tahun 2003 tentangRencana Tata Ruang Wilayah Kabupaten Langkat), Stabat.
Regional Physical Planning Programme for Transmigration (RePPProt)(1980) Main Report (Review of Phase I Result, Sumatra) ofRegional Physical Planning Programme for Transmigration(RePProt) Volume I and II, Land Resources Department ODNRIOverseas Development Administration Foreign andCommonwealth Office, London, England and Direktorat BinaProgram Direktorat Jendral Penyiapan PemukimanDepartement Transmigrasi, Jakarta, Indonesia.
Saaty, T. L. (1980) The Analytical Hierarchy Process: PlanningSetting Priorities, Resource Allocation. McGraw Hill, NewYork. 287pp.
Analytical Hierarchy Process for Land Use Allocation

Biological diversity or biodiversity (the variety of life onearth) Includes all organisms, species, and populations;
the genetic variation among these; and all their complexassemblages of communities and ecosystems. Thecomponents of biodiversity are ecosystem, species and
genetic variation (http://en.wikipedia.org/wiki/Biodiversity).Nepal has an extremely high level of biological diversity atthe landscape, ecosystem, and species levels, especiallyin relation to its small land area. This diversity is the result
of Nepal’s unique geographic position and altitudinal andclimatic variations. Nepal’s location in the central portion ofthe Himalayas places it in the transitional zone between
the eastern and western Himalayas. It incorporates thePalearctic and the Indo-Malayan bio-geographical regionsand the major floristic provinces of Asia (the Sino-Japanese,
Indian, western and central Asiatic, Southeast Asiatic, andAfrican Indian desert) creating a unique and rich terrestrialbiodiversity. Nepal is a mosaic of various forest types
intermixed with agricultural land, pastures, high mountains,and alpine plateaus, creating a range of landscapes.Ecologically linked to neighboring countries through shared
ecosystems, habitats, and rivers, Nepal containsinternationally important populations of large mammals thatare rare or extinct elsewhere in the world. Community
Forestry in Nepal has been successful to fulfill twin goals,conserving the biodiversity on one hand and socio-economicupliftment on other hand.
Community Forestry (CF) is a part of national foresthanded over to user group under specific rules andregulations for its conservation, development and utilization
for collective benefits (Anon., 1993). The community forestryis a social process in which user groups share mutuallyrecognized claims to specify their user rights to the
Community Forestry: The Centre for Biodiversity Conservation
Jyoti Bhandari* and G. C. Dhruba Bijaya*Tribhuwan University, Institute of Forestry, Office of the Dean, Pokhara, Nepal
China Agricultural University, College of Humanities and Development Studies, Beijing, China*E-mail: [email protected]
Abstract: Nepal has an extremely high level of biological diversity at the landscape, ecosystem, and species levels, especially in relationto its small land area. Community Forestry in Nepal has been successful to fulfill twin goals, conserving the biodiversity on one hand andsocio-economic upliftment on other hand. It was found that community forestry has rehabilitated the degraded forest, increased thenumber of plants, birds as well as animals and helped in soil conservation which proves that biodiversity has been conserved throughcommunity managed forests. It was noticed that local forest users were eager to increase biodiversity in the forest. Regular monitoringwas important to know the status of forest.
Key Words: Biodiversity, Community forestry, Peoples’ participation, Monitoring
management, development and utilization of forest. Nepalis recognized as one of the world’s leaders in community
forestry. Approximately 1.23 million ha of forests are
managed by 14,431 community forest user groups (CFUGs);
these schemes benefit 1.66 million households, about 40
per cent of all the country’s households (MoFSC, 2009). A
basic principle in community forestry is the need for a
location-specific approach to forest management, and
incorporation of local values and knowledge systems.
Originally, community forestry focused on the basic forest-
related needs of local communities. Forest biodiversity is
critical to the livelihoods of the people living around forests.
Some indigenous communities, such as the Raute in
western Nepal, are totally dependent on a variety of forest
products for their livelihoods. Other indigenous
communities, such as the Chepang in central Nepal, recently
started to practices agriculture, but still depend on forests
for many products. Even in communities that engage in
agriculture, many people collect a variety of food, fodder
and timber and non-timber forest products (NTFPs).
Participatory forestry is being increasingly considered as a
chief strategy of conservation, management and sustainable
use of forest biodiversity. The present study aimed to access
the biodiversity conservation through community forestry.
MATERIAL AND METHODS
The study was carried out in a Bhangara community
forest of Kaski district (Table 1). The district lies in westerndevelopment region, mid hills of Nepal having altitudinalvariation from 58 meters to 7939 meters. It covers an area
of 2,017 sq km in between 27°6’ to 28°36’ northern latitudeand 83°40’ to 84°12’ eastern longitude. It is centrally locatedbeing Lamjung and Tanahun in the east, Parbhat in the
Indian J. Ecol. (2011) 38 (Special Issue) : 166-168Indian Journal
of Ecology

167
Fig. 1. Perception of Forest user group about biodiversity
west, Manang and Lamjung in the north and Tanahun and
Syanjha in the south. It experiences humid subtropical towarm temperate climate. Administratively, Rupa lake basinfalls in 4 different VDCs and Lekhnath Municipality. At the
western part of Rupa lake lies Bangara Community. A totalof 49749 people reside in the basin areas. The majoroccupation is subsistence agriculture (Oli, 1996). Rupa is
a small advancing eutrophic lake with marshes and paddyfield along its shores. Lake covers an area of 115 ha in itswatersheds basin is 30 km2 and has humid upper tropical
and lower subtropical climate. The mean annualtemperature is 19.30oC and precipitation is 3157 mm. Rupais recognized for eight main vegetation types with 379 genera
and 128 families that comprise 128 tree species and 85herbs and shrubs containing 25 endangered, 13threatened, 5 rare and 2 vulnerable species of wetlands
plants.
The following methodologies were used to gatherinformation in the study.
Semi-structured questionnaire survey was conductedamong the users of the forests. The questionnaire wasabout the forest management, silvicultural activities and
importance of biodiversity in community forest. SamplingIntensity of questionnaire survey was 30 per cent.
Participatory social and resource maps were prepared
to collect the information on the distribution and conditionof forest resources. Focus group discussion was conductedto obtain the information on forest management and
silvicultural activities carried out, varying perceptions towardsmanagement and biodiversity conservation issues. Thediscussions were concentrated mainly in the male, female
and ethnic users. A survey was conducted with the keyinformants like teachers and users’ group committeeexecutives to collect the information on the forest
management and biodiversity conservation practices in theforests.
Different published and unpublished documents,review of operational plan and constitution journals, library
of forestry campus and department of forest, organizationsworking on biodiversity and community forestry, internetbrowsing, etc. were used to collect data. Data were edited,
coded and analyzed using MS-Excel Data.
RESULTS AND DISCUSSION
The community forestry has been practiced to preservebiodiversity since time immemorial and they are home to
many plants, birds and animals. The species richness canbe seen and the degraded lands have been covered withgreen forest.
Forest Management Operations
The Community Forest User Groups werepredominantly applying selective felling, singling, thinning,
pruning, lopping, and weeding/cleaning operations followedby plantations, soil conservation work and leaf littercollection. These forest management operations were
carried out depending upon the nature, kind and conditionsof the forests. The application of such activities may promoteuniformity in species composition, spacing and canopy
development.
Knowledge of Forest User Group about Biodiversity
It is clear from Fig.1 that 88 per cent of respondentshad knowledge about biodiversity conservation but still 12
per cent of the respondents do not have knowledge aboutbiodiversity conservation.
Local People Response to Biodiversitty Conservationthrough Community Forestry
Fig. 2 reveals that 90 per cent of respondent respondedthat they have experienced increase in biodiversity in theircommunity forest due to the increase in forest cover and
the water source has increased in Rupa lake, which hasincreased birds and animals in their community forest.According to 5 per cent of respondents, biodiversity is
decreasing and 5 per cent of the respondent reported thatthey don’t know about increasing or decreasing status ofbiodiversity.
Table 1. Flora and fauna of Bhangara community
Characteristics Bhangara Community CFUG Lekhanath.
Total households 218
Forest area 235.33 ha.
Main floral species Schima wallichii, Castonopsis indica,Shorea robusta, Albizzia, Oroxylonindicum. Ficus cunia, Pennisetumpurpureum, Ficus religiosa
Major fauna species Common Leopard (Panthera paradus),Rhesus monkey (Macaca mulatta), Tree-striped palm squirrel (Funambuluspalmarum), Funambulus palmarum(Canis aureus). Pheasant (Lophuraleucomelana), Crested serpent eagle(Spilornis cheela), etc.
Community Forestry for Biodiversity Conservation

168
Best Practices for Biodiversity Conservation
The study revealed that CFUGs are increasingly
adopting measures for biodiversity conservation in thecommunity forestry. Few major initiatives observedparticularly in Bangara Community Forest were:
1. Allocation of biodiversity conservation area,2. Species conservation,3. Plantation and Silvicutural (Forest management)
practices,4. Forest guard,5. Reward and penalties,
6. Awareness Program (School and community) and Lakeconservation,
7. Training on CBR (Community Based BiodiversityRegistration).
The Bangara Community Forestry was found rich in
biodiversity due to the presence of dense forests and lake.Forest User groups are actively participating in biodiversityconservation. Eighty per cent of respondents have good
knowledge about biodiversity conservation and accordingto 90% of respondents biodiversity is increasing in theircommunity forest. Appropriate mechanism to compensate
forest user groups is necessary for sustainableconservation of Biodiversity.
REFERENCESAnonymous (1993) Ministry of Forests and Soil Conservation,
Kathmandu, Nepal.
Oli, K.P. and coauthors (1996) National Conservation StrategyImplementation Project, 1996. Kathmandu. xxi+156.
MoFSC (Ministry of Forests and Soil Conservation) (2009) NepalFourth National Report to the Convention on Biodiversity.Kathmandu: Ministry of Forests and Soil Conservation.
USAID Nepal (2006) Nepal Tropical Forestry and Biodiversity (FAA118 & 119) Assessment Report, http://en.wikipedia.org/wiki/Biodiversity.
Fig. 2. Response of local peoples to biodiversity conservationthrough community forestry
Jyoti Bhandari and G. C. Dhruba Bijaya
The saying that “Green Forests are the Wealth of Nation”
has been successful only after the forest of Nepal has been
handed to the local people as Community Forestry. The
important role that forests play in rural livelihoods, especially
of the poor, is generally well recognized. In the late 1970s,
in countries such as India, Nepal and the Philippines, it
was generally perceived that widespread deforestation had
led to environmental degradation, and that governments
acting alone were not able to reverse the trends. So the
concept of community forestry arose into force, where the
management and utilization of the degraded forest and bare
land was done nationally. “Community forestry is a village-
level forestry activity, decided on collectively and
implemented on communal land, where local populations
participate in the planning, establishing, managing and
harvesting of forest crops, and so receive a major proportion
of the socio-economic and ecological benefits from the
forest.” (http://www.rainforestinfo.org.au/good_wood/
comm_fy.htm). According to the Forest Act 1993, Community
Forestry (CF) is a part of national forest handed over to user
groups under specific rules and regulations for its
conservation, development and utilization for collective
benefits. The Forest Act of 1993 and Forest Regulation of
1995 provide a clear regulation of the CF and the process
Community Forest as a Vehicle for Poverty Reduction, GoodGovernance and Gender Equity
G. C. Dhruba BijayaChina Agricultural University, College of Humanities and Development, Beijing-100193, China
E-mail: [email protected]
Abstract: Nepal has increasingly gained world-wide recognition in participatory forest management and natural resource management,primarily through “Community Forestry” (CF) program which has a well-documented history over 30 years. The local people have beeninvolved in the management, protection and utilization of forests. Community Forestry program has been successful to meet the twinedgoals of forest conservation on the one hand and socioeconomic transformation through poverty reduction, participation, good governanceand gender equity and power devolution. The main objective of community forestry was to meet the basic forest products required by thecommunities through active participation in forest development and management, but later on it was expanded to include the mobilizationand empowerment of the members of community forest user groups in the development of their local communities too. The data wascollected using PRA tools like household survey, key informants interview, internet and library. The data was edited, coded and fed in toanalyze using MS-Excel and SPSS. The result depicted that many Income Generating Activities (IGA) like goat rearing, non-timber forestproducts cultivation, leasing forest etc are conducted in the community forestry as a means of poverty reduction tool. Today a lot ofcommunity forests are even led and managed by women only. Out of three main positions in a user committee, at least one should bewoman. Woman participation in meetings and decision making is highly increased. CF lead by women group is more successful. The CFhas transparency of the decisions, equitable access and control of the services and resources, accountability/ownership of the users,active participation of the users, good and effective management and communication, equitable representation of the man and women ofthe different level in the committee, collective decision making and implementation, and rational and wise mobilization of the resources.Now-a-days, the community forestry has been a playground for the local users where they can protect, manage and utilize the forestproducts, increase participation of people and stakeholders, ensuring benefits to the local users, and regard forestry as a potential vehiclefor poverty reduction, good governance and gender equity.
Key Words: Community forestry, Good governance, Gender equity, Nepal
of handing over forest to the local communities by forminguser groups, the so called Community Forest User Groups
(CFUGs). Also the Forest Act of 1993 and the ForestRegulation of 1995 have entirely revised the Forest Act of1961 and its first amendment of 1978 in line with MPFS of
1989. The CFUGs are “independent, autonomous and self-perpetuating institutions”, responsible for both themanagement of community forests and the conduction of
community development activities. CFUGs have the legalright to claim support services from the Divisional ForestOfficer, and are also free to collaborate with other
organizations.
Community Forestry has been accorded the highestpriority in forestry sector in Nepal. It is a participatory
approach that has been in practice for more than threedecades and is being implemented throughout the country.The CF has resulted in rural farmers gaining increased
access to forest resources, together with improvements inbiodiversity and landscape values. CF has proved to be aneffective tool for managing and conserving forests where
local people are dependent on the forests for their dailysustenance but at the same time it has also been observedthat in many cases poorest users, who depend relatively
more on the forest for their livelihoods, have limited
Indian J. Ecol. (2011) 38 (Special Issue) : 169-181Indian Journal
of Ecology

170
participation and inclusion in the whole process of CF. Ithas been proved that communities are able to protect,
manage and utilize the forest resources in a sustainablemanner. However, the contribution of CF towards supportingthe poorest, most vulnerable and marginalized members
of society has been limited (Kandel and Subedi, 2004), butstill the important role that forests played in rural livelihoods,especially of the poor, is generally well recognized. The
Fourth National Workshop on Community Forestry in 2004focused on emerging issues related to poverty reduction.Poverty reduction is a major concern at global level and is
explicitly spelled out in the Millennium Development Goals(MDGs) of the United Nations. Community forestry isconsidered to have caused social and cultural change,
improved the livelihood of the locals and is believed to havepotential for poverty reduction. The present investigationaims to study whether community forestry has played the
role of good governance, gender equity and helped inreducing poverty.
MATERIAL AND METHODS
The primary data were collected by reconnaissance
survey, face-to-face interview or household survey, focusgroup discussion, key informants survey and directobservation. Different journals and bulletins, projects, I/
NGOs working in community forestry, China AgriculturalUniversity and Beijing Forestry University libraries, Internetsearch, e-forums & e-consultations were consulted to
gather secondary data. Data were edited, coded & fed intoand analyzed using MS-Excel. The data are shown in tableand bar graph for simplicity.
RESULTS AND DISCUSSION
Community forestry is directed from decentralization to
devolution, it has major contribution in socio-economic,
environmental and ecological aspects with the practice of
good governance that supports directly to the poverty
reduction and economic development of the nation.
Community forestry has become a means to increase
natural, social, human, financial, and to some extent the
physical capital of community forest users. National
Planning Commission has emphasized on poverty
reduction as a sole objective in 10th five year plan.
Development of CF improves environment in rural level and
create employment opportunity for poor group by developing
occupation based on timber and non-timber forest products
(NTFPs). CFUG based enterprises provide income and
employment for community members, and in many cases
jobs are prioritized for members of poorer households (Dev
et al., 2003), who are typically more vulnerable to food
shortages by nature of their socio-economic status. Eventhe leasehold program is included in the community forestry
where the poorest of the poor household or disadvantagedgroups (DAGs) can easily get the land free of cost andcultivate cash crops, non timber forest products and others
as their need and improve their livelihood. With the revolvingfund of community forestry, the users can rear goats, growvegetables and other cash crops in their own land too to
earn their living. Perception of users toward communityforestry, its uses and management is given in Table 1 andFig 1.
According to Pokharel and Niraula (2004), CF in Nepaloffers many examples of good governance such asdecentralized decision-making, participatory management
of resources, and equitable sharing of benefits. Government,nongovernmental and private sector agencies at servicedelivery level have become more accountable to the forest
users. More than 80 per cent of the Nepalese people dependon forest resources to support their livelihood. Goodgovernance is, therefore, crucial for providing equitable
access to and benefits from forest resources to all peopleincluding the poor and the marginalized. With participationfrom various sections of society, there will be better
community forest management and reduced conflicts. Wellfunctioning of CFUGs will eventually lead to sustainabilityof community forestry. Participation from different segments
of society, particularly women, poor and dalits is ensured toreflect their concerns and raise ownership feeling in thecommunity forestry management process. It was seen that
the government staffs, committee members and usergroups have commitment and accountability as per theassigned tasks/responsibilities. Auditing, sharing in yearly
general assembly, income transaction record keeping,meeting minutes reflect the transparency. Active participationin management, planning, decision making process,
monitoring and evaluation was seen in the communityforestry.
The Master Plan for the Forestry Sector,1989, has
adopted to balance the interests of both men and women.It is therefore emphasized that there should be equal accessof men and women in decision making processes.
Recognizing the importance of women’s participation incommunity forestry, forestry policy has focuses onenhancing the wider participation of women in decision
making and benefit sharing. Now-a-days, out of three mainpositions in a committee, (chairperson, secretary andtreasurer) at least one should be woman. The woman has
twin works of reproduction and taking care of the house.The community forestry is the only forestry activity activitiesin Nepal where both male and female are brought under
G. C. Dhruba Bijaya

171
Table 1. Perception of users (%) towards community forestry, its uses, management, committee members.
S. Questions Poor Medium Rich
No. Yes No Don’t Yes No Don’t Yes No Don’t
Know Know Know
1. Is CF beneficial for you? 83 15 2 91 7 2 96 3 1
2. Do you take part in CF 79 21 0 91 9 0 85 15 0
activities?
3. Do you think that there is 88 10 2 95 5 0 97 3 0
transparency in fund
mobilization?
4. Do you think that there is 77 13 10 87 7 6 89 10 1
equity in forest products
distribution?
5. Do you think that woman 82 6 12 93 3 4 95 3 2
and poor are included in
decision making process?
6. Do you think that CF 90 6 4 88 7 5 92 8 0
improves livelihood and thus
help to reduce poverty?
one umbrella to work together. About 10-15% of thecommunity forestry in Nepal are managed solely by womenonly. It was seen that community forest led by women only
was more successful and earned more revenue ascompared to led by men only. Women are increasinglyparticipating in user groups meetings and women
members in the local bodies have contributed further toenhancement of community forestry.
The critical role of Community Forestry in particular and
forestry in general in fostering social and economicdevelopment in Nepal’s rural areas has already drawnsome attention. The Community Forestry has been a cook-
book solution for conserving the forest of mid-hills of Nepal.
Community Forestry has not only helped to conserve
biodiversity and improve the environment and mitigate the
global warming but it has really become a boon for the
users, especially the poor. The socio-economic upliftment
and conservation of natural resources is achieved if people
become aware of their roles and responsibilities. CF is not
just a special technology rather a process of socio-economic
change that requires a continuous participation of the
community in planning, implementing and problem solving
(Kayastha, 1991). But in some places, the poor are often
restricted to using forest and tree resources only to help
mitigate poverty while the local elites and outsiders are
able to harness the same resources, either legitimately or
Fig. 1. CF helps in povert reduction, good governance and gender equity.
Community Forest for Biodiversity Convservation

172
illegally, in order to accumulate wealth. So this should becontrolled by increasing the level of awareness, participation
of women and disadvantaged groups. The CFs have beenpracticing decision making processes and leadership, andfunction equitably in cost and benefit sharing mechanism.
CFUGs have identified disadvantaged households and aresupporting household level livelihoods plans for theirdisadvantaged members to uplift their livelihood. A good
management of NTFPs have great potential for contributingto the national poverty alleviation programs and alsomaintaining the diversity of the forest ecosystem under
community forest management. The forest should bemanaged both scientifically and technically as well associally benefitted. Further researches on different aspects
of forestry like technical, social, etc. should be conductedfor the benefit of the forest and the users too. Thesuggestions and recommendations made by researchers,
technicians and forestry personnel should be checked andimplemented by the government and forest department.Above all, everything is good if we use it wisely and
sustainably but if we misuse it, the diamond will also be
valueless. Therefore, to protect environment and uplift usersand make them active the community forestry has really
played an important role and to make it sustainably is therole of us Nepalese people.
REFERENCESDev, O. P., Yadav, N. P., Springate-Baginski, O. and Soussan, J.
(2003) Impacts of community forestry on livelihoods in themiddle hills of Nepal. J. For. and Livelihood 3:64–77.
Kandel, B. R. and Subedi, R. (2004) Pro-poor Community Forestry:Some Initiatives from the Field. Proc. of the Fourth NationalWorkshop on Community Forestry, 4-6 August, 2004,Kathmandu.
Kayastha (1991) Elements of Community Forestry in Nepal,Kathmandu. Majesty’s Government of Nepal.
Pokharel and Niraula (2004) Community Forestry Governance inNepal: Achievements, challenges and options for the future.In: K.S. Kanel, P. Mathema, B. R. Kanel, D. R. Niaurla, A.R.Sharma and M. Gautam (eds.) Twenty Five Years of CommunityForestry. Proceeding of the Fourth Workshop on CommunityForestry, Dec. 2004 Community Forestry Division, DOF,Kathmandu, Nepal http://www.rainforestinfo.org.au/good_wood/comm_fy.htm.
G. C. Dhruba Bijaya

Slugs and snails (gastropods) are widely distributedthroughout the world and occasionally become serious
pests. In India, about 9 species of snails and 14 species ofslugs have been reported to cause damage to ornamentalplants, vegetables and horticultural crops and orchids, viz.rice, coffee, tea, tobacco, potato, sugarcane, cosmos,chrysanthemum, lady finger, beans and fruits (Jagtap, 2000),yet scanty attention has been paid towards studying the
extent of damage by these pests in the country.
Commercial nurseries are serving the farmingcommunity by providing planting material of wide range of
crops like vegetables, fruits, flowers, ornamental andplantation crops. These crops are important source of farmincome and fits well in crop diversification (Anonymous,
2003). Slugs and snails are common in almost everyecosystem and particularly in nurseries where idealhabitats are available. Plant damage normally occurs after
dark when moisture levels are higher and temperaturesare lower. During the day, slugs and snails usually hide in amoist dark place unless there is ample shade and high
levels of moisture.
Preliminary studies conducted by Kaur and Kaur (2003)indicated that black/brown slug with mid-dorsal streak,
Filicaulis alte (Ferrusac) inflicted three types of damage toseedlings/saplings of vegetables and flower plants inlaboratory feeding tests viz. leaves eaten from the margins,
consumption of whole upper portion of seedling and stemgirdling with resultant wilting of plants causing damage tosponge gourd (53%), coriander (69%), cabbage (75%),
cauliflower (20%), brinjal (51%), spinach (48%) and to flowerseedlings viz., zinnia (58%), portulaca (59%), balsam (69%)
Nature and Extent of Damage Inflicted by Gastropods to Saplings ofSome Ornamental Plants in Plant Nurseries at Ludhiana (Punjab)
H. Kaur and E. ChhabraDepartment of Zoology, Punjab Agricultural University, Ludhiana-141004, Punjab, India
Abstract: Slugs and snails are common in almost every ecosystem and particularly in nurseries with ideal habitats. Three commercialplant nurseries were surveyed for Gastropod (slugs and snails) infestation and damage inflicted by them to various ornamental plantsaplings. Two snail species viz., Macrochlamys indica GA and Macrochlamys (Euaustenia) cassida Hutton and one slug species i.e.,Filicaulis (Eleutherocaulis) alte (Ferrusac) with two biotypes viz., brown colour with black spots and caterpillar like excavated irregularholes within the leaves and on the margins. Maximum mean per cent plants attacked by gastropods were 81 in Dracaena green and moneyplant (Pothos), 58 in Dracaena mixed, 74 in Dracaena brown, 76 in Dieffenbachia, 71 in Song of India (Pleomle reflexa), 55 inbougainvillea (Bougainvillea sp.), 57 in selum (Phyllodendron var. selum), 61 in ribbon grass (Phalaris), 44 in poinsettia (Pulcherrimaeuphorbia), during April and 72 in Dracaena brown, 75 in Dracaena mixed, 80 in Dieffenbachia, 36 in money plant (Pothos), 31 in ribbongrass (Phalaris) during September. Control measures are essential during these months to minimize damage inflicted by these gastropods.
Key Words: Plant nurseries, Gastropods, Filicaulis alte, Macrochlamys indica
and marigold (97%). Same type of damage was inflicted bythe other biotype of F. alte i.e., the brown slug with black
spots but to somewhat less extent viz. sponge gourd (47%),coriander (34%), cabbage (56%), brinjal (22%), spinach(33%), cauliflower (20%) and to flower seedlings viz. zinnia
(41%), portulaca (32%), balsam (33%) and marigold (73%)(Kaur, 2007) indicating it’s less destructive nature ascompared to black/brown slug with mid-dorsal streak.
Laevicaulis alte has been found infesting neem seedlingsin forest nurseries of Rajasthan and Gujarat (Kumar etal.,1998).
During survey of three plant nurseries at Ludhiana, two
snail species viz. Macrochlamys indica and Macrochlamyscassida (Euaustenia) and one slug species i.e., F. alte(Ferrusac) with two biotypes viz. brown colour with black
spots and caterpillar like were noticed. Out of these
gastropods, snail M. indica and slug biotype brown colour
with black spots were predominant in all the three plant
nurseries. So far no damage assessment has been done
in plant nurseries in Punjab. Hence, present studies were
undertaken to study the nature and extent of damage inflicted
to ornamental plant saplings in three commercial plant
nurseries at Ludhiana, so that the effective timings for
gastropod control in plant nurseries can be determined.
MATERIAL AND METHODS
Three commercial plant nurseries viz. Bengal nurseryand Suman nursery, Pakhowal Road and Carewell
nurseries and flowers, New Rajguru nagar, Ferozepur roadat Ludhiana were surveyed to study the nature and extent ofdamage inflicted by gastropods to ornamental plants
Indian J. Ecol. (2011) 38 (Special Issue) : 173-177Indian Journal
of Ecology

174
saplings. Three replicates (each 10 m2) size for eachornamental plant type were undertaken. Plants were
observed carefully for gastropod damage at three weeksinterval in each nursery. Total plants in rows along withdamaged ones were counted in each replicate. Mean per
cent damage to various ornamental plant saplings bygastropods was arc sine or angular transformed intodegrees.
RESULTS AND DISCUSSION
Results of assessment of damage inflicted bygastropods to ornamental plant saplings in threecommercial plant nurseries are presented in Table 1, 2
and 3, respectively. Gastropods carved irregular holes withinthe leaves or on the margins of the plant saplings fromMarch to October as animals were in hibernation from mid
November to February.
Dracaena
Three varieties of dracaena were found in Sumannursery viz. brown, green and mixed but only two varieties
viz. brown and green were found in Bengal nursery andCarewell nurseries and flowers. The gastropods carvedirregular holes in the interior portion of leaves of all varieties
of Dracaena saplings.
Dracaena brown. Mean per cent infested plants bygastropods were above 71.6 per cent in the month of April
in Bengal nursery and Care well nurseries and flowers.
Damage declined afterwards to 44-49 per cent in July (Table1 and 2). However damage again increased to 72.3 per
cent in Care well nurseries and flowers (Table 2) and 59.3per cent in Bengal nursery in September (Table 1), whichdeclined to about 41-49 per cent up to October. However, in
Suman nursery 35 per cent plants were found damaged inMarch. Extent of damage increased again and wasmaximum in May (60%). It declined afterwards to 28.3 per
cent in August. 56.6 per cent plants were damaged inSeptember (Table 3). Maximum damage was observed inCare well nurseries and flowers i.e., 73.6 per cent in April
(Table2).Overall damage was less in Suman nursery ascompared to other nurseries. This might be due to lessdensity of gastropods.
Dracaena green. Gastropods in Bengal nurseryinfested maximum plants (81.3%) in April. Mean per centdamage declined afterwards to 46 per cent in June which
again increased to 52 per cent in July and declined to 35.33per cent in August. Damage again increased to 49.33 percent in September. However, mean per cent damage
declined afterwards and was 20 per cent in November(Table 1).
In Carewell nurseries and flowers, gastropods infested
mean per cent plants were 63.33 per cent in April. In May,damage declined to 47.6 per cent, however, it increasedafterwards and was maximum (67.3%) in July. No damage
was noticed in August. However, gastropods damaged 56.6per cent in September and damage reduced to 41 per cent
Table 1. Mean per cent damage inflicted by Gastropods to some ornamental plants per 10 m2 per replicate at Bengal nursery,Pakhowal road, Ludhiana
Ornamental Per cent plants with damage/row/replicate (Mean ± SE)
Plants
14-April 5-May 16-June 7-July 18-August 8-September 21-October 10-November
Dracaena 81.3 ±1.33 56.6±6.39 46±2.08 52±5.5 35.33±2.18 49.33±3.18 45.33±3.18 20±2.64
(Green) (64.2) (48.7) (46.1) (46.1) (36.3) (41.6) (42.1) (26.6)
Dracaena 71.6 ±2.60 54.3±5.23 53.3±1.86 49.3±3.18 50.67±2.03 59.33±4.98 49±2.89 -
(Brown) (57.8) (47.3) (46.7) (44.4) (48.7) (50.2) (44.4)
Croton 19±2.64 16±2.30 16± 4.04 - - - - -
(25.8) (23.6) (23.6)
Song of India 71.3±3.28 11.6±3.75 11.33±6.74 - - 5 ± 4.04 - -
(Pleomele reflexa) (57.4) (19.9) (19.4) (12.9)
Bougainvillea 54.6±3.52 - - - 15±2.54 3.66±2.03 - -
(Bougainvillea sp.) (47.6) (22.8) (10)
Money plant 80.6±5.45 - - 32.3±0.88 43.3±2.03 36.6± 5.04 29.3±5.84 -
(Pothos) (63.8) (34.4) (41.0) (37.2) (32.6)
Salem 56.6±5.45 7.33±1.76 6±3.21 - - 6.33 ±2.96 - -
(Phyllodendron (48.7) (15.3) (14.2) (14.2)
var.selum)
* Figures within parenthesis are angular transformation of per cent to degrees.
H. Kaur and E. Chhabra

175
in October (Table 2). Mean percent plants damaged bygastropods in Suman nursery were 20 per cent in March.
Damage increased afterwards and was maximum (48%)in May but declined to 42.6 per cent in June. In July, damagewas 47 per cent, which declined afterwards to 22.6 per cent
in October (Table 3). More damage was observed in Bengalnursery i.e., 81.3 per cent in April as compared to Care wellnurseries and flowers. This might be due to more density
of brown slug with black spots in Bengal nursery, whichpreferred Dracaena green variety.
Dracaena mixed. In Suman nursery gastropods
damaged 24.3 per cent plants in March. Damage increasedto 58.3 per cent in April, which declined afterwards to 41 percent in June. However, damage increased afterwards and
was maximum (75%) in September. It declined to 30 percent in October (Table 3).
These studies revealed that for protection of Dracaena
brown and green varieties from gastropod control measuresshould be adopted in months of April and September andfor Dracaena mixed in September.
Poinsettia (Pulcherrima euphorbia)
In Suman nursery, 27.7 per cent damage was seen inMarch that increased to 44.2 per cent in April and May.Damage was seen in the form of leaves eaten from the
margins and also holes within them. No damage was seenin June and July and about 24 per cent damage was noticedin August. No damage was seen afterwards (Table 3).
Gastropod damage control measures should be adoptedin April-May.
Croton (Codiaeum variegatum pictum)
Gastropods mainly ate margins of leaves. 13.7 per centdamage was noticed in Suman nursery in the month of
March that increased to 33.3 per cent in April, which againdecreased to 23.6 per cent in May and more afterwards(Table 3). However, little damage i.e., 16-19 per cent was
seen in the months of April to June and none afterwards inBengal nursery (Table 1). Hence gastropods should becontrolled in April.
Bougainvillea (Bougainvillea sp.)
Damage was in the form of holes in leaves. Mean per
cent damage was 38.8 per cent in the month of April that
declined to 10.3 per cent in May in Suman nursery (Table 3)
and no damage was observed afterwards. However, 54.6
per cent damage was observed in April in Bengal nursery
(Table 1). No damage was seen from May to July and October
onwards. Little infestation was seen in August-September.
So plants should be protected from gastropods in April.
Dieffenbachia
In Dieffenbachia, gastropods excavated holes withinleaves and margins were also eaten. In Care well nurseries
and flowers, maximum damage (76%) was seen in themonth of April that declined to 56 per cent in May and againincreased to 70 per cent in June. There was decline in plant
infestation afterwards to 54.6 per cent in September. Only36.6 per cent damage was seen in October (Table 2). InSuman nursery, about 27 per cent damage was seen that
Table 2. Mean per cent damage inflicted by Gastropods to some ornamental plants per 10 m2 per replicate at Care well nurseries andflowers, New Rajguru nagar, Ferozepur road, Ludhiana
Ornamental Per cent plants with damage/row/replicate (Mean ± SE)
Plants
28-April 19-May 30-June 21-July 11-August 22-September 13-October
Dracaena 73.6 ±2.03 65.3±3.48 60 43.6±5.36 - 72.3±3.52 41±6.81
(Brown) (59.0) (53.7) (50.8) (41.3) (58.1) (39.8)
Dracaena 63.3 ±2.33 47.6±8.23 20±2.64 67.3±11.7 - 56.6±8.82 41±6.81
(Green) (52.5) (43.6) (26.6) (48.7) (54.9) (39.8)
Dieffenbachia 76 ±3.21 56± 7 70 61±4.04 61.3±8.64 54.6± 8.25 36.6 ±7.21
(60.7) (48.7) (56.8) (51.4) (51.4) (47.6) (37.2)
Bougainvillea - 7 ±1.732 26.6±8.82 19.3±4.10 - 16.3±4.10 16±7.80
(Bougainvillea sp.) (13.9) (31.0) (25.8) (23.6) (23.6)
Money plant 53.3± 8.82 - - 30±8.39 - - 22.3±5.90
(Pothos) (46.7) (33.2) (28.0)
Ribbon grass 61.3±1.45 63.3±1.76 54.33±2.33 - 31±4.04 - 14.33 ±3.38
(Opheopogon (51.4) (52.5) (47.3) (33.8) (22.0)
jaburan variegated)
* Figures within parenthesis are angular transformation of per cent to degrees.
Damage of Gastropods on Ornamental Plants

176
increased to 54 per cent in May. Damage declinedafterwards and was 39 per cent in August that again
increased to 80 per cent in September. 42 per cent damagewas seen in October (Table 3). Gastropod control measuresshould be adopted during April to July and September.
Ribbon grass (Phalaris)
Margins of leaves were eaten leading to the gradualdestruction of the whole plant. About 61 – 63 per cent damagewas observed in April-May that declined to 54.33 per cent in
June and 31 per cent in August. Little damage (14.33%)was seen in October in Care well nurseries and flowers(Table 2).
Money plant (Pothos)
Damage in money plant was in the form of irregularholes in leaves and margins of leaves were also eaten. InBengal nursery, 80.6 per cent leaves were eaten in April.
Damage was 32.3 per cent in July that increased to 43.3per cent in August and again declined afterwards (Table 1).In Care well nurseries and flowers, 53.3 per cent damage
was seen in April that declined to 30 per cent in July. Littledamage (22.3%) was recorded in October. No damage wasseen in May and June in both nurseries (Table 2). Hence,
gastropods should be controlled in April to protect moneyplant. More damage was observed in Bengal nursery as
compared to Care well nurseries and flowers. This mightbe due to more population of slugs in Bengal nursery which
preferred money plant leaves more.
Song of India (Pleomele reflexa)
Irregular holes in leaves were noticed. 71.3 per centsaplings were damaged in Bengal nursery in April but
damage declined to 11 per cent in May and June. No damagewas noticed in July and August. However little damage wasnoticed in September (Table 1). Gastropods should be
controlled in April to protect Song of India
Salem (Philodendron var. Salem)
Irregular holes were noticed in Bengal nursery, 56.6%plants were damaged in April, however, little damage was
noticed afterwards. Leaves were destroyed heavily (Table 1).Gastropods should be controlled during month of April.
Begonia (Begonia nemperthneuse)
Thirty six per cent damage was seen in Suman nursery
in April only (Table 3). However, no damage was observedin case of saplings of plants like Areca palm(Chrysaledocarpus lutescens), Christmas tree (Piceaabies), Yucca palm and Narangi (Citrus reticulata). Thismight be due to their hardy leaves or alkaloid componentswithin them. Mean percent infestation of some plant type by
Table 3. Mean per cent damage inflicted by Gastropods to some ornamental plants per 10 m2 per replicate at Suman nursery, Pakhowalroad, Ludhiana
Ornamental Percent plants with damage/row/replicate (Mean ± SE)
Plants
31-March 14-April 5-May 16-June 7-July 18-August 8-September 21October
Dracaena 20±2.89 44.4±10 48±2.88 42.6±2.60 47±3.79 43±2.64 44±2.07 22.6±1.45
(Green) (26.6) (41.6) (43.9) (40.7) (43.3) (41.0) (41.6) (28.4)
Dracaena 35±2.88 55.5±10 60±2.08 54.6±3.48 52.3±3.18 28.33±2.60 56.6± 8.45 -
(Brown) (36.3) (48.1) (50.8) (47.6) (46.1) (31.9) (48.7)
Dracaena 24.3 ±8.17 58.3±7.35 56.6±4.98 41±2.08 44.3±5.45 50±3.46 75 30±1.73
(Mixed) (22.4) (49.6) (48.7) (39.8) (41.6) (45.0) (60.0) (33.2)
Croton 13.7±0.87 33.3±4.79 23.6± 2.03 - - - - -
(22.6) (35.4) (29.0)
Bougainvillea - 38.8±5.56 10.3±0.87 - - - - -
(Bougainvillea sp.) (38.4) (18.4)
Poinsettia 27.7±4.18 44.2±2.90 44±2.31 - - 24±1.53 - -
(Euphorbia (31.6) (41.8) (41.6) (29.3)
Pulcherrima)
Begonia - 36.1±7.35 - - - - - -
(Begonia (36.9)
nemperthneuse)
Dieffenbachia 21.7 ±2.4 44.4± 10 54±7.50 42.6±2.60 47.3±1.76 39± 7.5 80 42.6±2.60
(26.7) (41.6) (47.3) (40.7) (43.3) (38.6) (63.4) (40.7)
* Figures within parenthesis are angular transformation of per cent to degrees.
H. Kaur and E. Chhabra

177
gastropods varied in different plant nurseries which mightbe due to differences in shady conditions and slug
population. Similarly earlier studies reported that black orbrown slug biotype (Kaur and Kaur, 2003) and brown withblack spots biotype (Kaur, 2007) of slug F.alte showed no
feeding response towards seedlings of Kochnia, Coleus,Kalanga and Sadabahar in feeding tests under labortaryconditions. During these studies mainly damage was in
the form of holes within leaves or on margins in variousornamental plant saplings. According to Jagtap et al. (1990a& b) the damage inflicted may either be in the form of severe
defoliation or destruction of young plants. Raut and Ghosh(1984) reported that pestiferous gastropods fed on smallleaves, made holes in mature leaves, fed on leaf margins,
rasped the lower surface of thick leaves and bored minelike holes and tunnels in tubers, roots and bulbs. Liu et al.(1997) found that slugs mainly damage the leaves, flowers
and roots of the orchid plants.
These results, thus pointed out that brown slug withblack spots biotype, F.alte and snail, M.indica had a high
potential to cause heavy damage to saplings of ornamentalplants and thus more emphasis should be laid on savingthe plant saplings from these pestiferous gastropods in
commercial nurseries during months of April andSeptember.
REFERENCESAnonymous (2003) Package of Practices for Cultivation of
vegetables. Punjab Agric. Uni., Ludhiana. pp.1-79.
Jagtap, A. B., Mali, M. S. and Moholkar, P. R. (1990a) Use of chemicalbarriers for the control of pestiferous snails and slugs. Pestol.14(11):5.
Jagtap, A. B., Mali, M. S. and Moholkar, P. R. (1990b) Chemicalcontrol of slug, Laevicaulis alte Ferussac infesting cabbagecrop in Maharashtra. Pestol. 14(7):21.
Jagtap, A. B. (2000) Snails and slug problem of crops and theirintegrated management. In: (eds.) Upadhyay, R.K., Mukerji, K.G. and Dubey, O. P. IPM system in Agriculture, Key AnimalPests. Published by Aditya Book Pvt. Ltd, New Delhi, India. pp.309-322.
Kumar, S., Srivastava, K. K. and Ullah, A. (1998) Laevicaulis alteFerussac a severe pest of neem in Rajasthan and Gujarat.Indian For. 124: 351-353.
Kaur, H. and Kaur, A. (2003) Nature and extent of damage by theblack/ black brown slug to seedlings of some economicallyimportant plants. Pest Mgmt. Econ. Zool. 11(2):199-201.
Kaur, H. (2007) Nature and extent of damage inflicted by the brownslug, Filicaulis alte Ferussac to seedlings/ saplings of somevegetable and flower plants. Environ. Ecol. 25(3): 686-689.
Liu, T. S., Wang, W. J. and Lai, S. F. (1997) The occurrence andcontrol of slugs in orchidgardens Pl. Prot. Bull. Taipei 39(2):165-172.
Raut, S. K. and Ghosh, K. C. (1984) Pestiferous land snails of India.Technical Monograph No.11, Zoological Survey of India,Kolkata, 151p.
Damage of Gastropods on Ornamental Plants

Poplar is an important farm forestry tree species ofIndia with an estimated 30 million trees covering 0.06 million
ha (average density of 500 trees ha-1) in North WesternIndia (Chandra, 2001) with productivity of 30 m3 ha-1 perannum (Dogra, 1999). Poplar gives 1.125 million m3 of
industrial wood annually amounting to five per cent of thecountry’s total domestic wood requirement (Chandra, 2001).Wide spread acceptability of poplar as an agroforestry treein north western India is primarily attributed to its short
rotation (as compared to other trees) and winter deciduousnature (Newman, 1997). Prolonged leafless period (3-4months) makes poplar ideal for compatibility with intercrops
(Newman, 1997). However, the quality of the wood oftengets deteriorated due to insect pests attack. Both indigenousas well as exotic species of poplar are attacked by about
143 species of insect pests in north western India and about65 species alone were found to infest P. deltoides (Singh etal., 2004). Among the defoliators, Clostera cupreata (Butler),Clostera restitura (Walker) and Clostera fulgurita (Walker)often cause large scale defoliation of poplars and are wellestablished on P. deltoides in north western India. Large
scale defoliation of P. deltoides by Clostera sp. has beenreported from plantations (>1100 ha) in the central Tarairegion of northern India during 1980’s (Jha et al., 1991).
Sohi et al. (1987) reported epidemic defoliation of poplar byC. restitura in the Satluj river bed areas of Punjab. Simulateddefoliation studies have established that defoliation (>70
%) decreases the total biomass of poplar by about 33 percent (Reinchenbacker et al., 1996). Severe and repeateddefoliation of young plants (2-3 year old) of poplar by
defoliators result in their mortality (Singh and Singh, 1986).Complete loss of leaves, particularly in the growing season,
Clostera resitura (Walker) Larval Behaviour on Poplar(Populus deltoides) Clones
K. S. Sangha*, P. S. Shera1 and Gurmail Singh2
Department of Forestry & Natural Resources, 1Department of Plant Breeding and Genetics,2Department of Entomology, Punjab Agricultural University, Ludhiana-141004, Punjab, India
*E-mail: [email protected]
Abstract: The relative natural resistance/ susceptibility of 13 Populus deltoids clones ( USA, India and Australian origin) was evaluatedagainst its potential defoliators, Clostera restitura by single choice test at Forest Protection Laboratory, Department of Forestry andNatural Resources. The evaluation was carried out on the basis of actual leaf area consumed by the defoliator larvae. Eight clones,WSL22, WSL32, WSL39, PL5, S7C15, Udai, PL4 and PL2 were found resistant and the remained five, 65/27, PL3, Karanti, PL7 and PL1was susceptible to the defoliator. Biological parameters did not vary significantly among the clones indicating equal suitability and noadverse effect of clones on the larva and pupal period and their survival.
Key Words: Biological parameters, Defoliator, Populus, Resistance
is generally the most damaging as it renders the plant weakand exposes it to attack by other insects and diseases.
Among different methods of insect control, resistant/tolerantvarieties have played an important role in checking thepopulation build up of insect pests. Resistance to the pests
varies among clones, hybrids, cultivars and species of thePopulus. Screening of resistant clones are highly desirableso that, clones showing poor performance can be rejectedat nursery stage and the tolerant material would be
maintained pest free by using standard managementpractices. Keeping these points in view, the studies wereundertaken to identify of relatively resistant and susceptible
clones based on leaf consumption and to study biologicalparameters of C. restitura on the identified resistant clones.
MATERIAL AND METHODS
Relative natural resistance or susceptibility of 13 poplar
clones, viz, WSL 22, WSL 32, WSL 39, PL1, PL2, PL3, PL4,PL5, PL7, S7C 15, Udai, 65/27 and Karanti was evaluatedagainst defoliator, Clostera restitura by single choice test
on the basis of feeding potential, i.e. amount of foodconsumed by the insect under laboratory conditions. Theexperiment was carried out at Department of Forestry &
Natural Resources, Punjab Agricultural University, Ludhiana.A culture of C. restitura was maintained in the laboratory forthe experiments. The larvae of defoliator were collected from
the different poplar plantations and kept in glass jarscovered with muslin containing tender host leaves. The foodwas changed daily until pupation to maintain the culture of
C. restitura. The pupae obtained from these jars weretransferred to other glass jars having moist sponge sheetat the bottom. The males and females that emerged on the
Indian J. Ecol. (2011) 38 (Special Issue) : 178-182Indian Journal
of Ecology

179
same day were paired and released into split cage for matingand egg laying. Newly hatched larvae of uniform age were
used for the present study. Foliage of various clones wasassessed by releasing third instar larva in a petri dish on apre-measured leaf taken from the middle portion of 8-month-
old plant of each clone for maintaining homogeneity withinit. After 24 h of feeding, the leaf was again measured by leafarea meter and replaced with a new pre-measured leaf of
the same clone. The study was continued till the formationof pupae by all the larvae. The experiment was replicated 4times with each clone. The data was subjected to computer
analysis to calculate mean leaf area consumed by the larvaeper day for each clone, weightage percentage of resistanceand susceptibility. Weightage percentage of resistance
(WPR) and weightage percentage of susceptibility awerecalculated by applying the below given formula (Ahmed,1993):
Resistant and susceptible clones of poplar weregrouped into six categories by taking the value of the meanleaf area of each clone consumed by the larvae of C.restitura.
R1 = Most resistant = x < ( X -SD)
R2 = Resistant = ( X SD) < x < ( X -SD/2)
R3 = Moderately resistant = ( X -SD/2) < x < X
S1 = Most susceptible = x > ( X +SD)
S2 = Susceptible = ( X +SD) > x > ( X +SD/2)
S3 = Moderately susceptible = ( X ) > x > ( X +SD/2)
x = Mean leaf area consumed by larvae for each clone per day
X = Overall mean of leaf area consumed by larvae for all clone
per day.
SD = Standard deviation.
In another experiment, comparative developmentof poplar defoliator C. resitura was studied on resistantclones G 48, WSL 22 and S7C15 from the first experiment
in insect proof screen house made of galvanized wire-netting at Entomological Research farm, Punjab AgriculturalUniversity, Ludhiana. The different biological parameters
studied were duration of different larval instars, total larvalperiod, larval survival, pupal period and pupal survival of C.restitura. Twenty newly hatched larvae were taken from
reared culture. There were five larvae in each of the fourreplications for a clone. Larvae were kept individually in
separate plastic vitals containing leaves of different clonesof poplar. The number of larval instars was recorded onsample of 20 larvae. The time, when the larvae stopped
their activity and feeding, was considered to be near moultand appearance of exuva and head capsule confirmed theentrance of the larva into next stage. Larval period was
considered from the time of hatching till it stopped feedingto enter pupal stage. The numbers of larvae whichsuccessfully completed larval stage and entered pupal
stage were counted and survival percentage was workedout. The stage when pupae were formed to the emergenceof adults was taken as pupal period. The number of pupae
from which the adults emerged was counted and survivalpercentage was worked out. The experiment was carriedout in completely randomized design (CRD).
RESULTS AND DISCUSSION
Relative Resistance/ Susceptibility of PoplarClones against C. restitura
Mean leaf area of different clones consumed by thelarvae is arranged in descending order of magnitude inTable 1, and made the basis for calculating insect
resistance in each clone. The maximum and minimum leafarea consumed by the poplar defoliator per day were 22.13and 11.58 cm2, respectively with over all mean of 17.08 cm2
and standard deviation (SD) of 2.67. Clones werecategorized into six groups, R1, R2 and R3 as resistantand S1, S2 and S3 as susceptible groups. Out 13 clones, 8
were found resistant and remaining 5 were recorded to besusceptible.
Poplar clone WSL 22 was found to be most resistant
(R1) against C. restitura as only 11.58 cm2 of leaf area wasconsumed by the larvae and hence its weightagepercentage of resistance (WPR) was calculated as 100 per
cent. Three clones viz. S7C15, PL5 and Udai were adjudgedas resistant (R2). The average leaf consumption per dayon these clones were 14.71, 14.95 and 15.01 cm2 having
70.33, 68.05 and 67.48 per cent WPR, respectively. Fourclones, WSL 32, WSL 39, PL4 and PL2 were categorizedas moderately resistant (R3) having 50.23, 49.09, 48.34
and 45.30 per cent WPR and 16.83, 16.95,17.03 and 17.35cm2 leaf area consumed, respectively.
Poplar clones 65/27 and PL 3 were found to be the
most susceptible (S1) clones for the attack of C. restituraas 22.13 and 20.50 cm2 foliage was consumed by the larvaehaving 100 and 94.02 per cent weightage per cent of
susceptibility (WPS), respectively. Three clones, i.e. Karanti,
100 x [{Max. leaf area fed - leaf areafed of concerned clone }]Weightage % of
Resistance (WPR) (Max. leaf area fed-Min. leaf area fed)=
Weightage % of = 100 – WPR of concerned clone
susceptibility (WPS)
Larval Behaviour of Clostera resitura on Poplar

180
PL7 and PL1 were categorized as moderately susceptible(S3) clones. The leaf area fed by these clones was 18.28,
17.84 and 17.54 cm2 having 63.50, 60.85 and 59.33 percent WPS, respectively. Similar results with same set ofclones were recorded by Singh (2004). The overall
categorization was same although the order of clones w.r.t.resistance/ susceptibility category varied slightly in case ofC. fulgurita.
Tyagi and Khan (1993) conducted this type of study toscreen one hundred sixty clones of poplar for their relativeresistance to Pygaera cupreata Butler and on the basis of
maximum and minimum infestation the clones werecategorized from resistant to susceptible as EL-clones >D-clones > G-clones > other clones > ST- clones. Ahmad
(1993) evaluated 109 nine clones of P. deltoides for theirrelative resistance against its prime defoliator, C. cupreata.Clone 67 of USA was found to be the most resistant clone
with the weightage percentage of resistant as 100. All theclones were categorized into six homogeneous groups of13, 26, 19, 24, 14, and 13 in different categories i.e. R1, R2,
R3, S1, S2, and S3, respectively. Singh (2000) studied therelative susceptibility and resistance of 80 clones to C.cupreata larvae. Clone 110120 of Tennessee was the most
resistant where as Oklahoma clone 104 was mostsusceptible to this pest. Amongst the most resistant clones,WSL-4, WSL-12 and WSL- 18 were found to be superior, in
terms of growth increment as compared to the standardand most widely planted clones in the northern India (G-3
and G-48). Singh and Pandey (2000) screened 40 clonesof P. deltoides on the basis of feeing potential of secondinstar newly moulted larvae of C. cupreata. Clone G-48
followed by clones S4C2, 113413, 3567 and S13C14,
respectively, were ranked as most resistant clone. S7C8
followed by clone 113324, S7C1, 82-33-1, ST-124, D-75 and
82-26-5 were found to be most the susceptible. Singh (2002)
tested 39 poplar clones for their relative natural resistance
against the defoliator C. cupreata and results revealed that
Clone 14-15-6-1 (Mississippi) was the most resistant and
clone 77-26-7-1 the most susceptible. Singh and Pandey
(2002) evaluated relative natural resistance/susceptibility
of 45 P. deltoides clones against its potential insect
defoliator, C. cupreata, in Northern India. Seven American
clones (D-171 > 82-42-5 > 3167 > 3324 > S7C13 > D-273 >
S7C4) lying amongst the first 12 clones at the resistant end
were identified as promising clones based on their superior
growth performance and survival in the field plantations.
Comparative Development of C. restitura
Based on categorization of clones according to Ahmad(1993), clones WSL 22, S7C15 and PL5 were relatively more
resistant to C. restitura. To ascertain the effect of clones onbiological parameters, one generation of C. restitura was
Table 1. Relative resistance / susceptibility (weightage %) of poplar clones against poplar defoliator, Clostera restitura measuredalong with mean leaf area fed (cm2)
Clones Mean leaf area fed (cm2) WPR / WPS Resistance category
Most Resistant Clones
WSL 22 11.58 100.0 R1
Resistant Clones
S7C15 14.71 70.33 R2
PL5 14.95 68.05 R2
Udai 15.01 67.48 R2
Moderately Resistant Clones
WSL 32 16.83 50.23 R3
WSL 39 16.95 49.09 R3
PL4 17.03 48.34 R3
PL2 17.35 45.30 R3
Most Susceptible Clones
65/27 22.13 100.0 S1
PL3 21.50 94.02 S1
Moderately Susceptible Clones
Karanti 18.28 63.50 S3
PL1 18.00 60.85 S3
PL7 17.84 59.33 S3
‘X =17.08 Standard Deviation =2.67
WPR - Weightage percentage of resistance
WPS - Weightage percentage of susceptibility
K. S. Sangha, P. S. Shera and Gurmail Singh

181
studied on relative resistant clones (WSL 22, S7C15 andPL 5).
Duration of larval instars. Duration of larval instars did
not differ significantly when C. restitura was reared on threedifferent clones of poplar, i.e. G48, WSL 22 and S7C15 (Table2). The duration of first, second, third, fourth and fifth larval
instar was 3.06±0.06, 2.06±0.06, 3.13±0.31, 2.88±0.41 and4.50±0.20 days on PL5; 2.50±0.29, 2.29±0.17, 2.58±0.17,2.92±0.42 and 4.04±0.27 days on WSL 22; and 2.67±0.24,
2.25±0.25, 2.46±0.21, 4.00±0.41 and 4.71±0.17 days onS7C15, respectively.
Larval period and survival. The total larval period on
PL5, WSL 22 and S7C15 was 15.63±0.46, 14.33±0.51 and
16.08±0.49 days, respectively. However there were no
significant differences among the three clones. The survival
of larvae of defoliator was 50.0, 45.0 and 40.0 per cent when
reared on PL5, WSL 22 and S7C15 clones, respectively
with non-significant differences between the three (Table
3).
Pupal period and survival. The differences in pupal
period among different clones of poplar were non-significant (Table 3). The duration of pupal period was8.40±0.18 days on PL5, 9.33±0.51 days on WSL; and 22
9.75±0.75 days on S7C15.The survival of the pupae did notdiffer significantly among different poplar clones (Table 3).It was observed to be 75.0, 87.5 and 87.5 per cent on PL5,
WSL 22 and S7C15 clones, respectively.
The results of present investigation were in conformitywith the findings of earlier workers. Mann (1982) studied
various biological parameters of C. restitura and reported
the incubation period, larval period, pre-pupal period andtotal life cycle was 5-6, 38-55, 3-4 and 46-55 days,respectively. Sohi et al. (1987) reported incubation period,
larval period, pupal period and total life cycle of C. restitura,5-7, 25-30, 4-7 and 30-45 days, respectively. Sangha et al.(2005) studied the biology of C. restitura and reported the
larval, pupal and total life cycle of the insect varied from11.5-25.9, 5.7-8.5 and 22-30 days, respectively.
Damage index given by Ahmad (1993) help in
categorization of the clones based on standard deviationsand mean of the leaf consumed by the larvae during 24 h. Inpresent study the clones were categorised into five different
categories. Study of one generation of C. restitura on WSL22, S7C15 and PL5 (relative resistant clones) revealed nonsignificant differences among biological parameters. Thisindicated that there should be other better method/
technique for evaluating resistance/susceptibility.
REFERENCESAhmad, M. (1993) Relative resistance in different clones of Populus
deltoides to poplar defoliator Clostera cuperata (Lepidoptera:Notodontidae). Ann. For. 1: 1-12.
Chandra , J. P. (2001) Scope of poplar cultivation. Indian For. 127:51-60.
Dogra, A. S. (1999) Productivity of poplar plantations in Punjab. Asurvey. In: Abstracts of National Seminar on Poplars, 25-27th, November 1999, Forest Research Institute, Dehra Dun,India.
Jha, K .K., Gupta, C. and Verma, R. S. (1991) Field testing of fewpromising clones of poplar in Tarai. Indian J. For. 14: 83–89.
Mann, G. S. (1982) Pygaera restitura Walker (Notodontidae:Lepidoptera) a pest of poplars at Ludhiana, Punjab. IndianFor. 108: 237-238.
Table 2. Duration of larval instars of C. restitura on different poplar clones
Clones *Mean duration of different larval instars (days)
I II III V IV
PL5 3.06±0.06 2.06±0.06 3.13±0.31 2.88±0.41 4.50±0.20
WSL 22 2.50±0.29 2.29±0.17 2.58±0.14 2.92±0.42 4.04±0.27
S7C15 2.67±0.24 2.25±0.25 2.46±0.21 4.00±0.41 4071±0.17
CD (p= 0.05) NS NS NS NS NS
* Mean± SE of 20 Observations
Table 3. Total larval period, pupal period of C. restitura and their per cent survival on different poplar clones
Clones Larval duration (days) Pupal period (days)
Mean ±SE* Survival (%) Mean±SE* Survival (%)
PL5 15.63±0.46 50.00 (44.98) 8.40±0.18 75.00 (67.47)
WSL 22 14.33±0.51 45.00 (42.10) 9.33±0.51 87.50 (78.72)
S7C15 16.08±0.49 40.00 (38.93) 9.75±0.75 87.50 (78.72)
CD (p= 0.05) NS NS NS NS
* Mans± SE of 20 observation; figures in parentheses are arc sine values
Larval Behaviour of Clostera resitura on Poplar

182
Newman, S. M. (1997) Poplar agroforestry in India. For. Ecol.Manage. 90: 13-17.
Reinchenbacker, P. R. and Schultz, R. L. and Hart, E. R. (1996)Artificial defoliation effect on Populus growth, bio-massproduction and total non-structural carbohydrateconcentration. Environ. Biol. 25: 632-642.
Sangha, K. S., Shera, P. S. and Makkarm, G. S. (2005) Biology ofleaf defoliator, Clostera restitura (Walker) (Lepidoptera:Notodontidae) on Poplar. J. Insect Sci. 18 (2): 47-51.
Singh, A. P. (2000) Relative natural resistance in Populus deltoidesclones against defoliator, Clostera cuperata (Lepidoptera:Notodontidae) in northern India. Agrofor. Syst. 49: 319-326.
Singh, A. P. (2002) Relative natural resistance of newly introducedPopulus deltoides clones in India against defoliator, Closteracupreata. Indian For. 128: 307- 312.
Singh, A. P. and Pandey, R. (2000) Natural resistance of Populusdeltoides clones against the defoliator, Clostera cuperata innorth-western India-1. Indian For. 126: 619-623.
Singh, A. P. and Pandey, R. (2002) Natural resistance of Populusdeltoides clone selection to defoliator Clostera cupreata (Lep.,
Notodontidae) in northern India: relative pupal weight as aneasier criteria for accurate evaluation. J. Appl. Ent. 126: 475-480.
Singh, A. P., Bhandari, R. S. and Verma, T. D. (2004) Importantinsect pests of poplar in agroforestry and strategies for theirmanagement in north-western India. Agrofor. Syst. 63: 15-26.
Singh, K. (2004) Bioecology and management of poplar leafdefoliator, Clostera fulgurita (Walker) (Notodontidae:Lepidoptera) on poplar. (Unpublished) Ph D. Dissertation PunjabAgricultural University, Ludhiana.
Singh, P. and Singh, S. (1986) Insect Pests and Diseases ofPoplars. Dehra Dun UP, India: FRI and Colleges Publications,74 p.
Sohi, A. S., Singh, H. and Sandhu G. S. (1987) Clostera restitura(Walker) (Lepidoptera: Notodontidae) a defoliator of Poplar(Populus sp.) in the Punjab and its chemical control. J. TreeSci. 6(1): 30-33.
Tyagi, A. K. and Khan, M. A. (1993) Infestation of Pygaera cupreata(Notodontidae: Lepidoptera) on different clones of poplar inTarai region of Uttar Pradesh and its multiple egg parasitization.Indian For. 119: 63-70.
K. S. Sangha, P. S. Shera and Gurmail Singh

The state of Jammu and Kashmir is located in the
North-Western corner of India, stretching between 32o-17’
N to 37o- 05’ N latitude and 72o- 31’E to 80o- 20’ E longitude.
The mountainous region is characterized by diverse
ecosystem with respect to relief and agro-climatic
situations. The state occupies total geographical area of
22.223 m ha, half of which is under the illegal occupation of
Pakistan and China. The region comprises of diverse
natural vegetation ranging from lush green conifers on
gentle slopes of high altitudes, scrub jungles in the foot
hills to deciduous flora on southern slopes of Shiwaliks
and Pir Panjal ranges. The total forest cover in the state is
2.023 m ha (Anon., 2009) accounting to 19.95 per cent,
which is far below the National Forest Policyrecommendations. The three distinct agro-climatic regions
namely, sub-tropics of Jammu, temperate of Kashmir Valleyand cold arid region of Ladakh have witnessed exponentialgrowth in human and livestock population, rapid
industrialization and a spurt in developmental activities.
Short Rotation Forestry in Jammu and Kashmir: Options andOpportunities
S. K. GuptaDivision of Agroforestry, FOA, SKUAST - Jammu, Chatha–180 009, India
E-mail: [email protected]
These have resulted in loss of forest area accompanied by
an overall degradation of forest crop and forest soils.
Per capita forest cover has also witnessed a sharp
decline from 0.85 ha in 1947 to 0.20 ha in 2009 due to rapid
population growth. Total growing stock in the region is
estimated to be 132.92 million m3 with an average annual
yield of 1.65 m3 contributed mainly by coniferous species
occupying 31.8 per cent of the total forest cover (Anon.,
2009). Pre-dominant species include deodar (Cedrus
deodara), kail (Pinus wallichiana), fir (Abies pindrow) and
chirpine (Pinus roxburghii) (Table 1).
Forests of the region are managed primarily for timberproduction besides sustaining many forest basedindustries like resin/turpentine, wooden works, silk, leathertanning, etc. The destructive causes to damage the forests
are illicit felling, encroachments, unauthorized grazing andforest fires. To overcome these problems massiveplantations have been raised on the pattern of Joint Forest
Table 1. Major forest types of Jammu and Kashmir
S. Forest type Area covered in sq km Dominant species
No. (% of total area)
1. Sub-Tropiocal Dry 807 (4) Found in lower reaches of Shiwaliks of Jammu region. ImportantDeciduous Forests species include Acacia catechu, Dalbergia sissoo, Acacia modesta,
Albizia spp., Salmalia malabarica, Eucalyptus spp., Dendrocalamusstrictus, etc.
2. Sub-Tropiocal Pine Forests 2732 (14) Located in upper reaches of Shiwaliks and outer Himalayas andinclude species like Pinus roxburghii, Albizia spp., Dalbergia sissoo,Olea cuspitata and other broad leaved as associates.
3. Himalayan Moist Temperate 8914(44) This type of forests are found in Chenab valley and commonForests associates are Cedrus deodara, Pinus wallichiana, Picea smithiana,
Pinus gerardiana, Abies pindrow, Juglans regia, Acer spp., Populusciliata, Prunus padus and other broad leaved species like Aesculusindica, Fraxinus floribunda, Quercus spp., etc.
4. Himalayan Dry Temperate 1378 (7) This include the main forests of Kashmir Valley with tree species likeForests Cedrus deodara, Pinus wallichiana, Picea smithiana, Pinus
gerardiana, Abies pindrow, Juglans regia, Acer spp., Prunus spp.,Aesculus indica and a typical under growth of Parrotiajacquementiana.
5. Alpine Forests 5716 (28) These forests are situated well above the main temperate zone.Common species are high level fir and kail, Junipers, Quercus spp.,Populus ciliata, Betula spp., Salix spp., Rhododendron and widevariety of wild flowers and grasses.
Source: Anon. (2009)
Indian J. Ecol. (2011) 38 (Special Issue) : 183-184Indian Journal
of Ecology

184
Management (JFM) by sharing its harvests among thepeople. Production of timber from the forests to the tune of
72.207 thousand m3 has been realized during 2008-09 withrevenue of 1,18.55 million. Total fire wood out turn during2008-09 was 99,98 tones by the forest department. Although,
commercial felling of green trees has been discontinued,mortality of trees due to natural causes is unavoidable suchas continuous and unrestricted grazing, deficit regeneration,
forest fires, invasive weeds, un-regulated tourist movement,lack of timely and appropriate silvicultural operations. As aresult, more than 40 per cent of forests in the state have
moved to the category of open forests.
Why Short Rotation Forestry (SRF)
Failure of the natural forests to regenerate, sustainingthe farmlands, forests and industries, meeting bio-energyneeds, conservation of biodiversity as well as naturallandscape and environmental mitigation, integration ofshort rotation species seems to be the only viable optionunder the present scenario. The traditional species of theregion including confers like Cedrus deodara, Pinusroxburghii, Abies pindrow, Picea smithiana and broad leavedlike Quercus spp. having rotation of more than 75 yearsand felling restrictions imposed in conventional forests,fail to meet the regional requirements. Thus, Short RotationForestry (SRF) aiming at the intensive culture of fast growinghardwoods at close spacing for a rotation period of 10-30years for energy or small timber is ecologically acceptable.
Short Rotation Forestry (SRF) is the only fastestsilvicultural practice to reforest vast areas of barren forestlands, deforested mountains, salty grounds, enhance farmincome, from subsidence farming and also to mitigateadverse influence of global climatic change (Christerssonand Verma, 2005). SRF offers better energy returns thanconventional forestry and coppice crops. Ravindranath etal. (2001) predicted that to meet the biomass demands by2015, 3.63 mha area has to be covered under SRF with0.12 m ha annually.
Choice of species. Choice of the species is the keycomponent in meeting the requirements of SRF. Speciesshould be native, naturalized and exotic as well. Theindigenous tree species suitable under SRF in differentagro-climatic situations of Jammu and Kashmir (India) aresummarised in Table 2.
Area available for undertaking SRF. Under theprevailing situations, the land areas to be put under SRFbe identified. Area under rehabilitation of degraded forestsunder various programmes in the state is 3,664 ha. Thestate also possesses 6.529 m ha as the cultural non-forestarea, which can be put to judicious use under the conceptof short rotation management. Agricultural lands including
farmer arable and pasture lands, marginal lands with lowopportunity costs for high yields to establish biomass basedenergy systems such as slopes, marginal and degradedones, and integration of SRF with traditional cereal and fruitcrops or grazing lands in different agro-ecological situationsare potential areas of concern and importance for SRF.
Future Strategies to Extend Area under SRF andProductivity
• Facilitation of local communities and big farmers to
take up SRF which in turn will generate employment
and reduce the pressure of import of wood /woodproducts.
• Institutional funding to promote farmer-industryrelationship in production forestry, the long gestation
activity.
• Leasing of degraded forest lands and non-forestedwastelands to co-operative societies, corporate houses
and interested individuals can promote the SRF.
• Availability of quality planting material of speciesselected for promotion under SRF.
• Development of SRF based farm forestry models for
different regions.
• Arrangement of credit facilities for these interventionsand developing organized market with policy planningat the state level.
• Setting up of a separate mission to manage Short
Rotation Forestry (SRF) as a viable renewable energy
source, etc.
REFERENCESAnonymous. (2009) Annual Administration Report. Statistics
Division, J& K Forest Department, 144 pp.
Christersson, L. and Verma, K. S. (2005) Short Rotation Forestry -An Alternative Silviculture. In: K.S. Verma, D.K. Khurana andL. Christersson (eds.) Short Rotation Forestry for Industrialand Rural Development. ISTS, Nauni Solan, India, pp. 21-27.
Ravindranath, N. H., Sudha, P. and Rao, S. (2001) Forestry forsustainable biomass production and carbon sequestration inIndia. Mitigation and Adaptation Strategies for Global Change6: 233-256.
Table 2. Indigenous tree species under SRF
Zone Species
Sub-tropical zone Albizia lebbeck, A. procera,Azadirachta indica, Morus alba,Eucalyptus spp., Leucaenaleucocephala, Populus deltoides,Acrocarpus fraxinifolius, Meliaazedarach, Bombax ceiba,Bamboo, etc.
Temperate and cold Populus cil iata, Salix spp.,arid zones Robinia pseudoacacia, Alnus
neplensis, Ulmus wallichiana, etc.
S. K. Gupta

In the developing countries like India, traditionally, trees
occupy a place of paramount importance in meeting thebasic needs of timber, fodder, energy, etc. Major portion ofwood now produced in the country comes from tree
plantations established outside the conventional forestareas. Plantation boom in the country occurred in 1979 afterthe establishment of Forest Development Corporations
(FDCs) in the states and launching of Social ForestryProjects with the help of external donors. India’sachievements in raising tree plantations in term of area
have been impressive and figures second in the world afterChina (Anon. 2001). Till 1997-98, the total area of treeplantations under different schemes was 28.28 m ha. Of
this, some 3.54 m ha were raised before 1980; 13.51 m haduring 1980s and the rest during the 1990s (Bansil, 2002).The current rate of planting is about 1.2 m ha.
The existing recorded forest cover in India occupiesabout 69.09 million ha, which is 21.02 per cent of the totalgeographical area of the country (FSI, 2009). In addition,
the tree cover of the country has been estimated as 92,769km2 (2.82 per cent of the country’s geographical area).Therefore, there is need to extend tree plantations on non-
forestry lands, which include in its fold, environmentalgoods and services like carbon sequestration, replacementof fossil fuels, bio-diversity conservation, soil and water
conservation and eco-tourism in addition to conventionalforestry products in which the participants share theeconomic values. There are number of multipurpose tree
species existing throughout the tropical and sub-tropicalparts of India. But the paucity of information on their naturalvariability, adaptability and growth performance in different
agro-climatic zones of Punjab have restricted their optimumutilization. The present study was therefore proposed toassess the performance of some selected indigenous and
fast growing exotic tree species and to select the promisingones for massive afforestation programme.
The field experiment was established at Agroforestry
Research Farm, Ladhowal (Ludhiana) during August, 2003.To evaluate the performance of 18 tree species. Ladhowal
Growth Performance of Different Multipurpose Tree Speciesunder Riverain Soils of Punjab
H.S. Saralch* and Tirath SinghDepartment of Forestry and Natural Resources, Punjab Agricultural University, Ludhiana-141 004, India
*E-mail: [email protected]
is located at 30°56‘N Latitude and 75°52‘E Longitude at a
mean height of 247 m above mean sea level. The soil of theexperimental area is sandy loam in texture. The pH of soilsranges from 7.7 to 8.2 and electrical conductivity between
0.16 to 0.21 dSm-1. In general, the experimental site comesunder Zone VI (Flood plain zone) of agro-climatic zones ofPunjab, the climate typically shows three distinct seasons
viz.; a hot dry summer (March-June), a warm rainy season(July-October) and a cool dry winter (November-February).The average annual rainfall is 750 mm and of this 80 per
cent occurs during the rainy season i.e., July-September.
The experiment was laid out in the completelyrandomized design with 18 tree species i.e. Acaciaauriculiformis, A. catechu, A. nilotica, A. auriculiformis prov.springvalle, Acrocarpus fraxinifolius, Albizia lebbeck,Anthocephalus cadamba, Bombax ceiba, Eucalyptustereticornis, Gmelina arborea, Holoptelia integrifolia,Leucaena leucocephala, Madhuca indica, Melia azedarach,Morus alba, Pongamia pinnata, Syzigium cuminii and
Terminalia arjuna in 4 replications at spacing of 6 m x 3 m.Biometric observations namely per cent survival, height(cm), collar diameter (cm) and crown spread (east-west
and north-south directions) were recorded for differentspecies in each replication during January 2005 (at the ageof 2.5 years). The growth data were analyzed statistically to
test the differences in growth at 5 per cent level ofsignificance.
Results pertaining to the survival and growth
performance of different multipurpose tree species arepresented in Table 1. Cent per cent survival was recordedin Acacia catechu, A. nilotica, M. azedarach, P. pinnata, S.cuminii and T. arjuna followed by 97.50 per cent survival inA. auriculiformis, A. auriculiformis prov. springvalle andGmelina arborea. Albizia lebbeck, Anthocephaluscadamba and Morus alba had significantly lower survivalrate i.e., 90.00 per cent to Acacia catechu, A. nilotica,Holoptelia integrifolia, Pongamia pinnata, Syzigium cuminiiand Terminalia arjuna. Minimum survival (72.50%) wasrecorded in Eucalyptus tereticornis. The variation in survival
Indian J. Ecol. (2011) 38 (Special Issue) : 185-187Indian Journal
of Ecology

186
percentage of the species can be ascribed to the geneticbehaviour of the species on riverain soil.
Plant height varied from 66.67 cm to 281.49 cm andthree species, Acacia catechu, Eucalyptus tereticornis andTerminalia arjuna exhibited better growth than other
species, whereas, Madhuca indica, Bombax ceiba, Albizialebbeck and Holoptelia integrifolia performed poorly. Fastgrowth is one of the important attributes of a successful
species, which ensures higher photosynthesis rate andleast competitions with weeds. This is also silviculturallyimportant attribute, which extends the time interval between
planting and successive first weeding operation in a stand.The fast growth of Acacia catechu can be attributed toinherent ability of the species to grow better under riverain
soil condition and also accelerated fixing of atmosphericnitrogen through symbiotic association with Rhizobiumbacteria in nodules on the roots. This can help the plants to
survive and grow fast on such soils. The nitrogen fixingability of Mimosoid species, especially Acacia species havebeen well documented in many earlier studies (Dubey etal., 2004; Kanmegne et al., 2000; Gera et al., 1996) to boostthe growth.
Collar diameter of different MPTs differed significantly
and it varied from 1.45 cm to 5.87 cm (Table 1). Maximumcollar diameter (5.87 cm) was observed in Terminalia arjunafollowed by Acacia catechu (5.65 cm) but as such, the results
were statistically at par with each other followed by
statistically lower values under Anthocephalus cadambaand Melia azedarach with collar diameter 4.33 cm and 4.02
cm, respectively. Minimum collar diameter (1.45 cm) wasrecorded in Acrocarpus fraxinifolius, which was statisticallyat par with Madhuca indica (1.50 cm), Albizia lebbeck (1.57
cm), Holoptelia integrifolia (1.59 cm) and Acaciaauriculiformis (1.61 cm). Collar diameter is a key indicatorof healthy stock, which in turn results in successful
establishment of seedlings after field planting. Diametergrowth indicates the adaptation of tree species to the site(Kanmegne et al., 2000). Growth in diameter and height is
a response of tree to its particular combination of heredityand environment (Singh et al., 2004).
Plant foliage spread varied from 68.12 cm to 266.86
cm. Maximum plant spread (266.86 cm) was recorded in
Acacia catechu, which was statistically superior than the
plant spread in Anthocephalus cadamba (185.58 cm) and
Terminalia arjuna (178.96 cm), the later two were statistically
at par with each other. Plant spread in Eucalyptus
tereticornis and Acacia nilotica formed the second group
with respective values of 161.00 cm and 148.88 cm. The
plant spread in Syzigium cuminii (107.39 cm) and Melia
azedarach (100.43 cm) was found to be statistically at the
par with each other. Minimum plant spread (68.12 cm) was
recorded under Madhuca indica followed by Pongamiapinnata (73.28 cm) and Leucaena leucocephala i.e., 76.04
cm. Under agroforestry system for proper utilization of
Table 1. Survival percentage and growth performance of different MPTs under riverain soils of Punjab
Name of the Species Survival Height Collardiameter Plant spread
(%) (cm) (cm) (cm)
Acacia auriculiformis 97.50 111.00 1.61 73.04
Acacia catechu 100.00 281.49 5.65 266.86
Acacia nilotica 100.00 195.92 3.55 148.88
Acacia auriculiformis prov. springvalle 97.50 139.30 2.29 81.93
Acrocarpus fraxinifolius 75.00 115.30 1.45 85.44
Albizia lebbeck 90.00 100.17 1.57 81.63
Anthocephalus cadamba 90.00 187.20 4.33 185.58
Bombax ceiba 82.50 92.45 2.08 86.20
Eucalyptus tereticornis 72.50 223.99 3.45 161.00
Gmelina arborea 97.50 157.56 2.78 93.61
Holoptelia integrifolia 100.00 103.77 1.59 90.17
Leucaena leucocephala 92.50 143.90 2.20 76.04
Madhuca indica 95.00 66.67 1.50 68.12
Melia azedarach 100.00 196.70 4.02 100.43
Morus alba 90.00 121.20 2.22 83.36
Pongamia pinnata 100.00 120.17 2.17 73.28
Syzigium cuminii 100.00 142.92 2.91 107.39
Terminalia arjuna 100.00 210.28 5.87 178.96
CD (0.05) 3.31 22.86 0.55 7.53
H.S. Saralch and Tirath Singh

187
natural resources and optimization, trees with less canopyspread are preferred, on the contrary, larger canopy spread
is desired to maximize fodder production, hence, choice ofthe tree species is made accordingly. It is clear that inspiteof the similar microsite environment, tree species exhibited
differential intrinsic ability to achieve differential growth. Thebetter growth potential of some tree species can be ascribedto better adaptability and utilization of site resources, which
makes these tree species superior to other ones under theprevailing growing conditions.
REFERENCESAnonymous (2001) State of the World’s Forests. FAO, Rome, p.181.
Bansil, P. C. (2002) Agriculture Statistics in India (4th edition). CBSPublishers and Distributors, pp.86-99.
Dubey, P, Padmini, S.K., Banerjee, A.C., Dixit, R.K. and Rathore, S.K. (2004) Performance of exotic dry zone hardwoods in saltaffected semi-arid regions of Uttar Pradesh. Ind. For. 130(2):200-206.
FSI, (2009) State of Forest Report. Ministry of Environment andForests, Govt. of India, Dehra Dun, p.199.
Gera, M., Ginwal, H.S. and Srivastava, R. L. (1996) Performance ofseventeen different multipurpose tree species under semi-arid region of Cental India. Ind. For. 122 (3): 250-257.
Kanmegne, J., Bayomock, L.A., Duguma, B. and Lapido, D.O. (2000)Screening of 18 agroforestry species for highly acid andaluminium toxic soils of the humid tropics. Agrof. Syst. 49: 31-39.
Singh, A. N., Raghubanshi, A. S. and Singh, J. S. (2004) Survivaland growth pattern of three tropical forest plantations raisedon coal-mine spoils of central India. Ind. For. 130 (4): 376-384.
Growth Performance of Different Multipurpose Tree Species

Climate change is a global environmental problem that
has been associated with increasing concentrations ofgreenhouse gases (GHGs). Our modern lifestyles, theproducts we choose, the emissions of carbon dioxide from
industry, society, transport and from our homes, haveincreased the concentration of CO2 in the atmosphere. Thebuild-up of greenhouse gases (GHGs) in the atmosphere,
much of it driven by human activity, is already affecting theglobal climate. Under current projections, concentrationsof GHGs will continue to increase into the indefinite future,
entailing a process of continued global warming. Between1850 and 1998, some 270 billion tonnes of carbon werereleased into the atmosphere in the form of CO2, mainly
through the combustion of fossil fuels, resulting in a 30 percent increase of CO2, in the atmosphere. Accumulation of3.3 billion tonnes of carbon a year. World GHG emissions
have roughly doubled since the early 1970s, and on currentpolicies could rise by over 70% during 2008-2050. Inrecognition of this, the UN General Convention on Climate
Change, drawn up in Rio in 1992, agreed as its principalobjective that the concentration of greenhouse gasesshould be stabilized at a level that does not represent a
hazard to the environment. In 1997, the Kyoto Protocol setquantitative targets for how far emissions should bereduced, calling upon the industrialized countries to bring
down average emissions between the years 2008 and 2012by 5.2 per cent from the level of 1990.
GHG emissions through wood substitution, biomass
substitution, and avoided land-use change. Substitutingwood products obtained from sustainably managed forestsaddresses climate change in several ways, including fixing
the carbon in store. The carbon in lumber and furniture, forexample, may not be released for decades. Storage ofcarbon in harvested wood products is gaining recognition
in climate change mitigation programmes. The climatechange benefits of wood products lie in the combination oflong-term carbon storage with substitution for other
materials with higher emissions. As wood can substitutefor fossil fuel intensive products, the reduction in carbonemissions to the atmosphere is comparatively larger than
even the benefit of the carbon stored in wood products.
This effect-displacement of fossil fuel sources could makewood products the most important carbon pool of all.Simplified methods for estimating the fate of carbon in wood
products need to be developed to allow estimation at thenational level. Economists argue that if the cost of carbonemission was bid in the market, consumers would
effectively make purchases that would reduce emissions.Almost every change in product design, product selection,or management results in changed levels of carbon
emission across different stages of processing.
Global Instruments for Climate Change Mitigation
The United Nations Framework Convention on ClimateChange (UNFCCC), which was adopted in 1992 at the
United Nations Conference on Environment andDevelopment (UNCED), aims at stabilizing the concentrationof greenhouse gases in the atmosphere so as to prevent
dangerous human-induced changes to the global climatesystem. Parties to the UNFCCC committed themselves tocarrying out national inventories of greenhouse gas
emissions and carbon sinks. Industrialized countries andthe economies in transition (Annex I Parties) committedthemselves to working towards voluntary goals in the
reduction of emissions. These obligations were intensifiedand specified in the Kyoto Protocol, which was adopted atthe Conference of the Parties (COP)-3 of the UNFCCC, held
in Kyoto, Japan in December 1997. By June 2007, a total of175 states had joined the Kyoto Protocol, accounting for61.6 per cent of CO2, emissions of all Parties. The Protocol
came into force on February 16, 2005. There aremechanisms under the Kyoto Protocol which allow for someflexibility in how countries make and measure their emission
reductions. These include the Joint Implementation (JI) andthe Clean Development Mechanism (CDM) which includeforestry projects. Today, the Kyoto Protocol is the most
universally applied agreement for CO2 reduction. However,a major shortfall of the Kyoto Protocol is the lack of assertivesanction mechanisms because of which it will be difficult to
ascertain its effectiveness as a mechanism for reducingCO2 emissions.
Role of Short Rotation Forestry Products in Enhancing CarbonMitigation in India
C. N. Pandey* and SujathaIPIRTI, P.B.No.2273, Tumkur Road, Bangalore – 560 022, India
*E-mail: [email protected]
Indian J. Ecol. (2011) 38 (Special Issue) : 188-190Indian Journal
of Ecology
189
Role of Short Rotational Species
Carbon mitigation options include reducing emissions
from deforestation and forest degradation, enhancing thesequestration rate in existing and new forests providingwood fuels as a substitute for fossil fuels and providing
wood products for more energy-intensive material. One ofthe measures that are receiving increased attention is landmanagement to protect and reforest forest land either by
direct forest management or by establishment of fastgrowing plantations that can be substituted for fossil fuelsin energy production. A recent FAO study has indicated that
potential industrial wood production from planted forests in2005 was 1.2 billion m3 or two thirds of the overall industrialwood production in that year. Establishment of plantations
on degraded and waste lands is one of the best and themost promising options for halting deforestation andincreasing carbon storage in trees. In India, trees outside
forests have a major contribution in meeting timber andfuel wood needs. It is estimated that the amount incurredfor total import of timber including paper and pulp into the
country is in the order of Rs.12,000 crores per year. A realisticharmonization of various projections indicates a demandfor wood for panel products in the range of 30.53 million
cu.m. annually. Studies reveal that for short rotation species,the amount of carbon offset increases linearly with timesince biomass is continuously harvested and replantedand used. On forest lands, the carbon balance is negative
in the beginning (due to enhanced decomposition) but itturns positive after 3 and 14 years respectively for longrotation sal forests and short rotation poplar species. On
non-forests lands, at 6 years, the carbon sink attains amaximum value of 11 Mg C ha-1 yr-1 for short rotation poplarplantation. The carbon benefit at any time is highest for
short rotation poplar plantation. This may be attributed tothe high carbon sequestration rate and high energyconversion efficiencies. At year 100 a total of 216 Mg C ha-1
yr-1 is sequestered for afforestation/reforestation using longrotation sal species, as opposed to offset of 412 Mg Cha-1 yr-1 for carbon storage for short rotation poplar
plantations. Using short rotation plantations for electricpower generation gives a mitigation potential in the rangeof 227 to 303 Tg carbon per year form carbons torage and
fossil fuel substitution. The energy generation potential ofplantation generating 758 Tg wood annually would be 11,370Pj. Thus plantation biomass could supply about 43% of the
total projected energy consumption in India by 2015
Life Cycle Assessment and Carbon Foot Prints
Life cycle assessment of every product being used is
very essential tool . In India, the studies related to durability
or service life of wood based panel products have beenstudied which would form a part of life cycle assessment.
However, not many studies were made to study the energy,pollution and other issues involved from the manufacturingstage to the final usage of the panel products. IPIRTI has
taken up a project to assess the life cycle of wood basedpanel products. It has been found that the pollution releasedfrom panel industries are very negligible compared to
concrete, brick, ceramic tiles, aluminium and steel. Theenergy involved in the production is also less. After theservice life of the panel products, the same product can be
recycled into a range of products including particleboard.The panel products/timber which are not suitable for reuseor recycling can be utilized to generate renewable energy,
releasing the carbon back into the atmosphere to bereabsorbed by the growing trees. For waste not suitable forreuse, recycling or renewable bioenergy, Australian
research has shown that end-of-life timber stores thecarbon for very long periods of time in well-managedlandfills. The use of wood based panel products as a
building material creates a much lower carbon footprintthan does the use of other common building materials.The research showed that more than 25 tonnes of
greenhouse gases could be saved if timber products wereused instead of the common alternatives. Greenhouse gasemissions from the manufacture of different building
components in a family home are shown in Fig. 1. Thechemical analysis of wood products buried for 25yrs haverevealed that only up to 3.5% of the carbon in wood products
was lost through decomposition. It is reported that timbercan store up to 15 times the amount of carbon that isreleased during its manufacture.
The manufacture of timber building components uses
considerably less energy than the manufacture of other
major products such concrete, brick, ceramic tiles,
aluminium and steel. It therefore follows that usage of
timber and timber will leave a smaller carbon footprint.
Based on the survey of builders it is estimated that at least
25% of the carbon in the wood in dwelling would be
sequestered in use for at least 100 years. Timber production
also makes a positive contribution to reducing carbon
emissions by being part of the short term carbon cycle that
involves trees absorbing carbon dioxide from the air,
releasing oxygen and storing the carbon in the wood. Using
trees for timber and other wood products in this way creates
space in plantations and hardwood production forests for
replacement trees to absorb more carbon from the
atmosphere.
Short Rotation Forestry and Carbon Mitigation

190
In the early days of development of plywood and panelindustries, environmental issues represented a very small
component of any decision to build and operate a woodcomposite plant. However, in today’s highly sensitiveenvironmental climate, these issues have come torepresent a significant initial and operating investment. The
most suitable option for a developing country like India liesin the use of non forest lands for fast growing short rotationplantations. Short rotations plantations with higher growth
rates result in greater net carbon benefit at the end of 100year as compared to long rotation forests used forpermanent carbon storage. An understanding of promising
new environmental friendly technologies and theirapplication will go a long way in sustainable developmentof these industries. R & D works done at IPIRTI in the last
Fig.1. Greenhouse gas emissions from the manufacture of different building components in a family home(Source: CRC for Greenhouse Accounting)
couple of years in the field of development of bio-adhesives,
wood alternatives based on fast growing agro forestry timber
species, and other renewable fibres like bamboo and agro
residues, and use of eco-friendly preservatives as glue line
additive, have significantly contributed to the development
of greener engineered panel products. It is therefore
envisaged that more use of fast growing plantation wood
by the plywood and panel industries and application of green
technologies will go a long way in tackling the problems of
global warming and climate change mitigation. The
inclusion of wood and wood-based products into carbon
accounting will constitute a positive step to increase wood
consumption and carbon removals from the atmosphere
by wood products.
C. N. Pandey and Sujatha

Biomass is produced by green plants, which convertssunlight into plant material through photosynthesis andincludes all land- and water-based vegetation, as well as
all organic wastes. The biomass resource can beconsidered as that organic matter, in which the energy ofsunlight is stored in chemical bonds. Biomass is the fourth
largest energy source after coal, oil and natural gas. It is thelargest and most important renewable energy option atpresent. Renewability and versatility are the among many
other important advantages of biomass as an energysource. Compared to other energy sources biomassresources are common and wide spread viz., woody crops
& residues, agricultural crops & residues, sewage, industrialresidues, animal residues and municipal solid wastes,waste dry biomass-wood chip, wood pellets, rice husk,
waste wood, bark and fruit cones, etc. Burning fossil fuelsuses ‘‘old’’ biomass and converts it into ‘‘new’’ CO2; whichcontributes to the ‘‘greenhouse’’ effect and depletes a non-
renewable resource. Burning new biomass contributes nonew carbon dioxide to the atmosphere, because replantingthe harvested biomass ensures that CO2 is absorbed and
returned for a cycle of new growth. One important factor,which is often overlooked when considering the use ofbiomass to assist alleviate global warming, is the time lag
between the instantaneous release of CO2 from burningfossil fuels and its eventual uptake as biomass, which cantake many years. One of the dilemmas facing the developed
world is the need to recognize this time delay and takeappropriate action to mitigate against this lag period. Anequal dilemma faces the developing world as it consumes
its biomass resources for fuel but does not implement aprogramme of replacement planting. Numerous crops havebeen proposed or are being tested for commercial energy
farming. Important tree and crops for biomass productionfor bioenergy are: eucalypts, poplar, leucaena, switch grass,miscanthus, sorghum, sugarcane, canola starch and sugar
crops and oilseeds. Energy yield from various crops ispresented in Table 1.
Annual global primary production of biomass.Potential of annual global primary production of biomass isestimated to be equivalent to 4500 EJ of Solar energy
Prospects and Challenges of Biomass Use in Power Generation
Avtar SinghDepartment of Forestry and Natural Resurces, Punjab Agricultural University, Ludhiana-141 004, India
*E-mail:[email protected]
captured each year. About 5 per cent of this energy i.e., 225EJ should cover almost 50 per cent of the World’s totalprimary energy (Ladani and Vinterback, 2009). As per the
estimates upto 2050, the annual bioenergy requirement tomeet global energy demand shall supersede 1000 EJ. Morethan 30% of the world’s biomass resources are located in
Asia and in this region, labour inputs and transportationcost are competitive than rest of the world.
Presently sustainable potential of global biomass
resources is widely recognized. The land devoted to growingenergy crops for biomass fuel is only 0.19 per cent of theworld’s total land area. It is only 0.5 to 1.7 per cent of global
agricultural land (Ladani and Vinterback, 2009). Largepotential by algae as biomass resource is not included.Thus, biomass potential for energy production is promising.
Sustainably grown biomass fuels such as wood make onlyvery small contributions to atmospheric carbon. The sameamount of carbon that is released into the atmosphere when
one crop is burned is reabsorbed by the plants grown forthe next crop, and the carbon emitted by the machinery usedto establish, grow, harvest and transport the biomass is
very small. Biomass fuels result in fossil fuel emissions tothe atmosphere being avoided by replacing fossil fuel.
Global energy consumption. Global Energy
consumption is loosely correlated with gross national
product and climate, but there is a large difference even
between the most highly developed countries, such as
Japan and Germany with 6 kW/person and United States
with 11.4 kW/ person. In developing countries, particularly
those which are sub-tropical or tropical such as India, the
per person energy use is closer to 0.7 kW. Bangladesh has
the lowest consumption with 0.2 kW/person. In 2008, total
worldwide energy consumption was 474 exajoules
(474×1018 J) with 80 to 90 per cent derived from the
combustion of fossil fuels. This is equivalent to an average
annual power consumption rate of 15 terawatts
(1.504×10¹³ W). Not all of the world’s economies track their
energy consumption with the same rigor, and the exact
energy content of a barrel of oil or a ton of coal will vary with
quality.
Indian J. Ecol. (2011) 38 (Special Issue) : 191-193Indian Journal
of Ecology

192
Despite advances in efficiency and sustainability, of allthe energy harnessed since the industrial revolution, more
than half has been consumed in the last two decades.However, while considering this fact, it should not beoverlooked that this is primarily the result of global increases
in the standard of living and the increase in world population,and not as a failing of energy management as a whole.Energy consumption growth remained vigorous in several
developing countries, specifically in Asia (+4%). Conversely,in Organisation for Economic Co-operation andDevelopment (OECD) countries, consumption was severely
cut by 4.7 per cent in 2009 and was thus almost down to its2000 levels. In North America, Europe and Commonwealthof Independent States (CIS), consumptions shrank by 4.5
per cent, 5 per cent and 8.5 per cent, respectively, due to theslow down in economic activity. China became the world’slargest energy consumer (18% of the total) since its
consumption surged by 8 per cent during 2009 (from 4% in2008). Oil remained the largest energy source (33%) despitethe fact that its share has been decreasing over time. Coal
posted a growing role in the world’s energy consumption in2009, it accounted for 27 per cent of the total.
Biomass and biofuel. Until the beginning of the
nineteenth century biomass was the predominant fuel, todayit has only a small share of the overall energy supply.Electricity produced from biomass sources was estimated
at 44 GW for 2005. Biomass electricity generation increasedby over 100 per cent in Germany, Hungary, the Netherlands,Poland and Spain. A further 220 GW was used for heating
(in 2004), bringing the total energy consumed from biomassto around 264 GW. The use of biomass as firewood forcooking is excluded. World production of bioethnol
increased by 8 per cent in 2005 to reach 33 billion liters(8.72 billion US gallons), with most of the increase in theUnited States, bringing it to the levels of consumption in
Brazil. Biodiesel increased by 85 per cent to 3.9 billion liters(1.03 billion US gallons), making it the fastest growingrenewable energy source in 2005. Over 50 per cent is
produced in Germany.
Effect of changing climate on productivity of biomass.Environmental variables will not act in isolation, but also in
combination with one another, and with other pressuressuch as habitat degradation and loss or the introduction ofexotic species. It is suggested that these other drivers of
biodiversity change will act in synergy with climate changeto increase the pressure on species to survive (Mackey,2007). Therefore, it is important to know, how C3 and C4
plants will respond in changing climate. Some studies havebeen reported how C3 and C4 plants will adapt to changing
CO2 and temperatures.
Biomass production by C3 and C4 Plants. The C4
plants are more efficient, resulting in higher biomassproductivity. Many promising (tropical) energy crops followthis pathway. They include sugarcane, sorghum, and switch
grass (Panicum virgatum). The researchers from China’sZhejiang University grew the three C3 grasses (Poa annuaL., Lolium perenne L., Avena fatua L. and the three C4
grasses (Echinochloa crusgalli var. mitis (L.) Beauv.,Eleusine indica (L.), Setaria glauca (L.) P. Beauv) from seedto maturity under well irrigated conditions within controlled-
environment (maintained at a mean atmospheric CO2
concentration of either 350 or 700 ppm) in pots containing2.5 kg of soil that was low in extractable P content. Under
these conditions, total aboveground plus belowground plantbiomass was enhanced by an average of 9.92 per cent dueto the doubling of the air’s CO2 concentration in the group of
C3 grasses, but by an average of 12.27 per cent by thedoubling of the air’s CO2 concentration in the group of C4grasses. Tang et al. (2006) reported that the C3 grasses
they studied had low mycorrhizal colonization and thatatmospheric CO2 enrichment did not significantly enhancethis beneficial symbiosis, whereas, injecting extra CO2 into
the air did enhance mycorrhizal colonization in the C4grasses. Mycorrhizae are the result of the colonization ofthe roots of the plants by a fungus, in a mutually beneficial
relationship (either inside or outside of the root cells); thefungus survives by tapping energy (sugars) from the roots,but in exchange, it allows the plant to make use of the
fungus’ tremendous surface area to absorb mineralnutrients from the soil). In addition, a positive correlationbetween mycorrhizal colonization rate and shoot P
concentration, between the increase in mycorrhizal
colonization rate and the increase in total P uptake under
elevated CO2 was recorded, which indicates that
mycorrhizae might enhance P uptake for plants that have
high mycorrhizal colonization and then promote host-plant
growth response to elevated CO2 or this may be due to the
fact that the grasses used in experiment were also
significant mycorrhizal hosts and their mycorrhizal
colonization was significantly stimulated by elevated CO2
on this basis, it has been concluded that this situation may
promote the total P uptake of the C4 grass in low P soil and
enhance the C4 grasses response to CO2 enrichment. Tang
et al. (2006) had also included three C3 forbs (Veronica
didyma Ten., Plantago virginica L., Gnaphalium affine D.
Don.) in their study, as well as three legumes (Vicia craccaL., Medicago lupulina L., and Kummerowia striata (Thunb.)
Schindl.), both of the plant groups responded better to the
Avtar Singh

193
researchers’ enriching of the air with CO2 than did the twogroups of grasses. The C3 forbs, for example, exhibited a
mean biomass increase of 35.61 per cent, while the legumesexhibited a mean biomass increase of 41.48 per cent. Theyreported that high levels of mycorrhizae, and their
mycorrhizal symbionts were stimulated greatly by CO2. Theyagain noted that the higher enhanced total P uptake oflegumes under elevated CO2 concentrations implies that
mycorrhizae may facilitate P uptake and enhance legumeresponse to elevated CO2.
Productivity of C3 and C4 Plants under water stressenvironments. Plants naturally pump water from the soiland out through the tiny openings on their leaves calledstomata by a process known as transpiration. These
openings also allow carbon dioxide to be taken in by plants.Some plants have evolved to minimize water losses throughtranspiration, but they tend to grow very slowly, e.g. cacti. A
minority of plants, for example sugarcane and maize, haveevolved a different type of metabolism for sugar productioncalled Carbon 4 (C4), whereas, most plants have a Carbon
3 (C3) metabolism. C4 metabolisms make better use ofwater than C3 in hot arid zones. However, C3 plants aremore efficient in cooler moister conditions. C4 metabolisms
make better use of water than C3 in hot arid zones. C4plants have a competitive advantage over plants possessingthe more common C3 carbon fixation pathway under
conditions of drought, high temperatures, and nitrogen orCO2 limitation. When grown in the same environment, at30°C, C3 grasses lose approximately 833 molecules of
water per CO2 molecule that is fixed, whereas, C4 grasseslose only 277 water molecules per CO2 molecule fixed. Thisincreased water use efficiency of C4 grasses means that
soil moisture is conserved, allowing them to grow for longerin arid environments. Ward et al. (1999) reported that C3species may not be more severely affected by drought than
C4 species at low partial pressure (þCO2) and C3 speciesmay not have an advantage over C4 species during droughtin elevated partial pressure (þ CO2 ). The C4 species may
have advantage over C3 species in response to increasingatmospheric CO2 and more frequent and sever drought.
Challenges to maintain biomass supply for biomassbased power plants:
* Provision of genetically improved quality planting stock
at low cost.
* Securing the long term supply of biomass fuel source
at stable and low prices.
* Developing technologies for various woody crops to
grow biomass on problematic sites (salt and
waterlogged) and fixing its commercial rotations.
* Selling price of electricity, if connected to the grid to sell
electricity
* Small sized biomass needs to be briquetted.
* Maintenance in remote region can be difficult and
expensive
* Cheaper packing and transportation of agriculture and
forest biomass from farm and its unpacking at power
plant to keep the cost low for biomass handling.
Electricity production through biomass usage is viable
option. In future, when fossil fuel supply becomes in short
supply, the mankind has to rely upon to great extent on
energy production through biomass and other renewable
energy sources. Therefore, we have to develop strategic
planning keeping in view the effect of climate change on
biomass production and challenges outlined above to
maintain biomass supply at low costs for biomass based
power plants and accordingly we have to strengthen
research and development efforts in this direction.
REFERENCES
GOI (2007) Annual Report 2006-07. Ministry of new and renewableenergy. Govt. of India, New Delhi.
International Energy Agency (2007) Global Energy Review-2007.International Energy Agency, OECD Paris.
Ladani, S. and Vinterback, J. (2009) Global potential of sustainableBiomass for energy, Report 013, Swedish University ofAgriculture Sciences, Uppsala. 29 p.
Mackey, B. (2007) Climate change, connectivity and biodiversityconservation”. In Taylor M., Figgis P. Protected Areas: BufferingNature Against Climate Change. Proceedings of a WWF andIUCN World Commission on Protected Areas symposium,Canberra, 18-19 June 2007. Sydney: WWF- Australia.pp. 90-96.
Tang, J., Chen, J. and Chen, X. (2006) Response of 12 weedyspecies to elevated CO
2 in low-Phosphorus- availability soil.
Ecol. Res. 21: 664-670.
Ward, J.K., Tissue, T., Thomas, R.B. and Strain, B.R. (1999)Comparative response of model C3 and C4 plants to droughtin low and elevated CO2. Global Change Biology 5: 857-867.
Biomass Use in Power Generation

Indian J. Ecol. (2011) 38 (Special Issue) : 194-195Indian Journal
of Ecology
In developing countries, the dependence on wood fuels
is much greater. They provide about one-third of the totalenergy in these countries, and as much as 80 percent ofenergy is derived from biofuels in some sub-regions of
Africa. Wood and charcoal, the most commonly used wood-based fuels, are vital to the nutrition of poor rural and urbanhouseholds in developing countries. In addition to being
used for domestic cooking and heating, they are oftenessential in food processing industries for baking, brewing,smoking, curing and producing electricity. Wood energy is
the dominant source of energy for over two billion people,particularly in households in developing countries, itcurrently provide more than 14 percent of the world’s total
primary energy. Social and economic scenarios indicate acontinuous growth in the demand for wood fuels that isexpected to continue for several decades. Hence, in this
regard selection of suitable fuelwood tree species with highcalorific value is need of the day. The present study wasconducted in the College of Forestry, Kerala Agricultural
University, Trissur. The state of Kerala is endowed with highrainfall and most favourable humidity conditions whichmakes the way for growth of numerous tree species. Tropical
rain forests with maximum species diversity of flora andfauna are in abundance in the state. Even when so manymethods are being developed to improve the natural forests,
it would not be possible to meet the increasing demand forfood, fuel, fibre and timber. To meet this demand, thedegraded forest, marginal land, village common land, strips
on sides of roads, canals, railway, rivers and peripheries ofagricultural fields could be utilized for planting of trees. Forthis purpose choice of species is an important criteria. The
proper choice of tree species at a particular place whichcan yield enormous benefits is the need of the day.
The present experiment was carried out in the
arboretum of College of Forestry, Kerala AgriculturalUniversity, Vellanikkara, Thrissur, Kerala, during the period2006 to 2008. The experimental site is situated at 10o32' N
latitude, 76o10' E longitude and at an altitude of 22- 23 mabove mean sea level. The study site experiences a warmhumid climate, having a mean annual rainfall of 2668 mm,
most of which is received during the south west monsoon
Calorific Value Assessment of Selected Tropical Tree Species of theSouthern India for Higher Fuelwood Potential
Harsha Hegde*, K. Gopikumar, Kheen Samom, Nagaraj Hegde and S.K. JhaASPEE, College of Horticulture and Forestry,Navsari Agricultural University, Gujarat
*E-mail:[email protected]
(June to September). The mean maximum temperature
recorded at Vellanikkara varied from 28.4oC in July to 36.0oCin March. The mean minimum temperature varied from21.6oC in November to 25.0oC in April. The soil of the
experimental site is an Ultisol having a pH of 5 to 6, relativelyrich in organic matter. The experimental materials consistof 10 trees each of 10 species planted in the instructional
farm at a spacing of 4 x 4 m. Uniform seedlings were plantedduring 1991-92 and are being maintained. Proper wateringand weeding were done during the initial stages of
establishment and plant protection measures were takenup whenever necessary. The species, Adenantherapavonina L. , Artocarpus heterophyllus Lam., Bridelia retusaL. A. Juss., Ceiba pentandra L. Gaertn, Hydnocarpuswightiana Blume., Hymenodictyon excelsum Roxb. Wall.,Peltophorum pterocarpum Baker., Pterocarpus santalinusL. f., Samadera indica Gaertn. and Tectona grandis L.f. wereincluded in the study for evaluation.
For estimation of calorific value of the tree speciesgrown in the arboretum, samples of wood after drying in anelectric oven at 103±2°C were chipped separately using a
chisel to smaller sizes of approximately 0.3-0.4 cmthickness. The sample chips were then ground in an electricmill. The ground samples were stored in double sealed
polythene covers. One gram of the ground material fromeach sample was accurately weighed and the calorific valuewas estimated using an Oxygen Bomb Calorimeter. A
measured quantity of sample was burnt by supplying highvoltage current through the electric terminals in thepresence of oxygen and the heat absorbed by the water in
the bucket was recorded. This rise in temperature isproportional to the gross energy value of the substancewhich is burnt. The calorific value was estimated by using
the following formula:
Calorific value (H) = m
cbaTW )( ++−
H = heat of combustion of sample (cal.)T = difference in initial and final bucket temperature (°C)W = energy equivalent of bomb calorimeter (cal.oC)a = acid correction

195
b = calories liberated during the ignition of tungsten wire (cal.)c = calories liberated during the ignition of cotton thread (cal.)m = weight of the sample (g)
Close perusal of the data indicated that calorific valuesof wood significantly varied between different species. It
could be seen from the data that the basal portion of thetrunk of Pterocarpus santalinus recorded highest calorificvalue (7143.63 cal.g-1) followed by Ceiba pentandra(7088.75 cal.g-1). Samadera indica has the least calorificvalue of 3593.01 cal.g-1 followed by Bridelia retusa (3643.78cal.g-1). In the middle portion of trunk, Pterocarpus santalinusrecorded the highest calorific value (6025.07 cal.g-1) followedby Hydnocarpus wightiana (4723.10 cal.g-1) andAdenanthera pavonina (4367.60 cal.g-1), while Ceibapentandra has the least (3345.36 cal.g-1). With regard to thetop portions of trunk, Pterocarpus santalinus recordedhighest calorific value (6837.50 cal.g-1) followed by
Adenanthera pavonina (4572.57 cal.g-1), while the leastcalorific value was recorded for Ceiba pentandra (2926.29cal.g-1). The data also revealed that the mean calorific value
varied from 3626.85 to 6668.73 cal.g-1 in various treespecies studied. The mean calorific value was maximumfor Pterocarpus santalinus (6668.73 cal.g-1) followed by
Hydnocarpus wightiana (4810.11 cal.g-1) and Ceibapentandra (4453.47 cal. g-1 ). Least average calorific valuewas that of Samadera indica. The observations related to
calorific value of tree species grown in arboretum arefurnished in Table 1.
Based on the mean calorific values, Pterocarpussantalinus, Hydnocarpus wightiana, Ceiba pentandra,Tectona grandis and Adenanthera pavonina could beclassified under high calorific value class indicating the
use of these species and their branches as fuel wood treesalso in agro/social forestry programmes. Shanavas andKumar (2003) have reported the calorific values of 45
important fuelwood tree species grown in Kerala. Basedon the results, trees were classified into high calorific value
trees (>4500 cal. g-1), medium calorific value trees (3750-4500 cal. g-1) and low calorific value trees (<3750 cal. g-1).He has reported high calorific values for bottom portion of
trees. In the present study also, generally bottom portion ofmost of the trees recorded high calorific value. This may be
due to the fact that tissues had low moisture content in
these portions of the tree. However, this needs further
investigations. Haufa and Wojciechowska (1986) reported
that moisture content of wood have negative correlation with
fuel wood value. Gupta (2006) also reported high calorific
values for bottom portion of trees and calorific value
decreased with rise in moisture content. The most
promising tree species in terms of calorific value were in
the order of Pterocarpus santalinus > Hydnocarpuswightiana > Ceiba pentandra > Tectona grandis >Adenanthera pavonina > Hymenodictyon excelsum >Artocarpus heterophyllus > Peltophorum pterocarpum >Bridelia retusa > Samadera indica. Study focused on the
fuelwood potential of tropical tree species, which are earlier
less known species as woodfuels. The present investigation
indicated the scope of selecting tropical tree species with
higher calorific value along with other qualities for
distribution to farmers for social/agroforestry and even for
general afforestation programmes.
REFERENCESGupta, A. (2006) Screening of tree species for growth behaviour,
biomass and wood properties. M.Sc. Thesis submitted toKerala Agricultural University.
Haufa, P. and Wojciechowska, D. (1986) Fuel wood assortmentsas a potential source of heat energy. Las Polski. 2: 12-14.
Shanavas, A. and Kumar, B.M. (2003) Fuelwood characteristics oftree species in homegardens of Kerala. Agrofor. Syst. 58: 11-24.
Table1. Calorific value of tree species
Species Calorific value (cal.g-1)
Base Middle Top Mean
Adenanthera pavonina 4057.45 4367.60 4572.57 4332.54
Artocarpus heterophyllus 3848.28 3595.56 4261.15 3901.66
Bridelia retusa 3643.78 3541.73 4209.03 3798.18
Ceiba pentandra 7088.75 3345.36 2926.29 4453.47
Hydnocarpus wightiana 4776.13 4723.10 4931.10 4810.11
Hymenodictyon excelsum 4370.56 4108.77 4008.27 4162.53
Peltophorum pterocarpum 4261.73 4107.41 3027.64 3798.93
Pterocarpus santalinus 7143.63 6025.07 6837.50 6668.73
Samadera indica 3593.01 3590.74 3696.79 3626.85
Tectona grandis 4367.91 4366.01 4413.48 4382.47
CD (0.02) 2.46 2.66 2.68
S.Em ± 1.17 1.27 1.28
Calorific Value Assessment of Selected Tropical Tree Species

Based on the experiences with a bush chopper forsecondary forest vegetation in Brazil (Wegener and Block,
2005), the Section of Agricultural Engineering and partnershave developed and tested a helical chipper prototype thatshould allow the integrated strip cutting, chipping and
salvaging of woody biomass. The aim was to design a rearattachment for a backward steering forest tractor with anengine power of 130 kW that can clear succession
vegetation, short rotation coppice, hedgerows, logging trailsor roadside vegetation in a single-action move withoutmanual handling. The development took place within the
framework of the DBU-supported project “Fully mechanisedlandscape conservation in nature reserves and Natura 2000sites”. Field trials helped to redesign and improve the device
in order to enhance the overall performance and to adapt itto special purposes (Wegener and Block, 2006a).
The background for this development is the vast area
of non-productive land that cannot be let prone to naturalsuccession for ecological, statutory and culturalconservation reasons. Further potential for energetic
utilization lies in the planned and spontaneous vegetationalong roadsides. The main challenges are to handle theoften irregular and highly diverse structure of heterogeneous
plant stands, spatially as well as under the terms of age,stem diameter, species, growth stage and area relief.Additionally the amount of manual handling is to be reduced
to a minimum due to high labor costs in Germany andsecurity demands. A further goal is to fell the stems in acertain height with a thorough cut that does not damage the
root stock and enables the plantation to sprout again. Thisfeature would allow for an application in short rotationcoppice, too. Unlike self-propelled field choppers used in
maize, the device and its carrier cannot be too heavy inorder to avoid soil compaction and sod or root damage inprotection areas. It has to have a high maneuverability in
order to move back and forth and to work along road sides.Mere mulching is not desired because the contained
Development of the Goettingen Conservation Chipper Harvester forthe Production of Quality Wood Chips from Agroforestry, SRC and
Open Land Vegetation
Jens-Karl Wegener*, Sebastian Glaeser, Marco Lange and Tim WegenerUniversity of Goettingen, Agricultural Faculty, Department of Crop Sciences, Section of Agricultural Engineering,
Goettingen, Germany*E-mail: [email protected]
nutrients (especially from leguminous trees) shall beremoved from the protection areas and because the
dendromass offers an energetic value that can partly coverthe costs for harvesting measures. The principle of anenergy saving, smoothly spinning and self-feeding helical
chipping drum (Fig. 1) known from the bush chopper(Wegener and Block, 2005) shall be used again. Finally thewood chips shall have a coarse (ideally 50 to 100 mm) but
even particle size distribution in order to facilitate low-costdrying by blower aeration and their use in district heatingincinerators or in special wood gasification reactors
depending on a good aeration of the firebed (Wegener andBlock, 2006b) .
The prototype is a machine with a horizontally orientedand automatically feeding helical chipping drum with
conveyor floor, conveying rollers and feed cylinderstransporting dendromass from the preceding saw bladebeam with a cutting width of 2.4 m. The rotating parts are
powered by the tractor hydraulics and the rear power take-off shaft. A clamp above the funnel makes the dendromass(up to 12 cm in stem diameter) fall into the right direction
since the often voluminous shape of the bushes makes avertical entrainment impossible. Simultaneously the tractor
Fig. 1: Helical chipping: Wood chips are hopped and screwedout by the continuous lades
Indian J. Ecol. (2011) 38 (Special Issue) : 196-198Indian Journal
of Ecology
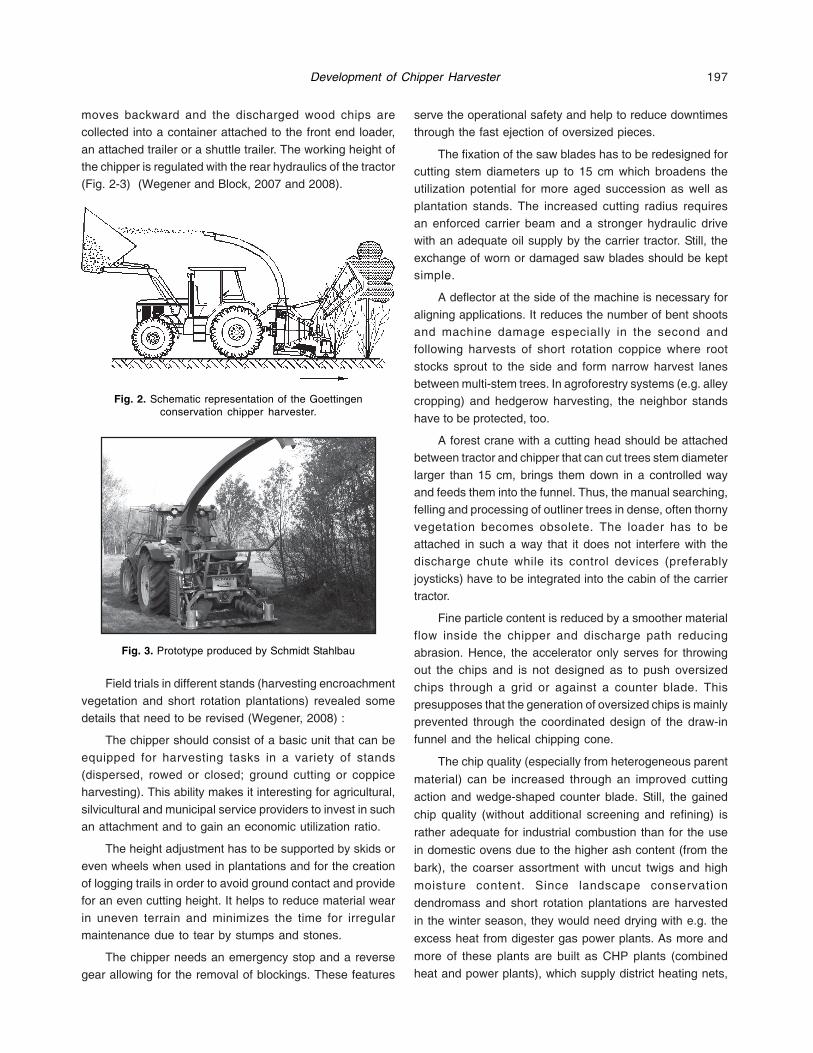
197
moves backward and the discharged wood chips arecollected into a container attached to the front end loader,
an attached trailer or a shuttle trailer. The working height ofthe chipper is regulated with the rear hydraulics of the tractor(Fig. 2-3) (Wegener and Block, 2007 and 2008).
Field trials in different stands (harvesting encroachment
vegetation and short rotation plantations) revealed somedetails that need to be revised (Wegener, 2008) :
The chipper should consist of a basic unit that can be
equipped for harvesting tasks in a variety of stands(dispersed, rowed or closed; ground cutting or coppiceharvesting). This ability makes it interesting for agricultural,
silvicultural and municipal service providers to invest in suchan attachment and to gain an economic utilization ratio.
The height adjustment has to be supported by skids or
even wheels when used in plantations and for the creationof logging trails in order to avoid ground contact and providefor an even cutting height. It helps to reduce material wear
in uneven terrain and minimizes the time for irregularmaintenance due to tear by stumps and stones.
The chipper needs an emergency stop and a reverse
gear allowing for the removal of blockings. These features
Fig. 2. Schematic representation of the Goettingenconservation chipper harvester.
serve the operational safety and help to reduce downtimesthrough the fast ejection of oversized pieces.
The fixation of the saw blades has to be redesigned forcutting stem diameters up to 15 cm which broadens theutilization potential for more aged succession as well as
plantation stands. The increased cutting radius requiresan enforced carrier beam and a stronger hydraulic drivewith an adequate oil supply by the carrier tractor. Still, the
exchange of worn or damaged saw blades should be keptsimple.
A deflector at the side of the machine is necessary for
aligning applications. It reduces the number of bent shootsand machine damage especially in the second andfollowing harvests of short rotation coppice where root
stocks sprout to the side and form narrow harvest lanesbetween multi-stem trees. In agroforestry systems (e.g. alleycropping) and hedgerow harvesting, the neighbor stands
have to be protected, too.
A forest crane with a cutting head should be attachedbetween tractor and chipper that can cut trees stem diameter
larger than 15 cm, brings them down in a controlled wayand feeds them into the funnel. Thus, the manual searching,felling and processing of outliner trees in dense, often thorny
vegetation becomes obsolete. The loader has to beattached in such a way that it does not interfere with thedischarge chute while its control devices (preferably
joysticks) have to be integrated into the cabin of the carriertractor.
Fine particle content is reduced by a smoother material
flow inside the chipper and discharge path reducingabrasion. Hence, the accelerator only serves for throwingout the chips and is not designed as to push oversized
chips through a grid or against a counter blade. Thispresupposes that the generation of oversized chips is mainlyprevented through the coordinated design of the draw-in
funnel and the helical chipping cone.
The chip quality (especially from heterogeneous parent
material) can be increased through an improved cutting
action and wedge-shaped counter blade. Still, the gained
chip quality (without additional screening and refining) is
rather adequate for industrial combustion than for the use
in domestic ovens due to the higher ash content (from the
bark), the coarser assortment with uncut twigs and high
moisture content. Since landscape conservation
dendromass and short rotation plantations are harvested
in the winter season, they would need drying with e.g. the
excess heat from digester gas power plants. As more and
more of these plants are built as CHP plants (combined
heat and power plants), which supply district heating nets,
Fig. 3. Prototype produced by Schmidt Stahlbau
Development of Chipper Harvester

198
drying with excess heat would have to take place in thewarmer time of the year. This would cause storage and
handling costs between harvesting, drying and utilizationperiod and bear the danger of energetic losses and fungispore formation through rotting processes. Municipal and
industrial plants can use coarse and moist chips thoughwill pay a lower price for those qualities, but still this utilizationpath is more economic than the upgrading for domestic
use through harvest and post-harvest measures (Yrjoelae,2004).
The Goettingen conservation chipper harvester is the
first tractor-based harvesting device that can perform cutting,
chipping and salvaging in a single-phase mowing action
independent from row structures and additional trailers.
The modular design makes it probable that applications
beyond its original purpose will be developed though the
harvesting capacity lies between 0.5 and 3.0 tatro/h in
conservation sites (due to heterogeneous stands and
discontinuous loading) and 8 – 10 tatro/h in short rotation
plantations with even feeding and homogenous trees. The
capacity depends on the relief, experience of the driver and
the logistics of the site, too. Since the enlargement of the
cutting diameter over 15 cm would be associated with
technical problems and a reduced controllability of the felling
process, the combination with a cutting head attached to a
forest crane is a likely solution for handling larger trees.
Upon finalization, the chipper will be a viable device for themanagement of woody growth and the usage of until now
decaying biomass along roadsides, waterways fallow landand field margins. The present tasks lie in the fine tuning
and coordination of the system components, thedevelopment of a serial manufacturing scheme, adjacentmaterial and weight reduction potential, the CAD-rendering
of complex chipper parts and their cheaper production withautomated machining.
REFERENCESWegener, T. (2008) The use of the Göttingen landscape
conservation chipper for landscape conservation and theharvesting of short-rotation plantations (un- published).
Wegener, T. and Block, A. (2005) Neue Ansätze zur Mechanisierungvon Landschaftspflegemaßnahmen. Landtechnik 60( 3): 152-153
Wegener, T. and Block, A. (2006a) SelbstschneidenderSchneckenhäcksler zur vollmechanisierten Landschafts-pflege. Landtechnik 61 (3):142-143.
Wegener, T. and Block, A. (2006b) Development of a Self-CuttingBush Chopper for Mechanized Landscape ConservationMeasures. In: VDI-MEG No. 1958, World Congress“Agricultural Engineering for a Better World”, Bonn,proceedings, pp. 235-236.
Wegener, T. and Block, A. (2007) Einsatz einesMähhäckslerprototyps in der Landschaftspflege. Landtechnik62(4): 224-225.
Wegener, T. and Block, A. (2008) Mähhäcksler zur Mechanisierungvon Landschaftspflegemaßnahmen und zur Bergung vonBiomasse. VDI-MEG No. 2045, Conference “AgriculturalEngineering”, Stuttgart-Hohenheim, proceedings, pp. 441-446.
Yrjoelae, J. (2004) Production of dry wood chips in connectionwith a district heating plant. Thermal Science 8(2): 143-155.
Jens-Karl Wegener, Sebastian Glaeser, Marco Lange and Tim Wegener

Conservation, protection and development of natural
resources has become a matter of concern in India. Neglectof environmental considerations like unplanned andoveruse of natural resources and deforestation is leading
to degradation of environment and loss of forest cover.During the early part of 20th century, rapid economicdevelopment and release of forest land for agriculture
industries and other activities led to large scale deforestationand decline of forest cover. Hence forth Government of Indiatook a policy decision to increase the forest cover to an
extent of 1/3rd or 33 per cent of the geographical area. Inorder to achieve this target, nearly 31 m ha still needs to becovered out of this 26 m ha (83.87%) has to come from
outside Government forests. This is a major challenge,which calls for optimum and adequate investment forplanting and regeneration of timber and non-timber forest
species which give adequate and sustained returns. Theindustrial demand for short rotation tree crops like Ailanthusexcelsa, Eucalyptus spp., Casuarina equisetifolia, Acaciaspp. and others is rising in Tamil Nadu and farmers in TamilNadu have started growing short rotation trees on their farmland. The cultivation of short rotation tree crops by the farmers
is often promoted by tree based industries and the extent ofcultivation is sometimes driven by market demand. Thesetwo factors often change the cultivation pattern by farmers
affecting wood based industries. However, the present trendof cultivation of short rotation tree crop by the farmers inTamil Nadu and its impact on ecology and socio-economic
aspects of the farmers are not available.Therefore, thepresent investigations were carried out in four divisionsviz., Karur, Villuppuram, Virudha Nagar and Dindigul of
Tamil Nadu, document the ecological and economic impactof short rotation tree crops on livelihood of stakeholders.
The study was conducted during the year 2008-09 in,
Karur, Dindigul, Villuppuram and Virudhanagar districts ofTamil Nadu. The study was undertaken in these districtsbecause most of the paper, matchbox, splints industries
and short rotation tree plantations are concentrated in these
Comparative Ecological – Economic Study of Short Rotation TreeCultivation and its Impact on Livelihood of Local Stakeholders in
Tamil Nadu
N. V. Saresh*, M. Sankanur, Rahul Singh, Archana Verma1 and D. NuthanDepartment of Silviculture and Forestry, Sirisi – 581401, Karnataka
1Department of Tree Improvement and Genetic Resources, Dr. Y.S. Parmar University of Horticulture and ForestryCollege of Forestry, Nauni- Solan- 173 230, H.P., India
*E-mail: [email protected]
districts. Pre-structured schedules were used for collection
of data from forest department, industries and farmers. Therespondents who were voluntarily willing to provide thenecessary information were contacted for the study.
In Tamil Nadu, short rotation trees are mostly cultivatedby Tamil Nadu Forest Plantation Corporation (TAFCORN)and industries in their captive plantations. Trees are also
raised under Tree Cultivation in Private Land Scheme(TCPL) and contract farming by industries such as TamilNadu News Prints and Paper Limited (TNPL). The most
commonly cultivated short rotation trees are Eucalyptusgrandis, E. tereticornis, E. camaldulensis, Ceiba pentendra,Casuarina equisetifolia and Ailanthus excelsa (Table 1).
Industries Using Short Rotation Tree Crops
Paper industry. There are 39 paper industries in the
state out of which, two industries are wood based and the
remaining industries are based on agricultural waste or
other source of fibre. The two major paper industries such
as TNPL, Karur using predominantly hard woods like
Eucalyptus and Casuarina as raw material. The requirement
of wood pulp for this industry earlier was 4.0 lakh tonnes
and most of it was supplied by TAFCORN and partly from
farm-lands. During 2002-03, this industry expanded its
paper production capacity (2300 Mt yr-1) resulting in increase
in demand of pulp wood from 4.0 lakh tonnes to nearly 9.0
lakh tonnes per annum.
Match box industry. Bengal is the birth place of matchindustry in India. The first match wood industry wasestablished in West Bengal in 1920s and second in Tamil
Nadu during 1923 at Sivakasi producing lucifer matches.The small scale handmade match industries in Sivakasi,Kovilpatti, Sattur, Kalagumalai and Sankarankoil towns of
Tamil Nadu state show a highly organized network. Thequality of the matches produced by the small scalehandmade match industries is as good as the quality of
matches produced by the WIMCO. The major success ofsmall scale match industries is the collective self reliance.
Indian J. Ecol. (2011) 38 (Special Issue) : 199-201Indian Journal
of Ecology

200
There are about 10,150 match industries in India out ofwhich 90% are located in southern districts of Madurai,
Tuticorn and Virudhanagar in Tamil Nadu.
Schemes or Corporation Involved in Short Rotation TreeCultivation
Tamilnadu forest plantation corporation limited(TAFCORN). TAFCORN was formed in 1974, with theobjective of raising, maintaining and harvesting forestplantation on sustained yield basis on commercial scale to
meet the demand of local industries and people. Thecorporation has leased land from forest department andpays fixed lease rent to the government.
Tree cultivation in private land scheme (TCPL). In order
to encourage tree cultivation outside forests, a new scheme
was launched in the State in the year 2007-08 and continued
during 2008-09. The scheme aims at improving green cover
outside the forest area besides benefiting the farmers
economically in the long run. This programme involves
planting tree seedlings in the holdings of small and
marginal farmers as inter-crops and alley crops in vacant
fields, thus covering the waste lands in their holdings. Small
and marginal farmers each with a holding of one hectare or
less having been selected under the TCPL scheme. The
forest department staff will undertake pitting and planting
works in the selected areas. Tree planting has been done
to the extent of 28,760 acres during 2007-08 and 25,800
acres during 2008-09. Tree planting programme in privatelands has benefited 15,000 farmers during the years 2007-08 and about 25,914 farmers during 2008-09. As the
scheme has benefited both wood based industries andfarmers it is proposed to continue the scheme during 2009-10.
Contract farming by TNPL. The wood based industriessuch as TNPL, Karur is using species like Eucalyptus and
Casuarina as raw material. Earlier, this paper industryrequired nearly 4.0 lakh tonnes of wood pulp and most of itwas met from the TAFCORN and partly from farm lands.
During 2000-03 industry expanded the paper productioncapacity (2300 Mt yr-1) resulting in increased wood pulpdemand of nearly 9.0 lakh t yr-1 against the actual availability
of around 3.5 to 4.0 lakh t of wood pulp. To meet theadditional requirement, the company developed contractfarming system with technological support from Forest
College and Research Institute of Tamil Nadu AgriculturalUniversity (TNAU) at Mettupalayam, Coimbatore,a tripartiteand quad-partite models for promotion of pulp wood based
farming system .
Tri-partite model. This model incorporates industry,growers and financial institutions. Under this system, the
industry supplies quality planting material at subsidizedrate and assures minimum support price of Rs. 2,000/t orthe prevailing market price whichever is higher. The financial
institutions viz., Indian Bank, State Bank of India andSyndicate Bank provide credit facilities to the growers at therate of Rs.15,000 to 20,000/acre in 3 installments. For credit
facilities, a simple interest rate at 8.5 per cent is chargedand the repayment starts after felling. The contract farmingsystem extends no collateral security for loan amount up to
Rs.1,00,000 per farmer.
Quad-partite model. This system is similar to tri-partitemodel with the exception of an involvement of research
institute. In this system, research institute plays the role oftechnological advancements through varietal developmentand also to advice site specific precision silvicultural
Table 1. Status of short rotation tree cultivation in Tamil Nadu
Scheme/corporation Year of Species planted Rotation period Area (ha)
implementation (yrs)
TAFCORN 1974 Euclaptus grandis 7E. tereticornis 7 45,000E. camaldulensis 7Casuarina equisetifolia 6 6,000
TCPL 2007 C. equisetifolia 6Alianthus excelsa 12Ceiba. pentandra - 55,000T. grandis -
Captive E. grandis 7plantation 1979 E. tereticornis 7by TNPL E. camaldulensis 7 2,000
C. equisetifolia 6Contract E. grandis 7farming by 2005 E. tereticornis 7 15,000TNPL E. camaldulensis 7
C. equisetifolia 6 2,000
N. V. Saresh, M. Sankanur, Rahul Singh, Archana Verma and D. Nuthan

201
technology to the growers. A pre and post-plantationtechnical advice helps to develop human resources through
on and off institute mode to farmers and plantation staff ofthe industries.
The soft wood, short rotation tree plantations raised
under various schemes have provided direct employmentto about 19,500 people and indirect employment to about1,02,000 people (Table 2).
Employment generation. Short rotation tree cultivationplays important role in providing shelter to birds, improvesmicro-climate of the region, makes easy availability of fuel
wood, fodder, timber, enriches the soil fertility, acts as bio-drainer in flood prone areas, increases green cover,provides recreational facilities, maintains nutrient and
hydrological cycles, decreases soil erosion and barriersagainst tidal waves mitigates the climatic change. Besidesthese ecological services, these above facts resulted in
increase in socio-economic status of villagers through directand indirect employment and moreover cultivation of shortrotation has become other alternative livelihood activities of
the local stakeholders. Presently there are no such studiesconducted on impact of short rotation tree cultivation onlivelihood of stakeholders in Tamil Nadu.
Karur Division. Eucalyptus tereiticornis cultivated byfarmers through TNPL contract farming scheme. Eucalyptusis grown in block plantations. A minimum of Rs. 1800/t is
assured by the buyback from TNPL. The average yield ofeucalyptus ranges from 18-20 Mt/ha. The average expectedincome is Rs. 36,000/- to 40,000/ha/rotation. During the 2
and 3 rotations the farmers retain two coppices per stump.
Dindigul Division. Important short rotation species areAilanthus excelsa, Eucalyptus tereiticornis and Casuarinaequisetifolia sponsored by TCPL scheme. Under TCPLscheme, planting of seedlings, technical support and anadditional grant of 25 paise/seedling are provided to the
farmers through the Forest Department. Recommendedspacing for Casuarina is 1mx1m and 4000 seedlings/acreare planted. The scheme is open to farmers who have a
maximum 2 ha land area.
Villupuram Division. Casuarina (block plantation) andAilanthus excelsa (bund plantation) are cultivated through
TCPL scheme, while Eucalyptus tereiticornis is grown underTAFCORN. It started was during 1974 and commands anarea of 45,032 ha in the state. Almost 1 lakh Mt of pulp
wood is supplied to wood based industries (mainly to TNPL).Clones of E. camuldalensis are now preferred to seedlingsdistributed prior to 1999. Coastal plantation of Casuarinaequisetifolia in Villupuram division are effective barriersagainst tidal waves. The farmers are free to sell the produceunder TNPL scheme.
Virudhanagar Division. The main species grown byfarmers in Virudhanagar are Casuarina and Ailanthusexcelsa in addition to Ceiba pentandra. About 500 – 600
small scale and 40-50 medium scale match industries arelocated in Sivakasi and nearby areas of VirudhanagarDistrict, which use A. excelsa, A. malabarica, C. pentandraand others produce from short rotation crops. The matchsplints and veneers for match box industry are mainlysupplied by companies from Kerala. At present, because
of the low availability of short rotation species, the companiesare making splints from Hevea brasilliensis and supplyingthese to match industries. For making match boxes, the
industry is using veneers and also card board as analternative.
These activites helped in uplifiting the socio-economicstatus of villagers due to direct and indirect employmentgenerations have become other alternative livelihoodactivities of villagers
The short rotation trees such as Eucalyptus grandis, E.tereticornis, E. camaldulensis, Casuarina equisetifolia andAilanthus excelsa are cultivated in block plantation byTAFCORN under TCPL and contract farming by industriessuch as TNPL. Forest Department provides additional grantof 25 paise/seedling, planting material and technicalsupport under TCPL scheme. The scheme is open tofarmers who have a maximum 2 ha land. Plantations raisedunder various schemes have helped in generating directemployment to about 19,500 people and indirectemployment of about 1,02,000 peoples.
Table 2. Employment generation in short rotation tree plantations
Scheme/Corporation / Year of Total area Employment generation
Company initiation planted (ha) Direct employee / Indirect
labour
TAFCORN 1975 48,000 5,000 20,000
TNPL 1982 32,000 8,000 80,000
TCPL 2007 30,000 2,000 1,000
Farmers - 5,000 4,500 500
Total 1,15000 19,500 1,02,000
Short Rotation Forestry Impact on Livelihood
There has been tremendous pressure on the forestsin the recent years. To reduce this pressure on forests, new
approaches like social forestry, agroforestry, etc. haveemerged as alternative resource generation options.Considering these new approaches, species which are
fast growing, enrich soil and fulfill rural needs are in greatdemand. Albizia lebbek is an important multipurpose treespecies widely distributed from Himachal Pradesh upto
Assam in sub Himalaya tract and ascends upto 1000 m inwestern Himalaya. The tree yields fuel, fodder, agriculturalimplements, small timber, sports goods and raw material
for paper industry. Albizia lebbek being a leguminous andmultipurpose tree species has attained added importancein various social forestry as well as in agroforestryprogrammes. The availability of quality seeds in increasing
the productivity of this species is therefore of utmostimportance as the seed source is known to have significantinfluence on the species and ecosystem productivity. The
present investigations were therefore carried out to studythe influence of seed source on quality traits of A. lebbekseedlings, which will enable the forester, farmers and field
practioners in raising the quality planting stock.
The seeds of A. lebbek were collected from middleaged plus tree starting at physiological maturity in the month
of February when pods turn yellow from green. Ripe andhealthy pods were collected from the trees betweenDecember and March, or collected from the ground soon
after they fall from the trees from the following seed sources:
HP Zone I: Nahan, Rajgarh, SolanHP Zone II: Kunihar, Bilaspur, Arki
HP Zone III: Suket, Seraz, HamirpurHP Zone IV: KangraHP Zone V : Mandi
Pods collected from the trees were sun dried for 4-5days by spreading them on taruplin in a thin layer whenpods become dry; seeds were extracted from them by
opening pods with hand and beating the pods with sticks.The experiment was laid out in CRD design having fourreplicates. In each replicate, there were 100 seeds kept in
Evaluation of Seed Source Influence on Quality of Albizia lebbekSeeds Using Standard Sampling Technique
D.R. Bhardwaj and Ashu Chandel*Department of Siviculture and Agroforestry, *Department of Basic Sciences
Dr YS Parmar University of Horticulture and Forestry, Nauni, Solan 173 230 Himachal Pradesh, (India)*E-mail:[email protected]
sterilized germination paper in the germinator at atemperature of 25 °C and RH of 94-96 %. Initial count was
made one week after starting the test and further countswere made at 7 days interval till the test ended. Seed vigourindex was calculated by determining the germination
percentage and seedling length of the same lot. Whileevaluating the number of normal seedling at the time of thefinal count, the seedling length of 5 randomly selected
seedlings were also measured. S.V.I. was calculated bymultiplying per cent germination and seedling length. Thedata, wherever possible were subjected to statistical
analysis by the methods described by Gomez and Gomez(1984).
The seeds of A. lebbek were collected from variousseed zones of HP in the month of February and March and
studied for physical and physiological characteristics. Onan average seeds were found to be light brown in colour,smooth, compressed with hard seed test (Table 1). The
number of seeds per kg varied from 8798 to 10472 indifferent seed zones. As regards to normal seedspercentage, its value ranged from 77.45 - 90.42. The seeds
collected from different seed sources (seed zones and sub-zones in Himachal Pradesh) recorded a significantdifference in physical and physiological characteristics such
as number of seed per kilogram, seed purity, hardseediness, germination, seedling length and seed vigourindex. The number of seeds per kilogram, moisture, normal
seeds, immature seeds, germination and hard seedspercentage varied in the range of 8798-10472, 10.0-10.82,77.45-90.42, 5.80-9.66, 37.50-48.12 and 17.50-26.25,
respectively due to variation in seed sources.
A perusal of the data presented in the Fig. 1 revealedthat seed germination was found maximum (80.50 %) for
the seeds collected from Zone II, which was foundstatistically at par with Zone IV (80.0%). Zone II (Fig. 2 & 3)i.e., seeds collected from Bilaspur district of (H.P.) displayed
maximum seedling length (19.52 cm) and seedling vigourindex (1571.36), which showed significant differences fromother seed zones. Minimum value (17.94 cm) for seedling
Indian J. Ecol. (2011) 38 (Special Issue) : 202-203Indian Journal
of Ecology

203
length was recorded for seed zone III, which also recorded
minimum seed vigour index (1350.16). In general, the seedsources which showed lesser number of seeds per kgand hence more food reserve displayed more per cent
germination, seedling length and seedling vigour index.
For raising quality seedling stock quickly and efficiently,the seeds of Albizia lebbek should be collected from Zone
Table 1. Location wise physical seed characteristics of Albizia lebbek
Location Physical characteristics Moisture Seed Seed purity (%)
(%) per kg Normal Immature Insect(No.) seed seed infested
seed
Solan (Z I) Light brown, smooth, compressed with 10.00 9000 85.45 7.80 5.97
hard testa
Sirmour (Z I) Light brown, smooth, compressed with 10.57 8798 86.65 7.17 5.43
Bilaspur (Z II) Light brown, smooth, compressed with 10.82 9413 77.45 9.66 16.10
Hamirpur (Z III) Light brown, smooth, compressed with 10.22 9346 87.60 5.80 6.20
Kangra (Z IV) Light brown, smooth, compressed with 10.70 10472 90.42 3.92 5.49
Fig. 3. Effect of seed source on seed vigour index characteristics of Albizia lebbek
Fig. 1. Effect of seed source on seed germination (%)characteristics of Albizia lebbek
Fig. 2. Effect of seed source on seedling length (cm)characteristics of Albizia lebbek
II i.e., Kunihar, Arki (Solan) and Bilaspur areas of Himachal
Pradesh.
REFERENCESGomez, K.A. and Gomez, A.A.(1984) Statistical procedure for
agriculture Research (2nd edition), Johan Willey and Sons,Inc. New York. 680 p.
Seed Sources and Quality of Albizia Seed

Eucalyptus tereticornis (Mysore gum) is one of the
preferred species for short rotation plantation due to itsvarious features like fast growth, wide adaptability, straightbole and least post plantation care (Mathur et al., 1984).The common method of raising eucalyptus seedlingsinvolves sowing of seeds in primary nursery beds and latertransplanting tender seedlings into suitable containers.
Raising the seedlings in primary nursery is very crucial, asweed competition at this stage is one of the majorconstraints. Moreover, eucalyptus is found to be very
sensitive to weeds especially grasses during initial phase.For this species initial weed free period of 15-20 days isessential for good growth and development in primary
nursery. At this stage, manual weeding is quite difficult astender seedlings are damaged. Chemical weeding hasled to environmental pollution, residue problems in soil
and water, toxicity to animals and development of resistancein weeds. Thus, the time demands for new method besidesbeing cost effective and non-hazardous to the users as
well as to the environment. In this context, use of soilsolarization for weed control is gaining importance. Soilsolarization is a method of soil disinfection which is basically
a method of heating the surface of soil by plastic sheetsplaced on the moist soil to trap the solar radiation andthereby increasing the soil temperature. Solarization
process would increase the surface soil temperature by 8-120C due to this effect many annuals, perennials andparasitic weeds are effectively controlled (Katan, 1980).
The experiment was carried out at the Karnataka Forestnursery, Kalave near Sirsi. There were 9 treatmentcombinations comprising of 3 levels of thickness of
polythene sheet (G1 – 0.03 mm, G2 – 0.06 mm and G3 – 0.12mm) and 3 levels of duration of soil solarization (D1 – 30days, D2 – 45 days and D3 – 60 days). In each replication,
control (normal weeding without solarization) andunweeded check (no solarization and no weeding) plotswere maintained for comparison as well as for computing
other parameters. The experiment was laid out inCompletely Randomized Block Design (Factorial) with 3
Weed Management through Soil Solarization in Primary Nursery ofEucalyptus tereticornis
N. V. Saresh*, M. Sankanur, S. L. Madiwalar and Archana Verma1
Department of Silviculture and Agroforestry, College of Forestry, Sirsi-581401, Karnataka1University of Horticulture and Forestry.Solan -173230 (HP)
*E-mail: [email protected]
replications. The raised nursery bed of size 0.7m x 1.0 mwas prepared for each treatment. After preparation of beds
2.5 kg FYM per bed was added and mixed thoroughly withthe soil. Prior to spreading of polythene sheets, uniformirrigation was given and the plots were allowed to attain the
moisture level nearly at field capacity. Transparent polythenesheets were spread on the nursery beds as per treatments.The free sides of the polythene sheets were buried in the
soil to make it air tight. The soil temperature of solarizedplots was recorded at 5 cm depth by using thermometer.Eucalyptus seeds were broadcasted on the nursery bed
after the removal of polythene sheet. Weed flora and thenumber of individual weed species were counted at 15 daysinterval in different treatments and expressed as number
per standard nursery bed. Weed samples were removedand oven dried at 600 C for 48 hours and dry weight wasrecorded and expressed in g per standard bed. Weed
Control Efficiency (WCE) was calculated by using standardformula.
Thickness of polythene sheet used in soil solarizationis associated with efficacy of weed control and cost involved
in weed management. Hence, finding optimum thicknessof polythene sheet for weed management in primary forestnursery is of great significance. The solarization treatment
with thin polythene sheet (0.03 mm) recorded significantlyhigher shoot, root and total dry matter production ineucalyptus seedlings (Table 1). The extent of increase in
total seedling dry weight due to thin polythene sheet overmedium (0.06 mm) and thick polythene (0.12 mm) was21.49 and 40.69 per cent, respectively. Similar observations
of increased biomass production due to solarization withthinner polythene sheet was made by Mudalagiriappa et al.(1999) in ground nut crop. This increase was mainly through
its favourable effect on growth parameters like plant height
Weed dry matter production in control plotsx100WCE =
Weed dry matterproduction in control
plots
Weed dry matterproduction intreated plots
-
Indian J. Ecol. (2011) 38 (Special Issue) : 204-206Indian Journal
of Ecology

205
and number of leaves per plant. The increase in growthparameters in eucalyptus seedlings can be attributed to
effective weed control. The number and diversity of weedwere significantly reduced with thin polythene sheet thanmedium and thick polythene sheet. The reduction in number
and diversity of weeds might be due to increasedtemperature build up at 5 cm depth was 56.0 0C ascompared to 53.7 and 54.40C in treatment with medium
and thick polythene sheet, respectively. Higher soiltemperature due to thin polythene sheet resulted in killingof weed seeds thus reducing diversity and density of weeds
species. The reduced diversity and density of weed speciesled to reduction in weed count. It was 416, 435.7 and 763.4in thin, medium and thick polythene sheet, respectively
(Table 1). Reduction in weed count in turn resulted insignificantly lower weed dry weight in treatments with thinpolythene sheet (154.04 g) compared to medium (211.17
g) and thick polythene sheet (413.37 g). This ultimatelyreflected in higher weed control efficiency (92.7 %)
compared to medium (90.07 %) and thick polythene sheet(79.75 %).
Duration of solarization is associated with period ofexposure of nursery beds to higher temperature regime,which in turn decides weed control efficiency. Treatment
with long duration of solarization (60 days) showedsignificantly higher total dry matter production in eucalyptusseedlings. Compared to control, soil temperature was
higher by 12.3, 11.4 and 11.30C under to high, medium andshort duration of solarisation, respectively. The extendedsoil exposure to higher temperature resulted in killing of
weed seeds in long duration solarization which causedreduction in diversity and density of weed species. Thereduced diversity and density of weed species lead to
reduction in weed count i.e 306.69, 573.67 and 734.72 inlong, medium and short duration of solarization respectively.Reduction in weed count resulted in significantly lower weed
dry weight in long duration of solarization (136.19 g)compared to medium (241.62 g) and short duration
Table 1. Soil temperature (0C) weed parameters and seedling parameters as influenced by thickness of polythene sheet (G) andduration of solarization (D)
Treatment Soil temp. Weed count weed dry WCE Plant height Number of Seedling
(0C) per bed weight (g) (cm) leaves dry weight (g)
Thickness of polythene sheet (G)
G1 56.0 415.97 154.04 92.70 2.01 5.86 7.13
G2 54.4 435.73 211.17 90.07 1.48 5.71 6.01
G3 53.7 763.38 413.37 79.75 1.56 5.34 5.09
SEm± 0.21 58.91 5.82 0.712 0.08 0.16 0.20
CD (5%) 0.68 188.46 18.63 2.28 0.27 0.53 0.61
Duration of solarization (D)
D1
54.3 734.72 400.75 80.20 1.62 5.72 5.30
D2 54.4 573.67 241.62 80.20 1.66 5.94 5.83
D3 55.3 306.69 136.19 93.68 1.78 6.25 7.10
SEm± 0.21 58.91 5.82 0.712 0.08 0.16 0.20
CD (5%) 0.68 188.46 18.63 2.28 NS* NS* 0.61
Interaction (GXD)
G1D1 55.0 733.66 314.39 84.99 1.70 6.13 5.48
G1D2 55.3 445.68 143.30 2.03 6.13 6.99
G1D3 57.3 68.57 4.42 99.87 2.30 6.76 8.92
G2D
154.0 544.84 368 82.74 1.43 5.33 5.28
G2D2 54.0 521.11 174.47 91.75 1.45 6.00 5.35
G2D3 55.7 241.25 91.03 95.73 1.54 6.26 7.41
G3D1 53.3 925.65 519.87 72.86 1.71 5.70 5.14
G3D2 53.7 754.23 407.08 80.95 1.49 5.70 5.14
G3D3 54.3 610.24 313.14 93.68 1.49 5.70 5.01
SEm± 0.37 102.04 10.09 1.23 0.15 0.28 0.33
CD (5%) 1.18 326.43 32.27 2.78 NS* 0.92 1.06
NS* = Non- significant
Weed Management through Soil Solarization

206
treatment (400.75 g). This ultimately resulted in higher weedcontrol efficiency (93.68 %) than medium and short (i.e.,
80.20 %) duration of solarization (Table 1). The higher weedcontrol efficiency due to long duration of solarization wasresponsible for improved growth of eucalyptus seedlings
due to greater availability of growth resources.
The combination of thin polythene sheet for longer
duration of solarization (G1D3) recorded significantly higher
total seedling dry weight of eucalyptus seedlings (8.92 g)
than in any other combinations (Table 1). This increase in
seedling dry weight due to the combination of thin polythene
sheet and longer duration of solarization was mainly
because of its favourable effect on growth parameters due
to effective weed control. such as plant height (2.30 cm)
and number of leaves per plant (6.76). The density and
diversity of weeds were reduced in treatments with
combination of thin polythene sheet and longer duration of
solarization compared to other combinations.
The solarization experiment indicated that, the optimumperiod of exposure of nursery beds to higher soil
temperature regimes and there by controlling the weedsthrough solarization can be achieved by using anappropriate combination of thin polythene sheet (0.03 mm)
with long duration (60 days) of exposure of polythene. Theincrease in temperature significant affect weed count, weeddry weight and there is an increase in weed control
efficiency, which ultimately reflected on survival per cent andgrowth attributes of eucalyptus seedling.
REFERENCESKatan, J. (1980) Solar pasteurization of soils for disease control,
Status prospects. Plant Dis. 64(5): 450-454.
Mathur, H.N., Francies, H. R. S. and Naithani, S. (1984) Groundwater quality (PH) under different vegetative cover at Osamund(Nilgiri hills), Indian For. 10(2): 110-115.
Mudalagiriyappa., Nanjappa, H.V. and Ramachandrapa, B.K. (1999)Effect of soil solarization in weed dynamics in Kharif Groundnut.Indian J. Weed Sci.31(1 & 2): 35-37.
N. V. Saresh, M. Sankanur, S. L. Madiwalar and Archana Verma

207
Subabul (Leucaena leucocephala L. dewit) is a miracletree with a wide assortment of cultivars for different useslike forage, timber, wind break, nitrogen fixation, pulp, etc.
for shallow marginal Vertisols. Subabul has beenintroduced in India mainly as an agroforestry crop to meetthe increasing demand for fuel, fodder and timber for poles
and posts. It can be grown in variety of soils and climaticconditions due to its tolerance to high temperature andextended drought and remarkable regenerative capacity
(Devaranavadgi et al., 1996;1999). The northern dry zone ofKarnataka is characterized by hostile environmentconditions like low and erotic rainfall, intense solar radiation
and poor fertility status of the soil. Therefore, cultivation offield crops in the shallow black soil is uneconomical and ithas become necessary to adopt alternative land use
systems in such soils. Considering all these factors, a studywas conducted to identify the fast growing subabulgenotypes for shallow vertisols of northern dry zone of
Karnataka.
The field experiment was carried out at RegionalAgricultural Research Station, Bijapur (Karnataka) during
1999 to 2010. The soils of the experimental site wereanalyzed for various physico-chemical properties (Sand25%, Silt 23%, Clay 52%, bulk density 1.43 g/cc, pH- 8.5,
EC- 0.34 dSm-1, CaCO3 18.5% and soil depth 30-35 cm).The average rainfall of the site is 585 mm in 39 rainy days.
Promising Subabul (Leucaena leucocephala) Genotypes for ShallowVertisols of Northern Dry Zone of Karnataka
S. B. Devaranavadgi* and Pradeep RathodRegional Agricultural Research Station, Bijapur- 586 001, Karnataka, India
*E-mail: [email protected]
The experiment was laid out in Randomized Block Designwith three replications during July 1999 with eight genotypesviz., K-8, K-28, K-29, K-67, K-409, K-636, S-10 and S-24. In
each replication, the treatment was represented by 25 plantsof same genotype at a spacing of 2 X 2 m in five rows. Only
the middle 9 plants were used for recording observations
in last four years on tree height (m), clear bole height (m),
diameter at breast height (DBH)(cm) and crown spread
(m). These parameter were further used to calculate wood
volume by using Huber’s formula (Avery and Burkhart, 1983)
and average annual increment. The data recorded on
various characters during the course of investigation were
subjected to Fisher’s method of analysis of variance and
interpretation of data was made as per the procedure given
by Gomez and Gomez (1984).
The data on tree height (m), diameter at breast height
(cm), clear bole height (m) and crown spread of ten year old
trees are presented in table 1. The genotype S-10 recorded
the highest tree height (11.70 m), diameter at breast height
(10.27 cm), clear bole height (3.57 m) and crown spread
(E-W: 3.42 m, N-S: 3.47 m) followed K-636 (11.60 m, 10.13
cm, 3.38 m and E-W: 3.21 m, N-S: 3.14 m, respectively) and
S-24 (11.53 m, 10.09 cm, 3.27 m and E-W: 3.13 m, N-S:
2.98 m, respectively). The lowest values were observed in
genotype K-29.
Table 1. Silvicultural parameters of subabul genotypes
Treatments Tree height (m) Clear bole height (m) DBH (cm) Crown spread (m)
E–W N–S
K - 8 10.34 3.26 9.34 3.13 3.33
K - 28 9.81 2.99 8.52 3.08 3.17
K - 29 8.44 2.51 5.84 2.97 3.15
K - 67 9.53 2.94 7.53 3.19 2.81
K - 409 10.82 3.86 7.62 2.88 3.01
K - 636 11.60 3.38 10.13 3.21 3.14
S - 10 11.70 3.57 10.27 3.42 3.47
S - 24 11.53 3.27 10.09 3.13 2.98
S.Em± 0.40 0.17 0.41 0.16 0.16
CD @ 5% 1.22 0.51 1.24 0.48 0.49
Indian J. Ecol. (2011) 38 (Special Issue) : 207-208Indian Journal
of Ecology

208
The data on total woody biomass production of fouryears (Table 2) revealed that genotype S-10 produced 91.11
m3 ha-1, 123.67 m3 ha-1, 163.20 m3 ha-1 and 193.74 m3 ha-1
in all the four years i.e., 8, 9, 10 and 11th year of plantingrespectively, followed by K-636 and S-24. The average yield
of wood increased as the years of planting increased in allthe eight genotypes but the genotype S-10 obtained highestannual average wood yield of 11.39, 13.74, 16.32 and 17.61
m3 ha-1 year-1 in all four years i.e., 8, 9, 10 and 11th year ofplanting, respectively followed by S-24 and K-636. Accordingto Gupta (1993), 18.75-23.75 m3 of average annual wood
can be harvested from Leucaena on marginal site with 6-8year rotation. At Bijapur on marginal soils, 102.50 m3 woodwas harvested with 6 year rotation (Guled et al., 1996).
Considering the all these parameters, it may be inferredthat the subabul genotypes, S-10, is the most promising togrow on shallow vertisols of northern dry zone of Karnataka
for minor timber purpose.
Table 2. Wood yielding ability of subabul genotypes for four years
Genotypes Wood yield (m3 ha-1) Average wood yield (m3 ha-1 year-1)
08th Year 09th Year 10th Year 11th Year 08th Year 09th Year 10th Year 11th Year
K-8 73.00 105.32 120.16 141.62 9.13 11.70 12.02 12.87
K-28 51.69 85.30 97.75 111.80 6.46 9.48 9.78 10.16
K-29 24.42 33.60 40.26 45.19 3.05 3.73 4.03 4.11
K-67 36.89 62.84 72.62 84.81 4.61 6.98 7.26 7.71
K-409 53.82 72.79 83.03 98.67 6.73 8.09 8.30 8.97
K-636 73.27 118.80 157.63 186.94 9.16 13.20 15.76 16.99
S-10 91.11 123.67 163.20 193.74 11.39 13.74 16.32 17.61
S-24 67.71 117.60 156.21 184.24 8.46 13.07 15.62 16.75
REFERENCESAvery, T.E. and Burkhart, H.E. (1983) Forest Measurement. McGraw
Hill Book Co., New York.
Devaranavadgi, S.B., Murthy, B.G., Desai, S.A. and Suhas Yelashetty(1996). Preliminary evaluation of subabul genotypes for psylidtolerance. Cur. Res. 25: 64-65.
Devaranavadgi, S.B., Guggari, A.K., Kalaghatagi, S.B., Wali, S.Y.and Nadagoudar, S.B. (1999) Suitable Leucaena genotypesfor shallow black soils of northern dry zone of Karnataka.Annals of Arid Zone 38(1): 45-48.
Gomez, K.A. and Gomez, A.A. (1984) Statistical procedure foragricultural research. John Wiley and Sons. New York. 680 p.
Guled, M.B., Belgaumi, M.I. and Agnal, M.B. (1996) Farming systemapproach, A means to manage resources for sustainedproductivity in northern dryzone of Karnataka. Souvenir ofInternational Meet on Resources inventory Techniques toSupport Agroforestry and Environmental Activities. DAVCollege, Chandigarh (October 1-3, 1996), India.
Gupta, R.K. (1993) Multipurpose Tree for Agroforestry and WastlandUtilization. Oxford and IBH Publishing Co., Bombay, pp. 10-73.
S. B. Devaranavadgi and Pradeep Rathod

Paulownia fortunei is a multipurpose tree growing onvariety of varied climatic and soil conditions. It is popularlyknown as “Chinese Wonder Tree” which belongs to family
Scrophularaceae. It was introduced in India by ForestResearch Institute, Dehradun from China in the last decade.The said tree is grown extensively in farm forestry sector in
China. It is a strong light demander, does not tolerate shadeand prefers to grow better in absence of top and side shade.It can withstand temperature between -20 to +40oC but
optimal conditions for growth are between 24 to 29 oC. Thedeciduous nature of plant forces it to remain leafless duringwinter months. The soil pH requirement varies from 5.0 to
8.9 for the Paulownia plantations. It has wide range ofnatural distribution which extends from tropical (plains) totemperate regions up to an elevation of 2400m amsl. The
annual rainfall requirement varies between 500 to 2000mmin its natural zone.
It is fast growing tree species considered to be
economically and ecologically viable option to the farm
forestry sector in the Kashmir region. The poplar clones
existed in the region are pre-dominantly females and are
responsible to create un-healthy aero-environment due to
cottony mass generated during May and June months of
each year, which is responsible for many allergic diseases
and other ill effects to human as well as livestock health.
Every year, state government is spending huge amount of
money to check this problem. However, so far no expected
results have been obtained.
Paulownia fortunei is looked upon as substitute to
poplar due to its short rotation and other broad spectrum ofuses like wood for carving, furniture, cabinet plywood andfuel. This species adds large quantities of nitrogen to soil
and can as such be used to restore the fertility of degradedsoils. It is also well documented that the absorbing roots ofP. fortunei are located below the rooting zone of annual
crops and thus, make the species suitable for differentagroforestry systems. With such multi-dimensional uses,an attempt was made to study its establishment, growth,
biomass, soil binding capacity and nutrient composition
Paulownia fortunei: A Pragmatic Approach to Intensive ForestFarming under Temperate Conditions of Kashmir Region
T. H. Masoodi, R. Banyal*, N. A. Masoodi and S. A. GangooDeptt. of Forestry, FOA & RRS, Wadura, Sopore, SKUAST-K, Srinagar, India
*E-mail:[email protected]
before it could be considered for plantation on waste, farmand degraded lands of the State.
MATERIAL AND METHODS
The present investigations were carried out in the
department of Forestry, FOA & RRS, Wadura, Sopore,SKUAST-K under rainfed conditions. The climate of the areais temperate with moderate summer and severe cool winter
with wide variations in the mean maximum and minimumtemperatures. The soil of the experimental site was acidicto neutral (5.8 to 7.2).
One-year-old entire plants raised from cuttings wereplanted in 45cm3 pits at 3x5m spacing during mid-week ofDecember 2001. Plantation is done deep enough to provide
good anchorage for young trees. No fertilizer or manurewas applied to the soil in the pits. Observations on growth,biomass, soil binding capacity and fodder values were
recorded every year at the end of growth period. Soilconservation value was determined by using the formulaegiven below:
V F = ———— r2
Where, F= Binding factor V= Volume of roots r= Radius of roots inmm
The values of nutrient composition were determinedby employing standard tested procedures. However, the
palatability of the leaves has not been tested.
RESULTS AND DISCUSSION
The growth of P. fortunei was recorded for 6 yearsbetween 2001 to 2007. The data presented in table 1
revealed that 6-year-old plants of this species attained anaverage height of 8.05 m with diameter of 14.56 cm. Theheight and diameter recorded for tallest tree was 9.27 m
and 18.30 cm, respectively. The results further revealed thatannual increase in growth is rapid in the first few years,which declined later with major fluctuations. The increase
in height of main stem in the 2nd year was 43 per cent, whichdecreased to 36, 28, 24 and 22 per cent during the
Indian J. Ecol. (2011) 38 (Special Issue) : 209-211Indian Journal
of Ecology

210
subsequent years. The rate of increase in diameter alsofollowed the similar trend and decreased progressively withadvancing in age. These results are in line with those
recorded under 6 year old plants of P. fortunei in KwangsiChina.
The data in table 1 shows that total biomass increased
from 2.77 kg/plant at the age of one year to 113 Kg/plantover a period of six years. The above ground biomasscomprised about 47 and 70 percent of total biomass at the
age of one and six years respectively. The data further showthat at the age of one year the biomass was ranked asroots> trunk>leaves and after 5 years, the trend was
trunk>roots>branches>leaves>fruits. This indicated that atthe age of one year Paulownia invests more assimilates toroot growth and as the age progress the growth of trunk
becomes faster to accumulate more biomass. The resultson partioning show that at the age of six years stemconstitutes 53 per cent of above ground biomass followed
by 22, 17 and 8 per cent by branches, leaves and fruits,respectively (Table 2).
The contribution of main, 1st, 2nd and 3rd order roots
to total root biomass was 59, 19, 12 and 10 per cent at the
age of one year and 27, 34, 22 and 17 per cent after attainingan age of 6 years (Table 3). The distribution of root biomassat various depths at the age of one year was 18 per cent
from 0-20 cm, 61 per cent from 20–40 cm, 16 per cent from40–60 cm and 5 per cent from 60-80cm. On the other hand,the distribution of roots at the age of 6 years was in order of
4 per cent from 0-20 cm, 25 per cent from 20–40 cm, 33 percent from 40–60 cm, 19 per cent from 60-80 cm, 15 per centfrom 80–100 cm and 5 per cent below the depth of 100 cm
.The data further showed that more than 80 and 96 per centof roots were found below the depth of 20 cm after the ageof 1 and 6 years, respectively. It can be inferred that P. fortuneicould be considered as an ideal species for introduction inany agroforestry systems involving annual crops, whichgenerally have a limited root zone of 0-25 cm.
The absorptive roots with an average diameter of 1.8mm constituted 77 and 79 per cent of total root length inone and six year old plants, respectively. The estimates of
root surface area manifests that one and six year old plantsof P. fortunei exhibited a respective surface area of 2173and 8254 cm2 plant-1. Generally, the third order roots (tertiary
roots) accounted for more than 54 and 44 per cent in one
Table 1. Growth trends of Paulownia fortunei during 1st and 6th year
Age Height DBH Above ground Below ground Total
(years) (m) (cm) (kg/ plant) (kg/ plant) (kg/ plant)
1 1.22(± 0.007) 1.72*(± 0.014) 1.304 (±0.008) 1.466 (± 0.006) 2.770 (± 0.018)
2 2.15(± 0.006) 3.00(± 0.13) 4.632 (±0.03) 5.223 (± 0.050) 9.855 (± 0.016)
3 3.37(± 0.016) 5.10(± 0.015) 11.613 (±0.012) 9.501(± 0.015) 21.114 (± 0.017)
4 4.72(± 0.009) 7.84(± 0.012) 26.912 (±1.22) 17.941(± 1.42) 44.853 (± 1.36)
5 6.27(± 0.03) 10.68(± 0.016) 55.565 (± 1.61) 23.248 (± 1.32) 78.813 (± 1.58)
6 8.05(± 0.11) 14.02(± 0.011) 78.887 (± 1.83) 34.192 (± 1.73) 113.079 (± 1.76)
Table 3. Below ground biomass (fresh weight kg/plant) distribution of P. fortunei at various soil depths
Soil depth (cm) Main root 1st order 2nd order 3rd order Total
1 yr 6 Yr 1 yr 6 Yr 1 yr 6 Yr 1 yr 6 Yr 1 yr 6 Yr
0 – 20cm 0.163 0.256 0.047 0.455 0.033 0.260 0.029 0.378 0.272 1.302
20 – 40cm 0.515 3.026 0.153 1.986 0.124 1.736 0.100 1.903 0.892 8.631
40 – 60cm 0.138 2.691 0.059 4.075 0.022 2.055 0.014 2.240 0.233 11.133
60 – 80cm 0.043 1.517 0.019 1.875 0.004 1.606 0.003 1.530 0.069 6.340
80 – 100cm - 1.447 - 1.556 - 1.150 - 0.561 - 5.000
>100cm - 0.350 - 0.664 - 0.638 - 0.257 - 1.786
Total 0.859 9.287 0.278 11.591 0.183 7.445 0.146 5.869 1.466 34.192
Table 2. Above ground biomass (fresh weight kg/plant) distribution of P. fortunei
Particulars Stem Branch Leaves Fruits Total
1 year old 1.095 (±0.06) - 0.209 (±0.003) - 1.304 (±0.05)
6 year old 41.68 (±1.12) 17.21 (±0.17) 13.48 (±0.19) 6.52 (±0. 08) 78.89 (±1.21)
T. H. Masoodi, R. Banyal, N. A. Masoodi and S. A. Gangoo

211
Tab
le 4
. R
oot
grow
th a
nd s
oil
cons
erva
tion
valu
e of
P.
fort
unei
Par
ticul
ars
Mai
n ro
ot1st
ord
er2nd
ord
er3rd
ord
erTo
tal
1st y
ear
5th
year
6th y
ear
1st y
ear
5th
year
6th y
ear
1st y
ear
5th
year
6th y
ear
1st y
ear
5th
year
6th y
ear
1st y
ear
5th
year
6th y
ear
Roo
t len
gth
132.
529
5.2
315.
338
0.3
10
93
.71
29
2.6
15
31
.43
37
2.8
23
65
6.7
69
62
.71
76
88
.31
93
13
.26
90
06
.90
22
45
0.0
02
45
77
.86
(cm
/pla
nt)
Roo
t su
rfac
e18
0.95
511
51.0
312
30.2
026
6.21
012
60.9
515
12.3
454
2.11
616
79.3
619
01.4
811
83.5
433
07.7
136
10.8
521
72.8
2173
99.0
582
54.8
7
area
(cm
2 /pl
ant)
Soi
l bin
ding
22.6
883
.35
89.1
425
.30
59
3.5
67
09
.73
12
2.1
47
88
.18
85
4.3
62
20
.47
26
27
.09
17
76
.07
39
0.5
94
09
2.1
84
42
9.3
0
valu
e
and six year old plants, respectively. The root surface areaof 6 year old plants was 3.8 times more as compared to
one old plant. Further, about 80 per cent of absorptive rootswere spread in a radius of 20 to 100 cm. These resultsindicate that this species has a well-developed root system,
which provides very suitable conditions for intercropping.
Soil conservation value. The soil conservation valueof one and six year old plants was 391 and 3429 per plant,
respectively (Table 4). Again, tertiary roots had the highestsoil binding capacity of 220 and 1776 per plant in one andsix year old plants. The binding factor increased by more
than 8.8 times over a period of 6 years. These data indicatedthat Paulownia roots have a high potential for stabilizingand conserving degraded lands prone to soil erosion. In
addition, the deep rooting system does not compete forsoil nutrients and water with crops, therefore, P. fortunei isconsidered most promising multiple purpose agroforestry
species.
It is also clearly observed that deep rooted system (76%of the absorbing root system is distributed at a depth of 40-
100cm under the ground surface) is not only reducing thecompetition for water and nutrients with inter-crops but alsoequally responsible for increasing the moisture and
nutrients from top soils. The phenological behaviour of thespecies favours its cultivation under tree farm lands. Thelate leaf emergence favours the growth of under crop and
late leaf fall protects the crops from frost injury. The moisturecontent of the soil at 0-40cm is 19.7 per cent higher thanthat of the open field.
Paulownia Farming in Temperate Areas

Agroforestry is a sustainable land management systemwhich increases the overall yields of lands, combine treesand shrubs with agriculture crops and lives stock on the
same unit of land either simultaneously or sequentially.Mulberry is a fast growing tree and hence produces verylarge quantities of renewable biomass in the form of
branches, shoots, leaves and fruits. Thus by growingmulberry it is possible to use the leaves as food forsilkworms and as a fodder for cattle and goats. The dried
branches can be used as a fuel. One kg of mulberry woodproduces 4600 calories. Thus mulberry can be cultivatedas a trained tree in a wide variety of soil condition and
adoptable to be cultivated as a rain-fed crop and plays animportant role in soil conservation and prevention of soilerosion. This form of cultivation is already been practiced
in temperate and hilly regions. Of late, the concept of treeplantation has also spread in to the plains as a sustainablecrop under severe water stress conditions in waste anddenuded lands. It is possible to grow short duration high
yielding varieties of ground nut, mung, soybeans, cowpea,ragi and various vegetables as intercrops in mulberry (Ahsanet al., 1989). Under these advantages, evolved packages
pertaining to various agronomical practices are discussedfor the use of different agencies.
MATERIALS AND METHODS
Central Silk Board’s R&D institutes evolved various
viable agronomical practices pertaining to mulberry treefarming and suitable intercrops. These techniques werevalidated at different agro-climatic conditions. Based on
the viabilities a package of alternatives are formulated anddocumented for the field application.
RESULTS AND DISCUSSION
Raising of saplings. Saplings should be raised 5-6
months prior to their direct plantation in the month ofFebruary with the onset of warm weather. Saplings meantfor tree mulberry are raised in nursery beds of convenient
size (8.5 X 1.2 cm). Cuttings are planted with a spacing of15 cm within the row and 30 cm between rows. About 168cuttings can be accommodated in a nursery bed of 10 m2
(Dandin et al., 1988).
Agro-Sericulture Pastorial System for Income Generation
K. V. Shankar Rao, R. Sahu and K. C. Brahma*Regional Sericultural Research Station, Central Silk Board, Landiguda, Koraput – 764 020, Orissa, India
*E-mail:[email protected]
Planting season. Plantations carried out duringmonsoon season are more successful than the one carriedout during winter season. Plantation should be carried out
within 1-2 days of uprooting from nursery site. Saplings aretransported only during morning/evening hours and coveredwith moist gunny cloth during transportation/Storage.
Mulberry varieties. S13, S146, S1 and S1635 varieties aresuitable for plain areas under rainfed conditions. Kanva2
and V1 in irrigated areas.
Method of plantation. In case of loosely textured anddeep soils, pits of 45x45x45 cm can be dug. In case of hardand shallow soils, pits of 60x60x60 cm can be dug. Pits
must be filled with FYM or compost (5 kg/pit) and soil. Forestsoils are generally acidic, lime application @ 500 g/pit isnecessary along with farmyard manure.
Spacing. In large extent of cleared forestland with
undulating surface, 2.4 x 2.4 m or 3 x 3 m spacing is moresuitable. In marginal land holdings, 1.5 x 1.5 m spacingand along with the border of the field, also two sides of
irrigation drainage channels 2.4 x 2.4 m spacing.
Sapling planting. Saplings of 5-6 months age with aheight of 1.5-1.8 m can be used for planting. One sapling
must be planted in each pit and it should be planted deepand straight in the center of the pit.
Training. The first apical cut should be given to the
sapling after about 15 days of planting. All the buds sprouting
below 150 cm should be removed allowing only the
uppermost 4-5 branches to grow during the first year of
plantation. Thereafter, these branches should be given a
cut at 60-75 cm each and crown allowed to be formed. No
pruning is advocated for the first two years of plantation.
Maintenance. During the first year of establishment,
all the lower buds should be removed regularly. Plants
must be protected from the grazing animals like cattle and
goats through a tree guard. Plants will attain a height of 2.4
– 3.0 m after one year of planting. During May-June (2nd
year) plants are given the first pruning at a height of 90 cm
from ground level in a spacing of 1.5 x 1.5 m and at a height
of 120 cm in spacing of 2.4 x 2.4 m and 3.0 x 3.0 m leaving
3-4 buds on each primary branch (15-20 cm). Soon after
Indian J. Ecol. (2011) 38 (Special Issue) : 212-213Indian Journal
of Ecology

213
pruning 5 kg of well decomposed FYM or compost must beapplied around the plant followed by the thorough digging
and weeding. After digging, a basin of 60 cm radius aroundeach plant is made for water retention. The second pruningis done 15 cm above the first cut before the cessation of
rains (October-November). The third pruning is doneanother 15 cm above the send cut with onset of monsoonshowers to maintain a final crown height of 120 cm in case
of 1.5 x 1.5 m spacing and 150 cm in case of 2.4 x 2.4 m and3.0 x 3.0 m spacing.
Nutritive management. FYM @ 10 mt/ha/yr and 2 mt
Vermi-compost plus green manure crop sunhemp ordhaincha once in a year in rainy season followed bymulching. Chemical fertilizer N:P:K @ 50:25:25 in two split
doses plus the use of VAM (Benchmin et al., 1997).
Mulberry Cocoon Production
With the proper care and maintenance in 3-5 yearsmulberry attains tree form and gives 6-8 mt/ha/yr through
4-5 harvests and can very easily rear 500-700 dfls which inturn yields 250-300 kg mulberry silk cocoons and as a solecrop Rs.15,000/- to Rs.25,000/- per annum per hectare can
be obtained. Thus, selection of mulberry tree in agro forestryis based on cultural and economic as well as environmentaland biological factors (Nadagoudar, 1998). Karnataka state
has a leading role in the development of several modelwatersheds, with which mulberry has been considered asone of the important component.
Intercropping in Mulberry
Intercropping in mulberry has been attempted bygrowing legumes (Sinha et al., 1987), vegetables (Koul etal., 1996) and pulses. It is possible to grow short duration
high yielding varieties of ground nut (Kasivishwanathan,1977), mung, soybeans, cowpea, ragi and variousvegetables (Gargi et al., 1997) as intercrops in mulberry.
This not only augments the farmer’s income but alsoimproves the soil fertility. Growing horsegram, cowpea (Daset al., 1990) and moth beans as intercrops in mulberry helps
in retention of soil moisture in rainfed areas, therebyimproving leaf yield. Intercropping helps in economic
distribution of labour, insurance against natural calamities,higher yield per unit, better control of weeds, pests ordiseases and continuous leaf cover gives better protection
against erosion.
Mulberry can be extensively used for social forestry,panchayat lands, community lands, schools land, etc.
needs to be encouraged, besides trees could be grown onroad sides and on backyard of farmers dwellings, as aboarder fencing. The tree is suitable for row intercropping,
mixed intercropping, strip intercropping, parallel multiplecropping, relay intercropping, multi-tier intercropping andalley cropping.
REFERENCESAhsan, M.M., Dhar, K.L., Fotedar, R.K. and Dhar, A. (1989) Studies
on intercropping of short duration crops with mulberry. IndiaJ.Seric. 28(2):194-199.
Benchamin, K.V. (1997) Mulberry cultivation techniques under waterstress condition. Indian Silk 36(3): 12-18.
Dandin, S.B., Pillai, S.V. and Sengupta, K. (1998) Guidelines forraising mulberry saplings on commercial scale - CentralSericultural Research & Training Institute, CSB, Mysore.
Das, P.K., Choudhury, P.C., Ghosh, A., Mallikarjuna, B.,Suryanarayana, N. and Sengupta, K. (1990) Effect of greenmanuring, dry weed and black polythene mulching on soilmoisture conservation, growth and yield of mulberry and theireconomics under rainfed condition. Indian J. Seric. 29(2):263-272.
Gargi, Shukla, P., Kumar, D., Kumar, R. and Pandey, R.K. (1997)Intercropping for profitable sericulture in purvanchal. IndianSilk 35(11): 31-32.
Kashiviswanathan, K., Sitarama Iyengar, M.N. and Venkataramu,C.V. (1977): Studies on dry farming of mulberry in Mysore (I-IV). Indian J. Seric. 6(1): 34-42.
Koul; Gupta, A., Singh, D. and Gupta, S.P. (1996) Intercropping ofvegetables in mulberry. J.Seric. 4(2) : 48-51.
Nandagoudar, B.S. (1998) Role of trees in watershed management.In : Integrated Dryland Farming Practices for SustainableProduction. University of Agricultural Sciences, Dharwad.
Sinha, A.C., Sarkar, A. and Das, B.C. (1987) Technology forintercropping in mulberry. Indian Farming 36(11): 11-12.
Agro-Sericulture Pastorial System for Income Generation
Exponential increase in human and livestockpopulation in India has put tremendous pressure on natural
resources, owing to not only degradation of principalresources like land, water and vegetation but also reducedper capita availability of land. The prime agricultural lands
continue to be diverted to non-agricultural uses likeindustrialization and urbanization with the result that
marginal rainfed lands are brought under cultivation with
least attention on resource conservation. Out of 143 million
hectares arable land in India, nearly 74 per cent is rainfed,
which contributes about 42 per cent of total food production.
However, soil moisture stress due to vagaries of weather,
moderate to severe soil erosion and poor soil fertility are
the major limiting factors of low productivity in rainfed areas.
Therefore, this trend needs to be discouraged. Virtually, a
sizable area (171 m ha) in our country is categorized as
degraded lands. Such lands are subjected to problem of
water and wind erosion, salinity, alkalinity, acidity, water
logging, gullied and ravine lands, shifting cultivation, etc.
are either lying vacant or under utilized. Therefore for fulfilling
the basic needs of food, fruit, fuel, fodder, fiber, fertilizer, etc.
horticulture based farming systems can play a major role
by adopting practically feasible, economically viable and
eco-friendly technologies developed in recent past.
Considering above facts, horticulture based composite
farming systems were evaluated to establish a viable model
for rehabilitation and utilization of semi-arid rainfed areas.
The experiment was carried out at Central HoriticultureExperiment Station Vejalpur farm with aonla and neembased cropping systems, grown under rainfed conditions.
The climate of the area is semi- arid with rainfall of 750mmduring the experimental period. The mean minimum andmaximum temperature was 440 C and 100 C .The soil of the
site has 0.75 to 1m depth, with a pH range of 7.5 to 8.1 .Thesoil of the area is saline in nature The aonla crop wasraised at 10x10 m spacing (100 plants ha-1) and neem at
10X5m spacing (200 plants ha-1).Vegetables and foddercrops were grown as intercrops during kharif season in the
Developing Sustainable Horticulture Based Farming Systems for theSemi-Arid Rain-fed Areas in Gujarat
S. S. Hiwale* and S. K. SharmaCentral Horticultural Experiment Station, Godhra –Baroda Highway, Vejalpur-389 340, Gujarat, India
*E- mail: [email protected]
interspaces. The system was compared with traditionalsystem of the farmers of the area. Data on growth, biomass,
yield and productivity of various crops grown in the systemwere recorded along with their economics.
Observations recorded on seven year old aonla plants
revealed that mean plant height was 4.84m, mean stockdiameter 28.11mm, plant spread 20.11 m2 and a leaf areaindex (LAI) of 20.56. In aonla based cropping system,
maximum LER (1.71) was recorded in aonla + okra croppingsystem. Highest mean net return (Rs. 68,715/-) was notedin aonla + maize cropping system. Aonla +maize was found
to be the most suitable for the semi- arid area as maizebeing a traditional crop of the farmers of the region andalso provide fodder for their cattle. Biomass production was
highest on fresh weight basis (163.48 q ha-1) as well as dryweight basis in maize (34.33 q ha-1).Total biomassproduction from the aonla with maize system was 332.30 q
ha-1. Root weight was 21.94 per cent of total biomassproduced by the trees (Hiwale, 2004).
Growth observation in neem based production system
indicated that mean plant height in seven year old plantswas 6.25 m, stock diameter was 19.32 mm, plant spreadwas 25.5 m2 with leaf area index of 25.38 m2.. Highest net
returns of Rs.14, 543/- was recorded in neem + cenchrus.Neem tree above ground biomass at seven years of agewas 218.84 q ha-1, whereas, below ground biomass was
80.94 q ha-1. Total biomass production in the seventh yearwas 414.39 q ha-1. (Table1). Root weight was 21.94 percent of total biomass produced by the aonla tree and 24.93
per cent in neem tree. Lower below ground biomassproduction has also been recorded in arid conditions byTokey and Bisht (1992).
Comparative performance of both the systemsindicated that plant height and LAI was more in neem whereas, stock diameter and plant spread was more in aonla.
Higher biomass was produced by neem tree compared toaonla, which is because of double the plant population perhectare.
Indian J. Ecol. (2011) 38 (Special Issue) : 214-215Indian Journal
of Ecology

215
Studies on leaf litter fall and estimation of nutrient
addition indicated that maximum leaf litter was recorded in
neem. N and P per hectare was recycled by neem (13.70
and 1,15kg/ha, respectively whereas maximum K was
recycled by aonla (3.38 kg ha-1). Rate of decomposition
was higher in aonla (28.53%).
Horti-agriculture production system composed of aonla
intercropped with maize was the best as it not only provides
food, fruit and fodder to the farming families but provides
additional income also. Among the different silvipastoral
systems neem intercropped with cenchrus grass was the
best.
The comparative economics worked out indicated thatin a seven year rotation aonla with maize gave a net return
of Rs. 2,03,610 with a annual net return of Rs. 29,087/-anda B:C ratio of 4.66. However, neem with cenchrus grass
gave a net return of Rs.1,52,725/- with a annual averagereturn of Rs.17,365/- and a B:C ratio of 10.18 (Table 3) . The
traditional system gave lowest net return of Rs. 56,700/-with a B:C ratio of 3.31. Thus, it can be concluded that insteadof monocropping, it is advisable to go in for horti-agri
cropping system for the farmers who have less land area tomeet the requirement and silvipastoral system to the farmershaving excess land to meet their basic requirement. The
composite system helps in increasing the productivity perunit area but also helps in maintaining the sustainability ofthe soil, besides proving food, fodder and fuel.
REFERENCESHiwale, S.S. (2004) Develop sustainable agri-silvi-horti production
on marginal lands. Technical bulletin 71 p.
Toky, O.P. and Bisht, R.P. (1992) Observations on the rooting patternof some agro forestry trees in arid regions of north westernIndia. Agrof. Syst. 18:245-263.
Table 3. Economic analysis of agroforestry systems
Particulars Horti-Agricultural Silvi-Pastural Traditional
system system system
1. Tree component Aonla (100plants ha-1) Neem (200plants ha-1) Maize
(Emblica officinalis Gaertn.) (Azadirchata indica)
2. Crop component Maize Cenchrus Red Gram
3. Rotation (yrs) 7Yrs. 7yrs. 7yrs.
4. Cost of cultivation (Rs.) 46,500/- 15,000/- 24,500/-
5. Gross return(Rs.) 217100/- 152725/- 81,200/-
6. Net return (Rs.) 203610/- 121560/- 56,700/-
7. Annual average net return (Rs.) 29087.14/- 17365.71/- 8,100/-
8. B.C. Ratio 4.66 10.18 3.31
9. B.C. Ratio at 12 % discount 4.11 8.96 2.91
10. Annual average employment 185 72 88
Table 1. Mean plant growth, LAI, biomass production in horti-agriculture and silvi-pasture production system
Plant Stock dia. Spread LAI Biomass produced (q ha-1) on fresh wt basis Total
height (mm) (m2 ) biomass
(m) Above Below Fruit Intercrop (q ha-1)
ground ground
Aonla 7Yr.old 4.84 28.11 25.5 20.56 62.02 37.05 69.75 163.48 332.30
Neem7yr.old 6.25 19.32 20.11 25.38 218.84 80.94 24.86 89.75 414.39
Table 2. Leaf litter fall, decomposition and nutrient recycling
Litter fall q/ha Litter Nutrient addition(kg/ha)
decomposition % N P K
Aonla 7 year old 9.37 28.53 7.46 1.03 3.38
Neem7 year old 9.62 25.27 13.70 1.15 3.08
Developing Sustainable Horticulture Based Farming Systems

Most of the introduced plant species that become
naturalized do not cause significant problems as they areconfined to highly disturbed sites or are not expanding theirrange but few species do, which are called invasive species.
In the last few decades, ecologist and natural resourcemanagers have recognized that the spread of non-native oralien organisms poses a serious threat to the conservation
of natural and semi-natural habitat, and such invaders canhave a tremendous impact on the native faunal and floralcommunities. The spread of alien plants is a pervasive
threat as the invaders proliferate and continue to spread,even if their introduction has ceased or ecosystems are notlonger under the influence and pollution, fragmentation, andclimate change. The problem of biological invasions has
become a central issue in the conservation of our biologicaldiversity, and their control and management become costlyand labor intensive.
Within the last 100 years, the number of establishedalien plant species increased rapidly in many regions ofthe world as a result of increasing trade volume and travel
around the globe (Rajmanek and Randall, 1994). InIndonesia, there are few comprehensive information oninvasive alien species and Acacia nilotica is one among
them. Acacia nilotica (L) is a thorny wattle native in India,Pakistan and Africa. This species is widely distributed intropical and subtropical Africa from Egypt and Mauritania to
South Africa. In Africa and the Indian subcontinent, Acacianilotica is extensively used as browse, timber and fire- woodspecies. The bark and the seeds are used as source of
tannins. The species is also used for medicinal purposes.Bark of Acacia nilotica has been used for treatinghaemorrhages, colds, diarrhea, tuberculosis, and lesion,
while the roots have been used as an aphrodisiac and theflowers for treating syphilis lesions. The invasion of Acacianilotica has resulted in the reduction of savanna in Baluran
National Park reaching about 50%. Pressure to savannahas a great impact on the balance and preservation of wholeecosystem in Baluran National Park. The objective of this
study is to know about potency Acacia nilotica as invasive
Potency of Acacia nilotica as Invasive Species at Baluran NationalPark, East Java- Indonesia
ZuraidaCenter for Plantation Forest Research and Development, Forest Research Development Agency, Ministry of Forestry,
Republic of Indonesia. Jl Gunung Batu No 5 Bogor, 16610. PO BOX. 331, IndonesiaE-mail: [email protected]
species at Baluran National Park in East Java Indonesia.
This study conducted in June 2007 at Baluran NationalPark. The methods here focus on collecting primaryinformation by using questionnaire to interview the leaders
in the village, and observing directly to the site study. Besides,this study also got secondary data from literature study suchas papers, proceeding, journals, edited books, and internet.
Baluran National Park is one of National Parks in
Indonesia. It is located in the East Java Province, the capital
city of East Java Province is Surabaya. It is located between
7°29’ - 7°55’ S and between 114°17’ - 114°28’ E, with 0-
1247 m up sea level, rain fall 900-1600 mm/yr and air
temperature ranges from 27° - 34°C. Baluran National Park
is dry specific ecosystem in Java Island. It contains savanna
vegetation type, coastal forest, mountain forest, mangrove
forest, and ever green forest. Savanna vegetation dominate
40 per cent of the total forest at baluran National Park. There
are 444 plant species there. Some of them are Ziziphusrotundifolia, Azadirachta indica, Acacia leucophloea, etc.
These species can adapt to the drought condition, while
the others can’t. The other plant species are Tamarindusindica, Dioscorea hispida, Aleurites moluccana, Coryphautan, Avicennia sp, Cordia obliqua, Syzygium polyanthum,
and Sterculia foetida. There are 26 mammals (Bosjavanicus javanicus, Bubalus bubalis, Cuon alpinusjavanicus, Muntiacus muntjak muntjak, Cervus timorensisrussa, Panthera pardus melas, Tragulus javanicuspelandoc, and Prionailurus viverrinus). Bos javanicus is
the mascot of Baluran National Park. Besides, there are
155 kinds of birds (Hirundo rustica, Eudynamysscolopacea, Pavo muticus, Gallus gallus, Anthracocerosconvecus, Buceros rhinoceros, Leptoptilos javanicus, etc.).
Acacia nilotica has spread on the most of savana at
Baluran National Park, in Banyuwangi-East Java, they aresavanna Bekol, Kramat, Kajang, Balanan, Lempuyang,Dadap, Asam Sabuk, Curah Udang, Widuri, and Merak. At
the site of savanna Kramat, Kajang, and Balanan, this plantshave formed closed canopy. Savana Taipat is the only
Indian J. Ecol. (2011) 38 (Special Issue) : 216-217Indian Journal
of Ecology
217
savanna hasn’t been invasived. Besides at savanna area,Acacia nilotica is also found at the coastal forest. The
climate condition at Baluran National Park is one factor thataccelerate the spread of Acacia nilotica growth. Intensivesun shine and drought are the main factors that the seeds
of these plants eaten by herbivores in that area, such asBos javanicus, Cervus timorensis, Muntiacus muntjak,Bubalus bubalis, etc. On the result, the seeds come out
with the feces spread in the almost of the Baluran NationalPark Area. High intense of sun light and rain fall trigger thegrowth of the dormant seed. At savanna Bekol, the area is
open because Acacia nilotica plants were pulled out. Notlong after that this species grow as soon as possible. Thespread speed of this species at savanna Bekol is very fast.
Many efforts have been done to eradicate this species. In1998/1999, 175 ha Acacia nilotica had been pulled out,and ten years later, the height of this species reach 100 cm
in high density.
Baluran savanna is specific identity (mascot) at BaluranNational Park, that is very important for the ecosystem. If
the environment is disturbed, it can influence theecosystem. One of threat to this ecosystem is Acacia nilotica,the species become invasive, and invaded almost the
Baluran National Park Area. The speed of this speciesgrowth resulted in decreasing the quality and quantityBaluran Savanna, and influenced behavior of herbivore that
live there.
The result of the study showed that carrying capacity of
savanna at Baluran National Park to source of feeding has
decreased to support wildlife, thus threatening the survival
of wildlife. Many efforts have been made to eradicate
Acacia nilotica, mechanically and chemically. The
eradication of Acacia nilotica by chemical method was not
effective and efficient. This method spent a lot of budget,
because it needed a lot of chemical material compared to
area to be treated. While eradication by mechanical method
by cutting have also not found successful. This method
triggerd the dormant seed to grow, and supported coppicing.
Mechanical methods are time consuming, while heavy
machines like bulldozers are quite effective but that will
change the land structure.
Now, method that applied to eradicate this species is
by cutting and burning the coppice and pull out the seedling.
These activities need a lot of labor, continuity, and
monitoring. Until now, about 63 ha/year has been eradicated,
which needs another 73 years to eradicate this species
completely, provided there is no additional reinvasion to
this area.
REFERENCESRejmanek, M. and Randall, J. (1994) Invasive alien plants in
California: summary and comparison with other areas in NorthAmerica. Madono 41: 161-177.
Potency of Acacia nilotica as Invasive Species

Nowadays mankind needs the wood and paper morethan the earlier times. The main resources of paper arebiomass cellulose. Deforestation increased in developing
countries to meet their own requirements and the demandsof rich industrialized counties thus led to large scaledeforestation, degrading the natural resources and the
climate. Planting the short rotation trees can conserve thenatural forests and mitigate the green house gases fromthe atmosphere. In this paper, an attempt has been made
to review the introduction of some suitable Populus speciesin different parts of Iran. This is a library research to reviewdocuments in order to identifying compatible Populusspecies as a short rotation tree in different parts of Iran.
Because of variable climates in different regions of Iran,many different species of Populus exists there. In different
regions of Iran, different species have been noticed, whichare compatible wit the existing ecosystems and theirproductivity was also found quite variable. Zanjan province
(north-west of Iran) is a good area for Populus plantationand about 60 per cent of Populus species in province is P.nigra var pubescens and 30 per cent is P. alba var shirazi,though the growth of P.alba has been observed better thanP.nigra. This species can reach the maximum height of 25m and 2.5m³ volume with the diameter of 50 cm, whereas,
P. nigra can only reach the maximum height of 22.5 m and1.6 m³ volume at same diameter. In Chahar Mahal-o-Bakhtiari province (south-west of Iran), P. nigra is the main
species, whereas, P. alba and P. euphratica are found innatural stands with lowest percentages of diffusion. In thisprovince, the average production of wood is 30 m³ per
hectare per year, so with considering it’s surface area,province can produce totally 540,000 m³ wood yearly.
In Gilan province, P. deltoides, P. euramericana, P.caspica, P. nigra and P. alba are available but because ofsuitable climate of this province to planting other speciessuch as Fagus and Quercus, Populus planting is not a good
choice. In Systan–va-Baloochestan province (south-east ofIran), there are natural stands of P. euphratica. This part of
Introduction of Compatible Populus Species in DifferentAreas of Iran
Maryam DaghestaniFaculty of Agriculture, Islamic Azad University-Abhar Branch-Abhar City, Zanjan Province, Iran
E-mail: [email protected]; [email protected]
Iran has a dry climate with salty soil. P. euphratica couldtolerate this condition. The average basal area for thisspecies in Systan is about 20 cm2 and average height can
be 5-7 meters. In Markazi province (center of Iran),P.euphratica, P.alba, P.nigra and P. deltoides with averagegrowth of 12.5 m³ per hectare per year has been noticed. It
is lower than average of Iran (22.5 m³ ha-1yr-1) and alsoaverage of world (45-60m³ ha-1 yr-1). The total stand volumeand growth in this province are about 616,000 m³ and
106,000 m³ per year, respectively. In Kerman, Kordestan,Khoozestan and Yazd province P. euphratica are used forplantation. Additonally, in West Azarbayjan, P. nigra attains
27.5 m³ ha-1 yr-1 growth. In Kermanshah, P.euramericanawith 39 m³/ha/yr growth and P. deltoides has comparativelylower rates of growth with 27 m³. In Kordistan, P.deltoideshas 25.18 m³ ha yr-1 growth and P. euramericana has lowerrate of growth (25.18 m³), whereas, in Karaj, P. nigra varbetulifolia has 30.83m³ ha-1 yr-1 growth and P. euramericanarecorded lower rates of growth of 27.45m³.
According to Iran forest organization study, Populusplantation area in Iran is 150,000 ha, with average 20m³
growth per hectare per year (Asadi, 1994; Kalagari, 1997).This area can produce 3,000,000 m³ wood yearly. Regardingto 10,000,000 m³ use of wood in Iran per year, this
production is not enough so the surplus need of wood issecured from other natural forests (Hyrcani forest) andimporting of wood. It is possible to increase the Populusplantation area to 500,000 hectare in Iran with attention ofplanting compatible species in each eco-regions. It canhappen with education and motivation of the farmers. The
plantations of fast growing tree species will certainly helpin protecting and conserving the natural forests of Iran.
REFRENCESAsadi, F. (1994) Investigation about economical and social causes
of Populus plantation reduce. M.Sc. Thesis, Tehran University,110 p.
Kalagari, M. (1997) Populus euphratica around Karoon. M.Sc.Thesis, Tehran University, 127p.
Indian J. Ecol. (2011) 38 (Special Issue) : 218Indian Journal
of Ecology

219
Grewia optiva, commonly known as ‘Beul’ belongs tofamily Tiliaceae, and it is a very important agroforestry tree
of the low and mid-hills regions in the western and centralHimalaya. It is naturally distributed in Indian subcontinent;Bhutan, Nepal, Pakistan and in India, it is distributed in
areas of Himachal Pradesh, Jammu and Kashmir, Punjab,Sikkim and Uttar Pradesh. It is a very popular tree which isgrown in different parts of Himachal Pradesh on account of
its utility as fodder, fuel and fibre. G. optiva is a small tomedium-sized deciduous tree of 9-12 m in height; crownspreading type; clear bole of 3-4 m with about 1 m diameter.
Branches smooth pale silvery-brown; bark dark brown, thickand roughish, exfoliating in small woody scales. Leavesopposite, ovate, acuminate, closely serrate, rough and hairy.
Flowers 1-8, together; penducles solitary, leaf opposed orexceptionally a few axillary. Sepals linear oblong greenoutside, white, pale yellow or red inside; petals white orpale yellow, shorter than the sepals, linear, claw distinct.
Fruit is a drupe, 1-4 lobed, olive green and black when ripe.It flowers from the end of March to June; flowers aremonoecious and lemon yellow in colour. Pollen grains
exhibit sulphur yellow colour and viability is upto 75 percent. About 60 genotypes of Grewia optiva are available inthe department which have been collected from different
districts of Himachal Pradesh. The aim of present studywas to investigate the relationship between the floral biologyand breeding system of Grewia optiva.
The present study was carried out in the department of
Tree Improvement and Genetic Resources in the College
of Forestry, University of Horticulture and Forestry, Solan
(HP). 12 genotypes from a collection of 60 genotypes were
selected to study floral biology and crossability pattern on
the basis of their growth performance. Visual observations
were made on flowering habit, initiation and duration of
flowering period, floral bud development, morphology of
flower, pattern of anthesis, dehiscence of anthers and
receptivity of stigma. The selected genotypes were used for
controlled crossing. For self pollination flowers were left
enclosed in cotton cloth bags. For hand pollination, the
flowers were emasculated in the evening hours and were
bagged with cotton cloth bag. Next morning, the
Floral Biology and Crossability Pattern in Grewia optiva Drummond
Archana Verma*, N. B. Singh, N.V. Saresh, Punit Choudhary and M. SankanurDepartment of Tree Improvement and Genetic Resources,
Dr. Y.S. Parmar University of Horticulture and Forestry, Nauni- Solan - 173 230, H.P. (India)*E-mail: [email protected]
emasculated flowers were hand pollinated. The handpollinated flowers were rebagged and tagged properly
indicating the date, time and genotypes which were crosspollinated. Finally, the percentage of self pollination, crosspollination and the per cent fruit set data was recorded.
The flowering buds started appearing along with theappearance of new leaves during the end of March month.Flowering started in first week of April and continued till the
end of June and first week of July, but a little variation fromgenotype to genotype was observed. The date ofappearance of first and last flower and duration of flowering
in different genotypes used for study is given in Table 1. Theflower buds appeared in the axils of the leaves in acropetalsuccession. The inflorescence is an umbellate cyme, there
were 2-8 flowers on one peduncel, the axils of the basalleaves bore more number of flowers than the axil of theterminal one. The flowers of G. optiva are complete, cyclic,regular with 5 sepals, polysepalous and 5 petals,
polypetalous. Androecium contains numerous anthers,ranging from 65-150 in number. Ovary monocarpellaryhaving 4 lobes, superior.
The dehiscence of anther took place prior to anthesis.The entire anther dehisced longitudinally. The dehiscencestarts from the point which is attached with the filament and
progresses towards the periphery, thus releasing pollen
Table 1. Date of initiation and flowering period in Grewia optiva
Genotypes Date of appearance Length of flowering
First flower Last flower period (days)
CH-4 16-4-2010 30-6-2010 76
CH-6 2-5-2010 15-7-2010 75
KA-1 28-4-2010 10-7-2010 74
KA-2 25-4-2010 14-7-2010 81
MA-3 27-4-2010 18-7-2010 83
MA-4 23-4-2010 10-7-2010 79
SH-2 30-4-2010 16-7-2010 78
SI-2 21-4-2010 11-7-2010 82
SI-7 24-4-2010 8-7-2010 76
SO-1 16-4-2010 5-7-2010 81
SO-2 16-4-2010 3-7-2010 79
SO-5 15-4-2010 5-7-2010 82
Indian J. Ecol. (2011) 38 (Special Issue) : 219-220Indian Journal
of Ecology

220
Table 2. Percentage of crossing and fruit set in self pollination and cross pollination in Grewia optiva
Mode of Pollination No. of flowers No. of flowers left Percentage No. of fruit Fruit set
pollinated after pollination set percentage
Self pollination 120 40 33.33 26 21.66
Cross pollination 400 179 44.75 103 25.80
grains. The process of dehiscence of anther took place
within 10-20 minutes. Pollen grains were dark yellow incolour and the size of pollen varied between 43-53.1 micronin size in different genotypes. Acetocarmine test was used
to determine the viability of the pollens. Percentage of fertilepollen grains of the individual plant was determined. Theaverage viability percentage varied from 77.19% to 80.39
per cent. The maximum receptivity of the stigma was
observed on the day of anthesis, when stigma becomes
shiny, sticky and have some viscous liquid on its surface,but the receptivity remains for a very short period. The totalnumber of crosses made in all the selected genotypes were
400 out of which 179 crosses were left hence, thepercentage of cross pollination is higher (44.75%) than selfpollination (33.3 %). Overall fruit set in all the crosses made
was 25.80 per cent (Table 2).
Archana Verma, N. B. Singh, N.V. Saresh, Puneet Choudhary and M. Sankanur
221
Since ancient times trees have been importantcomponents of human beings and an excellent part of
biodiversity. Trees are source of food, fodder, fuel wood,fiber, timber and lot of non-timber products like resins,biochemical used in pharmaceuticals, oils etc. Due to
deforestation, depletion of genetic resources due to withescalating present population needs, the forest cover hasdeclined at a very high rate. So there is a need to increase
area under trees. To improve forest vegetations especiallytrees, conventional approaches have been exploited forpropagation, but tree breeding efforts are most important
for the valuable fast growing tree species. However, suchmethods or approaches are limited with several inherentbottlenecks because these are generally long lived, sexually
self incompatible and highly heterozygous in nature. Due tothe prevalence of high heterozygosity in these species, anumber of recessive lethal alleles are retained within
existing population, resulting in high genetic load andinbreeding depression (Williams and Savolainen, 1996).Thus conventional breeding is rather slow and less
productive and cannot be used efficiently for the geneticimprovement of fast growing tree species (Srinidhi andChauhan, 2007). Plant biotechnological approaches mainly
plant tissue culture, genetic engineering or transformationoffer an epitomized option for effective multiplication andgenetic improvement of trees with a limited time span.
Interventions of biotechnological approaches for in vitroregeneration, mass multiplication and transgenic studiesin fast growing tree species have been encouraged
particularly in last few decades. Development of molecularmarker technology, the variation at chromosomal or DNAlevel can be detected easily. Elite and rare genetic material
of tree species can be multiplied true to type with the help ofmolecular markers.
Somatic embryogenesis also offers immense potential
to speed up the propagation of forest trees (Attree andFowke, 1993; Gupta et al., 1993). It is of great importance inforestry biotechnology because this system offers the
capacity to produce unlimited number of somatic embryoderived propagules (Attree et al., 1994) and artificial seeds
Role of Biotechnology for the Production and Improvement of FastGrowing Tree Species
Hira Singh* and S. S. BalDirectorate of Seed, Punjab Agricultural University, Ludhiana- 141 004 (India)
*E-mail: [email protected]
(Lulsdorf et al., 1993); in spite of this it can be the bestsource for genetic transformation.
Among fast growing tree species, the genus Populushas been adopted by the scientific community as the modelchoice because it offers numerous advantages such as
fast growing nature, facile vegetative propagation,interspecific hybridization, amenability to tissue culture andgenetic transformation, and a small genomic size
approximately 500 mb (Taylor, 2002).
Micropropagation of Forest Trees
Many biotechnologists have been working on plant
tissue culture in different forest tree species for decades.
The first achievement in this was reported by Winton (1968)
from leaf explants of Populus trichocarpa. Some forest tree
species or genotypes do show positive response while
some others are still recalcitrant during in vitro conditions.
In general juvenile tissues of trees are more responsive to
in vitro manipulations than mature tissues. The longer life
span of trees may add to the problem of contamination in
vitro by the symbiotic association of many microbes.
Besides the age of the tree, the response of explant is
primarily determined by genotype, physiological status of
tissue, and time of year when the explants are collected
and cultured (Giri et al., 2004). The concentration of plant
growth regulators and the composition of cultural media for
in vitro aseptic culture is very important.
In addition, there are many more limitations such as
low shoot prolification, excessive phenolic exudation
(Linington, 1991), callus formation at the base of explant
(Marks and Simpson, 1994), vitrification (Monsalede et al.,
1995) and shoot tip necrosis (Bargchi and Alderson, 1996).
Micropropagation without an intervening callus phase is
advantageous over conventional vegetative propagation in
terms of quantity, quality and economics (Altman and
Loberant., 1998). Micropropagation of trees in vitro is not
only a means for mass multiplication of superior clones
but it can be used for developing transgenic plants and
conservation of germplasm through cryopreservation.
Indian J. Ecol. (2011) 38 (Special Issue) : 221-224Indian Journal
of Ecology

222
Somatic Embryogenesis in Tree Species
In some cases somatic embryo formation occurreddirectly on the callus induction medium, whereas, in some
cases different media and different hormones are neededfor callus induction, somatic embryo formation, shootorganogenesis and plant conversion. Using cotyledon
explants with high concentrations of picloram or IBA somaticembryos have been produced from in vitro cultures ofEucalyptus globules (Nugent et al., 2001).
Genetic Modifications in Tree Species
The main advantage of the genetic modification is thatthe genetic constitution of the elite clone can be maintained,whereas in classical tree breeding programs it is lost with
every new cross, and inbred lines cannot be obtainedbecause of high inbreeding depression (Boerjan, 2005).The largest effort in genetic engineering has been devoted
to modifying the amounts and composition of lignin in treesto improve lignin extractability during pulp (Baucher et al.,2003). The deployment of such transgenic trees could
enhance the capability of the pulp mill while decreasingchemical costs and, importantly, reducing the ecologicalimpact on the environment. Over-expression of ferulate-5-
hydroxylase (F5H) in poplar results in a less condensedlignin and in significant improvements in lignin extractabilityand bleaching, whereas, fiber quality remained equal or
even better (Huntley et al., 2003).
By co-transformation poplar with two different
constructs – one armed at increasing F5H expression and
the other at reducing 4-coumarate CoA-ligase expression
– the combined effect expected for the single transformation
was obtained, lignin amount was reduced and
compensated for by more cellulose and lignin was less
condensed (Li et al., 2003). Such type of work revealed the
potential of modifying one genotype simultaneously for
multiple traits by stacking transgenes, a strategy that could
circumvent numerous generations of conventional breeding
(Halpin and Boerjan, 2003).
Besides quality, in case of fast growing or short rotation
forestry yield is one of the most important traits and severalgenes involved in different process have been shown toimpact on growth in transgenic poplar. Over-expression of
a cytosolic pine glutamine synthase (GS), a key enzymeinvolved in nitrogen assimilation, increases height by 41per cent and stem diameter by 36 per cent as measured for
three year old field grown transgenic poplar (Jing et al.,2004). The main obstacle for genetic transformation of treesis the regeneration of transformed plantlets (Giri et al., 2004).
In addition, it was found that Agrobacterium based genetic
transformation is the main method used for developingtransgenic trees. Selection of explant for transformation is
a very crucial factor.
Reduction in the Reproductive Phase
The long generation period of tree species is one ofthe major limiting factors for genetic improvement. However,
by taking advantage of biotechnology the time needed toproduce a new tree variety could be identified andmanipulated to enable flowering to be induced at will, the
fixing of beneficial recessive mutations, and introgressionor back crossing to increase rare alleles in breedingpopulation could become realities. For example, flowering
in aspen is generally observed after 8 to 20 years but one ofthe genes, LFY has been expressed in transgenic aspenand was able to produce flowers after 7 months of vegetative
growth (Weigel and Nilsson, 1995; Pena and Sequin, 2001).This approach, thus, can be extended to other economicallyimportant tree species.
Change of Tree Architecture and Size
Plant growth regulators play an important role in growthand development, and also affect formation of wood (Littleand Savidge, 1987). Thus the manipulation of plant
hormones synthesis in tree looks very interesting. Someprogress has been made using T-DNA, auxin and cytokininbiosynthesis genes from Agrobacterium tumefaciens and
A. rhizogenes. It has been demonstrated that themanipulation of IAA levels by the over expression of iaaMand iaaH A. tumefaciens T-DNA in Populus can change
growth, development and wood formation (Tuominen et al.,1995). Over expression of such genes in the transgenicplants bring about alterations in growth pattern and wood
properties (Tzfira et al., 1998).
Product Quality Traits
Quality traits for trees are quite different from qualitytraits being developed for other agricultural based crops.
Tree quality comprises wood and fiber properties, feedstockfor pulp and timber mills, for furniture manufacture, chemicalcellulose source and other special chemical products. The
modification of lignin is a focus given the possibilities ofaffecting and products through its manipulation (Baucheret al., 2003). Genes other than those in the lignin biosynthesis
pathway have also been used to alter wood composition.Reduction in laccase through antisense lac3S expressionin transgenic poplar has led to an alteration of the phenolic
content and aberrations in xylem fiber structure withoutaltering lignin content or composition. It is also reportedthat a gene that affects lignin biosynthesis can also affect
Hira Singh and S. S. Bal

223
growth. Down regulation of 4-coumarate ligase (4CL) leadsto reduce of lignin levels, increased cellulose and also
biomass accumulation (Nehra et al., 2005). Biomassincreased by introducing bacterial cellulose binding domaingene into poplar (Levy et al., 2002). Poplar transformed
with a pine glutamine synthatase gene was found to haveincreased drought resistance (El-Khatib et al., 2004).
Marker Assisted Selection (MAS)
The next important approach to boost up the
improvement of forest trees is based on the more efficientexploitation of genetic diversity in the existing germplasm.Over the past few decades, genetic maps have been made
for many tree species and QTLs have been mapped for arange of agronomically important traits, such as woodproperties, with the aim of using genetic markers linked to
QTLs to follow the trait in breeding programme (Brown etal., 2003). However, the potential of marker assistedselection in forest tree breeding is limited because linkage
between a trait and a linked marker decreases with eachgeneration owing to genetic recombination, unless themarker is in the gene itself. Presently, there are no examples
of genes that have been positionally cloned from any foresttree species.
CONCLUSIONS
The productivity of tree species has benefited
immensely from development and implementation ofimproved silviculture and forest management practicesduring the past century. A second wave of improvement has
been brought about by the introduction of elite and newgermplasm developed through genetics and breedingefforts. Coupled with the genetic gains achieved through
breeding, the emergence of biotechnological strategies hasadded a new horizon to tree improvement and production.The use of tissue culture methods as a micropropagation
system for tree is an established technology compared totraditional systems. True to type plants via direct or indirectsomatic embryogenesis may boost tree micropropagation.
It has been found that Agrobacterium mediated genetictransformation is used in most cases and marker geneshave been transformed and a genetic transformation
protocol has been standardized. Recent developments intransgenic trees can have multiple benefits likemanipulating generation time, plant protection against biotic
and abiotic stresses, wood quality, compounds ofpharmaceutical value and improvements of polluted soils.Populus trees have several advantages as a model system
including rapid growth, prolific sexual reproduction, ease ofcloning, small genome, etc. If current progress in
biotechnological application continues, the future maywitness super tree species tailored for special agronomic
characteristics.
REFERENCESAltman, A. and Loberant, B. (1998) Micropropagation: clonal plant
propagation in vitro. In: A. Altman (ed) AgriculturalBiotechnology. Marker Dekker, New York, pp 19-42.
Attree, S.M. and Fowke, L.C. (1993) Embryogeny of gymnosperms:Advances in synthesis seed technology of conifers. PlantCell Tiss. Org. Cult. 35: 1-35.
Attree, S.M., Pomeroy, M.K. and Fowke, L.C. (1994) Production ofvigorous desiccation tolerant white spruce (Picea glauca).Plant Cell Rep. 13: 601-606.
Bargchi, M. and Alderson, P. G. (1996) The control of shoot tipnecrosis in Pistacia vera L. in vitro. Plant Growth Regul. 20:31-35.
Baucher, M., Petit-Conil, M. and Boerjan, W. (2003) Lignin: geneticengineering and impact on pulping. Crit. Rev. Biochem. Mol.Bio. 38: 305-350.
Boerjan, W. (2005) Biotechnology and the domestication of foresttrees. Current Opn. Biotech. 16: 159-166.
Brown, G. R., Bassoni, D. L., Gill, G. P., Fontana, J. R., Wheeler, N.C., Megraw, R. A., Davis, M. F., Sewell, M. M., Tuskan, G. A.and Neale, D. B. (2003) Identification of quantitative trait lociinfluencing wood property traits in Joblolly pine (Pinus teadaL.).III. QTL verification and candidate gene mapping. Genetics164: 1537-1546.
El-Khatib, R. T., Hamerlynck, E. P., Gallardo, F. and Kirby, E. G.(2004) Transgenic poplar characterized by ectopic expressionof a pine cytosolic glutamine synthetase gene exhibitsenhanced tolerance to water stress. Tree Physiol. 24: 729-736.
Giri, C. C., Shymkumar, B. and Anjaneyulu, C. (2004) Progress intissue culture, genetic transformation and applications ofbiotechnology to trees: an overview. Trees 18: 115-135.
Gupta, P. K., Pullman, G., Timmis, R., Kreitinger, M., Carlson, W.,GFrob, J. and Welty, E. (1993) Forestry in the 21st century: thebiotechnology of somatic embryogenesis. Biotechnology 11:454-459.
Halpin, C. and Boerjan, W. (2003) Stacking transgenes in foresttrees. Trends Plant Sci. 8: 363-365.
Huntley, S. K., Ellis, D., Gilbert, M., Chapple, C. and Mansfield, S. D.(2003) Significant increase in pulping efficiency in C4H-F5H-transformed poplars: improved chemical saving and reducedenvironmental toxins. J. Agric. Food Chem. 51: 6178-6183.
Jing, Z. P., Gallardo, F., Pascual, M. B., Sampalo, R., Romeo, J.,Torres de Navarra, A. and Canovas, D. M. (2004) improvedgrowth in a field trial of transgenic hybrid poplar over-expressing glutamine synthetase. New Phytol. 164: 137-145.
Levy, I., Shani, Z. and Shoseyov, O. (2002) Modification ofpolysaccharides and plant cell wall by endo-1,4-beta-glucanase and cellulose-binding domains. Biomol. Eng. 19:17-30.
Li, L., Zhou, Y., Cheng, X., Sun, J., Marita, J. M., Ralph, J. andChiang, V. (2003) Combinational modification of multiple lignintraita in trees through multigene contransformation. Proc. Natl.Acad. USA 100: 4939-4944.
Biotechnology for Improvement of Tree Species Productivity
224
Linington, I. M. (1991) In vitro propagation of Dipterocarpus alatosand D. intricatus. Plant Cell Tiss. Org. Cult. 27: 81-88.
Little, C. H. A. and Savidge, R. A. (1987) The role of plant growthregulators in forest tree cambial growth. Plant Growth Regul.6: 137-169.
Lulsdorf, M. M., Tautorus, T. E., Kikcio, S. I., Bethune, T. D. andDunstan, D. I. (1993) Germination of encapsulated embryos ofinterior spruce and black spruce. Plant Cell Rep. 12: 385-389.
Marks, T. R. and Simpson, S. E. (1994) Factors affecting shootdevelopment in apical dominant Acer cultivars in vitro. J. Hortic.Sci. 69: 543-551.
Monsalede, M. J., Mathews, H., Litz, R. E. and Gray, D. J. (1995)Control of hyper hydricity of mango somatic embryos. PlantCell Tiss. Org. Cult. 42: 195-206.
Nehra, N. S., Becwar, M. R., William, H. R., Laslie, P., Chowdhary,K., Shujun, C., Wilde, H. D., Zhang, C., Gause, K. C., Parks, D.W. and Hinchee, M. A. (2005) Forest biotechnology: Innovativemethods, emerging opportunities. In vitro Dev. Bio-Plants 41:701-717.
Nugent, G., Chandler, S. F. and Whiteman, P. (2001) Somaticembryogenesis in Eucalyptus globules. Plant Cell Tiss. Org.Cult. 67: 85-88.
Pena, L. and Seguin, A. (2001) Recent advances in the genetictransformation of trees. Trends Biotechnol. 19: 500-506.
Srinidhi, H.V. and Chauhan, S.K. (2007) Biotechnological tools inforest tree improvement. ENVIS Forestry Bulletin 7(1):29-39
Taylor, G. (2002) Populus: Arabidopsis for forestry. Do we need amodel tree? Ann. Bot. 90: 681-689.
Tuominen, H., Sibon, F., Jacobsson, C., Sandberg, G., Olsson, O.and Sundberg, B. (1995) Altered growth and woodcharacteristics in transgenic hybrid aspen expressingAgrobacterium tumefaciens T-DNA indoleacetic acid-biosynthesis genes. Plant Physiol. 109: 1179-1189.
Tzfira, T., Zuker, A. and Altman, A. (1998) Forestry biotechnology:genetic transformation and its applications to future forest.Trends Biotechnol. 16: 439-446.
Weigel, D. and Nilsson, O. (1995) A development switch sufficientfor flower initiation in diverse plants. Nature 377: 495-500.
Williams, C.G. and Savolainen, O. (1996) Inbreeding deoression inconifers: implications for using selfing as a breeding strategy.For. Sci. 42: 102-117.
Winton, L.W. (1968) The rooting of liquid grown aspen cultures.Am. J. Bot. 55: 159-167.
Hira Singh and S. S. Bal

Dendrocalamus giganteus is the largest of the Indianbamboos and grows well in humid tropical and sub-tropical
regions, in the North and North Eastern part of the country.It produces culms up to 25 cm in diameter. B. vulgaris is amoderate-sized bamboo of 6m to 30m height and 5 to 11
cm diameter, with yellow or green striped culms growingseparate from one another. It is found in all the tropicalregion (origin unknown) and is frequently cultivated. In
warmer areas, it has run wild. Flowering has not beenrecorded so far. It has spineless culms, forming an open orloose clump. Generally the bamboo culm is hollow; widely
used for furniture, toys, cages and other essential items. B.vulgaris var. striata Gamble is an ornamental variety.
Availability of suitable planting material of bamboo isalways a problem as the unavailability of seeds every year
as well as difficult conventional vegetative propagationmethods. Vegetative propagation is not a breeding methodbut a way to rapidly multiply disseminate the desired clonal
material according to its genetic potential. In vegetativepropagation, the genetic potential of a species, includingthe non-additive variance, is automatically transferred to
the new plant. However, in nature the tree populations arehighly heterozygous and vegetative population helps toutilize maximum genetic gains in the shortest possible time.
The success of vegetative propagation depends upon aproper environment, genetic component and thephysiological status of cuttings, etc. (Cunningham, 1986).
Vegetative propagation is a good tool for propagatingthe selective genotype. Cloning by rooting of cuttings hasdeveloped a lot because it became possible to use
improved genetic material in the establishment of seedorchards, in nutrition trials, in increasing hybrids with moregenetic accuracy for tests and establishment of large
industrial forests through mass propagation of clonalplanting material.
Generally rooting response varies with season (Nanda
et al., 1968, 1970). In general, rooting is more profuse duringsummer months especially from April to July (Nanda, 1970),declines from August onwards and there is no rooting in
Bamboo Propagation by Branch Cuttings: A Farmer’s FriendlyTechnology for Mass Clonal Multiplication
S. Nautiyal*, D.P. Nautiyal and Ashutosh MishraPlant Physiology, Botany Division, Forest Research Institute, Dehradun – 248 006 (India)
*E-mail:[email protected]
winter (Nanda et al., 1968). Microproliferation of manybamboo species including B. vulgaris for mass propagation
has been done successfully by Plant Physiology Division ofFRI (A. Kumar, 1989), but here again seeds are required tobegin with.
Due to unavailability of seeds every year propagationtechniques for many bamboo species is a major bottleneckin regeneration. Keeping in view of this problem, branch
cuttings of D. giganteus and B. vulgaris which are easilyavailable were tried for their rooting response to producedquality planting material.
The branch cutting of D. giganteus and B. vulgaris werecollected from the already established planting material inForest Research Institute, Dehradun Nursery in the monthof April. About 30 cm long trinodal cuttings were made. After
surface treatments of cuttings by HgCl2 solution thesecuttings were divided into 4 groups of 20 cuttings each. Thebasal ends of the cuttings were dipped in test solutions
(IBA 100 ppm, Boric acid 100 ppm IBA + Boric acid 100 ppmand water) and kept for 24 hours for giving them treatmentof the appropriate solution. Treated cuttings were planted
in the poly bags containing sand, soil, and FYM (Farm yardManure) in the ratio 2:1:1, the basal ends of the cuttingswere inserted in the soil by keeping 1/3 portion of the cutting
under the soil level in the earthen pots. These pots werekept in open and watered regularly. The rooted cuttings werefinally harvested for knowing the number of roots and roots
length of roots after four months of planting.
The rooting response of branch cuttings of D. giganteuswas very encouraging. The maximum rooting of D. giganteuswas observed in untreated cuttings followed by Boric acid100 ppm and IBA 100 ppm treatment. The combination ofBoric acid and IBA 100 ppm showed minimum rooting. It is
interesting to note that the maximum rooting was initiatedin the untreated cuttings that mean this species does notrequire any rooting hormone treatment. Moreover, hormones
may be playing inhibitory role in the rooting of the cuttings inthis case. As compared to individual treatment, thecombination to two rooting hormone has most root inhibiting
Indian J. Ecol. (2011) 38 (Special Issue) : 225-226Indian Journal
of Ecology

226
effect.
In B. vulgaris, the maximum 80 per cent rooting wasobserved in the cuttings treated with IBA 100 ppm followedby Boric acid 100 ppm (70%) and control (70%). However,
the minimum rooting percentage was observed in case ofBoric acid + IBA 100 ppm (50%). It is interesting to not thatthe number of roots and root length per cutting was higher
in case of IBA 100 ppm treated cuttings, however, numberof sprouts was almost same (Table 1). The horizontalplanting of cuttings normally practical is dicots but equally
responsive in bamboos as well. The IBA was found to bethe best rooting hormone in case of many other tree speciesalso as reported by Gurumurti and Bhandari (1988); Nautiyal
et al. (1991); Pal (1992); Kaushal and Tewari (2009) .
Rooting of branch cutting of these species has opened
a new area of propagation of bamboos particularly of these
species. While using the main culms for different purposes,
the thin branches are left unused. These branches after
making binodal cuttings can be used for mass propagation
by rooting of these cuttings. This technology, which is easy
and farmer’s friendly can be tested for other bamboo
species as well. Therefore, serious efforts will be made to
test this technology for other commercially important
bamboo species as well to meet the huge demand of quality
planting stock of bamboos.
REFERENCESKumar A. (1989) Some experience in vegetative propagation of
bamboos. Seminar on Vegetative July, 27-28, 1989, Institutefor Genetics and Tree breeding, Coimbatore, India
Cunningham, M.W. (1986) Genetic variation in rooting ability ofAmerican Sycamore cuttings. Proc. TAPPI Res. and Dev.Conf. TAPPI Press, Atlanta, GA., USA. pp. 1-6.
Gurumurti, K. and Bhandari, H.C.S. (1988) Induction of rooting incladode cuttings of Casuarina equisetifolia. Curr. Sci. 57:1-2.
Kaushal, R. and Tewari, S. (2009) Technology for VegetativePropagation of Bamboo. Research Bulletin No. 166. Directorteof Experiment Station, G.B. Pant Univ. of Agric. & Tech.Pantnagar (Uttrakhand), 22 p.
Nanda, K.K., Anand, V.K. and Kumar, P. (1970) Seasonal changesin auxin effects on rooting of stem cuttings of Populus nigraand its relationship with mobilization of starch. Plant Physiology23: 99-107.
Nanda, K.K., Purohit, A.N., Bala, A. and Anand, V.K. (1968) Seasonalrooting response of stem cuttings of some forest tree speciesto auxins. Indian For. 94(2): 154-162.
Nanda, K.K. (1970). Investigations on the use of auxins in vegetativereproduction of forest plants. Final Report P.L. 480 projectA7-FS-11.
Nautiyal, S., Uma Singh and Gurumurti, K. (1991) Rooting responseof branch cuttings of teak (Tectona grandis) as influenced byseason and growth hormones and position of cutting on thecrown. Indian For. 118(2): 112-121.
Pal, M. (1992) Clonal propagation for yield improvement in forestplantations. IPPTA 4: 61-64.
Table 1. Rooting response of branch cuttings of Dendrocalamus giganteus and Bambusa vulgaris under different hormonal treatment.
Treatment No. of cuttings/ % Rooting No. of main Root length No. of sprouts
treatment of cutting roots (cm)
Dendrocalamus giganteus
Control 20 80 3 38 2.0
IBA 100 ppm 20 70 5 25 1.5
Boric acid 100 ppm 20 75 2 23 1.5
Boric acid + IBA 100 ppm 20 50 2 21 1.0
Bambusa vulgaris
Control 20 70 2 18 1.5
IBA 100 ppm 20 80 4 20 2.0
Boric acid 100 ppm 20 70 2 19 2.0
Boric acid + IBA 100 ppm 20 50 3 15 1.0
S. Nautiyal, D.P. Nautiyal and Ashutosh Mishra

Bamboos are the fastest growing woody plants in theworld. Bamboo cultivation, especially in intensively managedand productive plantation has attracted a great deal ofinterest in the recent years. The current demand of bamboois 26.69 million tonnes against supply of 13.47 milliontonnes in the country. To cater the growing demand ofbamboos, there is immediate need of large scale cultivation.Conventional methods of propagation are based on seedand vegetative methods. Vegetative propagation especiallyby culm cuttings has tremendous potential for massproduction of quality bamboo plating stock.
For propagating bamboo, culm segments resulted in45-56% rooting in thick walled bamboo viz., Bambusanutans, B. polymorpha, Dendrocalamus giganteus,whereas thin walled bamboos like Melocana bacifera, B.tulda, D. longispathus and Oclandra nigrociliata failed toproduce any propagule Banik (1984). Bambusa nutans isreluctant to root species (McClure and Kennard, 1955;Stapleton,1987). Keeping in mind above facts, effect of IBAfor rooting during different seasons on Bambusa nutans,B. tulda and D. Giganteus has been investigated.
Culm cuttings of Bambusa nutans, Bambusa tulda andDendrocalamus giganteus were collected in differentseasons viz. spring (March), summer (June) and rainy(August). Each culm was then cut into sections, leaving 2-4nodes on each section and retaining about 5 to 7 cm ofculm portions at either end beyond the node. The preparedculm cuttings were given prophylactic treatment with 0.2 %(w/v) solution of Bavistin against fungal infection beforeputting them in the propagation beds. Five nodes each offour IBA treatments 100ppm, 200ppm, 5000ppm, 10000ppmand control for Bambusa nutans (Bn), Bambusa tulda (Bt),
Effect of IBA on Rooting of Bamboo Species
Y. A. Gulabrao*, Rajesh Kaushal, N. V. Saresh, Archana Verma1 and Rahul SinghDepartment of Agronomy, G. B. Pant University of Agriculture & Technology, Pantnagar-263 145, Uttarakhand
1University of Horticulture and Forestry, Nauni, Solan 173230, Himachal Pradesh*E-mail: [email protected]
and Dendrocalamus giganteus (Dg), were replicated fourtimes. In culm cutting, a hole in the middle of the internodalcavity was drilled with the help of electric drill machine andintermodal cavity was filed in IBA before planting of culmcutting in the beds. Control was also maintained by pouringwater in the internodal cavity. The treated cuttings were kepthorizontally with the opening facing upwards. Watering ofthe beds was done by intermittent misting. Cuttings andthe new sprouts were covered with agroshade nets of 50per cent transmission capacity to prevent drying due tointense heat as excessive heat can increase the respirationrate and can lead to depletion of the stored food. After 2-3months, the cuttings were scored for rooting and sproutingper cent. The data obtained were subjected to three factorstatistical analysis, employing analysis of variance (ANOVA),F-test for significance at P ≤ 0.05.
During all the season viz. spring, summer and rainysprouting and rooting percent showed significant variationsin species and interaction effect of species and treatment.Among species (Fig. 1), irrespective of treatment highestsprouting 58, 32 and 21 per cent was observed in Bt duringspring and in Dg during summer (38.00%) and rainy(25.00%) season. Control (T1) produced maximum rooting46.67 and 26.67 per cent during spring and rainy season,respectively.
Overall the trend for sprouting and rooting was of theorder spring > summer > rainy (Fig. 2). Season hasinfluence on the physiological state of the plant and henceit has vital role in induction and growth of sprouting androoting of cuttings. Role of external factors especiallytemperature and photoperiod in adventitious rooting is wellestablished (Dykemen, 1976; Hartmann and Kester, 1983;
Fig. 1. Sprouting and rooting behaviour in culm cuttings of bamboo species during different season
Indian J. Ecol. (2011) 38 (Special Issue) : 227-228Indian Journal
of Ecology

228
Carpenter et al., 1973; Stoutemyer et al., 1961). In bamboosof North India, the cessation of winter and onset of summer,results in resumption of active extension growth and upwardmobilization of stored photosynthates and axillarysubstances from the underground rhizome which maybecome available for differentiation and growth of organssuch as culms and adventitious roots (Agnihotri and Ansari2000; Singh et al., 2004). Thus, higher rooting and sproutingin spring and summer is understandable.
Dendrocalamus giganteus showed lower sproutingand rooting. In D. giganteus, branching is usually observedat the top of culm. The basal and middle portion from wherethe culm cuttings were made are unbranched and possessbuds. The branch culm segments on culm cuttings offer anadvantage of higher photosynthesis which may divert thecarbohydrates for early growth of cuttings. Contrary, inunbranched cuttings, buds are below the soil due to whichthere are more chances of fungal attack. In the presentstudy also, very high mortality was observed in D. giganteusdue to fungal attack.
Exogenous application of growth regulators mainlyauxins has been reported to positively influence inductionand growth of adventitious roots in culm cuttings. IBA isconsidered as most important auxin due to its ability ofinitiating rooting in large number of species. Better formationof roots due to IBA may be attributed to accumulation ofmetabolites at the site of application, synthesis of newprotein cell division and cell enlargement (Nanda, 1970).Therefore enhanced rooting of B. tulda in spring and D.giganteus in both summer and rainy seasons may beattributed to increase in the auxin concentration to optimumlevel. Such species apparently lack sufficient non-auxinendogenous root forming stimulus (ERS), an essential forpredisposing them to root for which applied auxin cannotsubstitute (Hartmann et al., 1997).
The ‘cavity method’ which involves pouring the solutionof IBA/water (control) into the culm cavity, gave very goodsprouting and rooting in cuttings The advantage of ‘cavitymethod’ could be to keep the cuttings moistened andmaintain certain degree of humidity.
REFERENCES
Agnihotri, K. and Ansari, S. A. (2000) Adventitious rhizogenesis inrelation to seasonal variation, size of culm branch cuttingsand IAA treatment in bamboos. Indian For 126: 971-984.
Banik, R. L. (1984) Studies on the propagation techniques of differentbamboo species of Bangladesh. Paper presented at theWorkshop in the Contract Research Project, BangladeshAgriculture Research Council (BARC). 17-20 November,Dhaka, Bangladesh.
Carpenter, W. J., Beck, G. R. and Anderson, G. A. (1973) Highintensity supplementary lighting during rooting of herbaceouscuttings. Hort. Sci. 8: 338-340.
Dykemen, B. (1976). Temperature relationship in root initiation anddevelopment of cuttings. Proc. Int. Plant Prop. Soc. 26: 201-207.
Hartmann, H.T. and Kester, D.E. (1983) Plant Propagation: Principlesand Practices. Press Hall, New Delhi. p. 662.
Hartmann, T., Kester, D., Davies and Robert, L. (1997) PlantPropagation: Principles and Practices.Press Hall, New Delhi.p. 276-391.
McClure, F.A. and Kennard, W.C. (1955) Propagation of bamboo bywhole culm cuttings. Proc. American Soc. Hort. Sci. 65: 283-288.
Nanda, K.K. (1970) Investigation on the use of auxins in vegetativereproduction of forest plants. Final report PL- 480. Researchproject. pp. 215.
Singh, S., Kumar, P. and Ansari, S.A. (2004) A simple method forlarge scale production of Dendrocalamus asper. Scientia Hort.100: 251-255.
Stapleton, C.M.A. (1987) Studies on vegetative propagation ofBambusa and Dendrocalamus species by culm cuttings.Recent Research on Bamboos. Proc. Intl. Bamboo Workshop,1985, Hangzhou, China. Chinese Academy of Forestry andIDRC, Canada: 146-153.
Stoutemyer, T., Britt, O.K. and Goodin, J.R. (1961) The influence ofchemical treatments, understocks and environment on growthphase change and propagation of Hedera canariensis. Proc.American Soc. Hort. Sci. 77: 552-557.
Fig. 2. Effect of IBA treatments and season on sprouting and rooting in culm cuttings of bamboo species
Y. A. Gulabrao, Rajesh Kaushal, N. V. Saresh, Archana Verma and Rahul Singh

Forest provides a wide range of natural assets,including household goods, cultural values, physical and
biological products, and other services that are vital to thelivelihood of many people. Nepal ranges from 58 m abovemean sea level to the 8848 m. The summit of Mount Everest,
this unique geography of Nepal has made it rich in biologicalresources having valuable non-timber forest products,comprising about 10 per cent of the vascular plant species
(Malla and Shakya, 1984). The term NTFPs encompassesall biological materials other than timber, which are extractedfrom natural forests for human use; these include foods,
medicines, ornamental plants, wildlife, fuel-wood and rawmaterials, notably rattan, bamboo, small wood and fibers.Variation in topography is the prime factor, which reflectscontrasts in climatic, habitat, vegetation, flora and fauna.
Essential oils, spices and medicines are the most commonintermediate or the end products, which result from theprocessing of NTFPs and these are often sold to the national
or international markets. The role and contributions ofNTFPs are crucial amongst the rural communities of
developing countries. About 80 per cent of the population of
developing countries depends on NTFP for their primary
health, nutritional needs and income generation. This is
particularly true to a country like Nepal, where alternative
economic opportunities are limited. The increasing
commercial demand for the NTFPs found in Nepal presents
an economically, environmentally and socially viable means
of assisting rural communities in controlling the transition
from subsistence to cash economy. The tenth five-year plan
(2003-2007) had emphasized on the research and
development of NTFPs to create employment by promoting
IGA for the people below the poverty line (targeted
population) to get benefit from NTFPs management. The
majority of Nepalese population use wild plants in various
ways. Some of plants hold immense potentiality for livelihood
support of the local people while some are still unidentified
due to lack of knowledge and get decayed naturally in the
forest. In the absence of proper management and control
in collection and trade, NTFPs are going to be vulnerable,
endangered and even extinct (Acharya, 2000).
An Assessment of Non-Timber Forest Products and TheirContribution in Livelihood Security
Laxmi Kumari NeupaneDistrict Forest Office, Bhaktapur, Thimi, Nepal
E-mail: [email protected]
The sustainable livelihoods framework is bestunderstood with reference to five livelihood assets i.e.,
human capital, natural capital, financial capital, social capital,and physical capital. Sustainable livelihood is a holisticapproach that tries to capture, and provide means of
understanding, the vital causes and the dimensions ofpoverty without collapsing the focus on to just a few factors(e.g., economic issues, food security, etc). It also tries to
sketch out the relationship between the different aspects(causes, manifestations) of poverty, allowing for effectiveprioritization of action at an operational level. Since proper
attention hasn’t been paid regarding the value andconservation of NTFPs and its contribution to the livelihoodon local level. This study attempted to assess the non-timber forest product and its contribution in CFUG livelihood.
This task was selected with a view to quantifying andpromoting NTFPs in community forestry and also privateland by listing of the existing NTFPs in community forests,
to explore the potential NTFPs, which are economically andsocially viable, to assess the contribution of NTFPs tolivelihood assets and to find out the ethno-botanical uses
of NTFPs found in the study area.
Geographically, Baglung is a hilly and naturally beautifuldistrict of Dhabligari Zone, which is located between 280 15'
to 280 37' N latitude and 83000' to 830 36' East longitude. Thealtitude varies as 600m (Binamare) to 4690m(Phagunedhuri) from the mean sea level.It represents sub-
tropical to sub-alpine region; the average annualtemperature is 19.1 -26.6 °C and annual rainfall rangesfrom 1500-3000mm with average rainfall of 2200mm. Most
of the area represents with sandy loam and loamy soil. TheBaglung district is rich in biological diversity. The study wasconducted in two community forests under Batakachaur
village development committee (VDC) of Baglung districtnamely Aansar and Bhalukodarbar community forest. Thestudy area was selected through multistage stratified
sampling on the basis of richness and availability of NTFPs.Total population of the Baglung district is 268598 (123422male and 145176 female). Total number of households is53945 and the population density is 150.75 people per
Indian J. Ecol. (2011) 38 (Special Issue) : 229-231Indian Journal
of Ecology
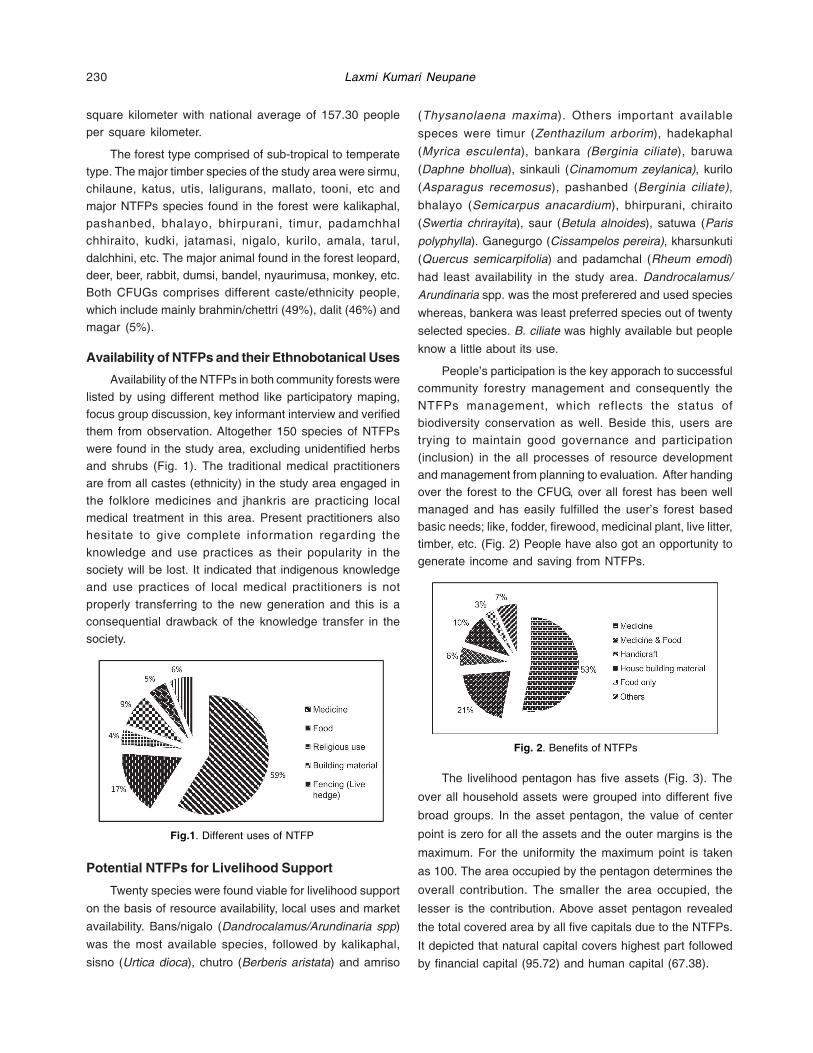
230
square kilometer with national average of 157.30 peopleper square kilometer.
The forest type comprised of sub-tropical to temperatetype. The major timber species of the study area were sirmu,chilaune, katus, utis, laligurans, mallato, tooni, etc and
major NTFPs species found in the forest were kalikaphal,pashanbed, bhalayo, bhirpurani, timur, padamchhalchhiraito, kudki, jatamasi, nigalo, kurilo, amala, tarul,
dalchhini, etc. The major animal found in the forest leopard,deer, beer, rabbit, dumsi, bandel, nyaurimusa, monkey, etc.Both CFUGs comprises different caste/ethnicity people,
which include mainly brahmin/chettri (49%), dalit (46%) andmagar (5%).
Availability of NTFPs and their Ethnobotanical Uses
Availability of the NTFPs in both community forests were
listed by using different method like participatory maping,focus group discussion, key informant interview and verifiedthem from observation. Altogether 150 species of NTFPs
were found in the study area, excluding unidentified herbsand shrubs (Fig. 1). The traditional medical practitionersare from all castes (ethnicity) in the study area engaged in
the folklore medicines and jhankris are practicing localmedical treatment in this area. Present practitioners alsohesitate to give complete information regarding the
knowledge and use practices as their popularity in thesociety will be lost. It indicated that indigenous knowledgeand use practices of local medical practitioners is not
properly transferring to the new generation and this is aconsequential drawback of the knowledge transfer in thesociety.
Potential NTFPs for Livelihood Support
Twenty species were found viable for livelihood support
on the basis of resource availability, local uses and market
availability. Bans/nigalo (Dandrocalamus/Arundinaria spp)
was the most available species, followed by kalikaphal,
sisno (Urtica dioca), chutro (Berberis aristata) and amriso
(Thysanolaena maxima). Others important available
speces were timur (Zenthazilum arborim), hadekaphal
(Myrica esculenta), bankara (Berginia ciliate), baruwa
(Daphne bhollua), sinkauli (Cinamomum zeylanica), kurilo
(Asparagus recemosus), pashanbed (Berginia ciliate),
bhalayo (Semicarpus anacardium), bhirpurani, chiraito
(Swertia chrirayita), saur (Betula alnoides), satuwa (Paris
polyphylla). Ganegurgo (Cissampelos pereira), kharsunkuti
(Quercus semicarpifolia) and padamchal (Rheum emodi)
had least availability in the study area. Dandrocalamus/
Arundinaria spp. was the most preferered and used species
whereas, bankera was least preferred species out of twenty
selected species. B. ciliate was highly available but people
know a little about its use.
People’s participation is the key apporach to successfulcommunity forestry management and consequently the
NTFPs management, which reflects the status ofbiodiversity conservation as well. Beside this, users aretrying to maintain good governance and participation
(inclusion) in the all processes of resource developmentand management from planning to evaluation. After handingover the forest to the CFUG, over all forest has been well
managed and has easily fulfilled the user’s forest basedbasic needs; like, fodder, firewood, medicinal plant, live litter,timber, etc. (Fig. 2) People have also got an opportunity to
generate income and saving from NTFPs.
The livelihood pentagon has five assets (Fig. 3). The
over all household assets were grouped into different five
broad groups. In the asset pentagon, the value of center
point is zero for all the assets and the outer margins is the
maximum. For the uniformity the maximum point is taken
as 100. The area occupied by the pentagon determines the
overall contribution. The smaller the area occupied, the
lesser is the contribution. Above asset pentagon revealed
the total covered area by all five capitals due to the NTFPs.
It depicted that natural capital covers highest part followed
by financial capital (95.72) and human capital (67.38).
Fig.1. Different uses of NTFP
Fig. 2. Benefits of NTFPs
Laxmi Kumari Neupane

231
CONCLUSION
People have indigenous knowledge on the use ofmedicinal plants but they did not have the scientificknowledge about propagation techniques, and
commercialization of available NTFPs. Old men, womenand Jhankri were the most knowledgeable persons aboutmedicinal plants in comparison the younger generation.
Since, the younger generations are reluctant to learn aboutthe traditional practices, there are great chance of loss ofwealth of knowledge and rich diversity. Some medicinal
plants are being used by local and traditional healers in
different form for the treatment of common ailments to
human and animals as well. These treatment practices
are done without being paid, so it’s difficult to calculate the
cash value of these practices. It can be said that these
customs benefit people economically in indirect way.
In rural areas, NTFPs are mostly use as medicine,
food and vegetable, handicraft/IGA, ceremonial species,
fiber, oil, etc. Different parts of the plant including fruit, seed,
leaf, root, stem, bark, bud, rhizome, flower and sap are used.
The study concluded that there has been appriciative and
inclusive peoples participation in forest management
activities and benefit sharing. NTFPs and other forest
products have ultimately been supported in CFUG members
livelihoods and environmental amelioration.
REFERENCESAcharya, T.P. (2000) Conservation of non-timber forest products
(NTFPs) in Humla, Nepal. In: S. M. Amatya (ed.) A case studyof Rudikot (Margor) Region for Biodiversity Conservation - thethird Regional workshop on community based NTFPManagement, 8-9 April, 2000, p. 26.
Malla, S. B. and Shakya, P. R. (1984) Medicinal plants. In: T.C.Majupuria (ed.) Nepal - Nature’s Paradise. Bangkok, Thailand,White Lotus Co. Ltd., pp. 261-297.
Fig. 3. Asset pentagon
Non-Timber Forest Products and Their Contribution in Livelihood Security

The abrupt climatic changes cause great impact on
plant diseases. This is well documented in great epidemicsof brown spot of rice (Helminthosporium oryzae) in Bengalin 1942, which was triggered by floods. Tropical storms
rapidly spread the Maydis leaf blight of corn to mid west andsouthern USA in 1970s. Intensity of western disturbancesaffected the climate in north western parts of India, which
intensified wheat rust damage in the region causing hugelosses prior to the introduction of dwarf wheat varieties.However, in case of forest tree species, where life cycles of
trees extend over the decades, this is a new and complexphenomenon. The abrupt climate changes are conflictingheavy damage to already fragile forest cover of the world. As
the length of conducive environmental conditions determinethe development of plant disease epidemics, the presentscenario of prolong dry or wet weather have significant effect
on diseases. Furthermore, the shift in temperature,moisture and CO2 levels may result into development ofnew disease problems along with failure of present day
disease management strategies. The adverse climaticconditions may suppress the pathogens but at the sametime may result into development of weak parasites to potent
pathogens. Thus, it is a win-win situation for pathogens.The establishment of new host pathogens relationshipsdue to changed physiology of the trees will be a major
challenge for plant pathologists. The precise prediction ofhow these factors affect the physiology of the host plant andits interaction with the pathogen is a major challenge in
order to understand emerging disease problems of trees.
Climate change can have serious consequences onforest health, as more growth is expected under elevated
carbon dioxide levels. The more succulent growth underhigh CO2 levels leading to more conservation of moisture issure to have exponential multiplication of pathogens. The
loss of wood to the tune of 20x 105 m3 in Ontario, Canadadue to lignin degrading fungi under changing climateconditions is very well documented (Hepting, 1963; Karlman
et al., 1994). A number of diseases were found closelyrelated to stress, which made trees more susceptible toinfections.
Forest Tree Diseases in Relation to Climate Change
Parminder Singh*, Vineet K. Sharma1, G.S. Rattan1 and Chander Mohan1
Farm Advisory Service Scheme, Jalandhar1Department of Plant Pathology, Punjab Agricultural University, Ludhiana-141 004, India
*E-mail:[email protected]
Under Asian conditions, similar effect was observed in
Pakistan, north-western India, Nepal and Bangladesh inthe form of large scale mortality of indigenous tree speciesof Dalbergia sissoo (shisham) and Acacia nilotica (kikar) in
last decade. The phenomenon has since been puzzlingthe researchers with no conclusive reasons for large scalemortality. The prolonged warming and shrinking of rainy
periods may have detrimental effect on tree physiology andhyper activity of pathogens. It is a known fact that, the twomost important environmental factors in the development
of plant disease epidemics are temperature and moisture(Agrios, 2005). While some diseases are favoured by cooltemperatures, whereas, others are influenced by hot
conditions. Under different environmental conditions, thepathogen-host interact differently and result into complexproblems, which are very difficult to manage. Thus, it
becomes all important to study the environmentalrequirements of plant pathogens before predicting theirresponses to climate change (Coakley et al., 1999).
Therefore, there is a need to study tree diseases in a holisticperspective as climate changes are a global phenomenon.The present approach of selecting few trees to study
disease dynamics needs to be changed to generalizeepidemic processes at spatial scales.
Survey of agro-plantations, forest nurseries and
roadside plantations was done in Punjab in which incidenceand severity of tree diseases were recorded. Diseasesymptoms were recorded and pathogen associated were
identified by standard methods. The literature was reviewedto find out already reported diseases of trees. With thisknowledge as background, the emerging tree diseases
were identified and correlated with the climate changesoccurred in last few decades. In Punjab, the last twodecades proved very crucial. The change in monsoon trend
in terms of delayed approach has led to stretching out ofhot months (Situation 1). The delayed rains which come incomparatively milder temperatures have led to prolonged
periods of soil wetness, causing increased activity of soilborne fungi/pathogens (Situation 2). High CO2 levels leadingto more succulent leaves and increased activity of foliar
Indian J. Ecol. (2011) 38 (Special Issue) : 232-234Indian Journal
of Ecology
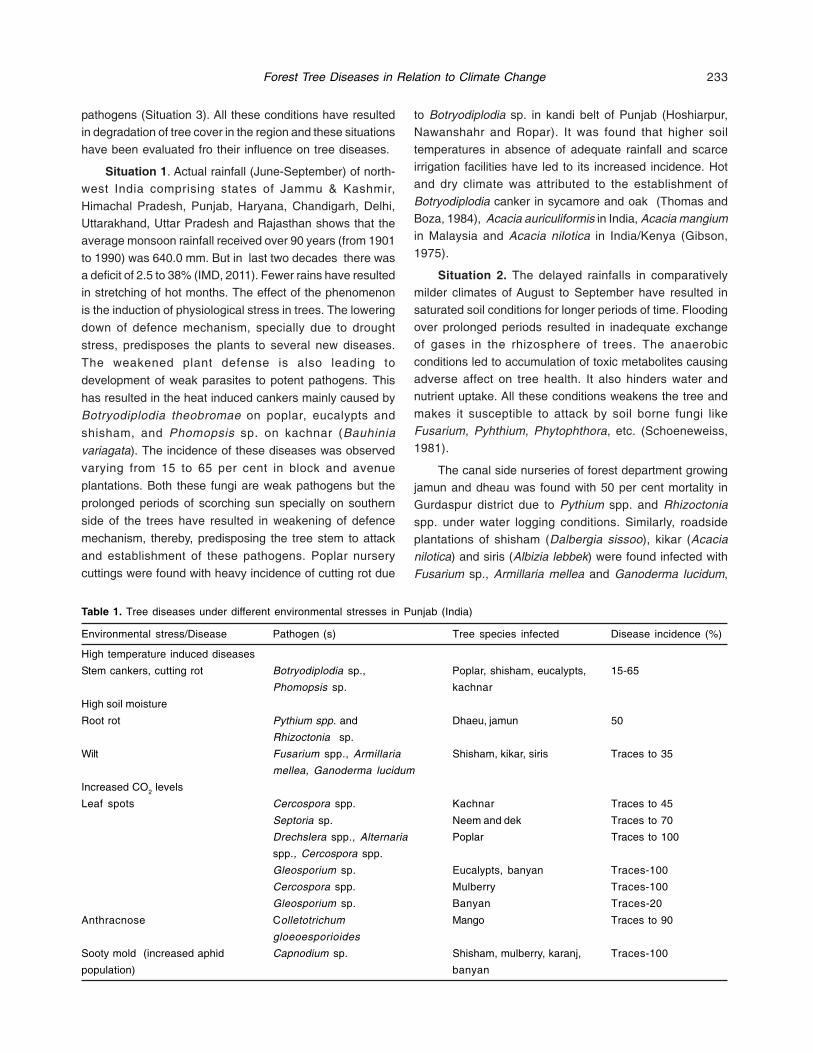
233
pathogens (Situation 3). All these conditions have resultedin degradation of tree cover in the region and these situations
have been evaluated fro their influence on tree diseases.
Situation 1. Actual rainfall (June-September) of north-west India comprising states of Jammu & Kashmir,
Himachal Pradesh, Punjab, Haryana, Chandigarh, Delhi,Uttarakhand, Uttar Pradesh and Rajasthan shows that theaverage monsoon rainfall received over 90 years (from 1901
to 1990) was 640.0 mm. But in last two decades there wasa deficit of 2.5 to 38% (IMD, 2011). Fewer rains have resultedin stretching of hot months. The effect of the phenomenon
is the induction of physiological stress in trees. The lowering
down of defence mechanism, specially due to drought
stress, predisposes the plants to several new diseases.
The weakened plant defense is also leading to
development of weak parasites to potent pathogens. This
has resulted in the heat induced cankers mainly caused by
Botryodiplodia theobromae on poplar, eucalypts and
shisham, and Phomopsis sp. on kachnar (Bauhiniavariagata). The incidence of these diseases was observed
varying from 15 to 65 per cent in block and avenue
plantations. Both these fungi are weak pathogens but the
prolonged periods of scorching sun specially on southern
side of the trees have resulted in weakening of defence
mechanism, thereby, predisposing the tree stem to attack
and establishment of these pathogens. Poplar nursery
cuttings were found with heavy incidence of cutting rot due
to Botryodiplodia sp. in kandi belt of Punjab (Hoshiarpur,Nawanshahr and Ropar). It was found that higher soil
temperatures in absence of adequate rainfall and scarceirrigation facilities have led to its increased incidence. Hotand dry climate was attributed to the establishment of
Botryodiplodia canker in sycamore and oak (Thomas andBoza, 1984), Acacia auriculiformis in India, Acacia mangiumin Malaysia and Acacia nilotica in India/Kenya (Gibson,
1975).
Situation 2. The delayed rainfalls in comparativelymilder climates of August to September have resulted in
saturated soil conditions for longer periods of time. Floodingover prolonged periods resulted in inadequate exchangeof gases in the rhizosphere of trees. The anaerobic
conditions led to accumulation of toxic metabolites causingadverse affect on tree health. It also hinders water andnutrient uptake. All these conditions weakens the tree and
makes it susceptible to attack by soil borne fungi likeFusarium, Pyhthium, Phytophthora, etc. (Schoeneweiss,1981).
The canal side nurseries of forest department growingjamun and dheau was found with 50 per cent mortality inGurdaspur district due to Pythium spp. and Rhizoctoniaspp. under water logging conditions. Similarly, roadsideplantations of shisham (Dalbergia sissoo), kikar (Acacianilotica) and siris (Albizia lebbek) were found infected with
Fusarium sp., Armillaria mellea and Ganoderma lucidum,
Table 1. Tree diseases under different environmental stresses in Punjab (India)
Environmental stress/Disease Pathogen (s) Tree species infected Disease incidence (%)
High temperature induced diseases
Stem cankers, cutting rot Botryodiplodia sp., Poplar, shisham, eucalypts, 15-65
Phomopsis sp. kachnar
High soil moisture
Root rot Pythium spp. and Dhaeu, jamun 50
Rhizoctonia sp.
Wilt Fusarium spp., Armillaria Shisham, kikar, siris Traces to 35
mellea, Ganoderma lucidum
Increased CO2 levels
Leaf spots Cercospora spp. Kachnar Traces to 45
Septoria sp. Neem and dek Traces to 70
Drechslera spp., Alternaria Poplar Traces to 100
spp., Cercospora spp.
Gleosporium sp. Eucalypts, banyan Traces-100
Cercospora spp. Mulberry Traces-100
Gleosporium sp. Banyan Traces-20
Anthracnose Colletotrichum Mango Traces to 90
gloeoesporioides
Sooty mold (increased aphid Capnodium sp. Shisham, mulberry, karanj, Traces-100
population) banyan
Forest Tree Diseases in Relation to Climate Change

234
especially when they were growing in low-lying areasadjoining roads where rainwater remain stagnant for long
times. The incidence of diseased trees varied from tracesto 35 per cent (Table 1). Under high soil moisture conditionsFusarium solani, Phytophthora spp., Pythium spp. and
Rhizoctonia solani were found causing serious damping-off of tree legume seedlings (Lee, 1985; Zakaria, 1990).Mehrotra (1990) reported that leaf web blight of neem
(Azadirachta indica) caused by Rhizoctonia solani appearedin the nursery after the regular monsoon rains set in.
Situation 3.The increased CO2 emissions have
resulted in enhanced soluble carbohydrates levels in thephloem of the trees. This increased succulence levels inleaves have led to appearance of foliar diseases with high
incidence. These include leaf spots of kachnar, neem, dek,poplar, eucalypts, banyan, mulberry; anthracnose in mangoand sooty moulds in shisham, mulberry, banyan and karanj.
The pathogens include fungi like Cercospora spp., Septoriasp., Drechslera spp., Alternaria spp., Cercospora spp.,Gleosporium sp., Colletotrichum gloeosporioides and
Capnodium sp. (Table 1).
Since, climate change is a global phenomenon, it isvery difficult to mitigate its harmful effects. In case of cankers
due to heat stress, some control can be achieved byapplying white lime paint on tree trunk. Tree breeding forheavy foliage bearing species could be another way out.
But both these methods have their limitations in terms oflarge operational areas and long gestation period. Thereare indications that in future more crop residue and faster
decomposition will increase pathogen survival due to milderwinters, which would result in an increased initial inoculum.There is a need to develop necessary epidemiological data
through long term field studies where more than one climatechange variable can be examined in relation to tree
diseases.
REFERENCESAgrios, G.N. (2005) Plant Pathology. Academic Press, New York.
Coakley, S.M., Scherm, H. and Chakraborty, S. (1999) Climate changeand disease management. Annual Rev. Phytopath. 37: 399-426.
Gibson, I.A.S. (1975) Diseases of Forest Trees Widely Planted asExotics in the Tropics and the Southern Hemisphere. Part I.Important members of the Myrtaceae, Leguminosae,Verbenaceae and Meliaceae. Commonwealth MycologicalInstitute, Kew, Surrey, UK.
Hepting, G.M. (1963) Climate and forest diseases. Annual Rev.Phytopath. 1: 31-50.
IMD (2011). http://www.imd.gov.in/section/nhac/dynamic/Monsoon_frame.htm
Karlman, M., Hansson, P. and Nitzell, J. (1994) Scleroderris cankeron lodge pole pine introduced in northern Sweden. Can. J.For. Res. 24: 1948-1959.
Lee, S.S. (1985) Tree diseases and wood deterioration problemsin Peninsular Malaysia. Occasional Paper No. 5, Faculty ofForestry, Agriculture, University of Malaysia, pp15.
Mehrotra, M.D. (1990) Rhizoctonia solani, a potentially dangerouspathogen of khasi pine and hardwoods in forest nurseries.European J. For. Path. 20: 329-338.
Schoeneweiss, D.F. (1981) The role of environmental stress indiseases of woody plants. Plant Disease 65: 308-314.
Thomas, W.D. and Boza, C.A. (1984) The oak decline complex. J.Arboriculture 10(6): 170-177.
Zakaria, M. (1990) Diseases of forest plantation species in PeninsularMalaysia. In: Hitacharen, C., MacDicken, K.G., Ivory, M.H. andNair, K.S.S. (eds), Proceedings of the IUFRO Workshop -Pests and Diseases of Forest Plantations. Regional Officefor Asia and the Pacific, FAO, Bangkok, pp. 94-99.
Parminder Singh, Vineet K. Sharma, G.S. Rattan and Chander Mohan

235
Eucalyptus is the backbone of Haryana’s successful
agroforestry forestry programme. It is the main species ofagroforestry of the state, introduced in state during 1961and has become part and parcel of Haryana’s farming
programme and seen everywhere in the fields, on roadsides, canal banks and along railway lines. Farmers ofcentral plains of Haryana supplement their agriculture
farming by growing Eucalyptus either on the bunds of theirfields or in block plantations alongwith suitable agriculturecrop. Out of about forty million seedlings being raised
annually by Forest Department Haryana, about forty per centshare goes to Eucalyptus alone. Eucalyptus seedlings aresupplied to the farmers free of cost and there is no restriction
on the sale of agroforestry produce in the state. This hasencouraged farmers to take up agroforestry in a big wayand about 15,000 hectares of Eucalyptus are planted every
year in Haryana. It is harvested after seven to eight yearsand more than 0.1 million hectare of area remains underEucalyptus plantations in the state.
Eucalyptus has brought prosperity to the farmers ofNorth-western states. Agroforestry has emerged as a mostdesirable and viable strategy for maintaining social,
economic and ecological sustainability in this region of thecountry. The success of agroforestry in Haryana andneighbouring districts of Punjab, U.P, and Uttrakhand states
of the northern region of India has led to evolution of anannual market for agroforestry based wood products worthmore than Rs.10,000 million (US$ 210 million, US$1=
Rs.46) in Yamunanagar district of Haryana, benefiting notonly farmers, but has also generated employment of variouskinds at different levels in the northern region of India
(Saxena, 2004).
By and large Eucalyptus did not face any major pestproblem in Haryana but recently a tiny wasp called
Eucalyptus Gall Wasp (Leptocybe invasa Fisher & La Salle)also called Blue Gum Chalcid, has severely infested youngEucalyptus plants in the nursery and in the field, and
threatening the Eucalyptus plantations in the state. GallWasp of Eucalyptus is causing loss to the tune of 25 crores
Studies on the Management of Eucalyptus Gall Wasp LeptocybeInvasa Fisher and La Salle in Haryana
Jagdish ChanderConservator of Forests (Research), Panchkula, Haryana
Email:[email protected]
annually. Resultantly, farmers have temporarily stoped
Eucalyptus plantations on their farm lands, which may causehuge setback to agroforestry in Haryana and otherEucalyptus growing states.
The history of this wasp pest is not very old and probablyof Australian origin but its distribution within Australia is stillnot fully known. It was first of all reported from the Middle
East in 2000 and subsequently it has spread to mostMediterranean countries and Northern and Eastern Africa.In India, it was first noticed in the year 2001 in Mandya district
of Karnataka, in Marakkanam area of Villupuram District ofTamilnadu in 2002 (Kumar et al., 2007) and travelled fromsouth to north and reached Haryana in 2007. Sporadic
incidences of its infestation were noticed in northern part ofHaryana in the year 2008-2009 and neither anybody couldidentify the pest at that time nor was it taken seriously. By
the year 2010, the pest became serious and infested almosthundred per cent nursery plants and the plantations. Thewestern part of Haryana is although a semi arid tract, yet
due to the prevalence of good canal irrigation system,Eucalyptus is grown on banks of canals. The surveys wereconducted in the western part of Haryana in May and June
and no Gall Wasp infestation was noticed. It was felt thatvery high temperature prevailing in the region duringsummer months deters the pest from establishing in the
region and therefore, this region of the state was consideredas Gall Wasp free zone. However, the pest was first timenoticed in Hisar region in July 2010 and by September,
2010 severe Gall Wasp infestation was noticed there. April,2011 saw the emergence of swarms of the adults of thepest and a number of adult wasps were seen hovering over
the young plants and coppiced shoots all over the state. Atpresent, the wasp has been reported from all Eucalyptusgrowing countries including Algeria, Iran, Israel, Italy, Jordan,
Kenya, Morocco, Spain, South Africa, Syria, Tanzania, Turkey,Uganda, Vietnam and India.
Realizing the importance of the species and threat due
to the insect, a study was conducted in Haryana state onyoung plantations on the farmer’s fields and also on the
Indian J. Ecol. (2011) 38 (Special Issue) : 235-236Indian Journal
of Ecology

236
plantations raised by Forest Department Haryana with aview to suggest Integrated Pest Management (IPM) for
Leptocybe invasa.
The results of the survey conducted throughout Haryanastate reveal that at present no clone or hybrid of Eucalyptusis tolerant or resistant to Leptocybe invasa. ThoughEucalyptus pellita has been reported to be resistant to thegall Wasp but under Haryana conditions, even Eucalyptuspellita was found susceptible to Gall Wasp. Pure E. pellitais definitely resistant to L. invasa but susceptability of E.pellita may be because of natural hybridization, which has
made E. pellita susceptible to Gall Wasp.
On the basis of analysis, the most affected Eucalyptusclones under Haryana conditions were 10, 271, 316, 83
and 2070. The lease affected clones in the order, 7, 288,130 and 526 under Haryana conditions. Hence, if gall waspinfestation is the major criterion, the above mentioned least
affected clones should be planted. The counting of gallswas done only upto January 2011 as infestation had touchedhundred per cent in the case of clone number 10 and equal
to ninety per cent or more than that in the case of clonenumber 271. Hence, further counting was stopped. Thisgave an impression that the pest remains active under north
Indian conditions throughout the year. However, regularmonitoring will be continued. It was found that galls becameblack after about a month due to the growth of some fungus.
Later on the galls disappeared giving the impression thatthe plant has become gall free. This happened till the 3rdweek of March, 2011. Later on by the last week of March,
2011 a huge swarm of tiny insects hovering over the freshshoots was noticed. These tiny insects were identified asLeptocybe invasa. By the second week of April, 2011, the
leaves of all susceptible germplasm got folded indicating
the initiation of gall formation due to the presence of foreign
material in the soft tissues. Use of light traps is very safe
and pollution free method of pest control for phototropic
insects. But this insect was not attracted to light.
As regards the efficacy of different insecticides, anti-
feedants and repellents of plant and synthetic origin for
controlling the pest, it can be concluded that the application
of the pesticides (Imidachloropid, Dimethoate, Carbaryl,
Monocrotophos, Profenphos, Cypermethrin, Carbofuron,
etc.) was not a effective solution for the control of the pest.
Biological control of L. invasa by using Quadrastichus
mendeli as parasite was also found ineffective, and more
studies are required to be done on Q. mendeli. Detailed
entomological surveys are required to be done under the
north Indian conditions for the presence of natural enemies
of L. invasa.
ACKNOWLEDGEMENTS
The author is thankful to Haryana Forest Department
in general and Dr. Parvez Ahmed, IFS, PCCF Haryana inparticular for providing all facilities, guidance, inspirationand suggestions for conducting the study.
REFERENCESKumar, S.S., Kant, S.K. and Emmanuel, T. (2007) Emergence of gall
inducing insect Leptocybe invasa (Hymenoptera: Eulophidae)in Eucalyptus plantations in Gujarat, India. Indian For. 133:1566-1568.
Saxena, V. (2004) Proceedings of Human Dimensions of Family,Farm, and Community Forestry. International Symposium,March 29 – April 1, 2004. Washington State University, Pullman,WA, USA. Washington.
Studies on the Management of Eucalyptus Gall Wasp

Rice straw is a cheap, abundant, and annuallyrenewable source suitable for producing high-qualitynatural cellulose fibers. With a production of more than 10
million tonnes of paddy about 15 million tonnes of rice strawis produced in Punjab. Natural cellulose fibers from ricestraw with properties similar to those of linen have been
produced using cheap and common chemicals for the firsttime (Reddy and Yang, 2006). Rice straw contains about 40per cent cellulose, 30 per cent hemi-cellulose, 15 per cent
silica, and about 15 per cent lignin. They patented methodand kit for rice fiber extraction of high quality and long naturalcellulose fibers from rice straw and method of producing
rice straw fibers. In addition, extracted rice fibers that are atleast 10 millimeters in length, no more than 0.5 millimetersin width and include a generally smooth surface, which
may be used for development of textile or compositeproducts (www.wipo.int). On the basis of the structure andproperties of the fibers, rice straw fibers could be used to
produce textiles, composites, and other fibrous productssimilar to those produced from the common natural andsynthetic fibers. The chemical composition and
heterogeneous structure of rice straw make it an ideal rawmaterial for composite panels (Smith et al., 2002; Inglesbyet al., 2004). However, the silica content of rice straw is still
a concern regarding cutting tool wear, and more studiesneed to be carried out in this area to understand the problem.
Using rice straw for high-quality fibrous applications
will add value to the rice crops, mitigate our concernsregarding the burning or disposing of rice straw, and provideus an environment friendly alternative (emissions from
burning of rice straw : 70 per cent CO2, 7 per cent CO, 0.66per cent CH4 and 2.09 per cent N2O). Estimated emissionsof greenhouse gases caused by the burning of rice straw in
three states in the Indo-Gangetic Plain of India arenoteworthy. Alkaline ash left on the soil surface after theburning of crop residues causes an increase in urease
activity and may cause N losses from soil and appliedfertilizer because of ammonia volatilization (Bacon andFreney, 1989). But still 85 per cent of the farmers of Ludhiana
(Punjab, India) preferred to burn the rice straw in field while
Employment Generation Potential in Pulpboard Mills of Punjab
Manpreet Singh*, H. S. Saralch and Gur Reet Pal Singh*Department of Processing and Food Engineering,
Department of Forestry and Natural Resources,Punjab Agricultural University, Ludhiana 141 004 (India).
*E-mail: [email protected]
very few of poor farmers feed rice straw to animals and 5per cent of farmers were also using rice straw as substratefor mushroom production or as fuel or bedding material for
animals. Since the straw has potential to be used for pulp-board and presently units are operating in Punjab andgenerating employment in rural areas. This study was
undertaken to know employment generation profile of theseindustrial units.
An exhaustive list of industries was prepared with the
help of State Department of Industries, Chandigarh; SmallScale Industries Department, Chandigarh and DistrictIndustry Centers, situated at all district headquarters. The
demographic and geographic data for all the blocks ofPunjab state were collected from the office of EconomicAdvisor to the Punjab Government. Prior to the start of survey,
a comprehensive proforma was prepared after consultingthe extension scientists/experienced concerned experts.After preparing the list of industries, the survey of pulp board
industries in Punjab was started in different zones (sub-montane zone, central plains, and southern districts).
Total geographical area of Punjab is 50,362 sq km
with 2642 sq km area under paddy during 2005-06 with
production of 10193 thousand metric tons. Out of 20 districts
of Punjab, Ludhiana district had maximum area under paddy,
while SAS Nagar had the minimum area under paddy
among all districts. In paddy production, Sangrur ranked
first with 1626 thousand metric tons and SAS Nagar has
the lowest production of 111 thousand metric tons
(Anonymous, 2007).
It was observed that 2239 persons (2187 Males + 52
Females) were employed in the pulp board mills of the
state. Out of these 477 (189 locals + 288 migrants) are
technical employees and 1710 (307 locals + 1403 migrants)
were non-technical employees (Fig.1). Sixty per cent of
technical employees and 82 per cent of non-technical
employees in pulp board mills were migrants and rest are
locals (Fig. 2&3). The percentage of female workers in the
pulp board industry is shown in Fig. 4. As stated by the mill
owners, majority of non-technical work in this industry is
Indian J. Ecol. (2011) 38 (Special Issue) : 237-238Indian Journal
of Ecology

238
being performed by the labour from other states likeHimachal Pradesh, Bihar, Jharkhand, Uttar Pradesh, etc.
This industry is also providing huge employmentopportunities to the unemployed and even uneducated youthin the form of indirect employment in various activities like
loading, unloading, shifting, transportation, etc. of rawmaterials as well as finished products. The indirectemployment generated by the pulp board mills in the area
where they are located was also estimated as quoted bymill owners and farmers. The indirect employmentgenerated by the pulp board mills in the Punjab state is
about 54,900 mandays.
The pulp board industry of Punjab is also providinghuge employment opportunities to the unemployed and
even uneducated youth in the form of indirect employmentin various activities like loading, unloading, shifting,transportation, etc. of raw materials as well as finished
products. Majority of work was being handled by migrantsfrom other states, which shows the scope of employment
Fig. 3. Background of non-technical employees in pulpboardmills of Punjab
Fig. 1. Employment categorization of employees in pulpboardmills of Punjab
Fig. 2. Background of technical employees in pulpboard mills ofPunjab
Fig. 4. Proportion of females in pulpboard mills of Punjab
to even uneducated youth of Punjab. Only a meager 2 percent of the total persons employed in these mills were
females. This low proportion of the female workers may beattributed to the nature of work being carried out by labour inthese mills.
REFERENCESAnonymous (2007) Statistical abstract of Punjab. Economic advisor
to Punjab government. Chandigarh.
Bacon, P. E. and Freney, J. R. (1989) Nitrogen loss from differenttillage systems and the effect on cereal grain yield. Fert. Res.20: 59-66.
Inglesby, M. K., Gregory, G., Wood, D. F. and Gregorski, K. (2004)Rice straw utilization in building materials: Characterization ofsurfaces and biomineral distribution. 22nd National Meetingof the American Chemical Soc., Anaheim, California.
Reddy, N. and Yang, Y. (2005) Biofibers from agricultural by productsfor industrial applications. Trends Biotechnol. 23(1): 22- 27.
Smith, B., Rolfe, T., Howard, T. and Hensen, P. (2002) Themanufacturing process of straw particleboard: An introduction.Washington State Univ. Rept.
Manpreet Singh, H. S. Saralch and Gur Reet Pal Singh

The tree farming is ecologically as well as
economically more viable than traditional agriculture.Investment in tree plantations always remained relativelylow in India, inspite of the fact that the existing forests cannot
continue to meet our wood requirements. However, realizingthe existing problem, the expenditure on afforestation hasincreased enormously from fifth five year plan onwards but
still the results on the land are not encouraging and wehave not been able to increase area as well as the forestproductivity to the desited level. The misery caused to the
entire nation due to unprecedented eco-degradation isenormous and warrants immediate remedial measures.To counteract the impending crisis, use of fast growing tree
species managed with intensive cultural operationsespecially in tree farming have opened up new vistas inwood biomass production. The short rotation forestry has
attained a success and many private concerns have initiatedplantation activities. Populus deltoides, Eucalyptustereticornis, Acacia mangium, Ceiba pentendra, Gmelinaarborea, Leucaena leucocephala, Robinia pseudoacacia,Melia composita, Prosopis juliflora, etc. have been exploitedby the private companies in the country because of their
market potential and fast growth. Exotic species thoughcontinues to be encouraged over the indigenous ones(Chauhan et al., 2008). Private companies have been
offering spectacular returns through investment in teakplantation programme also.
With the view to improve the productivity and profitability
of plantations and making farm forestry an attractive landuseoption, focus on genetic improvement of planting stock andimprovement of practices in silviculture have been
emphasized. Major gain in plantation productivity has beenachieved within a short span through the application ofvegetative and cloning techniques for gainful exploitation of
the existing useful variations. Eucalyptus clones and poplarplantations have achieved record productivity in north-western states exceeding 50m3/ha/yr under ideal site
conditions with intensive management compared to lessthan 1m3/ha/yr of Indian natural forests. Clonal plantations
Short Rotation Forestry for Economic and Environmental Benefits:Country Report (India)
Sanjeev K. Chauhan* and Rajni ChauhanDepartment of Forestry and Natural Resources, Punjab Agricultural University, Ludhiana-141 004, India
*E-mail:[email protected]; [email protected]
of jortor (Casuarina equisetifolia) in southern states, costal
areas and salt affected soils have repeated the successstory of eucalypt clones. The three year old Eucalyptustereticornis and Casuarina equisetifolia under high density
of 40,000 plants/ha produced nearly ten times more volumethan the conventional density of 2,500 plants/ha. Similarlythe Leucaena and Acacia species are exploited extensively
under short rotation intensive culture to meet industrialrequirements and generate ample employment during thecomplete chain from nursery to finished wood products.
Short rotation clonal plantations on 20 mha degraded landswith existing achievable productivity can meet country‘scurrent wood energy requirements of approximately 250
million tonnes per year.
It is however, not only the short fall in wood productivitybut the increased atmospheric concentration of greenhouse
gases, especially carbon dioxide has raised the threat ofrapid increase of global temperature. Various options haveemerged for mitigating the problem of increase in CO2
concentration and threats associated with climate change.The investment in forestry sector to store carbon in treesand forests is one of the viable options for offsetting the
gases released by fossil fuel burning and mitigating thepotential effects of global warming. Perennial vegetation,notably forests have an important role to play in regional,
national and international green house gas balances.Moreover, under the Kyoto Protocol recognition has beengiven to this option but at the global level, approximately
14.6 mha actual forest area is cut annually, which is alsoadding million tons of carbon to the atmosphere along withother sources of pollution every year. Short rotation forestry
including agroforestry can act as a good source of carbonsink, which is linked to enhanced photosynthetic fixation ofCO2 per unit land area. The harvest yield in forest trees is
vegetative rather than reproductive and most of the biomassconsists of carbon compounds. In addition, the treescompatible with agricultural crops form unique combination
for carbon sequestration. The rapid growth of short rotationwoody crop results in high rates of nutrient uptake and large
Indian J. Ecol. (2011) 38 (Special Issue) : 239-248Indian Journal
of Ecology

240
amounts of carbon storage over rotation lengths as shortas 5 to 15 years. Net carbon benefits are realized if the
wood fiber is used for solid wood products. In some regions,agreements are in place that allows nations or corporationsto offset their greenhouse gas emissions by buying credits
from farmers who increase their stores of carbon in the soilor in trees. The potential market for these carbon creditscould be beneficial to tree growers.
Waste management is another issue of concernincluding and water scarcity in many countries. Good qualitywater supplies are not sufficient to meet the rising demands
from agricultural, domestic use and industry. The urbanand industrial waste water is the major cause of river waterpollution, ground water contamination, spread of diseases
and environmental degradation in the country. Treatment ofsuch water is costly, requires lot of energy and man power,which is beyond the capacity of municipal corporations/
committees. Many a times, this untreated water is used forhigher production of vegetable and fodder crops, however,their unrestricted use without proper treatment aggravates
the contamination of food chain system and poses seriousthreat to soil also. Many techniques like waste water
treatment plants, oxidation ponds, fish culture, use of bluegreen algae, water hyacinth, etc. are used to clean pollutedwater to make it safer for use in agriculture yet most of
these methods are costly. But the use of this water inafforestation programme is an effective alternative, wherethe chances of pollutants to enter into the food chain are
minimum or negligible. The nutrient rich irrigation watercan be used for afforestation programme on infertile andinhospitable wastelands and the higher transpiration rate
of trees can be exploited to get rid of excess water. Wastedlands along the roads, railway tracts, drains, panchyat/villagelands, etc. can be profitably used for direct material benefits
besides meeting the ameliorative requirements in the urbanand sub-urban areas. Developed countries are alsoeffectively making use of this waste water and waste land
for the plantation programmes. A brief country reportpresented here for the benefits of the participants of thesymposium (Table 1).
Table 1. Short rotation forestry : Country report (India)
1a State of country forests : 69.09mha (21.02% of total geographical area) plus 9.28mha (2.82%)
(Forest area) tree cover outside forest (FSI, 2009)
1b Per capita forest area : 0.10 ha
1c Reserved/protected/ : 54.44/28.14/17.41unclassified forest area (%)
2 Trees outside forest (%age : 9.28mha (2.82%)of non- forest area or arable
land/geographical area)
3 Productivity of forests along : 0.7m3/ha/yearwith growing stock (m3 wood / Growing stock of forest= 4.499 billion m3
ha per year) Growing stock of trees outside forest = 1.599 billion m3
Total = 6.098 billion m3, which gives an average growing area of 80.9 m3
per ha in 78.37 mha of forest be covered (FSI, 2009)
4 Major commercial tree species : Acacia catechu, A. nilotica A. mollissima, A. auriculiformis, A. mangium,of the country (in the forests Azadirachta indica, Anogeissus latifolia, Abies pindrow, Bamboo, Cedrusas well as outside forests) deodara, Casuarina equisetifolia, Dalbergia sissoo, Eucalyptus spp.,Picea
smithiana, Pinus roxburghii, Quercus spp., Prosopis juliflora, Shorearobusta, Tectona grandis, Terminalia spp, Toona ciliata, etc.
5 List of fast growing tree species : Acrocarpus fraxinifolius, Anthocephalus cadamba, Ailanthus excelsa,Acacia mangium,A. auriculiformis, Bamboo, Eucalyptus tereticornis,Bombax ceiba, Casuarina equisetifolia, Cryptomeria japonica, Gmelinaarborea,Grevillea robusta, Leucaena leucocephala, Melia composita, Morusalba, Prosopis juliflora, Populus deltoides, Robinia pseudoacacia, Salixalba, Trewia nudiflora, Terminalia arjuna, etc.
Sanjeev K. Chauhan and Rajni Chauhan

241
6 Productivity of Short Rotation : Productivity can be raised only by appropriate choice of species, applicationTree Species (SRTS) (m3 wood of forest tree genetic principles supported by appropriate silvicultural/ ha per year) practices. Approximately 4-5 m3 ha-1 yr-1 growth of fast growing species in
forest against 20-25 m3 ha-1 r-1 under agroforestry/ farm forestry, whereas,the productivity of natural forest is 0.7m3 ha-1 yr-1 (Lal, 2004).
7a Usage of SRTS: timber, pulp, : Fast growing tree species are mostly used in paper/pulp, plywood, matchplywood, fuel, coal, etc. and other wood based industry. Biomass power plants have also started
raising captive plantations for their own use.
7b Domestic/industry It is used for energy and construction purposes. Wood based industrieslike plywood/board, paper/pulp and power plant are dependent upon SRTS.
8a Prospects of Short Rotation : The Govt. of India under the National Action Plan on climate change hasForestry identified the National Mission for Green India as one of the eight missions.
Greening Indian Mission puts the greening in the contact of climate changeadaptation and mitigation meant to enhance ecosystem services like carbonsequestration and storage, hydrological services and biodiversity, along
with provisioning services like fuel, fodder, small timber and non-timberforest products. National policy on biofuel (2009) has proposed target of20 per cent blending of biofuels, both for biodiesel and bioethanol by 2017,
which needs approximately 13mha afforestation of oil seed plants.Proposed plantation and processing involves huge business opportunities(13mha area to be brought under biofuel plantations which is 30 times
than the presently available) and employment generation. Therefore, raisingplantation on non-forest areas including agroforestry/farm forestry has brightprospects in enhancing the green cover.
8b Potential available area : 43 million ha, a two-pronged National Action Plan is proposed for achieving
this goal in 10 years:28 m ha to be developed through agroforestry(10mha on irrigated and 18mha on rain-fed area)
15 m ha of degraded forest having good root stock to be regeneratedthrough JFM.
8c Industry back up for purchase, : WIMCO Ltd., ITC Bhadrachalam Paper Ltd. (AP), West-coast Paper ltd.,etc. Dandeli (Karnataka), Ballarpur paper Industries, Balarshah, (Maharastra),
JK Paper Mill (Koraput, Orissa), etc. have been supporting SRF treeplantations. The twin towns of Yamunanagar and Jagadhri are hubs ofply-board. Additionally, biomass based power plants are dependent on
Prosopis, Eucalyptus, Leucaena, etc.
8d Industry back up for supply : Industrial incentive in terms of quality planting stock extension support, buyof planting material back etc. are provided to private growers.
8e Extension support : Clonal planting stock of poplar, eucalypts, casuarina, etc. have beenpromoted by the wood based industries on a limited scale supported with
technical extension services. Clonal technology has improved productivityto an average of 20-25 m3 ha-1 yr-1 with significant improvement in thequality and supply of timber.
8f Govt. Institutional support for : State Forest Department have been supporting stakeholders in meeting
extension, training, etc. their requirement of planting stock, marketing, technical support, policyissue, etc. Strong commitment among the government agencies, research
Short Rotation Forestry Country Report (India)

242
institutes/Universities, NGO, private sector, etc. is helping in restoring thelost glory of green India.
8g Superior planting stock : WIMCO Seedling Ltd, Rudrapur, ITC Ltd, Bhadrachalam, West-coast Paper
availability Ltd., Dandeli (Karnataka), Pargati Biotechnologies, Hoshiarpur, PrakritiConal Agrotech, Ambala, State Forest Departments, Researchorganizations, etc. are producing quality clonal planting stock of different
SRT species.
8h Gap of Wood demand & supply : DemandYear Fuelwood Timber
(million cum)
2010 362 952015 398 1232020 437 153
Supply2010 169 36
The demand and domestic supply gap is increasing and there is need to
take possible steps to expand plantations with substantial improvement inproductivity. Supply will be supplemented from agroforestry, tree growingon waste land/community land, etc. At present imported wood is important
source to bridge the demand and supply gap.
8i Wood Import/export : Industrial requirement are to be met from outside forest area includingfarmer fields or through import. Import specifically in paper, plywood, powergeneration, etc. is not cost effective. Therefore, industry is dependent on
SRF/Agroforestry and ready to offer incentives like quality planting material,technical support, buy back guarantee, etc. Wood import has beenliberalised due to clean ban on green felling from national forests. Export
is allowed in finished products only.
8j Legal bindings on harvesting, : Harvesting and interstate movement of timber is restricted, however, intransport & sale some states like Punjab, the farm grown timber is considered equivalent
to agricultural produce, therefore involves no restriction on harvesting and
interstate transport.
9 Carbon sequestration at the : The carbon storage/estimates depend upon the composition, age, sitecountry land by forests quality, management, etc. Studies indicate that Indian Forests store
3907.67MtC (above and below ground) and additionally the Carbon storage
in forest soil is estimated to be 9815.95Mt (Melkania, 2009). The plantedforests of SRF have more potential for carbon sequestration in soils,whereas, the long rotation species fix more carbon in wood. Mixed forests
of exotic and indigenous species could be more efficient in carbonsequestration than monoculture.
10 Carbon sequestration potential : Three different scenarios i.e., LUCS1: put max. land into forestry sectorof SRTS – country reports and is an economically feasible scenario; LUCS2: as usual; LUCS3: put
max. land in the plantations and is also a potential scenario. Total carbonsequestration per year in billion tons (projected)
Year LUCS1 LUCS2 LUCS3
2000 5.273 5.273 5.273
2010 7.403 7.037 7.229
Sanjeev K. Chauhan and Rajni Chauhan

243
2020 9.401 8.574 9.143
2030 10.800 9.545 10.640
2040 11.500 10.140 11.580
2050 11.920 10.500 12.210
These projects indicate much scope for carbon sequestration under forests
as well as putting land under plantations. (Bhadwal and Singh, 2002)
11a Phyto-remediation : Clean up the contaminants and subside it to a reduced amount is calledas phyto-remediation. Waste water utilization is mandatory for the industryand the municipal corporations. Phyto-remediation is cost effective way of
waste water management. For example, Eucalyptus can dispose of 5-15cm of effluent per day per hectare.
11b Species in usage for : Eucalyptus tereticornis, Salix alba, Terminalia arjuna, Leucaenaphyto-remediation leucocephala, Grevillea robusta, Casuarina equisetifolia, etc.
List of tree species known o accumulate heavy metals
Tree species Heavy metalsAzadirachta indica Hg,Cu,Ni
Eucalyptus tereticornis Cd, Cr, Pb,Albizia spp. Cd, Cr, Cu,Zn, Hg, MnSalix acamophylla Cu,Pb, Ni
Leucaena lecucocephala Fe, Zn, Cu, MnGrevillea robusta Cd, Cr, Zn,Pb, Ni, Mn,Trema orientalis, Prosopis juliflora Cd,Cu
(Srinidhi et al., 2007)
11c Utilization : Phyto-remediation takes advantage of plant nutrients through roots,transpires water through leaves and act as a transformation system tometabolize organic compounds such as oil and pesticides. They may
absorb and bio-accumulate toxic trace elements in wood.
12 Rotation age : Varies from species to species and their end use. Poplar : 5-8 years;Eucalyptus: 2-15 years; Melia composita: 8-12 years, etc.
Poplar 5x4m (block plantation) 5-8 years
3 m (boundary plantation)Eucalyptus 2x2m,3x3m,4x4m 2-15 yearsLeucaena 4x2m under agroforestry lopped
for fodder and fuelwood 3rd year onwards2x2 m for energy 3rd year onwards
Gmelina 6x6m (Agroforestry) 10-12 years
Melia 6x6m 8-12 yearsSalix 4m on bunds and 5x5m (block) 10-15 yearsBamboo 5x5m 4th year onwards
13 Agro-forestry interventions : : The country’s current need of timber, fuel wood, fodder, industrial wood
potential agro-forestry and medicinal plants must be met from private/community lands in ordersystems/ models (Detail of to reduce the growing demand from forests. The National Forestspecies and productivity) Commission, 2006 has laid stress on improving productivity of degraded
forest (10-40 per cent crown density) by regeneration and afforestation,growing high plantations and promotion of social/agroforestry plantationsbased on genetically improved seed/planting stock. Species: Eucalypts,
Short Rotation Forestry Country Report (India)

244
poplar, Casuarinas equisetifolia, Acacia nilotica, Prosopis juliflora, bamboohave been recommended by Greening India Task Force for mass plantation
under JFM and agroforestry. Detailed information of agroforestry systemsand productivity is available at www.nrcaf.ernet.in.
14a Constraints : Low awareness level of the farmers towards technical, legal, financial,
policy, marketing, etc. are the factors resulting in low adoption of SRFplantations.
14b Planting stock availability : There is no certification criteria for the forest tree planting stock. Very limitedreputed nursery growers provide the quality planting stock.
14c Awareness/attitude of farmers : Less favourable attitude, poor motivation and absence of awareness among
on towards SRTS the farmers is the root cause for less adoption of fast-growing trees ontheir farm lands in comparison to agricultural crops.
14d Legal constraints : Legal, policy, marketing, etc. constrains have been experienced by thefarmers and at the government institution as well
14e Technological constraints : Technology dissemination from research laboratory to land mechanism is
not appropriate, which is essential to motivate the public in favour of JFM/agroforestry.
14f Financial constraints : Financial/marketing support is an issue of immediate consideration.Because of long gestation period than agricultural crops, financial institutions
don’t support tree plantation activities.
15a Exotic species and their potential : Most of the fast growing species are exotic i.e., Eucalyptus spp., Populusdeltoides, Leucaena leucocephala, Acacia spp. Salix alba, Robiniapseudoacacia, Casuarina equisetifolia, Prosopis juliflora, etc. and are much
in demand due to their fast growth.
15b Adverse effects of exotics : Chemical like tannins in Acacia leucocephala, A. mangium and A.including the invasive species auriculiformis, phytotoxins in Eucalyptus and Casaurina, Mimosine content
in Leucaena leucocephala and other allelochemicals include phenolics,
terpenoids, etc. cause reduction in understorey crop yield. Litter fall is mainsource of allelochemicals (glycosides and polyphenols). Invasive species:Indian Council of Forestry Resarch and Education, Dehradun has released
list of 20 invasive species i.e., Acacia mearnsii De Wild.; Ageratumconyzoides (L.) Sieber; Ageratum houstonianum P. Mill.; Chromolaenaodorata (L.) King and Robinson; Cytisus scoparius L.; Eichhornia crassipes(Mart.) Solms; Eupatorium adenophorum Spreng.; Ipomaea carnea Jacq.;Lantana camara L.; Mikania micrantha (L.) Kunth.; Mimosa invisa Mart.;Parthenium hysterophorus L.; Salvinia molesta D.S. Mitch.; Ulex europaeusL.; Xanthium strumarium L.; Ectropis deodarae Prout; Lymantria obfuscataWalker; Pityogenus scitus Blanford; Polygraphus longifolia Stebbing andFusarium monoliforme Sheldon.
16a Clonal v/s seeding sources : The outstanding advantage of use of cutting to increase growth rate of
plantations is established and the same are almost 1½ to 2 times that ofplantations established from unimproved seed sources. Uniformity of woodin turn can enable reduction in the manufacturing cost, better energy,
efficiency and increase in product quality apart from increase in overallproductivity.
Sanjeev K. Chauhan and Rajni Chauhan

245
16b Productivity : With the productivity of 6-10m3 and 20-25m3 ha-1 yr-1 through seedling and
clonally propagated material, respectively the output differences wouldalso be more than double. Better management of existing dense forest,improving regeneration of open and degraded forest and multipurpose
reforestation on non-forest and forest waste lands/community lands aresome of the required initiatives for enhanced productivity.
16c Risk : Invasiveness, high water and nutrition requirements, loss of biodiversity,allelo-chemicals, reduced agricultural productivity, etc. are associated
disadvantages.
17 Emergence of plantation forestry : Investment in plantations always remained relatively low in India, inspite ofthe fact that existing forests cannot continue to meet wood requirements.The III National Forest Policy of 1988 was the turning point, when wood
based industries were emphasized to generate their own raw materialoutside forests. Even Government increased its expenditure manifoldson plantations thereafter, resultantly today India stands at number 2 in
plantations after China. Private plantations have come up in a big-way withsubstantial high productivity than the natural forests.
Top ten countries with largest forest areaRussian Fedration, Brazil, Canada, USA, China, Australia, Congo, Indonesia,Peru and India.
Top ten countries with largest proportion of world’s plantationsChina, India, Russian Fedration, USA, Japan, Indonesia, Brazil, Thailand,Ukrain and Iran.
Top ten countries with highest above ground biomassBrazil, Russian Fedration, Congo, USA,Canada, Peru, Indonesia,
Venezuela, China and Columbia. (www.fao.org)
18 Future directions : Increasing demand-supply gap (domestic as well as industrial), GHGmitigation and carbon trading, shifting from non-renewable to renewableenergy (coal to biomass power plants), awareness towards clean
environment, etc. are some of the issues support factors to increasedplantation drive.
19 Soil carbon sequestration : 9815,95 Mt.
20 Initiatives on adoption of SRF : Availability of quality planting stock, removal of barriers (legal, technical,financial, policy, etc.), site/need specific research, motivation to change
attitude of the growers, etc. are some of the initiatives to promote adoptionof tree plantations.
21a Perspective of energy plantation : The shift from fossil fuel to bio-energy has enhanced the prospects ofenergy plantation in the country. Industrial units have started investing in
captive plantations because of increased competition for the biomass. Inthis context, Short Rotation Forest Tree Species (Eucalyptus, Prosopis,Leucaena, Casuarina, Acacia, etc.) have emerged as a viable option to
meet the growing renewable energy requirements. On an average 50 percent of electricity generated in biomass power projects is derived from ricehusk, 30 per cent from wood and remaining 20 per cent is derived from
other agricultural crop residues. This energy production has brought aboutchanges in cropping pattern, and increased production of energy crops inagriculture fields. Agricultural residue production is not going to change
Short Rotation Forestry Country Report (India)

246
but wood resources have to be generated substantially to feed the industrialenergy requirements.
21b Government : Government is providing incentives for energy shift as well as for energyefficiency. India is a progressing economy and the pace of the development
is hampered by inadequate availability of energy. In addition, the ruralelectrification programme is an uphill task. The Government is reportedlyaiming to generate enough power from different renewable sources to
accelerate the economic growth rate in the 21st century.
21c Society : The environmental awareness among the masses is encouraging themto use renewable energy in stead of fossil fuel. Efforts have been made bythe non-governmental organizations for plantation drives for clean
environment. People realise that the polluted air does not need a passportto enter into the geographical boundary of other nation, therefore clean airis the responsibility of each and every one globally.
21d Corporate houses : Social obligations, Governmental restrictions and their own requirements
make them realise the situation and accordingly they have been fulfillingtheir commitments. In net shell, they realise that clean energy, energyefficiency, GHG mitigation, employment generation, socio-economic uplift-
ment, etc. are predictable outcomes of bio-energy and plantations.
22 Alternatives to meet wood : The Honourable Supreme Court of India imposed clean ban on the greendemand (strategies) felling from the forests in 1996. Therefore, there are only two options i.e.,
either import or produce outside forest area (social forestry/agroforestry).
Greening India Mission emphasizes to double the area for afforestation/eco-restoration in the next 10 years i.e., 20mha.
23 Use of Agricultural waste in : Number of paper industries are operating on material like Saccharumpaper industry/biomass based spp.,Arundo donax, Eulaliopsis binnata, paddy/wheat straw, other farm
power plants residues/fibers, etc.
24 Initiatives to reduce GHG release : Enhanced forestation, installed capacity of hydro and other renewableenergy technologies, technological upgradation, energy shift from fossil torenewable, energy efficiency, introduction of CNG vehicles, etc. are same.
25 Incentives for reducing : CDM is a viable option and number of projects have been registered and
the emissions are earning through the mechanism (detail below at column 33 below).
26 Initiatives to shift from non- : Ministry of New and Renewable Energy (MNRE), GOI is stressing hard onrenewable sources to renewable renewable energy and large scale projects have been initiated on solar,energy. wind, hydro, biomass energy, etc. Energy shift, energy efficiency, renewable
energy, afforestation/ reforestation and conservation/reduces deforestation,etc. are prominent initiatives in this direction.
27 Incentives for shifting from : MNRE is providing subsidy on shifting from non-renewable to renewablenon-renewable to renewable energy (domestic as well as industries) and much emphasis is placed on
sources. renewable (www.mnre.gov.in)
28 Any other community efforts : Many religious/social organizations have been working on SRTS for theirabout SRF. adoption to meet material requirements, mitigate GHGs, phyto-remediation,
etc. Individually farmers are integrating trees with agricultural crops for
higher economic benefits.
29 Institutional capacity building : Institutions are equipped with technological backup and efforts are beingmade to disseminate the required technology to the end users. International
Sanjeev K. Chauhan and Rajni Chauhan

247
collaborations in afforestation/ reforestation, energy sector specificallyenergy efficiency, energy shift, renewable energy, etc. has been encouraged.
30 Technological constraints, if any : The emphasis of SRTS is mainly on clonally propagated stock, therefore,the genetic base is narrowing down, the additional introductions of more
diverse material with high productivity of different species is essential.Efforts are required for multi-species/clonal plantations includingleguminous species.
31 State of CDM A/R projects Indian projects submitted for approval = 14
Registered till dated = 04{ITC (AP), Sirsa (Haryana), Saber Paper Ltd. Una (HP) and TIST (TN)}Validation contract terminated = 02
Correction action requested = 05Globally registered = 32{one each in Maldova (179472), Vietnam (2665), Ethiopia (29343), Chile
(9292), Malaysia (65883), Thailand (19344), Brazil (75783), Bolivia (4341),Uganda (5564), Peru (48689), Paraguay (1523), Albania (22964), Colombia(37783), fifteen in China (1521876) & and four in India(72982)}. Values in
parentheses indicate the potential reduction. (www.unfccc.org)
32 Approved A/R – CDM project Project Reduction Area InvolvementmtCO2 equiv. (ha) (farmers)
1. The internationa small Group 3594 106 1200
and tree planting prog. (TN)2. Small scale cooperative 11596 370 227
Afforestation CDM project (Haryana)
3. Reforestation of severely 57792 3070 3398Degraded landmass (ITC project, AP)
4. Saber Papr Ltd., Una (HP) 74692 - -
(www.cdmindia.in)
33 Basic Data on CDM Projects Project No. Total CER CERs issued-India 2012 (mtCO2) (mtCO2)
Biomass 144 34.7 6.60Wind power 102 26.9 7.29Waste gas/heat utilization 66 35.3 9.49Hydropower 64 16.8 1.75Energy efficiency 54 8.48 1.02Cement 17 16.8 1.25Biogas 14 2.47 0.57Fuel switch 14 24.58 1.42Methane avoidance 11 2.17 0.00HFC reduction 6 82.7 49.3N2O reduction 4 5.84 0.00Afforest./reforestation 4 0.72 0.00Other renew. energies 3 0.28 0.00PFC reduction 1 1.30 0.00Methane recovery 1 1.17 0.07& utilizationTransportation 1 0.24 0.003Total 506 260.4 78.8
(www.iges.or.je/en/cdm)
Short Rotation Forestry Country Report (India)

248
REFERENCESBhadwal, S. and Singh, R. (2002) Carbon sequestration estimates
for forestry options under different land use scenarios inIndia Curr. Sci. 83: 1380–1386.
Chauhan, S.K., Chauhan, R. and Saralch, H.S. (2008) Exotics inIndian Forestry. In: Exotics in Indian Forestry (Eds. Chauhan,S.K., Gill, S.S., Chauhan, R. and Sharma, S.C.), Agrotech Publ.Acad., Udaipur (India), pp24-56.
FSI (2009) India State of Forest Report 2009. Forest Survey of
34 Any other additional information India has generated approximately 30 million carbon credits andapproximately 140 million in run, India’s carbon market is growing faster
than even information technology, bio-technology and BPO sectors as 850projects with a huge investment of Rs. 650,000 million are in pipeline. Asper the Prime Minister’s Council on Climate Change, the revenue from 200
projects is estimated at Rs. 97 billion till 2012. Carbon, like any othercommodity, is traded on India’s Multi. In addition, stakeholders have beenusing voluntary markets for carbon trading to avoid CDM complications.
Commodity Exchange, Mumbai (first exchange in Asia to trade carboncredits).
India, Dehradun, 199p.
Lal, P. (2004) Integrated development of farm forestry plantationsand wood based industries. Ind. For. 130:71-78.
Melkania, N.P. (2009) Carbon sequestration in Indian natural andplanted forests. Ind. For. 135:380-392.
Srinidhi, H.V., Dutta, S.K., Chauhan, R. and Gill, M.K. (2007)Dendroremediation: use of trees to cleanup environment indifferent landuse systems. Environment and Ecology25S(2):245-254.
Sanjeev K. Chauhan and Rajni Chauhan

Place of Publication College of Agriculture
Punjab Agricultural University
Ludhiana-141001, India
Periodicity of Publication Half yearly
Printer’s Name Dr A.K. Dhawan
Nationality Indian
Address Punjab Agricultural University
Ludhiana-141004
Name and Address of individuals who Indian Ecological Society
own the newspaper and partners/ Ludhiana-141004
shareholders holding more than one (Registration No. 67 of 1974-75
per cent of the total capital Chandigarh, dated 14.6.74)
I, A.K. Dhawan, hereby declare that the particulars given above are true to the best of my knowledge and
belief.
Sd/ A.K. Dhawan
(Signature of Publisher)
STATEMENT OF OWNERSHIP AND OTHER PARTICULARSABOUT INDIAN JOURNAL OF ECOLOGY
(See Rule 8)

Calorific Value Assessment of Selected Tropical Tree Species of the Southern India for Higher Fuelwood Potential 194Harsha Hegde, K. Gopikumar, Kheen Samom, Nagaraj Hegde and S.K. Jha
Development of the Goettingen Conservation Chipper Harvester for the Production of Quality Wood Chips 196from Agroforestry, SRC and Open Land VegetationJens-Karl Wegener, Sebastian Glaeser, Marco Lange and Tim Wegener
Comparative Ecological – Economic Study of Short Rotation Tree Cultivation and its Impact on Livelihood 199of Local Stakeholders in Tamil NaduN. V. Saresh, M. Sankanur, Rahul Singh, Archana Verma and D. Nuthan
Evaluation of Seed Source Influence on Quality of Albizia lebbek Seeds Using Standard Sampling Technique 202D.R. Bhardwaj and Ashu Chandel
Weed Management through Soil Solarization in Primary Nursery of Eucalyptus tereticornis 204N. V. Saresh, M. Sankanur, S. L. Madiwalar and Archana Verma
Promising Subabul (Leucaena leucocephala) Genotypes for Shallow Vertisols of Northern Dry Zone of Karnataka 207S. B. Devaranavadgi and Pradeep Rathod
Paulownia fortunei: A Pragmatic Approach to Intensive Forest Farming under Temperate Conditions of 209Kashmir RegionT. H. Masoodi, R. Banyal, N. A. Masoodi and S. A. Gangoo
Agro-Sericulture Pastorial System for Income Generation 212K. V. Shankar Rao, R. Sahu and K. C. Brahma
Developing Sustainable Horticulture Based Farming Systems for the Semi-Arid Rain-fed Areas in Gujarat 214S. S. Hiwale and S. K. Sharma
Potency of Acacia nilotica as Invasive Species at Baluran National Park, East Java- Indonesia 216Zuraida
Introduction of Compatible Populus Species in Different Areas of Iran 218Maryam Daghestani
Floral Biology and Crossability Pattern in Grewia optiva Drummond 219Archana Verma, N. B. Singh, N.V. Saresh, Punit Choudhary and M. Sankanur
Role of Biotechnology for the Production and Improvement of Fast Growing Tree Species 221Hira Singh and S. S. Bal
Bamboo Propagation by Branch Cuttings: A Farmer’s Friendly Technology for Mass Clonal Multiplication 225S. Nautiyal, D.P. Nautiyal and Ashutosh Mishra
Effect of IBA on Rooting of Bamboo Species 227Y. A. Gulabrao, Rajesh Kaushal, N. V. Saresh, Archana Verma and Rahul Singh
An Assessment of Non-Timber Forest Products and Their Contribution in Livelihood Security 229Laxmi Kumari Neupane
Forest Tree Diseases in Relation to Climate Change 232Parminder Singh, Vineet K. Sharma, G.S. Rattan and Chander Mohan
Studies on the Management of Eucalyptus Gall Wasp Leptocybe invasa Fisher and La Salle in Haryana 235Jagdish Chander
Employment Generation Potential in Pulpboard Mills of Punjab 237Manpreet Singh, H. S. Saralch and Gur Reet Pal Singh
Short Rotation Forestry for Economic and Environmental Benefits: Country Report (India) 239Sanjeev K. Chauhan and Rajni Chauhan
CONTENTS

CONTENTS
Genotype × Envionment Interaction among Different Clones of Eucalyptus tereticornis Smith 110Rakesh Kumar and K. S. Bangarwa
Investigations on Pulp and Biomass Production of Subabul Genetic Resources (Leucaena leucocephala 113(Lam.) de Wit.)S. Umesh Kanna, S. B. Chavan, A. K. Bharathi, K. T. Parthiban, S. Vennila, P. V. Anbu, P. Kumar, V. Saravananand P. Durairasu
Variation in Oil Content among the Genotypes of Pongamia pinnata Linn. 119Anee Bora, Nafeesh Ahmed, Shivani Dobhal, M. K. Singh and Ashok Kumar
Microclimatic Amelioration and Yield Potential in Horti-silviculture System 124W.S. Dhillon, Sanjeev K. Chauhan1 and Nighat Jabeen
Agroforestry Systems of Lahaul and Spiti District of Himachal Pradesh, Western Himalaya 129Poonam, D. Nayak, Rajan Bawa and Tara Gupta
Evaluation of Nutritive Value of Leucaena Supplemented Fodder 132Sanjeev K. Chauhan, S.S. Sikka, Rajni Chauhan and Ateet Pal Singh
Effect of Grewia optiva Pollarded at Different Heights on Biomass Production of Agroforestry Systems in 137Mid-Hills of Himachal Pradesh of IndiaH. K. Deshmukh, V. K. Mishra, A. J. Deshmukh and Y. B.Taide
Tree Growth, Organic Carbon and Nutrient Content of Soil under Various Multipurpose Tree Species 141Baljit Singh and R. I. S. Gill
Terminalia arjuna – A Fast Growing Forest Species and a Source of Livelihood to Vana Samrakshana 145Samithi MembersP. Jaya Prakash, R.S. Jaikishan Singh, B.V.Sanjeeva Rao, M.Vijay Kumar
Screening and Selection of VAM Fungi for Fast Growing Fuel Wood Trees 149Reena Kulshrestha and Shama Afroze Baig
Enhancement of Leaf and Shoot Growth in Dalbergia sissoo Seedlings by Application of VAM, Rhizobium 152and Inorganic FertilizersAmanpreet Kaur and Rakesh KumarStudy of Reforestation of Mine Wastelands using Indigenous VAM Fungi through Nursery Technology 155for Acacia niloticaShama Afroze Baig, Reena Kulshrestha and Kiran Jain
Application of Analytical Hierarchy Process for Land Use Allocation 159Rahmawaty
Community Forestry: The Centre for Biodiversity Conservation 166Jyoti Bhandari and G. C. Dhruba Bijaya
Community Forest as a Vehicle for Poverty Reduction, Good Governance and Gender Equity 169G. C. Dhruba BijayaNature and Extent of Damage Inflicted by Gastropods to Saplings of Some Ornamental Plants in Plant 173Nurseries at Ludhiana (Punjab)H. Kaur and E. Chhabra
Clostera resitura (Walker) Larval Behaviour on Poplar (Populus deltoides) Clones 178K. S. Sangha, P. S. Shera and Gurmail Singh
Short Rotation Forestry in Jammu and Kashmir: Options and Opportunities 183S. K. Gupta
Growth Performance of Different Multipurpose Tree Species under Riverain Soils of Punjab 185H. S. Saralch and Tirath Singh
Role of Short Rotation Forestry Products in Enhancing Carbon Mitigation in India 188C. N. Pandey and Sujatha
Prospects and Challenges of Biomass Use in Power Generation 191Avtar Singh

CONTENTS
Contribution of Trees Outside Forests Toward Wood Production and Environmental Amelioration 1A. S. Dogra
Clonal Agroforestry Plantations in India 6Piare Lal
Development of Poplar Based Agroforestry System 11J.P. Chandra
Short Rotation Forestry as a Viable Option for GHG Mitigation 15Sreedevi Madhusudanan, N. S. Patil, Suman Jha and S. Aneesh
Making Short Rotation Plantation Forestry a Viable Land Use Option 20K. Srinivas and D. S. N. Raju
Private Sector in Short Rotation Forestry: Opportunities and Challenges 27R. C. Dhiman
Effect of Pre- extraction on the Pulping and Paper Making Properties of Short Rotation Trema orientalis 35M. Sarwar Jahan Mostafizur Rahman, M. Nuruddin, S. A. Haque and A. Chowdhury
Designing and Augmenting Pulpwood Supply Chain through Contract Tree Farming 41K.T. Parthiban, R. Seenivasan, S. Vennila, P.V. Anbu, P. Kumar, V. Saravanan, S. Umesh Kanna, P. Rajendran,V. Subbulakshmi and P. Durairasu
Symbiosis among Effluents Utilisation, Irrigated Plantation and Energy Production 48Ajay Sharma
Short Rotation Forestry for Sustainable Power Production 54Rajesh Soni
Economic and Environmental Sustainability of using Dendro-energy in Organic Tea Industry in Srilanka 60S. Thiruchelvam, V.M.B. Athula Priyantha and Narayansuwamy Somokanthan
Synergies of Wood Production and Carbon Sequestration through Acacia Hybrid Clones 63S. Vijaykumar, R. Hegde, N. M. Poonacha, Ashok Kumar Chaudhary and M. R. Karki
Forest Composition and Soil Carbon Stock in Oak and Pine Forests along Altitudinal Gradients 68Harpal Singh, Munesh Kumar, Mehraj A. Sheikh and Jahangir Ahmad Bhat
Harvest Related Nutrient Export from Fast Growing Multipurpose Trees (MPTS): A Case Study from South Gujarat 72Sreedevi Madhusudanan, N. S. Patil, S. Aneesh and Vishnu K. Solanki
Tree Legume Rotation in Teak Silviculture: Suitability of Acacia species 76K. K. Sreejesh, T. P. Thomas, K. M. Prasanth, P. K. Kripa, M. Seema Joseph and V. K. Sutheesh
Evidence for Nitrogen Fixation in the Salicaceae Family 80Georg von Wuehlisch
Pulpwood Characterization and Screening Short Rotation Eucalyptus Clones 84S. Vennila, K. T. Parthiban, R. Seenivasan, V. Saravanan, P. V. Anbu, S. Umesh Kanna and P. Durairasu
Selection and Breeding of Willows (Salix spp.) for Short Rotation Forestry 91Davorin Kajba and Ida Katièiæ
Improving Growth Performance and Drought Tolerance of Robinia pseudoacacia L. – Analysis of Seedlings of 95European ProgeniesThomas Guse, Volker Schneck, Mirko Liesebach and Georg von Wuehlisch
Phenological Behaviour and Reproductive Biology of Important Fast Growing Salix Species 99Punit Choudhary, N. B. Singh, I. K. Thakur, J. P. Sharma, Avinesh Sharma and Archana Verma
Growth Performance of Twelve New Clones of Poplar In Punjab, India 107R. K. Luna, N. S. Thakur and Vijay Kumar
Indian J. Ecol. (2011) 38 (Special Issue)Indian Journal
of Ecology