scms journal of indian management
128
Volume XII Number 3 July - September 2015 ISSN 0973- 3167 Estd. 1976 SCMS COCHIN SCHOOL OF BUSINESS, INDIA SCMS JOURNAL OF INDIAN MANAGEMENT Embedded in Cabell’s Directory, Ulrich’s, EBSCO, & ProQuest Kuznets’ Hexa Characteristics : Economic Development Comparatistics Dominica Mades and Kishore G. Kulkarni Literacy and Knowledge : Farmers’ Financial Inclusion Feasibility Michael Lalrinmawia and Hariom Gupta Individual Investors’ Behavior : In Demographical Backdrop Kiran Mehta and Renuka Sharma Investors’ Perception towards Alternativeness and Preferences N. S. Pandey and P. Kathavarayan Airport Passengers : Their Needs and Satisfaction Rajiv Gupta and Vunnam Venkaiah Recruitment and Selection Building Scale : Content Validity Evidence N.R. Aravamudhan and R. Krishnaveni Gender Difference: Investment Behavior and Risk Taking Malabika Deo and Vijayalakshmi Sundar Employee’s Perception towards e-HRM Implementation : Indian Service Sector Chandra Sekhar and Manoj Patwardhan Employee Retention Enablers : Generation Y Employees M. Aruna and J. Anitha Self Efficacy Beliefs and Campus Placement Outcome Nitin Kulkarni and A.H. Chachadi UGQR Impact Factor 1.1
-
Upload
khangminh22 -
Category
Documents
-
view
0 -
download
0
Transcript of scms journal of indian management

Volume XII Number 3
July - September 2015
ISSN 0973- 3167
Estd. 1976
SCMS COCHIN SCHOOL OF BUSINESS, INDIA
SCMS JOURNAL OF
INDIAN MANAGEMENT
Embedded in
Cabell’s Directory, Ulrich’s,
EBSCO, & ProQuest
Kuznets’ Hexa Characteristics : Economic Development ComparatisticsDominica Mades and Kishore G. Kulkarni
Literacy and Knowledge : Farmers’ Financial Inclusion FeasibilityMichael Lalrinmawia and Hariom Gupta
Individual Investors’ Behavior : In Demographical BackdropKiran Mehta and Renuka Sharma
Investors’ Perception towards Alternativeness and PreferencesN. S. Pandey and P. Kathavarayan
Airport Passengers : Their Needs and SatisfactionRajiv Gupta and Vunnam Venkaiah
Recruitment and Selection Building Scale : Content Validity EvidenceN.R. Aravamudhan and R. Krishnaveni
Gender Difference: Investment Behavior and Risk Taking Malabika Deo and Vijayalakshmi Sundar
Employee’s Perception towards e-HRM Implementation : Indian Service Sector Chandra Sekhar and Manoj Patwardhan
Employee Retention Enablers : Generation Y EmployeesM. Aruna and J. Anitha
Self Efficacy Beliefs and Campus Placement Outcome Nitin Kulkarni and A.H. Chachadi
UGQR
Impact Factor 1.1


Articles
Contents July - September 2015, Vol. XII, Issue No. 3
Articles
5 Kuznets’ Hexa Characteristics: Economic Development ComparatisticsDominica Mades and Kishore G. Kulkarni
17 Literacy and Knowledge: Farmers’ Financial Inclusion FeasibilityMichael Lalrinmawia and Hariom Gupta
25 Individual Investors’ Behavior : In Demographical BackdropKiran Mehta and Renuka Sharma
37 Investors’ Perception towards Alternativeness and PreferencesN. S. Pandey and P. Kathavarayan
46 Airport Passengers: Their Needs and SatisfactionRajiv Gupta and Vunnam Venkaiah
58 Recruitment and Selection Building Scale : Content Validity EvidenceN.R. Aravamudhan and R. Krishnaveni
75 Gender Difference : Investment Behavior and Risk TakingMalabika Deo and Vijayalakshmi Sundar
82 Employee’s Perception towards e-HRM Implementation : Indian Service SectorChandra Sekhar and Manoj Patwardhan
94 Employee Retention Enablers : Generation Y EmployeesM. Aruna and J. Anitha
104 Self Efficacy Beliefs and Campus Placement OutcomeNitin Kulkarni and A.H. Chachadi

Chairman’s Overview
According to the latest Deloitte study on economic outlook of Latin America, an international economicenvironment long favorable to the region is fading. In order to avoid the risk of stagnation due to lowgrowth, it has become necessary for the region to design and implement a growth strategy based onincreased productivity. Since economic stagnation in developing countries can create the conditionsfor political and social instability, a strategy for systematic improvement in productivity is required toensure a path to steady growth for the region.
However, there is also a silver lining in the situation that despite the recent slowdown in growth, theregion’s economic fundamentals and social conditions remain solid.
Our lead article in this issue - a comparative study of economic experiences in Ecuador, Colombia,and Venezuela, which were once part of Gran Colombia - examines the challenges and opportunitiesfor the three economies under study.
Financial inclusion and financial deepening have an important role to play in promoting economicgrowth and reducing poverty and inequality, while maintaining financial stability. We bring to you thesecond lead article, a case study on financial literacy among farmers.
Till date, research in behavioral finance has been sparse and sporadic. A better understanding onbehavioral processes is essential for the investment advisors and financial planners to appreciate theway Indian investors respond to market movements. We present to you our third lead article, asurvey of individual investors’ behavior in North India.
In addition, the issue carries a number of learned articles on a variety of topics such as airportpassengers’ needs, investors’ preferences, employee perception on e-HRM, retention of Gen Yemployees, gender difference in investment behavior, et al.
I am confident that this issue will be truly informative and educative to our readers.
Dr. G. P. C. NAYARChairman, SCMS Group of Educational Institutions.

SCMS Journal of Indian ManagementA Quarterly Publication of
SCMS-COCHIN
EditorsEditor-in-Chief
Dr. G. P. C. NayarChairman
SCMS Group of Educational Institutions
EditorDr. D. Radhakrishnan NairProfessorSCMS-Cochin School of Business
Dr. Subramanian SwamyProfessor, Harvard University
Cambridge, MA, USFormerly Professor of Economics
IIT, Delhi
Editorial Board
Dr. Filomina P. GeorgeDirector
SCMS-Cochin School of BusinessKochi
Dr. Radha ThevannoorDirector, SSTM
Kochi
Dr. Abhilash S. NairCo-ordinator
Management Development ProgramsIIM (K), Kochi Campus, Kerala
Dr. I.M. PandeyProfessor of Reseach
Delhi School of Business,New Delhi
Dr. Azhar KazmiProfessor, King Fahd University
of Petroleum and MineralsDhahran, Saudi Arabia
Dr. George SleebaJoint Mg. Director, V Guard
Industries Ltd., Kochi
Mr. Jiji Thomson IASChief Secretary
Government SecretariatThiruvananthapuram
Kerala
Dr. Thomas StegerChair of Leadership and Organization
University of RegensburgGermany
Dr. Kishore G. Kulkarni Distinguished Professor of Economics and Editor
Indian Journal of Economics and BusinessDenver, US
Dr. Naoyuki YoshinoProfessor of Economics
Keio UniversityTokyo, Japan
Dr. Jose Maria Cubillo-PinillaDirector of Marketing Management
ESIC Business and Marketing School Madrid, Spain
Dr. Mathew J. ManimalaProfessor
Indian Institute ofManagement, Bangalore

SCMS Journal o f Indian Management , July - September 2015 4
A Quarterly Journal
Editorial
Dr. D. Radhakrishnan Nair
Edi to r ia l Ass i s tan t :
Ms. Jessy Baby
Prof. K. J. Paulose
Prof. A.V. Jose
Prof. B. Unnikrishnan
Edi tor ia l Commit tee:
Invoke Solar Energy: Save thSetting direction, Creating alignment, and Gaining commitmentEffective leadership, to John Ryan formerly the Chancellor of the State University of NewYork, involves three key components: setting direction, creating alignment, and gainingcommitment. It’s important that leaders set a direction and they encourage people tofollow in that direction. The best people do it well and others not so well. What peoplemost want in a leader is someone who is authentic, who they trust. People now are educatedand intelligent and well-read and they see through people who are/or may be as genuineas they should be. Authentic leaders start with the courage of their convictions – they arenot holding polls or taking surveys. They obviously listen to people’s news and integrate
them but they also have to get the vision and the direction. They have to understand what direction this particularorganization needs to go in.Creative leadership involves people thinking beyond the boundaries that limit individuals and organizations and ifyou think about that it extends beyond the typical skills that are associated with routine leadership. Businessschools teach people how to analyze data, coach employees, even projects. We try to go beyond that and teachpeople how to be innovative. And we do that through three elements: assessment, challenge and support.Advancing Global Leadership is the thinking and emphasis behind this new initiative. People who are involved inglobal leadership positions are today facing greater complaints in their roles, whether it is at the mid-level or higherlevel in their organizations. They need to perceive new situations they face, culturally as well as organizationally,with the people they interact with and they have to adapt their leadership style accordingly.Leadership potential is a “muscle” that needs exercise to develop. What is the best sort of exercise? First of all, onehas to commit to it. One can’t be a leader if he/she is not going to work at it, practice it. You don’t become goodfootball players unless you practise and you don’t become a good leader unless you practise. The best way tobecome a leader is a yearning to become one, to read about it, look for a mentor or a coach, go to a programme andpractise those skills. Behaviours are very important in becoming a leader.Eleanor Roosevelt was born into a wealthy family but was orphaned when she was ten and had a terrible childhood.She became the person who started the Civil Rights Movement and the Women’s Right Movement. She hadtremendous compassion for the poor. She helped the entire world. She was chair of the UN Committee that draftedthe Universal Declaration of Human Rights. Most important she did not take public opinion polls to see what shethought was right.Mahatma Gandhi practised what he preached at every possible level. He treated others with great concern. In hisletters and writings to others to the world and even to young children, never had a patronizing or “holier thanthou” element, and always looked at everyone as equals. More importantly though was his ability to articulate avision in a language that they understood and were inspired by.

SCMS Journal o f Indian Managemen t , July - September 201 5 5
A Quarterly Journal
Kuznets’ Hexa Characteristics:Economic Development
ComparatisticsDominica Mades and Kishore G. Kulkarni
Key Words : Kuznets’ Hexa Characteristics, Total factor Productivity, Economic Development Comparatistics
Abstract
Ms. Dominica MadesGraduate Student, Korbel School of International StudiesUniversity of Denver, 2201 South Gaylord StreetDenver, CO 80208
Prof. Kishore G. KulkarniDistinguished Professor of EconomicsCB 77, P. O. Box 173362Metropolitan State University of DenverDenver, CO 80217-3362.E-mail: [email protected]
conomic development across the globe is oftenrelated to the countries’ locations, history, andcultural similarities. For instance, during the 1800s,
many Spanish colonies in Central and South America beganto fight for their independence including Gran Colombia.Today, the former Gran Colombia makes up modern dayColombia, Ecuador, and Venezuela. While these countrieswere once one country, they have since separated, creatingtheir own individual history, culture, and economy.However, there are ties between these countries, which couldhave an effect on all three economies. The purpose of thispaper is to look at how Kuznets’ Six Characteristics ofEconomic Development have shown themselves in Ecuador,Colombia, and Venezuela and also, compare how theeconomic development has taken place.
Before beginning the main focus of this paper, it is importantto have background knowledge on each country, Kuznetshimself, and each Six Characteristics of EconomicDevelopment. With this information, one can fully
The paper examines how Kuznets’ Six Characteristics of Economic Development have evolved in Ecuador, Colombia,
and Venezuela, once part of Gran Colombia. It explains these six characteristics of economic development which are:high growth rate of per capita income, which is GDP/population, high growth rates in Total Factor Productivity (TFP),
which looks at the means of production such as capital, enterprise, land, and labor, higher growth rate of structural
transformation, or the move away from the agricultural sector, high rates of social, political, and ideological transformationin the economy, which means the political changes, ability or propensity (tendency) to reach out to external markets and
opportunities, or participation in international trade, and economic growth leads to higher equal distribution of income,
or equal international distribution. Ecuador, Colombia, and Venezuela are examined according to Kuznets’ SixCharacteristics of Economic Development, in order to understand how the economic growth has progressed. For
instance, comparing the political changes under Correa in Ecuador and Chavez in Venezuela, or looking at how
Colombia has increased its international trade. All six of these characteristics have played a role in economic growth inthem, to better understand if there could be a relationship due to the similar characteristics of the countries.
Abstract
E

SCMS Journal o f Indian Management , July - September 201 5 6
A Quarterly Journal
understand the importance of the Six Characteristics, whichgo beyond economics but also into politics ad location, buthow each country has developed in a similar fashion butyet with slight differences.
To begin, Ecuador has become a popular tourist locationdue to the Galapagos Islands and the adventure activitiesin the Amazon region, but this country was once part ofGran Colombia. Ecuador was in the northern region of theIncan Empire before the Incas were conquered by theSpanish Empire in 1533. But once Gran Colombia gained itsindependence; it became part of a different state again. Yet,Gran Colombia separated as a young country, and Ecuadorwas formed in 1830. Yet life after the country came to be hasnot been easy, as Ecuador has been plagued with conflictswith neighboring countries and international politicalinstability, such as protests before the last four elections.Currently, the president is Rafael Correa, who has become acontroversial figure nationally and internationally due tochanging the constitution and putting limitations on freedomof speech, but he remains popular with many citizens becauseof increased social services. The population in Ecuador ismainly mestizo, which is a mix of white and indigenousheritage, along with indigenous, white, and Afro-Ecuadorian. And the economy is primarily based onpetroleum exports. Yet, Ecuador suffered a financial crisis,in which the GDP dropped and poverty increasedsignificantly, which led to Ecuador switching to the US dollarfrom the Sucre in 2000, this stabilized the economy with oilexports and non- traditional exports. While Ecuador is onits way to stability, but there is need to increase the economicdevelopment that is occurring.
Directly to the north of Ecuador is Colombia, which wasalso part of Gran Colombia during its existence. Similar toEcuador, Colombia has not had the easiest time establishingitself. For nearly fifty years, conflict has plagued the country,as the Revolutionary Armed Forces of Colombia (FARC)and the government have been at constant conflict witheach other. The war that plagues the country is primarilylocated in the southern part of Colombia; it has been fundedby the well- known drug trade. As the conflict has progressedover time, both sides agreed to meet for peace negotiationsin 2012, which resulted in 31,000 persons being demilitarized.However, many of these persons formed insurgent groups,which have attacked civilians, but there is a lack of supportto overthrow the government. Despite problems with the
FARC, Colombia has had peaceful and transparenttransitions of power and maintains civil liberties for itscitizens. The population in Colombia is made up of mestizos,which is followed by white and mulatto, a mix of black andwhite heritage. The Colombian economy is based on energyand mining exports, despite the common belief that coffee isthe main source of income. Due to these main exports, theeconomy is affected by commodity prices and politicalinstability.
The last country to emerge from Gran Colombia is Venezuela,which has come under international scrutiny due to HugoChavez’s political dealings. Unlike Ecuador and Colombiawhose histories have involved political violence,Venezuela’s transitions of power have tended to be peaceful.The political system was first controlled by generous militarymen, and democratic elections began in 1959, in which HugoChavez was elected in 1999. Chavez has become known forhis promotion of socialism and speaking out against theimportance of capitalism in globalization. Poverty has beenon the decline since Chavez came to power and there hasbeen an increase in government spending on education andhealth care. However, despite the peaceful elections, thereare major concerns about Venezuela, such as democraticstability due to the fact that Nicholas Maduro was handselected to be the next president by Chavez and also thepossibility of Dutch Disease due to the over dependencyon petroleum. The majority of the population is made up ofpeople of European descendants and indigenouspopulations. And 95% of the economy is based in oilrevenues, but this is affected by the influxes in oil prices,such as the economic contraction in 2009-2010.
The background information on these three countries isimportant to understand how development has affectedeach one differently, it is also crucial to know about SimonKuznets, who developed the Six Characteristics ofDevelopment. Kuznets is an important economist fordeveloping countries (LDCs), who was awarded the NobelPrize in Economics for his work focusing on the economicsystems in developing countries (Schommer, 347). He wasborn on April 30, 1901 in Kharkov, Ukraine, but immigratedto the USA in 1922 (Schommer, 347). While he was living inthe United States, Kuznets attended Colombia University,where he got his PhD in 1926 (Schommer, 347). He eventuallywent on to work for the US Federal Government (Schommer,347); during this time he helped the US Department of

SCMS Journal o f Indian Managemen t , July - September 201 5 7
A Quarterly Journal
Commerce standardize the Gross National Product (GNP) asa measure of economic well-being (Concise Encyclopedia).And he studied the U.S. national income and the patterns ofeconomic growth in nations (Schommer, 347). During hislife, Kuznets was a professor at the University ofPennsylvania, Johns Hopkins University, and Harvard(Schommer, 347).
During his life, Kuznets worked on a number of differentareas within economics, especially for developing countriesin an attempt to explain the differences in development. Forinstance, he looked at the complexity of fundamentaleconomic data by stressing reliable results can only bederived through large numbers of observations (Schommer,347). He also calculated national income back to 1869 andmeasured distribution of income between rich and poorcountries (Concise Encyclopedia). Additionally, hebelieved that economic data is dependent on population,structure, technology, quality of labor, government structure,trade, and markets (Schommer, 347). Although he was notthe first to build such economic data but Kuznets set thestandard with his thorough practice (Concise Encyclopedia).For this particular paper the focus will be on the SixCharacteristics of Economic Development, which qualifieshow countries obtain higher levels of economicdevelopment, which are:
- High growth rate of per capita income
- High growth rates in Total Factor Productivity(TFP)
- Higher growth rate of structural transformation
- High rates of social, political, and ideologicaltransformation in the economy
- Ability or propensity (tendency) to reach out toexternal markets and opportunities
- Economic growth leading to higher equaldistribution of income.
According to Kuznets, these six characteristics can be seenin every country no matter what the degree of development,which has occurred.
In this paper, Ecuador, Colombia, and Venezuela’sdevelopment will be looked at specifically according to these
Six Characteristics of Development as a way to betterunderstand how it occurs. While the development patternsof each may appear to be similar it is important to realize thateach has taken its own individual path to promote economicgrowth.
Empirical and Applied Section
Kuznets defined economic growth as “ a long- term rise incapacity to supply increasingly diverse economic goods toits population, this growing capacity based on advancingtechnology and the institutional and ideological adjustmentsthat it demands” (Todaro and Smith, 85). This statementcould be applied to every country no matter if it is developedor developing. In this section of the paper, the focus will beto better understand how each of Kuznets’ SixCharacteristics of Economic Development can be seen inEcuador, Colombia, and Venezuela. According to Kuznets,“The six characteristics are interrelated, and the interrelationsamong them are most significant” (Kuznets, 5).Demonstrating that while each characteristic is importanton its own, how they impact each other is even moreimportant. Therefore, following each of the characteristics,each country will be examined and correlations between eachcharacteristic will be better understood.
Characteristic 1: High growth rate of per capita incomeThe first characteristic of Kuznets is related to the Per CapitaIncome or PCI, which is calculated by (Schommer, 347):
PCI = Gross Domestic Product/ Population
This looks at how a country’s economic productivity isgrowing in comparison to its population, which in shortmeans that the PCI will increase if the GDP is growing fasterthan the population. “Both are large multiples of the previousrates observable in these countries and of those in the restof the world, at least until the recent decade or two,” meaningthat they divide between developed and developingcountries became more apparent recently, as the developedcountries continue to advance more rapidly than thedeveloping (Kuznets, 3). The PCI in developed countrieshas been increasing at a faster rate than those in developingcountries due to the fact that the GDP is significantly higherthan population growth. According to Kuznets, “thesustained rise in goods is the rise of economic growth(Kuznets, 2). In order to calculate the growth rate for PCI,one must look at the following equation (Schommer, 347):
SCMS Journal o f Indian Management , July - September 201 5 8
A Quarterly Journal
Growth rate of PCI = growth rate of output - growth rate ofpopulation
Therefore, countries with a high growth rate in the populationwould have a low or negative PCI in return (Schommer, 347).In other words, developed countries have been experiencinghigh growth rates in GDP starting in the 1770s to the present(Todaro and Smith, 86). And these populations in developedcountries are increasing at a slower rate while in developingcountries are increasing much faster. As a result, it isimportant to look at Ecuador, Colombia, and Venezuela’sPCI in order to understand how GDP and population growthhave impacted the economic growth there.
PCI and Population Rates in Ecuador, Colombia, andVenezuela
To compare the three different countries, it is important toknow where Ecuador, Colombia, and Venezuela stand inrelation to each other in terms of PCI. According to UN
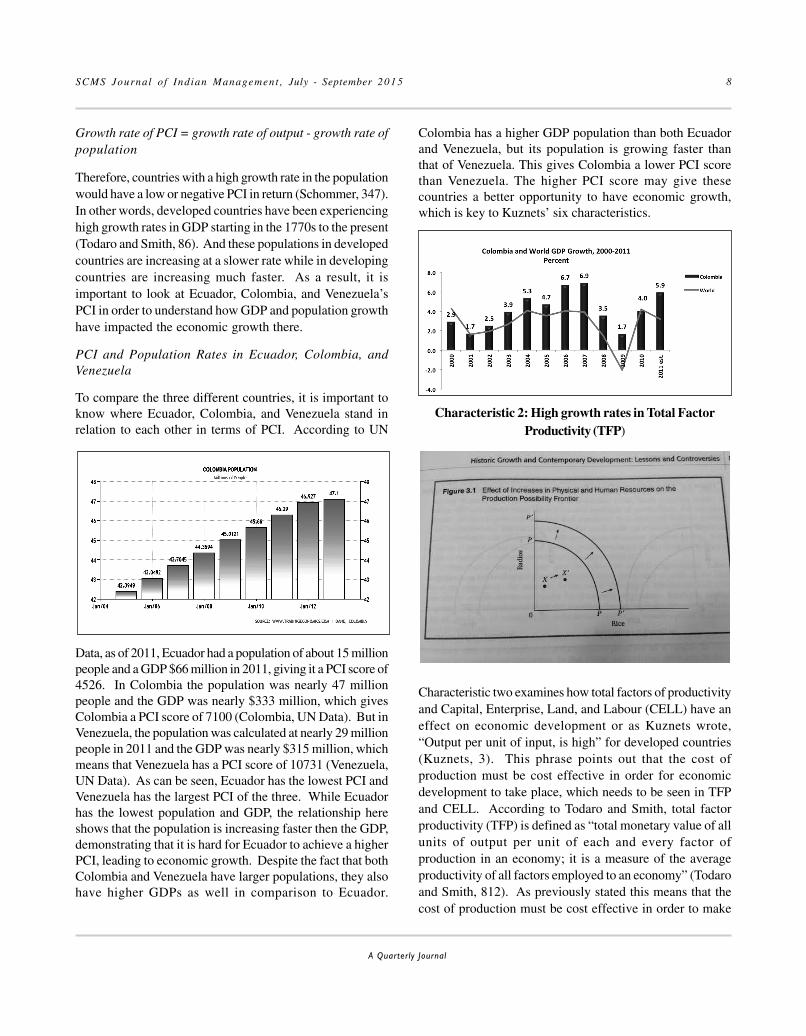
Data, as of 2011, Ecuador had a population of about 15 millionpeople and a GDP $66 million in 2011, giving it a PCI score of4526. In Colombia the population was nearly 47 millionpeople and the GDP was nearly $333 million, which givesColombia a PCI score of 7100 (Colombia, UN Data). But inVenezuela, the population was calculated at nearly 29 millionpeople in 2011 and the GDP was nearly $315 million, whichmeans that Venezuela has a PCI score of 10731 (Venezuela,UN Data). As can be seen, Ecuador has the lowest PCI andVenezuela has the largest PCI of the three. While Ecuadorhas the lowest population and GDP, the relationship hereshows that the population is increasing faster then the GDP,demonstrating that it is hard for Ecuador to achieve a higherPCI, leading to economic growth. Despite the fact that bothColombia and Venezuela have larger populations, they alsohave higher GDPs as well in comparison to Ecuador.
Colombia has a higher GDP population than both Ecuadorand Venezuela, but its population is growing faster thanthat of Venezuela. This gives Colombia a lower PCI scorethan Venezuela. The higher PCI score may give thesecountries a better opportunity to have economic growth,which is key to Kuznets’ six characteristics.
Characteristic 2: High growth rates in Total FactorProductivity (TFP)
Characteristic two examines how total factors of productivityand Capital, Enterprise, Land, and Labour (CELL) have aneffect on economic development or as Kuznets wrote,“Output per unit of input, is high” for developed countries(Kuznets, 3). This phrase points out that the cost ofproduction must be cost effective in order for economicdevelopment to take place, which needs to be seen in TFPand CELL. According to Todaro and Smith, total factorproductivity (TFP) is defined as “total monetary value of allunits of output per unit of each and every factor ofproduction in an economy; it is a measure of the averageproductivity of all factors employed to an economy” (Todaroand Smith, 812). As previously stated this means that thecost of production must be cost effective in order to make

SCMS Journal o f Indian Managemen t , July - September 201 5 9
A Quarterly Journal
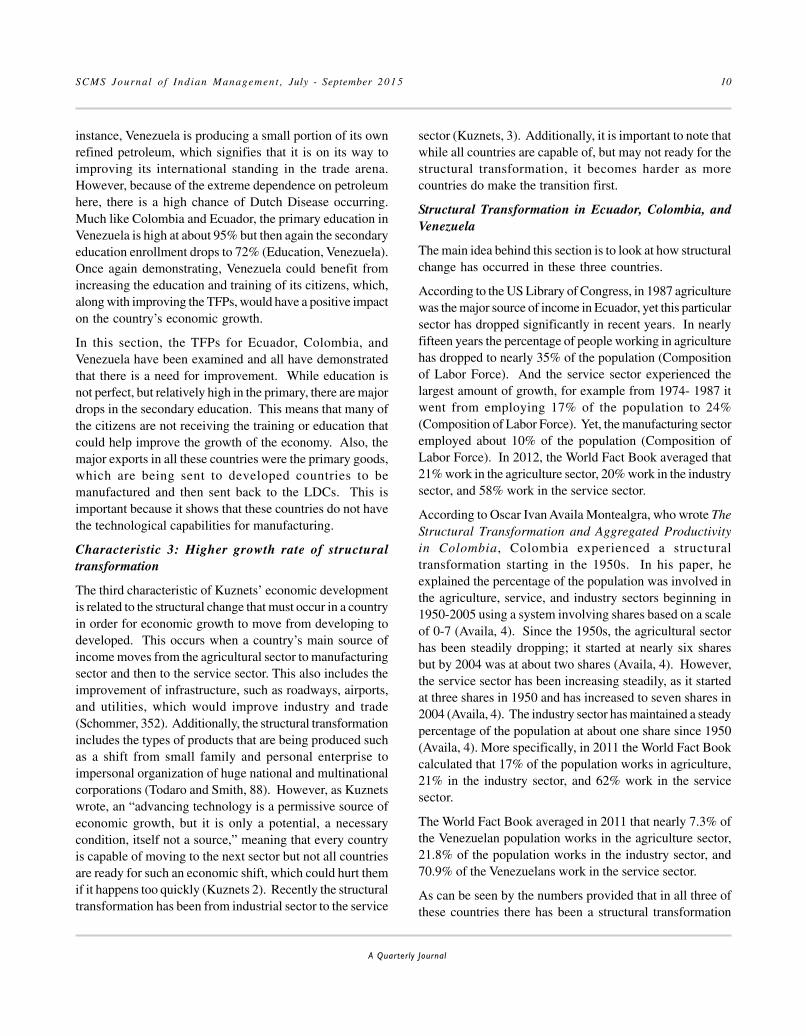
monetary gains. An example of TFP can be seen in Figure3.1 from Todaro and Smith, which shows that the productionpossibility frontier is shifting outward without calling formore capital or labor (Todaro and Smith, 81). While CELLalso play an important role under this characteristic, eachcomprises different aspects of productivity. To begin capitalproductivity is measured by the increase in newtechnologies, better machines, and the higher productionof machinery, tools, and equipment, in other words the manmade resources used to increase production. Enterprise, orthe knowledge or know-how of technology, can be improvedby training, services, research, and development innovation.Land productivity, or using the land to its best capabilitypossible, can be increased by the use of better fertilizers,water management, green revolution, or higher output peracre, and better agricultural technology, such as newconstruction and new buildings. And lastly, laborproductivity can be increased by improving the workers’skills, education, creating a higher labor force, andparticipation. It is crucial to understand that the growthrates for CELL must help to create the growth rate ofproductivity in the economy (Schommer, 349). Anotherimportant aspect of this characteristic to understand is theproduction possibilities curve, which is “a curve on a graphincluding alternative combination of two commodities… thatcan be produced when all available factors of productionare efficiently employed” (Todaro and Smith, 807). This issignificant because it points out that in order for adeveloping country to be successful it must use all of CELLin order to effectively use TFP. Additionally, “several WorldBank studies have confirmed Kuznets’ findings that totalfactor productivity growth is what determines the rate ofgrowth in developing countries” (Todaro and Smith, 86).While these factors make up characteristic two, they canonly be fully understood if they are put to practice.
TFP Growth Rate in Ecuador, Colombia, and Venezuela
According to Todaro and Smith, it is important to point outthat almost all developing countries are located in the tropicalor subtropical zones of the world (Schommer, 350). Thisidea relates to Ecuador, Colombia, and Venezuela becauseall three are close to the equator, making them fall into thissection of the developing world. Colombia and Venezuelaare simply to the north of the Equator, while it runs throughthe northern part of the country in Ecuador. Within thissection, the main exports and education for all threecountries will be examined to better understandcharacteristic two.
Despite Ecuador’s success with bringing in tourism, thereis a need for improvements in regards to the Total Factors ofProductivity. Ecuador’s top exports are crude petroleum at51%, bananas at 12%, crustaceans at 5%, refined petroleumat 4.5%, and fish at 4% (Learning more about Trade inEcuador). Yet, most of the imports coming into Ecuador aremanufactured goods, such as refined petroleum, cars, andpackaged medicines, which are more expensive than theexports being sent out. This puts Ecuador at a disadvantagewhen it comes to economic development. Another aspectthat is important to TFP is the education of the citizens inEcuador. According to UNICEF, from 2008-2012 a little morethan 95% were enrolled in primary education, but enrollmentin secondary education dropped to nearly 74% (Education,Ecuador). While nearly 98% of the population is literateand a majority has continued their education, Ecuador couldbenefit from more training and furthering education. Thefact that Ecuador is involved in international trade and themajority of its citizens have been educated to a degree, thereis major need for improvement to help the country’s economicgrowth.
While, in Colombia, the main exports are crude petroleum at38%, coal briquettes at 17%, refined petroleum at 7%, goldat 4%, and coffee at 4% (Learning more about trade inColombia). Much like Ecuador, the imports that are beingbrought in to Colombia are of greater cost than what isbeing sent out, such as refined petroleum, cars, andcomputers (Learning more about Trade in Colombia).Additionally, it is important for TFP to know about theeducation that is available for the citizens. By UNICEFstatistics, Colombia has a high rate of primary educationenrollment at about 90%, but then again drops to about75% for secondary education. Thus again demonstratingthat continuing education and training could be beneficialfor the economy in Colombia. In terms of economic growth,the relationship between education and TFP has had anegative impact on the economy in Colombia, making growthdifficult.
As can be expected, the top export in Venezuela is crudepetroleum at 78%, followed by refined petroleum at 18%,iron ore at 0.5%, raw aluminum at 0.5%, and iron reductionsat 0.3%. Similar to Ecuador and Colombia, the items that arebeing brought into Venezuela are the manufactured goods,such as medical equipment and broadcasting equipment(Learning More about Trade in Venezuela). Yet unlike theother two, the rates at which these items are coming in aresignificantly lower, creating more independence. For
SCMS Journal o f Indian Management , July - September 201 5 10
A Quarterly Journal
instance, Venezuela is producing a small portion of its ownrefined petroleum, which signifies that it is on its way toimproving its international standing in the trade arena.However, because of the extreme dependence on petroleumhere, there is a high chance of Dutch Disease occurring.Much like Colombia and Ecuador, the primary education inVenezuela is high at about 95% but then again the secondaryeducation enrollment drops to 72% (Education, Venezuela).Once again demonstrating, Venezuela could benefit fromincreasing the education and training of its citizens, which,along with improving the TFPs, would have a positive impacton the country’s economic growth.
In this section, the TFPs for Ecuador, Colombia, andVenezuela have been examined and all have demonstratedthat there is a need for improvement. While education isnot perfect, but relatively high in the primary, there are majordrops in the secondary education. This means that many ofthe citizens are not receiving the training or education thatcould help improve the growth of the economy. Also, themajor exports in all these countries were the primary goods,which are being sent to developed countries to bemanufactured and then sent back to the LDCs. This isimportant because it shows that these countries do not havethe technological capabilities for manufacturing.
Characteristic 3: Higher growth rate of structuraltransformation
The third characteristic of Kuznets’ economic developmentis related to the structural change that must occur in a countryin order for economic growth to move from developing todeveloped. This occurs when a country’s main source ofincome moves from the agricultural sector to manufacturingsector and then to the service sector. This also includes theimprovement of infrastructure, such as roadways, airports,and utilities, which would improve industry and trade(Schommer, 352). Additionally, the structural transformationincludes the types of products that are being produced suchas a shift from small family and personal enterprise toimpersonal organization of huge national and multinationalcorporations (Todaro and Smith, 88). However, as Kuznetswrote, an “advancing technology is a permissive source ofeconomic growth, but it is only a potential, a necessarycondition, itself not a source,” meaning that every countryis capable of moving to the next sector but not all countriesare ready for such an economic shift, which could hurt themif it happens too quickly (Kuznets 2). Recently the structuraltransformation has been from industrial sector to the service
sector (Kuznets, 3). Additionally, it is important to note thatwhile all countries are capable of, but may not ready for thestructural transformation, it becomes harder as morecountries do make the transition first.
Structural Transformation in Ecuador, Colombia, andVenezuela
The main idea behind this section is to look at how structuralchange has occurred in these three countries.
According to the US Library of Congress, in 1987 agriculturewas the major source of income in Ecuador, yet this particularsector has dropped significantly in recent years. In nearlyfifteen years the percentage of people working in agriculturehas dropped to nearly 35% of the population (Compositionof Labor Force). And the service sector experienced thelargest amount of growth, for example from 1974- 1987 itwent from employing 17% of the population to 24%(Composition of Labor Force). Yet, the manufacturing sectoremployed about 10% of the population (Composition ofLabor Force). In 2012, the World Fact Book averaged that21% work in the agriculture sector, 20% work in the industrysector, and 58% work in the service sector.
According to Oscar Ivan Availa Montealgra, who wrote TheStructural Transformation and Aggregated Productivityin Colombia, Colombia experienced a structuraltransformation starting in the 1950s. In his paper, heexplained the percentage of the population was involved inthe agriculture, service, and industry sectors beginning in1950-2005 using a system involving shares based on a scaleof 0-7 (Availa, 4). Since the 1950s, the agricultural sectorhas been steadily dropping; it started at nearly six sharesbut by 2004 was at about two shares (Availa, 4). However,the service sector has been increasing steadily, as it startedat three shares in 1950 and has increased to seven shares in2004 (Availa, 4). The industry sector has maintained a steadypercentage of the population at about one share since 1950(Availa, 4). More specifically, in 2011 the World Fact Bookcalculated that 17% of the population works in agriculture,21% in the industry sector, and 62% work in the servicesector.
The World Fact Book averaged in 2011 that nearly 7.3% ofthe Venezuelan population works in the agriculture sector,21.8% of the population works in the industry sector, and70.9% of the Venezuelans work in the service sector.
As can be seen by the numbers provided that in all three ofthese countries there has been a structural transformation
SCMS Journal o f Indian Managemen t , July - September 201 5 11
A Quarterly Journal
as a majority of the population works in the service sector,followed by the industry sector. This means that there hasbeen a drop in the number of people who work in theagricultural sector. While all three countries are involved ina structural transformation, this does not mean that theycan compete with other countries in the international sectorto improve their economic growth.
Characteristic 4: High rates of social, political, andideological transformation in the economy
For any economic change to take full effect in a country it iscrucial to realize the significance of social, political, andideological transformation, or what has come to be knownas modernization, that must occur. It is necessary to look atthe attitudes, age-old practices, taboos, and traditions thatexist in one’s own country and look at how these could beaffecting the economy (Schommer, 354). “Urbanization andsecularization come easily to mind as components of whatsociologists’ term the process of modernization” (Kuznets,4). Such changes can allow for growth in “labor efficiencyand diligence, promote effective competition, social andeconomic mobility and individual enterprise, permit greaterequality of opportunities, make possible higher productivity,raise levels of living, and promote development” (Schommer,355). This demonstrates all the different areas that the social,political, and ideological transformation can have on acountry’s economy and how the movement of citizens canalso have an impact, making the economy more capable ofsustainable growth. Gunnar Myrdal, a Nobel Prize winner,had another way of looking at this type of growth, whichfollowed for different characteristics of modernization(Todaro and Smith, 88). He first looked at rationality, whichmeans using more modern methods of thinking as opposedto the traditional ones in a country, but these new methodsmust be used in a logical way in order to work (Todaro andSmith, 88). The next important fact in Gunnar Myrdal’s modelis economic planning, which is a coordinated system thatwill allow for economic growth and development (Todaroand Smith, 89). Additionally, the promotion of equality in acountry, or social and economic stabilization, will alsopromote economic growth. And lastly, it is crucial to haveimproved institutions and attitudes will promote a higherquality of work force and a higher rate of productivity(Todaro and Smith, 89).
Social and Political Ideological Transformation inEcuador, Colombia, and Venezuela
Due to the importance of social and political ideologicaltransformation, this section will examine how the political
changes in each of these countries have effected theeconomic growth there. This is the section that will showthe most differences, due to the political situation that hasimpacted each country in a different way.
In 2008, under the direction of President Rafael Correa, theEcuadorian population voted to rewrite the constitution,which has been its twentieth constitution since it becamean independent nation, demonstrating that Ecuador is stilllooking for a political transformation that works for them (InGood Faith). Correa called the changes the “Citizen’sRevolution” due to the fact that there are more social servicesbeing offered and there is a committee of citizens to overseethe branches of the government (In Good Faith). However,many fear that the new constitution would give Correa theability to turn the government into an autocracy (In GoodFaith). Because this particular constitution is so young, itis hard to know if the country will experience economicgrowth in the future.
Unlike Ecuador and Venezuela, Colombia has not gonethrough a major social and political ideology change inrecent years, despite the attempts made. Colombia’s historyhas been plagued with violence, as other political partiesand guerrilla groups oppose the government (Governmentand Politics). For instance, the Colombian government andthe FARC are constantly struggling over who is in controlof the country. Due to the political struggles, Colombia hasnot had much success in reducing the poverty (Governmentand Politics). In other words, because Colombia has beenso focused on maintaining political stability, much of theattention has been taken away from economic prosperity.
Despite his international reputation, especially due to hispolitical challenges and changes in the oil reserves, HugoChavez made many political changes in Venezuela, whichchanged the ideology of the people. Under Chavez,Venezuela approved a new constitution in 2000 and heincreased social programs available for the population(Bulmer-Thomas). Additionally, Chavez increased theminimum wage, which brought many of the citizens out ofpoverty, and also increased the literacy rate in Venezuela(Bulmer-Thomas). Yet, he handpicked Maduro to be thenext president, instead of letting the people completely voteon their next president. This by itself could lead to anotherpolitical and social transformation in Venezuela.

SCMS Journal o f Indian Management , July - September 201 5 12
A Quarterly Journal
As can be seen by the short analyses of the political andsocial changes in these countries, these transformationshave had effects on the economic development. Forinstance, as can be seen by the political and social changesin Venezuela, the economy has been growing because ofthe services that have been provided to the people. And
despite the fact that Ecuador has the lowest GDP rate of thethree countries, it has been growing economically since thechanges that have been made under Correa’s presidency.On the other hand, Colombia has not experienced a majorpolitical change, despite the constant threat of violence,which has not allowed Colombia’s economy to fully develop.
Characteristic 5: Ability or propensity (tendency) to reach out to external markets and opportunities
A country’s involvement or even capability to participate ininternational trade is the fifth characteristic of Kuznets’theory. Due to their technological advances and greatereconomic growth, developed countries have a greater abilityto reach all international markets than LDCs, giving them anunfair advantage in international trade (Kuznets, 4). Yet it iscrucial for a developing country’s economic growth toparticipate in international trade as it creates a larger marketfor the products that they have to offer, but these productsare mainly natural or primary resources, which are by farless expensive than the manufactured goods. Kuznetsrecognizes the ongoing propensity of rich countries to reachout to the rest of the world for primary products and rawmaterials, cheap labor, and lucrative markets for theirmanufactured products” (Schommer, 356). While it isnecessary for countries to participate in international trade,the fact that developing countries are often the ones whoare trading the primary goods puts them not only at aneconomic disadvantage but also a political one, due to theability to end trade with one country and move on to another(Todaro and Smith, 89), proving that developing countries
could benefit but also be hurt by international trade. Whetheror not international trade hurts or benefits Ecuador,Colombia, and Venezuela will be seen in the followingsection.Free Trade and International Relations in Ecuador,Colombia, and Venezuela
It is important to understand how international trade canhave an impact on the economic growth and how Ecuador,Colombia, and Venezuela treat international trade.

SCMS Journal o f Indian Managemen t , July - September 201 5 13
A Quarterly Journal
Ecuador is highly dependent on the trade of imports andexports in order to help the economy grow (Trade and TariffGraph, Ecuador). As can be seen on the graph, are all thecountries that Ecuador does international trade with andthe degree to which the trade is done. “The vertical axisshows import values by key importing countries, while thehorizontal axis shows export values by the country for thesame sector, i.e. the country has gained market share in thecase of an importing country at the bottom right of chartand lost market share for countries top left. The size of circlesis proportional to market size” (Trade and Tariff Graph,Ecuador). Demonstrating Ecuador’s involvement with
international trade, yet as can be seen by the graph andinformation from previous sections, Ecuador is at adisadvantage due to exporting primary products.
As can be seen by the chart, Colombia has been increasingthe amount of international trade. There could be a numberof reasons that the trade has been increasing, due to theexpansion in the mining sector in Colombia. This has had apositive impact on the Colombian economy. Yet again, likeEcuador, due to the fact that the primary products are theones being sent out of Colombia, it is having a hard timecompeting with developed countries.
Similar to the Ecuadorian graph, this graph on Venezuelademonstrates the amount of international trade that occursfrom this country. As can be seen in both graphs, theUnited States is one of the major trading partners for bothEcuador and Venezuela. Again, it is important to recognizethe fact that the primary products that are produced inVenezuela are putting them at a disadvantage for tradingwith developed countries. Yet, they have made progress inrefining their own petroleum.
As can be seen by the charts, international trade is crucialfor the economic development for Ecuador, Colombia, andVenezuela. It can be seen that by opening up the market tointernational trade increases the money that is coming inbut as pointed out in characteristic two. However, all threecountries are at a disadvantage because they are mainly
exporting primary products. In order to fully compete withdeveloped countries, Ecuador, Colombia, and Venezuelaneed to work on producing more manufactured products.
Characteristic 6: Economic growth leads to higher equaldistribution of income
The final characteristic of Kuznets’ six characteristics ofEconomic Development pertains to the idea of increasingthe equality of income distribution. This equal distributionmeans a more widely spread growth across the globe, as itcreates a more balanced international distribution of wealth(Todaro and Smith, 89). Unfortunately, this has yet to beachieved due to the fact that 15% of the world’s populationhas a majority of the wealth (Todaro and Smith, 89). In orderto better understand how unequal the distribution of wealthis, Kuznets created a way of measuring the disparity.

SCMS Journal o f Indian Management , July - September 201 5 14
A Quarterly Journal
Kuznets’ curve is the “relationship between a country’sincome per capita and its equality of the income distributionsuch as per capita incomes increase, the distribution ofincome at first worsens and later improves from very lows”(Todaro and Smith, 800). An example of the Kuznets’ curvecan be seen in Figure 6.10, which represents the relationshipof the gross national product per capita and the Ginicoefficient, which is a collective number to measure income(Todaro and Smith, 215). As can be seen in the chart, theincome distribution takes on the shape of an inverted ‘u,’which represents the tendencies of growth.
Income Distribution for Ecuador, Colombia, andVenezuela
To understand how the income has been distributed, onemust look at how the Gini coefficients of both the developingand the developed world. As can be seen by the map belowaccording to the per capita incomes that Ecuador is thelowest just below $2000, then comes Colombia, which rangesfrom $2000- $9999, and then lastly Venezuela, which rangesfrom $10,000- $49,999. On the CIA has a list of all the GiniCoefficients listed on the website, which will help todistinguish how the Gini Coefficient is different fordeveloping and developed countries. There are differencesin the years, depending on when the last calculation wascompleted. Here is the list of some examples of the GiniCoefficients for Ecuador, Colombia, and Venezuela alongwith some developed countries:
Colombia- 55.9 calculated in 2010Ecuador- 44.7 calculated in 2012
United States- 45 calculated in 2007Venezuela- 39 calculated in 2010
United Kingdom- 32.3 calculated in 2012
As can be seen by the Gini Coefficients for Ecuador,Colombia, and Venezuela, these countries have fluctuatingscores, as do the developed countries of the United Statesand the United Kingdom.Yet, as was discussed in theprevious all three countries are working on increasing theirGDP in order to increase their PCI but this will still take along time. In terms of domestic income equality, thesecountries also have a long way to go in order to achieveequality. For instance, Ecuador, Venezuela, and the UnitedStates all have the same ratio as far as income discrepancygoes. While Colombia has a lower rate of income equalityand United Kingdom has the highest. This is importantbecause it shows that process needs to be madedomestically in order for the countries to compete on aninternational level. Therefore, all the countries that are listedare no where near having an equal distribution of income.

SCMS Journal o f Indian Managemen t , July - September 201 5 15
A Quarterly Journal
ConclusionAs previously stated, the focus of this paper is to look athow the economic development of Ecuador, Colombia, andVenezuela can fit into Kuznets’ Six Characteristics ofEconomic Development. It is easily seen that these countriesappear to be developing in a similar manner but with a closerlook one can see that the slightest variations can make allthe difference in the economic growth of a country.
To begin, according to Kuznets’ Six Characteristics, Ecuadorfits into the characteristics as follows: the GDP is notgrowing as fast as the population giving it a PCI score of4526; TFPs mainly produce the primary products like crudepetroleum and food products; only three fourths of thepopulation continue on to secondary education; there hasbeen a move from the agricultural sector to the servicesector; there were social and political changes underPresident Correa; Ecuador participates in international trade;and yet it has not reached equal income distribution in regardto the domestic or international realm.
Colombia has had a similar experience to Ecuador, but thepolitical instability has had a negative effect on the economicgrowth. By the Kuznets’ Six Characteristics, Colombia hashad a similar path: the PCI score of 7100 is slightly higherbecause the GDP and the population are increasing at acloser rate; the TFPs are based on primary products such asminerals and food products; only three fourths of thepopulation continues on to secondary education; a majorityof the population has started working in the service sectorinstead of agriculture and industry; there has not been anymajor social and political changes due to the politicalinstability that has plagued Colombia; it has participated ininternational trade; and much like Ecuador, Colombia hasyet to reach equal income distribution.
And lastly, Venezuela has followed a similar path to Ecuadorand Colombia with slight differences. The economicdevelopment follows Kuznets’ six characteristics by thesefactors: Venezuela’s population is growing slightly morerapidly than its GDP, which gives it PCI score of 10731; theTFPs are based on primary materials as well like crudepetroleum, minerals, and food products; yet, it has a lowerrate of secondary education with slightly less than threefourths of the population; over three fourths of thepopulation and the rest of the population are working in theagriculture and industry sector; additionally, there were
political and social changes in Venezuela under Chavez; thecountry participates in international trade; and like Colombiaand Ecuador, Venezuela has yet to reach equal incomedistribution.
As can be seen by the summary for each of the countries,the economic development has taken similar courses, yetthere have been some differences. There is no way to saywhich country is more developed than the other due to thestrengths and weaknesses of each. It is fair to say thatColombia faces the most challenges to economicdevelopment due to the political instability, where asEcuador’s population could continue to impact the PCI, andVenezuela faces challenges because of the lack of trainingfor the population. All three countries are working on theeconomic growth, but a lot still needs to be done to achieveeconomic development.
References
Aviala Montealegra, Oscar Ivan. “The StructuralTransformation and Aggregated Productivity of Colombia.”<http://www.banrep.gov.co/sites/default/files/eventos/archivos/sem_334.pdf>.
Bulmer-Thomas, Victor. “Radical Changes.” Analysis: HowHugo Chavez changed Venezuela. BBC. March 6, 2013.<http://www.bbc.com/news/world-latin-america-15240081>.“Colombia.” Country Profile. Data. UN Data, A World ofInformation. 2014. <http://data.un.org/CountryProfile.aspx?crName=Colombia>.
“Colombia.” Learn More about Trade in Colombia.Observatory of Economic Complexity. 2014. <http://atlas.media.mit.edu/profile/country/col/>.
“Colombia” World Factbook. Central Intelligence Agency.2014. <https://www.cia.gov/library/publications/the-world-factbook/geos/co.html>.
“Colombia’s Economy.” Economy. Embassy of Colombia,Washington, DC. <http://www.colombiaemb.org/node/1328>.
“Colombia’s Population.” Countries. Trading Economics.2014. <http://www.tradingeconomics.com/colombia/population>.
“Composition of Labor Force.” Ecuador Table of Contents.Ecuador Human Resources and Income. US Library ofCongress. <http://countrystudies.us/ecuador/42.htm>.

SCMS Journal o f Indian Management , July - September 201 5 16
A Quarterly Journal
******
“Distribution of Family Income- Gini Coefficient.” The WorldFact Book. The Library. CIA. 2014. <https://www.cia.gov/library/publications/the-world-factbook/rankorder/2172rank.html>.
“Ecuador.” Country Profile. Data. UN Data, A World ofInformation. 2014. <http://data.un.org CountryProfile.aspx?crName=ECUADOR>.
“Ecuador.” Learn More about Trade in Ecuador. Observatoryof Economic Complexity. 2014. <http://atlas.media.mit.edu/profile/country/ecu/>.
“Ecuador Trade, Exports and Imports.” Economy WatchContent. March 15, 2010. <http://www.economywatch.com/world_economy/ecuador/export-import.html>.
“Ecuador.” World Factbook. Central Intelligence Agency.2014. <https://www.cia.gov/library/publications/the-world-factbook/geos/ec.html>.
“Education.” Colombia- Statistics. UNICEF. 2014.< h t t p : / / w w w . u n i c e f . o r g / i n f o b y c o u n t r y /colombia_statistics.html>.
“Education.” Ecuador- Statistics. UNICEF. 2014.< h t t p : / / w w w . u n i c e f . o r g / i n f o b y c o u n t r y /ecuador_statistics.html>.
“Education.” Venezuela- Statistics. UNICEF. 2014.< h t t p : / / w w w . u n i c e f . o r g / i n f o b y c o u n t r y /venezuela_statistics.html>.
“Field Listings: Labor Force by Occupation.” The WorldFact Book. 2014. CIA. <https://www.cia.gov/library/publications/the-world-factbook/fields/2048.html>.
Fisher, Max. “Map: US Ranks Near Bottom on IncomeInequality.” Global. The Atlantic.September 19, 2011. <http://www.theatlantic.com/international/archive/2011/09/map-us-ranks-near-bottom-on-income-inequality/245315/>.
“Government and Politics.” Colombia Table of Contents.US Library of Congress. <http://countrystudies.us/colombia/78.htm>.
Honlan, Matt. “How the World’s Wealth is Distributed.”GizMag. December 6, 2006. <http://www.gizmag.com/go/6571/>.
“In Good Faith: Ecuador’s New Constitution.” TheEconomist. October 2, 2008. <http://www.economist.com/node/12342501>.
“Kuznets, Simon.” The Concise Encyclopedia of Economics.Library of Economics and Liberty. 2014. <http://www.econlib.org/library/Enc/bios/Kuznets.html>.
Kuznets, Simon. Modern Economic Growth Findings andReflections. The American Economic Review, Vol. 63, No. 3.June 1973. <http://www.sfu.ca/~dandolfa/kuznets.pdf>.
Schommer, Timothy J. “Simon Kuznets’ Six Characteristicsof Development: A Case Study of Ghana.” InternationalEconomic Review: Post Recession Challenges andAnalyses. Page 346- 359. Matrix: 2012.
“Trade and Tariffs Graph.” Colombia. Country. InternationalTrade Centre. 2014. <http://www.intracen.org/country/colombia/>.
“Trade and Tariffs Graph.” Ecuador. Country. InternationalTrade Centre. 2014. <http://www.intracen.org/country/ecuador/>.
“Trade and Tariffs Graph.” Venezuela. Country. InternationalTrade Centre. 2014. <http://www.intracen.org/country/venezuela/>.
Todaro, Michael P. and Smith, Stephen C. EconomicDevelopment, Eighth Edition. Pearson Education Asia,2003.
“Venezuela.” Country Profile. Data. UN Data, A World ofInformation. 2014. <http://data.un.org/CountryProfile.aspx?c rName=VENEZUELA>.
“Venezuela.” Learn More about Trade in Venezuela.Observatory of Economic Complexity. 2014.<http://atlas.media.mit.edu/profile/country/ven/>.
“Venezuela” World Factbook. Central Intelligence Agency.2014. <https://www.cia.gov/library/publications/the-world-factbook/geos/ve.html>.

SCMS Journal o f Indian Managemen t , July - September 201 5 17
A Quarterly Journal
Literacy and Knowledge:Farmers’ Financial Inclusion
FeasibilityMichael Lalrinmawia and Hariom Gupta
Key Words : Financial Inclusion, Financial Literacy, Lunglei, Farmers
Abstract
inancial Inclusion is the ability of individuals toaccess appropriate financial products and services.It is the delivery of financial services at affordable
costs to sections of disadvantaged and low-incomesegments of society like farmers, daily labourers etc.
Rangarajan’s committee on financial inclusion defines it as:
“Financial inclusion may be defined as the process ofensuring access to financial services and timelyandadequate credit where needed by vulnerable groups suchas weaker sections and low incomegroups at an affordablecost.”
The United Nations (2006) defines it as, “A financial sectorthat provides ‘access’ to credit for all ‘bankable’ peopleand firms, to insurance for all insurable people and firmsand to savings and payment services for everyone. Inclusivefinance does not require that everyone who is eligibleshould use each of the services, but they should be able tochoose to use them if desired.”
Thus, financial inclusion is a provision of broad range offinancial services such as deposits, loans, payment
Financial Inclusion is the ability of individuals to access appropriate financial products and services. It is the delivery of
financial services at affordable costs to sections of disadvantaged and low-income segments of society like farmers, daily
labourers etc. But is financial inclusion alone enough to sustain the individuals to make sound financial decisions. Do
they possess adequate financial literacy and knowledge? In the light of financial inclusion, is there still a chance to
commit mistakes on the ground of financial fronts? So the question arises, is financial inclusion feasible without the
presence of financial literacy? The present study examines the level of financial literacy among farmers of Lunglei
district. A survey of 320 farmers all over the district of Lunglei had been conducted. This survey shows that farmers were
financially illiterate: as 86.56% have poor financial literacy, 9.38% have fair financial literacy and only 4.06% have
sound financial literacy.
Abstract
F
Michael LalrinmawiaAssistant ProfessorDepartment of CommerceHATIM, MizoramE-mail: [email protected]
Dr. Hariom GuptaAssistant ProfessorDepartment of CommerceMizoram UniversityE-mail: [email protected]: 08414960120

SCMS Journal o f Indian Management , July - September 201 5 18
A Quarterly Journal
services, money transfers and insurance to vulnerablegroups such as poor and low-income households and theirmicro-enterprises. By providing these services, the aim is tohelp the vulnerable groups to come out of poverty throughrapid and sustained poverty reduction.
RBI and Government of India have been actively pursuingthe road to financial inclusion for the past few years and areconvincing the financial service companies and banks toincrease their presence and operations in rural areas. Due totheir relentless efforts India is now growing towards attainingfull financial inclusions. But is financial inclusion aloneenough to sustain the individuals to make sound financialdecisions. Do they possess dequate financial literacy andknowledge? In the light of financial inclusion, is there still achance to commit mistakes on the ground of financial fronts?There has been little research on this topic and the fewstudies that have existed, suggested that the individuals donot possess the basic economic principles and that financialilliteracy is widely prevailing (Lusardi and Mitchell, 2006).Moreover, studies show that financial illiterate persons tendto borrow at a higher rate (Gartner and Todd, 2005; Stangoand Zinman, 2007; and Lusardi and Tufano, 2009). Theseindividuals are more likely to seek financial advice fromfamilies and friends and tend to abstain from participatingin formal financial system (Rooij et al., 2007)
So the question arises: is financial inclusion feasible withoutthe presence of financial literacy? In other words, canfinancial inclusion succeed without financial literacy? Willthe long term objective of the Government to bring everycitizen of the country into mainstream financial system behindered by the prevailing financial illiteracy?
The Organisation for Economic Co-operation andDevelopment/International Network on Financial Education)OECD/INFE has defined financial literacy as follows:‘Acombination of awareness, knowledge, skill, attitude andbehaviour necessary to make sound financial decisions andultimately achieve individual financial wellbeing.’
A large number of initiatives have been developed to addressthe issue of financial literacy/illiteracy. In India, the ReserveBank of India has been aggressively working to increasethe financial knowledge of the general population. TheReserve Bank of India has also introduced Financial Literacyand Counseling Centers (FLCC) to provide consumers withthe tools to make better credit choices sources (The ReserveBank of India, 2008). However, an RBI study shows littleawareness among people about these centers. The
education material at these centers also goes little beyondthe individual bank’s publicity material (Nayak, 2012).
Thus statistics on the current levels of financial literacy,areas of low financial capability and an identification to whichthese financial educations should be addressed are requiredto provide financial education effectively. For countries tohave efficient financial education and to evaluate the impacton the national level, the measurement of financial literacylevels must be a priority. Such a measurement exercise shouldallow policy makers to identify need areas in relation todifferent aspects of financial literacy and provide informationabout which groups of people need the maximum support(Atkinson and Messy, 2012).
Though a number of studies relating to financial literacyhave been conducted (Hudson, 2010), majority of them areconfined to the developed countries like the USA. Only afew studies with regard to developing countries like Indiahave been reported. The results of this financial literacysurvey could prove to be useful for financial educationinitiatives and evaluation of impact on such initiatives.Further it could provide guidelines for further research onthis field.
Review of literature
Thorat (2007) finds out that the financially excluded sectionslargely comprise marginal farmers, landless labourers, orallessees, selfemployed and unorganised sector enterprises,urban slum dwellers, migrants, ethnic minorities and sociallyexcluded groups, senior citizens and women. While thereare pockets of large excluded population in all parts of thecountry, the North East, Eastern and Central regions containmost of the financially excluded population.
Agrawal (2008) pointed out that behavioral aspects, non-price barriers, high cost and financial exclusion are the mainreasons why financial inclusion cannot happen on its ownand why policy need to be made to increase financialinclusion. For the success of financial inclusion, financialinclusion has to be sync with Real-sector inclusion and abroader approach than microcredit is needed.
Sangwan (2008) carried out an extensive study to estimatethe relationship between the percentage of adults havingsavings and credit accounts with the bank branch density,the literacy percentage and some other factors for 35 states/union territories in India and observed that there is a positivesignificant impact of branch density and negative but asignificant impact of literacy on financial inclusion.

SCMS Journal o f Indian Managemen t , July - September 201 5 19
A Quarterly Journal
However, Sarma and Pais (2010) reported that literacy ispositively and significantly associated with financialinclusion.
Dutta and Dutta (2012) also observed that with a given levelof literacy, increase in literacy percentage can further improvethe level of financial inclusion in that region.
Cole, S., T. Sampson, and B. Zia (2009) leave us with theirfindings that financial literacy is an important correlate ofhousehold financial behaviour, and household well-being.This provides further suggestive evidence that financialliteracy is important, and that educated consumers will makebetter decisions.
Moodithaya (2012) highlighted the factors which haveimpacts on financial exclusions or factors which providehindrances for financial inclusions. These factors are: a)Gender issues b) Age factors c) Legal identity d) Limitedliteracy e) Place of living f) Social security payments g) Bankcharges h)Terms and conditions i) Level of income j) Typeof occupation k) Psychological and cultural barrier. He alsoshows that the level of financial exclusion is the lowest inAndhra Pradesh with 18 percent and the highest inMeghalaya with 95.9 percent. It is worthwhile to know thatthe level of financial exclusion in Mizoram is 76.4 percent.
Xu and Zia (2012) summarize the findings of various financialliteracy studies conducted across the world and find thatfinancial literacy tends to peak among adults in the middleof the life cycle, and it is usually lowest among young peopleand the elderly.Their findings also show that financial literacyis associated with higher educational attainment and income.
Agarwalla et al.(2013) finds that despite the education levelsbeing high, it does not translate into adequate financialliteracy.This is likely to be due to absence of inputs relevantto financial literacy in the general education process.
Scope of the study
The study is restricted to Lunglei district, one of the eightdistricts of Mizoram. Lunglei is at a distance of about 165kilometres from Aizawl, having a district population of1,61,428 and a literacy rate of 88.86 per cent (Census ofIndia, Mizoram, 2011). The district is 4536 square kilometresin area with three notified towns and four rural developmentblocks. As per area wise classification, Lunglei is the largestdistrict in the state of Mizoram. The district is primarily
agrarian in character consisting of 45,439 cultivators, 10,662agricultural labourers, and 813 household industries.Though the district is served by nine branches of rural banks,six branches of State Bank of India besides a number ofcommercial banks like HDFC, Axis bank, Canara bank etc,financial inclusion continued to be a major challenge.Moreover 50% of the banks in the district are confined toLunglei town alone. More than 70% of the population ofLunglei district is comprised of farmers and cultivators whoare primarily deprived of banking facilities due to theirgeographical remoteness and other problems. Lungleidistrict comprises 33058 households in all, out of the total18943 rural households (57.30%) are in the district. Only2677 rural households (14.13%) consisting of 12777populations are within 5 kms of a bank. Thus 15816households which constitute 83.49% of the total ruralpopulation are outside the perimeter of 5 kms from any bankbranch. (Census of India,Mizoram, 2011).
There are nineteen banks in Lunglei district, out of whichonly seven banks are in the villages. Thus only 36.84% ofthe banks are in the rural areas. One hundred and seventytwo villages are located in Lunglei district (Reports onbaseline survey 2010, Lunglei District), but only sevenvillages are banked. Thus one hundred and sixty five villagescomprising 95.93% of the total rural areas remain unbanked.The ratio of unbanked villages to banked villages is 23.57:1.This alone provides a strong case for selection of Lungleidistrict for this study. The study focused farmers of Lungleidistrict. Since the number of farmers was practically infinitefor the study in hand, selected representatives for bankedand unbanked villages in each rural development blockswere taken.
Sampling
Lunglei is divided into four rural development blocks,namely, Lunglei RD block, Lungsen RD block, HnahthialRD block, and Bunghmun RD block. Households havingfarming (Agriculture/Horticulture) as their main occupationwere taken as the respondents. Multistage stratified randomsampling procedure for the selection of sample units wasdone. Each RD block is divided into two categories:Households within villages which are banked andhouseholds within villages which are unbanked. For theunbanked villages, Tawipui N 2 from Lunglei RD block,

SCMS Journal o f Indian Management , July - September 201 5 20
A Quarterly Journal
Zohmun from Lungsen RD block, Cherhlun from HnahthialRD block and Laisawral from Bunghmun RD block wereselected. For the banked villages/towns, Lunglawn fromLunglei RD block, Lungsen from Lungsen RD block,Hnahthial from Hnahthial RD block and Bunghmun fromBunghmun RD block were selected. From each categoryforty farming households were selected at random. Thusfrom each RD block eighty households were selected atrandom. From the four RD blocks three hundred and twentyhouseholds were taken for the sample data collection.
Thus three hundred and twenty farming households wereselected and the required information was collected fromthem personally with the help of a structured questionnaire.
Data Collection
The measure of financial literacy developed by OECD/INFE(2011) was employed. This measure consisted of twomodules: the first one measure basic financial literacy withquestions about inflation, compounding, interest effect, timevalue of money etc. The second module stress advancedfinancial knowledge with focus on topics such as stocksand bonds, working of stock markets, relationship betweeninterest rates and bond prices etc. The original questionnairewas modified to adapt to the conditions prevailing in thedistrict and thus the second module was omitted as it wasfelt that the farmers may not be able to answer manystatements related to financial markets.
The Questionnaire
There were twenty three statements in the questionnaireout of which fourteen questions were related todemographics of respondents such as age, family size,gender, marital status, educational level etc. This was donein order to ascertain whether there was any associationbetween demographic profile and financial literacy. Sevenquestions relate to categories of basic financial principles,time value of money, inflation, interest and compounding.Most of the statements have several response categories:do not know, irrelevant answer, wrong answer, the correctanswer. But in some cases, the statements are highlightedwith various types of financial products which therespondents have to state whether they have known aboutthe products. In these statements the response categorieswere ‘YES’ and ‘NO.’
Data Analysis
For the data analysis, the various response categories forfinancial literacy statements were given scores as follows:
1. For response categories with ‘YES’ and ‘NO’a. YES - 2b. NO - 1
2. For other response categoriesa. Correct answer - 3b. Do not know - 2c. Wrong answer - 1
More weightage was deliberately given to ‘Do not know’because it has been observed that individuals generallybelieve that they are far more financially literate than is reallythe case (OECD 2009); they are more likely to commit financialmistake. Thus I do not know something is definitely lessdangerous than not knowing something but still claimingthe opposite. With this scoring scheme, the respondentcould score a maximum of 42 and a minimum of 18.Respondents who score 35 and above (approximately 83per cent or more) were considered to have sound financialliteracy: the respondents, whose score ranges from 27-35(approximately 65 per cent to 83 per cent) were consideredto have fair financial literacy: those who scored below 27(approximately below 65 per cent) were considered to havepoor financial literacy. The same scoring scheme was appliedfor each category of statements like basic financial principles,time value of money, inflation, interest and compounding.Karl Pearson’s Chi-square test was applied for anyassociation between financial literacy and demographiccharacteristics of respondent farmers. A cross examinationof banked village and unbanked village for each RD blockwas also undertaken. All the analysis was carried out usingMS Excel and SPSS.
Analysis
Table 1 shows the demographic/economic profile of therespondents. The categories of information includeresidential location; whether the respondent is from a villagewhich has a bank or banks or whether the village is deprivedof banks, educational qualification, age, marital status,village/town population and family size. Out of 320 farmers,160 (50 per cent) were from villages which have a bank orbanks while the remaining half; 160 farmers (50 per cent)were from villages without banks. With regard to educationalqualification, out of 320 farmers, 214 farmers (66.88 per cent)were educated within the range of matriculation and below.

SCMS Journal o f Indian Managemen t , July - September 201 5 21
A Quarterly Journal
This category has wide variations as some of the farmers’educational level were as low as class III. 91 (28.44 per cent)were educated upto higher secondary level, while there wereonly 15 (4.68 per cent) graduates and none were educatedupto post-graduation level. 76 (23.75 per cent) farmers werefrom age group 35 and below, 137 ( 42.81 per cent) farmersbelonged to age group 36-50, and 107 (33.44 per cent) farmerswere more than 50 years old. 244 (76.25 per cent) were marriedwhile 30 (9.38 per cent) were yet to get married and 46 (14.37
per cent) were either divorced or widowed. 180 (56.25 percent) farmers came from villages/towns with population lessthan 500, 80 (25 per cent) farmers came from villages/townwith populations between 501-1500, 20 (6.25 per cent) camefrom villages with population between 1501 -2500 while 40(12.5 per cent) were from towns with population above 2500.In terms of family size, 229 (71.57 per cent) farmers had familysizes of 5 members or less while 91 (28.43 per cent) farmershad family sizes of more than 5 members.
Table1: Demographic/economic profile of respondents
Socio economiccategory
Category Number ofrespondents
Percentage
Residential location Banked village/town 160 50Unbanked village/town 160 50
Total 320 100EducationalQualification
Matriculation and below 214 66.88Higher Secondary 91 28.44
Graduation 15 4.68Post-graduation and above 0 0
Total 100 100Age 35 and below 76 23.75
36 – 50 137 42.81Above 50 107 33.44
Total 320 100Marital Status Married 244 76.25
Single 30 9.38Divorced/Widowed 46 14.37
Total 320 100Village/townpopulation
Less than 500 180 56.25501-1500 80 251501-2500 20 6.25
Above 2500 40 12.5Total 320 100
Family size Upto 5 229 71.57More than 5 91 28.43
Total 320 100
Table 2 shows the level of financial literacy among thesurveyed farmers with respect to the different categories ofstatements and the overall financial literacy. At an overalllevel, 13 farmers (4.06%) enjoyed sound financial literacy,30farmers(9.38%) had fair financial literacy, and 277 farmers(86.56%) had poor financial literacy. On breaking up intodifferent statement categories it was seen that the financial
literacy level were the highest with basic financial principlesbut only 30 (9.38%) have sound financial literacy while 245(76.56%) have poor financial literacy. The financial literacylevel fell in terms of time value of money and interest andcompounding where 290 (90.62%) have poor financial literacy.It further fell for inflation with 313 (97.81%) having poorliteracy knowledge. Financial literacy level was at its lowest

SCMS Journal o f Indian Management , July - September 201 5 22
A Quarterly Journal
ebb with financial products wherein 320 (100%) had poorfinancial knowledge.
Overall the participating farmers were generally financiallyilliterate (only 4.06% had sound financial literacy). The details
show that farmers tend to have a bit more literacy when itcomes to basic financial principles, and becomes lesser withregards to time value of money and interest andcompounding. With regard to financial products, all thefarmers have poor financial literacy.
Table 2: Financial Literacy among Farmers
Statement category Number of respondents havingSound financial
literacyFair financial
literacyPoor financial
literacyBasic financial principles 30 (9.38%) 45 (14.06%) 245 (76.56%)
Time value of money 30 (9.38%) 0 290 (90.62%)Inflation 0 7 (2.19%) 313 (97.81%)
Interest and compounding 30 (9.38%) 0 290 (90.62%)Financial products 0 0 320 (100%)
Overall financial literacy 13 (4.06%) 30 (9.38%) 277 (86.56%)
Table 3: Association between financial literacy and demographic variables
Socio economiccategory
CategoryFinancial Literacy
Pearson’s Chi-squareSound Fair Poor
Residentiallocation
Banked village/town 9 18 133 3.560.50<p<0.10Unbanked village/town 4 12 144
EducationalQualification
Up to matriculation 1 8 205 191.320.05<pHigher Secondary 2 18 71
Graduation 10 4 1Post-graduation and above 0 0 0
Age 35 and below 7 13 56 18.4520.05<p36 – 50 5 13 119
Above 50 1 4 102Marital Status Married 9 21 214 9.310
p<0.05Single 0 1 29Divorced/Widowed 4 8 34
Village/townpopulation
Less than 500 2 11 167 59.4050.05<p501-1500 1 4 75
1501-2500 4 3 13Above 2500 6 12 22
Family size Upto 5 8 17 204 4.5(0.05<p<0.2)More than 5 5 13 73
As mentioned earlier, chi-square test was applied to see theindependence/association between financial literacy and thedemographic variables.
With the predetermined alpha level of significance (0.05)
and our calculated value of χ² for the different demographicvariables it is found out that there is no association between

SCMS Journal o f Indian Managemen t , July - September 201 5 23
A Quarterly Journal
level of financial literacy and the residential location andmarital status. However, there exists an association withlevel of financial literacy and education qualifications.Farmers with higher level of education tend to have higherlevel of financial literacy. Similarly, there is strong associationbetween level of financial literacy and age, population andfamily size.
Conclusion
In the past few years it has been the attempt of variouscountries and governments to eradicate financial exclusionand to have hundred per cent financial inclusion. In Indiatoo, the government along with the RBI is relentlessly takinginitiative steps for achieving financial inclusion within thecountry. Banks and other financial institutions areencouraged to increase their presence and operations inunserved rural areas. The need to build inclusive financialsystem for economic development has been greatly stressedupon in the past decades. Actions and initiatives are beingundertaken to achieve these goals.
We however argue that the purpose will not be servedeffectively and efficiently if we simply include the individuals(farmers and other low income group) in the mainstreamfinancial system unless they are financially literate. Therehas been little research on this topic and the few existingstudies, most of which are restricted to developedeconomies, indicate that financial illiteracy is widespreadand individuals do not possess the knowledge of even themost basic economic principles. In fact, those who are notfinancially literate are the ones who tend to make the mostmistakes on financial decision making. The governmentsaround the world are becoming more interested in findingeffective approaches to improve the level of financial literacyamong their population (Atkinson and Messy, 2012).
Nowadays, measurement of financial literacy is widelyrecognised as a priority due to the fact that evidence on thecurrent levels of financial knowledge is required for providingfinancial education effectively.
A survey of 320 farmers all over the district of Lunglei hadbeen conducted. This survey shows that farmers werefinancially illiterate as 86.56% have poor financial literacy,9.38% have fair financial literacy and only 4.06% have soundfinancial literacy. Farmers tend to have a bit more literacywhen it comes to basic financial principles, and becomes
lesser with regard to time value of money and interest andcompounding. With regard to financial products, all thefarmers have poor financial literacy. Further analysis showsthat the level of literacy is not associated with residentiallocation and marital status of the farmer. However a strongassociation was seen between level of financial literacy andeducational qualifications, age, village/town population andfamily size of the farmers.
The findings can serve as a foundation for policy formationwith this regard and a benchmark for any training programmerelated to financial knowledge and skills to the farmers.
References
Agarwalla,S.K., S.K.Barua, J.Jacob, and J.R. Varma(2013).”Financial Literacy among Working Young inUrban India.” W.P. No. 2013-10-02, IIMA, October 2013.
Atkinson, A. and F. Messy (2012). “Measuring financialliteracy: Results of the OECD / International Networkon Financial Education (INFE) Pilot Study.” OECDWorking Papers on Finance, Insurance and PrivatePensions,OECD Publishing.
Cole, S., T.Sampson and B. Zia (2009).”Financial Literacy,Financial Decisions, and the Demand for FinancialServices: Evidence from India and Indonesia.”Working Paper 09-117. Retrieved fromhttp://www1.worldbank.org/prem/poverty/ie/dime_papers/1107.pdf.
Huston, S.J. (2010). “Measuring financial literacy.” Journalof Business Consumer Affairs, 44, 2, 296-316.
Lusardi, A. andO.Mitchell (2006). “Financial literacy andplanning: Implications for retirement wellbeing.”Retrieved from Http://upenn.edu/prc/PRC/WP/PRC%20WP%202006 1.pdf.
Lusardi, A. and P. Tufano(2009). “Debt Literacy, FinancialExperiences, and Overindebtedness.”Retrieved fromhttp://ideas.repec.org/p/nbr/nberwo/14808.
Nayak, U. (2012). “Financial inclusion can make littleheadway without efforts to further financial literacy.”Business Line, 19, 229, 8.
OECD (2009).”Financial literacy and consumer protection:Overlooked aspects of the crisis.” Retrieved from http:/www.oecd.org/finance/financial-markets/43138294.pdf
SCMS Journal o f Indian Management , July - September 201 5 24
A Quarterly Journal
OECD INFE (2011).”Measuring Financial Literacy:Questionnaire and Guidance Notes for conducting anInternationally Comparable Survey of FinancialLiteracy.” OECD, Paris. Retrieved from http://www.oecd.org/daf financial marketsinsuranceandpensions/financialeducation/49319977.pdf
Rooij, M., A.Lusardi, and R. Alessie(2007). “Financial literacyand stock market participation.” Retrieved from http://nber.org/papers/w13565.pdf
Reserve Bank of India (2008). “Financial literacy and creditcounseling centers.” Retrieved from http://rbi.org.in/scripts/PublicationDraftReports.aspx?I D=526.
Stango, V. and Zinman, J. (2007). “Fuzzy math, disclosureregulation and credit market outcomes.” Retrievedfromhttp://www.dartmouth.edu/~jzinman/Papers/Stango&Zinman_Bias&CreditDisclosure_nov07.pdf.
Xu, L. andB. Zia(2012). “Financial Literacy around the World:An Overview of the Evidence with PracticalSuggestions for the Way Forward.” Retrieved fromhttp://elibrary.worldbank.org/doi/pdf/10.1596/1813-9450-6107.
******
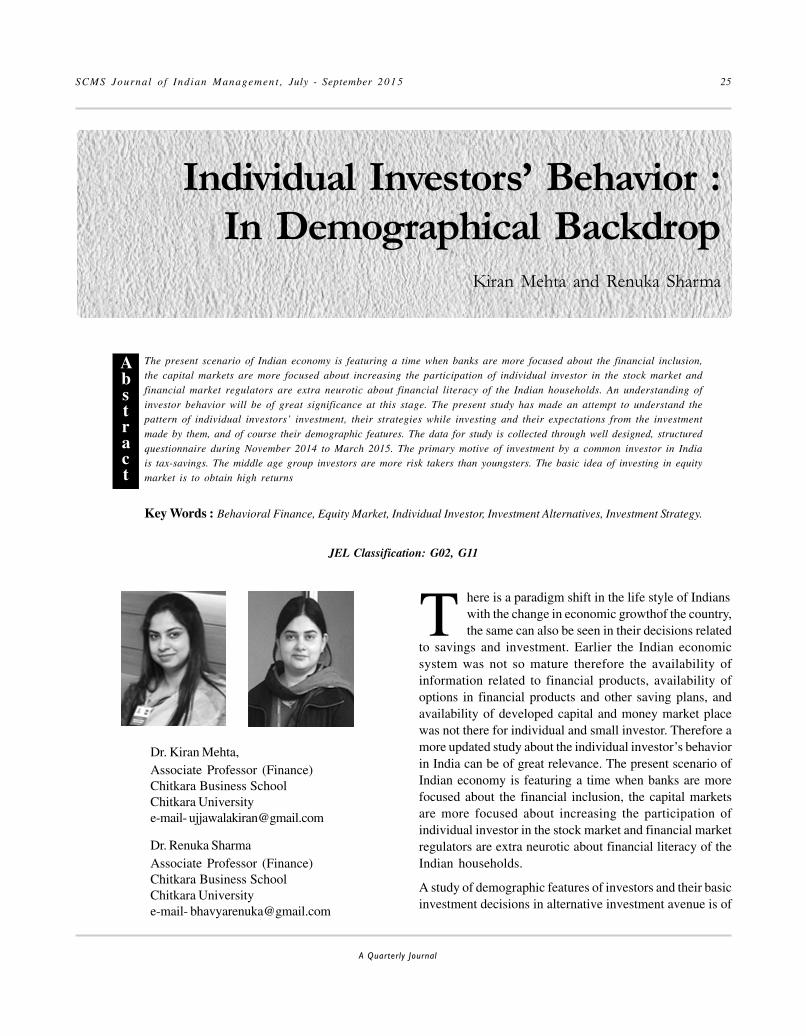
SCMS Journal o f Indian Managemen t , July - September 201 5 25
A Quarterly Journal
Individual Investors’ Behavior :
In Demographical BackdropKiran Mehta and Renuka Sharma
Abstract
Dr. Kiran Mehta,Associate Professor (Finance)Chitkara Business SchoolChitkara Universitye-mail- [email protected]
Dr. Renuka SharmaAssociate Professor (Finance)Chitkara Business SchoolChitkara Universitye-mail- [email protected]
here is a paradigm shift in the life style of Indianswith the change in economic growthof the country,the same can also be seen in their decisions related
to savings and investment. Earlier the Indian economicsystem was not so mature therefore the availability ofinformation related to financial products, availability ofoptions in financial products and other saving plans, andavailability of developed capital and money market placewas not there for individual and small investor. Therefore amore updated study about the individual investor’s behaviorin India can be of great relevance. The present scenario ofIndian economy is featuring a time when banks are morefocused about the financial inclusion, the capital marketsare more focused about increasing the participation ofindividual investor in the stock market and financial marketregulators are extra neurotic about financial literacy of theIndian households.
A study of demographic features of investors and their basicinvestment decisions in alternative investment avenue is of
The present scenario of Indian economy is featuring a time when banks are more focused about the financial inclusion,the capital markets are more focused about increasing the participation of individual investor in the stock market and
financial market regulators are extra neurotic about financial literacy of the Indian households. An understanding of
investor behavior will be of great significance at this stage. The present study has made an attempt to understand thepattern of individual investors’ investment, their strategies while investing and their expectations from the investment
made by them, and of course their demographic features. The data for study is collected through well designed, structured
questionnaire during November 2014 to March 2015. The primary motive of investment by a common investor in Indiais tax-savings. The middle age group investors are more risk takers than youngsters. The basic idea of investing in equity
market is to obtain high returns
Key Words : Behavioral Finance, Equity Market, Individual Investor, Investment Alternatives, Investment Strategy.
Abstract
TJEL Classification: G02, G11

SCMS Journal o f Indian Management , July - September 201 5 26
A Quarterly Journal
great significance in a country like India where thepopulation is quite large, role of women has increased infinancial decision making and income level of individualinvestor has also increased to a certain level. Consequentlya pool of even small savings and investment of thehouseholds can channelize huge amount of funds in theeconomy. Currently, the Indian financial environment hasthe following features.
� Indian financial sector has two broader segments,one is stock exchanges and the second is activenew issue market which are commonly known assecondary and primary markets respectively.
� In these segments (primary and secondary), debtand equity instruments are the most popularfinancial instruments and these instruments areopen for the investment by individual investor.
� The capital market plays a significant role inmobilization and allocation of domestic as well asforeign savings. The mobilization of funds isessential for the development of any countrybecause it boosts the capacity of the economy toproduce goods and services.
In a nut shell, it can be said that the capital market plays asignificant role in stimulating industrial growth leading toeconomic growth and development of a country but it mustbe done without making any compromise with the protectionof investors’ interest. In India, in spite of all efforts made bycapital market regulators, the participation and faith ofindividual investors is not found significant enough to takethe Indian capital market to next level of boom. Somethingmust have not been understood regarding the behavior andchoices of the Indian household investors by regulatorsand financial services providers in a right manner. Anunderstanding of investor behavior will be of greatsignificance at this stage as Indian capital market is expectedto touch new peak after the change in political scenariorecently.
A variety of empirical studies have been conducted in thecontext of investment behavior of Indian investors. All thesestudies have compiled various factors affecting investor’sbehavior in deciding their choices of investment alternatives.The theories of investment behavior are broadly categorizedinto economic theory and behavioral finance. The EconomicTheory of investment behavior says that the investment
decisions of an individual are termed as macroeconomicaggregate function and various microeconomic foundationsof these decisions are drawn from utility theory. The mostpopular proverbs of utility theory are: a) Investors areRational and risk averters, b) Investors are able to deal withthe complex choices and want to maximize their wealth. Asper these notions the investors want to select that portfoliowhich maximizes their expected returns (which is calledexpected utility of investment) while lowering or minimizingtheir risk. This theory is called mean-variance approach.Economists presume that when a person is given an optionto select a few from among a number of possible investmentalternatives, the person will prefer the one that yields highestutility. But the literature on the utility theory does not studythe individual investment behavior but it focuses on thedevelopment of the models that elaborate the marketbehavior. Behavioral finance is relatively new sub-disciplinewhich focuses on explaining the behavioral aspects of theinvestment decisions. It mingles the concepts of financialeconomics and cognitive psychology which is an attemptto structure a more detailed model of human behavior in thefinancial markets. As per this model, choices in the marketare available under uncertain conditions and informationstructure and various features of the market participantsthoroughly influence the individual’s investment decisions.Investor’s behavior in the financial markets is influenced byvarious psychological principles of decision making. It alsofocuses on how investors interpret the process and performson particular information floating in the financial market.The research in behavioral finance has concluded three mostimportant fundamental streams of investor behavior. Theseare Prospect Theory, Regret Aversion and Self Control. Allthese research streams noted and elaborated variousbehavior attributes of individual investor. As per thecognitive psychology of behavioral finance, the investorsmake systematic errors, they are overconfident and theymake decisions on their recent experience. But the role andparticipation of the individual investor is very important forboosting the financial strength of an economy.To maintainliquidity and efficiency in capital market, the transactionsby the individual investors are vital.
If one takes a glimpse of Indian capital market then it is clearthat it has expanded noticeably due to significant increasein the number of individual investors. And growth in capitalmarket in last few years has further increased this number ofindividual investors. Strong evidences for the increase in

SCMS Journal o f Indian Managemen t , July - September 201 5 27
A Quarterly Journal
the number of investors is not available but there is a roughestimate about the number of investors that it has beenincreased to 55 million. This increase in the number ofindividual investors in capital market has made it essentiallystimulating for the researchers to revamp a study tounderstand the various characteristics of the investors interms of their investments,strategies, expectations andrelating these features with their demographic features. Theinvestment avenues can be equity shares, mutual fundschemes, tax-saving bonds, bonds and debentures, realestate, gold, silver, pension funds, insurance schemes, bankdeposits (in the form of fixed deposits) and many more.Every investor has his/her own decision making criteria toselect a few investment avenues out of a given number ofavenues. Therefore,
� Decision making can be defined as the process ofselecting the best alternative from a number ofavailable alternatives.
� Same is the case in capital market where investorshave to make various decisions related to theirinvestments.
� In this process a proper evaluation is done for theavailable alternatives and an alternative whichgives maximum return is selected.
� Investment decision also involves the allocationof capital for the benefits to be received in thefuture. This benefit can be in the form of regularincome or capital gain or sometimes a combinationof both.
Succinctly, it can be said that even small investments by amassive pool of common investors can channelizesignificant amount of funds in financial markets.Considering the importance of investments by individualinvestors in an economic system, the present study has beendestined to understand the behavior of individual investorstowards various investment avenues available in Indianfinancial markets.
Literature Review
The past studies on investor behavior have focused onvery diverse aspects. Some have focused only on thedemographic profiles and investment behavior of individualinvestors. Other studies have focused only on a specificinvestment avenue and investor behavior. Some of the paststudies have specifically focused on individual investorbehavior differences on the basis of one aspect, viz., Gender
only or Income only or experience etc. A continuous researchis always on ramp studying the behavior of investors fromdifferent perspectives. Gupta, Jain, and Kulshreshtha (1994)studied the long term trend of the geographical distributionof the retail owners of shares, debentures and UTI units.Later on Rajarajan (1997a and 1997b) conducted two studiesand divided Indian investors on the basis of theirdemographical characteristics. After second study, it wasconcluded that the size of the investment in financial assetsgives significant information about the preferences of theinvestors for particular financial instrument and particularinvestment approach. Again, Rajarajan (1998) concluded thatas the investor moves up through various stages of lifecycle, the percentage of risky assets in his portfolio declines.Further in a study by Rajarajan (2000) it was founded thatlifestyle features such as segmentation variable gives achance for segmentation of investors and explain some realdistinction between individual investors and their financialservice needs. Gupta et al. (2001) conducted third All-Indiasurvey on household investors and investigatedhousehold’s preferences, future intentions and experiences,their perceptions and opinion about corporate management,regulators, credit rating agencies and auditors. Gupta andChoudhury (2001) critically evaluated Indian mutual fundindustry on the whole from investor point of view. In theirstudies it was further added that investors prefer fixed assetsportfolio when they have lower expected rate of return withlower risk bearing capacity and loss avoidance behavior(Rajarajan 2002-03). In another study, Rajarajan (2003)identified that there is strong association in the demographicfeatures and risk bearing capacity of the individuals.
In more recent studies, Maditinos et al. (2007) studiedindividual investor behavior and concluded that the majorityof the individual investors’ investment decisions are basedon information given in media, newspapers and noise in thefinancial market. AjmiJy.A. (2008) studied factors affectingthe risk tolerance of individual investor and concluded thatthe male investors are less risk averse than female investors,investors having less education are risk averse and agefactor is key factor in risk tolerance. Mittal M. and Vyas R.K.(2008) investigated the relationship between variousdemographic factors and the investment personalityrevealed by the investors. The empirical evidences of theirstudy suggested that demographic features like income,education and marital status influence an individual’sinvestment decision criteria. It was also revealed that Indianinvestors can be classified into four dominant personalities-Casual, Technical, Informed and Cautious. In the same year,

SCMS Journal o f Indian Management , July - September 201 5 28
A Quarterly Journal
a study by Waweru et al. (2008) examined the role ofbehavioral finance and investor psychology in investmentdecision making and recognized that certain behavioralfactors had an effect on the decision making behavior of theinvestors. Further, Shanmugasundaram and Balakrishnan(2009) concluded that investment related decisions are notguided by rationality or prudence, but the emotions, greedand insufficient information in stock market operations inthe highly overloaded information environment.Kabra, G.,Mishra, P.K. and Dash M.K. (2010) examined factors affectinginvestment behavior and their study concluded that ageand gender of the investors have main influence on the risktaking capacity of the investors.
Bennet and Selvam (2011) studied investors’ perception ofSocial, Political, Economic, Regulatory, Technological,Environmental and Legal (SPERTEL) risk on the value of theequity stock in the financial markets. The study concludedthat except for social factors between married and unmarriedinvestors, political, regulatory and legal factors for age andoccupations, all other factors have insignificant effect onthe investor’s investment decisions. Chaturvedi and Khare(2012) found that investors prefer bank deposits as theirfirst investment avenue. Harikanth and Pragthi (2012)concluded that income and occupation of the male andfemale investors have more impact on their investmentavenue selection criteria. Bhushan and Medury (2013)documented in their study that women investors are moreconservative than male investors.
The present study is aimed at building up a profile ofindividual investors (collected through a sample study) asper their demographic features to uncover the presentinvestment of investors and to classify the same on thebasis of gender, income and age of the investors. In additionto this, the current study has also made an attempt tounderstand the pattern of individual investors’ investment,their strategies while investing and their expectations fromthe investment made by them.
Sample Design
The present study is entirely based on the primary datacollected through well designed structured questionnaire.The data was collected from investors and period of thedata collection was November 2014 to March 2015. Datahas been collected from a sample of 750 individual investors.But a few respondents did not provide the full informationtherefore incomplete or otherwise unusable questionnaireshad been edited and discarded and finally data collectedfrom 621 respondents has been used for the purpose of
analyses. The lacking responses exposed at different stagesof the study are properly reflected in the tabular arrangementof data. The required data was collected from various Statesof North India. Both online and offline modes of datacollection were used to obtain desired information.
Questionnaire Design
A questionnaire consisting of ten questions other thanquestions on demographic details, was developed to collectthe required information about the individual investors. Allthese questions are designed to enquire about the presentinvestment patterns of individual investors, their equityinvestment strategies, investors’ expectations regardingreturns from equity, their reasons for investment in equityand investors’ awareness and reason to invest in derivativemarkets.
The present study used a structured questionnaire and thisquestionnaire was pre-tested on a sample of 40 individualinvestors before executing a thorough data collectionprocess. This pilot study was done to recognize and removeambiguous terms from the questionnaire and to check thereliability of various questions in the questionnaire.
Statistical Tools
The focal point of the present study is to bring out thedemographic characteristics of individual investors and theirinvestment behavior in India.Consequently the datacollected were analyzed using percentages and with this,possible cross sectional tables also have been used.
Findings of Study
The Table 1 has discussed the demographic features of thesample taken in present study. The age wise classificationhas shown that the majority of the respondents lie in theage bracket of 36-55 years. Only 22 (4%) respondents wereabove the age of 65. Out of a total of 621 respondents, morethan 70 percent respondents were males and 29.47% (183out of 621) respondents were females. The monthly incomeof approximately 69 percent respondents was found aboveRs. 20,000 per month and approx. 35% respondents werehaving more than Rs. 30,000 per month income.Approximately 70 percent respondents were found educatedor professionals. In addition to this, 20 percent respondentswere employed in government institutions, 30% were runningtheir own business and a small proportion of the samplerespondents were retired people. Therefore the demographicfeatures of the sample of 621 respondents cover wide rangeof options to discuss their investment behavior.

SCMS Journal o f Indian Managemen t , July - September 201 5 29
A Quarterly Journal
Table 1: Demographic Features of the Respondents
Age Group Count of Age of the respondent PercentageBelow 25 35 6
26-35 57 936-45 224 3646-55 217 3556-65 66 11
above 65 22 4Grand Total 621 100
Gender Count of Gender PercentageFemale 183 29.47Male 438 70.53
Grand Total 621 100
Income Per Month (Rs.) Count of Monthly Income PercentageUp to Rs 10000 86 14
Rs10000-Rs 20000 107 17Rs20001 to Rs 30000 208 33
Above Rs 30,000 220 35Grand Total 621 100
Education/Qualification Count of Educational Level PercentageGraduate 236 38.00
Non-graduate 124 19.97Other 55 8.86
Professional 206 33.17Grand Total 621 100
Employability Count of Occupation PercentageGovernment Service 125 20.13
Non-Government Service 165 26.57Other 22 3.54
Own Business 184 29.63Professional Practice 90 14.49
Retired 34 5.48Grand Total 621 100
The respondents of the present study have considered morethan one Investment Avenue for their investment. As shownin Table 2, the most preferred investment avenue of thesample investors is Tax-Saving bonds/schemes/funds,followed by investment in Gold & Silver and Real Estate.
The investment in Bank Deposits and Mutual Funds isrelatively least preferred by the investors. As said abovethat the respondents of the present research were investingin more than one Investment Avenue therefore the total ofmiddle column of Table 2 is more than 621.

SCMS Journal o f Indian Management , July - September 201 5 30
A Quarterly Journal
Table 2: Present Investment of Present Investors
Present Investment of Sample Investors No ofInvestments
%of Total
Equity Shares 238 13.57Mutual fund Schemes 210 11.97Tax-Saving bonds, schemes and Funds 408 23.26Gold & Silver 381 21.72Real Estate 314 17.90Bank Deposits (FDs) 203 11.57Total 1754 100
The following sections have thoroughly discussed theinvestment avenues considered by present investors onthe basis of their demographic features.
As depicted in Table 3, there is a great difference in thebehavior of investors on the basis of gender. The maleinvestors have picked different investment avenues incomparison to female investors. In case of some of theinvestment avenues, the behavior pattern of males is almostopposite to what female investors have preferred. Equityshares and mutual funds are highly preferred by the male
Table 3: Gender-Wise Classification of Present Investment
investors while these avenues are least preferred by femaleinvestors. The male investors have shown uppermost faithin Tax Saving bonds/ schemes and related funds, followedby Gold and Silver and then gave almost equal importanceto investment in Equity shares and Real Estate. But thefemale investors have considered Tax-Saving bonds,schemes and funds as their first choice followed byinvestment in Real Estate and Gold & Silver. The leastpreferred investment avenue for male investors is BankDeposits and for female investors, it is investment in equityshares and mutual funds.
Gender↓ Equity SharesMutual fund
Schemes
Tax-Savingbonds, schemes
and Funds
Gold &Silver
Real EstateBank Deposits
(FDs)
No % No % No % No % No % No %
Male 207 86.97 186 88.57 296 72.55 248 65.09 206 65.61 127 62.56
Female 31 13.03 24 11.43 112 27.45 83 21.78 108 34.39 76 37.44
Total 238 100 210 100 408 100 381 100 314 100 203 100
The age wise analysis of the data has given variousinteresting depictions. The age is generally correlated withrisk appetite of the investors. The same has also been noticedin Table 4. As shown in Table 4, the tax-saving bonds,schemes and similar funds are preferred most by Indianinvestors. No matter what is the age group of the investors,this investment avenue is chosen by majority of investorsin all age groups. Likewise the Indian investors have givendue importance to Gold and Silver as another preferredinvestment avenue. In case of age wise analysis of theselection of Investment Avenue, one interesting outcome is
also noticed. On an average, the investors below 25 yearsof age have invested in one investment avenue or two (insome cases), investors in the age bracket of 26-35 haveinvested in two investment avenues at a given point of time,in the age bracket of 35-45, three investment avenues areidentified for investment purpose, the next age bracket ofinvestors, i.e., 46-55 have picked four to five investmentavenues, 56-65 age bracket investors have preferred toinvest in three to four investment avenues and investorsabove 65 age have also been investing in three to fourinvestment avenues out of given six investment avenues.

SCMS Journal o f Indian Managemen t , July - September 201 5 31
A Quarterly Journal
These depictions indicate that the experienced investorsare more risk takers and considering more than fourinvestment avenues. The investors in the age bracket of 46-55 seem to be more strategic and decisive in making their
Table 4: Age-Wise classification of Present investment
portfolios in comparison to the young investors. Eveninvestors above 65 years of age are making better portfoliostrategies than the younger ones given in the followingtable.
AgeGroups ↓
Equity SharesMutual fund
Schemes
Tax-Savingbonds, schemes
and Funds
Gold &Silver
Real EstateBank Deposits
(FDs)
No % No % No % No % No % No %
Below 25 12 5.04 8 3.81 37 9.07 34 8.92 32 10.19 22 10.84
26-35 22 9.24 21 10.00 92 22.55 97 25.46 89 28.34 56 27.59
36-45 88 36.97 73 34.76 126 30.88 108 28.35 83 26.43 59 29.06
46-55 83 34.87 69 32.86 91 22.30 88 23.10 71 22.61 36 17.73
56-65 24 10.08 28 13.33 45 11.03 39 10.24 29 9.24 19 9.36
above 65 9 3.78 11 5.24 17 4.17 15 3.94 10 3.18 11 5.42
Total 238 100 210 100 408 100 381 100 314 100 203 100
The findings obtained on the basis of different incomegroups are also noteworthy. Investors from all incomegroups have also preferred to invest in tax-saving bonds/schemes and related funds in comparison to other options.The investors having income below Rs. 20000 monthlyincome have preferred to invest in Gold and Silver than tax-saving schemes. The investors having monthly income upto Rs. 10,000 has preferred to invest in equity shares whencompared with tax saving schemes. But in case of investorshaving monthly income above Rs. 20,000 have preferredprecious metals like Gold and Silver as second mostattractive investment avenue preceded by real estate and
then equity shares. Mutual funds are relatively leastpreferred by investors in all income groups. Here theclassification based on income has made it easy tounderstand that the Indian investors do invest for thepurpose of tax savings. The investors who do not fall in thecategory of income tax are probably giving relatively lessimportance to tax-savings schemes, bonds and funds butthose who have relatively higher income and expected tofall in the bracket of income tax payment, these investorshave preferred to invest in tax-saving schemes, bonds andfunds.
Table 5:Income-wise Classification of Present Investments
IncomeGroups↓
Equity SharesMutual fund
SchemesTax-Saving bonds,schemes and Funds
Gold &Silver
Real EstateBank Deposits
(FDs)No % No % No % No % No % No %
uptoRs10000
30 12.61 23 10.95 26 6.37 39 10.24 11 3.50 22 10.84
Rs10000-Rs 20000
42 17.65 37 17.62 67 16.42 82 21.52 73 23.25 41 20.20
Rs20001 toRs 30000
68 28.57 57 27.14 126 30.88 79 20.73 81 25.80 49 24.14
Above Rs30,000
98 41.18 93 44.29 189 46.32 181 47.51 149 47.45 91 44.83
Total 238 100 210 100 408 100 381 100 314 100 203 100

SCMS Journal o f Indian Management , July - September 201 5 32
A Quarterly Journal
Understanding Investment Strategy followed by Investors
As discussed above, the investment in equity is also one ofthe preferred investment avenue of Indian investors,therefore in the following sections, an attempt has beenmade to find out the reasons why Indian investors do investin equity stocks. As shown in Table 6, majority of the
Table 6: Sample Investors’ Equity Investment Strategy
investors hold their position in the equity stock till marketreaches a target level, many of them revise their target pricealso if there is a rise in the price of equity. Once the stockreaches to a target price, then the investors sell their shares.Many of them have said that they hold their positions forshort basis only which are generally less than a year andmany times it is just a few days or a few months.
Investment Strategy options No of Investors % of Total
Sell the shares within a few days or months or within a yearirrespective of the price level.
92 14.81
Sell the shares as soon as price reaches my target 304 48.95
Keep revising the target as price rises 147 23.67
Not interested in selling 78 12.56
Total 621 100
The above findings can further be generalized on the basisof the age group to which an investor belongs. Though aninvestor by and large has more than one strategy to survivein equity market but in most of the cases the investors fromdifferent age groups follow the strategy of selling the equitystock once it reaches a target level.The investors falling inthe age bracket of 36-45 and 46-55 are opting this strategymore aggressively. The investors in these age brackets aremore consistent in observing the performance of the marketand also revise their target prices whenever they find changein the performance of market benchmark. Very less number
of investors want to hold their position in equity stocks fora longer period of time (See Table 7).The income-wiseclassification of investment strategies of investors has alsosupported the above findings (See Table 8).
As a result it can be said that the Indian investors do notprefer to invest in equity for a longer period and they alwaysprefer to invest for a certain rise in the price of their equitystock and once it reaches the target price level then theinvestors sell the stocks and after that they switch toinvestment in other equity stocks.
Table 7: Age based Classification of investment Strategy
InvestmentStrategies/Age
Below25
% ofTotal
26-35
% ofTotal
36-45
%of
Total
46-55
%of
Total
56-65
% ofTotal
above65
% ofTotal
Total
Sell the shares within afew days or months orwithin a year irrespectiveof the price level.
2 1.69 9 10.17 37 40.68 33 35.59 6 6.78 5 5.08 92
Sell the shares as soon asprice reaches my target
20 6.54 23 7.48 119 39.25 102 33.64 28 9.35 11 3.74 304
Keep revising the targetas price rises
10 6.67 16 11.11 39 26.67 56 37.78 23 15.56 3 2.22 147
Not interested in selling 3 3.7 9 11.11 29 37.04 26 33.33 9 11.11 3 3.7 78
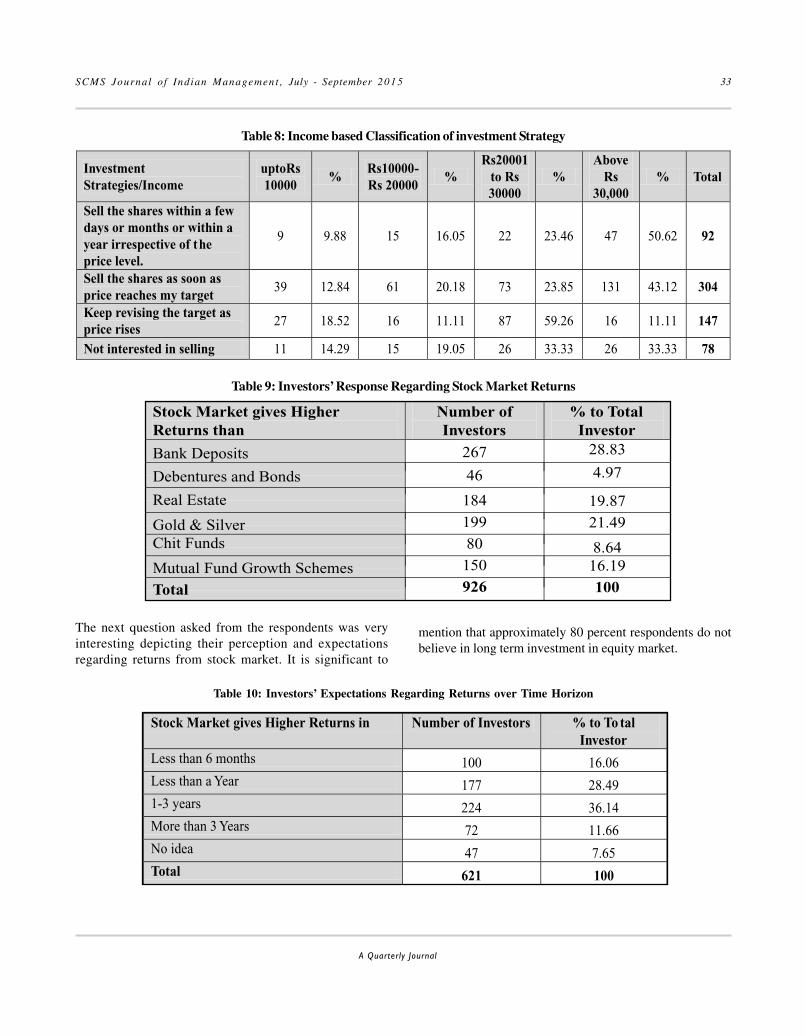
SCMS Journal o f Indian Managemen t , July - September 201 5 33
A Quarterly Journal
InvestmentStrategies/Income
uptoRs10000
%Rs10000-Rs 20000
%Rs20001
to Rs30000
%Above
Rs30,000
% Total
Sell the shares within a fewdays or months or within ayear irrespective of theprice level.
9 9.88 15 16.05 22 23.46 47 50.62 92
Sell the shares as soon asprice reaches my target
39 12.84 61 20.18 73 23.85 131 43.12 304
Keep revising the target asprice rises
27 18.52 16 11.11 87 59.26 16 11.11 147
Not interested in selling 11 14.29 15 19.05 26 33.33 26 33.33 78
Table 8: Income based Classification of investment Strategy
Table 9: Investors’ Response Regarding Stock Market Returns
Stock Market gives HigherReturns than
Number ofInvestors
% to TotalInvestor
Bank Deposits 267 28.83
Debentures and Bonds 46 4.97
Real Estate 184 19.87
Gold & Silver 199 21.49Chit Funds 80 8.64Mutual Fund Growth Schemes 150 16.19
Total 926 100
The next question asked from the respondents was veryinteresting depicting their perception and expectationsregarding returns from stock market. It is significant to
Table 10: Investors’ Expectations Regarding Returns over Time Horizon
mention that approximately 80 percent respondents do notbelieve in long term investment in equity market.
Stock Market gives Higher Returns in Number of Investors % to To talInvestor
Less than 6 months 100 16.06Less than a Year 177 28.491-3 years 224 36.14More than 3 Years 72 11.66No idea 47 7.65Total 621 100

SCMS Journal o f Indian Management , July - September 201 5 34
A Quarterly Journal
Majority of the investors look for quick and higherreturns from their investment. The same has beendocumented in the finding of the current study. Theinvestors want to earn a lot from their investors. Agood number of investors preferred a hassle freeinvestment avenue. Many other investors wait for fall
in interest rate to leverage their portfolio and to earnbetter return on their investment. A small number ofinvestors do invest for satisfying their pride instinctsand still some investors love to play a game of gamblingrather than a rational investment.
Table 11: Investors’ Ranking for the Reasons for Investment in Stock
Reasons Number of Investors % to TotalInvestor
Fall in interest rate 129 17.20Quick and Higher returns 202 26.93
Hassle free investment 189 25.20Pride of Ownership 61 8.13
Satisfy gambling instincts 40 5.33Any Other (Please specify) 129 17.20
Total 750 100
And at the end regarding awareness and participation inderivative market, more than 40 percent investors are awareabout the derivative market but they were not participating
very actively. Only 18 percent of investors were participatingin derivative market.
Table 12
Conclusion and Implications
From the findings of the current study, it can be generalizedthat the present study is descriptive in nature and destinedto know the behavior of common individual investors in aspecificregion in India. The findings of the study havedocumented the following evidences.
• The primary motive of investment by a commoninvestor in India is tax-saving.
• The middle age group investors are more risk takersthan youngsters.
• The basic idea of investing in equity market is toobtain high returns.
• Majority of investors classified on the basis ofincome and age prefer to hold their position inequity stocks till the price of equity stocks reachesa target level. Once the stock price touches thistarget price, the investors prefer to take a shortposition.
• Majority of investors do not prefer to hold theirposition in equity for long term. They prefer to sell
Awareness about Derivative Market
Yes 250 40.19
No 371 59.81Participate in Derivative Market
Yes 130 20.98
No 491 79.02

SCMS Journal o f Indian Managemen t , July - September 201 5 35
A Quarterly Journal
the equity stock as soon as it reaches to a certainpre-decided target price.
• The mutual funds are not very popular investmentavenue among the common investors.
• Only a few investors prefer to hold their positionin equity for long term and showed lesser interestin selling the stocks. Majority of such investorsare of middle age group and were lying in incomebracket of Rs. 20,000-40,000 per month.
• Majority of the common investors have awarenessregarding the existence of derivative instrumentsbut these investors do not prefer to invest in theseinstruments.
Implications of the Study
� After tax-saving instruments, the Indian investorsare more attracted towards real estate and preciousmetals like Gold. The reason is obvious, consideringthe historical performance of real estate, gold andequity the common investors believe that the equityreturns are higher than bank deposits and returnon bonds but real estate and gold has shown betterInvestment Avenue than investment in equitystocks. Moreover the behavior of investor alsovaries on the basis of their gender, income, agegroup etc. Therefore for promoting any kind offinancial product or Investment Avenue, theinvestor’s mindset needs to be understood on thebasis of gender and other demographic features.
� The findings of the study can be used by the AMCsand other portfolio/fund managers to strategizetheir tax-saving funds to common investorsbecause tax-saving is the primary objective ofinvestors in India specifically in Punjab region.
� One important implication for regulators andfinancial institutions to fulfill their CSR forupgrading the knowledge base of common investoris that the investor awareness must be increasedto understand the fundamentals behind equityinvestment so that the investment by commoninvestor could serve as a more productive capitalfor the financial system.
� The findings of the study also strengthen theevidences obtained from more recent studies oninvestor behavior (discussed under the heading
‘Literature Review’) that the demographic featuresspecifically gender based categorizationsignificantly affect the selection of investmentalternatives out of available bouquet.
Limitation of the Study
As far as the limitation of the study is concerned it can berelated to the number of the sampled investors. More than70 percent of questionnaires were got filled with the referenceof depository participants, share brokers and investorassociates; hence the sample investors are mostly thosepersons who are considered relatively active in the marketand are expected to be aware about the financial marketenvironment. Therefore the individual investor, who is notinvesting through the brokers and mutual funds or not apart of investor association, is not the part of the study.
References
AjmiJy, A. (2008).”Risk Tolerance of Individual Investors inan Emerging Markets.”International ResearchJournal of Finance and Economics, 17(2), 15-26.
Bennet, E. and M.Selvam (2011).”Investors’ perceptiontowards the influence of SPERTEL risks on the valueof equity shares: A Study conducted at CoimbatoreCity.”International Journal of Research in ComputerApplication and Management, 1(2), 61-65.
Bhushan, P. and Y.Medury (2013).”Gender Differences inInvestment Behaviour among Employees.”AsianJournal of Research in Business Economics andManagement,3(12), 147-157.
Chaturvedi, M. and S. Khare (2012).”A Study of savingpattern and investment preferences of individualhousehold in India.”International Journal ofResearch in Commerce & Management,3(5), 115-120.
Harikanth, D. and B. Pragathi (2012).”Role Of BehaviouralFinance In Investment Decision Making- A Study OnSelect Districts Of Andhra Pradesh,India.”International Journal in Multidisciplinary andAcademic Research(SSIJMAR), 1( 4), 1-15.
Gupta, L. C. (1959).”An Enquiry into the Ownership Patternof Industrial Share in India.”The Indian EconomicReview, August, 1959.
Gupta, L. C. (1969).”The Changing structure of IndustrialFinance in India.” Clarendon Press, Oxford, 154-157.

SCMS Journal o f Indian Management , July - September 201 5 36
A Quarterly Journal
Gupta, L. C. (1992). “Stock Exchange Trading in India:Agenda for Reforms.”Society for Capital MarketResearch and Development, New Delhi.
Gupta, L. C. (1993) “Mutual Funds and Assets Preference:Household Survey (2nd Edition).”Society for CapitalMarket Research and Development, New Delhi.
Gupta, L. C. and Utpal K. Choudhury (2001).“How Good areMutual Funds: The Household Investor’s Perception.”Society for Capital Market Research andDevelopment, New Delhi.
Gupta, L. C., C. P. Gupta and Naveen Jain (2001).”IndianHouseholds investment Preferences.”Society forCapital Market and Research Development, NewDelhi.
Gupta, L. C., Naveen Jain and YashKulshreshtha(1994).”Shareholders’ Geographic Distribution.”Society for Capital Market Research and Development,New Delhi.
IDBI (1985).“Ownership Pattern of Shares and Debenturesof IDBI Assisted Companies,” as in 1982 Monograph,Bombay, IDBI, 1985.
Kabra, G., P.K. Mishra and M.K. Dash (2010).”FactorsInfluencing Investment Decision of Generations inIndia: An Econometric Study.”Asian Journal ofManagement Research, 4(2), 305-326 .
Maditinos, D., Z. Sevic, and N. Theriou (2007).”Investorsbehavior in the Athens stock exchange.”Student’sEconomics & Finance, 24(1), 32-50.
Mittal, M. and R. K. Vyas (2008).”Personality type andinvestment choice. An empirical study.”The ICFAIUniversity Journal of Behavioral Finance, 5(3), 6-22.
NCEAR (1961). “Savings in India.” New Delhi, NationalCouncil of Applied Economic Research, April 1961.
NCEAR (1962).“Urban Income and Saving.”NationalCouncil of Applied Economic Research, Delhi, July1962.
NCEAR (1964).“Attitude Towards and Motivations forSaving.”National Council of Applied EconomicResearch, Delhi, July 1964, pp.22.
NCEAR (1965).“All India Household Survey: Saving,income and Investment Vol. II.”National Council ofApplied Economic Research, Delhi, July 1965.
NCEAR (1980).“Household Income and ItsDisposition.”National Council of Applied EconomicResearch, Delhi, 1980.
Rajarajan, V. (2002-03).“Determinants of portfolio Choice ofindividual investor.” The Indian Economic Journal,50(1), July-September, 81-84.
Rajarajan, V. (2003).“Investors-Demography and RiskBearing Capacity.”Finance India, XVII (2), June 2003.
Rajarajan, V. (1997a).Chennai Investor is ConservativeBusiness Line (Madras), February, P.20.
Rajarajan, V. (1997b).“Investment Size based Segmentationof Individual Investors.”Management Researcher,3(3&4), January-June, 27-36.
Rajarajan, V. (1998). “Stages in Life Cycles and InvestmentPattern.” The Indian Journal of Commerce, 51(2&3),April-September, 27-36.
Rajarajan, V. (2000).”Investors’- Life Style and InvestmentCharacteristics.”Finance India, XIV(2), June, 465-478.
RBI (1962). “Survey of Ownership of Shares in Joint StockCompanies as at the End of December 1959.”ReserveBank of India Bulletin, Reserve Bank of India, May,677-685.
RBI (1983). “Survey of Ownership of Shares in Joint StockCompanies as at the End of December 1978.”ReserveBank of India Bulletin, Reserve Bank of India,February, 69-128.
RBI (1955).“Survey of Ownership of Shares and Securities-Bombay City.”Reserve Bank of India Bulletin, ReserveBank of India, February, 116-124.
Shanmugasundaram, V. and V. Balakrishnan(2009).“Behavioral biases of investors in capitalmarket.”South Asian Journal of Socio PoliticalStudies, 10(1), 99-102.
Waweru, N. M., M. Evelyneand E. Elliana (2008).“The effectsof behavioral factors in investment decision making:A survey of institutional investor operating at theNairobi Stock Exchange.” International Journal ofBusiness and Emerging Markets, 1(1), 29-41.
******

SCMS Journal o f Indian Managemen t , July - September 201 5 37
A Quarterly Journal
Investors’ Perception towards
Alternativeness and Preferences
N. S. Pandey and P. Kathavarayan
Key Words : Investors, alternatives, perception, investment, mutual funds.
Abstract
his study deals with the behaviour of the investorsin Puducherry region to find the better investmentavenues. An understanding of the main concepts
and a thorough analysis of the options available can helpan investor create a portfolio that maximizes returns whileminimizing risk exposure. The main investment purposesare increasing the rate of return and also reducing the risk.Additional objectives like safety, liquidity and hedge againstincrease in risk are also considered here. Now-a-days a widerange of investment opportunities are available to theinvestor. These are mainly bank deposits, bonds, mutualfunds, pension plans, life insurance, and equity shares. Allthese options compete with each other for attracting theinvestors. All instruments have their own returns, risks,liquidity and safety. The investors tend to match their needswith the features of the instrument available for investment.They have varied degrees of preferences for differentsavings vehicles. Each investor tends to keep some cashbalance and maintain a certain amount in the form of bankdeposit to meet his/her immediate requirements and
This paper examines the investment preference towards Mutual Fund (MF) and other investment alternatives. It deals
with investment preference of shares, debentures, mutual funds, bank deposits and insurance policies. The investigation
is conducted through primary data with a sample of 100 respondents from Puducherry region, using convenience
sampling technique. The main objective of this study is to find out preference of investors about different investment
alternatives. The perception of investment and investors’ awareness level of MF as investment option have been analysed
and interpreted. The data has been collected through interview schedule from the selected respondents. Multiple regression
analysis, Chi-square and percentage analysis have been used. The results of the study show that Chi-square analysis is not
significant. The Regression analysis shows that gender, education and income are significant towards mutual funds.
Abstract
T
Dr. N. S. PandeyAssistant ProfessorPG and Research Department of CommerceKanchi Mamunivar centre for PG studiesEmail:[email protected]
Mr. P. KathavarayanDoctoral Research ScholarPG and Research Department of CommerceKanchi Mamunivar centre for PG studiesEmail:[email protected]
JEL Classification: G81, G11, G14

SCMS Journal o f Indian Management , July - September 201 5 38
A Quarterly Journal
protective needs. In the case of salaried people, contributionto Employees Provident Fund (EPF) becomes compulsory.Life Insurance is generally preferred to face situations arisingout of untimely deaths of the bread earner of the family. Thedisposable income after meeting the statutory requirements/commitments constitutes savings and here arises the needof selecting a good investment options.
Review of literature
Mane and Bhandari (2014) in “A Study of investor’sawareness and selection of different financial investmentavenues for the investor in Pune City,” discusses why mostinvestors prefer to park their funds in avenues like BankDeposits, Life insurance, Mutual Funds and Gold.
Raheja and Lamka (2013) in the study titled “Behaviour ofinvestors towards investment” prove that people withdifferent age groups prefer different investment options fordifferent objectives behind investment.
Bhatt, Brahma, P. S. Raghu Kumari, and Shamira Malekar(2012) in the study titled “A Study of Investor Behavior onInvestment Avenues in Mumbai Fenil” aimed to understandthe investment behaviour and it proves women are attractedtowards investing in gold than any other investmentavenues. Most of the investors are in the habit of discussingthe options with their family and friends before making anyinvestment decision.
Singh (2012) in his article “A study on investors’ attitudetowards mutual funds as an investment option” proves thatout of 250 respondents 71 respondents have a positiveattitude, 117 respondents have a neutral attitude, and 62respondents have a negative attitude towards the mutualfunds.
Geetha and Ramesh (2011) in “A Study on People’sPreferences in Investment Behaviour” show most of therespondents are unaware about stock market opportunitiesand most of the investors preferred life insurance policies.
Objectives of the study
• To find out investment preferences towards thevarious investment alternatives,
• To analyse impact of demographic variables onawareness towards mutual funds,
• To analyse the impact of demographic variableson awareness towards other investmentalternatives, and
• To study the perception of investors in choosinginvestment options.
Hypotheses
• Ho1: There is no significant impact of demographicvariables on investment preferences.
• Ho2: There is no significant impact of demographicvariables on awareness about mutual funds.
• Ho3: There is no significant association betweendemographic variables and awareness about otherinvestments.
• Ho3.1: There is no significant association betweenage and awareness about other investments.
• Ho3.2: There is no significant association betweengender and awareness about other investments.
• Ho3.3: There is no significant association betweeneducation and awareness about other investments.
• Ho3.4: There is no significant association betweenoccupation and awareness about other investments.
• Ho3.5: There is no significant association betweenannual income and awareness about otherinvestments.
Methodology
The source of the data for the study has been collectedfrom primary sources. A study was conducted to collect theprimary data from the selected respondents in Puducherryand the study is focused on investment preferences. Thetotal number of sample size is 100. Adopting conveniencesampling method, the data were collected through interviewschedule from the selected respondents. Data were analysedthrough statistical tools like percentage analysis, MultipleRegression analysis and chi-square.

SCMS Journal o f Indian Managemen t , July - September 201 5 39
A Quarterly Journal
Table 1 : Demographic profile of Respondents
STATUS RESPONDENTS PER CENTAGE %Gender
MaleFemale
8416
8416
Total 100 100Age
21-25 years26 to 30 yearsabove 31 years
333829
333829
Total 100 100Education
SSLCHigher secondary
UGPG
Others
99
44362
99
44362
Total 100 100Occupation
GovernmentPrivate sector
Self-employmentOthers
1748278
1748278
Total 100 100Annual income
Below `100000`100000 to `300000
Above `300000
325711
325711
Total 100 100
Table 1 shows that 84 per cent respondents are male and 16per cent are female. The highest percentage of therespondents is 38 per cent which is between 26-30 yearsage group followed by 33 per cent comes between 21-25years, and remaining 29 per cent belong to above 31 yearsof age. The education of the respondents having 44 percent as graduate followed by 36 per cent post graduate, 9
per cent each SSLC and HSC and 2 per cent under others. Inoccupation 48 per cent respondents belong to private sectorjob, 27 per cent self-employment, 17 per cent governmentemployees, and remaining 8 per cent in other profession.The annual income of the respondents 57 per centrespondents are between ̀ 1, 00,000 and ̀ 3, 00,000, 32 percent below ̀ 1, 00,000, and 11 per cent respondents belongto above ` 3, 00,000.

SCMS Journal o f Indian Management , July - September 201 5 40
A Quarterly Journal
Table 2 : Investment preferences
Investment preferencesSl.no Alternatives Respondents Percentage%
1 Bank deposit 24 242 Life insurance 13 133 Mutual fund 18 184 Post office saving 6 65 Shares and debenture 10 106 Gold and silver 14 147 Real estate 8 88 PF 7 7
Total 100 100
Table 2 shows that, 24 per cent respondents prefer to investin bank deposit, 18 per cent to invest in mutual funds, 14 percent to invest in gold and silver, 13 per cent to invest in lifeinsurance, 8 per cent to invest in real estate, 7 per cent toinvest in PF and remaining 6 per cent to invest in post officesaving.
I. Investment preferences towards the various investmentalternatives
Table 3
Influence of investors’ demographic variables (Independentvariable) and investment preference (Dependent variable)were analysed with multiple regression analysis. Thedemographic variables like age, gender, occupation, annualincome, and education on investment preferences towardsthe various investment alternatives were considered foranalysis (Y=a+b
1x
1+b
2x
2+b
3x
3+b
4x
4+b
5x
5).
Sl.no Variance
UnstandardizedCoefficients
StandardizedCoefficients
t Sig.B Std.err BetaInvestmentpreferences
5.039 1.634 3.085 .003
1 Age .319 .312 .109 1.024 .3082 Gender -1.834 .642 -.292 -2.857 .005**3 Education -.200 .278 -.081 -.720 .4734 Occupation .178 .279 .064 .637 .5255 Annual income .063 .398 .016 .151 .881
R2 .127Adjusted R2 .081F statistical 2.734
.Regression is significant at the 0.01 level
Table 3 depicts that age, education, occupation and incomeshow non-significant towards investment preferenceswhereas gender is significant at 1% level of significance, itmeans gender affects the investment preferences. F statisticsresult shows that it is not significant at 1% level ofsignificance. The multiple regression analysis has beencarried out, the demographical variable on investment
Source: Primary Data
preferences, the model significant value (p value <0.05) inthe model is significant p value (.003), it means there issignificant impact between demographic factors andinvestment preferences towards the various investmentalternatives, therefore Ho1 “there is no significant impact ofdemographic variables on investment preferences”
is
rejected.

SCMS Journal o f Indian Managemen t , July - September 201 5 41
A Quarterly Journal
II. To analyse the various impact of demographic factors onawareness towards mutual fund
Influence of investors’ demographic variables (Independentvariable) on awareness level towards mutual funds (
Table 4
Dependent variable) was analysed with multiple regressionanalysis. The demographic variables like age, gender,occupation, annual income, education on awarenesstowards mutual fund was considered for analysis(Y=a+b
1x
1+b
2x
2+b
3x
3+b
4x
4+b
5x
5).
Sl.no Variance
UnstandardizedCoefficients
StandardizedCoefficients
t Sig.B Std.err BetaAwareness level 3.984 .576 6.913 .000
1 Age .116 .110 .098 1.057 .2932 Gender -.511 .226 -.200 -2.257 .026**3 Education -.389 .098 -.388 -3.962 .000***4 Occupation .147 .098 .131 1.495 .1385 Annual income .386 .140 -.257 -2.749 .007**
R2 .343Adjusted R2 .308F statistical 9.794
.Regression is significant at the 0.05 level
Table 4 analyses the demographic variables and its relationto awareness level. Multiple regression analysis was carriedout to find out the impact of demographic variables onawareness level towards mutual funds and the modelsignificant value is (p value <0.05) in the model is highly
Source: Primary Data
III. To analyse the impact of demographic variables on awareness about other investment alternatives
Table 5 : Association between age and awareness about other investment alternatives
significant p value (.000). It means there is significant impactbetween demographic factors (gender, education, annualincome) on awareness towards mutual funds, therefore Ho2
“there is no significant impact of demographic variables onawareness about mutual fund” is rejected.
Results of the chi-square test
Source: Primary Data
Degree of freedom 6Calculated value 15.4772
Table value 1per cent level 16.812
Awareness level
Age Total awareness Good awareness Unaware Totally unaware Total
21-25 years 6 24 3 0 33
26-30 years 11 15 6 6 38
Above 31 8 7 8 6 29
Total 25 46 17 12 100

SCMS Journal o f Indian Management , July - September 201 5 42
A Quarterly Journal
Table 5 depicts that the calculated value of chi-square 15.4772is less than the table value 16.812 at 1% level of significance,
Table 5.1 : Association between Gender and awareness level
that “there is no significant association between the ageand awareness about other investment,” Ho3.1 is accepted.
Awareness level
Gender Total awareness Good awareness Unaware Totally unaware TotalMale 19 37 16 12 84
Female 6 9 1 0 16
Total 25 46 17 12 100
Results of the chi-square test
Source: Primary Data
Degree of freedom 3Calculated value 5.8834
Table value 5 per cent level 7.815
Table 5.1 shows that the calculated value of chi-square 5.8834is less than the table value 7.815 at 5% level of significance,that “there is no significant association between the gender
Table 5.2 : Association between Education and awareness level
and awareness about other investment.” Hence Ho3.2 isaccepted.
Awareness level
Education Total awareness Good awareness Unaware Totally unaware TotalSSLC 0 0 4 5 9
HSE 2 1 4 2 9
UG 12 19 9 4 44PG 11 25 0 0 36
Others 0 1 0 1 2Total 25 46 17 12 100
Results of the chi-square tests
Source: Primary Data
Degree of freedom 12Calculated value 58.48
Table value 5 per cent level 21.026
Table 5.2 depicts that the calculated value of chi-square 58.48is more than the table value 21.026 at 5% level of significance,
that “there is a significant association between the educationand awareness about other investment.” Hence Ho3.3 isrejected.
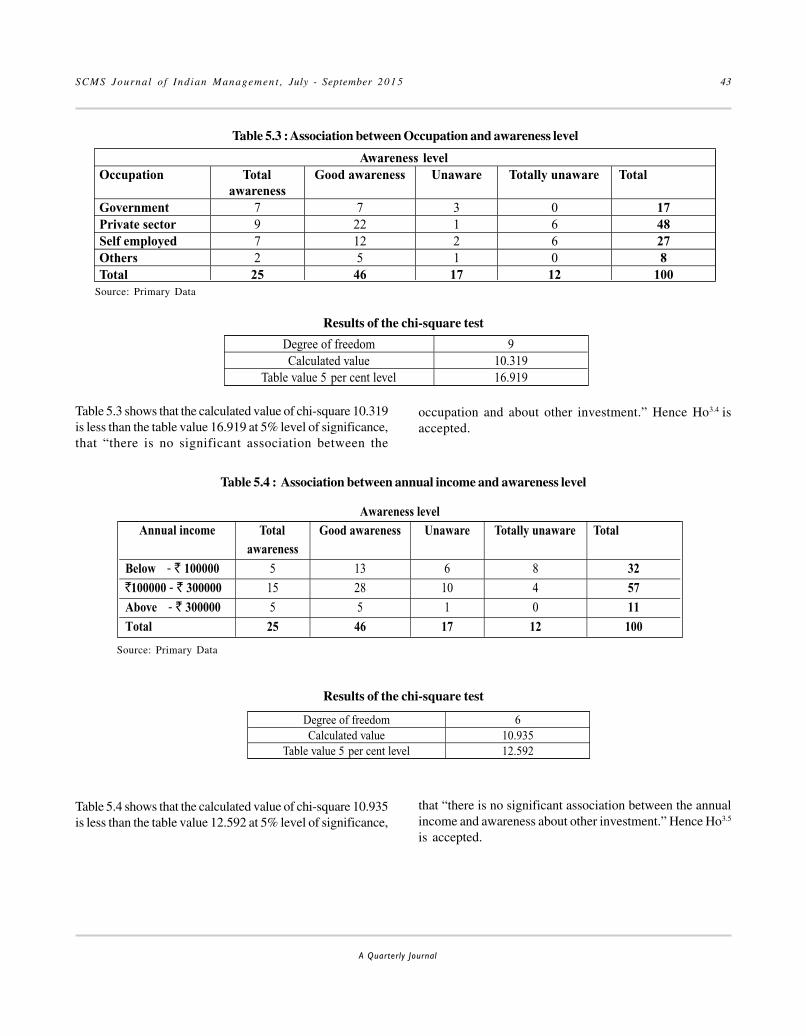
SCMS Journal o f Indian Managemen t , July - September 201 5 43
A Quarterly Journal
Table 5.3 : Association between Occupation and awareness level
Awareness levelOccupation Total
awarenessGood awareness Unaware Totally unaware Total
Government 7 7 3 0 17Private sector 9 22 1 6 48Self employed 7 12 2 6 27Others 2 5 1 0 8Total 25 46 17 12 100
Results of the chi-square test
Source: Primary Data
Degree of freedom 9Calculated value 10.319
Table value 5 per cent level 16.919
Table 5.3 shows that the calculated value of chi-square 10.319is less than the table value 16.919 at 5% level of significance,that “there is no significant association between the
Table 5.4 : Association between annual income and awareness level
occupation and about other investment.” Hence Ho3.4 isaccepted.
Awareness levelAnnual income Total
awarenessGood awareness Unaware Totally unaware Total
Below - ` 100000 5 13 6 8 32`100000 - ` 300000 15 28 10 4 57
Above - ` 300000 5 5 1 0 11Total 25 46 17 12 100
Results of the chi-square test
Source: Primary Data
Degree of freedom 6Calculated value 10.935
Table value 5 per cent level 12.592
Table 5.4 shows that the calculated value of chi-square 10.935is less than the table value 12.592 at 5% level of significance,
that “there is no significant association between the annualincome and awareness about other investment.” Hence Ho3.5
is accepted.
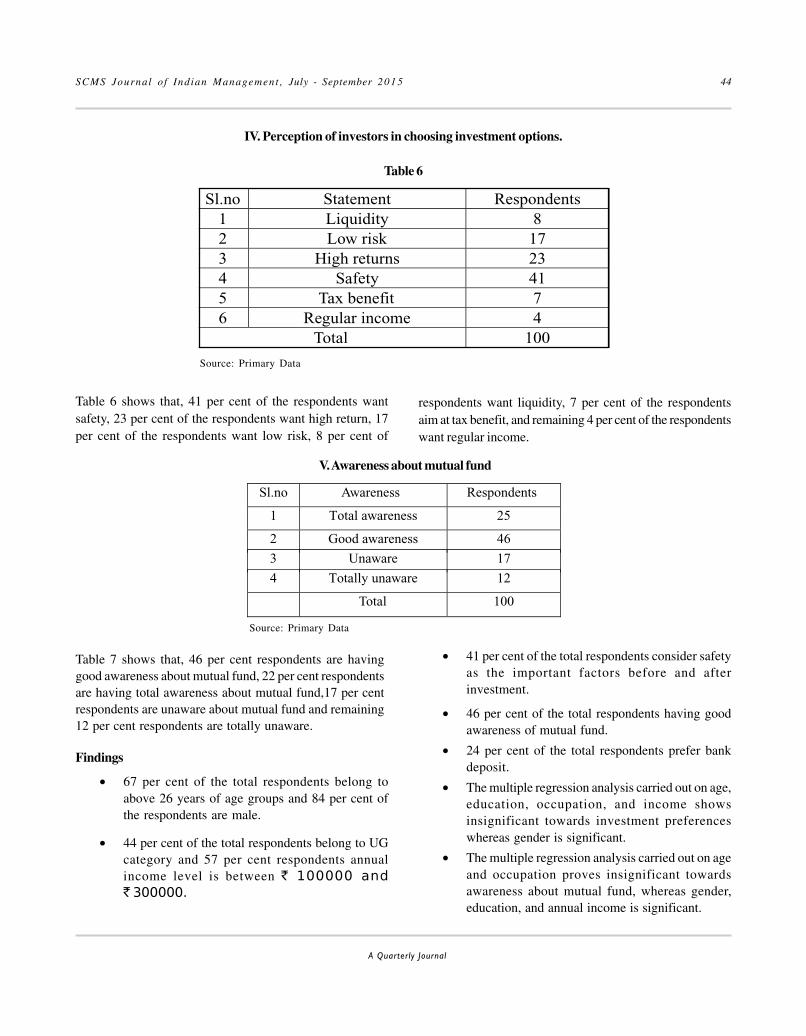
SCMS Journal o f Indian Management , July - September 201 5 44
A Quarterly Journal
IV. Perception of investors in choosing investment options.
Table 6
Sl.no Statement Respondents1 Liquidity 82 Low risk 173 High returns 234 Safety 415 Tax benefit 76 Regular income 4
Total 100
Table 6 shows that, 41 per cent of the respondents wantsafety, 23 per cent of the respondents want high return, 17per cent of the respondents want low risk, 8 per cent of
Source: Primary Data
V. Awareness about mutual fund
respondents want liquidity, 7 per cent of the respondentsaim at tax benefit, and remaining 4 per cent of the respondentswant regular income.
Sl.no Awareness Respondents
1 Total awareness 25
2 Good awareness 46
3 Unaware 17
4 Totally unaware 12
Total 100
Table 7 shows that, 46 per cent respondents are havinggood awareness about mutual fund, 22 per cent respondentsare having total awareness about mutual fund,17 per centrespondents are unaware about mutual fund and remaining12 per cent respondents are totally unaware.
Findings
• 67 per cent of the total respondents belong toabove 26 years of age groups and 84 per cent ofthe respondents are male.
• 44 per cent of the total respondents belong to UGcategory and 57 per cent respondents annualincome level is between ` 100000 and
` 300000.
Source: Primary Data
• 41 per cent of the total respondents consider safetyas the important factors before and afterinvestment.
• 46 per cent of the total respondents having goodawareness of mutual fund.
• 24 per cent of the total respondents prefer bankdeposit.
• The multiple regression analysis carried out on age,education, occupation, and income showsinsignificant towards investment preferenceswhereas gender is significant.
• The multiple regression analysis carried out on ageand occupation proves insignificant towardsawareness about mutual fund, whereas gender,education, and annual income is significant.
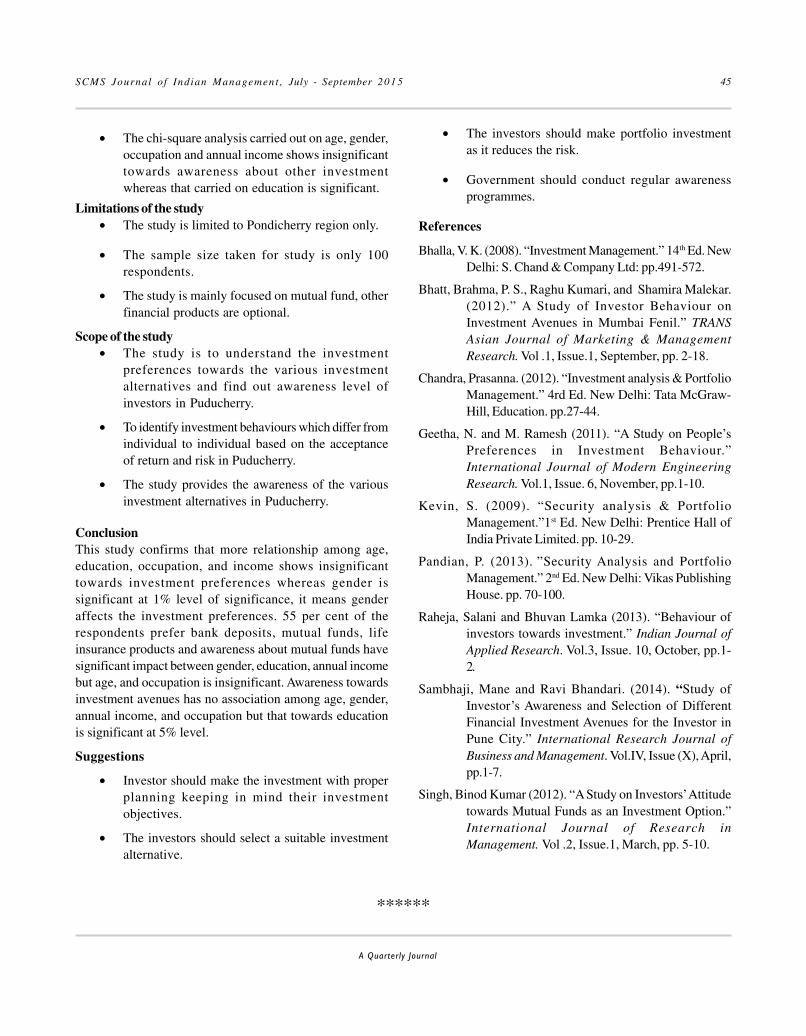
SCMS Journal o f Indian Managemen t , July - September 201 5 45
A Quarterly Journal
• The chi-square analysis carried out on age, gender,occupation and annual income shows insignificanttowards awareness about other investmentwhereas that carried on education is significant.
Limitations of the study• The study is limited to Pondicherry region only.
• The sample size taken for study is only 100respondents.
• The study is mainly focused on mutual fund, otherfinancial products are optional.
Scope of the study• The study is to understand the investment
preferences towards the various investmentalternatives and find out awareness level ofinvestors in Puducherry.
• To identify investment behaviours which differ fromindividual to individual based on the acceptanceof return and risk in Puducherry.
• The study provides the awareness of the variousinvestment alternatives in Puducherry.
ConclusionThis study confirms that more relationship among age,education, occupation, and income shows insignificanttowards investment preferences whereas gender issignificant at 1% level of significance, it means genderaffects the investment preferences. 55 per cent of therespondents prefer bank deposits, mutual funds, lifeinsurance products and awareness about mutual funds havesignificant impact between gender, education, annual incomebut age, and occupation is insignificant. Awareness towardsinvestment avenues has no association among age, gender,annual income, and occupation but that towards educationis significant at 5% level.
Suggestions
• Investor should make the investment with properplanning keeping in mind their investmentobjectives.
• The investors should select a suitable investmentalternative.
• The investors should make portfolio investmentas it reduces the risk.
• Government should conduct regular awarenessprogrammes.
References
Bhalla, V. K. (2008). “Investment Management.” 14th Ed. NewDelhi: S. Chand & Company Ltd: pp.491-572.
Bhatt, Brahma, P. S., Raghu Kumari, and Shamira Malekar.(2012).” A Study of Investor Behaviour onInvestment Avenues in Mumbai Fenil.” TRANSAsian Journal of Marketing & ManagementResearch. Vol .1, Issue.1, September, pp. 2-18.
Chandra, Prasanna. (2012). “Investment analysis & PortfolioManagement.” 4rd Ed. New Delhi: Tata McGraw-Hill, Education. pp.27-44.
Geetha, N. and M. Ramesh (2011). “A Study on People’sPreferences in Investment Behaviour.”International Journal of Modern EngineeringResearch. Vol.1, Issue. 6, November, pp.1-10.
Kevin, S. (2009). “Security analysis & PortfolioManagement.”1st Ed. New Delhi: Prentice Hall ofIndia Private Limited. pp. 10-29.
Pandian, P. (2013). ”Security Analysis and PortfolioManagement.” 2nd Ed. New Delhi: Vikas PublishingHouse. pp. 70-100.
Raheja, Salani and Bhuvan Lamka (2013). “Behaviour ofinvestors towards investment.” Indian Journal ofApplied Research. Vol.3, Issue. 10, October, pp.1-2.
Sambhaji, Mane and Ravi Bhandari. (2014). “Study ofInvestor’s Awareness and Selection of DifferentFinancial Investment Avenues for the Investor inPune City.” International Research Journal ofBusiness and Management. Vol.IV, Issue (X), April,pp.1-7.
Singh, Binod Kumar (2012). “A Study on Investors’ Attitudetowards Mutual Funds as an Investment Option.”International Journal of Research inManagement. Vol .2, Issue.1, March, pp. 5-10.
******
SCMS Journal o f Indian Management , July - September 201 5 46
A Quarterly Journal
Airport Passengers:
Their Needs and Satisfaction
Key Words : Airport Infrastructure, Customer Needs and Satisfaction, Facilities and Services
Abstract
Rajiv GuptaSr. Associate ProfessorNational Institute of Construction Management AndResearchNational Academy of Construction, NAC CampusHyderabad – 500033, Telangana State, IndiaEmail: [email protected]
Prof. Vunnam VenkaiahFormer Vice ChancellorKrishna University, MachlipatnamAndhra Pradesh State University.Email: [email protected]
he world over,privatisationof airports has seen thetransition of airports from being mere interchangehubs for different modes of transportation to
dynamic spaces for passengers to relax, stay over, shop,enjoy leisure and recreation activities, and also travel. Thishas led to emergence of newer needs which go beyond thefunctional needs associated with air travel. In India, the lastdecade has witnessed a major change in the role of theairports and the services provided by the private sectorairports under the Public Private Partnership arrangements.The Ministry of Civil Aviation, Government of India, in itsreport of 2012 policy for modernisation and expansion ofthe airport infrastructure, has stressed upon the fact thatairports should be built to international standards and shouldprovide certain pre-decided service standards. The airportstoo in their quest for higher revenues have accorded duerecognition to a customer centric approach by providing allthe necessary infrastructural facilities and services that apassenger requires to pass through an airport. The provisionof all the necessary facilities and services is dictated by thefunctional requirements of movement of passengers throughan airport as well as the custom and usage norms prevailingat different airports.
In India, the Public Private Partnership airports have improved the standard of airport services and facilities. The
research questions addressed are - what is the importance passengers attach to the various needs provided by an airport?
Does an airport which has consistently obtained high service quality ratings satisfy its passengers’ needs? Primary data
about 65 needs was collected from 502 passengers of Rajiv Gandhi International Airport (RGIA) at Hyderabad City, India
and empirically analysed. The study finds that psychological needs of security are most important to an air traveller and
that there is overall satisfaction of his need at RGIA.
Abstract
T
Rajiv Gupta and VunnamVenkaiah

SCMS Journal o f Indian Managemen t , July - September 201 5 47
A Quarterly Journal
Changing Role of Airports
Betancor and Rendeiro (1999) point out that traditionallyairports have been owned and operated by central or localgovernments, including, in some instances, even through abranch of the army. Airport infrastructure was commonlybelieved to be a public utility, which supported this type ofproperty arrangement. However, due to public budgetconstraints and efficiency concerns, consideration of thistype of model has occurred, and nowadays the range ofpossibilities for private sector involvement in airports maybe as wide as the range of airport activities themselves.
They further state that airports are complex and multi-product enterprises. An airport is a system that serves awide range of needs related to the movement of personsand things world-wide. Its development depends upon fourcrucial elements: passengers and goods that circulatethrough its terminals; its physical, social and economicenvironment; its nature as a productive and businessgenerator unit; and agents that operate in it, mainly airlinesand franchisees of commercial services. Activities carriedout at an airport may be classified in to three distinctgroups:essential operational services and facilities,handling services and commercial activities. Operationaland handling services are commonly referred to asaeronautical services, and the commercial activities areconsidered as non-aeronautical services. Essentialoperational services include the air traffic control system,meteorological services, telecommunications, police andsecurity, fire, ambulance and first aid services, and runways,aprons, taxiways, grounds and buildings maintenance.These activities determine the degree of safety in airportoperations, and hence, are considered essential and at thecore of the airport business. Handling services refer to agreat variety of activities - those that are directly related tothe aircraft (ground and ramp handling), such as cleaning,the provision of power and fuel, and the loading andunloading of luggage and freight; and those that are moretraffic related (traffic handling), such as the processing ofpassengers, baggage and freight through the terminalbuilding. Commercial services involve a large variety ofdifferent activities that may be located either at the terminalbuilding or around the airport. Duty free shops and otherretail shopping, restaurants and bars, leisure services, hotelaccommodation, banks, car rental and parking services, andconference and communication facilities are examples of the
myriad of activities that are included in the non-aeronauticalset of airport operations.
According to Doganis (1992), the arrival of the private sectorinto airport operations has led to what is called thecommercial airport model, where the infrastructure isregarded as a business opportunity, and as such somethingbeyond a traditional airport. Meetings, visitors,employees,local residents, and local businesses and industries wouldalso be important potential customers for airport commercialservices. From this point of view, greater the involvement ofthe private sector in airport activities, the greater theimportance of non-aeronautical sources of revenue.
Government of India Policy
Accelerated economic growth, aided by expansion of airservices in a competitive environment, has manifested itselfin a rapid increase in air traffic. For providing connectivityto regions hitherto not served by commercial flights, it isnecessary to expand the network of air services by settingup new airports. Some of the State Governments have alreadytaken steps for setting up Greenfield airports. Examples inthe past include Cochin, Hyderabad and Bangalore whereGreenfield airports have been commissioned with the activesupport and participation of the respective StateGovernments. The policy relating to setting up of Greenfieldairports has since been liberalised by the Central Governmentand several new projects are being planned in differentstates.The airport sector has been witnessing significantinterest from both domestic as well as foreign investorsfollowing the policy initiatives taken by the CentralGovernment to promote Public Private Partnerships (PPP)on Design, Build, Finance, Operate and Transfer (DBFOT)basis. The Ministry of Civil Aviation recognises that thefuture aviation sector prospects will depend on adoption ofa comprehensive policy and regulatory frame work necessaryfor addressing the complexities of PPP, and particularly forbalancing the interests of users and investors.
The Strategic plan (2010-15) of the Ministry of Civil Aviation,Government of India states that during the last decade thecivil aviation sector has grown at a phenomenal pace andIndia has emerged as the 9th largest civil aviation market inthe world. It also stresses upon continuously engaging theindustry and all stakeholders to understand the needs ofthe users and service providers for formulation ofprogressive policies.

SCMS Journal o f Indian Management , July - September 201 5 48
A Quarterly Journal
Rajiv Gandhi International Airport (RGIA), Hyderabad,India
According to RGIA Hyderabad airport website, RGIA hasthe distinction of being India’s first Greenfield Airport tohave become operational. It is promoted by GMR HyderabadInternational Airport Limited (GHIAL), a joint venturecompany of the GMR Group (63%) in partnership withGovernment of India (13%), Government of Telangana (13%)and Malaysia Airports Holdings Berhad (11%). TheCompany was incorporated to design, finance, build, operateand maintain a world class Greenfield airport at Shamshabad,named as Rajiv Gandhi International Airport (RGIA),Hyderabad. RGIA was commissioned in a record time of 31months and inaugurated on March 14, 2008, with an initialcapacity of 12 million passengers per annum (MPPA) and150,000 tons of cargo handling capacity per annum. Theairport has the flexibility to increase its capacity toaccommodate over 40 MPPA which is to be developed in aphased manner.
The airport is located strategically at the geographical centreof India within two hours flying time to all Indian majorcities. It is also well positioned globally within a five hourradius from all major cities in the Middle East and SouthEast Asia. Currently, there are 21 passenger airlines and 5Cargo Airlines operating from RGIA.
The airport terminal is spread over an area of 1,17,000 squaremeters with 96 check-in counters, 42 immigration countersand additional counters for “visa-on-arrival” facility. It has42 stands and 2 boarding bridges, 4 nos. baggage claimbelts and car parking capacity of 3200 nos. RGIA has anintegrated Passenger Terminal Building (PTB) havingmodular design for future expansion and is equipped withmultiple contact boarding bridges, remote stands, commonuser terminal equipment (CUTE), check-in desks, self-check-in kiosks, immigration counters and a transit hotel.At theforecourt of Passenger Terminal Building, ‘Airport Village’provides ample facilities for shopping and recreation, areafor ‘meeters and greeters,’dedicated parking facility, etc.Passenger facilities at the PTB also include Porter Service,free Wi-Fi, Multi cuisine food court, Airport Lounges withnight stay option, Children play area, Medical centre, Bank/ATM, Forex, facilities for baby care, transfer assistance,State Road Transport originating destination long distancebus services, free shuttle service for movement within theairport, taxi services, over-night stay facilities of dormitoriesand single rooms, general store, duty free shopping andcanteen etc. Its future plans are for developing India’slargest Airport City (Aerotropolis) spread over 1,500 acres.
RGIA has been consistently rated amongst the best airportshaving been ranked amongst the Best 3 airports in the worldin 5-15 MPPA capacity 6 times from 2009 to 2014. RGIA statesthat it has raised the bar in terms of facilities and servicesfor passengers, reflected by the significant progress madein the Airports Council International’s (ACI) survey ofAirport Service Quality(ASQ) score since 2009, when thescore was 4.44 (out of 5). RGIA on its website has affirmedthat its consistent accomplishment reflects RGIA’sunflinching endeavour to constantly strive to deliver serviceexcellence and offer the best to the travellers from all acrossthe globe. It has also received several other internationalawards for being the best airport in India and 4th and 8th bestin Asia in its category.
It was only in 2015 that the airport has logged a recordcapacity handling of 10 million passengers in a year.However, the fact is that the ASQ survey capturespassengers’ satisfaction with the airport services but leavesout passengers’ satisfaction of sufficiency in meeting allthe needs. The ASQ survey recognises that smaller airportsmay differ in some respects from their larger counterparts,but what they have in common is the need to understandtheir passengers and deliver the kind of quality servicesthat maximize spending of the passenger. The ASQ Surveyrates an airport’s performance in 34 key service areas andincludes eight major categories such as access, check-in,security, passport/personal ID control, finding your way,airport facilities, arrivals services, and airport environment.But the point is that we have to look beyond this and askourselves:what is the importance passengers attach to thevarious needs provided by an airport? Does an airportwhich has consistently obtained high service qualityratings satisfy its passengers’ needs? This, it is assumedwill help in creating a more customer centric bouquet ofproviding various facilities and services at Indian airports.
Review of Literature - Understanding Passengers’ Needs
Several researchers have identified the importance accordedto customer needs by customer centric organizations.Toombs et al.(1995) determined that forging a company thatis truly oriented towards the customer requires specificknowledge of the corporation’s external customers and theirtrue needs. Cream (2009) mentions that value needs to beperceived and created by meeting and exceeding the needsof both the business to business partner of airlines andairport passengers and that customer driven perceptions ofthe airport and service quality are paramount, in particular
SCMS Journal o f Indian Managemen t , July - September 201 5 49
A Quarterly Journal
in the current environment where value for money andservice is important. ACRP Report (2008) mentions thatairport terminal landside facilities evolve in response tochanges in travellers’ needs and industry development andregulation. New functions, services, and processes must beaccommodated as they appear even when the facility wasnot originally designed for the purpose.Increases inpassenger and baggage screening, provisions for self-service check-in, blast protection, an aging population,persons with disabilities, and the need to improve intermodalconnections are among the various functions, services, andprocesses that are currently necessitating design invention.To address such demands, some airports have movedfunctions from their traditional locations, reallocated spacewithin the terminal, converted and reconstructed facilities,or created new types of facilities. Such changes have variedimpacts on passengers’ experience, airlines’ relationshipswith their customers, and airport revenues and costs.Research isneeded on the interface between various airportterminal landside elements (e.g., garages,roads, curbs,terminals) to identify improved ways of accommodating newairport terminal functions.
GAO Report (2013) states that “Development at the airport”refers to existing infrastructure already in place and theactions of airport operators to enhance the viability of theirairport by focusing on commercial activities to increaseairports’ aeronautical and non-aeronautical revenue.
As airport operators seek to attract revenue from passengersand visitors, they are renovating their terminals or improvingtheir physical designs to improve the flow of people to theshops, concessions, and gates. The operators are alsoincreasing the number and quality of retail and services—such as wine bars, massage spas, health care clinics, andhigh fashion shops—offered to passengers and, in somecases, visitors from the local area.
Cotton (2007) in the context of providing service at anairport; states that the most pressing challenge for an airportis to enhance the quality of the passenger experience. Mosttravellers want short wait times, easy navigation throughthe airport and their baggage to arrive quickly.Strongcustomer focus is a competitive advantage in the air travelindustry, and because airports are the gateway to air travel,they can have a large impact on improving the customerexperience, helping to increase non-aeronautical revenue.In relation to a year 2025 outlook he further states thatairports are evolving to play different roles in the wider
ecosystem of the communities they serve. Driven by thecomplexity of shifting needs, the airport industry is adaptingitself by developing different models, each meeting adifferent combination of needs. Some travellers wish toexperience the airport almost as a destination unto itself,with many options for leisure and entertainment, dining,fitness and shopping. Others want a more minimalistexperience, moving as quickly as possible through theairport before and after their flight. Still others may needextra assistance to navigate through an airport. Thechallenge for the airport is to deliver the experience thateach type of passenger wants, consistently and cost-effectively, despite the inherent complexity in meeting a widevariety of needs. The magnitude of this challenge willincrease over time as passenger volumes continue to rise.
Rahman(2004) reinforces the thought that researchingcustomers’ requirements and developing /marketingproducts (goods/services) commensurate with the needsconstitutes a well-documented strategy for achievingsustainable advantage on an ongoing basis.
Traditionally, customer service analysis is carried out bydividing the overall service into various service elements(or attributes) and conducting a survey among customers(or a representative sample thereof) to obtain a rating of theimportance of these service elements.
The results of such a survey are then submitted to statisticalanalysis by which the service elements and the customerbase can be classified into useful groups (service dimensionsand customer segments respectively). After ascertaining thecustomers’ needs and the prevailing competitive situation,possible competitive advantages and disadvantages andareas of potential improvement are identified.
Bahia and Nantel (2000) state that linear scales havingtypically five or seven grades varying, e.g. from notimportant to very important and are often used in the surveyquestionnaires. Using these kinds of measures implies apresumption of linearity of the effect of service elements oncustomer satisfaction. By linearity, it is meant that customersatisfaction is supposed to vary in proportion to the changein service level of any service element. Under thisassumption, the order of importance of service elements isan adequate measure for assessing the improvementpotential of customer service.
Wang and Ji (2010) researched customer needs based onKano’s model. They emphasise that customer needs have

SCMS Journal o f Indian Management , July - September 201 5 50
A Quarterly Journal
become a primary concern for companies which compete inthe global market and that companies put their effort intomeeting customer needs or requirements and achievingcustomer satisfaction to remain competitive in the market.Kano’s model proposed by the Japanese professor NoriakiKano and his colleagues is a useful tool to understandcustomer needs and their impact on customer satisfaction.The model helps to ascertain the extent to which a given setof functions and features of a product satisfies customers’needs. By doing so, the model therefore, assists in (i)evaluating the efficacy of an existing product to satisfycustomer needs, and (ii) developing a product concept thatwill ensure customer satisfaction. Kano’s model is primarilyuseful in improving product quality by tweaking the productfeatures based on detailed analysis and understanding of acustomer’s needs. MacDonald et al. (2006) hold the viewthat the Kano classification system although sometimes seenin engineering and quality management publications, hasnot gained a wide acceptance in other academic communities.Even then several researchers have applied it in the contextof customer satisfaction. However, in an airport which is acomplex service scenario with multiple service providersand as such a direct application of Kano’s model was notpossible within the bounds of this research study. Animportant take away of Kano’s model is that once customerneeds are extracted from customer verbalizations and fieldobservations, it is critical to understand the relevance thateach need has to customers.
Surachartkumtonkun et al. (2012) recommended that financialsecurity, the effective use of time in various activities, orwhether money is well spent are the typical economic well-being issues that people deal with in their daily life.
Physical well-being needs or the need to be free fromphysical harm is the most basic of Maslow’s (1943)hierarchical needs. While describing the safety needs ofhuman beings Maslow stated that the organism may equallywell be wholly dominated by them. They may serve as thealmost exclusive organizers of behaviour, recruiting all thecapacities of the organism in their service, and we may thenfairly describe the whole organism as a safety seekingmechanism. Practically everything looks less important thansafety, (even sometimes the physiological needs whichbeing satisfied, are now underestimated). A man, in this state,if it is extreme enough and chronic enough may becharacterized as living almost for safety alone.
Customers cannot be satisfied with service encountersunless they feel secure in their lives. Service firms must beaware of security issues for the protection of both theiremployees and customers. In fact, individuals typically avoidinvolvement in situations that can harm their physical well-being. Following the September 11 attack, for example,manypeople feared being in an airport or taking a flight and hencetended to travel by plane less during that time.
Skellet 1995 stressed upon keeping in touch with customers’needs and opinions. Citing the example of Wessex Water hestates that it initiated a customer consultation exercise underthe slogan “How far should we go?” to understand morefully what customers really expected and endorse futurespending plans. An explanatory leaflet was sent to all 900,000account holders in addition to various other interest groupsand face-to-face interviews were held with 1200 customers.
Du et al. (2003) proposed an approach based onidentification and utilization of customer need patterns forbetter understanding of customer preferences andsubsequently enhancing the product definition forcustomization and personalization.
Simonson (1993) maintained that in order to get closer totheir customers and satisfy customer needs, companiesshould be able to identify what their customers want (e.g.on the basis of surveys, focus groups, customers’complaints) and use these wants to guide the developmentof their strategies.
Research Methodology
Using non-probabilistic snow ball sampling technique a totalof 800 questionnaires were distributed in October 2014 topassengers who had travelled through RGIA, Hyderabad.A total of 548 questionnaires were returned out of which502 were usable valid responses (N=502).
Demographic Profile of Respondents
The survey covered respondents from all age groups 69.3% of the respondents were in the younger age group of(less than 25 years 21.9%, 25-34 years 24.3%, 35-44 years23.1%) and 30.7% in the older age group (45-54 years 18.3%,55-64 years 7.6 %, 65 years and above 4.8%) . Above 55years of age there is a decline in air travel through RGIA.The Gender of the respondents was 55.6% males and 44.4%females and 32.3% were single while 67.7% were married.78.1% were residents of Hyderabad City and 21.9% were

SCMS Journal o f Indian Managemen t , July - September 201 5 51
A Quarterly Journal
visitors. The Education Level was 58% Post Graduate andabove, 35.6% Graduates, 2.2% Diplomas, 3.4% Intermediate(12th Standard), 0.8% Secondary School (10th Standard), 6.4%were Government Employees, 56.5% Private SectorEmployees, 12% Self Employed and 25.1% Not Employed.The family size of the passengers was singles 1.8%, twomember family 13.3%, three member family 21.9%, fourmember family 42.4%, five member family 14.2%, six memberfamily 4.6%, greater than six members 1.8%.
Respondents frequency of air travel through RGIA in thepast 12 months: zero trips 13.5%, one trip 17.5%, 2-5 trips51.2%, 6-12 trips 12.8%, more than 12 trips 5%, out of these48.2% had done international travel through RGIA and 51.8%had only domestic travel (within India) experience. To captureRecency Effect information about the most recent trip wassought regarding Finance of Most Recent Trip, 78.1% statedthat their most recent trip was self-financed while 21.9%had sponsored trips. Purpose of most recent travel revealed
that 29.9% travelled for work, 27.5% travelled for leisure,42.4% travelled for visiting relatives and friends, 11.2%travelled for some personal emergency, 7% travelled forreligious pilgrimage, 3.6% for employment, 9% travelled forattending conferences, 1.6% travelled for medical reasons,5.4% for pursuing studies, and 0.2% for Sports. Severalrespondents stated more than one purpose for their mostrecent air travel.
Scale and Reliability
Based on the review of literature and the focus groupdiscussions and passenger feedback responses on varioussocial media a total of sixty five different needs of passengersat an airport were identified. The respondents were requiredto rate the relative importance of each need on a Likert Scaleranging from “Most Important” to “Least Important” (Table1), the scores were added later during the coding of thesurvey results.
Table 1 Likert Scale Used in the Questionnaire
Airport NeedMost
ImportantImportant
FairlyImportant
Less ImportantLeast
ImportantScore 5 4 3 2 1
Reliability was tested usingCronbach’s Alpha (Table 2) which showed good internal structural reliability with Cronbach’s
Alpha of 0.958.
Table 2 Reliability Statistics
Cronbach'sAlpha
Cronbach'sAlpha Based on
StandardizedItems
N of Items
.958 .960 65
Data Analysis
The data was analysed on three parameters (i) locating needsclusters amongst the 65 identified needs, (ii) establishingimportance amongst the various needs (iii) testing forsignificant relationship between overall satisfaction of needsand sufficiency of facilities and services to meet the needsand pricing of needs.
(i) Locating needs clusters amongst the 65 identified needs
Cluster Analysis was used to understand the nature of theseneeds. Using SPSS21 a Hierarchical Cluster Analysis wasconducted with the Ward’s Cluster Method and IntervalMeasure using Squared Euclidian Distance generating the
Agglomeration Schedule and a Dendogram. TheAgglomeration Schedule was utilised to obtain a judgementabout the number of clusters using Nargundkar’s (2002)guideline: “the agglomeration schedule can help us toidentify large differences in the coefficient. A large differencein the coefficient values between any two rows indicates asolution pertaining to the number of clusters the lower rowrepresents. At this point it is the judgement of the researcher,which should decide whether to go for a 2-cluster or a 4-cluster solution.” Accordingly a four cluster judgement wasreached and a single solution cluster membership of 4clusters was performed and the needs emerged as per thefollowing clusters.

SCMS Journal o f Indian Management , July - September 201 5 52
A Quarterly Journal
The Needs Clusters that emerged are:-
Needs Cluster – 1 (29 Needs), Mean Value of Responses =4.39
Taxi, Parking, Quick Check-in, Baggage Trolley, FlightInformation, Security, Friendly Customs, Quick Immigration,Quick Baggage Arrival, Weighing Machine, Seating,Terminal Comfort, Aerobridge, Lift, Travelator, Escalator,buggy (battery car), Rest Rooms (Toilets), Free Wi-Fi,Pharmacy, Hospital Emergency, Doctor, Police, ATM, MoneyExchange, Snack Counter, Free Drinking Water, GeneralInformation Counter, Wheel Chair
Needs Cluster – 2 (16 Needs), Mean Value of Responses =3.74
Car Rental, Bus, Train, Metro Rail, Valet Parking, Porter,Business lounge, Special lounge, Computer with Internet
Table 3 Summary of Needs Clusters
facility, Public Telephone, New mobile connections-SIM,Hotel Lodging, Shower Rooms, Luggage Lockers, TravelDesk and Travel Agents, Bank
Needs Cluster – 3 (11 Needs) Mean Value of Responses =3.58
Fine dining Restaurants, Fast Food, Shopping, Books andPeriodicals,Souvenir & Gifts Shops, Duty Free Shopping,Recreation Facility, Children’s Play Area, Prayer Room, Infantfacility – Diaper Change, Nursing Room, Public Television
Needs Cluster – 4 (9 Needs) Mean Value of Responses =2.88
Bar, Beauty Parlour, Spa and Massage, Smoking Zones,Florist, Translators, Post Office, Courier, Photo Kiosk
Based on the type of needs that have emerged in the fourclusters they can be summarised as in Table 3:
Needs Cluster No.No. ofNeeds
Mean Value ofResponses
ImportanceAccorded
Cluster Classification
Needs Cluster - 1 29 4.39 Most ImportantPrimary Core Needs ofPassenger Processing andPassenger Security
Needs Cluster - 2 16 3.74 ImportantSecondary Needs of PassengerComfort and Convenience
Needs Cluster - 3 11 3.58 ImportantTertiary Needs for Leisure andRecreation
Needs Cluster - 4 4 2.88 Less ImportantLow Preference, non-essentialneeds
(ii) Establishing importance amongst the various needs
In pursuance of this objective the responses were analyzedusing SPSS 21 to understand the passengers’ needs andtheir relative importance. Since the list of needs generatedwas very long it was decided against using a ranking methodsince the passengers would tend to get confused in ranking65 different needs. This problem is also recognised byDaetz et al. (1995) They state that customers are asked torank a list of needs from highest (the most important) tolowest (the least important). Average rank is calculatedafterwards. This method is difficult when more than 10-12needs are ranked. It will also demand a lot of continuousconcentration from customers, which is difficult to obtain.
Instead, a descriptive analysis of all the needs wasconducted and their means ranked in descending orderindicating the Most Important Needs to the Least Importantand the same are given in the appendix Table 9. This is in-line with Afon et al. (2006) study which investigated howadequate the environmental services provided for users’consumption in Oshodi and Ojuelegba motorparks inNigeria. Six major environmental services were identified.The users were to rate the level ofadequacy of each serviceusing any of the five Likert’s scale of: very much adequate,very adequate, adequate, not adequate and not at alladequate. In order to obtain the aggregate Facility AdequateIndex (FAI) of each service, a weight value of 5, 4, 3, 2 and1 was respectively assigned to each rating above. The

SCMS Journal o f Indian Managemen t , July - September 201 5 53
A Quarterly Journal
summation of weight value (SWV) for each service wasobtained from the addition of the product of weight valueofeach rating and the number of responses to each rating.The FAI was finally obtained by dividing total weight value(TWV) by the total respondents that rated each service.Therefore for facility i-j
FAIij= TWVij; where
Nij
FAIij= Facility Adequacy Index for facility i-j
TWVij= Total Weight Value of facility i-j
Nij= Respondents rating each of facility i-j
The nearer the FAI to 5, the more adequate the services wasconsidered by users.
Out of the 65 Needs identified for the RGIA airportpassengers we have been guided by Griffin and Hauser’s
(1993), methodology to address both strategic andoperational decisions. They state that industry practice hasevolved a form of customer input that has become knownas the “Voice of the Customer.” The voice of the customer isa hierarchical set of “customer needs” where each need (orset of needs) has assigned to it a priority which indicates itsimportance to the customer, this methodology referred to asQuality Function Deployment (QFD) structures the customerneeds into a hierarchy of primary, secondary and tertiaryneeds. Primary needs, also known as strategic needs, arethe five to ten top level needs that are used by the team toset strategic direction for the product or service. However,instead of considering only the top level five to ten needs ifwe consider the higher mean scores of the ratings we observethat top 28 needs have obtained a score of 4 and above. Outof these, if we further classify the top 20 needs, four distinctneeds emerge as per Table no. 4
Table 4 Needs Clusters of Top 20 Ranked Needs
Needs with Rank and Mean Scores ( ) Type of NeedSecurity, rank no. 1 (4.69)ATM, rank no. 7 (4.53)Police, rank no.8 (4.49)Hospital Emergency, rank no. 9 (4.47)Doctor, rank no.10 (4.47)Pharmacy, rank no. 19 (4.34)
Security needs – personal security and financialsecurity
Flight Information, rank no. 2 (4.68)Quick Baggage Arrival, rank no. 3 (4.62)Quick Check-in, rank no. 4(4.59)Quick Immigration, rank no. 11 (4.46)
Time Management Needs
Restrooms (Toilets), rank no. 5 (4.58)Baggage Trolley, rank no. 6 (4.57)Terminal Comfort, rank no. 12 (4.46)Friendly Customs, rank no. 14 (4.43)Seating, rank no. 15 (4.43)Parking, rank no.16 (4.41)Escalator, rank no. 17 (4.40)General Information Centre, rank no.18 (4.37)
Comfort And Convenience Needs
Free Drinking Water, rank no.13 (4.45)Free Wi-Fi, rank no. 20 (4.32)
Value for Money Needs
(iii) Testing for significant relationship between overallsatisfaction of needs and sufficiency and pricing of needs.
The hypothesis developed is:
H0: There is no significant relationship between overall
satisfaction of airport needs and sufficiency and charges offacilities and services.
Ha: There is significant relationship between overall
satisfaction of airport needs and sufficiency and charges offacilities and services.
The survey elicited responses for four survey questionsabout the dependent and independent variables on a fivepoint Likert Scale – Strongly Disagree, Disagree, Neither
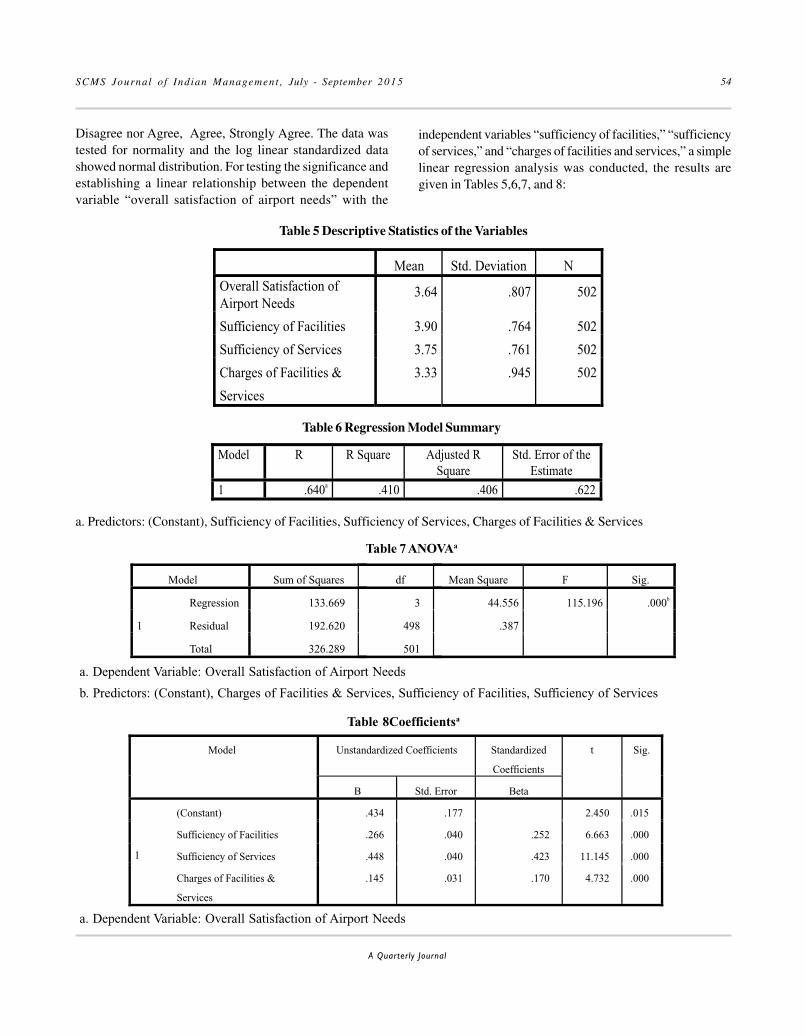
SCMS Journal o f Indian Management , July - September 201 5 54
A Quarterly Journal
Disagree nor Agree, Agree, Strongly Agree. The data wastested for normality and the log linear standardized datashowed normal distribution. For testing the significance andestablishing a linear relationship between the dependentvariable “overall satisfaction of airport needs” with the
Table 5 Descriptive Statistics of the Variables
independent variables “sufficiency of facilities,” “sufficiencyof services,” and “charges of facilities and services,” a simplelinear regression analysis was conducted, the results aregiven in Tables 5,6,7, and 8:
Mean Std. Deviation NOverall Satisfaction ofAirport Needs
3.64 .807 502
Sufficiency of Facilities 3.90 .764 502
Sufficiency of Services 3.75 .761 502
Charges of Facilities &
Services
3.33 .945 502
Table 6 Regression Model Summary
Model R R Square Adjusted RSquare
Std. Error of theEstimate
1 .640a .410 .406 .622
a. Predictors: (Constant), Sufficiency of Facilities, Sufficiency of Services, Charges of Facilities & Services
Table 7 ANOVAa
Model Sum of Squares df Mean Square F Sig.
1
Regression 133.669 3 44.556 115.196 .000b
Residual 192.620 498 .387
Total 326.289 501
a. Dependent Variable: Overall Satisfaction of Airport Needs
b. Predictors: (Constant), Charges of Facilities & Services, Sufficiency of Facilities, Sufficiency of Services
Table 8Coefficientsa
Model Unstandardized Coefficients Standardized
Coefficients
t Sig.
B Std. Error Beta
1
(Constant) .434 .177 2.450 .015
Sufficiency of Facilities .266 .040 .252 6.663 .000
Sufficiency of Services .448 .040 .423 11.145 .000
Charges of Facilities &
Services
.145 .031 .170 4.732 .000
a. Dependent Variable: Overall Satisfaction of Airport Needs

SCMS Journal o f Indian Managemen t , July - September 201 5 55
A Quarterly Journal
The correlation coefficient for the relationship between theindependent variable and the dependent variables was 0.640which can be characterized as a strong relationship usingthe rule of thumb that a correlation between 0.0 and 0.20 isvery weak, 0.20 to 0.40 is weak, 0.40 to 0.60 is moderate, 0.60to 0.80 is strong and greater than 0.80 is very strong.
Based on the ANOVA table for the linear regression F(3,498)= 115.196, p < 0.001, with an R2 of 0.410 there was arelationship between the dependent variable “overallsatisfaction of airport needs” and the independent variable“sufficiency of facilities,” “sufficiency of services,” and“charges of facilities and services.” Since the probability ofthe F statistic (p< 0.001) was less than the level of significance(0.05) the Null Hypothesis is rejected and we state that thealternate hypothesis that there is significant relationshipbetween the variables is supported. Hence we can concludethat the needs of RGIA airport users are sufficiently met.
Conclusion
Just as ACI’s Airport Service Quality survey is designed ina way that indicates the importance of each factor to overallsatisfaction and a Prioritisation Analysis provides airport
management with concise, actionable insight into areasrequiring immediate attention. Similarly this analysisprovides us insight into passenger needs and it emergesthat considering the demographic profile of the RGIApassenger survey the primary needs of passengers travellingthrough RGIA are security, reduced time in processing ofpassengers, terminal comfort, and convenience of basicservices and free service of Wi-Fi and water. If we considerthe lower end of the Needs Hierarchy it emerges that BeautyParlour (rank 65), Bar (rank 64) and Spa & Massage (rank 63)are perceived as least important by the travellers throughRGIA and based on our hypothesis we can conclude thatRGIA meets the needs of its passengers.
Scope for further Research
Further research in the area of matching the needs (facilitiesand services at an airport) to the socio-cultural requirementsof the passengers can help airports in different regions todesign their offerings of non-core facilities and services atan airport. Since security has emerged as the most importantneed of RGIA travellers further research can be conductedto determine what factors assuage travellers’ fears and buildtheir confidence.
APPENDIX
Table 9 Needs Hierarchy
Descriptive StatisticsValid N Minimum Maximum Mean Std. Deviation
1 Security 502 1 5 4.69 .6152 FlightInformation 502 1 5 4.68 .5993 QuickBaggageArrival 502 1 5 4.62 .6464 QuickCheck-in 502 1 5 4.59 .6445 Restrooms (Toilets) 502 1 5 4.58 .6636 BaggageTrolley 502 1 5 4.57 .6887 ATM 502 1 5 4.53 .7448 Police 502 1 5 4.49 .7739 HospitalEmergency 502 1 5 4.47 .806
10 Doctor 502 1 5 4.47 .79811 QuickImmigration 502 1 5 4.46 .82512 TerminalComfort 502 1 5 4.46 .67213 FreeDrinkingWater 502 1 5 4.45 .86914 FriendlyCustoms 502 1 5 4.43 .78815 Seating 502 1 5 4.43 .67316 Parking 502 1 5 4.41 .90817 Escalator 502 1 5 4.40 .74018 GenInformation Centre 502 1 5 4.37 .85519 Pharmacy 502 1 5 4.34 .81820 FreeWi-Fi 502 1 5 4.32 .915
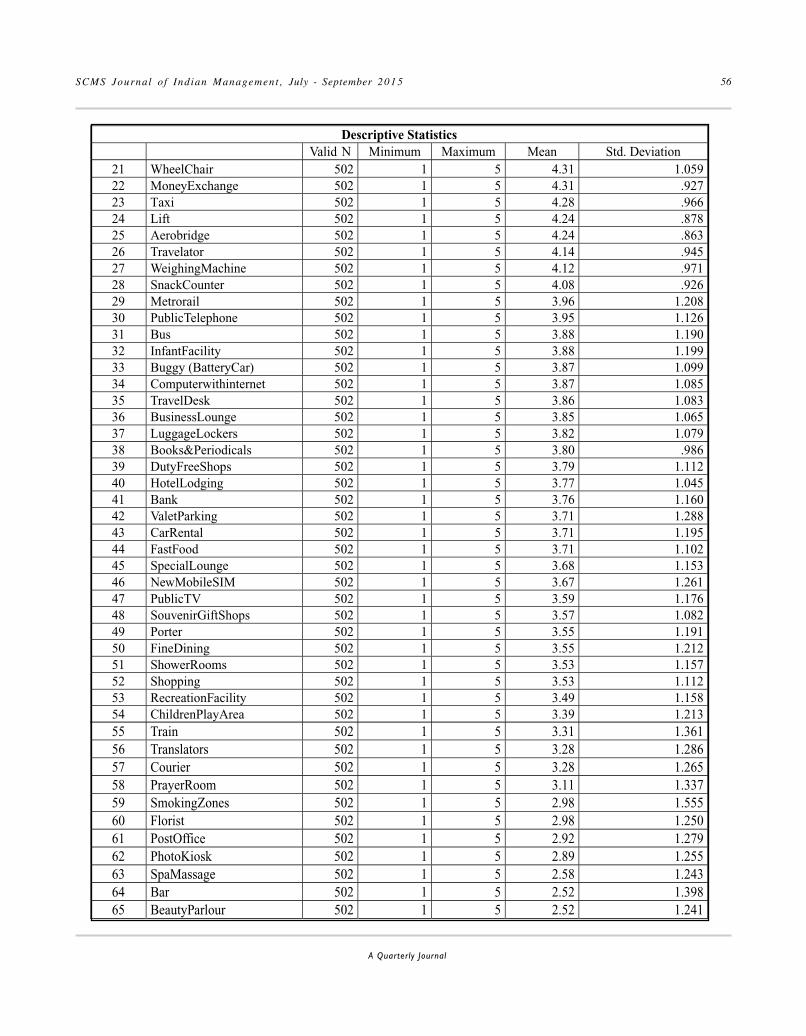
SCMS Journal o f Indian Management , July - September 201 5 56
A Quarterly Journal
21 WheelChair 502 1 5 4.31 1.05922 MoneyExchange 502 1 5 4.31 .92723 Taxi 502 1 5 4.28 .96624 Lift 502 1 5 4.24 .87825 Aerobridge 502 1 5 4.24 .86326 Travelator 502 1 5 4.14 .94527 WeighingMachine 502 1 5 4.12 .97128 SnackCounter 502 1 5 4.08 .92629 Metrorail 502 1 5 3.96 1.20830 PublicTelephone 502 1 5 3.95 1.12631 Bus 502 1 5 3.88 1.19032 InfantFacility 502 1 5 3.88 1.19933 Buggy (BatteryCar) 502 1 5 3.87 1.09934 Computerwithinternet 502 1 5 3.87 1.08535 TravelDesk 502 1 5 3.86 1.08336 BusinessLounge 502 1 5 3.85 1.06537 LuggageLockers 502 1 5 3.82 1.07938 Books&Periodicals 502 1 5 3.80 .98639 DutyFreeShops 502 1 5 3.79 1.11240 HotelLodging 502 1 5 3.77 1.04541 Bank 502 1 5 3.76 1.16042 ValetParking 502 1 5 3.71 1.28843 CarRental 502 1 5 3.71 1.19544 FastFood 502 1 5 3.71 1.10245 SpecialLounge 502 1 5 3.68 1.15346 NewMobileSIM 502 1 5 3.67 1.26147 PublicTV 502 1 5 3.59 1.17648 SouvenirGiftShops 502 1 5 3.57 1.08249 Porter 502 1 5 3.55 1.19150 FineDining 502 1 5 3.55 1.21251 ShowerRooms 502 1 5 3.53 1.15752 Shopping 502 1 5 3.53 1.11253 RecreationFacility 502 1 5 3.49 1.15854 ChildrenPlayArea 502 1 5 3.39 1.21355 Train 502 1 5 3.31 1.36156 Translators 502 1 5 3.28 1.28657 Courier 502 1 5 3.28 1.26558 PrayerRoom 502 1 5 3.11 1.33759 SmokingZones 502 1 5 2.98 1.55560 Florist 502 1 5 2.98 1.25061 PostOffice 502 1 5 2.92 1.27962 PhotoKiosk 502 1 5 2.89 1.25563 SpaMassage 502 1 5 2.58 1.24364 Bar 502 1 5 2.52 1.39865 BeautyParlour 502 1 5 2.52 1.241
Descriptive StatisticsValid N Minimum Maximum Mean Std. Deviation

SCMS Journal o f Indian Managemen t , July - September 201 5 57
A Quarterly Journal
References
ACRP Report 10 (2008) “Innovations for Airport TerminalFacilities” Airport Cooperative Research Program,Transportation Research Board of the NationalAcademies.
ASQ Survey: Benchmarking the Global Airport Industryretrieved from http://www.aci-na.org/static/entransit/ASQ_Brochure2008.pdf
Bahia, K.and J. Nantel (2000). “A Reliable and ValidMeasurement Scale for the Perceived Service QualityBanks.” The International Journal of BankMarketing, Vol. 18, No. 2 pp 84-91.
Betancor, Ofelia and Rendeiro Robert (1999). “RegulatingPrivatized Infrastructures and Airport Services.” aWorld Bank Policy Research Paper retrieved from http:/dx.doi.org/10.1596/1813-9450-2180.
Cotton, Brian (2007). “The Modern Airport, ConqueringComplexity in an Era of Increasing Expectations.” aFrost & Sullivan white paper, document #TTWO3007-USEN-00.
Cream, Frances (2009). “Economic Challenges FacingAirports in an Era of Global Financial Instability” awardwinning paper for ACI – Pacific Young Executive ofThe Year Award, Airports Council International.
Daetz, Douglas, William Barnard, and Richard Norman (1995).Customer Integration: The Quality FunctionDeployment (QFD) Leader’s Guide for DecisionMaking, New York: John Wiley & Sons, Inc.
Doganis (1992). “The Airport Business” Routledge ISBN 0-415-07877-6 (hbk).
Du, Xuehong, Jiao, Jianxin, Tseng, andM Mitchell (2003).“Identifying Customer Need Patterns forCustomization and Personalization.” IntegratedManufacturing Systems, Vol.15, No.5, pp 387-396.
GAO Report (2013). “National Airspace System, AirportCentric Development.” United States GovernmentAccountability Office, Report GAO-13-261 toCongressional Requests.
Griffin, Abbie and John R. Hauser (1993). “The Voice of theCustomer.” Marketing Science, Winter 1993, Vol.12,No.1.
MacDonald, Erin, Martin Backsell, Richard Gonzalez andPanosPapalambros “The Kano Method’sImperfections and Implications in Product DecisionTheory” retrieved from http://www-personal.umich.edu/~gonzo/papers/macdonald-etal-2006-kano.pdf
Maslow (1943). “A Theory of Human Motivation”Psychological Review, Vol 50, pp 370-396.
Ministry of Civil Aviation (2012).National TransportDevelopment Policy Committee, “Report of WorkingGroup on Civil Aviation Sector,” retrieved from http://civilaviation.gov.in/cs/groups/public/documents/document/moca_001680.pdf
Ministry of Civil Aviation, “Strategic Plan 2010-15” retrievedfrom http://civilaviation.gov.in/cs/groups/public/documents/newsandupdates/moca_000783.pdf
Nargundkar, Rajendra (2002). “Marketing Research.” TataMcGraw-Hill Publishing Co. Ltd., New Delhi pp 337
Rahman, Zillur (2004). “Developing Customer OrientedService: A Case Study.” Managing Service Quality,Vil.14, No.5 pp 426-435.
RGIA website, Rajiv Gandhi International Airport, Hyderabad“About GHIAL” retrieved from http://www.hyderabad.aero/our-company.aspx
Simonson, Itamar (1993). “Get Closer to Your Customers byUnderstanding How They Make Choices.” CaliforniaManagement Review, summer 1993, Vol.35, No. 4.
Skellet, Collin (1995). “Understanding and Meeting theNeeds of Our Customers.” Managing Service Quality,Vol. 5, No. 4, pp 22-24.
Surachart, Kumtonkun, Jiraporn, Paul G. Pattterson, Janet R.McColl-Kennedy (2013). “Customer Rage Back Story:Linking Needs Based Cognitive Appraisal to ServiceFailure Type.” Journal of Retailing Vol.9, No.1, pp 72-87.
Toombs, Ken and George Bailey (1995). “How to Redesignyour Organization to Match Customer Needs.”Managing Service Quality, Vol. 5, No.3. pp 52-56.
Wang, Ting and Ji Ping (2010) “Understanding Kano’sModel” International Journal of Quality andReliability Management, Vol.27, No. 2, pp 173-184.
******
SCMS Journal o f Indian Management , July - September 201 5 58
A Quarterly Journal
Recruitment and Selection Building
Scale: Content Validity EvidenceN.R. Aravamudhan and R. Krishnaveni
Key Words : content validity, construct validity, Capacity building Scale, recruitment and selection
Abstract
N.R. AravamudhanAssistant ProfessorDepartment of Management StudiesMahendra Institute of TechnologyMallasamudiram, Tamilnadu, IndiaEmail: [email protected]
Dr. R. KrishnaveniProfessorDepartment of Management StudiesPSG Institute of ManagementCoimbatore, IndiaEmail: [email protected]
n today’s microscopic world of business, talent isat premium. With the competition for outstandingcandidates getting fiercer, companies have to go all-
out and ultimately find the best-of-the-breed talent available.Since people inside the organization develop products andprocesses, make crucial decisions and implement programs,they are so vital to the success of the organization. Thecompanies that are successful in attracting qualityapplicants and selective in their hiring decision, can leapfrogthe competition and enjoy decisive edge over their rivals. Ifrecruitment is done meticulously, it has the potential to be along –term investment that can help build a top-notch workforce capable of accomplishing the organization’s vision.Recruitment is all about creating a world class company onthe back of strong workforce and investing in to the excitingfuture of an organization. Perhaps nothing sums up theimportance of Recruitment and Selection than the pithyobservation made by Jim Collins in his book Good to Great:Why Some Companies Make the Leap and Others Don’t. Toquote “Great companies first got the right people on the
A robust recruitment and selection process can help the company leapfrog the competition by seeking out, recruit, hire
and retain top-notch talents. The extant recruitment and selection literature, though vibrant and diverse, is highlyfragmented and compartmentalized. No tool is readily available for organizations to assess the complete recruitment and
selection cycle. The aim of this study was to develop a psychometrically sound assessment scale for improving and
enhancing recruitment and selection process. When a scale is developed, the first step is to assess the content validity. Thisresearch was re-calibrated according to Lynn’s two step stages of development and judgment. A total of 27 items were
generated for the four sub scales which form the recruitment and selection cycle. Experts’ ratings on the items were
analyzed using median, percentage agreement item ambiguity, Content Validity Index (I-CVI) and Aiken’s ContentValidity Coefficient (VI
k
)and content validity ratio. Based on the decision rules established for this study, items were either
retained or removed. The paper describes the process and results of generating evidence for content validity of the
Recruitment and Selection Capacity Building scale (RSCBS).
Abstract
I

SCMS Journal o f Indian Managemen t , July - September 201 5 59
A Quarterly Journal
bus, the wrong people off the bus, and the right people inthe right seats – and then they figured out where to drive it”unquote (Collins, 2001, p.41). A robust recruitment andselection process coupled with a multi-pronged focus onthe cutting-edge training, leadership development andattractive compensation packages can ensure that thecompany is able to seek out, recruit, hire and retain the besttalent and build a top-notch organization. In today’s high-octane competitive environment, recruitment serves theimportant function of infusing the necessary talent into theorganization. Admittedly, recruitment and selection had longbeen viewed as critical component in an organizationmatching candidates and future jobs (Scolarios and Lockyer,1999) central (Wolf and Jenkins, 2006) and critical (Carlsonet al., 2002) to the success of an organization (Taylor andCollins, 2000).
Justification for the research – Why do we need arecruitment and selection Capacity Building scale?
There has been a steady increase in the number of studies(Rynes et al., 1991; Rynes, 1993; Barber, 1998; Salgado, 1999;Hough and Oswald; 2000; High House and Hoffman, 2001;Rynes, 2003) focusing on recruitment and selection. Anyretrospective research in the domain of recruitment andselection would doubtlessly suggest that it continues toremain vibrant, robust, topical, and multifaceted over years.The over-arching themes addressed in the recruitment andSelection include examining the recruitment tactics (Lavigna,1996), sources of recruitment (Werbel and Landau, 1996),content of recruiting messages ( Mason and Belt, 1986),individual differences in job seekers (Judge and Cable,1997),applicants reaction to recruitment process (Taylor andBergmann, 1987), examining the role of personality andorganization images in recruitment (Tom, 1971), recruitmentadvertising (Ryan et al., 2000), realistic job previews(Breaugh,1983), applicant attraction (Turban, 1998), person–organization fit (Cable and Judge, 1996), recruitmentcommunication media ( Allen et al., 2004), recruitment on thenet (Cober et al., 2004), applicant decisions in the interview(Schmitt and Coyle, 1976), applicant reaction to selectionprocedures (Schmitt and Coyle, 1976), personal andsituational factors in the interview (Alderfer andMcCord,1970), effects of selection practices on attitudesand behavior (Rynes, 1993), employment interview (Judgeet al., 2001), types of interviews (Dipboye, R. L., 1994),fairness of selection procedures (Elkins and Phillips, 2000)and applicant reaction to selection methods (Macan et al.,1994).
On a closer scrutiny, R&S literature revealed some seriouslacunae too. Despite its longevity, there is a dearth ofresearch focusing on the wholesome recruitment andselection cycle in a single source. Most of the recruitmentresearch have examined only a single activity or stage ofthe recruitment process like realistic job previews,recruitment sources, recruitment interview, much to theexclusion of other recruitment activities and stages (Breaughand Starke 2000; Collins and Stevens, 2002), selectionresearch focused on selection methods (Ryan et al., 1999)and employee selection procedures (Hunter and Hunter,1984). This approach is rather slammed by researchers as apiecemeal (Rynes, 1991) and a heavily compartmentalizedresearch (Breaugh, 2008). There is a dearth of researchfocusing on the assessment of range of activities thatencompass the complete recruitment and selection cycle.This paper responds to the call for developing a scale fordetailed assessment of the wholesome Recruitment andSelection cycle. This purported discrepancy in therecruitment and selection literature provided the impetus tostudy the author to construct the Recruitment and SelectionCapacity Building Scale (RSCBS).
Methodology
Development of scientific scales mandates scale developersto establish adequate evidence of scale validity andreliability. A valid instrument is one which measures what itis supposed to measure (De Vellis, 2003). It helps researchersinterpret variables and the relationship between variablesin a more theoretical manner (Bagozzi, 1980). Hence, thedevelopment of a valid instrument is the most importantgoal of any instrument developer. Traditionally, three typesof validity may be established – Content, criterion andconstruct validity. Since content validity is a pre-requisitefor other validity, it should be given more importance duringthe instrument construction.This paper highlights theprocess and statistical procedures used to establish contentvalidity evidence for the Recruitment and Selection CapacityBuilding Scale (RSCBS). The content validity evidence ofthe Recruitment and Selection Capacity Building Scale(RSCBS) was established using Lynn’s (1986) two-stageprocess - Development and Judgment-quantification.Development of the recruitment and selection capacitybuilding scale (RSCBS) formed the first phase of the contentvalidity study. The scale was then assessed by a panel ofjudges using descriptive and quantitative analysis toestablish content validity evidence. This formed the secondphase of the content validity study. The outcome of eachstage is discussed below.

SCMS Journal o f Indian Management , July - September 201 5 60
A Quarterly Journal
Step 1: Content Domain identification
Step 2: Item Generation
Step 1: Solicit Expert participation
Step 3: Item Construction
Step 4: Analysis of the ratings
Step 2: Selection of the participants
Step 3: Identifying aberrant judge
Descriptive Analysis Quantitative Analysis
Median Itemambiguity
Percentageagreement
ContentValidity Index
ContentValidityRatio
Contentvaliditycoefficient
Figure No.1
showing the development and judgment-quantification process followed in establishing content validity
DevelopmentStage
JudgementStage

SCMS Journal o f Indian Managemen t , July - September 201 5 61
A Quarterly Journal
Discussions
Stage 1 – Instrument development.
Recruitment and Selection Capacity Building Scale (RSCBS)was developed by following three sequential steps. A)Domain Identification, B) Item generation, and C) ItemConstruction.
Step 1: Domain Identification
The significance of recruitment and selection has soared inimportance in many organizations across the world.Beaumont (1993) identified the constellation of forces thatfuelled the importance of recruitment and selection at work.First, an emergence of increasingly diverse work force hasput premium on team work. Second, the purpose ofrecruitment and selection has been turned on its head. Asidefrom Person –job match, organizations are also driven bythe overarching desire to have a multi skilled and flexiblework force and hence workforces are inexplicably gettinglinked with behavior and attitudes. Lastly, the process ofrecruitment and selection is assuming strategic overtoneswith more businesses seeking to align staffing practiceswith the organization strategy. Researchers have reportedthat a well managed recruitment and selection process canimprove organization performance (Robert, 2005) and helpcreate positive organizational image (Pilbeam and Corbridge,2006). There are enough shreds of evidence emerging tosuggest that a sophisticated selection process helped theorganization deliver exemplary customer service and enablethe company stand out from the competition (Strategic HRReview, 2004). Sophisticated recruitment and selectionprocedures are positively related to labor productivity (Kochand McGrath, 1996). On the contrary, poorly managedrecruitment is fraught with cost implications for employerssuch as low morale, lost business opportunities and highemployee turnover (Christina Evans, 2007). Findings gleanedfrom the Chartered Institute of Personnel and DevelopmentRecruitment and Retention Survey pegged the cost of staffturnover at around £12,500 for managerial and Professionalstaff (CIPD, 2006). About 60% of the undesirable turnoverin organizations is ascribed to bad hiring decisions on thepart of the employer (Smith, 2001). Recruitment and selectionserve as levers for organizational change, sustainingemployee commitment and achieving high performance(Price, 2004). Besides, there is a growing realization thatrecruiting and selection is super critical not only forsustaining competitive advantage but also for the
organizational survival (Taylor and Collins, 2000). For thisreason the recruitment and selection of human capital is acritical human resource function (Grobler et al., 2006). Hencethis research viewed recruitment and selection as animportant activity.
Recruitment and selection are integrative activities and‘where recruitment stops and selection begins is still a mootpoint (Anderson, 1994). Recruitment is considered to be amultistage process (Turban et al., 1995). The opinion is splitdown the middle amongst researchers about the stagescomprising the recruitment and selection process. Priorresearches proposed either three, four or five stages forrecruitment (Barber, 1998; Breaugh et al., 2008). Employeeselection follows two step processes modeled along thelines of Beach’s (1993) image theory which examines thedecision process as a two step stage comprising thescreening and choice stages. Similarly organizations oftenscreen individuals out of selection process in the initial phaseand then select the best from the pool in the subsequentstages. Synthesizing various stages of recruitment andselection mentioned in the extant literature, this researchproposed a four -stage recruitment and selection process.The proposed four-stage process leaned heavily onliterature review and partially on the scale created by VictoriaState Services Authority (2008). First, job analysis, jobdescription, and person specification were collapsed in tofirst stage of recruitment. Many HR experts believed that allthese three are interrelated in the business environment.Undertaking job analysis to determine the recruitment andselection criteria and developing key selection criteria andposition descriptions based on the job analysis formed thepart of this first stage. Job analysis and key selection criteriawere finally collapsed in to the phase one of the recruitmentand selection process. The specific selection steps whichtake place to make a selection decision formed the secondand third stage. Personnel and line management uses avariety of methods to help the task of predicting whichapplicants will be most suitable in meeting the requirementsof the job (Torrington and Hall, 1998). Drawing up a shortlistinvolves cutting through the pile of applicants untilorganization has selected candidates that they would liketo invite for interview. So short listing assumes a matter ofparamount and formed the second stage of the proposedprocess. It has been observed that recruiting, selecting andplacing applicants were the top three priorities for HRprofessionals (Straus et al., 2001). The myriads of methodsavailable to help in the selection process such as interviews

SCMS Journal o f Indian Management , July - September 201 5 62
A Quarterly Journal
and additional assessment criteria formed the penultimatestage of the process. The induction, an initiative needed tosupport the selection decision formed the last stage of theproposed process. Hence, this research deduced that Job
analysis and key selection criteria, short listing, interviewand additional assessment and induction formed theRecruitment and Selection cycle.
Figure no.2. showing the recruitment and selection cycle
Step 2 – Item Generation
In order to generate items, two approaches were used. Thefirst involved ‘culling’ or adapting items from existing scale.The second approach involves qualitative method. Thisstudy avoided the qualitative item generation for manyreasons. It was observed from the literature that manypublished scales in journals such as Journal of BusinessResearch (Sin et al., 2005a), Journal of Service Research(Lings and Greenley, 2005) did not always employ aqualitative item generation stage. Though Churchill’s (1979)research suggested a qualitative stage, recent scaledevelopment literature e.g. Netemeyer et al., (2003)highlighted the importance of reviewing literature to generateitems instead of incorporating qualitative stage. Theresearcher also had concerns regarding the administrationof large number of items to the expert panel. Such a largenumber of items had the potential to adversely impact thequantity and quality of expert panel participation. So it wasdecided to generate items grounded in literature. The tableshowing the items generated and its affiliate sources can befound in Appendix A.
Step 3: Item Construction
Items were organized in to constructs on the item ContentRating Review forms (Appendix A). The Item Content RatingReview forms included the definition for construct on thetop of the form. These definitions provided a reference forthe raters to rate the relevance and representativeness ofthe items. The content reviewers were called upon to judgethe degree to which an item fit with the respective construct.Items found to fit each of the construct were listed on theleft and rating scale of 1 (No fit) to 4 (Excellent Fit) werelisted on the right side. In line with the recommendations ofLyn (1986), four–point scale was used in order to avoidneutral responses. Additional room was provided for thejudges to write their suggestions on how items could befurther revised. At the bottom of the form, space was alsoprovided for giving further comments. At the end of theitem Content Rating Review form, the judges were calledupon to answer one open ended questions. The questionwas “Are there any items that you would recommend as‘having an excellent fit’ that have been omitted from thisitem pool?” The second question was intended to meet the

SCMS Journal o f Indian Managemen t , July - September 201 5 63
A Quarterly Journal
requirements of content validity that each of the domainswas adequately sampled (Linn, 1980). There were 27 itemsready to be reviewed by the expert panel members.
Stage 2: Expert judgment
The underlying objective of this stage is to analyze theextent to which items created are representative of the targetconstruct and the degree to which such items represent thefacet of construct they were developed for (Beck and Gable,2001). In this study, the items were assessed based on therelevance and representativeness. The higher the rating ofrelevance and representativeness, better the content validityrating. A description of the study conducted to obtain expertjudgment of the items developed for Recruitment andSelection capacity building scale is presented below in foursteps.
Step 1: Solicit expert participation
People who expressed desire to participate were sent out apackage containing a) covering Information letter b) ItemContent Rating Review Forms and c) A self-addressedstamped envelope. Participants were given 20 days tocomplete the package and send it back to the researcher.The letter explained the rationale for undertaking Recruitmentand Selection Capacity Building instrument, the targetpopulation that would be surveyed using the questionnaire,and a summary of the tasks involved in this portion of thestudy. Participants were assured that their responses wouldbe kept strictly confidential and that only the researcherand supervisor would have an access to the data collected.Participation was purely involuntary and participants arefree to withdraw from the exercise anytime. At any given
point in time, if participants were to withdraw, they werecalled upon not to return the envelope. Envelopes that werenot received seven business days after the stipulated 30days were deemed as withdrawn. The content judges wererequested to judge each item based on the degree of fit withthe definition for the domain (Crocker and Algina, 1986).After the completion of all the tasks, judges were requestedto place the item Content Rating Review forms in the pre-paid self-addressed envelope and return it to the researcher.Upon the receipt of the package, the content judges weregiven a period of 30 days to complete the judging of items.All rating packages returned were used in the analysis.
Step 2: Selection of the participants
In selecting the panel of experts, criteria outlined by Yunand Ulrich (2002) were used as a reference point. Selectionof experts was done on the basis of their job title, experience,knowledge and availability to complete the task within thespecified time frame. Specific guidelines used for theinclusion and selection of experts included experienced HRpractitioners with over 10 Years of experience in HumanResource function.
Potential participants who fulfilled the criteria were invitedto participate through e-mail. A total of 30 HR managerswere approached by e-mail. Personal connections of theresearcher were used to contact HR practitioners. A total of50 invitations were sent out through e-mail. Of the 30 HRmanagers, 15 agreed to participate and the packages weresent out to these experts. A final total of 11 packages werereceived with response rate being (73%) of the packagesthat were sent out.
Table no.1: Indicating the distribution of judges
Judges Category Area of expertise Experience
1 Industry HRM 15
2 Industry HRM 15
3 Industry HRM 10
4 Industry HRM 15
5 Industry HRM 11
6 Industry HRM 12
7 Industry HRM 23
8 Industry HRM 14
9 Industry HRM 20
10 Industry HRM 18
11 Industry HRM 13

SCMS Journal o f Indian Management , July - September 201 5 64
A Quarterly Journal
After the receipt of expert panel member’s ratings,participant’s names were separated from the data. The ratingsof the judges were keyed in to MS-Excel programme. Togather evidence of content validity, panel member’s ratingsfor each item on each subscale were compared andcontrasted. Hellsten (2008) proposed three major approachesto examine judgment ratings. They are: a) Quantitative b)Qualitative C) Descriptive. Due to paucity of time andresources, qualitative analysis was not employed by thisstudy. This study used three methods of descriptive analysissuch as Item Ambiguity, Median and Percentage Agreementand three types of quantitative methods such as ContentValidity Ratio, Content Validity Index, Aiken’s ContentValidity Co-efficient to examine the quality of items. Thesemethods were in turn compared to determine their overallagreement.
Step 3: Identifying Aberrant Judges through Inter-Judgeagreement
Though judges were experts in their chosen field, thepossibility of some judges scoring the items in aberrantmanner is quite high and can lead to measurement erroracross the ratings. Inter-rater agreement was employed toidentify the aberrant judges. Inter-rater agreements seek toexamine the degree of Inter-Judge agreement and identifythe aberrant raters as against the rest of the other judges. Itwas decided to remove the aberrant judges from the furtheranalysis if they were found before conducting analysis. Theformula for calculating inter–rater agreement is representedas: KJDM j= Σ XKj – MdK ⎟ K=1 where XKj is Judge j’s rating on subscale K and MdK isthe median of item K (Rogers, 2010).
Table No. 2: Showing the summary statistics of Judges’ Discrepancy from the Median
Judges JDM JDP1 13 9.52 11 8.53 12 12.54 11 95 15 126 12 107 15 15.58 12 14.59 10 12.5
10 9 9.511 55
The JDMj’s for the eleven judges rating the Recruitment andSelection capacity building scale ranged from 9 to 55. Thedetail on each judge’s rating of all the items is listed inAppendix B. One judge, judge 11 was sufficiently differentfrom the other judges to be considered an aberrant judge.The incongruence of judge 11 was a systematic preferencefor rating items at the extreme that is he/she was assigningonly 1 (No Fit) option. Judge 11 was an aberrant judge. Thejudge assigned a 1 (No Fit) to almost all the items. Therefore,the ratings for judge 9 were removed prior to completing
(Note: JDM = Judges’ Discrepancy from the Median (Judges 1-9); JDP =
Judges’ discrepancy from the Median (Judge 11 removed))
any further analyses. Rogers (2010) noted that if one judgehas been removed, the median should be recalculated withthe rest of the judges and the Inter-judge Agreement needsto be recalculated to determine if there is a second aberrantjudge. In line with these recommendations, the median andJDM were recalculated. After removing the aberrant judge11, the total number of expert panel members for this researchstood at ten. Following the removal of judge 11, the JDMj’swas recomputed and ranged from 8.5 to 15.5.

SCMS Journal o f Indian Managemen t , July - September 201 5 65
A Quarterly Journal
Step 4: Analysis of expert Ratings
This paper relied on Descriptive analysis and Quantitativeanalysis to obtain experts’ judgment. Qualitative analysiswas not done due to paucity of time and resources. Thoughresearcher acknowledged the merits of qualitative analysis,quantitative and descriptive analysis offered practicality interms of time and cost. Three kinds of descriptive analyses(i.e. Item Ambiguity, Median, and Percentage Agreement)and three quantitative methods (i.e. Content Validity Index,Content Validity Ratio, Content Validity Coefficient) wereused to determine the quality of the items. Descriptiveanalysis was conducted first as it highlighted the propertiesof the items. Firstly, the median item rating was worked outfor each subscale. A higher median value indicates a morerelevant item. Consistent with the work of Hellsten (2008),an item with a median of 2.75 or above was fixed for thestudy. Second, the item ambiguity score or the range ofscores for each item was worked out. In line with the work of(Rogers, 2010) a range of three or more between scores (orRk of 4 or higher) was deemed ambiguous since this researchused a rating scale of 1 to 4. Percentage agreement wasworked out to examine the percentage of judges who agreedthe item, was a good fit to the category mentioned. Thequestion “Is this item essential to the domain” was asked atthe end of each item and the raters were asked to choose“Yes or No.” A criterion of 80% was fixed for this study. Thecontent validity index for each individual item (CVI; Lynn,1986) is the percentage of judges that rated the item as 3 or4 (based on the rating scale of 1 to 4 where 4 representexcellent fit. The CVI is expressed in terms of Percentage.Polit, Beck, and Owen (2007) observed that the CV Indexvalue of 0.80 was considered acceptable for a panel of 10members. So, CVI for this study was fixed at 80%. In order tocalculate CV Ratio, the question “Is the item essential to thedomain” was worded in to the item content Rating ReviewForms for judges.The judges will have to answer in terms ofYes or No. The content validity coefficient (VIK; Aiken,1985) was examined next. The closer the coefficient is to 1,the higher content validity an item has. To determine whetherthe calculated coefficient is significant, a comparison is madewith a table of the Right-Tail Probabilities (p) for SelectedValues of the Validity Coefficient (V) by Aiken (1985, p.134).
After summarizing the results, it was decided that itemsmeeting the criteria of less than 4 methods (66.67%agreement) should be removed.
Findings of the study
The item rating scale had a response range from 1 to 4. Theexperts were directed to read and rate the items to see if theitem measured the construct. The median, item ambiguity,percent agreement, Content Validity Ratio, Content ValidityIndex, and Content Validity Coefficient (VI) were computedfor each item. Decision criteria outlined earlier were used inretaining or rejecting items. The right-tail probability valueof validity coefficient VI
k (Aiken, 1985, p.134) was found
from the table for 10 experts, with a rating category of 4 - avalue of 0.73 was significant at p <0.32. The VI
k for the items
retained were highly significant. Refer to Appendix C forthe values and decisions made for all the subscales and thenumber of items retained in each core and subscales. It showsthe results of the analysis for content validity and thedecisions made to retain or reject an item. Of the 27 items, 23items fulfilled the conditions of median cut off fixed for thestudy (2.75). In the case item ambiguity, eleven itemsdisplayed high ambiguity. In relation to percent agreement,only four items failed to achieve the cut-off (80%) fixed forthe study. While in the case of CVI, 23 items exhibited theconditions fixed for the study. The minimum CVR for eachitem to be considered as acceptable was 0.62 for a one-tailed test at the 95% confidence level if a minimum of 10panelists were used for the study (Lawshe, 1975). Of the 27items, four items (RS3, RS4, RS5 and RS24) failed to makethe cut. In the case of Content validity co-efficient, 22 itemsmet the conditions. 6 items (RS3, RS4, RS5, RS16, RS19,RS24) failed to fulfill the conditions. After all the calculationswere done, the results for each item under all the methodswere then summarized. It was decided that items meetingthe criteria of less than 4 methods (66.67% agreement)should be removed. 23 items met the criteria of four methodsfixed for this study. Hence, it was decided to delete fouritems that did not meet the criteria of less than 4 methods.As illustrated in the Appendix B, 85% of the original itemswere retained following the content analysis.
Future directions and conclusion
It would be interesting to conduct studies using qualitativeanalysis to obtain content validity evidence for the RSCBS.Interview, Focus Group discussions and open-endedfeedback can be conducted to establish content validityevidences. The Content validity study that includesqualitative, quantitative and descriptive analysis can makethe instrument a good test with strong psychometricproperties. It is to be noted that this research only providesone type of validity evidence (content validity) for this

SCMS Journal o f Indian Management , July - September 201 5 66
A Quarterly Journal
potential measure. Content validity evidence is unitary andtherefore multiple evidences should be collected for a test(Mesick, 1991). Hence additional research is needed to gatherother validity evidence such as construct validity andcriterion-related validity evidence. Aside from the validityevidence, reliability evidence such as test-retest reliabilityand internal consistency of the items should also beobtained. Continuation of collecting validity evidence canbe conducted along with examining reliability issues whileperforming pilot studies.
Content validity marks a crucial phase in the selection andadministration of an instrument. The two-step method usedin this study, consisting of a developmental stage and ajudgment-quantification stage, called for a comprehensive
literature review, item creation, and agreement from a specificnumber of experts about the items’ and the entireinstrument’s validity. Ten experts were asked to identifyomitted areas and to suggest areas for improvement, andthese revisions were made. In the validation process severalstatistical measures were deployed to identify a welldeveloped set of items for each subscale. The researcherwas cautious enough in using a conservative level ofsignificance to retain items. By employing a clear definitionof the construct and the matching items by the experts’ratings and deploying appropriate statistical evidence theresearcher has lent consistency, rigor, and structure to theRSCBS Scale. This research will also provide an opportunityfor future researchers in re-examining and supporting orrefuting the outcome of this research.
Dimensions Items Items culled or adapted from
Job analysis and Keyselection Criteria
Job analysis is conducted to inform the job description Kim, S. & Lee, J.2011;
Job description is prepared to inform selection criteria Mckillip,2001;Wilk& Capelli,2003;
Job analysis is conducted to inform the job evaluation McKillip, 2001; Kotey & Sheridan, 2004;
Job analysis is conducted to inform the job authority McKillip, 2001;
Job analysis is conducted to inform standards of job performance Lievens et al, 2002;
Knowledge , Skills and attributes(KSA) required to perform the role is identified Victoria State Services Authority, 2008
Incumbents are involved in the process of identifying Knowledge , Skills and attrib utes(KSA)
Victoria State Services Authority, 2008;
Managers are involved in the process of identifying Knowledge, Skills and attributes Victoria State Services Authority, 2008;
Candidates are able to clearly understand the Key selection criteria Victoria State Services Authority, 2008;
Organization values are communicated to candidate in the recruitment and selection process Victoria State Services Authority, 2008;
Short listing Standard application form is used Victoria State Services Authority, 2008;
Recording and acknowledging applicants is done Victoria State Services Authority, 2008;
Scoring procedure is used to evaluate whether applicants meet the key selection criteria Victoria State Services Authority, 2008;
Applicants are matched to other roles to create a talent pool Victoria State Services Authority, 2008;
Interview andassessments
Structured behavior oriented interviews are conducted Wiesner & Cronshaw, 1988;
Interviews questions are structured around job related Knowledge , Skills and attributes Campion et al 1988;
Job knowledge tests are used for Technically oriented roles Hunter, 1986;
Work sample are used for technically oriented roles Howard, A., 1983;
Personality tests are used for assessing the candidates Tett et al, 1991;
Cognitive tests are used for assessing the candidates Ree et al, 1994;
Selection decisions are based on the criteria applicant achieve throughout the selectionprocess
Victoria State Services Authority, 2008;
Standard offer procedure is adopted Armstrong ,2003;
Reference checks are collected and properly documented Hedricks et al , 2013
The organization communicates performance results to candidates at the end of the selectionprocess
Mathis and Jackson (2003)
Induction Structured Induction programme is conducted Snell, 2006;
Buddy system is arranged Rigby,2008 ; Sharon Florentine,2014;
Formal feedback from the new starter is obtained Stein & Christiansen, 2010
APPENDIX A- Generation of item pools and its affiliate sources

SCMS Journal o f Indian Managemen t , July - September 201 5 67
A Quarterly Journal
Appendix B. Content Validity Evidence of Recruitment and Selection scale
ItemsJudges Summary Ratings Descriptive Methods Quantitative Methods Decision Rules ( If the conditions
for 4 out of 6 methods are met,Item will be Retained or elseRejected )
No. of.Conditionsmet
Decision
1 2 3 4 5 6 7 8 9 10 Median IA PA CVI CVR KA
RS1 3 4 3 4 3 3 4 3 3 3 3 2 100% 100% 1 0.77 6 Retained
RS2 3 4 3 4 4 3 4 3 3 3 3 2 100% 100% 1 0.8 6 Retained
RS3 1 2 1 2 1 3 3 1 2 2 2 3 18% 18% -0.64 0.27 0 Deleted
RS4 1 2 1 1 1 2 2 2 2 1 1.5 2 0% 0% -1 0.17 0 Deleted
RS5 1 1 1 1 1 2 2 2 2 1 1 2 0% 0% -1 0.13 0 DeletedRS6
4 4 3 3 4 4 4 3 3 3 3.5 2 100% 100% 1 0.83 6 RetainedRS7
4 2 2 4 4 3 3 3 3 3 3 3 82% 82% .81 0.83 6 RetainedRS8
4 4 3 4 4 4 3 3 3 3 3.5 2 100% 100% 1 0.83 6 RetainedRS9
4 4 4 4 4 3 3 3 3 4 4 2 100% 100% 1 0.87 6 RetainedRS10
4 4 3 4 3 4 4 4 3 3 4 2 100% 100% 1 0.87 6 RetainedRS11
4 4 4 3 3 4 4 3 3 4 4 2 100% 100% 1 0.87 6 RetainedRS12
4 4 2 4 3 4 4 3 3 4 4 3 91% 91% .81 0.83 5 RetainedRS13
4 4 3 4 3 4 4 3 3 4 4 2 100% 100% 1 0.87 6 RetainedRS14
4 4 4 4 3 4 3 2 3 3 3.5 3 91% 91% .81 0.80 5 RetainedRS15
3 4 2 4 3 3 4 3 3 3 3 3 91% 91% .81 0.73 5 RetainedRS16
3 3 3 3 3 3 4 3 3 3 3 2 100% 100% 1 0.70 5 RetainedRS17
3 4 4 3 3 4 3 3 3 2 3 3 91% 91% .81 0.73 4 RetainedRS18
4 4 3 3 3 3 4 2 3 3 3 3 91% 91% .81 0.73 5 RetainedRS19
3 3 3 3 3 4 4 3 4 1 3 4 91% 91% .81 0.7 5 RetainedRS20
4 3 3 3 3 3 4 3 4 4 3 2 100% 100% 1 0.83 6 RetainedRS21
4 4 3 3 3 4 4 4 3 3 3.5 2 100% 100% 1 0.85 6 RetainedRS22
3 4 3 3 4 4 4 4 3 3 3.5 2 100% 100% 1 0.85 6 RetainedRS23
4 4 3 3 4 4 4 4 3 3 4 2 100% 100% 1 0.87 6 RetainedRS24
1 1 1 2 2 1 1 1 2 1 1 2 0% 0% -1 0.10 0 DeletedRS25
4 3 3 3 4 4 4 2 3 3 3 3 91% 91% .81 0.77 6 RetainedRS26
4 3 3 3 3 4 4 2 4 4 3.5 3 91% 91% .81 0.80 5 RetainedRS27
4 3 3 3 4 4 4 2 3 3 3 3 91% 91% .81 0.77 5 Retained
(IA- Item Ambiguity, PA- Percent Agreement , CVI-Current Validity Index, CVR-Current Validity Ratio, VIK-Content alidity co-efficient)

SCMS Journal o f Indian Management , July - September 201 5 68
A Quarterly Journal
APPENDIX -CRECRUITMENT AND SELECTION CAPACITY BUILDING SCALE
Dear Sir /Madam,
Regards. We are conducting a survey on “Recruitment and Selection Capacity Building of HRM Functions .The surveyfocuses on identifying the important areas for improving and strengthening the Recruitment and Selection, This study willhugely benefit the organizations that are keenly looking to identifying, improving and strengthening vital areas of performanceenhancement.
Instructions (Tips to assess the form)
1. Item rating – You need to rate the item on the scale of 1 to 4. ( 1- No fit, 2-May fit, 3- Good Fit, 4-Excellent Fit)
2. Suggested Ratings – You can re-word/correct the item if need be
3. Is the item well written – Indicate Yes or /No
4. Is the item essential to the Domain /Category - Indicate either Yes or /No
Recruitment and Selection
Category
Recruitment and Selection
Category Specifications
Organizationally articulated proposal, with theoretical and practical constructions , to perform job analysis , identify KSAPrepare position description , Short listing, interview assessment and selection criteria and InductionItem rating scale :
1 2 3 4“No Fit" "Excellent Fit
Item# Item Item Rating Suggested Item Revisions Is the ItemWellWritten?
Is the ItemEssential totheDomain?
Job analysis and Key Selection Criteria
RS1 Job analysis is conducted to inform the job description 1 2 3 4Yes / No Yes / No
RS2 Job description is prepared to inform selection criteria 1 2 3 4 Yes / No Yes / NoRS3 Job analysis is conducted to inform the job evaluation 1 2 3 4 Yes / No Yes / NoRS4 Job analysis is conducted to inform the job authority 1 2 3 4 Yes / No Yes / NoRS5 Job analysis is conducted to inform standards of job
performance1 2 3 4 Yes / No Yes / No
RS6 Knowledge , Skills and attributes(KSA) required toperform the role is identified
1 2 3 4 Yes / No Yes / No
RS7 Incumbents are involved in the process of identifyingKnowledge , Skills and attributes (KSA)
1 2 3 4 Yes / No Yes / No
RS8 Managers are involved in the process of identifyingKnowledge, Skills and attributes
1 2 3 4 Yes / No Yes / No
RS9 Candidates are able to clearly understand the Keyselection criteria
1 2 3 4 Yes / No Yes / No
RS10 Organization values are communicated to candidate inthe recruitment and selection process
1 2 3 4 Yes / No Yes / No
B. ShortlistingRS11 Standard application form is used 1 2 3 4 Yes / No Yes / NoRS12 Record and acknowledge applicants 1 2 3 4 Yes / No Yes / NoRS13 Scoring procedure used to evaluate whether applicants
meet the key selection criteria1 2 3 4 Yes / No Yes / No

SCMS Journal o f Indian Managemen t , July - September 201 5 69
A Quarterly Journal
RS14 Applicants are matched to other roles to create a talentpool
1 2 3 4 Yes / No Yes / No
C. Interview and assessment criteriaRS15 Structured behavior oriented interviews are conducted 1 2 3 4 Yes / No Yes / NoRS16 Interviews questions are structured around job related
Knowledge , Skills and attributesRS17 Job knowledge tests are used for Technically oriented
rolesRS18 Work sample are used for technically oriented roles 1 2 3 4 Yes / No Yes / NoRS19 Personality tests are used for assessing the candidates 1 2 3 4 Yes / No Yes / NoRS20 Cognitive tests are used for assessing the candidates 1 2 3 4 Yes / No Yes / NoRS21 Selection decisions are based on the criteria applicant
achieve throughout the selection process1 2 3 4 Yes / No Yes / No
RS22 Standard offer procedure is adopted 1 2 3 4 Yes / No Yes / No
RS22 Standard offer procedure is adopted 1 2 3 4 Yes / No Yes / No
RS23 Reference checks are collected and properlydocumented
1 2 3 4 Yes / No Yes / No
RS24 The organization communicates performance results tocandidates at the end of the selection process
1 2 3 4 Yes / No Yes / No
D. InductionRS25 Structured Induction programme is conducted 1 2 3 4 Yes / No Yes / No
RS26 Buddy system is arranged 1 2 3 4 Yes / No Yes / No
RS27 Formal feedback from the new starter is obtained 1 2 3 4 Yes / No Yes / No
1. If you were to group together the items you rated at 3 or 4,would these items completely represent the category ofRecruitment and selection?
� Yes � No
References
Aiken, L. R. (1985). Three coefficients for analyzing thereliability and validity of ratings. Educational andPsychological Measurement, 45, 131-142.
Ajzen, I. and M. Fishbein (1980). Understanding attitudesand predicting social behavior.Englewood Cliffs, NJ:Prentice Hall.
Alderfer, C. P. and C. G. McCord (1970). Personal andsituational factors in the recruitment interview. Journalof Applied Psychology, 54: 377–385.
Allen, D. G., J. R Van Scotter, and R. F. Otondo (2004).Recruitment communication media: Impact on prehireoutcomes. Personnel Psychology, 57, 143-171. doi:10.1111/j.1744-6570.2004.tb02487.x
Alreck, P. L. and R. B. Settle (1995). The Survey ResearchHandbook, 2nd edition. Chicago:Irwin
Armstrong, M. A. (2003). “A Handbook of Human ResourceManagement Practice (9th ed.).” Kundli, replica pressltd.
Bagozzi, R.P. (1980). Causal Models in Marketing, New York,John Wiley.
Baker, M. J. (2003). “Data Collection - Questionnaire Design.”The Marketing Review, 3, 343-370
Barber, A. E. (1998). “Recruiting employees: Individual andorganizational perspectives.” Thousand Oaks, CA:Sage.
Beach, L. R. (Ed.). (1998). Image theory: Theoretical andempirical foundations. Routledge.
2. If the answer is No, please indicate what items should beadded. Are there items that you would recommend as ‘havingan excellent fit’ that have been omitted from this item bank

SCMS Journal o f Indian Management , July - September 201 5 70
A Quarterly Journal
Beck, C. T., and R. K. Gable (2000). “Postpartum DepressionScreening Scale: Development and psychometrictesting.” Nurse Researcher, 49, 272-282.
Best practices in recruitment and selection, Victoria StateServices Authority, 2008 Retrieved form the net on 1September 2014 http://www.ssa.vic.gov.au/products/view-products/best-practice-recruitment-and-selection-toolkit.html
BlackwellTett, R. P., D. N. Jackson, and M. Rothstein (1991).“Personality measures as predictors of jobperformance: A meta-analytic review.” PersonnelPsychology, 44, 703-742.
Breaugh, J. A. (1983). “Realistic job previews: A criticalappraisal and future research directions.” Academy ofManagement Review, 8(4), 612-619.
Breaugh, J. A. (2008). “Employee recruitment: Currentknowledge and important areas for future research.”Human Resource Management Review, 18, 103-118.doi: 10.1016/j.hrmr.2008.07.003
Breaugh, J. A. and R. B. Mann (1984). “Recruiting sourceeffects: A test of two alternative explanations.” Journalof Occupational Psychology, 57: 261–267.
Cable, D. M. and T. A. Judge (1996). “Person-organizationfit, job choice decisions, and organizational entry.”Organizational Behavior and Human DecisionProcesses, 67: 294–311.
Campion, M. A., E. D. Pursell, and B. K. Brown (1988).“Structured interviewing: Raising the psychometricproperties of the employment interview.” PersonnelPsychology, 41, 25-42.
Churchill, G. A. J. (1979). “A Paradigm for Developing BetterMeasures of Marketing Constructs.” Journal ofMarketing Research, 16, 64-73.
CIPD (2006). Recruitment, Retention and Turnover Survey.www.cipd.co.uk.
Cober, R. T., D. J. Brown, L.M. Keeping, and P. Levy (2004).“Recruitment on the Net: How Do Organizational WebSite Characteristics Influence.” Journal ofmanagement. Vol. 30, No. 5, pp. 623-646.
Collins C. J. and C. K. Stevens (2002). The Relationshipbetween early recruitment-related activities and theapplicationdecisions of new labor-market entrants: Abrand equity approach to recruitment. Journal ofApplied Psychology, 87,1121–1133.
Collins, J. (2001). Good to Great: Why Some CompaniesMake the Leap and Others Don’t.
Crocker, J. and J. Algina (1986). Introduction to Classical &Modern Test Theory. Forth Worth, TX: Harcourt BraceJovanovich College Publishers.
Dawis, R. V. (1987). Scale construction. Journal ofCounselling Psychology, 34(4), 481-489.
De Vellis, R. F. (2003). Scale development: Theory andapplications (2nd ed.). Thousand Oaks, CA: SagePublications, Inc.
Dipboye, R. L. (1997). “Structured selection interviews: Whydo they work? Why are they underutilized?” In NAnderson & P. Herriott (eds). International Handbookof Selection and Assessment. London: J Wiley, pp.455-474. In International handbook of selection andassessment (pp. 455-474).
Elkins, T.J. and Philips, J.S. (2000). “Job context, selectiondecision outcome, and the perceived fairness ofselection tests: Biodataas an illustrative case.”Journal of Applied Psychology, 85,479–484.
Evans, Christina, Judith Glover, Yvonne Guerrier, andCornelia Wilson (2007). “Effective recruitmentstrategies and practices : addressing skills needs andgender diversity challenges in ITEC and relatedsectors.” Retrieved from the net on 18 February 2015from http://www.balatonfelvidek- tapolcaiterseg.hu/digitalcity/servlet/ PublishedFileServlet/ AAAAVNWI/Effective_recruitment_strategies_and_practices.pdf
Grobler, P., S. Wärnich, M.R. Carrell, N.F. Elbert, and R.D.Hatfield, (2006). Human resource management inSouth Africa (3rd edn.). London: Thomson.
Hedricks, C.A., C. Robie, and F.L. Oswald (2013). Web-basedmultisource reference checking: an investigation ofpsychometric integrity and applied benefits,International Journal of Selection and Assessment,21(1), 99-110.
Hellsten, L. M. (2008). “Accumulating content validityevidence: Assessing expert panel ratings of itemrelevance and representativeness.” Presented at the2008 National Council on Measurement in EducationAnnual Conference, New York, NY, March 25, 2008.
Hough, L. M. (1992). “The big five personality variables-construct confusion: Description versus prediction.”Human Performance, 5,135-155.

SCMS Journal o f Indian Managemen t , July - September 201 5 71
A Quarterly Journal
Hough, L.M. and F.L. Oswald (2000). “Personnel selection:Looking toward the future- remembering the past.”Annual Review of Psychology, 57, 631 -664.
Hunter, J. (1986). “Cognitive ability, cognitive aptitudes, jobknowledge, and job performance.” Journal ofVocational Behavior, 29, 340-362.
Hunter, J. E. and R. F. Hunter (1984). “The validity and utilityof alternative predictors of job performance.”Psychological Bulletin, 96, 72-99.
Johnson, J. M., D. N. Bristow, and K. C. Schneider (2004).“Did You Not Understand The Question or Not? AnInvestigation Of Negatively Worded Questions inSurvey Research.” Journal of Applied BusinessResearch, 20, 75-85.
Judge, T. A., C. A Higgins, and D. M. Cable (2000). “Theemployment interview: A review of recent research andrecommendations for future research.” HumanResource Management Review, 10, 383-406.
Judge, T.A. and D.M. Cable (1997). “Applicant personality,organizational culture, and organizational attraction.”Personnel Psychology, 50, 359-394.
Kim, S. and J. Lee (2011). “A Study on the Development ofKorean Academic Libraries’ Duty Model Based on theJob Analysis.” Aslib Proceedings: New InformationPerspectives, 63(1), 76-100.
Koch, M.J. and R.G. McGrath (1996). “Improving LabourProductivity: Human Resource Management PoliciesDo Matter.” Strategic Management Journal, 17: 335–54.
Kotey, B. and A. Sheridan (2004). “Changing HRM Practiceswith Firm Growth.” Journal of Small Business andEnterprise Development. 11 (4): 474-485.
Lavigna, Robert J. (Winter 1996). “Innovation in Recruitingand Hiring: Attracting the Best and Brightest toWisconsin State Government.” Public PersonnelManagement. 25, 423-437.
Lawshe, C. H. (1975). “A quantitative approach to contentvalidity1.” Personnel psychology, 28(4), 563-575.
Lievens, F. (2002). “Trying to understand the different piecesof the construct validity puzzle of assessment centers:An examination of assessor and assessee effects.”Journal of Applied Psychology, 87, 675-686.
Lings, I.N. and G.E. Greenley (2005). “Measuring InternalMarket Orientation.” Journal of Service Research,7(3),290-305.
Linn, R. L. (1980). “Issues of validity for criterion-referencedmeasures.” Applied Psychological Measurement, 4(4),547-561.
Luk, G. H. and Chiu, D. K. (2006). Web-service BasedHuman Resource Recruitment by Using, 2006.EDOCW ’06. Enter-prise Distributed ObjectComputing Conference Workshops, 1-8. Re-trievedJanurary 2, 2012.
Lynn, M. R. (1986). “Determination and quantification ofcontent validity.” Nursing Research, 35, 382-385.
Lytle, R. S., P. W. Hom and M. P. Mokwa (1998). “SERV*OR:A Managerial Measure of Organizational Service-Orientation.” Journal of Retailing, 4.
Macan, T. H., M. J. Avedon, M. Paese and D. E. Smith (1994).“The effects of applicants’ reactions to cognitive abilitytests and an assessment center.” PersonnelPsychology, 47(4), 715-738.
Mason, N. A. and J. A. Belt (1986). “Effectiveness ofspecificity in recruitment advertising.” Journal ofManagement, 12, 425-432.
Mathis, Robert L. and John H. Jackson (2003). HumanResource Management, 10th edition, Cincinnati, OH:South-Western College Publishing.
McKillip (2001). “Case studies in job analysis and trainingevaluation.” International Journal of Training andDevelopment.
Mestre, M., A. Stainer, and L. Stainer (1997). “Employeeorientation - the Japanese approach.” Journal ofEmployee Relations, 19, 443–456.
Meyer, R. N. (2000). “Adult version: Australian scale for104sperger syndrome.” Retrieved March23,2009, from ASPIRES Online via http://w w w . a s p i r e s r e l a t i o n s h i p s . c o m /articles_adult_version_austrailian_scale_for_as.htm.
Netemeyer, R. G., W. O. Bearden, and S. Sharma (2003).Scaling procedures: Issues and applications.Thousand Oaks, CA: Sage Publications.

SCMS Journal o f Indian Management , July - September 201 5 72
A Quarterly Journal
Nunnally, J. C. and I. H. Bernstein (1994). Psychometrictheory (3rd ed.). New York: McGraw-Hill.Osburn, H. G.(2000).
Payne, S. L. (1980). The Art of Asking Questions, Princeton:NJ, Princeton University Press.
Peter, J.P. (1979), “Reliability: a review of psychometric basicsand recent marketing practices”, Journal of MarketingResearch, Vol. 16, February, pp.6-17.
Pilbeam, S. and M. Corbridge (2006). “People Resourcing.Contemporary HRM in Practice.” London:Prentice Hall.
Ployhart, R. E. (2006). “Staffing in the 21st century: Newchallenges and strategic opportunities.” Journal ofManagement, 32, 868– 897.
Polit, D. F., C. T. Beck, and S. V. Owen (2007). “Is the CVI anacceptable indicator of content validity? Appraisal andrecommendations.” Research in Nursing & Health,30, 459-467.
Price A. (2004). Human Resource Management in a Businesscontext, 2nd edition, Florence: Thomson Learning.
Ree, Malcom James, James A. Earles and Mark S. Teachout(1994). “Predicting Job Performance: Not Much Morethan g.” Journal of Applied Psychology,79 (August)pp.518-24.
Rigby, K. (2010). Bullying interventions in school: Six basicapproaches. Camberwell, VIC:Australian Council forEducational Research.
Roberson Q.M., J.C. Christopher and O. Shaul (2005). “TheEffects ofRecruitment Message Specificity onApplicant Attraction to Organizations”, J. Bus.Psychol., 19(3): 319-339.
Roberts, G. (2005), Recruitment and Selection, second edition,London: Chartered Institute of Personnel andDevelopment.
Ryan, A. M., L. McFarland, H. Baron, and R. Page (1999).“An international look at selection practices: Nationand culture as explanations for variability in practice.”Personnel Psychology, 52, 359-391.
Ryan, G., M. Gubern and I. Rodriguez (2000). “Recruitmentadvertising: The marketing-human resource interface.”International Advances in Economic Research, 6(2),354-364.
Rynes, S. L. (1991). “Recruitment, job choice, and post-hireconsequences.” In Dunnette, M.D.,& Hough, L. M.(Eds.), Handbook of industrial and organizationalpsychology (2nd ed.),Vol. 2: 399-444. Palo Alto, CA:Consulting Psychologists Press.
Rynes, S. L. (1993). “Who’s selecting whom? Effects ofselection practices on applicant attitudes andbehavior.” Personnel selection in organizations, 240,274.
Rynes, S. L., and D. M. Cable (2003). “Recruitment researchin the twenty-first century.” In W. Borman, D. Ilgen, &R. Klimoski (Eds.), Handbook of psychology: Vol. 12.Industrial and organizational psychology: 55-76.Tampa, FL: John Wiley.
Rynes, S. L., J. M. Bartunek, and R. L. Daft (2001). “Acrossthe great divide: Knowledge creation and transferbetween practitioners and academics.” Academy ofManagement Journal, 44, 340-355.
Rynes, S. L., R. D. Bretz, and B. Gerhart (1991). “Theimportance of recruitment in job choice: A differentway of looking.” Personnel Psychology, 44, 487–521.
Schmitt, N. and B. W. Coyle (1976). “Applicants’ decisionsin the employment interview.” Journal of AppliedPsychology, 61, 184-192.
Scholarios, D. and C. Lockyer (1999). “Recruiting andselecting professionals: Context qualities andmethods.” International Journal of Selection andAssessment, 7(3), 142- 156.
Shadish, W. R., T.D. Cook, and D. T. Campbell (2002).Experimental and quasi-experimental design forgeneralized causal inference. Boston: HoughtonMifflin Company.
Simoes, C., S. Dibb, and P.R. Fisk (2005). “Managingcorporate identity: an internal perspective.” Journalof Academic Marketing Science, 33(2), 153–168.
Sin, L. Y. M., A. C. B. Tse, and F. K. K. Yim (2005). “CRM:Conceptualization and Scale Development.” EuropeanJournal of Marketing, 39, 1264-1290.
Snell, A. (2006). “Researching On boarding best practice.”Strategic HR Review, 5, 32–35.
Stein, Mark and Lilith Christiansen (2010). “SuccessfulOnboarding: A Strategy to Unlock Hidden Value WithinYour Organization.” Marketing Science, 35 (1), 127 -143.

SCMS Journal o f Indian Managemen t , July - September 201 5 73
A Quarterly Journal
Taylor, M. S., and C. J. Collins (2000). “Organizationalrecruitment: Enhancing the intersection of theory andpractice.” In C. L. Cooper & E. A. Locke (Eds.),Industrial and Organizational Psychology: LinkingTheory and Practice, 304-334. Oxford, UK:
Tom, V. R. (1971). “The role of personality and organizationalimages in the recruiting process.” OrganizationalBehavior and Human Performance, 6, 573-592.
Torrington, D. and L. Hall (1998). Human ResourceManagement, London.
Walsh, G. and S. E. Beatty (2007). “Customer-based corporatereputation of a service firm: scale development andvalidation.” Journal of the Academy of MarketingScience.
Wanous J. P. (1973). “Effects of a realistic job preview onjob acceptance, job attitudes, and job survival”, J.Appl. Psychol., 8: 327–332.
******
Werbel, J.D., and J. Landau (1996). “The effectiveness ofdifferent recruitment sources: A mediating variableanalysis.” Journal of Applied Social Psychology, 26,1337 1350.
Wilk, S. L., and P. Cappelli (2003). “Understanding thedeterminants of employer use of selection methods.”Personnel Psychology, 56, 103-124.
Wolf, A. and A. Jenkins (2006). “Explaining greater testuse for selection: the role of HRprofessionals in aworld of expanding regulation.” Human ResourceManagement Journal, 16: 2, 193–213.
Wynd, C. A., B. Schmidt, and M. A. Schaefer (2003). “Twoquantitative approaches for estimating contentvalidity.” Western Journal of Nursing Research, 25(5),508-518.
Yun, J., and D. A. Ulrich (2002). “Estimating mea-surementvalidity: A tutorial.” Adapted Physical ActivityQuarterly, 19, 32-47.

SCMS Journal o f Indian Management , July - September 201 5 74
A Quarterly Journal
Gender Difference :Investment Behavior and
Risk TakingMalabika Deo and Vijayalakshmi Sundar
Key Words : Investment, Risk, Gender, Investor Behavior, Stock market.
Abstract
Malabika Deo
Professor, Department of Commerce,Pondicherry University, Puducherry.Email:[email protected] No. 9442140745
Vijayalakshmi Sundar
Research AssistantDepartment of CommercePondicherry University, Puducherry.Email:[email protected] No. 8807835434
Behavioral finance is a unique school of thought that applies to investment decisions unifying the concepts of finance,
economics, and psychology. Through investment, an individual is swapping the present cash outflow with a future cash
inflow. While the present is certain, future is uncertain, thus the cash inflow is uncertain, as a result the investor is exposed
to risk. As Investment comprises risk, it becomes essential for an investor to discern the various investment avenues and
the risk associated to it. The study focuses on the role of gender in investment behavior and risk taking, with a sample size
of 200 respondents using Mann-Whitney U-test and Chi-square statistics for hypotheses testing. It discloses that there is a
significant difference among men and women in investment behavior. It also confirms that men are strong risk takers, and
women on the other hand seemed not to tolerate uncertainty in investments, and prove to be more risk-averse than men.
Abstract
I ndians are said to be the wise savers but poor investors.The world’s fourth-largest economy with 1.2 billionpopulace and, India’s recent growth and development
has been one of the most significant achievements of thetimes. Over the six and half decades since independence,the country has brought about massive economic growthbut still inequity endures in all dimensions, including region,caste, and gender. Although the education level of womenstarted leaping, still many women feel a burden for theinvestment and also deal it with less confidence and theygenerally avoid taking risk in most matters leave asideinvestments.
A recent all-India survey has found that 80% of workingwomen have no investment. Despite handlingresponsibilities at their workplace, they depend on parentsand family members, friends, and financial advisers when itcomes to taking a call on money matters such as where andhow much to invest. The reasons for this behaviour varyfrom risk aversion, insufficient financial knowledge to evenlack of freedom to take financial decisions. Though thehuman psychology is perceived to be common but still there

SCMS Journal o f Indian Managemen t , July - September 201 5 75
A Quarterly Journal
exists difference between the genders, as male and femalereact differently to certain circumstances, environment,incident etc. When comes to investment and risk taking, itis believed that men and women differ in their mentality andbehaviour. As per the dictum of finance theories, all humanbeings are rational and behave in the same manner as far asexpectations, preference etc., are concerned as all are utilitymaximizers. However, as far as investments are concernedwhether the unifying rational prudence prevails over thepsychology of the gender need to be examined. The presentstudy tried to find whether gender plays a significant role ininvestment.
The volume of research in the field of behavioural financehas grown over the recent years and is very popular in stockmarkets across the world for investment decisions as marketsgo in cycles, from bull to bear vice versa. It took a verylogical premise about the tradeoff between risk and returnand added psychology. Perfect application of behaviouralfinance can make investors successful in their stock marketalso the basic mistakes namely emotional decisions, mentalerrors, herd mentality can be avoided. People expend toomuch time studying investment behavior and not enoughtime focusing on investor behavior. Regardless of what aninvestment does, it is the decisions of the investor to buy orsell that ultimately determines success or failure. This factis the underlying premise in behavioral finance.
Review of literature
Academic researchers have identified various psychologicalapproaches to elucidate gender difference in investmentbehaviour, and risk taking level of male and female.Researchers like Jianakoplos and Bernasek 1998, Charnessand Gneezy 2007, Beckmann and Menkhoff 2008, Tahira andCäzilia 2008, Nataliya et al. 2009 point to difference by genderin investment goals; risk tendency and investment returnprospect. Martenson (2008) observes that women werefound to have a preference for short-term achievements areless interested than men in making long-term investments,investment decisions and financial choices when comparedto men. Burton (1995) observes that the identities, self-esteem and sense of power held by men, are intrinsicallyconnected with the attainment and use of money whileobserving that women tend to seek immediate satisfactionthrough spending money wisely rather than acquiring it.Estes and Hosseini (1988) and also Charness and Gneezy(2007) found that these gender-based self-perceptions led
to men being more preoccupied and concerned than womenin investment and resource allocation decisions,both in family and social life situations.
When the Risk attitude is concerned, it is observed thatthere are differences between men and women (Byrnes et al.1999, Bernasek and Shwiff 2001, Dwyer et al. 2002, Felton etal. 2003, Faff et al. 2008, Neelakantan 2010). In a meta-analysisof 150 studies in which the risk-taking tendencies of maleand female participants were compared, Byrnes et al. (1999)suggest that men are generally more inclined towards risktaking than women. Using data from a survey of nearly 2000mutual fund investors, Dwyer et al. (2002) report that womenexhibit more careful and cautious risk-taking behaviour thanmen in their mutual fund investment decisions. Research onprofessional investors by Olsen and Cox (2001) observesthat women often follow a more careful investment strategyof systematically reducing the level of risk involved in theirdecisions. Unlike men, who are found to be orientated toincreasing returns, women appear to be more concernedwith ensuring steady returns from their investments andaccordingly exhibit greater tendency to select a return targetand then work systematically forward, reducing the riskinvolved.
Behavioural finance researchers such as Barber and Odean(2001), Gervais and Odean (2001) and Tahira and Ca¨zilia(2008) believe that in matters relating to finance andinvestments, men are temperamentally more over-confidentthan women and therefore tend to be more prone to riskydecisions. A number of researchers have questioned thewidely held and deterministic assumptions about theinfluence of gender on investment orientation and behaviourof men and women (Schubert et al. 1999, Olsen and Cox2001, Bliss and Potter 2002, Dwyer et al., 2002, Barasinska etal., 2009, Sapienza et al., 2009). Olsen and Cox (2001), thoughreporting that women are more careful and risk-consciousthan men, state that women are equally capable of makingfinancial choices and decisions. Schubert et al. (1999) arguethat women are not typically risk-averse and that they donot always make less risky financial choices than men.Schubert et al. further state that the comparative riskpropensity of men and women in financial choices depends,to a large extent, on the decision frame. Similarly, Dwyeret al. (2002) believe that the impact of gender on risk takingis significantly weakened when investor knowledge offinancial markets and investments was controlled.

SCMS Journal o f Indian Management , July - September 201 5 76
A Quarterly Journal
Tahira and Ca¨zilia (2008), while reporting that womeninvested less money, in less risky ventures than men did,point to the lesser possession of capital in the former groupas a contributory factor alongside their traditionally lesseraccess to education and information.While the aboveobservations challenge many of the assumptions about therole of gender difference in investment behaviour, theobjectives and hypotheses adopted as a starting point forthis research investigation are formulated in the light of theassumption that gender differences may influenceinvestment and risk preference among investors.
Objectives:
The overall objectives of the study are:
1. To find out whether there exist difference ininvestment choice between men and women, and
2. To find out whether there exist difference risk levelbetween men and women.
Hypotheses:
Based on the above objectives, the following hypothesiswere set
H01= There is no significant difference in the investment
preference between male and female.
H02= There is no significant difference in the risk preference
between male and female.
Data
To accomplish the aforementioned research objectives, dataare collected from a structured questionnaire survey of 200investors from Pondicherry under Convenient samplingtechnique. The Mann-whitney Rank Sum and Chi-squaretests have been applied for data analysis.
Demographic Profile of the Sample Respondents
This section presents the demographic and economiccharacteristics of the respondents with emphasis on genderdifferences which include age, marital status, education,monthly income and monthly investment. About three-fourth of the respondents were men (75%), and about one-third were women (25%). On average, respondents werethirty five years old, majority married (83%). About three-quarters of the respondents held a Bachelor’s degree (41.5%)and are full-time employees, typically in highly professionalpositions. While the three fourth of the sample reported anannual single income group earned over 200,000 annually,
on average, respondents reported annual investment of60000.
It is evident from Table 1 that a majority of respondents(45%) were between twenty six and thirty five. Almost threefourth of the men (70%) were under the age of thirty five;while just slightly near half of the men (30%) were under theage of thirty five. To indicate their marital status, participantscould choose among the following options: married; orsingle. Overall, the majority of the respondents were married(83%) among that more were men (75.9%) than women(24.1%).
The survey instrument requested educational details;possible answers included Master’s degree, Bachelor’sdegree, Vocational or technical school and High school orequivalent. Gender differences in levels of educationreported that a majority (41.5%) of the participants in thissample hada Bachelor’s degree and in that more were men(84.3%) than women (15.7%) and a very small percentage ofthe total sample (12%) indicated that they had a vocationalor technical school. A larger percentage of men (66.7%) thanwomen (33.3%) reported that they had a professional degree.Slightly more than one fourth of the respondents hadMasters’ degree. Information provided by the respondentsabout their occupations was grouped in five occupationalcategories that are recognized by Professional, Business,Employee, Retired and Others. Information provided by therespondents about their occupations was grouped in fiveoccupational categories that are recognized by Professional,Business, Employee, Retired and Others. Slightly less thanhalf (44.5%) of the respondents were employed personnel.They were engineers, managers, teachers, share brokers andbusinessmen. Slightly less than a quarter (15.5%) indicatedthat they held managerial positions such as financialanalysts, accountants, executives, educational admini-strators, and managers.A small percentage of therespondents (5.5%) indicated that they are retired, as canbe seen from the information presented in the table below.There were notable differences between the occupations ofmen and women in the study. The percentage of menemployed in the professional occupational category (64.5%)was slightly higher than that of women (35.5%). On the otherhand, majority of men (96.4%) than women (3.6%) wereengaged in their own business. As can be seen from Table1, a majority of the respondents (54.5%) incomes are between10000 and 25000. However, 15% of the respondents were inhighest income category, more than 600000 annually. Genderdifferences were notable on both ends of the income scale.

SCMS Journal o f Indian Managemen t , July - September 201 5 77
A Quarterly Journal
Nearly three fourth of the men are earning above 10000. Onthe one hand, slightly larger percentage of men (92.3%) thanwomen (7.6%) reported a monthly income above 50000. Table
Table 1: Demographic characteristics
1 summarizes respondents’ demographic characteristics andalso exhibits the profile of respondents gender wise.
Variable All Men Women
N % N % N %
Gender 200 100 150 75 50 25
AgeUp to 25 Years 11 5.5 4 36.4 7 63.626 - 35 Years 90 45 63 70 27 3036 - 45 Years 60 30 51 85 9 1546 - 55 Years 20 10 14 70 6 3056 - 65 Years 14 7 13 92.9 1 7.165 and Above 5 2.5 5 100 0 0
Marital StatusSingle 34 17 24 70.6 10 29.4Married 166 83 126 75.9 40 24.1
EducationMaster’s degree 60 30 37 61.7 23 38.3Bachelor's degree 83 41.5 70 84.3 13 15.7Vocational or technical school 24 12 16 66.7 8 33.3High school or equivalent 33 16.5 27 81.8 6 18.2
OccupationProfessional 31 15.5 20 64.5 11 35.5Business 56 28 54 96.4 2 3.6Employee 89 44.5 58 65.2 31 34.8Retired 11 5.5 11 100 0 0Others 13 6.5 7 53.8 6 46.2
Monthly IncomeUp to 10000 36 18 27 75 9 2510001 - 25000 109 54.5 77 70.6 32 29.425001 - 50000 42 21 33 78.6 9 21.4Above 50000 13 15 12 92.3 1 7.6
Investment preference and risk taking: An investigation.
The participants were asked to respond by saying “yes” or“no” if they prefer any of the following investment assetssuch as real estate, gold, debenture, deposits, insurance,shares, PO savings, and mutual funds. Detailed informationis included in Table 2. A majority of the respondents (84%)owned shares. Nearly half of all respondents indicated thatthey prefer to invest in deposits (42.5%), insurance (40.5%)and gold (39.5%). One fourth of the respondents ownedMutual funds and PO savings (22.5% and 22%). A much
smaller percentage of the participants indicated investmentis real estate (14%) and debentures (15.5%). Differencesbetween men and women in these areas were prominent.Comparatively, higher rate of the men prefers land (86.5),Real estate (100%), shares (82.1%), and mutual funds (82.1%)than women. About a quarter of the women in our samplemade frequent use of PO savings (22.7%). Similarly, whenquestioned about their deposits, women reported a slightlyhigher rate (64.7%) than men (35.3%). Also women showednil interest toinvestin real estate and debentures.

SCMS Journal o f Indian Management , July - September 201 5 78
A Quarterly Journal
In case of type of company they invest, a majority indicatedthat they prefer matured company. More than three fourthsof men prefer to invest in matured, newly established anddiversified company, however it is of some concern to notethat about slightly more women (56.9%) than men said thatthey prefer growth oriented company.We also included aquestion to determine their scrip preference in relation torisk. The options presented to them were: (a) High Returnwith High risk, (b) Low return with low risk, (c) Moderatereturn with Moderate risk. Also included question todetermine their risk tolerance level and the choices givenwas:(a) Low risk, (b) High Risk, (c) Moderate risk, and (d)No Risk. The results presented in Table 2 show that mostrespondents (68.5%) prefer scrip with moderate returns and
a smaller percentage (13%) indicated that they prefer Highreturn with High risk.The scrip preference variedsignificantly between men and women. A majority of thewomen (91.9%) indicated that they preferred to take lowreturn with low risk. On the other hand, majority of the men(95.6%), preferred to take Moderate return with Moderaterisk.The results also show that most respondents (30%) werewilling to take low risk, smaller percentage (8%) indicatedthat they were willing to take high risk.The willingness totake specific levels of risk in anticipation of specific levelsof return varied significantly between men and women. Amajority of the women (76%) indicated that they preferredto take low risks with their investments. On the other hand,no women prefer to take High risk.
Table 2: Investment preference and risk taking
Variable All Men Women
N % N % N %
Gender 200 100 150 75 50 25
Asset preferenceLand 74 37 64 86.5 10 13.5
Real estate 28 14 28 100 0 0
Gold 79 39.5 55 69.6 24 30.4
Debenture 31 15.5 31 100 0 0
Deposits 85 42.5 45 52.3 30 35.3
Insurance 81 40.5 51 63 30 37
Shares 168 84 138 82.1 30 17.9
PO Savings 44 22 34 77.3 10 22.7
Mutual Funds 45 22.5 40 88.9 5 11.1
Company Preference
Matured 74 37 68 91.9 6 8.1
Growth 65 32.5 28 43.1 37 56.9
Newly established 43 21.5 33 76.7 10 23.3
Diversified Company 18 9 15 83.3 3 16.7
Choice of Income
Risk free regular income 114 57 77 67.5 37 32.5
High yielding risk 28 14 26 92.9 2 7.1
Earnings Investment 38 19 25 65.8 13 34.2
Enhanced returns 30 15 20 66.7 10 33.3
Scrip Preference
High Return with High risk 26 13 16 61.5 10 38.5
Low return with low risk 37 18.5 3 8.1 34 91.9
Moderate return with Moderate risk 137 68.5 131 95.6 6 4.4
Risk tolerance levelLow risk 60 30 24 40 46 76High Risk 16 8 16 100 0 0
Moderate risk 58 29 32 55.1 26 44.9

SCMS Journal o f Indian Managemen t , July - September 201 5 79
A Quarterly Journal
Results and Discussion
H0
1= There is no significant difference in the investmentpreference between male and female.Mann Whitney U test revealed that there is a significantdifference between gender and investment preference(Rejected Null Hypothesis). Males (Mean Rank = 115.98,
Table 3Investment preference between Gender
n=150), Females (Mean Rank = 54.06, n=50), U=1428, Z=-6.624, p=.000)
From the data analysis and hypothesis, it is concluded thatmale and female respondents do differ in their investmentpreference.
Gender N Mean Rank Sum of Ranks
InvestmentPreference
Male 150 115.98 2703Female
Total
50
20054.06
Mann- Whittney U test
Test Statistics
Gender difference
Mann Whitney U 1428
Wilcoxon W 2703
Z -6.624
Asymp Sig. (2 tailed) 0
Chi-Square Analysis:
Association between gender and risk preference
H02= There is no significant difference in the risk preference between male and female.
Chi-Square value discovered that there is no significant relationship between gender and risk preference (Rejected NullHypothesis).Chi-Square value = 5.537, Asymptotic. Sig. value = 0.019 which is lesser than the critical value (P=0.05).
Table 4Chi-Square results
Particulars Value df Asymp. Sig.(2-sided)
Pearson Chi-Square 5.537a 1 0.019
Likelihood Ratio 6.851 1 0.009Linear-by-LinearAssociation
5.509 1 0.019
N of Valid Cases 200

SCMS Journal o f Indian Management , July - September 201 5 80
A Quarterly Journal
Conclusion
A review of literature clearly shows that one of the significantdeterminants of investment behavior is risk tolerance level.In our effort to better understand the behavior of this samplewe included a question to determine their risk tolerance level.It is believed that men are less risk averse and do moreinvestments which involve high risks but on the other handwomen are risk averse and not ready to take up riskyinvestments. Basically women don’t come forward to doinvestments while men do lot of investments. As Investorsreact in a different way in their investment and risk taking, itis a necessity to substantiate the general conviction thatmen and women differ in their investment behavior. Fromthe results, it is understood that there is a significantdifference among men and women in investment preference,most of men were willing to take average risk for averagereturns and a smaller percentage indicated that they werewilling to take above average risk for an above averagereturn. On the other hand women are not willing to take highrisk. Very few are willing to take medium risk but they ratherprefer less risk. Overall, we found that the majority ofrespondents were involved in daily money management,saved regularly, and were well-equipped with regular bankingproducts, such as checking accounts, retirement accounts,and life insurance.
The study revealed that the women of our sample took onmore responsibility for daily money management whereasthe men were the investment decision-makers. Men weremore active investors than the women in our sample, likewisethe men of our sample reported a higher financial risktolerance. Women said more often that they consult with anadvisor. The ownership of investment vehicles mirrors thesedifferences between men and women.They are different inchoosing scrip, company, sector etc., besides men areconfirmed to be a strong risk takers, women on the otherhand seemed not to tolerate uncertainty in investments,and prove to be more risk-averse than men as largepercentage of women invested in the minimum-risk portfolioavailable to them.
References
Barasinska, N. O., Badunenko, and D. Scha¨fer (2009). “Riskattitudes and investment decisions across Europeancountries – are women more conservative investorsthan men? [online].” DIW Berlin discussion paper, no.928. Retrieved from: SRRN: http://ssrn.com/abstract¼1342731
Barber, Brad and Terrance Odean (2001). “Boys will be boys:Gender, overconfidence, and common stockinvestment.”The Quarterly Journal of Economics116(1):261-292.
Beckmann, D. and L. Menkhoff(2008). “Will women bewomen? Analyzing the gender difference amongfinancial experts.”Kyklos, 61 (3), 364–384.
Bernasek, Alexandra and Stephanie Shwiff (2001). “Gender,risk, and retirement.”Journal of Economic Issues35(2):345-356.
Bliss, R.T. and M.E. Potter (2002). “Mutual fund managers:does gender matter?”Journal of business & economicstudies, 8 (1), 1–15.
Burton, D. (1995). “Women and financial services: somedirections for future research.”International journalof bank marketing, 13 (8), 21–28.
Byrnes, J.P., D.C. Miller, and W.D. Schafer (1999). “Genderdifferences in risk taking: a meta-analysis.”Psychological bulletin, 125 (3), 367–383.
Charness, G. and U. Gneezy(2007). “Strong evidence forgender differences in investment [online].” Departmentworking papers, University of California, 18 September.Retrievedfrom: SSRN: http://ssrn.com/abstract¼648735
Charness, G. and U. Gneezy (2007). “Strong evidence forgender differences in investment [online].” Departmentworking papers, University of California, 18 September.Retrievedfrom: SSRN : http://ssrn.com/abstract¼648735.
Dwyer, P.D., J.H. Gilkeson and J.A. List (2002). “Genderdifferences in revealed risk taking: evidence frommutual fund investors.” Economic letters, 76, 151–158.
Dwyer, P.D., Gilkeson, J.H. and List, J.A.(2002). “Genderdifferences in revealed risk taking: evidence frommutual fund investors.” Economic letters, 76, 151–158.
Estes, R. and Hosseini, J. (1988). “The gender gap on WallStreet: an empirical analysis of confidence ininvestment decision making.”The journal ofpsychology, 122 (6), 577–590.
Faff, R., D. Mulino, and D. Chai (2008). “On the linkagebetween financial risk tolerance and riskaversion.”Journal of financial research, 31, 1–23.

SCMS Journal o f Indian Managemen t , July - September 201 5 81
A Quarterly Journal
Felton, J., B. Gibson and D.M. Sanbonmatsu(2003).“Preference for risk in investing as a function of traitoptimism and gender.”The journal of behavioralfinance, 4 (1), 33–40.
Gervais, S. and T. Odean(2001). “Learning to beoverconfident.”Review of financial studies, 14 (1),1–27.
Jianakoplos, Nancy A., and Alexandra Bernasek(1998). “Arewomen more risk averse?”Economic Inquiry36:620-630.
Loibl, Cäzilia and Tahira K. Hira(2006). “A workplace andgender-related perspective on financial planninginformation sources and knowledgeoutcomes.”Financial Services Review15 (1):21-42.
Martenson, R. (2008). “Are men better investors thanwomen? Gender differences in mutual fund andpension investments.”Journal of financial servicesmarketing, 13 (1), 72–81.
Neelakantan, U. (2010). “Estimation and impact of genderdifferences in risk tolerance.”Economic inquiry, 48 (1),228–233.
Olsen, R.A. and Cox, C.M. (2001). “The influence of genderon the perception and response to investment risk:the case of professional investors.”The journal ofpsychology and financial markets, 2 (1), 29–36.
Sapienza, P., Z. Zingales, and D. Maestripieri(2009). “Genderdifferences in financial risk aversion and career choicesare affected by testosterone.” Proceedings of theNational Academy of Sciences of the United States ofAmerica, published ahead of print version 24 August,doi: 10.1073/pnas.0907352106.
Schubert, R., et al.(1999). “Financial decision-making: arewomen really more risk-averse?” AEA papers andproceedings, 89 (2), 381–385
******
SCMS Journal o f Indian Management , July - September 201 5 82
A Quarterly Journal
Employee’s Perceptiontowards e-HRM Implementation :
Indian Service Sector Chandra Sekhar and Manoj Patwardhan
Abstract
ecent technology development and explosion ofinformation technology (IT) in India have made itpossible to create real time, information-based self-
service cooperative work environment for employee workingin service organisation. It helps employee to keep knowledgecurrent in line with recent development and competeworldwide. In 2013, Bissola and Imperatori showeddevelopment of electronic human resource management(e-HRM) helpful in shaping employees organisationrelationship and in influencing the role of human resource.It is gaining more attention these days, needed to introducein the working organisations as suggested by Lin (2011).Likewise, e-HRM as a research stream emerged, asconsequence of latest technological advancements (Lujanet al., 2007). Though, over the time, human resourceprofessionals began to explore full range of opportunitiesfor using internet along with other technologies for deliveryof human resource services. In the word of Parry (2011),e-HRM can be defined as a means to upsurge thesignificance of the human resources (HR) functions, withinthe framework of resource-based view. Many HR
The paper aims to examine employee perception towards implementation of e-HRM in service organisation. Employees,
Managers, and HR professionals working in service sector interviewed to examine their perception towards implementation
of e-HRM. Responses were analysed using factor analyses. The main findings were large elimination and cutting of
redundant activities and a boost to the profit margins of service organisations. e-HRM seemed to be both motivator and
facilitator of change in the service industry of India. It reduces dependence on time consuming and error-prone human
resource paper trail.
Abstract
R
Mr. Chandra SekharPhD Research ScholarABV-Indian Institute of Information Technology& Management,Gwalior, Madhya Pradesh, IndiaEmail: [email protected]
Dr. Manoj PatwardhanAssociate ProfessorABV-Indian Institute of Information Technology& ManagementGwalior, Madhya Pradesh, IndiaEmail: [email protected]
Keywords: Electronic Human Resource Management, Employee, Managers, HR Professionals,Service organisation

SCMS Journal o f Indian Managemen t , July - September 201 5 83
A Quarterly Journal
professionals expressed its advantages and believed thatfeasibility of implementing e-HRM is much dependent onavailability of resources. Here, the word ‘implementing’ hasa general meaning, such as putting something into practice,making something work or having somewhat realised (Ruelet al., 2004). Technophiles expressed, this phenomenoncould help to reduce cost as well as number of personnel inHR section. It makes HRM role more strategic and drivingforce behind HRM value creation. The goal of gainingefficiency is often related to goal of reducing costs.Technophobia’s posits implementation and maintenance ofe-HRM systems involve huge investment, complex anddifficult to understand. These results in, less educatedemployee can lose their employment and personal value inorganisation as well as in societies. e-HRM speeds uptransaction processing, decreases information errors, andadvances the tracking and control of HR actions(Bondarouka et al., 2009). With e-HRM facility tomanagement, employee is expected to improve and help tocreate new paths for contributing in organisational successand considered as driving force behind HRM value creation.e-HRM is identified as catalyst towards achieving businessstrategies, and little interest among local companies to adoptit. Likewise, (Strohmeier 2007) concluded e-HRM could beunderstood as the application of information systems (IS)for both networking and supporting actors in their sharedperformance of HR activities. It reduces the repetitivepaperwork that HR specialists have to carry out (Han et al.,2013) and it improves service delivery (Lengnick-Hall andMoritz, 2003). Most of the respondents opined that, betterinternet facility in organisation is critical success factor forusing e-HRM in service organisation. It speeds up andstreamline the recruitment process, makes it easier and willbe main tech driver for recruitment process in the years tocome (Nura et al., 2012). By using e-HRM web-basedtechnologies, supervisors and personnel are maderesponsible for fulfilling the activities of HR role and bythese a new HR architecture is created. Huang and Taylor(2013) highlighted, HR plays more proactive role in shapingand reshaping users’ perceptions towards accepting such atechnology by better understanding, how systematicinterventions can be developed, used and evaluated. Theactivities offer opportunity to generate cost savings,efficiency improvements and need fulfilment of employeesand managers. So, e-HRM technology implementationenables HR professionals to do HR activities when thetechnology “possesses the specialist knowledge” and e-
HRM activities are based on well through thought of HRpolicies. Hence, still interesting to test end-user acceptance,satisfaction, and actual use behaviour of HR activitiesprovided through e-HRM within the service organisation.
The paper is organized and will proceed in the followingmanner. First, section of the paper describes the overallintroduction of e-HRM and its consequences. Secondsection of the paper proceeds with service industries inIndia and its international comparison. Third section of thepaper includes the brief literature review and researchersview on e-HRM and problem statement. In the same way,fourth section is followed by research methodology sectionand characteristics of the service industries. Fifth sectioncomprised demographic profile of the respondents. Sixthsection includes reliability and factor loadings of the factors.Seventh section includes result and discussion of the paperand in the end paper ends with the conclusion, implication,limitations, and future direction of the paper.
Service Industry in India
The services industry is one of the largest and fastest-growing sectors in the global market [1]. Its contribution tothe Indian economy is significant, with regard to employmentpotential and impact on national income [1]. The sectorexpanded with double-digit growth in the second half of the2000s [2]. And in 2013, it contributes to 60 per cent (%) ofthe country’s gross domestic product (GDP), 35 per cent ofemployment, a quarter of the total trade, and over half of theforeign investment inflows [1]. The services sector receivedforeign direct investment (FDI) equity inflows worth Rs179,150.49 crore (US$ 28.78 billion) in the period April 2000–August 2013, according to Department of Industrial Policyand Promotion (DIPP), India [1]. 80 per cent (%) of India’stotal exports are dominated by high-skilled services, suchas financial services, software business services, andcommunication services [1]. The expenditure of Indianbanking and securities companies on IT products andservices is expected to be around US$ 422 billion in 2013, a13 per cent (%) increase from 2012 [1]. These characteristicsof service sector in India are the main motivation for selectingthe concerned sector for present study.
International Comparison
In world GDP of US$70.2 trillion in 2011, the share of serviceswas 67.5 per cent (%), more or less the same as in 2001 [3].Interestingly the top 15 countries in terms of services GDPare same in overall GDP in 2011 [3]. This list includes the
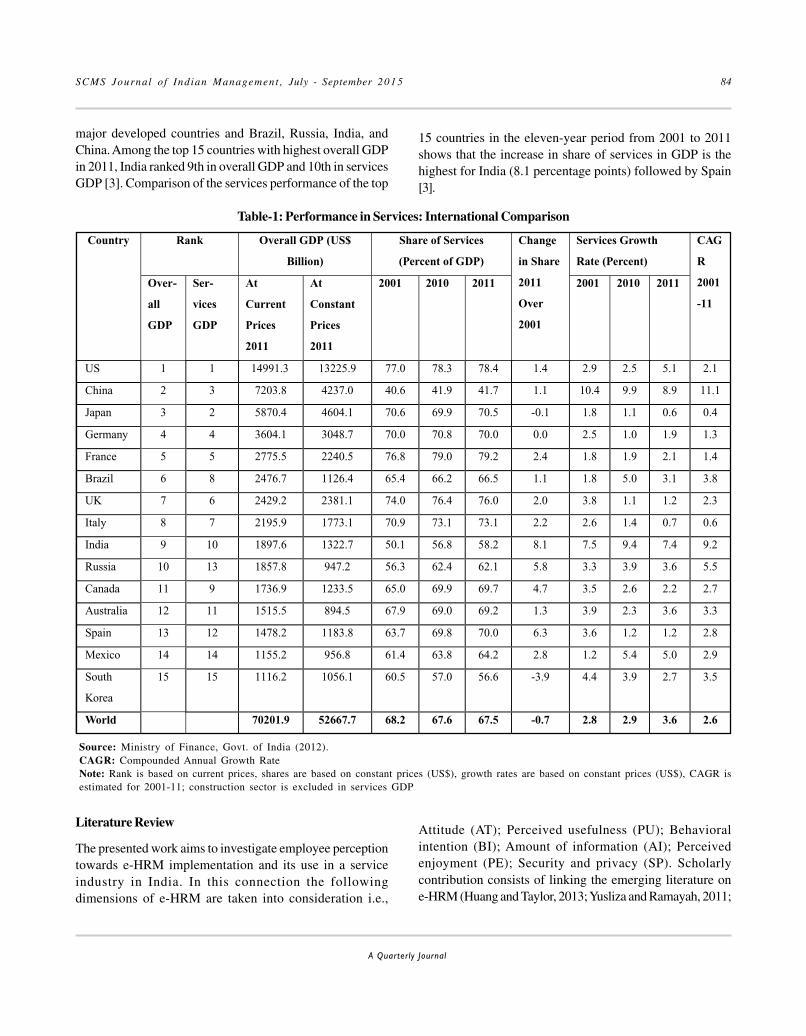
SCMS Journal o f Indian Management , July - September 201 5 84
A Quarterly Journal
major developed countries and Brazil, Russia, India, andChina. Among the top 15 countries with highest overall GDPin 2011, India ranked 9th in overall GDP and 10th in servicesGDP [3]. Comparison of the services performance of the top
Table-1: Performance in Services: International Comparison
15 countries in the eleven-year period from 2001 to 2011shows that the increase in share of services in GDP is thehighest for India (8.1 percentage points) followed by Spain[3].
Country Rank Overall GDP (US$
Billion)
Share of Services
(Percent of GDP)
Change
in Share
2011
Over
2001
Services Growth
Rate (Percent)
CAG
R
2001
-11
Over-
all
GDP
Ser-
vices
GDP
At
Current
Prices
2011
At
Constant
Prices
2011
2001 2010 2011 2001 2010 2011
US 1 1 14991.3 13225.9 77.0 78.3 78.4 1.4 2.9 2.5 5.1 2.1
China 2 3 7203.8 4237.0 40.6 41.9 41.7 1.1 10.4 9.9 8.9 11.1
Japan 3 2 5870.4 4604.1 70.6 69.9 70.5 -0.1 1.8 1.1 0.6 0.4
Germany 4 4 3604.1 3048.7 70.0 70.8 70.0 0.0 2.5 1.0 1.9 1.3
France 5 5 2775.5 2240.5 76.8 79.0 79.2 2.4 1.8 1.9 2.1 1.4
Brazil 6 8 2476.7 1126.4 65.4 66.2 66.5 1.1 1.8 5.0 3.1 3.8
UK 7 6 2429.2 2381.1 74.0 76.4 76.0 2.0 3.8 1.1 1.2 2.3
Italy 8 7 2195.9 1773.1 70.9 73.1 73.1 2.2 2.6 1.4 0.7 0.6
India 9 10 1897.6 1322.7 50.1 56.8 58.2 8.1 7.5 9.4 7.4 9.2
Russia 10 13 1857.8 947.2 56.3 62.4 62.1 5.8 3.3 3.9 3.6 5.5
Canada 11 9 1736.9 1233.5 65.0 69.9 69.7 4.7 3.5 2.6 2.2 2.7
Australia 12 11 1515.5 894.5 67.9 69.0 69.2 1.3 3.9 2.3 3.6 3.3
Spain 13 12 1478.2 1183.8 63.7 69.8 70.0 6.3 3.6 1.2 1.2 2.8
Mexico 14 14 1155.2 956.8 61.4 63.8 64.2 2.8 1.2 5.4 5.0 2.9
South
Korea
15 15 1116.2 1056.1 60.5 57.0 56.6 -3.9 4.4 3.9 2.7 3.5
World 70201.9 52667.7 68.2 67.6 67.5 -0.7 2.8 2.9 3.6 2.6
Literature Review
The presented work aims to investigate employee perceptiontowards e-HRM implementation and its use in a serviceindustry in India. In this connection the followingdimensions of e-HRM are taken into consideration i.e.,
Source: Ministry of Finance, Govt. of India (2012).CAGR: Compounded Annual Growth RateNote: Rank is based on current prices, shares are based on constant prices (US$), growth rates are based on constant prices (US$), CAGR isestimated for 2001-11; construction sector is excluded in services GDP
Attitude (AT); Perceived usefulness (PU); Behavioralintention (BI); Amount of information (AI); Perceivedenjoyment (PE); Security and privacy (SP). Scholarlycontribution consists of linking the emerging literature one-HRM (Huang and Taylor, 2013; Yusliza and Ramayah, 2011;

SCMS Journal o f Indian Managemen t , July - September 201 5 85
A Quarterly Journal
Zafar et al., 2010; Bondarouk et al., 2009). Body of empiricalresearch that discussed adoption of e-HRM in theorganisation (Strohmeier and Kabst, 2009; Galanaki andPanayotopoulou, 2008; Panayotopoulou et al., 2007; Ball,2001). Results showed that theoretical and empirical researchin this area is still at an early stage. Earlier researchers havesuggested e-HRM might support the HR role in becomingmore efficient, efficient service delivery system and adoptinga greater role in delivering the firm’s business. Main goal ofe-HRM is to produce efficiency gains or cost reductions byreducing headcount and removing administration, thisassertion is supported by the authors (Martin et al., 2008;Ruel et al., 2006; Snell et al., 2002). Panayotopoulou et al.,(2007) had identified array of reasons for e-HRM adoptionin an organisation which includes operating cost reduction(Stanton and Coovert, 2004) company image enhancementand time management etc. They concluded that collaborationbetween human resource (HR) and IT can be considered asthe most success factors for e-HRM adoption. It enhanceseffective evaluation of developmental activities and learningability of employee (Ensher et al., 2002). Likewise, Ruel etal., (2007) emphasized e-HRM research is still in its “youthphase” and could improve the HR service level and becomestrategic partner by giving space to HR department(Armstrong, 2005). They stated e-HRM were necessary tomeasure their value and uniqueness for the specificorganisation. The adoption of e-HRM affects theresponsibilities of different stakeholders for performing HRactivities. Likewise, Lengnick-Hall and Moritz (2003)identified three different levels of e-HRM that havedeveloped over time involves one-way communication fromorganisation to employees or managers through web-based
channels. The second higher-level involves automation oftransactions, workflow, and even supply-chain integrationwhere paperwork is replaced by electronic input. Managersand employees can access databases, update information,search for needed information, and make decisions. The thirdand highest-level involves transformation of HR system.The e-HRM systems are used to deliver training, manageemployee performance, administer compensation and helpsystems (Strohmeier, 2007; Gueutal and Stone, 2005). It werehelpful to increase the efficiency of HR practices, moderateadministrative costs, and decrease transaction times(Gueutal and Stone, 2005). Attitudes towards e-HRMimplementation should influence individuals’ behavioralintentions and behaviors when electronic systems are usedcompared to traditional HR systems for e-recruiting process(Braddy et al., 2008). The website characteristics influenceapplicants’ impressions of organisation. Likewise,technology developments have potential to generate morestrategic role than an administrative one for HR department(Lujan et al., 2007; Strohmeier, 2007). The ability to copewith changes in HR role and support that is provided toemployees during e-HRM implementations are deemedessential (Voermans and Veldhoven, 2007; Fisher andHowell, 2004). Likewise, Shabha (2000) stated wholetechnology have not only enhanced knowledge storingmethods and learning techniques but acted as catalyst tocombat inefficient HR practices and notable barriers ofinflexible organisational structures. In addition, Hall andMoritz (2003) still believes that it has potential to affectboth efficiency and effectiveness scientific in terms oforganisational decisions and e-HRM practices are more ofutilitarian in nature than a disaster (Nura et al., 2012).
Table-2: Researchers’ views on e-HRM from the period ranging from 2000 to 2013
Author Views on e-HRMBissola and Imperatori, (2013) e-HRM influences employee commitment and their
perceptions of competence in HR departments.Ruel and Kaap, (2012) e-HRM is anticipated as driving force behind HRM
value creation. It is in line with system's intendedpurpose and contextual factors.
Yusliza and Ramayah, (2011) e-HRM technology provides human resourcefunctions with opportunity to create new avenuesfor contributing in organisational success.
Zafar et al., (2010) e-HRM is in its init ial stage and has becomeimperative to meet HR challenges of 21st century.
Bondarouk et al., (2009) There are differences in use of e-HRM between linemanagers and employees. Its applications areassociated with HRM effectiveness.

SCMS Journal o f Indian Management , July - September 201 5 86
A Quarterly Journal
Sanayei and Mirzaei, (2008) e-HRM tools are rarely used, have a positive effecton HRM output in organization.
Ruel et al., (2007) e-HRM applications influences HRM technical andstrategic effectiveness. These will give HRdepartment space to become a strategic partner.
Hooi, (2006) e-HRM have significant impact on competitivenessof the industry, namely, recruitment, compensationand benefits, training and development,communication and performance appraisal.
Burbach and Dundon, (2005) e-HRM commonly used for administrative ratherthan strategic decision making purposes; and thefirms with e -HRM had better HRM informationcompared with non-e-HRM using companies.
Ruel et al., (2004) e-HRM is a concept - a way of ‘doing’ HRM.Helpful in implementing HR Policies, strategies,and practices in organisations through a consciousand directed support of and/or with the full use ofweb-technology-based channels.
Shrivastava and Shaw, (2003) e-HRM is expected to facilitate more efficient andstrategic way of working for HR professionals.
Snell et al., (2002) The main objective of e -HRM is to produceefficiency gains or cost reductions by reducingheadcount and removing administration.
Ball, (2001) e-HRM allows the managers to access data,relevant information, conducts analysis, makedecisions, and communicate with others withoutconsulting an HR professional.
Bowman and Ambrosini, (2000) e-HRM increase value through more efficientmanagement of generic labour and effective supportof differential labour.
Author Views on e-HRM
Problem Statement
After going through extensive literature review anddimensions revealed by earlier researchers, it has been clearlyindicated that there are very few studies that are carried outin Indian context with reference to e-HRM implementationin service organisation. e-HRM concept was implementedin international level and the outcomes of e-HRM help theservice sector in great manner. These inspired us to take upthe challenge to study the employee perception towardsimplementation of e-HRM in service organisation in India.Towards achieving these objective in Indian context onehas to focus on e-HRM in Indian service sector for the betterprogress. The authors therefore have identified that theproblem lies in the perception of employees whileimplementing e-HRM.
Research Methodology
The survey questions relating to six scales adapted fromexisting literature viz. Attitude (AT); Perceived usefulness(PU); Behavioral Intention (BI); Amount of information (AI);Perceived enjoyment (PE); Security and privacy (SP). Thethree dimensions including Attitude; Perceived usefulness;Behavioral Intention related questionnaire consisted of 11(Eleven) statements are adapted from Nura et al., 2012. Thedimension so called Amount of information; Perceivedenjoyment and Security and privacy, consists of 9 (Nine)statements are adapted from Pikkarainen et al., 2004.
Characteristics of the service sector
Enterprises from the samples were independent and areoperating in diverse activities sectors covering both low

SCMS Journal o f Indian Managemen t , July - September 201 5 87
A Quarterly Journal
and high technology environments, to obtain a completeand general outlook. The service organisation in samplehas diverse activity areas includes consulting firm (35.13%);Banking (33.58%); Retailing (31.29%) of the total samplesize.
The survey instrument for this research was structuredsurvey questionnaire. The structured questionnaire usedLikert scales ranging from strongly disagree to stronglyagree. It is to be noted that, the questionnaire as a surveyinstrument for this research, were more helpful due to itssimplicity, its versatility and its low cost as a method ofcollecting data (Singh et al., 2010). The strategy for collectionof responses carried out exclusively through internet(E-mail) and field survey. It was useful as it enabled theresearcher to be present in administering the questionnaireand allowed for greater response rate. Participation wasvoluntary and respondents were assured confidentiality ofdata. Three hundred fifty (350) questionnaires were
distributed to employees, managers, and HR professionalsusing convenience sampling. The data obtained from thequestionnaire were reduced using factor analysis. Thesoftware used for the statistical analysis was SPSS version19. Before using data for analysis, the normality conditionof data was checked. The standard range for normality isskewness and kurtosis lying between -1 and 1 (Chan, 2003).In 2009, Hair et al. describes for sample size < 30, significantdepartures from normality can have large impact on results.On the basis of reviewed literature, the data fulfills normalityand other assumptions and could be used for analysis.
Demographic profile of sample respondents
The characteristics of sample were summarized in Table 3. Atotal of 173 questionnaires were returned from 350 sent, 131of which were useable. This translates into an overallresponse rate of 49.42 per cent, and a usable response rateof 37.42 per cent.
Table-3: Demographic characteristics of sample respondents
Profile of the Respondents Frequency Percent (%) Mean StandardDeviation
Respondents Gender
Male 73 55.7%1.44 .49Female 58 44.3%
Respondents AgeBelow 25 14 10.7%
2.79 1.1025 - 35 44 33.6%36 – 45 37 28.2%46 – 55 27 20.6%56 and above 9 6.9%Respondents Marital StatusUnmarried 44 33.6%
1.66 .47Married 87 66.4%Respondents Academic QualificationGraduate 30 22.9%
2.32 .94Post-Graduate 41 31.3%Professional Degree 47 35.9%Others 13 9.9%Respondents Annual Income ( Indian Rupees)Below Rs. 100000 23 17.6%
2.90 1.33100001 – 300000 30 22.9%300001 – 500000 37 28.2%5, 00001 – 7, 00000 18 13.7%Above 700001 23 17.6%Respondents Work Experience (Years)1 - 5 yrs. 28 21.4%
3.68 1.88
6 - 10 yrs. 36 27.5%11 - 15 yrs. 23 17.6%16 - 20 yrs. 20 15.3%21 - 25 yrs. 14 10.7%More than 26 yrs. 10 7.6%

SCMS Journal o f Indian Management , July - September 201 5 88
A Quarterly Journal
Reliability
To establish internal consistency, Cronbach’s á value forreliability were calculated. The scales were reliable, withcomposite reliabilities ranging from 0.71 to 0.87, greater thanthe benchmark of 0.70 (Nunnally, 1978). The generallyapplied acceptability limit for Cronbach’s alpha has value0.70 (Hair et al., 1998). Table 4 shows the reliability level foreach scale and factor loadings for each item in a scale.
Exploratory factor analysis
Beforehand conducting the analysis, tests of samplingadequacy were first conducted. The Kaiser–Meyer–Olkin(KMO) statistic is 0.66, appropriately greater than therecommended cut off of 0.60. Furthermore, Bartlett test of
sphericity was significant at the 1% level. Construct validity(convergent and discriminant) is checked throughexploratory factor analysis. High loadings on one factorand no cross loading showed convergent and discriminantvalidity (Fornell and Larcker, 1981). The principal componentmethod was used to extract factors with an initial setting forEigen values >1.0 (Field, 2005). Orthogonal rotation (varimax)was applied to reduce potential multi-colinearity among theitems. High loading on the same factor and no large crossloading confirm convergent validity and discriminant validity.
Factor analysis results of Attitude (AT), Perceivedusefulness (PU), Behavioral intention (BI), Amount ofinformation (AI), Perceived enjoyment (PE), and Securityand privacy (SP) scale are shown in Table 4.
Table-4: Factor loadings and composite reliability (CR)
Factor items and composite reliability (CR) Factor LoadingAT PU BI AI PE SP
Attitude (AT); (CR=0.80)AT1 I feel confident with e-HRM 0.82AT2 I feel more committed to duty with e-HRM 0.67AT3 I enrich my skills with e-HRM 0.77AT4 I feel motivated with e-HRM 0.87Perceived Usefulness (PU); (CR=0.87)PU1 e-HRM is better up security wise 0.87PU2 e-HRM brings along efficiency and effectiveness 0.86PU3 e-HRM increases organisational performance 0.81PU4 e-HRM increases reliability 0.83Behavioral Intention (BI); (CR=0.81)BI1 e-HRM would inculcate the habit of discipline in
workers0.84
BI2 e-HRM would get deviant behaviors checked andreduced in my organisation
0.77
BI3 e-HRM would facilitate quick decision in myorganisation
0.87
Amount of information (AI); (CR=0.71)AI1 I has generally received enough information about e-
HRM0.85
AI2 I have received enough information about the benefits ofusing an e-HRM
0.84
Perceived enjoyment (PE); (CR=0.79)PE1 Using an e-HRM is pleasure 0.89PE2 Using an e-HRM is positive framework of mind 0.87Security and privacy (SP); (CR=0.82)SP1 I trust in the technology an e-HR is using 0.67SP2 I trust in the ability of an e-HRM to protect my privacy 0.82SP3 I trust in an e-HRM as an Organisation 0.83SP4 Using an e-HR is financially secure 0.74SP5 I am not worried about the security of an e-HRM 0.75Eigenvalue 3.69 3.11 2.54 1.88 1.56 1.50Percent of variance explained 18.48 15.58 12.75 9.44 7.79 7.52Total Variance explained 71.56
Table 4 shows the reliability level for each scale and factor loadings for each item in a scale

SCMS Journal o f Indian Managemen t , July - September 201 5 89
A Quarterly Journal
Table-5: Demonstrate inter-construct correlation
Variables AT PU BI AI PE SP
Attitude (AT) 1
Perceived Usefulness (PU) .879 1
Behavioral Intention (BI) .421 .308** 1
Amount of information (AI); .104 .507 .157 1
Perceived enjoyment (PE); .903 .882 .519 .439 1
Security and privacy (SP); .535 .517 .508 .360 .223* 1
Results and discussion
The outcome of the data analysis showed that theimplication of e-HRM implementation had significant,positive effect on HRM effectiveness in serviceorganisation. This means how employees, managers andHR professionals judge the content and design of e-HRMapplication and the extent to which they perceive the e-HRM to be technically effective. When they feel positiveabout the content of an e-HRM application, it is easier forthe employer to implement in service organisation. In generalterms, the authors found that employees, managers and HRprofessionals favored the introduction of e-HRM in serviceindustry in India. However, the experienced employee andmanagers are needed to support the shop-floor employeesin handling the new technology for its better use. All thefactors are in line with the earlier researchers.
Factor 1: Attitude
This factor measures the employee, managers and HRprofessional’s attitude towards the e-HRM implementationin the service organisation. It explained 18.48% of itsunderlying variables and its Eigen value is 3.69. It is acomposite index of four variables with reliability coefficientof 0.80 and the factor loading ranging from 0.67 to 0.87. Thevariable motivated with e-HRM 0.87and confident with e-HRM 0.82 was contributing more weight to the factor attitudefollowed by skills enrichment with e-HRM 0.77 andcommitted to duty with e-HRM 0.67. It revealed thatorganisation should give more emphasis on conducting theimplementation and motivation program related to e-HRM,so that employee that employee can understand theimportance of e-HRM in the service organisation. Thepresent finding is further in line with earlier researches thatemployee’s attitude is significant to the e-HRM
Notes: *Correlation is significant at the 0.05 level (two-tailed); **correlation is significant at the 0.01 level (two-tailed)
Table 5 demonstrates inter-construct correlation between the dimensions
implementation in the organisation (Nura et al., 2012; Tanand Teo, 2000). Developing the positive attitude amongemployee will be an added advantage towards achievingsuccess. Positive attitude should be developed through softskill development program within the service organisation.
Factor 2: Perceived Usefulness
This factor measures the degree to which person believesthat using an e-HRM enhance his or her job performance(Davis et al., 1989). The factor perceived usefulness consistsof 15.58% of its total variance of its underlying variableswith Eigen value 3.11. It is a composite index of four variableswith reliability coefficient of s 0.87 and the factor loadingranging from 0.81 to 0.87. The result indicated that, allvariables were contributing significant weight to thedimension. The result of the present study is in line with theearlier study that e-HRM implementation enhances his orher job performance (Nura et al., 2012; Tan and Teo, 2000).Here, perceived usefulness is the degree of managerialobligation to use e-HRM in the organization. Managerialobligation is to develop positive attitude of employeestowards e-HRM implementation in the organization.
Factor 3: Behavioral Intention
This factor measures the employee, managers and HRprofessional’s behavioral intention, as the amount of effort,one is willing to exert and meet a goal (Nura et al. 2012). It isthe employee’s perceived likelihood towards e-HRMimplementation. It explained 12.75% of its underlyingvariables and its Eigen value is 2.54. Factor Behavioralintention is a composite index of three variables withreliability coefficient 0.81 and the factor loading rangingfrom 0.77 to 0.87. This shows that variable such as helpquick decision in the organisation 0.87 and would inculcate

SCMS Journal o f Indian Management , July - September 201 5 90
A Quarterly Journal
the habit of discipline in workers 0.84, contributing moreweight to the factor and having more importance in thedimension. This factor is in line with the earlier research(Nura et al., 2012). It specified that employee intentiontowards e-HRM implementation could add help to the serviceorganisation.
Factor 4: Amount of information
This factor measures the amount of information employeeshave about e-HRM technology and is identified as a majorfactor impacting the adoption in the organisation(Pikkarainen et al. 2004). This factor, amount of informationconsists of 9.44% of its total variance of its underlyingvariables with Eigen value 1.88. It is a composite index oftwo variables with reliability coefficient 0.71, factor loadingof received enough information about e-HRM is 0.85 andreceived enough information about the benefits of using ane-HRM is 0.84. Both the variables were contributingsignificant weight to the factor. This factor is in line with theearlier study (Pikkarainen et al., 2004; Sathye, 1999). e-HRMimplementation is a new experience for many employees andlow awareness about the technology are the major hindrancefor not adopting technology in the organisation.Organization has to conduct a seminar on e-HRMimplementation in the organization so that employees becomeaware about the technologies which are being implemented.This leads to easy acceptance of technology by employeesin service organization.
Factor 5: Perceived enjoyment
This factor measures the extent to which activity of usingan e-HRM technology is perceived to be enjoyable in itsown right (Pikkarainen et al., 2004). It explained 7.79% of itsunderlying variables and its Eigen value is 1.56. It is acomposite of two variables with reliability coefficient 0.79factor loading using an e-HRM is pleasure 0.89 and usingan e-HRM is positive framework of mind 0.87. Both thevariables were contributing supplementary weight and areimportant to the factor. This factor is in line with the earlierstudy and is found to have the effect on the e-HRMimplementation in the organisation (Pikkarainen et al., 2004;Teo et al., 1999; Davis et al., 1989). e-HRM implementationin service organisation could provide with an enjoyablelearning experience for employees.
Factor 6: Security and privacy
This factor measures the security and privacy to theacceptance of e-HRM technology, are noted in many earlier
studies (Pikkarainen et al., 2004; Black et al., 2002; Tan andTeo, 2000; Sathye, 1999). The factor security and privacyconsist of 7.52% of its total variance of its underlyingvariables with Eigen value 1.50. It is a composite index offive variables with reliability coefficient 0.82 with factorloading ranging from 0.63 to 0.83. The variable trust in an e-HRM as an Organisation 0.83 and trust in the ability of an e-HRM to protect my privacy 0.82 were contributing moreweight to the factor. Followed by not worried about thesecurity of an e-HRM 0.75; using an e-HR is financiallysecuring 0.74; and trust in the technology, an e-HR is using0.67. The factor is in line with the earlier study and has animpact on e-HRM technology implementation in serviceorganisation (Pikkarainen et al., 2004). Security and privacyis confidence booster of the employees towards e-HRMimplementation and its use in service organisation.
Conclusion
In this research, the employee perceptions towardsimplementation of e-HRM in service industry were examinedalong with their related factors. Findings have insightfulimplication for academicians and for industry people. Thefactors that were considered for the study were in line withthe earlier research and have a significant influence onimplementing e-HRM in the service organisation. e-HRMreduces dependence on time consuming and error-pronehuman resource paper trail. But, as always, technologycomes with its inherent risk- that of huge set up costs,overkill and loss of the “human touch.” Hence, it is veryimportant for the HR professionals to have prior informationbeing implemented for the purpose to get comfortable withtechnology before they make other people see the value ofsuch tools. Employee attitude should be considered(positive and negative) prior to the e-HRM implementationin service organisation. This makes sure the safety as wellas perceived enjoyment for employee. Most of therespondents opined that better internet facility inorganisation is the success factor for using the e-HRM inthe organisation. Today’s e-HRM implementation offersincreasingly sophisticated functionality giving enterprisesthe opportunity to automate labour intensive processes anddevolve routine transactions to line managers, HRprofessionals and, to employees themselves. In nutshell itcan be said that challenges are many and havingphenomenal implications like huge set-up costs to supportrobust tech-infrastructure. The limitations in mappingphysical human resource processes into e-HR process, toomuch focus on aggressive timelines in project execution,

SCMS Journal o f Indian Managemen t , July - September 201 5 91
A Quarterly Journal
possible conflicts with respect to process ownership byhuman resource and information technology departments,etc. It gives managers and HR professionals with more timeto focus on strategic tasks and manage better the company’smost important resource- its people.
Implication
The study provides an insight for managers and HRprofessionals in context to e-HRM implementation in theservice organisation. The employee’s positive attitudetoward the e-HRM implementation reduces the predicamentrelated to resistance to change. e-HRM seemed to be both amotivator and facilitator of change in service industry ofIndia. The structure of service industry has changedsignificantly in recent years as it has technologically backedup opportunities to enter into the market resulting intoemergence of new technology-based services organisation.Through e-HRM, service organisation can combinecomputing and communications to facilitate ordering andproduct tracking. Its functions often are implemented asmanual processes; mechanizations of older, ideally, but, theyinclude fundamental redesign of processes. The e-HRMimplementation in service organizations can employ tomanipulate the performance and behaviour of the people onwhom they rely on to achieve business success.
The use of e-HRM in service organisation is believed to bean opportunity for employee, managers and HR professionalsto become strategic partners of the business. Corporationsthat have successfully tackled the challenges of e-HRMhave made life easier for employees. Its implementationmakes it possible for service organisation to performstrategic HR more efficiently, while at the same timepreserving quality standards for more routine HR operationaltasks, like administration, performance reporting. If itsinstallation is taken up in the right direction, considering allthe challenges, can take an organization a long way towardssuccess and manage better the company’s most importantresource- its people.
Since, service industries are technologically driven, theapplication of e-HRM will be immensely required for theeffectiveness of the service organisation. HR managers willbe able to capitalize the strengths of their employees tocater the goals of the organisation. Perceived usefulnesswill enhance the reliability among the employees which inturn will focus on customer satisfaction. The novelty of thepaper is: paper addresses an important sector that is servicesector whose contribution to nation (60%) GDP is significant
as compared to other sectors. Employees, Managers andHR professional working in service organisation areconsidered for the study.
Limitations and Future Direction
The study was carried out on specific organisation of serviceindustries operating in central India. Small sample size hasan effect on the generalisation of the findings that mighthave a concern for user’s acceptance. Furthermore, weencourage researchers to consider the manufacturing sectorfor the future study. Consideration of other sectors apartfrom Consulting; Banking; and Retailing sector for the studymay result in more generalization of findings.
Notes
[1]. http://www.ibef.org/industry/services.aspx (servicedata accessed on 14-01-2014).
[2] ht tp: / /www.indiastat .com/table/economy/8/10.servicessector/767395/767404/ data.aspx (accessedon 07-01-2014).
[3] ht tp: / /www.indiastat .com/table/economy/8/10.servicessector/767395/767398/ data.aspx (accessedon 07-01-2014).
References
Armstrong, G. (2005). “Differentiation through people: Howcan HR move beyond business partner.” HumanResource Management, Vol. 44 No. 2, pp. 195-199.
Ball, K.S. (2001). ‘The use of human resource informationsystems: a survey.” Personnel Review, Vol. 30 No. 6,pp. 677-693.
Bissola, R. and B. Imperatori (2013). “Facing e-HRM: Theconsequences on employee attitude towards theorganisation and the HR department in Italian SMEs.”European Journal of International Management, Vol.7 No. 4, pp. 450-468.
Black, N.J, A. Lockett, H. Winklhofer, and S. McKechnie(2002). “Modelling consumer choice of distributionchannels: an illustration from financial services.” TheInternational Journal of Bank Marketing, Vol. 20 No.4, pp. 161-173.
Bondarouk, T., H. Ruel, and D.V.B. Heijden, (2009). “e-HRMeffectiveness in a public sector organization: A multi-stakeholder perspective.” The International Journalof Human Resource Management, Vol. 20 No. 3, pp.578–590.

SCMS Journal o f Indian Management , July - September 201 5 92
A Quarterly Journal
Bowman, C. and V. Ambrosini (2000). “Value Creation versusValue Capture: Towards a Coherent Definition of Valuein Strategy” British Journal of Management, Vol. 11,pp. 1–15.
Braddy, P.W., A.W. Meade, J.J. Michael, and J.W. Fleenor(2008). “Internet recruiting: Effects of website featureson organizational culture” Paper presented at the 23rd
annual conference society of industrial andorganizational psychology, San Francisco, CA.
Burbach, R. and T. Dundon (2005). ‘The strategic potentialof human resource information systems: evidence fromthe Republic of Ireland.” International EmploymentRelations Review, Vol. 11 No. ½, pp. 97–117.
Chan, Y.H. (2003). “Biostatistics 101: data presentation.”Singapore Medical Journal, Vol. 44 No. 6, pp. 280-285.
Davis, F.D. and V. Venkatesh (1996). “A critical assessmentof potential measurement biases in the technologyacceptance model: three experiments.” InternationalJournal of Human-Computer Studies, Vol. 45, pp. 19-45.
Davis, F.D., R.P. Bagozzi, and P.R. Warshaw (1989). “Useracceptance of computer technology: a comparison oftwo theoretical models.” Management Science, Vol.35 No. 8, pp. 982-1003.
Ensher, E.A., T.R. Nielson, and E. Grant-Vallone (2002). “Talesfrom the hiring line: effects of the internet andtechnology on HR processes.” OrganizationalDynamics, Vol. 31 No. 3, pp. 224-244.
Field, A.P. (2005). “Discovering Statistics Using SPSS” SagePublications, London.
Fisher, S.L. and A.W. Howell (2004). “Beyond useracceptance: examination of employee reactions toinformation technology systems.” Human ResourceManagement, Vol. 43 No. 2/3, pp. 243-258.
Fornell, C. and D. Larcker (1981). “Evaluating structuralequation models with unobservable variables andmeasurement error.” Journal of Marketing Research,Vol. 18, pp. 39"50.
Galanaki, E. and L. Panayotopoulou (2008). “Adoption andsuccess of e-HRM in European firms.” in Torres-Corronas, T. and Arias-Oliva, M. (Eds), Encyclopediaof Human Resource Information Systems, IGI Global,Hershey, PA pp. 24-30.
Gueutal, H.G. and D.L. Stone (Eds.) (2005). “The brave newworld of e-HR: Human resources management in thedigital age.” San Francisco, CA: Jossey-Bass
Hair Jr., J. F., W. C. Black, B. J. Babin, R. E. Anderson, and R.L. Tatham, (2009). “Multivariate Data Analysis”Pearson Education, New Delhi.
Hair Jr., J.F., R.E. Anderson, R.L. Tatham and W.C. Black(1998). ‘Multivariate data analysis’ 5th Edn. PrenticeHall, Englewood Cliffs.
Han, Y., J.J. Zhang, and S.T. Huang (2013). “China’s civilservice adopts e-HRM up to a point: Most officesblend paper-based and electronic systems.” HumanResource Management International Digest, Vol. 21No. 4, No. 33-34.
Hooi, L.W. (2006). “Implementing e-HRM: The readiness ofsmall and medium sized manufacturing companies inMalaysia.” Asia Pacific Business Review, Vol. 12 No.4, pp. 465-485.
Huang, J. and M. Martin-Taylor (2013). ‘Turnaround useracceptance in the context of HR self-service technologyadoption: An action research approach.”International Journal of Human ResourceManagement, Vol. 24 No. 3, 621-642.
Igbaria, M., J Iivari, and H Maragahh (1995). “Why doindividuals use computer technology? A Finnish caseStudy.” Information & Management, Vol. 29, pp. 227-238.
Lengnick-Hall, M.L. and S. Moritz (2003). “The impact of e-HR on the human resource management function.”Journal of Labor Research, Vol. 24 pp. 3, pp. 365-379.
Lin, L.H. (2011). “Electronic human resource managementand organizational innovation: The roles ofinformation technology and virtual organizationalstructure.” International Journal of Human ResourceManagement, Vol. 22 No. 2, pp. 235-257.
Lu, J., C.S. Yu, C. Liu, and J.E. Yao (2003), ‘Technologyacceptance model for wireless Internet.” InternetResearch, Vol. 13 No. 3, pp. 206-222.
Lujan, O.R.M., J. Ramirez, and Z.L. Cantu (2007). “e-HRM inMexico: adapting innovations for globalcompetitiveness.” International Journal ofManpower, Vol. 28 No. 5, pp. 418-434.
Martin, G., M. Redddington, and H. Alexander (2008).‘Technology, Outsourcing and Transforming HR.”Oxford, UK, Elsevier.
Nunnally, J.C. (1978). “Psychometric Theory.” 2nd ed.,McGraw-Hill, New York, NY

SCMS Journal o f Indian Managemen t , July - September 201 5 93
A Quarterly Journal
******
Nura, A.A., M.D. Kumar, and N.H. Osman (2012).“Employer’s Attitude towards E-Human ResourceManagement Adoption: Research on HigherEducational institutions In Sokoto State, Nigeria.”Skyline Business Journal, Vol. 7 No. 1, pp. 1-10.
Panayotopoulou, L., M. Vakola, and E. Galanaki (2007). “e-HR adoption and the role of HRM: evidence fromGreece.” Personnel Review, Vol. 36 No. 2, pp. 277-294.
Panayotopoulou, L., E. Galanaki, and N. Papalexandris,(2010). “Adoption of electronic systems in HRM:Is national background of the firm relevant?” NewTechnology, Work and Employment, Vol. 25 No. 3,pp. 253-269.
Parry, E. (2011). “An examination of e-HRM as a means toincrease the value of the HR function.”International Journal of Human ResourceManagement, Vol. 22 No. 5, pp. 1146-1162.
Pikkarainen, T., K. Pikkarainen, H. Karjaluoto, and S. Pahnila.(2004). “Consumer acceptance of online banking:an extension of the technology acceptance model.”Internet Research, Vol. 14 No. 3, pp. 224–235
Ruel, H., T. Bondarouk, and J.K. Looise (2004), ‘e-HRM:Innovation or Irritation’ Management review, Vol.15 No. 3, pp. 364-380.
Ruel, H., T. Bondarouk, and M. Van der Vald (2006). ‘TheContribution of e-HRM to HRM Effectiveness.”Employee Relations, Vol. 29 No. 3, pp. 280–291.
Ruel, H., T. Bondarouk, and M. Van der Vald (2007). ‘Thecontribution of e-HRM to HRM effectiveness:Results from a quantitative study in a DutchMinistry.” Employee Relations, Vol. 29 No. 3, pp.280-291.
Ruel, H. and H. van der Kaap (2012). “e-HRM usage andvalue creation. Does a facilitating context matter?”Journal for Research Personnel, Vol. 26 No. 3, pp.260-281.
Sanayei, A. and A. Mirzaei (2008). “Designing a model forevaluating the effectiveness of e-HRM.”International Journal of Information Science andManagement, Vol. 6 No. 2, pp. 79-98.
Sathye, M. (1999). “Adoption of Internet banking byAustralian consumers: an empirical investigation.”International Journal of Bank Marketing, Vol. 17No. 7, pp. 324-334.
Shabha, G. (2000). “Virtual universities in the third millennium:an assessment of the implications of teleworkingon university buildings and space planning.”Facilities, Vol. 18 No. 5, pp. 235-244.
Shrivastava, S. and J.B. Shaw (2003). “Liberating HR throughtechnology.” Human Resource Management, Vol.42 No. 3, pp. 201-222.
Singh, G., R.D. Pathak, and R. Naz (2010). “Issues faced bySMEs in the internationalization process: resultsfrom Fiji and Samoa.” International Journal ofEmerging Markets, Vol. 5 No. 2, pp. 153-182.
Snell, S., D. Stueber, and D. Lepak (2002). “Virtual HRDepartments: Getting out of the Middle.” in HumanResource Management in Vitual Organizations’ eds.R. Henneman and D. Greenberger, Greenwich, CT:Information Age Publishing.
Stanton, J.M. and M.D. Coovert (2004). “Turbulent waters:the intersection of information technology andhuman resources.” Human Resource Management,Vol. 43 No. 2, pp. 12-16.
Strohmeier, S. and R. Kabst (2009). “Organizational adoptionof e-HRM in Europe.” Journal of ManagerialPsychology, Vol. 24 No. 6, pp. 482-501.
Strohmeier, S. (2007). “Research in e-HRM. Review andImplications.” Human Resource ManagementReview, Vol. 17 No. 1, pp. 19–37.
Tan, M. and T. Teo (2000). “Factors influencing the adoptionof Internet banking.” Journal of the Associationfor Information Systems, Vol. 1, pp. 1-42.
Teo. T.S.H., V.K.G. Lim, and R.Y.C. Lai (1999). “Intrinsic andextrinsic motivation in Internet usage.” Omega,International Journal of Management Science, Vol.27, pp. 25-37.
Voermans, M. and V.M. Veldhoven (2007). “Attitude towardsE-HRM: an empirical study at Philips.” PersonnelReview, Vol. 36 No. 6, pp. 887-902.
Yusliza, M.Y. and T. Ramayah (2011). “Explaining theintention to use electronic HRM among HRprofessionals: Results from a pilot study.”Australian Journal of Basic and Applied Sciences,Vol. 5 No. 8, pp. 489-497.
Zafar, J., M. Shaukat, and N. Mat. (2010). “An analysis of e-human resource management practices: A casestudy of State Bank of Pakistan.” European Journalof Social Sciences, Vol. 15 No. 1, pp. 18-26.
SCMS Journal o f Indian Management , July - September 201 5 94
A Quarterly Journal
rganisations in today’s scenario confrontchallenges in managing and retaining employees.Employee retention is a process of making
employees to stay with the organisation. Employee retentionis the responsibility of the employer to retain their bestemployees, if not the organization will lose the star performers(Gurumani, 2010).Generally Gen Y is not loyal to the companybut they are loyal to the job. Retaining Gen Y employees intoday’s corporate scenario has become a phenomenal taskfor the organisations in this VUCA scenario. The generationY are those who are born in the period 1980 – 2000. Gen Yersare also known as Millennials, Next Gen, Dot com generation,Net generation, Digital natives, Sunshine generation and anumber of other terminologies that denote their newnessand lifestyle. These young employees are rejuvenatingevery institution of modern life, from the workplace to themarketplace, from politics to education, and down to thebasic structure of the family.
Gen Y possesses significantly different characteristics fromprevious generation and high expectations of immediate
Employee Retention Enablers:
Generation Y Employees
M. Aruna and J. Anitha
Keywords : Generation Y, Employee Retention, Enablers, Mentoring, Work Environment
Abstract
M. ArunaPhD ScholarPSGR Krishnammal College for WomenPeelameduCoimbatore – 641 004.Email: [email protected]
Dr. J. AnithaAssociate ProfessorPSGR Krishnammal College for WomenPeelameduCoimbatore – 641 004.Email: [email protected]
Organisations face a daunting challenge in retention of Generation Y workforce in a vulnerable, uncertain, complex and
ambiguous (VUCA) situation. Their parental brought up, sense of get-now attitude and immediate gratification culture,
24*7 technological connections has all facilitated the Gen Y to adhere to sky rocketing expectations from the workplace.
This study identifies the significant factors for retaining Gen Y, namely, mentoring, career development, job satisfaction,
inclusive style of management, work environment and nature of working style. Descriptive statistics, correlation, and
regression analysis were used. The study implies that organisations have to redesign mentoring support and work
environment retention strategies..
Abstract
O

SCMS Journal o f Indian Managemen t , July - September 201 5 95
A Quarterly Journal
results that classify them as distinct employees. Popularmedia like Time, Newsweek, and Business Week advocatesthat Gen Y has to combat with globalization, global warmingand the advent of social media environment. These externalinfluences have moulded them in a robust manner. Theauthors, Cone (2006) and McElhaney (2008), have describedthe generation Y as friendly, open minded, intelligent,responsible, social – minded, informed and civic minded.Apart from these, they are techno savvy and fast learnerswho enhance the speed and efficiency to the organisations.
Above all, Gen Y, the new generation poses anultimatechallenge for the corporations with regard to theirretention.They tend to challenge new opportunities andmanagement decisions; strive for more work life balance,and involve in decision making. In a nutshell, the culture ofMillennial are asking challenging questions and demandinghonest answers, meaningful social interaction, valuingvolunteerism and caring for the society. Millennials are thenext hero generation and to be the perfect generation. Henceit has become a management challenge for the managers ashow to manage the generation Y talent and utilise theirpotential as they are the futuristic business leaders.
1. Literature Review
This section covers a wide literature review thatencompasses these factors, identified as significant and isclassified under six major headings. These are termed as‘enablers’ as they are found to have a positive influence inretaining employees in the organisation. The enablersdescribed below have been considered as importantrequisites for the millennial to stay with a particular enterprise.The enablers that are derived from the literature reviewinclude mentoring, career development, job satisfaction,inclusive style of management, work environment, andnature of working style. These six variables though seem tobe common motivators of previous generations; the studyhas shown that there is significantly a different perspectivein these qualities, when expected of, by the Gen Y employees.These variables were found to be vital for Gen Y employees’retention at workplace.
1.1. Mentoring in Gen Y context
Mentoring involves a relationship between a senioremployee, the mentor and a junior employee, the protégé, inwhich mentor provides career guidance to the protégé. Theprotégé gets benefits by the advice and guidance from thementor and in return, the mentor benefits through
recognition, respect, and sense of satisfaction. Mentoringis one of the retention strategies for the young employees(Munde, 2010). Mentoring in previous years relied onmentor’s one way of instructional direction, delayedfeedback, and primarily with senior level focus. The distinctexpectations of Gen Y in mentoring are reverse mentoring,progressive mentoring; instant feedback, good rapport withthe mentor, constant approval and praise;to respect andlisten to their views. The traditional hierarchical junior-seniormentoring model has been now replaced with reversementoring and progressive mentoring models in order tocope with generation Y employees (Bloomquist, 2014).Reverse mentoring is where the protégé shares theirtechnological knowledge to senior employees and in returnolder employees gives administrative and managerialtraining to the young employees. Reverse mentoring can beemployed which enhances harmonious relationshipsbetween Gen Y and older generations (Koster, 2013). Theolder generations can be supported by the millennials withthe dissemination of their knowledge and technology usage(Koster, 2013). Progressive mentoring model also called asrotational or serial mentoring having series of mentorshipsfor continuous learning and up gradation of skills(Bloomquist, 2014).
Many studies have explored that Gen Y employees expectthe superiors to provide instant feedback honestly and tohave a good rapport with them in coaching (Cennamo andGardner, 2008; Gibson et al., 2009; Lowe et al., 2008; Reynoldset al., 2008). They seek constant approval and praise fromtheir supervisors (Crumpacker and Crumpacker, 2007). Apartfrom these, they wanted to be respected for their views andexpect to know when they have done a good job and whenthey haven’t (Raman et al., 2011). Generation Y employeesare more efficient if the supervisor treats them with respectand provide frequent and honest feedbacks regarding theirperformance.
1.2. Career Development in Gen Y context
Career Development is the process of development givenby an organisation to enhance the employees in the processof acquainting skills, knowledge and individual growththroughout their career path. The career development inprevious years were found to rely on flexible workarrangements, professional growth, interested in acceptingrather than giving work, formal learning with step by stepinstructions, less exposed to computer technology inlearning and lesser turn over. The Career development aspect

SCMS Journal o f Indian Management , July - September 201 5 96
A Quarterly Journal
is found to have different dimensions for Gen Y which detailson professional development, self-development, changingcareers frequently, risk taker in career path, learning anddevelopment, lifelong learning, continuous learning,multimedia training and e-learning.The variations in thegenerational cohorts are due to many external influences,different parenting style of their bringing up and the natureof their lifestyle. A career should provide them flexibility intheir personal life and professional satisfaction (Sayers,2007).
If Gen Y employees feel that they have mastered their job,they would quickly move on to other companies (Weyland,2011). These employees change their careers more than sixtimes in their life (Burmeister, 2009 and Dolezalek, 2007).This depicts that they would not remain in a particularorganisation for a longer period of time. Surprisingly,employees are loyal as long as the organisation providesmeaningful work and self-development and they don’t evenhesitate to quit the job within 24 hours if unsatisfied (Logan,2008). It is interesting that they are found to acquaint withthe job only if the values are matched in the company(Ohlrich, 2011). They dare to quit the job and find a newposition at the new company as they are confident in theirskills. This characteristic provides a direct challenge fororganisations in retaining Gen Y employees. Apart fromthese, Johnson and Lopes (2008) advocate that youngemployees tend to accept higher level of risks in their earlycareer paths. This shows that they are risk takers and self-reliant in nature.
Significantly, Gen Y employees expect a significantcontribution by the organisation for learning anddevelopment. The learning and development shouldenhance their individualism, new experiences and self-development (Weyland, 2011). The organisation should actas a platform for their self-development and enhancementas well as life-long learning.Gen Y needs to have acontinuous learning environment with web based trainingapart from these workshops, job shadowing, temporaryassignments, and functional moves. However, they giveutmost importance to personal development and continuouslearning (Terjesen et al., 2007).
Obviously, training and development is one of the significantfactors for the development of Gen Y careers and also aretention tool for the millennials (Price Water house Coopers,2008; Dolezalek, 2007). Gen Y employees workcollaboratively with others and real world activities are
essential criteria for them to be included in training. Theyprefer multimedia training and development programmewhich enhance them both laterally and vertically to acquireskills with in a multi-directional career system (Shaw, 2008).It is obvious that e - learning has rapidly emerged as asignificant stake in the global workforce. Hence trainingand development should be a continuous program to updatetheir knowledge and skills.
1.3. Job Satisfaction in Gen Y context
Job satisfaction is the process of making employees fulfilledboth mentally and personally in their work. The previousgenerations were satisfied with more extrinsic rewards, extrapay for extra hours, lesser work-life balance, retirement andfringe benefits in the job. However, Gen Y employees seemto have different expectations with regard to satisfaction atjob. This characteristic is also of prime importance as jobsatisfaction is found to be a great retention tool for the GenY employees to stay in the organisation. Job satisfactioncaters to different aspects for Gen Y employees, as theygive importance to personal life in work life balance, highsalaries, immediate reward, and instant gratification. TheGen Y employees give preference to their family and friends,rather than work, when they ought to balance work and life(Crumpacker and Crumpacker, 2007).They are more interestedas how the organisations would support their family andpersonal lives.
They need their job to be paid well and expect high salariesby the time they reach the age of 30. Beck and Wade (2004)contend that immediate reward transfers are the essentialcriteria to excel in their work.Gen Yers disagrees with delayedgratification as they need everything now and now only(Henon, 2006). The main reason for their instant gratificationand immediate reward are due to the influence of digitalgaming as it provides immediate rewards for the player tothe next level of difficulty. Millennials tend to behave likeinvestors rather than assets as they seek best return fortheir input of their time and energy. They tend to expectwhat the employers will do for them rather than what theydo for their employers. This has made the organisation tooffer attractive compensation package to retain them.
1.4. Inclusive Style of Management in Gen Y context
Inclusive style of management is a style of managementwhich is wholesome and encompassing all the benefits thatthe employees need for. Previous generations relied onbureaucratic leadership and job security from their

SCMS Journal o f Indian Managemen t , July - September 201 5 97
A Quarterly Journal
management. Gen Y intends to stay in an organisation basedon a constructive management, look for corporate sociallyresponsible company, mutual respect and to be treated aspartners(Weyland, 2011); honest and participative leadersand open minded managers. The young workforce areenthusiastic and ready to contribute to the organisationthrough their suggestions, ideas, opinions and they alsochallenge the traditional mind set of organisationalmanagement and look for constructive management (Rai,2012). They add value to the company by understandinghow their everyday work has an impact on overall successof the organisation.
Apart from these, Corporate Social Responsibility (CSR) isfound to be a retention tool for the Gen Y employees(Pinkess, 2008). Price Waterhouse Coopers (2008) found thatGen Yers look for companies that promote CSR. Gen Y seeksto have a mutual understanding with their leaders and theyrespect their leaders who are honest, straight forward andopen (Rai, 2012). Generation Y seeks a participative leaderwho respects their views, listen to them, and make flexible intaking their decisions. Gen Yers are enthusiastic toparticipate in decision making process (Beck and Wade,2004). They perform better to the managers who are open-minded as they are not afraid to express their views.
1.5. Work Environment in Gen Y context
Work environment is a basic pre-requisite that a companyprovides to the employees which supports them to performbetter. The employees of previous generation had long hoursof work time, work only at office, lesser technologicalinfluence, lesser entertainment and no fun atmosphere. GenY employees have great expectations from the organisationsin work environment. The aspects of work environment thatGen Y expects from the company are physically comfortableand socially enhancing environment; boundaryless andopen with break out spaces; technology for disseminationof knowledge and entertainment; social media; funatmosphere. Work place environment is the place where theylearn, collaborate and socialize (Rai, 2012). Work environmentis very important for retaining millennials as it is composedof two elements, namely, physical and social environment(Raman et al., 2011).They need their workplace to beboundaryless, colourful and open with break out spacesand conversation areas (Rai, 2012).
Technology paves way for information dissemination in afaster pace in today’s workplace. They are highly frustrated
with old technology and slow communication and they needinstant results (Weyland, 2011). The Gen Y employees areengaged well if the company provide them the updatedtechnology and systems.
It is pertinent that social media has been the life blood ofmillennials and it has become a part and parcel of one’s lifewithout which it is difficult to survive. However, Social mediahas become a vital source for internal communicationbetween the employees in an organisation (Rai, 2012).Infosys Company has come out with employee social mediausage policy with Internal Bulletin Boards, InfiBlog, InfiWikiand Asian Paints Company with Blogs (Rai, 2012). SocialNetworking sites like Facebook, LinkedIn, Orkut, Big Addahas enlarged their interaction not only personally but alsoprofessionally by sharing the text based contents, pictures,videos and graphics and collaborating it (Rai, 2012). Apartfrom these, fun and exciting atmosphere is looked on bymillennial (Weyland, 2011). They ought to have luxuriousworkplace like breakout areas, creative rooms; even sleeprooms which energise them (Weyland, 2011).
1.6. Nature of Working Style in Gen Y context
The nature of working styleis the attributes of an employeethat he deals with different sorts of work. The working styleof previous generations were focussed on processes noton results, dependent in decision making, less freedom intheir work and followed rules and regulations. The nature ofworking styleof Gen Y seems to have significant variationson a par with the back generations. The nature of workingstyleof Gen Yare meaningful and challenging work,multitasking, responsibility, job autonomy, freedom,flexibility, appetite for work and pressure, problem solvingskills, and collaborating teams. Generation Y employeestake along all their positive skills and traits to the workplace.They always strive for meaningful and challenging work(Baruch, 2004). The major aims of Gen Y ers are to playmeaningful roles in meaningful work that helps others (Elkinset al., 2007). Hence, salary and status has not been preferredhigh by the Gen Yemployees, rather, they rely on a meaningfulwork environment.
Generation Y are found to be multi-tasking in their workwith high degrees of intelligence, confidence, andindependence (Martin, 2005). According to the Bureau ofLabour Statistics, 70 % of generation Y already possesspart time jobs and work multiple jobs over their life time. GenY employees prefer doing the job around the clock if they

SCMS Journal o f Indian Management , July - September 201 5 98
A Quarterly Journal
are given a responsibility (Weyland, 2011). The youngemployees look for independency and autonomy in theirwork in making their choice of when and where to work(Weyland, 2011).
Gen Y people expect freedom and flexibility to make theirwork done in their own way and at their own pace (Martin,2005). Gen Y prefers their own strategies to deal in theirwork task. They have a strong appetite for work andpressure and are result oriented (Shih and Allen, 2007).They need to be motivated and empowered in all manners.The unlimited exposure to video games by millennials hasshaped their problem solving skills (Beck and Wade, 2004).They prefer to work in teams and collaborate through textmessaging, instant messaging and blogging with their peers(Skiba, 2006).
In a nut shell, the paper has arrived at the conceptualframework based on literature review and the step ahead
includes, constructing an instrument to measure thesespecific characteristics of Gen Y which have entirely evolvedinto new phenomena and practice. These characteristicshave an entirely new face as perceived by the younggeneration. These characteristics need to be studied in detailand the level of influence and role played by them onemployee retention is to be determined. The results wouldhave significant steps and suggestions to organisations astheir workforce is rapidly transforming into Gen Y performers.
2. Model of the Study
The comprehensive literature review on Gen Y expectationsand Gen Y enablers has helped the researcher to arrive at aconceptual model depicting these six variables influencingthe employee retention of Gen Y employees. The modeldepicted in figure 1 is evaluated based on empirical dataand the specific impact of each of these variables ismeasured.
Figure 1 – Conceptual framework for Employee Retention of Gen Y Workforce

SCMS Journal o f Indian Managemen t , July - September 201 5 99
A Quarterly Journal
3. Objectives of the Study
The objectives of the study are as follows:
� To find the existing level of factors influencingretention of Gen Y workforce,
� To explore the association between various factorsinfluencing retention and employee retentionamong Gen Y workforce, and
� To examine the impact of the identifiedfactors, onemployee retention of Gen Y.
4. Research Methodology
The study is descriptive and causal in nature. It describesin detail the existing level and nature of the different variablesinfluencing retention of Gen Y workforce. It also focuses onanalysing the cause and effect relationship between thesesix variables and employee retention. Data was collectedfrom 100 Gen Y employees in senior level, junior level andmiddle level. The area of the study was confined toCoimbatore in IT sector.
Employee retention questionnaire, formulated and validatedby Bernsen et al. (2009) was used for data collection. Furtherconstructs were measured with the variables extracted fromrelevant literature and were validated by content analysis.Random sampling technique was used in selecting therespondents from the employees list, available with theorganisations. Pilot data was used to test the reliability andthe Cronbach alpha value was found to be 0.858.
Descriptive Statistics was applied to find the mean scoresand standard deviation of these variables. Correlation wasused to find the association between these variables andemployee retention. The impact of various factorsinfluencing the retention of Gen Y was analysed byemploying regression analysis.The respondents were thegeneration Y employees belonging to the age group of 20 to35 years. The data collected at junior, middle and seniorlevel found to be 27%, 35% and 37% respectively.
5. Analysis and Discussion
As discussed above, the significant factors influencingemployee retention of Gen Y is deduced using a thorough
literature review. The role played by these factors on
employee retention is presented as a conceptual frameworkwhich requires empirical proof. Statistical analyses applying
SPSS are used to arrive at each of the objectives intended.
5.1. Level of factors that influence retention of Gen Y
Descriptive statistics was employed to find the mean score
of various factors in employee retention. Figure 2 depictsthe level of interest or the expectation of Gen Y with these
factors. The factors are measured in a scale of 1 to 7, higher
the score depicts the utmost importance given to the factorfor retention of Gen Y and lower the mean score implies
least importance to the factor. It clearly emanates from the
figure 2, that Gen Y gives importance to the career anddevelopment with the mean score of 5.94. It depicts that
Gen Y seeks for constant progress in their career as they are
keen in both self-development and professionaldevelopment supporting these author reviews of Logan 2008
and Sayers 2007. The results of authors, Shaw (2008) and
Weyland (2011), are analogous with this study eliciting GenY crave for rapid advancement in their learning and
development, training and leadership programmes whichshape them. It is the Gen Y’s attitude of overly ambitious
dreaming and risk taking makes them to have huge
expectations in enhancing their career.
The next level of importance given by Gen Y are the nature
of working style with mean score as 5.71, it is because that
Gen Y indulges in a job which is meaningful, challengeableand seeks for autonomy todo the work in their own pace
and style supporting the views of Baruch (2004) and
Weyland (2011).The main reason is that lesser supervisionand more freedom in their work lead to independent decision
making and their multitasking nature tends to look for
challenging jobs. They quit a job if they are unsatisfied withthe work as they are loyal to meaningful job rather than the
company. If their job did not add any enrichment or value to
them they would move in to another company. In a nutshell,today’s millennials look for rapid advancement in their career
growth and independency in their work tasks.

SCMS Journal o f Indian Management , July - September 201 5 100
A Quarterly Journal
5.2. Association between employee retention and factorsinfluencing retention
Correlation determines the association of various factorswith employee retention. It has been found that nature ofworking style factor is highly correlated with retention of anemployee whose Pearson correlation value is 0.487 fromtable 1. It depicts that Gen Y adheres to flexibility in theirwork without robust supervision and need to work in theirown style and pace. Apart from these, they thrive for risktaking jobs and strong appetite for challenging work (Shihand Allen, 2007; Baruch, 2004). The independency andflexibility provided by Gen Y parents in their childhood hasundoubtedly made Gen Y to expect the same from theirrespective enterprise.
Figure 2 – Prevailing level of factors influencing Gen Y retention
Also, work environment (r = 0.467) from table 1, found tohave a higher association with retention; depicting that it isstatistically significant. Gen Y seeks for an environment withfun and a good work space obviously connected with socialmedia. It is because they take digital breaks when the workis hectic. As they are technologically connected with iPod,internet from their childhood, there is no doubt that theyrely on digital technologies even at the work place. Theirworkplace should be a platform to socialise and collaboratefor exchange of ideas. Hence, nature of working style andwork environment found to have greater association withretention which elicits that these two factors are closelyassociated with employee retention of Gen Y.
Table 1 – Correlation between different factors and employee retention
MentoringGen Y
CareerDevelopment
Gen Y
InclusiveManagement
Gen Y
JobSatisfaction
Gen Y
WorkEnvironment
Gen Y
Nature ofWorking
Style Gen Y
EmployeeRetention
PearsonCorrelation
0.409 0.332 0.309 0.4410.467** 0.487**
p value .000 .000 .000 .000 .000 .000
**. Correlation is significant at the 0.01 level (2-tailed).

SCMS Journal o f Indian Managemen t , July - September 201 5 101
A Quarterly Journal
The above analysis helps to segregate those factors thatare highly correlated (>0.4) with employee retention of GenY workforce, namely, mentoring, job satisfaction, workenvironment and nature of working style of Gen Y. Thesefactors are taken for further analysis of identifying theirspecific impact on retention, using regression analysis.
5.3.The impact of significant factors influencing EmployeeRetention
The extent of impact of those factors identified usingcorrelation in the above analysis were used as independentvariables and were tested for their impact on employeeretention which is the dependent variable using regression.The independent variables are mentoring, job satisfaction,work environment and nature of working style. Thecoefficient of determination value found to be 32.7%depicting it is statistically significant. Work environment(β = 0.235; t= 1.91)from figure 3, found to have a greaterimpact in staying in a particular company. The path validityt value is higher than the significant value of 1.9 depictingthe path from work environment to employee retention is
valid. It is because of the high sophisticated living renderedby the parents during their infancy stage paves Gen Y tolook for a sophisticated work space. Gen Y look for comfortand ease at work with breakout areas, creative rooms, evensleep rooms (Weyland, 2011). Apart from these, they havedigital breaks with social medias where they share personaland professional experience.
Mentoring (β = 0.202; t= 2.01) from figure 3, depicting thatthe path validity is significant; illustrating that good rapportwith the supervisor and instant feedback are essential forthem supporting the reviews of Crumpacker and Crumpacker(2007) and Cennamo and Gardner (2008). The main agendaconstitutes that Gen Y has a get-now attitude witheverything done right now and they no longer wait for moretime. It is because of this nature they look for frequentfeedbacks within a week; constant praise and applause fromtheir mentor. Gen Y is distinct from previous generations,where Gen Xwaits for promotions, fringe benefits andpensions. But Gen Y are fastlearners, quick earners, rapidworkers and swift gainers.
Mentoring –
Gen Y
Job Satisfaction- Gen Y
Work Environment- Gen Y
Natureof Working Style- Gen Y
Employee Retention
Gen Y
β = 0.202; t= 2.01
β = .206; t= .1.67
β = 0.235; t= 1.91
β = 0.209; t= 1.757
Rsq= 32.7%
Figure 3 – Level of impact of the factors on employee retention

SCMS Journal o f Indian Management , July - September 201 5 102
A Quarterly Journal
6. Conclusion
The study has revealed the enablers looked upon by Gen Yemployees fulfilling their urge of sky rocketing expectations.This study depicts that good mentoring support andluxurious workplace are the important factors for retainingGen Y in a particular enterprise. So the organisations are indire need to propound strategies on mentoring;workenvironment to increase the employee retention.This studywill have practical implications in automobile sector wherethe generation Y employees are more in number. As Gen Ytend to behave more like investors than assets, seeking thebest return on their investment of time and energy with anemployer, it is high time that the management had to redesignthe organisational processes, structure and methodsaccording to the style and approach of Gen Y.
References
Baruch, Y. (2004). “Transforming careers from linear tomultidirectional career paths: organisational andindividual perspectives.”Career DevelopmentInternational, 9(1), 58-73.
Beck, J. C. and M. Wade (2004). “Got game: How the gamergeneration is reshaping business forever.”Boston:Harvard Business School Press.
Bloomquist, C. (2014). “Mentoring Gen X librarian.”PublicLibraries, 53(3),30-33.
Burmeister, M. (2009). “It’s all about me becomes a crossgenerational conversation.” 63(5), 92-93.
Cennamo, L., and D. Gardner (2008). “Generationaldifferences in work values, outcomes and person-organization values fit.”Journal of ManagerialPsychology. 23, 891- 906.
Cone (2006). “The 2006 Cone millennial cause study: Themillennial generation: Pro-social and empowered tochange the world.” Retrieved from http://www.coneinc.com/about
Crumpacker, M. and J.D. Crumpacker (2007). “Successionplanning and generational stereotypes: should HRconsider age- based values and attitudes a relevantfactor or a passing fad?”Public PersonnelManagement, 36 (4), 349-369.
Dolezalek. H. (2007). “X-Y vision.”Training, 44 (6), 22-27.
Elkins M.J., K. McRitchie and M.Scoones (2007). “From theSilent Generation to generation X Y and Z: Strategiesfor Managing the Generation Mix.” 240-45.
Gibson, J., R. Greenwood, and E. Murphy (2009).“Generational differences in the workplace: Personalvalues, behaviours, and popular beliefs.”Journal ofDiversity Management, 4(3), 1-7.
Gurumani, V. S. (2010). “Invaluable Tools for TalentRetention.”Human Capital. 54-55.
Henon, E. (2006). “Why and how generation y saves andspends.”Benefits and Compensation Digest, 43, 30-32.
Johnson, J.A. and J. Lopes (2008). “The intergenerationalworkforce revisited.”Organization DevelopmentJournal, 26 (1), 31-36.
Koster, K. (2013). “Communication and engage-ment.”Employee Benefit News.
Logan, G. (2008). “Anatomy of a Gen Y-er.”Personnel Today,24-25.
Lowe, D., K. Levitt, and T. Wilson (2008). “Solutions forretaining Generation Y employees in theworkplace.”Business Renaissance Quarterly, 3(3), 43-57.
Martin, C. A. (2005). “From high maintenance to highproductivity: What managers need to know aboutGeneration Y.”Industrial and Commercial Training,37(1), 39-44.
McElhaney, K.A. (2008). Just good business: The strategicguide to aligning corporate responsibility and brand.San Francisco, CA: Berrett-Koehler.
Munde, G. (2010). “Considerations for managing anincreasingly intergenerational workforce in libraries.”Library Trends, 59 (1/2), 89.
Ohlrich, K. (2011). “Analysing corporate socialresponsibility’s impact on employee attraction andretention with a focus on generation y.”Proquest, 29-32.
Pinkess, A. (2008). “Employer branding: Show you reallycare to win staff.”Brand Strategy, 38.
Price Waterhouse Coopers, (2008). “Managing tomorrow’speople: Millennials at work – perspectives from a newgeneration.”Retrieved from www.pwc.com/managingpeople2020

SCMS Journal o f Indian Managemen t , July - September 201 5 103
A Quarterly Journal
******
Rai, S. (2012). “Engaging young employees (Gen Y) in asocial media dominated world. InternationalConference on Emerging Economies - Prospects andChallenges – Review and Retrospection.”Procedia -Social and Behavioural Sciences, 37, 257 – 266.
Raman, G., C. Ramendran, P. Beleya, S. Nodeson, andL.Arokiasamy(2011).”Generation Y in institution ofhigher learning.”International Journal of Economicsand Business Modelling, 2 (2), 142-148.
Reynolds, L., E. C. Bush, and R. Geist (2008). “The Gen Yimperative.”Communication World, 25(2), 19-22.
Sayers, R. (2007). “The right staff from X to Y.”LibraryManagement, 28(8/9), 474-487.
Shaw, S. (2008). “Engaging a new generation ofgraduates.”Education &Training, 50(5), 366-378.
Shih, W. and M. Allen (2007). “Working with generation-D:adopting and adapting to cultural learning andchange.”Library Management, 28(1/2), 89-100.
Skiba, D. J. (2006). “The Millennials: Have they arrived atyour school of nursing?”Nursing EducationPerspectives, 25(6), 370-371.
Terjesen, S., S. Vinnicombe, andC. Freeman (2007).“Attracting generation Y graduates.”CareerDevelopment International, 12 (6), 504-522.
Weyland, A. (2011). “Engagement and talent managementof Gen Y.”Industrial and commercial training, 43 (7),439-445.

SCMS Journal o f Indian Management , July - September 201 5 104
A Quarterly Journal
ndia with 3383 Engineering institutions, churningout over 1.6 million engineering graduates eachyear (AICTE, 2013 report), appears like a great source
of much needed engineering talent essential to build ournation. These engineering graduates holding a degree in 36or more engineering streams, pose a mammoth challenge tobe gainfully employed. According to one report publishedin the National Daily, Economic Times by Chaturvedi andSachitanand (2013), over a million engineers in India arestruggling to get placed in an extremely challenging globalmarket.
At the academic level, according to one reportfromVisvesvaraya Technological University,(a certifyingbody for all engineering graduates from the state ofKarnataka), over the last 3 years (2011-13), 50-60% ofstudents graduate in First class or better. The number ofstudents graduating in First Class with Distinction aloneare between 14-20%. The overall passing percentage isbetween 75-85%. Ideally the academic performance ascertified by the university should suffice to land a student
Self Efficacy Beliefs and Campus
Placement Outcome
Nitin Kulkarni and A.H. Chachadi
Key Words : Employability, Self esteem, Self efficacy beliefs, placement outcome
Abstract
Nitin KulkarniDirector – Center for Technology Innovation andEntrepreneurship (CTIE)RH Kulkarni Complex, Associate ProfessorBVB College of engineering and TechnologyHubli- 580032, Karnataka.Email: [email protected]
Dr. A.H. ChachadiRetd. Dean & DirectorKousali Institute of Management StudiesKarnataka University, Dharwad. 580004.Email: [email protected]
Employment is considered as a natural outcome of any professional education program. Students develop many skills
over their undergraduate program in engineering hoping to land in a job of their choice. Soft skills and hard skills
developed over their education, help in building their self esteem. It is generally believed that a student who has high self
esteem has a better chance to get placed. This study tries to relate self efficacy beliefs measured using seven of the most
commonly considered employability attributes and subsequent campus placement performance in two engineering
institutes of North Karnataka region, over a 3 year period. Also, interestingly, it was observed that, over rated or inflated
self efficacy beliefs of students have led them to more failures in campus placements than success.
Abstract
I

SCMS Journal o f Indian Managemen t , July - September 201 5 105
A Quarterly Journal
in a job. However, our national average is a dismal 18.43% ofgraduating engineers fit to take up a software services job.For a job in any of the core companies, only 7.49% of ourgraduates are employable (Aspiring Minds, 2014).
Review of Literature
Many studies have been published indicating the employer’sexpectations of fresh engineering graduates to beemployable. In a study conducted on the employer’sperspective of skills needed to be employed, human skillswas considered the most important skill a graduate shouldhave, followed by professional skills, communication skillsand lastly technical skills (Kulkarni et al., 2014). By the timethe engineering graduates get ready to face the campusplacements, would they possess these skills sufficiently toland in a job?
Dynamics of campus hiring in India have changeddramatically over the last decade. An academic degree, whichonce upon a time was enough to get a job, isn’t sufficientanymore. Students are expected to develop an imposingand impressive personality over and beyond the degree.Students are expected to take ownership of their careers todevelop and sustain their employability. Career counselorsand human resource practitioners have been concerned fora long time about employees’ psychological career resourcesor career meta-competencies that enable them to takeownership of their careers and be proactive in managingtheir careers and improving their employability (Baruch,2004; Coetzee, 2008; Fugate et al., 2004; Sinclair, 2009). Inview of this, present research paper has focused on careermeta-competencies, like self-esteem and associated self-efficacy beliefs. Self-esteem can predict employabilitysignificantly (Fugate et al., 2004; Hewitt, 2002; Kerka, 1998).However, there seems to be a lack of research in the contextof engineering graduates of North Karnataka, on how theirself-esteem relates to their employability outcomes atcampus placements.
Employability:There are many definitions of employabilitybased on various perspectives. Most of these definitionsconcern employability from the individual’s perspective. Ageneral definition of employability is the perceived abilityof a person to land in a job. Employability as an outcomehas been referred to, in various contexts in the literature,such as, in research studies investigating how graduatestudents should enter the labour market (Harvey, 2001;Knight andYorke, 2007). Many studies have also focused
on getting the unemployed back to work (Finn, 2000;McArdle, Waters, Briscoe, and Hall, 2007). More recently,employability has been increasingly used in the context ofhow employed people are to stay competitive in the labourmarket (e.g. ForrierandSels, 2003a; Fugate, Kinicki,andAshforth, 2004; Garsten, 2004).
Employability is a concept which has gained quite a tractionin recent years in India as the number of job opportunitieshave increased and so are the number of aspirants seekingthose. In the context of fresh engineering graduates, itbroadly consists of good attitude towards work, willingnessto unlearn and relearn quickly, being a good team player,professional outlook and appearance, good fundamentals,written and verbal skills and others. This study encompassesmeasuring some of the key parameters to employability andstudents’ self efficacy beliefs about them.
Objectives of the Study
Objectives of the study are to,
- identify various academic and non-academicparameters contributing to the employabilityof engineering graduates,
- measure the self efficacy beliefs of engineeringstudents based on the above identifiedparameters.
- measure the impact of their self efficacy beliefson campus placement outcomes.
Methodology
Engineering students studying in the final year ofundergraduate engineering degree were chosen from two ofthe North Karnataka tier II city. The study was conductedover 3 cohorts comprising students from 2007-11, 2008-12,and 2009-2013 batch of engineering. For the first cohort(2011), 494students participated out of population of 640. Inthe case of second cohort (2012), 463 student samples wereused from a population of 660. The third cohort (2013), 371students participated out of a total population of 660. Therewas no gender based segregation done. The data collectionwas completed right before the campus placement seasonfor the respective cohorts. That is in the summer break of 6th
and 7th semester. The third cohort, (2009-13) data wascollected to useas a test case to confirm the findings of thefirst two cohorts. All the sample sizes complement the

SCMS Journal o f Indian Management , July - September 201 5 106
A Quarterly Journal
requirement of accepted significance level set at p=0.05 forthis study.
Though placement outcomes depend on host of parameters,this study is focused on the following 7 control parametersto measure the student efficacy. Later, their placementrecords were superimposed on the survey data using uniqueUniversity Seat Numbers (USN). In the survey which wasprescribed using Google forms, students were asked toanswer 7 questions pertaining to various parameters listedbelow. The maximum point a student can earn is 21 and theleast is 6.
1. Academic Performance-Cumulative Grade Point Average(CGPA) - This is synonymous to academic performance inengineering, based on the Cumulative Grade Point Averageover 6 semesters. CGPA is infact one key criterion used as aqualifier for attending the campus placements. Companiesvisiting campuses to hold recruitment drives seek freshgraduates with 6.75 as the cutoff CGPA with someexceptions. Also, many companies offered relaxation tostudents who have scored 7.75 and above, allowing them toattend direct personal interviews, without written tests. Ingeneral, it is presumed that CGPA is the indicator of technicalproficiency of a student. Higher the CGPA, better is thetechnical caliber of that student. In this study, CGPA is thelone measure of academic performance of the students.
2. Campus Placement Preparation (CMP): Typical campusplacement processes include various screening steps andeach step can be an elimination round. It is imperative thatstudents understand company specific selection process,and prepare accordingly. In fact many colleges conduct peptalks right before the campus recruitment either by theirstaff or by hiring consultants. This is to sensitize thestudents about the selection process and provide tips toprepare for the same. CMP intends to measure student’sefficacy on their preparation for the upcoming campusrecruitment activity. Students can opt for a formal trainingprogram if engaged at the institution level or they can relyon self study. For this study, CMP considers the preparationfor both hard and soft skills needed to be employablethrough campus recruitment process.
3. Ability to communicate in English (ENG): Engineersthough are hired mainly for their technology competence, itis imperative that professional success can be achieved onlyby developing effective communication skills (Watson andAlexander, 2005). It is not uncommon for the hiring managers
who complain about the inability of engineering graduatesto communicate issues in, one-to-one and one-to-manysituations. Not just spoken English but a flair for writtencommunication in English is required for fresh engineeringgraduates (Blair, 1996). Engineering solutions are bettercommunicated across to various teams only througheffective communication, both verbal and written (Palmerand Salvin, 2003). Though there is no formal Englishcoaching as a part of engineering education, fresh graduatesare expected to perform at a professional level in terms oftheir ability to communicate in English. This can be a realchallenge for students who have done schooling invernacular language and have learning challenges withEnglish as a medium of education in Engineering. Accordingto one study, employers complain that their young engineershired have a good understanding of technology but lack inmuch needed oral and written communication skills(Liebowitz, 2004).
4. Gap/ Break in education between 12th and Engineering(BRK): Many students realize the impact of missing yearsbetween education only when they get to the stage of facingcampus recruitments. Many companies now seek studentswith no break in education from schooling to graduation.This gap in education can be a non-qualifier despite havingall other counts of eligibility in students favour.
5. Extra- Curricular activities (EC): Though not manystudies have been published on the impact of Extra- Curricularactivities on students of professional education likeengineering, it is believed to contribute to the social andleadership skills of students. Participating in Technical PaperPresentations, conducting Seminars, Guest Lectures,Technology Clubs in related subjects like - Photography,Film, Radio station, Weather station - add to the overallpersonality development of engineering graduates. It is thesoft skills that get honed by participating in Extra- Curricularactivities. Students also understand the importance ofconnecting theory to ideation of workable engineeringsolutions.
6. Cultural Activities (CUL): These activities are intendedto promote holistic growth of a student and develop overallpersonality. These activities not only unlock students’potential in the area of art, music, drama and through othersuch creative means, but provide an opportunity to look ata given problem from different perspectives, which is thebasis of innovative solutions. Many institutions spendsubstantial sums of money on such activities hoping to

SCMS Journal o f Indian Managemen t , July - September 201 5 107
A Quarterly Journal
reap the benefits of the same in the form of quality engineersand employable graduates.
7. Industry Visits and Internships (IND): By far thisparameter is the most important and is most relevant toengineering students. Industry visits enhance the ability tounderstand and apply the theory and question theassumptions made in the classrooms by experiencing them.In essence, Industrial visits and Internships help connectclassrooms to Engineering practices. Industry visits andinternships together simulate professional engineeringpractice. Also, industry visits help in providing hands oneducation in solving complex engineering problems. It helpsto develop communication skills and helps in makingstudents confident of using their technical ability in the realworld.
Measures
Academic Performance (CGPA): Marks scored by a studentare the direct measure of how ‘smart and knowledgeable’that student is. Is it really? But many campus hiringbusinesses seek a first class graduate. A student withaggregate score of 60 percent or higher is sought. This isespecially true of services organizations, as they need tosell these resources to their clients for billable hours andclients prefer ‘first class’ graduates.
60% is equivalent to 6.75 CGPA – Cumulative Grade pointAverage, set by AICTE (All India Council for TechnicalEducation). It is used as the threshold to separate eligiblecandidates from ineligible ones.
For this study, students have been grouped into three CGPAcategories. 6.74 or below – coded as 1, 6.75 to 7.74 – codedas 2, 7.75 and above- coded as 3.
Campus Interview Preparations (CMP):
The average number of hours a student spends on preparingfor campus placements is the second criterion we measured.Apart from the technology fundamentals, students areexpected to perform well in Analytical skills, Reasoning,Comprehension, Grammar, General Awareness and muchmore. Many companies allocate weights internally tonormalize student placement scores. Based on theinformation shared by many HR managers, weights in therange of about 55-60% is given to Technology fundamentalsand remaining for General Aptitude/Analytical capabilities.Most of the students need to consciously prepare forcampus placements and hence it is used as one of the keymeasures for success.
Students who spend time of 0-2hrs.per week are coded as 1,2-4 hrs.per week as 2 and beyond 4 hrs.per week as 3.
Knowledge of English (ENG):
Many students in the north Karnataka region hail fromvernacular schools. Their medium of study is normally theirmother tongue and transaction in English may seemoverwhelming. Many students spend time on improving theirwritten and verbal skills over their engineering education.However, for many, it is still a challenge. We measured theself-evaluation of their level of competency in Englishcommunication.
Students, who rated themselves as below average are codedas 1, at average as 2 and proficient in English as 3.
Break in Education (BRK):
Many students loose a year or two after their 12th grade toprepare for premium engineering institutions like IIT’s andNIT’s. However, many realize little late in their engineeringthat some companies have policies against hiring studentswho had break in their education. Many companies do permitstudents up to 1 year break to participate in their campushiring process.
For this study we have coded students with a break of 2years or more as 1, 1 year as 2 and no break as 3.
Extra-Curricular activities (EC):
Extra-curricular activities are a means to improve a student’sability to effectively apply Technology, Deliveringengineering solutions, Effective communication, Marketingbusiness / technology ideas successfully, Teamwork andsuch. Activities under EC include- Technical paperpresentation, Participation in Seminars and StudentConferences. We measured students for their participationin Extra-Curricular activities over three levels. Students whohave taken partin 1 or less in their engineering study tilldate as 1, 2-4 times as 2, more than 4 times as 3.
Cultural Activities (CUL):
Year on year, institutions spend lakhs of rupees to holdannual fests and other cultural events. Students can takebest advantage of these by participating to developcompetencies such as, Problem solving, Leadership skills,Dealing with ambiguity, People management, Event planningand so on. Students were asked to rate their participation insuch Cultural Activities held either in their institutions orelsewhere. If they had participated in 1 or less over their

SCMS Journal o f Indian Management , July - September 201 5 108
A Quarterly Journal
engineering study till date, it is coded as 1, 2-4times as 2, 4or more times as 3.
Industry visits and Internship (IND):
Industry visits help connect theory to practice. It brings infreshness in application of basics of engineering into solvinga problem. Industry visits could be formalized by theinstitutions or it can be undertaken on individual basis.
Internships are a little involved engagement with theindustry. They help students learn in a professional businessenvironment, working on business challenges with well-established processes under supervision. In this study, wehave coded students with no Industry/Internshipparticipation till date, as 0, with 1-2 as 2 and with 3 or moreas 3.
Hypotheses Formulation
North Karnataka region, where this study was held,proficiency in English language has always been a challengedue to socio-demographic factors. English languageproficiency is one of the important determinants of graduateemployability (Morshidi et al., 2004a, 2004b). Indeed, goodEnglish language proficiency gives an added advantage tothe job applicant. In other countries that use English as asecond language, English language proficiency is also foundto have a favorable impact on one’s employment outcomes(for instance, Dabalen et al., 2001; Lan, 2003).
The other significant determinants of employability are, Poorcommunication skills and Academic performance (Lim andBakar, 2002; Morshidi et al., 2004a, 2004b; Saodah et al.,2006; Hariyati et al., 2006). These findings suggest theimportance of including these socio-demographic variablesin predicting the employability of graduates. It is alsoimperative that institutions need to make all out effortsthrough curricular and Extra-curricular programs, to helpstudents develop their self esteem which has a direct bearingon the employability potential (Fugate et al., 2004; Hewitt,2002; Kerka, 1998).
Many factors contribute to a successful campus placementoutcome. Engineering students have to be prepared withhard skills (Technical skills) but also in human skills,professional skills and communication skills. Hard technicalskills are the outcome of academic programs and are usuallyreflected by the academic scores like CGPA of a student.
However, other skills like human skills, professional skillsand communication skills are the outcomes of participatingin experiential learning, projects undertaken, entrepreneurialinitiatives, industry visits, curricular and extra-curricularactivities.
Many colleges employ training as a means to enhance someof these skills in their students with a desire to bridge theperceived performance gap during campus placements. Littleis done to understand how training helps in building themuch needed competencies like, communication in english,analytical skills, logical and reasoning skills, industryexposure, leadership skills, results orientation, problemsolving skills and such. However, validating theeffectiveness and tangible outcomes of such trainingprograms have often relied on evidence of thecorrespondence between training and job content (Goldsteinand Ford, 2002). Students have different learning styles andEarley (1994) observed that individualists learn better inself-focused training modes and collectivists did better in agroup training setup.
To enhance student learning, irrespective of students’ styles,most institutions have been spending lakhs of rupees onextra- curricular, cultural activities and industry visits. Infact, according to one latest report published in a daily, TheHindu, dated 27 February 2014, college fests have crossedbudgets of up to Rs. 1.20 crore! And on an average, collegesare spending anywhere between Rs.60 lakhs and Rs.1 croreon various fests. These fests in general entail varioustechnology events, alongside cultural programs. Throughthese fests students pick up most of the soft skills andbusiness skills needed to be professionally successful.
The academic rigor as mandated by the university body,related extra-curricular activities, cultural events andindustry interface through visits and internships, helpdevelop overall personality of an engineering student.Though the outcomes of such off-class learning need furtherresearch, it is believed to bolsters the resolve of a studentto get placed on campus drives. The outcome of suchcampus placement is the measure of his/her self efficacybeliefs. This present exploratory study, intends to measurethe self efficacy of engineering students right before theircampus season. Bandura (1995:2) describes self-efficacy asthe “beliefs in one’s capabilities to organize and execute thecourses of action required to manage prospective
SCMS Journal o f Indian Managemen t , July - September 201 5 109
A Quarterly Journal
situations.” Self-efficacy beliefs can influence factors suchas motivation and commitment levels as well as anindividual’s willingness to take on difficult tasks. Now, selfefficacy can be typified by having an internal locus of control– i.e. the belief that they are in control of their own destiny(Rotter 1966: cited in Buchanan and Huczynski 2004:850)and a malleable (rather than fixed) self-theory – i.e. the beliefthat an individual can take action to enhance his/ her owncompetence (Yorke and Knight 2004). With employment insight, students must have a belief in themselves andinternalize the essential competencies needed, with theirown abilities and thus control and enhance their potentialcampus placement outcomes.
This study measures the self efficacy of engineering studentswith respect to their employability potential, right after theircompletion of 3rd year (6th Semester) and right before thebeginning of campus placement season. Following Null andAlternate Hypotheses have been formulated under thisstudy.
1. H0: CGPA scores of students have no effect on the
campus placement outcomes.
H1: Students with higher CGPA scores tend to fare
better in the campus placements in comparison withstudents with lower CGPA scores.
2. H0: Participation in Extra-curricular, Cultural
activities, Industry visits and internships have noimpact on the self esteem of students.
H2: Participation in Extra-curricular, Cultural
activities, Industry visits and internships boostsself esteem of students.
3. H0: Self efficacy beliefs have no significant
influence on the employability of a student.
H3: Self efficacy beliefs have a significant influence
on the employability of a student.
4. H0: Over inflated self efficacy beliefs have no impact
on campus placement outcomes.
H4: Over inflated self efficacy beliefs lead to higher
failure rates in the campus placements.
Data Analysis and Interpretation
Pearsons correlation analysis is used to find the strength ofcorrelation between various parameters under study for thethree cohorts. Table 1 below shows the values of Pearsonscorrelation. It is quite observable that CGPA is foundsignificantly associated to the campus placement outcomes(r=0.299 to r= 0.346 at p<0.01). This suggests that in itselfCGPA can be a better measure of the campus placementoutcome. Parameters like self perceived campus preparationsin terms of number of study hours per week (r=0.309),perceived command over English (r=0.311), participating inExtra-curricular activities (r=0.160 to r=0.377), Culturalactivities (r=0.535) and Industry visits and Industryinternships (r=0.456) seem to have a strong association withCGPA. It also indicates that across board, students whohave performed well in academics (represented by CGPA)tend to perceive themselves better prepared in all otherplacement parameters. Students who spent more time inpreparing for the campus placements also seemed to be moreconfident as shown by the fairly strong association(r = 0.106 to r=0.136 at p<0.01).
Engineering students are educated to be technology leaders.Apart from creating knowledge, how well they communicatetheir technology ideas across is one key successcomponent. Technical paper presentations, seminars andtech conferences promote such competencies in students.The association of Extra-curricular activities withparticipation in Cultural activities and Industry visits/internships is reasonably strong (r= 0.133 to r=0.233 atp<0.01). The competencies needed for getting placed incampus interviews can be learnt by participating in Extra-curricular, Cultural activities, and Industry visits andInternships which are evident from the strong r value (r=0.188 to r=0.252) with placement outcomes.
As we can see from the r values for the campus placementoutcomes of r=0.105 to 0.346, show that all the chosenparameters have a significant association with a studentgetting placed in the campus recruitments.

SCMS Journal o f Indian Management , July - September 201 5 110
A Quarterly Journal
Table 1 -Pearson Correlations:
What isyour
currentCGPA in
BE?
Approximatelyhow manyhours in aweek youspend oncampus
placementpreparations?
(Includesanalytical,
logic, problemsolving,language
readiness)?
How goodare you in
yourverbal
communication inEnglish?
Howmany
years ofbreak
you havebetween12th.andenginee
ring?
Do / Didyou
participatein Extra-
Curricularactivities
like, paperpresentati
on,Technicalevents?
Do / Didyou
participate in
culturalactivities
in thecollege?
How manyindustry
visits youhave made
so far(includinginternships
duringvacation)?
What is your currentCGPA in BE?
Cohort 2013(test data)
1
Cohort 2012 1
Cohort 2011 1
Approximatelyhowmany hours in aweek you spend oncampus placementpreparations?(includes analytical,logic, problemsolving, languagereadiness)?
Cohort 2013(test data)
.290** 1
Cohort 2012 -.013 1
Cohort 2011 .309** 1
How good are you inyour verbalcommunication inEnglish?
Cohort 2013(test data)
-.014 .009 1
Cohort 2012 .072 .062 1
Cohort 2011 .311** .061 1
How many years ofbreak you havebetween 12th.andengineering?
Cohort 2013(test data)
.216** .009 -.013 1
Cohort 2012 .134** .206** .063 1
Cohort 2011 .157** .087 .028 1
Do / Did youparticipate in Extra-curricular activitieslike, paperpresentation,Technical events?
Cohort 2013(test data)
.088 .043 .109* .116* 1
Cohort 2012 .160** .136** .083 .079 1
Cohort 2011 .377** .077 .022 -.054 1
Do / Did youparticipate in culturalactivities in thecollege?
Cohort 2013(test data)
-.040 .095 .206** -.038 .179** 1
Cohort 2012 .000 .239** .097 .056 .223** 1
Cohort 2011 .535** .106* -.003 -.147** .090* 1
How many industryvisits you have madeso far (includinginternships duringvacation)?
Cohort 2013(test data)
.107* .044 -.089 .077 .024 -.030 1
Cohort 2012 .052 .122* .066 .075 .167** .184** 1
Cohort 2011 .456** .063 .078 -.001 .133** .138** 1
Placed or Not placed Cohort 2013(test data)
.346** .240** .090 .134** .252** .079 .068
Cohort 2012 .299** .195** .006 .105* .188** .111* .105*
Cohort 2011 .327** .183** .207** .038 .211** .273** .262**
**. Correlation is significant at the 0.01 level (2-tailed).
*. Correlation is significant at the 0.05 level (2-tailed).

SCMS Journal o f Indian Managemen t , July - September 201 5 111
A Quarterly Journal
Measuring self efficacy has a risk of respondents overratingon some measures based on their perceptions. Many a timea student may feel very confident of getting placed in thecampus recruitment but the outcome could be otherwise. Itis interesting to know that other than CGPA all otherparameters are subjective in nature. Naturally, perception ofthe individual varies and hence needs to be measured andanalyzed to see why many students are unable to get placeddespite the fact that they see themselves to be quite ‘fit.’
It is also important to make students aware of self-efficacyand the impact that their individual beliefs have on theiremployment outcomes (as well as their degree classification).Furthermore, knowledge of the importance of self-efficacyis arguably akin to what Meyer and Land (2003:1) describeas a threshold concept i.e. “a transformed way ofunderstanding, or interpreting, or viewing something withoutwhich the learner cannot progress.” In other words it isonly through becoming aware of their own self-efficacybeliefs, and the impact that these can have on theiremployment prospects, a student will be able to maximizethe development of his/her employability attributes.
In the following tables and graphs, students’ self efficacybeliefs, against various measures have been depicted. Asand when cumulative measures are plotted against the
placement outcomes, an interesting pattern can be seen.Students show a tendency to overrate their efficacy beliefswith reference to the last three measures viz. –Extra-curricularactivities (EC), Cultural activities (CUL) and Industry visitsand Internships (IND). These inflated scores thoughrepresent higher self efficacy beliefs, but has led to aboveaverage failures to securing a campus job in that score band.
As CGPA is a measure of the technical capabilities of astudent, it has a direct and influential bearing on the campusplacement outcomes. However, in itself, CGPA is not enoughto guarantee a job. Students who are bucketed into 3categories of CGPA and the percentage of students in thosecategories,who could NOT be placed with CGPA alone as ameasure, are given in Table no. 2. As predicted, thepercentage of NOT placed students’ increases with lowerCGPA scores.Both from the Correlation table table no. 1 andtable no. 2, we can conclude that CGPA to placementoutcomes are significant at p=0.01, and the first nullHypothesis-‘CGPA scores of students have no effect onthe campus placement outcomes,’ cannot be accepted.Alternate hypothesis which states that ‘students with higherCGPA scores tend to fare better in the campus placementsin comparison with students with lower CGPA scores’ hasto be accepted.
Table 2 - CGPA grading and corresponding percentage of students not placed.
Percentage students NOT placed
2011 2012 2013 – Test data
CGPA3 37.39 30.39 42.37
CGPA2 41.88 42.08 84.28
CGPA1 89.02 49.23 100
Graph 1 -CGPA grading vs % of students NOT placed.

SCMS Journal o f Indian Management , July - September 201 5 112
A Quarterly Journal
CGPA + ENG - By adding the scores of students’ selfperceived command on English communication, we get
Table 3 -Self Efficacy scores and percentage of students not placed based on CGPA, ENG.
almost a similar picture. Students with lower self efficacyscores have NOT got placed in the campus recruitments.
Total Score Percentage students NOT placed
2011 2012 2013 Test Data
6 34.07 20.20 34.515 42.45 36.59 51.664 60.18 66.23 75.003 86.21 83.33 100.00
100.00 NA 100.00
Table no. 4 gives the cumulative scores of CGPA, ENG andextent of Campus preparation – CMP.
Graph 2 -Self Efficacy scores vs % of students not placed based on CGPA, ENG.
Table 4 -Self Efficacy scores and percentage of students not placed based on CGPA, ENG, CMP.
Graph no. 3 shows the corresponding outcomes based onthe scores of students.
TotalScore
Percentage students, NOT placed
2011 2012 2013 Test Data9 25.00 17.54 30.308 35.43 26.43 37.697 50.00 37.24 52.246 54.26 50.65 76.475 85.94 67.57 95.004 73.33 85.71 100.00
Graph 3 -Self Efficacy scores vs % of student not placed based on CGPA, ENG, CMP

SCMS Journal o f Indian Managemen t , July - September 201 5 113
A Quarterly Journal
Table No. 5 shows the scores of students based on their perception on CGPA, ENG, CMP and Break in Education – BRK.
Table 5 - Self Efficacy scores and percentage of students not placed based on CGPA, ENG, CMP, BRK.
TotalScore
Percentage Students, NOT placed
2011 2012 2013 Test Data12 24.24 18.75 32.2611 34.71 25.19 36.2210 47.75 31.71 50.009 54.44 48.24 74.558 75.64 70.45 91.677 81.25 55.17 100.006 75.00 50.00 100.005 66.67 100.00 NA
Table No. 6 and Graph No. 5 show the students, perception on CGPA, ENG, CMP, BRK and perceived performance inExtra- Curricular activities – EC.
Table 6 - Self Efficacy scores and percentage of students not placed based on CGPA, ENG, CMP, BRK, EC,
Graph 4 - Self Efficacy scores vs % of students not placed based on CGPA,
ENG, CMP, BRK
TotalScore
Percentage Students, NOT placed
2011 2012 2013 Test Data15 23.81 20.69 20.0014 35.93 30.00 34.7813 43.33 35.64 41.4312 42.86 35.23 45.5611 60.56 44.47 59.3110 73.85 55.81 77.789 91.82 69.23 88.248 100.00 68.75 100.007 50.00 NA NA6 100.00 100.00 NA

SCMS Journal o f Indian Management , July - September 201 5 114
A Quarterly Journal
Graph 5 - Self Efficacy scores vs % of students not placed based on CGPA, ENG, CMP, BRK, EC
Table No.7 and Graph No. 6 depict the students’cumulative score with the consideration for CGPA, ENG, CMP, BRK, ECand participation in Cultural Activities – CUL.
Table 7 - Self Efficacy scores and percentage of students not placed based on GPA, ENG, CMP, BRK, EC, CUL.
Total Score Percentage Students, NOT Placed2011 2012 2013 Test Data
18 0.00 20.00 12.0017 0.00 13.33 16.6716 33.33 26.79 24.0015 42.50 30.69 29.7914 33.90 30.26 34.0013 45.71 39.68 42.9612 62.50 47.58 51.4711 86.05 65.46 82.9310 92.50 69.71 85.719 72.22 72.73 81.828 100.00 75.00 100.00
Graph 6 -Self Efficacy scores vs % of students not placed based on GPA, ENG, CMP, BRK, EC, CUL.

SCMS Journal o f Indian Managemen t , July - September 201 5 115
A Quarterly Journal
Table No. 8 and Graph No. 7 show the overall scores of students and percentage of students who are NOT placed incampusrecruitments. The overall scores include, CGPA, ENG, CMP, BRE, EC, CUL and IND – Industry visits and Internships.
Table 8 - Self Efficacy scores and percentage of students not placed based on CGPA, ENG, CMP, BRK, EC, CUL, IND.
TotalScore
Percentage Students, NOT placed
2011 2012 2013 Test Data21 0.00 0.00 0.0020 21.43 33.33 33.3319 30.43 61.54 42.8618 30.23 23.53 25.0017 29.63 25.53 38.8916 36.11 29.85 34.8815 54.00 30.26 48.3314 39.22 38.10 45.9013 54.55 41.30 48.4812 85.71 54.55 68.7511 78.95 79.31 91.3010 83.02 66.67 75.009 85.71 69.23 83.33
Graph 7 -Self Efficacy scores vs % of students not placed based on CGPA,ENG, CMP, BRK, EC, CUL, IND.
SCMS Journal o f Indian Management , July - September 201 5 116
A Quarterly Journal
Key Findings
From graph no.1 till Graph no. 4, we see that, lower the selfefficacy scores, the numbers of NOT placed students isalmost linear. That means the self efficacy scores hold apositive relationship with the placement outcomes. As thecumulative scores increase, so is the percentage of studentswho have been placed on campus. Hence we cannot acceptthe second Null Hypothesis: ‘Participation in Extra-curricular,Cultural activities, Industry visits and internships have noimpact on the self esteem of students’- and have to acceptthe Alternate Hypothesis that, ‘participation in Extra-curricular, Cultural activities, Industry visits and internshipsboosts self esteem of students.’As the cumulative scoresare the direct measure of the strength of self efficacy beliefsof students, and correspondingly the number ofsuccessfully placed students also are on the increase, itcontradicts the third Null Hypothesis which states, -‘Selfefficacy beliefs do not have a significant influence on theemployability of a student’and supports the AlternateHypothesis, which states that, ‘Self efficacy beliefs have asignificant influence on the employability of a student.’
When the self efficacy scores of Extra Curricular activitiesare added to the total scores, the students’ seem to ratethemselves higher, especially those in the score band of 12-14 and 8-9, with no corresponding increase in the placementnumbers (This can be seen by increased number of NOTplaced students in these bands) - Ref. Graph 5.
Likewise, if the self efficacy scores of CUL – Culturalactivities are added to the total scores, we see the sametrend of over-rating their participation, which is evident atboth the extremes of the graph. This means, students in thehigher self efficacy score band have a tendency to over–rate their cultural activity participation and similarly, it isobserved students with lower self efficacy scores also havea tendency to ‘make-up’ for lost academic performance.However, in both these bands of self efficacy scores we seeincrease in the percentage of NOT placed students -Ref.Graph 6.
Interestingly, in Graph no. 7, which is the sum ofself efficacyscores of all parameters, we clearly see that students in thecumulative score band between 18-20 and 10-12 have overrated themselves on Industry visits and Internship measuresas well. This over inflation of their perceived performancewith reference to their perceptions about EC-Extra-curricular,CUL-Cultural Activities and IND-Industry Visits andInternships, is prominently used by students at both ends
of the spectrum. Students with better overall scores of 18-20, presume their experience with EC, CUL and IND to be lotmore valuable and hence they rate themselves higher.Likewise, students with self efficacy scores of 10-12, alsohave over-rated their participation but without proportionalincrement in their placement performance. The data suggeststhat these two bands have seen over inflation of self efficacyscores to the extent of exhibiting a jump in 10-30% increasein NOT being placed.
For the cumulative self efficacy score as shown in table 8and the corresponding graph no. 7, p-values are calculatedusing Chi-Square test. And for the given data p value waslying between 0.01 to 0.05. Hence the fourth Null Hypothesiswhich states, -‘over inflated self efficacy beliefs have noimpact on campus placement outcomes’-is no more relevantand hence the Alternate Hypothesis accepted. This means,there is a statistically significant increase in the failure ratesof students who have a tendency to over inflate their selfefficacy beliefs.
Discussion
It was observed in this study that, CGPA, a measure of theengineering knowledge of a student, was indeed a betterpredictor of student’s employability in the campusplacements. It can be observed that students from all threecohorts exhibited similar campus recruitment successes withCGPA taken as the single parameter of their employability.This strengthens the general belief that students holdingbetter academic scores can and will do better in campusrecruitment drives. This finding also goes in line withunderstanding that higher the CGPA, better is the jobperformance (Cohen, 1984; Lavigna, 1992; Muchinsky andHoyt, 1973; Samson et al.,1984).
The institutions, where this study was conducted, primarilyget ITeS companies for mass recruitment of engineers. Thesecompanies tend to consider engineering students from alldisciplines as long as they satisfy the CGPA cutoff limits.For many non-circuit branch students, their performance insuch mass campus recruitment drives, lynches on the writtentest and the interview performance. We also can observethat CGPA has a strong association with students’ abilityand motivation to educate themselves to perform better.However, students also tend to over-rate their self efficacybeliefs as if to compensate for their lack of performance insome key areas. This, they do by proclaiming theirparticipation and learnings seemingly of better value,

SCMS Journal o f Indian Managemen t , July - September 201 5 117
A Quarterly Journal
through extra-curricular activities, cultural activities, industryvisits and internships.
This type of over rating of their perceived self efficacy beliefscan be easily grasped, if one understands the campusinterview process. It consists of a series of Aptitude andTechnical tests, followed by Technical and Personalinterviews. Each of these designed to dig deep to understandthe ‘real’ caliber of the student. This explains as to,whythough the student feels confident about his/ her ability toget through, fails to get a job. This phenomenon quiteinterestingly can be observed at both higher and lower scorebands in this study.
There probably is a notion that lack of certain keyemployability competencies like Leadership,Communication, Problem solving, Dealing with ambiguity,can be compensated by merely claiming to be participatingin the campus activities. This shall surely be noticed by thehiring managers. Thus many students though score high inthese self efficacy beliefs, fail to get jobs. It perhaps is that,they over rated themselves without deserving it.
Conclusions and suggestions
Based on the test statistic value, which is significant enoughto contradict all the four Null hypotheses, and in turn supportthe alternate hypotheses, we can draw followingconclusions.
This study concludes that CGPA is a better predictor of astudent’s ability to get through in the campus recruitments.Students do understand the importance of preparing forcampus recruitments either through a formal trainingprogram or on their own. It is also observed that studentswho have invested reasonable time in preparing for campusplacements have fared better in campus placement outcomes.
English is a second language for most of the students wherethis study was held. Students who had finished theirschooling in vernacular language feel the need to be goodin English communication. Though most of the outwardlycommunication is verbal, written skills in English are checkedthrough tests. Students are to be encouraged to speak inEnglish on campus and must be reading English business /general news on a regular basis.
Though break in education is something that cannot beundone, it certainly has its effect on the campus placementoutcome. In fact, break in education criteria is checked as apart of eligibility rather than a selection criterion. However,
many companies visiting campus would permit students witha break up to one year to take part in their hiring process.
Students realize the importance of extra-curricular activitiesover a period of time. However, students who realize thesignificance tend to participate in these activities to developpresentation skills, effective communication, to overcomestage fear and to learn the importance of teamwork. Studentsmust be encouraged to participate in at least one such extra-curricular activity in a year. Extra-curricular activities liketechnical projects, B-plan competitions can help studentsto develop their self confidence through experientiallearning.
Cultural activities serve to develop critical competencieslike team work, problem solving, etiquettes, dealing withuncertainty, public speaking, time management and more.Many institutions spend lakhs of rupees on such culturalextravaganza, with an intention to build such skills in theparticipating students. However, the onus of learning insuch cultural activities rests with the students. Culturalactivities boost the self esteem of students.
For engineers, industry visits and internships are the closestopportunities to experience Industry environment.Industrial visits arranged regularly can help boost moraleand applicability aspects of the theory learnt. Internshipsstrengthen key functional skills of engineering students asthey take on responsibility under the watchful eye of asupervisor. Industry visits and internships certainly addvalue to a student’s employability if done the right way.
Limitations and Future work
This study focuses on students from two engineeringinstitutions in a tier 2 city of North Karnataka. There aremany generally accepted factors which have significantimpact on employability of an engineering student like –social background, gender, financial well-being, familysupport, environment, living conditions and such. However,this study intends to limit the campus placement outcomesto the chosen seven factors which are relevant in theirengineering education. Incidentally, this is one of the fewstudies undertaken in the North Karnataka region, whichtries to measure the relationship between the self-efficacybeliefs and employability.
Looking at the challenge of improving fresh graduate’semployability, an all-round approach is needed, whichincludes various perspectives – student, parent, social,academic, employer and many more. Another study to

SCMS Journal o f Indian Management , July - September 201 5 118
A Quarterly Journal
understand the employer’s perspective of employableengineering graduate, using a multi-level, multi criteriadecision models is underway. By augmenting such variousstudies, a fairly good understanding of drivers ofemployability can be understood specific to that region.These drivers shall bring in a paradigm shift in the wayengineering education ought to be designed.
References
Bandura, A. (1986). Social foundation of thought and action:A social cognitive theory. Upper Saddle River, NJ:Prentice Hall.
Baruch, Y. (2004). “Transforming careers: from linear tomultidirectional career paths. Organizational andIndividual perspectives.”Career DevelopmentInternational.
Blair, M. J. (1996).”Starting to manage: the essentialskills.”IEEE Engineers Guide to Business Series, l, R:IEEE, NJ.
Coetzee, M. (2008). “Psychological career resources andsubjective work experiences of working adults: a SouthAfrican survey.”SA Journal of Industrial Psychology/SA TydskrifvirBedryfsielkunde, 34(2), 32–41.
Cohen, P. A. (1984).”College grades and adult achievement:a research synthesis.”Research in Higher Education,20, 281–93.
Dabalen, A., O.Bankole and A.A.Olatunde (2001). “Labormarket prospects for university graduates in Nigeria.”Higher Education Policy, 14(2), 141–159.
Earley, C. P. (1994).”Self or Group? Cultural Effects ofTraining on Self-Efficacy and Performance.” JohnsonGraduate School of Management, Cornell University.
Finn, D. (2000). “From full employment to employability: anew deal for Britain’s unemployed?”InternationalJournal of Manpower, 21(5), 384-399.
Forrier, A., and L. Sels (2003a). “The concept employability:a complex mosaic.”International Journal of HumanResources Development and Management, 3(2), 102-124.
Fugate, M., A. Kinicki, and B.Ashforth, (2004).“Employability: a psycho-social construct, itsdimensions and applications.”Journal of VocationalBehaviour, 65, 14–38.
Goldstein, I. L. and K. J. Ford (2002).”Training inOrganisations; Needs Assessment, Development and
Evaluation (Belmont, CA: Wadsworth Thomson Learning).”
Hariyati, S.A.M., S.A.Rahman, S. Wok, N.A.M. Noor,A.M.Zubairi and D.M.Yusof (2006). “Genderdifferences in graduate employability: The role ofinclusive higher education in Malaysian universities.”Paper presented at International Higher EducationPolicy Research & Management Forum 2006, 8–11 Nov2006, USM, Penang, Malaysia.
Harvey, L. (2001). “Defining and measuringemployability.”Quality in Higher Education, 7(2), 97-109.
Hewitt, J. (2002). “The social construction of self-esteem.”Handbook of positive psychology, 135–147
Kerka, S. (1998). “Career Development and Gender, Raceand Class.”Clearinghouse on Adult, Career andVocational Education, 199
Kulkarni N, and A.H.Chachadi (2014)SCMS Journal of IndianManagement. Skills for employability – Employer’sperspective. Vol XI No. 3, 64-70.
Lavigna, R. J. (1992), ‘Predicting job performance frombackground characteristics: more evidence from publicsector’, Public Personnel Management, 21, 3, 347–61.
Lan, P-C (2003). They have more money but I speak betterEnglish! Transnational encounters between Filipinadomestics and Taiwanese employers. Identities: GlobalStudies in Culture and Power, 10(2), 133–161.
Liebowitz, J. (2004), ‘Teaching the importance ofcommunication in 11’, IT Professional, 6, 1, 38–42.
McArdle, S., L. Waters, J. P. Briscoe andD. T. Hall (2007).“Employability during unemployment: Adaptability,career identity and human and social capital.”Journalof Vocational Behavior, 71(2), 247-264.
Meyer, J. and R. Land (2003).”Threshold Concepts andTroublesome Knowledge: Linkages to Ways ofThinking and Practising within the Disciplines.”Occasional Report 4 [online] available from http://www.etl.tla.ed.ac.uk/docs/ETLreport4.pdf
Muchinsky, P. M. and D. P. Hoyt (1973).”Academic gradesas a predictor of occupational success amongengineering graduates.”Measurement and Evaluationin Guidance, 6, 2, 93–103.

SCMS Journal o f Indian Managemen t , July - September 201 5 119
A Quarterly Journal
Palmer, G. and D. Salvin (2003).Graduate engineeringprofessional development. IEEE International
Professional Communication Conference Proceedings,September, pp. 183–8.
Rotter, J. B. (1966).”Generalised expectations for internal v.external control of reinforcement.”PsychologicalMonographs 80 (609), 1-28. cited in Buchanan, D., andHuczynski, A. (2004) 5th Ed. OrganizationalBehaviour: an introductory text. Harlow: PearsonEducation Limited
Samson, G. E., M. E.Graue, T. Weinstein, and H. J. Walberg(1984).”Academic and occupational performance: aquantitative synthesis.”American EducationalResearch Journal, 21, 2, 311–21.
Saodah, W., S.A.Rahman, H.S.A.Majid, N.A.M. Noor,A.M.Zubairi, and D.M.Yusof (2006). “On profiling thefirst-degree graduates’ employability: A longitudinal
analysis.” Paper presented at International HigherEducation Policy Research & Management Forum2006, 8–11 Nov 2006, USM, Penang, Malaysia.
Sinclair, V. (2009). “Experiencing career satisfaction andcareer success over the life span.”
Yorke, M. and P. Knight (2004).”Self-theories: someimplications for teaching and learning in highereducation.”Studies in Higher Education 29, (1) 25-37
Yorke, M., and P. Knight (2007). “Evidence-informedpedagogy and the enhancement of studentemployability.”Teaching in Higher Education, 12 (2),157–170.
Watson, J. and C. Alexander (2005).”Communication aspectsof proskills: a non-technical skill development andenhancement program for engineering.” IEEEInternational Professional Communication ConferenceProceedings, pp. 631–37.
******

SCMS JOURNAL OF INDIAN MANAGEMENT123456789012345678901234567890121234567890123456789012345678901212345678901234567890123456789012123456789012345678901234567890121234567890123456789
Aims and Scope
The SCMS Journal of Indian Management is a blind peer-reviewed Journal. The Journal deems it its mission tosubmit to the readers fresh fruit of management thoughts and rich cream of current innovative research. The format ofthe Journal is designed reader-friendly. The academia and the corporates have an easy access to the Journal.
The Journal looks for articles conceptually sound, at once methodologically rigorous. The Journal loves to deal knowl-edge in management theory and practice individually and in unison. We wish our effort would bear fruit. We hope theJournal will have a long life in the shelves catering to the needs of b-students and b-faculty.
§ Proposals for articles that demonstrate clear and bold thinking, fresh and useful ideas, accessible and jargon-free expression, and unambiguous authority are invited. The following may be noted while articles are pre-pared.
§ What is the central message of the article you propose to write? Moreover, what is new, useful, counterintuitive,or important about your idea?
§ What are the real-world implications of the proposed article? Can the central message be applied in businessestoday, and if so, how?
§ Who is the audience for your article? Why should a busy manager stop and read it?
§ What kind of research have you conducted to support the argument or logic in your article?
§ What academic, professional, or personal experience will you draw on to make the argument convincing? Inother words, what is the source of your authority?
§ The manuscript of reasonable length shall be sent to the Editor—SCMS Journal of India Management (Both forpostal and electronic submission details are given here under).
The manuscript should accompany the following separately:
§ An abstract (about 100 words), a brief biographical sketch of above 100 words for authors describingdesignation, affi l iat ion, specialization, number of books and art icles published in the referee journals,membership on editorial boards and companies etc.
§ The declaration to the effect that the work is original and it has not been published earlier shall be sent.
§ Tables, charts and graphs should be typed in separate sheets. They should be numbered as Table 1, Graph 1 etc.
§ References used should be listed at the end of the text.
§ Editors reserve the right to modify and improve the manuscripts to meet the Journal’s standards of presentation andstyle.
§ Editors have full right to accept or reject an article for publication. Editorial decisions will be communicated within a period of four weeks of the receipt of the manuscripts.
§ All footnotes will be appended at the end of the article as a separate page. The typo script should use smaller size fonts.123456789012345678901234567890121234567890123456789012345678901212345678901234567890123456789012123456789012345678901234567890121234567890123456789123456789012345678901234567890121234567890123456789012345678901212345678901234567890123456789012123456789012345678901234567890121234567890123456789
Address for SubmissionElectronic Submission : E-mail: edi [email protected]
The electronic submission must be in the form of an attachment with a coveringletter to be sent as e-mail
Post Submission : The EditorSCMS Journal of Indian Management,SCMS New Campus, Prathap Nagar, Muttom,Aluva – 683106, Kochi, Kerala, IndiaPh : +91 484 2623803, 2623804, 2623885, 2623887Fax : +91 484 2623855
123456789012345678901234567890121234567890123456789012345678901212345678901234567890123456789012123456789012345678901234567890121234567890123456789123456789012345678901234567890121234567890123456789012345678901212345678901234567890123456789012123456789012345678901234567890121234567890123456789

CERTIFICATE OF REGISTRATION
Title of Newspaper : SCMS JOURNAL OF INDIAN MANAGEMENT
Language : English(in which it is to be published)
Registration Number : KERENG/2009/32718
Periodicity of the publication and the : Quarterlyday on which it is published 1 January, 1 April, 1 July, and 1 October
Retailing Selling price of the : ` 1000/- (One Year Subscription)Journal
Publisher’s Name : Dr. D. Radhakrishnan Nair
Nationality : Indian
Address : 25/74, Ambady,Kothamangalam-686691, Ernakulam.
Place of publication : Prathap Nagar, Muttom,(with complete Postal address) Aluva-683106, Ernakulam District, Kerala.
Printer’s Name : Dr. D. Radhakrishnan Nair
Nationality : Indian
Address : 25/74, Ambady,Kothamangalam-686691, Ernakulam.
Name of the Printing Press(with complete address where printing : Maptho Printings, Kalamassery, Cochin-683104is to be conducted)
Editor’s Name : Dr. D. Radhakrishnan Nair
Nationality : Indian
Address : 25/74, Ambady,Kothamangalam-686691, Ernakulam.
Owner’s Name : SCMS COCHIN SCHOOL OF BUSINESS
Place : Prathap Nagar, Muttom.
SCMS Journal o f Indian Managemen t , July - September 201 5 121
A Quarterly Journal

SCMS Journal o f Indian Management , July - September 201 5 122
A Quarterly Journal
SCMS Journal of Indian Managementa quarterly publication
ofSCMS COCHIN SCHOOL OF BUSINESS
Dates of Release: -
Number I – January-March on 1 April
Number II – A p r i l - J u n e o n 1 J u l y
Number III – July-September on 1 October
Number IV – October-December on 1 January
© SCMS Journal of Indian Management, SCMS New Campus, Prathap Nagar, Muttom, Aluva-683106, Kochi, Kerala, IndiaPh: 91-484-262 3803 / 262 3804 / 262 3885 / 262 3887 Fax: 91-484-262 3855, Website: www.scms.edu.inE-mail:[email protected] Journal Website : www.scms.edu.in/jim
All rights reserved. No part of this publication may be reproduced in any form without the written consent of thepublisher. School of Communication and Management Studies and SCMS Journal of Indian Management assume noresponsibility for the views expressed or information furnished by the authors. Edited and published by the Editorfor and on behalf of SCMS and printed at Maptho Printings, Cochin-683104.
SCMS Journal of Indian ManagementSCMS COCHIN SCHOOL OF BUSINESS
SCMS New Campus, Prathap Nagar
Muttom, Aluva-683 106, Kochi, Kerala, IndiaPh: 91-484-262 3803 / 262 3804 / 262 3885 / 262 3887 Fax: 91-484-262 3855
E-mail: edi [email protected]
Website: www.scms.edu.in/jim

SCMS Journal o f Indian Managemen t , July - September 201 5 123
A Quarterly Journal
Name :
Address :
City :
Zip Code :
Country :
E-mail :
Phone :
Draft Number :
(in favour of “SCMS Payable at Cochin”)
Advertisement Rate
Outside back cover : 30,000 in colour, 15,000 in black and white
Inside front cover : 17,500 in colour, 10,000 in black and white
Inside back cover : 15,000 in colour, 6,000 in black and white
Inner full-page : 7500 in colour, 4,000 in black and white
Inner half-page : 5000 in colour, 3,000 in black and white
Subscription Rates 1 Year 2 Years Per Issue
Companies/Academic Institutes: 1000 ($60) 1800 ($100) 250 ($15)
Individual 800 1500 200
SCMS Journal of Indian Management
Subscription / Advertisement Form
Contact:Editor, SCMS Journal of Indian Management, Prathap Nagar, Muttom,
Aluva - 683106, Ernakulam, Kerala, India.Phone: 91-484-262 3803 / 262 3804 / 262 3885 / 262 3887 Fax: 91-484-262 3855
E-mail: [email protected], Journal Website: <www.scms.edu.in/jim>

SCMS Journal o f Indian Management , July - September 201 5 124
A Quarterly Journal


Registration Number : KERENG/2009/32718
For information, please visit our website <www.scms. edu.in>
SCMS COCHIN SCHOOL OF BUSINESS
Estd. 1976
PRATHAP NAGAR, MUTTOM, ALWAYE, COCHIN-683106, KERALA, Ph: 0484 - 2623803/04, 2623885/87, Fax: 0484-2623855Email: [email protected], Website: <www.scmsgroup.org>
Journal Website: <www.scms.edu.in/jim>
? Recognized as equivalent to MBA by theAssociation of Indian Universities (AIU).
? Centrally air-conditioned world-class campus, anexcellent team of 56 full time faculty, well-stockedlibrary, full-fledged computer centre, superiorteaching aids etc.
? Academic tie-ups with Foreign Universities to givethe programme global focus and innovation. Ninefaculty members from the universities of USA,Australia & Switzerland teaching full course at SCMS.
? Dewang Mehta National Award for excellence inleadership training systems
? Impact Marketing National Award forintegration of exceptional communication skilldevelopment system
? The only recipient of a grant for track record inperformance from AICTE
? Ranking within the first 25 B.Schools in theA++ category
? Only B.School which has a Universityapproved Research Centre for PhD inManagement
? Only B.School in India to establish a Chair forClimate Change
? SCMS- is nowCochin School of Business
PGDM OF SCMS COCHIN SCHOOL OF BUSINESS
ISSN-0973-3167
SCMS COCHIN SCHOOL OF BUSINESS [Night View]
SC
MS
Jo
urn
al
of
Ind
ian M
an
ag
em
en
t, V
olu
me
XII
, N
um
be
r 3
,Ju
ly -
Se
pte
mb
er
20
15
, P
ag
es
1-1
24
ACCRE D I T E D
B . S C H O O L
Edited, printed and published by Dr. D. Radhakrishnan Nair on behalf of SCMS COCHIN SCHOOL OF BUSINESS and printed at Maptho Printings, Kalamassery, Cochin-683104
and published at Muttom, Aluva-683106, Cochin.
SCMS COCHIN
-The first
accredited, AIU
recognized and
ISO certified
business school in
Southern India
SCHOOL OF BUSINESS
ACBSP (US)
Cochin School of Business
one of the seven ACBSP (US) accredited B-Schools in India.