indian journal of business administration (ijba)
222
-
Upload
khangminh22 -
Category
Documents
-
view
0 -
download
0
Transcript of indian journal of business administration (ijba)


EDITORIAL BOARD INDIAN JOURNAL OF BUSINESS ADMINISTRATION (IJBA)
ISSN :- 0975-6825
Chief Editor
Dr. Umaid Raj Tater Head
Department of Business Administration,
Faculty of Commerce and Management Studies
Jai Narain Vyas University, Jodhpur (Raj.) 342001 Website:-www.busadmjnvu.org,
Email ID:[email protected], [email protected],
M:- 9414719807, Ph:- 0291 2513004
Managing Editor
Dr. Ashok kumar Assistant Professor
Department of Business Administration,
Faculty of Commerce and Management Studies
Jai Narain Vyas University, Jodhpur (Raj.) 342001 Email ID:[email protected], [email protected],
M:-9829545411
Associate Editors
Dr Ravi Kant Modi HOD & Associate Professor
Department of EAFM
LBS PG College, Jaipur
Rajasthan [email protected]
Dr Mangu Ram Assistant Professor
Department of Accounting
JNV University, Jodhpur
Rajasthan [email protected]
Dr Asha Rathi Assistant Professor
Department of Business Admin.
JNV University, Jodhpur
Rajasthan [email protected] [email protected]
Dr. Ashish Mathur Assistant Professor
Department of Business Admin.
JNV University, Jodhpur
Rajasthan [email protected]
Dr. Manish Vadera Assistant Professor
Department of Business Admin.
JNV University, Jodhpur
Rajasthan [email protected]
Dr Ramesh K. Chouhan Assistant Professor
Department of Business Admin.
JNV University, Jodhpur
Rajasthan [email protected]

INDIAN JOURNAL OF BUSINESS ADMINISTRATION (IJBA)
ISSN :- 0975-6825
EDITORIAL CUM ADVISORY BOARD / REVIEWER BOARD
Prof. B. S. Rajpurohit
Jodhpur, Rajasthan Prof. RCS Rajpurohit
Jodhpur, Rajasthan Prof. Lalit Gupta
Jodhpur, Rajasthan
Prof. Raman Kumar Dave
Jodhpur, Rajasthan Prof. Rajan Handa
Jodhpur, Rajasthan Prof. J. R. Bohra
Jodhpur, Rajasthan
Prof. Mahender Singh Rathore
Jodhpur, Rajasthan Prof. Shishu Pal Singh Bhadu
Jodhpur, Rajasthan Prof. J. K. Sharma
Jodhpur, Rajasthan
Prof. S. S. Modi
Jaipur (Raj.)
Prof. Dunger Singh Kheechee
Jodhpur, Rajasthan Prof. Sunil Mehta
Jodhpur, Rajasthan
Prof. Anil Mehta
Banasthali Prof. S. K. Khatik
Bhopal (MP) Prof. G. N. Jakhotiya
Jodhpur, Rajasthan
Prof. R. S. Meena
Varanasi (UP) Prof. Jitendra Kumar
Haryana Prof. Vijay Pithadia
Amreli
Prof. Mahabir Narwal
Haryana Prof. S. K. Mishra
Haryana Dr. Anil Verma
Jodhpur, Rajasthan
Dr. Rajnish Kler
New Delhi Dr Abhishek Sharma
Bareilly (UP) Dr. Vandana Yadav
Jodhpur, Rajasthan
Dr. Sandeep Kumar
New Delhi Mr. Yashpal Meena
Jodhpur, Rajasthan Dr. M. Sree Lakshmi
Nalgonda, Telangana
Dr. Surender Singh
New Delhi Dr. O. P. Gusai
New Delhi Dr Vinod Kumar Dave
Jodhpur, Rajasthan
Dr. Neelu Grover
New Delhi Lt. Arjun Singh Choudhary
Jodhpur, Rajasthan Dr Indu Singh
New Delhi
Statutory Warning :- No part of this departmental journal may be reproduced or copied in any form or by means (graphic, electronic
or mechanical, including photocopying, recording, typing or information retrieval system) or reproduce on any disc, tape, perforated
media or any other information storage device etc., without the prior written permission of the publishers. Breach of this condition is liable for legal action at Jodhpur jurisdiction. However, researchers may use any part of this journal in their research work provided
that proper citations used in their work and description of such reference /citation is compulsorily required to inform in writing to the
publisher within a month of publication/award of research work.
The Editorial Board of the “INDIAN JOURNAL OF BUSINESS
ADMINISTRATION” is not responsible for any kind of views expressed
by the authors and reviewers.
Website:- www.busadmjnvu.org
E-mail:- [email protected]

Indian Journal of Business Administration
(National Peer Reviewed Refereed Journal)
The Indian Journal of Business Administration a national peer reviewed refereed journal is an official
organ of the Department of Business Administration, Faculty of Commerce and Management Studies, Jai
Narain Vyas University, Jodhpur (Raj.) publishing in the month of June and December every year. Since from
starting issue of our departmental journal in year 1994-95, we aims at bringing and providing the surface to
original studies - papers, research notes, reviews of literature - in different areas of Commerce & Business
Administration, made by academicians, practitioners and independent thinkers having genuine concern with
the theory and practice of Business Administration, for the purpose of fuller appreciation of the manifold
dimensions of the subject that may lead to more effective and meaningful management of operations.
Previously, it was yearly journal of Department but due to the huge academic demand the frequency of our
journal has been changed as two issues for every year in the month of June and December and now it called as
Biannual (half-yearly) journal.
The findings, interpretations and conclusions expressed in this journal are solely those of the authors
and should not be attributed, in any manner, to the Department of Business Administration.
Material in this journal is copyrighted. Requests for permission to reproduce should be addressed to the
'Chief Editor'. All communications, including contributions, literature for review and correspondence regarding
subscription, advertisements, etc. should be addressed to the Chief Editor, The Indian Journal of Business
Administration, Department of Business Administration, Jai Narain Vyas University, Jaswant Campus,
Jodhpur- 342001 (INDIA).
Periodicity : Biannual (June and December)
Publication Fee:- Nil
Annual Subscription:- INDIAN FOREIGN
Individual 2,000/- $ 100
Institutional 3,000/- $ 200
Yearly subscription order should be accompanied by Bank Draft in favour of the 'Chief Editor, The
Indian Journal of Business Administration', C/o The Head, Department of Business Administration, Jai
Narain Vyas University, Jaswant Campus, Jodhpur-342001 (India), payable at Jodhpur or by online fund
transfer only after taken the written permission from Chief Editor, IJBA.
To be cited as IJBA Vol:-14, Issue:- 01 Jodhpur (Raj.) India.
Published by :
Dr Umaid Raj Tater
Chief Editor, IJBA
& Head, Department of Business Administration, FCMS,
JNV University, Jodhpur (Raj.)
0291- 2513004
Printed by :
Associated Book Company
Jodhpur (Raj.)

A PROFILE OF THE DEPARTMENT
The Jai Narian Vyas University was established on 2nd June 1962 as 'The University of Jodhpur'.
Later on, it was renamed as 'Jai Narain Vyas University.' The University has a residential character. The
erstwhile 'Faculty of Commerce' of the university was restructured into four separate teaching
departments, viz The Department of Accounting, The Department of Business Finance and Economics,
The Department of Business Administration, and the Department of Management Studies in the year
1990 with a new umbrella name of 'Faculty of Commerce and Management Studies.'
The Department of Business Administration came into existence on 3rd Feb.1990 and since then it
has grown both academically and professionally, With Prof. P.N. Saxena as its first and founder Head of
the Department, we have had a long journey of two decades. Prof. Saxena is both satisfied and happy to
see the Department growing for his successors Dr. D.P.Ghiya, Mrs. Asha Malhotra, Dr. A. B. L. Mathur,
Dr. R. R. Lodha, Dr. L. C. Bhandari, Dr. Rajan Handa, and Dr R.C.S. Rajpurohit, all have taken the
department to greater heights over the years.
The Department offers M.Com., Ph.D, and D.Litt in Business Administration. At the
undergraduate level, the Department offers B.Com (Hons.), B.Com and BBA Degree courses in
combination with sister departments. Two separate Post Graduate Diploma courses, namely Post
Graduate Diploma in Marketing and Sales Management and Post Graduate Diploma in Human Resource
Management have been successfully running on self-financing basis. Both the diplomas have proved
quite useful as professional job oriented courses for past many years.
The M.Com. Program offers specialization in four different areas: The Human area, The
Marketing area, The Finance area, and The Institutional area. Currently, teaching is provided in
Marketing and Human areas. The Department is staffed with and enriched by Seven Assistant
Professors. Since the creation of the Department to till date, regular research as good number of PhD
degrees have been awarded and numerous of PhD researches are in progress thereby usefully
contributing to Research for advancement of knowledge in the domain of business administration.
Several of our graduates have been very well placed in different organizations both in India and
Abroad. The Department is also contributing by working on major and minor Research projects
undertaken by its faculty members. The department successfully organized various UGC Refresher
Course, Workshops, National Seminar and Conferences sponsored by UGC, New Delhi.
I must say that we in the department have always worked with a team-spirit and therefore
whatever we have achieved so far, it is the gainful result of that. For all communications,
following is the address of the Department:
Dr Umaid Raj Tater
Head of the Department & Chief Editor, IJBA
The Department of Business Administration Faculty of Commerce & Management
Studies Jai Narain Vyas University, Jaswant Campus, Jodhpur 342 001
Rajasthan, India

MESSAGE
It is heartening to note that the Department of Business Administration is coming up with
the fourteenth edition of its prestigious journal, "Indian Journal of Business
Administration," featuring high-quality research papers on various management aspects
contributed by eminent academicians, practitioners, and professional thinkers, among
others. The intellectual and creative articles / papers published in the aforementioned
issue are of an exceptionally high standard which will prove to be a valuable for all
universities and academicians, contributing for their own intellectual renewal.
Publication of subjective matter with information and creativity is a “foundation of
Knowledge”. Advancement of knowledge takes place through continual research, and
research outcomes are communicated to the society through publication and other
suitable modes. The present issue of the journal being brought out by the department
rightly serves this purpose.
I would like to put on record my sincere appreciation for the young team of Department of Business Administration for committed efforts for academic advancement & enrichment. The continuance of this journal is indeed praiseworthy. The editorial team of the journal has really put in a great deal of effort for this issue for which they also deserve a big applause. I congratulate to all fellow teachers of Department of Business Administration for their continued effort in active engagement in research. With Best Wishes
Prof. (Dr.) Mahendra Singh Rathore
Ex. State Minister (Govt. of Raj.), Ex Chairman, Jodhpur Development Authority
Prof. (Dr.) Mahendra Singh Rathore Dean
Faculty of Commerce and Management Studies
Jai Narain Vyas University, Jodhpur (Raj.)

MESSAGE
Shri Dr. S Radhakrisnan, former President of India inaugurated our University in the year 1962 as ‘The University of Jodhpur’ which was renamed as “Jai Narain Vyas University, Jodhpur” in the year 1986. Shri Jai Narain Vyas was a former Chief Minister of Rajasthan hailing from Jodhpur in whose name it has been rechristened. In the inaugural speech of Dr. Radhakrisnan he said: “It is my hope and it is my earnest desire that the young people, who will be educated in this University, will go forward not as prisoners of the past, but as pilgrims of the future, will develop in them a spirit of dedication, a spirit of wholeheartedness, single-minded concentration on the advancement of knowledge whether in science or in humanities”.
As far as this issue of our Departmental Nation Peer Reviewed Refereed Journal in my ex-officio capacity as the Chief Editor of this Departmental Journal, I feel a sense of satisfaction in bringing out this current volume of our journal and we could not have reached this milestone without contributions and cooperation received at all levels of the editorial efforts and authors who have contributed to our growing and continued success.
The Journal explores subjects of interest to academicians, practitioners and others involved in the field of business. Our goal is to promote awareness, provide a research outlet for the students and faculty, and increase educational exchange. Through earlier articles, and those in this issue, we have explored a broad range of topics including: instructional improvement, methods for delivery of course material, performance measures, learning approaches in new business environment. Our contributors have written their papers in the fields of Banking, Finance, Management, Marketing, Business Education, and MIS.
I must express my sincere thanks to Prof. (Dr) Mahendra Singh Rathore, Dean, Faculty of Commerce and Management studies, Prof. (Dr) D.S. Kheechee, President, Jai Narain Vyas University Teachers’ Association and all my fellow teachers, friends and non-teaching staff members in the department as well as in the faculty of Commerce and Management studies for their affectionate and supportive behavior. We are still learning, still experimenting and still attempting to improve our process and product. We would appreciate your feedback and suggestions, and welcome additional assistance to the editorial board.
(Dr Umaid Raj Tater)
Dr. Umaid Raj Tater
Chief Editor, IJBA & Head,
Department of Business Administration, FCMS
Jai Narain Vyas University, Jodhpur (Raj.)
EDITORIAL
The "Indian Journal of Business Administration," founded in 1992 by Prof. P.N.
Saxena, has quickly gained a reputation for presenting the best of management ideas that
are conceived and developed by management thinkers in the academic society on issues
that are regarded as important and crucial in the contemporary world. In the process, it is
usual that while old concepts get reconfirmed or revised, new concepts and techniques
emerge for a fuller understanding of the problems and implications of diverse approaches
and strategies in the field of Commerce and Management.
The “Indian Journal of Business Administration” is a peer reviewed referred
national journal of the Department of Business Administration. Although, it is only a
small star in the galaxy of learners, it has been doing its humble bit in bringing to the
surface, some of the relevant issues in the realm of commerce and management, along
with necessary and even implicit non-business orientations towards a wide range of
public and offering possible tips or clues to the academician, readers and managers for
multiplying managerial/organizational effectiveness in general towards enhancing their
quality of business as well as a successful life.
The last two years have been tough for society and business alike due to the
Covid crisis. However, these circumstances have also led to the transformation of the
whole corporate environment, as well as the ways of doing business. New fields of study
have developed that have the potential to significantly alter future business situations.
The current edition of the journal encompasses few of those researchers in its present
volume. The current volume touches several research areas which include blockchain and
payment system in banking, covid-19 impact on Indian Economy, social impact of
women entrepreneurship, robotic accounting, health and education status of Rajasthan,
trademark issues in cyberspace, ethical business practices, digital era marketing,
changing consumer behaviour during covid pandemic, artificial intelligence in e-
commerce, corporate social responsibilities, brand community building to name few. The
present volume is a modest and honest attempt to bring to light contemporary researches
Dr. Ashok Kumar
Managing Editor, IJBA & Assistant Professor
Department of Business Administration, FCMS
Jai Narain Vyas University, Jodhpur (Raj.)

to solve social and industrial problems, in the fervent hope that the exercise would help
one have a better appreciation of the issues that matter. In the expectation that these
expert studies, in their own right and limits, would help stimulate the thinking of the
readers and generate responses, possibly helping in ways more than one.
The current issue would not have been possible had we not received
encouragement and support from our academic leaders. We are thankful to our Hon’ble
Vice Chancellor Professor (Dr.) Praving Chandra Trivedi for all his inspiration and kind
assistance that enabled the present volume to see the light of the day. We would also like
to extend our sincere gratitude to Professor (Dr.) Mahendra Singh Rathore, Dean, Faculty
of Commerce and Management Studies for his precious support and blessings.
The Department has potential and drive and each of the members hold the key to
open up the pathway to excellence. The members involved in this have done appreciable
work and unless members participate wholeheartedly, improvements would remain
elusive. The success of the journal will depend upon the deep involvement of the
members of the department as a family and the kind support from the Faculty of
Commerce and Management Studies as well as J N V University administration.
Though a significant attempt has been made in the improvement, quality being
elusive as to its boundary limits, the subsequent issues would be further developed for
which an evaluated feedback from the readers would be of immense help. The Editorial
Board will focus on professionalizing these management circles. It is believed that the
patronage and co-operation extended by contributors and readers would enable the
department to improve the quality of the journal as a continuous process in its value
growth. We are looking forward to valuable comments from readers and contributors for
the true improvement in the quality of our Departmental Journal.
Dr. Ashok Kumar

CONTENTS
1. BLOCKCHAIN AND PAYMENT SYSTEM IN BANKING : A KEY TO SUSTAINABLE CHANGE IN FINANCIAL SERVICES
- Dr. Rajnish Kler & Dr. Bishnu Charan Nag
01-15
2. A STUDY OF COVID-19 PANDEMIC ON INDIAN ECONOMY WITH REFERENCE TO CHALLENGES AND OPPORTUNITIES IN CONTEMPORARY ENVIRONMENT
- Dr Goldie Zaki & Dr. Mahesh Joshi
16-24
3. SOCIAL IMPACT OF WOMEN ENTREPRENEURSHIP IN INDIA
- Dr. Ashish Mathur & Raveen Purohit
25-35
4. ROBOTIC ACCOUNTING : A NEED OF NEW ACCOUNTING WORLD
- Dr. Mangu Ram
36-46
5. AN ANALYTICAL STUDY OF HEALTH AND EDUCATION STATUS WITH SPECIAL REFERENCE TO RAJASTHAN
- Dr. Kanta Choudhary
47-53
6. CRITICAL ANALYSIS OF TAX PAID AND INCOME TAX RETURNS FILED BY INDIVIDUAL ASSESSEE
- Patel Jatin Kamlesh bhai
54-60
7. A STUDY OF DOMAIN NAME & RISK MANAGEMENT OF ONLINE BUSINESS IN CONTEXT OF TRADEMARK ISSUES IN CYBERSPACE
- Nishant Gehlot & Amit Kumar Kashyap
61-71
8. NEED OF ETHICAL ISSUES AND PRACTICE IN BUSINESS
- Dr Ashok kumar & Dr Asha Rathi
72-79
9. DIRECTION OF INDIA’S EXPORTS
- Dr. Mathanraj. T & Saranya.C
80-104
ISSN : 0975-6825
INDIAN JOURNAL OF
BUSINESS ADMINISTRATION (IJBA) (A National Peer Reviewed Refereed Journal)
Volume:- 14 Issue:- 1 Jan- June:- 2021

10. DIGITAL ERA MARKETING: A RESEARCH STUDY OF HDFC BANK
- Dr. Sushil Kumar Daiya
105-113
11. CHANGING CONSUMER BEHAVIOUR DURING NOVEL CORONA VIRUS
- Dr.Umaid Raj Tater & Ms. Ishu Chalana
114-131
12. ROLE OF ARTIFICIAL INTELLIGENCE IN ENHANCING E-COMMERCE
- Dr. Champa Devi Maurya
132-136
13. A STUDY ON IMPACT OF GOODS AND SERVICE TAX (GST) ON INDIAN BANKING SECTOR
- Dr. Suresh Purohit
137-144
14. SAVING AND INVESTMENT BEHAVIOR OF RURAL HOUSEHOLDS IN THE BHIWANI DISTRICT OF HARYANA
- Sharmila Singh & Dr. Ishwar Mittal
145-155
15. CORPORATE SOCIAL RESPONSIBILITY AND ENVIRONMENT PROTECTION - A STUDY OF INDIAN CORPORATE SECTOR
- Mr. Vishal Anand & Dr. Mukesh Kumar
156-163
16. A PROJECT REPORT ON “A STUDY ON BRAND COMMUNITY BUILDING -WITH REFERENCE TO CAFÉ COFFEE DAY”
- Neha KS
164-173
17. CORPORATE SOCIAL RESPONSIBILITY ISSUES AND SUSTAINABILITY
- Reena Jain
174-181
18. E- COMMERCE – NEED OF THE MODERN MARKETING - AN ANALYTICAL STUDY
- Dr. Shilpa Parihar
182-193
19. ISSUES AND CHALLENGES OF CORPORATE GOVERNANCE
- Dr. Pushpendra Kumar Musha
194-207

Indian Journal Of Business Administration (IJBA)
(A National Peer Reviewed Refereed Journal)
ISSN : 0975-6825, Volume 14, Issue 1, January-June 2021, pp. 01-15
1
BLOCKCHAIN AND PAYMENT SYSTEM IN BANKING : A KEY
TO SUSTAINABLE CHANGE IN FINANCIAL SERVICES
Dr. Rajnish Kler*
Dr. Bishnu Charan Nag**
ABSTRACT
Due to the potential of disruptive influence it has on the business models,
blockchain technology is a matter of debate amongst the researchers. Studies for
exploring the effect of blockchain on the payment system, representing major cornerstone
of the banking system and cradle of the technology have been done. The results of the
studies along with 4 main areas of thought process, suggest that this technology allows
an offering of the new services which render few of the present day services completely
obsolete.
This has consequently impacted the financial system of organisations in payments
structure. It also generates a huge potential for the new blockchain management
technologies while making few of the present ones obsolete. Eventually, the new players
that have the capability of leveraging the prospects of blockchain technology have a very
strong impulse on this development. Findings contribute to studies by offering insight
regarding the impact these innovative technologies have on the blockchain technology
and the practical implications by giving a better explanation about the future of
blockchain technology regarding payments.
Keywords: Blockchain Technology, BMs, Blockchain Management System, Global
Payment System
Introduction
The technological changes bring new challenges and offer new opportunities for
organisations. Particularly, the innovative technologies are potential for modifying the
equilibrium amongst the firms within an industry. Top firms consistently are not able to
* Associate Professor Motilal Nehru College (E), University Of Delhi, Delhi-21
**Associate Professor Motilal Nehru College (E), University Of Delhi, Delhi-21

Dr. Rajnish Kler & Dr. Bishnu Charan Nag : Blockchain and payment system in banking: A Key to sustainable change in financial services
2
identify their effect on the BM or the business model might result in ruinous errors. For
stay on the top of the industry while the technological discontinuities happen. Not enough
instance an introduction of smartphones, online streaming and digital cameras.
Companies like Nokia, Eastman Kodak, and Blockbuster had to quit the market due to
their inability for adapting the BMs to the changed technological surroundings. Thus, it’s
imperative to assess the result of latest technologies for BMs in affected industry might
have (Christensen, Raynor and McDonald, 2015).
During the past few years, the sector of financial services went through the far
reaching changes because of the current crisis in the financial market but only partially.
These days, the move towards digitisation of the products and the process pushes the
banks and the other financial organisations for rethinking the BMs, strategies and
operations. Advent of the new technologies along with a reduction in the margin and rise
of the new competitors are compelling the incumbent institutions for finding feasible
solutions. This would help them in coping with this new surroundings. It’s in this case
that especially the technology called blockchain attracts the attention of actors of the
financial institutions for the potentially revolutionary improvements of financials and the
operations. Following, the blockchain technology vouches for the radical shift to the
direct transactions amongst the end parties without the intermediary services having
consensus mechanism for verifying the new transactions and decentralised maintenance
of records for all the transactions.
Even though misuse of crypto currency has aroused a lot of scepticism in payment
industry. The technology used for this forms the new digital currencies and has gradually
imposed the evocative presence. In the past few years, the applications based on
blockchain have multiplied manifolds and use the cases which cross over boundaries of
payment system. Blockchain has a unique potential and adopting it in the payment
industry is considered to be ground breaker.
Nevertheless, even when the preliminary predictions regarding the impact of
blockchain for the particular parts of banking sector have been done, a specific
delineation of consequences which could have for all the payments sector has been
identified. For addressing the point and for contributing to studies regarding
technological innovations and BMs, these studies answer all the questions related to this
research. The main question is how does this technology impacts at present and the new
business model in payment industry? The result is based on the Delphi studies amongst
the experts of the payment industry which knows about the blockchain technologies
(Roßbach, 2016).
The results along with the 4 thought areas indicate that the blockchain technology

Indian Journal Of Business Administration (IJBA)
(A National Peer Reviewed Refereed Journal)
ISSN : 0975-6825, Volume 14, Issue 1, January-June 2021, pp. 01-15
3
affects the blockading management technologies would affect BMs in payment industry
by: allowing the new services while making a few of the service obsolete, through these
change in the service, subsequent effect on financial structure in organisations in payment
industry has been realised, it generates a huge potential for the new BMs within the
market and some of the current ones become obsolete, eventually, this industry is
affected by the new players which are capable of leveraging the potential of this
technology. The contribution lies within an analysis of the effect of the new technologies
of BMs with the help ofblockchain technology (Bott&Milkau, 2016).
Literature Review
Innovation in the infrastructure facilities like energy, transportation and water that
accounts for a prominent amount of the emissions might have a huge impact for reducing
the emissions. However, it demands a game changing approach for reimagining the way
low carbon transition may happen at a low cost and in the most equitable way. The basic
attributes of Blockchain technology could help in enabling deep technological
integration, possibilities of the new business model and standardisation. The potential for
technology integration with the other important technologies such as internet or artificial
intelligence might have huge implications on the conventional infrastructure
service(Wirtz, 2016).
Core competencies of the blockchain technology including auditability of data,
transparency, value transfer, privacy, automation and efficiency in processing could be
leveraged for driving systematic changes which are important for delivering a sustainable
infrastructure. The attributes of the decentralised trust as well as immutable records help
with the real ownership transfer. While just copying the data through internet was
possible previously, the blockchain technology has helped in accelerating the shift to
internet of valuable things. It enables tangible and intangible assets such as currency,
data, infrastructure securities and other obligations such as contracts which need to be
exchanged without any intermediaries through trustworthy ledger (Guo& Liang, 2016).
While thinking of the blockchain, the carbon neutrality isn’t something to be considered.
The first application of blockchain is known to be the environmental polluter which
consumes a huge amount of energy while emitting a huge quantity of carbon dioxide. It
validates the transactions and sustains the network too. However, the concerns like these
are true just for the specific applications of underlying technologies (Knezevic, 2018).
On the basis of the architecture of network and the choice of the protocols,
blockchainmaybedeployed in energyefficient ways. For instance, the private block chains

Dr. Rajnish Kler & Dr. Bishnu Charan Nag : Blockchain and payment system in banking: A Key to sustainable change in financial services
4
with the help of algorithms such as proof of the authority while setting up properly don’t
consume more amount of energy as compared to the traditional solutions of the database
(Collins,2016).
The blockchain technology might unlock the new sources for finance and
mobilising the current pledges of the industry to reduction in carbon through
establishment of the new financial platforms. One objective which is very clear here is
lowering the cost for capital for the infrastructural projects apart from enhanced liquidity,
expanded access as well as transparency in finances. Secondly, technology might bring
visibility for alignment to the sustainability goals. This is done by enabling the
stakeholders and the countries in tracking the information and data on infrastructure
projects (Chung and Kim, 2016). The blockchain enabled platforms helps in
standardising the data, assessing the performance of the assets and improving the
compliance. These could further help in augmenting while they integrate with the remote
sensors or when they are connected with deep analytics such as artificial intelligence.
Thirdly, it might also help in improving awareness and in accessing by working as
transactions enabled infrastructure of the new models of market. It may incentivise and
boost the willingness of the consumers and the institutions and their ability to contribute
to the long term goals of sustainability. It also brings changes within the industries for
adapting to move to the demand by the consumers (Tschorsch, Scheuermann, 2016).
Blockchain was initially introduced in the form of an approach for payments
transactions on the basis of cryptography. It aimed at providing an alternate mechanism
for trust between the 2 transacting parties. The technology helped in collective ledger
keeping. This by means of mathematical function helped the participants in reaching to
an agreement for approval of the transactions. The information regarding the single
transactions may be collected in blocks. The blocks are verified as well as reviewed by
network and then added in the chronological order on computers of the participants in
that network. The distributed ledger of the verified transactions of the specific units is
provided to that network then (Yeoh, 2017). The conventional role which the financial
institutions play as trustworthy 3rd party, mitigate any risk related to transaction. Bit coin
is the first digital currency which is also the largest by far. It also represents the most
popular applications of this technology. These days, blockchain has been proposed as the
solution for broader spectrum of payments that range from real time payment between the
2 parties towards transfer of funds across different currencies such as remittances, micro
payments and the digital assets. The effect of this technology could proceed further than
some of the modified processes and some of the new commodities (Shang & Price,
2019). Researchers expect the consequences to reach further which would reach in the

Indian Journal Of Business Administration (IJBA)
(A National Peer Reviewed Refereed Journal)
ISSN : 0975-6825, Volume 14, Issue 1, January-June 2021, pp. 01-15
5
whole BMs would be impacted. From this it could be incurred that the effect on BMs of
blockchain technology are the best example for far reaching potential of the IT
development. According to this, the blockchain technology has attracted the interest of
the community of Information system regarding the cryptographic and trust aspects to
implications and procedure and diverse issues of the virtual currency (Geiregat, 2018).
The payments sector represents the biggest business fields of the financial institutions.
Payment in effect aren’t just attractive source of revenue, they also work as an anchor for
different services. Further, it is also a crucial element regarding customer data (Franke,
Schletz and Salomo, 2020).
For banks, the information payment is the main knowledge source regarding the
customers. Further, losing the stakes in the payments cause disastrous consequences on
the banks. At present, the industry of payments finds itself within the state of upheaval. It
is triggered by the regulations and the political initiatives. Amongst these it’sworth
mentioning development of single payments, establishment of the instant payment which
is decided already (Firdaus, et. al., 2019).
Globally, an emergence of the smartphones has helped the new players like large
telecommunication and technological enterprises, which enter the market. Further, a lot
of companies from Fintech arena have emerged. Squeezed between need to invest
according to IT, erosion of revenue from the conventional sources as well as increased
competition, BMs of a lot of financial institutions are under a lot of pressure. Thus, any
attempt at making current payments infrastructure obsolete or for pulling the payments
away from banking institutions and otherother financial institutions contribute strongly to
the deterioration of the BMs. Regarding this, the blockchain technologies represent
threats significantly as it may switch the 3rd party functions of the financial organisations
off in the payments. However a reduction in cost which might be realised by usage of the
blockchain in payment induces them to look at the development (Andoni, 2019).
The promising potential if the blockchain technology attracts the attention
towards the current payment system and operators, providers of the international
transactions payments and the regulators. The enterprises from both these technologies
and financial services domain are launching and considering the prototypes of the
blockchain based options (Casino, Dasaklis and Patsakis, 2019). Particularly, the
incumbent organisations make an attempt at defending the BMs. It’s done with the
application of different types of strategies from creating the in house platforms towards
directly investing in the blockchain organisations collaborating with them and offering
the accelerator services for exploring the blockchain applications. The large banks are

Dr. Rajnish Kler & Dr. Bishnu Charan Nag : Blockchain and payment system in banking: A Key to sustainable change in financial services
6
participating in the global collaborations. It’shappening in almost all the major
consultancies and audit firms offering their expertise and making an attempt at
positioning themselves as a leading knowledge carrier (Jia, et. al., 2016).
Before getting into the details with major proofs from western banks, it is
important to consider the role of geographical areas for the promotion of blockchainstart-
ups and developments of the companies.
While talking about the blockchain development and implementation,
geographical differences arise since the level of investment differ from one region to
another. In this regard, the US market is considered to be the pioneer of blockchain based
start-ups. This is mostly due to the initial few developments of this technology came from
those regions. However competitive edge regarding the environment and the investment
that American landscaping the initial few years have been reduced recently by the entry
of the Chinese Fintech organisations (Yogesh, 2021). Even because of the precise
regulations which developed the desired ecosystem for allowing blockchain based start-
ups for growing without any legal restrictions. Studies focus mainly on western areas, in
an attempt to state the state of art of the blockchainstrategy implementation in the
banking system of America and Europe (Burnson, 2017).
Being a revolutionary technologicalblockchain has a prominent impact on the
governance, law and the society. Some of the applications like voting on the basis of the
blockchain technology does have certain implications. Blockchain impacts the design of
the organisation as it creates the possibility for different stances for Bit coin ICOs and the
other applications of the blockchain (Ehrenberg and King, 2020).
A positive aspect of this is that a blockchain isn’t a single network. It comprises
of multiple networks along withdifferent mechanism of consensus as well as other
specifications. There are certain levels for tokenisation which may help with the adoption
of some of the blockchain networks. However some of the networks could also be banned
in risk averse or conservative nations. Tokenisation offers 4 main benefits to all the
sellers and the investors. These are cheap and fast transactions, better liquidity, increased
accessibility and improved transparency. Tokenisation isn’t important for all the
applications based on blockchain technology. However it’s the key for maximum number
of disruptions in a financial domain. It serves as the base for ICOs (Lee, Noh, Khim,
2020). The importance of blockchain for supply chain is acting as the inter organisation
system. It begins with the tracking of the product’s journey from raw material to the
finished goods. Low consumption of energy consensus protocol, tokenisation and the
smart contracts has additional new dimensions to potential of the blockchain technology
(Tan, Xuan, Cottrill, 2018). Studies have been done for providing a deep dive into

Indian Journal Of Business Administration (IJBA)
(A National Peer Reviewed Refereed Journal)
ISSN : 0975-6825, Volume 14, Issue 1, January-June 2021, pp. 01-15
7
benefits as well as the applications of the blockchain technology while reviewing the
current literature for the subject. Social performance, economic performance as well as
the environmental performance form the constructs of sustainability. It’s often the
challenge for the business hubs to follow the practice of sustainability while offering an
improved financial and environmental performance (Montecchi, Plangger, Etter, 2019).
It often becomes quite challenging for the businesses for following the practices
of sustainability while offering an improved financial and environmental performance.
Social performance demands a democrat’s structure where rights as well as requirements
of all the stakeholders are safeguarded. There’re long term advantages for boosting the
objectives of sustainable development that are even referred to under triple bottom-line
approach (George et. al., 2019).
While improving the competitive benefits, an organisation engages into activities
which positively impact the society and the environment. This particular aspect should be
assess regardingthe activities of supply chain. In this regard, it should be seen that
collaboration has an important role to play for optimising flow of information, goods as
well as financial payments. It often happens that the participants of supply chain have
conflicting priorities as well as interests (Behnke and Janssen, 2020). There are also
technological barriers of the incompatible system which are used by parties for tracking
the shipments. The firms address such challenges through integration of sustainability
into overall strategies. It would help the firms in positively impacting the society,
environment and the economy (Agrawal and, 2019). The latest peer review on
sustainability reflects that blockchain isn’t simply one single network. It comprises of
multiple networks which have different consensus mechanism as well as other
specifications. There are multiple level tokenisation which may help with adoption of
some of the networks of blockchain. However, some of the networks could also be
banned in the risk averse or conservative nations. Tokenisation offers 4 main advantages
for all the sellers and the investorsincluding cheap and fast transactions, improved
transparency and enhanced accessibility (Raheem, Shishaev and Dikovitsky, 2019).
Tokenisation isn’t important for the blockchain applications. However, it’s important to
see that disruptions in financial sector which also serves as the base for the technology.
The importance of blockchain for supply chain is acting as the inter-organisational
structure. It begins with tracking of the journey of the commodities from raw material to
finished goods. Low energy consuming consensus protocol, tokenisation as well as smart
contract add new dimensions into the efficiency of the blockchain technology into supply
chain management (Violino et. al., 2019).

Dr. Rajnish Kler & Dr. Bishnu Charan Nag : Blockchain and payment system in banking: A Key to sustainable change in financial services
8
Embracing the new technological advancements enable prominent reductions in
the greenhouse gases emission. It would be interesting to mitigate the impact of change in
climate. However, it’s not obvious what kind of breakthroughs would look like. It’s quite
likely that a lot of technologies, working in the concert would be required for handling
the complexities of the challenge at hand (Violino et. al., 2020).
Innovation as well as investment in the storage of energy, material, renewable
generation of energy, agricultural science, transport service and digital technology are a
few areas crucial for transition of low level of carbon. Various digital innovations emerge
in global economy offering the potential of transforming the systems which function by
making trade, manufacturing, agriculture and infrastructure more intelligent, efficient and
connected (Duan et. al., 2020). The biggest benefit of promoting the digital innovations
is that it causes further innovation, unlocking of the unprecedentedpossibilities, etc. It’s
true specifically in the infrastructure services with the potential to innovate within the
domain which is big. The report explores the way innovations and specifically
disseminated ledger technology like blockchaintechnologyalong with the other
technologies such as artificial intelligence and interest of things may help in boosting the
cost efficient transition of the key infrastructural services. While consideringblockchain
technology, carbon neutrality does not come to our mind first (Figorilli et. al., 2018).
Talking about bit coin again, the first application of blockchain technology is
considered to be an environmental polluter. It consumes a huge amount of energy while
emitting vast amount of carbon di oxide for validating the transactions and sustaining the
network. However, these kind of concerns are true only when the particular applications
of underlying technologies happen (Shi et.al. 2019).
According to reports, the blockchain technologies as well as the underlying
attributes have the capability of delivering sustainable infrastructure. It unblocks the
opportunities along with the value chain of infrastructure. In principle, the blockchain
technology which are used interchangeably could be used for the purpose of
recordkeeping and transferring of value without needing a trustworthy central entity for
maintaining the database or for validating the transactions. Instead, such activities are
accomplished with decentralisation of the network wherein data is saved (Treiblmaier,
Rejeb and Strebinger, 2020). The functions happen with the validation mechanism
which helps all the participants within the network to have immutable one single source
for truth. The as such smart contracts that are enabled throughblock Chan technologies
permit an auto execution of the transactions while one and more preconditions could be
fulfilled. Therefore, providing the potential for efficiency gain could be realised. The

Indian Journal Of Business Administration (IJBA)
(A National Peer Reviewed Refereed Journal)
ISSN : 0975-6825, Volume 14, Issue 1, January-June 2021, pp. 01-15
9
digital and physical assets could be represented as the token of value on shared
disseminated registry, helping tokens to be traded directly amongst the participants of the
network. In short, such core efficiencies allow use of the crypto currencies and token
digital records. This is in context to infrastructural lifecycle including finance as well as
procurement by way of operations and tenders (Bumblauskas et. al., 2020).
Objectives of the Study:
1. To find the reasons for radical shift in banking due to blockchain with special
reference to payment or global payment system and its role in sustainable change
in Financial Services
2. To ascertain the significance of the reasons forradical shift radical shift in banking
due to blockchain with special reference to payment or global payment system
and its role in sustainable change in Financial Services
Research Methodology:
The present study is descriptive in nature in which the reasons for radical shift in banking
due to blockchainwith special reference to payment / global payment system & how it
will be an enabler for sustainable change in financial services have been studied. The
sample size of the study is 160. The data were collected with the help of a structured
questionnaire on a five-point scale and analysed with the help of the mean values and t
test.
Table1: Demographic profile of the respondents
Organisation Gender Accept Blockchain Blockchain made
transaction easier
Yes No Yes No
Bank Male 28 20 8 21 7
Female 30 15 15 17 13
Stock
Market
Male 22 8 14 12 10
Female 27 8 19 18 9
Other
Services
Male 24 14 10 15 9
Female 29 16 13 20 9
Total 160 81 79 103 57
Table 1 presents demographic profile of the respondents on radical shift in banking due to
blockchainwith special reference to payment / global payment system and how it will be

Dr. Rajnish Kler & Dr. Bishnu Charan Nag : Blockchain and payment system in banking: A Key to sustainable change in financial services
10
an enabler for sustainable change in financial services. There are 56% males and 54%
females in the study. Among the respondents,33% are working in banking, 39% in stock
market and 28% in other sectors. The 51% of the respondents accepted blockchain and
49% of the respondents did not. The percentage of respondents who thinks that
blockchain made transaction easier is 64% and 36% thinks it has not.
Table 2: Mean Value of the radical shift in banking due to blockchainwith special
reference to payment / global payment system and how it will be an enabler for
sustainable change in financial services
Sr.
No.
Statements Mean
Score
1. Blockchain offers additional security to the financial transactions 4.25
2. Blockchain eradicates the middlemen for financial transactions 4.12
3. Blockchain technology has helped in making the payments faster 4.21
4. Blockchain has made it easy and safe to borrow money from
financial institutions
4.19
5. Blockchain helps banks to accept digital currency which is quite
beneficial for the banks
4.23
6. Since transactions are generated digitally, banks don’t need to
bother about any prominent errors
3.96
7. Blockchain helps the financial institutions in knowing their
customers better
4.02
8. Blockchain increases transparency between the participants of the
market
4.07
9. Blockchain permits use of certain tools like self-execution contracts
and smart contracts which automate the manual processes
3.91
10. Blockchain helps in replacing the heavy paper work of the process
of lading in trading finance industry
4.28
Table 2 shows the opinions of the respondents. It is observed that Blockchain helps in
replacing the heavy paper work of the process of lading in trading finance industrywith
the mean value of 4.28. It is followed by Blockchain offers additional security to the
financial transactions (4.25), Blockchain helps banks to accept digital currency which is
quite beneficial for the banks (4.23) Blockchain technology has helped in making the

Indian Journal Of Business Administration (IJBA)
(A National Peer Reviewed Refereed Journal)
ISSN : 0975-6825, Volume 14, Issue 1, January-June 2021, pp. 01-15
11
payments faster (4.21). Further, Blockchain has made it easy and safe to borrow money
from financial institutions (4.19), Blockchain eradicates the middlemen for financial
transactions (4.12), Blockchain increases transparency between the participants of the
market (4.07), Blockchain helps the financial institutions in knowing their customers
better(4.02) and Since transactions are generated digitally, banks don’t need to bother
about any prominent errors (3.96) were also considered important. Reasons like
Blockchain permits use of certain tools like self-execution contracts and smart contracts
which automate the manual processes (3.91) were also viewed as important.
Table 3 Radical shift in banking due to blockchainwith special reference to payment
/ global payment system and how it will be an enabler for sustainable change in
financial services
Sr.
No.
Statements Mean
Score
t-Value Sig
1. Blockchain offers additional security to the
financial transactions
4.25 9.285 0.000
2. Blockchain eradicates the middlemen for financial
transactions
4.12 7.219 0.000
3. Blockchain technology has helped in making the
payments faster
4.21 8.062 0.000
4. Blockchain has made it easy and safe to borrow
money from financial institutions
4.19 6.692 0.000
5. Blockchain helps banks to accept digital currency
which is quite beneficial for the banks
4.23 7.430 0.000
6. Since transactions are generated digitally, banks
don’t need to bother about any prominent errors
3.96 5.280 0.000
7. Blockchain helps the financial institutions in
knowing their customers better
4.02 6.201 0.000
8. Blockchain increases transparency between the
participants of the market
4.07 7.518 0.000
9. Blockchain permits use of certain tools like self-
execution contracts and smart contracts which
automate the manual processes
3.91 4.915 0.000
10. Blockchain helps in replacing the heavy paper work
of the process of lading in trading finance industry
4.28 9.410 0.000
Table 3 shows the results of t-test. It is found from the table that the significance value

Dr. Rajnish Kler & Dr. Bishnu Charan Nag : Blockchain and payment system in banking: A Key to sustainable change in financial services
12
for all the statements is below 0.05, hence all the statements regarding the Blockchain&
radical shift in banking with special reference to payment / global payment system and
how it will be an enabler for sustainable change in financial services are significant.
Conclusion
The blockchain technology is potential enough for improving how transactions
are happening across the world. It also has the potential of ensuring global access of the
financial structure. In short, as per World Economic Forum, there’re some key findings
regarding the blockchain technology. The distributed ledgers technology is efficient
enough of drivingefficiency and simplicity. It establishes the new financial service
infrastructure and process. The distributed ledger technologies forms the base for next
generation of financial service infrastructure along with the other existent as well as
emerging technologies.
The blockchain application also promotes formation of the multi-centre scenario
which improves the efficiencies of the banking structure. However it is important to take
into considerations some of the obstacles as technical regulatory as well as other issues
related to this technology would be resolved at the end.
References
• Christensen, C.M., Raynor, M. & McDonald, R., (2015), what isDisruptive
Innovation? Harvard Business Review, 93(10),44–53
• Roßbach, P., (2016), Blockchain-Technologien und ihreImplikationen. BIT –
Banking and Information Technology, 56(1), 54–69
• Bott, J. &Milkau, U., (2016), Towards a Framework for the Evaluation and
Design of Distributed Ledger Technologies in Banking and Payments. Journal of
Payments Strategy & Systems, 10(2), 153–171
• Wirtz, B.W., Pistoia, A., Ullrich, S. &Göttel, V., (2016), Business Models:
Origin, Development and Future Research Perspectives. Long Range Planning,
49(1), 36–54
• Guo, Y. & Liang, C., (2016), Block chain application and outlook in the banking
industry, Financial Innovation, 2(1), 24
• Knezevic, D., (2018), Impact of Blockchain Technology Platform in Changing the
Financial Sector and Other Industries. Montenegrin Journal of Economics, 14,
109-120
• Collins, R., (2016), Blockchain: A new architecture for digital content,
EContent,39, 8, 22–23

Indian Journal Of Business Administration (IJBA)
(A National Peer Reviewed Refereed Journal)
ISSN : 0975-6825, Volume 14, Issue 1, January-June 2021, pp. 01-15
13
• Chung, M., Kim, J., (2016), The internet information and technology research
directions based on the fourth industrial revolution, KSII Transactions on Internet
and Information Systems, 10(3), 1311–1320
• Tschorsch, F, Scheuermann, B., (2016),Bitcoin and beyond: A technical survey
on decentralized digital currencies, IEEE Commun. Surv. Tutorials, 18(3), 2084–
2123
• Yeoh, P., (2017), Regulatory issues in blockchain technology. Journal of
Financial Regulation and Compliance 25(2), 196-208
• Shang, Q. & Price, A., (2019), A Blockchain-based land titling project in the
Republic of Georgia: Rebuilding public trust and lessons for future pilot projects.
Innovations: Technology, Governance, Globalization 12(3-4), 72-78
• Geiregat, S., (2018), Cryptocurrencies are (smart) contracts. Computer law &
security review 34(5), 1144-1149
• Franke, L.A., Schletz, M. and Salomo, S., (2020), Designing a Blockchain Model
for the Paris Agreement’s Carbon Market Mechanism. Sustainability 12(3), 1068
• Andoni, M., Robu, V., Flynn, D., Abram, S., Geach, D., Jenkins, D., (2019),
Blockchain technology in the energy sector: A systematic review of challenges
and opportunities. Renewable and Sustainable Energy Reviews 100, 143-174
• Casino, F., Dasaklis, T.K., Patsakis, C., (2019), a systematic literature review of
blockchain-based applications: Current status, classification and open issues.
Telemat. Inf. 2019, 36, 55-81
• Jia, C.; CAI, Y.; Yu, Y.T.; Tse, (2016), 5W+1H pattern: A perspective of
systematic mapping studies and a case study on cloud software testing. J. Syst.
Softw.,116, 206–219
• Firdaus, A.; Ab Razak, M.F.; Feizollah, A.; Hashem, I.A.T.; Hazim, M.; Anuar,
N.B., (2019), The rise of “blockchain: Bibliometric analysis of blockchain study.
Scientometrics, 120(3), 1289-1331
• Hughes, L.; Dwivedi, Y.K.; Misra, S.K.; Rana, N.P.; Raghavan, V.; Akella, V.,
(2019), Blockchain research, practice and policy: Applications, benefits,
limitations, emerging research themes and research agenda. Int. J. Inf. Manag.,
49, 16, 114-129
• Yogesh K. Dwivedi, Laurie Hughes, Elvira Ismagilova, GertAarts, Crispin
Coombs, Tom Crick, Yanqing Duan, RohitaDwivedi, John Edwards,(2021),
Artificial Intelligence (AI): Multidisciplinary perspectives on emerging
Dr. Rajnish Kler & Dr. Bishnu Charan Nag : Blockchain and payment system in banking: A Key to sustainable change in financial services
14
challenges, opportunities, and agenda for research, practice and
policy,International Journal of Information Management,57, 101994
• Burnson, P., (2017), Blockchain coming of age. Suppl. Chain Manag. Rev., 21,
10–11
• Ehrenberg, A.J.; King, L.J., (2020), Blockchain in context. Inf. Syst. Front., 22,
29–35.
• Ki-Hoon Lee, Junsung Noh, Jong SeongKhim, (2020), The Blue Economy and
the United Nations’ sustainable development goals: Challenges and
opportunities,Environment International,137,,105528
• Tan, A.; Xuan, D.T.; Cottrill, K., (2018), Isblockchain the missing link in the
Halal Supply Chain. Suppl. Chain Manag. Rev., 22, 6–8
• Montecchi, M.; Plangger, K.; Etter, M., (2019), It’s real, trust me! Establishing
supply chain provenance using blockchain. Bus. Horizons, 62(3), 283-293
• George, R.V.; Harsh, H.O.; Ray, P.; Babu, A.K., (2019), Food quality traceability
prototype for restaurants using blockchain and food quality data index. J. Cleaner
Prod., 240, 8
• Behnke, K.; Janssen, M.F.W.H.A., (2020), Janssen Boundary conditions for
traceability in food supply chains using blockchain technology. Int. J. Inf.
Manag., 52, 101969.
• Agrawal, T.K.; Pal, R., (2019), Traceability in Textile and Clothing Supply
Chains: Classifying Implementation Factors and Information Sets via Delphi
study. Sustainability, 11(6), 1698
• Raheem, D.; Shishaev, M.; Dikovitsky, V., (2019), Food System Digitalization as
a Means to Promote Food and Nutrition Security in the Barents Region.
Agriculture, 9, 168
• Violino, S.; Pallottino, F.; Sperandio, G.; Figorilli, S.; Antonucci, F.; Ioannoni,
V.; Fappiano, D.; Costa, C., (2019), Are the Innovative Electronic Labels for
Extra Virgin Olive Oil Sustainable, Traceable, and Accepted by Consumers?
Foods, 8, 529
• Violino, S., Pallottino, F., Sperandio, G., Figorilli, S., Ortenzi, L., Tocci, F.,
Vasta, S., Imperi, G., Costa, C., (2020), A Full Technological Traceability System
for Extra Virgin Olive Oil. Foods, 9, 624
• Duan, J., Zhang, C., Gong, Y., Brown, S., Li, Z., (2020), a Content-Analysis
Based Literature Review in Blockchain Adoption within Food Supply Chain. Int.
J. Environ. Res. Public Health, 17, 1784
• Figorilli, S.; Antonucci, F.; Costa, C.; Pallottino, F.; Raso, L.; Castiglione, M.;

Indian Journal Of Business Administration (IJBA)
(A National Peer Reviewed Refereed Journal)
ISSN : 0975-6825, Volume 14, Issue 1, January-June 2021, pp. 01-15
15
Pinci, E.; Vecchio, D.D.; Colle, G.; Proto, A.R., (2018), A Blockchain
Implementation Prototype for the Electronic Open Source Traceability of Wood
along the Whole Supply Chain. Sensors, 18, 3133
• Shi, X.; An, X.; Zhao, Q.; Liu, H.; Xia, L.; Sun, X.; Guo, Y., (2019), State-of-the-
Art Internet of Things in Protected Agriculture. Sensors, 19, 1833
• Treiblmaier, H.; Rejeb, A.; Strebinger, A., (2020), Blockchain as a Driver for
Smart City Development: Application Fields and a Comprehensive Research
Agenda. Smart Cities, 3, 44
• Bumblauskas, D.; Mann, A.; Dugan, B.; Rittmer, J. A, (2020), blockchain use
case in food distribution: Do you know where your food has been? Int. J. Inf.
Manag., 52, 102008

Indian Journal Of Business Administration (IJBA)
(A National Peer Reviewed Refereed Journal)
ISSN : 0975-6825, Volume 14, Issue 1, January-June 2021, pp. 16-24
16
A STUDY OF COVID-19 PANDEMIC ON INDIAN ECONOMY
WITH REFERENCE TOCHALLENGES AND OPPORTUNITIES IN
CONTEMPORARY ENVIRONMENT
Dr Goldie Zaki*
Dr. Mahesh Joshi**
Abstract
The dreadful situation posed due to the novel corona virus is apparently visible. It has
affected all the aspects of life including business and economy. The pandemic has
negatively affected the world business cycle and the effect of it on Indian economy is no
exception. Thus, the paper entails studying about Manufacturing PMI, Service PMI,
Agriculture Production, Balance of Trade and other key Economic Indicators. A relative
effect on these three key sectors of Indian Economy is enclosedin the study. The badly
affected was the service sector. In the midst of devastating challenges there is a ray of
hope for the Indian economy as it is agriculture based. The kind of governmental support
extended to agriculture in India, is a bright opportunity. Additionally, India now being a
part of G-8+5 countries, the China based multinational companies wishing to shift their
production base to Asian countries and economic stimulus package of Rs. 20 lakh crores
may help Indian economy combat the economic challenge.
Keywords: Business Environment, PMI, Key Economic Indicators, Governmental
Support, Economic Policies, Atamanirbhar Bharat Scheme, etc.
*Associate Professor, Head, Department of commerce, St. Paul Institute of Professional Studies, Indore
** Assistant Professor, Department of commerce, St. Paul Institute of Professional Studies, Indore

Dr Goldie Zaki & Dr. Mahesh Joshi : A Study of Covid-19 Pandemic on Indian Economy with reference to Challenges and
Opportunities in Contemporary nvironment
17
Introduction
Economic activities over all over the world were proceeding on a reasonable pace
and the trade cycle was on boon, just then, the world economy got stuck by virus that was
later called as novel coronavirus. Then it transformed into pandemic. In the fear of people
losing their lives, the government announced lockdown. The government of India too
under the leadership of Prime Minister, Shri Narendra Modi, declared a complete
lockdown in the country. Consequently, all the economic and non-economic activities
came to a halt. This further resulted in shattering the country’s economic condition.
Rationale of the study
A very famous saying goes ‘There is no use crying over the split milk.’ The loss
due to the pandemic is grave. Nevertheless, it is necessary to struggle against the situation
and be resilient. When in 1930, there was the Great Depression that lasted for about nine
decades, restoration of economyround the world could happen only after the policies
followed by the governments. The effect of Covid-19 on India is dreadful like on any
other country, but there is a need to see how our country can financially overcome this
problem and resume its growth rate.
Thus, this paper emphasizes on how the ill-effects of coronavirus can be
combated with the help of initiatives taken by the government. The road ahead is
challenging and there are many hurdles that need to be tackled and handled effectively.
The contemporary business environment too has become increasingly uncertain. Thus, an
insight into the aspects that would assist in overcoming the economic challenges of the
pandemic is the rationale of this study.
Research Methodology
The current study is based on secondary data and was conducted on the basis of
observations and concepts. The data was gathered from relevant sources and reports of
Reserve Bank of India, National Stock Exchange, Department of Economic Affairs
Government of India, Data published on National Portal of India by Indian Government,
Websites, Newspaper, Magazines, Reports, etc. The figures presented in the paper are
taken from authentic sources. The observations given in the paper are based on the
theories and concepts prevailed in the economics in general.
Economic Health Indicators in India
Economic indicators refer to statistical data that help in analyzing economic
performance and predictions of future performance.

Indian Journal Of Business Administration (IJBA)
(A National Peer Reviewed Refereed Journal)
ISSN : 0975-6825, Volume 14, Issue 1, January-June 2021, pp. 16-24
18
The indicators relevant to the study are as follows: -
• Manufacturing PMI: The Purchasing Managers Index (PMI) is a measure the
prevailing direction of economic trends in manufacturing and is based on a
monthly survey of supply chain managers across 19 industries including both
upstream and downstream activity.
The Index was 27.4 in April 2020 that increased to 30.8 in May 2020. However,
this was far below than the expected level which is 38, thus, indicating significant
deterioration in business conditions, amidst the ongoing lockdown. Additionally,
the firms retrenched their staff numbers at the rapid pace that was not seen since
the year 2005. The prices in terms of input costs and output charges were affected
negatively as suppliers and manufacturers offered discounts in order to secure
orders. Cumulatively, all these resulted in decreased return to growth.
• Service PMI: India’s Services PMI dropped to 5.4 in April 2020 as compared to
49.3 in the month of March.This too is far lower than market expectations of 40.0.
The latest reading showed the steepest month of contraction since the series began
over 14 years ago, as methods to control the increase of the coronavirus pandemic
striked the economy. The new orders too fell at the contracting rate since
December 2005, due to fall in international sales across the whole survey panel in
April, as signalled by the respective index falling to 0.0.
• Current GDP Status: It is a known fact that the Lockdown has made our
economy totally lock but not down as it was forecasted by even RBI in mid-
February 2020. Opposite to the negative growth rate forecasted by the RBI for
January-March 2020, our GDP growth rate for the first quarter ended on March
2020 was reported at 1.1% which is far batter then most of the European countries
having zero GDP rate or Negative Growth rate for the same period. Even China
has a growth rate of 1.47% in this period. The US has -2.2% Growth rate. The
Annual Growth Rate of India is 3.1% which is nearly to the half of the
Governments estimates of 5.8%. this a point of concern.
• Data of Unemployment: These data are not very happening to see as India has
seen a hundred and thousands of huddles of migrant workers from all over the
country moving from their place of working to their home towns as their savings
were lost in just first few days of Lockdown 1.0. The lockdown has impacted
about 40 million workers throughout the country. Because of this the
unemployment rate has shoot up from average of 7% to 23.5% in just two months.

Dr Goldie Zaki & Dr. Mahesh Joshi : A Study of Covid-19 Pandemic on Indian Economy with reference to Challenges and
Opportunities in Contemporary nvironment
19
• Balance of Trade: The figures of BoThave been very low in January-March
2020. It is -6760 Million USD, because of Lockdown there was no homely
demand and well ass the demand from industry sided was also very low. The
positive impact of Low negative BoT is seen in India’s Foreign Exchange Reserve
which as at the highest level at 4,93480 USD on 29th May 2020. This signifies
our strength of economy to fight strongly for at least 8 months if the economic
conditions are not back on track.
Challenges Vs Opportunities
• Employment Indicator
Unemployment data indicates the health of an economy and its labour resources. The
unemployment rate in India has sharply increased.
Unemployment Rate in India can be understood with the help of chart beneath:-

Indian Journal Of Business Administration (IJBA)
(A National Peer Reviewed Refereed Journal)
ISSN : 0975-6825, Volume 14, Issue 1, January-June 2021, pp. 16-24
20
• Government Spending to Gross Domestic Product (GDP)
The governmental spending in India was last recorded at 13.2 % of GDP in the 2019-20
fiscal year.
• Agriculture Production
As the agricultural related activities continued during the period of lockdown, the
production was not affected as much as other indicators. Food grain production in India
in the year 2019-20 was 292 million tones and wasprobable to attain a record 291.95
million tones, as per advance approximation of production of food grains, oilseeds and
added commercial yield for the year 2019-2020 which is upper by 6.74 million tonesas
compared to the production of food grain of 285.21 million tonesattainedin 2018-19
agricultural year. Food grain production in the year 2019-20 iswas high by 26.20 million
tonesin comparison with the average production in the previous five years (2013-14 to
2017-18).
Special Governmental Initiatives and Support
• Increasing Liquidity
The major reserve ratio namely,Liquidity Coverage Ratio, cash reserve ratio
(CRR) and Repo rates were lessened.Pumpingextra liquidity in banking system to
lower bond yields,increasing a temporary liquidity for principal bond underwriters
to Rs 10,000 crore from Rs 2,800 crore, Rs 1 lakh crore of LTROs, open market
purchase of government bonds of 100 billion rupees March 20; another total Rs
30,000 crore of OMO purchases March 24 and March 26, 1 trillion rupees via 16-

Dr Goldie Zaki & Dr. Mahesh Joshi : A Study of Covid-19 Pandemic on Indian Economy with reference to Challenges and
Opportunities in Contemporary nvironment
21
day variable rate repos are the steps taken up by the government to increase
liquidity. To take care of providing cash, 200 million women with basic bank
accounts to get Rs 500 a month until June; 30 million senior citizens, widows and
disabled to get Rs 1,000; 87 million farmers to be immediately paid Rs 2,000
under an existing program.
• Regulatory Deferrals
Implementation of stricter regulations have been delayed. Pushing for three
months the Completion of Capital Conservation Buffer,deferring of rules
requiring banks to fund their activities through stable sources and additional 90
days allowed to Lenders to reach a resolution plan on large accounts in default
were major regulatory deferrals measures.
• Special Windows
These include support for corporate borrowers as well as rural industry, Rs 1 lakh
crore of targeted long term funds from the central bank to banks for investing only
in corporate bonds, aimed at easing cash crunch at firms (on April 15, RBI
announced new rule capping the exposure of any bank to a single entity at 10% of
TLTRO funds invested)
• Jobs and Wages
For people earning less than Rs 15,000 a month, government has planned to pay
24% of their monthly wages that feed into pension and provident fund accounts;
Wages under job guarantee program increased to provide annual benefit of Rs
2,000 to a worker.
Economy Booster Package
On May the 17th 2020 the PM of India announced a comprehensive relief package
ever announced in the history of independent India. The Package announced is 10% of
the GDP of our country. It is roughly more than 20 lakh Crore. Later the Finance Minister
Mrs. N Sitharaman described the allocation of the same in five phases. The aid is called
as a comprehensive as it covers all the sectors and strata of Indian economy and society.
The parts of the aid allocation are as follows.
• Part 1: Provided to MSMEs, Shadow Banks and Electricity Generation
Companies of Rs. 5.94 Lakh Crores.
• Part 2: Food delivery for Migrant Workers, MUDRA ShishuYojna for Very Small
businesses and Help for Farmers through Kissan Credit Card of Rs. 3.10 Lakh
Crores.

Indian Journal Of Business Administration (IJBA)
(A National Peer Reviewed Refereed Journal)
ISSN : 0975-6825, Volume 14, Issue 1, January-June 2021, pp. 16-24
22
• Part 3: For Agri-Infra development, Agriculture based allied sectors of Rs. 1.5
Lakh Crores.
• Part 4 and 5: For MGNREG workers and Structural Reforms of Rs 48100 Crores.
• The overall Allocation of fund for Atamnirbhar Bharat was announced in total Rs.
20.97 Lakh Crores.
Thus, the above announced package will surely work as a stimulus for the Indian
economy to come on the track of growth. However, the FDI equity shows a confidence of
Foreign Investors in our economy. The data on FDI equity as per RBI reports says that
from April 2019 to March 2020, the total FDI Equity flow is USD 49977 Million. The
increase is 13% as compared to year 2018-19. When COVID-19 hit the world in the mid
of January 2020, the FDI equity inflow was USD 18.32 Million in India (January - March
2020, I quarter). This is another sign of assurance showed by Foreign Investors in our
economy.
Forecast Based on Present Statisticsand Trends
The forecast of the economic indicators also shows a happy picture of our
economy in 2020-21, The GDP growth rate is projected at an average of 1.5% per
quarter. With a composite GPD growth rate of 2.5% per annum. The unemployment rate
which is at the peak in the lockdown time will be about 9.8% at the end of March 2021
which would be about 2% more than the average. The inflation rate will be about 5.2%
average for 2020-21 is another sign of relief. The rainfall data is projected average as per
data of Skymet and Indian Metrological Department. This means that our economy will
observe bumper agriculture production in 2020 for Kharif crops. Agriculture production
will further help Indian Industries to grow more. Interest rates will be average 3.75% as
projected which means loans will be available at nominal rate for business development
and growth. Over all the business confidence point will be more than 100. This shows
assurance of business lobby in the economy.
The Indian Government on 3rd June has announced a most demanded policy of
‘One Nation One Market’ for the benefit of the farmers. An amendment was done in
Essential Commodities Act which liberates the farmers to sell their crop anywhere in the
country to whomsoever they want to sell. This was done with a view to double the
income of farmers by the year 2022. Another landmark decision was taken by the Cabinet
Ministry to establish Project Development Cell in each department to solve and eradicate
the difficulties observed by the industries in financing, land acquisition and other similar
types for the speedy establishment of the business units. On same day the cabinet

Dr Goldie Zaki & Dr. Mahesh Joshi : A Study of Covid-19 Pandemic on Indian Economy with reference to Challenges and
Opportunities in Contemporary nvironment
23
approved Inclusion of Indian Medicine and Homeopathy as subordinate office under the
Ministry of AAYUSH. This action will give a direct growth to the production of
Indigenous Herbs and Medicines, the farmers and companies engaged in the production
of such herbs and medicines. The Research and Development, Clinical Trails and Human
Trails will be standardised as per world standards. This will give an extra boost to Indian
Medico Industry.
The world superpower US has invited our country to be the part of G-7 is yet
another point of pride and satisfaction. The US president and other G-7 member countries
are looking forward in the prospects of India to become a new supply chain hub other
than China. Most of the Multinational Companies have decided to shift their business
from China and Hong Kong and wanted to come to India as our country may offer labour
to them at an economical rate with expertise. The work done by the Indian government
and the state governments to attract foreign investment is very appreciable as India is
ranked 63 among 190 economies in the ease of doing business, according to the latest
World Bank annual ratings.
Conclusion
Even though, the economic condition of India has deteriorated considerably, but,
the governments both at centre and state level have left no stone unturned in order to fight
with the economic challenges. The way the virus is going to react in the next couple of
months is not clear, still economic strategy has been formulated and initiated. The impact
of covid -19 on the Indian Economy has been very adverse. Nevertheless, with the kind
of opportunities that are accessible to our country may help to come up. It is definite that
the governments, the businessmen, the locals and all the stakeholders need to join hands
to see a better dawn.
References
• https://www.india.gov.in/topics/finance-taxes/economy
• https://dea.gov.in/monthly-economic-report-table
• https://dippproductiondata.gov.in/
• https://www.indiabudget.gov.in/economicsurvey/doc/vol1chapter/echap06_vol1.p
df
• https://www.indiabudget.gov.in/economicsurvey/doc/vol1chapter/echap10_Vol1.
• https://m.rbi.org.in/Scripts/WSSViewDetail.aspx?TYPE=Section&PARAM1=2
• https://unemploymentinindia.cmie.com/

Indian Journal Of Business Administration (IJBA)
(A National Peer Reviewed Refereed Journal)
ISSN : 0975-6825, Volume 14, Issue 1, January-June 2021, pp. 16-24
24
• https://data.gov.in/keywords/unemployment
• https://www.rbi.org.in/scripts/SDDS_ViewDetails.aspx?Id=5&IndexTitle=Balanc
e%20of%20Payment
• https://economictimes.indiatimes.com/news/economy/policy/the-steps-india-has-
taken-so-far-to-contain-economic-fallout-of-covid-
19/articleshow/75285944.cms?utm_source=contentofinterest&utm_medium=text
&utm_campaign=cppst
• https://economictimes.indiatimes.com/news/economy/foreign-trade/india-looks-
to-lure-more-than-1000-american-companies-out-of-
china/articleshow/75595400.cms?from=mdr
• https://www.thebalance.com/top-economic-indicators-for-global-investors-
1979208
• https://tradingeconomics.com/india/indicators
• https://www.skymetweather.com/
• https://www.thebalance.com/top-economic-indicators-for-global-investors-
1979208
• https://tradingeconomics.com/india/indicators

Indian Journal Of Business Administration (IJBA)
(A National Peer Reviewed Refereed Journal)
ISSN : 0975-6825, Volume 14, Issue 1, January-June 2021, pp. 25-35
25
SOCIAL IMPACT OF WOMEN ENTREPRENEURSHIP IN
INDIA
Dr. Ashish Mathur*
Raveen Purohit**
ABSTRACT
Entrepreneurship is a route to self-fulfillment as well as a real motivator of
economic development and competitiveness.Women entrepreneurs may be understood as
the females who organizes and operates a business enterprise. Women are awaited to
improve, emulate or embrace an economic activity, which is to be called as women
entrepreneurs.Although, times have been changed and many females are actively taking
participation in entrepreneurship in India, but still as compared to western nations a lot
is still pending and many gaps are yet to be filled, plus more or less even today a huge
cultural or social revolutionary change is required on a mass level throughout the
country so that females can boost themselves up, feel enlightened and motivated which
will enable them to actively participate in Entrepreneurial Professions, which would
ultimately not only help the economy of whole country, but will open all doors for next
upcoming generation. The current paper is an attempt to understand women
entrepreneurship and its social impact on society. It also attempts to enlist skills required
for successful women entrepreneurs as well as the challenges faced by women
entrepreneurs in India.
Keywords: Entrepreneurship, female entrepreneurship, social impact
"Empowerment of a woman is crucial as the ideas of women and her value systems lead
to the development of a virtuous family, respectable society and finally a good nation.”
– Dr. APJ Abdul Kalam.
* Assistant Professor, Department of Business Administration FCMS, Jai Narain Vyas University, Jodhpur
** Guest Faculty, Department of Business Administration FCMS, Jai Narain Vyas University, Jodhpur

Dr. Ashish Mathur & Raveen Purohit : Social Impact Of Women Entrepreneurship In India
26
INTRODUCTION
The word “women entrepreneur” means that part of the female society which
initiates economic activities i.e. manufacturing, trading, dealing in job works, and various
other different types of businesses.Women entrepreneurs may be understood as the
females who organizes and operates a business enterprise. Women are awaited to
improve, emulate or embrace an economic activity, which is to be called as women
entrepreneurs.
In labor market scenariowhich is somehow unable to cope up with unlimited
demand, entrepreneurship and freelancing are alluringin different modes.
Entrepreneurship is a route to self-fulfillment as well as a real motivator of economic
development and competitiveness.However, in a developing country like India, women,
appears to be unrepresented in this field.
WHAT EXACTLY THIS TERM IS, IN INDIA?
According to the Government of India, woman entrepreneur are the ones who
assumes dominant financial control (minimum financial interest of 51 per cent of the
capital) in an enterprise (Government of India, 2012). Female Entrepreneurship or
Women Entrepreneurship, technically in its extended version, refers simply to self-
employed organizations which are created, organized, and managed by women and her
family members,who have not only taken the risk to incubate & develop the organization
but also at some times faced several criticism and social pressures. These factors several
times lead to de-motivate the women entrepreneur. Despite the fact that females have
wonderfully played a vital role in India’s development and economic upliftment of Indian
community, their entrepreneurial capability has been always underutilized due to Indian
women’s inferior social image and gender biasness.
FIVE SKILLS FOR FEMALES WHICH ARE MOST IMPORTANT
FOR PRACTICING ENTREPRENEURSHIP
Female Entrepreneurs learn to manage uncertainty by focusing on developing these
five skills viz.
1. Skill of Play:The skill of play frees the mind. In addition, this opens our minds to
a plethora of future possibilities and ideas, which enables us to be more creative
and entrepreneurial. Theories on child development have been putting emphasis
on playing. So we should also do enough of it. We feel more energized and

Indian Journal Of Business Administration (IJBA)
(A National Peer Reviewed Refereed Journal)
ISSN : 0975-6825, Volume 14, Issue 1, January-June 2021, pp. 25-35
27
engaged when we are playful Entrepreneurship is also a kind of a fun
Entrepreneurs will also benefit from creative exercises and that will encourage
them to interact with others. This exercise will also help to solve problems,
generate ideas, and learn from hit and trial. Here in the entrepreneurial context
various entrepreneurial games such as instructional games, reality games, and
simulations can be played. All these games will help to make the entrepreneur
creative and challenging in the real business world.
2. Skill of Experimentation:The skill to experiment is best defined as an act
performed in order to discover something new.Attempting something new and
gaining knowledge from the experience.For entrepreneurs, experimenting is
defined as taking relevant steps in order to learn and grow.This is somewhat
getting out of the comfort zone and collecting information about the real world
affairs. It also helps to test new concepts. It is always better than setting on the
desk and researching on the net for their latest research. This process involves
asking questions and taking nothing for granted. For example if a women
entrepreneur has formulated a product and she’s not sure about what should be its
price. Then she should have to spend weeks researching about the price of the
product which she has brought in the market through her competitors’ offering
price for the similar product. Then she might be able to calculate the price of her
product in the market. Another way is to bring the product to your friends and
contacts and to the local businesses and sell your product at different price points.
Based on the research you have made. Thus by bringing the product directly to
the customers you can acquire feedback directly on the price but also the quantity
of consumption of the product. This is what is known as experimentation – that is
learning by doing the actual work and thereby getting the real picture.
3. Skill of Empathy: Empathy is the ability to recognize and comprehend the
emotions, situations, intentions, ideas, and requirements of another. Whenever
one is in a comparable position to someone else, empathy is the capacity to
understand and connect to their feelings. Like a nutritionist who herself struggled
to lose weight and knows how a patient feels when he or she goes through the
same stages. Also a former smoker knows how a regular smoker is trying to quit

Dr. Ashish Mathur & Raveen Purohit : Social Impact Of Women Entrepreneurship In India
28
the habit of smoking. Empathy is important for female entrepreneur because it
helps her to feel what an entrepreneur feels like. To be a successful
entrepreneur,this aspect enables female entrepreneurs to put them in the same
shoes of an entrepreneur, and helps to understand and feel what they should do in
the same situation. Further most empathy helps women entrepreneurs to connect
with the stakeholders in a more meaningful way which lead towards creation of
new products and services at a given period of time.
4. Skill of Creativity:The capacity to be creative necessitates an openness to the
outside world in order to release our creative potential and to develop and
discover possibilities to address our issues. Those studying entrepreneurship are
more receptive to innovation than students studying other business disciplines.
Entrepreneurs who utilize their creative capacity may create chances rather than
just finding and seeking for possibilities. However, the extent to which you can
generate opportunities is determined by how much money you want to make, how
inquisitive you are about new ideas, and how much work you are willing to put
into your ideas. You must develop and execute ideas on your own. The amount of
resources you have and your capacity to cooperate rather than compete, as well as
your efforts to establish connections and your understanding of how much you
can afford to lose, all influences the creation of possibilities. It is possible to
dispel the components and circumstances that impair creativity, such as fear and
perceived barriers, by using these principles. This allows one to act even under
adverse situations of uncertainty and doubt, thus contributing to the creation of
something of worth.
5. Skill of Reflection:The ability to reflect aids in making sense of all other
activities needed for play, empathy, creativity, and exploration, among other
things. It aids in maximizing our learning from the four other abilities that we are
doing. In addition to being an action, taking some time to reflect is also a talent,
and it may be the most essential of all the other abilities. Reflection assists us in
understanding and analysing our own emotions. As well, it offers us with fresh
views and the ability to assess results and reach a decision. However, despite the
many advantages of reflection and the large quantity of evidence that supports it,
we do not seem to engage in it on a regular basis. One never learns from their
activities unless they engage in concentrated reflection. There are six distinct
types of reflection to consider.

Indian Journal Of Business Administration (IJBA)
(A National Peer Reviewed Refereed Journal)
ISSN : 0975-6825, Volume 14, Issue 1, January-June 2021, pp. 25-35
29
The five skills that we have discussed above are for those female entrepreneurs
who are ready to take actions. These skills cannot be developed without learning through
doing. In this article we have not beached to females about how to create a successful
businesswomenbut, to help them about how to be more entrepreneurial and live an
impactful life.
SUCCESSFUL WOMEN ENTREPRENEURS IN INDIA
Women with preset business aspirations exist on a different level. Few claim that they
were inspired by a small number of male role models, such as Jeff Bezos and Elon Musk,
or because they have been exposed towards the "startup world" by their male colleagues
who were already successful businessmen in their own right. At the organizational level,
the state has put in place a number of initiatives to increase the entrepreneurial
inclinations of girls and women.
Emotional
Reflection
Narrative
Reflection
Perceptive
Reflection
Analytical
Reflection
Critical
Reflection
Evaluative
Reflection

Dr. Ashish Mathur & Raveen Purohit : Social Impact Of Women Entrepreneurship In India
30
• DevitaSaraf of Vu Technologies has emerged as a sensational role model for
females on India who wants to pursue their career in the field of business, During
the pandemic Covid19 she successfully provided cheaper rated good quality
televisions in remote places of India, her motto as she told to few reporters was to
keep entertaining whole population during lockdown as public was totally locked
in their home and were having tensions related to health and professions, she took
use of smart televisions by providing OTT applications like Netflix, Amazon
Prime, etc. and by providing their content in her televisions branded as Vu 4k
televisions.
• Kiran Mazumdar Shaw,The founder of Biocon India is one of the country’s
richest and most dynamic self made multi billionaire. She founded her
biopharmaceutical firm in 1970’s, driven by experience and determination her
leadership inspired and motivated the whole organization to achieve the
organizational objectives and add the value for stakeholders. She was voted as
one of the most influential personalities of India in 2019.
• VandanaLuthra, the founder of VandanaLuthra Curls and Curves i.e. VLCC a
company that is one of the most leading organizations who deals with beauty
products and several different types of wellness and body care. The company has
settled up manufacturing units of personal and beauty care products in Haridwar,
India and in Singapore. These products are being sold by over 100,000 outlets and
salons all over India and more than 10,000 outlets and salons across the Middle
East and African nations. Her motto is also to provide training courses of beauty
and wellness in her company’s owned institute of beauty and wellness. Besides all
of this, she’s also vice president of a NGO named Khushi which gives scholarship
to physically challenged students.
• Aditi Gupta, The founder of Menstupedia, is often termed is one of the most
Inspirational female personalities throughout the country in today’s modern age
her bold step to take decision about teaching and learning of menstruation was not
so easy, initially she and her idea was criticized but after few months she was on
the top for creating something unique and influential, her idea provided guidance
to menstruation, puberty, and personal female hygiene. Last year, she was in
Forbes India U-30 list.

Indian Journal Of Business Administration (IJBA)
(A National Peer Reviewed Refereed Journal)
ISSN : 0975-6825, Volume 14, Issue 1, January-June 2021, pp. 25-35
31
• Suchi Mukherjee, the founder of an online shopping website called as Limeroad is
also a successful women entrepreneur on India. This online shopping portal was
introduced in 2012, The most interesting fact is that during its beginning it only
used to sell products relating to female wellness and goodness, apparels, etc.
keeping in mind all about the female needs, so because of this soon she was also
emerged as a role model amongst all the teenage female of the country and
because of that she still has a lot of female fan following throughout the nation.
Soon she became the face of E-commerce in India.
• Shahnaz Husain, the founder of Shahnaz Herbals, produces some of the most
unique and sought-after cosmetic products on the market. No one in the area
could have guessed that a girl who married when she was a teenager and gave
birth to a baby girl when she was 16 would one day soar to such great heights and
be one of the most well-known female characters on the face of the globe. It is
often stated that, if there's a will, there will always be a way, and she had made
the decision to overcome all of the hurdles that stood in her way in the middle of
her journey. Shahnaz Husain fought despite all obstacles, and at last have become
a known brand. Shahnaz is referred to as the "Queen of Herbal Beauty Care" and
was honored with the Padma Shri award by the Government of India in 2006.
Shahnaz Husain is widely regarded as one of India's most prominent
businesswomen, with her company operating in 138 countries and a network of
over 600 franchisees and related clinics across the globe. She is considered to be
one of the country's most successful businesswomen.
• Upasana Taku is the Founder of Mobikwik who bought this platform, bringing in
the cashless uprising. Heridea was about an easy substitution for the wallet which
makes cashless payment easier through smartphones. Nowadays, everyone find it
quick, safe, and secure making payments from their smartphones. Yet, earlier this
idea was equitably new for the people to welcome. Upasana saw it as an
opportunity, and she was patient enough to see her idea blossom into a thriving
business operation. It has now made its way into every individual's mobile phone
in the form of an e-wallet.

Dr. Ashish Mathur & Raveen Purohit : Social Impact Of Women Entrepreneurship In India
32
CHALLENGES FOR FEMALE ENTREPRENEURS IN INDIA
Although, times have been changed and many females are actively taking
participation in entrepreneurship in India, but still as compared to western nations a lot is
still pending and many gaps are yet to be filled, plus more or less even today a huge
cultural or social revolutionary change is required on a mass level throughout the country
so that females can boost themselves up, feel enlightened and motivated which will
enable them to actively participate in Entrepreneurial Professions, which would
ultimately not only help the economy of whole country, but will open all doors for next
upcoming generation.
Following are various different types of challenges regarding the female
entrepreneurship in India:
1. Gender Discrimination:Gone are the times when females were considered as
inferior and males were considered more superior. Some female entrepreneurs
claims that during their early tenure they were let down by many on the basis of
gender inequality, but as discussed earlier in this article, some females
entrepreneurs overcame all odds and flourished as a role model for other aspiring
female candidates.
2. Unavailability of Finance:Few female candidates says they have the idea and
also the zeal to convert it into an amazing venture but they are short on finance,
no matter the government of India have brought some schemes like MUDRA, etc
to overcome this problem but still there’s a huge path to cover.
3. Household Support:In some less developed part of the country females are
entangled with responsibilities such as child care, and day to day aspects related
to household and socio-relative circle we can say which deprives them of their
goals, and the idea remains in their mind forever and never comes on the surface
which in future sometimes also lead to family quarrels, so by this we can
understand that family support is the most crucial thing which is needed for
female entrepreneurship.
4. Risk Factor:This is the most universal challenge regarding entrepreneurship all
over the globe that each and every entrepreneur has to face in the very beginning
and have to find pathways to overcome this challenge, Now of we talk about
Indian Journal Of Business Administration (IJBA)
(A National Peer Reviewed Refereed Journal)
ISSN : 0975-6825, Volume 14, Issue 1, January-June 2021, pp. 25-35
33
females, the risk factor can be understood as double the rate as compared to male
entrepreneurs as females have lived a protective life in India. Lack of confidence,
hesitation, these all are part of this point.
5. Lack of Exposure:In some cases of female entrepreneurship that we have
discussed above in this article, few of the female entrepreneurs were already
having entrepreneurship in their blood, while a beginner has to undergo through
some entrepreneurial courses and entrepreneurial training, it becomes a bit
challenging for them, and without any proper training or guidance, things can take
an undesirable turn during the mid-way of venture.
SOCIAL IMPACT OF FEMALE ENTREPRENEURSHIP
1. Territorial Evolution:Female entrepreneurs in India have amazingly succeeded
to remove hurdles in the process of regional imbalances and other several types of
differences which varies from place to place in a big and populated country like
India, Females have used government schemes and various other subsidiaries
provided by both state and central government to install industrial plants and have
provided employment on mass level to local peoples.
2. Social Upliftment:Female entrepreneurship in India have played a great role in
social upliftment of the country the new and innovative ideas, products, and
services have changed the face of economy and has also acted as a magical
element to play the role of advancement and upliftment of a society.
3. Reduction of scarcity:In some rural areas of India, where modernisation was still
pending, Female entrepreneurs brought new and delightful products, services, and
techniques where scarcity was faced by the localities and they needed to go to
different regions of the country to purchase the products of their needs.
4. Innovation:Innovation here can be understood as a metamorphosized
restructuring of a place which eases life of users of the products or services
provided by an entrepreneurs. As female entrepreneurs succeeded in providing
exciting new ideas and new techniques in their new products which not only
proved to be game changer in the markets but also succeeded in making life of
female households easy and comfortable.
Dr. Ashish Mathur & Raveen Purohit : Social Impact Of Women Entrepreneurship In India
34
5. Cultural Modification:The most important social impact of female
entrepreneurship in India is that it has amazingly acted as a change agent in the
cultural image of India, long gone are the days where females were only meant to
engage themselves in household activities and their educational standards were
limited to higher secondary, the growth on female entrepreneurship sector in India
has shows many dreams to aspiring females and has broken cultural boundaries
which were meant to deprive women of her entrepreneurial dreams.
CONCLUSION AND FUTURE PERSPECTIVES
Female entrepreneurship is seriously crucialfor achieving economic and socio-
economic development. Despite being a part of around half of the total population of
Globe, India has a very low rate of economic participation of women in entrepreneurship.
Women entrepreneurs of India are now popping up in both traditional and nontraditional
(or we can say modern) sectors.
Women entrepreneurs can be understood asdiverse component having
heterogeneous societal, economic and academic background. There is a need of urgent
course of action to overcome these obstacles. In spite of the truth that both central and
state administration have made and applied different types ofhelpful initiatives, still
female entrepreneurship in India remains critically shallow.
They will have to work more than men, despite the fact that they will be given
lovely chances. When being a woman, let alone a working woman, isn't always simple,
reaching the top will be difficult. They must work with a clear head, bringing men along
for the ride.
In the last several years, the role of prominent female entrepreneurs in India has
changed dramatically for the better. In recent years, India has placed a greater emphasis
on encouraging female entrepreneurs. Top female entrepreneurs in India are gradually
overtaking male-dominated business positions. Gender biases that were more prevalent in
society a few years ago are now less prevalent and declining at a great pace. Female
entrepreneurs in India provide a unique set of perspectives to problem-solving that might
improve the quality of the end product. Top female entrepreneurs in India today bring a
unique set of experiences and difficulties to bear on decision-making and increasing the
superiority of a choice.

Indian Journal Of Business Administration (IJBA)
(A National Peer Reviewed Refereed Journal)
ISSN : 0975-6825, Volume 14, Issue 1, January-June 2021, pp. 25-35
35
REFERENCES
• Crawford, A. (2019). An exploratory study of core self-evaluation and
entrepreneurial motivation. Anatolia, 30(1), 103-114.
• Khajeheian, D. (2018). Enterprise social media: Ethnographic research on
communication in entrepreneurial teams. International Journal of E-Services and
Mobile Applications (IJESMA), 10(1), 34-46.
• Cunha, C., Kastenholz, E., &Carneiro, M. J. (2018). Lifestyle entrepreneurs: the
case of rural tourism. In Entrepreneurship and structural change in dynamic
territories (pp. 175-188). Springer, Cham.
• Osborne, M. (2018). Inclusivity and Lifelong Learning: An Introduction. In
Entrepreneurial Learning City Regions (pp. 295-298). Springer, Cham.
WEB REFERENCES
• https://www.ups.com/us/en/services/knowledge-
center/article.page?kid=art16d736a0e73&articlesource=longitudes
• https://www.mckinsey.com/~/media/McKinsey/Featured%20Insights/Employmen
t%20and%20Growth/The%20power%20of%20parity%20Advancing%20womens
%20equality%20in%20India/MGI%20India%20parity_Full%20report_November
%202015.ashx
• https://www.orfonline.org/research/rewriting-the-rules-women-and-work-in-
india-47584/
• https://www.starsunfolded.com/devita-saraf/
• forbes.com/profile/kiran-mazumdar-shaw/?sh=4e3d40b659ad
• https://www.indiaretailing.com/2019/11/20/whos-who/suchi-mukherjee-founder-
ceo-limeroad-com/
• https://www.ceostory.in/blog/vandana-luthra-the-founder-of-vlcc/
• https://www.vtvindia.com/success-story-of-aditi-gupta-an-indian-woman-
entrepreneur
• https://www.sugermint.com/success-story-of-shahnaz-husain-female-
entrepreneurs/
• https://www.legalwiz.in/blog/life-story-of-upasana-taku-from-mobikwik

Indian Journal Of Business Administration (IJBA)
(A National Peer Reviewed Refereed Journal)
ISSN : 0975-6825, Volume 14, Issue 1, January-June 2021, pp. 36-46
36
ROBOTIC ACCOUNTING : A NEED OF NEW
ACCOUNTING WORLD
Dr. Mangu Ram*
Introduction
"Slow and Steady Wins the race"This proverb has lost its relevance in the present
time, especially in the field of business where it has been replaced by the slogan "The
faster it is the better it is". At present, availability of information, its receipt and its
broadcasting have a huge impact on the fortunes of the business.Therefore, it has become
inevitable for accounting professionals to develop new advanced means for information
dissemination and production, to meet the requirements of the present times. In the
present time, failing to provide accounting information to their stakeholders in a time-
bound manner can be construed as leaving opportunities out of hand.
Robotic Accounting and Artificial Intelligence is a revolutionary concept and is
expected to grow beyond human comprehensive abilities. Artificial Intelligence has
relevance in the field of Accounting, Finance, Medical, Project Management, Industry,
Banking, Education,Manufacturing, and beyond that also. Robotics andArtificial
Intelligencehave displayed their ability to alter the spectrum of each of these sectors
despite receiving, resistance like any other change from those who are affected as well as
the ones who are expected to get affected by these revolutionary techniques. On the
faceof it, it doesn’t seem all that hunky-dory for Robotic Accounting and Artificial
Intelligence (AI)as they are seen as a probable threat to human existence in varied
business tasks. This fear-mongering finds substance from the fact that Robotic
Accounting and Artificial Intelligence (AI) has been able to challenge human existence
for a variety of tasks but one should rest assure oneself that itshall never be enough to
replace the human aspects that are beyond intelligence. Jack Ma, the founder of Alibaba
warned the audience at the World Economic Forum, 2018 (Davos) that AI and the big
data were a threat to humans and would disable people instead of empowering them.
* Assistant Professor, Department of Accounting, Jai Narain Vyas University, Jodhpur

Dr. Mangu Ram : Robotic Accounting : A Need of New Accounting World
37
A study by Ernst & Young and Nasscom also predicted that by 2022, around 46%
of the workforce will be deployed in jobs that have radically changed skill sets. In 2020
due to pandemic COVID, –19 progress of this field has declined but near future, it is
going to bounce back & that too with greater pace.
In 21st century field of accounting new aspects are emerging and are taking pole
positionmaking old practices almost irrelevant. Cloud accounting is also one of the new
emerging aspects which taking centre stage in the global arena. In cloud accounting, all
the data is stored in the cloud i.e.no data is stored on the hard disk of a desktop through
the local software, due to which it becomes possibleto perform the task of accounting
anywhere, anytime with the help of internet.
Robotic accounting can be defined as the use of automation applications to application of
human mind for best results and reduce human labour for the accounting of
financialtransactions. Robotic accounting requires automation applications known as
Robotic Automation Process(RPA).The Robotic Automation Process (RPA) is a software
that uses artificial intelligence and also controls the information that is used again. This
process replaces human labour, that is, all the work that is done by human labour, now all
those tasks are done with greater reliability and a higher level of efficiency in the robotic
automation process.
The Robotic Accounting attempts to replace or minimise the use of human labour.
That is why it becomes necessary for accounting professionals to study the methods and
systems currently in use and improve their skills as per the requirements of the users of
accounting information.
The use of a robotic automation process has given users access to quick and more
accurate reports with least human labour, contributing to the growth of the business in a
big way. Complex tasks of accounting and finance,e. g.
1. Operational accounting such as billing and collection etc.
2. General accounting such as allocation and adjustment, journal entry processing,
reconciliation, intercompany transactions etc.
3. Financial and external reporting
4. Planning, budgeting and forecasting.
5. Treasury procedures etc.can easily be done by robotic automation process that
too with 100% precisionwhich has resulted from institutions' reliance on human
labour getting being reduced.

Indian Journal Of Business Administration (IJBA)
(A National Peer Reviewed Refereed Journal)
ISSN : 0975-6825, Volume 14, Issue 1, January-June 2021, pp. 36-46
38
Why should the robotic automation process be used in accounting?
In the present era, due to social media networking and other software applications,
it is impossible to imagine a world where the Internet is not used because the Internet has
become an important part of our everyday life. Certainly, the next stage of our
development is the robot automation process. AccountingProfessionals and users of
accounting information should prepare themselves mentally for this. Robotic accounting
processes use artificial intelligence to handle a large number of iterative tasks. Robotic
accounting processes not only assist in data processing but also open the door to new
opportunities for the future for the business.
In Robotic Accounting, RPA uses artificial intelligence to help handle a huge
number of repetitive tasks. It allows for efficient learning and processing of data patterns,
which can have a lot of performance benefits for businesses, some of which are
enumerated as:
1. Better Performance - Robotic Process Automation (RPA) performance is definitely
better than accounting done with the help human effort or labour because it has the ability
to perform fast and flawless tasks in minimum time.
2. Faster Business Processes - The robotic automation process minimizes human
interference in business processes in the field of accounting and finance, resulting in
faster business processes.
3. Bette Productivity - Robotic Process Automation (RPA) works 24x7 for customers.
Provides better services for the convenience of the customers, without any time limit in
the field.
4. Cost Reduction - Robotic automation reduces the cost by automating process iterative
actions and also eliminates the need for institutions like subsidiary offices, as well as the
costs arising from delays from bureaucratic arrangements.
5. Inspiring future - Robotic automation process minimizes inefficiencies associated
with inefficient and human-intensive interfaces of older systems. Relatively low
implementation timeframe and low maintenance costthe future of robotic accounting
looks bright.
6. Reduced process costs - Labour costs, such as salaries and wages, are reduced by the
completion of difficult and replenishing tasks through a robotic automation process.
7. Reduced performance time - Robotic accounting in accounts payable and other areas
of finance makes a significant reduction in performance time by using robotic automation
process.

Dr. Mangu Ram : Robotic Accounting : A Need of New Accounting World
39
8. Reduction of errors - Automation in finance and accounting can increase production
quality by reducing or eliminating human errors. Robotic automation minimizes process
errors, saving employees’ labour of data entry. Anyone who has worked in the field of
accounting knows that the effects of errors can be devastating, and they will also agree
with the fact that it is almost impossible to avoid errors.One may sometimes need hours
to enter data still can’t guaranty error-free accounting. Robotic accounting can speed up
the accounting process and make them error-free by using the robotic automation
process, resulting in keeping customers and users of accounting and financial information
happy.
9. Reducing repetitive burden in financial planning - For financial planning, collecting
financial information from different departments and preparing various financial
statements from them, then preparing a shared financial statement from them is a
cumbersome and tedious task. With the help of Robotic Automation Process, robotic
accounting reduces the repetition of financial planning related tasks i.e. with RPA’s in
place; employees don’t have to engage themselves again & again in the processing of
data, creation of shared financial statements etc. this results in accelerated financial
planning. At the same time, it helps in maintaining clarity in the goals of various
departments.
10. Promoting better investment options - Robotic automation processes are able to
monitor investment values despite the possibility of sudden changes. Robots can assess
an investor's portfolio and reduce the risk inherent in investment options. Robotic process
automation tools can act as financial advisors without the prohibitive cost of their human
counterparts.
11. More control - Many businesses enjoy automating some of their processes as it helps
them to have of greater quality, a better understanding of processes and faster reporting.
Prevention of money laundering is a top priority for any organization in the finance
industry. Robotic accounting can significantly contribute to helping companies comply
with the robotic automation process. Robots use specialized software and verification
techniques to store customers' personal information and remove discrepancies which help
to establish better control.
12. Ensuring stability between the banking system and treasury system - Through
robotic automation process in the financial sector, an important advantage provided by
robotic accounting is that it can disseminate, process & store bank-related data in such a
way that the treasury system can generate reports easily. The reports generated by the
treasury system can rapidly be transmitted with the use of the robotic automation process,
allowing them to report their outstanding balances.

Indian Journal Of Business Administration (IJBA)
(A National Peer Reviewed Refereed Journal)
ISSN : 0975-6825, Volume 14, Issue 1, January-June 2021, pp. 36-46
40
13. Virtual System – Data can move between unequal and legacy systems via robotic
process automation systems by connecting them at the user interface level.
14. Data validation and Auditing – Robotic Automation Process resolve and cross
verify data between varioussystems to validate and check information to provide
compliance and auditing results and Goods and Services Tax system can also be treated
as a good example of data validation and auditing.The use of robotics accounting
processes in business vary from place to place, but many organisations that have
implemented RPA in accounting and finance have found it phenomenal as it has ledthem
to faster results and more accurate information.
How to choose a robotic automation process for robotic accounting?
Robotic process automation can be implemented using a variety of devices. There
are many type of tools available for this process in the market, such as: -
Blue prism
Automation Anywhere
UI Path
Work fusion
Pega System
As there are many options available for selection, it has become difficult to choose
what is best. Business organizations must consider the following points while choosing
the robotic automation process: -
Who will handle the initial automation?
Who will monitor and manage the way it is run?
How will automation support its own trading system?
What would be the appropriate time to implement robotic automation?
What will be the impact of robotic automation on costs?

Dr. Mangu Ram : Robotic Accounting : A Need of New Accounting World
41
RPA Implementation Process
I Planning -
The most important aspect is planning to implement a process in any business, at
this stage, the company must identify the processes it wants to automate. The following
steps will help the business organization to identify the process it should automate.
Business process manual and repetitive
Business process is rule-based
Business input data is in electronic format and is readable
Company’s existing system be used as it is with no change
Next, steps in planning stages are -
The company should set up a project team, finalize implementation timelines and
approach.
The company should agree on solution design for performing RPA processes.
The company should identify a logging mechanism that should be implemented to find
issues with running bots.
The company should clear roadmap should be defined to scale up RPA implementation.
II Development -
In the second phase of development, the company started developing the
automation workflows as per the pre-determined plan and continue support to roadmap of
RPA.
Planning Development Testing
Implementation Review

Indian Journal Of Business Administration (IJBA)
(A National Peer Reviewed Refereed Journal)
ISSN : 0975-6825, Volume 14, Issue 1, January-June 2021, pp. 36-46
42
III Testing –
In the third stage of testing of RPA, a company run testing cycles for in-scope
automation, to identify and correct defects. If any doubt and drawback in testing system,
company must rectify that system before taking next step.
IV Implementation–
In this stage, the business organizationimplements the RPA process which is
customise to cater its need. This is the stage where the RPA’s are open for use for all the
desired users.
V Review
At the review stage, the business organization should review all of the RPA
process for security purposes and find any lacuna in the RPA system, which is
immediately correct for that lacuna. The company should be mindful of the up-to-date
system in the competition network, so the business organization can compete with other
similar organizations.
Robotics automation should be implemented in a phased manner only after
thoroughly analysing the said points and the benefits of robotic automation. It can be
applied in a certain time frame by analysis, as well as understanding the effects on the
business in the long run so that one implementing it can easily figure out what is the best
for their business
Scope of RPA in Accounting and Finance
Robotic Process Automation drives the automation of accounting processes a step
further or towards a new generation of automation. Automation in accounting processes
began in the late twentieth century to the late 80s and early 90s when software systems
such as Tally ERP emerged, resulting today automation rate is about 80 percent of
common processes like AP / AR and for those less common processes, this rate is about
50 percent.Today's Chief Finance Officer (CFO) is aggressively moving towards
automation of accounting and finance sector processes due to the benefits from low usage
of automation in accounting processes and finance services. Even if automation is not
possible in their own offices, they are not averse to outsourcing it. Robotic process
automation nowadays is used in/or can be used in
1. Customers orderProcessing- Orders placed on websites of e-commerce may
then have to be placed on the actual repositories for the actual dispatch and also to
maintain the inventory recordings different than the customer-facing orders. E-

Dr. Mangu Ram : Robotic Accounting : A Need of New Accounting World
43
commerce transaction data entry processes can be assigned to robotic automation
process solutions, which will automate the entire process of order placement. It
can be rendered better by removing human errors caused by any
misunderstanding or any other reason.
2. Transfer of Information related to accounting and finance from one system
to another- Robotic Process Automation helps in automating, the process of
transferring information from one system to another to provide accounting and
finance information to users of information.The solution can be made fully
secured by making it necessary to provide the necessary credentials, source and
destination details, and automated monitoring for the entire task.
3. Operation of Accounting - Robotic automation process is being used for the
operationof accounting and finance sector, operational processsuch as: - billing
processes, payment records, maintaining records of receipts and so on.
4. General Accounting - Robotic automation process can be used by robotic
accounting to perform common accounting tasks like allocation and adjustment,
journal entry processing, matching, inter-company transactions etc. to make them
easier, cheaper and faster.
5. Internal and external reporting - Robotic accounting can be used to generate
reports and transfer them to stakeholders or both Internal and external users of
accounting information using a robotic automation process, with the help of a
single button.
6. Treasury and Cash Management Process - Robotic accounting can also be used
for treasury and cash management processes by using robotic automation process
as they come with a better and more reliable security mechanism, which makes
these tasks hassle-free. Whenrobotic automation processes are used in the field of
treasury and cash management processes, will help in the administration and
holdings of financial assets of a business much easier than ever before. Robotic
accounting is used in planning, budgeting and forecasting work, so these tasks can
be completed easily and in a short time.
7. Payroll Processing: Processing of Payroll is a good example that needs manual
intervention month after month or every year. An RPA system can be used instead
to extract the details that are required from hand-written timesheets and calculate
the pay from their stipulated CTC's and pay them as well.
8. Generating of Insurance Premium Renewals: Insurance companies have to
provide premium receipts for insurance renewal, when premium renewal is paid

Indian Journal Of Business Administration (IJBA)
(A National Peer Reviewed Refereed Journal)
ISSN : 0975-6825, Volume 14, Issue 1, January-June 2021, pp. 36-46
44
offline or online. These online or offline premium renewals for every premium
paid for every insurance policy can be completed through an RPA solution that
can do this work without any manual intervention 24 x 7.
9. Processing of Insurance Claims: Insurance companies have to process insurance
claims that are raised against insured members for an initial process to trigger
processing of claims in their system and which also forms the paper-based proof
that can be saved for further use in investigations. Processes as like these can be
automated such that the forms can be read by robotic process automationsystem
and then the manual data entry to the applications where these insurance claims
are processed can be done by the robotic process automationsystem.
10. Promotion for better investment options – In robotic accounting, robotic
process automation is preferable for tracking the investment process, despite the
potential for quick changes. The RPA system can assess an investor's portfolio
and reduce the risk inherent to investment options. RPA system tools can also
serve as financial advisors without the prohibitive costs of their human
counterparts.
11. Support against money laundering –RPA system can prevent money laundering
which is a top priority for any nation in the accounting and finance sector. RPA
system uses particular validation rules to check customers' personal information
and removal of discrepancies. Robotic process automation can make a significant
contribution in assisting companies’ in compliance with the laws which would be
useful in lending support against money laundering.
12. Overdraft protection Requests: Banking and non-banking companies can
handle the overdrafts and loan accounts of individuals and also institutions. Banks
can define specific set rules on how these requests can be classified and how
manual intervention can be minimized. Once a good and fair picture is decided
upon, then the responsibility of handling all the incoming overdraft requests of
individuals and organizations can be safely handed over to the RPA system.
13. Application of Credit cards: Banks are using the RPA system to take full
responsibility for launching credit card applications. The RPA system is used to
collect all the necessary documents from individuals, required credit checks,
background checks, deciding whether a person is eligible for a credit card based

Dr. Mangu Ram : Robotic Accounting : A Need of New Accounting World
45
on the details provided, issuing a new credit Card if it is eligible and ensures that
successful delivery of credit card and card can be blocked in case of card theft or
misuse.
14. Shipping notifications: Logistics Companies and e-Commerce websites are
getting benefits from this automated process system as these kinds of activities are
fully automated without the intervention of any human being at all. Since these
details can be fetched from the provider databases and the shipments can be
tracked for delivery over GPS or other latest technology, this can comfortably be
automated.
15. Closing of Fraudulent Account: Accounts about banks, organizations,
applications, services – all of these need robotic process automation based
software to take up monitoring for good and positive usage that goes suspicious
ought to be reported. Doing process which is going through logs on a continuous
basismanually is not a viable option for an individual or better to say RPA is the
best option for this.
16. Processing of Customer complaints: The complaint of customers can be
registered against a present set of issues and each of the newer issues that get
raised can be categorized into these issue categories by the RPA based system.
Based on each of these categories, there can be possible solutions that can be
suggested to the customers right away. Doing so, customer complaints can be
answered 24 x 7 positively without any human intervention.
At conclusion point, it can be said that the future of accounting subject is robotic
accounting which will change the appearance of the accounting and finance profession.
Robotic accounting with the help of robotic automation process will make the primary
duty of accounting, production and dissemination of information faster than ever.
However the use or benefits of robotic accounting processes, may vary by the place, by
region, by business varies may vary, Butit can be said that after the implementation of
robotic automation processes in accounting field have found that accounting data and
results have been more accurate and significantly faster.After implementing this
Accountants and financial professionals must master this cutting-edge technology if they
want to stay in business.
Indian Journal Of Business Administration (IJBA)
(A National Peer Reviewed Refereed Journal)
ISSN : 0975-6825, Volume 14, Issue 1, January-June 2021, pp. 36-46
46
REFERENCES
• Algorithmic Trading. Investopedia.2005-05-18.
• Gilchrist, A., 2016. Industry 4.0: the Industrial Internet of Things. Apress,
Berkeley
• Hacker Earth, 2018, https://www.hackerearth.com/Innovation Management, July
• Harrison, J.F. (2019, March 10). To bring humanness to tech, we need talent from
humanities, not just coders. (S. Joshi, Interviewer)
• ICAEW, (2015), Providing Leadership in a Digital World, London: ICAEW
• Jay Lee, Hossein Davari, Jaskaran Singh, VibhorPandhare (2018), Industrial
Artificial Intelligence for Industry 4.0 based Manufacturing Systems,
Manufacturing Letters, 18, 20-23
• Kamakoti (2018), National Strategy for Artificial Intelligence, June 2018,
Discussion Paper, NitiAayog, India,
• Kaplan, A.M.; Haenlein, M. (2018). "Siri, Siri in my Hand, who's the Fairest in
the Land? On the Interpretations, Illustrations and Implications of Artificial
Intelligence". Business Horizons. 62 (1): 15–25
• Russell, S. and Norvig, P.,1995. Artificial Intelligence: a modern approach, Upper
Saddle River, NJ: Prentice-Hall.

Indian Journal Of Business Administration (IJBA) (A National Peer Reviewed Refereed Journal) ISSN : 0975-6825, Volume 14, Issue 1, January-June 2021, pp. 47-53
47
AN ANALYTICAL STUDY OF HEALTH AND EDUCATION
STATUS WITH SPECIAL REFERENCE TO RAJASTHAN
Dr. Kanta Choudhary*
ABSTRACT
As we all know that growth of any nation is depending on the sectors of the
economy and the sector depending on production done through people , it means people
engaged in that sector are also working and when people are working means they are
maintaining good standard of living and good standard of living shows that they are
having proper education and proper health services.So,with this research paper we are
just trying to highlight the educational and health infrastructure of economy of Rajasthan
which is very helpful requirement for developing human capital for human
resource.Thus, this paper highlights the educational and health status of the Rajasthan
which contribute to economy of Rajasthan.
Keywords: Rajasthan Economy, Education, Health status, Growth.
Introduction
Human resource, we all know is very essential requirement of any economic
production because when we have human resource or labour resource only then any kind
of technique can be used. Along with that all type of management, direction and
supervision can be done for the production of goods and services and producing more
goods and services is contributing more towards GDP. As GDP increases, the growth rate
of economy increases likewise.So, for this reason there is a need to develop more
educational and health infrastructure as well as provide time to time modification in this
type of requirements to the people and some changes and policies so that nation or an
economy can build strong citizen smart brain and can stop brain drain to develop the
economy in a faster way.
* Assistant Professor, Department of Economics, Jai Narain Vyas University, Jodhpur

Dr. Kanta Choudhary : An Analytical Study of Health and Education Status with special reference to Rajasthan
48
With this point of view this paper highlights the importance of education and
health infrastructure in economy of Rajasthan.As we all know now that Rajasthan is a
faster growing economy in India. It is in the top 10 states of the country, so we need to
check that the policies related to education and health working properly in this state and
how their contribution towards the overall economic growth of the country. Position of
Rajasthan among top 10 states of India is seen in the table given below. On the basis of
the table it can be seen that Rajasthan holds 8th rank in terms of nominal GDP in trillion
Indian rupees. This becomes possible with growing educational and health infrastructure
in this state.
Table : 1
Source: wikipedia.org data related to 2019-20
Objectives of the study:The attempts have been made through this paper is :
1. To analyze the education status of Rajasthan.
2. To analyze the health status of Rajasthan.
Research methodology
For the study secondary data has been used from various sites of Government of
India and Rajasthan. For tabular presentation support of Excel sheet has been taken.
Educational achievement in Rajasthan
Private and public sector both provide education facilities in India, which is funded
by three tier of government like central, state and local to increase the level of education
at all levels. As we know that education of child is compulsory. in the world
Rank State Nominal (2019-20)
GDP
(trillion INR, lakh crore
1 Maharashtra 29.79
2 Tamil Nadu 20.54
3 Gujarat 17.03
4 Karnataka 15.88
5 Uttar Pradesh 15.79
6 West Bengal 13.14
7 Andhra Pradesh 10.80
8 Rajasthan 10.20
9 Telangana 09.69
10 Madhya Pradesh 09.62

Indian Journal Of Business Administration (IJBA) (A National Peer Reviewed Refereed Journal) ISSN : 0975-6825, Volume 14, Issue 1, January-June 2021, pp. 47-53
49
education,The Nalanda University was considered the oldest university-system of
education. Western education system embedded come into India with the founding of the
British Raj. Education in India is control by both the Union Government and states, with
some responsibilities lying with the Union and the states having autonomy for others. the
Indian Constitution provide education as a fundamental rightthrough its various articles
in which one is famous as Right to Education act 2009. Thus, it is important for every
state to maintain the education standard to this level.The improvement education standard
is calculated in terms of rising primary education, net attendance rate and increasing
literacy to approximately 2/3 of the population. Rajasthan improved education system is
the one way to improve economy of Rajasthan or as one of the main contributors to the
economic rise of Rajasthan. In the table given below it can be seen that literacy rate has
been improved since independence in Rajasthan. But drastic change in literacy level has
been seen in male literacy rate compare to female.Initially sine independence female
literacy rate was negligible. In 1951 the literacy rate among female was only 2.66%.This
rate has been changed over the period and till 2011 census it reaches to 52.12 % but it is
still lesser than male literacy rate that is 79.19% in 2011. Comparing rural area again
male literacy rate is higher than female literacy but female literacy rate is better in urban
area as compare to rural areas. We can see this reality in the table given below.
Table:- 2
Literacy rate in Rajasthan (in percentage)
Years Total Rural Urban
Male Female Male Female Male Female
1951 13.88 2.66 N.A. N.A. N.A. N.A.
1961 28.08 7.01 21.74 3.19 59.93 26.89
1971 33.87 10.06 27.04 4.85 64.53 34.94
1981 44.77 14 35.32 6.78 72.29 41.46
1991 54.99 20.44 47.64 11.59 78.5 50.24
2001 75.7 43.85 72.1 37.34 86.45 64.67
2011 79.19 52.12 76.16 45.8 87.91 70.73
Source: Census of India
Girl’s education is the main challenge confronting education strategies in
Rajasthan along to it education for Scheduled Tribes and Scheduled Castes is also
another challenge for Rajasthan Government.for universalizing literacy and ensuring
quality education, primary education in Rajasthan is identified as the key issues to

Dr. Kanta Choudhary : An Analytical Study of Health and Education Status with special reference to Rajasthan
50
strengthen initiatives. As well as all stages of education is important such as at primary,
secondary and higher among which primary and elementary education is very important
part of any education system.
According to estimate of 2011-12, here we compare the achievement of
Rajasthan and India we found that:
a. Till 2011-12 there were only 8 preprimary schools, 47818 primary school and
15691 high or secondary schools found in Rajasthan while in India this rate were
61499, 712437 and 124096 respectively.
b. Gross enrolment ratio for all categories in secondary and higher education in
Rajasthan till 2013-14 data state that in Rajasthan 78.68% students were enrolled
at secondary level and 53.03 % at higher secondary level while in overallIndia it
was 76.64 % and 52.21 % respectively.
c. Plan and non-plan total budget expenditure on elementary education on Rajasthan
till 2011-12 were 11947301 Rs thousand as planned and 53510573 Rs. Thousand
as non planned expenditure. The total percentage of budget expenditure on
education was 58.60 %. While at India level it was 50.06 %.
In 2014, the government of Rajasthan announced a new initiative, the Rajasthan
Adarsh Yojana, which would establish one Adarsh (Hindi for “ideal”) school in each of
the 9,895 gram panchayats across the state (a gram panchayat comprises a cluster of
villages governed by a single village council). The state defined an Adarsh school as an
integrated primary and secondary school that is large, child-friendly, and fully staffed;
most importantly, it provides a high-quality education. This model government school
would serve as a blueprint for other nearby schools and ensure that at least one fully
equipped, integrated school would be accessible to the area’s children.
Through the Rajasthan Adarsh Yojana, the government aims to improve the quality of
education for at least 4.6 million children by the end of 2018.
Health status of Rajasthan
The state has surged to second place with a jump of six positions and improving the
health indicator and significant progress is reflected in the report of NITI Aayog by 2019.
The report states that Rajasthan secured second position in improving the performance in
health facilities from 2015-16 to 2017-18.
Health status of any economy is indicated through following parameter such as life
expectancy, birth rate, death rate and infant mortality rate and also maternal mortality
rate. Before we analyze these indicators in reference to Rajasthan, first we must aware
about its meanings.

Indian Journal Of Business Administration (IJBA) (A National Peer Reviewed Refereed Journal) ISSN : 0975-6825, Volume 14, Issue 1, January-June 2021, pp. 47-53
51
a. Infant mortality rate: The number of children dying below the 1 year of age
which is divided by the number of live births that year.
b. Birth Rate is the rate shows the number of babies born every year per 1000
people in a population. Death Rate is used to show the number of deaths every
year per 1000 people in a population.
c. The Maternal Mortality Ratio (MMR) is the number of maternal deaths during a
given time period per 100,000 live births during the same time period.
d. Life expectancy: Average number of years that a newborn is expected to live if
current mortality rates continue to apply.
In the table given below it can be analyzed that crude birth rate has decreased
from 29 per thousand to 24.1 per thousand from 2004 to 2017. Analyzing the data, it is
also found that crude death rate in Rajasthan has also decreased from 7 per thousand to
6 only per thousand. But drastic change has been observed in case of infant mortality
rate which also declined from 67 per thousand to 38 per thousand from 2004 to 2017.
Table:- 3
Source: SRS bulletin @per 1000 mid-year population $ Per 1000 live births
Some fact related to status of Rajasthan in term of health:
In the following table given here some facilities provided in name of different
establishment in 12 five-year plans and it is found remarkable status in Rajasthan in
Health Indicators in Rajasthan
Years Crude birth rate @ Crude death rate @ Infant mortality rate $
2004 29 7 67
2005 28.6 7 68
2006 28.3 6.9 67
2007 27.9 6.8 65
2008 27.5 6.8 63
2009 27.2 6.6 59
2010 26.7 6.7 55
2011 26.2 6.7 52
2012 25.9 6.6 49
2013 25.6 6.5 47
2014 25 6.4 46
2015 24.8 6.3 43
2016 24.3 6.1 41
2017 24.1 6 38

Dr. Kanta Choudhary : An Analytical Study of Health and Education Status with special reference to Rajasthan
52
providing all such facilities to rural as well as urban area.
Table: 4
Number of establishments of health facilities till 12th five year plan
Facilities No of Establishments
SC (sub centres ) 14407
PHC( primary health centres) 2082
CHC( community health centres) 567
SDH (subdural hematoma) 19
Satellite 8
DH(Dermatitis herpetiformis) 34
Source: Pragati Prativedan 2016-17
In the table given above it can be seen that 14407 sub centers (SC) were established,
where primary health centres were 2082 and very less satellite hospitals were established
about only 8.
a. These facilities covers 4487, 33731 and 134922 populations in Rajasthan through
SC, PHC and CHC level hospitals respectively. They also cover 4, 27 and 133
villages of Rajasthan.
b. In Rajasthan 111 blood banks were opened till 2016-17, 13 registered Eye banks
were opened in the same time period.
c. In AYUSH system of health facilities there were 11 Ayurveda, 2 Unani, 3
Naturopathy and 8 Homeopathy till 2016.
Conclusion
On the basis of above research it can be said that Rajasthan has improved its status in terms of education and health facilities which provided it better position in India’s other states. In education status it is found that not only literacy rate improved but also facilities related to primary education and higher education has improved along with it is also found that this state focused more on girl’s education. Introduction of Adarsh school at Panchayat level also helpful in this way. Taking the analysis of health sector, we found that nowadays government of Rajasthan is working efficiently in providing better health care facilities in terms of Primary HealthCentres, Sub-Centres and Community Health Centres. They are covering villages as well as urban areas.Other facilities like AYUSH system is still needed to be focused more so as to achieve overall growth in health sector. And also there is a need of improving education status to foster the growth of the state which is possible only if female literacy rate increases in rural areas.

Indian Journal Of Business Administration (IJBA) (A National Peer Reviewed Refereed Journal) ISSN : 0975-6825, Volume 14, Issue 1, January-June 2021, pp. 47-53
53
References: • Banerjee Abhijit, Deaton Angus, Duflo Esther 2003, “Health care delivery in rural
Rajasthan “Department of Economics, MIT, Department of Economics and Woodrow Wilson School, Princeton University, Department of Economics, MIT.
• Chaudhury, Nazmul and Jeffrey Hammer (2003) Ghost Doctors: Absenteeism in Bangladeshi HealthFacilities MIMEO, Development Research Group, World Bank.
• Dhamuniya Shilpa 2015,” E-GOVERNANCE IN RAJASTHAN STATE UNIVERSITIES: IMPACTS ANDIMPEDIMENTS”, Int. J. Soc. Sci. Manage. Vol-2, issue-1: 31-35DOI: 10.3126/ijssm. v2i1.11684.
• Jain Akshay, Kumar Dr. Ashok, “A Survey of Government Polices to Improve the
Primary Education in Rajasthan” International Journal of Education and
Psychological Research (IJEPR) ISSN: 2279-0179 Volume 2, Issue 3, pp: 133-
142, August 2013 Copyright © IJEPR, All Rights Reserved Page 133.
• Shamika Ravi, RahulAhluwalia’sBergqvist2016, “Health and Morbidity in India
2004-2014.
• Sonal Kala, A study on “Awareness of Health Insurance among people with
special reference to Rajasthan (India)” ISSN: 2349-5677 Volume 1, Issue 12,
May 2015.
• Summary : Rajasthan economic Review 2017-18
Online recourses:
• List of Indian states and union territories by GDP – Wikipedia
• www.bridgespan.org
• www.timesofindia.indiatimes.com
• www.who.int.
• www.economictimes
• www.economichelp.org
• www.indiatoday.in
• www.rajras.in
• www.investindia.gov.in
• www.rajasthanstat.com

Indian Journal Of Business Administration (IJBA)
(A National Peer Reviewed Refereed Journal)
ISSN : 0975-6825, Volume 14, Issue 1, January-June 2021, pp. 54-60
54
CRITICAL ANALYSIS OF TAX PAID AND INCOME TAX RETURNS FILED
BY INDIVIDUAL ASSESSEE
Patel Jatin Kamlesh bhai*
ABSTRACT
In India we have adopted progressive principle of taxation,wherein liability of
taxpayer increases with increase in their income. With rising tax revenue and number of
income tax return filer it is inevitable to study trend of taxation. In addition, researcher
also tried to know relationship between tax paid and returns filed by individual assesses.
Researcher found that there exists a significant relationship between tax paid and return
filed by individual assessee.
Keywords:Assessment year, Individual assessee, Income tax return, Direct tax revenue.
Introduction
A renown quote from Chanakya’s Arthshashtra, “…to collect taxes from citizen
like a Bee collects honey from flowers quietly without inflicting pain”.
Taxes are important part of recurring revenue ofDepartment of Revenue under the
umbrella of Ministry of Finance.In India we have adopted progressive principle of
taxation. Wherein liability of taxpayer increases with increase in their income. Taxes in
India are broadly classified into two main categories based on leavy of charge i.e., Direct
and Indirect. When a taxpayer pays directly to government it is called Direct Tax and
when a tax payer pays taxes indirectly i.e., through retailer, wholesaler or service
provider in the form of consumption of goods or service, it is called indirect taxes. From
the table 1.1 given below we can see contribution of direct tax to total tax is 53% on
average basis during the period assessment year 2012-13 to 2018-19 and on the other side
filing of income tax return is made mandatory for individuals whose gross total income
exceeds basic exemption limit which draws the attention of the researcher for the study?
Review of literature
(Mittal, Prakash, & Vishal, 2020) In this study researchers tried to assess awareness
* Assistant Professor, KES Shroff College of Arts & Commerce

Patel Jatin Kamlesh bhai : Critical analysis of tax paid and income tax returns filed by individual assessee
55
level and predict attitude of Indian tax payers towards online filing of return. The study
reveals that education has great impact of awareness, attitude and perception of Indian
taxpayers. The second categorical variable i.e., Age of respondents reveal thatyounger
taxpayers are more inclined to adopt e-filing of tax return rather older age due to perceive
use of technology, perceive benefit and security purpose.
(Ruchika Jain & Dr. C. M. Jain, 2017) This study focuses on satisfaction level of
taxpayers of Udaipur district of Rajasthan. In this research scholars found that except
easiness of online filing of return respondents were satisfied by accuracy, safety, time
allotment for filing of return, e-payment gateway, refund and acknowledgment, and
accordingly researcher concluded that there exists significant relation between level of
satisfaction and feature of e-filing.
(MohdArif, 2016)did through analysis of pattern of direct and indirect taxes in India with
reference to various factors such as growth rate of taxes, cost of collection, gross
domestic production, level of awareness among taxpayers, attitude of income tax
department towards taxpayers, etc. The researcher observed that direct as well as indirect
taxes have an upward trend over the study period where as cost of collection has reduced.
Share of direct as well as indirect taxes to total revenue was remarkable. It was also
suggested by the researcher to combat tax evasion and avoidance, government should
focus on education, awareness taxation and simplify tax laws.
(Haryani, Motwani, & Matharu, 2015)researchers took efforts to study intentional
behavior of taxpayers with reference to e-return filing of income tax. In this study
researchers concluded that perceived ease of use and perceived usefulness are major
factors for adoption of online filing of income tax return. Scholars also suggested that
income tax department should endeavor to e-filing of return by improving user-friendly,
simplified system and increasing promotional advertisement during the due date of filing
of return. For further studies researchers emphasize to widen the geographical location
and inclusion of other variables.
(Geetha & Sekar, 2012) researchers tried to assess level of awareness and satisfaction
among taxpayers of Coimbatore City. Based on analysis of primary data researchers
observed that newspapers were the major source of gaining awareness followed by
friends and auditors. In this study researchers found that variables such as residential
status and educational qualification and awareness level of e-filing of income tax return,
online filing procedure, e-payment option, ITR Form, TDS return are not related
significantly.

Indian Journal Of Business Administration (IJBA)
(A National Peer Reviewed Refereed Journal)
ISSN : 0975-6825, Volume 14, Issue 1, January-June 2021, pp. 54-60
56
Research methodology
This research study is descriptive in nature wherein researcher has tried to analyzed data
related to income tax paid and return of income filed by taxpayers in India during the
period assessment year 2012-13 to 2018-19 which will enable researcher to draw a
meaningful conclusion.
Objective
i. To analyze trend of tax paid by individual assessee during the period
assessment year 2012-13 to 2018-19
ii. To analyze trend of income tax returns filed by individual assessee during
the period assessment year 2012-13 to 2018-19
iii. To study relationship between tax paid and returns filed by individual
assessee during the period assessment year 2012-13 to 2018-19
Hypothesis
H0: There is no significant relation between contribution of tax paid by individual
assessee and total direct tax revenue.
H1: There is significant relation between contribution of tax paid by individual
assessee
and total direct tax revenue.
H0: There is no significant relation between income tax return filed by individual
assessee and direct tax paid by individual assessee.
H1: There is significant relation between income tax return filed by individual
assessee
and direct tax paid by individual assessee.
Data collection: Secondary data were collected from website of income tax department.
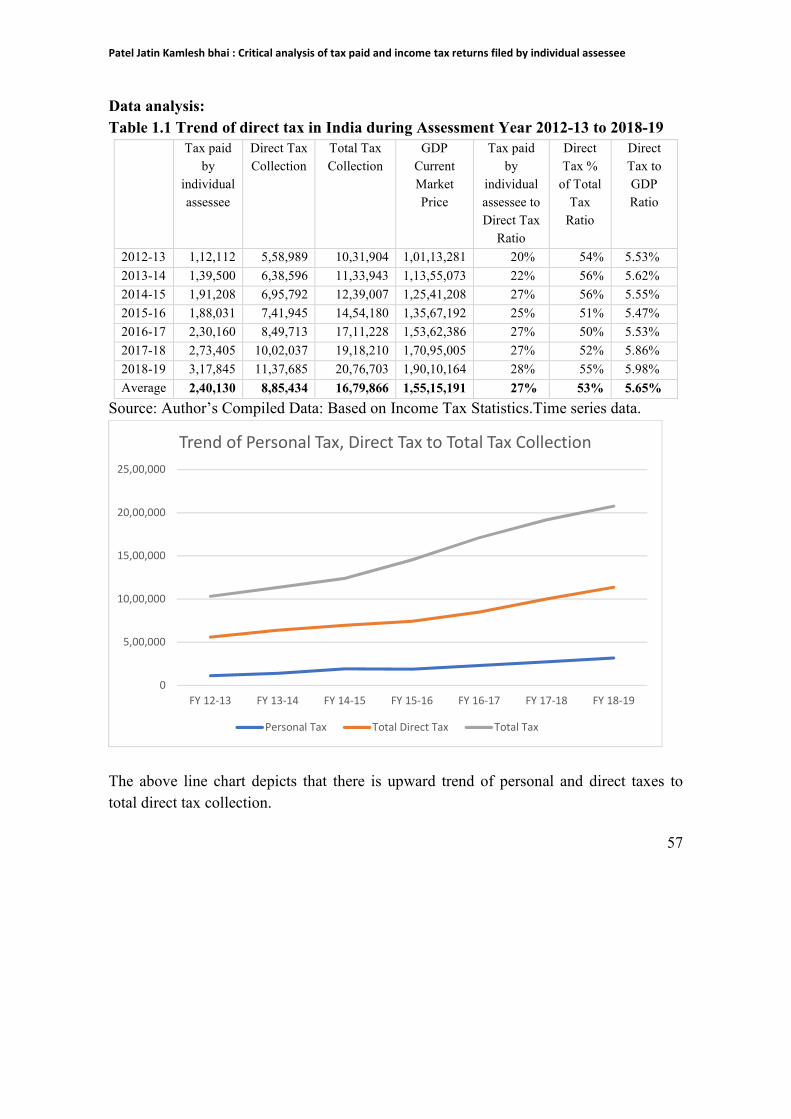
Patel Jatin Kamlesh bhai : Critical analysis of tax paid and income tax returns filed by individual assessee
57
Data analysis:
Table 1.1 Trend of direct tax in India during Assessment Year 2012-13 to 2018-19
Tax paid
by
individual
assessee
Direct Tax
Collection
Total Tax
Collection
GDP
Current
Market
Price
Tax paid
by
individual
assessee to
Direct Tax
Ratio
Direct
Tax %
of Total
Tax
Ratio
Direct
Tax to
GDP
Ratio
2012-13 1,12,112 5,58,989 10,31,904 1,01,13,281 20% 54% 5.53%
2013-14 1,39,500 6,38,596 11,33,943 1,13,55,073 22% 56% 5.62%
2014-15 1,91,208 6,95,792 12,39,007 1,25,41,208 27% 56% 5.55%
2015-16 1,88,031 7,41,945 14,54,180 1,35,67,192 25% 51% 5.47%
2016-17 2,30,160 8,49,713 17,11,228 1,53,62,386 27% 50% 5.53%
2017-18 2,73,405 10,02,037 19,18,210 1,70,95,005 27% 52% 5.86%
2018-19 3,17,845 11,37,685 20,76,703 1,90,10,164 28% 55% 5.98%
Average 2,40,130 8,85,434 16,79,866 1,55,15,191 27% 53% 5.65%
Source: Author’s Compiled Data: Based on Income Tax Statistics.Time series data.
The above line chart depicts that there is upward trend of personal and direct taxes to
total direct tax collection.
0
5,00,000
10,00,000
15,00,000
20,00,000
25,00,000
FY 12-13 FY 13-14 FY 14-15 FY 15-16 FY 16-17 FY 17-18 FY 18-19
Trend of Personal Tax, Direct Tax to Total Tax Collection
Personal Tax Total Direct Tax Total Tax
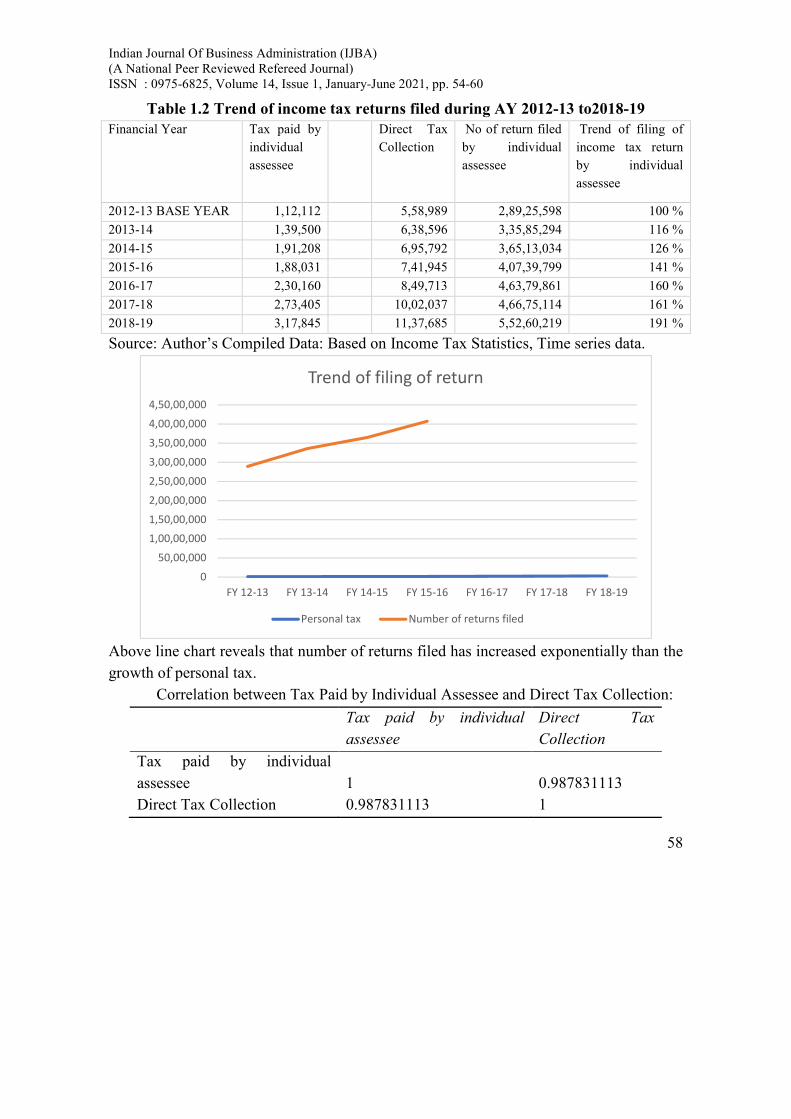
Indian Journal Of Business Administration (IJBA)
(A National Peer Reviewed Refereed Journal)
ISSN : 0975-6825, Volume 14, Issue 1, January-June 2021, pp. 54-60
58
Table 1.2 Trend of income tax returns filed during AY 2012-13 to2018-19
Financial Year Tax paid by
individual
assessee
Direct Tax
Collection
No of return filed
by individual
assessee
Trend of filing of
income tax return
by individual
assessee
2012-13 BASE YEAR 1,12,112 5,58,989 2,89,25,598 100 %
2013-14 1,39,500 6,38,596 3,35,85,294 116 %
2014-15 1,91,208 6,95,792 3,65,13,034 126 %
2015-16 1,88,031 7,41,945 4,07,39,799 141 %
2016-17 2,30,160 8,49,713 4,63,79,861 160 %
2017-18 2,73,405 10,02,037 4,66,75,114 161 %
2018-19 3,17,845 11,37,685 5,52,60,219 191 %
Source: Author’s Compiled Data: Based on Income Tax Statistics, Time series data.
Above line chart reveals that number of returns filed has increased exponentially than the
growth of personal tax.
Correlation between Tax Paid by Individual Assessee and Direct Tax Collection:
Tax paid by individual
assessee
Direct Tax
Collection
Tax paid by individual
assessee 1 0.987831113
Direct Tax Collection 0.987831113 1
0
50,00,000
1,00,00,000
1,50,00,000
2,00,00,000
2,50,00,000
3,00,00,000
3,50,00,000
4,00,00,000
4,50,00,000
FY 12-13 FY 13-14 FY 14-15 FY 15-16 FY 16-17 FY 17-18 FY 18-19
Trend of filing of return
Personal tax Number of returns filed
Patel Jatin Kamlesh bhai : Critical analysis of tax paid and income tax returns filed by individual assessee
59
Result of the above test indicates that there exists a significant relation between tax paid
by individual assessee to direct tax collection hence null hypothesis is accepted.
Correlation between Tax Paid by Individual Assessee and Number of returns filed
Tax paid by individual
assessee
No of return filed by
Individual assessee
Tax paid by individual assessee 1 0.974367531
No of return filed by Individual
assessee 0.974367531 1
Result of the above test supports null hypothesis that there exists a significant relation
between tax paid by individual assessee and number of returns filed by individual
assessee hence null hypothesis is accepted.
Regression Statistics
Multiple R 0.974
R Square 0.949
Adjusted R Square 0.939
Standard Error 22,16,320
Observations 7
ANOVA
df SS MS F
Significance
F
Regression 1 4.60747E+14 4.60747E+14
93.799
0.000
Residual 5 2.45604E+13 4.91207E+12
Total 6 4.85307E+14
Coefficients
Standard
Error t Stat
P-
value Lower 95% Upper 95%
Lower
95.0%
Upper
95.0%
Intercept 16023069.83 2726714.358 5.876328696
0.002 9013827.427 23032312.22 9013827.427 23032312.22
TPIA* 121.133481 12.50735891 9.684976807
0.000 88.98229135 153.2846706 88.98229135 153.2846706
*TPIA: Tax Paid by Individual Assessee.
Regression analysis of variances show that R square value is 0.949 which indicates strong
relation between the tested variables.Significance F value is below 0.05 and P value is
0.05 which supports null hypothesis indicates there exists significant relation between tax
paid by individuals and return of income tax filed by individuals.

Indian Journal Of Business Administration (IJBA)
(A National Peer Reviewed Refereed Journal)
ISSN : 0975-6825, Volume 14, Issue 1, January-June 2021, pp. 54-60
60
Conclusion
Based on review of existing literature and data analysis researcher draws inference that
personal tax contributes on an average 27% to direct tax, whereas direct tax contributes
53% to total tax collection and number of income tax returns filed has increased by 91%
of base year i.e., Assessment year 2012-13. Because of widening of tax bracket number
of tax payers as well as return filers has got increased.
Limitations
In this study researcher has taken into account only two independent variables i.e., Tax
paid by individual assessee and return of income tax filed by individual assessee. For
further study relation, impact of income, consumption expenditure can be measured with
reference to tax liability of an individual, returns filed. As per income tax time series data
2.12 Crore Indian who have paid tax but not filed return of income tax hence reason of
non-compliance can also be studied.
References
• GeethaR., & SekarM. (2012). E: Filing of Income Tax: Awareness and
satisfaction level of taxpayers in Coimbator City, India. Research Journal of
Management Sciences, 6-11.
• HaryaniSharda., Motwani B., & Matharu S. K. (2015). Behavioral Intention of
Taxpayers towards Online Tax Filing in India. Business & Finacial Affairs, 1-5.
• MittalR., PrakashB., & Vishal. (2020). Predicting Taxpayers Attitudes towards of
Indian Tax Payers towards the E-Return Filling: An Empirical Study of Delhi,
NCR, India. Asian Journal of Economics, Business and Accounting, 38-45.
• MohdArif. (2016). A critical analysis of direct taxes in india. Department of
commerce. Lucknow, uttar pradesh, (india): university of lucknow.
• Ruchika Jain & Dr. C. M. Jain. (2017). E-filing of income tax return: Satisfaction
level of Individual Tax Payers in Udaipur District, Rajasthan. Pacific Business
Review International, 172-177.
• Website: www.incometaxindiaefiling.gov.in

Indian Journal Of Business Administration (IJBA) (A National Peer Reviewed Refereed Journal) ISSN : 0975-6825, Volume 14, Issue 1, January-June 2021, pp. 61-71
61
A STUDY OF DOMAIN NAME & RISK MANAGEMENT OF ONLINE
BUSINESS IN CONTEXT OF TRADEMARK ISSUES IN CYBERSPACE
Nishant Gehlot*
Amit Kumar Kashyap**
INTRODUCTION
The aspect of modern business and culture has evolved very rapidly due to the increasing
importance and use of the internet in the commercial world (R. Ryder 2007). As the
Internet grew, every business is marking its online presence. Notwithstanding the digital
divide, India is one of the largest internet-user markets in the world and India e-
commerce will reach US$ 99 billion by 2024, growing at a 27% CAGR over 2019-24
(IBEF, 2021). India is now the fourth largest start-up hub in the world, with more than
3000 new companies (NASSCOM, 2015). Since the announcement of the Digital India
campaign by the government of India, several start-ups have emerged recently to signal
the potential in the South Asian country. The Covid-19 has also accelerated the adoption
of online technologies in India. At present, the development of internet business is
expanding around the world. Here an issue of danger emerges to ride the development.
The risk is of digital wrongdoing.The emergence of e-commerce has exposed persons and
businesses on networks and communication devices to greater risks of economic offences
in cyberspace (D. Slater, U. Gasser, M Smith, D. Bambauer&J. Palfrey, 2005). IPR
related issues in online business include, Privacy, piracy, Cybercrime, Online Banking
frauds, Domain Name Disputes, Copyright infringements, Spamming and so on.
Businesses rely on their trademarks and goodwill built through their good service to the
consumers to continue to make economic gains.
In short in recent business, it serves the functions like identifying the goods of one
seller from others and tell between the goods, identifies the goodwill, signifies the
quality, advertises the goods and services, announces the obscurity and finally, it
* Asst. Prof. Department of Management Studies, Jai Narain Vyas University, Jodhpur.
** Asst. Prof of Law, Head, Centre for Corporate Law Studies, Institute of Law, Nirma University, Ahmedabad.

Nishant Gehlot & Amit Kumar Kashyap : A Study Of Domain Name & Risk Management Of Online Business In Context Of Trademark Issues In Cyberspace
62
creates an image about the business in which it is used (W. Reid Paul & J Gallo Winery,
2001).Any dispute relating to a trademark may tarnish the whole image and goodwill of
the business and thus, such risk should be systematically identified and mitigated (Bond,
N. M. 1998).
ONLINE BUSINESS, DOMAIN NAME & TRADEMARK
The growth of the internet in business transactions throughout has raised
challenges to the business as well. With the rapid use of the internet in business the
intellectual property protection has become a challenge (Vakul Sharma, 2007). The
owners of intellectual property over the internet are thus provided with an unlimited
market for their works thanks to the global reach of the internet.Trademarks presence
online helps to build great brands. The Management Strategy of business expansion
online needs careful use of trademark, its registration and business policy for its
protection. If there is high brand loyalty, the companies can retain customers for a long
and reduce investment in marketing (R. Spinello, 2006).
The trademark for a business serves three main purposes (S. Reed, 2011);
• Protection of customers from confusion;
• Goodwill protection of property, &;
• Promotion of fair competition
Trademarks act as an identity for a particular business’ products or services.
Trademarks being visual make it easy for the consumers to quickly identify the products
of a particular business. They are usually distinct, either in their name or representation
and grab the attention of the consumers easily (S Agarwal, 2007).
A trademark may be infringed if another tries to pass off his good or services as that
of an established business that has a well-known trademark. A domain name is a method
devised for internet communication. They provide a system of easy to remember Internet
addresses. Addresses for webpages on the internet at assigned numerical identities called
Internet Protocol (IP) (A K.Mehrotra, and M Halpern, 2000). As the number of web
pages increased on the internet there was more Internet protocol and users couldn't
remember all internet protocols.
An alternative method was devised to assign names to each of the internet protocols.
These names came to be known as Domain names. Invariably the domain name and
trademark are irrevocably interconnected in online business (Rees, J. 2016).Websites are
a gateway for businesses, and domain names play a part in how customers reach these
websites(J. Jennings, 2015).

Indian Journal Of Business Administration (IJBA) (A National Peer Reviewed Refereed Journal) ISSN : 0975-6825, Volume 14, Issue 1, January-June 2021, pp. 61-71
63
Assigning domain names to internet protocols is known as Domain Name System
(DNS). Domain names represent the Internet protocol, which is the distinct address for
the webpage on the internet. Some domain names have a country code along with the
generic domain name to indicate the country of origin of the web page.
The system of Domain names was started by National Science Foundation (NSF)
USA around 1990. In 1992, the NSF with a cooperative agreement with Network
Solutions, Inc. (NSI) started managing the registration, coordination, and maintenance
functions of the Internet domain name system for some of these services, including the
domain name registration services till1998. Due to rising questions on the fairness of NSI
functioning, a not-for-profit Internet Corporation for Assigned Names and Numbers
(ICANN) was formed in the USA under the auspices of the Department of Commerce
(Osborn, 2001). In late 1998, the Department of Commerce reached an agreement with
ICANN to assume from NSI the role of overseeing domain names registration. The
agreement empowers ICANN to accredit and authorize other companies to register
domain names (A J Mcshane, OS Shifrin, 2000).
The Internet gives a great opportunity to corporations to efficiently build their
brands virtually and enhance their global presence. However, with this opportunity, there
are threats as well as anti-branding activities that are easier in cyberspace.
LEGAL & ETHICAL ISSUES IN OF TRADEMARK CYBERSPACE
The application of the Internet and virtual positioning in cyberspace of the
corporation have a relative effect on the marketing mix of the firm. Trademark protection
can be expected to facilitate consumer recognition, embody business goodwill, and
prompt product quality online as well as off (Burk, 1997). The web is such an attractive
medium that creates an environment that presents a dilemma in the mind of managers as
well as policymakers as to how to protect the trademark. The owner of the trademark
applies the law to manage and protect from any type of violation like counterfeiting or
misappropriation, delusion, infringement etc. (S. Kopp & T. Suter 2000).
Critical trademark violation issues may include illegal activities like
cybersquatting, trademark keying, Mata-tagging, framing, linking etc.
Cyber-Squatting
If somebody is using a domain name with badfaith or registering it to make an
illegal profit from the goodwill of others trademarks, then it can be referred to as
Cybersquatting (S Ahmed, 2010). This may cause loss to the owner of the registered

Nishant Gehlot & Amit Kumar Kashyap : A Study Of Domain Name & Risk Management Of Online Business In Context Of Trademark Issues In Cyberspace
64
trademark because he is unable to register it as a domain name and carry out his business
activities on such a web page (Jonh D Mercer, 2000).A cyber-squatter is anyone who
registers infringing domain names in bad faith. Cybersquatters may create ongoing battles
for businesses. The speculators buy the domains intentionally to get arbitrage for trade
with the owner of the business. In response to this problem, the US government passed
the Anti-cyber-squatting Act, 1999 which defined cyber-squatting to target only the true
cyber-squatters (A Wang, 2017).
“The courts there while giving shape to the
interpretation to the definition of cyber-squatting
stated that it may comprise the following acts (J.
Gilfoil, 2005):
1. There should be the intent to divert customers from the
trademark owner’s online location to another site
under the infringing domain name, either for
commercial gain or with the intent to tarnish or
disparage the mark.
2. It shall be seen whether the person has offered to sell
the domain name for financial gain without having
first used that domain name in the bona fide offering
of goods or services
3. It shall be seen whether the person has registered or
acquired multiple domain names that the person
knows are identical or confusingly similar to the
marks of others and
4. The extent to which the mark incorporated in the
person's domain name registration is distinctive and
famous”
Passing off
The basic notion of passing off emanates from the unfair use of the goodwill,
earned by one manufacturer, by another person for the promotion of his goods. Therefore,
when a person creates a domain name and uses an established brand name of some other
company and sells products of its own, then it is passing off its goods as that of other
more established brands and hence the concept of passing off comes into the picture.

Indian Journal Of Business Administration (IJBA) (A National Peer Reviewed Refereed Journal) ISSN : 0975-6825, Volume 14, Issue 1, January-June 2021, pp. 61-71
65
Typo Squatting
In this case, there is no pre-registration of a similar domain name or selling that in
profit or dealing/negotiation with the owner for higher gains. In typo squatting the
wrongdoer, registers as domain names the typographical errors that users are likeliest to
make when entering the address of popular Web sites (A J Mcshane, OS Shifrin, 2000).
For example, a typo-pirate might register "goooogle.com" or "radiif.com" hoping to
attract persons searching for rediff.com or the Google Web sites.
Meta tagging & linking
In the case of mitigating or linking hyperlinks or Meta tags of a registered
trademark is used on a particular website to serve as a link or it is used in the search
engine optimisation function as a keyword to get more traffic. And there is no connection
between the said website and the original trademark. Nevertheless, these issues are not
very important as they may get protection under the fair use category of defence under
copyright law. However, the seriousness depends on the nature of the injury, effect on
reputation and goodwill to the owner. The act of linking is mostly protected as fair use
under copyright law. Trademark law, however, may place limits on linking, it creates
confusion in the mind of the customer and affect business revenue or results in goodwill
misuse.
Framing
In the case of Framing, the wrongdoer uses certain commands in its HTML code
to make a link to another site and display it in his website as a window or frame (M A.
Rourke. 1998). In this, the website is created by taking data from another website. This
results in copyright violation. It can also be considered as the hijacking of your website
by others. This practice affects the rights of Web site owners for its exclusive use as it is
his Intellectual Property and unfairly drive traffic to framed site due to illegal use of
owner’s data.
Trademark Keying
Trademark keying involves the sale of search results and advertising linked to
searches based on product names and trademarks. Trademark owners claim that their
significant investments to build goodwill and brand awareness among consumers are at
risk when competitors are allowed to use their trademarks to trigger competitive
advertising online. A business that purchases a competitor’s trademark from a pay-for-
priority search engine is blatantly attempting to capitalize on the established goodwill in

Nishant Gehlot & Amit Kumar Kashyap : A Study Of Domain Name & Risk Management Of Online Business In Context Of Trademark Issues In Cyberspace
66
that mark and divert would-be customers to his site. Misappropriation of another’s
goodwill for commercial advantage is precisely what courts have sought for years to
prevent under trademark laws.
Deep Linking
Linking is a practice where the link of another website is used on its website
without permission. Sometimes the link provides access to the offsite pageand not the
home page of the owner’s site, then it is typically called a deep link. Owns of the website
have no problem generally if someone gives a link to his website, as it helps them
reaching to large customer base and get free advertising. However, when a deep link
bypasses the home page, advertisements placed on that home page get less exposure. This
has led people to argue that while most linking should be lawful, deep linking should not.
In many cases, deep linking results in loss of traffic as the visitor gets access to the
subpage which he wants and do not visit the main page. When trademarks are used in
linking to a particular website, this could lead a consumer to believe that the offending
website is related to the owner of the trademark in some way. For example, when an adult
website used the registered Playboy Bunny mark to link to the Playboy website, Playboy
sued and won a verdict in its favour.
LEGAL RISK MANAGEMENT IN ONLINE BUSINESS: TRADEMARK
CONTEXT
The Internet provides new trademark and branding opportunities for conducting
business globally and making it accessible to consumers worldwide at affordable prices.
However, the threats they pose are enormous and the general threats concerning websites
are:
1. Cross-Site Scripting (XSS)
2. Injection Flaws
3. Malicious File Execution
4. Insecure Direct Object Reference
5. Cross-Site Request Forgery (CSRF)
6. Information Leakage and Improper Error Handling
7. Broken Authentication and Session Management
8. Insecure Cryptographic Storage
9. Insecure Communications
10. Failure to Restrict URL Access
At the policy level, the legal tool currently used to battle domain name disputes at the

Indian Journal Of Business Administration (IJBA) (A National Peer Reviewed Refereed Journal) ISSN : 0975-6825, Volume 14, Issue 1, January-June 2021, pp. 61-71
67
global level are Uniform Domain name Dispute Resolution Policy (UDRP) and state
legislation on Trade Marks. For a successful business, policy and legal solutions are not
enough. Firms always strategize to avoid litigations and disputes with help of technology,
management strategies and best practices of good governance (S. Sunderland, 2010).
To counter these threats to websites some precautions could be taken. It would be
advisable if a website containing valuable content and information begins with an
opening agreement. It should inform the visitors about the nature of contents on the
websites and should legally cut off the hands of the visitors. It would be prudent to place
an undertaking on the homepage of the website. This undertaking from the online
customer would be to effect that he is entering the website out of his own choice and that
he agrees not to hold the website, its owners and administrators liable in any manner
whatsoever, in any event, or for any cause whatsoever. This is a legal precaution and
unless the online customer clicks on the button “I Accept”, he should not be allowed to
come into the site. Utilizing this, the online customer is stopped from pulling the website.
Through this, the online customer is stopped from pulling the website, its owners and
administrators into unwanted litigation. Websites must also contain terms and conditions
of use, which should detail legal and liability issues. The terms and conditions should
clarify the fact that the use of the website is at the risk and liability of the visitor and that
in case of any computer contaminant being released, the website or owners thereof will
not be responsible.
In case the website has a search facility or search engine, a specific declaration needs
to be given on the homepage. Express disclaiming statements need to be given on the
homepage. Express disclaiming statements need to be given stating that the search engine
is only spidering the web means of available technology and is not responsible either for
search results or the contents of the websites mentioned in search results. This is essential
to escape potential liability in case of unwanted litigation. In an e-commerce site, specific
jurisdiction has to be explicitly spelt out to avoid being dragged into unwanted litigation.
Adding a disclaimer to your website is essential. It won’t cover you for every
eventuality but helps to protect the corporate and restrict liability. Disclaimer is
nothing but a way of stating the terms under which people would access and use the
information, explaining the obligations of the person who makes it and that of others.
Disclaimers are sometimes called ‘Terms of Use’ and may incorporate a privacy
policy. A disclaimer thus protects against litigation. It is the sign of providing proof

Nishant Gehlot & Amit Kumar Kashyap : A Study Of Domain Name & Risk Management Of Online Business In Context Of Trademark Issues In Cyberspace
68
that you have purchased some products under international standards. The main
purpose of a disclaimer is to show that you have limited liability rights and are
responsible for the reader actions. It also includes some specifications related to the
purchased product.
Organizations are threatened with sophisticated cyber-attacks which are ever on the
increase unless suitably protected and managed to keep them under control, organizations
will be exposed to risks like data loss, failure to keep confidentiality of vital information
and will not be able to achieve business targets. In today’s environment organizations are
also required to comply with various regulations concerning information security. Unless
compliance and regulatory requirements are embedded in their process, they may have to
undergo litigations.
Further liability for the content and action arises in the case of copying of content.
This is where the issue of infringement of copyright comes in. Any and every web
containing original contents and design has inherent copyright and the same copyright
exists on the internet. Infringement of copyright gives rise to an actionable civil wrong.
There is no need to register a copyright. If your website gives links to other websites and
they open within the frame of your website, appropriate copyright disclaimers should be
given stating that the web pages the visitor intends to view are not your property and the
copyright for the same vests in the respective owners.
If one’s website is using famous trademarks/brands, it would be prudent to give
specific copyright acknowledgement that the copyright in respective trademark/brands
belongs to the respective owners. In case of infringement of copyright, one can exercise
the option for suits of permanent injunction restraining infringement and criminal
complaints. It is pertinent to note that the copyright act, 1957, is not fully equipped to
deal with newly emerging and complicated issues relating to Digital copyright. The
trademark should be registered with the relevant Registrar of trademarks.
In case the domain name is the trademark, registration of the domain name as a trademark
should be done with the concerned registrar for trademarks. In case of infringement of
trademarks, one can exercise the option for filing suit for permanent injunction
restraining the passing of goods and services and dilution of a trademark under the Trade
Marks Act, 1999. The remedy of filing a criminal complaint is also available.
Immense concerns are already prevailing concerning the protection of personal
data and information, in essence, the right to one’s privacy. The right to privacy refers to
the specific right of an individual to control the collection, use and disclosure of personal

Indian Journal Of Business Administration (IJBA) (A National Peer Reviewed Refereed Journal) ISSN : 0975-6825, Volume 14, Issue 1, January-June 2021, pp. 61-71
69
information. It, therefore, becomes very important to be careful about privacy on the net.
As an employer, it is generally felt that one should snoop over the mails sent by the
employees even of official accounts however the reporting of misuse of the official
account is a good enough ground to monitor emails of the relevant employees.
Websites should have a specific linking policy in case it provides links. The
policy should specifically state the crux of understanding or agreement with linking
websites. It should specifically state that links are purely given as a goodwill reciprocal
gesture and at no point is the website responsible for the contents of the links. It should
further be stated that the website does not seek to misappropriate the intellectual property
rights of linked websites. The linking policy should disclaim any liability for damage
caused to the online customer by the links.
Deep linking refers to the practice of linking to a web page(s) deep into another
site and passing off the content of the said web page(s) as one’s own. As far as possible,
deep linking should be avoided as various Courts of various countries have declared the
same illegal. Companies must endeavour to have a cyber law audit to find out their
compliance status of various cyber legal provisions.
CONCLUSION
With the development of science and technology, cyberspace is not only limited
to gather information and communication. Internet today has become a hub for
commercial activities. And to identify someone over this cyberspace there is a need fora
unique domain name. No two domain names can be identical because it is the address for
cyberspace. Thus, a domain name possesses high value to carry out commercial
activities. And this usage do domain name makes it vulnerable, with a little twist any
third party which does not have any legitimate interest can reap the benefits arising out of
someone hard work. Corporate organizations are, no doubt, facing various challenges but
a well-equipped organization with the awareness of cyberlaw issues and the way to
handle them would go a long way in fighting against any kind of odds.Thus legal risk
management of trademark disputes should be strategized by the start-ups and online
business organisations to avoid losses and litigations in future. Without legal and policy
changes with the emergence of critical IP issues in cyberspace, the management practice
will not get results. Thus, It is also required that the Trade Mark Act, 1999 can, and
should, be extended to provide a remedy in this arena for owners who have invested
countless hours and resources into the development of their marks.

Nishant Gehlot & Amit Kumar Kashyap : A Study Of Domain Name & Risk Management Of Online Business In Context Of Trademark Issues In Cyberspace
70
REFERENCES
• Anjana Pasricha, “Tech Startups Boom in India, Attract Big Investments”, Voice
of America News, May 06, 2015, Available at: https://www.voanews.com/east-
asia/tech-startups-boom-india-attract-big-investments
• Vakul Sharma, Information Technology Law and Practice (Universal Law
Publishing) 2nd ed. 2007
• Dawn Osborne, "ICANN procedure proves a resounding success", International
Internet Law Review, Issue 10, December 2000 / January 2001
• Shalini Agarwal, Satyendra Shrivastava, “Brief overview of Internet and E-
commerce in India, Computer and Telecommunications Law Review”, C.T.L.R.
2007, 13(7),
• D. Rodney, ‘Guide to Cyber Law (Information Technology Act,2000,E-
Commerce,Data Protection & Internet’, Wadhwa and Company, Nagpur, Third
Edition, 2007, p.240.
• Antony J. McShane and Orrin S. Shifrin Special Technology Issue “Protecting
Trademarks And Copyrights In The New Millennium” 14-APR CBA Rec. 32
• Mehrotra, Ajay K. and Halpern, Marcelo, "From International Treaties to Internet
Norms: The Evolution of International Trademark Disputes in the Internet Age"
(2000). Articles by Maurer Faculty. 288.
• https://www.repository.law.indiana.edu/facpub/288Antony J. McShane and Orrin
S. Shifrin Special Technology Issue “Protecting Trademarks And Copyrights In
The New Millennium” 14-APR CBA Rec. 32
• Jonh D Mercer, “Cyber-squatting: Blackmail on the Information Superhighway,
Boston University Journal of Science and Technology Law”, 11 (2000)
• Slahudding Ahmed, “Cyber-squatting: Pits and Stops”, ILI Law Review, 2010
• W. Reid Paul & J Gallo Winery, Understanding Basic Trademark Law, Pitman
Publishers, London, 2001, p.243.
• Slater, D., Gasser, U., Smith, M., Bambauer, D. E., & Palfrey, J. G. (2005).
Content and control: Assessing the impact of policy choices on potential online
business models in the music and film industries. Available at SSRN 654602.
• Rees, J. (2016). Protecting Your Brand in a Complicated Internet Landscape. Business
Law Today, 1-5. Retrieved July 25, 2021, from
https://www.jstor.org/stable/businesslawtoday.2016.08.07

Indian Journal Of Business Administration (IJBA) (A National Peer Reviewed Refereed Journal) ISSN : 0975-6825, Volume 14, Issue 1, January-June 2021, pp. 61-71
71
• Spinello, R. (2006). Online Brands and Trademark Conflicts: A Hegelian
Perspective. Business Ethics Quarterly, 16(3), 343-367. Retrieved July 25, 2021,
from http://www.jstor.org/stable/3857920
• Antonoy J Mcshane, Orrin S Shifrin, “Protecting Trademarks and Copyrights in
the new millennium, Chicago Bar Association Record”, Special Technology
Issue, April 2000
• Maureen A. O'Rourke, “Legal Issues on the Internet: Hyperlinking and
Framing”, D-Lib Magazine, April 1998, Available at:
https://www.dlib.org/dlib/april98/04orourke.html
• Bond, N. M. (1998). Linking and framing on the Internet: liability under
trademark and copyright law. DePaul Bus. LJ, 11, 185.
• IBEF Report, Available at: https://www.ibef.org/industry/ecommerce.aspx
• Burk, D. L. (1997). Trademark Doctrines for Global Electronic Commerce. SCL
Rev., 49, 695.
• Jennings, J. (2015). Developing Domain Name Enforcement Options. Franchise
Law Journal, 34(4), 521-534. Retrieved July 25, 2021, from
https://www.jstor.org/stable/26421580
• Reed, S. (2011). SENSIBLE AGNOSTICISM: AN UPDATED APPROACH TO
DOMAIN-NAME TRADEMARK INFRINGEMENT. Duke Law Journal, 61(1),
211-250. Retrieved July 25, 2021, from http://www.jstor.org/stable/23034815
• Wang, A. (2017). Diversifying the Domain Name Governance Framework.
Berkeley Technology Law Journal, 32(1), 137-178. Retrieved July 25, 2021, from
https://www.jstor.org/stable/26488663
• Kopp, S., & Suter, T. (2000). Trademark Strategies Online: Implications for
Intellectual Property Protection. Journal of Public Policy & Marketing, 19(1),
119-131. Retrieved July 25, 2021, from http://www.jstor.org/stable/30000492
• Sunderland, S. (2010). Domain Name Speculation: Are We Playing Whac-A-
Mole? Berkeley Technology Law Journal, 25(1), 465-492. Retrieved July 25,
2021, from http://www.jstor.org/stable/24118643
• Gilfoil, J. (2005). A Judicial Safe Harbor Under the Anti-Cybersquatting
Consumer Protection Act. Berkeley Technology Law Journal, 20(1), 185-208.
Retrieved July 25, 2021, from http://www.jstor.org/stable/24117499

Indian Journal Of Business Administration (IJBA)
(A National Peer Reviewed Refereed Journal)
ISSN : 0975-6825, Volume 14, Issue 1, January-June 2021, pp. 72-79
72
NEED OF ETHICAL ISSUES AND PRACTICE IN
BUSINESS
Dr. Ashok kumar*
Dr. Asha Rathi*
ABSTRACT
Generally, ethics refers to rightness or wrongness of an action. In other words,
it implies what must do or ought to not do. For instance- the moral issues regarding
abortion, euthanasia, giving to the poor, sex before marriage, the executing, gay/lesbian
marriage, censorship, so called “white lies”, paying bribe, cheating to the purchasers,
barren promise so on. Further, applied ethics may be a field of ethics that deals with
ethical questions in many fields, like medical, technical, legal, media, professional and
business ethics. Business ethics is one in every of the important aspects of applied ethics
that examines ethical principles and moral or ethical problems that arise in business
environment.
In other words, business ethics means the applying of ethical rules and
regulations in the field of business. It’s applied to any or all types
of business. It’s associated with the conduct of people and business organizations as an
entire. It one in all the emerging branches of philosophy generally, applied
ethics particularly. Business Ethics deals with most of the aspects of a person and his
obligations towards the shoppers, society and environment. It also affects every walks of
individuals. There are innumerable problems in business ethics. It’ll be difficult to
practice business ethics or to ask others to follow them, unless one adheres one’s
personal code of ethics. In business, how does one have ethics, after you must be cut-
throat? This can be an excellent dilemma for the businesspersons who want to
create profit only. Nothing else, only profit and profit! The researcher has
encountered some issues and challenges that are crucial and really pertinent with respect
to ethical issues in business.
KEYWORDS
Ethics, innumerable, Responsibility, Unemployment, Environment, Upliftment, Professional.
* Assistant Professor, Department of Business Administration, Jai Narain Vyas Univeristy, Jodhpur

Dr Ashok kumar & Dr Asha Rathi : Need Of Ethical Issues And Practice In Business
73
INTRODUCTION
There is one and only one social responsibility of businessto extend its profits.
What does it mean to mention that “business” has responsibilities? Only people can have
responsibilities. A company is a man-made person and during this sense may have
artificial responsibilities, but “business” as an entire can't be said to
possess responsibilities, even during this vague sense. If this statement isn't pure rhetoric,
it must mean that he must act in a way that's not within the interest of his employers. For
example, he's to refrain from increasing the value of the merchandise so as to contribute
to the social objective of preventing inflation, although an increase would be within
the best interests of the corporation. There are three approaches to guard the social
interests of man, namely, Corporate Social Responsibility (CSR), Business Ethics and
company Governance. It’s an obligation of decision-makers to require actions, which
protect and improve the welfare of society as a full together with their own interests.
Such decisions may affect environment, consumers and community.
The second approach deals with business ethics. It’s concerned with social
values that violate consumer and environmental protection. Business ethics are rules of
business conduct, by which propriety of business activities could also
be judged. It’s equally relates to the behavior and responsibilities of managers and ethical
obligations of business professionals. The third approach is corporate governance that
advocates enhancing the accountability of the board of directors to shareholders, more
transparent auditing and more responsibilities of independent directors and a division of
roles of chairperson and chief executive, etc.
IMPORTANCE OF ETHICAL VALUES IN BUSINESS
Ethical values play a big role, not just for the expansion of business, but also for
the upliftment of the living conditions of the workers. It helps the businessman to
understand where he/she committed miscalculation and provides the scope
to retrieve on the premise of ethical reasoning. Ethics and its values should go
simultaneously in any field of business. It’s said that, “to reach the highest is simple, but
to retain the position is difficult.” so as to retain the highest position in business,
one needs to adopt the core ethical values. How do the moral values help for the
expansion of business? If someone fails in an exceedingly business, he/she
will remember at the core ethical values to guide him. The moral values in business are
honesty, integrity, responsibility, quality, trust, respect, teamwork, leadership, corporate
citizenship and shareholder value. A number of the moral values of the business are

Indian Journal Of Business Administration (IJBA)
(A National Peer Reviewed Refereed Journal)
ISSN : 0975-6825, Volume 14, Issue 1, January-June 2021, pp. 72-79
74
1. Honesty:it's said that, “honesty is the best policy.” this can be true
today over ever. This can be just not a hypocrisy, but most of the firms showed their
commitment to honesty. One are often honest or not. Whether or not one has not been
caught yet, the majority know who is and who isn't.The dramatic collapse of a
number of the Fortune 500 companies like Satyam, Enron and World.com or the
well-known auditing firm Anderson showed that even successful companies could
ultimately meet with disaster, if their managers didn't practice the essential principles
of honesty. Honesty doesn't come from outside. It’s to return from inside the
organization. Business operates as a system of values regarding business goals and
techniques to fulfill specific human ends. This might mean viewing the
requirements and aspirations of people as a part of society. It also means realization
of the non-public dignity of people at large.
2. Integrity: Honesty and integrity are the two sides of the identical coin. One cannot
have honesty, without having integrity. These two (honesty and integrity) are
interdependent with one another. Integrity connotes strength and stability. It means
taking the high road by practicing the best ethical standards. Demonstrating integrity
shows completeness and soundness in one’s character and in his organization. Again,
integrity means soundness, firm adherence to a code, principles and values and
openness and honesty (i.e., transparency, accountability, and responsibility).6
Without integrity at the individual, organizational, or system level, there's no trust and
there may be no social, competitive, community or ecological sustainability nor
effective business transactions.
3. Responsibility:Blaming others, claiming victimhood or passing the buck may solve
short term crises but refusal to require responsibility erodes respect and cohesion in a
corporation. Those that practice ethics take responsibility for his or her actions.
Likewise, actions show the power to be responsible both within the little and
large things.
4. Quality:Quality plays a pivotal role in an exceedingly company’s reputation. Quality
should be quite making the simplest product but should reach every aspect of your
work. From one’s memos to one’s presentations, everything one touches should
communicate professionalism and quality. Quality business manages to draw
in customers, enhance their experience, satisfy and delight them, and generate
repurchase. Unethical conduct of service providers penalize customers, tarnish their

Dr Ashok kumar & Dr Asha Rathi : Need Of Ethical Issues And Practice In Business
75
experience, cause dissatisfaction that end in customer defection.
5. Trust: Legendary entrepreneur Warren Buffett has rightly pointed out: “Trust is just
like the air we breathe. When it's present, nobody really notices. Trust is difficult to
earn and even harder to induce back after one lost it. Trust consists of three
fundamental elements: predictability, dependability, and faith.10 Predictability tends
to eliminate surprises, which aren't usually welcome within the business environment.
Dependability provides assurance that one may be counted on to perform for sure.
Faith is the belief that one will still be predictable and dependable. The necessity for
trust arises when one faces some form of risk. Trust in an exceedingly person or a
firm is developed supported experience over time. Together gains positive experience
and develops trust in another, the perceived risk of managing the party declines. Thus
trust could be a risk-reducing mechanism.
6. Respect: Respect is over a sense, but an illustration of honour, value and reverence
for something or someone. We respect the laws, the people we work with, the
corporate and its assets and ourselves. It’s said that, “Courtesy pays nothing, but gains
much.” Everyone within the organization should pay respect towards one another.
As a pacesetter of the group, one must improve attitudes, so as to induce respect. A
person’s attitude can have a robust influence on the attitudes of others who is
also around him/her. This is often especially evident when people are involved during
a team effort. You’ve got probably experienced the sensation you get when someone
causes a positive change within the attitudes of a bunch.
7. Teamwork:it's not finance, strategy and technology. Teamwork remains the final
word competitive advantage because it's so powerful so rare. Can one think
about oneself performing on a project alone within the office and nobody out there to
support and assist you? Obviously not! We all like to be a part of a team and
achieve things through teamwork. Teamwork may be defined as an activity or a
group of inter-related activities done by over one person so as to realize a
standard objective. Teamwork isn't followed only within the corporate world today;
rather it's one in all the oldest things known to man.
ETHICAL CHALLENGES IN BUSINESS
The world of globalization, commercialization and liberalization has opened a
flood of ethical and unprecedented challenges in business. The moral challenges have
a profound impact on their well being, dynamics, performance and also the sort
of their survival. So as to attain success at the national and international level in

Indian Journal Of Business Administration (IJBA)
(A National Peer Reviewed Refereed Journal)
ISSN : 0975-6825, Volume 14, Issue 1, January-June 2021, pp. 72-79
76
business seems to be a frightening challenge. The researcher has tried his best to
debate the challenges that are crucial in business. A number of the challenges are:
1. The Challenge of Ethical Behavior:Ethics plays a pivotal role in business. The
importance of ethics in business shouldn't be neglected or overlooked. It seems to be
quite surprising that ethical behavior occurs in organizations. An efficient ethical
atmosphere can promote ethical business. Although ethical behavior may cost
initiatially, but within the long-run it pays.
2. The Challenge of Managing a Diverse Workforce:The challenge of
managing various workforces is the second ethical challenge in business. This is
often one amongst the very prominent challenges in business. The concept of
globalization has opened doors for various people from diverse cultures, beliefs, and
backgrounds than ever before across the planet to figure at one place. That’s why;
profit and nonprofit organizations need diversity to become more creative
and receptive change. Maximizing and capitalizing on workplace diversity has
become a vital issue for management today. Diversity is defined as acknowledging,
understanding, accepting, valuing, and celebrating differences among people
with reference to age, class, ethnicity, caste, creed, race, gender, physical and power,
sexual orientation, spiritual practice, and public assistance status.31 Since India may
be a secular state, Indian companies are specializing in diversity quite ever. They
need to specialize in diversity and appearance for methods to become totally inclusive
organizations because diversity has the potential of yielding greater productivity and
competitive advantages. India particularly and also the world generally simply cannot
ignore diversity.
3. The Challenge of New Technologies:this can be the third ethical challenge in
business. Business isn't any more confined to a specific area, customer and face-to-
face business. In the 21st century, business can be done through innovative
technologies; computer, internet and e-business have gained plenty of
importance nowadays. Technological innovations have brought in immense changes
to manufacturing, transport and communications, information and knowledge
management, pharmaceuticals and biotechnology, banking and financial management
and to a number of other spheres. The impact of those innovations on business and
industry, as in other walks of life, is immeasurable. Business and
trade became global. The globe itself has become as small on be called the

Dr Ashok kumar & Dr Asha Rathi : Need Of Ethical Issues And Practice In Business
77
world village. During this fast changing environment- social, political, economic and
governmental- corporations must adapt themselves faster, reckon competition
and figure out successful survival strategies.
4. The Challenge of Increased Quality:Quality plays a key role in an
exceedingly company’s reputation. Quality should be quite making the most
effective product but should reach every aspect of your work. Someone who
recognizes quality and strives for it daily incorporates a profound sense of self
respect, pride in accomplishment and attentiveness that affects everything. From
one’s memos to presentations, everything one touches should communicate
professionalism and quality. Quality business manages to draw in customers, enhance
their experience, satisfy and delight them, and generate repurchase. Therefore, most
companies have an interest to boost quality of their products and services through
“Total Quality Management” (TQM). TQM approach focuses on trying to
fulfill customer expectations or delighting the customer. All quality improvement
initiatives must begin with an understanding of customer perceptions and desires.
TQM is an organizational strategy with techniques that deliver quality products and
services to customers and achieves total customer satisfaction. It should be a
customer, which comes back and not the merchandise.
5. The Challenge of Employee Motivation and Commitment:this is often the fifth
ethical challenge in business. This challenge is taken into account to be the backbone
of any quite business. So as to succeed, as a manager or supervisor of a corporation,
one should motivate the staff. It’s possible to create their day or break their day. The
word “motivation” has come from the Latin word “movere”, which implies “to
move”. Hence a motive, quite simply, are some things that moves one to act.
Characteristically these words “motive” or “motivation”, however, suggest that
something within oneself is at work, impelling or driving him forward. It should be a
desire, desire or emotion, but it leads one to act and to act during a certain way.
Abraham Maslow39 has identified five sets of need, which are important to
motivate the workers of a company. In keeping with Maslow, a key principle is that a
satisfied need ceases to motivate. If a person’s physiological needs are met, for
instance, other needs emerge and supersede them in becoming the dominating
ones within the organism. When these successively are satisfied, yet higher needs
emerge, and so on. This can be what Maslow meant by asserting that the
essential human needs is organized into a hierarchy of relative prepotency.

Indian Journal Of Business Administration (IJBA)
(A National Peer Reviewed Refereed Journal)
ISSN : 0975-6825, Volume 14, Issue 1, January-June 2021, pp. 72-79
78
CONCLUSION
Ethics plays a cardinal role in business. In other words, it pays to be
ethical. A matter is often raised, if ethics really matters in business, then what's the
longer term of business ethics. So as to answer this typical question, there are two
approaches, namely, optimistic and pessimistic. The optimistic approach discloses
that ethics needs to play a dominant role in business. Those that have practiced
unethical/unfair means in business, they need never succeeded. Additionally, they'd to
pay the worth for it.
The company leaders were apologized and repented for his or
her misdeeds. a replacement commitment to moral management will cause many
leading executives to leap forward and demonstrate ethical leadership and
statesmanship, and therefore the world are going to be encouraged by those new
found expressions of integrity and transparency. At some point or other, the general
public will have a point of trust on business and economic process will return. The
pessimistic approach unfolds that business will never learn its lessons. This scenario
of business is gloomy and unpredictable.
Business leaders will shirk responsibility and society will have a tough time
holding decision makers accountable. Many companies are looking to chop corners so
as to realize profit due to fierce global competition, slacking demand and therefore
the pressure of cut. Under these harsh economic conditions, the chance of ethical
behavior is extremely questionable and doubtful. This ends up in further unethical
practices to stay companies afloat. Therefore, the long run of business ethics looks
gloomy. Out of those two (optimistic and pessimistic) approaches, the scholar
advocates former one. We’d like to be positive. Therefore, the scholar predicts
that the longer term of business ethics is bright and prosperous.
REFERENCES
1. Aswathappa, K. (2009): International Business (third edition), Tata McGraw Hill
Education Private Limited, New Delhi.
2. Ghosh, Biswanath. (2008): Ethics in Management and Indian Ethos, Second Edition,
Vikas Publishing House Pvt Ltd., New Delhi.
3. Gupta, D. (2006): Ethics Incorporated: Top Priority and Bottom Line, Response
Books, New Delhi.
4. Kiran, D.R. (2007): Professional Ethics and Human Values, Tata McGrawHill, New

Dr Ashok kumar & Dr Asha Rathi : Need Of Ethical Issues And Practice In Business
79
Delhi.
5. Murray, D. (2005): Ethics in Organisations, Crest Publishing House, New Delhi.
6. Pareek, V. (2006): Organizational Behaviour processes, Rawat Publications, Jaipur.
7. Prahalad, C. K. (2005): The Fortune at the Bottom of the Pyramid, Wharton School
Publishing, New Jersey.
8. Raju, MS and D. Xardel (2009): Consumer Behaviour: Concepts, Applications and
Cases, Vikas Publishing House Pvt. Ltd., New Delhi.
9. Sharma, J.K. (2002): Ethics for Journalism in Transition, Authors press, New Delhi.
10. Singh, M. (2001): A Text Book of Moral and Ethical Values (part-11), Harvinder M.
Singh, Chandigarh.

Indian Journal Of Business Administration (IJBA) (A National Peer Reviewed Refereed Journal) ISSN : 0975-6825, Volume 14, Issue 1, January-June 2021, pp. 80-104
80
DIRECTION OF INDIA’S EXPORTS
Dr. MATHANRAJ. T*
SARANYA.C**
ABSTRACT
Exports of a country plays a vital role in the growth of an economy. The
development of this sector is an indicator of the economic strength of a country. It helps
in raising productivity, generating employment and also supports other sectors of the
Indian economy.(i) To analyze the trends and growth rate of Direction of India’s Exports
during 1991-92 to 2016-17.(ii) To study the growth performance of India’s Export
toIndia’s Export to Various Regional Groups.(iii) To identify the India’s Export to
OPEC, OECD, EU, Developing countries, SAARC and African countries. The present
study is based upon the time series secondary data collected from various published
sources of Government Agencies from Directorate General of Commercial Intelligence
and Statistics, Handbook of Statistics on Indian economy, Reserve Bank of India (RBI),
Govt. of India. The analysis was done by the use of SPSS and Excel. The data were
analyzed using descriptive statistics such as tables. Similarly, an attempt is made in this
part to present collected data through line graph, bar diagram. Linear Model has been
applied to analyze the trends and growth rate of Direction of India’s Exports. Semi Log
Model and Compound Growth Rate has been applied study the trends and growth rate of
India’s Export to Various Regional Groups From 1991-92 to 2016-17.
Keywords: India’s Exports, Linear Model, Semi Log Model.
INTRODUCTION
Foreign trade occupied an important place in any economy and its role in the world
economy has increased over the past 69 years. (Paul Krugman, 1999). It is very crucial for
* Researcher, Department of Economics, Scott Christian College (Autonomous), Nagercoil-629003 Affiliated to
ManonmaniamSundaranar University, Tirunelveli-12, Tamil Nadu, India
** Research Scholar, Department of Economics, Scott Christian College (Autonomous), Nagercoil- 629003, Affiliated
to ManonmaniamSundaranar University, Tirunelveli-12, Tamil Nadu, India Email id: [email protected]
Dr. Mathanraj. T & Saranya.C : Direction of India’s Exports
81
a country’s economic development as it has made an increasingly significant contribution
to economic growth and substantially to the economic welfare of the people. The foreign
trade of a country consists of inward and outward movement of goods and services,
which results into outflow and inflow of foreign exchange from one country to another
country. No country in the world possesses the adequate facilities for economical
production of all the goods and services that are consumed by its people. This implies
that no country is self-sufficient in the sense that no country can produce all the goods
that it needs. Hence, the need to trade with each other arises. Economies of scale and
international specialization which is also the fruits of scientific and technological
progress in the world would become more easily accessible through foreign trade
(Agarwal, 1975). Developing countries need more goods to feed a rapidly growing
population. Exports can be a leading sector in growth. It clearly implies that increased
earnings from higher marketability of a country's commodities in the international market
would stimulate the indigenous industrial activity within the country. This in turn brings
many distinct benefits, viz., greater utilization of resources, larger employment
opportunities, more foreign exchange, etc. It was thus considered that foreign trade would
make an impressive contribution to a country's development; hence it is considered to be
not simply a device for achieving productive efficiency; but also, an engine of growth.
International trade has now become a vital part of development strategy and it can be an
effective instrument of economic growth, employment generation and poverty alleviation
in an economy.Export plays a substantial role in the economic development of all the
developed and developing economies. With the growth of international organizations like
WTO, UNCTAD, ASEAN, etc., world trade is growing at a very fast rate.Direction of
trade means a study of the countries to whom the exports are made and from whom the
imports are made.This paper has discussedtrends and growth rate of direction of India’s
exports during 1991-92 to 2016-17.
SIGNIFICANCE FOR THE STUDY
International trade is the engine of economic growth in any country. Following
the liberalization of Indian economy in 1991, exports and imports of India have been
growing tremendously. But the value of imports is still larger than the value of exports
Thus there is a need to boost the growth rate of India. Export is very important for the
growth of economy as it leads to the gaining of foreign exchange which helps in the
growth of the economy. More growth of the economy leads to more prosperous
nation.The study brings into light the trends and growth rate of direction of India’s
exports.At present, global trade is a vital part of development approach and it can be

Indian Journal Of Business Administration (IJBA) (A National Peer Reviewed Refereed Journal) ISSN : 0975-6825, Volume 14, Issue 1, January-June 2021, pp. 80-104
82
valuable instrument of poverty reduction create more employment, increases output,
earns foreign currency, financial development, and mobilizes of domestic resources and
saving optimally so that the economic benefits reach to the wider group of people
(Mathanraj.T 2019). It would be helpful for the policymaker to enact suitable policies for
encouraging trade. This study will also be helpful for the upcoming researcher in the field
of International economics.
OBJECTIVES OF THE STUDY
To analyze the trends and growth rate of direction of India’s exports during 1991-
92 to 2016-17.
To study the growth performance of India’s Export toIndia’s Export to Various
Regional Groups.
To identify the India’s Export to OPEC, OECD, EU, Developing countries,
SAARC and African countries.
RESEARCH METHODOLOGY
The present study is based upon the time series secondary data collected from
various published sources of Government Agenciesfrom Directorate General of
Commercial Intelligence and Statistics, Handbook of Statistics on Indian economy,
Reserve Bank of India (RBI), Govt. of India. The analysis was done by the use of SPSS
and Excel. The data were analyzed using descriptive statistics such as tables. Similarly,
an attempt is made in this part to present collected data through line graph, bar diagram.
Linear Model has been applied to analyze the trends and growth rate of Direction of
India’s Exports. Semi Log Model and Compound Growth Rate has been applied study the
trends and growth rate of India’s Export to various regional groups from 1991-92 to
2016-17.
TOOLS OF USED THE STUDY
. The researcher had analyzed the collected data with the basic objectives of the
study in mind. Some of the tools involved in the study include
1. Linear model
2. Semi-log Model and compound growth rate
3. ‘T’ test
LINEAR MODEL
Further the researcher has used percentage and the simple linear growth rate model. The
linear growth rate model
Y= a+bt

Dr. Mathanraj. T & Saranya.C : Direction of India’s Exports
83
Where, Y - Dependent variable, T – Time, ‘a’ and ‘b’ are the parameters. The linear
growth rate is obtained from the ‘b’ value.
SEMI LOG MODEL AND COMPOUND GROWTH RATE
Further the researcher has used the Semi log model, in order to compute the
Instantaneous Growth Rate and the Compounded Annual Growth Rate (CAGR) the
Semi-log is used and was computed using the following models.
If Y, = Variable at time t and Yt= initial year value of the variable, simple
compounding is explained as
logY=a+bt
CGR= (Anti log b-1)100
‘T’TEST
b1 – b2
t = -----------------------
(S.E. b1)2 + (S.E. b2)2
Here b1 represented the slope coefficient obtained in the regression model, which
was estimated for the study period and b2 was the slope coefficient obtained in the
regression model estimated for the study period S.E. is the standard error.
DIRECTION OF INDIA’S EXPORTS
The direction of exports refers to the various regional groups and commodity-
wise India’s export. This chapter examines the various groups, OPEC countries (Oil
Producing and Exporting countries), OECD countries (Organization for Economic Co-
operation and Development), European Union countries (EU), Asia and Oceania
countries, North America countries, Developing countries, SAARC countries (South
Asian Association for Regional Co-operation), other Asian developing countries and
African countries in exports from India.
TABLE NO.1.1INDIA’S EXPORT TO VARIOUS REGIONAL GROUPS FROM
1991-92 TO 2016-17(US$ Million)
Countries 1991-
92 1995-96 2000-01 2005-06 2010-11 2015-16 2016-17
OPEC
Countries 1561.8 3079 4850 15242.2 47812.1 46236 45309.9
OECD
Countries 10337 17705.1 23473.6 45836.9 83448.3 101102.5 104930.6

Indian Journal Of Business Administration (IJBA) (A National Peer Reviewed Refereed Journal) ISSN : 0975-6825, Volume 14, Issue 1, January-June 2021, pp. 80-104
84
Eastern
Europe 1952.7 1340 1317.8 1980.4 2715.9 2438.5 2820.2
Developing
Countries 3587.1 9198.4 13012.6 39736.4 101730 109171 120216.2
Source: Directorate General of Commercial Intelligence and Statistics (DGCI&S)
The Table No.1.1 shows that India’s export to developing countries has increased from $3,587.1 million US dollar in 1991-92 to $39,736.4 million US dollar in 2005-06 and $1, 20,216.2 million US dollar in 2016-17. India’s export to OECD Countries has increased from $10,337 million US dollar in 1991-92 to $45836.9 million US dollar in 2005-06 then to $1, 04,930.6 million US dollar in 2016-17. India’s export of OPEC has increased from $1,561.8 million US dollar in 1991-92 to $47812.1 million US dollar in 2010-11 finally decreased to $45,309.9 million US dollar in 2016-17. India’s export of Eastern Europe has declined from $1952.7 million US dollar in 1991-92 to $1,317.8 million US dollar in 2000-01 then improved to $2715.9 million US dollar in 2010-11 and finally to $2,820.2 million US dollar in 2016-17.
TABLE NO.1.2. TREND AND GROWTH RATE OF INDIA’S EXPORT TO
VARIOUS REGIONAL GROUP DURING 1991-92 TO 2016-17
Variable Linear Model Semi log Model CG
R a b t R2 a b t R2
OPEC
26822.60
(37671.7
4)
4912.79
(2439.3
3)
2.014 0.14
5
7.047
(0.236
)
0.175
(0.015
)
11.48
9
0.84
6 19.2
OECD
Countries
-
11309.37
(4807.47)
4512.29
(311.29)
14.49
5
0.89
7
9.125
(0.057
)
0.103
(0.004
)
28.04
7
0.97
0 10.9
Eastern
Europe
665.668
(214.82)
97.663
(13.910) 7.021
0.65
9
6.811
(0.100
)
0.051
(0.006
)
7.781 0.70
4 5.2
Developin
g
Countries
29190.83
(7873.47)
5953.30
(509.82)
11.67
7
0.85
0
8.116
(0.097
)
0.157
(0.006
)
24.89
4
0.96
3 17.0
Source: Calculated by the researcher (Figures in bracket indicate Standard Error)
It is found from Table No.1.2 that the t values of the trend co-efficient were found
to be statistically significant at one per cent level. The R2 values were also found to be
satisfactory. Among the India’s export to various regional group countries, Developing

Dr. Mathanraj. T & Saranya.C : Direction of India’s Exports
85
Countries had highest annual average export value of US $5953.30 million per year.
OPEC held the second largest annual average export value of US $4912.79 million per
annum. The third rank was secured by OECD which had the average annual export value
of US $4512.29 million per annum and Eastern Europe had the lowest annual average
export value of US $97.66 million per year. As far as the growth rate of the exports of
various regional groups exporting countries was concerned, OPEC had the top most
growth rate of 17.5 per cent per year; developing countries had the second largest export
growth rate of 15.7 per cent per year. The third place was secured by OECD which had
the export growth rate of 10.3 per cent per year. The lowest export growth rates were
witnessed in Eastern Europe which has 5.1 per cent per annum.Regarding the compound
growth rate of exports were concerned, OPEC had the highest compound growth rate of
19.2 per cent per annum and Eastern Europe had the lowest compound growth rate of 5.2
per cent per annum.
TABLE NO.1.3. INDIA’S EXPORT TO OPEC COUNTRIES FROM 1991-92 TO
2016-17(US$ Million)
Countries 1991-92 1995-96 2000-01 2005-06 2010-11 2015-16 2016-17
Iran 122.5 155.0 227.0 1188.3 2488.3 2776.8 2392.3
Iraq 0.0 0.6 84.0 155.9 674.9 999.8 1115.7
Kuwait 52.3 135.5 199.1 513.7 1854.0 1245.4 1494.2
Saudi Arabia 351.3 482.3 822.9 1809.8 4674.1 6385.7 5136.3
UAE 738.5 1428.3 2597.5 8591.8 33770.3 30295.5 31233.6
Eastern Europe 1952.7 1340.0 1317.8 1980.4 2715.9 2438.5 2820.2
Russia 1640.0 1045.0 889.0 733.1 1691.4 1593.3 1931.7
OPEC 1561.8 3079 4850.0 15242.2 47812.1 46236.0 45309.9
Source: Directorate General of Commercial Intelligence and Statistics
The Table No.1.3 reveals among the OPEC countries, UAE went up from $738.5
million US dollar in 1991-92 to $8,591.8 million US dollar in 2005-06 and $31,233.6
million US dollar in 2016-17. India’s export to Saudi Arabia improved from $351.3
million US dollar in 1991-92 then gradually increased to $6,385.7 million US dollar in
2015-16 and finally fell down to $5,136.3 million US dollar in 2016-17. India’s export to
Iran increased from $1, 22.5 million US dollar in 1991-92 to $1,188.3 million US dollar
in 2005-06 and $2,392.3 million US dollar in 2016-17. India’s export to Iraq increased
from $0.0 million US dollar in 1991-92 to $155.9 million US dollar in 2005-06 and it
reached to $1,115.7 million US dollar in 2016-17.
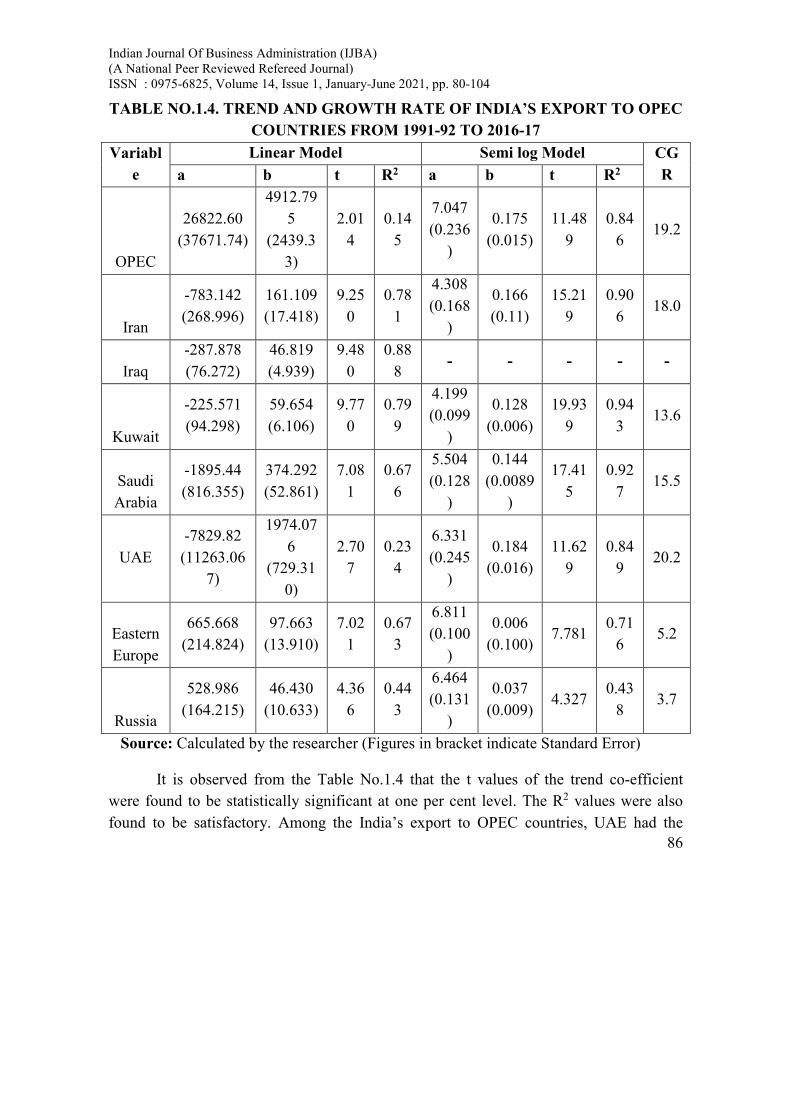
Indian Journal Of Business Administration (IJBA) (A National Peer Reviewed Refereed Journal) ISSN : 0975-6825, Volume 14, Issue 1, January-June 2021, pp. 80-104
86
TABLE NO.1.4. TREND AND GROWTH RATE OF INDIA’S EXPORT TO OPEC
COUNTRIES FROM 1991-92 TO 2016-17
Variabl
e
Linear Model Semi log Model CG
R a b t R2 a b t R2
OPEC
26822.60
(37671.74)
4912.79
5
(2439.3
3)
2.01
4
0.14
5
7.047
(0.236
)
0.175
(0.015)
11.48
9
0.84
6 19.2
Iran
-783.142
(268.996)
161.109
(17.418)
9.25
0
0.78
1
4.308
(0.168
)
0.166
(0.11)
15.21
9
0.90
6 18.0
Iraq
-287.878
(76.272)
46.819
(4.939)
9.48
0
0.88
8 - - - - -
Kuwait
-225.571
(94.298)
59.654
(6.106)
9.77
0
0.79
9
4.199
(0.099
)
0.128
(0.006)
19.93
9
0.94
3 13.6
Saudi
Arabia
-1895.44
(816.355)
374.292
(52.861)
7.08
1
0.67
6
5.504
(0.128
)
0.144
(0.0089
)
17.41
5
0.92
7 15.5
UAE
-7829.82
(11263.06
7)
1974.07
6
(729.31
0)
2.70
7
0.23
4
6.331
(0.245
)
0.184
(0.016)
11.62
9
0.84
9 20.2
Eastern
Europe
665.668
(214.824)
97.663
(13.910)
7.02
1
0.67
3
6.811
(0.100
)
0.006
(0.100) 7.781
0.71
6 5.2
Russia
528.986
(164.215)
46.430
(10.633)
4.36
6
0.44
3
6.464
(0.131
)
0.037
(0.009) 4.327
0.43
8 3.7
Source: Calculated by the researcher (Figures in bracket indicate Standard Error)
It is observed from the Table No.1.4 that the t values of the trend co-efficient
were found to be statistically significant at one per cent level. The R2 values were also
found to be satisfactory. Among the India’s export to OPEC countries, UAE had the

Dr. Mathanraj. T & Saranya.C : Direction of India’s Exports
87
highest annual average export value of US $1,974.07 million per year. Saudi Arabia held
the second largest annual average export value of US $374.29 million per annum. The
third rank was secured by Iran which had the average annual export value of US $161.10
million per year followed by Kuwait (US $59.65 million) per annum. Iraq had the lowest
annual average export value of US $ 46.81 million per year. As far as the growth rate of
the exports of OPEC countries was concerned, UAE has the topmost growth rate of 18.4
per cent per year, Iran had the second largest export growth rate of 16.6 per cent per year,
and Saudi Arabia held the third place in export growth rate of 14.4 per cent per year. The
lowest export growth rate was witnessed in Kuwait which had 12.8 per cent per
annum.Regarding the compound growth rate of exports, UAE had the highest compound
growth rate of 20.2 per cent per annum. Kuwait had the lowest compound growth rate of
13.6 per cent per year.
TABLE NO.1.5. INDIA’S EXPORT TO OECD COUNTRIES FROM 1991-92 TO
2016-17(US$ Million)
Countries 1991-
92
1995-
96
2000-
01
2005-
06
2010-
11
2015-
16
2016-
17
OECD Countries 10337 17705 23473 45836 83448 101102 104930
European Union 4826 8708 10410 22385 46123 44726 47599
North America 3109 5825 9961 18374 26634 42452 44322
Asia and Oceania 1878 2651 2263 3444 6991 8238 7128
Other OECD 522 519 837 1632 3638 5685 5880
Source: Directorate General of Commercial Intelligence and Statistics
From the Table No.1.5 that the OECD countries from, 1991-92 to 2016-17
European Union increased from $4,826 million US dollar in 1991-92 to $22,385
million US dollar in 2005-06 and $47,599 million US dollar in 2016-17. India’s export
to North America accelerated from $3,109 million US dollar in 1991-92 to $26,634
million US dollar in 2010-11 and $44,322 million US dollar in 2016-17. India’s export
to Asia and Oceania increased from $1,878 million US dollar in 1991-92 to $3,444
million US dollar in 2005-06 then to $7,128 million US dollar in 2016-17. India’s
export to other OECD countries improved from $522 million US dollar in 1991-92 to
$5,685 million US dollar in 2015-16 and finally reached to $5880 million US dollar in
2016-17.

Indian Journal Of Business Administration (IJBA) (A National Peer Reviewed Refereed Journal) ISSN : 0975-6825, Volume 14, Issue 1, January-June 2021, pp. 80-104
88
TABLE NO.1.6. TREND AND GROWTH RATE OF INDIA’S EXPORT TO
OECD COUNTRIES
FROM 1991-92 TO 2016-17
Variabl
e
Linear Model Semi log Model CG
R a b t R2 a b t R2
OECD
Countrie
s
11309.37
1
(4807.47
2)
4512.29
0
(311.295
)
14.49
5
0.89
7
9.125
(0.057
)
0.103
(0.004
)
28.04
7
0.97
0 10.9
Europea
n Union
-
5483.314
(2545.63
1)
2199.01
2
(164.836
)
13.34
1
0.88
1
8.350
(0.078
)
0.106
(0.005
)
20.95
1
0.94
8 11.2
North
America
-
4892.714
(1830.05
3)
1752.61
0
(118.500
)
14.79
0
0.90
1
8.081
(0.041
)
0.108
(0.003
)
40.47
6
0.98
6 11.4
Asia and
Oceania
152.474
(513.962)
308.925
(33.280) 9.283
0.78
2
7.245
(0.093
)
0.071
(0.006
)
11.69
1
0.85
1 7.3
Other
OECD
-
1084.526
(397.264)
251.477
(25.724) 9.776
0.79
9
5.730
(0.111
)
0.118
(0.007
)
16.39
8
0.91
8 12.5
Source: Calculated by the researcher (Figures in bracket indicate Standard Error)
Table No.1.6 depicts that the t values of the trend co-efficient were found to be
statistically significant at one per cent level. The R2 values were also found to be
satisfactory. Among the India’s export to OECD countries, European Union had the
highest annual average export value of US $2,199.01 million per year; North America
had the second largest annual average export value of US $1,752.61 million per annum.
The third rank was secured by Asia and Oceania which had the average annual export
value of US $308.92 million per year. Other OECD had the lowest annual average export

Dr. Mathanraj. T & Saranya.C : Direction of India’s Exports
89
value of US $251.47million per year. As far as the growth rate of the exports of OECD
countries concerned, other OECD had the topmost growth rate of 11.8 per cent per year,
North America had the second largest export growth rate of 10.8 per cent per year,
European Union held the third place in export growth rate of 10.6 per cent per year. The
lowest export growth rate was witnessed in Asia and Oceania which had 7.1per cent per
annum. Regarding the compound growth rate of exports, other OECD had the highest
compound growth rate of 12.5 per cent per annum and Asia and Oceania had the lowest
compound growth rate of 7.3 per cent per year.
TABLE NO.1.7. INDIA’S EXPORT TO EUROPEAN UNION FROM 1991-92 TO
2016-17(US$ Million)
Countries 1991-92 1995-96 2000-01 2005-06 2010-11 2015-16 2016-17
Belgium 666 1120 1470 2871 5782 5091 5664
France 425 747 1020 2079 5199 4635 5375
Germany 1269 1977 1907 3586 6745 7110 7243
Italy 580 1014 1308 2519 4543 4224 4944
Netherlands 372 769 880 2474 7674 4731 5057
UK 1138 2010 2298 5059 7307 8863 8576
E Union 4826 8708 10410 22385 46123 44726 47599
Source: Directorate General of Commercial Intelligence and Statistics
The Table No.1.7 reveals that the export to, UK increased from $1,138 million US
dollar in 1991-92 to $5,059 million US dollar in 2005-06 then to $8,576 million US
dollar in 2016-17. India’s export to Germany has improved from $1,269 million US
dollar in 1991-92 to $6,745 million US dollar in 2010-11 and $7,243 million US dollar in
2016-17. India’s export to Belgium accelerated from $666 million US dollar in 1991-92
to $5,091million US dollar in to $5,664 million US dollar in 2016-17. India’s export to
Italy enlarged from $580 million US dollar in 1991-92 to $1,308 million US dollar in and
it reached to $4, 944 million US dollar in 2016-17.

Indian Journal Of Business Administration (IJBA) (A National Peer Reviewed Refereed Journal) ISSN : 0975-6825, Volume 14, Issue 1, January-June 2021, pp. 80-104
90
TABLE NO.1.8. TREND AND GROWTH RATE OF INDIA’S EXPORT TO
EUROPEAN UNION
FROM 1991-92 TO 2016-17
Variable Linear Model Semi log Model CG
R a b t R2 A b t R2
Belgium -419.144
(318.495)
252.965
(20.623)
12.26
6
0.86
2
6.418
(0.075
)
0.098
(0.005
)
20.23
5
0.94
5 10.3
France -719.506
(265.566)
225.110
(17.196)
13.09
1
0.87
7
5.876
(0.067
)
0.113
(0.004
)
26.11
4
0.96
6 12.0
Germany -114.197
(368.617)
299.874
(23.869)
12.56
3
0.86
8
6.982
(0.078
)
0.081
(0.005
)
16.10
1
0.91
5 8.5
Italy -286.149
(213.537)
209.989
(13.827)
15.18
7
0.90
6
6.279
(0.075
)
0.097
(0.005
)
20.07
8
0.94
4 10.2
Netherlan
ds
-
1370.601
(720.071)
346.119
(46.626) 7.423
0.69
7
5.750
(0.153
)
0.135
(0.010
)
13.61
5
0.88
5 14.4
UK -478.359
(374.829)
378.575
(24.271)
15.59
8
0.91
0
6.955
(0.067
)
0.092
(0.004
)
21.27
3
0.95
0 9.7
E Union
-
5483.314
(2545.63
1)
2199.01
2
(164.83
6)
13.34
1
0.88
1
8.350
(0.078
)
0.106
(0.005
)
20.95
1
0.94
8 11.2
Source: Calculated by the researcher (Figures in bracket indicate Standard Error)
From the above Table No.1.8 it could be known that the t values of the trend co-
efficient were found to be statistically significant at one per cent level. The R2 values
were also found to be satisfactory. Among the India’s export to European Union
countries, UK had the highest annual average export value of US $378.57 million per
year. Netherlands had the second largest annual average export value of US $ 346.11

Dr. Mathanraj. T & Saranya.C : Direction of India’s Exports
91
million per annum. The third rank was secured by Germany which has the average annual
export value of US $299.87 million per year followed by Belgium (US $252.96 million),
France (US $225.11 million) per annum. Italy had the lowest annual average export value
of US $ 209.98 million per year.As far as the growth rate of the exports of European
Union exporting countries concerned, Netherlands had the topmost growth rate of 13.5
per cent per year, France has the second largest export growth rate of 11.3 per cent per
year, and Belgium held the third place in export growth rate of 9.8 per cent per year. The
lowest export growth rate was witnessed in Germany which had 8.1 per cent per
annum.Regarding the compound growth rate of exports, Netherlands had the highest
compound growth rate of 14.4 per cent per annum. Germany had the lowest compound
growth rate of 8.5 per cent per year.
TABLE NO.1.9. INDIA’S EXPORT TOASIA AND OCEANIA FROM 1991-92 TO
2016-17 (US$ Million)
Countries 1991-92 1995-96 2000-01 2005-06 2010-11 2015-16 2016-17
Australia 202 375 405 821 1712 3268 2964
Japan 1651 2215 1794 2481 5088 4662 3853
Asia and
Oceania 1878 2651 2263 3444 6991 8238 7128
Source: Directorate General of Commercial Intelligence and Statistics
The Table No.1.9 gives an idea that the Asia and Oceania countries, Japan
improved from $1,651million US dollar in 1991-92 to $2,215 million US dollar in 1995-
96 then declined to $1,794 million US dollar in 2000-01, again increased to $5,088
million US dollar in 2010-11 and finally decelerated to $3,853 million US dollar in 2016-
17. India’s export to Australia increased from $202 million US dollar in 1991-92 to $821
million US dollar in 2005-06 and to $2,964 million US dollar in 2016-17.
TABLE NO.1.10. TREND AND GROWTH RATE OF INDIA’S EXPORT TO
ASIA AND OCEANIA FROM DURING 1991-92 TO 2016-17
Variabl
e
Linear Model Semi log Model CG
R A b t R2 a b t R2
Australi
a
-448.043
(161.487
)
117.331
(10.457
)
11.22
1
0.84
0
5.128
(0.074
)
0.114
(0.005
)
23.90
3
0.96
0 12.1
Japan 622.430
(399.762
179.303
(25.8866.927
0.66
7
7.129
(0.105
0.056
(0.0078.337
0.74
3 5.8

Indian Journal Of Business Administration (IJBA) (A National Peer Reviewed Refereed Journal) ISSN : 0975-6825, Volume 14, Issue 1, January-June 2021, pp. 80-104
92
) ) ) )
Asia and
Oceania
152.474
(513.962
)
308.925
(33.280
)
9.283 0.78
2
7.245
(0.093
)
0.071
(0.006
)
11.69
1
0.85
1 7.3
Source: Calculated by the researcher (Figures in bracket indicate Standard Error)
From the above Table No.1.10 it could be known that the t values of the trend co-
efficient were found to be statistically significant at one per cent level. The R2 values
were also found to be satisfactory. Among the India’s export to Asia and Oceania
countries, Japan had the highest annual average export value of US $179.30 million per
year; Australia had the lowest annual average export value of US $117.33 million per
year.As far as the growth rate of the exports of Asia and Oceania exporting countries
concerned, Australia had the topmost growth rate of 11.4 per cent per year. The lowest
export growth rate was witnessed in Japan which had 5.6 per cent per annum.Regarding
the compound growth rate of exports, Australia had the highest compound growth rate of
12.1 per cent per annum. Japan had the lowest compound growth rate of 5.8 per cent per
year.
TABLE NO.1.11. INDIA’S EXPORT TO NORTH AMERICA FROM 1991-92 TO
2016-17(US$ Million)
Countries 1991-92 1995-96 2000-01
2005-
06 2010-11 2015-16
2016-
17
Canada 188 305 656 1021 1347 2057 2008
USA 2921 5520 9305 17353 25286 40394 42314
North
America 3109 5825 9961 18374 26634 42452 44322
Source: Directorate General of Commercial Intelligence and Statistics
It is observed that the Table No. 1.11 reveals that the North America countries from
USA accelerated from $2,921 million US dollar in 1991-92 to $25,286 million US dollar
in 2010-11 and to $42,314 million US dollar in 2016-17.India’s export to Canada
improved from $188 million US dollar in 1991-92 to $1,021 million US dollar in and
finally to $2,008 million US dollar in 2016-17.

Dr. Mathanraj. T & Saranya.C : Direction of India’s Exports
93
TABLE NO.1.12. TREND AND GROWTH RATE OF INDIA’S EXPORT TO
NORTH AMERICA FROM 1991-92 TO 2016-17
Variabl
e
Linear Model Semi log Model CG
R a b t R2 a b t R2
Canada -157.638
(77.459)
86.381
(5.016)
17.22
2
0.92
5
5.263
(0.058
)
0.103
(0.004
)
27.31
6
0.96
9 10.8
USA
-4735.106
(1760.528
)
1666.23
1
(113.998
)
14.61
6
0.89
9
8.019
(0.041
)
0.108
(0.003
)
40.62
5
0.98
6 11.4
North
America
-4892.714
(1830.053
)
1752.61
0
(118.500
)
14.79
0
0.90
1
8.081
(0.041
)
0.108
(0.003
)
40.47
6
0.98
6 11.4
Source: Calculated by the researcher (Figures in bracket indicate Standard Error)
From the above Table No.1.12 it could be known that the t values of the trend co-
efficient were found to be statistically significant at one per cent level. The R2 values
were also found to be satisfactory. Among the India’s export to North America countries,
USA had the highest annual average export value of US $1,666.23 million per annum,
Canada had the lowest annual average export value of US $86.38 million per year. As far
as the growth rate of the exports of North America countries concerned, USA had the
topmost growth rate of 10.8 per cent per year. The lowest export growth rate was
witnessed in Canada which had 10.3 per cent per annum.Regarding the Compound
growth rate of exports, USA had the highest compound growth rate of 11.4 per cent per
annum. Canada had the lowest compound growth rate of 10.8 per cent per year.
TABLE NO.1.13. INDIA’S EXPORT TO DEVELOPING COUNTRIES FROM
1991-92 TO 2016-17
Countries 1991-
92
1995-
96
2000-
01
2005-
06
2010-
11
2015-
16
2016-
17
Asian Countries 3016.4 7307.8 10037.
9 30981.
2 75759.
2 76497.5
88559.8
Other Asian Developing Countries
2394.9 5587.2 8109.4 25433.
5 64122.
8 58611
69555.7

Indian Journal Of Business Administration (IJBA) (A National Peer Reviewed Refereed Journal) ISSN : 0975-6825, Volume 14, Issue 1, January-June 2021, pp. 80-104
94
African Countries
441.3 1512.7 1956.4 5699 15880.
4 21378.4
19915.7
Latin American Countries
129.5 377.9 1018.2 3056.2 10090.
1 11295
11740.6
Developing Countries
3587.1 9198.4 13012.
6 39736.
4 101730 109171 120216
Source: Directorate General of Commercial Intelligence and Statistics
Table No.1.13 shows that among the developing countries, Asia increased from
$3016.4 million US dollar in 1991-92 to $30,981.2 million US dollar in 2005-06 and
$88559.8 million US dollar in 2016-17. India’s export to other Asian Developing
Countries accelerated from $2,394.9 million US dollar in 1991-92 to $64,122.8 million
US dollar in 2010-11 then declined to $58,611 million US dollar in2015-16 finally,
improved to $69,555.7 million US dollar in 2016-17. India’s export to Africa went up
from $441.3 million US dollar in 1991-92 to $5,699 million US dollar in 2005-06 then to
$19,915.7 million US dollar in 2016-17. India’s export to Latin American Countries
improved from $129.5 million US dollar in 1991-92 to $1, 09,171 million US dollar in
2015-16 and it reaches to $1, 20,216 million US dollar in 2016-17.
TABLE NO.1.14. TREND AND GROWTH RATE OF INDIA’S EXPORT TO
DEVELOPING COUNTRIES FROM 1991-92 TO 2016-17
Variable Linear Model Semi log Model CG
R a b T R2 a b t R2
Developin
g
Countries
77073.99
(32292.60
)
8483.43
1553.37)
5.46
1
0.74
9
9.301
0.370)
0.103
0.018)
5.76
9
0.76
9 10.8
Asia
Countries
47106.91
(22761.36
)
5127.87
(1094.89
)
5.23
1
0.73
2
9.151
0.356)
0.095
0.017)
5.54
2
0.75
4 10.0
Other
Asian
Developin
g
Countries
31613.28
(21752.84
)
4348.06
(1046.38
)
4.15
5
0.63
3
9.065
(0.399
)
0.089
(0.019
)
4.65
2
0.68
4 9.3
Africa
Countries
18881.35
(6897.29)
1754.65
(331.782
)
5.28
9
0.73
7
7.164
(0.435
)
0.121
(0.021
)
5.78
1
0.77
0 12.9

Dr. Mathanraj. T & Saranya.C : Direction of India’s Exports
95
Latin
American
Countries
11336.66
(4605.65)
1020.89
(221.54)
4.60
8
0.68
0
6.335
(0.495
)
0.132
(0.024
)
5.54
8
0.75
5 14.1
Source: Calculated by the researcher (Figures in bracket indicate Standard Error)
From the above Table No.1.14 it could be known that the t values of the trend co-
efficient were found to be statistically significant at one per cent level. The R2 values
were also found to be satisfactory. Among the India’s export to developing countries,
Asia had the highest annual average export value of US $5,127.87 million per year. Other
Asian Countries had the second largest annual average export value of US $4,348.06
million per annum. The third rank was secured by Africa which had the average annual
export value of US $1,754.65 million per year Latin American Countries had the lowest
annual average export value of US $1,020.89 million per year. As far as the growth rate
of the exports of developing exporting countries concerned, Latin American had the
topmost growth rate of 13.2 per cent per year, Africa had the second largest export
growth rate of 12.1 per cent per year, Asia secured third place in export growth rate of 9.5
per cent per year. The lowest export growth rate was witnessed in Other Asian Countries
which had 8.9 per cent per annum.Regarding the Compound growth rate of exports, Latin
American had the highest compound growth rate of 14.1 per cent per annum. Other Asian
Countries had the lowest compound growth rate of 8.9 per cent per year.
TABLE NO.1.15. INDIA’S EXPORT TO SAARC COUNTRIES FROM 1991-92
TO 2016-17
Countries 1991-
92
1995-
96
2000-
01
2005-
06 2010-11 2015-16 2016-17
Afghanistan 0 0 0 142.7 421.6 524.8 507.5
Bangladesh 324 1049.1 935 1664.4 3237.9 5694.5 6695.8
Bhutan 1.2 17.2 1.1 99.2 175.9 408.3 489.1
Maldives 4.9 15.7 24.6 67.6 100 178.1 198.2
Nepal 77.1 160 140.8 860 2166.4 3676.6 5362.1
Pakistan 40.1 76.8 186.8 689.2 2031.3 2109.2 1832.3
Sri Lanka 174.2 401.7 640.1 2024.7 3503.4 5295.1 3919.1
SAARC 621.5 1720.6 1928.5 5547.6 11636.5 17886.5 19004.1
Source: Directorate General of Commercial Intelligence and Statistics (DGCI &S)

Indian Journal Of Business Administration (IJBA) (A National Peer Reviewed Refereed Journal) ISSN : 0975-6825, Volume 14, Issue 1, January-June 2021, pp. 80-104
96
The Table No.1.15 shows that SAARC countries, Bangladesh accelerated from
$324 million US dollar in 1991-92 to $1,049.1 million US dollar in1995-96then
decreased to $935 million US dollar in2000-01again increased to $3,237.9 million US
dollar in2010-11 and to $6,695.8 million US dollar in2016-17. India’s export to Nepal
increased from $77.1 million US dollar in 1991-92 to $2,166.4 million US dollar in 2005-
06 then to $5,362.1 million US dollar in 2016-17.India’s export to Sri Lanka went up
from $174.2 million US dollar in 1991-92 to $2,024.7 million US dollar in 2010-11 and
to $3,919.1 million US dollar in 2016-17. India’s export to Maldives improved from $4.9
million US dollar in 1991-92 to $100 million US dollar in 2000-01 finally to $198.2
million US dollar in 2016-17.
TABLE NO.1.16. TREND AND GROWTH RATE OF INDIA’S EXPORT TO
SAARC COUNTRIES
FROM 1991-92 TO 2016-17
Variable Linear Model Semi log Model CG
R a b t R2 a b t R2
Afghanist
an
-235.001
(129.251
)
30.835
(6.217) 4.959 0.711
3.880
(0.460)
0.099
(0.02
2)
4.478 0.66
7 10.4
Banglades
h
-
6297.162
(1049.77
)
503.66
6
(50.498
)
9.974 0.909 5.378
(0.280
0.137
(0.01
3)
10.18
6
0.91
2 14.7
Bhutan -550.125
(74.413)
37.813
(3.580)
10.56
4 0.918
1.426
(0.337)
0.185
(0.01
6)
11.39
6
0.92
9 20.3
Maldives -90.179
(36.293)
10.156
(1.746) 5.818 0.772
2.945
(0.292)
0.086
(0.01
4)
6.148 0.79
1 9.0
Nepal
-
5337.857
(727.90)
388.76
8
(35.015
)
11.10
3 0.925
4.363
(0.234)
0.164
0.011
)
14.57
3
0.95
5 17.8

Dr. Mathanraj. T & Saranya.C : Direction of India’s Exports
97
Pakistan -3.488
(573.95)
84.359
(27.609
)
3.055 0.483 6.168
(0.431)
0.061
(0.02
1)
2.932 0.46
2 6.3
Sri Lanka
-2979.60
(1527.61
)
2979.6
0
(1527.6
)
4.412 0.661 6.250
(0.368)
0.092
(0.01
8)
5.208 0.73
1 9.6
SAARC
15493.67
(2624.03
)
1379.8
12
126.22)
10.93
1 0.923
6.966
(0.229)
0.117
(0.01
1)
10.65
7
0.91
9 12.5
Source: Calculated by the researcher (Figures in bracket indicate Standard Error)
From the above Table No.1.16 it could be known that the t values of the trend co-
efficient were found to be statistically significant at one per cent level. The R2 values
were also found to be satisfactory. Among the India’s export to SAARC countries, Sri
Lanka had the highest annual average export value of US $2979.60 million per year.
Bangladesh had the second largest annual average export value of US $503.6 million per
annum. The third rank was secured by Nepal which had the average annual export value
of US $388.76 million per year followed by Pakistan (US $84.35 million), Bhutan (US
$37.81 million) and Afghanistan (US $30.83 million) per annum. Maldives had the
lowest annual average export value of US $10.15 million per year.As far as the growth
rate of the exports of SAARC countries concerned, Bhutan had the topmost growth rate
of 18.5 per cent per year, Nepal had the second largest export growth rate of 16.4 per cent
per year, Bangladesh held the third place in export growth rate of 13.7 per cent per year,
followed by Afghanistan (9.9 per cent), Sri Lanka (9.2 per cent) and Maldives (8.6per
cent) per year. The lowest export growth rate was witnessed in Pakistan which had 6.1
per cent per annum.Regarding the Compound growth rate of exports, Bhutan had the
highest compound growth rate of 20.3 per cent per annum. Pakistan had the lowest
compound growth rate of 6.3 per cent per year.

Indian Journal Of Business Administration (IJBA) (A National Peer Reviewed Refereed Journal) ISSN : 0975-6825, Volume 14, Issue 1, January-June 2021, pp. 80-104
98
TABLE NO 1.17. INDIA’S EXPORT TO OTHER ASIAN DEVELOPING
COUNTRIES
FROM 1991-92 TO 2016-17
Countries 1991-
92
1995-
96
2000-
01
2005-
06
2010-
11
2015-
16
2016-
17
China 48.2 332.7 831.3 6759.1 15454.
3 9043.9
10207.
1
Hong Kong 614.3 1821.4 2640.9 4471.3 10323.
9
12162.
9
14141.
9
South Korea 238.7 448.3 450.8 1827.2 3723.4 3548.5 4237.8
Malaysia 202.4 393.2 608.2 1161.9 3879.8 3689.9 5230.8
Singapore 388.8 901.6 877.1 5425.3 9817.6 7732.8 9561.7
Thailand 198.6 472.9 530.1 1075.3 2270.8 3012.7 3173.0
Indonesia 146.7 662.4 399.8 1380.2 5689.9 2839.4 3500.6
Other Asian
Developing
Countries
2394.9 5587.2 8109.4 25433.
5
64122.
8 58611
69555.
7
Source: Directorate General of Commercial Intelligence and Statistics
The Table No.1.17 indicates India’s export to other Asian Developing exporting
countries; Hong Kong has improved from $614.3 million US dollar in 1991-92 to
$4471.3 million US dollar in 2005-06 then to $14,141.9 million US dollar in 2016-17.
India’s export to China accelerated from $48.2 million US dollar in 1991-92 to $831.3
million US dollar in 2005-06 again to $15,454.3 million US dollar in 2010-11 then
declined to $10,207.1million US dollar in 2016-17. India’s export of Singapore amplified
from $388.8 million US dollar in 1991-92 to $877.1 million US dollar in 2000-01 then to
$7,732.8 million US dollar in 2015-16 and to $9,564.7 million US dollar in 2016-17.
India’s export of Thailand increased from $198.6 million US dollar in 1991-92 to
$2,270.8 million US dollar in 2010-11 and it reached to $3,173.0 million US dollar in
2016-17.

Dr. Mathanraj. T & Saranya.C : Direction of India’s Exports
99
TABLE NO.1.18. TREND AND GROWTH RATE OF INDIA’S EXPORT TO
OTHER ASIAN DEVELOPING COUNTRIESFROM 1991-92 TO 2016-17
Variable Linear Model Semi log Model CG
R a b t R2 a b t R2
China 5217.313
(5760.10)
315.519
(277.080)
1.13
9
0.11
5
8.678
(0.481
)
0.032
(0.023
)
1.37
3
0.15
9 3.2
Hong
Kong
-
9611.445
(2182.59)
949.027
(104.990)
9.03
9
0.89
1
6.862
(0.277
)
0.110
(0.013
)
8.26
2
0.87
2 11.6
South
Korea
-118.455
(953.740)
182.369
(45.878)
3.97
5
0.61
2
6.963
(0.316
)
0.059
(0.015
)
3.85
8
0.59
8 6.0
Malaysia
-
3460.298
(1234.51
4)
341.806
(59.384)
5.75
6
0.76
8
5.638
(0.480
)
0.119
(0.023
)
5.15
0
0.72
6 12.6
Singapore 683.747
(5301.37)
431.319
(255.013)
1.69
1
0.22
2
8.053
(0.495
)
0.052
(0.024
)
2.16
7
0.32
0 5.3
Thailand -2103.36
(812.991)
225.767
(39.108)
5.77
3
0.76
9
5.684
(0.333
)
0.101
(0.016
)
6.33
1
0.80
0 10.7
Indonesia -851.042
(2713.85)
221.617
(130.545)
1.69
8
0.22
4
6.481
(0.702
)
0.080
(0.034
)
2.35
5
0.35
7 8.3
Other
Asian
Developin
g
Countries
31613.28
(21752.8
4)
4348.065
(1046.38
3)
4.15
5
0.63
3
9.065
(0.399
)
0.089
(0.019
)
4.65
2
0.68
4 9.3
Source: Calculated by the researcher (Figures in bracket indicate Standard Error)
From the above Table No.1.18 it could be known that the t values of the trend co-
efficient were found to be statistically significant at one per cent level. The R2 values

Indian Journal Of Business Administration (IJBA) (A National Peer Reviewed Refereed Journal) ISSN : 0975-6825, Volume 14, Issue 1, January-June 2021, pp. 80-104
100
were also found to be satisfactory. Among the India’s export to other Asian developing
countries, Hong Kong had the highest annual average export value of US $949.02 million
per year. Singapore had the second largest annual average export value of US $431.31
million per annum. The third rank was secured by Malaysia which had the average
annual export value of US $341.80 million per year, followed by China (US $315.51
million), Thailand (US $225.76 million) and Indonesia (US $221.61 million) per annum.
South Korea had the lowest annual average export value of US $182.36 million per
year.As far as the growth rate of the exports of Other Asian developing countries
concerned, Malaysia had the topmost growth rate of 11.9 per cent per year, Hong Kong
had the second largest export growth rate of 11.0 per cent per year, Thailand secured
third place in export growth rate of 10.1 per cent per year, followed by Indonesia (8.0 per
cent) South Korea (5.9 per cent) and Singapore (5.2 per cent) per year. The lowest export
growth rate was witnessed in China which had 3.2 per cent per annum.Regarding the
Compound growth rate of exports, Hong Kong had highest compound growth rate of 11.6
per cent per annum. China had the lowest compound growth rate of 8.5 per cent per year.
TABLE NO.1.19. INDIA’S EXPORT TO AFRICAN COUNTRIES FROM 1991-92
TO 2016-17
Countries 1991-
92
1995-
96
2000-
01
2005-
06
2010-
11
2015-
16
2016-
17
Benin 10.6 11.3 45.1 96.6 263.2 427.4 452.8
Egypt, Arab
Republic 81 164.3 357.5 672.4 1981.1 2332.5 2070.2
Kenya 41.7 245.1 140.9 576.5 2183.3 3021 2198.2
South Africa 0 0 0 1526.9 3925.3 3600 3553.6
Sudan 15.8 30.6 97.8 294.6 488.2 780.6 751.2
Tanzania 48 81.4 102 243.5 1470.8 1649.8 1786.8
Zambia 27.3 35.2 22.5 66.5 118.3 297.5 237.3
Africa 441.3 1512.7 1956.4 5699 15880.
4
21378.
4
19915.
7
Source: Directorate General of Commercial Intelligence and Statistics
It can be seen from the Table No.1.19 that African countries, South Africa
accelerated from $1526.9 million US dollar in 2005-06to $3925.3 million US dollar in

Dr. Mathanraj. T & Saranya.C : Direction of India’s Exports
101
2010-11 and to$3553.6 million US dollar in 2016-17. India’s export of Kenya increased
from $41.7 million US dollar in 1991-92 to $576.5 million US dollar in 2005-06 then to
$3,021 million US dollar in 2015-16 declined to $2,198.2 million US dollar in 2016-
17.India’s export of Egypt went up from $81 million US dollar in 1991-92 to $1981.1
million US dollar in 2010-11 and to $2,070.2 million US dollar in 2016-17. India’s
export of Zambia improved from $27.3 million US dollar in 1991-92 to $118.3 million
US dollar in and it reached to $237.3million US dollar in 2016-17.
TABLE NO.1.20. TREND AND GROWTH RATE OF INDIA’S EXPORT TO
AFRICA COUNTRIES FROM 1991-92 TO 2016-17
Variable Linear Model Semi log Model
CGR a b t R2 a b t R2
Benin -481.415
(254.396)
41.680
(12.237) 3.406 0.537
2.874
(0.643)
0.141
(0.031) 4.558 0.675 15.1
Egypt
Arab
Republic
-1679.983
(799.600)
176.215
(38.463) 4.581 0.677
5.146
(0.494)
0.113
(0.024) 4.775 0.695 12.0
Kenya -2765.050
(1334.997)
247.640
(64.218) 3.856 0.598
4.947
(0.602)
0.130
(0.029) 34.520 0.668 13.9
South
Africa
-2151.452
(1730.855)
274.674
(83.260) 3.299 0.521
6.206
(0.512
0.091
0.025 3.701 0.578 9.5
Sudan -450.310
(150.005)
51.557
(7.216) 7.145 0.836
4.459
(0.253)
0.092
(0.012) 7.600 0.852 9.7
Tanzania -2714.755
(1069.387)
204.253
(51.441) 3.971 0.612
3.001
(0.771)
0.197
(0.037) 5.317 0.739 21.8
Zambia -315.198
(112.273)
24.945
(5.401) 4.619 0.681
2.250
(0.531)
0.140
(0.026) 5.498 0.751 15.1
Africa 18881.357
(6897.290)
1754.653
(331.782) 5.289 0.737
7.164
(0.435)
0.121
(0.021) 5.781 0.770 12.9
Source: Calculated by the researcher (Figures in bracket indicate Standard Error)
From the above Table No.1.20 it could be known that the t values of the trend co-
efficient were found to be statistically significant at one per cent level. The R2 values
were also found to be satisfactory. Among the African exporting countries, South Africa
had the highest annual average export value of US $274.67 million per year. Kenya had
the second largest annual average export value of US $247.64 million per annum. The
third rank was secured by Tanzania which had the average annual export value of US

Indian Journal Of Business Administration (IJBA) (A National Peer Reviewed Refereed Journal) ISSN : 0975-6825, Volume 14, Issue 1, January-June 2021, pp. 80-104
102
$204.25 million per year followed by Egypt (US $176.21 million), Sudan (US $51.55
million) and Benin (US $41.68 million) per annum. Zambia had the lowest annual
average export value of US $24.94 million per year. As far as the growth rate of the
exports of African exporting countries concerned, Tanzania had the topmost growth rate
of 19.7 per cent per year, Benin had the second largest export growth rate of 14.1 per cent
Per year, Zambia secured third place in export growth rate of 14.0 per cent per year,
followed by Kenya (13.0 per cent), Egypt 11.3 (per cent) and Sudan 9.2 (per cent) per
year. The lowest export growth rate was witnessed in South Africa which had 9.1 per
cent per annum.Regarding the Compound growth rate of exports, Tanzania had the
highest compound growth rate of 21.8 per cent per annum. South Africa had the lowest
compound growth rate of 9.5 per cent per year
FIGURE NO.1.1. DIRECTION OF INDIA’S EXPORTS
CONCLUSION
Export is crucial for the growth of economy as it leads to the earning of valuable
foreign exchange which helps in the growth of the economy. More growth of the
economy leads to more prosperous nation. Exports have evolved a lot since
independence. It is important because of its effect on internal trade economic stability of
an Indian economy. The study finding thegrowth rate of the exports of various regional
groups exporting countries was concerned, OPEC had the top most growth rate of 17.5
0
100000
200000
300000
400000
500000
600000
1991-92
1992-93
1993-94
1994-95
1995-96
1996-97
1997-98
1998-99
1999-00
2000-01
2001-02
2002-03
2003-04
2004-05
2005-06
2006-07
2007-08
2008-09
2009-10
2010-11
2011-12
2012-13
2013-14
2014-15
2015-16
2016-17
OPEC Countries OECD Countries
Eastern Europe Countries Developing Countries
SAARC Countries Other Asian Developing Countries
Dr. Mathanraj. T & Saranya.C : Direction of India’s Exports
103
per cent per year. The lowest export growth rates were witnessed in Eastern Europe
which has 5.1 per cent per annum. India’s Export to OPEC countries was concerned,
UAE has the topmost growth rate of 18.4 per cent per year, and the lowest export growth
rate was witnessed in Kuwait which had 12.8 per cent per annum. India’s Export
toEuropean Union exporting countries concerned, Netherlands had the topmost growth
rate of 13.5 per cent per year, the lowest export growth rate was witnessed in Germany
which had 8.1 per cent per annum. India’s Export toAsia and Oceania exporting countries
concerned, Australia had the topmost growth rate of 11.4 per cent per year. The lowest
export growth rate was witnessed in Japan which had 5.6 per cent per annum. India’s
Export toNorth America countries concerned, USA had the topmost growth rate of 10.8
per cent per year. The lowest export growth rate was witnessed in Canada which had 10.3
per cent per annum. India’s Export to developing exporting countries concerned, Latin
American had the topmost growth rate of 13.2 per cent per year, and the lowest export
growth rate was witnessed in Other Asian Countries which had 8.9 per cent per annum.
India’s Export toSAARC countries concerned, Bhutan had the topmost growth rate of
18.5 per cent per year, the lowest export growth rate was witnessed in Pakistan which had
6.1 per cent per annum. India’s Export toOther Asian developing countries concerned,
Malaysia had the topmost growth rate of 11.9 per cent per year, the lowest export growth
rate was witnessed in China which had 3.2 per cent per annum. India’s Export toAfrican
exporting countries concerned, Tanzania had the topmost growth rate of 19.7 per cent per
year, the lowest export growth rate was witnessed in South Africa which had 9.1 per cent
per annum. Finally,Exporters should take the advantage of “Make in India” scheme
started by Prime Minister of India. Research and development need to be emphasized
upon. Optimum utilization of schemes and resources is required to minimize the trade
deficit and make India a productive and prosperous nation. Thus, in order to improve the
performance of export sector, policies must be introduced so that the performance of
agriculture sector is improved and strengthened in future.
REFERNCE
• Agarwal, A.N., Indian Economy: Problems of Development and Planning, Vikas
Publishing House Pvt. Ltd., New Delhi, pp. 577, (1975).
• A. Pushpalata Singh (2014) “Performance of Foreign Trade in India in the Post
Liberalization Era” International Journal of Humanities Social Sciences and
Education (IJHSSE) Volume 1, Issue 10, October 2014, PP 11-17 ISSN 2349-
0373 (Print) & ISSN 2349-0381 (Online) www.arcjournals.org.

Indian Journal Of Business Administration (IJBA) (A National Peer Reviewed Refereed Journal) ISSN : 0975-6825, Volume 14, Issue 1, January-June 2021, pp. 80-104
104
• Dr. Pesala Peter “Exports performance of primary products in India”Indian
Journal of Economics and Development, ISSN (online): 2320-9836 ISSN (Print):
2320-9828, Vol 6 (12), December 2018.
• T. Maheswari,Growth and Structure of India’s Foreign Trade in the Post-reform
Period socio - economic voices www.indiastat.com February - March, 2017.
• Dr. Priyanka Sahni (2014) Trends in India’s Exports: A Comparative Study of Pre
and Post Reform Period IOSR Journal of Economics and Finance (IOSR-JEF) e-
ISSN: 2321-5933, p-ISSN: 2321-5925.Volume 3, Issue 2. V. I (Mar. - Apr. 2014),
PP 08-18.
• Santos Paulino A. and Thirlwall A.P (2004), The Impact of Trade Liberalization
on Exports, Imports and the Balance of Payments of Developing Countries”, The
Economic Journal, 114 (February), pp. 50-72.
• Balaguer J. and Manuel Cantavella- Jorda (2002), “Structural Change in Exports
and Economic Growth: Co-integration and Causality analysis for Spain”, WP-EC
2000-2.
• Ghemawat pankaj and Patibandla Murli (1998), India’s Exports since the
Reforms, Economic and Political weekly, May 16, 1998.
• Shameek Mukherjee and ShahanaMukherjee (2012) Overview of India’ Export
Performance: Trends and Drivers, WORKING PAPER NO: 363.
• Mathanraj.T (2019)“Impact of trade liberalization on India’s manufactured
exports” Think India, ISSN: 0971-1260, UGC Approved CARE journal, Volume-
22 Issue-4, Impact factor-6.2, page no. 1495-1507, October- December 2019.
• Dr. P. Sekar and Dr. Mathanraj. T (2021) “Impact of Post Liberalization on
Agricultural Exports in India” Turkish Online Journal of Qualitative Inquiry,
ISSN: 1309-6591, UGC Scopus Approved International indexed journal, Volume-
12, No.3, Page No. 5155-5167.
• Directorate General of Commercial Intelligence and Statistics (DGCIS)
• Handbook of Statistics on Indian Economy, Reserve Bank of India (RBI),
Government of India.

Indian Journal Of Business Administration (IJBA)
(A National Peer Reviewed Refereed Journal)
ISSN : 0975-6825, Volume 14, Issue 1, January-June 2021, pp. 105-113
105
DIGITAL ERA MARKETING : A RESEARCH STUDY OF HDFC
BANK
Dr. Sushil Kumar Daiya *
ABSTRACT
Now a days marketing has become more customer oriented as well as
technology oriented. Marketing is a very important functional area of business
organization. Any business is not possible without marketing. Marketing changes its
form from time to time according to the environment. Therefore it is necessary that a
successful businessman recognizes these changing needs and converts them into
opportunities using marketing. On this basis, the present research paper has been
divided into three major parts.
In the first part of the research paper, the concept, meaning, components,
digital tools, digital channels and benefits of digital marketing are presented. In the
second part of the research paper, it has been told that the second name of success in
the present era is digital marketing. It shows the spread of digital marketing channels
worldwide. It is proved that entire world is a growing potential market which needs to
be captured with the help of digital marketing strategies. Third part of this report
describes the efforts of banks in digital marketing areas. In digital marketing, banks
are taking cautious steps to move forward.
While working within the framework of regulations and laws and handling all
safety and secrecy related issues with risk factors, banks are entering in digital
marketing very slowly and carefully. In Present era, digital marketing is so helpful for
establishment and expand business of private sector banks. In this research paper, the
efforts done by private sector banks have been analysed with the help of case study of
HDFC bank. The author of this paper also analysed the digital marketing system
adopted by HDFC Bank for expand their banking business.
Keywords : Banking Sector, Digital channels, Digital Marketing, Digital Devices.
* Assistant Professor Shri Jain P.G. College, Bikaner
Dr. Sushil Kumar Daiya : Digital Era Marketing : A Research Study of HDFC Bank
106
INTRODUCTION :
Banks play an important role in the development of the economy of any country.
An effective banking system of a bank has a positive impact on the economic
development of the country. Innovation takes the business both internally and
externally to prosper, grow and transform and keep up with the changes in the
environment. The banking sector has also witnessed radical changes from time to time,
on this basis innovations in technology, processes, products, services, governance and
regulation, business models etc. have been introduced in the banking industry. Thus a
globalized financial system has given additional impetus to this massive effort.
Banking has become digital and no boundary with a 24×7 tech driven model. Banks
have benefitted by adopting newer technologies in several ways. In modern era, E-
banking reduces costs significantly and also generate so many revenue through various
channels. As per an estimation the cost per transaction is expected to be in a range of
Rs.70 to Rs.75 on Branch Banking while on ATM it is around to Rs.15 to Rs.16,
whereas in Online Banking it is Rs.2 or less and on Mobile Banking it is Rs.1 or less.
The convenience of “Any Time, Anywhere Banking” has also increased the
number of customer base. Like every business, the customer is the focal point in the
banking sector, so it is necessary to do various types of advertisements through
efficient strategies to make the customers aware about the products and services
provided by the banks. In recent past banking industry is facing tough competition, to
beat the competition; the various digital channels are being used to communicate the
customers about the products and services offered by them. The information relating to
products and Service enables the customers making his purchase decision easier.
Since revolutionary transformation has taken place in the banking sector with the
advancement of Information Technology. Digital Marketing supply and transmit the
accurate information to the customers.
MEANING AND DEFINITION :
Bank is an institution, who deals in money, monetary forms and its substitutes.
Banks also provide crucial financial services. In modern era, commercial banking and
central banking are the principal type of baking in the world. In Common terminology
Banking Means “An Institute, who Accepting Deposits from the public, repayable on
demand or otherwise and withdraw by cheque, draft or otherwise.” According to
Oxford dictionary it has defined as “Establishment for custody of money which it pays
out on customers order.” In-fact this is the function which the bank performed when
banking originated.” Banking in the most general sense, is meant the business of
receiving, conserving & utilizing the funds of community or of any special section of
it.

Indian Journal Of Business Administration (IJBA)
(A National Peer Reviewed Refereed Journal)
ISSN : 0975-6825, Volume 14, Issue 1, January-June 2021, pp. 105-113
107
OBJECTIVES OF THE STUDY :
Banking industry plays a important role in the development of economy of the
nation. The banking industry is highly benefited by the digital transformation. The
specific objectives of this study are as follows:
� To highlight the marketing plan of the banking industry
� To study the Digital Marketing in Banking
� To highlight the Marketing strategy of HDFC Bank
CONCEPT OF DIGITAL MARKETING :
In Simple words, Digital marketing means promotion of goods and services
through the help of digital sources. The word Digital represents transmission of data
through the help of binary numbers. From the above said points it is clear that digital
marketing means the marketing who includes all efforts through the help of electronic
device. Digital marketing uses various channels through which content can be
transmitted with the help of digital devices. So, we can say that it is a combination of
electronic/digital devices with E-platform. Along with that, right skill and knowledge is
required on the part of personnel to make use of it.
DIGITAL MARKETING DEVICES :
� Computers
� Smart Mobile Phones
� Digital Outdoors
� Smart Digital TV
DIGITAL MARKETING CHANNELS :
� Social Media
� Videos
� Websites
� Mobile Apps
� Search Engine Optimisation
BENEFITS OF DIGITAL MARKETING :
� HIGHER REACH : Digital media has higher reach. With the help of
digital marketing, marketer can reach at every corner of the world as compared to
traditional media’s limited reach. Digital Marketing is a great opportunity to attract
customers in every area of the world.

Dr. Sushil Kumar Daiya : Digital Era Marketing : A Research Study of HDFC Bank
108
� COST EFFECTIVE : Digital marketing is cheaper than traditional
marketing. It requires less fund to market the product as compared to giving ads in
newspaper and TV, Magazine advertisements at a very high rate. It is definitely
affordable to all marketers whether single marketer or large organizations.
� EASY TARGETING OF RIGHT AUDIENCE : In digital marketing,
easy targeting of right audience is possible with the help of proper planning and
structuring of digital messages. Choice of right digital channel is necessary. Search
Engine Optimization is helpful technique to target right audience.
� HIGH RETURN ON INVESTMENT: Digital marketing assures high
return on investment. It is cost effective methods. Costs are less than the returns.
Higher returns in less time period are possible.
� FASTER GROWTH RATE : Digital media assures faster growth rate
in number of consumers and overall business as compared to traditional marketing
media.
� IMPROVES BRAND AWARENESS : E-gazettes are used to promote
products with the help of electronic devices. In present era, E-gazettes are mostly
used by the consumers of a business. The impact of these gazettes are so high in
creating value of brand. Use of digital media creates long lasting effect on
consumer’s mind.
� BRAND LOYALTY : For the success of any industry it is essential that its
consumer has a high level of satisfaction. This will be possible only when the
concerned industry provides high level of product and service to its customers which
will result in a brand loyal following. In the present competitive era, it is necessary
that the queries and problems of the customers are resolved promptly by the marketers.
� INTERACTION : Digital media marketing promotes interactions among
organization and customers. It will help to solve their queries and problems at personal
level. It tries to connect marketer and consumers for long term relations.
MARKETING PLAN OF BANKING INDUSTRY :
Presently there is an era of competition, in this era it is necessary for every
organization to retain its old customers as well as to attract new customers in this
changing environment, comprehensive marketing strategy is necessary. The
application of a marketing strategy in banks will therefore involve :
� Finding out customers’ financial needs and wants
� Developing innovative items (Product and Services) to satisfy the needs
of the existing and new customers’

Indian Journal Of Business Administration (IJBA)
(A National Peer Reviewed Refereed Journal)
ISSN : 0975-6825, Volume 14, Issue 1, January-June 2021, pp. 105-113
109
� Fixation of price for the services and products provided by the industry
� Make sure set up appropriate bank branches and outsells
� Research for development of future banking
� To promote the products and services doing attractive advertisement
DIGITAL MARKETING IN BANKING SECTOR
In Present Era where everyone affected from Covid-19. The whole industry have
used digital marketing plan to improve their service providing system. Banking sector
is also trying to walk on digital path. Digital marketing is definitely helping banks to
grow and expand at faster speed. Digital marketing symbolizes smart work rather than
hard work. Digital marketing increases the demand for the financial products at faster
rate as compared to traditional marketing. It is contributing to the goodwill and
reputation of banks. Banks needs to plan digital marketing strategy with proper skills
and expertise.
Private sectors banks are ahead in digital marketing efforts as compared to
public sector banks. Many private sector banks are trying to establish and expand their
business with the help of digital marketing. In the present research paper, the author has
analyzed the efforts of the bank with the help of case study of HDFC Bank. The author
has also gone through various statistics to find out that currently HDFC Bank is at the
top position in digital marketing efforts. Not only this, but HDFC Bank is also getting
positive response from the customers. In this technological age, every business sector
along with the banking sector should try to grab the opportunities in the market with the
help of digital marketing for future survival and growth. Various researches have been
done to find out effectiveness of digital marketing in case of merchandise goods. It is
proven that digital marketing is really improving the sales of products as well as it
contributes to generation of new customers and customer's loyalty. In service sector,
especially in banking business, still digital marketing is lagging behind. In this study
attempt is done to find out whether banks are choosing the path of digital marketing
and is it effective or not.
Indian banking system is well regulated system by Reserve Bank of India and
by various banking laws. Banks always have safety and secrecy related issues. That’s why
we found less numbers of banks are involved in digital marketing activities. Digital
marketing is the needed for successful present and future of any organization. That’s
why; every business needs to be in digital system to flourish their business. Banks

Dr. Sushil Kumar Daiya : Digital Era Marketing : A Research Study of HDFC Bank
110
cannot be the exception. Large number of people in world has been connected with
the help of digital media. In this new era, person cannot be isolated from digital
media.
INTRODUCTIN OF HDFC BANK
The HDFC (Housing Development Finance Corporation) Limited was
amongst the first to receive an ‘in principle’ approval from the Reserve Bank of India
to establish as a bank in the private sector in 1994. The bank was incorporated in
August 1994 in the name of ‘HDFC Bank Limited’. The registered office of HDFC
Bank Ltd. is in Mumbai, India. Its commenced operations as a Scheduled Commercial
Bank since January 1995.
HDFC (Housing Development Finance Corporation) is India's leading housing
finance company. Its outstanding loan portfolio covers over one million residential
units. HDFC has developed significant expertise in retail mortgage loans for various
market segments and also has a large corporate client base for its housing loan
facilities. HDFC (Housing Development Finance Corporation) was a pioneer in
promoting a bank in the Indian environment, with experience in the financial markets,
market reputation, large shareholder base and unparalleled consumer franchise. HDFC
Bank's main objective is to become a world class Indian bank and to build strong
customer franchise across various businesses to make it the preferred provider of
banking services for retail and wholesale customer segments and healthy growth in
profitability commensurate with the bank's risk appetite. be able to achieve All this is
possible only if the Bank remains committed to maintaining the highest level of
ethical standards, professional integrity, corporate governance and regulatory
compliance. That is why HDFC Bank has set four core values of its business
philosophy - Operational Excellence, Customer Focus, Product Leadership and People.
BUSINESS OBJECTIVES OF HDFC BANK :
The main business objectives of HDFC Bank are following :
� CUSTOMERS : The core objective of HDFC is to provide customer care
customer service with the required solutions and satisfy them innovatively beyond the
expectations.
� SHAREHOLDERS : To optimize return on shareholders’ funds.
� EMPLOYEES : The another objective of HDFC Bank is to motivate,
develop, recognize and reward our employees.
� COMMUNITY : To be strongly committed to contribute to the national goal
of providing shelter for all.

Indian Journal Of Business Administration (IJBA)
(A National Peer Reviewed Refereed Journal)
ISSN : 0975-6825, Volume 14, Issue 1, January-June 2021, pp. 105-113
111
� INDUSTRY : Setting industry benchmarks of international standard in
delivering customer value through out comprehensive product range, customer service
and all our activities
� ETHICS : Maintaining the highest ethical standards worth of a leading
corporate citizen.
SOCIAL MEDIA STRATEGIES :
The bank use social media to engage their clients and employing number of
channels to attract and retain the customers. Following social media strategies are
adopted by HDFC Bank to beat another private sector bank in competition and
increase customer base.
� HDFC Facebook Page Getting feedback from the clients helps to understand
their opinion on products and services. This page of HDFC also generates
admirable feedback so that the bank design the product accordingly. There
is a separate money matters section to supply interesting recent financial
news of interest.
� The HDFC Twitter page is designed to share the relevant and interesting
information with their customers and followers to asking them interesting
sharing new deals, puzzle, products etc. The idea behind is to attract more
customers.
HDFC BANKS AND TOOLS OF DIGITAL MARKETING :
Annual reports of HDFC bank indicates that bank is focusing more on
experience differentiation rather than only transactional interactions. This approach
provides bank competitive advantage over other banks. Bank has tried to integrate newer
technology platforms to attract more customers and to design more satisfying
customer’s experience. Following are efforts taken by HDFC bank towards this
direction through various tools i.e. EVA (Electronic Virtual Assistant), On Chat, DCC
(Digital Command Care), Insta Alerts, Digital Loans, Virtual Insta Card, PayZapp,
Smart Buy, Digital loans against securities and mutual fund, Smart Hub, Smart Hub
Merchant App and BHIM App in digital marketing.
HDFC has achieved the target to install point of sale units, integrate the Bharat QR
payment system and promote the Bhim mobile app based on the unified payment
interface after demonetization. These are some of the tools which bank is providing to

Dr. Sushil Kumar Daiya : Digital Era Marketing : A Research Study of HDFC Bank
112
attract customers digitally. HDFC bank is trying their best to provide excellent digital
banking experience with digital marketing to build trust among customers. HDFC bank’s
proportion of investment in digital marketing has increased. Bank is spending more on
technical staff which is handling the digital media marketing. So, in every aspect bank is
becoming ready to face future challenges, equipped with digital marketing.
CONCLUSION :
From above analysis of information, it is concluded that digital marketing has
greatest potential to improve the business. Various channelsof digital marketing and its
great advantages definitely provide competitive edge to marketers. Customers are more
satisfied and attached with the organisation due to constant interaction through digital
media. The services and products have become more customised. It is observed that
growing population on internet can be converted into actual consumers of products and
services with the help of digital marketing. Banking sector is taking steps more
cautiously in digital marketing. It is observed that the HDFC bank has taking continuous
efforts towards digital marking. HDFC bank is ahead in digital marketing and enjoying
the benefits of greater reach with customers. All other banks, at their maximum strength
are trying improving in digital marketing area to gain the benefits of it. It is sure that
with changing time, digital marketing will be the top priority for every bank.
REFERENCES :
• Bandgar (2019). Environment and Management of Financial Services. Vipul
Prakashan.
• Bharti (2017). Influence of digital marketing on brand building of North Indian
Universities.
• Denscombe (2010). The Good Research Guide for small-scale social research
projects. 4th edition, Open University press.
• Kothari (2014). Research Methodology, Methods and Techniques. New age
International Publishers.
• Mithani (2015). Money, Banking, International Trade and Public Finance.
Himalaya Publishing House.
• N. Lakshmi (2017). An Overview of Banking Sector. Vipul Prakashan.
• Pawar (2016). Digital Media. Vipul Publication.
• Rekha (2018). Impact of digital marketing communication on consumer
buying decision process.
• Sanchela (2016). Digital Media. Vipul Prakashan.

Indian Journal Of Business Administration (IJBA)
(A National Peer Reviewed Refereed Journal)
ISSN : 0975-6825, Volume 14, Issue 1, January-June 2021, pp. 105-113
113
• Singh (2006). Fundamental of Research Methodology and Statistics. New Age
International Publisher.
• Digital Marketing for Finance Industry: A Complete Guide - Digital Vidya
https:// www.digitalvidya.com/blog/digital-marketing-for-finance-industry/
• Internet and Mobile Association of India (IAMAI) report, June 2018
• Sudha, B. (2016). Technology in Indian Banking Sector. IJARTET, pp.202 -
205
• Sudha, B. (2015) Entrepreneurship and Economic Development, IJMDRR,
pp.195-197
• www.hdfc.com

Indian Journal Of Business Administration (IJBA)
(A National Peer Reviewed Refereed Journal)
ISSN : 0975-6825, Volume 14, Issue 1, January-June 2021, pp. 114-131
114
CHANGING CONSUMER BEHAVIOUR DURING NOVEL
CORONAVIRUS
ABSTRACT
The era of marketing made consumer the king and in order to aim for survival,
growth, profits businesses are directed to make their king satisfied and happy. All this can
be achieved by carefully evaluating the buying behaviour of consumers so as to acquire
and maintain customers. Consumer’s behaviour depends on the external stimuli of the
environment whether it be any innovative change, cultural, social, political, international
event as well as on its personal belief and social system in which they live. The drastic and
tragic event of Covid 19 has deeply impacted the very behaviour of buying and purchasing.
The study is an attempt to understand the very nature at the time of crisis.
Key words: Consumer Behaviour, Buying Behaviour, Coronavirus, Covid19
Introduction
The buzz all around the world is of Covid-19. The hot topic being rumoured to be
from China has halted the life, growth of countries around the globe. An intangible flu
with just minor symptoms of cold and cough has taken the lives of many. Seems to be like
much of the biological Warfare initiated by the Dragon country to acquire control over rest
of the world. The terrorism is prevailing till now when almost two years have passed,
nothing seems to have changed with mask, sanitizers be the new normal of human life.
* HOD & Assistant Professor, Department of Business Administration, JNVU Jodhpur
** Research Scholar, Department of Business Administration, JNVU Jodhpur
Dr. Umed Raj Tater*
Ms. Ishu Chalana**

Dr. Umed Raj Tater & Ms. Ishu Chalana : Changing Consumer Behaviour During Novel Coronavirus
115
In the family of viruses, the spread of coronavirus has proved to be fatal and life
threatening. Things and situations are becoming much better than before but it will never
be the same for some families who lost their only earning members or young kids. The
drastic change being brought in the environment devastated the whole market structure
with continuing lockdowns being imposed by the government. Everybody was caught
inside their homes with strict vigilance of police force, only being the grocery, vegetables
and medicines available in the market. The time as if stopped. National highways
experienced peace and rest with no vehicle moving on them. As the lockdown was removed
country faced huge repercussions in the form of second wave where the number of patients
and deaths increased and the country according to WHO report might experience the third
wave. Work from home was the new normal for corporates, schools, colleges, education
system suffered a huge setback as students have developed the new normal of online
classes, online examinations to the extent that CBSE and regional boards cancelling the
board examinations and gave a formula/criterion to evaluate the performance of students.
Competitive exams of the country IIT JEE, NEET various state examinations school
lecturer, judicial and administrative services are all hanging down waiting for the situation
to settle down.
Travel, tourism, restaurant industry suffered huge losses as the weddings were
allowed with only 11 or 21 guests. All kind of travel including foreign, domestic via air,
road route was prohibited. Country's per capita income, National Income, GDP all have
alarming results. Oxygen supplies were falling short to save the lives of the citizens of the
country and many even died due to shortage. The era of vaccination where the companies
came out with the vaccines (the only way to put the life back onto track) including Pfizer,
Moderna, Sputnik V, Covidshield of AstraZeneca, Covaxin of Bharat Biotech.
Together united we are fighting, doctors, policemen all giving their full services to save
the countrymen. The one essential lesson that the pandemic gave was of brotherhood
mankind and not rushing towards the materialistic items.
Consumer Behaviour
Reaction of individuals while buying a particular good/service. It is the whole
branch of study which aims to study the psychology of the consumer based on the buying
decision making. In the words of Webster "Buyer behaviour is all psychological, social and
physical behaviour of potential customers as they become aware of, evaluate, purchase,
consume and tell other people about product and services". It is never static or fixed in

Indian Journal Of Business Administration (IJBA)
(A National Peer Reviewed Refereed Journal)
ISSN : 0975-6825, Volume 14, Issue 1, January-June 2021, pp. 114-131
116
nature and depends upon various factors based on which the company provide promotions,
offers, products. The interdisciplinary study covering the areas of psychology,
anthropology, economics covers both the buyer and end user of the product. The branch
helps in organisations in segmentation of the market it aims at reducing the chances of
product failure, helps in adapting to the environmental change, availing the marketing
opportunities, helps in increasing consumer protection.
Buying process stages:
Factors which determine consumer behaviour
Psychological Personal Social Cultural
1. Sensation 1. Family 1. Family 1. Sub culture
2. Needs 2. Demographic 2. Ref. groups 2. Social classes
3. Perception 3. Income 3. Opinion Leaders
4. Beliefs 4. Lifestyle 4. Beliefs
5. Attitudes 5. Education 5. Attitudes
6. Learning 6. Occupation 6. Learning
7. Motives 7. Motives
8. Personality 8. Personality
9. Self concept 9. Self concept
Cognitive Dissonance
The post purchase dilemma that a consumer experiences regarding the choice that
he has made the various available alternatives The state of anxiety in the mind of the
consumer in choosing a particular brand. Dissonance gets higher and causes a situation of
dilemma when teh prices of the product is high, the product is new/ innovative (consumer
Stage 1: Need Recognition
Stage 2: Product Awareness
Stage 3: Development of Interest
Stage 4: Evaluation of alternatives
Stage 5: Purchase decision
Stage 6: Post purchase behaviour

Dr. Umed Raj Tater & Ms. Ishu Chalana : Changing Consumer Behaviour During Novel Coronavirus
117
has never seen and is not aware of), various choices, knowledge of consumer is nil, when
the decision plays an important role.
Models:
1. Howard Sheth Model
Developed by John Howard and Jagdish Sheth popularly known as machine model
considers buying a rational exercise according to which behaviour is systematic. It
considers Input variables (Brand Info, Social Environment, perception and learning),
external (culture, financial status). The buying decision of a consumer a based on these 3
variables which leads to usually repetitive purchase by a consumer. If the choices are
satisfactory enough then this is called 'Psychology of Simplification' and when the product
appears to be boring for the consumer, he searches for a new brand this is 'Psychology of
Complication'.
2. Nicosia Model
It is a system model according to which the behaviour of a consumer depends on
the external stimuli. It focusses on the relation between firm and customers. Buyers
experience conflict while choosing a brand. It is also known as 'Conflict Model'.
3. Learning Model
Based Ivan Pavlov's theory of learning stats that a firm can change the behaviour
of a consumer by manipulating the stimuli and drive through proper use of sales promotion
techniques. Originally being conducted on a dog pavlov noticed that if food is given at a
fixed time after ringing a bell he tends to learn the aspect and if after ringing the bell the
food is not given at that time the dog starts salvating and shows sign of hunger.
4. Psychoanalytical Model
Based on the study of Freud, the model states that consumers have deep rooted
motives which drive him to a particular behaviour. It is necessary to study those drives of
unconscious mind (hidden motives).
5. Economic Model
The model states that a buying decision is made judiciously on rational basis
concerning efficiency, quality, durability, safety, performance price, after sale services of
the product.
6 Sociological Model
According to this a purchase decision is guided by the social group to which a
consumer belong which includes their family, friends, relatives, social class.
Indian Journal Of Business Administration (IJBA)
(A National Peer Reviewed Refereed Journal)
ISSN : 0975-6825, Volume 14, Issue 1, January-June 2021, pp. 114-131
118
Research Methodology
Scope of the Study
The study is conducted to study the impact of the pandemic that has stuck in the
world causing an atmosphere of fear and threat on the buying behaviour of consumers. All
over the globe where the only aim of governments was crying out loudly to make people
understand the value of masks, sanitizers, social distancing. The concept of socializing,
meetings, parties, big fat weddings, get-togethers, movies, travel, festival and celebrations
all took a U-turn and India being a nation where all the purchases are made for the events,
occasions and celebrations. The market suffered a huge setback with no demand for luxury,
fashion goods and only daily purchases of groceries.
Limitations of the study
1. The study was conducted on a small group of population.
2. It was based on the consumers of a particular city (Jaipur).
3. It was conducted on the people of a particular state (Rajasthan)
4. It was conducted in a short span of time.
5. Results are based on the information provided by the respondents. There may be
chances of discrepancy, false information.
Hypothesis
H0: Covid-19 has changed the purchase and consumption pattern of consumers.
H1: Covid-19 has not changed the purchase and consumption pattern of consumers.
Research Design
The study is exploratory in nature, aimed to study the impact of virus on purchase
behaviour of consumers.
Sample
The data was collected from 50 respondents covering both male and female of age
group between 20-40 years of age.
Sources of data collection
Data was collected primarily from the respondents and secondary means of books,
newspapers was also used.
Research tool
Data is collected by means of a questionnaire framed on Google Forms which was
forwarded to respondents and their responses were recorded.

Dr. Umed Raj Tater & Ms. Ishu Chalana : Changing Consumer Behaviour During Novel Coronavirus
119
Data Analysis and Interpretation
Interpretation: The table above shows the classification of sample which is
bifurcated into 52% of male responses and 48% of female responses.
Interpretation: The table above shows that during the time of pandemic
46.9% respondents were impacted by advertising which makes majority,
22.4% were not impacted and remaining were not sure.
Table 1
Table 2

Indian Journal Of Business Administration (IJBA)
(A National Peer Reviewed Refereed Journal)
ISSN : 0975-6825, Volume 14, Issue 1, January-June 2021, pp. 114-131
120
Interpretation: The table above shows that only 6% people went to the market
on daily basis, 32% in 3 days, 32% in a week and remaining 30% fortnightly
which means they stepped out mostly after 7-week days.
Interpretation: The table above shows that maximum respondents i.e.94%
people were within the reach of market and only 6% had difficulty in access.
Table 3
Table 4

Dr. Umed Raj Tater & Ms. Ishu Chalana : Changing Consumer Behaviour During Novel Coronavirus
121
Interpretation: The table above shows that good were easily available to
majority of 61.2% of the sample, 16.3% faced problems and 22.4% were not
sure.
Interpretation: The table above shows that a majority of 69.4% of sample
were satisfied with what was available in the market and 30.6% were not.
Table 5
Table 6

Indian Journal Of Business Administration (IJBA)
(A National Peer Reviewed Refereed Journal)
ISSN : 0975-6825, Volume 14, Issue 1, January-June 2021, pp. 114-131
122
Interpretation: The table above shows that 44% of respondents increased
their consumption, 42% did not and 14% were not sure which reflect an
overall increase in the consumption.
Interpretation: The table shows that people were mainly effected by their
own self opinion which makes 42.9% of sample, then by news 30.6%,
family system 28.6%, social media 16.3% and least by friends which is
12.2%
Table 8
Table 7
Table 8

Dr. Umed Raj Tater & Ms. Ishu Chalana : Changing Consumer Behaviour During Novel Coronavirus
123
Table 9
Interpretation: The table above shows that maximum respondents that is
56% were using cash as the payment method and remaining 44% were
inclined towards card or online payment methods.
Interpretation: The table above shows that 82% respondent’s purchase
behaviour were affected by the risk of the virus and remaining 18% did not
base the purchasing decisions on the fear of virus.
Table 9
Table 10

Indian Journal Of Business Administration (IJBA)
(A National Peer Reviewed Refereed Journal)
ISSN : 0975-6825, Volume 14, Issue 1, January-June 2021, pp. 114-131
124
Interpretation: The table above shows that majority that is 61.2%
respondents were looking for substitute products and the remaining 38.8%
respondents were not.
Interpretation: The table above shows that people were more inclined
towards buying groceries and vegetables these days which was 82% and
were spending very less on lifestyle goods, apparels comprising of only 6%.
Table 11
Table 12

Dr. Umed Raj Tater & Ms. Ishu Chalana : Changing Consumer Behaviour During Novel Coronavirus
125
Interpretation: The table shows that 62% of respondents were purchasing
regularly from the same stores and 38% did not practise that which implied
maximum people followed one mechanical process of buying the article from
a fixed store.
Table 14
Interpretation: The table above shows that 59.2% of respondents were
getting the full financial value of the product and remaining were not
satisfied with the product utility, and its cost.
Table 13
Table 13

Indian Journal Of Business Administration (IJBA)
(A National Peer Reviewed Refereed Journal)
ISSN : 0975-6825, Volume 14, Issue 1, January-June 2021, pp. 114-131
126
Interpretation: The table above shows that maximum people still preferred
buying their favourite brand whereas only 48% switched to other goods.
Interpretation: The table above shows that maximum respondents were not
looking for discount these days and were ready to buy at the available price
which made 54%.
Table 15
Table 16

Dr. Umed Raj Tater & Ms. Ishu Chalana : Changing Consumer Behaviour During Novel Coronavirus
127
Interpretation: The table above showed that maximum people were not
rushing to buy articles i.e. 66% of them only 34% rushed to stock.
Interpretation: The table above shows that 62% respondents purchased from
the nearby shops, 20% from departmental stores and 14% from online
sources.
Table 17
Table 18

Indian Journal Of Business Administration (IJBA)
(A National Peer Reviewed Refereed Journal)
ISSN : 0975-6825, Volume 14, Issue 1, January-June 2021, pp. 114-131
128
Interpretation: The table above shows that 54% of shopkeepers still aimed at
maintain good customer relations.
Interpretation: The table above showed that 52% people preferred buying
packed food items whereas 48% did not.
Table 19
Table 20
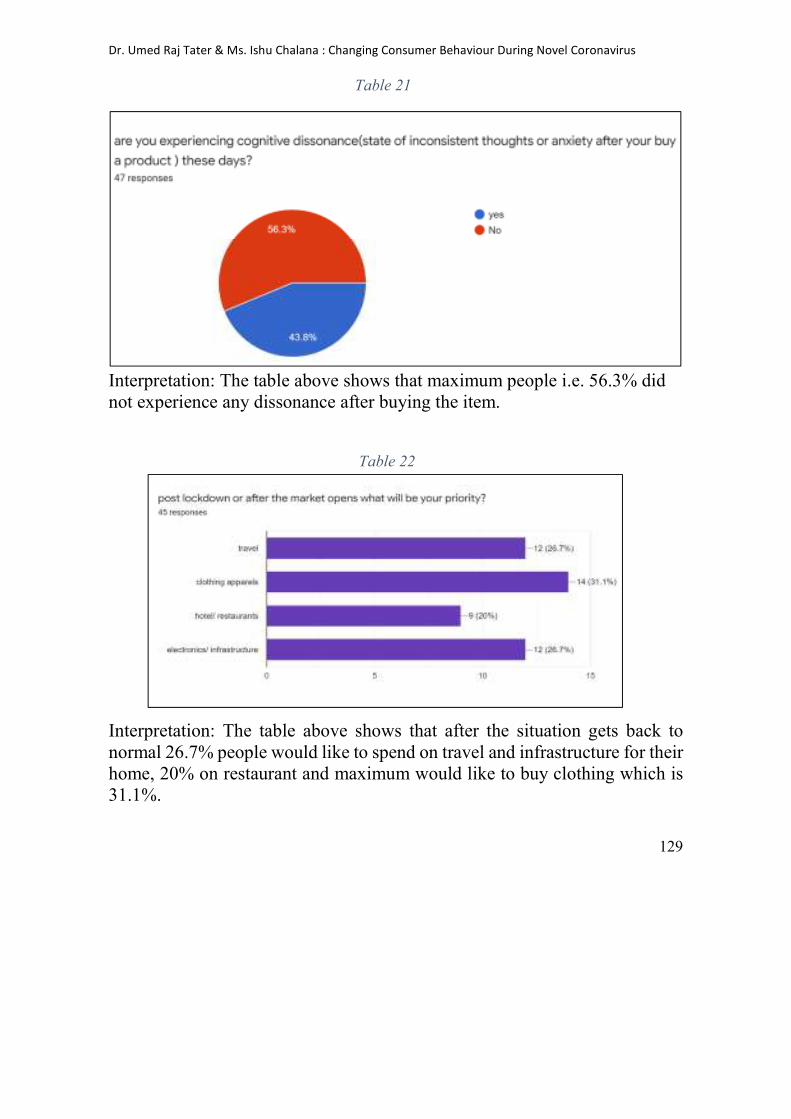
Dr. Umed Raj Tater & Ms. Ishu Chalana : Changing Consumer Behaviour During Novel Coronavirus
129
Interpretation: The table above shows that maximum people i.e. 56.3% did
not experience any dissonance after buying the item.
Interpretation: The table above shows that after the situation gets back to
normal 26.7% people would like to spend on travel and infrastructure for their
home, 20% on restaurant and maximum would like to buy clothing which is
31.1%.
Table 21
Table 22

Indian Journal Of Business Administration (IJBA)
(A National Peer Reviewed Refereed Journal)
ISSN : 0975-6825, Volume 14, Issue 1, January-June 2021, pp. 114-131
130
Conclusion
The study conducted did not show drifting opinion of consumers. They
all had a planned and set pattern of buying the goods as they mainly went
weekly out to buy more of only vegetables and household essentials. Strict
guidelines of government and educated and informed consumer bought very
sensitively in proper quantities without any hush and rush and not creating
any situation of scarcity in the market. The hypothesis of my research has been
duly accepted thereby rejecting the null hypothesis. The saddened era of
pandemic has badly and deeply impacted the lives of general mass in its due
period of almost three years but people fought courageously and sensibly.
Hoping the day comes soon when we will be able to breathe and smile without
masks.
References
• Aiyar Y., Krishnamurthy, M. (2020 april1). COVID-19: Centre and states must
work together/ opinion. The Hindustan Times.
• Boston Consulting Group. (2020, April 6). COVID-19 consumer sentiment
snapshot: fighting in the dark. (ebook)
• Dayansindhu, R. T. K. (2020 april 20). Can Covid-19 spark deep tech innovation?
The Hindu Business Line.
• Dikid, t., Chaudhary, S. K., Singh, S.K. Narain, J. P. (2020). Responding to covid-
19 pandemic: why a strong health system is required. IJMR, 151(2), 140-145
• Kotler, P., Keller, K.L. (2012). Marketing management. Pearson
• Solomon, M. R. (2016). Consumer buying behaviour (12th edition)

Dr. Umed Raj Tater & Ms. Ishu Chalana : Changing Consumer Behaviour During Novel Coronavirus
131
• The Economic Times (2020 April 22). PM Modi ranked top among global leaders
in fight against COVID-19: J P Nadda. The Economic Times
• WHO. (2020 march 12). WHO announces COVID-19 outbreak as pandemic.

Indian Journal Of Business Administration (IJBA)
(A National Peer Reviewed Refereed Journal)
ISSN : 0975-6825, Volume 14, Issue 1, January-June 2021, pp. 132-136
132
ROLE OF ARTIFICIAL INTELLIGENCE IN ENHANCING E-COMMERCE
Dr. Champa Devi Maurya*
ABSTRACT
AI is a study of how human brain think, learn, decide and work, when it tries to
solve problems. The main purpose of Artificial Intelligence is to improve computer
functions which are related to human knowledge, like reasoning, learning, and solving
problems. E-commerce is now adopting this technology to identify patterns based on
browsing, purchase history, credit checks, account information transportation etc. Many
e-commerce businesses have started implementing various types of Artificial Intelligence
for understanding customers, and provide them a better customer experience. Now a day’s
AI has become a very important force for the development of e-commerce. Artificial
Intelligence gives customers an enriched experience which in return helps them to
maximizing profits. Machine learning system, a part of Artificial Intelligence, it solves
the inconvenience related with human intelligence and helps to make better logistic speed
and quality. This paper highlights the role of artificial intelligence in enhancing e-
commerce in different forms.
Keywords: Artificial Intelligence, E-Commerce, Optimize, Enhancing, Logistics
Introduction
Artificial Intelligence is an intelligent device that is created by human beings.
It is capable of performing tasks smartly without being openly instructed to do so. AI
is very smart in handling the customer data and forecasting the purchase behaviour of
customers. This has brought the high level of automation in the e -commerce industry.
We make use of AI in our daily lives without even realizing it. For example Spotify,
Siri, Google Maps, YouTube, Search, protection and prevention from Fraud, etc., all
of these applications make use of AI for their working. The main aim of AI is to
facilitate computers and machines to perform smart tasks like problem solving,
decision making and understanding human communication. It has a great impact on
our quality of life.
*Assistant Professor, SBJS Rampuria Jain College, Bikaner, E-commerce is the buying

Dr. Champa Devi Maurya : Role Of Artificial Intelligence In Enhancing E-Comme
133
and selling of goods and services over the internet. Almost anything can be purchased
through e-commerce today. Examples of e-commerce sites are Amazon, Nykaa, Myntra,
etc. E-Commerce is providing unique non-cash payment features, 24x7 availability of
services and improved sales. The models of E-commerce are:
1. Business-to- Business (B2B)
2. Business-to- Consumer (B2C)
3. Consumer-to- Business (C2B)
4. Consumer-to-Consumer (C2C)
5. Government-to- Business (G2B)
6. Government-to- Citizen (G2C)
Application of AI in E-Commerce
Artificial intelligence is becoming more mature and is smartly changing the
way people work and live, especially in the field of E-commerce, AI has gradually
developed into a powerful tool to increase sales growth and maximize e-commerce
operations. Most large e-commerce players have adopted AI to make product
recommendations that users might be interested in, which has led to considerable
increases in their sales. Artificial intelligence is a self-learning algorithm which is
creating personalized shopping experiences for online buyers. At present, the
application of AI is used in the field of e-commerce is as follows:
1. Chatbots: It automatically responds to customer questions and recommend
product using a natural language processing system. Chatbots helps to find suitable
products for consumers, check the supply of products, evaluate products, and help
consumers to pay. If there are any complaints, chatbot can help customers to contact
the corresponding service personnel. Consumers can talk to the robots through text,
voice and even pictures. Labour costs reduced through effective use of chatboats, user
experience optimized, service quality improved, and wealth maximize. They are now
serving customers in odd-hours and peak hours as well.
2. AI Detection of Fake Reviews and Filtering Spam: Customers feedback is very
important terms that is necessary for customer trust in the E-Commerce shopping.
Customer positive feedback on products help other customers to make buying
decisions, but due to the huge volume of reviews it would be impossible for human
eyes to scan through them to filter out malicious content.
3. Optimising Voice Search: Voice is slowly replacing text based search in online
shopping. Voice recognition accuracy is continuously improving. Almost 80% of

Indian Journal Of Business Administration (IJBA)
(A National Peer Reviewed Refereed Journal)
ISSN : 0975-6825, Volume 14, Issue 1, January-June 2021, pp. 132-136
134
requests are made in a natural language with Google assistant. Apple’s HomePod
powered by Siri is a voice controlled personal device.. Another example is Amazon’s
Echo powered by Alexa. Today, people are relying on voice assistants like Alexa, Siri
to find out about a product to buy it online. Artificial Intelligence helps in finding
exact products through various parameters.
4. Supply-Chain: Forecasting of demand for different products at different time
frames is possible through AI, so that they can manage their stocks to meet the
demand. Inventory forecasting is not simple task in rapidly changing competitive
markets, So, artificial intelligence can help to order cycle and calculate the influence
of these factors on turnover and inventory. Now a day’s AI is become smarter and
making it more accurate for businesses to predict inventory demand.
5. Recommendation Systems: It was powered by artificial intelligence to assist
customers to quickly discover the items they were looking for. Amazon’s home
assistant, Alexa is also artificial intelligence enabled virtual shopper assistant. It
provides the customer modern shopping experience and only needs to verify your
voice pattern to process the order. This is one of the main reasons why companies
have been investing in them since the early 2000s.
6. Auto-Generated Product Descriptions: Product descriptions are used by
customers to make purchase decisions. It influences customers decision. AI helps in
content generation tools, E-Commerce use the power of AI to create descriptions that
tackle the interest of the buyer. The AI reply customer queries solve their problems
and even identify new opportunities for the sales team. Those products and services
will not be offered to the customers whom are inappropriate for online shopping.
7. Personalized Search: The E-commerce industry is transforming by artificial
intelligence in online shopping, it predicts shopping patterns that shopper buys when they
want. For example, if online shoppers regularly buy a particular brand of product, then
the online retailer could send a personalized offer to these shoppers for this product, or
even use a machine learning-enabled recommendation for a supplementary product that
goes well with grocery products.
8. Virtual personal shoppers: Customers can have direct conversation with a shop
assistant to enquire about a specific item in an offline store. These smart virtual
shoppers will actively engage with the customers. Customers will now be able to
talk to these virtual assistants and solve their queries. They do not have to select
options by r entering specific words.

Dr. Champa Devi Maurya : Role Of Artificial Intelligence In Enhancing E-Comme
135
9. Upgrading delivery method: Once customer buys any product on any E-
Commerce website, they want it to be delivered as soon as possible. Amazon even
offers prime membership that allows customers to avail same day or one day delivery.
The future application of AI will witness robots delivering products at doorstep; it is
the power of AI and data-driven innovation.
10. Virtual Reality and Augmented Reality: The use of virtual reality and
augmented reality can be used to create systems that give customers to have fantasy
of shopping in the real store. The E-Commerce industry can have real-time access to
customer data and systematically identify opportunities for selling its products. This
is one of the best applications of AI for E-Commerce.
11. AI based hiring processes: HR department can reduce their work by using AI
technology in many ways. For example, sorting of application, screening applications,
keep applications with most match preferences, arranging face-to-face interview can
be automated through AI technology, by using software as a service product. This
reduces the work load of HR departments by using AI technology for best candidate
selection.
12. Re-commerce: As the name suggests, re-commerce refers to the resale of
products that were owned by others previously. E-Commerce stores can work with
AI to design, develop, and implement systems that explore this opportunity. It makes
the world leaning towards sustainability & environmental friendliness.
Future of Artificial Intelligence: Artificial intelligence is not only important
for the industry but for the human being also in the coming future, it acts as the main
driver of emerging technologies like big data, robotics and IoT. AI will have more
impact on the quality of life. Virtual assistants in everyday life, helping us save time
and energy. The future of Artificial Intelligence is inspiring and will come with high
intelligence.
Conclusion: Artificial Intelligence has emerged to be the next big thing in the
field of technology. It has impacted almost every industry AI makes every process
better, faster, and more accurate. This technology has many applications such as
identifying and predicting fraud transactions, accurate credit scoring, and manage
huge amount of data automatically. Artificial Intelligence provides better
management process of industries and also helps in developing new solutions to
problems which is very cumbersome manually. Artificial intelligence in E-commerce
industry is helpful to online retailers for providing chatbot services, evaluate customer
comments, and provide personalized services to online shoppers.

Indian Journal Of Business Administration (IJBA)
(A National Peer Reviewed Refereed Journal)
ISSN : 0975-6825, Volume 14, Issue 1, January-June 2021, pp. 132-136
136
References
• Pannu Avneet,(2015). Artificial Intelligence and its Application in Different
Areas. International Journal of Engineering and Innovative
Technology (IJEIT) Volume 4, Issue 10.
• Shyna K and Vishal M (2017). A Study on Artificial Intelligence in E-
Commerce. International Journal of Advances in Engineering & Scientific
Research, Volume 4,(Issue 4, June-2017), pp 62-. ISSN: 2349 –3607 (Online),
ISSN: 2349 –4824 (Print),
• Gupta Siddharth, Borkar Deep, Chevelyn De Mello, Patil Saurabh,(2015). An
E-Commerce Website based Chabot. International Journal of Computer
Science and Information Technologies (IJCSIT), Vol. 6 (2).
• Sahu Mausami, (2016). Plagiarism Detection Using Artificial intelligence.
International Journal of Scientific &Technology Research, Volume 5, Issue
04.
• Dr. Gawali S. N., (2019). Artificial Intelligence in E-Commerce. International
Journal of Management and Economics, ISSN: 2231 – 4687,Vol. I No. 28.
• Delfmann, W., S. Albers, and M. Gehring, (2002). The impact of electronic
commerce on logistics service providers. International Journal of Physical
Distribution & Logistics Management, 2002. 32(3): p. 203 -222.
• Nadikattu, Reddy Rahul, (2019). New Ways in Artificial Intelligence.
International Journal of Computer Trends And Technology.
• Shukla Saloni, Joel Rebello, Threat of automation: Robotics and artificial
intelligence to reduce job opportunities”, http://economictimes.indiatimes.com
• http://www.optimonk.com
• http:/www.dzone.com

Indian Journal Of Business Administration (IJBA)
(A National Peer Reviewed Refereed Journal)
ISSN : 0975-6825, Volume 14, Issue 1, January-June 2021, pp. 137-144
137
A STUDY ON IMPACT OF GOODS AND SERVICE TAX (GST)
ON INDIAN BANKING SECTOR
Dr. Suresh Purohit*
ABSTRACT
Banking sector acts a very vital role in a macro economic and monetary
policies of any country overall context and the business dynamics of this sector largely
varies from other sectors. The regulatory bodies for this sector is very strong and
leaves no possibility for any differences. Unlike, other businesses where there are
many un-organised ways of style of workings still exist, same is not the case with this
sector which is largely organised in nature. Therefore, any issues for this sector has to
be closely looked at and timely resolved so to that larger economic interest of the nation
is achieved. This article lay down various disputes that a Banking sector may look due
to introduction of GST and the implications so as to improve the rules, wherever required
to be address the negative effect of Goods and Service Tax (GST) on the Banking sector.
Various aspects discussed with this would apply to all types of banks viz., Nationalised
Banks, Private Banks, Public Banks, Co-operative Banks etc.
Keywords : GST, Banking sector, Co-operative Banks
Introduction
With the development of ancient civilizations, the tax system has also evolved.
Taxes are levied by the government in any country for the purposes of welfare and
development activities as well as defense and maintenance of law and order. Through the
government tax system, the government also tries to make provision for public goods to
meet the collective needs of the people of the country. The
* Principal Basic P.G. College, Bikaner

Dr. Suresh Purohit : A Study on Impact of Goods and Service Tax (GST) on Indian Banking Sector
138
introduction of GST is proving to be an important step in the reform of indirect taxation
under the Indian tax system. In the tax system implemented earlier, there was a system of
separate taxes by the central and state governments on many products, due to which the
common consumer had to pay tax on the same product multiple times.
The implementation of GST has got rid of double taxes on various products.
GST can be termed as "one tax, one nation and one market". GST is building an impact
on every business sector in the country, including service sector. The service sector like
banking, insurance and other financial services. The impact of GST has been also
affected banking sector. In the Economic Development of the country, banking sector
plays a huge role. To growth of business banks provide finance or money to
businessmens as well as needy people. Finance and Money have been treated as blood
of the business cycle. Banks also accepting deposits from the public. In India the
banking system is undergoing structural transformation under the deregulation,
institutional, technological advances, legal, taxation reforms and influence of
globalization.
Objectives of the study
� To study the critical implications of GST on the banking sector.
� To study the issues and challenges of banking sector after implementation of
GST.
� To know the tax rates variations of banking sector after GST.
� To explore the impact of GST on customers of the banks.
An overview on GST
Goods and Services Tax, popularly called GST, is applicable on the supply of
goods and services. It has replaced the taxes like excise, VAT, and service tax. The main
objective behind the
introduction of GST by the Central Government is to introduce a uniform taxation
system in the country and at the same time allow full tax credit from the purchase of
inputs and capital goods. GST can also be seen as an aspect of eliminating the
cascading effect of cost of production and distribution of goods and services.
Critical implications of GST on the Banking Sector
The framework under the Law of Model GST does not allow a lot of benefits or
consideration to banks for understanding the type of transactions they make constantly
and on a great scale. Some impacts and issues relating to the provisions in the Law of
Model GST are discussed below:

Indian Journal Of Business Administration (IJBA)
(A National Peer Reviewed Refereed Journal)
ISSN : 0975-6825, Volume 14, Issue 1, January-June 2021, pp. 137-144
139
A. Registration has become a problem : During the pre-GST administration,
banks could release its service tax abidance by a single centralised registration process.
Now, under the current GST regime, these banks need to get distinctive registration for
each separate state that they work into. Along with the burden of GST compliance, the
filing of returns has also expanded liberally wherever periodicity of returns, level of
details needed in such returns and number of return formats are concerned.
B. Leveraging and De-Leveraging input Tax Credit (ITC) : Banks had an
option of reversing 50% of CENVAT credit which was availed against the inputs and as
well as input services, while CENVAT credit for capital goods was available without a
reversal condition, during the pre-GST regime.
C. Adjudication and assessment made difficult : The assessment was
performed by the state regulators under which a specific branch is registered in the
previous tax regime. After implementation of GST, it is compulsory that all registered
branches of banks will need to justify their position as per their chargeability in a State
and also a acceptable cause for using ITC (Input Tax Credit) in different states. As far as
judgement is concerned, the process will be prolonged owing to more than one judging
authority and the difference in their opinions on a similar underlying issue. Under the pre-
GST regime, a taxpayer was adjudged by only one adjudicating authority for an issue.
Under GST, dealing with the difference in the opinion by different authorities has
become difficult.
Issues and challenges of Banking Sector
1. Separate registration for each state where they operate : All banks in
India had a centralized registration for all its branches before implementation of GST.
Now, after the implementation of GST 2017 act, the banks having branches in more
than one state will required to obtain registration in each state in the GST regime. It
creates compliance burden about filling of multiple returns state-wise, multiple audits
and assessments.
2. Determining place of supply could be critical :
� As per the records of supplier of services, place of supply of services for
banking shall be the location of recipient of services.
� If the location of the recipient of services is not available on the records of
the supplier, then the place of supply shall be the location of the supplier.
� However what constitutes the “records of the supplier” is not defined in the
law leading to multiple interpretations as to whether it is to be understood

Dr. Suresh Purohit : A Study on Impact of Goods and Service Tax (GST) on Indian Banking Sector
140
as accounting records or customer records, vendor records so on.
3. Interstate transaction between the same Banks at two branches is
taxable : Before implementation of GST, transactions between two branches of the
same bank had exempted for tax under service tax rules, but under GST Act 2017,
these transaction would be attract chargable under Integrated Goods and Services Tax
(IGST).
4. Actionable claims : Actionable claims did not consist any tax before July,
2017 but after implementation of GST these actionable claims are also now included in
the meaning of supply of goods. So these are taxable under GST Act.
5. Interest is taxable : Pre GST implementation interest income and discount
provide by the banks are under negative list, so no tax can be payable under service
tax. But now
under GST service is defined in wide manner to cover anything (other than goods),
which may also cover interest. In other parts of the world does not levy GST on
interest, India is only the country levy tax on interest.
6. Increase in compliance : Almost every bank has a multi state presence, and
under GST, they are required to pay taxes at the state and central level therefore, banks
are required to get registration of for each state where they function. In order to
maintain this, they require separate books for every branch to create proper control over
their usage. This has led to an increase in compliance levels. Therefore increase in
compliance is one of the major GST implications and challenges. Along with the burden
of GST compliance, return filing has expanded liberally where the periodicity of returns
and number of return formats are concerned.
7. Revenue recognition under GST : Banks and NBFCs may face issues
regarding to revenue recognition as the majority of their services are related to the
different sectors and segments.
8. Account related financial services : In the digitalization era,
professionals, businessmen, and others can get different types of services anywhere across
the country, and there is a possibility that they may move to a new location. This can
cause hardship due to different address. On the other hand, branches provide different
types of services relating to payment and other goods, within the state and outside the
state, to determine the place where these services are provided would be a tough deal.
9. Financial services not related to account : Providing financial services to
people who are running a business from a remote location and managing a bank account
from different location may cause GST implications and challenges because the area of

Indian Journal Of Business Administration (IJBA)
(A National Peer Reviewed Refereed Journal)
ISSN : 0975-6825, Volume 14, Issue 1, January-June 2021, pp. 137-144
141
the service provider is different from the area of the operator.
10. Transactions affected by GST : Loans given by NBFCs and banks are not
affected, because these are money to money transactions. Therefore no GST on loans
and interest charged there on. In NBFCs or banks, lease may be either supply of services
or supply of goods both attracts GST charges that is similar to goods and services that is
being leased. Under Hire purchase process, where the buyer of an asset pays regular
instalments and takes asset possession from the beginning of the agreement, but the
ownership is transferred only when all instalment are paid. In this, cost price and
charges of leasing are applicable to Goods and Service Tax.
Positive impact of GST (Goods and service tax) on Banking Industry :
The benefits to the banking industry are as follows:
� Banks would be able to set off their GST obligations against credit received
on goods purchase.
� Banks were qualified to take credit of excise duty and service tax on purchase of
qualifying goods and services Under the CENVAT system, which is used for
provision of output service, but under GST, banks will take input tax credit,
which shall be used by banks for payment of output liability.
� Banks don’t receive ITC (Input Tax Credit) of State VAT paid on purchase of
any goods by them as all of the indirect taxes is included in GST, banks would
be able to take credit of GST paid on purchasing of goods also.
� GST may lead to minimizing tax evasion. Carrying on business would be
easier, and the increase in business may lead to additional demand of fund,
which in turn lead to increase in transactions in the bank as the business and
present developments go for digital transactions.
Positive impact of GST also includes self regulatory taxation system with
transparency, uniform taxation rate, and it can increase the number of online banking. In
contrast, the GST implications and challenges would include costlier banking for
customers etc.
Tax rates imposed by banks :
� Before GST Act 2017, the rate of service tax was 15 percent, but after GST
implementation it increased to 18 percent tax rate.
� No Centraliziation registration is possible under GST regime. Banks need
to register separately if they open branch for every state. They can have

Dr. Suresh Purohit : A Study on Impact of Goods and Service Tax (GST) on Indian Banking Sector
142
only one registration for many branches in one state.
� An annual return and three times a monthly return are to be furnished by the
bank.
� As per definition of Service provided by section 2(102), Service means
anything that is other than goods. By interpreting it in that way interest earned
by banks is responsible to be taxed in GST. Further according to Schedule
III, which describes activities or transactions should not be treated as supply
of goods and services. So, No exemption is provided to any banking
services. The Indian GST law should make clear whether the ambit of GST
includes or excludes the interest on GST.
� Inter sale as well as Purchase of Foreign currency by banks or authorized
dealers of foreign exchange are liable to be taxed in GST since no exemption
is provided.
� Services by RBI are liable to be taxed in GST since no exemption is
provided to them also.
� As GST is considered a supply tax regime, so for every kind of transaction,
banks should determine the place of consumption and payment of GST.
� GST increases the cost of capital as under GST 50 percent of CENVAT is
charged which is then reversed, reducing credit of about 50 percent.
� Pension - not taxable
� Deposits - not taxable
� Debit and credit cards -18%
� Loan - 18%
� Investments - 18%
� Banking facilities - 18%
� Remittances (RTGS, NEFT) - 18%
� Insurance -18%
� ATM - 18%
� Input tax credit -18%
� Foreign exchange - 1% of gross rupee.
Difficulties to Banking Industry :
� Every bank need to register for their all office location.
� They have to maintain separate books of accounts for every state where they
registered.
� They have to make auditing of the financial statements for each place where they
Indian Journal Of Business Administration (IJBA)
(A National Peer Reviewed Refereed Journal)
ISSN : 0975-6825, Volume 14, Issue 1, January-June 2021, pp. 137-144
143
registered.
� The tax burden is increased because tax rate is increased to 18% compared
to earlier service tax of 15%.
� The another difficulty is that the IT software systems of banks, which are
needed to update.
� Lack of skilled resources is also a main problem for banking industry.
� Lack of training with updated GST subject knowledge.
Impact of GST on customers of Banks :
� AMC of debit and credit card increased due to GST implementation.
� Due to GST implementation on Banking industry Loans charges are also
increased because of increase in 3% of tax rate.
� Mutual funds also affected to customers after implementation of GST.
� ATM Services charges are also hike and become costly after implementation
GST.
Conclusion
The GST system is launched to restructure for simplify current indirect Tax
system in India. In the beginning of GST implementation, all the sectors were facing
many difficulties. But this system will help to improve the current taxation system and will
further help to reduce the inefficiencies in the present taxation system. This new system
will provide so many advantages like reduced complaints and complexities, unified tax
system etc. May be the last consumer will find its cost a bit higher, but it will remove all
the discrepancies. GST also impact on the working cost of banks, they will also face a
higher cost due to mandatory registration and inter-state goods and service tax.
Overall, the impact of GST on Banks reflects to be such that operations of banks,
transactions of banks, accounting and compliance should be reconsidered in its totality
and ultimately, there is need for more analytical based research for successful
implementation.
References
• ATM money withdrawal limits is decreased by SBI.
• Mujalde, S., Vani, A. (2017). Goods and Service Tax (GST) and its outcome in
India. Journal of Madhya Pradesh Economic Association, 27(1), 1-4.
• Tewari, V. K. (2018). Goods and Service Tax. GST Simplified Tax System :
Challenges and Remedies, 1(1), 173

Dr. Suresh Purohit : A Study on Impact of Goods and Service Tax (GST) on Indian Banking Sector
144
• Yadav, S. S., Shankar, R. (2018). Goods and service tax (GST): how and why.
Journal of Advances in Management Research, 15(1), 2-3.
• Banerjee, S., Agrawal, P. (2018). Impact of Goods and Service Tax after
Implementation. Global Journal of Management and Business Research, 18(2),
1-6.
• Bedi, Balwinder., Kavish, Sharma (2017). Moving to goods and service tax in
India: Impact on India’s growth. International Journal of Engineering Research
& Manage- ment Technology, 4(3), 120-128.
• Article on “Impact of GST On the Banking Sector in India” published in
gsthelplineindia.com on 09-10-2017.
• Article on “The impact of GST on banking transactions, Insurance and
Investments.” published in www.equitymaster.com dated on 11- 07-2017
• G.Meena (2018) Impact of GST on Banking Sector
http://www.ijirms.com/downloads/ 0202201801-02-2018.pdf
• B.Savithri (2018) GST It’s Impact On Banking Sector http://ijrar.org/papers/
IJRAR190A051.pdf?? Revathi R (2018) Impact of Implementation of Goods and
Ser- vice Tax on Indian Banking Sector
• Pavankumar G Kulkarni (2018) Impact of GST on banks – issues and challenges
https://acadpubl.eu/jsi/2018-118-14-15/articles/15/8.pdf

Indian Journal Of Business Administration (IJBA)
(A National Peer Reviewed Refereed Journal)
ISSN : 0975-6825, Volume 14, Issue 1, January-June 2021, pp. 145-155
145
SAVING AND INVESTMENT BEHAVIOR OF RURAL HOUSEHOLDS
IN THE BHIWANI DISTRICT OF HARYANA
Sharmila Singh*
Dr. Ishwar Mittal**
ABSTRACT
Money works like blood in business as well as at home. In business, a
businessman invests money to gain profits, but at home, a household spends its money on
its consumption. The households manage their money for routine expenditure, education
and marriage of children, and other family functions. Households save money so that
they can spend more in the future. A decision about when to spend and save money is
very complicated. All these financial decisions are dependent on monthly income,
disposable income, total wealth, interest rates, and preferences for saving or spending.
People have different habits towards saving and investments. Many people believe in
holding some part of their income, but others believe in spending their income to meet
present needs and think the future will care for itself.
The present paper is based on a study of rural households’ behavior towards
savings and investments. The present study was conducted through a primary survey of
89 rural households in the Bhiwani district in Haryana, India. There are differences
found in rural and urban households’ savings and investment patterns. Rural people,
after meeting their daily needs and requirements, are left with very little income to save.
This study shows that rural households in India have low financial literacy and they do
not have proper knowledge about financial services and products.
Keywords: Saving and Investment Behavior, Rural Households, Financial
Literacy, Income.
* Research scholar, Institute of Management Studies and Research (IMSAR), Maharshi Dayanand University, Rohtak
** Assistant Professor, Institute of Management Studies and Research (IMSAR), Maharshi Dayanand University, Rohtak

Sharmila Singh & Dr. Ishwar Mittal : Saving and Investment Behavior of Rural Households in the Bhiwani District of Haryana
146
INTRODUCTION
Saving is a part of income that cannot be spent. There are various methods of
saving, such as bank accounts, pension accounts, post office accounts, securities, mutual
funds, insurance, gold, cash, and other investment schemes. Savings reduce personal
expenditure. Savings and investments are different from each other because people save
money it does not mean they invest money. People save money to fulfill their future
needs, but they invest money to increase their future earnings and profits. There is a
positive relationship between saving and the economic growth of a nation also (Alguacil,
Cuadros, and Orts, 2004). People invest their money in different ways, such as bank
deposits, insurance, real estate, security, like government bonds, equity shares,
debentures, preference shares, and mutual funds, etc. Among all explained investments,
bank deposits are the best and safest mode preferred by rural households, and investing in
equity shares is the most profitable and risky mode of investment and is not preferred by
rural households. Most of India's population lives in rural areas and most of them engage
in agricultural activities. With technological development, people in the village have
improved their methods of cultivation and the quality of their grains.
Researchers found a sensible line in a famous forbs magazine: "Money is not
everything in life, but make sure that you have earned it a lot before starting thinking like
this". The quoted line shows the need and importance of money in a person’s life. It also
increases a person’s involvement in earning more money in his/her life and managing
earned money for the future. Earn more money is a task in which a person uses his/her
physical and mental ability, but he/she manages money with their mental ability. The
mental ability of a person is directly linked with his/her financial behavior. Financial
behavior and financial management have become essential facts for every person at
present time. The need for financial knowledge is not always for investing activities and
earning more money, but it helps us with carefully spending money, saving money, and
investing money for the future.
The basic rule of the economy is "resources are scarce and wants are unlimited",
so, according to this rule, all of us need to manage our finances properly. Sometimes, our
financial capability shows an imbalance to live up to our wants and expectations. In this
situation, a person realizes the need and importance of financial knowledge for his/her
routine life. Financial knowledge, financial attitude, and financial behavior are all part of
financial literacy.
Review of Literature
To assess the saving and investment behavior of rural households, it becomes
vital to review the existing background of an equivalent. A literature review is a

Indian Journal Of Business Administration (IJBA)
(A National Peer Reviewed Refereed Journal)
ISSN : 0975-6825, Volume 14, Issue 1, January-June 2021, pp. 145-155
147
description of the prior literature relevant to a particular area or topic. It gives an
overview of the area of inquiry: what has already been said on the topic by the key
writers. It also gives an idea about the research methodologies and methods which are
appropriate and useful for the present study. It also helps to find some gaps in the existing
literature. In order to have a convenient study and a better understanding of the facts, it
has been classified as follows:
S.No. Author, Year Title Key Findings
1. Carswell,
2009
“Does Housing
Counseling Change
Consumer Financial
Behaviors? Evidence
from Philadelphia”
He found that some aspects of
borrowers’ financial performance were
significantly affected by housing
counseling.
2. Tamimi and
Kalli, 2009
“Financial Literacy
and Investment
Decisions of UAE
Investors”
They found a positive relationship
between financial literacy and
investors’ investment decisions.
3. Muradoglu
and Harvey,
2012
“Behavioural
Finance: The Role of
Psychological Factors
in Financial
Decisions”
They found that psychological factors
affected the decision power of
investors, but all the factors affected the
various degrees of influence.
4. Lim, Soutar
and Lee, 2013
“Factors Affecting
Investment
Intentions: A
Consumer Behaviour
Perspective”
They found that product knowledge and
product involvement both significantly
influenced the investment intentions of
consumers.
5. Nye and
Hillyard,
2013
“Personal Financial
Behavior: The
Influence of
Quantitative Literacy
and Material Values”
They found that subjective numeracy
and quantitative financial literacy were
significantly related to financial
behavior.
6. Shih and Ke,
2013
“Determinates of
Financial Behavior:
Insights into
Consumer Money
Attitudes and
Financial Literacy”
They concluded that attitude and
financial literacy positively influenced
the financial behavior of consumers.

Sharmila Singh & Dr. Ishwar Mittal : Saving and Investment Behavior of Rural Households in the Bhiwani District of Haryana
148
7. Bhabha,
Khan,
Qureshi,
Naeem and
Khan, 2014
“Impact of Financial
Literacy on Saving-
Investment Behavior
of Working Women
in the Developing
Countries”
The study found that working women
were poorly financially literate and they
depended on male members of their
family for financial matters.
8. Grohmann
and
Menkhoff,
2015
“School, Parents, and
Financial Literacy
Shape Future
Financial Behavior”
They found that the parents’ teaching
and level of education positively
affected the children’s financial
behavior. The education in school also
influenced the financial behavior of the
students.
9. Sharma and
Joshi, 2015
“Financial Literacy
of Women and its
Effect on their
Investment Choice
Decision”
The study revealed that working
women lacked financial knowledge and
confidence to make good financial
decisions.
10. Jamal,
Ramlan,
Mohidin and
Osman, 2016
“Determinants of
Savings Behavior
among University
Students in Sabah,
Malaysia”
The study found that the variables self-
control, family references, financial
literacy, and peer group positively
influenced the saving behavior of the
students.
11. Sharma and
Singh, 2016
“Awareness of
Households towards
Financial Services: A
step towards
Inclusive Financing”
They concluded that the income level,
occupation, and educational
qualifications were significantly related
to the awareness of households.
12. Widyastuti,
Suhud and
Sumiati, 2016
“The Impact of
Financial Literacy on
Student Teachers’
Saving Intention and
Saving Behaviour”
The study showed that financial literacy
and saving intentions positively
influenced the saving behavior of
student teachers and financial literacy
did not have an impact on the saving
intentions of student teachers in Jakarta.
13. Pathy, 2017 “Saving and
Investment Habit of
Rural Households in
Cuttack District of
Odisha”
He found that most rural households
saved their money in banks and post
offices but didn’t know about
insurance, shares, and gold
investments.
14. Alekam, “The Effect of Family,
Peer, Behavior, Saving
The results showed that there is a
positive relationship between family,

Indian Journal Of Business Administration (IJBA)
(A National Peer Reviewed Refereed Journal)
ISSN : 0975-6825, Volume 14, Issue 1, January-June 2021, pp. 145-155
149
Salleh and
Mokhtar,
2018
and Spending Behavior
on Financial Literacy
among Young
Generations”
peer group, personal behavior, and
financial literacy.
15. Shetty, 2018 “A Study on Personal
Financial Planning
Attitudes of
Individuals in Nilai”
A study showed that the financial
attitude and eternal locus of control
highly influenced the personal financial
planning behavior of individuals.
16. Azeez and
Banu, 2019
“Rural
Transformation
through Financial
Literacy: A Study of
Aligarh District”
They found that socio-demographic
variables positively influenced the
financial literacy and financial behavior
of households.
17. Baker,
Kumar, Goyal
and Gaur,
2019
“How Financial
Literacy and
Demographic
Variables Relate to
Behavioural Biases”
They revealed that financial literacy
and demographic variables were
positively related to the behavioural
biases of individual investors.
18. Jayanthi and
Rau, 2019
“Determinants of
Rural Household
Financial Literacy:
Evidence from South
India”
They found that education level, marital
status, type of family, and bank
relationships positively affected
financial literacy.
19. Zulaihati,
Susanti and
Widyastuti,
2020
“Teachers’ Financial
Literacy: Does it
Impact on Financial
Behaviour?”
They concluded that financial literacy
developed the decision-making power
of teachers towards their shopping,
saving, and future financial planning.
Need for the Present Study and Research Gaps
The prior studies showed that although many studies conceptual as well as
descriptive are conducted on financial behavior in India and abroad, Many studies are
analyzing the saving and investment behavior of various respondents, such as students,
investors, teachers, young people, women, and individual households, but only a few
studies have assessed the saving and investment behavior of rural households in Haryana.
So, there is a need for a fresh attempt to assess the status of saving and investment
behavior among the rural households of Haryana in India.

Sharmila Singh & Dr. Ishwar Mittal : Saving and Investment Behavior of Rural Households in the Bhiwani District of Haryana
150
Objectives of the Study
The main objectives of the present study are as followed:
• To identify the factors which influence the saving behavior of rural households.
• To observe the saving preference tools of rural households.
Research Methodology
The present study is descriptive by nature and there is an application of the
quantitative research method. In this study, researchers collected data from 89 rural
households using a well-structured questionnaire. In this questionnaire, questions
consisted of demographic profile, the purpose of savings and investments, selection
factors for savings and investments, sources of information, and options for savings and
investments of rural households. A similar method of study was used by Pathy (2017) in
his study. The questionnaire has been developed by taking the reference of Pathy (2017).
"The research population is built from a group of people who meet the requirements of
research objectives" (Newman, 2012; Cavana, Delahaye and Sekaran, 2001). For the
present study, the population has been decided by individual households from a rural area
in the Bhiwani district of Haryana. In the present study, the sample has been selected
using the convenient non-random sampling method. This study survey was conducted
through personal interviews with respondents. To observe appropriate results, researchers
used the percentage method and concluded this study.
Data Analysis
Researchers collected data for this study on various aspects of rural households,
such as their demographic profile, purposes of saving and investment, options for saving
and investment, and sources of information about these options for saving and
investment. All the above explained aspects are analyzed by researchers with the help of
the percentage method below.
Table: 1. Demographic Profile of Rural Households
S.
No. Category No. of Respondents Percentages
1. Gender:
a. Male
b. Female
51
38
57.303%
42.697%
2. Age Group
a. 30-40
b. Above 40
37
52
41.573%
58.427%
3. Educational Level
a. Above Matric
b. Below Matric
63
26
70.787%
29.213%

Indian Journal Of Business Administration (IJBA)
(A National Peer Reviewed Refereed Journal)
ISSN : 0975-6825, Volume 14, Issue 1, January-June 2021, pp. 145-155
151
4. Occupation
a. Agriculture
b. Government Job
c. Private Job
d. Other
34
21
28
06
38.202%
23.596%
31.461%
6.741%
5. Income Level
a. 50,000-1,00,000
p.a.
b. 1,00,001-
5,00,000 p.a.
c. More than
5,00,000 p.a.
13
48
28
14.607%
53.932%
31.461%
Sources: Primary data collected by authors
Table 1 shows the summary of the demographic profile and socioeconomic status
of the respondents. It shows that the percentage of male respondents is 57.303% and the
percentage of female respondents is 42.697%. 41.573% of the respondents fall into the
age group of 30-40 years and 58.427% of respondents are above 40 years old. The
majority of the respondents, i.e. 70.787% in our study, are above matric in their
educational level, followed by 29.213% having below matric level. The proportion of
respondents from agriculture, government jobs, private jobs, and other jobs are 38.202%,
23.596%, 31.461%, and 6.741% respectively. The number of respondents having an
income level between 50,000-1,00,000 p.a. is 14.607%, between 1,00,001-5,00,000 p.a.
is 53.932% and those respondents having an income of more than 5,00,000 is 31.461% of
the selected sample.
Table: 2. Purposes of Saving and Investment of Rural Households
S.
No.
Purpose of Savings/Investments No. of Respondents Percentage
1. Sources of Income 14 15.730%
2. Children’s Education and Marriage
etc.
43 48.315%
3. Acquisition of Home/Land 21 23.595%
4. Safe Way to Keep Money 11 12.360%
Sources: Primary data collected by authors
Table 2 shows the summary of the purposes of the saving and investment
behavior of rural households. It shows the majority of the respondents (48.315%) save

Sharmila Singh & Dr. Ishwar Mittal : Saving and Investment Behavior of Rural Households in the Bhiwani District of Haryana
152
money for their children’s education and marriages. It means respondents save money to
fulfill their social requirements. The second preference of their savings is the acquisition
of homes and land (23.595%). The other purposes preferred by the respondents are the
source of money (15.730%) and a safe way to keep money (12.360%) for their future
requirements.
Table: 3. Options of Saving and Investment of Rural Households
S.
No.
Options of Saving/Investment No. of Respondents Percentage
1. Savings in Bank 44 49.438%
2. Savings in Post-Office 19 21.348%
3. Savings in Gold 11 12.360%
4. Savings in Shares and Debentures 3 3.371%
5. Savings in Insurance 12 13.483%
Sources: Primary data collected by authors
Table 3 indicates the options for saving and investment of the respondents. The
observations were taken from the existing study by Pathy (2017). According to the above
table, the majority of the respondents want to save/invest their money in banks (49.438%)
because it is the safest way to save their money. Their second preference is to save/invest
their money in post offices (21.348%). It has also provided security for their money.
Some respondents are showing an interest in gold (12.360%) and insurance (13.483%)
modes to save their money. The least preferable mode is shares and debentures (3.371%)
because it has the drawbacks of higher risk and higher formality and also a lack of
awareness among respondents. The explained results are supported by Pathy (2017) also.
Table: 4. Sources of Information towards Saving and Investment
S.
No.
Sources of Information No. of Respondents Percentage
1. Advertisements 09 10.112%
2. Financial Agents 38 42.697%
3. Family and Peer groups 29 32.584%
4. Brochure 00 00
5. Self Assessment 13 14.607%
Sources: Primary data collected by authors
Table 4 indicates the different sources of information towards saving and
investment of the respondents. It tells the sources influencing the respondents to decide
on their investment pattern. It shows that most of the respondents are influenced by the
information provided by financial agents (42.697%) and their family members & peer

Indian Journal Of Business Administration (IJBA)
(A National Peer Reviewed Refereed Journal)
ISSN : 0975-6825, Volume 14, Issue 1, January-June 2021, pp. 145-155
153
groups (32.584%), followed by self assessment (14.607%) and advertisements
(10.112%). It also shows that the information provided by the brochure of the institution
did not influence the saving and investment decisions of the respondents. This section of
the study shows that the level of financial awreness is not satisfactory among the
respondents because they do not make their investment decisions themselves.
Suggestions
According to the present study, there is a need to conduct financial awareness
programs to improve the capability and decision-making power of rural households in
their financial matters. Personal financial awareness programs should be organized by
financial institutions to create financial awareness among rural households towards
saving and investment. To increase the usage of financial products and services, they
must be designed with some special features and basic information about the features of
financial products and services.
Summing up
It can be revealed from the present study that rural households have less
knowledge about their invested money in securities, insurance, and gold etc. They prefer
to make savings in banks and post offices for security reasons. Safety is the main factor
that influences the saving and investment decisions of rural households. They secure their
money for their social obligations, such as children’s education and marriage, different
festivals, and so on. The study shows that most respondents belong to agriculture and
private job background families and their economic criteria influence them to retain their
surplus family income for further savings. This shows that in our country, mainly in
Haryana, people still do not know much about their financial-related issues. It also shows
that the level of financial awareness varies significantly among people based on their
qualifications. From the above findings, it can be revealed that those respondents who
have a high education level and a high-income level are making wise decisions about
their financial-related matters. Overall, it can be suggested that the financial awareness
level is low in Haryana (India) and appropriate measures should be taken by the
government and financial institutions to increase knowledge about finance-related issues
of rural households.

Sharmila Singh & Dr. Ishwar Mittal : Saving and Investment Behavior of Rural Households in the Bhiwani District of Haryana
154
References
• Alekam, J. M. E., Salleh, M. S. B. M., & Mokhtar, S. S. B. M. (2018). The Effect of
Family, Peer, Behavior, Saving and Spending Behavior on Financial Literacy among
Young Generations. International Journal of Organizational Leadership, 7(1), 309–
323.
• Alguacil, M., Cuadros, A., & Orts, V. (2004). Does Saving Really Matter for
Growth? Mexico (1970-2000). Journal of International Development, 16, 281–290.
• Azeez, A. N. P., & Banu, N. M. (2019). Rural Transformation through Financial
Literacy: A Study of Aligarh District. International Journal of Innovative Studies in
Sociology and Humanities, 4(5), 175–185.
• Baker, H. K., Kumar, S., Goyal, N. & Gaur, V. (2019). How Financial Literacy and
Demographic Variables Relate to Behavioural Biases. Managerial Finance, 45(1),
124–146. https://doi.org/10.1108/MF-01-2018-0003
• Bhabha, J. I., Khan, S., Qureshi, Q. A., Naeem, A., & Khan, I. (2014). Impact of
Financial Literacy on Saving-Investment Behavior of Working Women in the
Developing Countries. Research Journal of Finance and Accounting, 5(13), 118–122.
• Carswell, A. T. (2009). Does Housing Counseling Change Consumer Financial
Behaviors? Evidence from Philadelphia. Journal of Family and Economic Issues, 1–
37.
• Cavana, R. Y., Delahhaye, B. L., & Sekaran, U. (2001). Applied Business Research:
Qualitative and Quantitative Methods (3rd ed.). Australia: John Wiley & Sons.
• Grohmann, A., & Menkhoff, L. (2015). School, Parents, and Financial Literacy Shape
Future Financial Behavior. DIW Economic Bulletin, 5(30/31), 407–412.
• Jamal, A. A. A., Ramlan, W. K., Mohidin, R., & Osman, Z. (2016). Determinants of
Savings Behavior among University Students in Sabah, Malaysia. International
Journal of Accounting, Finance and Business, 1(1), 24–37.
• Jayanthi, M., & Rau, S. S. (2019). Determinants of Rural Household Financial
Literacy: Evidence from South India. Statistical Journal of the IAOS, 35(1), 299–304.
• Lim, K. L., Soutar, G. N., & Lee, J. A. (2013). Factors Affecting Investment
Intentions: A Consumer Behaviour Perspective. Journal of Financial Services
Marketing, 18, 301–315.
• Muradoglu, G., & Harvey, N. (2012). Behavioural Finance: The Role of
Psychological Factors in Financial Decisions. Review of Behavioural Finance, 4(2),
68–80. https://doi.org/10.1108/19405971211284862
• Neuman, W. L. (2012). Understanding Research Canada. Prentice Hall Publisher.

Indian Journal Of Business Administration (IJBA)
(A National Peer Reviewed Refereed Journal)
ISSN : 0975-6825, Volume 14, Issue 1, January-June 2021, pp. 145-155
155
• Nye, P., & Hillyard, C. (2013). Personal Financial Behavior: The Influence of
Quantitative Literacy and Material Values. Advancing Education in Quantitative
Literacy, 6(1), 1–24.
• Pathy, M. (2017). Saving and Investment Habit of Rural Households in Cuttack
District of Odisha. International Journal of Commerce and Management Research,
3(2), 56–58.
• Sharma, A., & Joshi. B. (2015). Financial Literacy of Women and its Effect on their
Investment Choice Decision. Global Journal for Research Analysis, 4(7), 190–192.
• Sharma, N., & Singh, V. (2016). Awareness of Households towards Financial
Services: A step towards Inclusive Financing. International Journal of Advance
Research in Computer Science and Management Studies, 4(6), 370–379.
• Shetty, S. (2018). A Study on Personal Financial Planning Attitudes of Individuals in
Nilai. Herald NAMSCA 1, 820–823.
• Shih, T. Y., & Ke, S. C. (2013). Determinates of Financial Behavior: Insights into
Consumer Money Attitudes and Financial Literacy. Springer, DOI 10.1007/s11628-
013-0194-x
• Tamimi, H. A. H. A., & Kalli, A. A. B. (2009). Financial Literacy and Investment
Decisions of UAE Investors. The Journal of Risk Finance, 10(5), 500–516.
• Widyastuti, U., Suhud, U., & Sumiati, A. (2016). The Impact of Financial Literacy on
Student Teachers’ Saving Intention and Saving Behaviour. Mediterranean Journal of
Social Sciences, 7(6), 41–48.
• Zulaihati, S., Susanti, S., & Widyastuti, U. (2020). Teachers’ Financial Literacy:
Does it Impact on Financial Behaviour? Management Science Letters, 10(1), 653–
658.

Indian Journal Of Business Administration (IJBA)
(A National Peer Reviewed Refereed Journal)
ISSN : 0975-6825, Volume 14, Issue 1, January-June 2021, pp. 156-163
156
CORPORATE SOCIAL RESPONSIBILITY AND ENVIRONMENT
PROTECTION - A STUDY OF INDIAN CORPORATE SECTOR
Mr. Vishal Anand *
Dr. Mukesh Kumar **
ABSTRACT
The concern of CSR is gaining considerable exposure in the scholarly literature,
since CSR serves a crucial influence in company expansion and environmental
preservation. This paper examines the employee’s perception of CSR activities
implemented by various companies under study. It also attempted to emphasize the
corporate social responsibility efforts that had been implemented as well as their
influence on environmental preservation and resilience. A self-administered
questionnaire was designed to obtain primary data from participants. The questionnaire
was used to assess reactions to CSR efforts and their influence on environmental and
safety protection.
This research is based on the Tripple Bottom Line approach to corporate social
responsibility, which links CSR to profit, people, and the environment. Employees are
actively involved in the formulation of policies and plans, as well as CSR decision
making in the firm, and they are the actual actors in CSR administration. As a result,
there is a need to examine CSR from the perspective of employees and investigate if
employee’s perceptions of various CSR efforts implemented by their firm differ. 20
companies from 5 industries were investigated for their CSR efforts, and responses from
343 workers were gathered and assessed to study the variations related to CSR
Components. Findings of the study revealed that Employees perception regarding CSR
initiatives are positive and CSR initiatives have strong and positive impact on
Environment protection and safety. To test the Hypothesis, descriptive analysis, Karl
Pearson coefficient of Correlation and Linear Regression was applied.
Keywords- CSR, Perception, Environment Protection and Conservation, Indian
corporate sector, CSR initiatives
* Research Scholar, Department of Commerce, J.V. Jain (P.G.) College, Saharanpur (U.P.), Chaudhary Charan Singh University,
Meerut (U.P.)
**Associate Professor, Department of Commerce, J.V. Jain (P.G.) College, Saharanpur (U.P.), Chaudhary Charan Singh University,
Meerut (U.P.)

Mr. Vishal Anand & Dr. Mukesh Kumar : Corporate Social Responsibility and Environment Protection - A Study of Indian Corporate Sector
157
INTRODUCTION
Incorporating Sustainability needs in company’s strategy development is a
primary concern for their success. There is a growing societal and commercial interest in
pursuing environmental preservation and sustainability (Bansal, 2005; Eweje, 2011;
Dahlsrud, 2008). This study is based on the Tripple bottom line approach of corporate
social responsibility.
The triple bottom line (TBL) concept is profound and much needed for future
generations. It inspires the commercial enterprise to include environment orientation in
their operations for empirical manifestations of triple bottom line success (orlitzky,
2011). It encompasses the concepts of sustainability and corporate social responsibility
(CSR). The triple bottom line (environmental, social, and economic) elements define the
subject of sustainability. Sustainable development is an essential component of corporate
social responsibility. Many definitions of sustainable development exist (Gladwin,
Kennelly, & Krause, 1995), and many of them are conceptually inadequate (Beckerman,
1994; Arora & Puranik 2004). Furthermore, there is a heated discussion about whether
management motives should be operational (Siegel, 2009) or non-instrumental (Marcus
& Fremeth, 2009) in promoting environmental sustainability.
The government of India launched Corporate Social Responsibility (CSR) as a
revision to the Companies Act 2013, which went into effect in 2014. According to the
revised companies Act 2013, any companies having net worth exceeds 500 crores, sales
revenue exceeds 1000 crores, or net profit exceeds 5 crore in a certain year are obligated
to devote 2% of their average annual earnings on CSR initiatives. Companies should
develop a CSR policy, establish a CSR committee, and incorporate CSR initiatives in
their annual report.
Managers must implement tools and techniques to make their businesses socially
responsible, environmentally sustainable, and commercially competitive (Baron, 2001).
They should focus on business sustainability strategy creation, implementation, control,
and improvement (McGee, 1998; Hannon and Callaghan, 2011; Aguinis and Glavas,
2012). As a result, this study gives greater insight into this critical component of
corporate sustainability and CSR management.
REVIEW OF EXISTING LITERATURE
The literature on CSR is enormous which defines and conceptualize the term
(Bowen 1953, Friedman 1970, Carroll, 1979, 1991, 1999, 2004, 2010, Freeman 1984,
Wood 1990, and so on). For this paper, the World Business Council on Sustainable

Indian Journal Of Business Administration (IJBA)
(A National Peer Reviewed Refereed Journal)
ISSN : 0975-6825, Volume 14, Issue 1, January-June 2021, pp. 156-163
158
Development (WBCSD) conceptualization was used, which defines CSR as “the
continuing commitment by business to behaving ethically and contributing to economic
development while improving the quality of life of the workforce and their families, as
well as the community and society at large” (Holmes and Watts, 2010). CSR was
originally explored in the 1930s, in a Harvard Review Paper that called for management's
responsibilities to society (Dodd 1932). Corporate social responsibility (CSR) is a key
topic on the global business agenda in today's socially conscious economy. It contributes
to society via discretionary business practices and corporate philanthropy (Kotler and
Lee, 2005; Porter and Kramer, 2006). According to World Bank experts, between 1995
and 2010, India was in the forefront of the world in addressing environmental concerns
and improving environmental quality (Chopra, 2016). Further, the Indian government
started Corporate Social Responsibility (CSR) as a mandate after the revisions in the
Companies Act 2013, which went into place in 2014. This made India as the first country
in the world to legitimate the CSR. Furthermore, the phenomena of environmental
sensitivity and sustainability were incorporated as root level to practice CSR for the
betterment of the developing nations such as India (Biswas and Roy, 2015). Mishra and
Suar (2010) discovered a Favorable relationship between environmental CSR and
business performance.
OBJECTIVES OF THE STUDY
(a) To investigate relationship among Employee’s perception regarding CSR initiatives
and Environment protection and safety in selected industries under Indian Corporate
sector.
(b) To identify the Impact of Various CSR initiatives on Environment protection and
safety.
HYPOTHESIS
H01: There is no significant relationship among employee’s perception of CSR initiatives and
Environment protection and Safety in selected Industries under Indian Corporate Sector.
H02: There is no significant impact of CSR initiatives on Environment protection and Safety.
RESEARCH METHODOLOGY
A pragmatic research was undertaken to appraise employee perceptions of CSR
efforts and Environment Protection and safety. Primary data was obtained from workers
of 20 prominent businesses from five diverse sectors: Automobile, Banking, Petroleum

Mr. Vishal Anand & Dr. Mukesh Kumar : Corporate Social Responsibility and Environment Protection - A Study of Indian Corporate Sector
159
and Natural Gas, FMCG, and IT sector, related to CSR initiatives adopted by their
company and their Environment impact. The self-administered questionnaire was meant
to elicit employee’s responses on a five-point Likert scale. Descriptive Analysis, One-
Way ANOVA, and Pearson coefficient of Correlation and linear Regression modeling
were used to evaluate the hypothesis.
ANALYSIS AND FINDINGS
Table-1
Pearson Correlation among CSR Initiatives and Environment Protection and Safety
Pearson Correlation CSR
Initiatives
Environment
Protection and Safety
CSR Initiatives Correlation(Karl Pearson) 1 0.879
Sig. (2-tailed) 0.001
Environment
Protection and Safety
Pearson Correlation 0.879 1
Sig. (2-tailed) 0.001
(Source –Author’s Compilation from Primary Data, significant as p<0.05)
Karl Pearson Coefficient of Correlation was applied and results are presented in Table-1.
It study the relationship between above mentioned two constructs. It is observed that
there exists high degree of Positive and significant relationship between employees
perception to CSR initiatives and Environment protection and safety. From the 343
observation of employee’s responses R comes out to be 0.897 with p=.000 shows high
degree of positive and significant relationship. Thus null hypothesis H01: There is no
significant relationship among employee’s perception of CSR initiatives and Environment
protection and Safety in selected Industries under Indian Corporate Sector, stands rejected and
alternate hypothesis accepted that there exist positive relationship.
CSR initiatives predicting Environment Protection & Safety
Table -2.1
Regression Analysis to study the Impact of CSR initiatives (Consolidated) on
Environment protection and Safety
Regression R R2 Adjst R2
Change Statistics
R2
Change F df1 df2 Sig.Value
1 0.879 0.773 0.773 0.773 1163.09 1 341 0.001
(Source –Author’s Compilation from Primary Data)
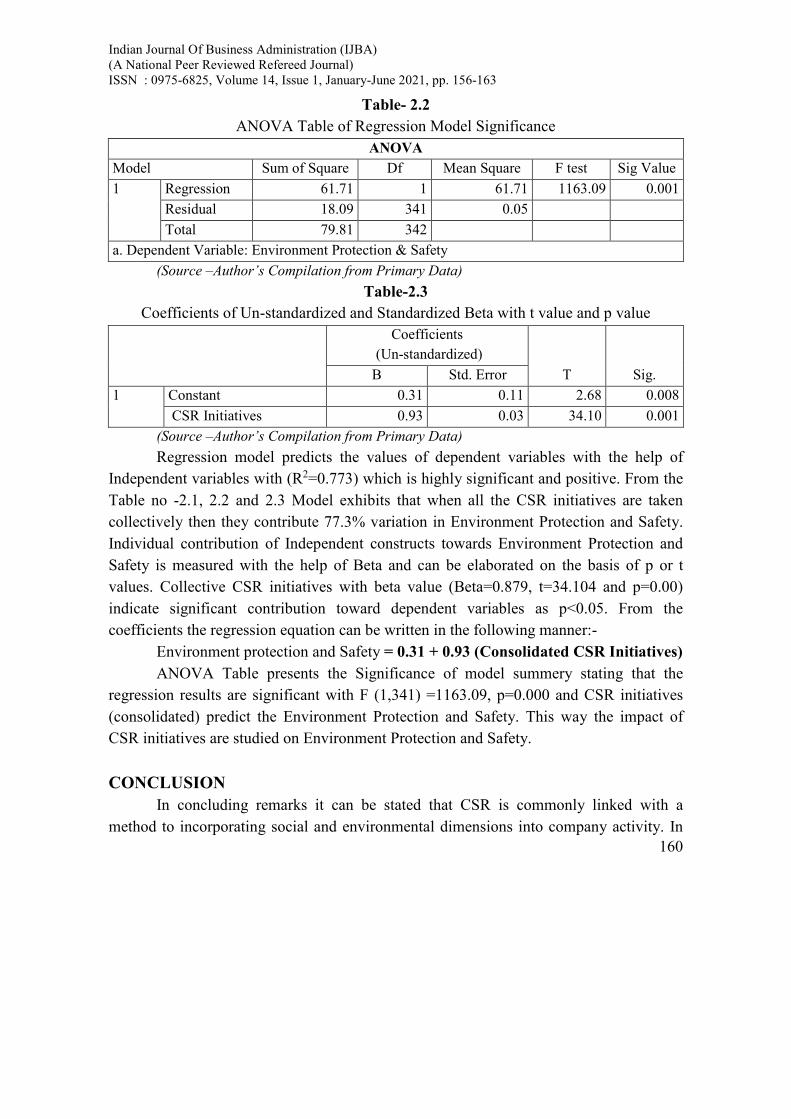
Indian Journal Of Business Administration (IJBA)
(A National Peer Reviewed Refereed Journal)
ISSN : 0975-6825, Volume 14, Issue 1, January-June 2021, pp. 156-163
160
Table- 2.2
ANOVA Table of Regression Model Significance
ANOVA
Model Sum of Square Df Mean Square F test Sig Value
1 Regression 61.71 1 61.71 1163.09 0.001
Residual 18.09 341 0.05
Total 79.81 342
a. Dependent Variable: Environment Protection & Safety
(Source –Author’s Compilation from Primary Data)
Table-2.3
Coefficients of Un-standardized and Standardized Beta with t value and p value
Coefficients
(Un-standardized)
T Sig. B Std. Error
1 Constant 0.31 0.11 2.68 0.008
CSR Initiatives 0.93 0.03 34.10 0.001
(Source –Author’s Compilation from Primary Data)
Regression model predicts the values of dependent variables with the help of
Independent variables with (R2=0.773) which is highly significant and positive. From the
Table no -2.1, 2.2 and 2.3 Model exhibits that when all the CSR initiatives are taken
collectively then they contribute 77.3% variation in Environment Protection and Safety.
Individual contribution of Independent constructs towards Environment Protection and
Safety is measured with the help of Beta and can be elaborated on the basis of p or t
values. Collective CSR initiatives with beta value (Beta=0.879, t=34.104 and p=0.00)
indicate significant contribution toward dependent variables as p<0.05. From the
coefficients the regression equation can be written in the following manner:-
Environment protection and Safety = 0.31 + 0.93 (Consolidated CSR Initiatives)
ANOVA Table presents the Significance of model summery stating that the
regression results are significant with F (1,341) =1163.09, p=0.000 and CSR initiatives
(consolidated) predict the Environment Protection and Safety. This way the impact of
CSR initiatives are studied on Environment Protection and Safety.
CONCLUSION
In concluding remarks it can be stated that CSR is commonly linked with a
method to incorporating social and environmental dimensions into company activity. In

Mr. Vishal Anand & Dr. Mukesh Kumar : Corporate Social Responsibility and Environment Protection - A Study of Indian Corporate Sector
161
particular, CSR approaches fall under three categories i.e. organizational generosity
(Porter and Kramer, 2006), incorporating stakeholder perceptions (O'Riordan and
Fairbrass, 2008), and extensively described CSR that incorporates environment attributes
(CSR as corporate strategy) (European Commission, 2011). For long run survival and
economic success, businesses must take an integrated and comprehensive strategy. Firms
must priorities the triple bottom line, i.e. people, planet, and profit. With the prologue of
sustainability, CSR has become crucial to a company's existence. For providing high-
quality products at competitive prices, efforts should be made to make business
operations environment friendly. CSR should not be viewed by management as a
necessity to comply with legislation and social standards. CSR efforts, on the other hand,
may be a consistent strategy that is recorded and assessed on a consistent basis in order to
curtail the negative influence of companies on the ecosystem.
REFERENCES
• Aguinis H, Glavas A. 2012. What we know and don´t know about corporate
social responsibility: A review and research agenda. Journal of Management
38(4): 932–968.
• Arora, B., Puranik, R., 2004. A review of corporate social responsibility in India.
Development 47, 93e100.
• Bansal P. 2005. Evolving sustainably: A longitudinal study of corporate
sustainable development. Strategic Management Journal 26(3): 197–218.
• Baron, D. P. (2001). Private politics, corporate social responsibility and integrated
strategy. Journal of Economics and Management Strategy, 10, 7-45.
• Beckerman, W. (1994). Sustainable development — Is it a useful concept?
Environmental Values, 3, 191-209.
• Biswas, A., Roy, M., 2015. Green products: an exploratory study on the consumer
behaviour in emerging economies of the East. J. Clean. Prod. 87, 463e468.
• Bowen, H. R. (1953). Social responsibilities of the businessman. University of
Iowa Press. Carroll, A. B. (1996). Business and Society: Ethics and Stakeholder
Management. Cincinatti: Southwestern Publishing.
• Carroll, A. B. (1979). A three-dimensional conceptual model of corporate social
performance. Academy of Management Review, 4, 497-506.
• Carroll, A. B. (1991). The pyramid of corporate social responsibility: Toward the
moral management of organizational stakeholders. Business Horizons, 34(4), 39-
48.

Indian Journal Of Business Administration (IJBA)
(A National Peer Reviewed Refereed Journal)
ISSN : 0975-6825, Volume 14, Issue 1, January-June 2021, pp. 156-163
162
• Carroll, A. B. (1999). Corporate social responsibility—Evolution of a definitional
construction. Business and Society, 38(3), 268–295.
• Carroll, A.B. (2004). Managing ethically with global stakeholders: a present and
future challenge. Academy of Management Executive 18(2): 114–120.
• Chopra, S. (2016). Eco-activities and operating performance in the computer and
electronics industry. European Journal of Operational Research, 248(3), 971-981.
• Dahlsrud A. 2008. How corporate social responsibility is defined: An analysis of
37 definitions. Corporate Social Responsibility and Environmental Management
15: 1–13.
• Dodd, E. M., Jr. (1932). For whom are corporate managers trustees? Harvard Law
Review, 45(7), 1145−1163.
• European Commission (2011). Communication from the commission to the
European Parliament, the Council, the European Economic and Social Committee
and the Committee of the Regions: A renewed EU strategy 2011–2014 for
corporate social responsibility. Brussels, Belgium: European Commission.
• Eweje G. (2011). A Shift in corporate practice? Facilitating sustainability strategy
in companies. Corporate Social Responsibility and Environmental Management
18(3): 125–136.
• Freeman, R. E. (1984). Strategic management: A stakeholder approach.
Marshfield, MA: Pitman.
• Friedman, M. (1970, September 13). The social responsibility of business is to
increase its profits. New York Times Magazine.
• Gladwin, T. N., Kennelly, J. J., & Krause, T. S. (1995). Shifting paradigms for
sustainable development: Implications for management theory and
research. Academy of management Review, 20(4), 874-907.
• Hannon A, Callaghan EG (2011). Definitions and organizational practice of
sustainability in the for-profit sector of Nova Scotia. Journal of Cleaner
Production 19(8): 877–884.
• Holmes L, Watts R. (2000). Corporate Social Responsibility: Making Good
Business Sense. World Business Council for Sustainable Development: Geneva.
• Kotler, P., & Lee, N. (2005). Corporate social responsibility. Doing the Most
Good for Your Company and Your Cause, New Jersey.
• Marcus, A. A., & Fremeth, A. R. (2009). Green management matters regardless.

Mr. Vishal Anand & Dr. Mukesh Kumar : Corporate Social Responsibility and Environment Protection - A Study of Indian Corporate Sector
163
Academy of Management Perspectives, 23(3), 17-26.
• McGee J. (1998). Commentary on ‘corporate strategies and environmental
regulations: An organizing framework’ by A. M. Rugman and A. Verbeke.
Strategic Management Journal 19(4): 377–387.
• McWilliams A, Siegel D (2000). Corporate social responsibility and financial
performance: correlation or misspecification? Strategic Management Journal,
21(5):603-9.
• Mishra, S., Suar, D., (2010). Does corporate social responsibility influence firm
performance of Indian companies? J. Bus. Ethics 95, 571e601.
• O’riordan, L., & Fairbrass, J. (2008). Corporate social responsibility (CSR):
Models and theories in stakeholder dialogue. Journal of business ethics, 83(4),
745-758.
• Orlitzky, M., Siegel, D. S., & Waldman, D. A. (2011). Strategic corporate social
responsibility and environmental sustainability. Business & society, 50(1), 6-27.
• Porter, M., & Kramer, M. R. (2006), Strategy & society: The link between
competitive advantage and corporate social responsibility. Harvard Business
Review, 84(12), 78–92.
• Siegel, D. S. (2009). Green management matters only if it yields more green: An
economic/ strategic perspective. Academy of Management Perspectives, 23(3), 5-
16.
• Turban, D. B., & Greening, D. W. (1997). Corporate social performance and
organizational attractiveness to prospective employees. Academy of Management
Journal, 40(3), 658–672. https://doi.org/10.5465/257057
• Wood DJ, (1990). Business and Society. London: Scott, Foresman/Little, Brown
Higher Education.

Indian Journal Of Business Administration (IJBA) (A National Peer Reviewed Refereed Journal) ISSN : 0975-6825, Volume 14, Issue 1, January-June 2021, pp. 164-173
164
A PROJECT REPORT ON A STUDY ON BRAND COMMUNITY BUILDING -
WITH REFERENCE TO CAFÉ COFFEE DAY
Neha KS*
ABSTRACT
A brand community building describe likeminded buyer who choose a particular
brand and share similar characteristics and they share experience with a brand, Every
brand has their own community for example coffee day they focus on coffee lovers.
Key words:- Brand, Brand community building,
Problem Statement & Introduction
It is observed that advertising & place a very vital role in increasing any sales, the budget allotted for advertising & drawing the attention of customer with respect to CCD also but in case CCD special events all conducted with draw more attention & there it was felt an newly to understand the customer perception towards this special events & how they help in drawing more attention & sales for the company.
Objectives
� To understand the various event conducted by CCD. � To examine the responses of the customer towards this events and � To invested whether this event helped in gaining more attention from the
customer.
Methodology to be used
� Primary data � Secondary data
The information being gathered through
� Gather through web source � Official site � Company magazine
* USN: 1DY19MBA08, MBA, Dayananda Sagar College of Engineering

Neha KS : A Project Report on “A study on Brand Community Building -With reference to Café Coffee Day
165
Information analysis tools used � Questionnaire � Survey
Research design
Type of research : Survey method & questionnaire Sample size : 100 Sample unit : Customer Sample area : Bangalore, chikkamagalore Sample chart : Bar chart
Plan of analysis
The data collected is analyzed using SPSS and the result is presented through table chart and graph.
Literature Review
1. (Albert, 2009) Using social practice theory, this article says that the process of collective the value creation within brand communities.
Company Profile
Cafe Coffee Day was introduced by VG Siddhartha, in the year 1996, and its head quarters is located at Bangalore Brigade Road.
Mission
We found an extra boundless potential in all that we do—just as we have for every cup of coffee.
Vision
Showing the whole world where the coffee can take us.
Swot Analysis • Strengths:
• It has a very good brand name and brand appearance • It target on youth • It has a very good service
It has a 1000+ coffee shops and 3000000+visitors in a day
• Weaknesses:
• It has a very huge competition in the market • Struggling to get a new idea
• Opportunities:
• Merchandising
• It depend on other companies for advertising
• Threats:
• Arrival of outside companies like STARBUCKS
• It depend on government commodity rates • Big unorganised market

Indian Journal Of Business Administration (IJBA) (A National Peer Reviewed Refereed Journal) ISSN : 0975-6825, Volume 14, Issue 1, January-June 2021, pp. 164-173
166
NUMBER OF PLAYERS
Data analysis and interpretation
Crosstabs
How many people do you usually visit with
Case Processing Summary
Cases
Valid Missing Total
N Percent N Percent N Percent
Gender * Howmanypeopledoyouusuallyvisitwith
98 94.2% 6 5.8% 104
Cross Tabulation
How many people do you usually visit with
Alone one person 2 or 4 person more than 4
people
Gender Male Count 1 3 26 4
% within Gender
2.9% 8.8% 76.5% 11.8%

Neha KS : A Project Report on “A study on Brand Community Building -With reference to Café Coffee Day
167
According to this survey the majority of the people visit cafe coffee day with 2 or
4 person, 34% are male visitors, for male 1% are alone visitors, 3% are one person visitors, 26% are 2 or 4 person visitors, 4% are more than 4 people visitors, 64% are female visitors, for female 2% are alone, 8% are one person, 45% are 2 or 4 person, 9% are more than 4 people .
% within How many people do you usually visit with 33.3% 27.3% 36.6% 30.8%
Female Count 2 8 45 9
% within Gender
3.1% 12.5% 70.3% 14.1%
% within How many people do you usually visit with 66.7% 72.7% 63.4% 69.2%
Total Count 3 11 71 13
% within Gender
3.1% 11.2% 72.4% 13.3%
% within How many people do you usually visit with
100.0% 100.0% 100.0% 100.0%

Indian Journal Of Business Administration (IJBA) (A National Peer Reviewed Refereed Journal) ISSN : 0975-6825, Volume 14, Issue 1, January-June 2021, pp. 164-173
168
Chi-Square Tests
Value df Asymptotic Significance (2-sided)
Pearson Chi-Square .474a 3 .924
Likelihood Ratio .486 3 .922
Linear-by-Linear Association .018 1 .892
N of Valid Cases 98
Hypothesis
H0 -Respondents of CCD visit in same frequency H1 - Respondents don’t visit CCD in same frequency
Why do you go to café coffee day ?
Case Processing Summary
Cases
Valid Missing Total
N Percent N Percent N Percent
Gender * Why do you go to
café coffee day 98 94.2% 6 5.8% 104 100.0%
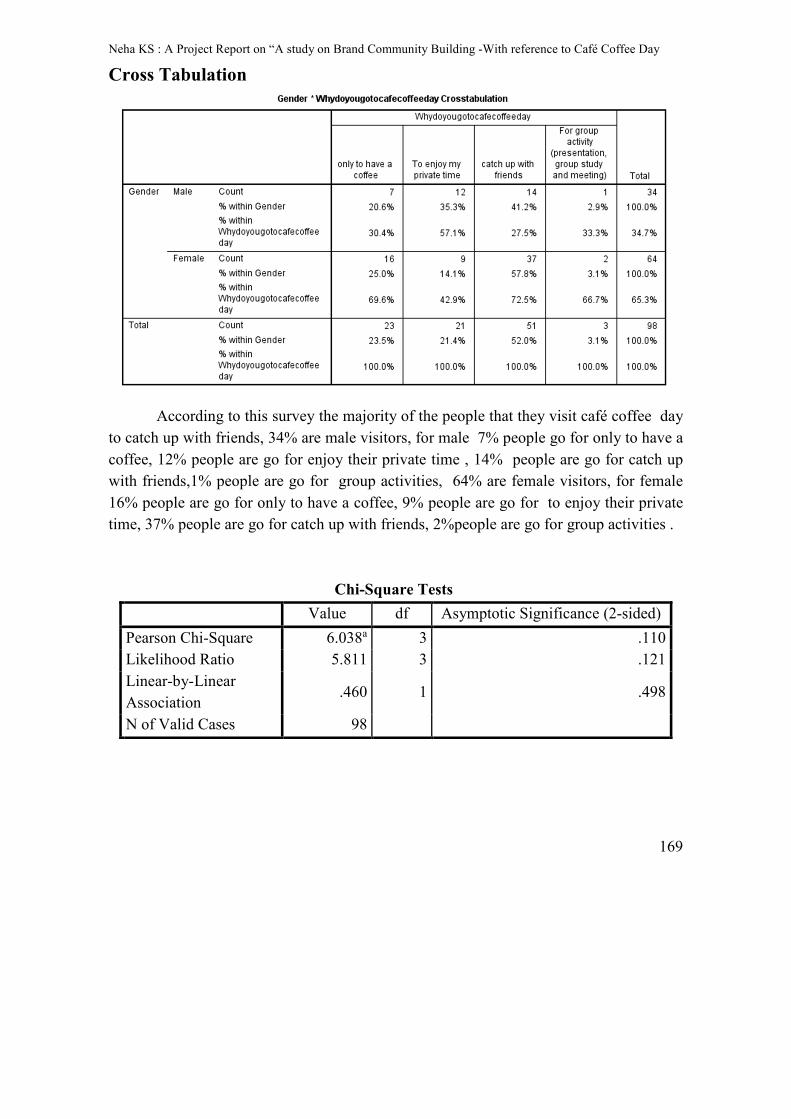
Neha KS : A Project Report on “A study on Brand Community Building -With reference to Café Coffee Day
169
Cross Tabulation
According to this survey the majority of the people that they visit café coffee day
to catch up with friends, 34% are male visitors, for male 7% people go for only to have a coffee, 12% people are go for enjoy their private time , 14% people are go for catch up with friends,1% people are go for group activities, 64% are female visitors, for female 16% people are go for only to have a coffee, 9% people are go for to enjoy their private time, 37% people are go for catch up with friends, 2%people are go for group activities .
Chi-Square Tests
Value df Asymptotic Significance (2-sided)
Pearson Chi-Square 6.038a 3 .110 Likelihood Ratio 5.811 3 .121 Linear-by-Linear Association
.460 1 .498
N of Valid Cases 98
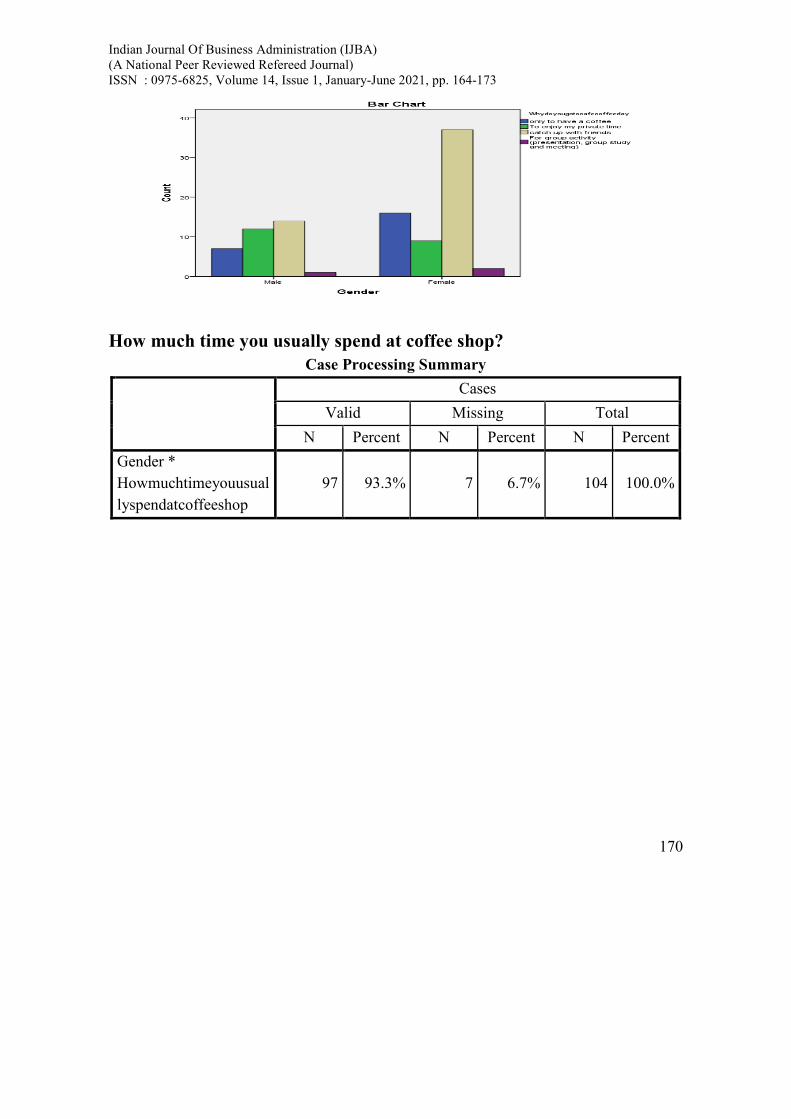
Indian Journal Of Business Administration (IJBA) (A National Peer Reviewed Refereed Journal) ISSN : 0975-6825, Volume 14, Issue 1, January-June 2021, pp. 164-173
170
How much time you usually spend at coffee shop?
Case Processing Summary
Cases
Valid Missing Total
N Percent N Percent N Percent
Gender * Howmuchtimeyouusuallyspendatcoffeeshop
97 93.3% 7 6.7% 104 100.0%

Neha KS : A Project Report on “A study on Brand Community Building -With reference to Café Coffee Day
171
4.2.4 Cross tabulation
According to this survey the majority of the people that they spend less 1 hour in
café coffee day, 34% are male visitors, 16% people are spend less 1 hour, 12% people are spend 1hour, 4% people are spend 2 hour, 2% people are spend 3 hour ,0% people are spend more than 4 hour , 63% are female visitors, 21% people are spend less 1 hour, 24% people are spend I hour ,13% people are spend 2 hour, 3% people are spend 3 hour, 2% people are spend more than 4 hour .
Chi-Square Tests
Value df Asymptotic Significance (2-
sided)
Pearson Chi-Square 3.262a 4 .515 Likelihood Ratio 3.942 4 .414 Linear-by-Linear Association 2.061 1 .151 N of Valid Cases 97

Indian Journal Of Business Administration (IJBA) (A National Peer Reviewed Refereed Journal) ISSN : 0975-6825, Volume 14, Issue 1, January-June 2021, pp. 164-173
172
4.2.4 Bar chart
Findings
• The majority of the people visit CCD were aged between 15-25.
• The ambience & décor of café coffee day outlets received a below average rate from the respondents of the market survey. A lot of the respondents did not like the fact that café coffee day outlet and literature served a prime space for a lot of advertising and promotion.
• According to the research CCD is the most preferred coffee shop, as there are many outlets, combo offers with affordable price.
Suggestions • It can be advised that advertisements should be made more attractive and
innovative to draw the attentions of the customers
• It can be advice that by giving discount or offers to loyal customers, and coming with attractive offers for its prospect buyers and by advertising effectively.
• It can be advised that the company should have their upper held priorities towards their pricing strategies and service to their products for the mass greater reach outs in the future period of time.
• Company should try to attract the different classes of people it will help to generate the higher revenue for the company.

Neha KS : A Project Report on “A study on Brand Community Building -With reference to Café Coffee Day
173
Conclusion
CCD got a huge ranking in market survey, for taste & quality of their products. If they work on this aspect, there is huge potential for them to attract customers, just based on the taste and quality of products. This is also helped by the fact that they grow their own coffee beans, and this provides an important base for future expansion and growth. CCD has value for money brand and youth brand.
CCD has a high growth in the coffee market, and their Target group is youth in the average and above average income group and many of the people select CCD as a place to hang out and frequent visitors are 15-25 age bracket and Most important factors influencing to visit CCD is convenience and quality of food and it is Perceived as place to hangout, quality and value for money brand.
Reference
• HABIBI, M. (AUG 2014). The roles of brand community and community engagement in building brand trust on social media. COMPUTERS IN HUMAN BEHAVIOUR .
• KIM, M. (2 AUGUST 2011). Building brand loyalty through managing brand community commitment. MANAGEMENT DECISION .
• Website
www.wikipedia.com www.cafecoffeeday.com

Indian Journal Of Business Administration (IJBA)
(A National Peer Reviewed Refereed Journal)
ISSN : 0975-6825, Volume 14, Issue 1, January-June 2021, pp. 174-181
174
CORPORATE SOCIAL RESPONSIBILITY ISSUES AND SUSTAINABILITY
Reena Jain*
ABSTRACT
The corporate social responsibility rules, which came into force from April 2014,
make it mandatory for large Indian firms to set aside at least 2% of their average net
profit for socially responsible expenditures. CSR is a term describing a company’s
obligation to be accountable to all of its stakeholders in all its operations and activities.
The Companies Act, 1956 is replaced with the Companies Act, 2013 and CSR has been
made mandatory for a particular class of companies. There has to be an all inclusive
growth of the companies. Perhaps keeping this in mind, Indian law makers brought this
law. This paper aims to provide an assessment of the response by firms to these rules. It
examines the extent to which these rules have led firms to comply and the extent to which
their implementation over the financial year 2014-15 has contributed additional funds
towards the social development of the country. The analysis is based on firm-level data
sets of Indian firms for 2010-15. We find that following the implementation of these rules
there has been an increase in the number of firms that are spending on CSR initiatives as
well as the total amount spent on CSR activities. However, the distribution of CSR
expenditures amongst firms is extremely unequal.
KEYWORDS: Corporate social responsibility rules, CSR, Implementation, CSR
initiatives, CSR expenditures
INTRODUCTION
The United Nations Sustainable Development Goals have highlighted the
challenges of achieving economic prosperity, social inclusion, and environmental
sustainability. However these challenges cannot be met by governments alone.
* Research Scholar, Jai Narain Vyas University, Jodhpur, Rajasthan

Reena Jain : Corporate Social Responsibility Issues And Sustainability
175
Corporations have large resources, knowledge and capacity to contribute to
sustainable development and there is an increasing expectation of proactive socially
responsible behavior from them. This goes beyond the earlier held view that the sole
responsibility of the firm is to increase profits for its shareholders (Friedman 1970).
Socially responsible management has typically been defined as private firms
doing more than that required by applicable laws and regulations governing the
environment, worker safety and health and investments in the communities in which they
operate. These efforts are typically voluntary and contribute to the environmental quality
and social development agenda of society. While altruism, personal environmental values
and attitudes of managers may lead some firms to make their business more socially
responsible (for example, Benabou and Tirole 2010; Nakamura et al 2001; Ervin et al
2012), such efforts need to be in the self- interest of firms to be adopted widely and be
sustainable in the long run.
WHAT CORPORATE SOCIAL RESPONSIBILITY ENTAILS
To engage large corporations to contribute towards the social development agenda
in India, Section 135 of the enacted Companies Act, 2013 mandates a minimum spending
on CSR initiatives. The provisions of Section 135 (referred to as CSR rules hereafter)
became effective from 1April 2014. This makes India the first country in the world where
it is mandatory for large firms (defined in terms of net profits, net worth or turnover) to
set aside at least 2% of their average net profit made during the three immediately
preceding years for socially responsible expenditures.
The purpose of this paper is to provide an assessment of the response by firms to
the CSR rules have. It examines (1) the extent to which the CSR rules have led firms to
comply and increase the share of profits being spent on CSR activities; (2) the extent to
which implementation of the CSR rules over the financial year 2014-15 has contributed
additional funds towards the social development of the country; (3) if the compliance
with these rules has resulted in shrinking of firms’ other charitable donations; and (4) the
types of CSR activities undertaken by firms.
We have undertaken this analysis by examining reported data by firms over the
period 2010-15 to compare CSR expenditures before and after the enactment of CSR
rules as well as across large and small firms at a point in time. We have used data from
the Prowessiq database, which is the largest available firm-level time series data set on
financial variables of Indian firms and has over 38,000 firms in its database. This
database is a product of the centre for Monitoring Indian Economy(CMIE).

Indian Journal Of Business Administration (IJBA)
(A National Peer Reviewed Refereed Journal)
ISSN : 0975-6825, Volume 14, Issue 1, January-June 2021, pp. 174-181
176
We find that following the implementation of the CSR rules there has been an
increase in the percentage of firms reporting expenses on CSR from 10% or below in
previous years to 48% in 2014-15. The percentage of firms spending 2% on CSR
expenses has also increased .However, only 19% of the firms that come under the
purview of these rules are spending 2% or more; that is, 81% of such firms are not
complying. Interestingly, these 19% of firms in 2014-15 are spending 40% of the total
expenditure on CSR by all the firms that come under the purview of these rules. So, the
11% of firms spending more than 2% are making up for the 78% of the firms that are not
spending enough on CSR. This suggests a very unequal distribution of CSR expenditures
by firms. In terms of activities, CSR expenditure has been mainly directed towards
health, education, environment, and community development.
CSR RULES: A BACKGROUND
The CSR rules in India define CSR more narrowly as expenditures that contribute
to the social development agenda of the country. These rules specify that expenditures
that benefit the company directly or its employees will not be considered as CSR
activities in compliance with the CSR law. Instead, the company is expected to make
these expenditures outside its area of operations. It specifies CSR as activities that go
beyond a firm’s internal efforts at being environmentally or socially responsible to those
that meet the larger societal needs like eradicating extreme hunger and poverty;
promoting education; promoting gender equality and empowering women; reducing child
mortality and improving maternal health; combating HIV/AIDS, malaria and other
diseases; ensuring environmental sustainability; employment enhancing vocational skills;
social business projects; contribution to the Prime Minister’s National Relief Fund
(PMNRF) or any other fund set up by the central government or the state governments
for socio-economic development and relief and funds for the welfare of the Scheduled
Castes, Scheduled Tribes, Other Backward Classes, minorities and women; and such
other matters as may be prescribed.
The CSR rules require every company with a net worth of Rs.500 crore, or a
turnover or Rs. 1000 crore, or a net profit of Rs. 5 crore or more during any financial year
to constitute a CSR committee of the board of directors. This committee will recommend
to the board a CSR policy for the company as well as the amount of expenditure to be
incurred on CSR activities and monitor the implementation of this policy. The company
is required to disclose its CSR policy in its annual report and on the company’s website.
Firms may undertake such expenditures directly or through trusts, societies, or Section 8

Reena Jain : Corporate Social Responsibility Issues And Sustainability
177
companies operating in India, which is not set up by the company itself.
The CSR provisions under the Companies Act, 2013 grew out of the National
Voluntary Guidelines on Social, Environmental and Economic Responsibilities of
Businesses released by the Ministry of Corporate Affairs in 2011 that promoted
responsible business practices. However, these rules still remain voluntary guidelines as
there is no formal penalty for non- compliance. If a company fails to spend at least 2% of
its average net profit on CSR activities, its board is only required to provide an
explanation for not spending that amount in its annual report and on its website.
Many firms in India were undertaking voluntary CSR, philanthropic, and other
charitable activities even before the announcement of the CSR rules. Examples in the
private sector include Birlas, Tatas, Hindustan Lever, Jindal, and Wipro and in the public
sector include Oil and Natural Gas Corporation (ONGC), Indian Oil, National Thermal
Power Corporation (NTPC), and Gas Authority of India Limited (GAIL). But, the recent
rules have made such expenditures mandatory for all large firms.
We now present some anecdotal evidence of the type of CSR activity firms in
India are engaged in for altruistic or strategic reasons: Aditya Birla spends Rs.250 crore
annually to develop model villages which are supposed to be self-sustainable. The
programme covers 5,000 villages, reaching out to 7.5 million people out of which 60%
live below the poverty line (adityabirla.com). Public sector companies like ONGC, Indian
Oil, NTPC, and GAIL have been undertaking renovation and maintenance activities for
temples and monuments around their operational area.
Some multinationals like Coca-Cola was found to have pesticide residues above
the permissible limit in India. To recover its image, in June 2007, Coca-Cola
implemented a water stewardship programme and committed itself to reducing its
operational water footprint and to offset the water used in the company’s products
through locally relevant projects. It carried out many projects on water harvesting and
management thereafter. Hindustan Unilever initiated a project in India by the name
“Shakti.” It recruits village women, provides them with access to microfinance loans, and
trains them in selling soaps, detergents, and other products door-to-door. This not only
increases the market size for the company but also improves household income of the
villagers, contributes to public health by providing access to hygiene products and leads
to women’s empowerment (Rangan et al 2015).

Indian Journal Of Business Administration (IJBA)
(A National Peer Reviewed Refereed Journal)
ISSN : 0975-6825, Volume 14, Issue 1, January-June 2021, pp. 174-181
178
CSR ACTIVITIES OF FIRMS IN 2014-15
In this section, we analyse what kind of activities firms are undertaking under
their CSR obligation. This information is not available in the Prowessiq data set. We
collected data from the annual reports of randomly selected 50 firms for the financial year
2014-15.
Broadly, we have identified the following areas in which CSR activities are
undertaken by the firms: education; healthcare; community development; protecting and
sustaining the environment; promoting gender equity; skill development; and other
activities like contribution to the PMNRF, disaster relief, etc.
Education: The firms are undertaking a range of activities to promote, provide
and support education and educational institutions. While some firms like Bajaj Auto
make generous donations to various schools, colleges and universities, firms like
Hindalco directly fund and supervise the construction of school buildings and provide the
required infrastructure to the school. Many firms such as Finolex and Birla have their
own schools and colleges that are managed and funded by the firms themselves. Firms
such as Indian Oil Corporation give away academic scholarships to the meritorious
student. Maruti Suzuki has tried to improve the state of affairs in government schools.
Healthcare: This sector amounts to the largest share of firms CSR expenditure.
With a goal of providing better healthcare facilities, firms undertake activities like
organizing health checkup camps(Reliance Capital), schemes to combat malnourishment
(Tata Steel, ITC, and JSW steel), etc. Some firms like Bajaj Auto provide financial
assistance to hospitals (to help them acquire better medical equipment and also encourage
medical research) Essar Steel India and Bank of Baroda have made significant
contributions to the provision of mobile medical facilities to make healthcare facilities
accessible. Though most of the firms are carrying out their CSR activities in this sector in
the rural areas, there are a few firms that have worked towards improving the medical
facilities in the metropolitan cities of Mumbai and New Delhi (for example, Bank of
Baroda, Hindustan Times Media, and Jaypee Infratech.
Community development: Community development includes activities that
contribute to the betterment of the society and benefits the members of the society. Some
of the activities that are undertaken include: protection of national heritage (Bombay
Dyeing and Bajaj Auto), promotion of traditional handicrafts, art and culture( Essar Oil
and Tata Steel), setting up of orphanages and old age homes (JSW Steel), construction of
village roads, halls, drainages(Grasim Industries) and running free bus services for the

Reena Jain : Corporate Social Responsibility Issues And Sustainability
179
people (Essar Steel). These activities are undertaken in cities like Mumbai, Delhi, and
Coimbatore as well as in the rural areas in states like West Bengal, Bihar, Punjab, and
Uttarakhand.
Promoting gender equity: Axis Bank, Reliance Industries, ITC, and Bajaj Auto
have been trying to help women through construction of special hostels and homes for
working women, providing them training so that they can make a living from it.
Skill development: Many firms have started schemes under CSR through which
they provide vocational and technical education, support Industrial Training Institutes,
and encourage entrepreneurship among the youth. ONGC, Hindalco, Berger Paints and
Maruti Suzuki have made a notable contribution in this sector.
Protecting and sustaining the environment: Ensuring environmental
sustainability has been the major focus firms like Tata Steel, ONGC, Reliance Industries,
and Tata Motors; Firms like JSW Steel and Power Grid Corporation of India have planted
thousands of trees. ONGC, Aditya Birla Nuvo, and Grasim Industries are making efforts
to spread awareness about the environment and conserving natural resources. While some
firms carry out these activities in their local area where their plants are located, other
firms conduct these activities beyond their local area.
Other activities: Firms also make a contribution to the PMNRF and engage in
other activities that cannot be categorized into any of the above- mentioned sectors.
The two sectors where the maximum numbers of firms in our sample have
directed their attention to are healthcare and education. These two sectors are closely
linked to community development. The next most important sector where firms have
directed their CSR activities is sustaining and protecting the environment. Nearly 40% of
the firms in our sample has been working towards providing technical education and
improving the job prospects of the workers. In terms of CSR expenditure, the maximum
amount has been spent on healthcare, followed by education and environmental
protection.
In our sample of 50 firms, more than 50% of the firms (18 out of 35) are spending
less than the required amount on CSR activities. Many reasons have been cited in the
firm’s annual reports for not complying with CSR. One of the reasons is that the schemes
implemented by the firms were in a nascent stage when infrastructure and the project
parameters and resources were identified and set up, and therefore the entire amount
devoted to the schemes could not be spent. Second, the companies were still in the
process of evaluating the focus area/locations of intervention for CSR activities to cater
to the needs of society and deliver optimal impact. Third, this being the first year after the

Indian Journal Of Business Administration (IJBA)
(A National Peer Reviewed Refereed Journal)
ISSN : 0975-6825, Volume 14, Issue 1, January-June 2021, pp. 174-181
180
law has come into effect, formulating new policy, putting new systems and procedures
into place, and mobilizing additional resources took up a substantial part of the year.
REVIEW OF LITERATURE
There are many obstacles which are emerging while considering successful CSR
strategies in making a business case for CSR, intricacy in integrating CSR with
organizational values and practices, the lack of organizational buy-in and assurance to
CSR. Other factor which hinders CSR is the lack of time and financial resources to
follow CSR practices are directly related to the above three. When an organization finds
it difficult to make a business case for CSR or its association with core organizational
operations, it will be averse to commit and allocate resources or time to such practices.
Moreover, these obstacles also point to another set of findings in the report respondents
view csr more so as a mean to manage regulatory impacts, reduce risk and respond to
stakeholders concern to a lesser extent as a strategic source of competitive advantage.
Mc Williams (2002) states that, CSR strategies, when backed by political
framework & strategies can be used to develop strong firm with long-term competitive
benefits.
According to Baron (2001) the use of CSR to attract socially responsible consumers is
referred to as a strategic CSR, in the sense that firms provide a public good in
conjunction with their business strategy.
RESEARCH METHODOLOGY
The study based on both primary and secondary data. The primary data collected
through interview scheduled from 100 respondents. Secondary data collected through
various questionnaire, books, journals and websites.
CONCLUSION
India is the first country to mandate a minimum spending on CSR expenditure of
large firms. These funds have the potential to complement the government’s effort
towards social and economic development and protection of environment. The objective
of this study was to provide an assessment of the Indian firms’ response to the law.
We do find a sharp spurt in the number if firms reporting CSR expenses in their
annual reports and also an increase in the number of firms t6hat are undertaking expenses
on CSR activities. Yet about 52% of the firms that come under the purview of the law did
not report CSR expenditures. There are spillover effects as not only the eligible but non-
eligible firms also increased their CSR expenditure. We also observe firm’s CSR
expenditure to be clustering around 2% of the profits. This suggests that firms that are

Reena Jain : Corporate Social Responsibility Issues And Sustainability
181
reporting CSR are trying to comply by the 2% stipulated in the law. There is also
evidence that some firms are meeting their mandatory CSR obligation by reducing
expenditure on other philanthropic activities such as donation.
The effectiveness of CSR expenditure, however, on development goals would
depend on successful functioning of the initiatives taken. For instance, substantial
investment has been incurred in the construction of toilets. But, just their construction
does not ensure that these will be used. The success of toilets would depend on
availability of toilets per person (one toilet in a school is not of much use) and the
availability of water. Similarly, cook stoves are distributed to reduce emissions from bio-
fuels. Again they will be successful only if households change their cooking behavior and
actually use them. However, this was the first year of implementation. How firms
respond to the new regulation in the long run needs to be investigated in future.
REFERENCES
• Berger Paints Annual Report 2014-15.
• Bharti Airtel Annual Report 2014-15.
• National Thermal Power Corporation Annual Report 2014-15.
• Bansal,S and S Gangopadhyay (2003): “Tax-subsidy Policies in the presence of
Environmentally Aware Consumers.”Journal of Environmental Economics and
Management, Vol 45, no 2, pp333-55.
• Davis, K and R L Blomstrom (1975): Business and Society: Environment and
Responsibility, New York: McGraw-Hill.
• WorldBank(2013):CorporateSocialResponsibility.”http://www.worldbank.org/en/
news/feature/2013/08/27/india-corporate-social-responsibility.
• Rangan, Kasturi V, Lisa Chase and Sohel Karim (2015):” The Truth about CSR,
“Harvard Business Review, January-February Issue, https://hbr.org/2015/01/the-
truth-about-csr.
• Mosley,D,P H Pietri and L C Megginson (1996): Management: Leadership in
Action, New York: Harper- Collins.
• Friedman, M (1970): “The Social Responsibility of business Is to Increase Its
Profits,” New York Times Magazine,13 september.
• Benabou, R and J Tirole (2010): “Individual and Corporate Social
Responsibility.” Economics and Policy, Vo77, no305, pp 1-19.
• Khanna, M and C Speir(2013):” Motivations for Proactive Environmental
Management ,” Sustainability, Vol 5,No 6, pp 2664-92,
http://doi.org/10.3390/su5062664.

Indian Journal Of Business Administration (IJBA)
(A National Peer Reviewed Refereed Journal)
ISSN : 0975-6825, Volume 14, Issue 1, January-June 2021, pp. 182-193
182
E- COMMERCE – NEED OF THE MODERN MARKETING - AN
ANALYTICAL STUDY
Dr. Shilpa Parihar*
ABSTRACT
India has been developing and there has been a policy change in the recent past
which has constrained India to digitalize itself, not only nation but also every person’s
daily to daily life now a day’s being digitalize. So the main objective of this study to
examine that how much demographical factors influence E-Commerce or digital
shopping behavior of Jodhpur’s consumer. Demographical factors such as – age,
monthly income, occupation, education, sex. To conclude the data researcher framed
questionnaire & collect data, as per the data through SPSS the result were analyzed. The
result showed that there is a strong & significant & positive relationship between
demographical factors of online shopping with digital shopping buying behavior.
Keywords: - Digital shopping , E- Commerce , Demographic factors.
Introduction
India has been developing and there has been a policy change in the recent past
which has constrained India to digitalize itself. During implementation of the
demonetization in the recent past and further bringing up of GST has invoked the use of
digital transactions even for purchasing vegetable and fruits. During that crucial period
where there were long queues before the banks and ATMs, the apps like Pay TM,
Mobiquik, Free Charge RuPay and many other e-wallet apps have found good place
because of the need of the time. As per report of Times of India, the e-wallet transactions
in India after demonetization have witnessed a growth of 400 to 1000 percent from 17
lakh per day to 63 lakh per day (ToI, 2016). Not only in urban, but also in rural India
have the people started using internet and these digital apps for online money
transactions. The above is the witnessed of increased scope of digital shopping . The
digital technologies, on one hand has made an attempt to accelerate economic growth by
providing opportunities for small business to establish & flourish,
* Guest Faculty, Department of Commerce & Management Studies, Jai Narain Vyas University, Jodhpur (Raj.)

Dr. Shilpa Parihar : E- Commerce – Need Of The Modern Marketing - An Analytical Study
183
one the other hand it has strongly affected the culture. The advancement of accessibility
to internet through computers & smart phone has virtually brought the markets in the
pockets of consumers. What consumer needs to do is to connect the online shopping apps
with the e-valet and the payment is securely done & the item purchased will be at the
door step of the consumers. Not only this, but unlike off-line shopping, the consumer is
able to rate his shopping experience on number of parameters. This rating influences
other consumers for taking their buying decision with respect to product as well as
marketer which ensures trust and transparency in the system. There are various similar
variables which affects the consumer behavior towards online shopping. A lot of studies
in India and abroad have been done on factors influencing consumer behavior towards
online shopping.
Theoretical background and literature review
(Babar.Rasheed & Sajjid 2014) collected the sample of 132 internet users as
respondents for four variables (namely, usefulness, ease of use, financial risk and
attitude). Of these it was found that usefulness was detected as a strong influence on
attitude of consumers. (Chahal 2015) identified 21 variables affecting consumer behavior
towards online shopping from review of literature. (Javadi. Dolatabadi, Poursaeedi &
Asadollahi 2012 ) studied the impact of demographic factors on on-line shopping
parameters like satisfaction, re-purchase intention, numbers of items purchased and
overall expenditure made for on-line shopping. It was revealed that on-line shopping in
India is significantly affected by demographic factors such as age, gender, marital status,
income etc.( Nazir ,Tayyab. Sajjid, UrRashid & Javed 2012 ) used various qualitative
tools to analyze the factors affecting online shopping by making a survey of 120
respondents in Pakistan and revealed that security in payment, privacy of financial
information, price, trust, convenience, online reviews were identified as most fascinating
measures affecting online shopping. (Li & Hong 2013) in their study attempted to explain
the inter-relationship between perceived vale, satisfaction and consumer re-purchase
intention.
South Korea. (Ul Hassan 2015) used regression analysis found that there is a
positive relationship and significant influence between self-efficacy, brand image and
social brand communication on online buying behavior of a customer. (Hardia & Sharma
2013) also examined the impact of demographic factors on online buying behavior of
youth. They studied impact of four demographic variables namely; age, gender,
educational background and pocket money on four measures of online shopping namely

Indian Journal Of Business Administration (IJBA)
(A National Peer Reviewed Refereed Journal)
ISSN : 0975-6825, Volume 14, Issue 1, January-June 2021, pp. 182-193
184
internet facility, ease of process, security of website and timely delivery. (Gulmeez &
Kumar Sharma 2016) have done a descriptive study to understand the factors influencing
teenager's behavior, attitude and perception towards online shopping. They revealed that
Marketing Strategies of the company, Delivery System, Product diversity and Browsing
Speed as important factors. (Chandra & Sinha 2013) also attempted to analyses factors
affecting online shopping behavior of 100 respondents in Bhilai and Durg cities and
applied regression analysis to conclude that website design, convenience, time saving and
security were the top influencing factors.
(Khanna & Sampat 2015) analyzed in their study specifically done during festive
season i.e. Diwali by online shopping giants in India namely, Amazon.com and
flipkart.com. They observed that price and product specification to be the most important
factors in selecting an item but the selection process may further be improved by making
personalized recommendations and stickiness to one online retailer. (Novak 1996)
revealed that attributes like less variety, any time shopping, physical evidence are
impacting on online purchase intention. Bellman et al. (1999) revealed in their research
the demographical factors are influencing positively towards purchase intention. Gender
impact on Internet usage has also been analyzed from different perspectives by different
researchers. Novak et al. (2000), proved in the research factors like product varieties,
mismatch between actual and delivered, sense of intangibility making impact intention to
purchase online.
Mauldin & Arunachalam (2002), identified that certain attributes like long deliver
time, speed of the internet, more searching time for a specific product, no negotiation are
closed related intention to purchase the products through online. Hoffman and Tonita et
al. (2004) found that in Digital shopping context consumer evaluate their internet
shopping experience in terms of perception regarding product customization, form of
payment, delivery terms, service offered, risk involved, privacy, security, personalization,
and enjoyment. In a research by Haq Ul Zia, (2008), “Perception towards digital
shopping: An Empirical study of Indian Consumers” suggested that overall website
quality, commitment factor, customer service and security are the four key factors which
influence consumers’ perceptions of online shopping. The study revealed that the
perception of online shoppers is independent of their age and gender but not independent
of their education & gender and income & gender. Convenience is the most influencing
factor. Time saving and security is also important, particularly the security concerns are
very important while shopping online. Most of the respondents are fulfilling that there

Dr. Shilpa Parihar : E- Commerce – Need Of The Modern Marketing - An Analytical Study
185
has no risk in digital shopping. It can be concluded that there is a opportunity for the near
future. The digital shopping among consumers of business development and we can
suggest that there has a need to provide online shopping services (Chandra and Sinha,
2013).
According to Seema Agarwal, (2013), “A study of factors affecting online
shopping behavior of consumers in Mumbai region”, factors that affect online shopping
are time saving, money saving, no risk in transaction, easy to choose and compare with
other products and delivery of product on time. With advancements in Online shopping,
there have been changes in the methodology for business transactions. India, being a
rapid adaptor of technology is apace with the current scenario of electronic data
exchanges and has taken to e-commerce. Though Online Shopping provides many
advantages, there are still a significant number of customers who refuse or reluctant to
adopt the facilities of online services. In India the adoption rate of the technology is
significantly different from other nations because of the country’s unique social and
economical characteristics. The aim of this research study is to investigate the factors
influencing the adoption of Online Shopping in West Bengal, India (Chatterjee and
Ghosal, 2014).
Research objective
The present paper focuses on identifying various variables dependent on
underlying variables which influences or inducts consumers for online shopping for
FMCG products. Various other parameters such as quality of product, time taken for
delivery of product, security of payment, after sales services etc are other parameters
influencing consumers’ online purchases decision. These variables have been identified
by the researchers by immense review of literature and brain storming sessions with
subject experts and professionals in area of marketing.
Research Methodology
The study is descriptive for the purpose which data has been collected using
convenience sampling targeting 120 customers having adequate experience in online
purchasing. While selection of these customer respondents, due care has been taken to
ensure diversity regarding demographic measures namely, gender, age, income and
educational qualification as these can be the controlling variables.
The measures influencing online shopping behavior has been identified by
immense literature review and were included in the second part of the questionnaire.
A closed ended questionnaire with five point likert scale asking the respondents to
rate their level of agreement from strongly agree (5) to strongly dis-agree (1) regarding
Indian Journal Of Business Administration (IJBA)
(A National Peer Reviewed Refereed Journal)
ISSN : 0975-6825, Volume 14, Issue 1, January-June 2021, pp. 182-193
186
various measures influencing them to buy online was administered.
Hypothesis
H01: Gender makes no significant difference regarding factors affecting online shopping
behavior of customers.
H02: Income makes no significant difference regarding factors affecting online shopping
behavior of customers.
H03: Education makes no significant difference regarding factors affecting online
shopping behavior of customers.
H04: Age makes no significant difference regarding factors affecting online shopping
behavior of customers.
The factors so identified with the constructs will be analyzed on various
demographics using appropriate tests (T-Test).
Data Analysis
In this study T-test was used to determine the significance difference between
independent variables (Age, income, education, occupation & gender) & the behavior of
consumer towards online shopping. It helps to identified that how demographical factors
influence online shopping behavior. Also reliability coefficient test was done by using
cronbach’s alpha analysis.
1. Sample Description of Demographics
Table no.1 shows the sample description of demographical factors table indicated
that age composition of those whose ages were less than 30 were 50% of the respondents,
whereas half (50%) of the respondents ages ranged more than 30 years. The education
profile of the surveyed respondents indicates that 36% of the respondents had graduate &
Post Graduate degree and 64% with professional degree ,As per occupation, result
showed that 41 % of the respondent were working & 59 % respondent were non working
As per result in age, 50% of the respondent were female & rest of the respondent were
50% .

Dr. Shilpa Parihar : E- Commerce – Need Of The Modern Marketing - An Analytical Study
187
Table :- 1
Sample Description of Demographics
Factor Frequency %
Age
Less than 30 60 50
More than 30 60 50
Occupation
Working 33 27.5
Non Working 70 58.3
Gender
Female 66 55
Male 54 45
Education Level
Graduate & Post Graduate 43 36
Professionals 75 64
2. Ranking of independent variable
Resulted that there were five independent variables that were tested by the
researcher through the questionnaires & these were distributed to the respondents. The
Likert scale was used in the questionnaire: 1 indicates strongly disagree, 2 indicate
disagree, 3 indicate neutral, 4 indicate agree and 5 Indicates strongly agree.

Indian Journal Of Business Administration (IJBA)
(A National Peer Reviewed Refereed Journal)
ISSN : 0975-6825, Volume 14, Issue 1, January-June 2021, pp. 182-193
188
Table :- 2
Ranking of Independent Variables
Factor Mean Mean Average Rank Order
Occupation
Working 60.333 4.022 5
Non Working 60.357 4.023
8.045
Gender
Female 59.742 3.982
Male 61.667 4.111 2
8.093
Education
Graduate & Post
Graduate 59.465 3.964
Professionals 61.973 4.131 1
8.095
Age
Less than 30 59.983 3.998
More than 30 61.233 4.082
8.08 3
Monthly income

Dr. Shilpa Parihar : E- Commerce – Need Of The Modern Marketing - An Analytical Study
189
Less than 50,000 61.2115 4.08
More than 50.000 60.147 4.009
8.089 4
From the above Table 2 it could be interpreted that with the ranking score of the
independent variables, Highest mean score of factors based on the respondents’ answers.
The overall result showed that Education was the most important factor; on the basis of
result it was interpreted that professional qualified respondent mostly preferred digital
shopping. Respondents who are highly educated choose online shopping. Second most
important factor that influencing customer online shopping was gender the ratio of male
& female customer using digital shopping was equal followed by age , age was also most
preferable factor that influence customer to purchase products from digital shopping,
according to ranking order monthly income consist 4th ranking followed by occupation.
Ranking order identified the preference levels of demographical factor. After age
monthly income was the most influencing factor. Occupation is lowest influencing factor.
3. Reliability for data collected
From the table 03 listed the Cronbach’s Alpha (coefficient alpha) of each
variable. All the variables Show a high degree of reliability. If the value of Cronbach’s
Alpha (coefficient alpha) is Greater than .6 then the reliability of the independent factor
was highly positive. Result showed that the value was .86 & it was greater than .6 so the
reliability of the independent variable were highly positive
Table - 3
Reliability Statistics
Cronbach's Alpha N of Items
.868 15

Indian Journal Of Business Administration (IJBA)
(A National Peer Reviewed Refereed Journal)
ISSN : 0975-6825, Volume 14, Issue 1, January-June 2021, pp. 182-193
190
4. Case Processing summary
Table - 4
Hypothesis test
Occupation
Gender
Education
Level Age
Monthly
Income
F Sig F Sig F Sig F Sig F Sig
Digital shopping
improve shopping
style /
1.591 .210 9.597 .002 5.798 .018 1.400 .239 3.042 .084
Digital shopping
enhance shopping
habits / activity
.001 .969 .129 .720 16.404 .000 1.618 .206 15.380 .000
Digital shopping is
Entail a lot of
mental stress
.040 .843 .961 .329 .041 .840 .091 .764 .065 .799
Digital shopping is
easy to understand
& clear
.047 .829 2.578 .111 3.839 .052 2.437 .121 8.156 .005
is Digital shopping
improving your
effectiveness
1.223 .271 5.472 .021 2.287 .133 .322 .572 5.586 .020
Does the time of
delivery is
important *
.390 .533 4.076 .046 .044 .834 2.364 .127 .672 .414
Is the brand loyalty
of the company is
important
.012 .913 1.256 .265 .054 .816 .041 .840 2.846 .094
Is the guarantee &
warrantee of the
company is
important
.060 .807 .065 .799 .352 .554 .883 .349 1.644 .202
Is the secrecy level
of the payment
information is .006 .941 3.606 .060 .028 .868 .611 .436 1.203 .275
N %
Cases
Valid 120 100.0
Excluded a 0 .0
Total 120 100.0

Dr. Shilpa Parihar : E- Commerce – Need Of The Modern Marketing - An Analytical Study
191
important
Does the whole
description of
product is
important
.019 .890 5.947 .016 .068 .795 .002 .966 1.663 .200
Is the product
quality is important .197 .658 .919 .340 .780 .379 .681 .411 3.763 .055
Does the product
price is important .411 .523 2.749 .100 .860 .356 .023 .881 .670 .415
Digital shopping
stores should
provide product
pictures from
various positions
.161 .689 .001 .979 2.017 .158 1.100 .297 .032 .857
Digital marketing
should have various
variety of options
.994 .321 .037 .849 .365 .547 .818 .368 .004 .953
Color of the
product in an digital
store creating
confusion to
deciding to
purchase the
product *
.028 .868 .333 .565 .074 .786 .030 .863 .999 .320
5.180
10.266
37.726
5.203
33.010
7.138
12.420
7.438
45.726
4.692
Analysis
In the context of statistical analysis, we often talk about null hypothesis or
alternative hypothesis. Significance difference between variables shows the accepting or
rejecting null hypothesis or alternative hypothesis. The above result indicated that
significance level of difference in occupation & Age was more than .05%. it shows that
occupation & age doesn’t impact on buying behavior of consumers. Whereas value of
significance level of monthly income, gender & education were equal or less than .05% it
resulted that these variables impact on buying behavior of consumers.
Conclusion
This research has provided an impact of demographical factor on online shopping
behavior of consumers the purpose of this research paper is to investigated the shopping
behavior of consumers .the overall result showed that online shopping behavior is highly
& positively accepted by consumers result analyzed the growth of online shopping & also

Indian Journal Of Business Administration (IJBA)
(A National Peer Reviewed Refereed Journal)
ISSN : 0975-6825, Volume 14, Issue 1, January-June 2021, pp. 182-193
192
identified that online shopping is more reliable & demographical factor influence online
shopping behavior of consumers. t- test uses to analyze the data researcher resulted that
occupation & age doesn’t impact on online shopping behavior of consumers whereas age
, gender & monthly income impact the consumers shopping behavior .ranking order
resulted that education is highest influencing factor followed by gender , age , monthly
income & & occupation.
References
• Agarwal, S., (2013), “A study of factors affecting online shopping behavior of
consumers in Mumbai region”, Tactful Management Research Journal, (ISSN:
2319-7943).
• Baber, A., Rasheed, A, & Sajjad, M (2014), Factors influencing online shopping
behavior of consumers .Journal of Basic and Applied Scientific Research.
4(4).314-320.
• Bellmen, et al. (1999), “Predictors of online buying behavior”, Communication of
the Acm, . 42, (12), 32-38.
• By, E,.Gulmez, M, & Kumar Sharma assistant professor senior ,A,(2016). Factors
influencing youngsters behaviour towatds online shopping in vellore district of
Tamilnadu , India. Journal of Internet Banking and Commerce, 21(21S5).
• Chahal, P. (2015).International Research Journal of Commerce and Law .2(6).44-
50.
• Chandra, A.K,. & Sinha, D. K. (2013). Affecting the Online Shopping
Behaviour : a Study With Reference To Bhilai Durg. International Journal of
Advanced Research in Management and Social Sciences, 2(5), 160–177.
• Hardia, A., & Sharma, K. (2013). Empirical Study of Factors Affecting Online
Shopping Amongst Youths, 3(2), 91–96.
• Javadi, M. H. M., Dolatabadi, H. R., Poursaeedi, A., & Asadollahi, A. R. (2012).
An analysis of factors affecting on online shopping behavior of consumers.
International Journal of Marketing. 4. 3(5), 81.
• Khanna, P., & Sampat, B. (2015). Factors Influencing Online Shopping During
Diwali Festival 2014 : Case Study of Flipkart and Amazon . In. Journal of
International Technology and Information Management, 24(2), 65–87.

Dr. Shilpa Parihar : E- Commerce – Need Of The Modern Marketing - An Analytical Study
193
• Li, H., & Hong, J. (2013). Factors Influencing Consumers ’ Online Repurchasing
Behavior : A Review and Research Agenda. iBusiness, 5(4), 161–166.
• Luarn, P., & Lin, H.H. (2003), “Customer loyalty model for e-service context”,
Journal of Electronic Commerce, 4, (4), 156-167.
• Mauldin, E. & Arunachalam, V. (2002), “An experimental examination of
alternative forms of web assurance for business-to-consumer E-commerce”,
Journal of Information Systems.16 (1), 33-55.
• National Monthly Referred Journal of Research in Commerce and Management,
1, (8)
• Nazir, S., Tayyab, A., Sajid, A., Ur Rashid, H., & Javed, I. (2012). How Online
Shopping Is Affecting Consumers Buying Behavior in Pakistan? IJCSI
International Journal of Computer Science, 9(3), 486–495.
• Novak, et al. (2000), “Building consumer trust online", Communication of the
ACM”, 42, (4), .80-85.
• Nysveen, H. & Pedersen, P. (2004), “An exploratory study of customers'
perception of company web sites offering various Interactive applications:
Moderating effects of customers' internet experience”, Decision Support Systems,
37, (1) 137-150.
• Rastogi, A.K., (2010), “A study of Indian online consumers and their buying
behavior”, International Research Journal, July 2010, 1,(10).
• Sen, Rahul, (2014), “Online shopping: A study of the factors influencing online
purchase of products in Kolkata”, International Journal of Management and
Commerce Innovations (Online), 2 (1), 44-52.
• Tonita, P.M. et al. (2004), “What drives consumers to shop online?”,
International Journal of Service Industry Management, 15,(1),102-121
• TulsiRaval, (2005), “Study of effectiveness of online shopping”, Indian Journal
of Applied Research, 4, (9).
• Ul Hussain, T. (2015). Factors Influencing Consumer Actual Online Buying.
IQSR.Journal of business and management 17(6) ,2319-7668
• Zia Ul Haq, (2008), “Perception towards online shopping: An empirical study on
Indian consumers”,

Indian Journal Of Business Administration (IJBA)
(A National Peer Reviewed Refereed Journal)
ISSN : 0975-6825, Volume 14, Issue 1, January-June 2021, pp. 194-207
194
ISSUES AND CHALLENGES OF CORPORATE GOVERNANCE _______________________________________________________
Dr. Pushpendra Kumar Musha*
ABSTRACT
Good governance includes all actions pointed toward giving its residents, good
personal satisfaction. With the quick change in the business climate and the development
of new guidelines by world bodies like EEC, WTO, OECD, World Bank and so on the
idea of Corporate Governance (CG) is presented and has additionally been the stimulus.
Corporate governance offers the crucial benefit structure for the way of life of an
association, which guarantees productive working of big business on strong moral
qualities and standards. It centers around the suitable administration and control design
of a company. It characterizes and limits the rights and responsibilities of the
constituents of the corporate like sheets, administrators, investors and different partners.
Corporate governance fundamentally (a) Long-term connections, which needs to manage
governing rules, motivating forces of chiefs and interchanges among the executives and
financial backers (b) Transactional connections including matters identifying with
divulgence and authority. A large portion of the meanings of Corporate Governance
referred to above around setting down least principles and characterizing the job of the
different players associated with Corporate Governance.
Keywords—corporate governance, corporate legal system, corporations, issues,
Challenges
INTRODUCTION
The favourable features of Indian industry notwithstanding, there are considerable
scope for Indian companies attaining significant share in different industrial and services
sectors. For instance, India represents only one per cent of the worldwide IT market. The
portion of the help area in Indian GDP is expanding due to reevaluating and two-thirds of
India's human resources are as yet occupied with farming, however, the vast majority of
them stay under-utilized.
* Assistant Professor, Faculty of Law, Jai Narain Vyas University, Jodhpur, Rajasthan (India).

Dr. Pushpendra Kumar Musha : Issues And Challenges Of Corporate Governance
195
Also, the pace of development in this area is much slower compared to
manufacturing and services. Also, the country has no coordination system or legal
framework for its skill-development and improvement, so as to react to the changing
necessities of industry and self-employed people in more small countries like Malawi,
Philippines and Tanzania adopted such frameworks almost 10 years prior in order to
adjust to the realities of globalization. The country is thus in a situation of “little done,
much yet to be done.” Taking into account these real factors, there ought to be nothing to
feel suddenly amped up for the above acknowledge. The worldwide economy is evolving
quickly; increasingly more Indian organizations are required to march towards attaining
global standards. Except if they incorporate themselves with all-around acknowledged
brands, it is hard to think about their practicality in the worldwide market despite
remarkable ample, the Usha Martin group has world-class skills in producing wire ropes;
in any case, worldwide purchasers don't hazard their application in territories, for
example, connect building.
Similarly, Sundaram Fasteners may sell General Motors (GM) just the least
complex of its items (radiator caps), and that too for models that GM was gradually
phasing out. Despite phenomenal success of IT companies, they despite everything think
that it is hard to sell their products for some of the most complex jobs in IT at the global
level.
Taking a gander at the presentation of Indian corporate pioneers of the pre-reform
era, it is significant that their performance in the post-reform time has been falling
quickly. As uncovered in an ongoing report, out of a sum of 2151 companies, 1696 (i.e.,
79 per cent) were making profit in the year 1991 but in the year 2001, only 1000 (46 per
cent) were making profit. And, the presentation of more than 50% of the pre-change
corporate pioneers has gone down both as far as their business rank and benefit position.
It is quite evident that Indian corporates have not had the option to withstand the
undeniable trends caused by the globalization syndrome.
Again, the scenario of performance of Indian industry in terms of its share in
exports and acceptability of its items by worldwide players show that senior corporate
pioneers in India, all in all, have not built up the essential confidence in themselves that
they can succeed in the worldwide market. While Indian industrialists know about the
significance of revolutionary reaction to the difficulties presented by globalization, they
are by one way or another caught in a steady mentality. They have not shown the
essential feeling of activism that warrants worldwide change elements. Obviously, there

Indian Journal Of Business Administration (IJBA)
(A National Peer Reviewed Refereed Journal)
ISSN : 0975-6825, Volume 14, Issue 1, January-June 2021, pp. 194-207
196
are numerous instances of eminent accomplishment by Indian organizations. However,
the majority of these are untold stories, in which the principle heroes are unheard.
First of all, Indian companies and managers need to learn to discard their so-
called tried and tested solutions and old perspectives in understanding the scope of
today’s business problems. They are still associated with strategy-structure-theory, which
hypothesizes that the structure follows the strategy. This model is viewed by Indian
managers as the primary level to direct the performance of their organization. He has
reconciled to see this model is the most significant. They are occupied with guiding
themselves towards strategizing and shaping. Most have not yet completely figured it out
to what extent the world is changing in various areas of economic operations. In the new
era, the strategy building model has little precedence in view of the uncertainties arising
due to chaotic competition. It is therefore not high on the agenda of global organizations.
Rather, they are concentrating on their ability constructing to stand up to the
flighty floods of rivalry more competently. Researchers have revealed that the front-
running organizations are putting vigorously in building their intangibles to improve their
long stretch market esteem; probably the most significant intangibles in this relationship
include: shared mindset, talent, speed, education, accountability, collaboration and
leadership quality.
Intangibles mirror the positive or negative estimation of a company that isn't
clarified by its present profit. The ‘intangibles’ thesis has become more popular since the
publication of research findings of Baruch Lev, a Professor of Finance at New York
University. He has scrutinized the customary perspective on the ascent in stock costs. The
customary postulation accepted that when a firm procures more cash, its offer worth goes
up in the market. Lev's research has contended that before, 75–90 per cent worth of a
company's market could be anticipated by its monetary exhibition; nonetheless, since
1990 this figure has boiled down to simply around 50 per cent. Rather, it is attached to
the estimation of intangibles in a company as the deciding element.
Consequently, the defenders of the 'intangibles' proposal claims that companies
that have high intangible value have higher price/value of their stock. Jack Welch, the
previous CEO of General Electric, has been credited as an ace in the impalpable worth
structure. The offer costs of GE could zoom because of the trust in the company that he
made through his guarantees. He imparted to the investors, workers and clients precisely
what he arranged. He additionally endeavoured to see that his guarantees were conveyed.

Dr. Pushpendra Kumar Musha : Issues And Challenges Of Corporate Governance
197
CHALLENGES WHICH DWELL FOR GOOD CORPORATE GOVERNANCE
BY INDIAN GOVERNMENT
Corporate governance is tied in with guaranteeing that a business performs well
through the appropriation of reasonable and moral standards and those investors get
sensible returns. The governance structure gives generally speaking bearing to the
executives and guarantees accountability to investors and different partners. Corporate
governance exists at a complex crossroads of law, ethics and economic efficiency.
Corporate governance is expected to follow the principles of fairness, transparency,
accountability, responsibility, maximize business performance and global
competitiveness. Corporate governance is concerned with the effective strengthening of
the rights of investors and creditors. According to the elite Milton Freedman, "Corporate
governance is to conduct business according to the will of the owner or shareholders."
This would normally be to get whatever amount of income could be anticipated, while
finding a place with the fundamental standards of society exemplified in law and close by
traditions. Corporate governance is worried about the concordance among money related
and social destinations and the objectives of people and the company. There is a
corporate governance system to energize the productive utilization of resources and
responsibility for working these assets. Its motivation is to adjust whatever amount as
could be anticipated in light of a legitimate concern for individuals, corporations and
society.
i) Regulations for Corporate Governance in India Many financial scandals have forced the establishment of corporate governance
in India. The concentrated ownership of money shares, pyramiding and tunneling among
the group companies has marked the Indian corporate landscape. Unethical and illegal
actions during 1990–2000 forced business sectors to adopt corporate governance.
Corporate governance and financial advancement are inherently connected. Successful
corporate governance frameworks advance the turn of events of a strong financial system,
regardless of whether they are to a great extent bank-based or market-based, which
positively impact economic growth and poverty reduction. Good corporate governance is
portrayed by the solid duty and appropriation of moral practices by associations over its
whole worth chain with a wide set of stakeholders comprising employees and clients,
sellers, controllers and shareholders. Ministry of Corporate Affairs proposes new
companies bill 2008, the reason for which is to improve corporate governance by the
forces vested in the shareholders. These powers have been balanced by greater emphasis
on self-regulation, reducing regulatory approvals and increasing financial matters and

Indian Journal Of Business Administration (IJBA)
(A National Peer Reviewed Refereed Journal)
ISSN : 0975-6825, Volume 14, Issue 1, January-June 2021, pp. 194-207
198
more transparent disclosures. In 1996, a committee headed by Rahul Bajaj developed the
Confederation of Indian Industry Code for desirable corporate governance. The 2001
Standing Committee on International Financial Standards and Codes, RBI's advisory
group, submitted its report influence on changing the state of corporate governance in
India. The Birla Committee recommendations were executed through the order of
statement 49 of the posting understandings. These suggestions were implemented: (1)
Companies in BSE 200 and S&P, C&X Nifty indices and newly listed companies as on
31 March 2001. (2) Companies with paid up capital of Rs 25 crores or net worth of Rs
25 crores whenever in the last 5 years. (3) Other listed companies with paid-up capital in
excess of Rs 3 crore as on March 2003. (4) More attention to the subject of share transfer.
Since 1994, the Board of Financial Supervision has been monitoring and monitoring
banks using the Camels (Capital Adequacy, Asset Quality Management, Income,
Liquidity and System Control) approach. In 1995, audit committees were set up in
banks. Important laws to regulate the whole corporate construction and manage different
parts of governance in corporations are the Companies Act, 1956 and the Companies Bill,
2004. The Securities Contracts (Regulations) Act, 1956, the Securities and Exchange
Board of India Act, 1992 and the Depository Act, 1996 was presented by the Board of
Securities and Exchange with the target of ensuring the charges of analysts in the
securities market of India is to stay aware of the standards of corporate governance in the
country. The Securities Contracts (Regulation) Amendment Act, 2002 has been enacted
to change the Securities Contracts (Regulation) Act, 1956 so as to incorporate
securitization instruments under the definition of securities and to provide disclosure-
based rules for the issuance of securities. The Security and Exchange Board of India has
specified matters identifying with abuse of capital, the move of securities and different
matters, for example, such makes a difference to be unveiled companies. The Depository
Act, 1996 provides for the introduction of dividend less trading systems and settlements,
which is considered essential for effective functioning.
The Companies Bill, 2004 contains significant arrangements identifying with
corporate governance like free reviewers with the administration of the company,
autonomous directors to further develop corporate governance rehearses in the corporate
area. It is dependent upon more perceptible adaptability and self-rule by companies,
better cash related and non-monetary disclosure and more efficient enforcement of the
law.

Dr. Pushpendra Kumar Musha : Issues And Challenges Of Corporate Governance
199
ii) Effective Corporate Governance There are few features of effective corporate governance:
1. Access to outside financing that will prompt more prominent venture, growth
and employment
2. Reduce the cost of capital to reduce the risk of financial crisis.
3. Better asset allotment to win the trust of stack holders, to improve social and
labor relations and to conserve the environment.
4. Transparency in all financial and non-financial matters.
iii) Current Position of India in World Scenario As indicated by the CLSA Corporate Governance Watch 2012 rundown, India's
corporate governance score has improved, worked in a joint effort with the Asian
Corporate Governance Association by 3 percentage points, but the ranking remains the
same. "This isn't because of an absence of mindfulness by controllers, yet rather a
piecemeal way to deal with change and an intermediary government incapable to do
anything important given its cutoff among its partners," ACGA look into executive
Sharmila Gopinath said in the report. In the market rankings, Singapore topped 2012 and
was followed by Hong Kong and Thailand in second and third place respectively. There
is a tie between Japan and Malaysia in fourth place, the report said. Among others at the
top, Taiwan is ranked 6th, followed by India (7th), Korea (8th), China (9th), Philippines
(10th) and Indonesia (11th). In addition, there were only five Indian companies that
made it to the top 50 league table. Apart from this, the other four Infosys include HUL,
Wipro, Titan Industries and Yes Bank. "Despite efforts by the corporate part and
individual controllers to increase corporate governance expectations, these generally
neglect to address key governance issues, for example, bookkeeping measures, Gopinath
said, regulating auditors and voting barriers for investor’s incapable to-go-to company
meetings. The report, titled "Tremors and Cracks", noted that cracks in Asian corporate
governance have become more pronounced since the release of the previous CG Watch
report in 2010, with a drop in corporate scores. Investors have confronted issues going
from moderately minor corporate changes to developing worries about the unwavering
quality of fiscal summaries and outright fraud at the extreme. "Corporate governance is
to a great extent about checks and balances," CLSA Head of Asia Research Amar Gill
said in a statement "To deal with the rift in administration and the setbacks in Asian
investment, investors will need to make a tight grip and get a grip."

Indian Journal Of Business Administration (IJBA)
(A National Peer Reviewed Refereed Journal)
ISSN : 0975-6825, Volume 14, Issue 1, January-June 2021, pp. 194-207
200
CHALLENGES TO EFFECTIVE CORPORATE GOVERNANCE There are certain practices prevalent in the market and in our society that are
becoming a challenge for corporate governance in our country. (1) Weak and
underdeveloped to manipulate the illiquid equity market, with traditional analyst activity.
(2) Domination and monopoly of family firms. (3) High level of corruption is visible only
after revelations of major financial scam. (4) Weak and non-transparent monitoring
system. (5) Lack of respect for shareholders and less financial disclosure. The notion of
poor corporate governance in public sector enterprises may be a conduit to the
government's divestment program. The government is hoping to raise Rs 30,000 crore by
selling stakes in companies like Steel Authority of India Limited, Bharat Heavy
Electricals Limited, NMDC Limited, National Aluminum Company Limited, Oil India
Limited, Rashtriya Ispat Nigam Limited and MMTC Limited. In a new low, recently
released government data showed that many state-owned companies are not eager to self-
assess their governance standards. According to data released on Monday by the
Department of Public Enterprises (DPE), out of the 249 central public area endeavours in
the nation, 109 substances didn't give self-evaluation reports on their corporate
governance rehearses for 2010–11. As indicated by an ongoing overview conducted by
the Confederation of Indian Industry and Institutional Investor Advisory Service,
investors ruled 1.75 on a scale of four among state-owned companies, well below 3.67
for multinational corporations and for professionally-run companies 3.17. As a result of
this low impression of governance, a poor return was expected. Public sector
undertakings (PSUs) are one of the four categories of companies in terms of alleged
shareholder returns. At a score of 1.36, PSU lagged behind promoter-run companies,
whose governance level was low.
While share prices have improved significantly over a series of government
decisions and get cheap and easy money around the world, Government deficiencies are
seen as a major risk by institutional investors for government issues, including the
protection of minority investor rights. The administration is regularly blamed for dealing
with PSUs listed as public sector undertakings, using its balance sheet to subsidize
populist plans. In 2009, Goldman Sachs gave a slogan to the government for using the
balance sheet of Oil and Natural Gas Corp to subsidize fuel prices. Currently, UK-based
hedge fund TCI is allegedly messing with the government to follow pricing policies that
are harmful to shareholder interests. The CII-IIAS survey showed that investors have low

Dr. Pushpendra Kumar Musha : Issues And Challenges Of Corporate Governance
201
resilience levels for corporate governance issues in investment companies. "About 33
percent of investors expect corporate governance issues to be settled inside a month,"
While 42 per cent hope that the issues of corporate governance will be resolved within
three months. In other words, institutional investors have little tolerance for poor
corporate governance, and may respond to exit from the company. Although PSUs are
rated very low in terms of perceived shareholder returns (rated 1.36), they have fared
better when investors have been asked to rate their chances of investing (rated 2.33). The
IIAS report states, "In the current environment this means that investors expect some
favorable policy changes."
The effective Corporate Governance seeks to find ways of reducing conflict
among minority shareholders and majority shareholders (including the promoter, founder
etc. in a company, those who actually make decisions on behalf of all the shareholders). It
is only through effective Corporate Governance that strategic aims and objectives are
established and the proper management is set up to achieve those aims and objectives.
Though SEBI has been established as trustees of the shareholders, and in
principles, India has the most stringent regulations in the world for corporate governance;
shareholders are yet at the mercy of the promoters and receive nothing beyond the
promoters will.
i) Problems in Corporate Governance in Private Organizations
The problem of Corporate Governance has arisen due to the rising need to
separate ownership and management control and the increasing demand to make the
organization more visible, accountable not only to founders, but also to every
shareholder, groups and the community at large. The legal responsibility for the overall
management and the control of the organization rests with the Board. Good Governance
is the responsibility of the Board. Globalization has increased the interest in governance
issues. There are following major issues in the Corporate Governance practices i.e.
ii) The Conflict between Promoters and Management Since numerous companies are family-claimed ventures, Promoters are majority
shareholders who continue to have an undue influence on business choices. This
occasionally prompts a showdown between the advertisers and the administration, which
is liable for every day working of the company. Recent examples of Tata Sons exiting
the chairman of the Tata group, and the forced exit of Infosys CEO, both have exposed
weaknesses in our corporate governance norms due to differences between management
and promoters. The conflict has also reflected weaknesses in succession planning by
founders / promoters, many of them leading to inherent barriers to take control of their
Indian Journal Of Business Administration (IJBA)
(A National Peer Reviewed Refereed Journal)
ISSN : 0975-6825, Volume 14, Issue 1, January-June 2021, pp. 194-207
202
companies.
iii) Stressed Balance Sheets
The awful obligation issue, which has influenced the corporate area, is as much a
result of terrible Corporate Governance standards. Many expensive acquisitions were
made in the last decade by companies without a proper approval from the shareholders
and conducting due diligence. As a result, few of them paid off for the shareholders.
iv) The Composition of the Board
The Companies Act presented a few decent Corporate Governance arrangements,
for example, 33% of the company board ought to include Independent Directors, the
board ought to have in any event one-lady Director, the constitution of Audit Committee
inside the board and so forth. Be that as it may, a few companies despite everything
haven't delegated Woman Directors in their Board, while some of them have named the
women family members or friends of promoters as Directors in order to fulfill the
requirements on the paper.
v) Role of Independent Directors
The role of Independent Directors is to enhance the accountability of the Board
towards shareholders. Top employees are paid in some cases excessive remuneration,
where they allow promoters to have an important say as quid pro quo. Then again, many
small companies fail to offer competitive remuneration to attract talented professionals.
Sometimes, excessive remuneration of top employees can turn into a state of contention
among advertisers and the executives, as on account of Infosys decisions if they find it
against the interest of all stakeholders.
vi) Family Owned Business- Voting Majority
Family owned business is the business where voting majority is in the control of a
family; and approx. 75 percent of Indian big firms are controlled by different family. It
includes the founder also who always intend to transfer his establishment to his family
descendants. It becomes difficult for pariahs to follow the business real factors of
individual companies. These types of firms need proper monitoring and controlling
mechanism in order to create proper governance. Family owned business has created
problem for the proper implementation of the corporate governance norms, as the
majority stakeholders run the business in light of a legitimate concern for the family and
the interest of the company and furthermore, the interest of the minority investors have
never been kept at par with the family interest. The family owned business in listed

Dr. Pushpendra Kumar Musha : Issues And Challenges Of Corporate Governance
203
companies is critical because in case of listed company the shareholders are not allowed
to participate in the day to day business activity.
vii) Executive Compensation
As per the new Companies Act, after the earlier endorsement of the shareholder,
the nomination and remuneration committee of the Board is to decide on the
compensation to key employees. Top employees are paid in some cases excessive
remuneration, where they allow promoters to have an important say as quid pro quo.
Then again, many small companies fail to offer competitive remuneration to attract
talented professionals. Some of the time, excessive compensation to the top workers can
turn into an issue of contention among advertisers and the board, similar to the instance
of Infosys.
viii) Conflict between Dominant Shareholders and Minority Shareholders
The main problem in implementing corporate governance in India is the conflict
between the predominant shareholders and the minority shareholders. In United States
and UK, the conflict has been observed specially between the management and the
owner. The substance of this relationship of minority and majority shareholding is
contractual in nature and every shareholder is qualified for an offer in the benefits in
relation to their stake and the advantages of the company with respect to his
shareholding. Shareholder also keeps certain other rights including the right to control
and a few different rights in relation to their shareholding rights. Spilling out of this is the
way that the Board and the organization of the company have a trustee obligation towards
every single shareholder and not simply towards the greater part of predominant
shareholder.
ix) Non-compliance to the Disclosure Norms
The provisions have been made for the compliance to the disclosure norms. But
the above provisions have hardly been followed in India. Failure to submit the auditor’s
report attracts the nominal fines and no substantial action has been taken against any firm
till date for non-submission of the auditor’s report.
x) Irregularities in Updating Share Registers
The mandatory provision has also been made for updating the share registers, but
the above provisions have also been defaulted by the small firm and the minority
shareholders have often suffered from irregularities.
xi) Misleading Financial Statements
There are various ways to deal with present factually exact information on a
careful spending plan rundown in a way that is deluding to monetary benefactors for

Indian Journal Of Business Administration (IJBA)
(A National Peer Reviewed Refereed Journal)
ISSN : 0975-6825, Volume 14, Issue 1, January-June 2021, pp. 194-207
204
example selling property from a parent company to an auxiliary to expand the parent
company revenue e.g. Harshad Mehta scam followed by the companies assigning special
offers to their advertisers at limited costs too those of companies essentially vanishing
with speculators' cash.
xii) Clause 49 of the listing agreement provides that every listed company must have non-
executive director. The provisions for the non-executive director have been made to
challenge the unfair acts of the management, but in reality, the non-executive director has
failed to perform the above duty. The reason behind the above failure is that the
competent persons are hardly available and even if few competent persons are willing to
join, they are not allowed the reasonable salary and remuneration. Further, the non-
executive director was expected to act independently but the study shows that they have
failed to act as per the expectation.
xiii) Now and then non-casting ballot particular offers are utilized by advertisers to
channel reserves and deny minority shareholders of their contribution.
xiv) It is though noteworthy that regardless of how solid a regulatory system, it can't
forestall cheats as the terms of the rules and regulation are not as important as the spirit of
the rules and regulations. Despite of the gigantic increment of exposures and rigid danger
the board systems tricks do occur. There are cutoff points to legislation as a great deal
relies upon the honesty and moral estimations of different corporate players, for example,
chiefs, advertisers, administrators and shareholders. One ought to perceive the
responsibility of the company towards its stakeholders.
CONCLUSION
Corporate governance has been proving a very efficient and effective system for
our economy and to save the premium of investors however some more productive
observing and straightforward interior audit framework, proficient board and the
executives can lead it to powerful corporate governance.
It is axiomatic that in the face of a dynamically changing - and even somewhat
painful - change for certain economic functions the exhibition of the Indian economy in
the post-globalization era is quite satisfactory in terms of growth in GDP. While many
established Indian companies couldn't withstand the unavoidable trends and needed to
leave the field, new business people have joined the worldwide band-wagon to establish
themselves in emerging commercial realities. Inflows as a result of the entry of large
numbers of multinationals and foreign direct investment have increased competition
events and thus are the expected standard of corporate performance. And, given the

Dr. Pushpendra Kumar Musha : Issues And Challenges Of Corporate Governance
205
increasing incidence of globalization and the convergence thesis in management across
countries, Indian corporations have a huge scope to learn from the experience of
multinationals and other professionally managed organizations. More than four decades
of statistical philosophy and consequent protectionist policies of the Government of India
have led to a mindset of decency, rule-domination and changing resistance in the public
and private sectors, which hinders Indian companies from attaining world class status. A
lot needs to be done in the area of change management and internalization.
The ability to lead organizational and cultural change will be maybe the main
competency that pioneers would be required to exhibit in the new business time. Studies
have shown that around the world, around 20 to 25 percent of corporates can support
durable change the board methodologies. Given the outlook of tasks in shut frameworks,
Indian organizations should be more proactive to deal with the elements of progress. For
attaining lasting success, an organization’s people-management strategy must find an
important place in its top management philosophy. In this regard, there is a case for
leadership advancement; teaching and sustaining of fundamental beliefs in authoritative
governance; building up a culture of getting the hang of, benchmarking and development;
and changing of mindsets of organizational members through the utilization of proactive,
and not reactive, HRM methodology including the structure of ideal working
environments.
As the Indian economy pushes forward in its development direction, the shift
from reducing the expense to contributing in people will become more apparent. Human
resources managers will be seen performing the roles of strategic partners and change
agents in organizational transformation. But it is more imperative to execute this through
the present change plan with the goal that this cycle can be sped up as social prudence of
corporate India. Huge scope operationalization of the strengthening model of Human
resources in India is an aspiring motivation as it requires a sort of social change separated
from financial revamping. And, the Indian corporate sector has miles, miles to go to
make it happen as a national work ethos. But given the speed with which Indian services
industry is flourishing, for example, it is certainly not impossible to achieve.
References
1. Saini, Debi S. (2005), “Organizational Change, the Indian Context and the
Change Champion’s Fieldguide: An Introduction” In Ulrich, Carter, Goldsmith
and Saini (eds.).
https://www.researchgate.net/publication/260276899_Organizational_Change_the
Indian Journal Of Business Administration (IJBA)
(A National Peer Reviewed Refereed Journal)
ISSN : 0975-6825, Volume 14, Issue 1, January-June 2021, pp. 194-207
206
_Indian_Context_and_the_Change_Champion's_FieldGuide_An_Introduction.
2. Ghoshal, Sumantra, and Christopher A. Bartlett (1997), The Individualized
Corporation, New York: Harper Collins Publishers.
3. Kumar, Krishna (2003), “Has India Inc Failed in Playing the Leadership Role?,”
Vikalpa, Vol. 28 No. 3 (July-September).
4. Ulrich, Dave and Norm Smallwood (2003), Why the Bottom Line Isn’t––How to
Build Value Through People and Organization, Hoboken: John Wiley & Sons.
5. Ulrich, Dave and Wayne Brockbank (2005), The HR Value Proposition, Boston:
Harvard Business School Press.
6. R.A. and S.C. Myers, Principles of Corporate finance, Tata McGraw Hill, Delhi,
1997.
7. Sir Aderian Cadbury, Global corporate Governance forum, world Bank, 2000.
8. Claesseans, 2003.
9. Indian business portal, www. Google.com.
10. India ranks 7thin corporate governance in Asia-Pacific, Business News, Sun, Sep
23, 2012.
11. Low corporate governance in PSUs could hit govt’s disinvestment plan, N
Sundarshan Subramanian, N Delhi Sep 23, 2012.
12. Whittington, Johnson and Scholes (2007).
13. Bain and Band 1996.
14. Family owned companies are characterized as organizations in which the
shareholders belong to the same family and participate substantially in the
management, direction, and operation of the company.
15. http://www.ijimt.org/papers/23-C050.pdf
16. Sharma Nidhi, "Corporate Governance Mechanisms in India" International
Journal of Advance Research and Development, Vol.2, Issue 5, Available online
at www.ijarnd.com
17. As the family and its business grow larger, this situation can lead to many
inefficiencies and internal conflicts that could threaten the continuity of the
business. http://www.ibanet.org/Article/Detail.aspx?ArticleUid=4BBCD91B-
ADC0-466A-9B1729071AE06FC0.
18. The key constituents of corporate governance are shareholders, Board of
Directors and managements. The three major aspects of corporate governance are
accountability, transparency and equal treatment of all shareholders.

Dr. Pushpendra Kumar Musha : Issues And Challenges Of Corporate Governance
207
19. It comprising a majority of Independent Director.
20. The problem of the dominant shareholder arises in three large categories of Indian
companies. First are the public sector units where the government is the dominant
shareholder and the general public holds a minority stake. Second are the
multinational companies where the foreign parent is the dominant shareholder.
Third is the Indian business group where the promoters are the dominant
shareholders and the balance is held by the general public.
21. ILR 1993 Delhi 274.
22. http://pushkarchandna.sulekha.com/blog/post/2010/02/satyam-lessons-
andcorporate- governance-reforms.htm

ISSN :- 0975-6825
Indian Journal of Business Administration
Faculty of Commerce and Management Studies
Jai Narain Vyas University, Jodhpur (Raj.)
Jaswant Campus, Mohanpura Pulia, Jodhpur (Raj) 342001
IJBA -Yearly Subscription Form
2021
I/We………………………………………………. wish to subscribe to/renew my/our
subscription for ‘Indian Journal of business Administration, ISSN:- 0975-6825.
Subscription Period: ..................................to...................................
� Yearly Subscription Fees:
Period Amount Payable
One Year (02 issues)
January - June
July- December
2,000/-
Name of Bank & Address Bank of Baroda, Jaswant Hall, Jodhpur
Name of Account (Current A/c) Head Department of Business Administration
Branch IFSC Code BARB0XTUNIJ (fifth character is Zero)
Current A/c No. 98070100003960
� Online Payment / Transaction Details:
Transaction No.:………………………………………………Dated ..................... ……..............
(Enclose scanned copy of online payment)
� Subscriber No. /(Renewal):………………………….......………………….......
� Address for sending journal hard copy: • Name:-……………………………………………...…………………..........
• Organization:- ...…….……………………………………………………....
• Address:- …………………………………..………………………..………
• City:- ………………………………State:-………….....................................
• Pin code………………………..Phone/Mobile…………………….........…..
• Email id …………………………………….....…………………………….
Signature with date
Note:- Please submit scanned copy of your filled subscription form at
[email protected] along with the proof of online payment of Nationalized Electronic
Fund Transfer (NEFT) or online payment.

Thoughts that inspire ..........
THE LAW OF INDIVIDUAL GROWTH :
XäÉÄâà|ÉÇ |á tÄãtçá xåÑxÜ|ÅxÇàtÄA TÄÄ ÑÜÉzÜxáá |á zt|Çxw à{ÜÉâz{ Å|áàt~xá tÇw à{x|Ü Üxvà|y|vtà|ÉÇA aÉ zÉÉw vÉÅxá yâÄÄç ytá{|ÉÇxw Éâà Éy zÉw:á {tÇw? uâà {tá àÉ ux vtÜäxw Éâà? à{ÜÉâz{ ÜxÑxtàxw xåÑxÜ|ÅxÇàá tÇw ÜxÑxtàxw yt|ÄâÜxá? uç ÉâÜáxÄäxáA g{|á |á à{x Ätã Éy |Çw|ä|wâtÄ zÜÉãà{AAAAAA g{x Ü|z{à àÉ xÜÜ? ã{|v{ ÅxtÇá à{x yÜxxwÉÅ àÉ àÜç xåÑxÜ|ÅxÇàá? |á à{x âÇ|äxÜátÄ vÉÇw|à|ÉÇ Éy tÄÄ ÑÜÉzÜxááA
-Mahatma Gandhi
j{tà |á |ÅÑÉÜàtÇà |á àÉ ÉuáxÜäx ã{tà |á tvàâtÄÄç àt~|Çz ÑÄtvx |Ç ÉâÜ wt|Äç Ä|yx? |ÇãtÜwÄç tÇw ÉâàãtÜwÄçA gÉ ÉuáxÜäx? àÉ ÄÉÉ~? Çxxw ÇÉ Ñ{|ÄÉáÉÑ{ç? ÇÉ àxtv{xÜ? lÉâ }âáà ÄÉÉ~A \y çÉâ àÜç àÉ áàâwç çÉâÜáxÄy tvvÉÜw|Çz àÉ tÇÉà{xÜ? çÉâ ã|ÄÄ tÄãtçá ÜxÅt|Ç t áxvÉÇw@{tÇw {âÅtÇ ux|ÇzA jx Åâáà à{xÜxyÉÜx ÄxtÜÇ tuÉâà ÉâÜáxÄäxá? ÇÉà tvvÉÜw|Çz àÉ áÉÅx Ñ{|ÄÉáÉÑ{xÜ uxvtâáx à{xÇ ãx ÄxtÜÇ tuÉâà {|Å? ÇÉà ÉâÜáxÄäxá @ ãx Åâáà ÄxtÜÇ ã{tà ãx tvàâtÄÄç tÜxA _xà âá áàtÜà ÉÇ ÉâÜ }ÉâÜÇxç àÉzxà{xÜ ã|à{ tÄÄ à{x ÜxÅxÅuÜtÇvxá Éy çxáàxÜwtç Äxyà ux{|Çw tÇw uxz|Ç àÉ âÇwxÜáàtÇw ÉâÜáxÄäxá yÉÜ à{x y|Üáà à|ÅxA
-Jiddu Krishnamurti

GUIDELINES FOR PAPER PUBLICATION
Guidelines for submission of Research Manuscripts for publication in Indian
Journal of Business Administration (IJBA), ISSN:-0975-6825
The following are the guidelines applicable to contributions:-
1. The cover page should include Title, Abstract, Keywords, Author (s) and
Affiliation(s) Official Address as well as Residential Address with Pin Code Email
Address. Please indicate the corresponding author. The abstract not exceeding 200
words along with 5 Keywords, citing the purpose, scope and conclusion of the
submission.
2. Articles should not be more than 2,500-5,000 words including notes, references &
tables.
3. Text should be 1.5 spaced typed in MS-word on A-4 size paper leaving one inch
margins all around. The text must be typed in font size 12 and font type "Times New
Roman".
4. The Main text should not contain name of the author. The manuscript should not
contain footnotes.
5. References should be given at the end of the manuscript.
6. Authors are requested to include only a list of cited References and not a
Bibliography.
7. Reference to a citation in the text should be made by means of the author's name
followed by the year of publication in parenthesis.
8. The references must follow the style guide of the American Psychological Association
(APA),(www.apastyle.org).
9. Page numbers, names of publishers and place of publishing are very important and
should not be left out of book references
10. Tables: tables (each on a separate sheet) should be numbered consecutively in Arabic
numerals and should be referred to in the text as Table:-1, Table:-2 etc. Tables should
not duplicate results in Graphs.
11. Graphs: With minimum descriptive text and Graph axes should be labeled with
variable written out in full, along the length of the axed, with the unit in parenthesis.
12. All submissions for publication are referred on the 'double blind' system by at least
two professionals.
13. Articles must be original ad hitherto unpublished.
14. The final decision on the acceptance or otherwise of the paper rests with the Editors,
and it depends entirely on the standard and relevance of the paper.
15. The final draft may be subjected to editorial amendment to suit the Journal's
requirements.
16. All author/s must sign and send the "Copyright Certificate" along with their
submission.
17. In the cases of website, please do not forget to mention the date of accessing.
18. Electronic submissions should be sent by mail at [email protected]
Hard copies are also accepted, but there must be three printed copies along with the
soft copy saved on a CDROM should be reach our official address in prescribed time.
Dr Umaid Raj Tater
HoD & Chief Editor
Indian Journal of Business Administration (IJBA)