Master of Business Administration - Syllabus - Amity University ...
Upload
khangminh22Category
view
1download
0
Master Thesis for Business Administration (MBA)
Thesis Title: How Project Management Principles are related to the success of a business
Student Name: Athina Constanti
Registration Number: S20161010
Supervisor Name: Dr. Andreas Efstathiades
SUBMITTED ON ………………………………………….

ABSTRACT
Project management is a significant tool and it has become crucial in the management of
organizations, be it profit or nonprofit oriented. The majority of organizations coordinate their
strategic objectives according to the nature of their projects.
However, the success of these projects is to a large extent depends on the knowledge, skills, tools
and techniques apply by the project manager. Facing resources constraints, organizations find ways
of utilizing the limited available resources to achieve the most result by coordinating and managing
those resources with possible maximum efficiency.
This thesis is set to examine how the general application of project management tools and
techniques can help organizations to carry out these projects effectively and efficiently.
The research question – How Project Management Principles are related to the success of a business-
was initially set and carried out using a self-constructed questionnaire, which has been distributed
to more 62 Cypriot companies to participate.
Findings: This research covered, and revealed a lot of useful information about the Project
Management tools and principles used by Cypriot companies, which are engaged in the delivery of
various projects.
On top of that, according to the results of regression analysis there is a positive relationship between
the use of Project Management tools and company’s overall performance, meaning that a company
which has a good Project Management System (human resources, natural resources, procedures,
methodology) is likely to have a better overall performance than a company which does coordinate
its projects according to the Project Management principles and methods.
The findings of the current study can serve as a roadmap not only for the companies that are not
applying Project Management tools but also for the companies that they are already engaged in
Project Management philosophy and they can improve their current operations. Considering that
competitive advantage in our modern world is a combination of various parameters, Project
Management can be a great force in the continuous efforts of an organization to remain sustainable,
profitable and competitive in the market.
Key Words: Project, project management, project management tools, business performance, project
success.

ACKNOWLEDGEMENTS:
There are several individuals that I would like to acknowledge for their valuable contribution to this
study.
Firstly, I would like to sincerely thank my supervisor Dr. Andreas Efstathiades for his valuable
guidance and useful advises throughout the research. I would also like to take this opportunity to
express my truthful appreciations to the managers/owners of the Cypriot and foreign firms who
spent some of their valuable time answering this study’s questionnaire. Without their active
participation, this survey would quite simply not have been possible. Finally, I would like to
acknowledge my family and friends who were very supportive in the MBA journey.

LIST OF ABBREVIATIONS
CAPM Certified Associate in Project Management
OECD Organization for Economic Co-operation and Development
PLC Product Life Cycle
PMI Project Management Institution
PMP Project Management Professional
UNEP United Nations Environment Program

LIST OF FIGURES
FIGURE 1: APPLICABILITY MATRIX IN PROJECT MANAGEMENT IN PROJECTS ............................................................................................ 10
FIGURE 2 : DEMING CYCLE .............................................................................................................................................................. 19
FIGURE 3: THE THREE SHIFTS OF SUSTAINABLE PROJECT MANAGEMENT .................................................................................................. 25
FIGURE 4: GENDER OF THE PARTICIPANTS .......................................................................................................................................... 35
FIGURE 5: AGE OF THE PARTICIPANTS ................................................................................................................................................ 36
FIGURE 6: EDUCATIONAL BACKGROUND OF THE PARTICIPANTS .............................................................................................................. 36
FIGURE 7: COMPANY SIZE OF THE PARTICIPANTS ................................................................................................................................. 37
FIGURE 8: YEARS OF OPERATION FOR PARTICIPANTS' COMPANY ............................................................................................................ 37
FIGURE 9: POSITION OF PARTICIPANTS .............................................................................................................................................. 38
FIGURE 10: SECTOR OF THE COMPANY-PUBLIC OR PRIVATE ................................................................................................................. 38
FIGURE 11: BUSINESS INDUSTRY OF THE PARTICIPANTS' COMPANY ........................................................................................................ 39
FIGURE 12: PROJECT MANAGEMENT SYSTEMS EVALUATION.................................................................................................................. 40
FIGURE 13: NUMBER OF PROJECTS UNDERTAKEN BY THE PARTICIPANTS ................................................................................................. 40
FIGURE 14: TYPICAL DURATION OF A PROJECT .................................................................................................................................... 41
FIGURE 15: LEVEL OF AUTHORITY OF THE PARTICIPANTS ....................................................................................................................... 42
FIGURE 16: RANGE OF DISCIPLINES FOR A TYPICAL PROJECT .................................................................................................................. 42
FIGURE 17: INVOLVEMENT IN THE PHASES OF PROJECT MANAGEMENT ................................................................................................... 43
FIGURE 18: PROJECT SUCCESS ......................................................................................................................................................... 44
FIGURE 19: LEVEL OF SUPPORT BY ORGANIZATION .............................................................................................................................. 44
FIGURE 20: LEVEL OF DIFFICULTY FOR VARIOUS ELEMENTS ................................................................................................................... 45
FIGURE 21: LEVEL OF USE FOR VARIOUS TOOLS IN PROJECT MANAGEMENT ............................................................................................. 46
FIGURE 22: EVALUATION OF PROJECT MANAGEMENT PROCESSES .......................................................................................................... 47
FIGURE 23: EVALUATION OF PROJECT MANAGEMENT METHODOLOGY ................................................................................................... 48
FIGURE 24: EVALUATION OF PROJECT EXECUTION ............................................................................................................................... 48
FIGURE 25 : EVALUATION OF PROJECT MONITORING ........................................................................................................................... 49
FIGURE 26: EVALUATION OF PROJECT MANAGEMENT SUCCESS ............................................................................................................. 50
FIGURE 27: INDEPENDENT VARIABLES ............................................................................................................................................... 52
FIGURE 28 : CONFIGURATION OF FACTORS FOR REGRESSION ANALYSIS .................................................................................................. 56
FIGURE 29: DEPENDENT VARIABLES ................................................................................................................................................. 57

TABLE OF CONTENTS ABSTRACT .................................................................................................................................................. 2
ACKNOWLEDGEMENTS: ............................................................................................................................ 3
LIST OF ABBREVIATIONS ........................................................................................................................... 4
LIST OF FIGURES ........................................................................................................................................ 5
CHAPTER 1: INTRODUCTION..................................................................................................................... 7
1.1. BACKROUND ............................................................................................................................. 7 1.2. VALUE OF RESEARTH ................................................................................................................ 8 1.3. THESIS OUTLINE ....................................................................................................................... 8 CHAPTER 2: LITERATURE REVIEW: ......................................................................................................... 10
2.1. WHAT IS PROJECT MANAGEMENT:....................................................................................... 10
2.2. APPLICABILITY OF PROJECT MANAGEMENT ......................................................................... 10
2.3. PROJECT MANAGEMENT HISTORY- THE MILESTONES ........................................................ 11
2.4. WHY PROJECT MANAGEMENT IS CRUCIAL IN TODAYS WORLD .......................................... 13
2.5. THE PROJECT LIFE CYCLE ....................................................................................................... 13
2.6. P-D-C-A METHOD ................................................................................................................... 19
2.7. HOW TO REDUCE A PROJECT SCHEDULE .............................................................................. 20
2.8. EMPLOYEE PERFORMANCE ................................................................................................... 22
2.9. EARNED VALUE MANAGEMENT ............................................................................................ 23
2.10. GREEN ECONOMY .................................................................................................................. 23
2.11. HOW PROJECT MANAGEMENT IS CONNECTED TO SUSTAINABILITY .................................. 24
2.12. SUSTAINABILITY VARIABLES IN THE PROJECT MANAGEMENT ............................................ 25
2.13. THE DRIVERS FOR SUSTAINABILITY: ...................................................................................... 27
CHAPTER 3: METHODOLOGY .................................................................................................................. 29
3.1 RESEARCH APPROACHES ....................................................................................................... 29
3.2. CHOSEN METHODOLOGY ...................................................................................................... 29
3.3. RESEARCH AIM AND OBJECTIVES .......................................................................................... 30
3.4. RESEARCH VALUE ................................................................................................................... 30
3.5. RESEARCH HYPOTHESIS ......................................................................................................... 30
3.6. STATISTICAL HYPOTHESIS ...................................................................................................... 31
3.7. DATA COLLECTION ................................................................................................................. 32
3.7.1 Secondary data ....................................................................................................................... 32
3.7.2 Primary data ........................................................................................................................... 32
CHAPTER 4: FINDINGS AND ANALYSIS OF THE RESULTS ....................................................................... 34
4.1 QUESTIONNAIRE RESULTS ..................................................................................................... 35
CHAPTER 5: ECONOMETRIC ESTIMATIONS ........................................................................................... 51
5.1. FACTOR ANALYSIS ................................................................................................................ 51
5.2. REGRESSION ANALYSIS ........................................................................................................ 56
CHAPTER 6: CONCLUSIONS AND RECOMMENDATIONS ....................................................................... 66
6.1. DETAILED CONCLUSION ...................................................................................................... 66
6.2. RECCOMENDATIONS AND SUGGESTIONS .......................................................................... 68
6.3. THESIS LIMITATIONS ............................................................................................................ 69
7. REFERENCES ........................................................................................................................................ 71

CHAPTER 1: INTRODUCTION
1.1. BACKROUND
Each company is living organization with specific goals and objectives. The goals and objectives of
each company are considered to be a primary need a company should set before strategic planning
by using certain variables .Goals and objectives should be measured over certain time intervals in
order to provide an accurate progress of the company. The main purpose of setting the goals and
objectives is to maintain the current and future health of the company.
A business cannot move forward without defining specific action steps to get them to their goals.
Action planning involves identifying the top goals for an organization, then develop smart goals. By
setting and achieving smart goals, the aim of each organization is to meet the specific business goals
along the way.
Since the middle of the last century, many organizations are using project management approach to
bring about the change needed to meet organizational goals and objectives.
Project management is not a recent discovery, it has been in existence since time immemorial, from
the construction of the ancient Egyptian pyramids to the industrial revolutions of 1760’s through
1840’s in Europe and the United States. However, the term project management was not used until
the 1950’s when some companies begun to create tools and techniques such as the Program
Evaluation and Review Technique (PERT) by the US defense contractor, RAND and Critical Path
Analysis by the chemical company, Du Pont for the planning of their production activities, and the
later establishment of project management professional institutions (IPMA 1965 and PMI 1969).
The rapid advancement of technology has important effects on business operations and is creating
a more competitive and demanding environment for the companies. Technological infrastructure
affects the culture, efficiency and relationships of a business. The challenge for the companies is to
convert the threats technology and other factors create in the environment into opportunities for
development.
The application of computer software in project planning have made project management an
important means of addressing problems or taking opportunities, making the discipline even more
attractive to many individuals and organizations in the performance of their activities. Project has
therefore become integral part of modern organizations, both profit and on-profit oriented.
Each project is different and the success or failure of an organization in achieving the project’s
objectives is depending on a variety of parameters which are not constant.

This thesis is to examine the general application of project management methodologies in various
Cypriot companies by analyzing the effectiveness of its application in the overall business
performance.
The aim of the project is to provide a broader image in Project Management principles and tools in
order to provide a better understanding on why is important for a company to coordinate its
activities according to a Project Management philosophy and mechanisms.
1.2. VALUE OF RESEARTH
The following research is an attempt to determine that project management has an actual
relationship with the business success factors and how we can evaluate this relationship
Additionally, through this research the Cypriot firms will be able to understand what would be the
benefits by applying the Project Management tools in their projects how this is contributing to the
company’s overall performance in terms of profitability and knowledge.
The author decided to focus on Cypriot Companies which are mainly service providers, firstly,
because of her working experience in this field the last 6 years and secondly, due to the indications
that service providers (law firms, corporate service firms, Forex etc) in Cyprus are showing
tremendous opportunities that it could be a vital for the Cypriot companies and Cyprus economy as
well.
This Thesis can be also used as a guide for the Cypriot firms that are trying to find ways to be more
competitive, sustainable and profitable and enhancing their knowledge and experience about the
project management.
1.3. THESIS OUTLINE
This section provides a snapshot of the five chapters that are covered in this thesis. Each chapter
begins with a brief introduction that highlights the areas that will be covered in various sections of
the chapter.
Chapter 1: Introduction.
This chapter provides the introduction to the research and the problem area. It introduces the
reader to the research context by discussing about the implementation of Project Management.
The research value is briefly mentioned.
The outline of the Thesis is the last section of this chapter, which gives details of the contents of

each chapter.
Chapter 2: Literature review.
The aim of this chapter is to give a theoretical base for a better understanding of the concept of
Project Management. The topic will be investigated through an extensive literature review including
publications of leading authors in the field. Research will be a strong academic foundation for
understanding what is project management and why is important. The literature review also will be
comprised of secondary research in the form of academic and management journals.
Chapter 3: Methodology
The chapter introduces the research approaches and the steps for conducting the research. The
author explains which method is used in this project and why it is chosen over others research
methods found in literature. Secondary and primary data are described and the reason why they
are used is given. The research will be carried out using a survey method (qualitative questionnaire)
that will be given to Cypriot companies from different industries.
Chapter 4: Findings and Analysis of the Results
The researcher will analyze and present findings from the questionnaire and compare them to
findings in academic literature so as to derive solid conclusions.
Chapter 5: Econometric Analysis
A hypothesis test has been performed, at the 0.005 level of significance, to help determine whether
there is significant correlation between the dependent variables and independent variables (export
(Y or N)). The regression equation Ψ=α+β.χ has been initially set and proved through the regression
analysis.
Factor analysis was preceded before hypothesis test in order to determine the independent
variables.
Chapter 6: Conclusion and recommendations.
In the last chapter, the project concludes by summarizing the findings from the research and
academic literature. Some useful recommendations and implications will be presented for further
expansion of this stud

10
CHAPTER 2: LITERATURE REVIEW: The aim of this chapter is to give a theoretical base for a better understanding of the concept of Project Management. The topic will be investigated through an extensive literature review including publications of leading authors in the field. Research will be a strong academic foundation for understanding what is project management and why is important. The literature review also will be comprised of secondary research in the form of academic and management journals.
2.1. WHAT IS PROJECT MANAGEMENT:
The Project Management Institute provides the following definition of a project:
A project is a temporary endeavor undertaken to create a unique product, service, or result
Megginson, Mosley and Pietri define management as:
Working with human, financial and physical resources to achieve organizational objectives by performing
the planning, organizing, leading and controlling functions.
Project management can be described as the use and control of company’s resources (human and non-
human) in the most efficient and effective way in order to achieve the qualitative and quantitative goals
of a company.
2.2. APPLICABILITY OF PROJECT MANAGEMENT
The applicability of project management is related to the degree of standardization of the activities and
processes and the degree of management or organizational complexity (Pica, 2015). These two
dimensions define the applicability of Project Management to specific projects.
Figure 1: Applicability Matrix in Project Management in projects
High
Degree of Management or
Organizational Complexity
Low
Project Management
Applicable (A)
Project Management not
Applicable or Applicable?
(B)
Project Management
Applicable
(C)
Project Management not
Applicable
(D)
Low High
Degree of standardization

11
According to the above table the need for Project Management is high when the Degree of Management
and Organizational Complexity is High and the Degree of standardization is low (case A of Figure 1). For
example in the construction industry the Organizational Complexity is high, different departments in the
construction field and in the offices, are cooperate for the completion of a project (i.e.: architects, civil
engineers, workers, contractors). At the same time the degree of standardization is low due to the
variety of factors which are affect the project (i.e regulations, deadline of the project, budget, weather
conditions).
According to the case C of Figure 1, if the level of Management is low and the Degree of standardization
is low the need to adopt a Project Management System is high as well. Consequently, if the level of
standardization is low, irrespective of the complexity of management the implementation of the project
management fundamentals are important.
When the degree of Management is high and the Degree of Standardization is high as well (case B in the
Figure 1), the level of technology determines whether the project management is applicable. Specifically
low technological level of processes means that the project management is not required. On the other
side high technological level of processes makes the adoption of a Project Management System
Necessarty.
On another note Project Management is not applicable when the degree of standardization is high and
the degree of Management or Organization Complexity is Low (case D of Figure 1). For instance in a
coffee shop the organizational Complexity is typically low and most of the procedures for the
preparation of beverages are standardized, which is the reason the project management is not
applicable. Therefore Project Management is not economically feasible with respect to simple or
routinely fashioned activities.
2.3. PROJECT MANAGEMENT HISTORY- THE MILESTONES
Project Management is tool that humans defined in the last decades, although it was implemented
thousands years ago.
There are numerous examples showing that the greatest monuments of humanity is actually finalized
projects of our antecedents, many years ago.
Ancient Greeks had a vision: to build a temple for the Goddes Athena. Directed by the Athenian
statesman Pericles, the Parthenon was built by the architects Ictinus and Callicrates under the
supervision of the sculptor Phidias. Work began in 447 BCE and the building itself was completed by 438
(Encyclopedia Britannica, 2019).It was the largest and most lavish temple the Greek mainland had ever

12
seen. Today, it is one of the most recognized buildings in the world and an enduring symbol of Ancient
Greece.
The pharaohs built the pyramids of Egypt around 2500 BC, and to this day researchers aren’t certain
how they accomplished such as vast task. But records do show that there were managers, even back
then, who were responsible for each of the four faces of the Great Pyramid.
In 208 BC the Great Wall of China was constructed and historical data reveals that the workforce for this
large project was organized into groups. There were three that we know of: soldiers, common people
and criminals.
The Project Management as definition, was formed during 1900s. AS projects became industrialized,
the process to manage them also experienced a revolution.
In 1911, the publication of Frederic Taylor’s The Principle of Scientific Management, which he based on
his work in the steel industry, was an attempt to help unskilled workers transition to new, more
complicated projects by simple learning techniques. He pioneered the need for incentive-based wage
systems, and how to take advantage of time-saving techniques.
Henry Gantt might be the father of modern project management. In 1917, he created the eponymous
scheduling diagram. It was an innovation. He used a visual timeline to plot tasks as points with durations,
and linked them if they were dependent. That way, everyone could see the schedule more clearly. Gantt
charts continue to be used today and have transitioned to the digital world with online versions that
make them easier to use.
In 1965, the International Project Management Association (IPMA) was founded. It is the world’s first
project management association. Founded in Vienna as a means for project managers to network, the
organization is now registered in Switzerland and is compiled of 50 national and internationally oriented
project management associations. As of 2012 it had over 120,000 members.
The nonprofit Project Management Institute (PMI) was founded by five volunteers in 1969. Incorporated
in Pennsylvania, it held its first symposium in Atlanta in 1969. It has since published A Guide to the Project
Management Body of Knowledge (PMBOK), which outlines the processes and knowledge areas of
project management and became standard in 1998. PMI is also a certification body, offering both the
Certified Associate in Project Management - CAPM and the Project Management Professional- PMP,
Westland and Westland, 2019)

13
2.4. WHY PROJECT MANAGEMENT IS CRUCIAL IN TODAYS WORLD
Project Management is a tool that managers all over the world use to achieve projects on time, on
budget and with the maximum quality of the output. According to Project Management Institution
(2017) organizations are wasting an average of US$97 million for every US$1 billion invested. On another
note, a study by PricewaterhouseCoopers, which reviewed 10,640 projects from 200 companies in 30
countries and across various industries, found that only 2.5% of the companies successfully completed
100% of their projects.
Although, project management scope is not limited to the technical view of budget and time, is a results-
oriented management style that places a premium on building collaborative relationships among a
diverse cast of characters (Gray and Larson, 2006). Project Management is the way to connect the
stakeholders in the most effective and efficient manner. A project to be completed requires at least the
below:
Money
Physical Resources
Human Resources
The challenge is that the aforementioned parameters needs to be aligned. The investors always want
the minimum contribution of money with the maximum return. The physical resources have a limit and
the concern for the environmental impact is rising. The human capital is diverse and cannot be a
constant parameter in the equation.
The project manager, is the person in charge to align the parameters in the right way, at the right time
for the right purpose and for the benefit of the company, the people and the environment.
2.5. THE PROJECT LIFE CYCLE
All the projects have a life cycle irrespective of how many phases are included in it. The name and
number of project phases are determined on the basis on the control needs of the organization involved
in the project. Management of project requires good understanding of all the phases of project cycle in
order to justify the required actions which will result the best outcome in terms of time, cost and quality.
Process Management five process
Process Management five process groups are as follows: initiating, planning, executing,
monitoring/controlling, and closing. Each of these represents a distinctive stage in the project lifecycle
and will have various implications. With initiating, for example, there will be implications around
authorizing the project as a whole and identification of necessary resources. Planning has the

14
implementations of actively scheduling resources and equipment so this may impact the rest of the
business or organization accordingly if resources are taken away from front-line applications accordingly
(Schwalbe, 2015).
Then, the control system is at play throughout every process.
1. Initiating
All projects start with an idea for a product, service or another desirable outcome- typically a project is
a way to address a problem or to create an opportunity. The initiating process group then determines
the nature and scope of the project. Not performing this stage well means it's unlikely the project will
be successful in meeting the business' needs.
The key project controls required are an understanding of the business environment and incorporating
all necessary checks into the project.
There's two crucial things throughout this process:
1) reporting any deficiencies and
2) making a recommendation to fix them.
The first project document is the project charter. These key components are the following:
A detailed description of the business case- problem-opportunity
Scope and deliverables
Objectives
Resources needed
Milestone plan and timeline
Analysis of the business risks, benefits, costs and issues
Dependencies
A summarized plan for implementation
The charter answers the fundamental question, "What are we trying to do?"
(Free management book, 2017)
Once the business study is approved by the identified project sponsor and the required funding is
allocated, the next step is he feasibility study.
Initiating Planning ExecutingMonitoring
/ControllingClosing

15
The purpose of the feasibility study is to assess the likelihood of each alternative solution and the
investigation on whether the costs are reasonable, the solution is achievable, the risks are acceptable
and the identified issues are avoidable.
The next step includes the establishing of the terms of reference, in order to create a clear image for
the vision, objectives, scope and deliverables of the new project.
The last phase of the Initiation Process is the appointment of the project team. The roles in the team
are clarified by the Project Manager.
2. Planning
After initiating, the project is planned to an appropriate level of detail. Planning is about defining
fundamentals. The main purpose is to plan time, cost and resources adequately to estimate the work
needed and to manage risk effectively during project execution.
All of this information is recorded in the project management plan. As with the initiating process group,
a failure to plan adequately lessens the project's chance of success.
Project planning includes the following:
Developing the scope statement
Definition of the deliverable quality through a quality plan which summarize each of the
management processes undertaken during the project.
Developing the schedule (often a Gantt chart)
Developing the budget
Creating a work breakdown structure
Identifying deliverables
Planning for risk
Establishing a communication plan
One of the most important steps in the planning phase is the identification of stakeholders. The
stakeholders are the people might be affected by the project’s activities and outcomes, who will
contribute to the resources and who will use and benefit from the project’s output. The project manager
needs to take into consideration the fact that the stakeholders might change.
Furthermore, definition of the project objectives is crucial in order to meld stakeholders’ expectations
into a manageable set of goals.
This information forms the project contract used to gain formal approval to begin work.

16
3. Executing
Executing consists of the processes used to complete the work defined in the project management plan.
It's about accomplishing the project's objectives. The executing process involves coordinating people
and resources, as well as integrating and performing the project activities. The deliverables are
produced as outputs from the processes performed, as defined in the project management plan. A
series of management processes are undertaken to monitor and control the aforementioned
deliverables including the following:
Identification of changes;
Identification of risks and potential issues;
Review, control and maintain the deliverables’ quality;
Ensure that the deliverables are according to the acceptance criteria.
4. Monitoring
The monitoring process group involves managing and tracking the project. Potential problems can be
identified quickly for the team to take corrective action. The project management plan is used for this
purpose.
Monitoring includes the following:
Measuring ongoing project activities (where are we against where we should be?)
Monitoring the project variables (cost, effort, scope) against the project management plan and
the project baseline (where should we be?)
Identifying corrective actions to address risks and issues (how can we get back on track?)
Managing changes using the change control process (what is the impact of this change?)
The monitoring process group ends once the project has achieved its goals and objectives, as detailed
in the project contract. Monitoring also means that sometimes a project is stopped before completion.
This can happen for many reasons, including changes in the business, lack of resources or higher
priorities.
Below are listed the main management processes, which are part of the efficient monitoring of a project:
a. Time Management
Is the monitoring of the time spent by the members of the team for each activity. There are various
software which enables to track the duration of for each task so the Manager can have the project plan
fully update and proceed with changes if necessary.

17
b. Cost Management
Is the process in which the costs incurred in the project are identified, examined, approved and paid.
The costs are typically recorded in an expense register for the accounting purposes.
There are three cost categories:
Fixed Costs
These are any costs that do not rely on the output. They could be rent, equipment payments,
insurance, salaries of supervisors etc.
Direct Costs
These are the costs that can be specifically identified with a particular project or program.
These could be salaries, fringe benefit, equipment, supplies, travel, training, consultancy fees, interest
on loans, lease charges etc.
They may be specified in the proposal budget.
Variable Costs
These are over and above any fixed cost for a particular project and will vary depending the output of
the task.
Hence, if the output doubles the variable cost will double. This is not strictly true as doubling the
number of workers will not necessarily double the output. (Institute and Project, 2012)
Cost is directly related to time management as well. For instance if there is a need to reducing task
durations this requires a cost. If the project manager wishes to save 2.5 or 3 days the cost would not
be pro rata. This is due to the fact that as the labor resource is increased there is a point where extra
labor will make no difference. This results to a tradeoff. As durations go down the cost penalty per day
goes up.
This cost penalty per day will vary according to the task.
c. Quality Management
Quality management is the act of overseeing all activities and tasks needed to maintain a desired level
of excellence. Quality Management includes all the necessary processes so that the customers’
requirements will be accomplished and the quality of the deliverables will be controlled and assured
during the whole process before the delivery of the project. There are various quality assurance and
control techniques, depending on the type of project, the difficulty and the level of restrictions
(Westland, 2010).

18
d. Change Management
Change Management is the process in which changes are requested related to the project scope,
deliverables, timescales or resources. The project management needs to understand the business and
systems’ drivers requiring a change, to identify the costs and benefits from adopting the change, and to
formulate a plan in order to implement the change in the most efficient way.
e. Risk Management
Risk Management is the process in which the risk of the project are identified, quantified and managed.
5. Closing
Project closing is an important part of project management that's sometimes overlooked. Closing a
project means finishing all activities across all process groups, disbanding the project team and signing
off the project with the customer.
At this point, it's important to know how well the project has performed. This task is done using the
project closure report. The report communicates how well the project has performed against its original
business case, quality measures, cost, duration and tolerances.
Rather than leave valuable project experiences locked in people's heads, it's a good idea to complete
and publish a lessons learned report. This report passes on valuable lessons that future projects can
apply.
6. Project Control
Throughout the above processes, project control is the part of a project that keeps it on track, on-time
and within budget. Project control begins early in the project with planning and ends late in the project
with a post-implementation review.
Projects should be assessed for the right level of control needed. Too much control is time-consuming.
Too little control is risky.
Typical elements of project control are as follows:
Overall business strategy
Standards for new systems
Project management policies
Change management
Quality control

19
(Projectmanagementacademy.net, 2019)
There is no single approach for project control which can works for all the projects. Project-monitoring
software systems help significantly to measure the progress of a project and control the resources
efficiently.
2.6. P-D-C-A METHOD
The P-D-C-A is an iterative four-step management method, which one use continuous improvement. In
simple terms, this approach advises us to:
Plan : Understand the existing situation and then establish the objectives and processes necessary to
deliver results in accordance with the target or goals.
Do: Implement the plan. That is execute the planned process
Check: Study the actual results of the previous phase and compare them against the expected targets
or goals to discover any differences.
Look for deviation from the plan in implementation and also look for the appropriateness and
completeness of the plan to enable the execution.
Convert the collected data into a form that can be used in the next step.
Act: Where there are significant differences between the actual and planned results request corrective
actions.
Analyze the differences to determine their root causes.
Determine where to apply that will include improvement of the process of product.
Figure 2 : Deming Cycle
In fact the process groups are a form of PDCA, since we are dealing with project management processes,
which are like any other business process. For any project, we have to plan, do, check, and act.
There are some differences. The first of differences is that PMI used different terminology:

20
Kept the term Plan; as in the Planning process group
Instead of Do, PMI uses Execute, representing the Executing process group
Replaced Check with Monitor and Act with Control
PMI also combined Monitor and Control into one process group called Monitoring and
controlling process group.
The second major difference was because projects are temporary – not ongoing. In other words, in the
project management environment, there is a need to start and close, hence the Initiation and Closing
process groups. (Linked In, 2015)
2.7. HOW TO REDUCE A PROJECT SCHEDULE
There are multiple ways used in project management to reduce the project schedule. In the following
paragraphs some of the most common used will be analyzed.
Each task consists of labor, equipment and materials. The easy view in achieving a better project
duration is to increase the resources at it. The simplistic view does not consider the limitations and
issues of increasing the three resources. Despite the fact that reducing a project’s duration is neither a
simple nor a standard procedure, there are many advantages in trying to reduce a project’s lifespan:
Projects are funded with borrowed money which is costing the project interest every day.
The shorter the project the less the interest costs.
The overheads of running projects over a year are reduced per project if you carry out more.
Carrying out more projects speedily to a high standard increases the company reputation and
more work ensues.
Accepting poor schedules encourages poor performance in other areas.
As it is mentioned above, reducing a project’s duration is a complicate procedure.
There are multiple limitations to how many people you can put onto one job, for example:
Not all workers are highly productive which will reduce the effective output per man.
Space may be limited reducing worker efficiency.
People may have personal issues which reduces their efficiency to work together.
Similarly for equipment, is not that simple to consider that increasing the equipment will be efficient
and beneficial for the project:
Extra equipment usually means extra labor.
There may not be enough skilled labor for the machinery to run.

21
Equipment takes up space which may not be available.
Regarding materials:
These may not be readily available.
Storage space may be limited etc.
(Project Management Basics, 2017)
There are two key ways to reduce a project schedule. These are ‘task splitting’ and ‘crashing’.
In Task Splitting, the aim is to split a large task into smaller task each which could start ahead of the
completion of the previous one. There are a few things to consider when choosing a task to split and
how to do it most efficiently.
1. The task you are considering for ‘splitting’ must be on the critical path otherwise you cannot
reduce the overall project duration.
2. Tasks after splitting should not all run in series.
3. The tasks after splitting cannot use the same resource at the same time.
The second way is called Crashing. In this method extra resource is added to a task in order to increase
its rate to completion. The resource that is added will be “rate determining” resource. This is usually
people but could also be equipment or material as mentioned above. This way is not as simple as it may
seem. For instance someone can assume that double the workers can result in a half duration. Although
for a task there will always be a duration that you cannot go below. For example many time there is not
enough space to work more than a specific number of employees. Furthermore working performance
is different from person to person and productivity as a result cannot be easily defined.
Another common resource to add is extra equipment. Although extra equipment can be hampered by
room for working or a lack of suitably qualified staff to work it.
Regarding materials, increasing the rate of raw material availability would require excessive costs.
In crashing method, a variety of data should be collected in order to identify that normal cost, normal
time, crash cost and crash time for each activity, as well as the indirect costs and penalties if there are
any. Each time we reduce the duration of an activity or a combination of activities we need to make sure
that it is actually possible to be reduced, that no other path becomes critical and that the increase in
the direct costs does not exceed the savings from reducing the project’s time.
Before you can crash any tasks there must be a certain items in place:
You must have a schedule of all tasks together with their total floats.
You must know the durations of each task

22
There must be financial information available that will allow you to reach a cost for reducing a
task by 1 day.
You must know the total fixed costs per day.
2.8. EMPLOYEE PERFORMANCE
As it is already mentioned, not every person will work to the same level of performance and it is
impossible to maintain a perfect group of workers. When you add resource to a task in order to ‘crash’
it you may well be diluting the productivity due to adding a worker whose output may less than the
output of the others. Therefore, he project manager must assess the benefits of reducing a task’s
duration and weigh this against the extra cost in doing so.
Furthermore, to achieve the extra labor the employees may be working overtime or the execution of
some activities may be given to a third party. Some of the employees of the company that are not
working at a particular time can also be assigned on critical activities. A good resource forecasting must
be done in order to be able to make resource smoothing to address any overloads or under loads.
Another key point is motivating the employees so as to increase their productivity. Employee motivation
is defined as “psychological forces that determine the direction of a person’s behavior in an
organization, a persons’ level of effort and a person’s level of persistence” (Rawat et al., 2015). When
employees feel that are not recognized for their achievements the motivation is low (Scheers & Botha,
2014). When employees are motivated it drives them to do things and do them well (Scheers & Botha,
2014). Managers need to find different ways to motivate their employees or increase their motivation.
Choosing the proper way to motivate employees is difficult since some motivation actions are more
successful than others and they have different effects on employees. The main two categories of
employee motivation is economic and emotional; they could be separated on the way they are applied
(Ahammad et al., 2015). A much-debated topic is how motivation affects productivity, which factors
might influence productivity and whether emotional motivation has a greater impact than other
motivational factors.
Through good management, employees should be influenced to work in a way that can lead to fulfilling
the desirable goal. They should be given clear instructions on what they have to do and they should be
assigned to jobs that offer them satisfaction. As it is already mentioned motivation could be economic
or emotional. Each company is important to undertake internal researches in order to find what
employees need and prefer as ways to be more productive and feel job satisfaction. Some studies for
instance , as those done by Akintoye, 2000 and Katz found in Sinclair et al., 2005 found that economic

23
motivation increases productivity of employees (Akintoye, 2000; Sinclair et al., 2005). The study done
by (Rawat et al., 2015) found that motivational action differ between the difference demographics of
their respondents; they identified that career development opportunities and job security had the
highest impact on improving productivity of employees (Rawat et al., 2015). Another study done by
Ahmet et al., 2015 for the ministry of France found that the working conditions, training and recognition
influence the productivity of its employees; thus an act in improving working conditions, training of
personnel and recognition motivational actions would increase the productivity (Ahmed et al., 2015).
2.9. EARNED VALUE MANAGEMENT
Earned Value management is a common method in project management used to integrate scope,
schedule and resources. It is also used in measuring project performance. It compares the amount of
work that was planned with what was actually earned with what was actually spent to determine cost
and schedule performance are as planned. (Institute and Project, 2012).
All Earned Value Management Control Account Plans must continuously measure project performance
by relating three independent variables:
The planned value, the physical work scheduled to be performed, including estimated value of this
work ;
The earned value ,physical work actually accomplished, including the estimated value of this work;
The actual costs incurred to accomplish the earned value.
2.10. GREEN ECONOMY
The term of Green Economy was introduced at the Rio+20 Conference by the United Nations
Environment Program (UNEP) in 2012 as an economy concept “that results in improved human well-
being and social equity, while significantly reducing environmental risks and ecological scarcities” (UNEP,
2012a)
Green Economy, is a direct result of a sustainable project management in business. The term was
introduced due to the conflict between economic and ecological objectives and detectable ecological
consequences.
Some of the objectives the members of the UN have endorsed are the below:
“Access to sustainable modern energy services to meet developmental needs” (UNEP, 201b2b,
p.24)

24
Promotion of an “integrated approach to planning and building sustainable cities and urban
settlements” including waste management, Infrastructure and affordable housing (UNEP, 2012 b,
p.26)
A global cooperation by all countries in order to provide low-carbon economy, which moderates
the climate change and a consensus on the importance of forest management (“sustainable
deforestation, reforestation and restoration” (UNEP, 2012 b, p.37)
An adapted use of chemicals irrespective of the economic growth and a sound waste management
(“reduce, reuse, recycle”) in order to use resources more efficiently (UNEP, 2012 b, p.42).
According to the project management cycle, the four step management method includes the following:
Plan, Do, Check and Act. Most of the objectives and arrangements of the project Green Economy are
neither specific enough or in appropriate time frame. Although, sustainable project management is the
greatest supporter of the project Green Economy.
2.11. HOW PROJECT MANAGEMENT IS CONNECTED TO SUSTAINABILITY
Sustainability is one of the biggest challenges humans are dealing with in order to secure that future
generations will have the resources for survival, development and progress.
Sustainable development is the “development that meets the needs of the present without
compromising the ability of the future generations to meet their own needs” (Bruntland, 1987)
Companies all over the world are integrating ideas of sustainability in various aspects of the business,
i.e marketing, operation, communication.
According to the Association of Project Management (2006), “Project and Program Managers are
significantly placed to make contributions to Sustainable Management practices”.
A broader concept of Sustainable development is based on the integration of three dimensions:
economic – Profit;
environmental – Planet; and
social- People,
Constituting the sustainability commonly referred to as “triple bottom line” (Elkington, 1998)
Sustainability integrates and aligns economic, social and environmental interests within the business
model.Sustainability can be linked to project management in various ways. It can be as leading variables
(Which variables should be managed toward sustainability during the project life cycle?) but also as a
lagging success indicator (What is the impact – while the project is on process and in the future- for the
Profit, Planet and People) (Carvalho and Rabechini Junior, 2009).

25
Figure 3: The three shifts of sustainable project management
(Silvius et al., 2012)
Having a final sample consisted of 164 publications and covering a time frame of 20 years from 1993 to
2013, A.J. Gilbert Silvius and Ron P.J. Schipper, on their publication in Social Business, Sustainaboility in
project Management, A literature review and impact analysis, define the sustainable project
management as “the planning, monitoring and controlling of project delivery and support processes, with
consideration of the environmental, economical and social aspect of the life-cycle of the project’s
resources, processes, deliverables and effects, aimed at realizing benefits for stakeholders, and
performed in a transparent, fair and ethical way that includes proactive stakeholder participation”.
2.12. SUSTAINABILITY VARIABLES IN THE PROJECT MANAGEMENT
A research released on December 2017 by Maura Luiz Martens and Mary M. Carvalho, analyzed the
different models of sustainability in project management from different areas of engineering and
administration and is concentrated in the three pillars of the triple bottom line.
The sustainability variables were grouped into the three constructs and below some of the main
variables are listed for each construct, related to the sustainability in project management:
(A) Economic Dimension
Financial and economic performance- return on investments, solvency, profitability, liquidity, added
value, profit sharing, market share, GDP.
Mind Shift: Taking Responsiblility for sustainable development
Paradigm Shift:Having a holistic perspective on managing change
Scope Shift: Managing social, environmental and economic impact

26
Financial benefits from good social and environmental practices -health and safety, job creation,
education, training and gains from recycling.
Cost Management – raw materials, labor, products, waste, quality, research and development, transport
and production.
Customer relationship management – marketing and brand management, market share, opportunity
management, risk and price management, warranties and customer complaints.
Business Ethics -fair trade, relationship with the competition, anticrime policies, codes of conduct,
bribery and corruption, legal requirements, payment of taxes.
(B) Environmental Dimension
Natural Resources – reducing the use of natural resources and the generation of waste recycling
reduction of impacts
Water - consumption, use, quality, liquid waste, recycling
Energy- generation, use, distribution, transmission, global warming
Air –quality, environmental footprint, emissions, global warming
Eco-efficiency -business opportunities of services and products, process of design and innovation,
environmental footprint, reuse of materials
Management of environmental impacts -on the environment, on the life cycles of products and services
etc.
(C) Social Dimension
Labor practices management -health and safety, working conditions, training and education,
relationship with employees, employment, diversity
Relationships with the local community- local impacts and relations with local organizations, human
rights, support to the community
Management of human rights – strategy and management
Stakeholder engagement – participatory management, social reporting, social justice, business ethics
Responsibility with products and services- consumer health and safety, marketing and advertising,
respect and privacy, availability of products and risk management.
According to the quantitative research by Martens and Carvalho on 2017 8 of 11 experts in project
management indicated the economic dimension as priority in project management.

27
2.13. THE DRIVERS FOR SUSTAINABILITY:
Despite the fact that people understand the importance of sustainability in the organizations, the
motivation to implement the sustainability strategies differentiates from one company to another and
is much depended on the type of business.
There are internal and external drivers for sustainability (Labuschagne and Brent, 2005):
External:
(A) Stakeholder expectations
The external stakeholders are: consumers, regulators, investors, suppliers.
ISO 26000 mentions that “proactive stakeholder engagement” is an important principle. Stakeholder
participation therefore requires “a process of dialogue and ultimately consensus-building of all
stakeholders as partners who together define problems, design possible solutions, collaborate to
implement them and monitor and evaluate the outcome”. (Goednegt & Silvius, 2012, p.3)
(B) Government regulations
Governments and regulators have a direct interest in sustainability reporting – it can help markets
function more efficiently, and drive progress towards sustainable development goals. An increasing
amount of policy and regulation promotes sustainability reporting.
Many of the laws that provide starting points for sustainability are not environmental laws. For instance
a 1994 Cuban law made it easier for residents of urban areas to grow and sell food on unused land. Since
then, the government has provided financial, technical, and marketing assistance for this kind of
agriculture.
(C) Civil society Expectations
Sustainability is about transparency and accountability. The principle of transparency implies that an
organization is open about its policies, decisions and actions, including environmental and social
effects of those actions and policies (International Standards Organization, 2010).
Internal:
(A) Stakeholder negotiation
The Internal stakeholders are the entities within a business (e.g., employees, managers, the board of
directors, investors). Sustainability contributes to the security of the interest of all the internal
stakeholders.
(B) Risk Management

28
In project management standards, a risk is defines as a uncertain event or set of events that, should it
occur, will have an effect on the achievement of objectives (Office of Government Commerce, 2010).
Considering sustainability in risk identification and management does not only apply to the kind of
risks concerned by also is considered from different perspectives and view of interests.
(C) International Standards and guidelines compliance
A research by published in the Annals of Faculty Engineering Hunedoara – International Journal of
Engineering, Sustainability in Project Management: Where are we? ,with four different companies,
indicates that Technology Innovation is also an important driver for sustainable organizations.
(Paniagua Tufinio et al., 2013)

29
CHAPTER 3: METHODOLOGY
The chapter introduces the research approaches and the steps for conducting the research. The author explains which method is used in this project and why it is chosen over others research methods found in literature. Secondary and primary data are described and the reason why they are used is given. The research will be carried out using a survey method (qualitative questionnaire) that will be given to Cypriot companies from different industries.
3.1 RESEARCH APPROACHES
As we stated in the introduction the aim, research questions and objective of this project are to examine
and evaluate how the success of a Company and its projects is related to the project management
parameters.
There are two approaches which can be used in research, either the inductive or the deductive
approach. Through the deductive method, the researcher can analyze and scan previous literature,
journals and deriving on logical conclusions from the theory in form of theory and prepositions. On the
other hand, the inductive approach is based on opposite techniques observation lead to theoretical
framework.
3.2. CHOSEN METHODOLOGY
The topic will be investigated through a formulation of a survey that was informed by the extensive
literature review. Research will be a strong academic foundation for understanding how the success of
a project and the overall business success is correlated with the principles and procedures of
management. The research was carried out using a self-constructed quantitative questionnaire which
was completed by Cypriot companies in various business industries. The participants (mainly managers)
were asked to answer the questionnaire anonymously in order to remove response biases in the
answers. The answers to the questionnaire were consolidated and entered into the SPSS Statistical
Software, which was used to produce results in a user- friendly format, mainly consisting of stack bar
diagrams and pie charts (as presented in Chapter 4).
Through Econometric analysis, the researcher will try to identify and understand what is the relationship
between a successful project and the use of project management tools through the project life cycle.
The statistical hypothesis set and can be tested and proven using econometric tools and specifically
regression analysis. The rationale behind the inclusion of regression analysis selected for the data
analysis, so the researcher will be able to understand the relationship between the dependent variables
(various success factors-will be analyzed in Paragraph 5.2) and independent variables (project
management tools, techniques and principles- will be analyzed in Paragraph 5.2) which has a greater

30
effect on company’s overall performance. Furthermore, through econometrics the author will be able
to understand the degree of influence each independent variable has in the depended variables. This
will provide a broader image and a better understanding of the significance of each step in project life
cycle for the project success. The researcher will analyze findings from the questionnaire and compare
them to findings in academic literature so as to derive solid conclusions which will form the basis of his
recommendations.
3.3. RESEARCH AIM AND OBJECTIVES
The following research will try to develop a better understanding on how the Project Managers in
various industries are using the principles of Project Management during a project life cycle and whether
this is related to the overall business performance. It is important to clarify that according to the
literature review the Project Life Cycle involves various phases and the success of a Company is
measured through different parameters. In the light of the above the research was conducted based on
the following fact mentioned fact - there is not only one business success factor and the project
management includes multi discipline procedures.
3.4. RESEARCH VALUE
A business operation can be described as a bicycle: The bicycle is a vehicle which drive the rider
somewhere- as the business operation aim is to run and create profits. The bicycle has various parts
which are connected together creating the vehicle and there is a mechanism through which the petals
are moving by the rider’s correct force.
The business on the other hand is a living organism which is constituted by its stakeholders, offices,
machines etc. If the chain of the petals in a bicycle is not working the bicycle is not functional- if the
chain of business operations is not strong the business cannot run in a profitable manner (or it might
run but without the competitive advantage).
Project management is the connecting factor between the various stakeholders and procedures in order
for a project to be completed in the most effective and efficient way.
The following research is an attempt to determine that project management has an actual relationship
with the business success factors and how we can evaluate this relationship.
3.5. RESEARCH HYPOTHESIS
The research hypothesis states that there is an actual relationship between the variables.

31
IT is a specific, clear, and testable proposition or predictive statement about the possible outcome of a
scientific research study based on a particular property of a population, such as presumed differences
between groups on a particular variable or relationships between variables. (Sage Research Methods,
2020)
In order to provide a better understanding concerning the success factors of a business and the relation
with project management, this thesis used and analyzed in depth data involving a number of Cypriot
companies which are engaged in the delivery of projects (i.e construction projects, corporate projects,
legal projects), to address the below questions:
What are the variables of project management with significant impact in the projects’ success
and business overall performance?; and
What is the level of impact for each variable in the projects and overall business success?
3.6. STATISTICAL HYPOTHESIS
A statistical hypothesis is a hypothesis concerning the parameters or from of the probability distribution
for a designated population or populations, or, more generally, of a probabilistic mechanism which is
supposed to generate the observations (OECD, 2020).
The Null Hypothesis (Ho) is a statement about the value of a population parameter and is referring to a
particular hypothesis under test, as distinct from the alternative hypotheses which are under
consideration. It is therefore the hypothesis which determines the probability of the type I error
(Rejecting the null hypothesis when it is actually true). In some contexts, however, the term is restricted
to a3 hypothesis under test of “no difference” (OECD, 2020).
On the other hand, the Alternative Hypothesis H1 is a statement that is accepted if the sample data
provide evidence that the null hypothesis is false.
Ho: β=0 – Projects management tools and processes affect the projects’ success and the overall
business performance
H1: β≠0 - Projects management tools and processes do not affect the projects’ success and the overall
business performance
Level of significance (α) =0.05

32
3.7. DATA COLLECTION
Data collection consists of two types, secondary and primary. The secondary data is available on the
internet, books, statistics, and articles that were collected in the past by others. However, the primary
data is new data collected directly from the field by the author, who carrying out the project.
For the project purpose a combination of both techniques primary and secondary will be used in order
to have the most accurate information.
3.7.1 Secondary data
Secondary data is collected routinely by researchers, institutions or agencies for other purposes, but can
be used also for the author’s research. To collect and analyze secondary information is not the same
time consuming as collecting the primary data.
Additionally, with secondary data the researcher has the opportunity to have a better understanding of
the problem and not just relying entirely on his own sources. Moreover, secondary sources of
information are considerate more accurate especially when they are published by governmental bodies
and trading organizations.
The only drawback of using secondary sources is that the data is not always appropriate for cross-size
comparisons, especially when different criteria and measurements are set.
3.7.2 Primary data
Primary data are information that does not exist and will be collected by the researcher directly from
the field. For the project purpose, primary date will be obtained through the use of a survey self-
constructed questionnaire contacted with selected manufacturing companies that operated in Cyprus
industry. With the procedure of carrying out a self- constructed questionnaire as source of primary data
there are many advantages and disadvantages, but as technique is less expensive and consumes less
time than other methods such as interviews, and covers a wider geographical area. The advantage of a
questionnaire enables the research conductor to have access to a wider spectrum of views, and opinions
in a short time frame. On the other hand, the respondent has to choose from predefined answers and
not to state their opinion and comments.
In this project questionnaires have been contacted among all size companies that operate in the Cyprus
industry. An online self-constructed questionnaire was created as it was best choice because of the
geographic and time limits.
The survey took place over a period of approximately one month, was carried out via email and the
feedback was valuable to understand the significance of project management in the overall business
success. Additionally, it is easier for the participants, who answer the questionnaire in a place they feel

33
comfortable. Moreover, online surveys have some faults because of the non-existing personal contact
with the two parties (Cooper and Schindler, 2014).The questionnaire has been distributed via email to
more than 50 Cypriot companies where the participants were asked to participate in the research.

34
CHAPTER 4: FINDINGS AND ANALYSIS OF THE RESULTS The researcher will analyze and present findings from the questionnaire and compare them to findings in academic literature so as to derive solid conclusions.
Given the time constraints, it was decided that a simple and quick methodology should be used in order
to accomplish the research objective of the thesis. The participants were asked to answer an online
questionnaire anonymously in order to remove response biases in the answers.
The questionnaires have been contacted among all size and categories companies that operate in the
Cyprus industry. An online questionnaire was created as it was best choice because of the geographic
and time limits. The questionnaire was carried out via email and the feedback was valuable to
understand the influence, benefits and barriers of using motivation in the organization and how this
affect the employees performance and productivity as well. Moreover, it is easier for the participants,
who answer the questionnaire in a place they feel comfortable. The sampling method is considered to
be snowball random sampling.
The answers to the questionnaire were consolidated and entered into the statistical software package
SPSS and Excel program as well, which were used to produce results in a user- friendly format, mainly
consisting of stack bar diagrams and pie charts. All results and data from the responses are
demonstrated analytically below.
The total number of participants are 62.

35
4.1 QUESTIONNAIRE RESULTS
In the following paragraphs the analysis of the questionnaire results will be presented. In order to
provide a better picture, the results of the survey are also shown in graphs.
The first questions of the survey were related to the participants’ characteristics, background and job.
Based on the survey responses 51.61% of the overall participants were females and 48.39% males.
Despite the fact that the gender of the participants is not a determining factor which affects the results,
it was important for the sample to include both genders in order to have better reflection of the reality.
Figure 4: Gender of the participants
Turning to the responses to the question years, 22.6% and 6.5% were between the ages of 31-40 and
41-60 years, each correspondingly. In relation the distribution of participants age, there was a variation
on the age; the highest percentage of respondents were between the ages 18-30 years (71%). Therefore
the sample of the survey are mainly young professionals around 18-40.

36
Figure 5: Age of the participants
In continuation with the demographic characteristics of the sample, the analysis of the question related
to the educational level of the participants showed that 12.9% out of all responders had a Bachelor’s
Degree, 80.6% had a Master’s degree, 3.2% had a PhD degree. A small percentage of 1.6% of the
participants had a high school diploma and also a percentage of 1.6% had a college diploma.
Figure 6: Educational background of the participants
Finally, the participants were asked to provide details for their company (size of their company, industry
etc.) in order to have an outline of the samples characteristics.
Specifically, 21.1 % of the participants were form Micro companies, 29% were from small companies,
29% were from medium companies and 21% from large companies.

37
Micro (1-25 employees) Small (25-100 employees) Medium (100-500 employees) Large (more than 500 employees)
Figure 7: Company size of the participants
The majority of participants with a percentage 66.1% are working in a company which is running more
than 10 years. A percentage of 17.7% of the participant are working in a company which is running 2-5
years, 9.7% of the participant are working in a company which is running less than two years and 6.5%
of the participant are working in a company which is running 5-10 years.
Figure 8: Years of operation for participants' company

38
The participants were also asked to clarify their position. The majority of the participants have
management positions. Specifically 43.5% of the participants are in the medium Level of management
in their company, 24.2% of the participants are in the lower level of management in their company,
14.5% of the participants are in the top level of management in their company and a small percentage
of 17.7% are office employees. Since the purpose of the survey was related to project management
implementation and approach, the questionnaires were distributed mainly to individuals with
managerial positions in order to have a better reflection of the current reality in the Cyprus industry.
Figure 9: Position of participants
The majority of the participants are working in the public sector (87.1%). Only 12.9% of the participants
are working in the public sector.
Figure 10: Sector of the Company-Public or Private

39
As for the Companies’ industry category, the result are shown in the below pie chart and it is shown that
the participants belong to different business industries.
The majority of the participants with a percentage 27.42% answered that the industry category of their
company is Finance. A percentage of 16.13% of the participants are in the construction industry, a
percentage of 6.5% of the participants are in the real estate industry.
Figure 11: Business Industry of the participants' Company
The second part of the survey, included general questions related to the project management principles
and implementation.
The majority of the participants with a percentage of 33.87% rated the level of management in their
company with 4 which is close to the optimizing level, a percentage of 37.10% rated the level of
management in their company with 3 which considered to be a good level, a percentage of 12.90% rated
the level of management in their company as optimizing, a minor percentage of 6.45% rated the level
of management in their company as initial and 9.68% rated the level of management in their company

40
with 2 which is less than the average level. The total average of all the answers are 3.37 with a standard
deviation 1.04.
Figure 12: Project management systems evaluation
The majority of the participants (43.5%) mentioned that they handle 3-4 projects at the same time. A
percentage of 22.6% answered that they handle 2 projects at the same time, a percentage of 17.7%
answered that they handle 5-6 projects at the same time, 12.9% of the participants answered that they
are in charge for more than 8 projects at the same time and only 3.2% are in charge for only one project
at a time.
Figure 13: Number of projects undertaken by the participants

41
As far as the duration of the project is concerned, the majority of the participants ( 37.10%) answered
that the typical duration of their projects are up to 3 months, 27.42% of the participants answered that
the typical duration of their projects are 3 to 6 months, 19.35% of the participants answered that the
typical duration of their projects are 6 months to 1 year, 11.29% of the participants answered that the
typical duration of their projects are 1 to 2 years and only a minor percentage of 4.84% answered that
their projects have a duration of more than 2 years.
Figure 14: Typical duration of a project
On another, note it was important to define the level of authority, since the level of authority determines
on whether our sample has actual impact on the overall process and success. According to the below
figure, the majority of the participants with a percentage of 41.94% rated the level of authority they
have with 4 which is close to the full authority, a percentage of 30.65% rated the level of their authority
with 3 which considered to be a good level of authority, a percentage of 12.90% rated the level of their
authority with 2 which is low level of authority, a percentage of 4.84% rated the level of their authority
with 1 which is the limited authority and a percentage of 3.39% of the participants mentioned that they
have the full authority. Conclusively, a total percentage of 82.27% of the participants have a significant

42
level of authority and the average of the total participants for the level is 3.39 with standard deviation
1.00. This is directly related to the fact that the majority of the participants have management positions.
Figure 15: Level of authority of the participants
The range of disciplines was also an important parameter, typically projects include a wide range of
disciplines in industries like: construction, financial services and other support services, taking into
consideration that the average time of a project is more than month.
According to the below figure, the majority of the participants with a percentage of 51.61% rated the
range of disciplines for their projects with 3, 33.87 % with 4 , 9.68% with 5 and a small percentages of
3.23% and 1.61% with 2 and 1 respectively.
The average of the answers is 3.47 with 0.78 standard deviation, which means that the majority of the
participants answered that their projects involve a diverse range of disciplines.
Figure 16: Range of disciplines for a typical project

43
The project life cycle, according to the literature review, includes four phases:
Initiation/Concept
Planning/Development
Execution/Implementation
Finalization/Commissioning/Handover
The participants were asked, on whether they are involved in each phase and what the level of their
involvement is. According to the arithmetic average for each phase, the majority of the participants are
involved in all the phases of project management. In some industries the project management phases,
requires management from different individuals since each phase requires expertise (i.e in the
construction area), although a project manager shall be involved in all phases in order to ensure the
successful completion of each phase. It is like a chain, if the initiation procedure is not successful then
the planning phase is highly likely to fail. Therefore, the involvement of a project manager in all phases
is crucial for the overall project success.
Figure 17: Involvement in the phases of project management
The participants were also asked to rate the project success in their organization compared to other
organizations. The success of a project is measured with a variety of parameters, the easiest to
understand and measure is the success of an organization in compare to another of the same field.
A total of 91.94 % of the participants rated the project success compared to other organizations as
more successful and only 8.06% as less successful. The average is 3.65 with 0.81 standard deviation
which means that the majority of the participants evaluate the project success of their organization as
high.

44
Figure 18: Project success
According to the literature review, the project life cycles has various phases and there are several tools
and techniques to support the implementation of the project management principles. The participants,
were asked on whether their organization, supports the use of tools or techniques with: templates,
training, detailed instructions and procedures, and to evaluate the level of support in their company
which are related to the procedures of a project. The level of support with the use of tools and
techniques is critical especially if the range of disciplines in a project is high and the time boundaries are
strict, in order for the project cycle procedures to be implemented in an efficient and effective way.
According to the below figures, the majority of the participants with a percentage of 92.94 % answered
that they have significant support from their organizations related to the use of tools and templates
which help the finalization of a project in a proper manner. The total average is 3.73 with 0.94 standard
deviation. Only 1.61 % of the participants (which is actually only one participant) stated that they have
no support and 6.45% of the participants stated that their organization provides limited support to the
use of tools and techniques which enables them to participate in a project with a most effective and
efficient way. This question is also related to the project success since the majority of the participants
rated the project success compared to other organizations. Detailed analysis of this relationship will
follow in the next chapter.
Figure 19: Level of support by organization

45
According to the literature review, there are various elements which are considered to be challenging
during the project life cycle, some of these elements are listed below:
Find a subject
Time constraints
Coherent research design
Integration between theory and reality
According to the below figure, the participants believes that is relatively easy to find the subject of a
project (the average of the total answers is 2.35 and the standard deviation 1.01).
The time constrains are more difficult to be managed (the average of the totals answers is 3.40 and the
standard deviation is 1.02). The Coherent research design is also difficult to be managed (the average
of the totals answers is 3.11 and the standard deviation is 0.89).
The integration between theory and reality is also difficult to be managed (the average of the totals
answers is 3.37 and the standard deviation is 0.94).
Conclusively, the participants understand that each stage in the project management has a level of
difficulty, with the time constrains to be more difficult to be managed as the first element, the
integration between theory and reality the second element, the coherent research design as the third
element and to find a subject as the forth less difficult but not totally easy element.
Figure 20: Level of difficulty for various element
Furthermore, the participants were asked to determine the use of some tools (which are considered
to be included in the soft skills of a manager rather than in the technical skills):
Collaboration, Coordination, Communication and Progress monitoring.

46
According to the below figure, the participants answered that they significantly use collaboration,
coordination, communication and project monitoring during a project cycle. A very small percentage
rated the use of the afore-mentioned tools as limited. The major conclusion is that all the elements
have arithmetic average around 4 which means that the participants use the tools extensively to
successfully complete the phases of the project cycle.
Figure 21: Level of use for various tools in project management
Process Management five process groups are as follows: initiating, planning, executing,
monitoring/controlling, and closing. Each of these represents a distinctive stage in the project lifecycle
and will have various implications. In order to examine each phase of life cycle separately, the
participants were asked different questions for each phase.
In relation to Project management process the participants were asked to rate the level of the project
manager involvement in the following:
Methodology used for managing projects;
Determination of the project;
Determination of the projects’ success criteria;
Establishing the project management methodology;
Monitoring and controlling phase of programs and portfolios; and
Monitoring the progress of projects.
According to the below figure, the participants stated that the Company’s top managers are involved in

47
the project management process at a significant level.
Figure 22: Evaluation of project management processes
PROJECT MANAGEMENT METHODOLOGY
In relation to Project management methodology the participants were asked to rate the level of the
below elements:
Project management processes are well documented and controlled;
Organizational culture, structure and processes strongly influence the project management plan;
Project managers have to ensure compliance with company's policies and any regulatory
requirements;
Project managers have to consider specific structure, culture, and processes of their company;
Project management processes are standardized and subject to improvements; and
Project managers are requested to follow organizational processes and procedures such as
standardized guidelines, templates, etc.
According to the below figure the participants stated that the project management processes in their
organization are in a good level, well documented and controlled according to the company’s culture
mission and are according to the regulatory requirements. Although, the participants also answered that
the processes are subject to improvement with a significant percentage as it is clearly shown in the
figure below.

48
Figure 23: Evaluation of project management methodology
The third phase of a project cycle includes the execution of the project, and the following elements
were examined:
Project managers identify any potential changes at the execution phase;
Project managers identify the risks and potential issues;
Project Managers review, control and maintain the deliverables’ quality; and
Project managers ensure that the deliverables are according to the acceptance criteria.
The participants were asked to rate the above statements related to the execution phase of a project.
According to the below figure, the project managers are using the project management principals in the
execution phase of a project in order to deliver the best outcome.
Figure 24: Evaluation of project execution

49
Project Monitoring is also a significant part of the project life cycle, through which opportunities can
arise, weaknesses can be detected and threatens can be prevented and/or faced.
The participants were asked to rate the below statements related to the project monitoring:
Project managers measure the ongoing project activities;
Project managers monitor the project variables (cost, effort, scope) against the project
management plan and the project baseline (where should we be?);
Project Managers identifying corrective actions to address risks and issues (how can we get back
on track?); and
Project managers managing changes using the change control process (what is the impact of this
change?).
According to the below figure, the participants answered that the project managers in their company
are using the project management principals in the monitoring phase of a project in order to deliver the
best outcome.
Figure 25 : Evaluation of project monitoring
Finally, all the projects are carried out to have a success (in terms of budget, time, quality,
expectations). The participants were asked to rate the below statements related to the project
management success in their company.
Projects meet their operational performance goals;
Projects meet their technical performance goals;
Projects meet their schedule objectives;
Projects stay within budget limits;

50
Project results meet stakeholders expectations; and
Stakeholders are satisfied with project results.
According to the below figure, the participants stated the project success factors are satisfied in a
significant level.
Figure 26: Evaluation of project management success

51
CHAPTER 5: ECONOMETRIC ESTIMATIONS A hypothesis test has been performed, at the 0.005 level of significance, to help determine whether there is significant correlation between the dependent variables and independent variables (export (Y or N)). The regression equation Ψ=α+β.χ has been initially set and proved through the regression analysis. Factor analysis was preceded before hypothesis test in order to determine the independent variables.
5.1. FACTOR ANALYSIS
Factor analysis represents a class of procedures for treating data that are applied with increasing
frequency. It is a statistical technique used to identify a relatively small number of underlying dimensions,
or factors, which can be used to represent relationships among interrelated variables. The emphasis in
factor analysis is the identification of underlying "factors" that might explain the dimensions associated
with data variability. (Bartholomew and Knott, 1999)
The main primary applications of Factor analysis are to reduce the number of variables and detect
structure in the relationships between variables
The factor analysis it usually involves the below steps:
Selecting of variables;
Computing the matrix of correlations among the variables;
Extracting the unrotated factors;
Rotating the factors; and
Interpreting the rotated factor matrix.
(Comrey and Lee, 1992)
According to the questionnaire prepared, 29 different independent variables were defined.
The variables are shown in the below table in which the third column indicates the respective question.
Name of Variable Related
Question
1 Initiation_Phase_Involvemeent 14.A
2 Planning_Phase_Involvement 14.B
3 Execution_Phase_Involvement 14.C
4 Finalazation_Phase_Involvement 14.D
5 Use_of_tools_support 16
6 Find_Subject_Difficulty 17.A

52
Figure 27: Independent Variables
Using the factor analysis tool of SPSS, the below table was extracted:
Total Variance Explained
Component
Initial Eigenvalues
Extraction Sums of Squared
Loadings
Rotation Sums of Squared
Loadings
Total
% of
Variance
Cumulative
% Total
% of
Variance
Cumulative
% Total
% of
Variance
Cumulative
%
1 7,129 24,583 24,583 7,129 24,583 24,583 4,333 14,943 14,943
7 Time_Constrains_Difficulty 17.B
8 Coherent_Research_Design_Difficulty 17.C
9 Integration_between_theory_and_reality 17.D
10 Collaboration 18.A
11 Coordination 18.B
12 Communication 18.C
13 Progress_Monitoring 18.D
14 Methodoloy 19.A
15 Decision_for_the_project 19.B
16 Active_Role 19.C
17 Methodology_Establishment 19.D
18 Monitoring_and_Control_Involvement 19.E
19 Progress_feedback 19.F
20 Processes 20.A
21 Culture_Structure_impact 20.B
22 Compliance 20.C
23 Standardization 20.D
24 Changes 21.A
25 Risks 21.B
26 Quality 21.C
27 Acceptance_Criteria 21.D
28 Activity_Monitoring 22.A
29 Variables_Monitoring 22.B

53
2 3,598 12,405 36,989 3,598 12,405 36,989 3,503 12,080 27,023
3 2,184 7,532 44,521 2,184 7,532 44,521 3,288 11,338 38,361
4 1,939 6,686 51,207 1,939 6,686 51,207 2,372 8,178 46,539
5 1,664 5,739 56,946 1,664 5,739 56,946 2,256 7,778 54,317
6 1,368 4,716 61,662 1,368 4,716 61,662 2,130 7,344 61,662
7 1,286 4,434 66,096
8 1,129 3,893 69,989
9 1,022 3,525 73,514
10 ,950 3,275 76,789
11 ,772 2,661 79,450
12 ,709 2,443 81,893
13 ,638 2,199 84,092
14 ,578 1,993 86,085
15 ,533 1,838 87,923
16 ,496 1,709 89,633
17 ,472 1,627 91,259
18 ,423 1,458 92,717
19 ,346 1,193 93,910
20 ,293 1,011 94,921
21 ,265 ,914 95,835
22 ,247 ,852 96,687
23 ,220 ,757 97,445
24 ,175 ,604 98,048
25 ,166 ,572 98,620
26 ,140 ,483 99,103
27 ,105 ,363 99,466
28 ,089 ,307 99,773
29 ,066 ,227 100,000
The chosen rotation method was varimax. Varimax is an orthogonal rotation method that tends produce factor
loading that are either very high or very low, making it easier to match each item with a single factor.
The below Rotated Component Matrix was used to define the six variables. The rotation maintains the cumulative
percentage of variation explained by the extracted components, but that variation is spread more evenly over the
components. The large changes in the individual totals suggest that the rotated component matrix will be easier
to interpret than the unrotated matrix.
It is important to highlight that the cumulative percentage is above 60%. The cumulative variance is the amount
of variance of the original data explained by each type of model plotted against the number of components.
In is concluded that 61% of the variability in the original 29 variables, and therefore it can considerably reduce the
complexity of the data set by using these components, with 39 % loss of information.

54
Rotated Component Matrixa
Component
1 2 3 4 5 6
Involvement in Initiation
Phase ,250 ,136 -,091 ,087 ,763 ,144
Involvement in Planning
Phase -,053 ,166 -,028 -,032 ,766 ,265
Involvement in Execution
Phase ,185 ,081 -,030 ,092 ,234 ,742
Involvement in FInalization
Phase ,115 ,070 -,131 -,085 ,132 ,823
Support for the use of tools
of project management ,090 ,103 -,113 -,206 ,650 -,040
Find_Subject_Difficulty -,074 -,446 -,131 ,379 ,247 -,346
Time_Constrains_Difficulty -,084 -,010 -,290 ,737 ,070 ,301
Coherent_Research_Design
_Difficulty -,022 -,050 ,132 ,822 -,072 ,003
Integration_between_theory
_and_reality -,164 -,051 ,034 ,663 -,154 -,213
Level of use of collaboration ,193 ,703 -,134 -,124 ,096 ,173
Level of use of coordination ,151 ,714 -,010 -,007 ,328 ,059
Level of use of
communication ,270 ,799 -,076 -,138 ,043 -,079
Level of use of Project
Monitoring ,174 ,684 -,055 ,025 ,077 ,175
Company's top managers
are aware of the
methodology used for
managing projects
,541 -,173 ,528 -,142 ,185 -,102
Company's top managers
decide the projects that
have to be developed
,120 ,078 ,642 ,238 -,141 ,000
Company's top managers
have an active role when
defining projects' success
criteria
,118 ,056 ,791 -,072 ,076 -,129
Company's top managers
are responsible for
establishing the project
management methodology
,019 -,051 ,782 -,043 -,069 -,002

55
Company's top managers
are involved in the
monitoring and controlling
phase of programs and
portfolios
,181 -,041 ,799 -,118 -,182 ,017
Company's top managers
are frequently informed
about the progress of
projects
,445 ,435 ,364 -,058 -,151 ,012
Project management
processes are well
documented and controlled
,656 ,103 ,140 ,042 ,237 ,232
Organizational culture,
structure and processes
strongly influence the project
management plan
,569 ,300 ,211 -,083 ,104 ,123
Project managers have to
ensure compliance with
company's policies and any
regulatory requirements
,786 ,346 ,204 ,062 -,018 -,099
Project management
processes are standardized
and subject to
improvements
,669 ,114 -,071 ,194 ,139 ,034
Project managers identify
any potential changes at the
execution phase
,552 ,158 ,180 -,318 -,047 ,371
Project managers identify
the risks and potential
issues
,651 ,130 ,120 -,318 ,203 ,065
Project Managers review,
control and maintain the
deliverables’ quality
,528 ,203 ,132 -,264 -,002 ,246
Project managers ensure
that the deliverables are
according to the acceptance
criteria.
,727 ,227 ,024 -,161 -,099 -,032
Project managers measure
the ongoing project activities ,276 ,457 ,322 -,042 ,307 -,390

56
Project managers monitor
the project variables (cost,
effort, scope) against the
project management plan
and the project baseline
(where should we be?)
,157 ,558 ,353 ,129 ,139 -,151
The next step was to group the 29 variables into 6 according to the component results. Specifically,
the maximum number of each row was taken and then for each column (which represent the
factor) the factors were named according to the theme of the questions.
CONFIGURATION OF FACTORS
FACTOR NAME RELATED QUESTIONS
1 PROJECT MANAGEMENT
METHODOLOGY
19A, 20A,20B,20C,20D,21A
2 USE OF TOOS AND
MONITORING
18A,18B,18C,18D,19F,21B,2
1C
3 PROJECT MANAGEMENT
PROCESS
19B,19C,19D,19E
4 PROJECT MANAGEMENT
DIFFICULTIES
17A,17B,17C,17D
5 INVOLVEMENT OF PROJECT
MANAGER IN INITIATION AND
PLANNING
14A,14B,16
6 INVOLVEMENT OF PROJECT
MANAGER IN EXECUTION AND
FINALIZATION
14C,14D
Figure 28 : Configuration of Factors for Regression Analysis
5.2. REGRESSION ANALYSIS
The regression will be based on the following null hypothesis:
Ho: β=0 – Projects management tools and processes affect the projects’ success and the overall
business performance
Based on the results, we will determine whether the null hypothesis can be rejected.

57
a) P<0.05 if the p-value is less than the level of significance (0.05), we reject the Null
hypothesis.
b) P>0.05 if the p-value is greater than the level of significance (0.05), we cannot reject
the Null hypothesis.
The depended variables of this research are the following:
Variable Related
Question
Project_Success 23.A
Techical_goals 23.B
Schedule_Objectives 23.C
Budget 23.D
Stakeholders_expectations 23.E Figure 29: Dependent Variables
Taking into consideration the above, five different Regression Analysis were performed via SPSS
for each depended variable and the six independent variables extracted from the factor analysis.
The tables below display all results found when performing the regression analysis in SPSS. Case A: Dependent Variable: Projects meet their operational performance goals
Model Summary
Model R R Square
Adjusted R
Square Std. Error of the Estimate
1 ,501a ,251 ,170 ,651
The "R" column represents the value of R, the multiple correlation coefficient. R can be considered to
be one measure of the quality of the prediction of the dependent variable; in this case, VO2max. A
value of 0.501, indicates a relatively good level of prediction. The "R Square" column represents the R2
value (also called the coefficient of determination), which is the proportion of variance in the
dependent variable that can be explained by the independent variables (technically, it is the proportion
of variation accounted for by the regression model above and beyond the mean model). You can see
from our value of 0.251 that our independent variables explain 25.1% of the variability of our
dependent variable, VO2max.

58
According to the above figures the p-value=0.011, where is less than the level of significance 0.05,
which rejects the null hypothesis and one can conclude that there is a statistically significant
relationship between the dependent variable (Projects meet their operational performance goals) and
the independent variables.
Coefficientsa
Model
Unstandardized Coefficients
Standardized
Coefficients
t Sig. B Std. Error Beta
1 (Constant) 3,694 ,083 44,642 ,000
REGR factor score 1 for
analysis 1 ,282 ,083 ,395 3,386 ,001
REGR factor score 2 for
analysis 1 ,127 ,083 ,178 1,526 ,133
REGR factor score 3 for
analysis 1 ,106 ,083 ,148 1,270 ,209
REGR factor score 4 for
analysis 1 -,104 ,083 -,145 -1,244 ,219
REGR factor score 5 for
analysis 1 ,066 ,083 ,092 ,785 ,436
REGR factor score 6 for
analysis 1 ,079 ,083 ,110 ,943 ,350
Using the Coefficient table, the statistical significance of each of the independent variables can be
tested. This tests whether the unstandardized (or standardized) coefficients are equal to 0 (zero) in the
population. If p < .05, you can conclude that the coefficients are statistically significantly different to 0
(zero).
According to the above results, it is indicated that Factor 1(PROJECT MANAGEMENT METHODOLOGY) has a
statistical significance and therefore there is a strong relation between Factor1 and the depended
variable- Projects meet their operational performance goals.
The b coefficients tell us how many units job performance increases for a single unit increase in each
predictor. For instance, 1 point increase on Factor 1 corresponds to 0.282 points increase on Opertional
Performance success.
ANOVAa
Model Sum of Squares df Mean Square F Sig.
1 Regression 7,834 6 1,306 3,077 ,011b
Residual 23,343 55 ,424
Total 31,177 61

59
Equation: Y=3,694 + (0,282* Factor1 ) + (0,127* Factor2 )+ (0,106* Factor3 )- (0,104* Factor4 )+(0,066* Factor5 )+ (0,079* Factor6)
Case B: Dependent Variable: Projects meet their technical performance goals
Model Summary
Model R R Square
Adjusted R
Square
Std. Error of the
Estimate
1 ,637a ,406 ,341 ,587
The multiple correlation coefficient in this case is 0.637 which indicates a good level of prediction. The
The R Square (coefficient of determination), it has also a good value- 0,406, which means that our
independent variables explain 40.6% of the variability of our dependent variable, VO2max.
ANOVAa
Model Sum of Squares df Mean Square F Sig.
1 Regression 12,940 6 2,157 6,260 ,000b
Residual 18,947 55 ,344
Total 31,887 61
According to the above figures the p-value=0.000, where is less than the level of significance 0.05,
which rejects the null hypothesis and one can conclude that there is a statistically significant
relationship between the dependent variable (Projects meet their technical performance goals) and
the independent variables.

60
Coefficientsa
Model
Unstandardized Coefficients
Standardized
Coefficients
t Sig. B Std. Error Beta
1 (Constant) 3,661 ,075 49,118 ,000
REGR factor score 1 for
analysis 1 ,371 ,075 ,512 4,930 ,000
REGR factor score 2 for
analysis 1 ,102 ,075 ,141 1,354 ,181
REGR factor score 3 for
analysis 1 ,159 ,075 ,220 2,116 ,039
REGR factor score 4 for
analysis 1 -,114 ,075 -,158 -1,521 ,134
REGR factor score 5 for
analysis 1 ,063 ,075 ,088 ,844 ,403
REGR factor score 6 for
analysis 1 ,149 ,075 ,206 1,980 ,053
According to the above results, it is indicated that Factor 1(PROJECT MANAGEMENT METHODOLOGY) and
Factor 3 (PROJECT MANAGEMENT PROCESS) have a statistical significance and therefore there is a strong
relation between Factor 1 and Factor 3 with the depended variable- Projects meet their Technical
performance goals.
Equation:
Y=3,661 + (0,371* Factor1 ) + (0,102* Factor2 )+ (0,159* Factor3 )- (0,114* Factor4 )+(0,063* Factor5 )+ (0,149* Factor

61
Case C:
Dependent Variable: Projects meet their schedule objectives
Model Summary
Model R R Square
Adjusted R
Square
Std. Error of the
Estimate
1 ,583a ,339 ,267 ,771
The multiple correlation coefficient in this case is 0.583 which indicates a good level of prediction. The
R Square (coefficient of determination), it has also a good value - 0,339, which means that our
independent variables explain 33.9% of the variability of our dependent variable, VO2max.
ANOVAa
Model Sum of Squares df Mean Square F Sig.
1 Regression 16,818 6 2,803 4,710 ,001b
Residual 32,731 55 ,595
Total 49,548 61
According to the above figures the p-value=0.001, where is less than the level of significance 0.05, which
rejects the null hypothesis and one can conclude that there is a statistically significant relationship
between the dependent variable (Projects meet their schedule objectives) and the independent
variables.
Coefficientsa
Model
Unstandardized Coefficients
Standardized
Coefficients
t Sig. B Std. Error Beta
1 (Constant) 3,677 ,098 37,536 ,000
REGR factor score 1 for
analysis 1 ,372 ,099 ,413 3,764 ,000
REGR factor score 2 for
analysis 1 ,220 ,099 ,244 2,231 ,030
REGR factor score 3 for
analysis 1 ,130 ,099 ,144 1,314 ,194
REGR factor score 4 for
analysis 1 -,116 ,099 -,129 -1,177 ,244

62
REGR factor score 5 for
analysis 1 ,236 ,099 ,261 2,386 ,021
REGR factor score 6 for
analysis 1 -,055 ,099 -,061 -,559 ,579
According to the above results, it is indicated that Factor 1(PROJECT MANAGEMENT METHODOLOGY) Factor
2 (USE OF TOOS AND MONITORING) and Factor 5 (INVOLVEMENT OF PROJECT MANAGER IN INITIATION AND PLANNING)
have a statistical significance and therefore there is a strong relation between Factor 1 ,Factor 2 and
Factor 5 with the depended variable- Projects meet their schedule objectives.
Equation:
Y=3,677 + (0,372* Factor1 ) + (0,220* Factor2 )+ (0,130* Factor3 )- (0,116* Factor4 )+(0,236* Factor5 )-(0,055* Factor6 )
Case D: Dependent Variable: Projects stay within budget limits
Model Summary
Model R R Square
Adjusted R
Square
Std. Error of the
Estimate
1 ,603a ,364 ,294 ,769
The multiple correlation coefficient in this case is 0.603 which indicates a good level of prediction. The
The R Square (coefficient of determination), it has also a good value - 0,364, which means that our
independent variables explain 36.4% of the variability of our dependent variable, VO2max.

63
ANOVAa
Model Sum of Squares df Mean Square F Sig.
1 Regression 18,580 6 3,097 5,238 ,000b
Residual 32,517 55 ,591
Total 51,097 61
According to the above figures the p-value=0.000, where is less than the level of significance 0.05,
which rejects the null hypothesis and one can conclude that there is a statistically significant
relationship between the dependent variable (Projects stay within budget limits) and the independent
variables.
Coefficientsa
Model
Unstandardized Coefficients
Standardized
Coefficients
t Sig. B Std. Error Beta
1 (Constant) 3,581 ,098 36,668 ,000
REGR factor score 1 for
analysis 1 ,278 ,098 ,304 2,825 ,007
REGR factor score 2 for
analysis 1 ,229 ,098 ,250 2,322 ,024
REGR factor score 3 for
analysis 1 ,118 ,098 ,129 1,201 ,235
REGR factor score 4 for
analysis 1 -,053 ,098 -,058 -,542 ,590
REGR factor score 5 for
analysis 1 ,395 ,098 ,431 4,009 ,000
REGR factor score 6 for
analysis 1 ,048 ,098 ,053 ,493 ,624
According to the above results, it is indicated that Factor 1(PROJECT MANAGEMENT METHODOLOGY) Factor
2 (USE OF TOOS AND MONITORING) and Factor 5 (INVOLVEMENT OF PROJECT MANAGER IN INITIATION AND PLANNING)
have a statistical significance and therefore there is a strong relation between Factor 1 ,Factor 2 and
Factor 5 with the depended variable- Projects stay within budget limits. Equation:
Y=3,581 + (0,278* Factor1 ) + (0,229* Factor2 )+ (0,118* Factor3 )- (0,053* Factor4 )+(0,395* Factor5 )+(0,048* Factor6 )

64
Case E: Dependent Variable: Project results meet stakeholders expectations
Model Summary
Model R R Square
Adjusted R
Square
Std. Error of the
Estimate
1 ,556a ,309 ,234 ,684
The multiple correlation coefficient in this case is 0.556 which indicates a good level of prediction. The
The R Square (coefficient of determination), it has also a good value - 0,309, which means that our
independent variables explain 30.9% of the variability of our dependent variable, VO2max.
ANOVAa
Model Sum of Squares df Mean Square F Sig.
1 Regression 11,525 6 1,921 4,108 ,002b
Residual 25,717 55 ,468
Total 37,242 61
According to the above figures the p-value=0.002, where is less than the level of significance 0.05,
which rejects the null hypothesis and one can conclude that there is a statistically significant
relationship between the dependent variable (Project results meet stakeholders expectations) and the
independent variables.

65
Coefficientsa
Model
Unstandardized Coefficients
Standardized
Coefficients
t Sig. B Std. Error Beta
1 (Constant) 3,565 ,087 41,046 ,000
REGR factor score 1 for
analysis 1 ,328 ,088 ,420 3,745 ,000
REGR factor score 2 for
analysis 1 ,150 ,088 ,192 1,715 ,092
REGR factor score 3 for
analysis 1 ,140 ,088 ,179 1,598 ,116
REGR factor score 4 for
analysis 1 -,096 ,088 -,123 -1,094 ,279
REGR factor score 5 for
analysis 1 ,174 ,088 ,222 1,983 ,052
REGR factor score 6 for
analysis 1 -,003 ,088 -,004 -,032 ,975
According to the above results, it is indicated that Factor 1(PROJECT MANAGEMENT METHODOLOGY) has a
statistical significance and therefore there is a strong relation between Factor 1 and the depended
variable- Project results meet stakeholders expectations.
Equation:
Y=3,565 + (0,328* Factor1 ) + (0,15* Factor2 )+ (0,140* Factor3 )- (0,096* Factor4 )+(0,174* Factor5 )-(0,003* Factor6 )

66
CHAPTER 6: CONCLUSIONS AND RECOMMENDATIONS In the last chapter, the project concludes by summarizing the findings from the research and academic literature. Some useful recommendations and suggestions will be presented for further expansion of this study. Additionally the Thesis limitations are outlined.
6.1. DETAILED CONCLUSION
The conclusions of this thesis project will be based on three pillars:
(A) The Literature Review: the existing knowledge and information (this is the driver of this project).
(B) The questionnaire answers: the mentality and reality of Cypriot companies (this is the situation of
this project).
(C) The econometric estimation: the analysis of the results to define connecting factors, validity and
create the equations (this is the combination of the theory and reality).
It is important to mention that the questionnaire participants are mainly individuals around the age of
18-30 which belongs to the management body of companies (80% of the participants) therefore the
participants are actually the next top level managers of Cyprus companies. All the size of companies
have been included with almost equal percentages. These facts are important and directly related to
the findings since the sample of each research determines in great extent on whether a research will
be valuable and worth to be conducted.
According to the participants answers the most important conclusions are the below in relation to
Cypriot companies engaged in the delivery of various project:
The level of project management systems is high;
The project success compared to other organizations (with similar activities) is high;
There is a significant support from the companies for the use of tools tools or techniques with:
templates, training, detailed instructions and procedures;
Time Constraints, Coherent Research Design and Integration between theory and reality are
challenges for the project managers, which consider their level of difficulty to address high;

67
For the delivery of a project collaboration, coordination, communication and project
monitoring are important tools, used by the project managers;
Companies top managers are involved in the project management process in a significant lever;
The project management processes are in a good level, well documented and controlled
according to the company’s culture mission and are according to the regulatory requirements;
The project managers use the project management principals in the execution phase of a
project in order to deliver the best outcome;
The project managers use the project management principals in the monitoring phase of a
project in order to deliver the best outcome;
The project success factors are satisfied in a significant level.
Based on the above, it is concluded that the participants which represent a sample of the management
bodies in Cypriot companies, rate the project management systems, tools, processes in a relatively
high level. Whether this is correct or not, cannot be defined through this research. It can be assumed
though, that since the project management processes, principals and tools are used in a significant
level and the success factors are also met, a positive relationship might be existed.
The Econometric analysis provided us the below table connecting the success factors with the
significant related factors:
SUCCESS FACTOR SIGNIFICANT RELATED FACTORS
Projects meet their operational performance goals
PROJECT MANAGEMENT
METHODOLOGY
Projects meet their technical
performance goals
1.PROJECT MANAGEMENT
METHODOLOGY
2.PROJECT MANAGEMENT PROCESS
Projects meet their schedule 1.PROJECT MANAGEMENT

68
According to the literature review, each the project life cycle includes five steps: initiating, planning,
executing, monitoring- control and the closing phase.
Each phase is significant for the delivery of the project with the best outcome in terms of time, cost
and quality. While all the independent variables examined have a relationship with the success factor,
not all of them are equally important and influence in the same level the output of a project.
The afore mentioned table, provide us with the conclusion that the Project Management Methodology
plays a significant role for the achievement of operational performance goals, technical performance
goals, schedule objectives, the control of the budget and the fulfillment of shareholders’ expectations.
Project Management process plays a significant role to the achievement of technical performance
goals.
The schedule objectives and the budget limitations are directly related to the used of tools, the monitor
of the project and the involvement of the project manager.
objectives METHODOLOGY
2.USE OF TOOS AND MONITORING
3.INVOLVEMENT OF PROJECT
MANAGER IN INITIATION AND
PLANNING
Projects stay within budget limits
1.PROJECT MANAGEMENT
METHODOLOGY
2. USE OF TOOS AND MONITORING
3. INVOLVEMENT OF PROJECT
MANAGER IN INITIATION AND
PLANNING
Project results meet stakeholders
expectations
PROJECT MANAGEMENT
METHODOLOGY
Initiating Planning ExecutingMonitoring
/ControllingClosing

69
6.2. RECCOMENDATIONS AND SUGGESTIONS
Base on the above analysis, the following recommendations are made:
1. Using of Project Management tools according to the company’s specific needs and focus on
improved project management practices;
2. Understand how Project Management will fit into the corporate culture;
3. Manage organizational resistance to change;
4. Clearly define Project goals, purpose, roles, authorities, and responsibilities and communicate
them to all stakeholders;
4. Implementing or transforming a Project Management tools with an appropriate change
management strategy;
5. Have knowledgeable and experienced Project Managers who promotes the value of Project
Management;
7. Ensure support of the senior management and various stakeholders to the Project Life Cycle as
well as opinion leaders who favour the Project Management implementation;
8. Be able to demonstrate value, use metrics to evaluate Project Management performance.
Project management is not a straight way to accomplish a task, is the combination of tools, the
knowledge, experience for each project with the same philosophy but not always in the same manner.
In addition, the participants of a projects are individuals with a different character, the challenge is to
create a culture in the company so that the employees understand the value of their task for the overall
success.
In addition, international history proves that people, countries, organizations, governments always
change their mindset upon a crisis. While a crisis cannot always be prevented, organizations can be
proactive and can create the change before the change is the only option. Project Management is
evolving and every organization shall consider the internal and external environment and its changes
in order to remain sustainable, profitable and competitive.

70
6.3. THESIS LIMITATIONS
This Thesis has its limitations, mainly the major drawback is the limited number of
participating companies, due to the time constrains, therefore the findings cannot be taken
as representative for all Cypriot companies.
Secondly, the limited number of informants (62) that were willing to participate on the survey
(questioner) did not provide with accurate results. Additionally, the results of this project are
highly depending on the researcher's interpretation; as a result the ability to reproduce these
results is questionable. Moreover, the majority of the examined Companies have already
engaged in project management philosophy, therefore, this project does not explore in detail
the barriers and challenges of the companies that are not engaged in project management
philosophy.

71
7. REFERENCES
PUBLICATIONS
Bruntland, G.H. (1987). Our Common Future: World Commision of Environment and Development.
Oxford: Oxford University Press
Silvius, A.J.G., Schipper, R., Planko, J., van den Brink, J., & Kohler, A (2012). Sustainability in Project
Management, Farnham: Gower Publishing
A.J. Glibert Silvius, Ron P.J. Schipper. Sustainability in project management: A literature review and
impact analysis, Social Business.
Elkington, J. (1998). Canibals with forks: The triple bottom line of 21st century business, Gabriola
Island, Canada: New Society Publishers
Labuschagne, C. and Brent, A. (2005). Sustainable Project Life Cycle Management: the need to
integrate life cycles in the manufacturing sector. International Journal of Project Management, 23(2),
pp.159-168.
Paniagua Tufinio, S., MOOI, H., Ravestijn, W., Bakker, H. and Boorsma, M. (2013). Sustainability in
Project Management: Where are we?. Annals of Faculty Engineering Hunedoara-International Journal
of Engineering, Tome XI(Fascicule 1 (ISSN 1584-2665).
Martens, M. and Carvalho, M. (2017). Sustainability and Success Variables in the Project
Management Context: An Expert Panel. Project Management Journal, 47(6), pp.24-43.
Goedknegt D., & Silvius (2012). The implementation of sustainability principles in project
management. Proceedings of the 26th IPMA World Congress, Crete, pp. 875-882.
E- BOOKS
Free management book. (2017). www.free-management-ebooks.com. [online] Available at:
https://edisciplinas.usp.br/pluginfile.php/3759733/mod_resource/content/3/
Project Management Basics. (2017). Reducing Project Duration. [online] Available at: 1.
http://www.project-management-
basics.com/project_management/project_management_163_Reducing_project_durations.shtml

72
Schwalbe, K. (2015). Introduction to project management. 5th ed. Schwalbe Publishing, Copyright
2015. Available at: https://intropm.files.wordpress.com/2015/06/5e-ch-1.pdf
Pica, M. (2015). Project life cycle economics. pp.4-6. Available at:
https://books.google.com.cy/books?id=RQWrCwAAQBAJ&pg=PA10&dq=project+life+cycle&hl=en&sa
=X&ved=0ahUKEwi37eqq_KDnAhXhThUIHWnyBKYQ6AEILzAB#v=onepage&q=project%20life%20cycle
&f=false
Westland, J. (2010). The Project management life cycle. London and Philadelphia: Kogan Page, pp.5-
10. Available at:
https://books.google.com.cy/books?id=4ph42sGN9vwC&dq=project+life+cycle&source=gbs_navlinks_
s
WEBSITES:
Projectmanagementacademy.net. (2019). The Five Traditional Process Groups Explained - Project
Management Academy. [online] Available at: https://projectmanagementacademy.net/articles/five-
traditional-process-groups/
Linked In. (2015). The Plan-Do-Check-Act and PMBOK® Guide Process Groups. [online] Available at:
https://www.linkedin.com/pulse/plan-do-check-act-pmbok-guide-process-groups-sukad-group
Encyclopedia Britannica. (2019). Parthenon | History & Facts. [online] Available at:
https://www.britannica.com/topic/Parthenon
Westland, J. and Westland, J. (2019). History of Project Management - ProjectManager.com. [online]
ProjectManager.com. Available at: https://www.projectmanager.com/blog/history-project-
management
UNEP, 2012a “Green Economy. What do we mean by Green Economy” online:
https://www.unenvironment.org/resources/report/green-economy-what-do-we-mean-green-
economy
2020. [online] Available at: <https://stats.oecd.org/glossary/search.asp> [Accessed 18 April 2020].

73
Methods.sagepub.com. 2020. Research Hypothesis - SAGE Research Methods. [online] Available at:
<https://methods.sagepub.com/Reference//encyclopedia-of-survey-research-methods/n472.xml>
[Accessed 18 April 2020].
BOOKS:
Institute, P. and Project, M. (2012). A Guide to the Project Management Body of Knowledge (PMBOK®
Guide)-Fifth Edition (ENGLISH). Newtown Square, PA: Project Management Institute, p.92,151.
Rawat, B., Khugshal, R. & Chaubey, D.D.S., 2015. Employee attitude towards motivational practices:
an empirical study. Sona Global Management Review, 9(2), pp.14-28.
Scheers, L.v. & Botha, J., 2014. Analysing relationships between employee job satisfaction and
motivation. Journal of Business and Retail Management Reseach, 9(1), pp.98-109.
Ahmed, T.M.S., Oyagi, D.B. & Tirimba, O.I., 2015. Assessment of non-financial motivationa on
employee producivity: case of ministry of France headquarters in Hargeisa Somaliland. International
Journal of business Management and Economic Research, 6(6), pp.400-16.
Akintoye, I.R., 2000. The place of fincnacial mangement in personnel psychology. Nigeria: Univeristy
of Ibadan; Department of Guidance and Couselling.
Gray, C. and Larson, E. (2006). Project management. 7th ed. New York: McGraw-Hill/Irwin, p.3.
Carvalho, M. and Rabechini Junior, R. (2009). Construindo competencias para gerenciar projetos. 3rd
ed. Sao Paulo: Atlas.
Comrey, A. and Lee, H., 1992. A First Course In Factor Analysis. Hillsdale, New Jersey: Lawrence
Erlbaum Associates, Publishers, p.5.
Bartholomew, D. and Knott, M., 1999. Latent Variable Models And Factor Analysis. London: Edward
Arnold.

Dear participants,
You are invited to participate in a research study titled ‘How Project Management is connected to sustainable development’’. This study is being conducted by an MBA candidate of European University Cyprus for the completion of the final Dissertation Project. The present research will examine and evaluate whether project management fundamentals are implemented in various industries and how this is related to sustainable development in business. In this study, you will be asked to complete an electronic survey. Your participation in this study is voluntary and you are free to withdraw your participation from this study at any time. The survey should take only few minutes to complete.
This survey has been approved by European University Cyprus. There are no risks associated with participating in this study. The survey collects no identifying information of any respondent. All of the response in the survey will be recorded anonymously. While you will not experience any direct benefits from participation, information collected in this study may benefit our research topic in the future by better understanding the influence, benefits and barriers of using project management principles in the organization and how this affect the organization's success.
If you have any questions regarding the survey and this research project in general, or if you have any questions concerning your rights as a research participant, please contact the following email:
. By completing and submitting this survey, you are indicating your consent to participate in the study. Your participation is appreciated.
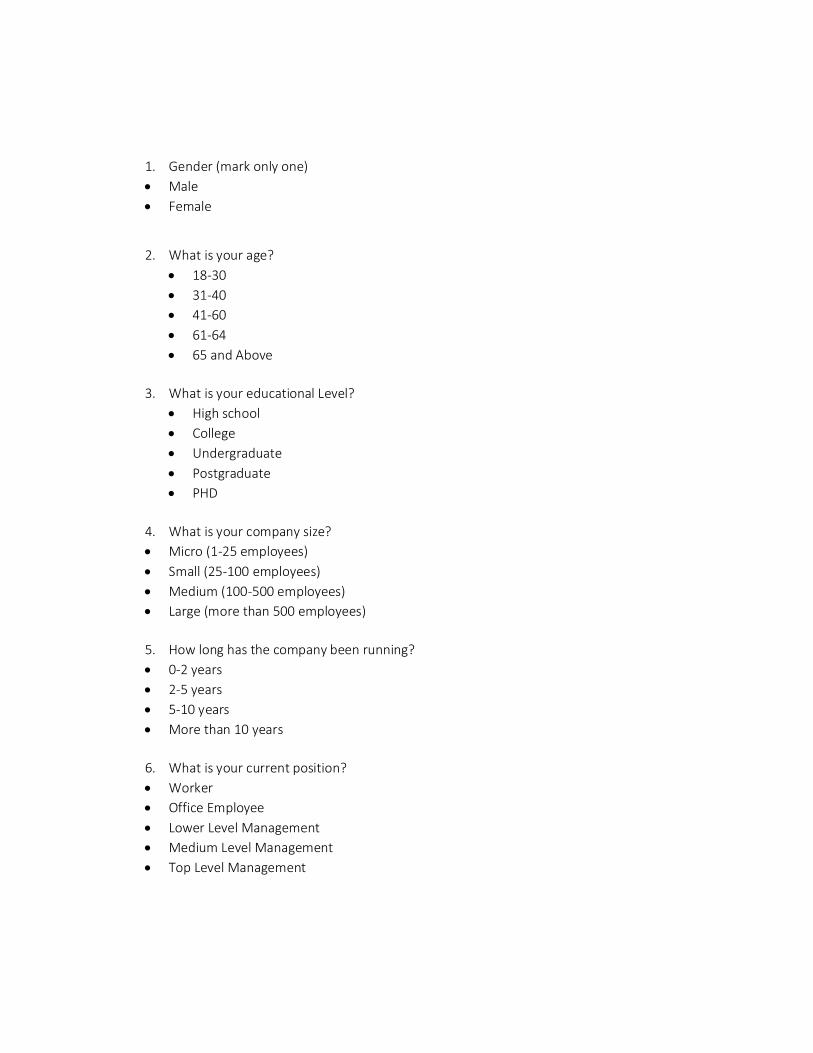
1. Gender (mark only one) Male Female
2. What is your age? 18-30 31-40 41-60 61-64 65 and Above
3. What is your educational Level?
High school College Undergraduate Postgraduate PHD
4. What is your company size? Micro (1-25 employees) Small (25-100 employees) Medium (100-500 employees) Large (more than 500 employees)
5. How long has the company been running? 0-2 years 2-5 years 5-10 years More than 10 years
6. What is your current position? Worker Office Employee Lower Level Management Medium Level Management Top Level Management

7. Is the organization you work for in the public or private sector? Public Sector Private Sector
8. What is the industry Category the business is in? Construction Software and computer services Support Services Real Estate Import and Export Beverage and Restaurant Industry Genera Retailer Travel and Leisure Marketing Finance Other…………………………
9. What is the level of the project management systems in your operational area? Please tick the appropriate box according to your opinion, your current role and your company.
1 : Initial Level 5 : Optimizing level 1 2 3 4 5
Project Management Systems in your operational area
10. How many projects do you typically work on, or manage, at one time? 1 2 3-4 5-6 More than 7
11. What is the typical duration of the primary project(s) that you work on?
Up to 3 months 3 to 6 months 6 months to 1 year 1 to 2 years 2 years

12. What level of authority do you have in your current primary project role? Please tick the appropriate box according to your opinion, your current role and your company.
1 : Limited Authority 5 : Full Authority 1 2 3 4 5
Level of Authority
13. Do the projects you usually work on involve a diverse range of disciplines or a narrow range of disciplines? Discipline means specialization of skills or area of formal training. Please tick the appropriate box according to your opinion, your current role and your company.
1 : Single Discipline 5 : Multi Disciplines 1 2 3 4 5
Range of Disciplines
14. In which phases of a project you are most often involved? Please tick the appropriate box according to your opinion, your current role and your company.
1 : Limited involvement 5 : Significant involvement 1 2 3 4 5
Initiation/Concept
Planning/Development
Execution/Implementation
Finalization/Commissioning/Handover

15. Compared to other organizations of the same sector, how would you qualify the rate of project success in your organization? Please tick the appropriate box according to your opinion, your current role and your company.
1 : Much Less successful 5 : Much more successful 1 2 3 4 5
Project success compared to other organizations of the same sector
16. Does your organization support the use of tools or techniques with: templates, training, detailed instructions and procedures? Please tick the appropriate box according to your opinion, your current role and your company.
1 : No support 5 : Very extensive support 1 2 3 4 5
Level of support
17. In each of the following, state the level of difficulty to manage on a project: Please tick the appropriate box according to your opinion, your current role and your company.
1 : Easy 5 : Difficult 1 2 3 4 5
Find a subject Time constraints Coherent research design
Integration between theory and reality
18. In what level you use the following tools during a project cycle?

Please tick the appropriate box according to your opinion, your current role and your company.
1 : Limited use 5 : Extensive use 1 2 3 4 5
Collaboration Coordination Communication Progress monitoring
19. Please tick the appropriate box according to your opinion, your current role and your company.
1 strongly disagree/never 5 strongly agree/always 1 2 3 4 5
Company's top managers are aware of the methodology used for managing projects
Company's top managers decide the projects that have to be developed
Company's top managers have an active role when defining projects' success criteria
Company's top managers are responsible for establishing the project management methodology
Company's top managers are involved in the monitoring and controlling phase of programs and portfolios
Company's top managers are frequently informed about the progress of projects

20. Please tick the appropriate box according to your opinion, your current role and your company.
1 strongly disagree/never 5 strongly agree/always 1 2 3 4 5
Project management processes are well documented and controlled Organizational culture, structure and processes strongly influence the project management plan
Project managers have to ensure compliance with company's policies and any regulatory requirements
Project managers have to consider specific structure, culture, and processes of their company
Project management processes are standardized and subject to improvements Project managers are requested to follow organizational processes and procedures such as standardized guidelines, templates, etc.
21. Please tick the appropriate box according to your opinion, your current role and your company.
1 strongly disagree/never 5 strongly agree/always
1 2 3 4 5 Project managers identify any potential changes at the execution phase Project managers identify the risks and potential issues Project Managers review, control and maintain the deliverables’ quality Project managers ensure that the deliverables are according to the acceptance criteria.
22. Please tick the appropriate box according to your opinion, your current role and your company.
1 strongly disagree/never 5 strongly agree/always 1 2 3 4 5
Project managers measure the ongoing project activities

Project managers monitor the project variables (cost, effort, scope) against the project management plan and the project baseline (where should we be?)
Project Managers identifying corrective actions to address risks and issues (how can we get back on track?)
Project managers managing changes using the change control process (what is the impact of this change?)
23. Please tick the appropriate box according to your opinion, your current role and your company.
1 strongly disagree/never 5 strongly agree/always 1 2 3 4 5
Projects meet their operational performance goals Projects meet their technical performance goals Projects meet their schedule objectives Projects stay within budget limits Project results meet stakeholders expectations Stakeholders are satisfied with project results

The results will follow in the next page.

GET FILE='C:\Users\user\Desktop\SPSS Analysis\try 2\SPSS Analysis.sav-05.04.2020.sav'.
DATASET NAME DataSet1 WINDOW=FRONT.FACTOR
/VARIABLES Initiation_Phase_Involvemeent Planning_Phase_Involvement Execution_Phase_Involvement Finalazation_Phase_Involvement Use_of_tools_support Find_Subject_Difficulty Time_Constrains_Difficulty Coherent_Research_Design_Diffi
culty Integration_between_theory_and_reality Collaboration Coordination Communication Progress_Monitoring Methodoloy Decision_for_the_project Active_Role
Methodology_Establishment Monitoring_and_Control_Involvement Progress_feedback Processes Culture_Structure_impact ComplianceStandardization Changes Risks Quality Acceptance_Criteria Activity_Monitoring
Variables_Monitoring /MISSING LISTWISE
/ANALYSIS Initiation_Phase_Involvemeent Planning_Phase_Involvement Execution_Phase_Involvement Finalazation_Phase_Involvement Use_of_tools_support Find_Subject_Difficulty Time_Constrains_Difficulty Coherent_Research_Design_Diffic
ulty Integration_between_theory_and_reality Collaboration Coordination Communication Progress_Monitoring Methodoloy Decision_for_the_project Active_Role M
ethodology_Establishment Monitoring_and_Control_Involvement Progress_feedback Processes Culture_Structure_impact ComplianceStandardization Changes Risks Quality Acceptance_Criteria Activity_Monitoring
Variables_Monitoring /PRINT INITIAL EXTRACTION ROTATION FSCORE
/PLOT ROTATION /CRITERIA FACTORS(6) ITERATE(25) /EXTRACTION PC
/CRITERIA ITERATE(25) /ROTATION VARIMAX /SAVE REG(ALL)
/METHOD=CORRELATION.
Factor Analysis[DataSet1] C:\Users\user\Desktop\SPSS Analysis\try 2\SPSS Analysis.sav-05.04.2020.sav
Page 1

Communalities
Initial ExtractionInvolvement in Initiation PhaseInvolvement in Planning PhaseInvolvement in Execution PhaseInvolvement in FInalization PhaseSupport for the use of tools of project management
Find_Subject_DifficultyTime_Constrains_Difficulty
Coherent_Research_Design_DifficultyIntegration_between_theory_and_realityLevel of use of collaboration
Level of use of coordination
Level of use of communicationLevel of use of Project MonitoringCompany's top managers are aware of the methodology used for managing projectsCompany's top managers decide the projects that have to be developed
Company's top managers have an active role when defining projects' success criteria
1,000 ,700
1,000 ,688
1,000 ,655
1,000 ,737
1,000 ,497
1,000 ,546
1,000 ,729
1,000 ,701
1,000 ,539
1,000 ,604
1,000 ,644
1,000 ,744
1,000 ,539
1,000 ,666
1,000 ,509
1,000 ,671
Page 2

Communalities
Initial ExtractionCompany's top managers are responsible for establishing the project management methodology
Company's top managers are involved in the monitoring and controlling phase of programs and portfoliosCompany's top managers are frequently informed about the progress of projectsProject management processes are well documented and controlled
Organizational culture, structure and processes strongly influence the project management planProject managers have to ensure compliance with company's policies and any regulatory requirements
Project management processes are standardized and subject to improvementsProject managers identify any potential changes at the execution phaseProject managers identify the risks and potential issuesProject Managers review, control and maintain the
Project managers ensure that the deliverables are according to the acceptance criteria.
1,000 ,621
1,000 ,720
1,000 ,547
1,000 ,573
1,000 ,491
1,000 ,793
1,000 ,524
1,000 ,603
1,000 ,601
1,000 ,467
1,000 ,617
Page 3

Communalities
Initial ExtractionProject managers measure the ongoing project activitiesProject managers monitor the project variables (cost, effort, scope) against the project management plan and the project baseline (where should we be?)
1,000 ,637
1,000 ,520
Extraction Method: Principal Component Analysis.
Total Variance Explained
Component
Initial Eigenvalues Extraction Sums of Squared LoadingsTotal % of Variance Cumulative % Total % of Variance Cumulative %
12345678910111213141516171819202122232425
7,129 24,583 24,583 7,129 24,583 24,5833,598 12,405 36,989 3,598 12,405 36,9892,184 7,532 44,521 2,184 7,532 44,5211,939 6,686 51,207 1,939 6,686 51,2071,664 5,739 56,946 1,664 5,739 56,9461,368 4,716 61,662 1,368 4,716 61,6621,286 4,434 66,0961,129 3,893 69,9891,022 3,525 73,514
,950 3,275 76,789,772 2,661 79,450,709 2,443 81,893,638 2,199 84,092,578 1,993 86,085,533 1,838 87,923,496 1,709 89,633,472 1,627 91,259,423 1,458 92,717,346 1,193 93,910,293 1,011 94,921,265 ,914 95,835,247 ,852 96,687,220 ,757 97,445,175 ,604 98,048,166 ,572 98,620
Page 4

Total Variance Explained
Component
Rotation Sums of Squared LoadingsTotal % of Variance Cumulative %
12345678910111213141516171819202122232425
4,333 14,943 14,9433,503 12,080 27,0233,288 11,338 38,3612,372 8,178 46,5392,256 7,778 54,3172,130 7,344 61,662
Total Variance Explained
Component
Initial Eigenvalues Extraction Sums of Squared LoadingsTotal % of Variance Cumulative % Total % of Variance Cumulative %
26272829
,140 ,483 99,103,105 ,363 99,466,089 ,307 99,773,066 ,227 100,000
Page 5

Total Variance Explained
Component
Rotation Sums of Squared LoadingsTotal % of Variance Cumulative %
26272829
Extraction Method: Principal Component Analysis.
Component Matrixa
Component1 2 3 4 5 6
Involvement in Initiation PhaseInvolvement in Planning PhaseInvolvement in Execution PhaseInvolvement in FInalization PhaseSupport for the use of tools of project management
Find_Subject_DifficultyTime_Constrains_Difficulty
Coherent_Research_Design_DifficultyIntegration_between_theory_and_realityLevel of use of collaboration
Level of use of coordination
Level of use of communicationLevel of use of Project MonitoringCompany's top managers are aware of the methodology used for managing projects
,381 ,468 ,195 ,257 ,482 ,010
,246 ,496 ,080 ,180 ,500 ,305
,302 ,426 -,043 ,506 -,178 ,304
,245 ,494 -,248 ,436 -,267 ,332
,257 ,363 -,048 -,008 ,545 -,007
-,416 -,048 ,297 ,220 ,360 -,323
-,260 ,379 ,564 ,372 -,247 ,028
-,196 -,137 ,713 ,318 -,186 ,011
-,341 -,174 ,606 ,062 -,132 -,064
,542 ,390 ,089 -,321 -,169 ,137
,563 ,352 ,272 -,293 ,073 ,193
,621 ,244 ,167 -,504 -,127 ,012
,507 ,319 ,218 -,252 -,195 ,173
,513 -,451 -,094 ,301 ,283 -,143
Page 6

Component Matrixa
Component1 2 3 4 5 6
Company's top managers decide the projects that have to be developed
Company's top managers have an active role when defining projects' success criteriaCompany's top managers are responsible for establishing the project management methodology
Company's top managers are involved in the monitoring and controlling phase of programs and portfoliosCompany's top managers are frequently informed about the progress of projectsProject management processes are well documented and controlled
Organizational culture, structure and processes strongly influence the project management planProject managers have to ensure compliance with company's policies and any regulatory requirements
Project management processes are standardized and subject to improvementsProject managers identify any potential changes at the execution phase
,248 -,536 ,269 ,150 -,087 ,238
,377 -,619 ,065 ,054 ,238 ,285
,228 -,645 ,001 ,138 ,093 ,354
,350 -,706 -,085 ,146 -,014 ,265
,646 -,249 ,096 -,112 -,210 ,031
,638 ,071 ,055 ,366 ,010 -,153
,688 -,025 ,024 ,094 -,051 -,072
,774 -,159 ,201 ,033 -,128 -,332
,503 ,115 ,209 ,247 -,059 -,386
,647 -,005 -,320 ,198 -,206 ,001
Page 7

Component Matrixa
Component1 2 3 4 5 6
Project managers identify the risks and potential issuesProject Managers review, control and maintain the
Project managers ensure that the deliverables are according to the acceptance criteria.Project managers measure the ongoing project activitiesProject managers monitor the project variables (cost, effort, scope) against the project management plan and the project baseline (where should we be?)
,690 ,010 -,222 ,117 ,112 -,223
,618 ,015 -,223 ,112 -,142 -,055
,654 -,059 -,081 -,001 -,177 -,384
,557 -,168 ,287 -,310 ,345 -,029
,499 -,130 ,394 -,247 ,071 ,182
Extraction Method: Principal Component Analysis.6 components extracted.a.
Page 8

Rotated Component Matrixa
Component1 2 3 4 5 6
Involvement in Initiation PhaseInvolvement in Planning PhaseInvolvement in Execution PhaseInvolvement in FInalization PhaseSupport for the use of tools of project management
Find_Subject_DifficultyTime_Constrains_Difficulty
Coherent_Research_Design_DifficultyIntegration_between_theory_and_realityLevel of use of collaboration
Level of use of coordination
Level of use of communicationLevel of use of Project MonitoringCompany's top managers are aware of the methodology used for managing projectsCompany's top managers decide the projects that have to be developed
Company's top managers have an active role when defining projects' success criteria
,250 ,136 -,091 ,087 ,763 ,144
-,053 ,166 -,028 -,032 ,766 ,265
,185 ,081 -,030 ,092 ,234 ,742
,115 ,070 -,131 -,085 ,132 ,823
,090 ,103 -,113 -,206 ,650 -,040
-,074 -,446 -,131 ,379 ,247 -,346
-,084 -,010 -,290 ,737 ,070 ,301
-,022 -,050 ,132 ,822 -,072 ,003
-,164 -,051 ,034 ,663 -,154 -,213
,193 ,703 -,134 -,124 ,096 ,173
,151 ,714 -,010 -,007 ,328 ,059
,270 ,799 -,076 -,138 ,043 -,079
,174 ,684 -,055 ,025 ,077 ,175
,541 -,173 ,528 -,142 ,185 -,102
,120 ,078 ,642 ,238 -,141 ,000
,118 ,056 ,791 -,072 ,076 -,129
Page 9

Rotated Component Matrixa
Component1 2 3 4 5 6
Company's top managers are responsible for establishing the project management methodology
Company's top managers are involved in the monitoring and controlling phase of programs and portfoliosCompany's top managers are frequently informed about the progress of projectsProject management processes are well documented and controlled
Organizational culture, structure and processes strongly influence the project management planProject managers have to ensure compliance with company's policies and any regulatory requirements
Project management processes are standardized and subject to improvementsProject managers identify any potential changes at the execution phaseProject managers identify the risks and potential issuesProject Managers review, control and maintain the
,019 -,051 ,782 -,043 -,069 -,002
,181 -,041 ,799 -,118 -,182 ,017
,445 ,435 ,364 -,058 -,151 ,012
,656 ,103 ,140 ,042 ,237 ,232
,569 ,300 ,211 -,083 ,104 ,123
,786 ,346 ,204 ,062 -,018 -,099
,669 ,114 -,071 ,194 ,139 ,034
,552 ,158 ,180 -,318 -,047 ,371
,651 ,130 ,120 -,318 ,203 ,065
,528 ,203 ,132 -,264 -,002 ,246
Page 10

Rotated Component Matrixa
Component1 2 3 4 5 6
Project managers ensure that the deliverables are according to the acceptance criteria.Project managers measure the ongoing project activitiesProject managers monitor the project variables (cost, effort, scope) against the project management plan and the project baseline (where should we be?)
,727 ,227 ,024 -,161 -,099 -,032
,276 ,457 ,322 -,042 ,307 -,390
,157 ,558 ,353 ,129 ,139 -,151
Extraction Method: Principal Component Analysis. Rotation Method: Varimax with Kaiser Normalization.a
Rotation converged in 6 iterations.a.
Component Transformation Matrix
Component 1 2 3 4 5 6123456
,709 ,534 ,317 -,220 ,206 ,147-,065 ,272 -,767 ,007 ,418 ,398-,015 ,343 ,086 ,888 ,155 -,248,319 -,619 ,168 ,348 ,216 ,566
-,129 -,219 ,170 -,196 ,834 -,416-,613 ,305 ,497 -,055 ,128 ,515
Extraction Method: Principal Component Analysis. Rotation Method: Varimax with Kaiser Normalization.
Page 11

Component 31,0 0,5 0,0 -0,5 -1,0
Com
pone
nt 2
1,0
0,5
0,0
-0,5
-1,0
Component 11,00,50,0-0,5-1,0
Monitoring_and_Control_Involvement
Active_Role
Methodoloy
Compliance
Methodology_Establishment
Progress_feedback
Decision_for_the_project
Culture_Structure_impact
Processes
Activity_Monitoring
RisksChanges
Variables_Monitoring
Acceptance_Criteria
Quality Standardization
CommunicationCoordination
Progress_MonitoringCollaboration
Execution_Phase_InvolvementInitiation_Phase_Involvemeent
Coherent_Research_Design_Difficulty
Use_of_tools_supportPlanning_Phase_Involvement
Finalazation_Phase_Involvement
Integration_between_theory_and_reality
Find_Subject_Difficulty
Component Plot in Rotated Space
Page 12

Component Score Coefficient Matrix
Component1 2 3 4 5 6
Involvement in Initiation PhaseInvolvement in Planning PhaseInvolvement in Execution PhaseInvolvement in FInalization PhaseSupport for the use of tools of project management
Find_Subject_DifficultyTime_Constrains_Difficulty
Coherent_Research_Design_DifficultyIntegration_between_theory_and_realityLevel of use of collaboration
Level of use of coordination
Level of use of communicationLevel of use of Project MonitoringCompany's top managers are aware of the methodology used for managing projectsCompany's top managers decide the projects that have to be developed
Company's top managers have an active role when defining projects' success criteria
,028 -,048 ,000 ,057 ,350 -,004
-,131 ,013 ,086 -,013 ,370 ,093
-,017 -,022 ,057 ,073 ,051 ,365
-,039 -,013 ,026 -,011 -,008 ,407
-,021 -,032 -,015 -,092 ,318 -,090
,110 -,178 -,058 ,144 ,178 -,195
,031 ,018 -,053 ,333 -,003 ,153
,040 ,012 ,061 ,374 -,028 ,043
,014 ,040 ,014 ,286 -,052 -,068
-,055 ,239 -,051 -,023 -,040 ,045
-,093 ,238 ,013 ,025 ,099 -,011
-,022 ,271 -,070 -,027 -,060 -,090
-,061 ,241 -,016 ,044 -,042 ,061
,152 -,176 ,118 -,028 ,117 -,065
-,043 ,037 ,227 ,129 -,041 ,071
-,089 ,006 ,284 -,016 ,096 -,004
Page 13

Component Score Coefficient Matrix
Component1 2 3 4 5 6
Company's top managers are responsible for establishing the project management methodology
Company's top managers are involved in the monitoring and controlling phase of programs and portfoliosCompany's top managers are frequently informed about the progress of projectsProject management processes are well documented and controlled
Organizational culture, structure and processes strongly influence the project management planProject managers have to ensure compliance with company's policies and any regulatory requirements
Project management processes are standardized and subject to improvementsProject managers identify any potential changes at the execution phaseProject managers identify the risks and potential issuesProject Managers review, control and maintain the
-,109 -,009 ,298 -,008 ,027 ,083
-,045 -,026 ,270 -,029 -,044 ,085
,052 ,115 ,066 ,022 -,118 ,007
,190 -,091 -,007 ,073 ,062 ,061
,120 ,014 ,014 ,014 -,003 ,022
,242 ,010 -,054 ,092 -,073 -,108
,265 -,078 -,119 ,136 ,005 -,059
,114 -,038 ,014 -,091 -,086 ,159
,180 -,084 -,039 -,095 ,054 -,037
,117 -,017 -,010 -,071 -,060 ,087
Page 14

Component Score Coefficient Matrix
Component1 2 3 4 5 6
Project managers ensure that the deliverables are according to the acceptance criteria.Project managers measure the ongoing project activitiesProject managers monitor the project variables (cost, effort, scope) against the project management plan and the project baseline (where should we be?)
,252 -,030 -,119 -,017 -,118 -,085
-,008 ,121 ,070 ,004 ,153 -,227
-,078 ,199 ,117 ,085 ,052 -,070
Extraction Method: Principal Component Analysis. Rotation Method: Varimax with Kaiser Normalization. Component Scores.
Component Score Covariance Matrix
Component 1 2 3 4 5 6123456
1,000 ,000 ,000 ,000 ,000 ,000,000 1,000 ,000 ,000 ,000 ,000,000 ,000 1,000 ,000 ,000 ,000,000 ,000 ,000 1,000 ,000 ,000,000 ,000 ,000 ,000 1,000 ,000,000 ,000 ,000 ,000 ,000 1,000
Extraction Method: Principal Component Analysis. Rotation Method: Varimax with Kaiser Normalization. Component Scores.
Page 15

GET FILE='C:\Users\user\Desktop\SPSS Analysis\try 2\SPSS Analysis.sav-05.04.2020.sav'.
DATASET NAME DataSet1 WINDOW=FRONT.FACTOR
/VARIABLES Initiation_Phase_Involvemeent Planning_Phase_Involvement Execution_Phase_Involvement Finalazation_Phase_Involvement Use_of_tools_support Find_Subject_Difficulty Time_Constrains_Difficulty Coherent_Research_Design_Diffi
culty Integration_between_theory_and_reality Collaboration Coordination Communication Progress_Monitoring Methodoloy Decision_for_the_project Active_Role
Methodology_Establishment Monitoring_and_Control_Involvement Progress_feedback Processes Culture_Structure_impact ComplianceStandardization Changes Risks Quality Acceptance_Criteria Activity_Monitoring
Variables_Monitoring /MISSING LISTWISE
/ANALYSIS Initiation_Phase_Involvemeent Planning_Phase_Involvement Execution_Phase_Involvement Finalazation_Phase_Involvement Use_of_tools_support Find_Subject_Difficulty Time_Constrains_Difficulty Coherent_Research_Design_Diffic
ulty Integration_between_theory_and_reality Collaboration Coordination Communication Progress_Monitoring Methodoloy Decision_for_the_project Active_Role M
ethodology_Establishment Monitoring_and_Control_Involvement Progress_feedback Processes Culture_Structure_impact ComplianceStandardization Changes Risks Quality Acceptance_Criteria Activity_Monitoring
Variables_Monitoring /PRINT INITIAL EXTRACTION ROTATION FSCORE
/PLOT ROTATION /CRITERIA FACTORS(6) ITERATE(25) /EXTRACTION PC
/CRITERIA ITERATE(25) /ROTATION VARIMAX /SAVE REG(ALL)
/METHOD=CORRELATION.
Factor Analysis[DataSet1] C:\Users\user\Desktop\SPSS Analysis\try 2\SPSS Analysis.sav-05.04.2020.sav
Page 1

Communalities
Initial ExtractionInvolvement in Initiation PhaseInvolvement in Planning PhaseInvolvement in Execution PhaseInvolvement in FInalization PhaseSupport for the use of tools of project management
Find_Subject_DifficultyTime_Constrains_Difficulty
Coherent_Research_Design_DifficultyIntegration_between_theory_and_realityLevel of use of collaboration
Level of use of coordination
Level of use of communicationLevel of use of Project MonitoringCompany's top managers are aware of the methodology used for managing projectsCompany's top managers decide the projects that have to be developed
Company's top managers have an active role when defining projects' success criteria
1,000 ,700
1,000 ,688
1,000 ,655
1,000 ,737
1,000 ,497
1,000 ,546
1,000 ,729
1,000 ,701
1,000 ,539
1,000 ,604
1,000 ,644
1,000 ,744
1,000 ,539
1,000 ,666
1,000 ,509
1,000 ,671
Page 2

Communalities
Initial ExtractionCompany's top managers are responsible for establishing the project management methodology
Company's top managers are involved in the monitoring and controlling phase of programs and portfoliosCompany's top managers are frequently informed about the progress of projectsProject management processes are well documented and controlled
Organizational culture, structure and processes strongly influence the project management planProject managers have to ensure compliance with company's policies and any regulatory requirements
Project management processes are standardized and subject to improvementsProject managers identify any potential changes at the execution phaseProject managers identify the risks and potential issuesProject Managers review, control and maintain the
Project managers ensure that the deliverables are according to the acceptance criteria.
1,000 ,621
1,000 ,720
1,000 ,547
1,000 ,573
1,000 ,491
1,000 ,793
1,000 ,524
1,000 ,603
1,000 ,601
1,000 ,467
1,000 ,617
Page 3

Communalities
Initial ExtractionProject managers measure the ongoing project activitiesProject managers monitor the project variables (cost, effort, scope) against the project management plan and the project baseline (where should we be?)
1,000 ,637
1,000 ,520
Extraction Method: Principal Component Analysis.
Total Variance Explained
Component
Initial Eigenvalues Extraction Sums of Squared LoadingsTotal % of Variance Cumulative % Total % of Variance Cumulative %
12345678910111213141516171819202122232425
7,129 24,583 24,583 7,129 24,583 24,5833,598 12,405 36,989 3,598 12,405 36,9892,184 7,532 44,521 2,184 7,532 44,5211,939 6,686 51,207 1,939 6,686 51,2071,664 5,739 56,946 1,664 5,739 56,9461,368 4,716 61,662 1,368 4,716 61,6621,286 4,434 66,0961,129 3,893 69,9891,022 3,525 73,514
,950 3,275 76,789,772 2,661 79,450,709 2,443 81,893,638 2,199 84,092,578 1,993 86,085,533 1,838 87,923,496 1,709 89,633,472 1,627 91,259,423 1,458 92,717,346 1,193 93,910,293 1,011 94,921,265 ,914 95,835,247 ,852 96,687,220 ,757 97,445,175 ,604 98,048,166 ,572 98,620
Page 4

Total Variance Explained
Component
Rotation Sums of Squared LoadingsTotal % of Variance Cumulative %
12345678910111213141516171819202122232425
4,333 14,943 14,9433,503 12,080 27,0233,288 11,338 38,3612,372 8,178 46,5392,256 7,778 54,3172,130 7,344 61,662
Total Variance Explained
Component
Initial Eigenvalues Extraction Sums of Squared LoadingsTotal % of Variance Cumulative % Total % of Variance Cumulative %
26272829
,140 ,483 99,103,105 ,363 99,466,089 ,307 99,773,066 ,227 100,000
Page 5

Total Variance Explained
Component
Rotation Sums of Squared LoadingsTotal % of Variance Cumulative %
26272829
Extraction Method: Principal Component Analysis.
Component Matrixa
Component1 2 3 4 5 6
Involvement in Initiation PhaseInvolvement in Planning PhaseInvolvement in Execution PhaseInvolvement in FInalization PhaseSupport for the use of tools of project management
Find_Subject_DifficultyTime_Constrains_Difficulty
Coherent_Research_Design_DifficultyIntegration_between_theory_and_realityLevel of use of collaboration
Level of use of coordination
Level of use of communicationLevel of use of Project MonitoringCompany's top managers are aware of the methodology used for managing projects
,381 ,468 ,195 ,257 ,482 ,010
,246 ,496 ,080 ,180 ,500 ,305
,302 ,426 -,043 ,506 -,178 ,304
,245 ,494 -,248 ,436 -,267 ,332
,257 ,363 -,048 -,008 ,545 -,007
-,416 -,048 ,297 ,220 ,360 -,323
-,260 ,379 ,564 ,372 -,247 ,028
-,196 -,137 ,713 ,318 -,186 ,011
-,341 -,174 ,606 ,062 -,132 -,064
,542 ,390 ,089 -,321 -,169 ,137
,563 ,352 ,272 -,293 ,073 ,193
,621 ,244 ,167 -,504 -,127 ,012
,507 ,319 ,218 -,252 -,195 ,173
,513 -,451 -,094 ,301 ,283 -,143
Page 6

Component Matrixa
Component1 2 3 4 5 6
Company's top managers decide the projects that have to be developed
Company's top managers have an active role when defining projects' success criteriaCompany's top managers are responsible for establishing the project management methodology
Company's top managers are involved in the monitoring and controlling phase of programs and portfoliosCompany's top managers are frequently informed about the progress of projectsProject management processes are well documented and controlled
Organizational culture, structure and processes strongly influence the project management planProject managers have to ensure compliance with company's policies and any regulatory requirements
Project management processes are standardized and subject to improvementsProject managers identify any potential changes at the execution phase
,248 -,536 ,269 ,150 -,087 ,238
,377 -,619 ,065 ,054 ,238 ,285
,228 -,645 ,001 ,138 ,093 ,354
,350 -,706 -,085 ,146 -,014 ,265
,646 -,249 ,096 -,112 -,210 ,031
,638 ,071 ,055 ,366 ,010 -,153
,688 -,025 ,024 ,094 -,051 -,072
,774 -,159 ,201 ,033 -,128 -,332
,503 ,115 ,209 ,247 -,059 -,386
,647 -,005 -,320 ,198 -,206 ,001
Page 7

Component Matrixa
Component1 2 3 4 5 6
Project managers identify the risks and potential issuesProject Managers review, control and maintain the
Project managers ensure that the deliverables are according to the acceptance criteria.Project managers measure the ongoing project activitiesProject managers monitor the project variables (cost, effort, scope) against the project management plan and the project baseline (where should we be?)
,690 ,010 -,222 ,117 ,112 -,223
,618 ,015 -,223 ,112 -,142 -,055
,654 -,059 -,081 -,001 -,177 -,384
,557 -,168 ,287 -,310 ,345 -,029
,499 -,130 ,394 -,247 ,071 ,182
Extraction Method: Principal Component Analysis.6 components extracted.a.
Page 8

Rotated Component Matrixa
Component1 2 3 4 5 6
Involvement in Initiation PhaseInvolvement in Planning PhaseInvolvement in Execution PhaseInvolvement in FInalization PhaseSupport for the use of tools of project management
Find_Subject_DifficultyTime_Constrains_Difficulty
Coherent_Research_Design_DifficultyIntegration_between_theory_and_realityLevel of use of collaboration
Level of use of coordination
Level of use of communicationLevel of use of Project MonitoringCompany's top managers are aware of the methodology used for managing projectsCompany's top managers decide the projects that have to be developed
Company's top managers have an active role when defining projects' success criteria
,250 ,136 -,091 ,087 ,763 ,144
-,053 ,166 -,028 -,032 ,766 ,265
,185 ,081 -,030 ,092 ,234 ,742
,115 ,070 -,131 -,085 ,132 ,823
,090 ,103 -,113 -,206 ,650 -,040
-,074 -,446 -,131 ,379 ,247 -,346
-,084 -,010 -,290 ,737 ,070 ,301
-,022 -,050 ,132 ,822 -,072 ,003
-,164 -,051 ,034 ,663 -,154 -,213
,193 ,703 -,134 -,124 ,096 ,173
,151 ,714 -,010 -,007 ,328 ,059
,270 ,799 -,076 -,138 ,043 -,079
,174 ,684 -,055 ,025 ,077 ,175
,541 -,173 ,528 -,142 ,185 -,102
,120 ,078 ,642 ,238 -,141 ,000
,118 ,056 ,791 -,072 ,076 -,129
Page 9

Rotated Component Matrixa
Component1 2 3 4 5 6
Company's top managers are responsible for establishing the project management methodology
Company's top managers are involved in the monitoring and controlling phase of programs and portfoliosCompany's top managers are frequently informed about the progress of projectsProject management processes are well documented and controlled
Organizational culture, structure and processes strongly influence the project management planProject managers have to ensure compliance with company's policies and any regulatory requirements
Project management processes are standardized and subject to improvementsProject managers identify any potential changes at the execution phaseProject managers identify the risks and potential issuesProject Managers review, control and maintain the
,019 -,051 ,782 -,043 -,069 -,002
,181 -,041 ,799 -,118 -,182 ,017
,445 ,435 ,364 -,058 -,151 ,012
,656 ,103 ,140 ,042 ,237 ,232
,569 ,300 ,211 -,083 ,104 ,123
,786 ,346 ,204 ,062 -,018 -,099
,669 ,114 -,071 ,194 ,139 ,034
,552 ,158 ,180 -,318 -,047 ,371
,651 ,130 ,120 -,318 ,203 ,065
,528 ,203 ,132 -,264 -,002 ,246
Page 10

Rotated Component Matrixa
Component1 2 3 4 5 6
Project managers ensure that the deliverables are according to the acceptance criteria.Project managers measure the ongoing project activitiesProject managers monitor the project variables (cost, effort, scope) against the project management plan and the project baseline (where should we be?)
,727 ,227 ,024 -,161 -,099 -,032
,276 ,457 ,322 -,042 ,307 -,390
,157 ,558 ,353 ,129 ,139 -,151
Extraction Method: Principal Component Analysis. Rotation Method: Varimax with Kaiser Normalization.a
Rotation converged in 6 iterations.a.
Component Transformation Matrix
Component 1 2 3 4 5 6123456
,709 ,534 ,317 -,220 ,206 ,147-,065 ,272 -,767 ,007 ,418 ,398-,015 ,343 ,086 ,888 ,155 -,248,319 -,619 ,168 ,348 ,216 ,566
-,129 -,219 ,170 -,196 ,834 -,416-,613 ,305 ,497 -,055 ,128 ,515
Extraction Method: Principal Component Analysis. Rotation Method: Varimax with Kaiser Normalization.
Page 11

Component 31,0 0,5 0,0 -0,5 -1,0
Com
pone
nt 2
1,0
0,5
0,0
-0,5
-1,0
Component 11,00,50,0-0,5-1,0
Monitoring_and_Control_Involvement
Active_Role
Methodoloy
Compliance
Methodology_Establishment
Progress_feedback
Decision_for_the_project
Culture_Structure_impact
Processes
Activity_Monitoring
RisksChanges
Variables_Monitoring
Acceptance_Criteria
Quality Standardization
CommunicationCoordination
Progress_MonitoringCollaboration
Execution_Phase_Involvement
Initiation_Phase_Involvemeent
Coherent_Research_Design_Difficulty
Use_of_tools_supportPlanning_Phase_Involvement
Finalazation_Phase_InvolvementIntegration_between_theory_and_reality
Find_Subject_Difficulty
Component Plot in Rotated Space
Page 12

Component Score Coefficient Matrix
Component1 2 3 4 5 6
Involvement in Initiation PhaseInvolvement in Planning PhaseInvolvement in Execution PhaseInvolvement in FInalization PhaseSupport for the use of tools of project management
Find_Subject_DifficultyTime_Constrains_Difficulty
Coherent_Research_Design_DifficultyIntegration_between_theory_and_realityLevel of use of collaboration
Level of use of coordination
Level of use of communicationLevel of use of Project MonitoringCompany's top managers are aware of the methodology used for managing projectsCompany's top managers decide the projects that have to be developed
Company's top managers have an active role when defining projects' success criteria
,028 -,048 ,000 ,057 ,350 -,004
-,131 ,013 ,086 -,013 ,370 ,093
-,017 -,022 ,057 ,073 ,051 ,365
-,039 -,013 ,026 -,011 -,008 ,407
-,021 -,032 -,015 -,092 ,318 -,090
,110 -,178 -,058 ,144 ,178 -,195
,031 ,018 -,053 ,333 -,003 ,153
,040 ,012 ,061 ,374 -,028 ,043
,014 ,040 ,014 ,286 -,052 -,068
-,055 ,239 -,051 -,023 -,040 ,045
-,093 ,238 ,013 ,025 ,099 -,011
-,022 ,271 -,070 -,027 -,060 -,090
-,061 ,241 -,016 ,044 -,042 ,061
,152 -,176 ,118 -,028 ,117 -,065
-,043 ,037 ,227 ,129 -,041 ,071
-,089 ,006 ,284 -,016 ,096 -,004
Page 13

Component Score Coefficient Matrix
Component1 2 3 4 5 6
Company's top managers are responsible for establishing the project management methodology
Company's top managers are involved in the monitoring and controlling phase of programs and portfoliosCompany's top managers are frequently informed about the progress of projectsProject management processes are well documented and controlled
Organizational culture, structure and processes strongly influence the project management planProject managers have to ensure compliance with company's policies and any regulatory requirements
Project management processes are standardized and subject to improvementsProject managers identify any potential changes at the execution phaseProject managers identify the risks and potential issuesProject Managers review, control and maintain the
-,109 -,009 ,298 -,008 ,027 ,083
-,045 -,026 ,270 -,029 -,044 ,085
,052 ,115 ,066 ,022 -,118 ,007
,190 -,091 -,007 ,073 ,062 ,061
,120 ,014 ,014 ,014 -,003 ,022
,242 ,010 -,054 ,092 -,073 -,108
,265 -,078 -,119 ,136 ,005 -,059
,114 -,038 ,014 -,091 -,086 ,159
,180 -,084 -,039 -,095 ,054 -,037
,117 -,017 -,010 -,071 -,060 ,087
Page 14

Component Score Coefficient Matrix
Component1 2 3 4 5 6
Project managers ensure that the deliverables are according to the acceptance criteria.Project managers measure the ongoing project activitiesProject managers monitor the project variables (cost, effort, scope) against the project management plan and the project baseline (where should we be?)
,252 -,030 -,119 -,017 -,118 -,085
-,008 ,121 ,070 ,004 ,153 -,227
-,078 ,199 ,117 ,085 ,052 -,070
Extraction Method: Principal Component Analysis. Rotation Method: Varimax with Kaiser Normalization. Component Scores.
Component Score Covariance Matrix
Component 1 2 3 4 5 6123456
1,000 ,000 ,000 ,000 ,000 ,000,000 1,000 ,000 ,000 ,000 ,000,000 ,000 1,000 ,000 ,000 ,000,000 ,000 ,000 1,000 ,000 ,000,000 ,000 ,000 ,000 1,000 ,000,000 ,000 ,000 ,000 ,000 1,000
Extraction Method: Principal Component Analysis. Rotation Method: Varimax with Kaiser Normalization. Component Scores.
REGRESSION /MISSING LISTWISE /STATISTICS COEFF OUTS R ANOVA
/CRITERIA=PIN(.05) POUT(.10) /NOORIGIN
/DEPENDENT Project_Success /METHOD=ENTER FAC1_1 FAC2_1 FAC3_1 FAC4_1 FAC5_1 FAC6_1.
Regression
Page 15

Variables Entered/Removeda
ModelVariables Entered
Variables Removed Method
1 REGR factor score 6 for analysis 1, REGR factor score 5 for analysis 1, REGR factor score 4 for analysis 1, REGR factor score 3 for analysis 1, REGR factor score 2 for analysis 1, REGR factor score 1 for analysis 1b
. Enter
Dependent Variable: Projects meet their operational performance goalsa.
All requested variables entered.b.
Model Summary
Model R R SquareAdjusted R
SquareStd. Error of the
Estimate1 ,501a ,251 ,170 ,651
Predictors: (Constant), REGR factor score 6 for analysis 1, REGR factor score 5 for analysis 1, REGR factor score 4 for analysis 1, REGR factor score 3 for analysis 1, REGR factor score 2 for analysis 1, REGR factor score 1 for analysis 1
a.
ANOVAa
ModelSum of Squares df Mean Square F Sig.
1 RegressionResidualTotal
7,834 6 1,306 3,077 ,011b
23,343 55 ,42431,177 61
Dependent Variable: Projects meet their operational performance goalsa.
Predictors: (Constant), REGR factor score 6 for analysis 1, REGR factor score 5 for analysis 1, REGR factor score 4 for analysis 1, REGR factor score 3 for analysis 1, REGR factor score 2 for analysis 1, REGR factor score 1 for analysis 1
b.
Page 16

Coefficientsa
Model
Unstandardized CoefficientsStandardized Coefficients
t Sig.B Std. Error Beta1 (Constant)
REGR factor score 1 for analysis 1REGR factor score 2 for analysis 1REGR factor score 3 for analysis 1REGR factor score 4 for analysis 1REGR factor score 5 for analysis 1REGR factor score 6 for analysis 1
3,694 ,083 44,642 ,000
,282 ,083 ,395 3,386 ,001
,127 ,083 ,178 1,526 ,133
,106 ,083 ,148 1,270 ,209
-,104 ,083 -,145 -1,244 ,219
,066 ,083 ,092 ,785 ,436
,079 ,083 ,110 ,943 ,350
Dependent Variable: Projects meet their operational performance goalsa.
Page 17

REGRESSION /MISSING LISTWISE /STATISTICS COEFF OUTS R ANOVA
/CRITERIA=PIN(.05) POUT(.10) /NOORIGIN
/DEPENDENT Techical_goals /METHOD=ENTER FAC1_1 FAC2_1 FAC3_1 FAC4_1 FAC5_1 FAC6_1.
Regression
Variables Entered/Removeda
ModelVariables Entered
Variables Removed Method
1 REGR factor score 6 for analysis 1, REGR factor score 5 for analysis 1, REGR factor score 4 for analysis 1, REGR factor score 3 for analysis 1, REGR factor score 2 for analysis 1, REGR factor score 1 for analysis 1b
. Enter
Dependent Variable: Projects meet their technical performance goalsa.
All requested variables entered.b.
Model Summary
Model R R SquareAdjusted R
SquareStd. Error of the
Estimate1 ,637a ,406 ,341 ,587
Predictors: (Constant), REGR factor score 6 for analysis 1, REGR factor score 5 for analysis 1, REGR factor score 4 for analysis 1, REGR factor score 3 for analysis 1, REGR factor score 2 for analysis 1, REGR factor score 1 for analysis 1
a.
Page 1

ANOVAa
ModelSum of Squares df Mean Square F Sig.
1 RegressionResidualTotal
12,940 6 2,157 6,260 ,000b
18,947 55 ,34431,887 61
Dependent Variable: Projects meet their technical performance goalsa.
Predictors: (Constant), REGR factor score 6 for analysis 1, REGR factor score 5 for analysis 1, REGR factor score 4 for analysis 1, REGR factor score 3 for analysis 1, REGR factor score 2 for analysis 1, REGR factor score 1 for analysis 1
b.
Coefficientsa
Model
Unstandardized CoefficientsStandardized Coefficients
t Sig.B Std. Error Beta1 (Constant)
REGR factor score 1 for analysis 1REGR factor score 2 for analysis 1REGR factor score 3 for analysis 1REGR factor score 4 for analysis 1REGR factor score 5 for analysis 1REGR factor score 6 for analysis 1
3,661 ,075 49,118 ,000
,371 ,075 ,512 4,930 ,000
,102 ,075 ,141 1,354 ,181
,159 ,075 ,220 2,116 ,039
-,114 ,075 -,158 -1,521 ,134
,063 ,075 ,088 ,844 ,403
,149 ,075 ,206 1,980 ,053
Dependent Variable: Projects meet their technical performance goalsa.
Page 2

REGRESSION /MISSING LISTWISE /STATISTICS COEFF OUTS R ANOVA
/CRITERIA=PIN(.05) POUT(.10) /NOORIGIN
/DEPENDENT Schedule_Objectives /METHOD=ENTER FAC1_1 FAC2_1 FAC3_1 FAC4_1 FAC5_1 FAC6_1.
Regression
Variables Entered/Removeda
ModelVariables Entered
Variables Removed Method
1 REGR factor score 6 for analysis 1, REGR factor score 5 for analysis 1, REGR factor score 4 for analysis 1, REGR factor score 3 for analysis 1, REGR factor score 2 for analysis 1, REGR factor score 1 for analysis 1b
. Enter
Dependent Variable: Projects meet their schedule objectivesa.
All requested variables entered.b.
Model Summary
Model R R SquareAdjusted R
SquareStd. Error of the
Estimate1 ,583a ,339 ,267 ,771
Predictors: (Constant), REGR factor score 6 for analysis 1, REGR factor score 5 for analysis 1, REGR factor score 4 for analysis 1, REGR factor score 3 for analysis 1, REGR factor score 2 for analysis 1, REGR factor score 1 for analysis 1
a.
Page 1

ANOVAa
ModelSum of Squares df Mean Square F Sig.
1 RegressionResidualTotal
16,818 6 2,803 4,710 ,001b
32,731 55 ,59549,548 61
Dependent Variable: Projects meet their schedule objectivesa.
Predictors: (Constant), REGR factor score 6 for analysis 1, REGR factor score 5 for analysis 1, REGR factor score 4 for analysis 1, REGR factor score 3 for analysis 1, REGR factor score 2 for analysis 1, REGR factor score 1 for analysis 1
b.
Coefficientsa
Model
Unstandardized CoefficientsStandardized Coefficients
t Sig.B Std. Error Beta1 (Constant)
REGR factor score 1 for analysis 1REGR factor score 2 for analysis 1REGR factor score 3 for analysis 1REGR factor score 4 for analysis 1REGR factor score 5 for analysis 1REGR factor score 6 for analysis 1
3,677 ,098 37,536 ,000
,372 ,099 ,413 3,764 ,000
,220 ,099 ,244 2,231 ,030
,130 ,099 ,144 1,314 ,194
-,116 ,099 -,129 -1,177 ,244
,236 ,099 ,261 2,386 ,021
-,055 ,099 -,061 -,559 ,579
Dependent Variable: Projects meet their schedule objectivesa.
Page 2

REGRESSION /MISSING LISTWISE /STATISTICS COEFF OUTS R ANOVA
/CRITERIA=PIN(.05) POUT(.10) /NOORIGIN
/DEPENDENT Budget /METHOD=ENTER FAC1_1 FAC2_1 FAC3_1 FAC4_1 FAC5_1 FAC6_1.
Regression
Variables Entered/Removeda
ModelVariables Entered
Variables Removed Method
1 REGR factor score 6 for analysis 1, REGR factor score 5 for analysis 1, REGR factor score 4 for analysis 1, REGR factor score 3 for analysis 1, REGR factor score 2 for analysis 1, REGR factor score 1 for analysis 1b
. Enter
Dependent Variable: Projects stay within budget limitsa.
All requested variables entered.b.
Model Summary
Model R R SquareAdjusted R
SquareStd. Error of the
Estimate1 ,603a ,364 ,294 ,769
Predictors: (Constant), REGR factor score 6 for analysis 1, REGR factor score 5 for analysis 1, REGR factor score 4 for analysis 1, REGR factor score 3 for analysis 1, REGR factor score 2 for analysis 1, REGR factor score 1 for analysis 1
a.
Page 1

ANOVAa
ModelSum of Squares df Mean Square F Sig.
1 RegressionResidualTotal
18,580 6 3,097 5,238 ,000b
32,517 55 ,59151,097 61
Dependent Variable: Projects stay within budget limitsa.
Predictors: (Constant), REGR factor score 6 for analysis 1, REGR factor score 5 for analysis 1, REGR factor score 4 for analysis 1, REGR factor score 3 for analysis 1, REGR factor score 2 for analysis 1, REGR factor score 1 for analysis 1
b.
Coefficientsa
Model
Unstandardized CoefficientsStandardized Coefficients
t Sig.B Std. Error Beta1 (Constant)
REGR factor score 1 for analysis 1REGR factor score 2 for analysis 1REGR factor score 3 for analysis 1REGR factor score 4 for analysis 1REGR factor score 5 for analysis 1REGR factor score 6 for analysis 1
3,581 ,098 36,668 ,000
,278 ,098 ,304 2,825 ,007
,229 ,098 ,250 2,322 ,024
,118 ,098 ,129 1,201 ,235
-,053 ,098 -,058 -,542 ,590
,395 ,098 ,431 4,009 ,000
,048 ,098 ,053 ,493 ,624
Dependent Variable: Projects stay within budget limitsa.
Page 2

REGRESSION /MISSING LISTWISE /STATISTICS COEFF OUTS R ANOVA
/CRITERIA=PIN(.05) POUT(.10) /NOORIGIN
/DEPENDENT Stakeholders_expectations /METHOD=ENTER FAC1_1 FAC2_1 FAC3_1 FAC4_1 FAC5_1 FAC6_1.
Regression
Variables Entered/Removeda
ModelVariables Entered
Variables Removed Method
1 REGR factor score 6 for analysis 1, REGR factor score 5 for analysis 1, REGR factor score 4 for analysis 1, REGR factor score 3 for analysis 1, REGR factor score 2 for analysis 1, REGR factor score 1 for analysis 1b
. Enter
Dependent Variable: Project results meet stakeholders expectationsa.
All requested variables entered.b.
Model Summary
Model R R SquareAdjusted R
SquareStd. Error of the
Estimate1 ,556a ,309 ,234 ,684
Predictors: (Constant), REGR factor score 6 for analysis 1, REGR factor score 5 for analysis 1, REGR factor score 4 for analysis 1, REGR factor score 3 for analysis 1, REGR factor score 2 for analysis 1, REGR factor score 1 for analysis 1
a.
Page 1

ANOVAa
ModelSum of Squares df Mean Square F Sig.
1 RegressionResidualTotal
11,525 6 1,921 4,108 ,002b
25,717 55 ,46837,242 61
Dependent Variable: Project results meet stakeholders expectationsa.
Predictors: (Constant), REGR factor score 6 for analysis 1, REGR factor score 5 for analysis 1, REGR factor score 4 for analysis 1, REGR factor score 3 for analysis 1, REGR factor score 2 for analysis 1, REGR factor score 1 for analysis 1
b.
Coefficientsa
Model
Unstandardized CoefficientsStandardized Coefficients
t Sig.B Std. Error Beta1 (Constant)
REGR factor score 1 for analysis 1REGR factor score 2 for analysis 1REGR factor score 3 for analysis 1REGR factor score 4 for analysis 1REGR factor score 5 for analysis 1REGR factor score 6 for analysis 1
3,565 ,087 41,046 ,000
,328 ,088 ,420 3,745 ,000
,150 ,088 ,192 1,715 ,092
,140 ,088 ,179 1,598 ,116
-,096 ,088 -,123 -1,094 ,279
,174 ,088 ,222 1,983 ,052
-,003 ,088 -,004 -,032 ,975
Dependent Variable: Project results meet stakeholders expectationsa.
Page 2
Copyright © 2022 FDOKUMEN