ISSN 0973 - 3167 - SCMS Cochin School of Business
160
Volume XVIII Number -1 January - March 2021 Dr. Narinder Pal Singh, Dr. Bhupender Kumar Som, Dr. C. Komalavalli and Himanshu Goel Dr. Vaishali S. Dhingra and Dr. Pooja Patel Dr. Rupa Rathee and Ms. Renu Bhuntel Rajesh Desai Meru Das, Dr. Vivek Singh and Dr. Shashank Mehra Krishnasree Gogoi and Dr. Papori Baruah Dr. Deepa Mangala and Neha Singla Amal Jishnu H.M. and Dr. Hareendrakumar V.R. Dr. Chitra S. Nair Dr. Nisarg A Joshi and Mruga Joshi A Meta-Analysis of the Application of Artificial Neural Networks in Accounting and Finance An Empirical Analysis of BRICS Bond Market Integration A Study on Employee Perception about the Use of E-HRM in IT Organisations Working Capital Management as a Determinant of Financial Performance: Accounting vs Market- based Approach Employee Demography and Employee Engagement- An Empirical Study on IT Employees Goal Setting: Its Impact on Employee Outcome Earnings Management in Banking Industry: A Systematic Review of Literature The Impact of Extrinsic and Intrinsic Rewards on Employee Commitment in the Public Sector Manufacturing Companies in India Dialectics of Constructed Identities as Tools of Oppression – Concept of Reverse Metamorphosis as a factor Reinforcing Ageism Co-Integration and Causality Among Stock Market Indices: A Study of 35 Indices Across 5 Continents Estd. 1976 ISSN 0973 - 3167
-
Upload
khangminh22 -
Category
Documents
-
view
0 -
download
0
Transcript of ISSN 0973 - 3167 - SCMS Cochin School of Business

Volume XVIII Number -1 January - March 2021
Dr. Narinder Pal Singh, Dr. Bhupender Kumar Som, Dr. C. Komalavalli and Himanshu Goel
Dr. Vaishali S. Dhingra and Dr. Pooja Patel
Dr. Rupa Rathee and Ms. Renu Bhuntel
Rajesh Desai
Meru Das, Dr. Vivek Singh and Dr. Shashank Mehra
Krishnasree Gogoi and Dr. Papori Baruah
Dr. Deepa Mangala and Neha Singla
Amal Jishnu H.M. and Dr. Hareendrakumar V.R.
Dr. Chitra S. Nair
Dr. Nisarg A Joshi and Mruga Joshi
A Meta-Analysis of the Application of Artificial Neural Networks in Accounting and Finance
An Empirical Analysis of BRICS Bond Market Integration
A Study on Employee Perception about the Use of E-HRM in IT Organisations
Working Capital Management as a Determinant of Financial Performance: Accounting vs Market-based Approach
Employee Demography and Employee Engagement- An Empirical Study on IT Employees
Goal Setting: Its Impact on Employee Outcome
Earnings Management in Banking Industry: A Systematic Review of Literature
The Impact of Extrinsic and Intrinsic Rewards on Employee Commitment in the Public Sector Manufacturing Companies in India
Dialectics of Constructed Identities as Tools of Oppression – Concept of Reverse Metamorphosis as a factor Reinforcing Ageism
Co-Integration and Causality Among Stock Market Indices: A Study of 35 Indices Across 5 Continents
Estd. 1976
ISSN 0973 - 3167

January - March 2021, Vol. XVIII, Issue No. 1
5 A Meta-Analysis of the Application of Artificial Neural Networks in Accounting and FinanceDr. Narinder Pal Singh, Dr. Bhupender Kumar Som, Dr. C. Komalavalli and Himanshu Goel
22 An Empirical Analysis of BRICS Bond Market Integration Dr.Vaishali S. Dhingra and Dr. Pooja Patel
37 A Study on Employee Perception about the Use of E-HRM in IT OrganisationsDr. Rupa Rathee and Ms. Renu Bhuntel
48. Working Capital Management as a Determinant of Financial Performance: Accounting vs Market-based ApproachRajesh Desai
59. Employee Demography and Employee Engagement- An Empirical Study on IT EmployeesMeru Das, Dr. Vivek Singh and Dr. Shashank Mehra
75. Goal Setting: Its Impact on Employee OutcomeKrishnasree Gogoi and Dr. Papori Baruah
87. Earnings Management in Banking Industry: A Systematic Review of LiteratureDr. Deepa Mangala and Neha Singla
107. The Impact of Extrinsic and Intrinsic Rewards on Employee Commitment in the Public Sector Manufacturing Companies in IndiaAmal Jishnu H.M. and Dr. Hareendrakumar V.R.
122. Dialectics of Constructed Identities as Tools of Oppression – Concept of Reverse Metamorphosis as a factor Reinforcing AgeismDr. Chitra S. Nair
131. Co-Integration and Causality Among Stock Market Indices: A Study of 35 Indices Across 5 ContinentsDr. Nisarg A Joshi and Mruga Joshi

Chairman’s OverviewThe divide between human and machine is narrowing with every major advance in technology. On one side is Elon Musk's Neuralink developing neural laces to provide a common interface between human brains and digital technology, while on the other side, technologies such as artificial neural networks try to mimic human brain functioning in machine learning. Our lead article, this time about the applications of Artificial Neural Networks in accounting and finance, offers a fascinating glimpse into the literature published in this area and points out possible directions for future research.
As the world economy grapples with the long term effects of the pandemic induced slowdown, the second article in the issue offers empirically backed insights into risk mitigation strategies for investors. The authors investigate long- term and short- term BRICS Bond Market Integration through a variety of analytical tools and come up with some interesting findings and recommendations.
E-HRM and the factors that affect its implementation in IT companies is another study that is especially relevant to these times of increasing work from home culture. This issue also features a good mix of articles on subjects ranging from working capital management in the healthcare industry to earnings management in the banking industry. We have interesting perspectives on how employee demographics influence employee engagement, how goal setting is perceived by employees and the outcomes of such goal- setting, as well as how reward systems in public sector companies influence employee commitment. A qualitative study that explores identity construction and its effect on the subjective wellbeing and quality of life of aged women, as well as a comprehensive study on stock market integration across 35 indices in 5 continents, rounds out the collection of scholarly literature offered for your perusal.
I am confident that this issue will be truly informative and educative to our readers.
Dr. G. P. C. NAYARChairman, SCMS Group of Educational Institutions.

SCMS Journal of Indian ManagementA Quarterly Publication of
SCMS-COCHIN
Editors
Editor-in-Chief
Dr. G. P. C. NayarChairman
SCMS Group of Educational Institutions
Editorial Board
Dr. Subramanian SwamyPhD (Economics, Harvard University)
Formerly Union Cabinet Minister of Commerce, Law & Justice, Formerly Professor of Economics
IIT, Delhi & Department of Economics, Harvard University, USA
Dr. Jose Maria Cubillo-PinillaDirector of Marketing Management
ESIC Business and Marketing SchoolMadrid, Spain
Dr. Naoyuki Yoshino Professor of Economics
Keio UniversityTokyo, Japan
Dr. I.M. PandeyProfessor of Research
Delhi School of Business New Delhi
Dr. George SleebaJoint Mg. Director, V Guard
Industries Ltd., Kochi
Mr. Jiji Thomson IASFormerly Chief Secretary
Kerala
Dr. Azhar KazmiProfessor, King Fahd University
of Petroleum and MineralsDhahran, Saudi Arabia
Dr. Thomas Steger(Chair of Leadership and Organization)
Faculty of Business, Economics andManagement Indoraction System
University of RegensburgGermany
Dr. Mathew J. ManimalaFormerly Professor Indian Institute of
Management, Bangalore
Dr. Kishore G. Kulkarni Distinguished Professor of Economics and Editor
Indian Journal of Economics and BusinessDenver, US
Dr. Abhilash S. NairCo-ordinator
Management Development ProgramsIIM (K), Kochi Campus, Kerala
Editor
Dr. Radha ThevannoorRegistrar and Group Director
SCMS Group of Educational Institutions

Three months into 2021, as the new financial year is being ushered in, with the positive notes of large scale development and distribution of effective vaccines, it is finally possible to hope that normality will return with time, though the definition of what is normal will be changed forever. It is up to each individual and business to take on the challenge of embracing the new normal and making it one that is better and more humane.
Grappling with the crisis brought in by the pandemic has given business schools across the world a never-before opportunity- that of using real-time, real-world experiences that each individual is experiencing, as case studies, for teaching students’ crisis management principles. The world has, in effect, become a gigantic case study- one that is replete with takeaway lessons for anyone with a mind that is willing to think, question and learn from the life unfolding around them. Businesses are coming out of the worst of the pandemic with new lessons learnt and fresh insights on the possibilities of managing disruptions and emerging stronger.
In many ways, this change is for good. There has been an opportunity for introspection and for re-evaluating the accepted norms and procedures followed. Hybrid delivery of classes- with a combination of offline and online sessions, seems to be increasingly preferred. Students are encouraged to be increasingly self-reliant in their learning, and physical classes are used as a platform for discussing and putting into practice what they have learned. The shakedown should result in the academic world re-evaluating its course contents and assessing whether students are actually learning the skills that it takes to navigate a world of uncertainty. We are witnessing the birth of a new culture- one that is characterized by a questioning of how things have always been done, to one that is willing to embrace the ‘ifs’ and ‘buts’, and grow and become stronger with the challenges.
A Quarterly Journal
Editorial
Editorial Committee:
Prof. K. J. Paulose Dr. Praveena K.Praveen Madhavan
Associate Editor
Anju Varghese Philip
Asst. Editors : Dr. Mohan B.Sudheer Sudhakaran
Transformation through Disruption
Dr. Radha Thevannoor
SCMS Journal of Indian Management, January- March 2021

A Quarterly Journal
5
Abstract
Artificial Neural Networks (ANNs) have emerged as a robust technique of forecasting and prediction in
almost every part of the business. This study explores the development of ANNs over a period of time and
provides an extensive and exhaustive literature review on the applications of ANN in various fields of
accounting and finance, such as stock market prediction, bankruptcy, and many others. The findings of the
study support the superiority of the ANN model over conventional statistical techniques in prediction,
such as Linear Discriminant Analysis (LDA), Logit Model, etc. However, determining the optimal
architecture of an ANN model is a time consuming and difficult process. The novelty of this study lies in
the fact that there is a dearth of literature on applications of ANNs in some sub-areas of accounting and
finance, namely time series forecasting, specifically in foreign exchange and commodity markets. Thus,
ANN application can be explored in these sub-areas of accounting and finance.
Keywords: Neural Networks (NNs), Artificial Neural Networks, Meta-Analysis, Bankruptcy, Stock Market Prediction.
Himanshu GoelAssistant Professor
Lloyd Business School, Greater NoidaEmail: [email protected]
A Meta-Analysis of the Application of Artificial
Neural Networks in Accounting and Finance
Dr. Narinder Pal Singh Associate Professor,
Jagan Institute of Management StudiesEmail: [email protected]
Dr. Bhupender Kumar SomProfessor & Director,
Lloyd Business SchoolEmail: [email protected]
Dr. C. KomalavalliProfessor
Jagan Institute of Management StudiesEmail: [email protected]
SCMS Journal of Indian Management, January- March 2021

6
A Quarterly Journal
1. Introduction
“Artificial Neural Network is a system of hardware and software patterned after the operation of neurons in the human brain. It builds a relationship in the form of data through a process that mimics the way a human brain operates.” Artificial Neural Networks are dynamic in nature as they can adapt to changes in output so that they provide the best possible result without changing the input nodes. ANNs have shown huge potential in the field of finance where they are used for various purposes to enhance the productivity of the business in the global arena. ANN follows a series of algorithms that helps in finding the underlying relationship between the output and input variables. ANN consists of several neurons or nodes that are operated in parallel and arranged in layers or tiers. The layers are highly connected as each node from the tier N is connected to subsequent tiers N+1. The first layer receives raw input and transfers it to the preceding layer to generate the desired output, and the middle layer is called the hidden layer, which is responsible for connecting the first layer, i.e., the input layer and the last layer called the output layer. However, the number of nodes and layers depends on the desired accuracy to be achieved and also the complexity of the problem. Also, there can be a series of nodes in the output layer which forms an image in the readable format. In ANN, each node carries a weight that entirely depends on values that contribute to getting the correct answers. In other words, nodes that contribute to getting the desired results are awarded higher weights in comparison to nodes that don’t. Initially, nodes are flooded with huge chunks of data and output is told to the network in advance. With advantages also come drawbacks and ANN is the one that is unaffected by this curse as the assumptions people make that causes bias during training has evolved as the biggest threat for the practitioners. If the data feeding is not neutral – the machine propagates bias.
Many scientists, practitioners and academicians have developed models based on ANNs in the past. The first computational model of Artificial Neural Networks, popularly called threshold logic which was based on mathematics and algorithms, was developed by Warren McCulloch and Walter Pitts in 1943. It splits the ANNs research into two approaches. The first approach was related to the biological process in the human brain, and the second approach was related to the application of ANNs. Later, Minsky and Papert (1969) discovered two critical issues with the Artificial Neural Network technique. The first one
was the ability of the machine to solve complex problems, and the second was the incapability of the computers to run large ANN models efficiently. This brought a slowdown in research on ANNs till the machines got fast processing circuit boards.
Due to its ability to learn and model non-linear relationships, its usage has gained popularity in different fields of business. They also allow users to build a strong and reliable model that can help in predicting future events. Nowadays, it is being used to check the reliability of a business plan, recognition of human faces, speech, characters and so on. Also, it is widely used in various areas of finance such as prediction of stocks, evaluation of loan application, analyzing the credit- worthiness of customers and many more. However, there is a dearth of review articles that combines the various applications of the ANN model in accounting and finance. Moreover, the authors believe that there is a great demand for comprehensive review articles that combine the various methods and current studies. Therefore, this study analyzes the various applications of the ANN model in different fields of accounting and finance.
This paper presents a review of articles comparing numerous models of ANN and conventional statistical techniques. Section 1 represents the introduction of the study, and section 2 consists of relevant literature in different areas of accounting and finance. The results of the study have been presented and summarized in section 3; section 4 deals with the future scope for research, and the last section deals with the conclusion part of the study discussing certain issues pertaining to ANN models.
2. A Review of Literature
Over the past few years, the usage of ANN has gained popularity due to its distinct ability to detect the underlying relationship between different sets of data. However, there are various factors that determine the accuracy of ANNs, which include the choice of input variables, architecture selected for a specified problem, training pattern of ANNs, etc. Thus, it becomes significantly important to study these factors before building an Artificial Neural Network. Also, various studies conclude that ANNs have provided a better statistical technique in forecasting when compared with other conventional prediction models. However, some studies also reveal that traditional statistical tools have outperformed ANNs in forecasting. Thus, it becomes important to identify the key areas where ANNs have shown good potential. This section provides a brief overview of applications of ANN in various areas of accounting and
SCMS Journal of Indian Management, January-March - 2021

finance, namely bankruptcy prediction, stock market prediction and other applications.
2.1. Bankruptcy Prediction
Much of the research has been done on bankruptcy prediction as detection of accounting frauds, and bankruptcy is an important measure to evaluate a firm’s performance. In the study of Odom et al. (1990), an analysis was performed on ratios using both discriminant and artificial neural network techniques. The authors have used the predictive abilities of both the models and the results show that neural networks might apply to this problem. Salchenberger et al. (1992) made a comparative analysis between a logit and ANN model, and to reduce the dimensionality of the model; the authors employed stepwise regression on twenty-nine variables resulting in five significant variables. The findings of the study reveal the ANN model has outperformed the logit model in terms of forecasting bankruptcy. Furthermore, the authors reported a reduction in type I and an increase in Type II error.
Tam and Kiang (1992) introduced a neural network approach to perform Linear Discriminant Analysis (LDA). They compared the performance of the ANN technique with linear classifier, logistic regression, k-Nearest Neighbour and ID3. The results show that ANN is a promising technique having the ability to outperform other traditional statistical models, especially in evaluating bank conditions. However, there are certain limitations too that includes limited interpretation ability of weights and computation time etc. The authors have also quoted that it is necessary to test the on-line capabilities before the full potential of ANNs is asserted.
One year later, Fletcher and Goss (1993) stated that ANN provides a better and accurate view of the given data. The author has used two methods to ascertain the firm’s performance and stated that ANNs are more statistically accurate and viable than logit function as it has less variance and lowers forecasting risk as determined by the coefficient of variation. However, both methods failed to predict the performance of the firms implying the presence of missing explanatory variables in the model. After one year, Wilson and Sharda (1994) explained that the ANNs are better at forecasting the bankruptcy of firms in comparison to the traditional discriminant model. The author used five
7SCMS Journal of Indian Management, January-March - 2021
A Quarterly Journal
variables and achieved 97% accuracy. The study argued that the number of variables has a direct relation with the accuracy of NNs, i.e. larger the number of variables higher will be the accuracy. However, NNs failed to predict correctly in the case of non-bankrupt firms due to limitations in the data set, methodology, and training. Still, when NNs were provided with balanced data sets, they outperformed discriminant analysis in forecasting non-bankrupt firms.
Later, in the same year, Fanning and Cogger (1994) determined two basic interpretations, ANNs should be viewed as a potential competitor, especially in the area of predicting financial distress of the firms and- ANNs can outperform other existing models that can be used in prediction. ANNs can be capitalized in the arena of forecasting as they are capable of exploring the underlying relationship between different data sets. The authors quoted that NNs have good potential that can be used in several other areas of business. Yang et al. (1999) examined four different methods to predict bankruptcy using financial ratios of the U.S. oil industry. Fisher Discriminant Analysis, back-propagation NN and probabilistic NN with and without patterns were used to determine the bankruptcy of firms, particularly in the oil industry, using deflated and non-deflated data. The authors quoted that the back-propagation NN model managed to achieve the highest accuracy using non-deflated data and the possible reason inferred was it predicted non-bankruptcy only. Another important finding of the study was that the discriminant analysis technique obtained the best results when using deflated data sets in both bankrupt and non-bankrupt firms.
Further, Zhang et al. (1999) explained that ANN techniques are superior to traditional statistical methods of prediction. In his study, the authors used the ANN technique to predict the bankruptcy of firms and also quoted that a better understanding of causes can substantially impact the financial and managerial decision-making process. The findings of the study reveal that ANN is the only known model that makes use of posterior probability to determine the underlying relationship of the unknown population. The study used a cross-validation technique to verify the robustness of neural classifiers, and the results reveal that ANNs are quite robust. The study also compared logistic regression with the ANN technique for classification purpose, and the results were very encouraging as ANNs were significantly superior to logistic regression in

8SCMS Journal of Indian Management, January-March - 2021
A Quarterly Journal
determining the classification rate of the unknown population.
Charalambous et al. (2000) proved that ANNs show superior results in comparison to traditional methods of prediction in the current scenario. However, the author also argued that the reliability of the model majorly depends on the complexity of the problem and variables used, but researchers can apply the ANNs to their problems to find whether they indeed provide better results than commonly used statistical methods or not. Atiya (2001) explained that ANNs are better techniques, especially in predicting stock prices. However, the author also said that improvements must be made by way of better training methods, inputs, and architecture. The study showed this by improving the inputs resulting in improved performance of ANNs. Two years later, Lin et al. (2003) stated that Fuzzy Neural Networks (FNNs) outperformed other statistical models, and the performance of FNNs was compared with the logit model using fraudulent and non-fraudulent firm’s data set. Both models have proved their potential in classifying non-fraud cases that will, in turn, enhance the validity and efficiency of the audit. However, the authors also quote that the Logit model was slightly better in forecasting non-fraud cases, and at the same time, FNN was substantially better than the Logit model in predicting fraud cases. Overall, when compared with other conventional statistical methods of forecasting, FNN was better in assessing the risk associated with the fraudulent firms. The study also recommends the auditors to implement these techniques as they offer the great potential that can enhance the effectiveness and efficiency of the audit.
West et al. (2005) explained ensemble ANNs are better predictors than “Single best” multilayer perceptron models, and this fact was supported by examples of three real-world financial data sets where generalization error was reduced by 3-4%, which is a significant reduction statistically. The author evaluated bagging and boosting strategies on the same data set and found bagging was more effective than boosting with the fewest number of variables and least noise. Later, Alfaro et al. (2008) compared two classification methods and showed improvement in accuracy that AdaBoost achieved against ANNs. The authors used these technologies to ascertain the corporate bankruptcy using financial ratios, and the results of the study indicate that the AdaBoost algorithm outperformed
the ANN technique both in the cross-validation and test set estimation in the classification error because AdaBoost makes use of a modified version of the training set to build consecutive classifiers. Also, the authors used accounting-based variables, the size of the firm, the industry and the organizational structure as inputs to evaluate the financial performance of the firm.
Celik and Karatape (2007) examined the performance of ANN in forecasting banking crises. The authors indicated by using a 25 input neurons ANN model that ANN is capable of forecasting banking crises, and ANN can be used for developing effective policies for the banking sector. Kim and Kang (2010) proposed an ensemble neural network for enhancing the performance of conventional ANN models for predicting bankruptcy. The results of the study indicate that the bagged and boosted ANN is a better predictor than traditional ANN models. Particularly, bagged ANN produced better accuracy than other classifiers. Also, the authors recommended more algorithms for future research. Rafiei et al. (2011) made the comparison of ANN, GA, and MDA for bankruptcy prediction. The results of the study indicate that the ANN is better than the other two models. However, the Genetic Algorithm has also evolved as a powerful technique of prediction. Olson et al. (2012) compared the forecasting ability of decision tree algorithms, artificial neural networks and support vector machines. The results of the study indicate that decision trees are more powerful predictors than ANN and SVM. Also, the authors indicate there were more rule modes than desired.
Lee and Choi (2013) analyzed the performance of ANN and MDA for a “multi-industry bankruptcy prediction model”. The results indicate an ANN model outperformed the traditional MDA technique. Also, the authors quote the results will partially overcome the limitations of ANNs. Bredart (2014) developed a model to predict the bankruptcy of small and medium enterprises by using three financial ratios that are easily available and achieved 80 percent accuracy. Iturriaga and Sanz (2015) proposed a model based on ANNs to predict the bankruptcy of U.S. banks. The authors took into consideration some specific features of the financial crisis of 2014. Also, they combined multilayer perceptrons and self-organizing maps that can access the insolvency up to three years before bankruptcy occurs. The results reveal the proposed model to be more accurate due to the following reasons. First, the developed model has

9SCMS Journal of Indian Management, January-March - 2021
A Quarterly Journal
outperformed other statistical tools. Second, it provides a better visualization of the complex structures. Third, it is simpler than other models proposed in the previous studies. However, the authors have also explained certain limitations that limit its usage.
Duan (2019) quoted that NNs can outperform traditional statistical tools. The author used Multi-Layer Perceptron (MLP) consisting of three hidden layers trained by the back-propagation algorithm to predict loan default. The study classifies the loan application into three categories: safe loan, risky loan and bad loan. The results of the study reveal that the accuracy level of MLP was much better than the conventional logistic model and the commonly used MLP with one hidden layer.
2.2. Stock Market Prediction
During the past few decades, a precise prediction of the stock price has become a significant issue. Thus, ANN models are used extensively to predict stock price movement more precisely and accurately. Yoon et al. (1991) quoted that the precise forecasting of a stock price is a difficult and complex preposition. The findings revealed that artificial neural networks are capable of learning a function that maps input to output and encoding it in the magnitudes of the weights in the network’s connection. The number of hidden layers employed in the model contributed to achieving a certain amount of viability. Also, the increase in the number of hidden units resulted in higher performance. However, additional hidden units beyond the point impaired the model’s predictive performance. Furthermore, the results of the comparison reveal a superior performance of the ANN model than the MDA approach.
Chen et al. (2001) proposed that Probability Neural Networks (PNNs) have shown great potential in forecasting stock price movement as compared to the GMM-Kalman filter and the random walk model. The results of the study reveal that PNN guided trading strategies have obtained higher returns in comparison to strategies suggested by other models. The authors also recommend that Probability Neural Networks (PNNs) capability can be increased by including the threshold levels. Three years later, Cao et al. (2004) explained the superiority that ANNs have established over a period of time in predicting stock prices. ANNs indeed do provide an opportunity for the investors to
enhance their predictive ability that can, in turn, increase profitability. The findings of the study also suggest that the univariate model has shown more potential than multivariate models in predicting stock prices and also recommends using macroeconomic variables like volume; economic indicators can significantly enhance the accuracy estimates of NNs.
Kim and Lee (2004) proposed a genetically transformed ANN for stock market prediction. The results reveal that the proposed methodology is significantly better than the models considered for comparison in this study. Zhang and Wu (2009) proposed an integrated model consisting of IBCO and BPNN for the prediction of various stock indices. The authors used the IBCO algorithm to adjust the weights of the BPNN network and achieved better results than the traditional BPNN model. Further, Hadavandi et al. (2010) proposed a novel methodology based on the Genetic Fuzzy System and SOM Clustering for predicting stock price. In their study, the authors used the three-stage method to model the proposed structure. In the first stage, they used stepwise regression to choose significant variables, then in the second stage, they categorized the data into k clusters by SOM method, and in the last stage, they fed the clusters into a genetic fuzzy network to build the proposed model and validated the results using real-life datasets. In the end, the authors concluded that the proposed method outperforms all other models held for comparison. One year later, Guresen et al. (2011) compared simple MLP, DAN2 and Hybrid models that used GARCH to define input variables and reported that simple MLP outperforms the other two models in predicting NASDAQ stock exchange prices and recommended focusing on improving the architecture of DAN2 and hybrid models to improve accuracy measures.
Kara et al. (2011) analyzed the performances of ANN and Support Vector Machines (SVM) to predict the stock price movement. The results of the study clearly reveal the potential of the ANN model in determining the stock price movement in comparison to SVM with an average accuracy of 75.74%. Ticknor (2013) introduced a novel technique that combined the Bayesian regularization and ANN for predicting stock prices. The results of the study reveal the proposed methodology solves the problem of overfitting and local minima than commonly used ANNs. Later, Qiu et al. (2016) examined the NN approach to predict the return on
10SCMS Journal of Indian Management, January-March - 2021
A Quarterly Journal
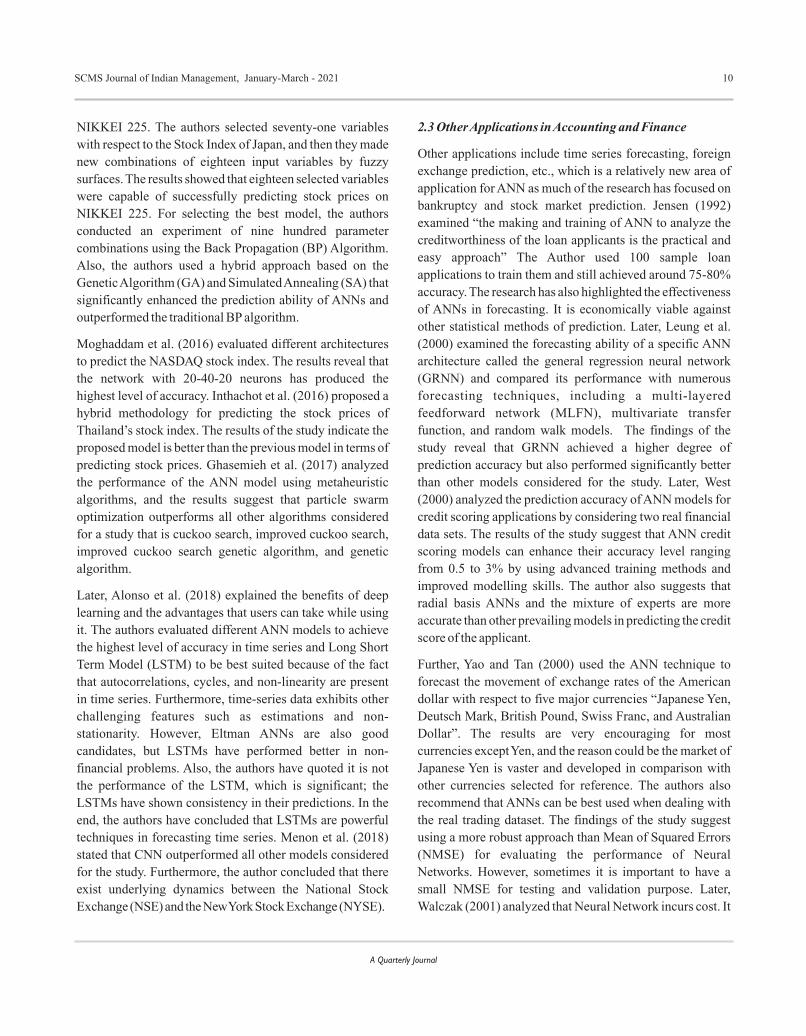
NIKKEI 225. The authors selected seventy-one variables with respect to the Stock Index of Japan, and then they made new combinations of eighteen input variables by fuzzy surfaces. The results showed that eighteen selected variables were capable of successfully predicting stock prices on NIKKEI 225. For selecting the best model, the authors conducted an experiment of nine hundred parameter combinations using the Back Propagation (BP) Algorithm. Also, the authors used a hybrid approach based on the Genetic Algorithm (GA) and Simulated Annealing (SA) that significantly enhanced the prediction ability of ANNs and outperformed the traditional BP algorithm.
Moghaddam et al. (2016) evaluated different architectures to predict the NASDAQ stock index. The results reveal that the network with 20-40-20 neurons has produced the highest level of accuracy. Inthachot et al. (2016) proposed a hybrid methodology for predicting the stock prices of Thailand’s stock index. The results of the study indicate the proposed model is better than the previous model in terms of predicting stock prices. Ghasemieh et al. (2017) analyzed the performance of the ANN model using metaheuristic algorithms, and the results suggest that particle swarm optimization outperforms all other algorithms considered for a study that is cuckoo search, improved cuckoo search, improved cuckoo search genetic algorithm, and genetic algorithm.
Later, Alonso et al. (2018) explained the benefits of deep learning and the advantages that users can take while using it. The authors evaluated different ANN models to achieve the highest level of accuracy in time series and Long Short Term Model (LSTM) to be best suited because of the fact that autocorrelations, cycles, and non-linearity are present in time series. Furthermore, time-series data exhibits other challenging features such as estimations and non-stationarity. However, Eltman ANNs are also good candidates, but LSTMs have performed better in non-financial problems. Also, the authors have quoted it is not the performance of the LSTM, which is significant; the LSTMs have shown consistency in their predictions. In the end, the authors have concluded that LSTMs are powerful techniques in forecasting time series. Menon et al. (2018) stated that CNN outperformed all other models considered for the study. Furthermore, the author concluded that there exist underlying dynamics between the National Stock Exchange (NSE) and the New York Stock Exchange (NYSE).
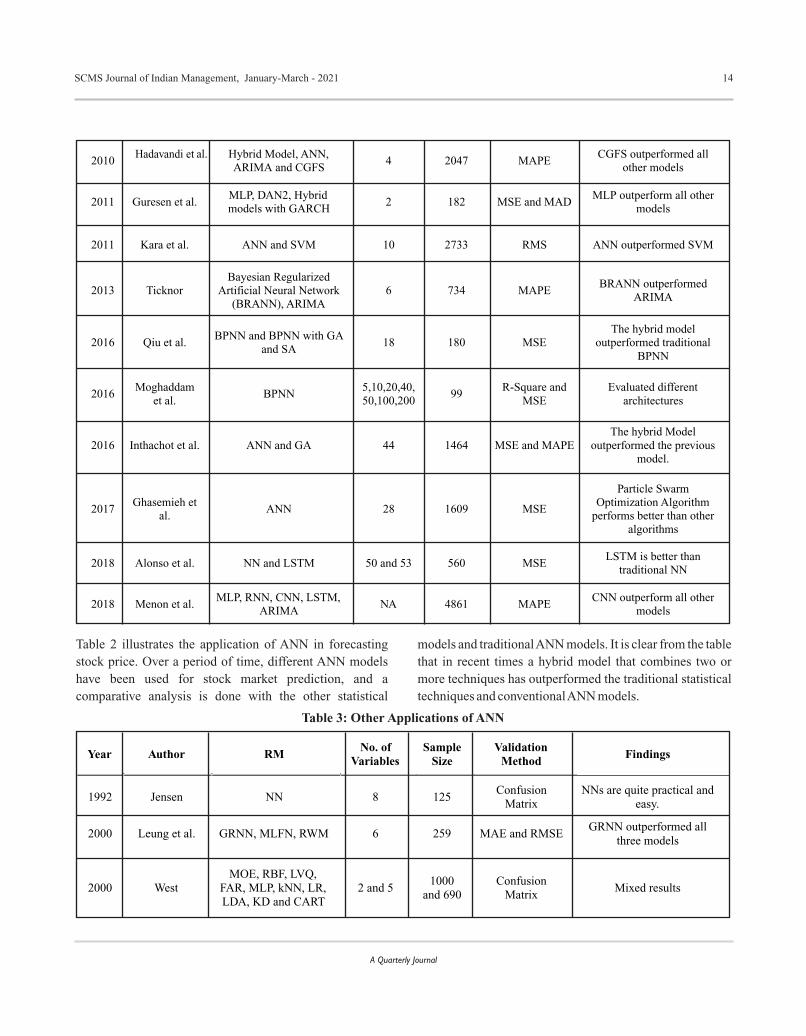
2.3 Other Applications in Accounting and Finance
Other applications include time series forecasting, foreign exchange prediction, etc., which is a relatively new area of application for ANN as much of the research has focused on bankruptcy and stock market prediction. Jensen (1992) examined “the making and training of ANN to analyze the creditworthiness of the loan applicants is the practical and easy approach” The Author used 100 sample loan applications to train them and still achieved around 75-80% accuracy. The research has also highlighted the effectiveness of ANNs in forecasting. It is economically viable against other statistical methods of prediction. Later, Leung et al. (2000) examined the forecasting ability of a specific ANN architecture called the general regression neural network (GRNN) and compared its performance with numerous forecasting techniques, including a multi-layered feedforward network (MLFN), multivariate transfer function, and random walk models. The findings of the study reveal that GRNN achieved a higher degree of prediction accuracy but also performed significantly better than other models considered for the study. Later, West (2000) analyzed the prediction accuracy of ANN models for credit scoring applications by considering two real financial data sets. The results of the study suggest that ANN credit scoring models can enhance their accuracy level ranging from 0.5 to 3% by using advanced training methods and improved modelling skills. The author also suggests that radial basis ANNs and the mixture of experts are more accurate than other prevailing models in predicting the credit score of the applicant.
Further, Yao and Tan (2000) used the ANN technique to forecast the movement of exchange rates of the American dollar with respect to five major currencies “Japanese Yen, Deutsch Mark, British Pound, Swiss Franc, and Australian Dollar”. The results are very encouraging for most currencies except Yen, and the reason could be the market of Japanese Yen is vaster and developed in comparison with other currencies selected for reference. The authors also recommend that ANNs can be best used when dealing with the real trading dataset. The findings of the study suggest using a more robust approach than Mean of Squared Errors (NMSE) for evaluating the performance of Neural Networks. However, sometimes it is important to have a small NMSE for testing and validation purpose. Later, Walczak (2001) analyzed that Neural Network incurs cost. It

11SCMS Journal of Indian Management, January-March - 2021
A Quarterly Journal
can be in the form of money, time and effort. During his study, the author focused on training ANNs and argued that typically a Neural Network takes around 1 to 2 years to produce the best results through the back-propagation algorithm.
One year later, Nag and Mitra (2002) explained that ANNs had proved superiority over traditional statistical models in forecasting exchange rates in the past few decades. However, researchers argue that there is no theory available on the model building process as it depends on the decision of the model builder to choose an optimal number of hidden layers and a number of neurons in hidden and input layers to find the best solution. Therefore, the authors used a genetic algorithm optimization technique to overcome the shortcomings of traditional ANN models. The findings of the study revealed the potential of the proposed approach over conventional ANNs in forecasting foreign exchange rates. The researchers also quote that the proposed model is best suited to find the optimal topology of NNs, and further Malhotra and Malhotra (2003) compared the performance of Multiple Discriminant Analysis (MDA) and Artificial Neural Network in identifying potential loans. The findings of the study show that the ANN techniques consistently perform better than the MDA models in identifying potential loans and alleviating the problem of bias in the training set, and to examine the robustness of the model in identifying bad loans, the authors cross-validate the results through seven different samples of the data. In the same year, Zhang (2003) used a hybrid methodology consisting of ARIMA for linear modelling and ANN for non-linear modelling. The author concludes that the proposed hybrid methodology is significantly better than the traditional ANN model. Also, the authors validated the results by considering real-life data sets.
Later, Kumar and Bhattacharya (2006) stated ANNs outperformed Linear Discriminant Analysis (LDA) in both training and tests partition as they are capable of handling complex data sets and can be even employed to unseen data as it has the potential to determine the underlying relationship between the target and input variables. However, the author employed both techniques to check the credit score of companies by using financial statements and found NNs achieved a 79% accuracy level and the LDA technique achieved a 60% accuracy level which is very low
statistically. Also, the findings of the study suggest carefully choosing the variables after addressing the problem of multicollinearity in order to enhance the validity and reliability of the model. Weizhong (2012) proposed an automatic ANN modelling scheme that made use of a special type of network called GRNN. The author introduced several design parameters to automate the process of modelling ANN for time series forecasting. In the end, the results of the study conclude that GRNNs are robust and potentially good candidates for the automatic ANN modelling process.
Later, Wang et al. (2015) proposed the ADE-BPNN model to enhance the prediction accuracy of traditional BPNN. In their study, the authors concluded that ADE-BPNN outperforms conventional BPNN and statistical tools such as ARIMA in time series forecasting. Also, the authors validated the results by using two real-life cases. Khandelwal et al. (2015) proposed a novel methodology for time series forecasting that combines the unique features of Discrete Wavelet Transform (DWT), ARIMA and ANN. The results of the study were compared with Zhang’s hybrid model and found to be significantly better. Parot et al. (2019) analyzed the performance of the hybrid model to forecast EUR/USD returns. The results of the model indicate that the proposed methodology is better than the traditional and classical forecasting models. Also, the authors recommend that post-processing is significant for increasing forecasting accuracy. Cao et al. (2019) introduced a novel methodology by combining the CEEDMAN and LSTM neural networks, and the results of the study indicate that the proposed method is better than other models used for comparison. Also, the authors say the proposed model can also be used for predicting other time series such as traffic and weather.
3. Findings
This paper presents a review of the application of ANN models in accounting and finance. The authors have reviewed 50 papers that have used ANN and other models to forecast in various areas of accounting and finance, namely bankruptcy prediction, stock market prediction and other applications such as time series forecasting, etc. An attempt is made to look at the literature more critically with respect to various criteria such as the number of variables, sample size chosen for the study, error measure, the model used in the study and the findings.

12SCMS Journal of Indian Management, January-March - 2021
A Quarterly Journal
The articles discussed in the survey are summarized in tables 1-3. Each table provides a summary of each area in accounting and finance in order bankruptcy prediction, stock market prediction and other applications in accounting and finance. Each table consists of seven columns. Column 1 represents the year in which the study
was conducted, column 2 represents the names of the authors, column 3 illustrates the models used for the study, column 4 shows the number of variables, column 5 represents the sample size selected for the study, column 6 gives the error measure, and column 7 represents the findings of the respective studies.
Year Author RM No. of
Variables
Sample
Size
Error
Measure
Findings
1990
Odom and Sharda
NN and MDA
5
129
Confusion
Matrix
NNs are better than MDA
1992
Salchenberger et al.
BPNN and LM
29
3479
Confusion
Matrix
NNs outperformed Logit Model
1992
Tam and Kiang
NN, Linear Classifier, kNN,
ID3 and LR 19, LR-14
236
Confusion
Matrix
NN outperforms all three other statistical techniques
1993
Fletcher and Goss
BPNN and LM
3
36
Confusion Matrix, MSE
NN are better predictors than LM
1994
Wilson and Sharda
NN and MDA
5
129
Confusion Matrix
NN outperformed MDA
1994
Fanning and Cogger GANNA, BPNN
and LR 3
230
Confusion Matrix
GANNA outperformed the other two models
1999
Yang et al. BPNN,
PNN, FDA
and MDA 5
122
Confusion Matrix
PNN is better than the other three models
Table1: Applications of ANN in Bankruptcy Prediction
1999
Zhang et al.
NN and LR
6
220 Confusion
Matrix NN outperforms LR
2000 Charamlambous
et
al. LVQ,
RBF and
FFNN 7
139
Confusion Matrix
LVQ is better than the other two models
2001
Atiya
NN
5 and 6
911 Confusion
Matrix Proposed novel Indicators to
improve performance of NNs
2003
Lin et al.
FNN and Logit
8
200
Confusion Matrix
Mixed Results
2005 West et al. MLP, Cross -validation,
Boosting, Bagging 24, 5 1000,
329 Confusion
Matrix Ensembles are better than single
best MLP
2007 Celik and Karatape ANN 25 350 RMS ANN performs reasonably well.

13SCMS Journal of Indian Management, January-March - 2021
A Quarterly Journal
2008 Alfaro et al. AdaBoost and NNs 16 590 Confusion
Matrix AdaBoost outperforms NNs
2010 Kim and Kang NN, Bagged NN, Boosted NN 32 1458 Type I and
Type II Bagged and Boosted NN is better
than traditional NN.
2011 Rafiei et al. ANN, GA and
MDA 17 180
Confusion Matrix
ANN outperforms other models
2012 Olson et al. Decision Tree,
MLP, RBF, BPNN and SVM
18 1321 NA Decision trees outperformed neural
networks and SVM
2013
Lee and Choi
BPNN and MDA
46,40 and 58
6767 t-test
BPNN outperforms MDA
2014
Bredart
NN
3
3728
Confusion Matrix
NN achieves 80% accuracy
2015
Iturriaga and Sanz
MLP and SOM
32
386
ROC
The proposed model is better than other statistical techniques
2019 Duan MLP and LM 28 887383MSE,
Confusion Matrix
MLP outperforms LM
Table 1 illustrates the application of ANN models in bankruptcy prediction. In most of the cases, the ANN model outperformed the other statistical models except for two. Olson et al. (2012) showed that decision tree algorithms are better predictors than ANN models and Alfaro et al. (2008)
showed the Adaboost algorithm is better than an artificial neural network. However, there are studies that compare the different kinds of ANN models. Also, it is clear from the table that the majority of the studies have used the confusion matrix as the most common error measure.
Table 2: Applications of ANN in Stock Market Prediction
Year
Author
RM
No. of Variables
Sample Size
Validation Method
Findings
1991Yoon and
Swales NN and MDA 9 58
Confusion Matrix
NNs are better than MDA
2003
Chen et al.
PNN, RWM and GMM-kalman filter
4 and 6
128
Confusion Matrix
PNN outperformed the other two models
2004
Cao et al.
ANN and Fama and French's Model
1 and 3
367
MAD, MAPE, SD, MSE
ANN is better than other
statistical models
2004
Kim and Lee
Fuzzy Transformation Model, Genetic
Transformation Model, Linear Transformation
Model
12
2348
Confusion
Matrix
GTM outperform all other
models
2009
Zhang and Wu
IBCO-BPNN and BPNN
1
2350
MSE
IBCO-BPNN outperformed BPNN
14SCMS Journal of Indian Management, January-March - 2021
A Quarterly Journal
2010Hadavandi et al.
Hybrid Model, ANN,ARIMA and CGFS
4 2047 MAPECGFS outperformed all
other models
2011
Guresen et al.
MLP, DAN2, Hybrid models with GARCH
2
182
MSE and MAD
MLP outperform all other
models
2011
Kara et al.
ANN and SVM
10
2733
RMS
ANN outperformed SVM
2013
Ticknor
Bayesian Regularized Artificial Neural Network
(BRANN), ARIMA
6
734
MAPE
BRANN outperformed
ARIMA
2016
Qiu et al.
BPNN and BPNN with GA
and SA
18
180
MSE
The hybrid model outperformed traditional
BPNN
2016
Moghaddam et al.
BPNN
5,10,20,40, 50,100,200
99
R-Square and
MSE Evaluated different
architectures
2016
Inthachot et al.
ANN and GA
44
1464
MSE and MAPE The hybrid Model
outperformed the previous model.
2017 Ghasemieh et
al. ANN
28
1609
MSE
Particle Swarm
Optimization Algorithm performs better than other
algorithms
2018 Alonso et al. NN and LSTM 50 and 53 560 MSELSTM is better than
traditional NN
2018
Menon et al.
MLP, RNN, CNN, LSTM, ARIMA
NA
4861
MAPE
CNN outperform all other models
Table 2 illustrates the application of ANN in forecasting stock price. Over a period of time, different ANN models have been used for stock market prediction, and a comparative analysis is done with the other statistical
models and traditional ANN models. It is clear from the table that in recent times a hybrid model that combines two or more techniques has outperformed the traditional statistical techniques and conventional ANN models.
Year Author RM No. of
Variables
Sample Size
Validation Method
Findings
1992
Jensen
NN
8
125
Confusion Matrix
NNs are quite practical and easy.
2000
Leung et al.
GRNN, MLFN, RWM
6
259
MAE and RMSE
GRNN outperformed all three models
2000
West
MOE, RBF, LVQ, FAR, MLP, kNN, LR, LDA, KD and CART
2 and 5
1000 and 690
Confusion Matrix
Mixed results
Table 3: Other Applications of ANN

15SCMS Journal of Indian Management, January-March - 2021
A Quarterly Journal
2000
Yao and Tan
NN and ARIMA
5 and 6
510
NMSE
NN outperformed ARIMA
2001
Wakczak
BPNN
2 and 3
125
Confusion Matrix
BPNN incurs cost
2002
Nag and Mitra
GANN, FGNN, ARCH, GARCH,
EGARCH, AGARCH
NA
250
AAE, MAPE, Max AE, RSQ,
MSE
GANN is better than other models
2003
Malhotra and Malhotra
MDA and NNs
6
1078
Confusion Matrix
NN outperformed MDA
2003
Zhang
NN and Hybrid Model
4
1133
MAD and MSE
Hybrid model outperformed NNs
2006
Kumar and Bhattacharya
LDA and ANN
25 and 8
129
Confusion Matrix
ANN is better than LDA
2012
Weizhong
GRNN
12
111
sMAPE
GRNNs performed well
2015
Wang et al.
BPNN and ADE-BPNN
12
168
RMSE, MAPE, MSE
ADE-BPNN outperforms BPNN
2015 Khandelwal et
al.
DWT, ARIMA, ANN and Zhang's Hyrbid
Model
4 1133 MSE and MAPE
Proposed model outperformed all other
techniques
2019
Parot et al.
ANN, VAR, VECM
20
4242
RMSE, MAE, MAPE
Proposed model is better than classical models
2019
Li et al.
CEEDMAN, LSTM, SVM and MLP
9951
128
MAE, RMSE and MAPE
The Proposed model is better than other models

16SCMS Journal of Indian Management, January-March - 2021
A Quarterly Journal
Table 4 illustrates the error measures used in the studies to compare the performance of different techniques. Confusion matrix has been used most frequently, followed by MSE/RMSE/NMSE.
4. Future Scope and Limitations
The present study has further scope for more comprehensive results. It can be explored in other areas of accounting and finance as there is a dearth of literature on applications of ANNs in other areas of accounting and finance such as time series forecasting, foreign exchange rate prediction and commodity market prediction. Furthermore, a comparative analysis can be done by comparing the forecasting accuracy of traditional ANN models and the hybrid models that combines two or more techniques. Also, the current study can be performed using different techniques such as the PRIMA method, bibliometric analysis, systematic analysis, etc.
Though ANN models find applications in a wide spectrum of areas like geo-engineering, marketing, operations etc., but the scope of this study is limited to applications of ANNs in the finance and accounting domain. Another limitation of this study is that it reviews research articles published over
the last three decades. Despite this limitation, the present study covers the entire gamut of applications of ANNs in accounting and finance.
5. Conclusion
In this study, we have carried out a comprehensive literature review on the evolution of artificial neural networks over a period of time and the application of ANN models in various domains of accounting and finance. Since artificial neural networks have gained popularity over the last three decades due to which they have been applied to different domains. The review clearly points out the superiority of artificial neural networks over the conventional statistical models for classification and prediction problems. However, there have been studies where traditional statistical models outperformed the artificial neural network technique. One of the biggest advantages of this technique is it can model any non-linear function. This aspect is particularly useful where the relationship between the variables is unknown, as in the case of prediction of stock prices. However, the determination of various parameters like the number of hidden layers, number of nodes within the layers, the number of input variables is not straight forward and finding the optimal architecture is a time-consuming process.
Another disadvantage highlighted in most of the studies is the lack of interpretability of the weights obtained during the model building process. In this respect, the traditional statistical model stands out as they offer an interpretation of variables, and inferences can be drawn based on these variables. Further, most of the studies have compared the neural network with other statistical models such as logistic regression, linear discriminant analysis and artificial found neural networks to be more effective as they were capable of handling non-linear datasets and establish a relationship between them more precisely. This is particularly so because the performance of these conventional statistical models depends on the validity of the assumptions, which is not considered in the majority of the studies. Also, in most of the articles, the architecture of artificial neural networks is selected by trying out various models on the training data set, which is not done in the case of traditional statistical techniques. Furthermore, various studies have combined the artificial neural network technique with other statistical models and algorithms to enhance the predictive and classification ability of artificial neural networks, and results are very encouraging as they help in lowering down the error
Table 3 illustrates the application of ANN models in other areas of accounting and finance which includes time series forecasting and exchange rate prediction. Various models have been studied by the researchers and a comparison is made with other ANN models. The table shows a recent trend of using hybrid models instead of traditional ANN models.
Table 4: Frequency of error measures used
Error Measure No. of Papers
Confusion Matrix 24
MSE/RMSE/NMSE 16
MAPE/MAE/MAPE/AAE 12
MAD 3
RMS 2
R square 2
ROC 1
Type I and Type II
1
t-test 1
SD 1
Max AE 1

17SCMS Journal of Indian Management, January-March - 2021
A Quarterly Journal
rate by 3 to 5%, which is significant statistically. Therefore, the authors conclude that ANN has shown potential in the field of prediction, specifically in accounting and finance and outperforms the traditional statistical techniques. However, the predictability or accuracy level depends on the understanding of the problem statement. Thus, utmost care should be taken while designing the ANN model for a given problem.
References
Alfaro, E., García, N., Gámez, M., & Elizondo, D. (2008). Bankruptcy forecasting: An empirical comparison of AdaBoost and neural networks. Decision Support Systems, 45(1), 110-122. doi:10.1016/ j.dss. 2007.12.002
Alonso, M. N., Batres-Estrada, G., & Moulin, A. (2018). Deep Learning in Finance: Prediction of Stock Returns with Long Short-Term Memory Networks. Big Data and Machine Learning in Quantitative Investment, 251-277. doi:10.1002/9781119522225.ch13
Atiya, A. (2001). Bankruptcy prediction for credit risk using neural networks: A survey and new results. IEEE Transactions on Neural Networks, 12(4), 929-935. doi:10.1109/72.935101
Bredart, X. (2014). A “User Friendly” Bankruptcy Prediction Model Using Neural Networks. Accounting and Finance Research, 3(2). doi:10.5430/afr.v3n2p124
Cao, J., Li, Z., & Li, J. (2019). Financial time series forecasting model based on CEEMDAN and LSTM. Physica A: Statistical Mechanics and its Applications, 519, 127-139. doi:10.1016/j.physa.2018.11.061
Cao, Q., Leggio, K. B., & Schniederjans, M. J. (2005). A comparison between Fama and French's model and artificial neural networks in predicting the Chinese stock market. Computers & Operations Research, 32(10), 2499-2512. doi:10.1016/j.cor.2004.03.015
Celik, A. E., & Karatepe, Y. (2007). Evaluating and forecasting banking crises through neural network models: An application for Turkish banking sector. Expert Systems with Applications, 33(4), 809-815. doi:10.1016/j.eswa.2006.07.005
Charalambous, C., Charitou, A., & Kaourou, F. (2001). Comparative Analysis of Artificial Neural Network Models: Application in Bankruptcy Prediction. SSRN Electronic Journal. doi:10.2139/ssrn.251082
Chen, A., Daouk, H., & Leung, M. T. (2001). Application of Neural Networks to an Emerging Financial Market: Forecasting and Trading the Taiwan Stock Index. SSRN Electronic Journal. doi:10.2139/ssrn.237038
Duan, J. (2019). Financial system modeling using deep neural networks (DNNs) for effective risk assessment and prediction. Journal of the Franklin Institute, 356(8), 4716-4731. doi:10.1016/j.jfranklin.2019.01.046
Fanning, K. M., & Cogger, K. O. (1994). A Comparative Analysis of Artificial Neural Networks Using Financial Distress Prediction. Intelligent Systems in Accounting, Finance and Management , 3(4) , 241-252. doi:10.1002/j.1099-1174.1994.tb00068.x
Fletcher, D., & Goss, E. (1993). Forecasting with neural networks An application using bankruptcy data. Information & Management, 24, 159-167.
Ghasemiyeh, R., Moghdani, R., & Sana, S. S. (2017). A Hybrid Artificial Neural Network with Metaheuristic Algorithms for Predicting Stock Price. Cybernetics and Systems, 48(4), 365-392. doi:10.1080/ 01969722. 2017.1285162
Guresen, E., Kayakutlu, G., & Daim, T. U. (2011). Using artificial neural network models in stock market index prediction. Expert Systems with Applications, 38(8), 10389-10397. doi:10.1016/j.eswa.2011.02.068
Hadavandi, E., Shavandi, H., & Ghanbari, A. (2010). Integration of genetic fuzzy systems and artificial neural networks for stock price forecasting. Knowledge-Based Systems, 23(8), 800-808. doi:10.1016/ j.knosys. 2010.05.004
Inthachot, M., Boonjing, V., & Intakosum, S. (2016). Artificial Neural Network and Genetic Algorithm Hybrid Intelligence for Predicting Thai Stock Price Index Trend. Computational Intelligence and Neuroscience, 2016, 1-8. doi:10.1155/2016/3045254
Jensen, H. L. (1992). Using Neural Networks for Credit Scoring. Managerial Finance, 18(6), 15-26. doi:10.1108/eb013696
Kara, Y., Acar Boyacioglu, M., & Baykan, Ö. K. (2011). Predicting direction of stock price index movement using artificial neural networks and support vector machines: The sample of the Istanbul Stock Exchange. Expert Systems with Applications, 38(5), 5311-5319.doi:10.1016/j.eswa.2010.10.027
18SCMS Journal of Indian Management, January-March - 2021
A Quarterly Journal
Khandelwal, I., Adhikari, R., & Verma, G. (2015). Time Series Forecasting Using Hybrid ARIMA and ANN Models Based on DWT Decomposition. Procedia Computer Science, 48, 173-179. doi:10.1016/ j.procs.2015.04.167
Kim, K., & Lee, W. B. (2004). Stock market prediction using artificial neural networks with optimal feature transformation. Neural Computing and Applications, 13(3), 255-260. doi:10.1007/s00521-004-0428-x
Kim, M., & Kang, D. (2010). Ensemble with neural networks for bankruptcy prediction. Expert Systems with Applications, 37(4), 3373-3379. doi:10.1016/ j.eswa.2009.10.012
Kumar, K., & Bhattacharya, S. (2006). Artificial neural network vs linear discriminant analysis in credit ratings forecast. Review of Accounting and Finance, 5(3), 216-227. doi:10.1108/14757700610686426
Lee, S., & Choi, W. S. (2013). A multi-industry bankruptcy prediction model using back-propagation neural network and multivariate discriminant analysis. Expert Systems with Applications, 40(8), 2941-2946. doi:10.1016/j.eswa.2012.12.009
Leung, M. T., Chen, A., & Daouk, H. (1999). Forecasting Exchange Rates Using General Regression Neural Networks. SSRN Electronic Journal. doi:10.2139/ ssrn.200448
Lin, J. W., Hwang, M. I., & Becker, J. D. (2003). A fuzzy neural network for assessing the risk of fraudulent financial reporting. Managerial Auditing Journal, 18(8), 657-665. doi:10.1108/02686900310495151
López Iturriaga, F. J., & Sanz, I. P. (2015). Bankruptcy visualization and prediction using neural networks: A study of U.S. commercial banks. Expert Systems with Applications, 42(6), 2857-2869. doi:10.1016/ j.eswa.2014.11.025
M, H., E.A., G., Menon, V. K., & K.P., S. (2018). NSE Stock Market Prediction Using Deep-Learning Models. Procedia Computer Science, 132, 1351-1362. doi:10.1016/j.procs.2018.05.050
Malhotra, D. K., & Malhotra, R. (2002). Evaluating Consumer Loans using Neural Networks. SSRN Electronic Journal. doi:10.2139/ssrn.314396
Moghaddam, A. H., Moghaddam, M. H., & Esfandyari, M. (2016). Stock market index prediction using artificial neural network. Journal of Economics, Finance and Administrative Science.
Mokhatab Rafiei, F., Manzari, S., & Bostanian, S. (2011). Financial health prediction models using artificial neural networks, genetic algorithm and multivariate discriminant analysis: Iranian evidence. Expert Systems with Applications, 38(8), 10210-10217. doi:10.1016 /j.eswa.2011.02.082
Nag, A. K., & Mitra, A. (2002). Forecasting daily foreign exchange rates using genetically optimized neural networks. Journal of Forecasting, 21(7), 501-511. doi:10.1002/for.838
Odom, M., & Sharda, R. (1990). A neural network model for bankruptcy prediction. 1990 IJCNN International Joint Conference on Neural Networks. doi:10.1109/ ijcnn.1990.137710
Olson, D. L., Delen, D., & Meng, Y. (2012). Comparative analysis of data mining methods for bankruptcy prediction. Decision Support Systems, 52(2), 464-473. doi:10.1016/j.dss.2011.10.007
Paliwal, M., & Kumar, U. A. (2009). Neural networks and statistical techniques: A review of applications. Expert Sy s t ems w i th App l i ca t i ons , 36 (1 ) , 2 -17 . https://doi.org/10.1016/j.eswa.2007.10.005
Parot, A., Michell, K., & Kristjanpoller, W. D. (2019). Using Artificial Neural Networks to forecast Exchange Rate, including VAR‐VECM residual analysis and prediction linear combination. Intelligent Systems in Accounting, Finance and Management, 26(1), 3-15. doi:10.1002/ isaf.1440
Qiu, M., Song, Y., & Akagi, F. (2016). Application of artificial neural network for the prediction of stock market returns: The case of the Japanese stock market. Chaos, Solitons & Fractals, 85, 1-7. doi:10.1016/ j.chaos.2016.01.004
Salchenberger, L. M., Cinar, E. M., & Lash, N. A. (1992). Neural Networks: A New Tool for Predicting Thrift Failures. Decision Sciences, 23(4), 899-916. doi:10.1111/j.1540-5915.1992.tb00425.x
Tam, K. Y., & Kiang, M. Y. (1992). Managerial Applications of Neural Networks: The Case of Bank Failure Predictions. Management Science, 38(7), 926-947. doi:10.1287/mnsc.38.7.926
Smith, K. A., & Gupta, J. N. (2000). Neural networks in business: techniques and applications for the operations researcher. Computers & Operations Research, 27(11-12), 1023-1044.

19SCMS Journal of Indian Management, January-March - 2021
A Quarterly Journal
Ticknor, J. L. (2013). A Bayesian regularized artificial neural network for stock market forecasting. Expert Systems with Applications, 40(14), 5501-5506. doi:10.1016/j.eswa.2013.04.013
Walczak, S. (2001). An Empirical Analysis of Data Requirements for Financial Forecasting with Neural Networks. Journal of Management Information Systems, 17(4), 203-222. doi:10.1080/ 07421222. 2001.11045659
Wang, L., Zeng, Y., & Chen, T. (2015). Back propagation neural network with adaptive differential evolution algorithm for time series forecasting. Expert Systems with Applications, 42(2), 855-863. doi:10.1016/ j.eswa.2014.08.018
Weizhong Yan. (2012). Toward Automatic Time-Series Forecasting Using Neural Networks. IEEE Transactions on Neural Networks and Learning Systems, 23(7), 1028-1039. doi:10.1109/ tnnls.2012 .2198074
West, D. (2000). Neural network credit scoring models. Computers & Operations Research, 27(11-12), 1131-1152. doi:10.1016/s0305-0548(99)00149-5
West, D., Dellana, S., & Qian, J. (2005). Neural network ensemble strategies for financial decision applications. Computers & Operations Research, 32(10), 2543-2559. doi:10.1016/j.cor.2004.03.017
Wilson, R. L., & Sharda, R. (1994). Bankruptcy prediction using neural networks. Decision Support Systems, 11(5), 545-557. doi:10.1016/0167-9236(94)90024-8
Yang, Z., Platt, M. B., & Platt, H. D. (1999). Probabilistic Neural Networks in Bankruptcy Prediction. Journal of Business Research, 44(2), 67-74. doi:10.1016/s0148-2963(97)00242-7
Yao, J., & Tan, C. L. (2000). A case study on using neural networks to perform technical forecasting of forex. Neurocomputing, 34(1-4), 79-98. doi:10.1016/s0925-2312(00)00300-3
Youngohc Yoon, & Swales, G. (n.d.). Predicting stock price performance: a neural network approach. Proceedings of the Twenty-Fourth Annual Hawaii International Conference on System Sciences. doi:10.1109/ hicss.1991.184055
Zhang, G. (2003). Time series forecasting using a hybrid ARIMA and neural network model. Neurocomputing, 50, 159-175. doi:10.1016/s0925-2312(01)00702-0
Zhang, G., Y. Hu, M., Eddy Patuwo, B., & C. Indro, D. (1999). Artificial neural networks in bankruptcy prediction: General framework and cross-validation analysis. European Journal of Operational Research, 116(1), 16-32. doi:10.1016/s0377-2217(98)00051-4
Zhang, Y., & Wu, L. (2009). Stock market prediction of S&P 500 via combination of improved BCO approach and BP neural network. Expert Systems with Applications, 36(5), 8849-8854. doi:10.1016/j.eswa.2008.11.028
***********

Appendix
The abbreviations used in tables 1 - 4 are described below:
20SCMS Journal of Indian Management, January-March - 2021
A Quarterly Journal
Notation Meaning
LR Logistic Regression
MDA Multivariate Discriminant Analysis
k-NN k-Nearest Neighbour
NN Neural Network
ANN Artificial Neural Network
LM Logit Model
BPNN Back Propogation Neural Network
GANNA Generalized Adaptive Neural Network Architectures
PNN Probability Neural Networks
FDA Fisher Discriminant Analysis
LVQ Learning Vector Quantization
FFNN Feed Forward Neural Network
FNN Fuzzy Neural Network
RBF Radial Basis Function
GA Genetic Algorithm
MLP Multilayer Perceptron
SVM Support Vector Machine
SOM Self-Organizing Maps
BRANN Bayesian Regularized Artificial Neural Network
LSTM Long Short Term Memory
CNN Convolutional Neural Network
ARIMA Auto Regressive Integrated Moving Average
GARCH Generalized AutoRegressive Conditional Heteroskedasticity
RNN Recurrent Neural Network
GFS Genetic Fuzzy Systems
RWM Random Walk Model
GMM Generalized Methods of Moments
IBCO Improved Bacterial Chemotaxis Optimization
DAN2 Dynamic Artificial Neural Network
GRNN General Regression Neural Network
MLFN Multi Layered Feed forward Network
MOE Mixture of Experts
FAR Fuzzy Adaptive Resonance

21SCMS Journal of Indian Management, January-March - 2021
A Quarterly Journal
***********
KD Kernel Density estimation
GANN Genetic Algorithm Neural Networks
FGNN Fixed Geometry Neural Networks
EGARCH Exponential Generalized AutoRegressive Conditional Heteroskedasticity
AGARCH Asymmetric Generalized AutoRegressive Conditional Heteroskedasticity
VECM Vector Error Correction Model
CEEDMAN
ADE Adaptive Differential Evolution
VAR Vector AutoRegression
DWT Discrete Wavelet Transformation
LDA Linear Discriminant Analysis
MSE Mean Sqaured Error
RMSE Root Mean Sqaured Error
NMSE Normalized Mean Squared Error
MAPE Mean Absolute Percentage Error
MAE Mean Absolute Error
ROC Receiver Operating Characterstic Curve
SD Standard Deviation
Max AE Maximum Absolute Error
MAD Mean Absolute Deviation
AAE Average Absolute Error
sMAPE Symmetric Mean Absolute Percentage Error
Complete Ensemble Empirical Mode Decomposition with Adaptive Noise
SCMS Journal of Indian Management, January-March - 2021 22
A Quarterly Journal
An Empirical Analysis ofBRICS Bond Market Integration
Abstract
This paper aims to understand the financial linkages and interdependence of BRICS (Brazil, Russia, India, China and
South Africa) nations through the Government security market considering the 10-year bond yield. Long-run and short-
run linkages among the 10-year bond yield of these countries are investigated using Johansen and Juselius’ co-integration
method. Interdependence and Causal relationship are further explored using correlation, cross-correlation, Granger
causality test and Wald test. The coefficients of correlation recorded very small values, yet positive, for the bond
markets of BRICS economies except for Russia with Brazil and India. The results of cross-correlation, Granger causality
tests and Wald tests suggested several statistically significant unidirectional linkages. The results of Johansen co-
integration identified a single balanced relationship in the long run among BRICS countries. The paper suggests and
supports the adoption of diversification through investments in these emerging market economies, especially in the long-
term government security market, as few countries have revealed negative correlation which would induce in lessening
the risk during financial distress.
Keywords: BRICS, government security market, financial linkages, Johansen and Juselius’ co-integration,
Granger causality test
Abstract
Dr.Vaishali S. DhingraAssistant Professor
Applied Mathematics and Humanities Department,Sardar Vallabhbhai National Institute of Technology,
Surat, Gujarat, IndiaEmail: [email protected]
Dr. Pooja PatelAssistant Professor
S. R. Luthra Institute of ManagementSurat, Gujarat, India
Email: [email protected]

SCMS Journal of Indian Management, January-March - 2021 23
A Quarterly Journal
1. Introduction
Brazil, Russia, India, China and South Africa, collectivelyknown as BRICS economies, are a small group of coun-tries that have acquired lots of consideration fromresearchers and investors during the past decade. Thereasons are diverse, but the essential perception being theseemerging economies of relatively large size couldpotentially deliver the anticipated push to augment theeconomic growth of the world. As a consequence of theGlobal Financial Crisis of 2007-2008, the yearly growthrate of per capita GNP at an international level has plungedto an average of 1.7% (measured in 2005 $PPPs during2008 to 2017. On the other hand, BRICS economies havebeen the major contributors to the growth of per capitaGNP globally, at an average of 5.4% and are considered tooutlast the key drivers of growth of the world by 2030.These economies are currently accounting for 30.4% oftotal world GNP.1 Since 2015, these five countries havebeen sharing a GDP of $ 16.6 trillion, which is equivalentto roughly about 22 percent of the gross world GDP. Theestimated expansion in the growth rate of BRICS is 5.3%in 2019.2
This turn of the century has observed one of the mostcomplex and major financial crisis so far. The crisis hasescalated rapidly from the U.S. housing market to its ownfinancial market and to the whole world financial market.The proliferating growth of the BRICS market has madethem significantly financially dependent on other marketsof the world. BRICS economies today are more matured,and thus their markets are exhibiting a higher level offinancial integration and linkages with other developedmarkets of the world. BRICS stock market exhibit linkageswith global stock market (S&P index), commodity markets(oil and gold) and U.S. stock market uncertainty (Mensi,Hammoudeh, Reboredo, & Nguyen, 2014). Furthermore,bilateral relations among BRICS nations are mainly basedon equality, non-interference and mutual benefit (LopesJr, 2015). These five BRICS countries differ in theirstructural characteristics, economic policies and
geopolitical importance. Brazil and Russia are primarilynatural resource-based economies, well-known for theexport of commodities and are more open in terms offoreign trade. Their capital markets witness liberalregulation with limited control by the state as comparedto the markets of India, China and South Africa. These threecountries are relatively closed and highly populatedamongst the five BRICS economies, where the majorityof the population is living in the rural areas having a state-controlled capital market.
The remarkable fall in the equity market wealth resultingfrom the deteriorating consumption patterns worldwidecould pose grave implications on the health of the economyas well as on its financial institutions (Dynan & Maki,2001). The correlations between major asset classes(particularly stock markets and bond markets) are of majorconcern for financial regulators and monetary authoritiesalike. An enriching number of researches in this domainhave analysed the characteristics of these linkages and theiressence through which information flows between markets.The past literature has been focusing on studying theinteraction among the BRICS economies and how / whatthey contribute to the global markets. The domestic assetprices shocks pose a substantial impact on assets prices;however, the international spillover, both within and acrossvarious asset classes, is more considerable (Ehrmann,Fratzscher & Rigobon, 2011). International bond marketshence play a very crucial role in determining asset pricesfor the developed markets of the world. Financialauthorities can influence the term structure minimally.Fundamentally, the expected future inflation and the shortterm real interest rates determine the long term bond rates.The increased co-variation amongst the bond rates ofdifferent economies restricts the influence of highermonetary authorities towards the term structure.
The correlation between bond markets of differentcountries may crop up through various channels. It can bedone by framing an internationally diversified portfolio ordetermination of real rates by global factors. Risks in theworldwide prices or ‘flight to quality’ in terms of financialstress may also cause this correlation. The indefinitemeasure of correlations amongst the key international bondmarkets indicated an increased association between thesemarkets since the 1960s; however, the results of
1 Mckinley, T. (2018, Apr 20). Brics to play a leading role in driving futureglobal economic growth (Blog post). Retrieved from https://www.ineteconomics.org/perspectives/blog/brics-to-play-a-leading-role-in-driving-future-global-economic-growth
2 Global Economic Prospects: Divergences and Risks, A World BankGroup Flagship Report,2016

SCMS Journal of Indian Management, January-March - 2021 24
A Quarterly Journal
correlations were neutral in displaying any trend (Solnik,Boucrelle & Le Fur, 1996; Christiansen & Pigott, 1997).In spite of the fact that the absolute prices and measuresof the international bond market correlations are not in asituation of increasing trends, the measures taken by themonetary authorities in balancing the yield curve bychanging the short-term rates still prevails.
A generous number of studies have examined the linkages,co-movements and correlations amongst the stock marketsof BRICS nations (Sharma, Singh, & Litt, 2011; Xu &Hamori, 2012; Chkili & Nguyen, 2014; Bekiros, 2014;Mensi et al., 2014). Many of them have also tried to findthe integration of one of the BRICS nations with U. S. bondmarkets, but the present study is differentiated from theother research by studying the integration within the BRICSnations through the government security market. In thesame direction, the impact of the bond price movement onthe rest of the BRICS countries has also never beenexamined. Thus, the study is novel in its type and exploresthe same concepts with the new dimensions.
The present study attempts to investigate the relationshipbetween the 10-year bond yields of BRICS economies. Theempirical analysis uses monthly data from January 2008to December 2017. At the first stage, the presence of unitroot and order of integration of all five series wasexamined. Secondly, the test of correlation, cross-correlation and Granger causality were adopted to identifyshort-run linkages and Johansen and Juselius (1994) co-integration framework was used to examine the long termrelationships among BRICS countries. Finally, the short-run relationship was verified and confirmed using the Waldtest. The paper is further structured as follows: Section 2provides the synopsis of previous studies. The methodologyand description of data are presented in section 3. Estimatedresults and their rationales are enumerated in section 4,followed by a conclusion and final summary in section 5.
2. Literature Review
The crash of stock markets in October 1987 was one ofthe key stimulants to study the financial marketassociations. Koutmos and Booth (1995) find that the majorstock markets of New York, London and Tokyo witnessedhigher interdependencies after the crash of 1987. The 1997financial crisis played an influential role in bringing the
integration of ASEAN stock markets with other economies(Janor, Ali, & Shaharudin, 2007). The globalisation ofeconomies had driven this obvious increase in the linkagesbetween the domestic equity markets, which in turn haveincreased the presence of international investorsworldwide. The early studies of international financialintegration and linkages were triggered by the motive ofhaving an internationally diversified portfolio (Grubel,1968; Hilliard, 1979; Becker, Finnerty, & Gupta, 1990;Hamao, Masulis, & Ng, 1990). The increased number offoreign investors and strong international marketinterrelations are motivated by the relaxed restrictions ofthe capital markets (Phylaktis & Ravazzolo, 2005). Thecontagion financial crisis of the developed countries alongwith their portfolio diversification has attractedresearchers to investigate the topics of financialintegration. The correlation between the BRICS and theUSA is increasing since early 2009 after the global financialcrisis (Dimitriou, Kenourgios & Simos, 2013). Tornell andWestermann (2002) show that many countries thatliberalised their financial markets experienced thedevelopment of lending that sometimes resulted in twincrises. King and Wadhwani (1990) anticipated volatilitytransmission as a result of contagion effect becauseintermediaries do not measure the economic inference ofnews from the foreign market; rather, they are merelyresponding by reacting first and thinking (Shiller, Kon-Ya& Tsutsui, 1991; Taylor & Sarno, 1997; Calvo, 1998).Dhingra, Gandhi, & Bulsara (2016) also argued that theforeign portfolio investors are purely the feedback tradersand hence, they increase the financial market volatility.Pereira (2018) investigated the contagion effect in theBRICS economies with special reference to the collapseof Lehman Brothers and the European Sovereign DebtCrisis. The relationship and co-movements between theBRICS markets are analysed using the co-integration,causality and VECM methodology. The results verified andconfirmed the long run and short-run relationship betweenthe BRICS nations; however, the same has significantlychanged during the crisis period.
Some of the empirical papers have also studied therelationship between stock and bond markets. A VARapproach of Campbell and Shiller (1987) has been used bythe studies of Shiller and Beltratti (1990) and Campbelland Ammer (1993) to decompose asset returns. The results

SCMS Journal of Indian Management, January-March - 2021 25
A Quarterly Journal
of this study recorded an unexplained change in excessreturns, and hence these returns can be explained by futureevents which are predominantly driven by the futureexpected inflation rates. Norden and Weber (2009) studiedinter temporal co-movement among stock return, CreditDefault Swap (CDS) and bond market, where they clearlyshowed stock returns lead CDS and bond spread changes.A negative relationship is found between the uncertaintymeasures and the future correlation of stock and bondreturns (Connolly, Stivers & Sun, 2005). The returns onthe bond market are likely to be higher compared to returnson the stock market, particularly on those days when thevolatility in the stock market increases significantly, andthe turnover is unusually low or high.
Barr and Priestley (2004) study the integration of theselected world markets by applying the factors of returnson government bonds and expected risks. Their studyapplies a conditional asset pricing model, which allowschanges in the price and risk exposure. The results of theconditional asset pricing model reveal a partial integrationof national markets with the world markets. Nasir and FanFah (2012) investigate the dynamic relationship of bondyields using the government bond returns and yield curvesof India, Japan, Malaysia, Singapore and Thailand. With theresults of VECM (Vector Error Correction Model), theyindicate a presence of co-integration among all considerednations except Japan. Lapodis (2010), using GARCH(Generalised Autoregressive Conditional Heteroskedasticity) and VAR (Vector Autoregression), identifythe existence of short-run relationships for the sovereignbond market of four major economies; Germany, Japan,the U.S. and the U.K. He confirms that the U.S bond marketvolatility also affects the other countries bond yield. Chaieb,Errunza and Brandon (2020) studied the dynamics of bondmarket integration for 21 developed and 18 emergingmarkets of the world. Results revealed a higher degree ofintegration for factors like political stability, credit quality,lower level of inflation and lower illiquidity. The level ofintegration and its impact on borrowing cost is measuredusing an asset pricing model in this study.
To our knowledge, few studies like Yu, Fung and Tam(2007), Barr and Priestley (2004) and Clare, Maras, andThomas (1995) investigated the relationships betweeninternational bond markets. Ahmad, Mishra and Daly (2018)
analysed the financial connectedness with the help ofreturns and volatility spillovers of BRICS with three globalindices. DY model, correlation analysis and VAR wereapplied to investigate the volatility spillover. Russia andSouth Africa are found to be the net transmitters of shocksand may have an adverse impact on other BRICS nations.Conversely, China and India revealed weak connectedness.Mohammad and Palaniappan (2017) investigated theintegration of stock markets of BRICS nations. JohansenCo-integration Test (1994) and Pairwise Granger Causalitytest were applied to measure the interdependency anddynamic linkages among these markets. The resultssupported the absence of a long-run relationship betweenthese markets. The literature studying the relationshipamongst the bond yield of BRICS nations are scant innumber. The present paper aims to coincide with theexisting literature on financial market linkages by analysingthe links between government security markets.
3. Data and Methodology
3.1 Data
To render a comprehensive account of interrelationships,integration, interdependencies and dynamic linkages of theBRICS economies through the government securitymarket, monthly data of 10-year bond prices have beenextracted and further considered for detailed analysis. Thedata set comprises 120 observations ranging from January,2008 to December, 2017 (i.e. last ten years) for five seriesor variables (representing BRICS economies) viz. Brazil,Russia, India, China and South Africa.
3.2 Preliminary Analysis
The co-integration test in the time series analysis requiresfulfilling the assumption of time series being integratedof the same order to make the regression equationbalanced. Augmented Dickey-Fuller and Phillips-Perronunit root tests have been performed for checking thestationarity of individual series. Results of stationarity testsreveal that all the series are stationary at the first difference,that is, individually, they are I(1).To verify autocorrelationamong the residuals Ljung–Box Q-statistic is used, whichsuggests the absence of significant autocorrelations amongthe residuals. Akaike Information Criterion (AIC) andSchwarz Bayesian Criterion (BIC) are used to determinethe optimal lag length.

SCMS Journal of Indian Management, January-March - 2021 26
A Quarterly Journal
of and , respectively and are assumed to be time-
independent.
Where and are the standard deviation
correlation between and is defined as
3.3 Correlation Analysis
Correlation analysis is performed for getting the initialsign of dynamic linkages and integration among theseEMEs through the government security market. Thecorrelation test measures the direction and strength of theassociation between the considered series. However,Leong and Felmingham (2003) criticised the reliability ofthe correlation test since the coefficients of correlationtend to be more upward biased in nature if the series issuspect to heteroskedasticity.
3.4. Contemporaneous Cross-correlation Analysis
To measure the strength of linear dependence between anytwo series under consideration, the cross-correlationcoefficients are calculated (Haugh, 1976). The cross
Equation 1
Non-zero value of (where ) indicates that
the series leads the series at lag , whereas thenon-zero value of (where implies thatthe series lags the series at lag .
3.5 Granger Causality Test
To eliminate the possible simultaneity bias, the Grangercausality test (Granger, 1988) is performed, which usesstandard F-test:
represents the coefficients between values ofvariable at time and variable at time . The nullhypothesis being variable j does not Granger cause variable iif all other coefficients of the polynomial are set tozero.
The Granger Causality test involves estimating thefollowing pair of equations:
Where and are white noise processes; m is asuitably chosen lag length; t is the trend variable; α
i, β
j, γ
i
and δj are the slope parameters. One pair of equations is
estimated for each series of bond prices with the otherfour series of bond prices. While estimating this pair ofequations, all the series are I(1). β
j denotes the linear
dependenc of on in the presence of .Similarly, denotes the linear dependence of on in the presence of .
3.6 Cointegration Test
To examine the presence of a long-run relationship amongBRICS’ bond markets, the VAR based co-integrationapproach has been adopted, which is given by Johansen andJuselius (1994). The pre-requisite for the application ofthis approach confirms the considered variables to be non-stationary at level and having the same order of integration.This method finds the co-integrating relationship betweennon-stationary variables using maximum likelihoodestimation. To carry out the test, the first VAR of variablesp and order k is formulated using equation 5.
Equation 5
Where, is the vector containing the p variables( , are the matrixof parameters and is an independently and identically
distributed n-dimensional vector with zero mean and
constant variance.
The reparameterisation of equation 5 would yieldequation 6.
, in equation 6 is the rank of the matrix. It represents thenumber of co-integrating vectors. If rank , the ma-
Equation 2
Equation 3
Equation 4
Equation 6
-

SCMS Journal of Indian Management, January-March - 2021 27
A Quarterly Journal
trix is null. In such a condition, equation 6 becomes theordinary VAR with the first difference signifying that vari-
ables in are not co-integrated. Value of the rank indicates the presence of only co-integrating vector and
denotes the error term. suggests theexistence of multiple co-integrating vectors.
One can obtain the existence of a number of co-integrat-ing vectors by assessing the significance of characteristic
roots of . and statistics can be used to checkthe number of characteristic roots that are significantlydifferent from one.
The statistic given by equation 7 involves assessing the nullhypothesis that the number of distinct co-integrating vec-tors is less than or equal to r against the alternative.
The second test represented by equation 8 assessesthe null that the number of co-integrating vectors is r againstthe alternative r+1 co-integrating vectors.
Equation 8
In equation 7 and 8, and are the estimated valuesof the characteristic roots, which are obtained from theestimated matrix, also known as eigen values, and isthe number of usable observations.
3.7 Wald Test
Toda and Yamamoto (1995) proposed the Granger Causalitytechnique to determine the causal relationship between twovariables. The technique became very popular amongresearchers due to its simple application, which does notinvolve pre-testing of the same level of integration and co-integrating properties of the considered variables. Toda andYamamoto (1995) gave an augmented VAR(p+d) modelestimated through equation 9, which is used to test thecausality between integrated variables.
Equation 9
Where variables with circumflex represent the OLSestimates, p and d represent the order of the process and
the order of integration respectively of the consideredvariables. kth element of non-granger cause the jth
element of becomes the null hypothesis. The test forcausality between two variables in can be written asequation 10, which is popularly known as Modified Wald(MWALD) test. The full set of coefficients in the modelmay be arrayed in a single coefficient vector, γ. Assumeò to be the sample estimator of γ and V the estimatedasymptotic covariance matrix. The Wald statistic for thenull hypothesis is.
Equation 10
The null hypothesis for the Granger causality test will be a
certain sub-vector of , say , equals zero, where the test
statistic will be equation 11.
Equation 11
Where is the corresponding sub-matrix of V. Theadequacy of the models is tested by serial correlation testand the test of heteroskedasticity. The null hypothesis forserial correlation is that residuals are not seriallyautocorrelated. For the heteroskedasticity test, the nullhypothesis is that the residuals are homoskedastic. Theproficiency of both the tests is measured by its p values.The value of the coefficient of determination that is R-square from the regression is an indication of the extentto which the conditional variance is explained. It helps toevaluate the adequacy of the models. The model having ahigh R-square suggests the good-fit.
4. Empirical Analysis and Discussion
4.1 Preliminary Analysis
The daily bond prices of BRICS (Brazil, Russia, India,China, and South Africa) economies are illustrated using agraph for the considered period of study in Figure 1. Thisplot hints at the likely nature of the time series. Figure 1exhibits an upward and downward trend in the prices ofbonds for BRICS economies, suggesting the changes inthe mean values of different series and the series areconfirmed to be of non-stationary nature.
Equation 7

SCMS Journal of Indian Management, January-March - 2021 28
A Quarterly Journal
Figure 1: Daily bond prices of BRICS economies
Source: Author’s analysis
To achieve the objective of the study that is identifyinglong-run and short-run linkages among BRICS economies,Johansen co-integration test has been performed. This testpre-conditions that the variables under consideration shouldbe in the same order of integration. Augmented Dickey-Fuller(ADF) Test and a Phillips-Perron (PP) Test are used
to examine the non-stationarity of the series. The resultsof both the tests of unit root in Table 1 confirm thepresence of non-stationarity at level and stationarity at thefirst difference for all the series. All the series, therefore,are integrated at order one, that is I(1).
Table 1: Unit Root Test
Note: Estimation procedure follows Ordinary Least Square (OLS) method. The null hypotheses are seriescontain unit root. ‘*’ denotes values significant at 1% level.

SCMS Journal of Indian Management, January-March - 2021 29
A Quarterly Journal
4.2 Correlation Analysis
The correlation analysis enumerated in Table 2 reveals thatall bond price series are positively related to each otherexcept the relationship of Russia with Brazil and India. Allthese coefficients do not support the strong associationas these values are ranging between 0-0.3 except for the
Table 2: Correlation Analysis
correlation coefficient between Brazil and South Africa.The reason being that all the bond investments are relateddirectly to policy rates, and they tend to be related for thelong term. Investors cannot further exploit arbitrageopportunity in these markets due to the presence of interestrate parity.
Source: Author’s analysis
4.3 Contemporaneous Cross-correlation Analysis
Table 3 shows the estimated cross-correlation coefficientsof the first variable X(±i) up to 5 leads and lags. The “leads”and “lags” of the first variable are given in the first columnas positive and negative integers. Lead coefficient suggeststhe influence of the first series that is the bond price ofone country at time (t+1) on the other country bond priceat time t. Similarly, the lag coefficient suggests theinfluence of the second series at time (t-1) on the bondprice of the first series. Brazil bond price influences thebond prices of China and South Africa as the lead
Table 3: Contemporaneous Cross-correlation Analysis
coefficients of Brazil are statistically significant, whereaslag coefficients with Russia, India and South Africa arestatistically significant. These suggest the bidirectionalcause and effect relationship between Brazil and SouthAfrica. Russia and India have a causal relationship flowingfrom each other. In the rest of the relationships betweenRussia - China, Russia - South Africa, India - China, India -South Africa and China - South Africa, the former causeschange in the latter variable. A significant coefficient atlag 0 implies a contemporaneous two-way relationship forthe selected variables.

SCMS Journal of Indian Management, January-March - 2021 30
A Quarterly Journal
Note: Asymptotic standard error for the cross-correlation coefficients is ±0.1789. First column of the table denoted as “k”represents the leads/lags of first variable X(±i). Here correlation is between and other series and is denoted as .“*” represents significant cross correlation coefficient which fall outside the asymptotic bounds.
4.4 Granger Causality Test
Short-run causality among considered Emerging Marketshas been analysed using an alternative approach. Thisapproach involves estimating Granger causality statisticsby applying the Toda–Yamamoto (1995) approach, whichhas its roots in the VAR model. Table 4 provides bivariateVAR framework-based results of the Granger causality test.The presence of unidirectional causality from Brazil to theother four countries has been confirmed from the results.Russia granger causes China at lag 2. However, the causality
in the case of India is flowing only towards Russia. Thenull hypotheses, “China does not Granger cause Brazil/India”, are rejected. The result further suggests that theChina bond market contains useful information for Braziland India. Similarly, South Africa contains usefulinformation for Russia and India. These results areconsistent with the results of the cross-correlation ofBrazil and India.

SCMS Journal of Indian Management, January-March - 2021 31
A Quarterly Journal
Table 4: Granger Causality Test
Note: Arrow “” shows unidirectional causality running from column variable to row variable. “-” indicates theabsence of causal relationship at particularlag. Arrows represent significant F-statistics at 5% level. Number oflags have been determined using BIC criterion.
↓
4.5 Lag selection Criteria
The first and foremost step to analyse either long-run orshort-run relationship among considered series is to selecta proper lag length for further analysis. To decide the lagsto be included for estimating the Johansen – Juselius co-integration test (for long-run relationship) and the Wald
test (for short-run relationship), unrestricted Vector AutoRegression (VAR) has been estimated. The test statisticsfor lag selection criteria are shown in Table 5. FPE, AIC,SC and HQ unanimously select lag 2. Thus, the inclusionof variable up to two lags would make the modelparsimonious and restrict us from over-parameterisation.
Table 5: Lag selection criteria
Note: * indicates selected lag order by the criterion at 5% significant level. LogL, LR, FPE, AIC, SC and HQ standsfor Log Likelihood ratio, sequential modified LR test statistics, Final prediction error, Akaike information criterion,Schwarz information criterion and Hannan-Quinn information criterion, respectively.

SCMS Journal of Indian Management, January-March - 2021 32
A Quarterly Journal
4.6 Cointegration Test
To ascertain whether the non-stationary bond price seriesshare a long-run stochastic trend, Johansen – Juselius co-integration test is employed, and the results are shown inTable 6. The calculated values of and are reportedin the second and fourth column. The considered seriesfor all five variables are I(1). From both the test statistics,
Table 6: Johansen Cointegration Test
it is likely to accept the alternative hypothesis of thepresence of one or more co-integrating vectors by rejectingthe null hypothesis of no co-integrating vector, as the teststatistics exceed the 5 per cent critical value. The valuesof the and statistics are such that the nullhypothesis of no co-integration (i.e., r=0) is soundlyrejected. As such, it is evident that there is only one co-integrating vector among the five BRICS variables.
Note: “*” denotes rejection of the hypothesis at the 0.05 level and “**” MacKinnon-Haug-Michelis (1999) p-values
4.7 Wald Test
To test the joint hypotheses of two or more coefficients,instead of using the classical F-test, the Wald test is used,which is a large sample test. The Wald statistics follow theChi-square statistic with degrees of freedom equal to thenumber of regressors estimated. The null hypothesis, as inthe usual F-test, is that all the regressor coefficients arezero simultaneously; that is, collectively, none of theregressors have any bearing on the endogenous variable.In our case, the Chi-square statistics are significant forBrazil, India, China and South Africa. Collectively, out ofall the regressors India and China have an important impact
on the monthly bond prices of Brazil. For India, short-runcausality is running from all other countries except Russia.China and South Africa are in a short-run equilibriumrelationship with South Africa and Brazil, respectively.Although the co-integration test confirms the long-runrelationship among the bond markets of all five countries,they also possess a short-term causal relationship withsome of the countries under consideration. The findingsof the Wald test are perfectly matching with the findingsof the Granger causality test for Brazil, India and SouthAfrica. It is interesting to note that the findings of the Waldtest for Russia is quite different from the findings of theGranger causality test (Please refer Table 7).

SCMS Journal of Indian Management, January-March - 2021 33
A Quarterly Journal
Table 7: Wald Test
4.8 Breusch-Godfrey Serial Correlation Test andBreusch-Pagan-Godfrey Heteroskedasticity Test
The last step to validate the findings is checking the modelfit by analysing the residuals for serial correlation and thepresence of heteroskedasticity. Table 8 shows the resultsfor the Breusch-Godfrey Serial Correlation Test andBreusch-Pagan-Godfrey Heteroskedasticity Test. Theobserved F-statistics for serial correlation fails to rejectthe null hypothesis that there is no serial correlation in thegenerated residuals series of the regression model. This
Table 8: Breusch-Godfrey Serial Correlation Test and Breusch-Pagan-Godfrey Heteroskedasticity Test
validates the results of Johansen – Juselius co-integrationtest and Wald test for the long run along with short-runlinkages as the residuals are not victimised byautocorrelation throughout the series. The p-values forcorresponding F-statistics in Breusch-Pagan-GodfreyHeteroskedasticity Test fails to reject the null hypothesisof the presence of Heteroskedasticity for all consideredmodels except for South Africa. Thus one can concludethat the residuals are homoskedastic in nature.
SCMS Journal of Indian Management, January-March - 2021 34
A Quarterly Journal
5. Summary and Conclusion
The study of linkages and interdependencies betweenfinancial markets has been a highly researched topic in thefield of finance. Several studies tried to find the linkagesbetween the stock markets, money markets and bondmarkets of different countries. The BRICS nations in thepast decade have already gone through noteworthy changesin their processes, international trade opportunities andfinancial integration (Pereira, 2018). The absence oflinkages between markets results in an advantage forinvestors and leads to the creation of portfoliodiversification in the global market. On the contrary, somestudies revealed a negative performance in the portfolioreturns due to the occurrence of extreme events such asfinancial crises and stock market catastrophes. In suchcases, foreign investors should be allowed greaterflexibility to switch between equity and debt assets whichwill make their investments more elastic. Such type ofbalance strategies may help to stabilise the movements offoreign investors in and out of any country. This kind ofprudent measure would be an indirect effort to prevent assetprice bubbles in the financial markets. This may result inimposing the ban on certain financial activities for a shorttime span by governments, as is deemed fit (Bulsara,Dhingra, & Gandhi, 2015; Dhingra et al., 2016).
The existing research is an empirical assessment of short-term and long-term integration among the bond values ofBRICS (Brazil, Russia, India, China and South Africa)economies. In order to determine the co-integratingrelationships for the bond markets of the five economiesof BRICS, the co-integration approach given by Johansenwas performed on these variable series. The data is rangingfrom January, 2008 to December, 2017. The results of thetest strongly support the presence of a co-integratingrelationship among the bond markets of these emergingeconomies. These results are consistent with the findingsof Bianconi, Yoshino and De Sousa, 2013. This will benefitinternational investors by diversifying their portfoliointernationally in the long run.
In order to assess the presence of co-variation and short-term co-movements contemporary correlationcoefficients were calculated. The coefficients of
correlation recorded very small values, yet positive, amongthese countries’ bond markets except Russia with Braziland India. This result provides international investors witha chance to exploit the opportunity of possiblediversification in the international bond market. The resultsof Granger causality tests and Wald tests confirm quite afew numbers of statistically significant unidirectional links.In the short run, Brazil is dependent on India and China,India is dependent on China and South Africa and SouthAfrica is dependent on Brazil. These short-run relationshipsare not so strong for Russia and China if both the tests(Granger causality tests and Wald tests) are considered.
The Johansen co-integration test revealed the existenceof a single balance long-run relationship among the BRICScountries. This co-movement may emerge due to theexistence of some of the common factors, which restrictsthe independent movement of the bond prices of thesecountries and leaves scope for prediction. The certificationof such relationships, in turn, facilitates the investmentopportunities in international portfolio diversification. Theresults advocate the possibility for international investorsin the long run to espouse the investment strategies whichcombine assets from the countries that do not showassociation in the long run, particularly in the governmentsecurity market where inflow and outflow are not muchfrequent. The existence of these long-run and short-runrelationships questions the legitimacy of the efficientmarket hypothesis. The prediction of the price movementof one series can be improved if the movements of therest of the variable series in the model are known.
References
Barr, David G., and Richard Priestley. “Expected returns,risk and the integration of international bondmarkets.” Journal of International Money andFinance 23.1 (2004): 71-97.
Becker, Kent G., Joseph E. Finnerty, and Manoj Gupta. “Theintertemporal relation between the US and Japanesestock markets.” The Journal of Finance 45.4 (1990):1297-1306.
Bekiros, Stelios D. “Contagion, decoupling and thespillover effects of the US financial crisis: Evidencefrom the BRIC markets.” International Review ofFinancial Analysis 33 (2014): 58-69.

SCMS Journal of Indian Management, January-March - 2021 35
A Quarterly Journal
Bianconi, Marcelo, Joe A. Yoshino, and Mariana O.Machado De Sousa. “BRIC and the US financial crisis:An empirical investigation of stock and bondmarkets.” Emerging Markets Review 14 (2013): 76-109.
Bulsara, Hemantkumar P. Bulsara, Vaishali Dhingra, andShailesh B. Gandhi. “Dynamic Interactions betweenForeign Institutional Investment Flows and StockMarket Returns–The Case of India.” ContemporaryEconomics 9.3 (2015): 271-298.
Calvo, Guillermo A. “Capital flows and capital-marketcrises: the simple economics of suddenstops.” Journal of Applied Economics 1.1 (1998):35-54.
Campbell, John Y., and John Ammer. “What moves the stockand bond markets? A variance decomposition for longterm asset returns.” The journal of finance 48.1(1993): 3-37.
Campbell, John Y., and Robert J. Shiller. “Cointegrationand tests of present value models.” Journal ofpolitical economy 95.5 (1987): 1062-1088.
Chaieb, Ines, Errunza, Vihang, and Gibson Brandon, Rajna.“Measuring sovereign bond market integration.” TheReview of Financial Studies 33.8(2020), 3446-3491.
Chkili, Walid, and Duc Khuong Nguyen. “Exchange ratemovements and stock market returns in a regime-switching environment: Evidence for BRICScountries.” Research in International Business andFinance 31 (2014): 46-56.
Christiansen, Hans, and Charles Pigott. “Long-term interestrates in globalised markets.” OECD EconomicsDepartment Working Papers, 175. (1997).
Clare, Andrew D., Michael Maras, and Stephen H. Thomas.“The integration and efficiency of international bondmarkets.” Journal of Business Finance &Accounting 22.2 (1995): 313-322.
Connolly, Robert, Chris Stivers, and Licheng Sun. “Stockmarket uncertainty and the stock-bond returnrelation.” Journal of Financial and QuantitativeAnalysis 40.1 (2005): 161-194.
Dhingra, Vaishali S., Shailesh Gandhi, and HemantkumarP. Bulsara. “Foreign institutional investments in India:An empirical analysis of dynamic interactions withstock market return and volatility.” IIMB ManagementReview 28.4 (2016): 212-224.
Dimitriou, Dimitrios, Dimitris Kenourgios, and TheodoreSimos. “Global financial crisis and emerging stockmarket contagion: A multivariate FIAPARCH–DCCapproach.” International Review of FinancialAnalysis 30 (2013): 46-56.
Dynan, Karen E., and Dean M. Maki. “Does stock marketwealth matter for consumption?.” (2001). FEDSDiscussion Paper No. 2001-23.
Fah, Cheng Fan, and Annuar Nasir. “Dynamic relationshipbetween bonds yields of Malaysia, Singapore, Thailand,India and Japan.” International Journal of AcademicResearch in Business and Social Sciences 2.1 (2012):220.
Ehrmann, Michael, Marcel Fratzscher, and RobertoRigobon. “Stocks, bonds, money markets and exchangerates: measuring international financialtransmission.” Journal of Applied Econometrics 26.6(2011): 948-974.
Granger, Clive WJ. “Some recent development in a conceptof causality.” Journal of econometrics 39.1-2(1988): 199-211.
Grubel, Herbert G. “Internationally diversified portfolios:welfare gains and capital flows.” The AmericanEconomic Review 58.5 (1968): 1299-1314.
Hamao, Yasushi, Ronald W. Masulis, and Victor Ng.“Correlations in price changes and volatility acrossinternational stock markets.” The review of financialstudies 3.2 (1990): 281-307.
Haugh, Larry D. “Checking the independence of twocovariance-stationary time series: a univariate residualcross-correlation approach.” Journal of the AmericanStatistical Association 71.354 (1976): 378-385.
Hilliard, Jimmy E. “The relationship between equity indiceson world exchanges.” The Journal of Finance 34.1(1979): 103-114.
Irshad VK, Mohammad, and Shanmugam, Velmurugan,Palaniappan. “Stock Market Integration Among BRICSNations-An Empirical Analysis.” (June 18, 2017).
Janor, Hawati, Ruhani Ali, and Roselee Shah Shaharudin.“Financial integration through equity markets and therole of exchange rate: Evidence from ASEAN-5countries.” Asian Academy of Management Journalof Accounting and Finance 3.1 (2007): 77-92.

SCMS Journal of Indian Management, January-March - 2021 36
A Quarterly Journal
Johansen, Søren, and Katarina Juselius. “Identification ofthe long-run and the short-run structure an applicationto the ISLM model.” Journal of Econometrics 63.1(1994): 7-36.
King, Mervyn A., and Sushil Wadhwani. “Transmission ofvolatility between stock markets.” The Review ofFinancial Studies 3.1 (1990): 5-33.
Koutmos, Gregory, and G. Geoffrey Booth. “Asymmetricvolatility transmission in international stockmarkets.” Journal of International Money andFinance 14.6 (1995): 747-762.
Lopes Jr, Gutemberg P. “The Sino-Brazilian principles in aLatin American and BRICS context: the case forcomparative public budgeting legal research.” Wis.Int’l LJ 33 (2015): 1.
Mensi, Walid, et al. “Do global factors impact BRICS stockmarkets? A quantile regression approach.” EmergingMarkets Review 19 (2014): 1-17.
Norden, Lars, and Martin Weber. “The co movement ofcredit default swap, bond and stock markets: Anempirical analysis.” European financialmanagement 15.3 (2009): 529-562.
Pereira, Dirceu. “Financial Contagion in the BRICS StockMarkets: An empirical analysis of the Lehman BrothersCollapse and European Sovereign DebtCrisis.” Journal of Economics and FinancialAnalysis, Triple Publishing House 2.1(2018): 1-44.
Phylaktis, Kate, and Fabiola Ravazzolo. “Stock marketlinkages in emerging markets: implications forinternational portfolio diversification.” Journal ofInternational Financial Markets, Institutions andMoney 15.2 (2005): 91-106.
Sharma, Gagan Deep, Sanjeet Singh, and Gurjit Singh Litt.“Inter-linkages between Stock exchanges: A study ofBRIC Nations.” Available at SSRN 1837223 (2011).
Shiller, Robert J., and Andrea E. Beltratti. Stock prices andbond yields: Can their co-movements be explainedin terms of present value models?. No. w3464.National Bureau of Economic Research, 1990.
Shiller, Robert J., Fumiko Kon-Ya, and Yoshiro Tsutsui.“Investor behaviour in the October 1987 stock marketcrash: The case of Japan.” Journal of the Japaneseand International Economies 5.1 (1991): 1-13.
Solnik, Bruno, Cyril Boucrelle, and Yann Le Fur.“International market correlation andvolatility.” Financial analysts journal 52.5 (1996):17-34.
Taylor, Mark P., and Lucio Sarno. “Capital flows todeveloping countries: long-and short-termdeterminants.” The World Bank EconomicReview 11.3 (1997): 451-470.
Toda, Hiro Y., and Taku Yamamoto. “Statistical inferencein vector autoregressions with possibly integratedprocesses.” Journal of econometrics 66.1-2 (1995):225-250.
Tornell, Aaron, and Frank Westermann. “Boom-bust cyclesin middle income countries: Facts andexplanation.” IMF Staff Papers 49.1 (2002): 111-155.
Wasim, Ahmad, Mishra, Anil, V., and Daly, Kevin, J.“Financial connectedness of BRICS and globalsovereign bond markets.” Emerging MarketsReview 37 (2018): 1-16.
Woodford, Michael. “Optimal monetary policyinertia.” The Manchester School 67 (1999): 1-35.
Xu, Haifeng, and Shigeyuki Hamori. “Dynamic linkages ofstock prices between the BRICs and the United States:Effects of the 2008–09 financial crisis.” Journal ofAsian Economics 23.4 (2012): 344-352.
Yu, Ip-wing, Laurence Fung, and Chi-sang Tam. “Assessingbond market integration in Asia.” Available at SSRN1330709 (2007).
************

SCMS Journal of Indian Management, January-March - 2021 37
A Quarterly Journal
A Study on Employee Perceptionabout the Use of E-HRM in IT
Abstract
In a digital economy, the use of online systems is pertinent for all organisations. The online systems have provided better
connectivity and save a lot of time due to reduced paperwork. One such system is e-HRM which helps in smoothening
the operations of the HR department. Since e-HRM helps in faster decision-making and better communication, therefore,
it was found to be an important area for research. Thus, the present study was undertaken to find out the various factors
that influence the implementation of e-HRM system. This forms the primary objective of this research. For this, data
was collected from employees of IT organisations located in the National Capital Region, India. The sample size for the
study was 320 employees using convenience sampling. The data was analysed using SPSS version 23. It was found that
there are eight factors that influence the e-HRM system in IT organisations. These factors include ease of use of
technology, experience of information technology, secure systems, technology usefulness, communication tools, risk
perception, usage intention and organisational support. All these factors play an important role in the effective
implementation of e-HRM. The study has several implications, important among which is that organisational support
should be taken care of as the adoption of e-HRM requires that the employees should have the required support.
Keywords: e-HRM, IT organisations, factors of E-HRM implementation, organisational support, usage intention
Abstract
Dr. Rupa RatheeAssistant Professor
DMS, DCRUST, Murthal, Haryana, [email protected]
Ms. Renu BhuntelResearch Scholar
DMS, DCRUST, Murthal, Haryana, [email protected]

SCMS Journal of Indian Management, January-March - 2021 38
A Quarterly Journal
1. Introduction
Over recent years, the majority of organisations haveintegrated their HR departments with IT using e-HRMsystems to improve their performance. This shift has notbeen sudden, but the changes were gradual as therequirement for automated systems became a necessity.According to Strohmeier (2007), “e-HRM is the planning,implementation and application of information technologyfor both networking and supporting at least two individualor collective actors in their shared performing of HRactivities.” However, moving from pen and paper to onlinesystems has not been an easy task.
In developed countries, e-HRM is already being used on alarge scale. However, its implementation in Indianorganisations has taken place mostly in the past few years.In the present scenario, there is a need for revision in theHR department because now internet technology has beenassociated profoundly with HRM. The term e-HRM cameinto existence in the early 1990s. Now the trend is newinnovative technological developments, which realised theconcept of paperless work at the touch of a finger. In fact,e-HRM has transformed traditional HR into a morerealistic, informative and interactive format. Everything,including our way of thinking, living, communicating,culture, economies, demographics and even society, hasbeen affected by these technological changes.
The organisations were influenced by several factors inthe implementation of these systems. The internalenvironment and several external variables includedtechnology available, sense of security, ease of use, use oftechnology and many more. The e-HRM implementationhas been the fastest in the IT industry in comparison toothers as the employees of this industry are tech-savvy whencompared to those in other industries. Therefore, thepresent study dealt with the various factors affecting theimplementation of e-HRM in the IT industry.
2. Review of Literature
2.1 Implementation of e-HRM
Panayotopoulou et al. (2010) conducted a study in 13European countries. They explored the impact of thebackground of the nation on e-HRM implementation. They
stressed the existence of front end and back end systems.The study outcomes revealed that there were three clusters,namely Northern, Central and South-Eastern, on the basisof diffusion of e-HRM. In another study, Stone andDulebohn (2013) presented advanced theory and researchon HRMS (Human Resource Management System) and e-HRM. They also enhanced the effectiveness of thesesystems in organisations. This article reviewed theevolution of HRMS and e-HRM and provided an overviewof the existing literature. The authors examined how HRscholars may perceive HRMS and e-HRM. A conceptualstudy was conducted for the research. HRMS and e-HRMprovided internal support for HR professionals, e-HRMapplications provided access to all internal and externalstakeholders. The study also found that strategicconsiderations influenced decision-making on e-HRMapplications. Ruel and Kaap (2012) aimed to clarify therelationship between e-HRM usage and HR value creationby considering contextual factors. A sample of 450 wascollected from three different large internationalorganisations of the Netherlands through e-mail and anonline questionnaire. This study clearly indicated thatcontextual factors moderates the relationship between e-HRM usage and HR value creation- as HRM facilitationincreases, the relationship between usage and HRM valuecreation becomes weaker.
Pant et al. (2012), in their conceptual study, provided aframework for e-HRM implementation. The exceptionalsuccess of e-commerce systems motivated organisationsto make use of e-HRM systems. These systems havecreated dramatic changes in the HR department along withimprovement in performance. Through this study, theauthors have tried to assess the benefits of implementinge-HRM systems. They have also tried to find the factorsthat influence the relationship of e-HRM implementationwith its benefits. More recently, Subhashree and Vasantha(2020), in their study, reviewed previous literature relatedto the adoption of e-HRM. The study discussed theimportance of automation of tasks which reduces theburden on HR and saves time. The study also found that themost important factors influencing e-HRM adoption werethe implementation of IT infrastructure and the expertiseof employees in the field of IT. Earlier, Al-kasasbeh et al.(2016) focused on a review of the literature regarding

SCMS Journal of Indian Management, January-March - 2021 39
A Quarterly Journal
electronic human resource management and proposed amodel to integrate variables of e-HRM, workforce agilityand organisational performance. This was a conceptualstudy. The result of the review was employed to developthe study’s theoretical framework. The framework of thestudy comprised of integrating literature and models ofelectronic human resource management, e-HRMimplementation at the firm level, organisationalperformance and workforce agility. Guenter et al. (2014)aimed to provide a conceptual framework for understandinghow delays in information exchange negatively impactedemployee outcomes. This was a conceptual study. It wasfound that managers and co-workers should focus onrestoring control in employees in order to prevent delaysand deterioration of workplace relationship. Delay ininformation exchange and its impact on co-workerrelationship was important for researchers who studiedtemporal events at work as well as managers structuringworkplace interactions. Similarly, Findikli and Bayarcelik(2015) focused on the perspectives for choosing theapplications and perspectives about e-HRM for the system.A descriptive study was conducted for the research. Aqualitative method with an open-ended questionnaire andsemi-structured interviews was used. A limited number ofrespondents in the company were chosen from only theHR department without involving any level of managementhierarchy or other departments. The study found that theprimary motivators for e-HRM applications were timemanagement, ease of acquiring, access to personal data andreduced administration cost. Nagendra and Deshpande(2014) found that to increase the effectiveness of HRplanning, HRIS (Human Resource Information System)needs to offer more intelligent capabilities. The authorstried to investigate the contribution of HRIS subsystem,to the training recruiting subsystem, to the workforceplanning of an organisation, and to the development of theworkforce of an organisation through HRIS. Primary datawas collected from a sample that included 50 senior andjunior HR managers/ executives in three organisations inPune. The findings of the paper clearly showed that seniorHR executives were well aware that they can increase theefficiency of HR planning through HRIS.
2.2 Factors influencing e-HRM implementation
Sindu (2018) tried to find how various factors influenceorganisational culture in the adoption of e-HRM systems.The study made use of previous literature and models inorder to find the impact of these factors. These includedthe Yale model of communication and persuasion, Theoryof Planned Behaviour and Technology Acceptance Model.On the basis of previous literature, it was found thatactorial, external and organisational factors influence e-HRM implementation. Heikkila (2013) studied theapplication of e-HRM and strategic IS (InformationSystem). They also focused on how normative, cognitiveand regulative institutional dimensions in MNC (Multi-National Companies) subsidiaries in China affect western-based e-HRM practices. Interview data from Beijing andShanghai related to key informants in 10 MNC subsidiarieswas collected. The study found that institutional pressurescreated both negative dysfunctional and positivetransformational consequences for subsidiaries. They alsofound that the ability of the information system to achieveits strategic potential was based on subsidiary responsesto these substantial pressures. Al-Dmour et al. (2013) usedcontent analysis to collect data regarding the adoption andimplementation of HRIS (Human Resource InformationSystem). The authors found that many researchers had triedto find the factors affecting HRIS implementation. Theauthors categorised them as internal and external factorsof the environment. However, it was found that many ofthe studies had conflicting results. Later, Azhar Naima(2019) conducted a study in Iraq to find the factors thatinfluence the acceptance of e-HRM. The data was collectedusing a two-part questionnaire from a sample of 332respondents. Random sampling was used for datacollection. On applying regression analysis, the results ofthe study revealed that industry support, managementsupport, IT expertise, compatibility, complexity andemployee attributes influence the adoption of e-HRM.Earlier, Masum (2015) identified the factors influencingthe adoption of e-HRM in Bangladeshi Banks. A sample of265 bank employees was taken using stratified randomsampling. A pre-tested questionnaire was used to collect

SCMS Journal of Indian Management, January-March - 2021 40
A Quarterly Journal
the data. The results of the study showed that industrypressure, IT infrastructure, management support andcompatibility, and individual attributes had an influence onthe adoption of e-HRM in banks of Bangladesh. Ibrahimand Yusoff (2015) investigated the antecedent factors oftechnostress towards e-HRM in government agencies ofMalaysia. Semi-structured interviews were conducted withseven HRMIS (Human Resource Management InformationSystem) experts in three state governments agencies ofMalaysia. The findings of the paper focused on theimplementation of HRMIS in Malaysian governmentagencies and solving the problem of training anddevelopment program. The HRMIS experts were of the
opinion that three characteristics (attitude, technology
readiness and readiness for change) were all related tocomponents of technostress. Later, Rahman et al. (2018)
researched on the Bangladeshi government organisations
regarding e-HRM implementation. They tried to find theinfluence of various factors like social, legal, economic,
political, organisational, environmental and technological.
The study used a case study method as a part of qualitativeresearch. Two government organisations were used as part
of the study. The study busted certain myths surroundingthe slow implementation of e-HRM in government agencies.
It also provided empirical data for further research.
2.3. Research Gap
The above literature review on e-HRM shows that there is
a gap in the understanding of the e-HRM practices in theIT organisation. There is a need to explore the e-HRM
practices used in IT organisation and the factors which
affect the e-HRM. e-HRM practices focus on how theorganisation can facilitate the employer-employee
relationship by using information technology. E-HRM and
its implementation have been studied in various sectorslike manufacturing/mining, banking, hotels etc. There is a
need to study the e-HRM and the factors affecting it in IT
organisations as well.
2.4. Objective of the Study
To find the factors influencing the effective
implementation of e-HRM in IT organisations.
3. Research Methodology
3.1 Sample size and population
The study used a descriptive research design. The data was
collected from IT companies located in the National
Capital Region, India. A sample of 320 IT employees wastaken using a non-probability sampling technique. A sample
of above 300 was taken as it is considered to be a good
sample size (Comrey & Lee, 1992). The mail-ids ofemployees were obtained for mailing the questionnaire.
3.2 Data collection
Primary data was collected using a structured questionnaireusing online Google forms. Secondary data was collected
from research papers, books, magazines using keywords
such as “e-HRM”, “factors affecting e-HRM”,“implementation of e-HRM”. The data was collected from
May 2020 to August 2020.
3.3. Measures
The questionnaire consisted of two sections the first
section included statements related to factors influencing
the effective implementation of e-HRM in IT organisations.In the second section demographic information of the
respondents was recorded. The statements were developed
by researchers using previous literature and expert opinion.Initially, a total of 40 statements were developed, but only31 statements were used in the final questionnaire. Theitems were measured on a 5-point Likert scale ranging from1 “strongly disagree” to 5 “strongly agree”.

SCMS Journal of Indian Management, January-March - 2021 41
A Quarterly Journal
Table 1: Demographic Profile of IT employees
Table 2: KMO and Bartlett’s Test
4.1. Factor Analysis
Before applying factor analysis, the values of KMO andBartlett’s test of sphericity were checked. As seen fromthe table, the value of KMO was .766 and the significance
Source: Survey by authors
value (p<.001) of Bartlett’s test of sphericity was less than.05. As both the values were within range (Nunnally, 1978)
factor analysis could be applied.
Source: Survey by author
4. Results
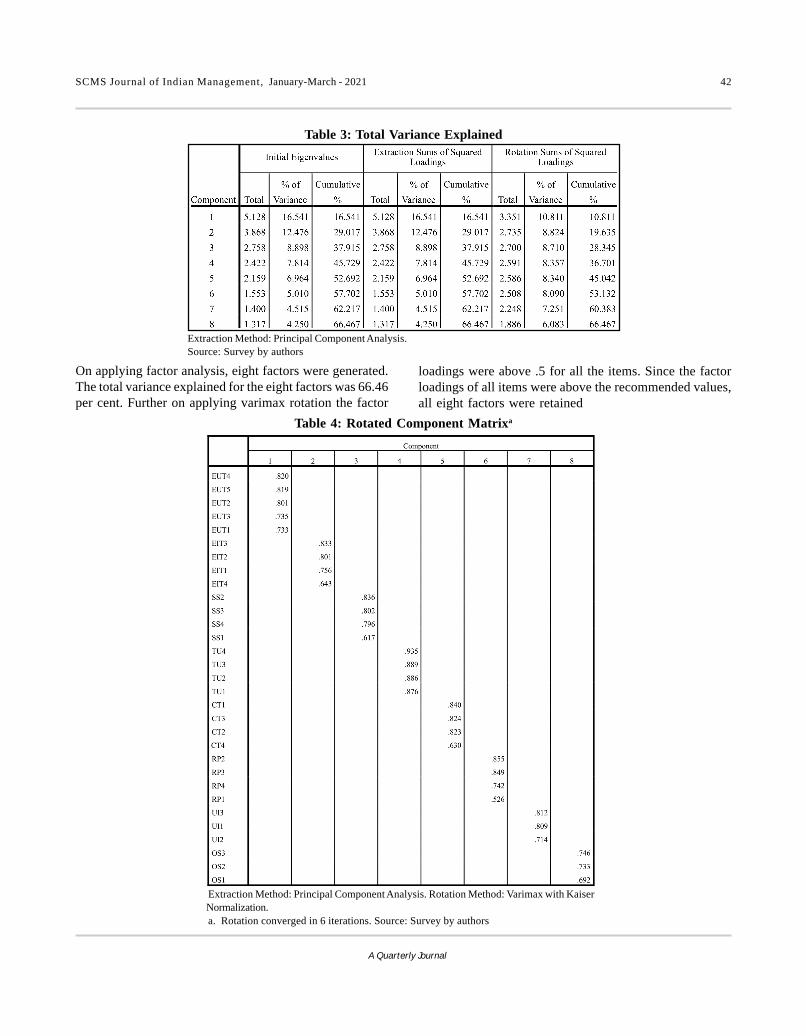
SCMS Journal of Indian Management, January-March - 2021 42
A Quarterly Journal
Table 4: Rotated Component Matrixa
On applying factor analysis, eight factors were generated.The total variance explained for the eight factors was 66.46per cent. Further on applying varimax rotation the factor
loadings were above .5 for all the items. Since the factorloadings of all items were above the recommended values,all eight factors were retained
Table 3: Total Variance Explained
Extraction Method: Principal Component Analysis.Source: Survey by authors
Extraction Method: Principal Component Analysis. Rotation Method: Varimax with KaiserNormalization.a. Rotation converged in 6 iterations. Source: Survey by authors

SCMS Journal of Indian Management, January-March - 2021 43
A Quarterly Journal
Table 5: Factor Analysis
TU (TECHNOLOGY USEFULNESS) CR=.81, AVE=.93

SCMS Journal of Indian Management, January-March - 2021 44
A Quarterly Journal
Source: Survey by authors
The eight factors generated were as follows:
FACTOR 1: EUT (EASE OF USE OF TECHNOLOGY)
Ease of use of technology was the first factor. The valueof Cronbach’s alpha for this factor was .861 (asrecommended by Hair et al., 2014). This was the mostimportant factor because the eigen value and the total
variance explained was the highest for this factor. The eigenvalue was 5.12 and the total variance explained was 10.81.The value of AVE and CR was .61 and .88 respectively. Thus,the factor was both valid and reliable. In this factor thetotal number of five statements were included. Thestatements include: “e-HRM is easy to use, so I can followall the useful information, ease of use of e-HRM increaseusefulness that expected to it, if e-HRM is easy to use this

SCMS Journal of Indian Management, January-March - 2021 45
A Quarterly Journal
will increase staff administration to use it, perceivedusefulness of e-HRM increase the interest to use it, staffacceptance of e-HRM is proof that system is easy to use”(Voermans & Veldhoven, 2007).
FACTOR 2: EIT (EXPERIENCE OF INFORMATIONTECHNOLOGY)
Experience of information technology was the secondfactor. The alpha value of the four statements of this factorwas 0.836. The total percentage of variance explained bythis was 8.82 and the eigen value was 3.8. Here also, thevalue of AVE and CR was above the recommended value of.5 and .8 respectively. This factor also included the fourstatements as: “ICT device which are available in theorganisation enough to use e-HRM, the employee has theability and skills to use e-HRM system, Employee mustbe trained continuously to reduce perceived risk of e-HRMsystem, the availability of computers and moderncommunications tools can reduce the risk of e-HRM” (Pantet al., 2012).
FACTOR 3: SS (SECURE SYSTEMS)
Secure system was analysed as the third factor through thefactor analysis. The Cronbach’s alpha of system securitywas .806. The total variance explained and the eigen valuewas the second-highest for this factor. The eigen value was2.7 and the total variance explained was 8.71. The value ofAVE and CR was .58 and .84 respectively. This factorincluded four statements. The statements were: “High levelof system security reduces the risk of e-HRM, I need moretraining on the e-HRM system to reduce mistakes andincrease my knowledge of the tools available in it, e-HRMsystem should not take time to perform tasks through it toincrease system efficiency, less time needed to use e-HRM increase system usefulness” (Rahman et al., 2018).
FACTOR 4: TU (TECHNOLOGY USEFULNESS)
Technology usefulness was the fourth important factor inthe analysis. The value of Cronbach’s alpha for this factorwas .814. The eigen value and total variance explained was2.4 and 8.35 respectively. The value of AVE and CR was.81 and .93 respectively. The technology usefulness factorincluded four statements. The statements were: “Theconcept of e-HRM is clear, perceived usefulness of e-
HRM increase staff attitude to use it, perceived usefulnessof e-HRM increase staff behaviour intention to use it, usinge-HRM reduce employee mistakes in the work” (Voermans& Veldhoven, 2007).
FACTOR 5: CT (COMMUNICATION TOOLS)
Communication tools was the fifth factor. The Cronbach’salpha value of this factor was .798, which was above thecutoff of .7. The total variance explained and the eigen valuewas 8.34 and 2.15. Here also, the value of AVE and CR wasabove the recommended value of .5 and .8 respectively.This factor included the four statements and thesestatements were as: “The lack in using communication toolsreduces employee’s intention towards e-HRM, the lack inusing communication tools increase e-HRM perceivedrisks, Employee must be trained continuously to reduceperceived risk of e-HRM system, the availability ofcomputers and modern communications tools can reducethe risk of e-HRM” (Pant et al., 2012; Azhar Naima, 2019).
FACTOR 6: RP (RISK PERCEPTION)
Risk perception was the sixth factor generated throughfactor analysis. The value of Cronbach’s alpha for perceivedrisk was .798. The value of AVE and CR was .56 and .83respectively. In this factor four statements were included.These statements were: “e-HRM must be difficult andcomplex to reduce perceived risk, my attitude decline ife-HRM system is not secured, perceived usefulness of e-HRM increase when perceived risk is decreased, e-HRMsystem within an organisation is clear and highly secure”.The eigen value of this factor was 1.55 and the total varianceexplained was 8.09 (Voermans & Veldhoven, 2007).
FACTOR 7: UI (USAGE INTENTION)
Usage intention was the seventh important factor of theanalysis. The Cronbach’s alpha value of this factor was .747.The total variance explained by this factor was 7.25 andthe eigen value was 1.4. Here also, the value of AVE andCR was above the recommended value of .5 and .8respectively. The usage intention factor included thefollowing three statements: “Perceived usefulness of e-HRM increase my desire to use it, I intend to use orcontinue to use e-HRM system, Employee adoption of e-HRM increase colleagues’ intention to use” (Rahman etal., 2018).

SCMS Journal of Indian Management, January-March - 2021 46
A Quarterly Journal
FACTOR 8: OS (ORGANIZATIONAL SUPPORT)
Organisational support was the eighth and the last factorof the analysis. The alpha value of this factor was .735.The total variance explained was 6.08 and the eigen valuewas 1.3. Here also, the value of AVE and CR was above therecommended value of .5 and .8 respectively. This factorincluded the three statements and these statements were:“The organisation support to use e-HRM system increaseemployees’ intention to use it, the organisation decisionsadoption of e-HRM reinforce employees’ attitude to useit, the organisation depends on the e-career system toattract the employees” (Azhar Naima, 2019).
5. Discussion
In the context of the current study, it was found that e-HRM includes eight factors that were found to have asignificant impact on its effective implementation. Thesefactors included ease of use of technology, experience ofinformation technology, secure systems, technologyusefulness, communication tools, risk perception, usageintention and organisational support. These factors werecritical to the implementation of e-HRM. Numerousresearchers revealed that there were similar factors thataffected e-HRM implementation (Voermans & Veldhoven,2007; Pant et al., 2012; Rahman et al., 2018; Azhar Naima,2019). The researchers had worked on different factorsincluded ease of use of technology, technology usefulness,risk perception (Voermans & Veldhoven, 2007), experienceof information technology, communication tools (Pant etal., 2012), secure systems, usage intention (Rahman et al.,2018), communication tools and organisational support(Azhar Naima, 2019). Among these, the most importantfactor was the ease of use of technology which was foundto be having the highest value of explained variance thatwas more than 10 per cent. Employees of organisations,especially IT organisations in this case, find it suitable touse e-HRM as it is an easy-to-use technology. It makestheir work simpler and convenient. No previous study hadfound all these factors contributing together to theeffective implementation of e-HRM. Thus, the study madea significant contribution to the field of e-HRM byexploring the major factors affecting e-HRM.
6. Conclusion
The implementation of e-HRM has been influenced by anumber of factors. Previous authors have given factors like
security, the expertise of employees, infrastructure etc.,as the main factors. In this study, the authors also tried tostudy factors affecting e-HRM implementation from theperspective of IT employees. The study revealed that therewere primarily eight factors that were influential in e-HRMimplementation. These factors included ease of use oftechnology, experience of information technology, securesystems, technology usefulness, communication tools, riskperception, usage intention and organisational support. Theorganisations should take care of these aspects whenimplementing e-HRM so that the process can besmoothened.
7. Implications
The present study provided some useful implications fororganisations and HR managers. The successful e-HRMimplementation requires that the employees should havesecure systems and communication tools. Next,organisational support was another important aspect thatshould be taken care of as the adoption of e-HRM requiresthat the employees should have the required support.Further, organisations should try to involve people withexperience in information technology to initiate successfule-HRM implementation. The HR managers should also takean assessment of the risks involved when implementing e-HRM. These risks may be related to lack of technologicalsupport, lack of coordination between departments,shortage of skilled staff and training facilities.Organisations should try to overcome these risks for thesmooth implementation of e-HRM.
8. Limitations
The study was conducted only in the IT organisations ofIndia and cannot be generalised to other industries. Thestudy was conducted through questionnaires and thus wassubject to respondent bias.
9. Future Research
The present study focused only on the IT sector. But e-HRM is used in many other sectors also like banking,hospital, education, manufacturing, hotels, forecasting andmany others which can also be studied in future. Themajority of the respondents in the present study belongedto the younger age-group. There is a scope in future tostudy the adoption of technology among the senioremployees working in an organisation.

SCMS Journal of Indian Management, January-March - 2021 47
A Quarterly Journal
References
Al-Dmour, R. H., Love, S., & Al-Zu’bi, Z. “Factorsinfluencing the adoption of HRIS applications: Aliterature review”. IJMBS, 34, (2013): pp. 9-26.
Al-kasasbeh, A. M., Halim, M. A. S. A., & Omar, K. “E-HRM, workforce agility and organisationalperformance: A review paper toward theoreticalframework”. International Journal of AppliedBusiness and Economic Research, 14(15), (2016):pp.10671-10685.
Azhar Naima, M. “Factors Affecting the Acceptance of E-HRM in Iraq”. International Journal of AcademicResearch in Business and Social Sciences, 9(2),(2019).
Comrey, A. L., & Lee, H. B. (1992). A first course in factoranalysis (2nd Edition), Hillsdale, NJ: LawrenceErlbaum.
Fýndýklý, M. A., & Beyza Bayarçelik, E. “Exploring theoutcomes of Electronic Human ResourceManagement (E-HRM)?”. Procedia-Social andBehavioral Sciences, 207, (2015): pp. 424-431.
Guenter, H., van Emmerik, I. H., & Schreurs, B. “Thenegative effects of delays in information exchange:Looking at workplace relationships from anaffective events perspective”. Human ResourceManagement Review, 24(4), (2014): pp. 283-298.
Hair, J. F., Black, W. C., Babin, B. J., & Anderson, R. E.“Multivariate Data Analysis. Exploratory DataAnalysis in Business and Economics”. PearsonNew International Edition, (2014), https://doi.org/10.1007/978-3-319-01517-0_3
Heikkilä, J. P. “An institutional theory perspective on e-HRM’s strategic potential in MNC subsidiaries”.The Journal of Strategic Information Systems,22(3), (2013): pp. 238-251.
Ibrahim, H., & Yusoff, Y. M. “User characteristics asantecedents of techno stress towards EHRM: Fromexperts’ views”. Procedia-Social and BehavioralSciences, 172, (2015): pp. 134-141.
Masum, A. K. M. “Adoption Factors of Electronic HumanResource Management (e-HRM) in BankingIndustry of Bangladesh”. Journal of SocialSciences/Sosyal Bilimler Dergisi, 11(1), (2015).
Nagendra, A., & Deshpande, M. “Human ResourceInformation Systems (HRIS) in HR planning anddevelopment in mid to large sized organisations”.Procedia-Social and Behavioral Sciences, 133,(2014): pp. 61-67.
Nunnally, J. C. Psychometric Theory. New York: Mc GrawHill, (1978).
Panayotopoulou, L., Galanaki, E., & Papalexandris, N.“Adoption of electronic systems in HRM: Isnational background of the firm relevant?”. NewTechnology, Work and Employment, 25(3),(2010): pp. 253-269.
Panayotopoulou, L., Galanaki, E., & Papalexandris, N.“Adoption of electronic systems in HRM: Isnational background of the firm relevant?”. NewTechnology, Work and Employment, 25(3), (2010):pp. 253-269.
Pant, S., Chatterjee, A. & Jaroliya, D. “e-HR systemsimplementation: a conceptual framework”. AMCIS2008 Proceedings, 338, (2012).
Rahman, M., Mordi, C., & Nwagbara, U. “Factorsinfluencing E-HRM implementation in governmentorganisations”. Journal of Enterprise InformationManagement, (2018).
Ruël, H., & Van der Kaap, H. “E-HRM usage and valuecreation. Does a facilitating context matter?”.German Journal of Human ResourceManagement, 26(3), (2012): pp. 260-281.
Sindu, M. “Adoption and implementation factors for theestablishment of e-HRM systems”. InternationalJournal of Scientific Development and Research,3(11), (2018): pp. 172-176.
Stone, D. L., & Dulebohn, J. H. “Emerging issues in theoryand research on electronic human resourcemanagement (eHRM)”, (2013).
Strohmeier, S. “Research in e-HRM: Review andimplications”. Human Resource ManagementReview, 17(1), (2007): pp. 19-37.
Subhashree, V. and Vasantha. “Influence of IT Infrastructureand IT Expertise on E-HRM Adoption”.International Journal of Scientific & TechnologyResearch, 9(01), (2020): pp. 585-589.
Voermans M. and Veldhoven M. V. “Attitude towards E-HRM: an empirical study at Philips”, EmeraldPersonnel Review, 36(6), (2007): pp. 887-902.
************

SCMS Journal of Indian Management, January-March - 2021 48
A Quarterly Journal
Working Capital Management as aDeterminant of Financial
Performance: Accounting vsMarket-based Approach
Abstract
The present study analyses the influence of working capital management on the financial performance of Indian healthcare
companies. Considering a sample of 211 listed companies over a reference period of 10 years (2010 – 2019), the study
examines the effect of inventory holding period and net receivable period on accounting (measured by return on assets
– ROA) as well as stock market (measured by Tobin’s Q ratio) based measures. Findings, based on panel data regression
along with fixed and random effects estimation, have presented dynamic effects of working capital management and
firm performance. The inventory holding period has reported a significant negative impact on ROA, whereas it has a
strong positive effect on Tobin’s Q ratio. On the contrary, the net receivable period has a negative effect on both
measures but lacks statistical significance. The outcome of the current research will assist managers to understand the
relevance of liquidity management, and it also bridges the gap in the existing literature by contributing to the pool of
knowledge.
Keywords: Working Capital, Return on Assets, Tobin’s Q, Healthcare, Panel data regression
Abstract
Rajesh DesaiAssistant Professor
Chimanbhai Patel Institute of Management & ResearchAhmedabad – 380015, Gujarat
Email: [email protected]

SCMS Journal of Indian Management, January-March - 2021 49
A Quarterly Journal
1. Introduction
Functions of corporate finance are categorised intofour major groups, i.e. investment, financing, workingcapital and dividend decision. Investment and financing areassociated with a long-term horizon and are non-recurringfunctional areas. On the other hand, working capitalmanagement (WCM) is more concerned with the operatingactivities of business and is more episodic than otheraspects. The quest for working capital starts with theprocurement of raw material, transforming them intofinished goods to cash collection from debtors (Soukhakian& Khodakarami, 2019). The importance of WCM has beenrecognised in financial literature and is evidenced by amplecontribution by past researchers (Deloof, 2003; Lazaridis& Tryfonidis, 2006; Garcia-Teruel & Martinez-Solano,2007; Muhammad, Jan, & Ullah, 2008; Aggarwal &Chaudhary, 2015; Afrifa & Tingbani, 2018). In practice,WCM is a process of striving for a balance betweenliquidity and profitability. Lowering investments in currentassets such as stock and receivables can reduce cost andimprove profitability (Afrifa & Tingbani, 2018), whereasdisproportionate investment in current assets yieldssuboptimal returns (Raheman & Nasr, 2007). Efficientmanagement of WCM can assist in maximisation of firms’value (Deloof, 2003) and have a critical impact onprofitability and risk of the firm (Garcia-Teruel &Martinez-Solano, 2007).
Conventionally, the influence of WCM on profitability hasbeen analysed using operating profit and return on assets(ROA) as a measure (Raheman & Nasr, 2007; Rahman,2011; Vijayakumaran & Atchyuthan, 2017) which furtherextended to market-based measures like Tobin’s Q ratio(Abuzayed, 2012; Afrifa & Tingbani, 2018). The presentresearch work is aimed at assessing the effect of WCM onthe financial performance of the Indian healthcare industry.The current study differs from existing work in two ways.Firstly, it adopts ‘net receivables period’ as a novel measureof WCM, as firms always attempt to balance betweenaccounts receivable and payable period to reduce the needfor excessive working capital financing; hence, the netperiod should be used due to offsetting effects. Secondly,the study examines the effect of WCM on accounting aswell as market-based financial performance in the contextof the Indian healthcare industry. Besides, past studies haverevealed contradictory results, such as the research findings
of Ganesan (2007), Ramachandran and Janakiraman(2009), Aggarwal and Chaudhary (2015) and Vartak andHotchandani (2019) have concluded that WCM has anegative effect on profitability whereas Muhammad et al.,(2008), Sharma and Kumar (2011) and Makori and Jagongo(2013) have reported a positive impact. Such differingresults create a need for further probing in this area.
The present article has been organised as follows. The firstsection highlights the theoretical foundation of WCM andits importance in research as well as corporate practice.The second section briefly describes the Indian healthcareindustry, along with its position in the Indian economy. Areview of past literature has been summarised in the thirdsection, followed by the research methodology adoptedfor conducting research. Further, data analysis, scope offuture research and concluding comments are included atthe end.
1.1 Indian Healthcare Industry
Healthcare has become one of the largest sectors in Indiain terms of revenue as well as employment. The industrystood as the fourth largest employer in India in 2017 byemploying more than 0.3 million people. The Indianhealthcare sector is expected to grow at a CAGR of 22%by the fiscal year 2022 and will reach a size of USD 372billion. Besides, the medical equipment and hospitalindustry will record a CAGR of 16% and will cross USD143.82 billion by FY2022. Favourable demographicconditions such as increasing income, improving healthattentiveness, lifestyle diseases and access to healthinsurance facilities are major growth drivers of this industryin India. The healthcare industry contributes nearly 14%to the nations’ GDP, which is expected to increase to 19.7%by 2027.
Government and regulatory support is also acting as a majordeterminant of growth in the healthcare industry. Publicexpenditure on the health industry has grown at 1.4% ofGDP in FY 2018, which will reach 2.5% by 2025. Policiessuch as allowing FDI, tax advantages on life-savingequipment, healthcare education and training, NationalNutrition Mission and such other initiatives have witnessedencouraging steps of regulators. High potential andfavourable government schemes attract competitors, andthat leads to increasing mergers and acquisitions (M&A)

SCMS Journal of Indian Management, January-March - 2021 50
A Quarterly Journal
deals. In FY2019, the total value of M&A in the healthcaresector has recorded a 155% increment and crossed USD1 billion. Cost-effective medical services have attractedmedical tourism and the establishment of internationalR&D centres. Growing demand, coupled with a favourableregulatory environment, are major success drivers of thehealth care industry.
2. Review of Literature
WCM practices and their impact on financial performancehas been studied extensively by researchers using differentapproaches. The majority of research work has focused onassessing the effect of WCM on accounting-basedperformance indicators such as gross operating profit, netoperating profit, ROA and return on equity (ROE). Further,several researchers have concentrated on WCM andmarket-based performance measures like Tobin’s Q ratio.Besides, few research articles have moderated theinfluence of WCM on firm performance by macro-economic variables such as GDP growth and inflation. Thepresent section summarises the findings of past researchwork by classifying them into three broad categories asdiscussed.
2.1 WCM and Accounting based Financial Performance
Financial performance of business, as indicated bymeasures like gross profit margin, net operating profit,ROA, ROE, and earnings per share, is based on informationrecorded in the books of accounts. Deloof (2003) hasconsidered gross operating income as a measure of firms’performance. He has concluded that profitability can beimproved significantly by reducing receivable days andinventory conversion period. Hindered collections resultin a cash deficit which further leads to delay in paymentsto creditors. Lazaridis and Tryfonidis (2006) havesupported the findings of Deloof (2003) and proved theadverse effect of a longer cash conversion cycle (CCC)on profitability. The extension of credit to the customermay lead to collection delinquencies and bad debts. Toincorporate this adverse effect, gross profitability shouldbe replaced by net profitability, i.e. net operating profit.Raheman and Nasr (2007) and Ramachandran andJanakiraman (2009) have considered net operating profitas a measure of financial performance. They have shownthe strong negative effect of various components of
working capital management on operating profit, indicatingthat longer conversion cycles adversely affect financialperformance. Firms with lower profitability are persuadedto reduce the credit period allowed to customers to bridgethe gap between cash requirement and its availability(Ramachandran & Janakiraman, 2009).
Profitability, when expressed as a percentage of assets orinvestments, enables peer comparison and assists indecision making. ROA has been one of the most widelyused measures of accounting-based financial performance(Chowdhury & Amin, 2007; Rahman, 2011; Makori &Jagongo, 2013; Gaur & Kaur, 2017). However, Deloof(2003) advocated for the use of operating income ratio tomeasure financial performance. But, ROA incorporates theoperating profits of the company as well as utilisation ofavailable assets in generating such profits (Makori &Jagongo, 2013) and hence can be viewed as a comprehensivemeasure of profitability (Padachi, 2006). Following thepast studies from Senanayake, Dayaratna, and Semasinghe(2017) and Vartak and Hotchandani (2019), the study adoptsROA as the accounting-based measure of financialperformance. Liberal credit policy can increase sales whichfurther boosts profitability, but it also extends the CCC,which is used as a wide-ranging measure of WCM of thefirm. Hence, companies have to trade-off betweenprofitability and liquidity. Higher cash holding enablescompanies to avoid high-cost financing and also providesautonomy in decision making (Vijayakumaran &Atchyuthan, 2017). Sharma and Kumar (2011) haveconcluded a similar positive relationship for Indiancorporates by considering a large data set of 263 listedcompanies. The direct relationship between profitabilityand CCC is quite uncommon in empirical research and hasbeen contradicted by the findings of Rahman (2011), Goeland Jain (2017) and Vartak and Hotchandani (2019). Alonger conversion cycle may be the result of inefficiencyin the production process and delay in receiving payments.CCC as a composite measure cannot assist in decisionmaking directly because of its inclusiveness, and therefore,it has to be broken down into sub-parts, namely stockconversion period (SCP), receivable payment period (RPP)and creditor disbursement period (CDP). Research studiesfrom Ganesan (2007), Muhammad et al. (2008) andAggarwal and Chaudhary (2015) have augmented the single

SCMS Journal of Indian Management, January-March - 2021 51
A Quarterly Journal
measure of WCM, i.e. CCC, by incorporating activity-wiseconversion time to assist managerial decision making.Holding inventory for a longer span of time is an indicatorof poor financial performance as firms with deterioratingprofits find their stock level intensifying (Deloof, 2003;Garcia-Teruel & Martinez-Solano, 2007; Sharma & Kumar,2011). The delay in payments adversely affects theprofitability and credit worthiness of an organisation, andhence profitable firms prefer to discharge their obligationson time (Vartak & Hotchandani, 2019). On the contrary,loss-making firms struggle to pay their dues and hencelonger CDP adversely affects profitability (Ganesan, 2007;Muhammad et al., 2008; Seyoum, Tesfay, & Kassahun,2016). In addition to the phases of operating cycle and timeperiod involved, the working capital policy can be analysedusing an activity ratio expressed as a frequency rather thannumber of days. Rehman and Anjum (2013) and Gaur andKaur (2017) have considered current ratio, acid-test ratio,current assets to total assets and current assets to salesratio as exploratory variables and assessed their impact onfinancial performance. Both research studies haveconfirmed a positive relationship between working capitalmanagement and the profitability of firms. Collectively,this section highlights the significant impact of WCM onfirms’ performance; however, it also reveals that theresearch findings are not consistent.
2.2 WCM and Tobin’s Q Ratio
Maximisation of shareholders’ wealth is the central areaof all financial decision making. The wealth of shareholdersis expressed by the market value of the firm derived fromthe price of its equity shares listed on the capital market.Accounting measures cannot express the response ofinvestors on firms’ business practices, and hence it isinevitable to study the effects of financial practices suchas capital budgeting, capital structure, dividend and workingcapital management on the market value of the firm.Further, the profitability of the firm is an outcome ofhistorical revenue, whereas firm value is an estimationbased on expected future revenue. Hence, the linkagebetween firm value and WCM may differ from that ofprofitability and WCM (Abuzayed, 2012). Firm value canbe measured by market-based performance indicators asP/E ratio, market-to-book value ratio, and Tobin’s Q ratio.Out of these, Tobin’s Q ratio has been the most commonly
used measure in past studies (Nazir & Afza, 2009;Abuzayed, 2012; Altaf & Ahmed, 2019). Q ratio capturesthe reputational value effects of firms WCM capabilitieson the performance (Afrifa & Tingbani, 2018), and it hasmore desirable distribution properties than other measures(McGahan, 1999). Therefore, following the extantliterature, the study considers the Q ratio as a measure ofmarket-based financial performance. Investors assess theefficiency of senior management in handling workingcapital issues, and the same has been reflected in the marketprice of shares. The findings of Abuzayed (2012) and Afrifaand Tingbani (2018) reveal that stockholders attach negativevalue to longer CCC as an investment in working capitalneeds external funds, which leads to borrowing cost. Nazirand Afza (2009) have examined the effect of working capitalinvestment (measured by current assets) and working capitalfinancing (measured by current liabilities) on shareholders’value creation and proved the significant positive effect ofaggressive financing policy on the Q ratio. On the otherhand, Altaf and Ahmed (2019) have found an inverted U-shaped relationship between Tobin’s Q ratio and workingcapital financing. They have concluded that a low (high)level of working capital finance through short-termborrowings improves (deteriorates) financial performance.The above discussion implies that shareholders considerWCM as value-relevant while evaluating a company’sperformance. But, this area has been less explored,especially in emerging economies like India.
2.3 WCM and Financial Performance moderated byMacro-Economic variables
Macroeconomic conditions affect the financialperformance of companies operating in a particularcountry. Favourable conditions such as increasing GDP,moderate inflation, virtuous balance of payments andexchange rates affect the profitability and investmentactivities in a progressive manner. One of the mostcommonly used proxies for macroeconomic conditionsis the annual growth rate in GDP (Garcia-Teruel &Martinez-Solano, 2007; Nazir & Afza, 2009; Abuzayed,2012; Soukhakian & Khodakarami, 2019). Garcia-Terueland Martinez-Solano (2007) have concluded the positiveand significant impact of GDP growth on ROA. Theconfidence of investors gets reinforced with the positivegrowth in GDP, which is reflected in the market value of

SCMS Journal of Indian Management, January-March - 2021 52
A Quarterly Journal
the firm (Nazir & Afza, 2009; Abuzayed, 2012). Soukhakianand Khodakarami (2019) have considered GDP growth andinflation rate as economic indicators and have concludedthe direct and significant effect of these variables onfinancial performance. However, they lack evidence tosupport the moderating effect of economic factors on firmperformance and WCM and have explained that the firm’sWCM policy depends on company-specific factors. Lastly,the section concludes that the moderating effect ofeconomic variables needs to be tested through furtherresearch.
2.4 Research Gap and Conceptual Model
Though substantial literature focusing on working capitaland firm performance is available, very limited research
work has concentrated on the linkage between WCM andshareholders’ wealth as well as the market value of the firm.Besides, empirical studies focusing on this point are notcarried out in the Indian context, especially in the healthcaresector. Moreover, past research work shows inconsistentresults so far as WCM and financial performance areconcerned. Hence, the current research will bridge the gapin the existing research by assessing the effect of WCMmarket based financial measures along with accountingmeasures. Figure – 1 presents the conceptual modelhighlighting the working capital, financial performancealong with firm-specific and macroeconomic controlvariables identified from the review of literature.
Figure 1. Conceptual Model
(Source: Developed by Author)
3. Research Methodology
3.1 Purpose, Variables of Study and Hypothesis
3The present research aims to analyse the effect of workingcapital management on accounting and market based
financial performance of selected healthcare sectorcompanies in India. The current study extends the researchwork of Nazir and Afza (2009) and Abuzayed (2012) in theIndian context. Based on the existing literature, the variablesof the study are divided into three categories, i.e. (i)

SCMS Journal of Indian Management, January-March - 2021 53
A Quarterly Journal
Controls, as the financial performance is affected by severalfirm-specific factors other than WCM; hence, revenuegrowth (RG), size (SZ), leverage (LV) and efficiencymeasured by asset turnover ratio (AR) are considered ascontrol variables. The annual percentage change in saleshas been proxied for growth (Gaur & Kaur, 2017), whereasthe size is measured by the natural log value of total assets(Vijayakumaran & Atchyuthan, 2017). Leverage iscomputed as the ratio of debt to assets (Makori & Jagongo,2013), and the asset turnover ratio is measured as sales tototal assets ratio. The present study adopts a descriptivemethodology of research and analyses the effect of WCMon financial performance. Following hypothesis areformed and eventually tested using empirical results.
H01
: SCP does not have a significant impact on ROAH
02: NRP does not have a significant impact on ROA
H03
: SCP does not have a significant impact on Tobin’sQ Ratio
H04
: NRP does not have a significant impact onTobin’s Q Ratio
3.2 Sampling Plan and Data Collection
The present study focuses on the Indian healthcare industry;hence all listed companies are considered for inclusion in
WCM, treated as the independent variable, has beenmeasured using the stock conversion period (SCP) and netreceivable period (NRP). As against past research work,CCC has been dropped as conclusions derived from it need
to be re-examined activity-wise for decision making. NRPis a novel measure calculated as the difference betweenthe receivables collection period and creditorsdisbursement period.
the sample. The empirical results are based on thesecondary data collected from the Centre for MonitoringIndian Economy (CMIE), Prowess and Ace Equity database.According to the CMIE database, 230 healthcarecompanies are listed on the Indian stock exchanges. Tocreate a balanced panel dataset for the study period of 10years (2010 – 2019), companies are selected using amultistage sampling technique. Continuous listing andavailability of data for selected variables throughout thestudy period are the primary filters of sample selection.Finally, 211 companies are selected based on therequirement, which creates an ultimate dataset of 2110firm-year observations.
3.3 Techniques of Data AnalysisFinancial data collected from secondary sources have beenanalysed using descriptive analysis, correlation andmultiple regression analysis. The data has been validatedfor assumptions like autocorrelation and multicollinearityusing the Durbin-Watson (DW) test and Variance InflationFactor (VIF), respectively. Panel data methodology has beenadopted as it incorporates the potential endogeneity ofvariables arising from unobserved firm heterogeneity,which is ignored in the ordinary least square method(Vijayakumaran & Atchyuthan, 2017). Fixed effects model
financial performance, (ii) working capital, and (iii) controlvariables.
Financial performance has been considered as thedependent variable. Accounting and market performance
has been measured by return on asset (ROA), and Tobin’s
Q (TQ) ratio, respectively and are computed as mentioned
below.

SCMS Journal of Indian Management, January-March - 2021 54
A Quarterly Journal
assess the firm-wise variation in intercept assuming sameslope, constant variations, and time-invariant individualeffects whereas random-effects model treats individualintercept as a random variable with mean value á
and express
intercept of each company as αi =
α +
εi where ε
i is a random
Fixed Effects Model
ROAit = α
i + β
1SCP
it + β
2NRP
it + β
3RG
it + β
4SZ
it + β
5LV
it + β
6AR
it + u
it
TQit = α
i + β
1SCP
it + β
2NRP
it + β
3RG
it + β
4SZ
it + β
5LV
it + β
6AR
it + u
it
Random Effects Model
ROAit = α + β
1SCP
it + β
2NRP
it + β
3RG
it + β
4SZ
it + β
5LV
it + β
6AR
it + ε
i + u
it
TQit = α + β
1SCP
it + β
2NRP
it + β
3RG
it + β
4SZ
it + β
5LV
it + β
6AR
it + ε
i + u
it
Where,
α = Intercept
β1 to β
6 = Regression coefficients
uit = stochastic error of firm i and year t
i = Number of Firms
t = Time period from 2010 – 2019
error with zero mean (Gujarati, 2003). The suitability offixed and random effects has been examined by a Hausmantest with the null hypothesis that a random-effects model isa better estimate than fixed effects. Following regressionmodels are formulated considering financial performance asthe dependent variable and WCM as the independent variable.
Table 1. Descriptive Statistics
Source: Compiled from SPSS Output
4. Data Analysis And Interpretation
4.1 Descriptive Results
Descriptive statistics that assist in analysing the data andits variability have been summarised in Table 1. Indianhealthcare companies generate an average ROA of 12.88%with a standard deviation of 7.88%, which indicatesmoderate volatility in returns. The mean and standarddeviation values of the Q ratio are 1.1014 and 0.6930,respectively, indicating quite satisfactory results. The
average stock holding period of selected companies isapproximately 67 days indicating a huge piling of inventoryin the industry. The average net receivable period is closeto 10 days, and its standard deviation is 38 days portrayingfirm-wise differences in collection and payment policies.The Healthcare industry has reported an average revenuegrowth of 15.71%, whereas its average debt ratio is only0.2805, from which it can be inferred that healthcarecompanies rely more on owners’ funds compared toborrowings.

SCMS Journal of Indian Management, January-March - 2021 55
A Quarterly Journal
4.2 Correlation Matrix
Results of Pearson correlation have been abridged in Table2, indicating linear relationships among the selectedvariables. A significant negative correlation has beenobserved between ROA and both WCM indicators. Theresults indicate that a higher length of operating cycle willadversely affect the financial performance of selectedcompanies. Reducing the storage period of inventory andminimising the gap between collection and payment dayscan significantly improve the profitability of firms. Pastresearch from Deloof (2003), Lazaridis and Tryfonidis(2006) and Sharma and Kumar (2011) has also supportedthe inverse relationship. Analysing the result for Tobin’s Qratio, NRP has an indirect relation, but it is not significant,and only inventory holding has a significant positive relationwhich is contradicting previous studies. An explanation forsuch results can be given as the current market value of afirm is an indicator of future returns, and investors analyseinventory holding jointly with revenue growth. Increasinginventories are associated with higher sales which canfurther improve operating profitability (Abuzayed, 2012)and gives a positive signal towards future profitability.Further, among control variables, sales growth, assetturnover, and leverage have significant relation with ROA,whereas Q ratio is significantly related with only leverageand turnover ratio.
Table 2. Correlation Matrix
4.3 Result of Econometric Models
To strengthen the conclusion on the effect of WCM onfinancial performance, multiple regression analysis has
been applied. Table 3 and Table 4 summarises the regressionoutput of Model 1 and Model 2, respectively. Therobustness of results has been analysed by estimating bothequations using fixed-effects as well as random effectsmethods, and the Hausman test has been applied to checktheir suitability. The results support (Significance value <0.05) rejection of the null hypothesis and confirms theapplicability of fixed-effects for both econometric models.Further, DW statistic and VIF values are also within theacceptable range (DW = 1.5 to 2.5; VIF < 10), indicatingthat any problem of autocorrelation and multicollinearityhas been controlled (Gujarati, 2003). The fit of regressionmodels has been tested using F-statistics, and itsprobability value (<0.01) shows that both models aresignificant.
The output of regression Model 1 (see Table 3) portraysthe negative impact of WCM variables on the profitabilityof selected companies. SCP has a significant adverse effecton ROA, whereas the impact of NRP has not been supportedby statistical significance. Holding inventory for a longerspan of time will increase the carrying cost that adverselyaffects the profitability of the firm. Likewise, increasingthe gap between collection and payments creates a liquiditycrunch and forces companies to resort to externalfinancing that leads to interest and procurement cost.Critical values of regression coefficients of SCP and NRPconcludes rejection of H
01 hypothesis whereas failed to
reject H02
hypothesis. The findings of the present researchcoincide with the conclusions drawn from the researchwork of Raheman and Nasr (2007), Ramachandran andJanakiraman (2009), Aggarwal and Chaudhary (2015) andGoel and Jain (2017). Makori and Jagongo (2013) havereported contradictory results and concluded the positiveeffect of stock holding on profitability as higher inventoryreduces the possibility of production interruption and lossof sales. Among the control variables, only leverage andasset turnover ratio are found to be significant, and leveragereported negative impact, whereas turnover ratio improvesprofitability. Further, the fixed effects model can explain56.30% variations in ROA, which is more than randomeffects validating the results of the Hausman test.
Source: Compiled from SPSS Output

SCMS Journal of Indian Management, January-March - 2021 56
A Quarterly Journal
Table 3. Regression Output of Model – 1 (ROA)
Source: Compiled from E-views Output
The effect of WCM on the market value of firm measuredby Tobin’s Q ratio has been highlighted in Table 4. Asagainst ROA, SCP has a significant positive impact on theQ ratio, demonstrating that investors attach favourablesignal to increasing inventory. Higher inventory reducesthe procurement and operating risk and ensures undisturbedproduction. Further, as explained by Abuzayed (2012), thegrowing inventory level is linked with increasing saleswhich improves the profitability of the firm. This willfurther strengthen the expectations of future returnsresulting in a positive effect on market value. Though thisis in contrast with conventional understanding, the extantliterature has not explored the relationship between theinventory holding period and Tobin’s Q ratio adequately.
Thus, these findings need further validation through futureinquiries in this direction. On the contrary, increasing NRPreduces the cash reserve of companies which could havebeen utilised for profitable investment opportunities andthereby maximising shareholders’ returns. Hence, NRP hasa negative impact on market performance, but the resultsare significant at a 10% level (Prob. value = 0.065).Hypothesis testing for Model 2 reveals a similar result asModel 1 and supports the rejection of the H
03 hypothesis,
and fails to reject the H04
hypothesis. The Asset TurnoverRatio has a positive and significant effect on Tobin’s Qratio as it indicates efficient utilisation of fixed assets.Other control variables are found to be insignificant.
Table 4. Regression Output of Model – 2 (Tobin’s Q)
Source: Compiled from E-views Output

SCMS Journal of Indian Management, January-March - 2021 57
A Quarterly Journal
5. Conclusion And Research Extentions
Working capital management is an indispensable part ofthe decision making under corporate finance. The efficientmanagement of current assets and current liabilities play avital role in determining the profitability and value of afirm. The present research article examines the impact ofworking capital management on the financial performanceof 211 healthcare companies in India by taking balancedpanel data for ten years (2010 – 2019). Using panel dataregression methodology, the study concludes the negativeand significant effect of working capital measured by theinventory holding period on the accounting performancemeasures, whereas market measures have been favourablyaffected by the same. The net receivable periods has anegative influence on profitability and market value, butthe relationship is significant at the 10% level. Hence, thefindings conclude that firms can maximise theirprofitability and value by managing their working capitaloptimally. The outcome of research work will helppractitioners to devise a suitable strategy for managingworking capital, and it also bridges the gap in the existingliterature by contributing to the pool of knowledge.
Though the present research attempts to provide acomprehensive view of WCM and financial performance,few areas still require further examination. The currentresearch does not include macroeconomic variables, whichcan be explored for future research. The conceptual modeldeveloped from the literature review can be empiricallytested with different industry datasets. Further, similarstudies can be conducted by concentrating on small andmedium enterprises (SMEs) as they are equally exposedto the problems of profitability and liquidity.
References
Abuzayed, Bana. “Working capital management and firms’performance in emerging markets: the case ofJordan.” International Journal of ManagerialFinance 8.2 (2012): 155-179.
Afrifa, G. A. and I. Tingbani. “Working capital management,cash flow and SMEs’ performance.” Int. J. Banking,Accounting and Finance 9.1 (2018): 19-43.
Aggarwal, Agrim and Rahul Chaudhary. “Effect of WorkingCapital Management on the Profitability of IndianFirms.” IOSR Journal of Business and Management17.8 (2015): 34-43.
Nufazil Altaf, Farooq Ahmad. “Working capital financing,firm performance and financial constraints: Empiricalevidence from India.” International Journal ofManagerial Finance (2019) https://doi.org/10.1108/IJMF-02-2018-0036
Chowdhury, Anup and Md. Muntasir Amin. “WorkingCapital Management practised in PharmaceuticalCompanies listed in Dhaka Stock Exchange.” BRACUniversity Journal IV.2 (2007): 75-86.
Deloof, Marc. “Does Working Capital Management AffectProfitability of Belgian Firms?” Journal of BusinessFinance & Accounting 30.3 & 4 (2003): 573-587.
Ganesan, Vedavinayagam. “An Analysis of Working CapitalManagement Efficiency in TelecommunicationEquipment Industry.” Rivier Academic Journal 3.2(2007): 1-10.
Garcia-Teruel, Pedro Juan and Pedro Martinez-Solano.“Effects of working capital management on SMEprofitability.” International Journal of ManagerialFinance 3.2 (2007): 164-177. <https://doi.org/10.1108/17439130710738718>.
Gaur, Reeti and Dr. Rajinder Kaur. “Impact of WorkingCapital Management on Firm Profitability: A Studyof select FMCG Companies in India.” IndianJournal of Accounting XLIX.1 (2017): 117-126.
Goel, Prof. Kushagra and Surya Jain. “Impact of WorkingCapital Management on Profitability: EmpiricalEvidence from Indian Textile Industry.” InternationalJournal of Management Studies IV.4 (2017): 78-92.
Gujarati, Damodar N. Basic Econometrics. 4th. New York:McGraw Hill, 2003.
India Brand Equity Foundation. Healthcare. New Delhi:IBEF, 2020, https://www.ibef.org/archives/industry/healthcare-reports/indian-healthcare-industry-analysis-january-2020 (Accessed on 24/02/2020)
India Brand Equity Foundation. Healthcare. New Delhi:IBEF, 2019, https://www.ibef.org/download/Healthcare-December-2019.pdf (Accessed on 20/01/2020)

SCMS Journal of Indian Management, January-March - 2021 58
A Quarterly Journal
Kumar, Sunil, Dr. Praveen Srivastava and Dr. S.K. Sinha.“An Empirical Study on efficiency of Working CapitalManagement of Indian Pharmaceutical Industry.”International Journal of Logistics & Supply ChainManagement Perspectives 3.3 (2014): 1253-1258.
Lazaridis, Dr. Ioannis and Dimitrios Tryfonidis. “Therelationship between working capital managementand profitability of listed companies in the AthensStock Exchange.” Journal of FinancialManagement and Analysis 19.1 (2006): 26-35.<http://ssrn.com/abstract=931591>.
Makori, Daniel Mogaka and , Ambrose Jagongo. “WorkingCapital Management and Firm Profitability:Empirical Evidence from Manufacturing andConstruction Firms Listed on Nairobi SecuritiesExchange, Kenya.” International Journal ofAccounting and Taxation 1.1 (2013): 1-14.
McGahan, A.M. “The performance of US corporations:1981–1994.” Journal of Industrial Economics, 47.4(1999): 373–398.
Muhammad, Malik, Waseem Jan and Kifayat Ullah.“Working Capital Management and Profitability AnAnalysis of Firms of Textile Industry of Pakistan.”Journal of Managerial Sciences VI.2 (2008): 155-165.
Nazir, Mian Sajid and Talat Afza. “A Panel Data Analysis ofWorking Capital Management Policies.” BusinessReview 4.1 (2009): 143-157.
Raheman, Abdul and Mohamed Nasr. “Working CapitalManagement and Profitability – Case of PakistaniFirms.” International Review of Business ResearchPapers 3.1 (2007): 279-300.
Rahman, Mohammad Morshedur. “Working CapitalManagement and Profitability: A Study on TextilesIndustry.” ASA University Review 5.1 (2011): 115-132.
Ramachandran, Azhagaiah and Muralidharan Janakiraman.“The Relationship between Working CapitalManagement Efficiency and EBIT.” ManagingGlobal Transitions 7.1 (2009): 61-74.
Rehman, Mobeen Ur and Naveed Anjum. “Determinationof the Impact of Working Capital Management onProfitability: An Empirical Study From the CementSector in Pakistan.” Asian Economic and FinancialReview 3.3 (2013): 319-332.
Senanayake, Mahasena, Banda O.G Dayaratna and D.M.Semasinghe. “The effects of working capitalmanagement on profitability, liquidity, solvency andorganic growth with special reference to SMEs: Areview.” International Journal of Accounting &Business Finance 3.2 (2017): 19-50.
“Trends in working capital management and its impact onfirms’ performance: An analysis of Sri Lankan smalland medium enterprises.” International Journal ofAccounting & Business Finance 3.1 (2017): 46-60.
Seyoum, Dr. Arega, Tadele Tesfay and Tadesse Kassahun.“Working Capital Management and Its Impact onProfitability Evidence from Food ComplexManufacturing Firms in Addis Ababa.” InternationalJournal of Scientific and Research Publications 6.6(2016): 815-833.
Sharma, A.K and Satish Kumar. “Effect of Working CapitalManagement on Firm Profitability: EmpiricalEvidence from India.” Global Business Review 12.1(2011): 159-173.
Soukhakian, Iman and Mehdi Khodakarami. “Workingcapital management, firm performance andmacroeconomic factors: Evidence from Iran.”Cogent Business & Management 6 (2019): 1-24.< h t t p s : / / d o i . o rg / 1 0 . 1 0 8 0 / 2 3 3 11 9 7 5 . 2 0 1 9 .1684227>.
Vartak, Pallavi and Vishal Hotchandani. “Working CapitalManagement and Firm Performance: Evidence fromIndian Listed Firm.” International Journal ofManagement, Technology And Engineering IX.IV(2019): 914-925.
Vijayakumaran, Ratnam and Nagajeyakumarn Atchyuthan.“Cash holdings and corporate performance: Evidencefrom Sri Lanka.” International Journal ofAccounting & Business Finance 3.1 (2017): 1-11.
************

SCMS Journal of Indian Management, January-March - 2021 59
A Quarterly Journal
Employee Demography andEmployee Engagement-
An Empirical Study on IT Employees
Abstract
In order to survive and gain a competitive advantage in today’s fast-changing organisational environment, competitive
pressures, and stakeholder demands, organisations attribute more importance to their workforce. The recent buzz
among the industry, consulting firms and academia, still with vast scope for research, is the concept of employee
engagement. There is an increasing awareness that employee engagement is pivotal to the success of the organisation.
That is the reason that the world today is paying increased attention to Employee Engagement. The objective of the
study is to ascertain how Employee Engagement and its facets like Growth, Teamwork, Management Support and
Basic Needs, differ with workers demographic factors, including gender, age, and experience. Data was collected
through self-administered questionnaires from 223 working adults in the IT companies of Pune, Maharashtra. Findings
were made with the help of standard statistical software such as SPSS, and complete model testing was done with the
help of AMOS. One-way ANOVA, Post Hoc test and T-tests are also used.
The current study discovered that overall male employees have elevated engagement level than females. Female
employees outscore men employees in the dimension of Basic Need of Employee Engagement, thus concluding that
females are greatly engaged at the entry-level. Findings reveal that employees between 31-40 years, and employees
with more experience are highly engaged. The study has practical implications as now the employers are aware that
employee engagement in males on two dimensions, namely Growth and Management support, is more than as compared
to females in the IT organisations.
This study gives a clear understanding of how demographic factors influences employee work engagement that supports
human capital management strategy within organisations. It is suggested that HR professionals can deploy targeted
employee engagement programs and strategies to engage employees with their work and with the organisation.
Keywords: Employee Engagement, Gender, IT, Experience, Age
Abstract
Meru DasResearch Scholar
MIT College of Management,MITADT University
Pune, Maharashtra IndiaEmail: [email protected]
Dr. Vivek Singh,Professor and HOD
MIT College of Management,MITADT University
Pune, Maharashtra, IndiaEmail: [email protected]
Dr. Shashank MehraProfessor
School of Commerce & Management,Lingaya’s, Vidyapeeth, Faridabad
Email: [email protected]

SCMS Journal of Indian Management, January-March - 2021 60
A Quarterly Journal
1. Introduction
In today’s high-velocity environment, competition is theorder of the day. In this cut-throat scenario, it’s importantthat both businesses and individuals strive hard to keeptheir competitive edge intact. In this dynamic andincreasing hyper-competition, managers will have to focuson employees physical and mental wellbeing. Accordingto The Harvard Business Review (2013), 71 per cent ofrespondents concur with the thought that (employeeengagement is a substantial predictor for the economicsuccess of the organisation). Gallup (2006) definesEmployee Engagement as “engaged employees are morelikely to view the organisation and job as a healthyenvironment and therefore more likely to support theorganisation.” Hence, employee engagement is a strongtool that can be beneficial in these tough times. Employeeengagement will be considered as a strategic techniquefor the service organisations to survive and to sustain inthe prevailing extreme competitive environment (Amabileet al., 2011). Because engaged employees have a hugeamount of energy which is obtained from the emotionswhich they experience in their workplace, and theseengaged employees are fervent about their employment(John & Raj, 2020).
The engaged employees are the ones who go beyond thatextra mile – who invest that discretionary effort for thesuccess of the organisation (Leary Joyce, 2004).Employee engagement is a factor related to manyorganisational issues and individual outcomes such as workperformance (Laschinger et al. 2006; Paul &Anantharaman, 2004) or turnover intentions (Agarwal etal., 2012; Bailey et al.,2015; Soane et al., 2012), and moreproductivity (Gallup, 2013)
Employee Engagement trait is used to denote the emotionaland cognitive factors of organisational loyalty, which isdesired to be in tandem with the missions and goals of theorganisation (Ehambaranathan, et al., 2014). Engagementand immersing one’s self into the job completely bringsout a happy and good performer who will be more creative,motivated, authentic, non-retaliatory and overall, a morepassionate employee about the work. Gallup, in their mostrecent “State of the Global Workplace Report” (2017),says that 85 per cent of the workforce is not engaged at
the workplace. Hence explaining it further, Gallup declaresthat 18 per cent are actively disengaged, while 67 per centshow all the characteristics of not being engaged at theworkplace at all. The above-mentioned employees may notbe the most awful performers, but these employees have acouldn’t care less attitude with respect to their employment.This explains that employees do give their organisationsthe time, but they are not involved in their work in totality.Hence, their findings revealed that due to disengagedemployees, the businesses suffered a major financial lossof $7 trillion (Gallup, 2017.) Therefore, the organisationshould develop strategies that serve to enhanceengagement.
The exponential advancement of the IT sector has createdincredible work prospects for a large section of educatedwomen. Singhal (1995) is of the opinion that “Participationof women in the workforce is essential for economicdevelopment and population planning.” According to theMinistry of Electronics & Information Technology, thereare 34 per cent female employees, out of a total of 39.68lakhs employees in Information Technology and web-enabled services combined. This is a fairly sudden increasefrom 21 per cent of women workers in 2001 (NASSCOM,2001) and 30 per cent in 2012 (NASSCOM, 2013), citedin Gupta (2015).
In our patriarchal society, where a female is generally ahomemaker or a caregiver, striking the right amount ofbalance amidst job and family can be quite a daunting task.Balancing work and family was one of the frequently quotedchallenges in a study on women in Information Technology(Adya, 2008). The Information Technology sector ismaking all the endeavours to improve the work engagementof their employees as engagement makes the employeeperform better, which in turn increases the productivity ofthe organisation.
Different employees will have different expectations,requirements, wants, desires, anticipations, etc., from theemployers because they all are from varied social-demographic backgrounds. Hence, the management should,therefore, try to understand the employees at an individuallevel. Balain and Sparrow (2009) opined that when theattitudes of the employees have to be assessed, theemployee demography should be taken into consideration.

SCMS Journal of Indian Management, January-March - 2021 61
A Quarterly Journal
Owing to its significance, employee engagement is now amatter of contention and is on the rise quite steadfastly upthe agenda of Human Resource professionals. The literaturerevealed that employee engagement (EE) is diminishingand that an increasing disengagement currently exists inthe workforce (Kular et al., 2008). Therefore, theengagement of the employee factor is keeping the HR folksand the employers on their toes since leveraging this keybusiness driver is significantly critical for achievingcompetitive advantage. (Soldati, 2007; HR Focus, 2006)and now, the concept of work engagement is beingresearched comprehensively. This paper, therefore, is aneffort to fill the gap in the literature and provide a differentperception to the outcomes of earlier studies about therole of various demographics like age, experience and genderin employee engagement in the organisations under study.
2. Literature Review
2.1 Employee Engagement
Employee engagement, of late, has surfaced as an importantpart of business success in today’s competitive arena (Saks,2006; Bakker & Schaufeli, 2008). Sadique (2014)considered engagement as an emotional connect to theworkplace because he opined that employees who areenthusiastic and passionate about their work are dedicatedand are empowered. Albrecht (2011) added that engagementtakes a particularly important role in all organisations. Itmakes an employee give his best performance in terms ofwork activities, and thereby allow them to understand thecorporate culture. The investment in employees will helpthe organisation improve leadership and the creation oftechnological innovation that will result in elevatedfinancial gain. Organisations that execute employeeengagement strategies, implies that their employees havefull faith in the company that they will be unbiased in allrespects. Work engagement is also defined as theinvolvement and contributions that employees put into theirwork (Kuok & Taormina, 2017).
When business leaders implement the policies or strategieson employee engagement, it elevates customer satisfaction,increases production and profit (Bowen, 2016), andreduces turnover intentions (Memon et al., 2016).Consequently, employees with heightened employeeengagement work more efficiently and effectively because
they work with a lot of involvement in their work, alongwith emotional connect.
Kahn (1990) recommended that engaged employees areones who put a lot of effort into their work beyond theminimum requirement for the work to be completed bygiving extra time, passion, and intellect. Chartered Instituteof Personnel and Development (2013), in their report,describes employee engagement as “being positivelypresent during the performance of work by willinglycontributing intellectual effort, experiencing positiveemotions and meaningful connections to others.”
Recent research has identified engagement as more of anemotional feeling towards their work (Baumruk, 2004;Richman, 2006). In short, there is a psychic income ornon-pecuniary income at work which is respect,appreciation, admiration, self-actualisation needs gettingfulfilled, etc., and that makes employees committed andsocially acceptable (Camerer & Malmendier, 2007).
In the opinion of many researchers, employee engagementis substantially related to the feeling that the employeesare “glued” to their work (Harter et al., 2002; Schaufeli &Bakker, 2004). Engaged employees have an emotionalattachment with the organisation, which results in higherproductivity, return on investment, retention, loyalty andlower absenteeism (Shukla et al.,2015).
Consequently, these engaged employees are better suitedto cope up with the uncertain demands of their work. Theseengaged employees will seldom have an intent to exit fromthe organisation, which is evident from the study ofSchaufeli et al. (2001), who investigated that workforcewho are engaged with full involvement in their job are morecontent with it and enjoy their work.
2.2 Demographic Variables
2.2.1 Gender
Men are from Mars and Women are from Venus and whichmeans that women can be just as unique professionally andpersonally. Though they are walking tall with men in theworkplace, they have not become replicas of men. Bothmale and females exhibit different behaviours in theworkplace.

SCMS Journal of Indian Management, January-March - 2021 62
A Quarterly Journal
Kelkar and Nathan (2002) stated in their study that thedevelopment of information technology (IT) in Asia hashad a significant impact on women. Clark and Sekher(2007) assert in their study that IT employment to womenhas enhanced their socio-economic status. This has beenreinforced by the findings of Shanker (2008), who alsoobserved that Information Technology employment hascontributed to the upliftment of the women employeespertaining to economic capital, social capital and symboliccapital.
Eagly’s (1987) gender socialisation and social role theorystated that women are more focused on emotional relationinvestment by which they complete a task by emotionallyconnecting with the team, whereas men are supposed to be“agentic” and move directly to the project goal. Femalesbelieve in building relationships with people while on thetask or job (Donelson, 2010; Eagly, 1987; Gilligan, 1982;Farrell & Finkelstein, 2007; and Knowles andMoore,1970). This nature of females can be because theyare highly compassionate and emotional and have greatteam-building skills. Ramamurthy and Flood (2004)reported in their study that women in general reportedhigher emotional attachment than men. The outcomes ofmany studies also indicate that the disparity in employeeengagement between the genders is prevalent (Kong, 2009;Mauno et al., 2005; Rothbard, 2001).
Maitland (2001) suggested that in this dynamicenvironment, the women workforce will fill the gap ofcompetent and well-trained talent in the workplaceinternationally. However, IT employers are facing achallenge when it comes to hiring and retaining skilledfemale employees. In spite of women-friendly retentionpolicies, this is proving to be a substantial challenge in theInformation Technology sector (Pfleeger & Mertz, 1995).
Shuttleworth (1992) found out that females in the ITcompanies are majorly participating in routine kinds ofjobs, whereas men are involved in decision making andexecutive jobs. Many have advocated that enhancing therepresentation of females to decision-making levels andpolicy implementations will definitely make the workplacemore conducive for women to work. On the contrary, manypast studies have reinforced the fact that womenfolk in theIT field are at the lower and middle levels, and very few ofthem reach the top of the pyramid in the organisational
hierarchy (Myers, 1990; Benditt, 1992) Based on theresearch of Reid et al. (2010) and Trauth et al. (2012), the“equality argument” criticises existing world powerstructures, where men occupy most of the top positions inthe IT field and elsewhere. Raghuram et al. (2017), in theirresearch, found that 51 per cent of entry-level hiresrepresent women; a little over 25 per cent of women reachthe managerial level, but <1 per cent are at the seniorexecutive level. Marcus and Gopinath (2017) signify intheir study of professionals that gender as a demographicvariable has no influence on employee engagement, i.e.,no significant difference between male and femalerespondents with respect to the drivers of employeeengagement in IT companies. Hence we propose:
H01: There is no significant difference in engagementlevels of male and female employees.
2.2.2 Experience of employees
Robinson, Perryman and Hayday (2004) carried out asurvey of around ten thousand employees in fourteenorganisations and discovered that employee engagementdecreased when the age and tenure in the organisationincreased. Mahboubi et al. (2015) identified a significantassociation between work engagement and length ofemployee work experience Employees who have spentmore time with the employer are more likely to reach alevel where there is no advancement in career (Allen,Poteet, & Russell, 1998) and thus feel low engagementlevel as compared to those who spend less time in theorganisation. Jaupi and Llaci (2015) observed changes inthe engagement levels of employees due to the longevityof experience with the organisation. Some studiesconducted suggested that the engagement of the employeeis not affected by the demographic factors such as gender,age, position, and income of the respondents (Madan &Srivastava, 2015; Sarath & Manikandan, 2014). Hence it isimperative to propose:
H02: There is no significant difference in engagementlevels of employees with different years of experience.
2.2.3. Age of Employees
Not many researches have been conducted for examiningthe linkage between the age of an employee and employeeengagement. Whatever researches have been conducted on

SCMS Journal of Indian Management, January-March - 2021 63
A Quarterly Journal
this critical area has given us quite contradictory outcomes.Age has been identified as a predictor of work engagement(Kim & Kang, 2017). Bezuidenhout and Cilliers (2011)and Douglas and Roberts (2020) stated that there exists apositive association between age and work engagement ofemployee, which suggests that employee engagementincreases with age. Vijay et al. (2016) posited thatemployee engagement does not vary with the demographicfactors, namely gender, age, position and income of therespondents. Pitt-Catsouphes and Matz-Costa (2008) didthe analysis from data which was obtained from 20organisations and highlighted the importance of jobflexibility and reported that flexibility in the job was moreimportant to older employees in comparison to youngemployees, and this could be the driver for employeeengagement. Similarly, their work was substantiated byBrough, O’Driscoll and Kalliath 2005 and De Cieri et al.
2005, who examined the effects of flexibility at work onemployee engagement, and their outcomes of the studyrevealed that more the flexibility more the employeeengagement. George & Ben (2017) posited that age andgender have a statistically significant effect on theengagement level of employees. It was found those workerswhose age was more than 45 years was more engaged. Inresearch conducted by Wolfe (2004), it is indicated thatthe highest level of employee engagement is felt when theemployees are in the first year of the job, and then itsubsequently comes to stagnation and then again falling inthe 5–10-year bracket. The age of an employee and theamount of work experience an employee has shouldincrease the likelihood of engagement. Therefore, wepropose
H03: There is no significant difference in the engagementlevels of employees with different age groups.
Figure 1: Conceptual framework
2.3 The Information Technology (IT) Industry of India
India has evolved as one of the primary IT servicebreadwinners in the World since it has a skilled andintellectual knowledge base. IT Services is the segment thatis growing by leaps and bounds. According to the latestreport by NASSCOM, 2018, the Information Technologysector is projected to make exports revenues of the orderof US$ 69.3 billion in the year 2017-18 as compared toUS$ 66.0 billion in the year 2016-17.
Quick advancement in technologies along with multi-dimensional projects or flexi-timings and multi-linguistic,multicultural employees stationed all across boundaries,in different time zones (Sharma, 2014). With theamalgamation of these factors, the IT industry is dynamicand unique at the same time. The advent of globalisationand huge development and advancement in InformationTechnology saw greater career opportunities.
Subsequently, Information Technology’s dynamism and itstechnological advancement have increased the attentivenessof the academic attention of scholars in the recent past.Yet, very few studies have been carried out with respect toemployee engagement in the Indian IT industry. Computer-aided disciplines are known to be project-based andnormally operate with multi-dimensional tasks catering tocustomers who have varied demands, hence the demand forsuch personnel who can contribute emotionally to theirjob has risen. The IT industry has ever been trying tomitigate the challenge of lack of skilled manpower and theburning problem of retention of employees. (Pereira V &Budhwar P, 2015). The subtle nature of abilities ofemployees due to steadfast progressing hi-tech expertise,mergers, support and use of talent has become of significantvalue, and this empirical research attempts to study theeffect of demographic variables on employee engagementof the employees across the IT companies of the city ofPune, Maharashtra.
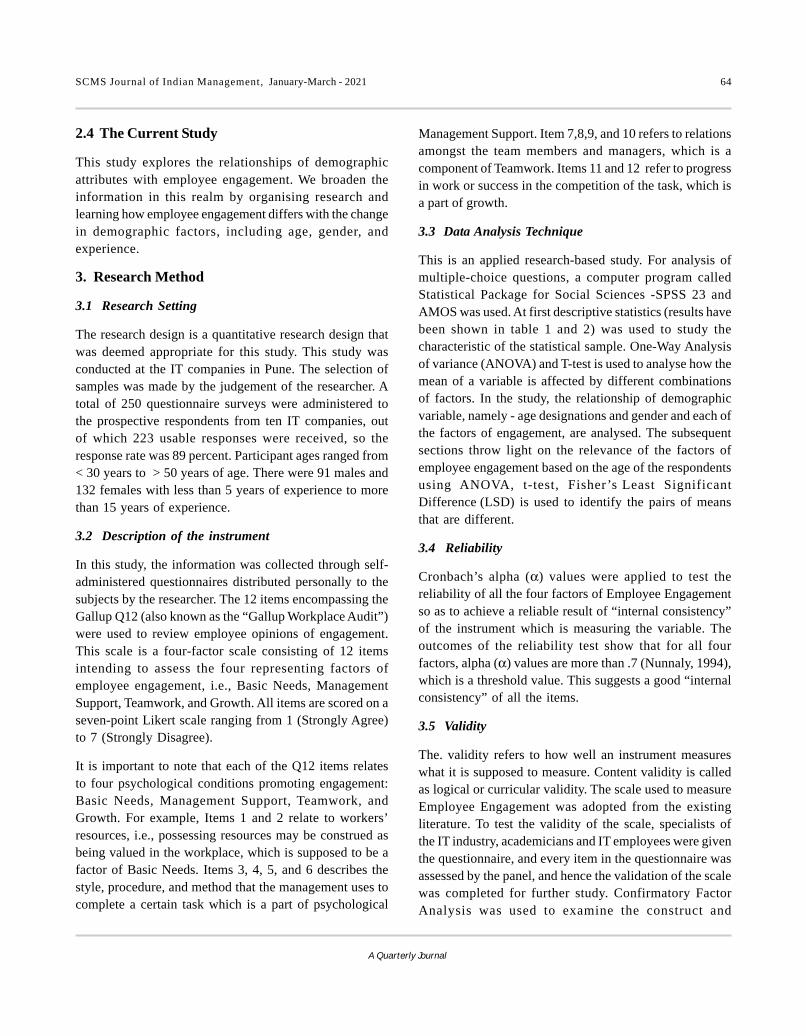
SCMS Journal of Indian Management, January-March - 2021 64
A Quarterly Journal
2.4 The Current Study
This study explores the relationships of demographicattributes with employee engagement. We broaden theinformation in this realm by organising research andlearning how employee engagement differs with the changein demographic factors, including age, gender, andexperience.
3. Research Method
3.1 Research Setting
The research design is a quantitative research design thatwas deemed appropriate for this study. This study wasconducted at the IT companies in Pune. The selection ofsamples was made by the judgement of the researcher. Atotal of 250 questionnaire surveys were administered tothe prospective respondents from ten IT companies, outof which 223 usable responses were received, so theresponse rate was 89 percent. Participant ages ranged from< 30 years to > 50 years of age. There were 91 males and132 females with less than 5 years of experience to morethan 15 years of experience.
3.2 Description of the instrument
In this study, the information was collected through self-administered questionnaires distributed personally to thesubjects by the researcher. The 12 items encompassing theGallup Q12 (also known as the “Gallup Workplace Audit”)were used to review employee opinions of engagement.This scale is a four-factor scale consisting of 12 itemsintending to assess the four representing factors ofemployee engagement, i.e., Basic Needs, ManagementSupport, Teamwork, and Growth. All items are scored on aseven-point Likert scale ranging from 1 (Strongly Agree)to 7 (Strongly Disagree).
It is important to note that each of the Q12 items relatesto four psychological conditions promoting engagement:Basic Needs, Management Support, Teamwork, andGrowth. For example, Items 1 and 2 relate to workers’resources, i.e., possessing resources may be construed asbeing valued in the workplace, which is supposed to be afactor of Basic Needs. Items 3, 4, 5, and 6 describes thestyle, procedure, and method that the management uses tocomplete a certain task which is a part of psychological
Management Support. Item 7,8,9, and 10 refers to relationsamongst the team members and managers, which is acomponent of Teamwork. Items 11 and 12 refer to progressin work or success in the competition of the task, which isa part of growth.
3.3 Data Analysis Technique
This is an applied research-based study. For analysis ofmultiple-choice questions, a computer program calledStatistical Package for Social Sciences -SPSS 23 andAMOS was used. At first descriptive statistics (results havebeen shown in table 1 and 2) was used to study thecharacteristic of the statistical sample. One-Way Analysisof variance (ANOVA) and T-test is used to analyse how themean of a variable is affected by different combinationsof factors. In the study, the relationship of demographicvariable, namely - age designations and gender and each ofthe factors of engagement, are analysed. The subsequentsections throw light on the relevance of the factors ofemployee engagement based on the age of the respondentsusing ANOVA, t-test, Fisher’s Least SignificantDifference (LSD) is used to identify the pairs of meansthat are different.
3.4 Reliability
Cronbach’s alpha (α) values were applied to test thereliability of all the four factors of Employee Engagementso as to achieve a reliable result of “internal consistency”of the instrument which is measuring the variable. Theoutcomes of the reliability test show that for all fourfactors, alpha (α) values are more than .7 (Nunnaly, 1994),which is a threshold value. This suggests a good “internalconsistency” of all the items.
3.5 Validity
The. validity refers to how well an instrument measureswhat it is supposed to measure. Content validity is calledas logical or curricular validity. The scale used to measureEmployee Engagement was adopted from the existingliterature. To test the validity of the scale, specialists ofthe IT industry, academicians and IT employees were giventhe questionnaire, and every item in the questionnaire wasassessed by the panel, and hence the validation of the scalewas completed for further study. Confirmatory FactorAnalysis was used to examine the construct and

SCMS Journal of Indian Management, January-March - 2021 65
A Quarterly Journal
discriminant validity of the measures. This method was usedto examine our model. The measurement modelencompassing all the 12 items from the questionnaires wereput to the test. This statistical procedure tests the validityof the model by analysing the goodness of fit indicesagainst the established GOF-goodness of fit analysis (Hu& Bentler, 1999). A good fit warrants the Root Mean SquareError of Approximation (RMSEA) to score 0.05 or below,and less than 0.08 is also treated as an acceptable value.
The Tucker-Lewis Index (TLI) and the Comparative FitIndex (CFI) should exceed 0.95 for a good model fit. Thefour-factor model fits well with the 12 items which areloaded on their latent factors with factor loadings greaterthan 0.40. The model was found to be a good fit. CMIN/Df=1.096; RMSEA = 0.021 CFI = 0.998 ; TLI = 0.997).Therefore, the outcomes reinforce the validity of the factorstructure measure by the Q12 scale.
Figure 2: CFA of Employee Engagement
Table 1: Goodness-of-fit statistics
4. Results And Discussions
The data collected from 223 respondents working in variousIT companies in Pune was analysed, and the findings are asunder:
4.1. Demographic Characteristics of The Respondents
The range of respondents age was < 30 years to > 50 years.There were 91 males and 132 females with less than 5 yearsof experience to more than 15 years of experience. Theage of the respondents has been divided into four groups,namely, < 30 years, 31-40 years, 41-50 years, > 50 years.
4.2 Testing of Hypothesis
4.2.1Gender
In table two, a T-test was performed to evaluate the fourdimensions of work engagement among Females and Males.In the dimension of teamwork, males scored (M=4.11,SD=1.29) and females scored (M=3.96, SD=.910), withno significant difference (t= 0.001, p= .343) between thetwo. The males scored more in the Growth dimension and

SCMS Journal of Indian Management, January-March - 2021 66
A Quarterly Journal
Management Support dimension. Female employees gainmore scores than males on the dimension of Basic Needs.The studies show that women are less engaged in the growthdimension. According to the NASSCOM-Mencher report(2009), the senior management women represent only fivepercent, the rationales ascribed to the above statement are:(1) ‘stereotyped female professionals’, (2) ‘personal senseof mid-career guilt’, and (3) ‘glass ceiling effect’.
Female employees are thus clustered at the lower level ofthe career climbing ladder; hence it leads to a certainfeminisation of jobs. The percentage of female workersreaching the top level is exceptionally low (Kelkar et al.2002; Upadhya, 2006). Shanker (2008) reiterated thesimilar outcomes in Bangalore that female employees’show less level of engagement at the senior level but arehighly engaged at the entry-level, as most of the times,they fail to upgrade their technical proficiencies; theyrefrain from job-hopping and remain loyal to one companyfor a pretty long time (Shanker, 2008). Their familyresponsibilities forbid them to put up late hours in theirwork to establish networking (Upadhya, 2006). Their
choice of career is governed by distance from home, familyobligations, the security of the work and other socialreasons that make the women less engaged when theyclimb up the ladder.
Our findings reveal that overall, the males have higheremployee engagement as compared to females. This findingwas in line with the study of Kong (2009). At the sametime, female employees showed higher scores on thedimensions of the basic needs of employee engagementthan their male counterparts. However, Madan andSrivastava (2015) reported that demographic variables suchas age, gender and marital status do not have a significantimpact on employee engagement. However, we concludethat there is a significant difference between male andfemale respondents with respect to the drivers of employeeengagement in IT companies in Pune. Therefore, we rejectthe null hypothesis(H03). The only factor which wasinsignificant between the gender of the respondents wasTeamwork.
Table 2: Comparisons of dimensions of Employee Engagement between Females and Males (T-Test)
4.2.2 Experience
In table three, Fisher’s LSD post hoc test was applied tocompare the four factors of work engagement among threegroups, namely D1, D2 and D3, it comprised of employeeswho have less than 5 years experience, 5-15 yearsexperience and employees who have more than 15 yearsof experience respectively. There was a significantdifference which was found in employee engagement,Growth, Teamwork, Management Support and Basic Needsbetween D1/D2, D1/D3, and D2/D3. Employees of the D2group showed higher employee engagement and Teamwork(M= 4.59, SD= .888) than employees of group D1 (M=
3.6, SD= .85881, F= 66.699). Workers comprising ofgroup D3 exhibited elevated employee engagement andTeamwork (M= 6.2940, SD= .601) as compared to thosewho were in group D1 (M= 3.61, SD= .85881, F= 66.699).Employees who were a part of the D3 group showed higheremployee engagement and Teamwork (M= 6.290, SD=.601) than employees in the D2 group (M= 3.61, SD=.85881; F= 66.699).
Hence, workers with different tenure in the organisationdiffer substantially in the study as regards their engagementlevels. Employees having more experience will be more

SCMS Journal of Indian Management, January-March - 2021 67
A Quarterly Journal
engaged than employees having fewer years of employeeexperience in the organisation. Similarly, Sibiya et al.(2014) too opined that years of service were positivelyrelated to employee engagement, implying that longer-tenured employees were more engaged. Having said that,more experienced workers go the extra mile, exercisemore discretionary effort, and are likely to keep customerssatisfied and generate more revenue for the Organisations.This may be because, with the increase in the length ofservice, the match between individuals’ values and theorganisational values gradually increases as individuals getedified (Yang, 2010). Besides, while their work experiencegradually accumulates, and they have better workproficiency, they gradually enjoy higher positions andsalaries. Thus, the sense of achievement and recognitioncoming from work gradually increases, which is reflectedas increased job engagement and a sense of responsibility(Xudong et al., 2016).
In the survey done by Business World (2008), it wasindicated that senior professionals with respect to
Table 3: Comparisons of Dimensions of Work Engagement among Three Experience Groups
experience are highly engaged. Sharma et al. (2017)identified a statistically significant difference in the workengagement level of employees based on different yearsof experience. Employees who have more experience andhave spent more time in the organisation are not mereemployees in the organisation; they are the institution inthemselves. They have remained with a company throughall the challenges and been a witness to the strategies,policies, changes in personnel, mergers and acquisitionsand redefining of competitive landscapes. The researchconducted by Chaudhary and Rangnekar (2017) was in thesame continuation with our findings where junior, middle,and senior employees with respect to work experienceshow different levels of engagement (Mathieu & Zajac,1990).
Based on our above findings, we reject the null hypothesis(H
01) that there is no significant difference in engagement
levels of employees with different years of experience.Instead, there is a significant difference in the engagementlevels of employees with different years of experience.
4.2.3 Age
In table four, Fisher’s LSD post hoc test was performed tocompare the four factors of employee engagement amongfour age groups. A1, A2 and A3, A4 comprised of age less
than 30, 31-40 years and 41-50 years and above 50 years,respectively. Significant difference was found in employeeengagement and Growth, Teamwork, Management Supportand Basic Needs between A1/A2, A1/A3 and A2/A4.

SCMS Journal of Indian Management, January-March - 2021 68
A Quarterly Journal
Employees who were in group A2 showed higher employeeengagement and Teamwork (M= 4.36, SD= 1.00, F=8.065)as compared to those who were present in group A1(M=3.41, SD= 1.10; F= 8.065). Employees who were in groupA3 showed higher employee engagement and Teamwork(M= 3.922, SD= 1.025) than employees in group A1 (M=3.41 SD= 1.10; F= 8.065). Employees who were in groupA2 showed higher employee engagement and Teamwork(M= 4.36, SD= 1.00) than employees who were a part ofgroup A4 (M= 3.995, SD= 1.0588, F= 8.065).
Thus, we can say that the respondents who were in the 31-40 years bracket showed the highest level of employeeengagement. This group of respondents are the ones whoare looking at this particular work or job with their wholecareer in front of them. They show more engagementtowards their work because they have their futureprofessional life at stake more than the employees whoare older in age as compared to them. These employeesare possibly a little more stable, experienced and maturedin comparison to employees who are less in age and whoare inexperienced. This group between 31-40 years maybe less demanding or have limited wants and desires andare less materialistic about the trivial needs that can detractthem or irritate them about the working culture of theorganisation. Hence these employees exhibit high levelsof engagement at this juncture as they are more focusedon their careers and their professional life.
Employees who are old or aged show low levels ofaccommodation with the circumstances and situations, areless ebullient, slow in their work, take extra sick days, etc.,and hence appears to be having low levels of engagement.The real issue of older workers is absenteeism. It is knownto be an ageing workforce tendency. There can be manyreasons for their absence from work; either it is theirhealth, or they are disengaged, that is, they are not motivatedenough to work. The reason can be any, that does not matter;what matters is that the company has to incur that cost.Older employees seem to be less engaged.
As per the findings, employees under the age of 30 wereleast engaged when compared to other employees.
According to “The Qualtrics 2020 Employee ExperienceTrends” report, the employees under the age of 30 werefound to be most at risk of attrition, with many of themlooking to switch jobs within twelve months and the restof them look for jobs within two years.
The teamwork dimension scored the highest amongst allthe other factors of Employee Engagement, indicating thatWorker engagement increases markedly when employeesare able to work together in teams and show a team spirit.Employee engagement is enhanced tremendously whenworkers work in effective collaborations and together. Themantra for Google’s success and its efficient and effectiveteam performance is attributed to the combinedindependence to take risky decisions, which paves the wayfor creativity and innovation. Hence when workers thinkthey can voice their ideas, they have this feeling of sharing;those employees are engaged emotionally and connectedto the work.
A global study of engagement was carried out by ADPResearch Institute (2020), and the outcomes stated thatwhen employees feel that they belong to a team, it elevatestheir engagement towards the work. A similar trend wasfound in a study by Mckinsey (2020), where it was foundout that employees working in teams exhibit a great amountof engagement because the team leaders develop trust inthe employees. Trusting one’s team members and regardinghim to be as helpful is viewed as a significant job- resourcethat helps in the achievement of personal as well asorganisational goals associating substantially withemployee engagement (Schaufeli & Bakker, 2004). Mayet al. (2004) were of the opinion that amicable and cordialrelations with one’s team members could establishemotional safety in the organisation, leading to better jobperformance, thus being more engaged. On the contrary,employees who do not have good relations with otheremployees gives rise to mistrust resulting in disconnectionin the workplace, contributing to disengaged employees.Ducharme and Martin’s (2000) results advocate thoseemployees who have sound interpersonal relations exhibitheightened job satisfaction that will yield more employeeengagement (Harrison et al., 2006).

SCMS Journal of Indian Management, January-March - 2021 69
A Quarterly Journal
Table 4: Comparisons of dimensions of Work Engagement among four age group
5. Discussion and Conclusion
The study was conducted on Indian IT employees. We foundthat there is a difference in the employee engagementamong IT workers of different genders, which is consistentwith the results of some earlier studies (Li, 2011; Zhu etal., 2015). Our findings reveal that the employeeengagement of women in this study is generally lower thanthat of men (Schaufeli, Martínez, Marques Pinto, Salanova,& Bakker, 2002; Zhou, 2013; Pang, 2014).
Domestic responsibilities may make women less likely topursue an avenue for upward mobility (Britton, 2003;Rothbard, 2001). This implies that men in general (relativeto women) have better status and influences in theirpositions, and thereafter are more likely to experiencepsychological meaningfulness and employee engagement.Of course, we have examples of career successes andupward mobility of several women moving into higher ranksof organisations. This may suggest that at least someorganisations may have paid attention to improving thework engagement of female employees. It also suggeststhat successful women may also have invested an extraamount of hard work and resources in overcoming gender-discriminatory structures and cultures.
Employees in the age group of 31-40 years and employeeswho have more years of experience have a significant partto play in keeping the employees engaged by building trustin them, putting forth the goals and values of the company
and communicating what is expected of the employees bythe management. They are an especially important andcritical resource for the organisation, and that is why theycan be termed as the ‘central nervous system’ of theorganisation as they are highly engaged employees. Highlyengaged employees bring spirit and energy to theworkplace. Their motivation and drive to succeed don’t takelong to spread to others. Such employees motivate othersto achieve their tasks. Such employees are a lot more activeto take up tasks and participate in activities. They facilitatein executing and implementing the plans and changesformed by the management in day-to-day activities becausethey naturally become company advocates. They feel asense of pride to be a part of the organisation. Theseemployees play a key role in setting a clear vision for whatcan be achieved through the implementation of seniormanagement decisions (Parker & Williams, 2001).
All highly engaged employees put in the extra effort interms of time, energy and passion in their work. The clientsare satisfied with them, and they contribute more towardsthe organisational level outcomes of growth andproductivity (Buliñska-Stangrecka & Iddagoda, 2020).
5.1 ImplicationsEngagement is a psychological state. Researchers callengagement “an amalgamation of commitment, loyalty,productivity and ownership” (Wellins & Concelman,2005). It is much more than making employees feelhappiness and paying them a hefty paycheck.

SCMS Journal of Indian Management, January-March - 2021 70
A Quarterly Journal
The current research will add to researchers endeavours incomprehending the relationship between employeeengagement and demographic factors in the InformationTechnology sector. This research provides new findings tothe management of the organisations by leading a discussionas it shows how employee engagement varies with diversedemographic attributes.
Male employees in the organisations were found to bemore engaged in their jobs as compared to their femalecounterparts in the dimensions of Growth and ManagementSupport. It was found that females are more engaged at theentry-level than their male counterparts. When they firstenter the organisation, they are of the belief about the equalopportunities to achieve their potential as men, andsubsequently, this enthusiasm and passion diminishes overtime because what females observe and experience has anadverse effect on their belief system about the genderdisparity. This was the most significant finding of thisresearch.
It was also found that employees’ having high experiencewere more engaged than employees’ having lessexperience. Another outcome of this research was that theresults pointed towards employees between the range of31-40 years as the most engaged amongst all theemployees. However, the Teamwork dimension ofEmployee Engagement was found to be of insignificantvalue in male and female employees of the IT workforce.
The findings of this study will help management and HRprofessionals to design strategies so that employeeengagement can be enhanced to a great extent.Consequently, the employers need to understand that havingan engaged workforce in the organisations will lead toenhanced productivity, happy, satisfied employees andfewer turnover intentions.
The organisations also need to develop strategies to engagethe female workforce during the whole life cycle of theircareer. Due to family, travelling concerns, and in an effortto strike a balance in work and family life, the womenemployees are forced to remain in the organisation, at timeswhich may not be conducive for them to stay, due to which
they become disengaged. This could lead to untowardconsequences both for the employees and employer. So,engaging the women workforce by analysing the female-oriented issues should be a primary concern for theorganisations. Organisations ought to give equal prospectsto the female folk because a feeling of getting ignored orneglected conveys a malevolent shade on employeeengagement levels. An engagement programme exclusivelyfor women employees will build a better organisationalculture where there is no scope for gender discriminationor biases against women.
Difference due to age can prove to be detrimental foremployee interpersonal relationships, which can turn outto be a challenge for the engagement of employees in theiremployment. Hence the companies should involve staffmembers of diverse attitude, skills and age in team outings,outdoor activities and also execute programs like ‘reversementoring.’ Such activities will foster comradeship amongthe employees, and in general, the silo mentality can bebroken.
The study also value adds to the sparse literature onemployee engagement especially related to InformationTechnology that is undergoing huge turmoil and vagariesof business in the form of retentions, hiring skilledmanpower, acquisitions, mergers, leaning the manpowerand suffering from business closures.
5.2 Limitations of the Study
This paper has its own limitations. The study is based on across-sectional design, which is one limitation. Secondly,the sample size is less, due to which the outcomes arelimited in generalisability.
5.3 Directions for future Research
The present results add to our knowledge in comprehendingthat employee engagement varies with demographicfeatures, and it acquires a larger sample from many moreInformation Technology Companies. In future, morestudies can be carried out while considering the senioritylevel/ hierarchy level of employees in the organisation toinvestigate their employee engagement level. It would alsobe interesting to know employee engagement differencesacross generations.

SCMS Journal of Indian Management, January-March - 2021 71
A Quarterly Journal
References
Adya, M. (2008). “Women at work: differences in IT careerexperiences and perceptions between south Asian andAmerican women”. Human Resource Management,47(3), 601e635
Agarwal, U.A., Datta, S., Blake Beard, S. and Bhargava, S.(2012). Linking LMX, innovative work behavior andturnover intentions: the mediating role of workengagement. Career Development International, 17,pp. 208– 230
Amabile, Teresa M. and Kramer, Steven J., 2011. TheProgress Principle: Using Small Wins to Ignite Joy,Engagement and Creativity at Work, HarvardBusiness School Publishing Corporation, Boston,USA
Albrecht, S. L., & Andreetta, M. (2011). The influence ofempowering leadership, empowerment andengagement on affective commitment and turnoverintentions in community health service workers.Leadership in Health Services, 24(3), 228–237.
Bakker, A. and Schaufeli, W., (2008). Positiveorganisational behavior: engaged employees inflourishing organizations, Journal of OrganizationalBehavior, Vol. 29, Issue 2, pp. 47 – 154.
Bailey, Catherine & Madden, Adrian & Alfes, Kerstin &Fletcher, Luke. (2015). The Meaning, Antecedents andOutcomes of Employee Engagement: A NarrativeSynthesis. International Journal of ManagementReviews. 1-23.
Balain, S., & Sparrow, P. (2009). Engaged to perform: Anew perspective on employee engagement: ExecutiveSummary. Lancaster University Management School.
Bowen, D. E. (2016). The changing role of employees inservice theory and practice: An interdisciplinary view.Human Resource Management Review, 26, 4–13.
Barrick, M. R., Thurgood, G. R., Smith, T. A., & Courtright,S. H. (2014). Collective organisational engagement:Linking motivational antecedents, strategicimplementation, and firm performance. Academy ofManagement Journal, 58, 111–135.
Baumruk, R. (2004). ‘The missing link: the role ofemployee engagement in business success. Workspan,Vol 47, pp 48-52.
Buliñska-Stangrecka, H., Iddagoda Y. A. (2020). Therelationship between inter-organisational trust andemployee engagement and performance, Academyof Management, 4(1), 8-25
Business World (2008, May).HR special survey: Engagethe employee. Business World, 32–35.
Brough P, MP O’Driscoll and TJ Kalliath (2005) The abilityof ‘family friendly’ organisational resources to predictwork-family conflict and job and family satisfaction.Stress and Health 21, 223–234.
Carol Gilligan (1983) In A Different Voice: PsychologicalTheory and Women’s Development.Cambridge MA,Harvard University Press,1982
Chaudhary, R., & Rangnekar, S. (2017). Socio-demographicFactors, Contextual Factors, and Work Engagement:Evidence from India. Emerging Economy Studies,3(1), 1–18.
CIPD (2013) Employee Engagement, [Online]. Availablefrom http://www.cipd.co.uk/>
Clark, A.W. and T. V. Sekher, 2007 Can Career-MindedYoung Women Reverse Gender Discrimination? AView from Bangalore” s High-Tech (5) Sector”,Gender, Technology and Development, 11 (3), 2007,285-319
C. F. Camerer and U. Malmendier,(2007) BehavioralEconomics of Organizations, Behavioral Economicsand Its Applications, Chapter 7, Princeton UniversityPress, New Jersey
De Cieri H, B Holmes, J Abbott and T Pettit (2005)Achievements and challenges for work/life balancestrategies in Australian organisations. InternationalJournal of Human Resource Management 6(1), 90–103.
Douglas, S., & Roberts, R. (2020). Employee age and theimpact on work engagement. Strategic HR Review,ahead-of-print(ahead-of-print). doi:10.1108/shr-05-2020-0049

SCMS Journal of Indian Management, January-March - 2021 72
A Quarterly Journal
Eagly, A. H. (1987). John M. MacEachran memoriallecture series; 1985.Sex differences in socialbehavior: A social-role interpretation. LawrenceErlbaum Associates, Inc.
Ehambaranathan, E., Samie, A. and Murugasu, S. (2014),“The recent challenges of globalisation and the roleof employee engagement – the case of Vietnam”,International Journal of Human Resource Studies,Vol. 5 No. 1, pp. 69-85
Farrell, S. K., & Finkelstein, L. M. (2007). Organisationalcitizenship behavior and gender: Expectations andattributions for performance. North AmericanJournal of Psychology, 9(1), 81–95.
Forsyth, Donelson (2010). Group Dynamics (5thed.).USA: Wadsworth. ISBN 978-0-495-59952-4
Gallup (2006), Gallup study: engaged employees inspirecompany innovation: national survey finds thatpassionate workers are most likely to driveorganisations forward, The Gallup ManagementJournal, http://gmj.gallup.com/content/24880/GallupStudy Engaged Employees Inspire Company.aspxpfleeger
Gallup (2013). State of the Global Workplace: EmployeeEngagement Insights and Advice for Global BusinessLeaders. Retrieved from: https://www.gallup.com/services/178517/state-global-workplace. aspx
George, E., & Ben, N. (2017). Influence of age and genderon employee engagement. Asian Journal of Researchin Business Economics and Management, 7(9), 97-105.
Gupta, M. (2015). A study on employee’s perceptiontowards employee engagement. Global ManagementJournal, 9(1/2), 45–51.
Harter, J.K., Schmidt, F.L., and Hayes, T.L. (2002),‘Business-Unit-Level Relationship BetweenEmployee Satisfaction, Employee Engagement, andBusiness Outcomes: A Meta-Analysis,’ Journal ofApplied Psychology, 87, 268–279
https://economictimes.indiatimes.com/news/economy/indicators/india-to-overtake-japan-to-become-3rd-l a r g e s t - e c o n o m y - i n - 2 0 2 5 / a r t i c l e s h o w /70193869.cms?from=mdr
HR Focus (2006), Critical issues in HR drive 2006priorities: number 1 is talent management HR Focus,83(8), 8–9
Jaupi, F., & Llaci, S. (2015). The impact of communicationsatisfaction and demographic variables on employeeengagement. Journal of Service Science andManagement, 8(02), 191–200. doi:10.4236/jssm.2015.82021
John, A., & Jagathy Raj, V. P. (2020). Employer brand andinnovative work behaviour: Exploring the mediatingrole of employee engagement. Colombo BusinessJournal. 11(2), 93-113
Kahn WA (1990), ¹Psychological conditions of personalengagement and disengagement at work¹, Academy ofManagement Journal, 33(4), 692–724
Kelkar, G., & Nathan, D. (2002). Gender Relations andTechnological Change in Asia. Current Sociology,50(3), 427–441
Kim N., Kang S.-W. (2017). Older and more engaged: themediating role of age-linked resources on workengagement. Human Resource. Management. 56 731–746. 10.1002/hrm.21802]
Kong, Y. (2009). A study on the job engagement of companyemployees. International Journal of PsychologicalStudies, 1(2), 65–68
Kular, S., Gatenby M., Rees, C., Soane, E. and Truss , K(2008). Employee Engagement: A Literature Review.Kingston University.
Kuok, A.C.H. & Taormina, R.J. (2017). Work engagement:evolution of the concept and a new inventory.Publishing Psychology, 10(2), 262-287.
Leary Joyce J (2004), Becoming an employer of choice:make your organisation a place where people wantto do great work, The Chartered Institute of Personneland Development
Laschinger, H.K.S., Leiter, M.P., 2006. The impact ofnursing work environments on patient safetyoutcomes: the mediating role of burnout/engagement.The Journal of Nursing Administration 36 (5), 259–267.

SCMS Journal of Indian Management, January-March - 2021 73
A Quarterly Journal
Madan, P. and Srivastava, S. (2016) ‘Investigating the roleof mentoring in managerial effectiveness-employeeengagement relationship: an empirical study of Indianprivate sector bank managers’, European J. Cross-Cultural Competence and Management, Vol. 4, No.2, pp.146–167.
Mahboubi, M., Ghahramani, F., Mohammadi, M., Amani,N., Mousavi, S. H., Moradi, F., Kazemi, M. (2015).Evaluation of work engagement and its determinantsin Kermanshah hospitals staff in 2013. GlobalJournal of Health Science, 7(2), 170.PMID:25716395
Maitland A (2001) A long-term solution to the IT skillsshortage. Financial Times (22 February)
Marcus, A., and Gopinath, N. M. (2017). Impact of thedemographic variables on the employee engagement-an analysis. Ictact Journal on Management Studies,3(2), 502-510. https://doi.org/10.21917/ijms.2017.0068
Mathieu, J. E., & Zajac, D. M. (1990). A review and meta-analysis of the antecedents, correlates, andconsequences of organisational commitment.Psychological Bulletin, 108(2), 171–194
Mauno, S., Kinnunen, U., Makikangas, A., & Natti, J.(2005). Psychological consequences of fixed termemployment and perceived job insecurity among healthcare staff. European Journal of Work andOrganizational Psychology, 14(3), 209–237.
Memon, M. A., Salleh, R., & Baharom, M. N. R. (2016).The link between training satisfaction, workengagement and turnover intention. European Journalof Training and Development, 40(6), 407–429.https://doi.org/10. 1108/EJTD-10-2015-0077
Myers K (1990) Cracking the glass ceiling: despite somehigh-profile gains, women executives in IS remain arare phenomenon. Information Week 38, 284
Pang, X. Y. (2014). Analysis of the engagement of medicalpersonnel in five tertiary general hospitals in TianjinCity. Chinese Journal of Hospital Administration,(6),455–456.
Parker, S. & Williams, H. (2001). Effective Teamworking:Reducing the Psychosocial Risks, Norwich: HSEBooks.
Paul, A.K. and Anantharaman, R.N. (2004), “Influence ofHRM practices on organisational commitment: a studyamong software professionals in India”, HumanResource Development Quarterly, Vol. 15 No. 1, pp.77-88
Pereira V., and Budhwar P., HRM and firm performance:the case of Indian IT/BPO industry, Newyork:Routledge; 2015
Pfleeger SL and Mertz N (1995) Executive mentoring: whatmakes it work? Communications of the ACM 38, 63–73
Ramamoorthy, N. and P. C. Flood (2004). ‘Gender andEmployee Attitudes: The Role of OrganizationalJustice Perceptions’, British Journal ofManagement, 15(3), pp. 247–258
Raghuram, P., C. Herman, E. Ruiz Ben and G. Sondhi (2017),Women and IT Scorecard - India, A Survey of 55 Firms,Milton Keynes: The Open University, accessed 4March 2017
Reid, M. F., Allen, M. W., Armstrong, D. J.,& Riemenschneider, C. K. (2010). Perspectives onchallenges facing women in IS: The cognitive gendergap. European Journal of Information Systems,19(5), 526–539
Richman, A. (2006) ‘Everyone wants an engaged workforcehow can you create it?’ Workspan, Vol 49, pp36-39.
Rothbard, N. P. (2001). Enriching or depleting? Thedynamics of engagement in work and family roles.Administrative Science Quarterly, 46(4), 655–684.
Sadique, M. (2014) Employee Engagement in HospitalityIndustry in India: An Overview. Global Journal ofFinance and Management, 6(4), 375-378
Sarath, P and Manikandan, K. (2014). Work engagementand work related wellbeing of school teachers. SELPJournal of Social Science, 5(22), 93-100
Saks, M. (2006), “Antecedents and consequences ofemployee engagement”, Journal of ManagerialPsychology, Vol. 21 No. 7, pp. 600-619
Schaufeli, W. B., Salanova, M., Gonzalez-Roma., V., &Bakker, A. B. (2002). The measurement of engagementand burnout and: A confirmative analytic approach.Journal of Happiness Studies, 3 (1), 71-92.

SCMS Journal of Indian Management, January-March - 2021 74
A Quarterly Journal
Schaufeli, W.B., and Bakker, A.B. (2004), ‘Job Demands,Job Resources, and Their Relationship with Burnoutand Engagement: A Multi-Sample Study,’ Journal ofOrganizational Behavior, 25, 293–315.
State of the Global Workplace - Gallup Report(2017)GALLUP PRESS , New York
Sibiya, M., Buitendach, J. H., Kanengoni, H., & Bobat, S.(2014). The prediction of turnover intention by meansof employee engagement and demographic variablesin a telecommunications organisation. Journal ofPsychology in Africa, 24(2), 131–143. doi:10.1080/14330237.2014.903078
Sleeth, R.G. and Humphreys, L.W., “Differences inLeadership Styles among Future Managers: AComparison of Male and Female Managers”(unpublished).
Soane, E., Truss, C., Alfes, K., Shantz, A., Rees, C. andGatenby, M. (2012). Development and application ofa new measure of employee engagement: the ISAEngagement Scale. Human Resource DevelopmentInternational, 15, pp. 529– 547
Sushma Singhal (1995) Development Of Education,Occupation, And Employment Of Women In India.Mittal Publications, 1995
Shuttleworth T (1992) Women and computer technology.Have the promises of equal opportunities beenfulfilled? Women in Management Review 7, 24–30
Sharma D.C(2014)., “Indian IT outsourcing industry: Futurethreats and challenges,” Futures, vol. 56, pp. 73–80,
Sharma, A., Goel, A., & Sengupta, S. (2017). How doesWork Engagement vary with Employee Demography?
************
Procedia Computer Science, 122, 146–153. doi:10.1016/j.procs.2017.11.353
Shanker, Deepika, “Gender Relations in IT Companies: AnIndian Experience,” Gender, Technology andDevelopment, 12 (2), 2008, 185- 207
Shukla S, Adhikari B, Singh, V. Employee engagement-roleof demographic variables and personality factors.Amity Glob. HRM Rev. 2015, 5, 65–73.
Soldati P (2007), ¹Employee engagement: what exactly isit?¹ www.managementissues.com/2007/3/8/opinion/employee engagement what exactly is it.asp
Trauth, E. M., Cain, C. C., Joshi, K. D., Kvasny, L.,& Booth, K. M. (2012). Embracing Intersectionalityin Gender and IT Career Choice Research.In Proceedings of the 50th annual conference onComputers and People Research - SIGMIS-CPR ’12 (pp. 199–212)
Vijay Anand, V., Vijaya Banu, C., Badrinath, V., Veena, R.,Sowmiyaa, K., & Muthulakshmi, S. (2016). A Studyon Employee Engagement among the Bank Employeesof Rural Area. Indian Journal of Science andTechnology, 9(27). doi:10.17485/ijst/2016/v9i27/97598
Wellins, R., & Concelman, J. (2005), “Creating a culturefor engagement”, Workforce Performance Solutions(www.WPSmag.com)
Wolfe, H, (2004), ‘Royal Bank of Scotland Case Study’,Appendix four, In Robinson, D., Perryman, S. andHayday, S. ‘The drivers of employee engagement.’Institute of Employment Studies. Report 405.
Zhou, Employee engagement in private hospitals, MasterThesis, Shandong Normal University (2013).

SCMS Journal of Indian Management, January-March - 2021 75
A Quarterly Journal
Goal Setting:Its Impact on Employee Outcome
Abstract
The research investigated the individual perception of goal setting and its relationship with employee outcome. Using the
10-factor model of Goal Setting, 640 executives of Central Public Sector Enterprises (CPSEs) judged the quality of the
goal-setting program in their respective organisations. The study also tried to establish the relationship between goal-
setting factors and employee outcome. The results provided empirical evidence of a moderate implementation of the
goal-setting program in the CPSEs. The correlation analysis further established the relationship between goal setting
and employee outcome. The present study helped to figure out a more comprehensive picture of the influence of a goal-
setting program on employee outcome, thereby providing important insights into the individual differences regarding the
implementation of a goal-setting program.
Key Words: Goals, 10-factor model, Public Sector, Job performance, Job Satisfaction, Employee Engagement,
Motivation
Abstract
Krishnasree GogoiResearch Scholar
Department of Business AdministrationTezpur University, Assam
Email: [email protected]
Dr. Papori Baruah Professor and Dean
Department of Business AdministrationTezpur University, Assam
Email: [email protected]

SCMS Journal of Indian Management, January-March - 2021 76
A Quarterly Journal
1. Introduction
Present-day organisations aim at maximising employeeperformance and achieving the highest level of qualityoutput. In order to achieve these, the organisations need totranslate their organisational objectives into individual andgroup level objectives. Performance Management Systemserves as a critical tool for achieving these objectives. Theorganisation that prioritises effective goal setting willsucceed in its performance management, in developing itsemployees’ skills and confidence, and in its business ingeneral. One of the key components of performanceplanning is the setting of individual goals and objectives. Itprimarily refers to the process of setting the work-relatedactivities in the form of job objectives that are integratedwith the department or unit goals which are further tied tocorporate goals and strategies. The goal-setting processneeds to be properly planned and administered in order toachieve a desired level of performance. This study aims atinvestigating the perceptions of executives regarding thegoal-setting process and analysing the possible relationshipbetween goal setting with employee outcome.
2. Literature review
The modern understanding of goal setting and motivationwas pioneered by Locke in 1968, where he highlighted thatemployees work more productively when guided by clearand achievable goals, given the appropriate feedback(Locke, E.A.,1968,1982). His findings were validated byLatham and Baldes (1975) by stating that the performanceincreases immediately after assigning specific and hardgoals. Kim and Hamner (1976) further found that goalsetting without formal feedback can enhance performance,but when supervisory feedback and praise was added to aformal goal-setting program, performance was enhancedeven more. Latham, Mithchell and Dossett (1978) foundthat employee participation in goal- setting led to highergoals being set than in a case when the supervisor assignsgoals to the employee. In 1984, a 53-item questionnairewas developed by Locke and Latham that attempted tomeasure the core goal attributes of “specificity anddifficulty” in addition to other attributes of the goal-settingprocess such as perceptions regarding participation in goalsetting, supervisor support, conflict and stress. In 1990,however, a more comprehensive Goal Setting theory ofmotivation was presented by Edwin A. Locke and Gary P.
Latham on the basis of nearly 400 empirical studiesconducted nearly over a 25-year period. These studies wereconducted in Asia, Australia, Europe and North America,at individual, group and organisation levels, in bothlaboratory and field settings involving more than 40000subjects, 88 different tasks, in different time spans andtaking different performance criteria. The two core findingsof these studies were; first, there is a linear relationshipbetween goal difficulty and performance. Second, specificand difficult goals lead to higher performance than vagueor abstract goals. (Locke & Latham,1990, 2002, 2013).Over the years, the studies relating to goal setting wasexpanded across many domains. Lee et al. (1991) carriedout a principal component analysis of the goal-settingquestionnaire developed by Locke and Latham (1984) andextracted 10 meaningful factors consisting of both positiveand negative factors. The positive factors were found to bepositively associated with job performance and jobsatisfaction, whereas negative factors were found to benegatively associated for the same. Orpen (1995) foundthat the impact of goal setting was stronger among poorperformers than among good performers and that thisrelationship was moderated by superior relations with theemployees. Medlin and Green Jr (2009) investigated therelationships between goal setting, employee engagement,workplace optimism and individual performance and foundthat goal setting leads to engaged employees, which in turnleads to higher levels of workplace optimism that improvesthe individual performance of employees. Mahbod (2007)in their study, provided an integrated approach thatprioritised organisational key performance indicators(KPIs) in terms of the criteria of SMART (Specific,Measurable, Attainable, Realistic, Time-sensitive) goals.Bipp and Kleingeld (2011) found that employee perceptionof a goal-setting system is related to both job satisfactionand goal commitment. Devrajan et al. (2018) studied therole of goal setting in the creation of work meaningfulnessand found a positive association between goal rationale andwork meaningfulness. Hoek et al. (2018) studied the extentand utility of goal setting at the team level within the publicsector and its effect on their performance. From theindividual and group level, the research on goal setting hasbeen further extended to a more macro-level where theorganisation as a whole is being studied. Goal-setting wasproven in the literature to have increased the performance

SCMS Journal of Indian Management, January-March - 2021 77
A Quarterly Journal
among individuals, teams, and the organisation in Germany(Asmus, Karl, Mohnen & Reinhart, 2015; Bipp &Kleingeld, 2011), Spain (Morelli & Braganza, 2012),Taiwan (Chiu, Chen, Lu, & Lee, 2006), Sweden (Thorgren& Wincent, 2013) and India (Bhattacharya & Neogi, 2006;Mishra & Srivastava, 2008).
3. Conceptual Framework
Goal Setting is an open theory, and there is no limit to thediscoveries that can be made between the goal-settingtheory and other theories (Locke & Lantham, 2006).Longitudinal studies are needed to gain insight into theperceptions of a goal-setting program and its effect onperformance-related variables (Bipp & Kleingeld, 2011).
According to Lantham et al. (2008), goal setting has a roleto play in public sector management, and it being combinedwith self-management techniques can prove equallyimportant in the Public Sector. The past literature foundlimited studies considering all the relevant variables of thegoal-setting scale developed by Locke and Latham in 1984(Lee et al., 1991; Bipp & Kleingeld, 2011). However, mostof these studies did not consider the overall employeeoutcome as one of its variables. Therefore, the presentstudy mainly focuses on the relationship of the 10-factormodel developed by Lee et al. (1991) with EmployeeOutcome. Therefore, a structural model is being theorised,incorporating Goal Setting as an antecedent to EmployeeOutcome, which is shown in Fig.1.1.
Fig. 1.1: Hypothesised structural model.
Source: From author’s study
3.1 Goal Setting variables
Goal clarity describes the clarity and specificity of goalsand the prioritisation of those goals. Goal rationale isconcerned with the clarity of performance-goalrelationships and the reason behind those goals. Goalefficacy relates to the existence of proper action plans,job training and feedback and one’s happiness on achieving
the goals. Supervisor Support relates to the supervisor’ssupportiveness and willingness to let subordinatesparticipate in setting goals and strategies. Use of goalsetting in performance appraisal describes the use ofgoal setting in the performance appraisal and reviewprocess. Rewards represent the probability that goalachievement will lead to security, pay raise and opportunityfor promotions etc. Organisational facilitation for goalachievement relates to teamwork, company resources and

SCMS Journal of Indian Management, January-March - 2021 78
A Quarterly Journal
policies that facilitate goal achievement. Goal stressrelates to the difficulty and stressfulness of goals andemployee’s failure to attain them. Dysfunctional effectsof goal deals with punitive measures such as a non-supportive supervisor or top management, using goals as amode of punishment rather than to facilitate performance.And Goal Conflict describes different types of goal inducedconflicts such as inter-role conflicts, too many goals andpersonal value related conflicts (Lee et al., 1991).
3.2 Employee Outcome variables
Job performance refers to “employee behaviours that areconsistent with the expectations and that contribute toorganisational effectiveness (Judge & Meuller, 2012).Harter et al. (2002) defines the term employee engagementas “an individual’s involvement and satisfaction with as wellas enthusiasm for work”. According to Locke (1976), jobsatisfaction is a pleasurable or positive emotional stateresulting from the appraisal of one’s job or job experiences.Motivation is defined by Pinder (1998) as “a set ofenergetic forces that originates both within as well asbeyond an individual’s being, to initiate work-relatedbehaviour, and to determine its form, direction, intensityand duration” (cited in Tremblay et al., 2009).
4. Research Methodology
Based on the conceptual framework, a research design hasbeen laid down to follow the study in a systematic way.Goal Setting is considered to be the primary independentvariable and Employee Outcome is considered to be thekey dependent variable for the present study.
The study is focused on the CPSEs present in Assam. Thestudy has been conducted with respect to the presence ofMoU based Goal Setting process in CPSEs. Only thoseExecutives/Officers who are assigned with individual KeyResult Areas (KRAs)/ Key Performance Areas (KPAs) aretaken into consideration for the study. Four behaviouralattributes were taken into consideration while measuringthe employee outcome.
4.1 Objectives
The study aims to fulfil the following objectives;
i) To measure employee perception regarding the qualityof Goal Setting in Central Public Sector Enterprises inAssam.
ii) To examine the relationship between Goal Settingand Employee Outcome.
4.2 Sampling design
The data was collected from 640 participants from sixprofit-making CPSEs present in Assam, Oil and NaturalGas Corporation Ltd (ONGC), Indian Oil Corporation Ltd.(IOCL), Power Grid Corporation of India Ltd (PGCL), OilIndia Ltd. (OIL), Airport Authority of India (AAI), NorthEastern Electric Power Corporation Ltd. (NEEPCO).Judgement sampling was used to identify the top profit-making CPSEs from each category present in Assam (PEsurvey report, 2014-15). Non-probability purposivesampling method was used to select the sample for thepresent study. Purposive sampling, also known as judgmentsampling basically involves selecting a sample that isbelieved to be representing the population (Gay & Diehl,1992). Moreover, for the purpose of our research, theselection of cases was based on the following criteria;
a. The respondent should be of Executive Level.
b. The respondent should be assigned with goals andshould be involved in the goal-setting process.
All the items in the questionnaire were measured in 5-pointLikert Scale ranging from “Strongly Agree” to “StronglyDisagree”.
4.3 Research tools
In order to measure the perception of goal setting, the 10-factor model developed by Lee et al. (1991) is being used.These 10 factors are a reduced version of the goal-settingquestionnaire developed by Locke and Latham in 1984.
In order to measure Employee Outcome, four behaviouraloutcomes were selected, viz., Job Performance, Motivation,Employee Engagement and Job Satisfaction. It should benoted that the items that are related to individual job andjob-related goals are included in the questionnaire. As such,the Job Performance scale by Koopmans et al. (2013),Work Motivation scale by Shouksmith (1989) andTremblay et al. (2009), Employee Engagement scale byHarter, Schmidt & Hayes (2002), and the Job SatisfactionScale by Macdonald and Macintyre (1997) and SHRMReport (2014), were taken into consideration for measuringthese outcome variables.

SCMS Journal of Indian Management, January-March - 2021 79
A Quarterly Journal
4.4 Hypotheses
The hypotheses for the present study were set in thefollowing manner;
H1: Goal Setting is positively related to EmployeeOutcome.H2: The positive aspects of Goal Setting are positivelyrelated to Employee Outcome variables.
H3: The negative aspects of Goal Setting are negativelyrelated to Employee Outcome variables
5. Analysis
The responses (n=640) are subjected to analysis using theSPSS 20 version. The reliability test revealed theCronbach’s Alpha for Goal Setting to be .89 and forEmployee Outcome to be .92. These values fall under theacceptable range of 0.70 to 0.95 (Tavakol & Dennick,
2011). Descriptive analysis is carried out in order to findthe mean scores for analysis of the first objective, andCorrelational Analysis is done for the analysis of thesecond objective.
5.1 Perception of Goal setting
The mean scores obtained from descriptive analysis wereinterpreted based on the criteria given by Kraetschmer etal. (2004) and Francois (2014), where mean scores lessthan 3 was termed as ‘low level’, 3 to 3.99 as ‘moderatelevel’ and 4 to 5 as ‘high level’ perception. The data onperception of executives of CPSEs regarding Goal Settingand its factors are displayed in the following manner, asshown in Table 1.1.The mean scores (Table 1.1) indicated that the Goal Settingscore (3.81) in CPSEs was ‘Moderate’. This implied thatthe quality of Goal Setting process was perceived by theexecutives to be moderate in the CPSEs.
Table 1.1 : Mean Scores of Goal Setting variables.
If the individual factors were analysed, the mean score ofGoal Clarity (4.43), Goal Efficacy (4.14) and SupervisorSupport (4.03) was found to be ‘High’ for the CPSEs. Thisimplied that the executives of CPSEs have specific andclear goals set for the executives with proper prioritisation.They have all the skills and capabilities to achieve theirgoals. They are properly trained for the particular jobassignments. There existed a participative relationshipbetween the Supervisor and the Subordinate regarding Goalsetting. The supervisors were found to be highly supportive
and helpful towards the executives in achieving their goals.It was also found that the other positive aspects, i.e., GoalRationale (3.95), Use of Goals in Performance Appraisal(3.85), Rewards (3.34) and Organizational Facilitation(3.97), have scored ‘Moderate’. This implied that theexecutives had moderate knowledge about their assignedgoals and the use of those goals in their appraisal process.They perceived that they have a moderate level of goal-related rewards and that achievement of their goals is notdirectly linked to rewards like PRP, Promotion etc. It
Source: Primary data

SCMS Journal of Indian Management, January-March - 2021 80
A Quarterly Journal
should be noted that the executive’s rewards are based onother factors as well, such as the Profit of CPSE,Executive’s Grade, MoU rating, Performance review ratingand the recommendations by the Remuneration Committee(DPE OMs dated 26.11.08 & 09.02.09). The negativeaspects, viz., Goal Stress (3.44), Dysfunctional Effects(3.50) and Goal Conflict (3.46) of Goal setting were alsofound to be present at a ‘Moderate’ level in the CPSEs.This implied that executives experience a moderate levelof difficulty and stressfulness in relation to their goals.
The mean scores of goal setting across CPSEs wereanalysed and are displayed in Fig.1.2. The total Goal Settingscore was ‘Moderate’ for all the CPSEs indicating that allthe CPSEs had a moderate level of Goal Setting Process.The opinions of executives were subjected to one-wayANOVA in order to find out the significant difference ofopinion regarding Goal Setting across CPSEs.
Fig.1.2: Goal setting scores across CPSEs
They have a moderate level of managerial dysfunctions andconflicts arising during their goal-setting process.
Source: Primary Data
The result revealed a significant difference of meansregarding goal setting (p=.033, p<.05) across CPSEs,implying that the executives differ in their opinionregarding goal setting across the six CPSEs.
5.2 The relationship between Goal Setting and EmployeeOutcome
Correlation analysis was used in order to find out anysignificant relationship between Goal Setting andEmployee Outcome. The effect sizes for the coefficientswere assumed as .10 to be Small/Weak, .30 to be Medium,.50 to be Strong/High and .70 and above as Very Strongcorrelation (Kotrlik & Williams, 2003).
Figure 1.3 below shows a ‘Strong’ positive correlationbetween Goal Setting and Employee Outcome (p=.680,
p<.001). This indicated Goal Setting to be stronglyassociated with the Employee Outcome in CPSEs.Similarly, Goal Setting was found to have a significantpositive correlation with the sub-variables of EmployeeOutcome. All the sub-variables showed a strong correlationexcept for only Job Performance that was found to havescored a moderately significant correlation with GoalSetting. This implied that when the quality of Goal Settingis increased, the sub-variables, viz., Job Satisfaction,Motivation and Employee Engagement increases at a higherrate and Job Performance increases in a moderate manner.Therefore, supporting H1, it can be said that at the .01 levelof significance, Goal Setting was positively related toEmployee Outcome.

SCMS Journal of Indian Management, January-March - 2021 81
A Quarterly Journal
Fig. 1.3. Figure showing Correlation coefficients betweenGoal Setting and Employee Outcome.
Source: Author’s analysis
Again, correlation analysis between Goal Setting variableswith sub-variables of Employee Outcome was carried outin order to find out any significant relationships. The resultsare shown in Table. 1.2.
In the case of Goal Setting variables and EmployeeOutcome, it can be seen that all the variables have a p-valueless than .01, which indicate a significant correlationbetween Goal setting and Employee Outcome. GoalClarity, Goal Rationale, Goal Efficacy, Supervisor Support,
Goal Setting in PA and Organizational Facilitation werefound to have a strong positive relationship with EmployeeOutcome. This meant that the higher the level of thesevariables, the higher is the Employee Outcome. Rewardsare found to have a moderate positive relationship withEmployee Outcome. And the negative factors such as GoalStress, Dysfunctional Effects of Goal and Goal Conflictis found to have a ‘Weak’ negative relationship indicatingthat the increase in these variables decreases EmployeeOutcome in a similar manner (Refer to Table 1.2)

SCMS Journal of Indian Management, January-March - 2021 82
A Quarterly Journal
Table. 1.2. Table showing Correlation coefficients between Goal SettingVariables and Employee Outcome variables
When the relationship between the Goal Setting variablesand the sub-variables of Employee Outcome are analysed,it can be seen that the all the positive aspects of Goal settinghave a significant positive correlation. The strength of theco-efficient ranged from strong to weak (refer to Table1.2). This implied that when the positive aspects of Goalsetting increased, the sub-variables of Employee Outcomealso increased in the given manner. Therefore, supportingH2, it can be said that .01 level of significance, the positiveaspects of Goal setting are positively related to EmployeeOutcome variables.
When the negative aspects of Goal setting and Employeeoutcome variables are analysed, it can be seen that exceptfor Goal Stress and Job Satisfaction, all the other variablesare found to have a significant weak negative correlationwith the Employee Outcome and its sub-variables. Thisimplied that when these negative variables have increased,the Employee Outcome is decreased. Therefore, with the
* Correlation is significant at the 0.01 level (2-tailed). Source: Primary Data
exception mentioned above and supporting H3, it can besaid that at the .01 level of significance, the negative aspectsof goal setting are negatively related to Employee Outcomevariables.
5.3 Impact of Goal Setting on Employee Outcome
The correlation analysis only helped in determining thedegree of the relationship, and it was not sufficient to provecausality. As such, a regression analysis was used tomeasure the impact of goal setting on employee outcome.The value of R2 for Employee Outcome was found to be.463, indicating that the model explains 46.3% variance inthe Total Employee Outcome; the estimated regressionparameters were found to be βββββ0
= 1.571(intercept) and βββββ1=
.684 (slope), indicating a positive linear relationship. Thisregression line can be interpreted as, when X= 0, the valueof Y is 1.571.
i.e., Employee Outcome =1.571 + .684 × Goal Setting

SCMS Journal of Indian Management, January-March - 2021 83
A Quarterly Journal
This implies that goal setting has a positive impact onEmployee Outcome and that Employee Outcome increaseswith a better goal-setting process.
Table. 1.3. Table showing regression coefficients.
Again, Multiple Regression analysis is carried out to findout the major predictors of Goal Setting that affectsEmployee Outcome. With an R2 value of .576, theregression coefficients are shown in Table 1.3.
* Significant at .01 level. Source: Primary Data
The regression coefficients Table 1.3 reveals that GoalClarity (β=.182, p=.000<.01), Goal Efficacy (β=.161,p=.000<.01), Supervisor Support (β=.105, p=.000<.01),Organizational Facilitation (β=.173, p=.000<.01), and GoalStress (β= -.073, p=.000<.01), and Goal Conflict(β= -.064, p=.001<.01) significantly predicts EmployeeOutcome. The positive aspects of Goal setting such as,Goal Clarity, Goal Efficacy, Supervisor Support andOrganisational facilitation were found to have a positiveimpact on Employee Outcome and the negative aspects suchas Goal Stress and Goal Conflict were found to have anegative impact on employee outcome. This can besummarised in quadratic form as shown below;
i.e., Employee Outcome = 1.337 +.182 × Goal Clarity+.161 × Goal Efficacy + .105 × Supervisor Support+.173 × Organisational Facilitation - .073 × Goal Stress- 0.064 × Goal Conflict
Thus, the results from regression analysis suggest that GoalSetting significantly predicts Employee outcome and sixout of the ten Goal Setting factors (i.e., Goal Clarity, GoalEfficacy, Supervisor Support, Organizational Facilitation,Goal Stress and Goal Conflict) were found to have thesignificant power to predict Employee Outcome.
6. Conclusion
Organisations nowadays rely highly on effectiveperformance management and goal setting interventions.This study contributes to the practical and theoreticalknowledge of Goal Setting and its relationship withdifferent behavioural outcomes. The study providedinformation on how the employees perceived their goal-setting process and how this can be used as a tool for furtherpolicymaking. The study brought upon some interestingfacts about the relationship between Goal Setting in Central
SCMS Journal of Indian Management, January-March - 2021 84
A Quarterly Journal
Public Sector Enterprises (CPSEs) and EmployeeOutcome. Firstly, the results supported the notion thatexecutives scoring high on goal setting variables have abetter understanding of the goal-setting process. Secondly,the Goal Setting process is found to be of moderate levelin the CPSEs present in Assam. This raised an importantquestion regarding the credibility of the individual goal ofthe executives of these profit-making CPSEs. It is arguedthat the targets set in CPSEs are much lower than actualachievements (Sharma, 2013; Althaf & Ramesh, 2013;Shirley, 1998; Yadav & Dabhade, 2013). Therefore, theCPSEs should attempt to re-evaluate the goal-settingprocess and focus on all the other factors that make thegoal-setting process more effective. Thirdly, the study ofpossible relationships between Goal Setting and EmployeeOutcome leads the researcher to conclude that positiveperception of Goal Setting increases Employee Outcomeand all the 10-factors are significantly associated withEmployee Outcome. Lastly, the significant relationshipsbetween Goal Setting and Employee Outcome found fromRegression analysis revealed Goal Setting to be asignificant predictor of Employee Outcome and six factors,viz., Goal Clarity, Goal Efficacy, Supervisor Support,Organizational Facilitation, Goal Stress and Goal Conflictwere found to significantly predict Employee Outcome.Therefore, the CPSEs should focus more on increasing thepositive aspects and reducing the effects of the negativeaspects. Further, the organisations can provide theemployees with high goal-specific support so that they canobtain realistic expectations with respect to goals. Thus,the conclusion suggests that Employee Outcome can beenhanced through proper goal setting and those goal-settingvariables have a direct impact on Employee Outcome.
6.1. Limitations
The present study is limited to only six CPSEs and theirexecutives present in Assam. As such, the data is limitedto a specific sample, given that the data was collected onlyfrom the units of the organisation present in Assam. Assuch, the small size effects, especially in correlationanalysis, was difficult to detect. Since the measurementof items is subjective, it needs to be interpreted withcaution. For example, differing interpretation of items bysubjects may lead to socially desirable answers, which may,in turn, lead to bias. The employee outcome is limited tobehavioural aspects only.
6.2 Scope for future research
Future research can be done for the development andrefinement of the goal-setting questionnaire. Studies canbe done either in the qualitative or quantitative areas ofgoal setting and its relationships with other outcomevariables. Given that the study conducted is limited toCPSEs only, it would be interesting to look at differencesin opinions among two or more organisations, preferablybetween public and private organisations.
References:
Althaf, S. and Ramesh, G. (2013). Management of AgencyProblem through Performance Contracts–Case ofPublic Sector Enterprises. Proceedings of 3rd
Biennial Conference of the Indian Academy ofManagement, IIM Ahmadabad Institutional Repos-itory, 2013. Retrieved from, < http://hdl.handle.net/11718/11607>
Asmus, S., Karl, F., Mohnen, A., & Reinhart, G. (2015).The impact of goal-setting on worker performanceempirical evidence from a real-effort productionexperiment. Paper presented at 12th GlobalConference on Sustainable Manufacturing.ProcediaCIRP, Elsevier, 26, pp. 127-132. Retrievedfrom, < https://www.sciencedirect.com/science/article/pii/S2212827115001626 >
Bhattacharya, S. & Neogi, D.G. (2006).Goal SettingTendencies, Work Motivation and OrganizationalClimate as Perceived by the Employees. Journal ofIndian Academy of Applied Psychology, 32(1), pp.61-65.
Bipp, T. & Kleingeld, A. (2011).Goal Setting in Practice:The Effects of Personality on Perceptions of the GoalSetting Process on Job Satisfaction and GoalCommitment. Personnel Review, 40(3), pp. 306-326.
Chiu, J. S., Chen, W., Lu, F. C., & Lee., S. (2006, May).The Linkage of Job Performance to Goal Setting,Team Building and Organizational Commitment in theHigh-Tech Industry in Taiwan. The Journal ofHuman Resource and Adult Learning, pp.130-142.Retrieved from <http://www.hraljournal.com/Page/17James%20Shan-Kou%20Chiu.pdf >

SCMS Journal of Indian Management, January-March - 2021 85
A Quarterly Journal
Department of Public Enterprises. Public EnterprisesSurvey, 2014-2015. New Delhi: Govt. of India(2015).Web. 2nd June 2015.
Devarajan, R., Maheshwari.S., & Vohra, V. (2018).Managing Performance: Role of goal setting increating work meaningfulness. The Business andManagement Review, 9(4), 261-274.
Francois, E. J. (2014). Development of a scale to assessfaculty motivation for internationalising theircurriculum. Journal of Further and HigherEducation, 38(5), pp. 641-655.
Gay, L.R. and Diehl, P.L. (1992). Research Methods forBusiness and Management. New York, NY:Macmillan Publishing Company.
Harter, J.K., Schmidt, F. L., & Hayes, T. L. (2002).Business-Unit-Level Relationship BetweenEmployee Satisfaction, Employee Engagement, andBusiness Outcomes: A Meta-Analysis. Journal ofApplied Psychology, 87(2), pp. 268–279.
Hoek, M., Groeneveld, S., & Kuipers, B. (2018). GoalSetting in Teams: Goal Clarity and Team Performancein the Public Sector. Review of Public PersonnelAdministration, 38 (4), pp. 472-493.
Kim, J.S., & Hamner, W.C. (1976). Effect of performancefeedback and goal setting on productivity andsatisfaction in an organisational setting. Journal ofApplied Psychology, 61 (1), pp. 48-57
Kotrlik, J. W. & Williams, H.A. (2003). The incorporationof effect size in Information Technology, Learningand Performance Research. Information, Learning,and Performance Journal, 21(1), pp. 1-7
Koopmans, L., Bernaards, C., Hildebrand, V., Buuren, S.,Beek, A. J., & Vet, H.C.W. (2013). Development ofan individual work performance questionnaire.International Journal of Productivity andPerformance Management, 62(1), pp.6-28.
Kraetschmer, N., Sharpe, N., Urowitz, S. & Deber, R. B.(2004). How does trust affect patient preferences forparticipation in decision-making? HealthExpectations, 7, 317-326.
Latham, G.P., & Yukl, G.A., (1975). A review of researchon the application of goal setting in organisations.Academy of Management Journal,18(4), pp. 824-845.
Latham , G. P. , & Baldes , J. J . ( 1975 ). The PracticalSignificance of Locke’s theory of goal setting.Journal of Applied Psychology, Vol 60, pp.122 – 124.
Latham, G. P., Mitchell, T. R., & Dossett, D. L. (1978).The importance of participative goal setting andanticipated rewards on goal difûculty and jobperformance. Journal of Applied Psychology, Vol.63, pp. 163 – 171.
Latham, G. P., Borgogni, L., and Petitta, L. (2008). GoalSetting and Performance Management in the PublicSector. International Public ManagementJournal,11(4), pp. 385-403.
Lee, C., Bobko, P., Earley P.C. and Locke, E. A. (1991).AnEmpirical Analysis of a Goal Setting Questionnaire.Journal of Organizational Behaviour, Vol 12, pp.467-482.
Locke, E. (1968). Toward a theory of task motivation andincentives. Organisational Behavior and HumanPerformance, 3(2), pp. 157-89.
Locke, E. A. (1982). The Ideas of Fredrick W. Taylor: AnEvaluation. Academy of Management Review,7(1),pp. 14-24.
Locke. EA and Latham, G. P. (1984). Goal Setting: AMotivational Technique That Works. New Jersey:Prentice Hall.
Locke, E. A. and Latham, G. P. (2002). Building a practicallyuseful theory of goal setting and task motivation: A35-year odyssey. American PsychologicalAssociation, 57(9), pp 705–717.
Locke, E. A. and Latham, G. P. (1990). A Theory of GoalSetting and Task Performance. New Jersey: Prentice-Hall.
Locke, E. A. and Latham, G. P. (2013). New Developmentsin Goal Setting and Task Performance. New York,NY: Routledge.
Locke, E. A., & Latham, G. P. (2006). New Directions toGoal Setting. Association of Psychological Science,15(5), 265-268.
Locke, E. A. ( 1976 ). Nature and Causes of JobSatisfaction. In M. D. Dunnette (Ed.), Handbook ofindustrial and organisational psychology, pp. 1297 –1349. Chicago: Rand McNally.

SCMS Journal of Indian Management, January-March - 2021 86
A Quarterly Journal
Macdonald, S., & MacIntyre, P. (1997). The Generic JobSatisfaction Scale: Scale Development and ItsCorrelates. Employee Assistance Quarterly,13(2),pp. 1-16.
Medlin, B. & Green Jr. K.W., (2009): Enhancingperformance through goal setting, engagement andoptimism. Industrial Management & DataSystems,109(7), pp.943-956.
Misra, S. & Srivastava, Kailash B.L. (2008). Impact of GoalSetting and Team Building Competencies onEffectiveness. Proceedings of the 4th IEEEInternational Conference on Management ofInnovation and Technology, ICMIT. Web. 11th Jan2019.
Morelli, G. & Braganza, A. (2012). Goal Setting Barriers:A Pharmaceutical Sales Force Case Study.” TheInternational Journal of Human ResourceManagement, 23(2), pp. 312-332.
Orpen, C. (1995). Employee job performance and relationswith superior as moderators of the effect of appraisalgoal setting on employee work attitudes.International Journal of Career Management,7(2),pp.3 – 6.
Shahin, A. and Mahbod, M. A. (2007). Prioritisation of KeyPerformance Indicators: An Integration of AnalyticalHierarchy Process and Goal Setting. InternationalJournal of Productivity and PerformanceManagement, 56(3), pp. 226-240.
Shirley, M. (1988). Why Performance Contracts for State-Owned Enterprises Haven’t worked. Public Policy forthe Private Sector Note 150. World Bank: WashingtonDC.
Sharma, G. L. (2013). A Committee Report on PublicSector Enterprises and the Memorandum ofUnderstanding: Charting New Frontiers. LalBahadur Institute of Management, New Delhi.Available at < http://www.dpemou.nic.in/>
Shouksmith, G. (1989). A construct Validation of a Scalefor Measuring Work Motivation. New ZealandJournal of Psychology, Vol 18, pp. 76-81.
Society for Human Resource Management. (2014).Employee Job Satisfaction and Engagement: TheRoad to Economic Recovery. A Research Report bythe Society for Human Resource Management.Retrieved from, <https://www.shrm.org/hr-today/trends-and-forecasting/research-and-surveys/D o c u m e n t s / 1 4 - 0 0 2 8 % 2 0 J o b S a t E n g a g e _Report_FULL_FNL.pdf >
Tavakol, M. & Dennick, R. (2011). Making sense ofCronbach’s alpha. International Journal of MedicalEducation, Vol 2, pp. 53-55.
Tremblay, M. A., Blanchard, C. M., Taylor, S., Pelletier, L.G., & Villeneuve, M. (2009). Work Extrinsic andIntrinsic Motivation Scale: Its Value forOrganizational Psychology Research. CanadianJournal of Behavioural Sciences,41(04), pp. 213-226.
Yadav, R.K. & Dabhade, N. (2013). Performancemanagement system in Maharatna Companies (aleading public-sector undertaking) of India – a casestudy of BHEL, Bhopal (MP.) International Lettersof Social and Humanistic Sciences, Vol 4, pp. 49-69.
************

SCMS Journal of Indian Management, January-March - 2021 87
A Quarterly Journal
Earnings Management inBanking Industry: A Systematic
Review of Literature
Abstract
Scams in the banking sector have diverted stakeholders’ attention towards manipulated financial figures that reduce the
authenticity of accounting numbers. There is an urgent need to investigate and plug the loopholes. The objective of the
present paper is to review the literature on earnings management (EM) in the banking industry and to develop a
conceptual framework. The review is based on 129 selected papers published between 1988 to 2019 in peer-reviewed
journals. The literature is mapped on the basis of databases, publication year, country of study, number of citations, and
approaches used to measure EM. The proposed conceptual framework of EM in the banking industry comprises of its
determinants, approaches, consequences and mitigators.
Keywords: Earnings Management, Banking Industry, Scams, Systematic Literature Review, Conceptual
Framework, Loan Loss Provision
Abstract
Dr. Deepa MangalaProfessor
Haryana School of Business, Guru Jambheshwar University ofScience and Technology, Hisar, Haryana (125001)
Email: [email protected]
Neha SinglaJunior Research Fellow
Affiliated Institution: Haryana School of Business, GuruJambheshwar University of Science and Technology,
Hisar, Haryana (125001)
Email: [email protected]
SCMS Journal of Indian Management, January-March - 2021 88
A Quarterly Journal
1. Introduction
Collapse of banks and financial institutions have alwayslanded the economies around the globe into trouble with anumber of shocks to the stakeholders. The story starts withthe collapse of the Medici Bank, founded by Giovanni diBicci in the year 1397, in Florence in Italy. Historywitnessed another collapse of the Overend Gurney & Co.bank of the United Kingdom in the year 1866. During thetwentieth century, banks such as the Danat-bank (1931,Germany), the Herstatt Bank (1974, Germany), the LincolnSaving and Loan Association (1989, California), the Bankof Credit and Commerce International (1991, Pakistan),the Nordbanken (1991, Sweden) and the Barings Bank(1995, Britain) became bankrupt. The advent of the twenty-first century has made the situation worse. In the year 2008,seven prominent banks became bankrupt such as BearStearns (USA), Northern Rock (Britain), Lehman Brothers(USA), Washington Mutual (USA), Royal Bank of ScotlandGroup (Britain), ABN-Amro (The Netherlands) andBankwest (Australia) (“List of corporate collapses andscandals,” 2019).
Banks in developing countries are not far behind in thisrace. The recent Indian examples include the PunjabNational Bank (2018) and the Punjab Maharashtra Co-operative Bank (2019). “In the last 11 fiscal years, a totalof 53,334 cases of fraud were reported by banks involvinga massive amount of 2.05 trillion, the RBI data said”(Press Trust of India, 2019). This has resulted in asignificant increase in the percentage of bad loans (non-performing assets) from below 3% in 2006-2008 to 11.5%by 2018 (Mistry, 2019), pressurising banks to manipulateearnings. The most common element in all these scamswas misreporting of financial numbers. In the case ofLehman Brothers, “A March 2010 report by the court-appointed examiner indicated that Lehman executivesregularly used cosmetic accounting gimmicks at the endof each quarter to make its finances appear less shaky thanthey really were” (“Lehman Brothers,” 2019). In anotherexample of Punjab and Maharashtra Cooperative (PMC)Bank, “The bank misled auditors of the Reserve Bank ofIndia (RBI) by replacing legacy accounts of the companywith dummy accounts, dating back to 2008, to show ahealthy balance sheet” (Roy & Panda, 2019). Thesecollapses did not happen overnight, but were hidden initially
in the guise of window dressed financial statements. Theprimary reasons responsible for the collapse of banks areirregularities in financial statements, inadequateprovisioning, non-recognition of NPAs, bad governancepractices, etc. Earnings Management (EM) can bedescribed as the manipulation of earnings in a desireddirection by managers within the flexibility provided byaccounting standards and laws to fulfil their personalmotives. Though it does not violate any standard or law, itdeviates from the spirit of the standard or law. This has notonly downgraded banks’ image but has also shattered theinvestors’ and depositors’ confidence in banking systemsin general. So, it has become essential to curb themalpractice of EM.
The concept of EM has evolved over a period of time.Schipper (1989) defines EM as, “disclosure managementin the sense of a purposeful intervention in the externalfinancial reporting process with the intent of obtainingsome private gain.” According to Healy and Wahlen (1999),“EM occurs when managers use judgement in financialreporting and in structuring transaction to alter financialreports to either mislead some stakeholders about theunderlying economic performance of the company or toinfluence contractual outcomes that depend on reportedaccounting numbers.” Managers are supposed to applyprofessional judgement and ethics in accounting as thesituation demands so that the financial statements reporttrue and fair information. However, the accountingprofessional’s judgement gets biased by personal motives,hidden corporate agendas and the flexibility provided bythe regulatory environment. Magrath and Weld (2002) viewEM as a value-maximising function as it helps in meetingthe regulatory requirements, avoiding violation of debtcovenants and achieving the analyst’s expectation regardingstock prices. Dutta and Gigler (2002) found thatshareholders do not find it appropriate to restrict EM as ithelps in reducing the cost of low-earnings prediction bymanagers. Discussing the divergent views of practitioners,regulators and accounting academics, Dechow and Skinner(2000) opine that regulators and practitioners see EM as atroublesome practice that needs immediate correctiveactions, while accounting academicians believe that EMdoes not have any significant effect on financial statements,and for small effects, investor’s attention is not necessary.So, it is a matter of conflict whether EM is good or bad,and till now, there are no conclusive answers to this.

SCMS Journal of Indian Management, January-March - 2021 89
A Quarterly Journal
The present paper strives to provide a detailed review ofliterature on EM practices in the banking industry. Thefollowing sections detail the data and methodology, theme-based classification of selected articles, a conceptualframework of EM in the banking industry, research gap,and major areas for future research.
2. Data and Methodology
For the purpose of a systematic literature review of EMpractices in the banking industry, specific databases wereused to collect relevant empirical research papers. Aftercollecting papers, inclusion and exclusion criteria wereapplied for the final selection of articles. The databasesused were Elsevier’s Science Direct, Emerald, JSTOR,
SAGE, Taylor & Francis and Google Scholar. Search forarticles was done using specific keywords or strings. Thesearch strings are: ‘earnings management in bankingindustry’, ‘earnings management and bank’, ‘consequencesof earnings management in banks’ and ‘bank managers’motivation for earnings management’.
Some articles were manually searched on Google Scholarfrom references of other papers.
The systematic search resulted in an aggregation of 503articles, out of which 106 duplicate articles were deleted,and the remaining 397 were subjected to specified articleinclusion and exclusion criteria (Table 1).
Table 1: Article Inclusion and Exclusion Criteria
Further, 268 articles were removed because these wereeither not available as full text, or were in a language otherthan English, or not related to EM. Few other articles dealtwith EM but were not in the context of the banking industry.Further, the papers which were published before the year
Table 2: Number and Percentage of Included and Excluded Articles
1988 or after 2019 are not included in the scope of thepresent study. Finally, 129 articles were selected fordetailed review. The number and percentage of the includedand excluded articles within the selected databases arepresented in Table 2.

SCMS Journal of Indian Management, January-March - 2021 90
A Quarterly Journal
Classification of Literature
Further, classification of the selected articles (129) is doneon the basis of databases, year of publication, theapproaches used to detect EM, country of study and thenumber of citations. The articles published between 1988to 2019 were classified according to the database (Figure1). The richest sources of selected articles were GoogleScholar and Elsevier’s Science Direct, which contributed80 articles. Emerald (27), JSTOR (13), Taylor & Francis(5) and SAGE (4) contribute 21%, 10%, 4% and 3% of thetotal selected articles respectively. The higher percentageof articles from Google Scholar is due to its freeavailability. It has articles from many databases such asWiley, Kulwer, American Accounting Association, etc.
Figure 1: Article Classification by Database
The articles are arranged on the basis of the year ofpublication (1988 to 2019) to pinpoint the trend ofpublication and development of research on EM in thebanking industry (Figure 2). Only a few studies gotpublished during the period of 1988-2010, and after 2010the number of published research papers has increasedtremendously, exhibiting that in the past decade,researchers in the area of finance and accounting haveshown keen interest in explaining EM practices in thebanking industry. Post 2010, banks across the globe wereat the centre of controversies due to underperformance,stressed assets and governance issues. The subprime crisisfurther posed a question mark on the credibility of major
banks. These circumstances motivated the researchers tore-examine the issues at the heart of the problem fuellingresearch in the area of EM.
Figure 2: Classification of Articles by Publication Year
The articles are distributed on the basis of countries inwhich the study is conducted or from where data iscollected. The country-wise classification (Figure 3)shows that the research on EM practices in the bankingsector is primarily confined to 21 countries. The majorityof the studies focus on a single-country approach, whereas40 empirical papers use a multi-country approach. Themulti-country studies are helpful in making cross-countrycomparisons of the EM behaviour of banks. Of the single-country studies, the majority (around twenty-eight percent)are conducted in the USA. There is a dearth of studies inEuropean countries and other parts of the world, includingfrom emerging markets.
The literature is also categorised on the basis of theapproaches used to detect EM (Figure 4). Specific Accrual,
Figure 3: Classification of Articles by Country

SCMS Journal of Indian Management, January-March - 2021 91
A Quarterly Journal
Total Accrual and Real Activities are the alternativeapproaches used. The analysis reveals that 68.21% ofarticles use the Specific Accrual model due to its popularityin the banking industry. This helps in identifying theimportant factors that have a potential impact on accruals.
Citation of research papers denotes scholarly orintellectual use of one’s research by another scholar in thesame or related area. Citation analysis helps to locate themost critical and influential papers/ researchers in aspecific field. The information about citations was gatheredfrom Google Scholar in February 2020. Out of 129
Figure 4: Classification of Articles by Approaches of EM
Table 3: List of Articles According to Citations
Total Accrual, Real Activities and Specific Accrualapproaches are also used. The ‘Distribution Approach’ isnot popular in the banking industry because it is a relativelynew approach and is primarily helpful in detecting thebenchmark-beating behaviour of bank managers.
selected papers, 104 have been cited. Table 3 includespapers that have more than 100 citations. Ahmed et al.(1999) is the most cited (1067 citations) article, followedby Beatty et al. (2002), Beatty et al. (1995), Laeven andMajnoni (2003), and so on.

SCMS Journal of Indian Management, January-March - 2021 92
A Quarterly Journal
4. Conceptual Framework of Earnings Management
A conceptual framework of EM in the banking industry wasdeveloped (Figure 5) comprising of determinants,approaches, consequences and mitigators of EM. Thedeterminants motivate managers to practice EM. Different
approaches have been developed in the literature to detectEM. EM has far-reaching consequences on banks’performance and corporate social responsibility. Finally,mitigators were identified that ensure a check on EM.
4.1 Determinants of Earnings Management
EM is the result of the application of managerial judgementin the preparation and presentation of financial accounts.Numerous factors motivate managers to manipulateearnings like signalling, managerial compensation, debtcovenants, threshold management, bank risk, ownershipstructure, industry-specific regulation, etc. Table 4 presentsa list of articles that have investigated various determinantsof EM.
Signalling theory was introduced by Spence (1973) andlater developed by Ross (1977). In the corporate world,information asymmetry exists, which means that all theparties do not possess the same amount of information.Managers have privileged access to information, and theyuse this position to signal to various parties and marketparticipants about the future prospects of the company. Inthe banking industry, inflated Loan Loss Provision (LLP)gives an indication to investors that banks have sufficientfunds to face any unforeseen circumstances, and they regardit as a symbol of the bank’s financial soundness. Wahlen
(1994) opines that an increase in LLP is viewed as ‘goodnews’ by investors. Kanagaretnam et al. (2005) concludethat though banks use discretionary LLP to emit signalabout future prospects of the bank to investors, thepropensity of the signal differs positively with investmentopportunities and variability of earnings, and negativelywith the size of the bank. Ghosh (2007) made a study onIndian banks and observed that listed and unlisted banksexhibit no significant difference in their signallingbehaviour. Curcio and Hasan (2015) found that in non-Eurocurrency countries, banks use LLP to signal to outsiders.Abu-Serdaneh (2018) also found that the loan lossallowance is positively associated with year-ahead earnings.Contrary pieces of evidence indicate that managers do notuse LLP to emit signals (Ahmed et al. 1999; Anandarajanet al. 2003; Anandarajan et al. 2007).
Managerial Compensation motivates managers tomanipulate earnings as explained by agency theory initiatedby Ross (1973) and later developed by Jensen andMeckling (1976). According to this theory, managers tendto serve their own interest over the general interest of the
Figure 5: Conceptual Framework of EM

SCMS Journal of Indian Management, January-March - 2021 93
A Quarterly Journal
company and to overcome this behaviour, compensationof managers’ is attached to the firm’s performance (Jensen& Meckling, 1976). This results in upward manipulationof earnings to increase current managerial remunerationand downward manipulation to increase futureremuneration. Cornett et al. (2009) found that CEO pay-for-performance has a positive relation with EM. When abank’s capital adequacy ratio is close to the minimumregulatory requirement, an increase in the level of equityincentives leads to an increase in the level of EM (Chenget al., 2011). Uygur (2013) concludes that EM is positivelyaffected by bank executive’s incentives.
Watts and Zimmerman (1986) hold debt covenantsresponsible for manipulation in accounting numbers. Debtcovenants are the agreement between a company andcreditors stating certain limits regarding earnings orfinancial ratios that a company should not breach. To avoidthe violation of these agreements, managers tend to manageearnings. Kanagaretnam et al. (2003) and Kanagaretnam etal. (2004) found that debt to loan ratio is positivelyassociated with income smoothing, and banks indulge inincome smoothing through discretionary LLP to reducethe cost of external financing. In accordance with theliterature, income smoothing and EM can be usedinterchangeably (Uygur 2013). Othman and Mersni (2014)also found a positive relation between loan to deposit ratioand discretionary LLP. Moghaddam and Abbaspour (2017)discussed a positive and significant effect of financialleverage on EM.
Threshold Management theory describes that managersuse discretion to manipulate earnings in order to achieve atarget ‘threshold’. Burgstahler and Dichev (1997) suggesttwo thresholds: ‘zero threshold’ or loss avoidance and ‘nilvariation threshold’ or avoiding the negative changes inearnings. A new variant, ‘analyst expectation threshold’, hasbeen added by Degeorge et al. (1999). These thresholdscreate incentives for managers to manipulate earnings.Robb (1998) states that when market analysts are unanimousabout the earnings forecast of the bank, the bank managersget highly motivated to manage earnings. Beatty et al.(2002) claim that public banks, when compared with privatecounterparts, are more actively engaged in EM byannouncing more consecutive strings of increase inearnings and circumventing small earnings reduction. Shenand Chih (2005) found that banks use EM to eliminatenegative variation in earnings and earnings losses.
A bank may face different types of risks like credit risk,liquidity risk, operational risk and market risk. In high-risksituations, bank managers resort to EM to hide theirinefficiency or financial difficulties. Operational risk hasa positive association with discretionary accruals,indicating the use of EM by managers to hide theiroperational deficiencies, whereas systematic risk has nosignificant relation with discretionary accruals, implyingthat general risk faced by all the sectors of an economydoes not motivate banks to manage their earnings(Mohammad et al. 2011; Abaoub et al. 2013), firm-specificrisk is negatively associated with EM (Mohammad et al.2011), and total risk has no significant impact (Abaoub etal. 2013) on EM. Cohen et al. (2014) conclude that EMcan successfully predict a bank’s tail risk. Ozili (2017a)found that non-performing loans and loans outstanding havea positive impact on discretionary LLPs.
“The ownership structure is defined by the distribution ofequity with regard to vote and capital, but also by the identityof equity owner” (Wahl, 2006). Different ownershipstructures affect EM differently. If majority shares are heldby a few investors the ownership is concentrated. It is foundthat concentration of ownership has a positive impact onEM (Bouvatier et al., 2014; Lassoued et al., 2017; Lassouedet al., 2018), suggesting that the few controllingshareholders encourage managers to manage earnings tomaximise their personal benefits. State and institutionalownership have a positive impact on EM (Lassoued et al.,2017; Lassoued et al., 2018), indicating that these investorsare interested in current earnings. Family ownership has anegative impact on EM (Lassoued et al., 2017).
Rules and regulation that are specifically meant for aparticular industry are referred to as Industry-specificRegulations. In the banking industry, various regulatoryauthorities, primarily the central bank, impose capitaladequacy requirements to curtail the risk exposure of banks.It is found that banks use discretionary LLP to meet theirminimum capital ratio requirement in order to avoid thecost associated with violating the norms (Moyer, 1990;Lobo & Yang, 2001). Ahmed et al. (1999) reported thatbefore changes in capital regulation of banks in the USA inthe year 1990, LLP had a negative association with capitalratio and subsequent to the changes, the coefficientexhibited a positive association with LLP, indicating a

SCMS Journal of Indian Management, January-March - 2021 94
A Quarterly Journal
declining trend of managing capital via LLP because ofstricter regulations. Chipalkatti and Rishi (2007)investigated Indian banks and found that after 1999 bankingreforms, the banks which are less profitable and poorlycapitalised understate their non-performing assets and LLP.Another study by Ghosh (2007) on Indian banks marks thatLLP is used by managers to manage capital ratio. On thecontrary, Anandarajan et al. (2003) found that in the newcapital ratio regulatory environment, banks do not engagein managing capital via LLP. Further, Kanagaretnam et al.(2003) noted that managers of well-capitalised banks havea higher propensity to indulge in income smoothing thanmanagers of weakly-capitalised banks, as the well-capitalised banks are less prone to regulatory scepticism.Few studies, such as Kanagaretnam et al., 2004; Chang etal., 2008 and Pérez et al., 2008, exhibit that capital ratiodoes not incentivise managers to use discretionary LLP inSpanish banks.
Auditor’s independence implies that the external auditordoes not have any relation with the parties that have afinancial interest in the company. Lack of auditorindependence provides an opportunity for managers tomanipulate earnings. Kanagaretnam et al. (2010a) foundthat in the case of large banks, abnormal audit fees are notlinked with EM as Federal Deposit Insurance CorporationImprovement Act, 1991 holds auditors of large banksresponsible for ensuring the effectiveness of internalcontrol system. On the other hand, small banks are exempt
from these requirements resulting in strong negativerelation of abnormal non-audit fees and abnormal total feesof audit paid to auditor with discretionary LLP. Jayeola etal. (2017) and Akintayo and Salman (2018) reinforce thataudit independence has a positive association with EM.
CEO Turnover is the replacement of an existing CEO witha new one. Bornemann et al. (2015) testified that theincoming CEO reports more discretionary expenses in theturnover year irrespective of low credit risk, to blame hispredecessor for poor performance. The results are strongerwhen the incoming CEO is an outsider as the new internallypromoted CEO cannot blame his predecessor, unlike anincoming outsider CEO, because of his previous positionin the company.
Different phases of growth in an economy are termed asBusiness Cycle. Many studies endorse negative relationbetween GDP growth and LLP (Laeven & Majnoni, 2003;Bikker & Metzemakers, 2005; Ozili, 2017a; Ozili, 2017c;Ozili & Outa, 2018) indicating that banks do not makeadequate provision for bad loans in a boom period andduring a recession in the economy they increase suchprovisions to cope with increased credit risk. Liu and Ryan(2006) reported that in a pre-boom period bank managersincrease their earnings via reducing LLP and during theboom period they decrease earnings via increasingprovision for loan losses. Abu-Serdaneh (2018) found noevidence of procyclicality in Jordanian banks.
Table 4: Determinants of EM

SCMS Journal of Indian Management, January-March - 2021 95
A Quarterly Journal
4.2 Approaches for Detecting Earnings Management
The application of managerial discretion is the genesis ofEM. Researchers have developed different approaches todetect EM. Sun and Rath (2010) have discussed criticallythe approaches used to detect EM, i.e. real activities,specific accrual, earnings distribution approach, totalaccruals and changing accounting choices. The presentpaper elaborates on the EM methods used in the bankingindustry (Table 5).
In the Total Accruals Approach, Healy (1985) used thediscretionary accruals model to detect EM for the firsttime, but he assumed the non-discretionary portion of totalaccrual as a constant, which led to the detection of EMwith error. To overcome this limitation, Jones (1991)introduced another model which controlled the change inthe non-discretionary portion of total accruals. Dechowet al. (1995) presented a new model, called the ModifiedJones model, after making some modifications in the Jonesmodel whose power to test for EM was low. Earnings havetwo parts; one is accruals, and the other is cash flow. Totalaccruals are the adjustment in cash flows as per thejudgement and estimates of management and can besegregated into non-discretionary and discretionaryaccruals. Non-discretionary accruals refer to thoseadjustments in cash flows that are dictated by accountingregulations, whereas discretionary accruals refer to theadjustment in cash flow at the will of the managers butwithin the flexibility provided by accounting regulations(Sun & Rath, 2010). Thus, discretionary accruals are usedas a measure to detect EM.
The Specific Accrual Approach is widely used in thebanking industry. In the specific accrual model, a singleaccrual is used to calculate EM. In the banking industry,LLP forms a major part of total accruals and has beenextensively used by researchers. “An LLP is an expenseset aside as an allowance for uncollected loans and loanpayments. This provision is used to cover a number offactors associated with potential loan losses, including badloans, customer defaults, and renegotiated terms of a loanthat incur lower than previously estimated payments”(Kagan, 2019). The discretionary part of LLP is used todetect EM and has a negative relation with EM. Whenmanagers want to manage earnings upward, they decreaseLLP and vice-versa. Nevertheless, some studies like Beaver
and Engel (1996) use loan loss reserve to detect EM. Morethan 50% of studies have used this approach, therebyexhibiting its popularity in the banking industry, wheresingle accrual (LLP) forms a major part of the totalaccruals portfolio.
Schipper (1989) recognised that the Real ActivitiesApproach can be used to detect EM. Gunny (2010) (ascited in Ruiz 2016, p. 6) explains that real activitymanipulation refers to actions of managers that cause achange in financial or investment transaction orrestructuring operations with the purpose of reaching adesired level of earnings. Real EM can be done in manyways, such as (i) increasing sales through lenient creditterms, (ii) overproduction to reduce fixed cost per unit,(iii) deliberately cutting research and developmentexpenses or advertisement expenses, (iv) selling orpurchasing of securities, etc. In the banking industry,realised securities gains and losses (RSGL) is used as ameasure to manipulate earnings; however, some studiesexhibit that commission and fee income (CF) are also used.Greater information asymmetry in public banks gives theman incentive to indulge in EM more than private banks bymanipulating securities gains and losses (Beatty & Harris,1998). Ozili (2017b) concludes that banks manage earningsthrough commission and fee income.
In the Specific Accrual and Real Activities Approach, acombination of two approaches is used to evaluate EM.Beatty et al. (2002) developed this approach in whichdiscretionary LLP is calculated by applying the modeldeveloped by Beatty et al. (1995), and discretionaryrealised securities gains and losses are calculated byapplying the model developed by Beatty and Harris (1998).EM is the difference between discretionary realisedsecurities gains and losses and discretionary LLP.
The Earnings Distribution Approach is a relatively new,innovative and less explored approach in the literature.Burgstahler and Dichev (1997) developed this approach.This approach is mostly used in those cases where theachievement of earnings benchmark provides greaterincentives to managers. Burgstahler and Dichev (1997) andDegeorge et al. (1999) recognise three benchmarks, whichare loss avoidance, positive change in earnings and analysts’consensus forecast.

SCMS Journal of Indian Management, January-March - 2021 96
A Quarterly Journal
The selection of the right kind of approach is a tough taskfor detecting EM accurately. So, one should take intoconsideration the pros and cons of every approach beforemaking a final selection. McNichols (2000) concludes thatin the specific accrual approach, a direct relation can beestimated between the specific accrual and explanatoryfactors, and it helps researchers in developing an instinctfor the important factors that have a potential impact onaccruals, but it can be applied to only those industries wherea single accrual forms a major portion of total accruals.The total accrual approach can be applied to all industries
Table 5: Constructs Used as Approaches in Detecting EM
which is the main reason for its wider acceptability. Sunand Rath (2010) explained that managers favour the accrualapproach to manipulate earnings rather than resorting tomanipulation through real activities. On the other hand, theuse of managerial discretion in altering real activities needsto be disclosed and hence is easily detectable. Withinaccruals, the total accrual approach is good as it measuresthe effect of various accruals in aggregate, unlike in thecase of specific accrual, but in the banking industry,specific accruals approach is more useful.

SCMS Journal of Indian Management, January-March - 2021 97
A Quarterly Journal
4.3 Consequences of Earnings Management
Researchers have investigated the consequences of EM onbanks’ performance and banks’ responsibility towardsstakeholders in the form of Corporate SocialResponsibility (CSR) (Table 6). Bank Performance canbe estimated through various measures such as Return onEquity, Return on Assets, Earning Per Share, etc. Thefinancial performance of banks has a negative andsignificant relationship with LLP (Wu et al., 2016; Ujah etal., 2017; Ashfaq & Saeed, 2017), implying that with theincrease in EM, the performance of bank decreases.Alhadab and Al-Own (2017) found that in European banks,a high level of EM results in inferior performance measuredthrough return on asset and return on equity. Umoren et al.(2018) revealed that return on assets has a negative relationwith EM. On the other hand, Saidu et al. (2017) did not
find any relationship between EM and bank performance.On the contrary, Abbas (2018) marked that both income-increasing and income-decreasing EM behaviour have apositive impact on bank value. A bank uses differentresources of society to run its operations smoothly;therefore, it also has a responsibility towards society interms of providing employment and providing services orgoods at reasonable rates termed as Corporate SocialResponsibility (CSR). Grougiou et al. (2014) found thatEM and CSR are positively and significantly associatedwith each other, indicating that the banks that are practisingEM are also actively engaged in CSR activities. Bankmanagers view CSR as a pre-emptive approach to build apositive image and to avert the attention of outsiders fromEM activities. Pertiwi and Violita (2017) found that thequality of the CSR report of Islamic banks is not affectedby the presence of EM.
Table 6: Constructs used as consequences of EM
4.4 Mitigators of Earnings Management
EM has both good and bad sides to it. Few managers useEM to further the interests of other parties instead of theirown, thereby creating wealth for the stakeholders. On thecontrary, bad EM practices lead to fraud (Yaping, 2005).Schipper (1989) opined that it is not advisable to eliminateEM completely. He further clarifies that if compensationcontracts are removed, it would result in the lowerperformance of managers. Dechow and Skinner (2000) alsoopined that complete elimination of EM is not an adequatesolution because earnings that are influenced by managerialpredictions and judgement about the future are a bettermeasure of the economic performance of a company thancash flows. Table 7 provides a list of articles that haveexamined the variables that help to mitigate EM.Corporate Governance is a system of monitoring andcontrolling the actions, policies, procedures and decisionsof corporations. Zhou and Chen (2004) opined that goodgovernance experts in the audit committee, active auditcommittee and board of directors play a significant role in
restraining EM. Board independence is negativelyassociated with EM (Cornett et al., 2009; Akintayo &Salman, 2018; Oladipupo & Ademola A, 2018), thoughboard size has no impact on EM (Akintayo & Salman, 2018;Oladipupo & Ademola A, 2018). It is seen that corporategovernance has a negative association with EM (Leventiset al., 2012; Jallow et al., 2012). The presence of foreigninvestors can help in reducing EM. Wu et al. (2012)observed that foreign strategic investors’ presence inChinese banks reduces loss avoidance EM. Ugbede et al.(2013) while investigating Malaysian and Nigerian banks,found that Nigerian banks resort to a higher level of EMcompared to Malaysian banks. Mersni and Ben Othman(2016) found that large board size, presence of auditcommittee and small size of Shariah Supervisory Board(SSB) play a significant role in constraining the use ofdiscretionary LLP to manipulate earnings. Kumari andPattanayak (2017) revealed that in public banks, the sizeof the board and the number of audit meetings have anegative association with EM. On the other hand, in private

SCMS Journal of Indian Management, January-March - 2021 98
A Quarterly Journal
banks, independence of the board and the number ofcommittees in the board play a significant role in mitigatingEM. The reasons attributed to these differences aredissimilarity of ownership structure, regulatoryrequirements and other environmental variables. García-Sánchez et al. (2017) found that gender diversity and thepresence of financial experts on board positively influenceearnings quality.
Auditors are the persons who examine the company’sfinancial records and assess the integrity and reliability offinancial statements. It is evident that the specialisation ofthe auditor in the banking industry restrains the income-increasing EM (Kanagaretnam et al., 2010b; Deboskey &Jiang, 2012) and the type of auditor moderates bank’sbehaviour of avoiding losses and meeting or beatingprevious year earnings (Kanagaretnam et al., 2010b).Further, high quality of audit is also helping in mitigatingEM behaviour of bank managers (Bouvatier et al., 2014;Nawaiseh, 2016). Jayeola et al. (2017) remarked that jointaudit and audit specialisation negatively influence EM.Adoption of IFRS by banks helps in controlling EM. Onaloet al. (2014) opined that the adoption of IFRS significantlyreduces EM behaviour in Malaysian and Nigerian banks.Hassan (2015) revealed that different attributes, i.e., size,growth, profitability, liquidity and leverage of a bank haveno relation with earnings quality in the pre-IFRS period,but subsequent to the adoption of IFRS, all the attributesget positively related with earnings quality except leverage.Adzis et al. (2016) marked that adoption of IAS 39(International Accounting Standards) has led to thereduction of income smoothing behaviour in Hong-Kongbanks. Ozili and Outa (2018) explained that the
implementation of IFRS creates an opportunity formanagers to indulge in income smoothing practices insteadof curbing them.
In banks, sturdy regulations regarding investor protection,effective supervision, accounting disclosure, accountingenforcement, etc., would prove helpful in reducing EM. Itis found that stricter requirements related to accountingdisclosure (Shen & Chih, 2005; Fonseca & Gonzalez, 2008;Uwuigbe et al., 2017), stringent supervisory regulations(Bouvatier et al., 2014), restrictions on activities of banks,effective private and official monitoring, and greaterprotection to investors (Fonseca & Gonzalez, 2008) playa significant role in controlling EM. In the case of Euro-countries that have adopted higher protection for creditorsand sound banking regulation (Curcio & Hasan, 2015), andin the case of tighter legal protection to shareholders inthe Middle East and North African (MENA) countries(Bourkhis & Najar, 2017), it has resulted in acting as aconstraint to manipulating earnings. Di Martino et al.(2017) found that new banking regulations have a negativeassociation with LLP. Dal Maso et al. (2018) found thataccounting enforcement is directly related to earningsquality, as the rise in accounting enforcement results in adecline in the loss avoidance and the use of discretionaryLLP to manage earnings behaviour of banks. Religiosityshows that someone holds strong religious beliefs. Theorganisational structure of banks also differs acrosscountries due to religiosity and cultures. Kanagaretnamet al. (2015) discerned that countries where people arehighly religious are less prone to EM. Religiosity decreasesthe benchmark-beating EM behaviour.
Table 7: Constructs used as mitigators of EM

SCMS Journal of Indian Management, January-March - 2021 99
A Quarterly Journal
4.5. Research Gap and Area for Future Research
Research on EM in the banking industry is still evolving.The review helped to identify research gaps or the areasrelated to EM that need to be explored in the bankingindustry. There is a dearth of research on EM by banks indeveloping countries like India. The results drawn fromthe studies in developed countries are not applicable at parto the banking system of developing countries due todifferences in regulatory mechanisms and bankingstructures. Financial markets have globalised. Bankmanager’s motivations to indulge in EM and methods ofmanipulating earnings differ across countries. Thus, infuture studies, samples can be drawn from differentcountries to make an international comparison of EMbehaviour. The specific accrual model has been extensivelyused to calculate EM, whereas few studies have used acombination of models simultaneously. Researchers canuse more than one approach to measure EM to assess whichapproach better explains EM behaviour.
5. Conclusion
Manipulation of earnings in banks can badly hit the growthof an economy. When managers indulge in EM, thefinancial statements fail to convey accurate informationabout the bank’s value and its risk level, and it may also notbe able to provide early warning signals which may lead tobankruptcy at later stages. This paper examined EM in thebanking industry through a systematic literature review. Inthis review paper, articles are classified on the basis ofpublication year, country of study, journal of publication,citation analysis etc., to give a comprehensive idea of allthe articles. A conceptual framework of EM is alsodeveloped. It is concluded that bank managers take undueadvantage of discretion in accounting choices to hide theirinefficiencies, to increase their compensation, to avoiddebt covenant violation, to signal private information tostakeholders, and there may be many other factors such asthreshold achievement, bank risk, capital adequacyregulations etc. that motivate managers to indulge in EMpractices. Though EM may be measured through variousapproaches, the most popular approach in the bankingindustry is the specific accrual approach in which LLP iswidely taken as a proxy for EM. Further, the paper disclosesthat EM influences banks’ profitability and reduces thereliability of the CSR report. Thus, there is a need tocontrol and mitigate EM practices through effectivecorporate governance, implementation of IFRS in the truespirit, enhanced audit quality, sturdy regulations and
propagation of ethical business practices in the bank. Onlygood quality financial reports can help in gaining theconfidence of the public and providing valuable and relevantinformation to the stakeholders.
References
Abaoub, Ezzeddine, Kaouther Homrani, and Souha BenGamra. “The determinants of EM: Empirical evidencein the Tunisian banking industry (1999-2010).” Journal of Business Studies Quarterly 4.3(2013): 62-72.
Abbas, Ahmad. “EM in banking industry and its impact onthe firm value.” AKRUAL: Jurnal Akuntansi 10.1(2018): 69-84.
Abdulazeez, D. A., L. Ndibe, and A. M. Mercy. “Corporategovernance and financial performance of listed depositmoney banks in Nigeria.” Journal of Accounting andMarketing 5.1 (2016): 1-6.
Abu-Serdaneh, Jamal. “Bank loan-loss accounts, incomesmoothing, capital management, signaling andprocyclicality.” Journal of Financial Reporting andAccounting 16.4 (2018): 677-693.
Adzis, Azira Abdul, David WL Tripe, and Paul Dunmore.“IAS 39, income smoothing, and procyclicality:evidence from Hong Kong banks.” Journal ofFinancial Economic Policy 8.1 (2016): 80-94.
Ahmed, Abubakar, Abdu Y. Mohammed, and AbdulmaroophO. Adisa. “LLP and EM in Nigerian deposit moneybanks.” Mediterranean Journal of SocialSciences 5.17 (2014): 49-49.
Ahmed, Anwer S., Carolyn Takeda, and Shawn Thomas.“Bank LLPs: A reexamination of capital management,EM and signaling effects.” Journal of accounting andeconomics 28.1 (1999): 1-25.
Akintayo, Joel S., and Salman, Ramat T. “Effects of auditquality and corporate governance on EM of quoteddeposit money banks in Nigeria.” InternationalJournal of Economics and ManagementEngineering 12.6 (2018): 690-696.

SCMS Journal of Indian Management, January-March - 2021 100
A Quarterly Journal
Alhadab, Mohammad M., and Bassam Al-Own. “EM andbanks performance: Evidence fromEurope.” International Journal of Academic Researchin Accounting, Finance and ManagementSciences 7.4 (2017): 134-145.
Alhadab, Mohammad, and Bassam, Al-Own. “EM and equityincentives: Evidence from the European bankingindustry.” International Journal of Accounting &Information Management 27.2 (2019): 244-261.
Alves Dantas, José, et al. “Securities-based EM in banks:Validation of a two-stage model.” RevistaContabilidade & Finanças-USP 24.61 (2013): 37-54.
Amidu, Mohammed, and Haruna Issahaku. “Doglobalisation and adoption of IFRS by banks in Africalead to less EM?.” Journal of Financial Reportingand Accounting 17.2 (2019): 222-248.
Anandarajan, Asokan, Iftekhar Hasan, and Ana Lozano-Vivas. “The role of LLPs in EM, capital management,and signaling: The Spanish experience.” Advances inInternational Accounting 16.1 (2003): 45-65.
Anandarajan, Asokan, Iftekhar Hasan, and CorneliaMcCarthy. “Use of LLPs for capital, EM and signallingby Australian banks.” Accounting & Finance 47.3(2007): 357-379.
Ashfaq, Saira, and Muhammad Ali Saeed. “Financialperformance of banking industry of pakistan: The roleof corporate governance index and EM practices.”Asian Journal of Scientific Research 10.2 (2017): 97-103.
Bacho, Muhamad Sufian Hadi Bin, Rozita Uji Mohammad,and Imbarine Bujang. “The roles of earningmanagement, capital management and banks specificfactors in estimating LLPs: Evidence from Malaysiaand Indonesia.” The Business and Management Review10.3 (2019): 258-265.
Beatty, Anne L., Bin Ke, and Kathy R. Petroni. “EM to avoidearnings declines across publicly and privately heldbanks.” The Accounting Review 77.3 (2002): 547-570.
Beatty, Anne, and David G. Harris. “The effects of taxes,agency costs and information asymmetry on EM: Acomparison of public and private firms.” Review ofAccounting Studies 4.3-4 (1998): 299-326.
Beatty, Anne, Sandra L. Chamberlain, and Joseph Magliolo.“Managing financial reports of commercial banks: Theinfluence of taxes, regulatory capital, andearnings.” Journal of Accounting Research 33.2(1995): 231-261.
Beaver, William H., and Ellen E. Engel. “Discretionarybehavior with respect to allowances for loan losses andthe behavior of security prices.” Journal of Accountingand Economics 22.1-3 (1996): 177-206.
Bikker, Jacob A., and Paul AJ Metzemakers. “Bankprovisioning behaviour and procyclicality.” Journal ofInternational Financial Markets, Institutions andMoney 15.2 (2005): 141-157.
Blasco, Natividad, and Begona Pelegrin. “A newmethodological approach for detecting incomesmoothing in small samples: An application to the caseof Spanish savings banks.” Journal of Accounting,Auditing & Finance 21.4 (2006): 347-372.
Bornemann, Sven, et al. “Earnings baths by CEOs duringturnovers: Empirical evidence from German savingsbanks.” Journal of Banking & Finance 53.1 (2015):188-201.
Bortoluzzo, Adriana Bruscato, Hsia Hua Sheng, and AnaLuiza Porto Gomes. “Earning management in Brazilianfinancial institutions.” Revista de Administração 51.2(2016): 182-197.
Bourkhis, Khawla, and Mohamed Wajdi Najar. “The Effectof Ownership and Regulation on Bank Earnings Qualityan investigation of the conventional and Islamic banksin MENA region.” European Journal of IslamicFinance 6 (2017): 1-16.
Bouvatier, Vincent, Laetitia Lepetit, and Frank Strobel.“Bank income smoothing, ownership concentration andthe regulatory environment.” Journal of Banking &Finance 41.1 (2014): 253-270.
Bratten, Brian, Monika Causholli, and Linda A. Myers. “Fairvalue exposure, auditor specialisation, and banks’discretionary use of the LLP.” Journal of Accounting,Auditing & Finance (2017): 1-31.
Bratten, Brian, Monika Causholli, and Thomas C. Omer.“Audit firm tenure, bank complexity, and financialreporting quality.” Contemporary AccountingResearch 36.1 (2019): 295-325.

SCMS Journal of Indian Management, January-March - 2021 101
A Quarterly Journal
Burgstahler, David, and Ilia Dichev. “EM to avoid earningsdecreases and losses.” Journal of accounting andeconomics 24.1 (1997): 99-126.
Chang, Ruey-Dang, Wen-Hua Shen, and Chun-Ju Fang.“Discretionary LLPs and EM for the bankingindustry.” International Business & EconomicsResearch Journal (IBER) 7.3 (2008): 9-20.
Chen, Peter, and Lane Daley. “Regulatory capital, tax, andEM effects on loan loss accruals in the Canadianbanking industry.” Contemporary AccountingResearch 13.1 (1996): 91-128.
Cheng, Qiang, Terry Warfield, and Minlei Ye. “Equityincentives and EM: evidence from the bankingindustry.” Journal of Accounting, Auditing &Finance 26.2 (2011): 317-349.
Cheng, Xiaoyan. “Managing specific accruals vs.structuring transactions: Evidence from bankingindustry.” Advances in Accounting 28.1 (2012): 22-37.
Chipalkatti, Niranjan, and Meenakshi Rishi. “Do Indianbanks understate their bad loans?.” The Journal ofDeveloping Areas 40.2 (2007): 75-91.
Cohen, Lee J., et al. “Bank EM and tail risk during thefinancial crisis.” Journal of Money, Credit andBanking 46.1 (2014): 171-197.
Collins, Julie H., Douglas A. Shackelford, and James M.Wahlen. “Bank differences in the coordination ofregulatory capital, earnings, and taxes.” Journal ofAccounting Research 33.2 (1995): 263-291.
Cornett, Marcia Millon, Jamie John McNutt, and HassanTehranian. “Corporate governance and EM at large USbank holding companies.” Journal of CorporateFinance 15.4 (2009): 412-430.
Curcio, Domenico, and Iftekhar Hasan. “Earnings andcapital management and signaling: The use of loan-lossprovisions by European banks.” The European Journalof Finance 21.1 (2015): 26-50.
Dal Maso, Lorenzo, et al. “The influence of accountingenforcement on earnings quality of banks: Implicationsof bank regulation and the global financialcrisis.” Journal of Accounting and Public Policy 37.5(2018): 402-419.
De Chickera, GK Suren W., and Liu Qi. “Accounting Ruleson Loan Losses and Security Gains Contribute to EMfor the Banking Industry in Sri Lanka.” South AsianJournal of Social Studies and Economics 3.3 (2019):1-16.
DeBoskey, David Gregory, and Wei Jiang. “EM and auditorspecialisation in the post-sox era: An examination ofthe banking industry.” Journal of Banking &Finance 36.2 (2012): 613-623.
Dechow, Patricia M., and Douglas J. Skinner. “EM:Reconciling the views of accounting academics,practitioners, and regulators.” Accounting Horiz-ons 14.2 (2000): 235-250.
Dechow, Patricia M., Richard G. Sloan, and Amy P.Sweeney. “Detecting EM.” Accounting Review 70.2(1995): 193-225.
Degeorge, Francois, Jayendu Patel, and RichardZeckhauser. “EM to exceed thresholds.” The Journalof Business 72.1 (1999): 1-33.
Di Fabio, Costanza. “Does the business model influenceincome smoothing? Evidence from Europeanbanks.” Journal of Applied Accounting Research 20.3(2019): 311-330.
Di Martino, Giuseppe, et al. “Does the new Europeanbanking regulation discourage EM?.” InternationalBusiness Research 10.10 (2017): 45-56.
Dutta, Sunil, and Frank Gigler. “The effect of earningsforecasts on EM.” Journal of AccountingResearch 40.3 (2002): 631-655.
El Sood, Heba Abou. “LLPing and income smoothing inUS banks pre and post the financialcrisis.” International Review of FinancialAnalysis 25.3 (2012): 64-72.
Elleuch, Sarra Hamza, and Nelia Boulila Taktak. “EM andevolution of the banking regulation.” Journal ofAccounting in Emerging Economies 5.2 (2015): 150-169.
Elnahass, Marwa, Marwan Izzeldin, and OmneyaAbdelsalam. “LLPs, bank valuations and discretion: Acomparative study between conventional and Islamicbanks.” Journal of Economic Behavior &Organization 103.1 (2014): S160-S173.

SCMS Journal of Indian Management, January-March - 2021 102
A Quarterly Journal
Fan, Yaoyao, et al. “Women on boards and bank EM: Fromzero to hero.” Journal of Banking & Finance 107(2019): 105-607.
Farouk, Musa Adeiza, and Muhammad Aminu Isa. “EM ofListed Deposit Banks (DMBs) in Nigeria: A Test ofChang, Shen and Fang (2008) Model.” InternationalJournal of Finance and Accounting 7.2 (2018): 49-55.
Fernando, W. D. I., and E. M. N. N. Ekanayake. “Docommercial banks use LLPs to smooth their income?empirical evidence from Sri Lankan commercialbanks.” Journal of Finance and BankManagement 3.1 (2015): 167-179.
Fonseca, Ana Rosa, and Francisco Gonzalez. “Cross-country determinants of bank income smoothing bymanaging loan-loss provisions.” Journal of Banking& Finance 32.2 (2008): 217-228.
Garcia-Sanchez, Isabel-Maria, Jennifer Martínez-Ferrero,and Emma García-Meca. “Gender diversity, financialexpertise and its effects on accountingquality.” Management Decision 55.2 (2017): 347-382.
Geagon, Margot S., and John V. Hayes. “Evaluating EM infinancial institutions.” Management and EconomicsResearch Journal 1 (2015): 1-12.
Ghosh, Saibal. “LLPs, earnings, capital management andsignalling: Evidence from Indian Banks.” GlobalEconomic Review 36.2 (2007): 121-136.
Greenawalt, Mary Brady, and Joseph F. Sinkey. “Bank loan-loss provisions and the income-smoothing hypothesis:An empirical analysis, 1976–1984.” Journal ofFinancial Services Research 1.4 (1988): 301-318.
Greiner, Adam J. “The effect of the fair value option onbank earnings and regulatory capital management:Evidence from realised securities gains andlosses.” Advances in Accounting 31.1 (2015): 33-41.
Grougiou, Vassiliki, et al. “Corporate social responsibilityand EM in US banks.” Accounting Forum 38.3 (2014):155-169.
Hassan, Shehu Usman. “Adoption of international financialreporting standards and earnings quality in listed depositmoney banks in Nigeria.” Procedia Economics andFinance 28 (2015): 92-101.
Healy, Paul M. “The effect of bonus schemes on accountingdecisions.” Journal of Accounting andEconomics 7.1-3 (1985): 85-107.
Healy, Paul M., and James M. Wahlen. “A review of theearnings management literature and its implications forstandard setting.” Accounting Horizons 13.4 (1999):365-383.
Isa, Mohd Yaziz Mohd, et al. “Determinants of LLPs ofcommercial banks in Malaysia.” Journal of FinancialReporting and Accounting 16.1 (2018): 24-48.
Ismail, Abd Ghafar, and Adelina Tan Be Lay. “Bank loanportfolio composition and the disclosure of LLPs:Empirical evidence from Malaysian banks.” AsianReview of Accounting 10.1 (2002): 147-162.
Jallow, Kumba, Stergios Leventis, and PanagiotisDimitropoulos. “The role of corporate governance inEM: experience from US banks.” Journal of AppliedAccounting Research 13.2 (2012): 161-177.
Jayeola, O., T. Agbatogun, and T. Akinrinlola. “Audit qualityand EM among Nigerian listed deposit moneybanks.” International Journal of AccountingResearch 5.2 (2017): 1-5.
Jensen, Michael C., and William H. Meckling. “Theory ofthe firm: Managerial behavior, agency costs, andownership structure.” Journal of Financial Economics3.4 (1976): 305-360.
Jin, Justin Yiqiang, et al. “Economic policy uncertainty andbank earnings opacity.” Journal of Accounting andPublic Policy 38.3 (2019): 199-218.
Jones, Jennifer J. “EM during import reliefinvestigations.” Journal of Accounting Research 29.2(1991): 193-228.
Kagan, Julia. “LLP.” 9 April 2019, https://www.investopedia.com/terms/l/loanlossprovision.asp.Accessed 20 December 2019.
SCMS Journal of Indian Management, January-March - 2021 103
A Quarterly Journal
Kanagaretnam, Kiridaran, Chee Yeow Lim, and Gerald J.Lobo. “Auditor reputation and EM: Internationalevidence from the banking industry.” Journal ofBanking & Finance 34.10 (2010b): 2318-2327.
Kanagaretnam, Kiridaran, Chee Yeow Lim, and Gerald J.Lobo. “Effects of national culture on earnings qualityof banks.” Journal of International BusinessStudies 42.6 (2011): 853-874.
Kanagaretnam, Kiridaran, Chee Yeow Lim, and Gerald J.Lobo. “Effects of international institutional factors onearnings quality of banks.” Journal of Banking &Finance 39 (2014): 87-106.
Kanagaretnam, Kiridaran, Gerald J. Lobo, and Chong Wang.“Religiosity and EM: International evidence from thebanking industry.” Journal of Business Ethics 132.2(2015): 277-296.
Kanagaretnam, Kiridaran, Gerald J. Lobo, and Dong-HoonYang. “Determinants of signaling by banks throughLLPs.” Journal of Business Research 58.3 (2005):312-320.
Kanagaretnam, Kiridaran, Gerald J. Lobo, and RobertMathieu. “EM to reduce earnings variability: evidencefrom bank LLPs.” Review of Accounting andFinance (2004).
Kanagaretnam, Kiridaran, Gerald J. Lobo, and RobertMathieu. “Managerial incentives for income smoothingthrough bank LLPs.” Review of Quantitative Financeand Accounting 20.1 (2003): 63-80.
Kanagaretnam, Kiridaran, Gopal V. Krishnan, and GeraldJ. Lobo. “An empirical analysis of auditorindependence in the banking industry.” The AccountingReview 85.6 (2010a): 2011-2046.
Kim, Myung-Sun, and William Kross. “The impact of the1989 change in bank capital standards on LLPs and loanwrite-offs.” Journal of Accounting andEconomics 25.1 (1998): 69-99.
Kolsi, Mohamed Chakib, and Rihab Grassa. “Did corporategovernance mechanisms affect EM? Further evidencefrom GCC Islamic banks.” International Journal ofIslamic and Middle Eastern Finance andManagement (2017).
Krishnan, Gopal V., and Yinqi Zhang. “Is there a relationbetween audit fee cuts during the global financial crisisand banks’ financial reporting quality?.” Journal ofAccounting and Public Policy 33.3 (2014): 279-300.
Kumari, Prity, and Jamini Kanta Pattanayak. “Linking EMpractices and corporate governance system with thefirms’ financial performance.” Journal of FinancialCrime 24.2 (2017): 223-241.
Kumari, P., and J. Pattanayak. “EM and firm performance:An insight into Indian commercial banks.” Journal ofScientific Research and Development 2.11 (2015): 76-84.
Laeven, Luc, and Giovanni Majnoni. “LLPing andeconomic slowdowns: too much, too late?.” Journalof financial intermediation 12.2 (2003): 178-197.
Lassoued, Naima, Mouna Ben Rejeb Attia, and Houda Sassi.“EM in Islamic and conventional banks: does ownershipstructure matter? Evidence from the MENAregion.” Journal of International Accounting,Auditing and Taxation 30 (2018): 85-105.
Lassoued, Naima, Mouna Ben Rejeb Attia, and Houda Sassi.“EM and ownership structure in emergingmarket.” Managerial Finance 43.10 (2017): 1117-1136.
“Lehman Brothers.” Wikipedia, 21 Nov. 2019, https://en.wikipedia.org/wiki/Lehman_Brothers. Accessed 21Nov. 2019.
Lestari, Puji, Syaiful Azhar, and Utik Nurwijayanti. “Thedeterminant of’ EM’: ‘Size aspect’ and’ non performingloans’.” MIMBAR: Jurnal Sosial danPembangunan 35.1 (2019): 104-114.
Leventis, Stergios, Panagiotis Dimitropoulos, and StephenOwusu Ansah. “Corporate governance and accountingconservatism: Evidence from the bankingindustry.” Corporate Governance: An InternationalReview 21.3 (2013): 264-286.
Leventis, Stergios, Panagiotis E. Dimitropoulos, andAsokan Anandarajan. “Signalling by banks using LLPs:The case of the European Union.” Journal of EconomicStudies 39.5 (2012): 604-618.

SCMS Journal of Indian Management, January-March - 2021 104
A Quarterly Journal
“List of corporate collapses and scandals.” Wikipedia, 20Nov. 2019, https://en.wikipedia.org/wiki/List_of_corporate_collapses_and_scandals. Accessed 20 Nov.2019.
Liu, Chi-Chun, and Stephen G. Ryan. “Income smoothingover the business cycle: Changes in banks’ coordinatedmanagement of provisions for loan losses and loancharge-offs from the pre-1990 bust to the 1990sboom.” The Accounting Review 81.2 (2006): 421-441.
Lobo, Gerald J., and Dong-Hoon Yang. “Bank managers’heterogeneous decisions on discretionaryLLPs.” Review of Quantitative Finance andAccounting 16.3 (2001): 223-250.
Magrath, Lorraine, and Leonard G. Weld. “Abusive EM andearly warning signs.” CPA Journal 72.8 (2002): 50-54.
McNichols, Maureen F. “Research design issues in EMstudies.” Journal of accounting and publicpolicy 19.4-5 (2000): 313-345.
Mersni, Hounaida, and Hakim Ben Othman. “The impactof corporate governance mechanisms on EM in Islamicbanks in the Middle East region.” Journal of IslamicAccounting and Business Research 7.4 (2016): 318-348.
Mistry, Jigar. “Financial markets: Gatekeepers of money.”Business Standard, 2 August 2019, p. 9.
Moghaddam, Abdolkarim, and Narges Abbaspour. “Theeffect of leverage and liquidity ratios on EM and capitalof banks listed on the Tehran StockExchange.” International Review of Management andMarketing 7.4 (2017): 99-107.
Mohammad, Wan Masliza Wan, Shaista Wasiuzzaman, andRapiah Mohd Zaini. “Panel data analysis of therelationship between EM, bank risks, LLP and dividendper share.” Journal of Business and PolicyResearch 6.1 (2011): 46-56.
Mohammed, Ishaq Ahmed, Ayoib Che-Ahmad, and MazrahMalek. “Regulatory changes, board monitoring and EMin Nigerian financial institutions.” DLSU Business &Economics Review 28.2 (2019): 152-168.
Morris, Richard D., Helen Kang, and Jing Jie. “Thedeterminants and value relevance of banks’discretionary LLPs during the financial crisis.” Journalof Contemporary Accounting & Economics 12.2(2016): 176-190.
Moyer, Susan E. “Capital adequacy ratio regulations andaccounting choices in commercial banks.” Journal ofAccounting and Economics 13.2 (1990): 123-154.
Mune, Tesfamlak Mulatu, and Abiy Getahun Kolech.“Income smoothing via LLPs and IFRS implication:Evidence from Ethiopian banks.” European Journalof Business and Management 11.16 (2019): 40-52.
Nawaiseh, Mohammad Ebrahim. “Impact of external auditquality on EM by banking firms: Evidence from Jordan.”British Journal of Applied Science andTechnology 12.2 (2016): 1-14.
Oladipupo, Olaoye Festus, and Ademola A, Adewumi.“Corporate governance and earning management ofdeposit money banks in Nigeria.” InternationalJournal of Scientific & Engineering Research, 9.7(2018): 184-199.
Onalo, Ugbede, Mohd Lizam, and Ahmad Kaseri. “Theeffects of changes in accounting standards on EM ofMalaysia and Nigeria banks.” European Journal ofAccounting Auditing and Finance Research 2.8(2014): 15-42.
Osma, Beatriz García, Araceli Mora, and Luis Porcuna-Enguix. “Prudential supervisors’ independence andincome smoothing in European banks.” Journal ofBanking & Finance 102 (2019): 156-176.
Othman, Hakim Ben, and Hounaida Mersni. “The use ofdiscretionary LLPs by Islamic banks and conventionalbanks in the Middle East region.” Studies in Economicsand Finance 31.1 (2014): 106-128.
Ozili, Peterson K. “Bank EM and income smoothing usingcommission and fee income.” International Journalof Managerial Finance 13.4 (2017b): 419-439.
Ozili, Peterson K. “Bank earnings smoothing, audit qualityand procyclicality in Africa.” Review of Accounting andFinance 16.2 (2017c): 142-161.

SCMS Journal of Indian Management, January-March - 2021 105
A Quarterly Journal
Ozili, Peterson K. “Bank income smoothing, institutionsand corruption.” Research in International Businessand Finance 49 (2019a): 82-99.
Ozili, Peterson K. “Discretionary provisioning practicesamong Western European banks.” Journal of FinancialEconomic Policy 9.1 (2017a): 109-118.
Ozili, Peterson K. “Impact of IAS 39 reclassification onincome smoothing by European banks.” Journal ofFinancial Reporting and Accounting 17.3 (2019b):537-553.
Ozili, Peterson K., and Erick Outa. “Bank EM usingcommission and fee income.” Journal of AppliedAccounting Research 20.2 (2019a): 172-189.
Ozili, Peterson K., and Erick R. Outa. “Bank earningssmoothing during mandatory IFRS adoption inNigeria.” African Journal of Economic andManagement Studies 10.1 (2019b): 32-47.
Ozili, Peterson K., and Erick Rading Outa. “Bank incomesmoothing in South Africa: role of ownership, IFRS andeconomic fluctuation.” International Journal ofEmerging Markets 13.5 (2018): 1372-1394.
Parveen, Shagufta, et al. “Impact of ownership structureon EM: Evidence from Pakistani bankingsector.” Journal of Poverty, Investment andDevelopment 23 (2016): 24-34.
Pérez, Daniel, Vicente Salas-Fumas, and Jesus Saurina.“Earnings and capital management in alternative LLPregulatory regimes.” European AccountingReview 17.3 (2008): 423-445.
Pertiwi, Dina Andyani, and Evony Silvino Violita. “Theeffects of earning management and financialperformance on the quality of Islamic banking socialresponsibility report.” 2nd International Conferenceon Indonesian Economy and Development (ICIED2017). Atlantis Press, 2017.
Pinto, Inês, and Winnie Ng Picoto. “Earnings and capitalmanagement in European banks–Combining amultivariate regression with a qualitative comparativeanalysis.” Journal of Business Research 89 (2018):258-264.
Pramono, Sigid Eko, Hilda Rossieta, and WahyoeSoedarmono. “Income smoothing behavior and theprocyclical effect of LLPs in Islamic banks.” Journalof Islamic Accounting and Business Research 10.1(2019): 21-34.
Press Trust of India. “Bank fraud at record 71,500 cr in2018-19, says RBI.” Business Standard, 4 June 2019,p. 4.
Quttainah, Majdi A., Liang Song, and Qiang Wu. “Do Islamicbanks employ less EM?.” Journal of InternationalFinancial Management & Accounting 24.3 (2013):203-233.
Robb, Sean WG. “The effect of analysts’ forecasts on EMin financial institutions.” Journal of FinancialResearch 21.3 (1998): 315-331.
Ross, Stephen A. “The determination of financial structure:The incentive-signalling approach.” The Bell Journalof Economics 8 (1977): 23-40.
Ross, Stephen A. “The economic theory of agency: Theprincipal’s problem.” The American EconomicReview 63.2 (1973): 134-139.
Roy, Anup, and Panda, Subrata. “Crisis-hit PMC useddummy accounts to escape RBI attention.” BusinessStandard, 30 September 2019, p.1.
Ruiz, Cinthia Valle. “Literature review of EM: Who, why,when, how and what for.” Finnish BusinessReview 21.1 (2016): 74-87.
Saidu, Hauwa et al. “The impact of EM on financialperformance of listed deposit money banks inNigeria.” Journal of Accounting and FinancialManagement 3.2 (2017): 39-50.
Santy, Prima, Tawakkal Tawakkal, and Grace T. Pontoh. “Theimpact of IFRS adoption on EM in banking companiesin Indonesia stock exchange.” Jurnal Akuntansi DanAuditing 13.2 (2016): 176-190.
Schipper, Katherine. “EM.” Accounting horizons 3.4(1989): 91-102.
Shen, Chung-Hua, and Chien-An Wang. “Do new broomssweep clean? Evidence that new CEOs take a ‘BigBath’in the banking industry.” Journal of EmergingMarket Finance 18.1 (2019): 106-144.

SCMS Journal of Indian Management, January-March - 2021 106
A Quarterly Journal
************
Shen, Chung-Hua, and Hsiang-Lin Chih. “Investorprotection, prospect theory, and EM: An internationalcomparison of the banking industry.” Journal ofBanking & Finance 29.10 (2005): 2675-2697.
Shen, Lu. “Research on industry competition, ownershipstructure and EM: Empirical analysis based on listedbank.” International Journal of Smart Home 10.3(2016): 221-230.
Shrieves, Ronald E., and Drew Dahl. “Discretionaryaccounting and the behavior of Japanese banks underfinancial duress.” Journal of Banking &Finance 27.7 (2003): 1219-1243.
Spence, Michael. “Job Market Signalling”: The QuarterlyJournal of Economics. 87.3 (1973): 355-374.
Sun, Lan, and Subhrendu Rath. “EM research: A review ofcontemporary research methods.” Global Review ofAccounting and Finance 1.1 (2010): 121-135.
Suteja, Jaja, Ardi Gunardi, and Annisa Mirawati.“Moderating effect of EM on the relationship betweencorporate social responsibility disclosure andprofitability of banks in Indonesia.” InternationalJournal of Economics and Financial Issues 6.4(2016): 1360-1365.
Taktak, Neila Boulila, and Ibtissem Mbarki. “Boardcharacteristics, external auditing quality andEM.” Journal of Accounting in EmergingEconomies 4.1 (2014): 79-96.
Ugbede, Onalo, Lizam, Mohd, and Kaseri, Ahmad.“Corporate governance and EM: Empirical evidencefrom Malaysian and Nigerian banks.” Asian Journalof Management Sciences and Education 2.4 (2013):1-21.
Ujah, Nacasius U., Jorge Brusa, and Collins E. Okafor. “Theinfluence of EM and bank structure on bankperformance.” Managerial Finance 43.7 (2017):761-773.
Umoren, Adebimpe, Ikpantan, Itoro, and Ededeh, Daniel.“EM and financial performance of deposit moneybanks in Nigeria.” Research Journal of Finance andAccounting 9.22 (2018): 94-100.
Uwuigbe, Uwalomwa, et al. “Disclosure quality and EM ofselected Nigerian banks.” The Journal of InternetBanking and Commerce 22.S8 (2017): 1-12.
Uygur, Ozge. “EM and executive compensation: Evidencefrom banking industry.” Banking & FinanceReview 5.2 (2013): 33-54.
Vishnani, Sushma, et al. “EM, capital management andsignalling behaviour of Indian banks.” Asia-PacificFinancial Markets 26.3 (2019): 285-295.
Wahl, Mike. “The ownership structure of corporations:Owners classification & typology.” EBS Review 21.1(2006): 94-103.
Wahlen, James M. “The nature of information incommercial bank loan loss disclosures.” AccountingReview 69.3 (1994): 455-478.
Watts, Ross L., and Jerold L. Zimmerman. “Positiveaccounting theory.” (1986).
Wu, Chiu-Hui, Cherng G. Ding, and Cheng-Ying Wu. “Onthe assessment of the performance in EM for thebanking industry: the case of China’s banks.” AppliedEconomics Letters 25.20 (2018): 1463-1465.
Wu, Meng-Wen, et al. “Impact of foreign strategic investorson EM in Chinese banks.” Emerging Markets Financeand Trade 48.5 (2012): 115-133.
Wu, Yueh-Cheng, et al. “The impact of EM on theperformance of ASEAN banks.” EconomicModelling 53 (2016): 156-165.
Yaping, Ning. “A different perspective of EM.” CanadianSocial Science 2.6 (2006): 53-59.
Yaping, Ning. “The theoretical framework ofEM.” Canadian Social Science 2.2 (2005): 32-38.
Yasuda, Yukihiro, Shin’ya Okuda, and Masaru Konishi. “Therelationship between bank risk and EM: evidence fromJapan.” Review of Quantitative Finance andAccounting 22.3 (2004): 233-248.
Zhou, Jian, and Ken Y. Chen. “Audit committee, boardcharacteristics and EM by commercialbanks.” Unpublished Manuscript (2004).

SCMS Journal of Indian Management , January-March - 2021 107
A Quarterly Journal
The Impact of Extrinsic andIntrinsic Rewards on Employee
Commitment in the Public SectorManufacturing Companies in India
Abstract
Rewards are very critical to attracting, motivating, and retaining talents. Reward satisfaction plays a determinant role in
shaping employee attitudes, those reflected in their performance. This study is intended to assess the impact of extrinsic
and intrinsic rewards on employee commitment among the public sector employees in India. The sample subjects are
chosen from ten public sector companies using the method of stratified random sampling and the data is analysed
through Structural Equation Modelling (SEM). The results reiterated the impact of extrinsic and intrinsic rewards on
employee commitment and the importance of intrinsic rewards over extrinsic rewards. The findings are beneficial to the
practicing managers in formulating typical reward packages based on employee preferences by mixing extrinsic and
intrinsic rewards in varying proportions.
Keywords: Reward management, Total rewards, Extrinsic rewards, Intrinsic Rewards, Employee Commitment
Abstract
Amal Jishnu H.M.Assistant Manager (Corporate Business Development)
Prism Johnson LtdH&R Johnson (India) Division.Mumbai.
E mail: [email protected]
Dr. Hareendrakumar V.R.Visiting Professor
CET School of ManagementEmail: [email protected]

SCMS Journal of Indian Management , January-March - 2021 108
A Quarterly Journal
1. Introduction
The employee expectations and perceptions arerapidly changing due to the fast changes taking place inthe organisational context (Stairs, 2005). A shift ofemployee interest from physical requirements topsychological needs is evident in the present-day literatureas part of these contextual changes. Employee responsestowards these changes is an area of attention of employers,and this has resulted in finding out new approaches tomanage employee rewards, both extrinsically andintrinsically, so as to satisfy both physical andpsychological requirements (Harter et al., 2002; Luthans,2002; Linley et al., 2005). This realisation about the changein employee expectations, on another side, led themanagement to study and research the effect of employeeperceptions in determining the financial performance ofthe organisations and the impact of people managementstrategies and policies on shaping employee behaviours.Employee commitment has a determinant role in ensuringcustomer commitment towards the organisation. It isnecessary for every organisation to maintain committedemployees for organisational success and wellbeing(Fischer, 2003). Rucci et al. (1998) clearly identified astrong bond between employee commitment and customercommitment within the organisation. As per their study, afive percent increase in employee commitment may causea three percent change in customer commitment.
Traditionally reward management is supposed to attract,retain, and motivate employees in a desirable manner soas to get optimum employee performance. This connectionof rewards with performance is the reason for developingthe ‘pay for performance strategy’. Over the last decade,employers are practising reward strategy by aligningemployee performance with the organisation’s strategicgoals (Higgs, 2004; Brown, 2006; Gerhart, Rynes, &Fulmer, 2009). This concept is the core of strategic humanresource management, where the HRM strategies arealigned with business strategies for leveraging the valueof human capital for improved organisational performance(Gratton & Truss, 2003; Christainsen & Higgs, 2006).Many studies reported that performance pay is not thesolution for organisational performance (Kohn, 1993;Pink, 2009; Ledford, Gerhart & Fang, 2013). Accordingto Kohn (1993), extrinsic rewards are less effective thanintrinsic rewards, and on many occasions, it seems toreduce intrinsic motivation. This finding led the researchers
to develop a comprehensive reward strategy thatencompasses all the tangible and intangible rewards withina single package. This movement has resulted in developinga comprehensive rewarding system known as the TotalReward Strategy (TRS). Many professional rewardmanagement organisations such as WorldatWork (2006 and2015); SHRM (2007); Hay Group (2008); Aon Hewit(2012); Towers Watson (2012), and many more developedtheir own distinct TRS models with different componentsand elements representing extrinsic and intrinsic forms ofrewards. Hertzberg’s (1966) two-factor theory illustratesthe dichotomous nature of rewards and their employeevalues. The hygiene factors of rewards consisting of themajor elements of extrinsic rewards such as basic pay andbenefits, by themselves, are not sufficient to motivateemployees at their workplaces. Even though these factorssignificantly contribute to demotivation, the realmotivators are the intrinsic form of rewards such as workby its content and context, career development, authorityand responsibility.
This study is an attempt to examine the influence ofextrinsic and intrinsic rewards in shaping employeecommitment among the public sector manufacturingemployees in India. This study is also intended to examinethe relative importance of each category of rewards andits components. This information can be used by themanagement while formulating a rewarding mix that iscapable of satisfying the employees optimally.
2. Literature Review
2.1 Extrinsic and Intrinsic Rewards
Rewards are very important to employees. Rewardscomprise everything offered to the employees by theemployer as a return to their services towards theorganisation. The study of Sarvar and Abugre (2013)revealed that higher rewards and satisfied employeescontribute more to organisational performance and profit.All the goals of the organisation can be achieved by offeringa good rewarding system that can motivate employee(Lawler, 1993), and a well-defined rewarding system canattract, retain and motivate employees (Mc Cormic, 2015).Rewarding an employee is not merely paying salary andbenefits, but it is equally concerned about non-financialrewards such as recognition, increased job responsibility,and learning and development opportunities (Armstrong,2010).

SCMS Journal of Indian Management , January-March - 2021 109
A Quarterly Journal
Extrinsic rewards are the tangible and visible form ofrewards offered to the individual or employee for his/hercontribution to achieving something. The monetary partof rewards such as salary, incentives, bonus, etc. andbenefits such as medical care, various kind of allowances,fringe benefits those have some financial content indirectlyare considered as extrinsic rewards (Mottaz, 1985;Mahaney & Lederer, 2006). Extrinsic rewards areimportant for employees because it is instrumental to theirpersonal, family, and social existence. Most of theemployees’ physical needs are satisfied with this form ofrewards, and therefore it is the basic requirement for theirexistence. Literature shows that while employees at thelower levels of hierarchy are more concerned aboutextrinsic rewards, the employees at higher levels preferintrinsic rewards (Stumpf, Tymon Jr, Favorito & Smith,2013)
Intrinsic rewards differ from extrinsic rewards which arein tangible form. Intrinsic rewards are generally qualitative(intangible) in form and critical in motivating employees.This non-physical form of rewards which is emotionallyconnected to the employees comprises challenging jobs,sense of achievement, recognition, work freedom,participation in decision making, the content of authority,attracting positions in the hierarchy, etc. (Mottaz, 1985;Mahaney & Lederer, 2006). The degree of influence of theseelements may differ from individual to individual. Thisrepresents the portion of rewards that satisfy an individual’spsychological needs. Wherever a job is intrinsicallyrewarding, the individual involves with more enthusiasmand accomplishes the task more effectively (Mahaney &Lederer, 2006). Intrinsic rewards are the positive feelings anemployee experiences at the workplace that energises himto do the task in a personally fulfilling manner (Deci & Ryan,1987; Thomas & Tymon, 1997; Thomas, 2009). Thomas,Jansen & Tymon (1997) reported that when individuals getopportunities to do meaningful work with a sufficient levelof freedom and choice, they feel intrinsically motivated.Tymon Jr, Stumpf and Doh (2010) argued that intrinsicrewards can improve organisational satisfaction even in lowextrinsic rewards. It is possible to provide many non-financial or less financial benefits, which can bringsatisfaction to the employees and better performance(Mohamood, Ramzan & Akbar, 2012). A higher level ofhygiene factors (extrinsic rewards) can make good results
only with an adequate level of intrinsic rewards (Tremblay,Sire & Balkin, 2000). The study conducted by Tymon Jr.,Stumpf and Doh (2010) rejects the argument of Deci andRyan (1987) that extrinsic rewards have a tendency to reduceintrinsic motivation.
2.2 Employee Commitment and Reward
Employee commitment is the reflection of a psychologicalattachment of the employee towards his organisation thatreflects in higher employee performance, increasedcitizenship behaviour and reduced turnover (O’Reilly &Chatman, 1986; Williams & Anderson, 1991). Whenemployees perceive a caring approach from the side of theemployer, they demonstrate committed behaviours toachieve organisational goals (Ajmal, Bashir, Abrar & Khan,2015). Committed employees always show a willingness toaccept company values and targets as their own and dowhatever possible to achieve the goals (Porter, Steers,Mowday & Boulian, 1974). Allen and Meyer (1985,1990)proposed three dimensions for employee commitment. Thesethree dimensions of commitment refer to the relationshipwith an organisation that reflects on the desire of theemployee to remain with the organisation and contributemore for the benefit of the organisation (Wo³owska, 2014).The first dimension of affective commitment refers to thewillingness and likeness of the employee to remain with theorganisation due to psychological attachment towards theorganisation and the need to be known as part of theorganisation. Continuous commitment refers to theawareness of the individual about the cost of leaving thejob for another one, and so he wants to stay with theorganisation anyhow (Allen & Meyer, 1985). Normativecommitment reflects in employees’ determination to remainwith the organisation even at bad times and it shows a moralobligation. Mehtha, Singh, and Bhasker (2010) observedemployee commitment as a component of the emotionaldimension of employee loyalty.
Work rewards refer to the benefits that an employeereceives as part of the employment relationship from theemployer and is considered as the determinant of employeecommitment (Malhotra et al., 2007). Employeeperceptions of reward fairness significantly influenceemployee attitudes, behaviours and performance (Scott,Mac Mullen, & Royal, 2011; Munir, 2016; Hareendrakumar,

SCMS Journal of Indian Management , January-March - 2021 110
A Quarterly Journal
2020). Turkyilmaz, Ali., Akman, Gulsen., Ozkan, Coskum.,and Pastuszak (2011), and Ajmal et al. ( 2015) reportedthat both extrinsic and intrinsic rewards play a significantrole in determining employee loyalty and commitmentthrough the mediating variable of job satisfaction. The studyconducted by Kokubun (2017) among the employees ofJapanese companies in Thailand revealed a strongrelationship between extrinsic and intrinsic rewards withemployee commitment.
Milcovitch and Newman (2008) commented that the wayin which employees are paid affects their behaviours, anda good compensation system would help the organisationto achieve its goals effectively. Mishandling ofcompensation issues is likely to affect employee andorganisational performance due to a lack of employeeloyalty (Gomez, Balkin, and Cardy, 2005). Schultz (2005)opined that rewards can induce changes in the observedbehaviour of individuals and can act as a reinforcement forthe behaviour that creates better rewards. Obicci (2015)observed a strong bond between extrinsic and intrinsic
rewards and employee engagement, which is ademonstration of employee commitment itself. The studyof Allen and Grisaffe (2001) also supported the relationof extrinsic and intrinsic rewards with employeebehaviours.
3. Methodology
3.1 Model development
The total reward is a newer concept of rewarding employeesby incorporating all the intrinsic and extrinsic elements ofrewards, those that are valued by the employees, in uniqueproportions. To develop a conceptual model, this studyadapted the Total Reward model consisting of sevendimensions developed by Hareendrakumar et al. (2020).In this model, extrinsic reward satisfaction is measured bytwo dimensions (Compensation and Benefits), and intrinsicreward satisfaction is measured through five dimensions(Recognition, Performance Management, TalentDevelopment, Work, and Work-life) as shown in the
Figure 1: Conceptual diagramSource: prepared by the author
SCMS Journal of Indian Management , January-March - 2021 111
A Quarterly Journal
conceptual model. While the two extrinsic dimensions arefocused on the financial content of rewards, which arenecessary to satisfy the basic needs of employees, the fiveintrinsic dimensions are concerned about the non-financialform of rewards, which are necessary to satisfy thepsychological needs of individuals. The model hypothesisesthat extrinsic and intrinsic rewards positively influenceemployee commitment.
3.2 Scale development
All the scales to measure the dimensions of extrinsic andintrinsic rewards are adapted from the literature(Hareendrakumar, 2020). The scale to measure employeecommitment is adapted from Meyer and Allen (1990). Thusa comprehensive instrument containing 46 items(Compensation-7, Benefits-6, Recognition-5, PerformanceManagement-5, Talent Development-5, Work-5, Work Life-5, and Commitment- 8) have been developed to measure allthe eight latent variables under study. The pilot study isconducted among the employees of a large scale publicsector company at Thiruvananthapuram and found that allthe constructs have reliability (Cronbach alpha) greaterthan 0.7.
3.3 Hypotheses of the study
The following two hypotheses are set to test thesignificance of multiple relationships between the latentvariables.
H 1: Intrinsic Rewards significantly influences EmployeeCommitment in the public sector companies in India
H 2: Extrinsic Rewards significantly influences EmployeeCommitment in the public sector companies in India
3.4 Population and sample
The population of interest comprises all the employeesworking in the public sector manufacturing companies inIndia. The public sector manufacturing companies aregrouped under various sectors such as electrical,electronics, engineering, chemical, textile, traditional, etc.The sample size is fixed at 400. The sample units areselected by following the method of stratified randomsampling.
3.5 Research design
Even though the topic of study is qualitative in nature, amixed approach is followed, and the data is collected in aquantitative manner. Structured questionnaires, theinstrument for data collection, are served to the respondentsand requested to mark their degree of agreement/disagreement in a five-point Likert scale, using numericvalues ranging from 1 (strong disagreement) to 5 (strongagreement). This quantitative data collected in the form ofnumbers is used for statistical analysis and to test thesignificance of relationships between the variables.
3.6 Data collection
The sample data is collected from 418 employees chosenfrom ten public sector companies in South India. Out of 418instruments collected, after eliminating 14 instruments withextreme values/ missing responses, 404 instruments are takenfor final statistical analysis.
4. Analysis and Discussion
4.1 Demography and Descriptive Statistics
More than forty percent of the sample subjects have serviceof more than twenty years and are of age above forty. Hencethe responses can be considered as highly reliable inrevealing the realistic character of the attributes throughthe employee lens. As shown in Table 1, the samplecomprises candidates from all levels of the hierarchy,starting from unskilled labour to senior managers andqualification ranging from matriculation to post-graduation.Most of the participants are from the non-executivecategory (74.6 %). Only one third belongs to the executivecategory. Among the total, around 25 percent are fromtechnical backgrounds and seventy-five percent are fromnon-technical backgrounds.
Table 2 shows the descriptive statistics of the sample. Themean for the eight latent variables ranges from 2.6 to 3.5,and the standard deviation ranges from 0.709 to 0.986. Thecorrelation coefficients range from 0.202 to 0.609. Allthe dimensions of independent variables show a goodcorrelation with the dependent variable. The descriptivestatistic shows that work and work-life are the mostcorrelated one, among the seven dimensions, to employeecommitment.

SCMS Journal of Indian Management , January-March - 2021 112
A Quarterly Journal
Table 1: Demography of the sample
Source: Primary Data
Table 2 Descriptive statistics and inter correlation coefficients
Source: Primary Data, **p < .01

SCMS Journal of Indian Management , January-March - 2021 113
A Quarterly Journal
4.2 Structural Equation Modeling (SEM)
To assess the causal relationships between variables andto test the hypotheses, the method of Structural EquationModeling (SEM) is employed using IBM SPSS Amos 22.SEM analysis comprises a two-step assessment (i)measurement model assessment and (2) structural modelassessment.
4.2.1 Measurement model assessment
In this first step, also known as the confirmatory analysis,the researcher develops a measurement model with all thevariables under study and test for the reliability and validityof the scales used. In this study, the measurement model
Table 3: Fit indices of measurement model
has been developed with all the first-order variables andcorrelated, as shown in Figure 2. Prior to CFA, it is necessaryto ensure the fitness of the model with the data, and this isdone by comparing the fit indices with the recommendedthreshold values. At this stage, fifteen items (Compensation-1, Benefit-1, Recognition-2, Performance Management-2,Talent Development-2, Work-2, Work-life-3 andCommitment-2) are eliminated to achieve a sufficient levelof fitness as per the recommendations. Thus the final modelhas only thirty-one items under the eight latent variables.The values in Table 3 show that the model is adequately fitwith the data as per the recommended fit measures and goodfor further statistical analysis.
Note: COM- Compensation, BEN-Benefit, REC- Recognition, PRM- Performance management, TD-Talent
development, WOR- Work, WL-Work life, COMM- Commitment
Figure 2: Measurement model

SCMS Journal of Indian Management , January-March - 2021 114
A Quarterly Journal
4.22 Reliability of indicators and constructs
After ensuring the fitness of the data, the next step is toassess the reliability of the indicators and the constructs inmeasuring the attributes which are intended to measure. Inthis part, the researcher ensures whether the items and theset of items under different constructs are unidimensionalin measuring the construct and whether the scale items areconsistent with different time of measurement. For thispurpose, the usual practice is to evaluate the factor loadingsof each indicator variable to assess the indicator reliabilityand Cronbach Alpha and Composite Reliability (CR) toassess the reliability and internal consistency of variousconstructs. Factor loading above 0.5 is considered as a goodmeasure for indicator liability (Hair, Black, Babin, &
Anderson, 2010; Kline, 2010; Mishra. 2016). Cronbach’sAlpha and Composite Reliability greater than 0.7 indicatesadequate reliability of constructs (Gefen, Straub &Boudreau, 2000). In this study, all the indicator variableshave loadings greater than 0.5, and all the constructs havealpha and CR greater than 0.7(Table 4). Hence it is assumedthat the indicators and constructs have sufficient internalconsistency and reliability in measuring the related attributes.
4.2.3 Validity assessment
To assess the validity of the scale, the researcher has toexamine both content and construct validitiessimultaneously. Content validity examines whether the scaleitems are capable of measuring the characteristic which theresearcher intended to measure (Lawshe, 1975).
Table 4: Reliability, Internal Consistency and Convergent Validity

SCMS Journal of Indian Management , January-March - 2021 115
A Quarterly Journal
In this study, the content validity is ensured with the helpof the literature and collecting opinions from the practitionersof various public sector companies in Kerala. Constructvalidity of the scale is generally evaluated by assessing twosubsets of validity measures, namely convergent validityand discriminant validity. The criterion that is generallyfollowed to assess convergent validity is to ensure theAverage Variance Extracted (AVE) as recommended for thepurpose. AVE refers to the extent of variance explained by
Table 5: Fornell-Larcker criteria for Discriminant validity
the set of variables under a construct. AVE greater than 0.5is regarded as a good indication of sufficient convergentvalidity (Fornell & Larcker, 1981; Bagozzi & Yi, 1988; Chin,1998). To assess discriminant validity, the method is tocompare the squared root of AVE of a construct with theintercorrelations of that construct with other constructs. Ahigher squared root of AVE than the intercorrelations ensurethe discriminant validity of the construct (Fornell & Larcker,1981).
Note: Bold diagonal value represents square root of AVE
In this study, all the AVE measures are > 0.5 ranging from0.527 to 0.715 (Table 4), and the squared root of the AVE ofeach construct is greater than the intercorrelations of theconstruct with other constructs (Table 5). The complianceof these two criteria ensures adequate convergent anddiscriminant validity of the constructs. From Table 4, it isevident that all the indicator variables have factor loadingsabove 0.5, Cronbach Alpha and CR greater than 0.7 and AVE
greater than 0.5. The squared root of AVE for everyconstruct, given as diagonal values in Table 5, is greaterthan the intercorrelations of that construct with otherconstructs. The correlation between variables shows thepresence of sufficient nomological validity for the latentvariables (Table 2). Figure 3 shows that there is a moderatecorrelation between the second-order constructs ofextrinsic and intrinsic rewards (r = 0.68).

SCMS Journal of Indian Management , January-March - 2021 116
A Quarterly Journal
Source: Prepared by the authorNote: COM- Compensation, BEN-Benefit, REC- Recognition, PRM- Performance management, TD-Talent development,WOR- Work, WL-Work life, COMM- Commitment
Figure 3: Structural Equation Model for hypotheses test (with standardizedregression coefficients)
The structural model is the inner part of the StructuralEquation Model that represents the multiple relationshipsbetween variables. The structural model assessment enablesthe researcher to interpret the causal relationships betweenvariables and to test the hypotheses. In this multi-factor
Table 6: Fit measures of the Structural model
second-order structural equation modelling, there are twoexogenous variables, namely extrinsic and intrinsic rewards,and one endogenous variable, employee commitment. Thevarious fit measures for the structural model are given inTable 6.
Source: Calculated by the author
4.2.4 Assessment of Structural Model

SCMS Journal of Indian Management , January-March - 2021 117
A Quarterly Journal
Most of the fit indices are as per the recommendations,and the others are very close to the recommended values,which indicate a satisfactory or moderate fit of the datawith the proposed model. The correlated exogenousvariables-extrinsic and intrinsic rewards - could explain 83percent of the variation of the dependent variable,employee commitment.
Table 7: R- square values for the first order constructs
The two dimensions of extrinsic rewards showed good R2
values ranging from 0.63 to 0.95. The R2 values for the fiveintrinsic dimensions range from 0.38 to 0.60 (Table 7). Allthese measures are found significant at the level p < 0.001.The regression coefficients (standardised beta coefficients)between the first and second-order constructs are foundsignificant at the level p< 0.001(Table 8).
Table 8 shows the comparative contribution of each rewardcomponent under the extrinsic and intrinsic rewards. Amongthe extrinsic rewards, employee benefit is found moresignificant with a beta value of 0.972. As such, all the five
Table 8: Unstandardized and Standardized beta values with level of Significance
dimensions of intrinsic rewards are also found significant atthe level p < 0.001. Recognition, Talent Development andWork are found more influential in determining employeecommitment with beta values 0.80, 0.77 and 0.76, respectively.
The beta coefficients in Table 9 show that extrinsic andintrinsic rewards have a significant impact on employeecommitment and hence the statistical conclusion is to rejectthe null hypotheses of no impact for the exogenous variableson the endogenous variable. This finding supports the studyconducted by Obicci (2015), Ajmal et al. (2015), andTurkyilmaz et al. (2011). As far as employee commitment isconcerned, the intrinsic reward is found highly influential in
Source: Prepared by the author, ***. P < 0.001 level (2-tailed).
comparison with extrinsic rewards with a standardised betacoefficient of 0.759 (p < 0.001), which is two times higherthan the extrinsic rewards (beta coefficient = 0.20, p < 0.001).The regression values indicate that unit change in theintrinsic rewards would cause for 0.759 unit change inemployee commitment while the same change in extrinsicrewards would cause for 0.203 unit change in employeecommitment.

SCMS Journal of Indian Management , January-March - 2021 118
A Quarterly Journal
Table 9: Hypotheses test results
***significant at the level p< 0.001 (2-tailed).
5. Managerial Implication
The findings of this research are highly beneficial to theHR managers who are responsible for formulating andimplementing tailor-made rewarding systems for theiremployees. From the results, it is clear that employeeattitudes are determined mainly by non-financial rewards.It highlights the possibility of influencing employeeattitudes without spending additional money. This greaterimportance of intrinsic rewards due to employeepreference helps the managers to make good rewardpackages by blending more non-financial rewards with theextrinsic rewards in unique proportions. All the intrinsicrewards are highly influential on employee commitment.Hence management of public sector companies in Indiamust give more attention to offer intrinsic motivators toattract, motivate, and retain talents with their organisation.The results of this study revealed the relative importanceof each reward component to the employees, and it can betaken as a base for formulating or modifying the prevailingrewarding systems in the public sector companies in India.
6. Conclusion
This study once again established the strong bond betweenrewards and employee commitment. The management cannever undermine the importance of either extrinsic orintrinsic rewards. Among the two dimensions of extrinsicrewards, employee benefits showed high significance withemployee commitment (0.972, p < 0.001). In this era, thenew generation of employees is more concerned about theindirect financial rewards that provide more work comfortand security feeling to them. The results show that theemployees in public sector manufacturing companies arehighly concerned with their intrinsic rewards. Thedifference in regression coefficients between these two
predictor variables gives a vital message of employeepreference towards the intrinsic rewards over the extrinsicrewards. In determining employee commitment, intrinsicrewards are three times more powerful than extrinsicrewards. This reveals the potential power of intrinsicmotivation over extrinsic motivation in shaping employeeattitudes at the workplace. This expectation of employeestowards the intrinsic form of rewards may be the result oftheir higher level of satisfaction with extrinsic rewards.The regression values show that among the intrinsicrewards, performance recognition, talent development andchallenging work are the highest influencers. Performancemanagement comparatively showed a less value (0.62; p <0.001). This may be due to the lack of proper performancemanagement schemes in the public sector industries.
7. Limitation and Scope for Further Research
This study has been conducted among the public sectoremployees in south India. It would be better to conduct awide study by including more samples from North Indianstates also. As the working conditions and pay patterns aredifferent across the states, such a study will yield betterresults that are more reliable in a Nationwide context.
8. Funding
The authors received no financial support for the research,authorship, and/or publication of this article.
References
Ajmal, A., Bashir, M., Abrar, M., & Khan, M. M. (2015)“The Effects of Intrinsic and Extrinsic Rewards onEmployee Attitudes/ ; Mediating Role of PerceivedOrganizational Support”. Journal of Service Scienceand Management, 8(August), 461–470. Retrievedfrom http://dx.doi.org/10.4236/jssm.2015.84047%0A

SCMS Journal of Indian Management , January-March - 2021 119
A Quarterly Journal
Amstrong. M. (2010). “Human Resource ManagementPractice, A guide to People Management”. KoganPage Ltd, New Delhi, 2010.
Aon Hewitt (2012). “Total Reward survey” http://www.aon.com/human-capital-consulting/thoughtl e a d e r s h i p / t a l e n t _ m g m t / 2 0 1 2 _ a o n h e w i t t _total_rewards_
Bagozzi, R. P., & Yi, Y. (1988). “On the evaluation ofstructural equation models”. Journal of the Academyof Marketing Science, 16(1), 74–94.
Brown, D (2006) Home Grown, People Management. 12(17), pp 38-40.
Chin, W.W (1998), “The partial Least Squares approach tostructural equation modeling.In: Marcoulides”,G.A(Ed). Modern Methods for business Research,New Jersey
Christiansen, C L and Higgs, M (2006) “The Alignment ofHR and Business Strategies and its Relationship toEffective Organisational Performance”. HenleyWorking Paper Series HWP 0609, HenleyManagement College.
Cronbach,L.J.(1951). “Coefficient alpha and the internalstructure of tests”. Psychometrika, 16(3), 297–334.
Deci, E. L., & Ryan, R. M. (1987) “Intrinsic motivationand self-determination in human behavior”. NewYork: Plenum Press.
Fischer. R(2003) “Rewarding employee loyalty/ : Anorganizational justice approach” InternationalJournal of Organisational Behaviour, 8(3).
Fornell, C. G., & Larcker, D. F. (1981) “Evaluatingstructural equation models with unobservablevariables and measurement error”. Journal ofMarketing Research, 18(1), 39–50.
Geffen, D., Rigdon, E. E., & Straub, D. W. (2011) “Editor’scomments: An update and extension to SEMguidelines for administrative and social scienceresearch” MIS Quarterly, 35, iii–xiv.
Gerhart, B., S.L. Rynes, and I.S. Fulmer. 2009. “Pay forMotivation”
Gomez – Mejia.LR, Balkin. DB, Cardy.RL (2005),“Managing Human Resources”, 4th Ed, Prentice Hallof India Pvt.Ltd, New Delhi.
Gratton, L and Truss, C (2003) “The three-dimensionalpeople strategy: Putting human resources policiesinto action”, Academy of Management Executive,17(3), pp 74-86.
Hair, J. F., Black, W. C., Babin, B. J., Anderson, R. E. (2010).“Multivariate Data Analysis” (7 Ed.). Upper SaddleRiver, NJ, USA: Prentice-Hall,Inc
Hareendrakumar, V. R., Subramoniam, S., & Hussain, N.(2020). “Redesigning Rewards for Improved FairnessPerception and Loyalty.” Vision, 24(4), 481-495.
Harter, J. K., Schmidt, F. L., Hayes, T. L., Immigration, U.S., & Service, N. (2002). “Business-Unit-LevelRelationship Between Employee Satisfaction,Employee Engagement, and Business Outcomes: AMeta-Analysis”. Journal of Applied Psychology, 87(2), 268–279. https://doi.org/10.1037//0021-9010.87.2.268
Hay Group (2008), “The Hay Group Total RewardFramework,” http://haygroup.co
Herzberg, F. (1966). “Work and the Nature of Man”,Cleveland, OH: World Publishing.
Higgs, M (2004) “Future Trends in HR”. In: D. Rees andR. Mc Bain, People Management Challenges andOpportunities, Basingstoke: Palgrave Macmillan.
Hulland, J. (1999). “Use of partial least squares (PLS) instrategic management research: a review of fourrecent studies”. Strategic Management Journal,20(2), 195–204.
Kline, R. B (2010), “Principles and Practice of StructuralEquation Modeling”. Fourth edition (4 Ed.). NewYork: Guilford Press.
Kohn, A (1993), “Why Incentive Plans Cannot Work”,Harvard Business Review 71(5): 54-63.
Kokubub.K(2017), “Organizational Commitment andRewards in Thailand, with comparison betweenUniversity Graduates and Others” Asian SocialScience. Vol. 13 (6), pp 1-19.

SCMS Journal of Indian Management , January-March - 2021 120
A Quarterly Journal
Lawler.E.E. (1993). CEO Publication-93-5(225) http://www. morshall.use.edu/ceo
Lawshe. C H (1975), “A quantitative approach to contentvalidity”, Personnel psychology, 28(4), 563-575
Ledford.GE, Gerhart, B and Fang. M (2013), “NegativeEffects of Extrinsic Rewards on Intrinsic Motivation:More Smoke Than Fire”, Worldat Work Journal,Second Quarter. 2013.
Linley, P A, Harrington, S and Hill, J R W (2005) “Selectionand Development: A new perspective on some oldproblems”, Selection and Development Review, 21 (5)
Luthans, F. and Peterson, S. J. (2002). “Recognition: APowerful but Often Overlooked, Leadership Tool toImprove Performance”. The Journal of LeadershipStudies, 7 (1), pp. 31-39.
Mahaney, R. C. & Lederer, A.L. (2006). “The Effect ofIntrinsic and Extrinsic Rewards for Developers onInformation Systems Project Success”, ProjectManagement Journal, 37 (4), 42-54.
Malhorta, N., Budhwar, P., & Prowse, P. (2007). “Linkingrewards to commitment: An empirical investigationof four UK call centres.” International Journal ofHuman Resource Management”, 18(12), 2095–2 0 1 7 . h t t p s : / / d o i . o r g / 1 0 . 1 0 8 0 /09585190701695267
Mc Cormick.H. (2015). “Rethinking Total Rewards”, UNCExecutive Development. www. exedev.unc.edu
Meyer P J, Allen J N (1990). “A three-componentconceptualization of organizational commitment”.Human Resource Management Rev. 1: 61"89.
Meyer, P J, Allen J N (1984). “Testing the side-bet theoryof organizational commitment: Somemethodological considerations”. Journal of AppliedPsychology. 69: 372"378.
Milkovich, G.T., & Newman, J.M (2008). “Compensation”,9th Ed. New York, NY: McGraw- Hill, 2008
Mishra.P. (2016). “Business Research Methods”, OxfordUniversity Press, New Delhi, India
Mohamood, S., Ramzan, M & Akbar M. T. (2012),“Managing Performance through Rewards Systems”,Journal of Education & Research for sustainableDevelopment, Vol. 1, on line issue. 2.
Mottaz, C. J. (1985). “The Relative Importance of Intrinsicand Extrinsic Rewards as Determinants of WorkSatisfaction”, The Sociological Quarterly, 26 (3),365-385.
Munir, R. (2016). “Impact of Rewards (Intrinsic andExtrinsic) on Employee Performance with SpecialReference to Courier Companies of FaisalabadCity”. European Journal of Business andManagement, 8, 88-97.
O’Reilly, C & Chatman. J (1986). “Organizationalcommitment and psychological attachment: Theeffects of compliance, identification andinternalization on prosocial behavior”. Journal ofApplied Psychology. 71: 492"499.
Obicci, P. A. (2015). “Influence of Extrinsic and IntrinsicRewards on Employee Engagement ( Empirical Studyin Public Sector of Uganda )”. Management Studiesand Economic Systems, 2(1), 59–70.
Pink, D. H. (2009), Drive: “The Surprising Truth AboutWhat Motivates Us”. New York: Riverhead Books.
Porter, L.W., Steers, R.M., Mowday, R.T. and Boulian, P.V.(1974) “Organizational Commitment, JobSatisfaction, and Turnover among PsychiatricTechnicians”. Journal of Applied Psychology, 59,603-609. http://dx.doi.org/10.1037/h0037335
Sarwar .S., & Abugre. J. (2013). “The Influence of Rewardsand Job Satisfaction on Employees in the ServiceIndustry”, The Business and Management Review,Vol.3(2), pp.22-32.
SHRM (2007), “Implementing Total Rewards Strategies,A guide to successfully planning and implementinga total rewards system”, SHRM Foundations’sEffective Practice Guidelines Series.

SCMS Journal of Indian Management , January-March - 2021 121
A Quarterly Journal
Stumpf, S. A., & Doh, J. P. (2010). “Exploring talentmanagement in India/ : The neglected role ofintrinsic rewards”. Journal of World BusinessJournal, 45(2010)(April), 109–121. https://doi.org/10.1016/j.jwb.2009.09.016
Stumpf, S.A., Tymon, W.G., Jr., Favorito, N., & Smith, R.R.(2013). “Employees and change initiatives: Intrinsicrewards and feeling valued. Journal of BusinessStrategy”, 34(2), 21–29. https://doi.org/10.1108/02756661311310422
Thomas, K. W. (2009). “Intrinsic motivation at work” (2nded.). San Francisco: Berrett- Koehler.
Thomas, K. W., & Tymon, W. G., Jr. (1997). “Bridging themotivation gap in total quality”. QualityManagement Journal, 4(2): 80–96.
Thomas, K. W., Jansen, E., & Tymon, W. G., Jr. (1997).“Navigating in the realm of theory: An empoweringview of construct development”. In Pasmore, W. A.,& Woodman, R. W. (Eds.), Research inorganizational change and development. Vol. 10(pp.1–30). Greenwich, CT: JAI Press
Towers Watson (2012), “Total rewards strategies for the21st century”, Towers Watson <http//www.towerswatson. com>
Tremblay, M., Sire, B. and Pelchat, A. (1996). “A study ofthe determinants and the impact of flexibility onsatisfaction with social benefits”. Working paper,HEC Montreal
Turkyilmaz, Ali., Akman, Gulsen., Ozkan, Coskum.,Pastuszak, Z. (2011). “Empirical study of publicsector employee loyalty and satisfaction”.Industrial Management & Data Systems, III(5),6 7 5 – 6 9 6 . h t t p s : / / d o i . o r g / 1 0 . 1 1 0 8 /02635571111137250
Tymon Jr.WG, Stumpf,S.A, Doh.J,P , “Exploring talentmanagement in India: The neglected role of intrinsicrewards,” Journal of World Business Journal,Vol.45(2010) pp 109-121
Wolowska, A. (2014). “Determinants of OrganizationalCommitment, Organizational commitment in Meyerand Allen’s three -component model”. HumanResources Management & Ergonomics, VIII(1),129–146.
World at Work. (2006), “Total Rewards Model; A FrameWork for Strategies to Attract, Motivate and RetainEmployees.” www.worldatwork.org.
World at Work. (2015), “ Total Rewards Model”;www.worldatwork.org
************
SCMS Journal of Indian Management , January-March - 2021 122
A Quarterly Journal
Dialectics of Constructed Identitiesas Tools of Oppression – Concept ofReverse Metamorphosis as a factor
Reinforcing Ageism
Abstract
Self-identities and social identities on ageing are constructed on the basis of ‘conditions’ and
‘experiences’ in the life of the aged. Using Bourdieu’s Theory of Habitus, the study tried to understand
the dialectics of self and social identity constructions on subjective well being and quality of life of
aged women. Qualitative analysis using narratives and photo-elicitation method was used. The study
consisted of 14 elderly women aged 70 years and above living in Kerala. Results showed that perceptions
about age identity have both direct and indirect impact on subjective well being. Corresponding to the
nature of self-identity, both positive and negative influences are observed. Disengagements from active
roles and power positions, attitude towards old age as a definite period of dependency, belief in the
inevitability of ill health, pessimism about cure for health problems, fear and anxiety about miseries and
unpredictability in life were the leading self-identity statements. Identity constructions, when used
deliberately as a tool of oppression, results in Reverse Metamorphosis. Unlike biological
metamorphosis– where the process brings life to an active, vibrant, beautiful stage till the end of life, in
Reverse Metamorphosis, aged women enter into cocoons of identities and images that label their life as
passive, inactive, shadeless and unattractive. Gender and widowhood add to the process by setting limits
to the conditions of life. Reverse metamorphosis is reinforced through marginalisation, isolation, neglect
and abuse leading to depression, poor subjective well being and reduced quality of life. Suggestions are
made to use Social, Cultural, Economic and Symbolic Capitals envisaged by Bourdieu to influence the
identity constructions, explore designs for Inclusive Social Spaces and gender sensitisation to reduce
ageism.
Keywords : Quality of life, Habitus, Reverse Metamorphosis, Ageism, Inclusive Social Spaces
Abstract
Dr. Chitra S. NairAssistant Professor of Sociology
K.N.M. Govt. College, KanjiramkulamUniversity of Kerala
Trivandrum, Kerala, IndiaEmail: [email protected]

SCMS Journal of Indian Management , January-March - 2021 123
A Quarterly Journal
1. Introduction
World Health Organization explains ageism as thestereotyping, prejudice, and discrimination against peopleon the basis of their age. Ageism is a widespread andinsidious practice that has harmful effects on the health ofolder adults. For older people, ageism is an everydaychallenge. Overlooked for employment, restricted fromsocial services and stereotyped in the media, ageismmarginalises and excludes older people in theircommunities.
Ageism is everywhere, yet it is the most socially“normalised” of any prejudice and is not widely countered– like racism or sexism. These attitudes lead to themarginalisation of older people within our communitiesand have negative impacts on their health and well-being.In low-and middle-income countries, older people facedaily discrimination and are largely invisible. Ageismleaves people excluded, considered different, restrictedin what they can do or simply treated like they don’t exist.It means older people are often at risk of violence, areexcluded from health services and face disproportionatelevels of poverty.
Gender is the major intersecting factor that explainsdiscrimination, exploitation and marginalisation. Womenoutlive men in nearly all countries in the world. Currently,in the developed world, differences in mortality favourwomen at all ages and especially so at the oldest ages. Indeveloping countries, seventy percent of females have alife expectancy at birth of more than 80 years, comparedto 52 percent in developed countries, while no males havea life expectancy over 80 (Help Age International, 1996).
Gender is a powerful determinant of mental health thatinteracts with such other factors as age, culture, socialsupport, biology, and violence. For example, studies haveshown that the elevated risk for depression in women is atleast partly accounted for by negative attitudes towardsthem, lack of acknowledgement for their work, feweropportunities in education and employment, and greaterrisk of domestic violence. The risk of mental illness is
also associated with indicators of poverty, including lowlevels of education and, in some studies, with poor housingand low-income (Patel & Kleinman, 2003). Gender shapesolder women’s experience of ageing, health, and ill health.Previous researches identify that ageing, gender, and healthare intrinsically linked and collectively shape olderwomen’s experience.
Elderly women, especially in Third World countries likeIndia, face several threats. They are likely to be illiterateor poorly educated, unlikely to be employed, most likelyto be widowed and dependent on others, and they sufferfrom malnutrition and disabling symptoms as well as reporthigher psychological distress. The vulnerability of theageing women, special types of problems they are likelyto encounter over the life span, and factors that marginalisethem need to be better understood. There is no clearawareness as yet, of the potential contribution of ageingwomen to the development process as ageing women arestereotypically perceived as burdens on the nationaleconomy (Prakash, 1997). This again gives strength to thefact that ageism manifests in various forms in the life ofaged women, making them vulnerable.
Humphries (1991) links women’s health status to theiraccess to control of production. In societies where womenare viewed as an economic burden, not only is their statuslower, but this in turn adversely affects their access toeducation, food and health. The dependence of womenwithin the family, coupled with cultural norms, promotesdiscrimination at a number of levels. For example, foodallocation in many households often leaves women andfemale children undernourished. The intra- householdallocation of food and its impact upon women have receivedlittle attention from gerontologists and remains asignificant factor in determining the quality of later life.Long term malnourishment has severe implications forwomen who survive into older ages, and these areparticularly significant for the contemporary developingworld. The following chart shows how gender and cultureare determining the concept of active ageing in the world.

SCMS Journal of Indian Management , January-March - 2021 124
A Quarterly Journal
International efforts span back to the Vienna Action Planon Ageing (1982) to address the developmental potentialand dependency needs of older persons, World Summit forSocial Development in Copenhagen (1995) that aimed tointegrate “äge” into a “Society for all”, the Madrid Plan ofAction on Ageing (2002) that focused on “Building aSociety for all Ages”. All of these efforts were formaterialising certain key areas like older persons and theirdevelopment, advancing health and well being into old age,ensuring and enabling supportive environments, etc.Recently, the Sustainable Development Goals also putforward inclusive growth, good health and well being ofthe people, reducing gender inequalities etc., into theforefront of the global action plans. However, ageismcontinues to be a threat in achieving the target of active,healthy and successful ageing and the motto of adding lifeto years and not just years to lives.
The Study
In determining the health and well being of a population,the physical and social environments play a major role alongwith our biological and genetic factors. Especially thesocio-cultural environments hold a vital role in designingthe physical and mental capacity across a person’s life
Figure 1 – Gender and Culture Determinants of Active Ageing
Source: Active Ageing: A Policy Framework, WHO, 2002
course. The accommodation and realisations of one’s owncondition in old age determine the whole process by whichshe adapts to her environment, manipulates her conditionsand overcomes the challenges. Aged people are alwaysheterogeneous based on the conditions they are exposedto and the variation of experiences they have. Both olderpeople and their environments will always be diverse,dynamic and changing. The interaction between both theconditions and experiences during the life course haveenormous potential to decide whether or not the agedwomen will be successful in leading a healthy, successful,active aged life that is devoid of ageism.
In this background, the study tries to explain three majorobjectives. What are the conditions and experiences of theaged women that design or help to design the identities inwhich they live? Images of ageing exist at two levels;personal or self-identity and societal or social identity. Tounderstand ageing holistically, it is imperative tounderstand how self-identity is influenced by the processof ageing and what is the mutual interaction between thetwo identities in the life of the aged women? Thisinteraction related to the production and reinforcement ofageism became the third major objective of the study.

SCMS Journal of Indian Management , January-March - 2021 125
A Quarterly Journal
The study used a qualitative methodology. Narratives andphoto-elicitation methods were depended upon. Fourteen(n=14) aged women were selected for the study out ofnearly 50 aged women who were interviewed. Strength andrichness of the narratives, age barrier of 70 years were theinclusion criteria adopted. Disinterest to share personaldetails, interference by the caretakers and blunt narrativeswere excluded from the study. The photo-elicitation methodwas carried out in two ways. One, the photographs availablewith the family or the aged women were used to elicitinformation regarding life events and identityconstructions. Second, a pre-designed set of photos withimages of daily used materials, dress combinations,accessories, colours, daily activities and entertainmentswere used to identify their preferences as well as imageswith which they relate themselves and old age. Secondarydata involved a thorough search of research works onageism, books, newspapers, and social media.
Theoretical consideration
Bourdieu’s theory of habitus is used to explain thedialectics of self and social identity, constructions andageism. Bourdieu defines habitus as “A structuringstructure, which organises practices and the perception ofpractices.” (Bourdieu, 1984: 170). Habitus is the cognitive/mental system of structures that are embedded within anindividual (and/or collective consciousness) which are theinternal representations of external structures. Habitusconsists of our thoughts, tastes, beliefs, interests and ourunderstanding of the world around us and is created throughprimary socialisation into the world through family, cultureand the milieu of education. Habitus has the potential toinfluence our actions and to construct our social world aswell as being influenced by the external. The internal andexternal worlds are viewed by Bourdieu as interdependentspheres and because of the fluid nature of habitus (changingwith age, travel, education, parenthood etc.) It is alsosignificant that no two individual’s habitus will be the same.
The study tries to use Habitus to explain the influence ofideas of identity constructions, the impact in structuringthese identities, how it varies between the two, how itcultivates mutual constructions, how it contributes todetermining positive and negative conditions andexperiences of well being and whether the process affects
in producing and reinforcing ageism at any level.Bourdieu’s concept of habitus is intricately linked with thesocial structures within a specific field and is essential toa sociological analysis. Reality, according to Bourdieu, isa social concept; to exist is to exist socially and what isreal is relational to those around us.
Findings and discussions
The table given below explains the socio-demographicprofile of the aged women interviewed.
Table 1- Socio- demographic profile of respondents
Perception about one’s own self greatly depends on thesocio-economic and demographic situations specific to theperson. Earlier studies also show that the conditions ofthe aged women differ with respect to their age, religion,education, income, occupation, health, marital status, familysupport and whether living in rural or urban areas.(Karuppiah, 2002).
The present study showed that the condition in which anaged woman lives her life course has an immense impacton her experiences with cumulative effect in later life. Aswomen live longer, the biological process of ageing thatinitiates with birth in every human being receives another

SCMS Journal of Indian Management , January-March - 2021 126
A Quarterly Journal
dimension. Ageist connotations can be identified as themajor factors. Willingly or unwillingly, aged women stepinto the socially constructed threshold and are forced tofollow the norms of society that depicts certain things asnormal or ideal for those who are aged- women, widowed,and financially dependent.
Here, influenced by the conditions and experiences in theirlives, identity constructions can be observed as existing in
Table 2 – Positive and negative self-identities developed by the respondents.
two ways - positive and negative. When the constructionsare positive, it becomes a refuge or support for the womento age successfully. On the contrary, negative self andsocial identity creations prove to be a risk. Compared topositive identity constructions, what we see in a patriarchal,highly stratified society is the construction and deep-rooted existence of negative age identities.
Table 3 – Positive and negative social-identities developed by the respondents.
Narratives also showed that positive self and social identityconstructions are mutually nurturing. It gives the capacityfor the aged women to have high self-esteem, assertiveness
in their behaviour, feeling of fulfilment and freedom, self-sufficient and happy to gracefully embrace the changesrelated to ageing.

SCMS Journal of Indian Management , January-March - 2021 127
A Quarterly Journal
Table 4 – Narratives and corresponding constructs by the respondentsshowing positive self and social identities.
““I understand that I am getting old. But that does not mean that I am unhealthy. I do all my household works. I leavethe rest to god.”
“What else is there for me to worry about? I have fulfilled all my duties. Now I have to obey my son and demand onlygenuine needs”.
Constructs – Aged women can experience inner peace and fulfilment when they can understand their own limitationsand come into terms with the process of aging.
“I do not have much demands. I have secured enough for my old age. Now until death comes, I have to live calmly”.Constructs – Aged women should feel satisfied with the conditions of life and stay calm. In doing so, they can finddignity and meaning in the later years when physical and biological senescence progresses.
“I was an atheist. But after 65, when I felt alone after my husband’s death and daughter’s marriage, I found GOD as acompanion to share everything. I talk with the GOD. He is like a friend to me. I feel he is with me when I talk. Afterthat I feel lightened”.
Constructs – More dependent on ‘God’, but not necessarily on religion.
“Even when there is financial crisis, my daughter and son take care of me very well. We - my husband and me - do nothave any savings. Whatever we have earned were spend for the children. We didn’t have any worries. Life will go likethat.”
Constructs – Even in low socio-economic conditions they feel supported and cared by the significant others. “Ihave to live without my husband since my younger ages. Had faced everything till now. I do not easily get worried bycrisis. I have lived all my years through crisis. I have made them (children) realise the struggles I have been through.So expect that they will stand by me”
Constructs – They can retrospect, face challenges in later life with optimism.
“I know what I want. I am still independent. I will hire according to my demands and never bother my children. But Iwill inform them. Because nowadays there is lot of insecurity around.”
Constructs – Observed sense of freedom – physical, mental and economical.
“I have changed a lot. Earlier I used to worry a lot. Was angry almost all the time. But now there is a sense ofdetachment from everything. But I enjoy the solace in life.”
Constructs – Detaching from worldly pleasures and practicing asceticism are identified as self-realisation in old age.
The Dialectics
When the identities are constructed negatively, theybecome risks for the survival, happiness, and well being ofthe aged women. These negative identities function as toolsof oppression perpetuating ageism in society. Knowinglyor unknowingly, standards are being set, and images arebeing projected in such a way that self and social identitiesare built at the expense of each other. At various junctures,social identity can be seen as dominating self-identity.Through this domination, social identities control the self-identity constructions in aged women. Self-identitiesconstructed by the aged women always tend to be in
confirmation with the one projected by social identities.When this process continues for a longer period of time,it automatically reaffirms the existing ageist socialidentities into concrete social identities through actionsand interactions. It gets normalised in society as a synonymfor old age and aged women. Gender, widowhood andnegative social identities perpetuate ageism throughprocesses of discrimination, exploitation andmarginalisation. In this sense, there is a vicious cycle ofthe structuring of ageist negative identities and processesof ageism. The processes may take the following forms:
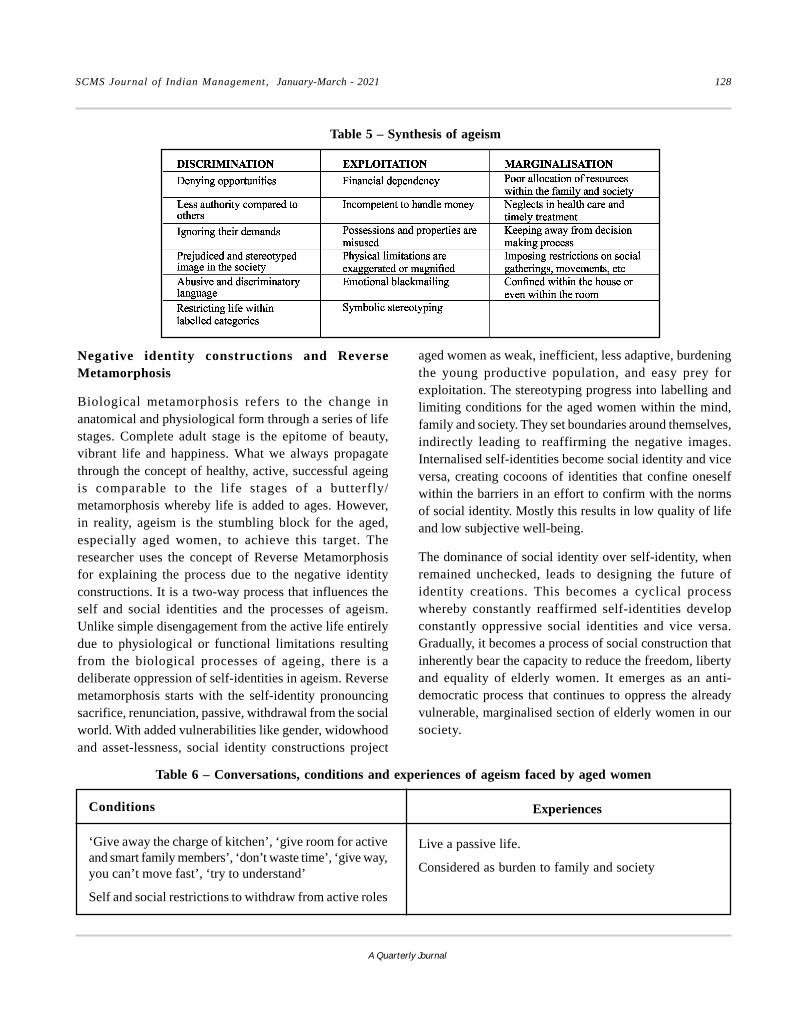
SCMS Journal of Indian Management , January-March - 2021 128
A Quarterly Journal
Table 5 – Synthesis of ageism
Negative identity constructions and ReverseMetamorphosis
Biological metamorphosis refers to the change inanatomical and physiological form through a series of lifestages. Complete adult stage is the epitome of beauty,vibrant life and happiness. What we always propagatethrough the concept of healthy, active, successful ageingis comparable to the life stages of a butterfly/metamorphosis whereby life is added to ages. However,in reality, ageism is the stumbling block for the aged,especially aged women, to achieve this target. Theresearcher uses the concept of Reverse Metamorphosisfor explaining the process due to the negative identityconstructions. It is a two-way process that influences theself and social identities and the processes of ageism.Unlike simple disengagement from the active life entirelydue to physiological or functional limitations resultingfrom the biological processes of ageing, there is adeliberate oppression of self-identities in ageism. Reversemetamorphosis starts with the self-identity pronouncingsacrifice, renunciation, passive, withdrawal from the socialworld. With added vulnerabilities like gender, widowhoodand asset-lessness, social identity constructions project
aged women as weak, inefficient, less adaptive, burdeningthe young productive population, and easy prey forexploitation. The stereotyping progress into labelling andlimiting conditions for the aged women within the mind,family and society. They set boundaries around themselves,indirectly leading to reaffirming the negative images.Internalised self-identities become social identity and viceversa, creating cocoons of identities that confine oneselfwithin the barriers in an effort to confirm with the normsof social identity. Mostly this results in low quality of lifeand low subjective well-being.
The dominance of social identity over self-identity, whenremained unchecked, leads to designing the future ofidentity creations. This becomes a cyclical processwhereby constantly reaffirmed self-identities developconstantly oppressive social identities and vice versa.Gradually, it becomes a process of social construction thatinherently bear the capacity to reduce the freedom, libertyand equality of elderly women. It emerges as an anti-democratic process that continues to oppress the alreadyvulnerable, marginalised section of elderly women in oursociety.
Conditions
‘Give away the charge of kitchen’, ‘give room for activeand smart family members’, ‘don’t waste time’, ‘give way,you can’t move fast’, ‘try to understand’
Self and social restrictions to withdraw from active roles
Experiences
Live a passive life.
Considered as burden to family and society
Table 6 – Conversations, conditions and experiences of ageism faced by aged women

SCMS Journal of Indian Management , January-March - 2021 129
A Quarterly Journal
Conditions
‘It’s time for prayers’, ‘request god not to make yousuffer’, ‘you are aged’, ‘it’s not suitable for the agedwomen’, ‘you are an aged widow’, ‘obey your son/daughter’
Imposes to take shelters in “age molds or labels.”
‘Vegetarianism, bhajans, temples, prayers, soft colourtraditional wears, television series of bhakthi/god/devotion’
Change in tastes- dress, food, entertainments, frequencyof travels.
‘You can wait’
Less prioritised
‘It’s enough,’ ‘what else do you want?’
Spared with less resources
‘You have lived your life, now let us live ours’, ‘we haveto build our career and home’, ‘we are busy, try tounderstand’, ‘ you always have lot of complaints’, ‘ youare hard to manage.’
Lack of social support and care
Experiences
Socially isolated and experience loneliness
Cocoons of age is developed. Spiritually modified spaceand materials Market value as ‘spiritual consumers’
Neglect in resource allocation and prioritisation
Marginalisation
Alienation
Ageism explained by Habitus
Habitus emerges over time and acts like a durable‘structuring structure’. It comes from practice, and itshapes practice. It predisposes people to think and act inpatterned ways. In this sense, habitus can be used toexplicate what are the socio-cultural underpinnings ofageism in a multicultural society like India- a risk leadingto reverse metamorphosis in later life. Stereotyped ageidentities are so ingrained that people often mistook thefeel of being marginalised as a natural process associatedwith ageing instead of identifying it as culturally developed.This often leads to justifying social inequality because itis mistakenly believed that some sections of the populationare disposed to the finer things in life while others arenot. Aged women, as a group with multiple vulnerabilitieslike widowhood, lack of personal financial assets, cognitiveas well as physical limitations that increases with age,social and cultural constructions of subordinate powerpossessions, set the foundation for limiting their socialworld. Self-identity created on this basis becomes thefoundation for constructing social identity about the agedwomen. Bourdieu’s concept of habitus as “a structuring
structure, which organises practices and the perception ofpractices” fittingly explains this situation.
Managing Ageism and the Action Plan
Examining the WHO Strategy on a global action plan onageing and health, we can see that the plan focuses onfive strategic objectives:
· Commitment to action on Healthy Ageing in everycountry;
· Developing age-friendly environments;
· Aligning health systems to the needs of olderpopulations;
· Developing sustainable and equitable systems forproviding long-term care (home, communities,institutions); and
· Improving measurement, monitoring and researchon Healthy Ageing.
Application of theory
A key point within Bourdieu’s theory is that habitusconstrains but does not determine thought and action. If

SCMS Journal of Indian Management , January-March - 2021 130
A Quarterly Journal
an individual is both reflective and aware of their ownhabitus, they possess the potential to observe social fieldswith relative objectivity. Bourdieu outlines four speciesof capital that are linked with habitus. Species capital islocated as part of the structuring process of habitus. Thiscan be used by individuals within the relative field as a toolfor gaining dominance and power. Bourdieu breaks speciescapital down into:
1. Social capital which can be defined as the circles offriends, groups, memberships and social networks(also virtual within online communities).
2. Cultural capital which is an individual’s knowledge,experience and connections. (Academic background,credentials and work-life).
3. Economic capital is the economic assets held(property owned, earning ability).
4. Symbolic capital is the honour, prestige andrecognition relative to the individual (a veteran in acertain field, an aged person, a respectful person).
Older women can age gracefully depending on theireffective utilisation of all the four capitals. They shouldlearn new ways to build community, find spiritual andcultural interests and continue to render services even it islimited. Habitus has the potential to influence our actionsand to construct our social world as well as being influencedby the external. By modifying their identity constructions,they can mould their identities to support successful,positive ageing. Society is the essential counterpart forattaining the purpose. Support for the efforts of agedwomen in this direction can be pragmatically achieved byrestructuring age identities through inclusive age-friendly- gender-friendly initiatives done by governmental, non -governmental and community level programs.
Conclusion
Around the globe, the fastest-growing population group isthe group of people over 60 years of age. It is estimatedthat by 2050, one in six people will be over the age of 65.This demands the need that ageism is to be urgently tackledat every level possible, whether it is at the global, nationalor community level.
Describing the need for a global strategy and action planon ageing and health, WHO recognises that it is the needof the hour. We cannot move blindfolded towards thefuture in an ageing population. With some of the rapidlyageing low- and middle-income countries, promotinghealthy ageing and building systems to meet the needs of
older adults will be sound investments in a future whereolder people have the freedom to be and do what they value.(WHO, May 2016)
Creating environments that are truly age-friendly requiresaction in many sectors: health, long-term care, transport,housing, labour, social protection, information andcommunication, and by many actors – government, serviceproviders, civil society, and older people and theirorganisations, families and friends. The study suggests thatcombating ageism, enabling autonomy, supporting healthyageing and age-inclusive policies at all levels are certainkey approaches that are relevant to all stakeholders.
References
Akundy, Anand (2004). Anthropology of Aging: Contexts,Culture and Implications. New Delhi. SerialsPublications.
Bourdieu, P. (1984). Distinction: A Social Critique of theJudgement of Taste. London, Routledge.
Bourdieu, P. (1986). ‘The Forms of Capital’. Handbook ofTheory and Research for the Sociology of Capital. J.G. Richardson. New York, Greenwood Press: 241-58.
Humphries, Jane (1991). The Sexual Division of Labourand Social Control – An Interpretation Volume: 23issue: 3-4, page(s): 269-296. Issuepublished: September 1, 1991. Sage Journals.
Jaiprakash, Indira (2001). On being old and female: someissues on quality of life of elderly women in India.New Delhi. Rawat publications.
Karuppiah, C. (2002), “Health Problems and Health Needsof the Aged in the Villages of Tamil Nadu”, inTharabhai L., (ed)., Aging: Indian Perspectives, 159-176, New Delhi: Decent Books.
Patel, V., Kleinman A., (2003). Poverty and common mentaldisorders in developing countries. Bulletin of theWorld Health Organization, 81:609–615. 23. WorldHealth Report.
Prakash, I. J. (1997). Women and Ageing. Indian Journalof Medical Research. Oct;106:396-408.
WHO (2002). Active Ageing: A Policy Framework (http://www.who.int/ageing/publications/active/en/index.html)
WHO (2016). Multisectoral action for a life courseapproach to healthy ageing: global strategy and planof action on ageing and health” (Document A69/17)
************

SCMS Journal of Indian Management , January-March - 2021 131
A Quarterly Journal
Co-Integration and Causality AmongStock Market Indices:
A Study of 35 Indices Across 5Continents
Abstract
This paper analyses the nature and level of interdependence of various stock markets of the world. The study explores
stock market interdependencies and dynamic interactions among selected global indices. The paper also ascertains the
degree of association between developed and emerging markets. The findings show that a considerable amount of
interdependency exists among the Indian stock market and other global stock markets. Findings suggest that there is an
association between developed and emerging markets. These results are recommended to policymakers, regulators and
researchers on the one hand and firms’ managers as well as investors. These results provide insights to investors for
portfolio diversification.
Keywords: co-integration, cross-correlation, stock markets, market efficiency, interdependence, causality,international financial markets,
Abstract
Dr. Nisarg A JoshiIndependent Academician and Researcher
National Finance Head, Agrifeed, BotswanaEmail: [email protected]
Mruga JoshiAssistant Professor
New L. J. Commerce College, Ahmedabad, IndiaEmail: [email protected]

SCMS Journal of Indian Management , January-March - 2021 132
A Quarterly Journal
1. Introduction
Global capital market integration over the last thirty yearshas been noticed through major strategic deviationsunder which international investment limits were reduced,exchange control was almost eliminated, free movementof capital, humans and technology was promoted, and thefundamental structures of most worldwide markets weretransformed. Such progress in markets can change therelationship among different markets across the globe.Market integration has been promoted throughliberalisation, which has critical implications oninvestment decisions and policies.
The stock market is connected with a sharp increase inuncertainty both in developed and emerging markets. Stockmarket behaviour analysis offers information about thefuture evolution of the stock market.
The dynamics of the progress of economy is inevitable.Nowadays, there is great attention towards the analysis oflinkages among global stock markets. Through financialintegration, native country can be linked with internationalcapital markets. Increasing regional integration of financialmarkets helps to diversify the risk. The cost of financialcontagion and crisis can be avoided by global financialopenness (Cyn & Jong, 2011).
Integration can be deliberated from different standpoints:first is the general integration process at the global level,and the second is the economic integration process. Thegeneral integration process explores the level of globalfinancial integration and its impact on economic growth.Previous studies by Lane and Milesi-Ferretti (2003),Arestis and Basu (2003) and Edison et al. (2002) concludedthat the impact of financial integration on economic growthis dependent on various factors such as financial growth,economic development, legal progress etc. The economicintegration is more critical as it focuses on the relationshipbetween the financial markets as part of economicintegration. Such integration can change the relationshipamong stock prices in various countries. Such marketintegration leads to international diversification, whichresults in better benefits to investors. Integrated marketsare likely to have a higher transmission of market turbulenceamong different countries. Few previous studies likeErrunza and Losq (1985) and Jorion and Schwartz (1986)
concluded that global capital markets were moderatelyintegrated.
The probable reason behind co-integration comes from theefficient market hypothesis (EMH). According to EMH,asset/stock prices reflect the new information arrival inthe market. The change in stock prices of one market dueto change in other stock indices is not constant. Hence, itis important to analyse the change in the stock price in onemarket due to changes in different variables in differentmarkets. The cause of co-integration among various stockindices is due to increased global market capitalisationbased on the factors like development in MNCs, advancesin technology, deregulation of financial systems, increasein capital flows due to relaxed foreign exchange policiesetc. Such movement of stock prices across the marketsleads to superior profits and better diversification whichwill lead to co-integration of stock markets globally.
According to Jorion and Schwartz (1986), lower co-integration of stock prices propels the investors to takeadvantage of diversification by investing across variousstock markets globally. Mukherjee (2007) found that theIndian stock market had very high co-integration with stockmarkets of the USA, Russia, Korea, Japan and Hong Kongdue to the ADRs and GDRs listed by the Indian companiesin these markets.
Co-integration among the stock markets can be studied tounderstand if there are any mutual factors that determinethe returns of stocks or indices or if an individual marketor stock is driven by its own fundamentals. If mutual factorsare found across markets, they are perfectly correlated witheach other over a long period of time and are found to bemore prone to contagion and ripple effects. The study ofco-integration and causality among the markets can helpto reduce such risks.
Khan (2011) explained two major reasons for co-integration in his study, namely global liberalisation ofcapital flows and a better network of communication whichmade it easier for investors to invest in global markets. Healso concluded that co-integration has also happened dueto a financially and economically integrated world whichwould result in an efficient international financial scope,and various markets would not be able to show independentbehaviour of prices. Other studies by Domowitz (1995),

SCMS Journal of Indian Management , January-March - 2021 133
A Quarterly Journal
Lee (1998), Domowitz and Steil (1999), Cybo-Ottone etal. (2000), Shy and Tarkka (2001), Hasan and Schmiedel(2004), Armanious (2007) and Nicolini (2010) confirmedthat mergers, acquisitions, strategic alliances, cross-listingand other forms of restructuring and co-operativemovements between various stock markets as well asderivatives indices could lead to co-integration to increasethe value of stock exchanges across the world. Accordingto Dorodnykh (2014), “co-integration is a complex process,and it depends on various macroeconomic, structural,cultural-geographical and operative forces, where differentstakeholders can also affect the integration decision.”
In order to obtain the variations in the degree of integrationamong markets, correlations can be used as a technique toobserve the discrepancies in the stock values over the years.A higher correlation can be implied as an increase in thedegree of integration and can have a much significanttendency that impacts in one country can be spread to others.As such, this methodology is not found to be muchinformative as the correlations can be found as a result ofshort and long-term relationships.
Co-integration is the study of a long-term relationship orco-movements between two variables in an equilibriumsetup. The co-integration relationship in stock marketsindicates the presence of a common trend that connectsthe stock markets. The presence of co-integration betweenstock markets reduces the portfolio risk diversificationopportunities since the co-integrated stock markets sharesimilar investment risks. The implications of no integrationbetween international stock markets increase the benefitsof investing in different stock markets. Therefore, theInternational investors looking out for global investmentopportunities can formulate portfolios that includesecurities of either single asset class or multiple classesbut spread in different countries’ stock markets that arenot co-integrated. Further, the non-integrated stock marketshave fewer implications of global news affecting theirdomestic stock markets. The research in stock market co-integration helps international investors, mutual fundhouses and hedge funds to look for investmentopportunities across international stock markets.
The studies on the co-integration between the stock marketshave been a vital topic in the financial literature ever sincethe works of Granger (1983) formalised the concept of
co-integration. Later studies of Granger and Weiss (1983);Engle and Granger (1987) evolved into a model to test thelinear relationships among the financial markets. Theunfavourable events in one market cause fluctuations instock prices. Due to the interlinkages with other markets,the fluctuations are spread as a Contagion to the interlinkedmarkets.
The co-integrated and interlinked stock markets can leadto a worldwide crash to begin with a particular news eventin one country (Roll, 1989). The studies of Arshanapalliand Doukas (1993), Masih and Masih (1997), and Kizysand Pierdzioch (2011), among others, have reported theinterlinkages among developed markets of USA, Japan andEurope. The interlinkages between the US, Japan and Asianmarkets were evidenced by Arshanapalli et al. (1995),Anoruo et al. (2003), Asgharian et al. (2013), among others.Further, these studies attributed the decline in the stockindices after the United States stock market crash ofOctober 1987, the Asian Financial Crisis of 1997 and theGlobal Financial Crisis of 2008 to co-integration andinterlinkages of stock markets.
Normally, the long-term equilibrium relationship isspecified by a bivariate co-integration relationship. In sucha relationship, the deviation from the equilibriumrelationship is found to be stationary with a mean value ofzero. It can be interpreted into an application that can beassessed as a combination of two non-stationary series,which itself is stationary. According to Engle and Granger(1987), such bivariate series is considered to be co-integrated.
Such bivariate relationships can be expanded to amultivariate relationship. In such relationships, a deviationin the price factors from the long-term relationship can becreated from a grouping of all the time series. Though itlooks like a complicated structure, the concept remainsthe same. Multivariate co-integration is a long-termrelationship among the non-stationary time series, andthere is a combination of non-stationary time series, whichis stationary. In such a situation, a bivariate relationshipcan lead to inappropriate results and inference.
It has been observed that co-integration is expected to befound more in larger systems than smaller ones, which canbe explained as representing the broader association among

SCMS Journal of Indian Management , January-March - 2021 134
A Quarterly Journal
international stock markets, and these markets areintegrated to a greater extent. A change in the degree of co-integration among the factors/variables can explain the long-term relationship among global stock markets. This can beachieved through the comparison of the co-integrationrelationship over various sub-sample periods. In this study,the multivariate approach of co-integration is adopted toinvestigate the co-integration of multiple countries.
2. Literature Review
There had been a number of studies done by variousresearchers over the years emphasising differentparameters of co-integration such as risk, return, volatility,prices etc.
Corchy Rad and Urbain (1995) studied the relationshipamong various stock markets by applying the Grangercausality test for the period of 1981 to 1991 and foundthat there was no co-integration among these stockmarkets. Darrat, Elkhal and Hakim (2000) studied aboutthe integration of emerging stock markets in the MiddleEast. Modelling techniques such as co-integration and errorcorrection were associated with the international stockmarkets, and the stock prices in each country have beenequalised by the arbitrage force. They found manydifferences between the trading patterns, which haveespecially been marked in regard to the market integrationat a national level. Macroeconomic shocks throughout theeconomy have affected the capital markets at theinternational level. Free-flowing information and capitalacross international borders are some of the levels whichhave characterised the foreign market integrationeffectively.
Schleicher (2001) observed co-integration between theEastern European Market and the Western EuropeanMarket. The study had used a VAR model with multivariateGARCH and concluded that Eastern markets were moreinfluenced by the Western markets.
According to Brooks and Negro (2002), the internationalequity market has a low degree of correlation returns acrossthe stock markets at a national level. Emerging stockmarkets have constituted only the data with a small fraction.They pointed out that the stock market has been consideredas the benchmark portfolio in most of the cases. Theyemphasised on the regional perspectives of internationalstock markets and market integration.
Click and Plummer (2003), Majid et al. (2009) and Phuanet al. (2009) studied about the stock market integration inASEAN after the financial catastrophe and found that theco-integration of five ASEAN markets have not beencompleted in an economic sense. Serwa and Subramanian(2008) studied the relationship among five stock exchangesin East Asia. He used co-integration test and Grangercausality test to study the relationship and concluded thatthese stock exchanges were co-integrated anddiversification across various markets can be beneficial inthe short-term but not in the long-term.
Mukherjee and Mishra (2005) observed long-term co-integration among the Indian stock market and other Asianstock markets.
A study done by Guidi (2010) has shown contradictoryresults that there was no co-integration found in the Indianstock market and Asian stock markets. The study revealedthat the long-term benefits of investing in India are verylimited. Another study done by Chittedi (2010) observedthe relationship between developed countries stock marketsand the Indian stock market and found that these marketswere not co-integrated. He used the Granger causality testand found a uni-directional relationship between the Indianstock market, US market and Japan, whereas the UK andAustralia were found to have no causality. Nath and Verma(2003) found that there is no co-integration among threeSouth Asian stock markets, i.e. India, Taiwan and Singapore.
Thalassinos and Thalassinos (2006) studied the integrationanalysis of the stock market and analysed that there weresignificant changes in the market integration degree amongvarious stock markets using different econometrictechniques. The EMU establishment has affected theEuropean stock market integration highly when comparedto others. They also concluded that there has been asignificant relationship between the dependence ofbilateral import and the degree of stock market integration.
Alagidede (2008) studied the African stock marketintegration with implications for portfolio diversificationand international risk sharing. Integration of stock marketshas tended to be more efficient when compared to thesegmented markets. Co-integrating vector numbers haverevealed the integration extent across stock markets.Geographical proximity has not clearly dealt with the

SCMS Journal of Indian Management , January-March - 2021 135
A Quarterly Journal
African stock markets. Further, they suggested that theefforts at integrating African stock markets have remainedfutile to date.
Tirkkonen (2008) studied the stock and bond marketintegration with evidence from Russian financial markets.Long-run relationships testing with the autoregressivemodel (VAR) has played an important role in the Russianstock market integration.
Wang and Moore (2008) studied the stock marketintegration for the transition economies by using time-varying conditional correlation. They found a very highlevel of correlation after entering to the European Union.Financial market integration has seemed to be a largelyself-fuelling process, and it also has a dependence on thedevelopment of the financial sector at the existing levels.
Chen and Shen (2009) studied the co-integration amongstock markets of U.K., U.S.A., Japan and Germany Marketsby using Granger causality and co-integration test and foundthe integration among markets. Chancharat (2009) studiedstock market integration by using econometric techniquessuch as the Co-integration test, factor analysis and GARCHmodels, which are found to be useful to investigate therelationship among the economic variables and the stockmarket integration. These techniques also have the tendencyto examine whether the international stock markets havethe capability to move together in the context of the stockmarket integration.
Erdogen (2009) concluded that co-integrated stockmarkets have created greater chances for global investorsby discarding country-specific risks. It was found that co-integrated markets reduce the capital cost, which helps thegrowth of an economy. Co-integrated markets have thecapability to intensify the sector effects and nullify countryeffects. Co-integration among developing stock marketsin Asia was studied by Raju and Khanapuri (2009), and theyfound the existence of a high degree of co-integrationamong the markets used in the sample.
Baumöhl and Výrost (2010) analysed co-integration usingthe Granger causality test with respect to non-synchronoustrading effects. They used classical mean-variancemethodology and concluded that there was no significantlead-lag relationship of stock market integration in the pre
and post-crisis period. Karagöz and Ergun (2010) observedmarket co-integration among Balkan countries and foundthat economic and financial integration has helped to reducethe political risk and to promote the stability of theeconomy and local markets size. Yeoh et al. (2010) studiedco-integration between Malaysia and Singapore stockmarkets. They concluded that the Malaysian stock marketwas having a higher degree of co-integration.
Babecký et al. (2012) studied co-integration betweenChinese and Russian stock markets by using beta-convergence and sigma-convergence approaches. Bhuniaand Das (2012) studied about the financial marketintegration from India and selected south Asian countries.The global crisis of finance has focused more attention onthe linkages among the Asian countries stock market.Authors have predicted that the stock index of the Indianstock market has not co-integrated with the developedmarkets. Indian stock market has integrated with the maturemarkets effectively.
Birau and Trivedi (2013) studied stock market co-integration and contagion of emerging markets with respectto the global financial crisis. The financial systemturbulence resulted in the heavy reduction on the stockmarket around the world. Joshi (2013) examined the co-integration among BRIC’s stock indices and concluded thatIndia had a long-term equilibrium relationship with Russiaand China but not with Brazil.
Park (2013) studied co-integration among Asian stockmarkets and found that there was an increased correlationbetween the movement of assets prices, and the degree ofstock market co-integration was enhanced over time fromone market to another. Mohamed (2014) investigated theexistence of co-integration among GCC stock markets.Most of the GCC stock markets are relatively small, closedto foreign investors, which also have led to the blockingof inflows of foreign portfolio investment effectively.
Patel (2014) proposed a study regarding the co-integrationof Indian and selected Asian stock markets. This studyexamined the Indian stock market independence with otherequity markets of Asia like Sri Lanka, Pakistan, Korea,Japan, Malaysia, China, Singapore and Taiwan. The studyconcluded that all Asian stock indices are first differencestationary, and there is an existence of long-term

SCMS Journal of Indian Management , January-March - 2021 136
A Quarterly Journal
equilibrium relationship among Asian markets. It found thatthe stock market of India is influenced by stock indices ofChina, Sri Lanka, Singapore and Japan. The majorsuggestion derived is that the government of India mustsupervise the Asian equity markets movements very closelybecause a crisis in any country of Asia may influence theIndian stock market performance.
Seth and Sharma (2015) studied the co-integration amongthe Asian and US markets by applying the Granger causalitytest, Johnsen co-integration test and found the existenceof short term and long term co-integration among themarket. Mitra and Bhattacharjee (2015) found a co-integration of BSE with other markets.
Bhattacharjee and Swaminathan (2016) studied the stockmarket integration of India and few selected countries andfound that co-integration of the Indian market with otherindices have improved over the years due to liberalisation,and during the recession, the Indian market was moreresponsive to Asian markets.
Everaert and Pozzi (2016) studied co-integration among19 European stock markets for a period from 1970 to 2015by using a panel of monthly stock market returns. Theydeveloped a model of dynamic factor, which decomposesequity risk premium into a country risk factor of Europewith stochastic volatilities and time-varying factorloadings. This model was evaluated using Bayesian MCMC(Markov Chain Monte Carlo) methods. The studyconcluded that there was an existence of co-integration infew developed European countries from the late 1980s toearly 1990s, but also neither euro area membership norEuropean Union has developed the integration of the stockmarket. Shahzad, Kanwal, Ahmed and Rehman, (2016)studied co-integration among the stock markets applyingARDL and found the existence of co-integration amongthe markets.
Patel (2017) explored the co-integration among 14 stockmarkets. The correlation analysis showed that BSEremained somewhat positively correlated. Results of theJohansen co-integration test concluded that there was along-run relationship among selected stock markets.
Kiviet and Chen (2018) reviewed the literature on theanalysis of co-integration between the price indices of
stocks or their realised returns at various markets andregistered frequently recurring methodologicaldeficiencies such as omitted regressor problems,neglecting to verify agreement of estimation outcomes withadopted model assumptions, employing particularstatistical tests in inappropriate situations and, occasionallyand lack of identification.
Nautiyal and Kavidayal (2018) examined cross-countryreturns and co-integration of 11 stock indices of developedand developing countries by using VECM and found thatthere was a slow but significant price adjustment and stockmarket co-integration was found.
3. Data and Methodology
3.1 Data Sources
This study included closing values of daily prices of variousindices from January 2005 to December 2018, which werecollected from the respective websites of the stockexchanges. The stock market behaviour and the extent ofco-integration were investigated among 35 stock indicesfrom 5 continents (Africa, America, Asia, Europe andAustralia) in the world. The major stock indices of the Asianmarkets (SENSEX, HSI, JAKARTA, KLSE, KOSPI,NIKKEI 225, NZSE50, SHANGHAI, STRAITS, TAIWANand NIFTY), stock indices of European markets (AEX, ATX,BEL20, BIST100, CAC40, DAX, FTSE100, IBEX, OMX,OSE ALL SHARE, RTSI, SMI and STOXX50), index AORDfrom the Australian market and stock indices of theAmerican market (DJIA, GSPC, IBOVESPA, IPC,MERVAL, NASDAQ, NYSE and S&P TSX) were selectedfor this study.
3.2 Methodology and Hypothesis
This study involved a two-stage methodology. In the firstpart, normality, stationarity and causality of the time serieswere tested using statistical techniques like Jarque-BeraStatistic, ADF Test and Granger Causality Test, respectively.The hypothesis statements were developed for each testas follows.
H0
1: Stock indices prices are normally distributed.
H0 2: A Unit Root is present in the stock indices prices.
(Dickey & Fuller, (1979 & 1981))

SCMS Journal of Indian Management , January-March - 2021 137
A Quarterly Journal
H0
3: x(t) doesn’t Granger-cause y(t). (There is no causalrelationship between stock indices)
In the second part of the methodology, the focus was givento analyse the stock markets interdependencies, toascertain the degree of association and to measure themarket efficiency using various techniques like Johansen’sCointegration test, Cross-Correlation test and HurstExponent. Johansen’s Cointegration test was used with twoapproaches, i.e. trace test and eigenvalue test.
H0 4: The number of co-integration vectors is r = r* < k.
(Null Hypothesis for trace test as well as eigenvalue test)
H0 5: Cross-correlation is not significantly different fromzero.
H0 6: Stock price variations are independent.
4. Analysis and Results
4.1 Descriptive Statistics
The descriptive statistics of the variables under study areshown below, which include mean, median, maximum-minimum values, standard deviation, JB statistic, skewnessand kurtosis. These figures are taken from the original data,daily prices and include annotations from 2005 to 2018.
Table 1: Descriptive Statistics of sample indices

SCMS Journal of Indian Management , January-March - 2021 138
A Quarterly Journal
The descriptive statistics show that mean returns of mostof the indices in the sample were positive though it wasfound that the mean daily return of the JALSH index washighest (0.2) among all the indices followed by theMERVAL index, whereas the average daily return of OSEindex was lowest (-0.02) among all. The fact that theemerging markets are more volatile is evident fromstatistics on the standard deviation of daily returns in thesemarkets. In general, the developed market returns are lessvolatile with a standard deviation lesser than the emergingmarkets. The South African market, though, provides thehighest magnitude of maximum daily returns, along with amaximum standard deviation of 5.5, followed by Russia(2.25) and India (1.52). The Developed markets exhibit highvolatility in US DJIA (4.71), and the least volatility in thedeveloped market sample is exhibited by the AustralianMarket (1.08).
Skewness values of emerging markets like Russia and Chinaexhibit an asymmetrical distribution with a long tail to theleft, while India situation is near to zero exhibiting onlyasymmetrical distribution. In developed markets, the USstock market exhibits symmetric distribution around theaverage value. While other developed markets like the UK,Japan and Singapore exhibits left-skewed distribution. Allthe Kurtosis values of the stock markets investigated inthis study display a value of more than three, showing aleptokurtic curve, which demonstrates that the distributionof stock returns in these countries contain extreme values.The values of Kurtosis accompanied by those of Jarque-Berra statistic clearly indicate that the returns ofdeveloping markets are not normally distributed. Thesefindings are consistent with Harvey (1995) and Bekaert etal. (1998). Under large departure from normality, the mean-variance criterion given by Markowitz (1952) can lead tothe application of wrong portfolio weights (Jondeau andRockinger, 2005). For risk-averse investors, the use of sub-optimal mean-variance criterion in portfolio constructioncan result in substantial opportunity cost. The non-normality of returns in emerging markets, therefore,compels the international investors to use distinct andtypical models for determining expected returns ofportfolios comprising emerging-market assets.
4.2 Examining Stationary of Variables
In order to check the co-integration, a requirement is tocheck that all factors are non-stationary. The ADF test wasused to determine that the variables are stationary or not.AIC was used to find out that the optimal lag structure forconducting the test.
The ADF test was performed for each of the indices in thesample included. The findings of the ADF test are shownin Table 1. As can be seen from Table 1, that the p-value isless than 1% for all the variables at the 1st difference level.It was found that all the stock indices prices are non-stationary at the original level, and they are stationary atthe 1st difference.
4.3 Test for Causality
Granger causality test was performed to examine the causalrelationship among these markets. Since co-integration—at any level—exists, the Granger causality testing isappropriate for bilateral pairs of markets. As Granger(1988) pointed out, if two variables are co-integrated,causality must exist at least uni-directional.
The Granger causality test was conducted by dividing thedata into three sub-periods (Period 1: 2005 – 2009; Period2: 2010 – 2014; Period 3: 2015 – 2018). For most of theindices, the causality remained the same during all sub-periods. But in the case of some indices, the causality wasfound during one sub-period (either bi-directional or uni-directional) with an index but was not found in another sub-period. In a couple of cases, it also happened that for onesub-period, causality between two indices was uni-directional, for another sub-period, it was bi-directional,and for the third sub-period, there was no causality betweenthose two indices. This led to a very interesting change oftrends during short-term Granger causality results. Theseresults for each of the sub-period are shown in the tablebelow. In the last column of the table, the results show bi-directional or uni-directional causality of an index withother indices for the long-term, i.e. for the entire durationof the study. These long-term results are the combinationof all short-term results, which include the bi-directionaland uni-directional causality of an index with other indices,which were found in all three sub-periods as mentionedbelow. For instance, for bi-directional causality, the ATXindex causes 12 indices during 2005-2009, 13 indicesduring 2010-2014 and 11 indices during 2015-2018. Outof these indices, ATX causes 11 indices during all threesub-periods, which is cited as long-term causality.
From the causality analysis, it can be inferred that there isan existence of bi-directional causality. Among 35 indices,AEX index causes 14 indices, AORD causes 9 indices, ATXcauses 11 indices, Bel20 causes 11 indices, CAC40 causes11 indices, DAX causes 8 indices, DJIA causes 3 indices,FTSE100 causes 12 indices, GSPC S&P500 causes 14indices, HIS causes 9 indices, IBEX causes 8 indices,

SCMS Journal of Indian Management , January-March - 2021 139
A Quarterly Journal
IBOVESPA causes 5 indices, IPC causes 9 indices, Jakartacauses 8 indices, JALSH causes 1 index, KLSE causes 12indices, KOSPI causes 12 indices, Merval causes 8 indices,Nasdaq causes 13 indices, Nifty causes 12 indices,Nikkei225 causes 6 indices, NYSE causes 13 indices,NZSE50 causes 4 indices, OMX causes 4 indices, OSEcauses 23 indices, RTSI causes 11 indices, S&P TSX causes24 indices, Sensex causes 10 indices, Shanghai cause 1index, SMI causes 9 indices, Stoxx50 causes 10 indices,Straits causes 12 indices, Taiwan causes 8 indices, and TelAviv causes 21 indices.
As far as uni-directional causality is concerned, AEX causes15 indices, AORD causes 5 indices, ATX causes 11 indices,BEL20 causes 18 indices, BIST 100 causes 2 indices,
CAC40 causes 15 indices, DAX causes 23 indices, DJIAcauses 9 indices, FTSE causes 13 indices, GSPC S&P500causes 14 indices, HIS causes 5 indices, IBEX causes 15indices, IBOVESPA causes 22 indices, IPC causes 19indices, Jakarta causes 7 indices, JLSH causes 8 indices,KLSE doesn’t cause any indices in one way, KOSPI causes3 indices, Merval causes 16 indices, Nasdaq causes 15indices, Nifty causes 7 indices, Nikkei225 causes 1 index,NYSE causes 15 indices, NZSE50 doesn’t cause any indicesin one way, OMX causes 15 indices, OSE causes 4 indices,RTSI causes 9 indices, S&P TSX causes 3 indices, Sensexcauses 7 indices, Shanghai causes 5 indices, SMI causes24 indices, Stoxx50 causes 14 indices, Straits causes 4indices, Taiwan causes 1 index, and Tel Aviv causes 5indices.
Table 2: Results Showing Bi-directional and Uni-directional Causality

SCMS Journal of Indian Management , January-March - 2021 140
A Quarterly Journal

SCMS Journal of Indian Management , January-March - 2021 141
A Quarterly Journal

SCMS Journal of Indian Management , January-March - 2021 142
A Quarterly Journal
4.4 Co-integration Test
The Johansen (1988, 1991, 1995) efficient maximumlikelihood test was used to examine the existence of a long-term relationship among indices. A model of the Johansenprocedure was used: the one with a linear trend in leveland intercept in the co-integrating equations (CE). Thisversion was found to be more appropriate to our data sincewe have trending series with stochastic trends. The testwas performed using a formulation of a VAR model withlag length determined according to AIC and Akaike’s FinalPrediction Error (FPE). Determination of co-integrationrank (r) depends on the values of eigenvalue and tracestatistics.
Maximum likelihood estimators of the co-integratingvectors for an autoregressive process were derived byJohansen (1988) and Johansen and Juselius (1990) byconsidering the following equation.
(1)
VAR model can be estimated at the first level difference,i.e. 1(1), a majority of time series variables are non-stationary at level 1(0). The above-mentioned equation (1)of Johansen and Juselius (1990) can be represented byintroducing a first level difference operator as follows:
Matrix can be used to trace co-integration. The first leveldifference, i.e. 1(1), might be preferred when all Xt valuesare found to have unit roots which can be determined if p xp matrix has rank 0.
The Johansen co-integration test was performed for theset of 35 stock exchanges to investigate the integration ofthese markets as a group. Analysis using the multiple
equations was based on a VAR model, which is requiredbefore constructing a related VECM system. The VARmodel of order 2, which was chosen according to AIC,contains a 5x1 vector that contains logarithms of the shareprice index of the five markets. The multivariate approachexamined the existence of a co-integrating vector in thestochastic matrix and a sequence of hypotheses test usingmaximum likelihood methods, establishing the greatestpossible number of vectors within the system. In this study,the null hypotheses assumed for each row of numbers: zeroand at most one co-integrating equations. The alternativehypothesis states one, co-integrating equations,respectively, for each row. As long as trace statistics exceedcritical values at 5 or 1 percent, the alternative hypothesiswas accepted (the null hypothesis was rejected).
Table 3 shown co-integration between the SENSEX andother indices. At r=o, the trace statistic was higher thanthe critical value at 5 percent; therefore, the null hypothesisof no co-integration was rejected. The result implied thatthere was at most one co-integrating equation between thetwo variables. The findings of the co-integration test ofBSE and WALSH were consistent with the finding of thecorrelation analysis, which determined that the relationshipbetween movements in the two stock markets was stronglypositive. Positive co-integration was compatible with theconcept of stock market integration, which assumed asimilarity in securities offerings and the ability of investorsfrom each market to hold investments in all securities.
As illustrated in Table 3, trace statistics and Eigenvaluestatistics indicated one co-integrating vector at the 5percent significance level among the markets. Since thetrace statistic exceeds the 5 percent critical value, it ispossible to reject the null hypothesis of no co-integratingvectors, indicating that there are one or more co-integratingequations.
(2)

SCMS Journal of Indian Management , January-March - 2021 143
A Quarterly Journal
Table 3: Results of Co-integration Test for All Indices

SCMS Journal of Indian Management , January-March - 2021 144
A Quarterly Journal
4.5 Cross-Correlation and Serial Correlation
Correlation is one of the simplest but most widely usedtools used by portfolio managers in making asset allocationdecisions. The correlation analysis revolves around the
measure of strength or degree of linear associationbetween two variables. Correlation structure across stockmarkets returns gives a preliminary idea of stock marketlinkages. Stock markets sharing high correlation

SCMS Journal of Indian Management , January-March - 2021 145
A Quarterly Journal
coefficients can be interpreted as those having significantlinkages. On the other hand, low correlation reflects theseparation property of stock markets and, therefore, theexistence of an opportunity to diversify risk. Further,markets in the common region are more correlated becausethese markets are more prone to get influenced by theirregional news and developments and also because ofreasons such as trade and economic ties. The correlationstructure of emerging and developed markets has beenexamined to detect preliminary evidence on potentialdiversification benefits in the region.
One of the procedural issues to be handled in the contextof the log return correlation matrix in the table is theexistence of timing difference or difference in tradinghours between emerging stock markets and selectdeveloped stock markets, especially for the US stockmarket. Remaining all the markets taken in the sampleinteract within a single day of each other because all theemerging markets under study operate in the same timezone. On account of this, the contemporaneous correlationamong the US market and the selected markets is not ofmuch importance. Therefore, the correlation matrix isderived, taking into account the one day lagged returns forthe US market. The same approach is followed forsubsequent analysis of return data throughout the study.
The examination of the correlation structure of log returnsfrom Table 4, 5 and 6 gives the following importantfindings:
The emerging markets exhibit mixed correlationcoefficients with each other and also with select developedstock markets. At the same time, it can be observed that ingeneral, however, the emerging equity markets share lowcorrelation coefficients (less than 0.50) during the wholesample period. The Russian stock market exhibits highcorrelation coefficients with developed stock markets suchas Japan as well as the UK and USA, positive correlationswith both India and China, and having a negative correlationwith Singapore. In an emerging market context, both Indiaand China stock markets are having a relatively low degreeof correlation coefficients with other counterparts.
The Indian stock market exhibits significant correlationcoefficients with Singapore and with the Japanese stockmarkets. The lowest correlation coefficients with respect
to the Indian stock market is with Germany’s (European)stock market, and India does not share a negative correlationwith any index. Chinese stock market exhibit negativecorrelation coefficients with respect to US and Europeanstock markets. This indicates that the Chinese market isby far the most isolated market in the region, which furtheris an indication of potential diversification benefits. Thedeveloped US stock market has a positive correlationcoefficient with emerging market Russia followed by Indiaand China.
Sensex and Nifty Index are positively correlated with allthe indices. Sensex is highly correlated with other stockmarket indices, i.e. STRAITS (0.562) and HIS (0.536). Itindicates that Sensex, BIST100, SMI and DAX indicesfollowing the same trend. There is a low positive correlationexisting between Sensex and BIST100, SMI and DAX.
The below table is representing the test result of cross –Correlation between Developing Countries and DevelopedCountries. In this table, all the sample countries’ stockreturns are compared with the US stock return. In thesecross-correlation tests, the results data is significant at 1%levels.
In the case of developed countries, Germany cross-correlation test results, most of the values of the lags arepositive, which shows the positive association of Germanystock return with the USA stock return. It is clear that theGermany stock returns and the US stock returns movetogether. We can say that the Germany stock return isdependent on the US stock return. In the case of the UK,cross-correlation test results, 7 lags values are positiveout of 11, which shows the positive association of the UKstock market with the USA stock market. It is clear thatthe UK stock market and US stock market move together.We can say that the UK stock market is dependent on theUS stock market.
The cross-correlation results of Japan and Canada showthat there are mostly negative lags values that show anegative association with the US stock return. We can saythat Japan and Canada stock markets are not dependent onthe US stock market. The cross-correlation results ofFrance and Italy show that there are mostly positive lagsvalues that show a positive correlation with US stock return.It is clear that France and Italy stock markets move withthe US stock market.

SCMS Journal of Indian Management , January-March - 2021 146
A Quarterly Journal
In the case of developing countries, the cross-correlationresults of India and Malaysia show that there are mostlypositive lags values that show a positive correlation withUS stock return. It is clear that the Bangladesh and Malaysiastock market is related to the US stock market. In the caseof Turkey, the cross-correlation test clearly shows that the
Turkey stock market was not associated with the US stockmarket. The Egypt stock return, Pakistan stock return, andthe Indonesia stock return show that there are many negativelags values that show a negative association with US stockreturn. The findings and inference of the cross-correlationare shown in the table below.
Table 4: Findings and Inference of High Correlation of Indices
Highly Correlated :>0.50
Bel20 FTSE100
CAC40 FTSE100 and Bel20
IBEX FTSE100, Bel20 and CAC40
S&P TSX FTSE100
NASDAQ FTSE100, Bel20, CAC40, IBEX and S&P TSX
OMX FTSE100, BEL20, CAC40, IBEX
HIS AORD and STRAITS
NIFTY50 STRAITS and HIS
IBOVESPA FTSE100, Bel20, CAC40, S&P TSX, Nasdaq, NYSE and OMX
ATX FTSE100, Bel20, CAC40, IBEX, NYSE and OMX
KOSPI AORD, STRAITS and HIS
OSE FTSE100, CAC40, OMX and ATX
Sensex STRAITS, HIS and Nifty50
Nikkei225 AORD, STRAITS, HIS and KOSPI
GSPC S&P500 FTSE100, BEL20, CAC40, S&PTSX, NASDAQ, NYSE, OMX and IBOVESPA
IPC FTSE100, BEL20, CAC40, S&P TSX, NASDAQ, NYSE, OMX, IBOVESPA and S&P500
AEX FTSE100, BEL20, CAC40, IBEX, NASDAQ, NYSE, OMX, IBOVESPA, S&P500, ATX, OSE and IPC
RTSI Russia FTSE100, BEL20, CAC40, OMX, ATX and AEX
Merval Nasdaq, NYSE, IBOVESPA, S&P500 and IPC
JLSH DJIA
STOXX50 FTSE100, BEL20, CAC40, IBEX, NASDAQ, NYSE, OMX, IBOVESPA, S&P500, ATX, IPC, AEX, RTSI RUSSIA
TAIWAN AORD, STRAITS, HIS, KOSPI and NIKKEI225
NZSE50 AORD

SCMS Journal of Indian Management , January-March - 2021 147
A Quarterly Journal
Table 5: Findings and Inference for High Degree of Anti-correlation
Table 6: Findings and Inference for Low Degree of Anti-correlation
To examine if there is a problem of serial correlation, theDurbin Watson statistics of the model is 2.141974, whichinfers that there is no problem of serial correlation.Regression is spurious if the residual of the regression isauto-correlated, i.e. they are not stationary at level.Autocorrelation among residuals is checked using acorrelogram of residuals and unit root test; estimates ofQ-statistics are statistically insignificant for all 36 lags.This means the null hypothesis of no autocorrelation cannotbe rejected, i.e. confirming the non-spurious regressionmodel.
Stationary estimates (using ADF-Test) of residual showsthat the residuals of the estimated function are stationaryat the I(0) order of integration. Thus if the variable isintegrated of the same order and the linear combinationamong them is stationary, indicating the presence of co-
integration. This finding implies the existence of a long-run equilibrium relationship among the variables. In thiscase, OLS estimation is consistent, and there is no problemof spurious regression and t, as well as F statistics, arevalid.
4.6 Hurst Exponent Analysis
There is a basic assumption in theories of quantitativefinance that the changes in stock prices are independent.Such changes can be exhibited using Brownian motion. Forthis purpose, Hurst exponent analysis is used as a test forindependence in time series data. Hurst exponent value of0.5 explains that the time series is independent. Butpredetermined Brownian motion data will give a value ofHurst exponent, which can be higher or lower than 0.5.Such values can be wrongly inferred as evidence of long-term memory in the case of the absence of a proper test.
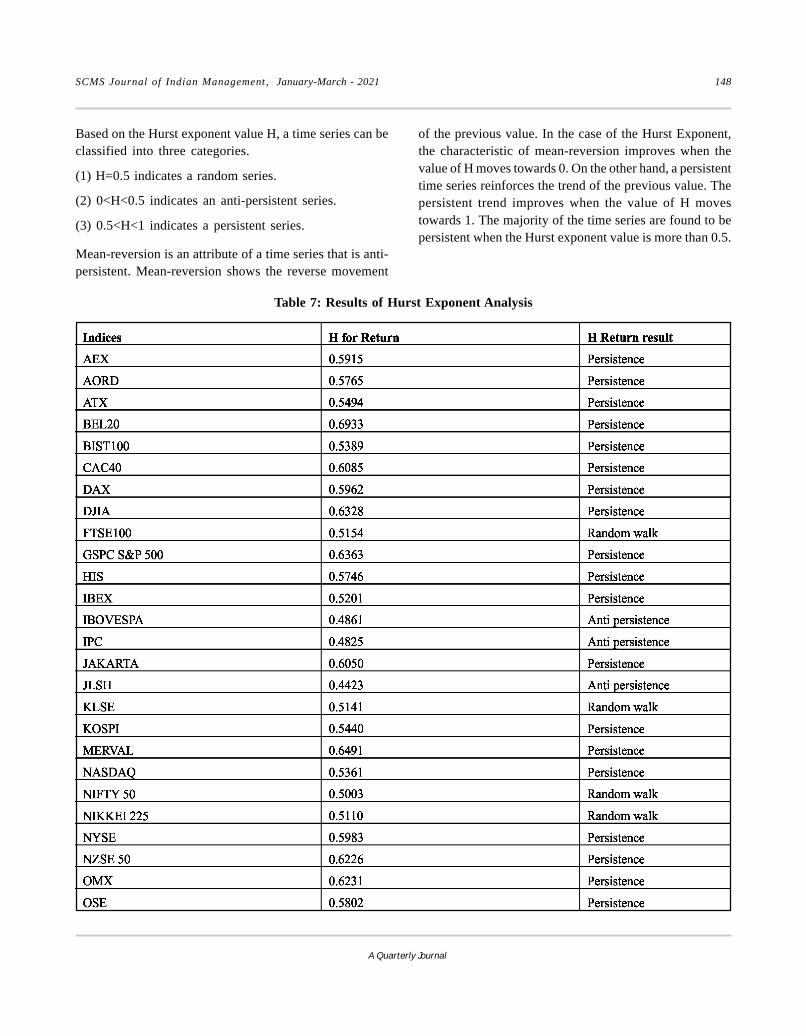
SCMS Journal of Indian Management , January-March - 2021 148
A Quarterly Journal
Based on the Hurst exponent value H, a time series can beclassified into three categories.
(1) H=0.5 indicates a random series.
(2) 0<H<0.5 indicates an anti-persistent series.
(3) 0.5<H<1 indicates a persistent series.
Mean-reversion is an attribute of a time series that is anti-persistent. Mean-reversion shows the reverse movement
Table 7: Results of Hurst Exponent Analysis
of the previous value. In the case of the Hurst Exponent,the characteristic of mean-reversion improves when thevalue of H moves towards 0. On the other hand, a persistenttime series reinforces the trend of the previous value. Thepersistent trend improves when the value of H movestowards 1. The majority of the time series are found to bepersistent when the Hurst exponent value is more than 0.5.

SCMS Journal of Indian Management , January-March - 2021 149
A Quarterly Journal
It can be found that out of a total of 35 indices in thesample, 25 indices follow persistence trend, 6 indicesfollow a random trend, and the remaining 4 indices followan anti-persistence trend. In a persistent time-series, anincrease in values will most likely be followed by anincrease in the short term, and a decrease in values willmost likely be followed by another decrease in the shortterm. A random trend means there is no correlationbetween observations and future observations. Series ofthis kind are very difficult to predict. In the anti-persistencetrend, an increase will most likely be followed by a decreaseand vice versa. This means that future values have a tendencyto return to a long-term mean.
5. Conclusion
The study has analysed the co-integration among 35 stockindices across the globe. This study explored the stockmarket interdependencies and dynamic interactions usingthe co-integration test and found that co-integration existsbetween the Indian Stock Market (Sensex) and otherindices. As the trace statistic was higher than the criticalvalue at 5 percent; therefore, the null hypothesis of no co-integration was rejected. The result implied that there wasat most one co-integrating equation between the twovariables.
A Co-integration test was performed for the set of 35 stockexchanges to investigate the integration of these marketsas a group using multiple equations based on a VAR model.Trace statistics indicated at least one co-integrating vectorat the 5 percent significance level among the markets.
This study also ascertained the degree of associationbetween developed and emerging markets. Cross-correlation was used to ascertain the association and foundthat out of 35 indices, there were 23 indices that werehighly correlated with one or more indices. There were 5indices that had a high degree of anti-correlation, and 8indices had a low degree of anti-correlation. The findingsof the correlation analysis determined that the relationshipbetween movements in the two stock markets was stronglypositive.
This study also found bi-directional as well as uni-directional causality among the stock market indices. TheHurst Exponent analysis found that out of the total of 35indices in the sample, 25 indices follow the persistencetrend, 6 indices follow the random trend, and the remaining4 indices follow the anti-persistence trend.
5.1 Research Implications
This study contributes in the following ways. First, co-integration can be considered companionable to theperception of integration of financial markets. This acceptshomogeneity in investment avenues, and the stakeholdersacross different markets will be able to make investmentsin a wide range of securities.
The co-integration among the stock indices show thatenhanced profits from international diversification arepossible as the returns from various stock markets are notperfectly correlated. Based on the correlation results,institutional and foreign investors can take advantage of

SCMS Journal of Indian Management , January-March - 2021 150
A Quarterly Journal
the diversification benefits from the markets that have aweak correlation. Therefore, the investors who diversifytheir portfolio across various countries can improve theportfolio’s expected return without increasing the risk ofthe portfolio. FIIs and individual investors can use this studyto understand the correlation structure and interdependenceof the global stock indices for better and effectiveportfolio diversification.
Further, these results are recommended to policymakers,regulators and researchers on the one hand and firms’managers as well as investors on the other. FIIs, HNIs,individual, institutional, and public investors can makedecisions regarding their investments based on co-integration among the markets, which may be of short aswell as long-run. These results provide insights to theinvestors for portfolio diversification which can helpreduce the systematic risk of the portfolio.
5.2 Limitations of the Study
This study is constructed on the secondary data of stockmarket indices which included daily closing prices. Thisstudy does not involve the weekly or monthly prices, whichcan be used for further analysis, such as seasonality in stockindices.
One of the procedural issues to be handled in the contextof the log return correlation matrix is the existence oftiming difference or difference in trading hours betweenemerging stock markets and select developed stockmarkets, especially for the US stock market. Anotherlimitation of the study is that it does not cover event-specific co-integration.
5.3 Scope for Further Research
The study has further scope of research. The dependencyof each market to other markets can be studied using theRegression analysis. The analysis of dependency can helpin taking the investment in a better way. The effect ofvolatility among markets can also be analysed.
References
Alagidede, P. (2008). “African Stock MarketIntegration: Implications for PortfolioDiversification and International Risk Sharing.”Proceedings of the African EconomicConferences. Tunis.
Anoruo, E, Ramchander, S and Thiewes, H. (2003). “Returndynamics across the Asian equity markets.”Managerial Finance, 29 (4), 1-23.
Arestis, P. and Basu, S. (2003). “Financial Globalisationand Regulation.” Levy Economics Institute WorkingPaper No. 397.
Armanious, A.N.R. (2007), “Globalisation effect on stockexchange integration”. Paper presented at Meetingof Young Researchers Around the Mediterranean,Tarragona, May 3-4, http://dx.doi.org/10.2139/ssrn.1929045
Arshanapalli, B and Doukas, J. (1993). “International stockmarket linkages: Evidence from the pre and post-October 1987 period.” Journal of Banking &Finance, 17 (1), 193-208. https://doi.org/10.1016/0378-4266(93)90088-U
Arshanapalli, B., Doukas, J. and Lang, L.H.P. (1995). “Pre-and post-October 1987 stock market linkages betweenUS and Asian markets.” Pacific Basin FinanceJournal, 3 (1), pp. 57-73.
Asgharian, H., Hess, W. and Liu, L. (2013). “A spatialanalysis of international stock market linkages”,Journal of Banking & Finance, 37 (12), 4738-4754.
Babecký, J. Komarek, L. and Komárková, Z. (2013).“Convergence of Returns on Chinese and RussianStock Markets with World Markets: National andSectoral Perspectives.” National Institute EconomicReview, 223, 16-34.
Baumöhl, E. and Výrost, T. (2010) “Stock MarketIntegration: Granger Causality Testing with Respectto Non-synchronous Trading Effects.” Finance aUver: Czech Journal of Economics and Finance, 60(5), 414–425.
Bekaert, G., Erb, C.B., Harvey, C.R., and Viskanta, T.E.(1998). “Distributional characteristics of emergingmarket returns and asset allocation.” Journal ofPortfolio Manager, Winter,102–116.
Bhattacharjee S. and Swaminathan A. M. (2016). “StockMarket Integration of India with Rest of the World:An Empirical Study.” Indian Journal of Finance. 10(5),22-32. DOI: 10.17010/ijf/2016/v10i5/92934

SCMS Journal of Indian Management , January-March - 2021 151
A Quarterly Journal
Bhunia, A. and Das, A. (2012). “Financial MarketIntegration: Empirical Evidence from India and SelectSouth Asian Countries.” Afro Asian Journal of SocialSciences, 3 (3/1).
Birau, R. and Trivedi, J. (2013). “Emerging stock marketintegration and contagion in the context of globalfinancial crisis.” International Journal ofMathematical Models and Methods in AppliedSciences, 7, 828-836.
Brooks. R. and Del Negro, M. (2002a). “The Rise in Co-movement across National Stock Markets: MarketIntegration or IT Bubble?” Federal Reserve Bank ofAtlanta Working Paper 2002-17a.
Brooks. R. and Del Negro, M. (2002b). “International StockReturns and Market Integration: A RegionalPerspective.” International Monetary Fund WorkingPaper 02/202.
Brooks. R. and Del Negro, M. (2002c). “InternationalDiversification Strategies.” Federal Reserve Bank ofAtlanta Working Paper 2002-23.
Chancharat, S. (2009). “Stock market Integration – AnOverview.” NIDA Economic Review, 4 (2), 23-35.DOI: 10.14456/der.2009.1
Chen, S. and Shen, C. (2009). “Can the nonlinear presentvalue model explain the movement of stock prices”International Research Journal of Finance andEconomics, 23 (23), 155-170.
Chittedi, K. (2010). “Global Stock Markets Developmentand Integration: with Special Reference to BRICCountries.” International Review of AppliedFinancial Issues & Economics, 2 (1), 18-36.
Click, R. and Plummer, M. (2005). “Stock marketintegration in ASEAN after the Asian financial crisis.”Journal of Asian Economics, 16, 5-28.
Cybo-Ottone, A., Di Noia, C. and Murgia, M. (2000),“Recent developments in the structure of securitiesmarkets”. Brookings-Wharton Papers on FinancialServices.
Cyn-Young P. and Jong-Wha L. (2011). “FinancialIntegration in Emerging Asia: Challenges andProspects.” Asian Development Bank
Dickey, D.A. and Fuller, W. A. (1981). “Likelihood ratiostatistics for autoregressive time series with a unitroot.” Econometrica, 49, 1057-1072. DOI: 10.2307/1912517
Dickey, D.A. and Fuller, W.A. (1979). “Distribution of theestimators for autoregressive time series with a unitroot” Journal of the American StatisticalAssociation, 74 (366a), 427-431. DOI: 10.2307/2286348
Domowitz, I. (1995). “Electronic derivatives exchanges:implicit mergers, network externalities andstandardisation”. The Quarterly Review of Economicsand Finance, 35(2). 163-175.
Domowitz, I. and Steil, B. (1999). “Automation, tradingcosts, and the structure of the trading servicesindustry”. Brookings-Wharton Papers on FinancialServices.
Dorodnykh E. (2014). “Determinants of stock exchangeintegration: evidence in worldwide perspective”.Journal of Economic Studies, 41(2). 292 - 316. http://dx.doi.org/10.1108/JES-08-2012-0111
Edison, H.J., Levine, R., Ricci, L.A., and Slok, T., (2002).“International Financial Integration and EconomicGrowth.” International Monetary Fund Working Paper,02/145.
Engle, R., and Granger, C. (1987). “Co-Integration and ErrorCorrection: Representation, Estimation, and Testing.”Econometrica, 55 (2), 251-276. DOI: 10.2307/1913236
Errunza, V. R., and Losq, E., (1985). “International assetpricing under mild segmentation: Theory and Test.”Journal of Finance, 40 (1), 105–124.
Everaert, G. and Pozzi L. (2016), “Time-varying stockmarket integration and institutions in Europe: aBayesian dynamic factor analysis.” Working paper.
Granger C. (1983). “Co-Integrated Variables and Error-Correcting Models.” unpublished UCSD DiscussionPaper, 83-13.

SCMS Journal of Indian Management , January-March - 2021 152
A Quarterly Journal
Granger, C. and Weiss, A. (1983). Time Series Analysis ofError-Correcting Models. In: S. Karlin, T. Amemiya,and L. Goodman, (Eds.), Studies in Econometrics, TimeSeries, and Multivariate Statistics, (pp. 255-278)Academic Press, New York.
Granger, C. W. J. (1988). “Causality, co-integration, andcontrol.” Journal of Economic Dynamics andControl. 12 (2-3), 551–559. doi:10.1016/0165-1889(88)90055-3
Guidi, F. (2010) “Co-integration relationship and timevarying co-movements among Indian and Asiandeveloped stock markets”. Munich Personal RePEcArchive, No. 19853. https://mpra.ub.uni-muenchen.de/19853/
Harvey, C.R. (1995). “Predictable risk and returns inemerging markets.” Review of Financial Studies, 8(3), 773–816. http://www.jstor.org/fcgi-bin/jstor/listjournal.fcg/08939454
Hasan, I. and Schmiedel, H. (2004), “Networks and equitymarket integration: European evidence”. InternationalReview of Financial Analysis, (13), 601-619.
Johansen S. (1988). “Statistical Analysis of CointegrationVectors.” Journal of Economic Dynamics andControl, 12 (2-3), 231–254. https://doi.org/10.1016/0165-1889(88)90041-3.
Johansen S. (1991). “Estimation and Hypothesis Testingof Cointegration Vectors in Gaussian VectorAutoregressive Models,” Econometrica, 59 (6), 1551–1580. DOI: 10.2307/2938278 https://www.jstor.org/stable/2938278
Johansen, S. (1995). Likelihood-Based Inference inCointegrated Vector Autoregressive Models, OUPCatalogue, Oxford University Press.
Johansen, S., and Juselius K. (1990). “MaximumLikelihood Estimation and Inference on Cointegrationwith Application to the Demand for Money,” OxfordBulletin of Economics and Statistics, 52 (2), 169-210. https://doi.org/10.1111/j.1468-0084.1990.mp52002003.x
Jondeau, E., and Rockinger, M., (2005). “Conditional assetallocation under non-normality: How costly is theMean-Variance criterion.” HEC Lausanne. FAMEResearch Paper Series, rp132
Jorion, P. and Schwartz, E. (1986). “Integration versussegmentation in the Canadian stock market.” Journalof Finance, 41, 603-613.
Joshi S. S. (2013). “Correlation and Co-integration of BRICCountries’ Stock Markets.” Indian Journal ofFinance, 7 (4,) 42-48.
Karagöz, K. and Ergun, S. (2010). “Stock MarketIntegration among Balkan Countries.” MIBESManagement of International Business andEconomics Systems Transactions, 4 (1), 49 – 59.
Khan T. A. (2011). “Cointegration of International StockMarkets: An Investigation of DiversificationOpportunities”. Undergraduate Economic Review,8(1), 1-50.
Kiviet, J. and Chen, Z. (2018). “A critical appraisal ofstudies analysing co-movement of international stockmarkets.” Annals of Economics and Finance, 19 (2),151-196.
Kizys, R. and Pierdzioch, C. (2011). “Changes in theInternational Co-movement of Stock Returns andAsymmetric Macroeconomic Shocks.” Journal ofInternational Financial Markets, Institutions, andMoney, 19, 289"305
Lane, P.R. and Milesi-Ferretti, G.M. (2003). “InternationalFinancial Integration, Staff Papers”. 50, 82-113,International Monetary Fund.
Lee, R. (1998). “What is an Exchange? The AutomationManagement and Regulation of Financial Markets”.Oxford University Press, New York, NY.
Majid, M., Meera, A., Omar, M., and Aziz, H. (2009).“Dynamic linkages among ASEAN-5 emerging stockmarkets.” International Journal of EmergingMarkets, 4 (2), 160-184.

SCMS Journal of Indian Management , January-March - 2021 153
A Quarterly Journal
Markowitz, H. (1952). “Portfolio selection.” The journalof finance, 7 (1), 77-91. https://doi.org/10.1111/j.1540-6261.1952.tb01525.x
Masih, A., and Masih, R. (1997). “On the temporal causalrelationship between energy consumption, realincome, and prices: Some new evidence from Asian-energy dependent NICs Based on a multivariate co-integration/vector error correction approach.” Journalof Policy Modelling, 19 (4), 417-440.
Mitra, A. and Bhattacharjee, K. (2015). “FinancialInterdependence of International Stock Markets: ALiterature Review.” Indian Journal of Finance, 9 (5),2 0 - 3 3 . D O I : h t t p : / / d x . d o i . o r g / 1 0 . 1 7 0 1 0 /ijf%2F2015%2Fv9i5%2F71447
Mukherjee, D. (2007). “Comparative Analysis of IndianStock with International Market”, Great Lakes Herald,1 (1), 39-71.
Nath, G. and Verma, S. (2003). “Study of commonstochastic trend and co-integration in the emergingmarkets: A case study of India, Singapore and Taiwan”(NSE Research Paper No. 72). Mumbai, India: NationalStock Exchange.
Nautiyal N. and Kavidayal P. C. (2018). “A VECM Approachto Explain Dynamic Alliance Between Stock Markets.”Indian Journal of Finance. 12 (11), 49-64.DOI: http://dx.doi.org/10.17010/ijf%2F2018%2Fv12i11%2F138203
Nicolini, G. (2010), “L’integrazione dell’exchange industryEuropea”, EIF-e book.
Park, J. W., (2013). “Co-movement of Asian stock marketsand the U.S. influence.” Global Economy and FinanceJournal, 3, 76-88.
Patel, R. (2017). “Co-Movement and Integration AmongStock Markets: A Study of 14 Countries.” IndianJournal of Finance. 11 (9), 53-66 DOI: http://dx.doi.org/10.17010/ijf%2F2017%2Fv11i9%2F118089
Patel, S. (2014). “Causal and Co-Integration Analysis ofIndian and Selected Asian Stock Markets” Drishtikon:A Management Journal, 5 (1), 37-52.
Phuan, S. Lim, K. and Ooi, A. (2009). “FinancialLiberalization and Stock Markets Integration forAsean-5 Countries.” International BusinessResearch, 2 (1), 100–111.
Raju, A. and Khanapuri, H. (2009). “Regional Integrationof Emerging Stock Markets in Asia: Implications forInternational Investors.” The Journal of Investing, 18,31-39.
Schleicher, M. (2001). “The Co-movements of StockMarkets in Hungary, Poland and the Czech Republic.”International Journal of Finance & Economics, 6,27-39.
Seth, N. and Sharma, A. (2015). “International stock marketefficiency and integration: evidences from Asian andUS markets.” Journal of Advances in ManagementResearch, 12 (2), 88-106.
Shahzad, J., Kanwal, M., Rehman, M. and Ahmad, T. (2016).“Relationship between developed, European and SouthAsian stock markets: a multivariate analysis.” SouthAsian Journal of Global Business Research. 5 (3),385-402. doi.org/10.1108/SAJGBR-01-2015-0002
Shy, O. and Tarkka, J. (2001), “Stock exchange alliances,access fees and competition”. Bank of FinlandWorking Paper No. 22/2001.
Subramanian, U. (2008). “Cointegration of Stock Marketsof East Asia.” European Journal of Economics,Finance and Administrative Sciences, 14, 84-92.
Tirkkonen, V. (2008). Stock and bond market integration:Evidence from Russian financial markets, (Master’sThesis), Lappeenranta University of Technology.
Wang, P. and Moore, T. (2008). “Stock Market Integrationfor the Transition Economies: Time-varyingConditional Correlation Approach.” ManchesterSchool, 76 (1), 116-133. https://doi.org/10.1111/j.1467-9957.2008.01083.x
Yeoh, B., Hooy, C. and Arsad Z. (2010). “Time-varying worldintegration of the Malaysian stock market: A Kalmanfilter approach.” Asian Academy of ManagementJournal of Accounting and Finance, 6 (2), 1-17.
************
Aims and Scope
The SCMS Journal of Indian Management is a blind peer-reviewed Journal. The Journal deems it its mission to submit to the readers fresh fruit of management thoughts and rich cream of current innovative research. The format of the Journal is designed reader-friendly. The academia and the corporates have an easy access to the Journal.
The Journal looks for articles conceptually sound, at once methodologically rigorous. The Journal loves to deal knowledge in management theory and practice individually and in unison. We wish our effort would bear fruit. We hope the Journal will have a long life in the shelves catering to the needs of b-students and b-faculty.
· Proposals for articles that demonstrate clear and bold thinking, fresh and useful ideas, accessible and jargon-free expression, and
unambiguous authority are invited. The following may be noted while articles are prepared.
· What is the central message of the article you propose to write? Moreover, what is new, useful, counterintuitive, or important about
your idea?
· What are the real-world implications of the proposed article? Can the central message be applied in businesses today, and if so,
how?
· Who is the audience for your article? Why should a busy manager stop and read it?
· What kind of research have you conducted to support the argument or logic in your article?
· What academic, professional, or personal experience will you draw on to make the argument convincing? In other words, what is
the source of your authority?
· The manuscript of reasonable length shall be sent to the Editor—SCMS Journal of India Management (Both for postal and
electronic submission details are given here under).
The manuscript should accompany the following separately:· An abstract (about 100 words), a brief biographical sketch of above 100 words for authors describing designation, affiliation,
specialization, number of books and articles published in the referee journals, membership on editorial boards and companies etc.
· The declaration to the effect that the work is original and it has not been published earlier shall be sent.
· Tables, charts and graphs should be typed in separate sheets. They should be numbered as Table 1, Graph 1 etc.
· References used should be listed at the end of the text.
· Editors reserve the right to modify and improve the manuscripts to meet the Journal’s standards of presentation and style.
· Editors have full right to accept or reject an article for publication. Editorial decisions will be communicated with in a period of
four weeks of the receipt of the manuscripts.
· All footnotes will be appended at the end of the article as a separate page. The type script should use smaller size fonts.
·
·
An Author/Co-author shall submit only one article at a time for consideration of publication in the Journal. The author/co-author can send another article only on hearing from the editor whether it is accepted / rejected.
The author getting one article published in the Journal has to wait for two years to get another published
Submit the manuscript to:[email protected]
The submission must be in the form of an attachment with a covering letter to be sent as e-mail.
SCMS JOURNAL OF INDIAN MANAGEMENTSCMS New Campus, Prathap Nagar
Muttom, Aluva-683 106, Kochi, Kerala, India Ph: 91-484-262 3803 / 262 3804 / 262 3885 / 262 3887 Fax: 91-484-262 3855
E-mail: [email protected] Website: www.scms.edu.in/journal
A Quarterly Journal
154SCMS Journal of Indian Management, January-March - 2021

The Journal abides by the The Best Practices Guidelines of COPE (COMMITTEE ON PUBLICATION ETHICS) for Editors, Authors, and Peer Reviewers.
SCMS JOURNAL OF INDIAN MANAGEMENT
Ethical Guidelines for AuthorsThe Author shall present an accurate and complete account of the research performed. The corresponding author must have obtained the approval of all other authors for each submission. Ghost authors are not permitted. The material in the submission shall be original. The material based on prior work, including that of the same author/s shall be properly attributed by proper citation. The author shall have the obligation to notify the editor immediately should any one of the statements in this list ceases to be true.
Ethical Guidelines for Peer ReviewersThe Peer reviewer shall review manuscripts for which they have the subject expertise required to carry out a proper assessment. Peer reviewers shall respect the confidentiality of peer review and shall not reveal any details of the manuscript under review and of its review. Peer reviewers shall be objective and constructive in their reviews.
Ethical Guidelines for the EditorThe Editor shall actively seek the views of authors, readers, reviewers, and editorial board members about ways of improving the journal's success. The Editor shall support initiatives designed to reduce academic misconduct. The Editor shall support initiatives to educate researchers about publication ethics. The Editor shall provide clear advice to reviewers. The Editor shall require reviewers to disclose any potential competing interests before agreeing to review a submission. The Editor shall encourage reviewers to comment on ethical questions and possible research misconduct raised by submissions.
© SCMS Journal of Indian Management, SCMS New Campus, Prathap Nagar, Muttom, Aluva-683106, Kochi, Kerala, India
Ph: 91-484-262 3803 / 262 3804 / 262 3885 / 262 3887 Fax: 91-484-262 3855, Website: www.scms.edu.inE-mail: [email protected] Journal Website : www.scms.edu.in/journal
All rights reserved. No part of this publication may be reproduced in any form without the written consent of the publisher. School of Communication and Management Studies and SCMS Journal of Indian Management assume no responsibility for the views expressed or information furnished by the authors. Edited and published by the Editor for and on behalf of SCMS and printed at Maptho Printings, Cochin-683104.
SCMS New Campus, Prathap Nagar Muttom, Aluva-683 106, Kochi, Kerala, India
Ph: 91-484-262 3803 / 262 3804 / 262 3885 / 262 3887 Fax: 91-484-262 3855 E-mail: [email protected]
Website: www.scms.edu.in/journal
A Quarterly Journal
155SCMS Journal of Indian Management, January-March - 2021

DD in favour of SCMS payable at Cochin
Subscription Rates1 Year 2 Years Per Issue
2000 ($100) 3600 ($150) 500 ($30)
A Quarterly Journal
156
Mail the bank transfer details and mailing address to [email protected]
SCMS Journal of Indian Management, January-March - 2021


Registration Number
SCMS COCHIN SCHOOL OF BUSINESS
: KERENG/2009/32718
For information, please visit our website <www.scms. edu.in>
PRATHAP NAGAR, MUTTOM, ALWAYE, COCHIN-683106, KERALA, Ph: 0484 - 2623803/04, 2623885/87, Fax: 0484-2623855Email: [email protected], Website: <www.scmsgroup.org>
Journal Website: <www.scms.edu.in/journal>
♦ Recognized as equivalent to MBA by theAssociation of Indian Universities (AIU).
♦ Centrally air-conditioned world-class campus, anexcellent team of 56 full time faculty, well-stockedlibrary, full-fledged computer centre, superiorteaching aids etc.
♦ Academic tie-ups with Foreign Universities to givethe programme global focus and innovation. Ninefaculty members from the universities of USA,Australia & Switzerland teaching full course at SCMS.
♦ Dewang Mehta National Award for excellence inleadership training systems
♦ Impact Marketing National Award forintegration of exceptional communication skilldevelopment system
♦ The only recipient of a grant for track record inperformance from AICTE
♦ Ranking within the first 25 B.Schools in theA++ category
♦ Only B.School which has a Universityapproved Research Centre for PhD inManagement
♦ Only B.School in India to establish a Chair forClimate Change
♦ SCMS- is nowCochin School of Business
PGDM OF SCMS COCHIN SCHOOL OF BUSINESS
ISSN-0973-3167
Edited, printed and published by Dr. Radha Thevannoor on behalf of SCMS COCHIN SCHOOL OF BUSINESS and printed at Maptho Printings, Kalamassery, Cochin-683104
and published at Muttom, Aluva-683106, Cochin.
ACCRE D I T E D
B . S C H O O L
SCMS COCHIN
-The firstaccredited, AIU recognized and ISO certified
business school inSouthern India
SCHOOL OF BUSINESS
ACBSP (US)
Cochin School of Business
one of the seven ACBSP (US) accredited B-Schools in India.
Estd. 1976
SCMS COCHIN SCHOOL OF BUSINESS