
ijrcmeas issn 2454-6593
191
IJRCMEAS ISSN 2454-6593 1 INTERNATIONAL CONFERENCE ON “FINANCIAL INCLUSION IN INDIA” B.V.V.Sangha`s BASVESHWAR ARTS, SCIENCE & COMMERCE COLLEGE Vidyagiri, Bagalkot-587102 Subject : Agriculture and Agri-Business Submitted By: Yallaling.M.Kambar 815005182 [email protected] Iranna.B.Kumbar 8880041389 [email protected] Pradeep.N.Dodamani 8197734143 [email protected] ABSTRACT Agriculture is described as the backbone of Indian economy. Agriculture has special significance for low income, poor and vulnerable sections of rural society. So we are plan to investing for agriculture the purpose of investing is that to generate the capital in the form of infrastructure, improvement in quality of natural resources and assets, and creation of productive assets for promoting long run growth and improving efficiency in production and marketing. The main goal of National Agricultural Policy to achieve growth rate higher than four percent seems to be formidable task particularly when we look at historical rate of growth in Indian agriculture.
-
Upload
khangminh22 -
Category
Documents
-
view
2 -
download
0
Transcript of ijrcmeas issn 2454-6593

IJRCMEAS ISSN 2454-6593
1
INTERNATIONAL CONFERENCE ON
“FINANCIAL INCLUSION IN INDIA”
B.V.V.Sangha`s
BASVESHWAR ARTS, SCIENCE & COMMERCE COLLEGE
Vidyagiri, Bagalkot-587102
Subject : Agriculture and Agri-Business
Submitted By:
Yallaling.M.Kambar
815005182
Iranna.B.Kumbar
8880041389
Pradeep.N.Dodamani
8197734143
ABSTRACT
Agriculture is described as the backbone of Indian economy. Agriculture has special significance for
low income, poor and vulnerable sections of rural society. So we are plan to investing for agriculture the
purpose of investing is that to generate the capital in the form of infrastructure, improvement in quality of
natural resources and assets, and creation of productive assets for promoting long run growth and improving
efficiency in production and marketing.
The main goal of National Agricultural Policy to achieve growth rate higher
than four percent seems to be formidable task particularly when we look at historical
rate of growth in Indian agriculture.

IJRCMEAS ISSN 2454-6593
2
An in depth composition and structure analysis of the agricultural export is undertaken. The study also examines
the changing dynamics of the contribution of individual group commodities in the basket of agricultural export.
And we can also know that the remedies to improve the agricultural activities in India. And by implementing
those suggestions we can get best agricultural results and we can earn more income by agriculture and from this
the Indian GDP also increases.
AGRICULTURE AND AGRI BUSINESS
Introduction:
India is known as the land of agriculturists. We can know this from our ancients. Before
independence the agriculture was started in India. We can know this by seeing history of India. How means
when Wasko-di-gama came to India he saw that different types of samba products are sold in Indian markets.
By this we can understand that already India started agricultural activities. Before and after the independence
agriculture become most power full activity in India. Hence agriculture is described as the backbone of Indian
economy. Most of the Indians are depended on agriculture only. And most of the land in India is used for
agriculture. In India most of the village or rural people are depend on agriculture and India has plenty of
villages. So hence agriculture become backbone of the Indian economy. Agriculture has special significance for

IJRCMEAS ISSN 2454-6593
3
low income, poor and vulnerable sections of rural society. Because of these reasons agriculture is at the core of
socio economic development and progress of Indian society, and proper policy for agriculture sector is crucial to
improve living standards and to improvewelfare of masses.
Growthprospects:
Agricultural growth is essential for growth of Indian economy. This growth rate is also a sort of essential
condition for improving living standard of those who are dependent on agriculture. Past growth experience of
Indian agriculture can be seen from Table 1. After the independence the leaders of our nation concentrated on
agriculture because most of the people in India are depended on agriculture only. Our first Prime Minister
Mr.Jawaharlal Neharu started five year planning programme. In the first five year planning they concentrated
more on agriculture. After end of this first five year plan the agriculture became more strong and efficient. The
main goal of National Agricultural Policy to achieve growth rate higher than four percent. As can be seen from
Table 1 long run growth rate in Indian agriculture in the post Independence period is found to be 2.55 percent
per annum. expansion in irrigation and in area under cultivation. Out of these three sources of output growth the
scope for expansion of cultivated area is much more limited in future compared to that experienced in the past.
Net cultivated area (NCA)
has become constant at 142 million hectares (Table 2) and unless serious efforts are launched to bring
wastelands under cultivation there would be no scope to expand NCA. However cultivated area as such can be
expanded by raising more number of crops on the same piece of land i.e. by raising crop intensity. This
expansion depends heavily on provision of irrigation.
Table 1: Growth rates in GDP and value of output of agriculture and its sub sectors at
1993-94 prices
GDP Value of Output
Period
Agri. & Agriculture Crop Live Fruit & Non horti.
allied Fishing sector stock vegetable crops
Decade -wise growth
rates
1950-51 to 1959-60 2.71 2.93 5.79 3.06 1.42 0.56 3.44
1960-61 to 1969-70 1.51 1.2 4.00 1.70 0.41 5.82 1.09
1970-71 to 1979-80 1.74 1.94 2.90 1.79 3.92 2.88 1.55
1980/81 to 1989-90 2.95 3.13 5.82 2.47 4.99 2.36 2.48
1990/91 to 1999/2000 3.23 3.28 5.46 2.99 3.82 5.97 2.26
Historic growth rate
1950-51 to 2001-02 2.55 2.66 4.31 2.65 3.12 4.00 2.39
Reforms: growth rate

IJRCMEAS ISSN 2454-6593
4
1990/91 to 1995/96 3.15 3.16 7.49 2.65 4.25 4.93 2.13
1996/97 to 2001/02 1.82 1.75 2.72 1.28 3.47 4.55 0.34
Post WTO growth rate
1990/91 to 1995/96 3.15 3.16 7.49 2.65 4.25 4.93 2.13
1 990/91 to 1996/97 3.64 3.69 7.41 3.22 4.12 5.92 2.59
1990/91 to 1997/98 3.33 3.35 6.90 2.92 3.95 5.91 2.21
1990/91 to 1998/99 3.37 3.43 5.90 3.10 3.89 6.14 2.36
1990/91 to 1999/00 3.23 3.28 5.46 2.99 3.82 5.97 2.26
1990/91 to 2000/01 2.98 3.01 5.07 2.66 3.76 5.88 1.84
1990/91 to 2001/02 2.94 2.95 4.96 2.58 3.73 5.78 1.76
Source of data: National accounts Statistics, various issues.
According to official estimates, available water resources can provide irrigation
to 140 million hectares area (Tenth Five Year Plan Vol. 2 Ch. 8) which can provide irrigation to 72 percent
of gross cropped area, assuming irrigated crop intensity to be1.36, as compared to 40 percent area under
irrigation at present. Further, productivity ofone hectare of gross irrigated area is reported to be 2.75 times the
productivity ofunirrigated area (Dhawan 1994 p. 83). A simple exercise based on this informationreveals that if
irrigation potential is fully exploited it would raise presentlevel of output by 50 percent. This further implies that
if the entire irrigation potential is exploited bythe year 2020 it would enable the country to realize annual growth
rate of the order of2.00 percent per annum for two decades. This would require decadal increment in gross
irrigated area by 31.8 million hectare, which is more than double the irrigation potential created during the
decade of 1990s. In case the pace of irrigation development ismaintained at the level of decade of 1990s,it
would help inattaining only 0.78 percentgrowth rate in output.
Institutionalstructure:
NAP advocates land reforms by focusing on consolidation of holdings, redistribution of surplus/waste land
among landless, tenancy reforms, development of lease market and recognition of women’s rights in land. Other
areas listed for policyattention are private sector participation through contract farming, assured markets for
crops especially for oilseeds, cotton and horticultural crops, increased flow of institutional credit, strengthening
and revamping of cooperative credit system.Out of these, some policy concerns like land lease market have
already been discussed at length in section 4.5 above. Land consolidation has assumed greater importance due to
large scale fragmentation of land holdings due to division of inherited property and certain other factors.
Division of land parcels into smaller pieces scattered over space has become so complex that their consolidation
by revenue authority, as witnessed during first two decades of planned development in some states, would not
help much but would leave it free to revenue officials to use their authority to show favours and disfavours. The
best way to encourage land consolidation would be to encourage mutual transfers of land by providing
incentives like complete waiving or nominal stamp duty in land transactions that lead to land consolidations.
Investment sinagriculture
The purpose of investments in agriculture is to generate capital in the form of
infrastructure, improvement in quality of natural resources and assets, and creation of
productive assets for promoting long run growth and improving efficiency in
production and marketing. This investment in any sector comes from two sources viz.
public and private. While public investment is meant mainly to create infrastructure,
private investment is used mainly for assets formation and for improvement in quality
of existing assets. Traditional agriculture and agriculture in underdeveloped countries is
generally starved of investment resources because private capital is deterred by the risk
involved in agriculture (Schultz, 1964) and institutional investment has also been
meagre (Shonfield, 1960). Therefore, special efforts and attention are required to direct
and induce public and private investments in agriculture in underdeveloped countries.
In the recent years there has been renewed interest in public and private
investments in Indian agriculture. This has been induced by serious concern for secular
decline in public investments in Indian agriculture, which began in the early 1980s.
This adverse trend did not reverse even during 1990s (Table 6 and Fig. 1 and 2). GFCF

IJRCMEAS ISSN 2454-6593
5
in the public sector showed some improvement during mid 1990s but again declined
during late 1990s. GFCF public sector as percent of GDP agriculture has declined to
1.56 percent compared to more than two percent during early 1990s . This shows that
infrastructure development for agriculture sector failed not only to keep pace with
growth of the sector but lagged far behind the growth in the sector. There is some
comfort that like the decade of 1980s decline in public investments did not cause
decline in private investment even during 1990s.
GROWTH AND COMPOSITION OF INDIAN
AGRICULTURAL EXPORTS DURING REFORM ERA
INTRODUCTION:
Indian agriculture has greatly contributed to foreign trade even in its traditional form. Indian
Agricultural products are facing competition from Asian countries. Due to globalisation and liberalised regime,
this competition is likely to increase
further and new initiatives in agriculture development shall have to meet the emerging
challenges. The performance of agriculture after integration with the world markets is linked
to the success of exports. In its bid to increase overall exports, the government of India has
decided to achieve this objective by giving a push to production and export of agricultural
commodities. Agriculture has been a source of foreign exchange for India in the past. Most
of the export earnings of agriculture came from the conventional items such as tea, cashew
and spices.
Growth and Performance
Presently Indian agriculture sector contributes nearly 17 per cent to the Gross Domestic Product (GDP) and two
third of its population is still engaged in agriculture. The GDP from agriculture has experienced
a total growth of 69.8 per cent from 1991 -92 to 2008-09 and CAGR of 3.0 per cent from 1991-92 to 2008-09.
The trend growth rate of agricultural output in India is marginally ahead of the population growth. Therefore, it
is necessary that the growth rate of agricultural sector needs greater acceleration. The increase in the growth rate
of agricultural sector is necessary not only for food grain production but also to generate enough surpluses for
export.
The share of agricultural exports in India’s GDP (both in total GDP and GDP originated in agriculture) would
indicate three major aspects, viz, (a) The degree of openness or outwardorientation of the agricultural sector
with regard to the export activity; (b) The nature of agricultural trade strategies adopted in the country; and (c)
Supply capacity of the agricultural sector as regards exports. After a marginal rise in the shares of agricultural
exports in total GDP and in GDP originated through the agricultural sector during the seventies, both the shares

IJRCMEAS ISSN 2454-6593
6
were on the decline in the eighties. However, since the beginning
of the nineties there is a perceptible rise in these shares.
In case of share of agricultural exports in GDP originated from agriculture sector the rise was from 2.4 per cent
in 1991 -92 to 6.1 per cent in 1997-98. Later in next two years there was a decline to 5.7 per cent, thereafter, it
gradually increased from 6.4 per cent in 2000-01 to 14 per cent in 2007-08. From these observations, it can be
inferred that the degree of openness or outward orientation of the agricultural sector, with regard to exports, has
increased in recent times, albeit a marginal decline occurred in 1999-00. It reflects the effects of the
liberalisation of agricultural exports and improvement in the supply capacity of the economy in recent times.
Further the data reveals that agricultural sector is less outward-oriented than the economy as a whole. This is
evident from the share of total exports to national GDP as
against the share of agricultural export to national GDP. The share of nonagricultural commodities export in
national GDP increased from 3.3 per cent in 1991 -92, to 16.9 per cent in 2009-10, whereas the agricultural
export increased to 1.9 per cent during 18 years from 1991-92 to 2009-10. During the study period the gap
between agricultural exports and nonagricultural exports has increased. Agricultural exports experienced very
slow rise compared to the total exports. India’s exports have increased since the reforms in 1991. In the post-
reform period the annual rate of growth of exports was around 10 per cent and India’s share in world exports
increased from 0.5 per cent in the first half of the 1990s to 0.7
per cent in 2000-01. Growth of exports has significantly contributed in relatively high growth rates of GDP in
the post reform period states Balasubramanyam (2003).
Table 1. Share of Agriculture and Non-agriculture export in total Exports of India
Year Total Exports Agricultureand Percentage Percentage Ratio of
(MillionUSD) alliedproducts Share of Share of Agricultural export
Export Agricultural Nonagricultural to Nonagricultural
(Million USD) Export Export Export
1 2 3 4 5 6
1991-92 17865.4 3202.5 17.9 82.1 1:5
1992-93 18537.2 3135.8 16.9 83.1 1:5
1993-94 22238.3 4027.5 18.1 81.9 1:5
1994-95 26330.5 4226.1 16.1 83.9 1:5
1995-96 31794.9 6081.9 19.1 80.9 1:4
1996-97 33469.7 6862.7 20.5 79.5 1:4
1997-98 35006.4 6626.2 18.9 81.1 1:4
1998-99 33218.7 6034.5 18.2 81.8 1:4
1999-00 36822.4 5608 15.2 84.8 1:6
2000-01 44560.3 5973.2 13.4 86.6 1:6
2001-02 43826.7 5901.2 13.5 86.5 1:6
2002-03 52719.4 6710 12.7 87.3 1:7
2003-04 63842.6 7533.1 11.8 88.2 1:7
2004-05 83535.9 8474.7 10.1 89.9 1:9
2005-06 103090.5 10213.8 9.9 90.1 1:9
2006-07 126361.5 12683.5 10.0 90 1:9
2007-08 159006.7 19398.8 12.2 87.8 1:7
2008-09 173865.3 17774.5 10.2 89.8 1.8
2009-10 184770.0 19572.4 10.6 89.4 1.8
Source: Directorate General of Commercial Intelligence and Statistics, Government of India Table 1 shows that
the share of agricultural exports in the total exports was 17.9 per cent in 1991-92, which has increased to nearly
3 per cent by the year 1996-97, there after the share was continuously declining and it reduced to 9.9 per cent in
2006-07. Between the year 2006-07 and 2007-08 there was an increase of 2.3 per cent. With a fall in 2008-09 to
10.2 percent it has seen a growth of 0.4 per cent in 2009-10. The slow rise in agricultural export calls for the
change in strategic approach of Indian agriculture in a big way to achieve higher levels of production in crops in
which India has comparative advantage and generate surpluses for exports. The government’s commitment

IJRCMEAS ISSN 2454-6593
7
towards agriculture is seen from the ambitious 4 per cent growth target set under the Eleventh Plan. In its quest
for accelerated growth, India has to increase its agricultural growth rates of 2.0 per cent to the long term trend of
around 4 % per annum. Contribution of Indian agricultural export to the total export of India in 2009-10 stood at
9.4 per cent. There is an increase in the volume of agricultural export from 3130.08 million USD in 1991-92 to
16753.23 in 2009-10. The compound annual growth rate for these 18 years is 9.3 per cent. The commodity
group wise analysis of for the study period presented in this section reveals the actual scenario of growth of each
of the group.
Three Year Export Statement of APEDA Products
Value in Rs. Lacs
Qty In MT
2013-14 2014-15 2015-16
PRODUCT Qty Rs. Lacs Qty Rs. Lacs Qty Rs. Lacs
FLORICULTURE
Floriculture 22485.21 45590.62 22947.27 46077.23 22518.58 47942.04
Fruits & Vegetables
Seeds 17816.70 41053.76 12499.31 42703.80 10925.60 49353.68
Total 40301.91 86644.38 35446.58 88781.03 33444.18 97295.72
FRESH FRUITS & VEGETABLES
Fresh Onions 1482498.58 316961.25 1238102.60 230054.14 1201245.29 274741.05
Other Fresh
Vegetables 953731.22 229332.27 835501.20 240223.60 699600.34 211949.80
Walnuts 6726.36 32453.50 2665.85 13645.24 3291.71 11791.54
Fresh Mangoes 41279.97 28542.85 42998.33 30253.66 36329.01 31710.03
Fresh Grapes 192616.91 166647.45 107257.81 108648.99 156218.34 155131.67
Other Fresh Fruits 240552.45 102159.21 274436.09 124588.02 308261.23 153815.57
Total 2917405.49 876096.53 2500961.88 747413.65 2404945.92 839139.66
PROCESSED FRUITS AND VEGETABLES
Cucumber and
Gherkins( Prepd. &
Presvd)
218749.79 95520.18 251183.01 120242.24 202926.91 99917.20
Dried & Preserved
Vegetables 56158.38 74271.74 63701.77 84713.55 66189.61 91420.90
Mango Pulp 174860.33 77294.76 154820.66 84138.54 128866.01 79616.93
Other Processed
Fruits & Vegetables 287384.61 226660.26 316059.42 256991.89 320732.58 290033.31
Pulses 345051.38 174637.14 220914.58 120949.67 251644.32 160321.88

IJRCMEAS ISSN 2454-6593
8
Total 1082204.49 648384.08 1006679.44 667035.89 970359.43 721310.22
ANIMAL PRODUCTS
Buffalo Meat 1449758.65 2645781.59 1475526.01 2928258.19 1314158.05 2668155.51
Sheep/Goat Meat 22608.95 69411.53 23611.54 82811.34 21950.71 83775.61
Other Meat 255.23 323.43 261.92 267.17 0.10 0.25
Processed Meat 488.78 691.75 406.11 1419.71 280.92 618.18
Animal Casings 352.20 2845.84 260.15 1933.25 206.36 1702.45
Poultry Products 437673.53 56587.37 556698.81 65119.18 659304.15 76871.61
Dairy Products 159228.51 331857.40 66424.37 120539.56 33377.16 75420.27
Casein 11461.71 63692.84 8168.05 42853.42 5897.99 21594.03
Natural Honey 28378.40 44501.46 29578.56 53509.97 38177.08 70586.99
Albumin( Eggs &
Milk ) 2025.32 13163.79 2125.02 16118.53 1934.12 14982.69
Total 2112231.28 3228857.00 2163060.54 3312830.32 2075286.64 3013707.59
OTHER PROCESSED FOODS
Groundnuts 509664.84 318773.51 708386.26 467536.90 537888.26 404605.21
Guargum 601945.42 1173452.49 665177.71 947993.57 325250.71 323387.42
Jaggery &
Confectionery 266471.96 113687.91 258252.73 116181.13 292212.03 128925.82
Cocoa Products 15962.95 57078.03 20877.70 84865.67 32633.58 126699.37
Cereal Preparations 321468.07 285500.15 306328.81 303875.50 314644.59 334130.63
Milled Products 418397.99 100576.93 415984.45 101909.43 416079.29 107843.72
Alcoholic Beverages 311564.19 239357.58 264625.53 223162.15 239127.51 200513.41
Miscellaneous
Preparations 338972.77 218388.87 372998.36 243781.07 354905.14 259348.88
Total 2784448.19 2506815.47 3012631.55 2489305.42 2512741.11 1885454.46
CEREALS
Basmati Rice 3757271.42 2929995.91 3702260.07 2759789.17 4045796.25 2271843.54
Non Basmati
Rice 7133183.37 1774995.98 8274046.02 2042854.26 6366585.53 1512908.95
Wheat 5562374.74 926161.08 2924070.18 499183.94 618020.01 97859.25
Maize 3954236.61 598365.81 2825610.60 403750.82 650103.38 108989.66
Other Cereals 657700.54 115690.83 688199.92 122401.73 264974.25 51721.69
Total 21064766.68 6345209.61 18414186.79 5827979.92 11945479.42 4043323.09
Grand Total 30001358.04 13692007.07 27132966.78 13133346.23 19942256.70 10600230.74
Source: DGCIS Annual Data

IJRCMEAS ISSN 2454-6593
9
Analysis of the composition of agricultural export of India
On the basis of analysis of structure and composition of agricultural exports of India can be
broadly divided into the following categories. These categories are based on generis species.
These categories include;
1. Cereals and cereal preparation
2. Fresh and processed vegetables
3. Fresh and processed Fruits
4. Pulses
5. Floriculture products
6. Tea and coffee
7. Spices
8. Tobacco
9. Cotton
10. Marine products
11. Meat and meat preparations
12. Poultry & dairy products
13. Oil cakes, oil and oil seeds, and
14. Sugar and molasses
Conclusion
Now days most of the people are moving towards the different jobs and they are neglecting the agricultural
activities. So the government should concentrate on this by giving some advantages like as follows
1. Providing good quality of seeds
2. Providing best quality of fertilizers
3. Good marketing facility
4. Fixed price for different products
5. Giving credit facility to farmers with low rate of interest
6. Good infrastructure facility
7. Avoiding the work of middlemen

IJRCMEAS ISSN 2454-6593
10
8. Encouraging the youth to move towards agricultural activities
9. Proper education to farmers about the new technologies adopting in modern agriculture
By implementing the above points we can improve our agriculture and agriculture business in a better way.
REFERENCES:
Chand Ramesh(2001)
Hanumantha Rao CH(2000)
Joshi S. N.(1996)
Agriculture APEDA
Information By:
Mr.Shripad Vishweshwar
M.Sc (Agril. Economics)
Assistant Professor Of Agril. Economics
Directorate of Research university of
Horticultural Sciences, Udyanagiri, Bagalkot.
e-mail:[email protected]
GREEN MARKETING
A perceptual study of the impact of green practices
(In Hubli-Dhārwad Region)
VITTAL BHAT
Research scholar , lecturer, Department of Commerce, KLE’S J G College of Commerce, Hubli
email: [email protected] cell:9916298921
B.S. PATIL Assistant professor, Department of Commerce, KLE’S J G College of Commerce, Hubli
V.S. KATTIMATH Assistant professor , Department of Commerce, KLE’S J G College of Commerce, Hubli
Email: [email protected] Cell:981448158
ABSTRACT
Environmentally safe products with international standards are the main objectives of green marketing. It has
developed its own importance in the modern market. In the modern and competitive world it has turned around
on us as our priority to keep our ecology safe. This concept has developed manufacturing, packing and
marketing of products which already aware of such guidelines. It has opened up way out for companies to co-
brand their product. In the emerging world the concept of pollution free activity is given more importance in
all most all areas and stages. Especially The independent directors and environmental experts are targeting
the industrial sectors as the major contributors for depleting natural resources and environmental destruction.
Hence, manufacturing, packing and marketing departments of industries are stressed more to take priority care
in these areas along with satisfying the market needs.
To overcome these challenges a new concept has born in the present globalized world where production,
consumption and also marketing of the products can be carried effectively ensuring environmental safety.
This concept is named as ‘Green Marketing’. Awareness about the destruction of natural resources has
raised the issue of environmental protection which in turn has created eco-friendly consumption called
‘green consumerism’. Strategic business houses have accepted green marketing as a part of their strategy.
Many multinational corporations in diversified strategic business units now successfully
implemented green marketing practices. Various studies by environmentalists, experts indicate that people
are concerned about the environment and are changing their behavioral pa t tern. The most of the
consumers, both individual and industrial, are becoming more concerned about eco-friendly products.
Majority of them feel that environment-friendly products are safe for consumption. As a result, green
marketing has emerged, which aims at marketing of sustainable and socially-responsible products and
services. Today is the era of recyclable, non-toxic and environment-friendly goods. This has become the
new slogan for industries to satisfy the needs of consumers and earn better profits.
It is an attempt to understand awareness of consumers towards green marketing,

IJRCMEAS ISSN 2454-6593
11
environmentally safe, nontoxic products and brands along with exploring the values of going green.
KEY WORDS: Green marketing, environmentally safe, nontoxic products and brands.
INTRODUCTION
Green Marketing is the marketing of products that are presumed to be environmentally safe. Thus green
marketing incorporates a broad range of activities, including product modification, changes to the production
process, packaging changes, as well as modifying advertising. Yet defining green marketing is not a simple task
where several meanings intersect and contradict each other, an example of this will be the existence of varying
social, environmental and retail definitions attached to this term. Other similar terms used are Environmental
Marketing and Ecological Marketing. Thus "Green Marketing" refers to holistic marketing concept wherein the
production, marketing consumption an disposal of products and services happen in a manner that is less
detrimental to the environment with growing awareness about the implications of global warming, non-
biodegradable solid waste, harmful impact of pollutants etc., both marketers and consumers are becoming
increasingly sensitive to the need for switch in to green products and services. While the shift to "green" may
appear to be expensive in the short term, it will definitely prove to be indispensable and advantageous, cost-wise
too, in the long run.
According to the American Marketing Association, The marketing of products that are
presumed to be environmentally safe are considered as green products. The development and marketing of
products designed to minimize negative effects on the physical environment or to improve its quality. The effort
by organization to produce, promote, package and reclaim products in a manner that is sensitive or responsive to
ecological concerns. Green marketing emphasizes environmental stewardship.
Alma T. Mintu and Hector R. Lozada define green marketing as "the application of marketing tools to facilitate
exchanges that satisfy organizational and individual goals in such a way that the preservation, protection and
conservation of the physical environment are upheld." Walter Codington defines environmental marketing as
"marketing activities that recognize environmental stewardship as a business development responsibility and
business growth responsibility." Others have focused more on strategic dimensions in defining green marketing;
for example, Martin Charter defines it as "a holistic and responsible strategic management process that
identifies, anticipates, and satisfies and fulfills stakeholder needs for a reasonable reward that does not adversely
affect human or natural environmental well-being.
Environmental sustainability
involves developing strategies that sustain the environment and produce profits for the company. It protect and
preserve the environment .(Armstrong and Kotler, 2007, pp. 509-510).
A green consumer
someone who voluntarily engages in consumer practices that are regarded as environmentally friendly.
Peattie (2001, p. 187-191)
Green or environmentally friendly activities energy-efficient operations, better pollution controls and
recycled materials.(Armstrong and Kotler, 2007).
Eco labels
labels which identify overall environmental preference of a product or service within a specific product or
service range.
Depletion of ozone layer and global warming are the main issues for the healthy survival. Environmentalist
and Green marketing leaders have also suggested that, in order to avoid accusations of marketing green wash
and ensure that the principles of green marketing are meaningfully applied to every level of a company’s
operations, businesses should consider the nature of their involvement with suppliers, franchisees and other
partners, as well as potentially pursuing new relationships with NGOs, regulatory bodies and educators.

IJRCMEAS ISSN 2454-6593
12
• Customer requirements: Ultimately, the relationship with the consumer, and the company’s ability to
fulfill customers’ needs without compromising on fundamentals such as profit, is one of the cornerstones
of doing business.
• Environmental considerations: These may at times directly clash with customer requirements, which is
one of the greatest challenges of green marketing. More often though, it will be possible to find a middle
way between environmental concerns and customer needs – and indeed, there are times when consumers
will be positively attracted by the green marketing credentials of a company.
OBJECTIVES OF THE STUDY
• To study the consumer awareness on green marketing concept.
• Consumer attitude towards green products.
NEED FOR GOING GREEN
With the rising concerns of global warming, people are becoming more and more aware of the dangers that
will arise if they don’t take the needs of mother earth into consideration. People are looking for
environmentally friendly products that are good for the environment and their personal health. Corporations
turn to green washing to make business houses look more environmentally friendly so that they can keep their
customers coming back. If corporations were up front with their environmental wrongdoings, customers
would most likely take their business elsewhere.
RESEARCH METHODOLOGY
Researcher has used structured interview schedules and five point balance scale for measuring consumer
attitude towards green marketing. Primary data was collected from local respondents in Hubli-Dhārwad city
region through a questionnaire designed for sample of 200 respondents. Duo to limitation of time factor
random sampling method was adopted by the researcher and selected the sample.
LITERATURE REVIEW
Green marketing, also alternatively known as environmental marketing and sustainable marketing, refers to an
organization's efforts at designing, promoting, pricing and distributing products that will not harm the
environment. (Pride and Ferrell 1993)
Green marketing activities designed to generate and facilitate any exchanges intended to satisfy human needs
or wants, such that the satisfaction of these needs and wants occurs, with minimal detrimental impact on the
natural environment. (Polonsky 1994)
Green consumer as one who avoids products that are likely to endanger the health of the consumer or others;
cause significant damage to the environment during manufacture, use or disposal; consume a disproportionate
amount of energy; cause unnecessary waste; use materials derived from threatened species or environments;
involve unnecessary use of, or cruelty to animals; adversely affect other countries. (Elkington 1994: 93)
Introduces several papers discussed in the July 1998 issue of 'Journal of Marketing Management' focusing on
green marketing. This includes; a citation of the need to review existing literature on green marketing, an

IJRCMEAS ISSN 2454-6593
13
empirical study of United States and Australian marketing managers, a description of what a green alliance
look like in practice in Great Britain, ecotourism and definitions of green marketing. (Prothero, A. 1998)
Greater ecological enlightenment can be secured through capitalism by using the characteristics of
commodity culture to further progress environmental goals. Marketing not only has the potential to
contribute to the establishment of more sustainable forms of society but, as a principle agent in the operation
and proliferation of commodity discourse, also has a considerable responsibility to do so. (Fitchett, J.A.
(2000)
In his paper presents a conceptual link among green marketing, environmental justice, and industrial
ecology. It argues for greater awareness of environmental justice in the practice for green marketing. A
research agenda is finally suggested to determine consumers' awareness of environmental justice, and their
willingness to bear the costs associated with it. (Oyewole, 2001)
The author identifies areas that must be examined for their effect in the marketing/environment relationship,
namely economic, political and technological dimensions of the cultural frame of reference. (Kilbourne, 1998)
Interpret that proactive marketers are the most genuine group in implementing environmental marketing
voluntarily and seeking competitive advantage through environmental friendliness. The results also give
evidence that green values, environmental marketing strategies, structures and functions are logically
connected to each other as hypothesized according to the model of environmental marketing used to guide this
study. (Karna, J., Hansen, E. & Juslin, 2003)
In his study realized in the Great Britain initially concluded that in general the ecological attitude of
consumers changed positively. This study reported the strong faith of consumers in the known commercial
brands and in the feeble behavior referring to the "green" claims, which was the main cause behind the
consuming failure to interpret their concerns beyond the environment in their behavior. (Donaldson 2005).
The Economic Times, Mumbai, had an article which stated that, Green Ventures India is a subsidiary of New
York based asset management firm Green Ventures International. The latter recently announced a $300
million India focused fund aimed at renewable energy products and supporting trading in carbon credits.
(Brahma, M. & Dande, and R. 2008).
SOME PROBLEMS WITH GOING GREEN
No matter why a firm uses green marketing there are a number of potential problems that they must overcome.
One of the main problems is that firms using green marketing must ensure that their activities are not misleading
to consumers or industry, and do not breach any of the regulations or laws dealing with environmental
marketing. In order to comply with the FTC's guidelines Green marketing claims must;
• Clearly state environmental benefits;
• Explain environmental characteristics;
• Explain how benefits are achieved;
• Ensure comparative differences are justified;
• Ensure negative factors are taken into consideration; and
• Only use meaningful terms and pictures.
CONCEPTUAL RAMEWORK
A statistical tool of research approach has been under taken in this study. Well-structured questionnaire was
prepared for collecting the required primary data. A number of questions along with a likert scale have been

IJRCMEAS ISSN 2454-6593
14
incorporated in the study. The field survey conducted by Personal interview as the contact method used to
collect the information for the study.
DATA ANALASIS AND INTERPRETATION
Table 1. Consumers’ awareness on green marketing concept.
Level of measurement % of Respondents
5 Strongly agree 76
4 Agree 13
3 Neither agree nor disagree 6
2 Disagree 3
1 Strongly disagree 2
total 100
from the above table it is clarified that consumers awareness on green marketing, 7 6 % of the
respondents strongly agree, 13% of the respondents agreed, 6% of the respondents neither agree nor
disagree, 3% of the respondents disagree, and 2% of the respondents strongly disagree. From the
analysis, it is concluded that 7 6 % of the respondents have awareness on green marketing.
Table 2. Consumers’ attitude towards green products.
Level of measurement % of Respondents
5 Strongly agree 84
4 Agree 6
3 Neither agree nor disagree 5
2 Disagree 2
1 Strongly disagree 3
total 100
The above table highlights that 84% of the respondents had awareness on green products. So we conclude that
consumer purchasing decision have strong impact on green marketing of products witch are environmentally
safe.
FINDINGS
Green marketing is already a known concept adopted all over the world. In the study consumers have very
strongly responded towards the concept of going green. So Green marketing will not only become marketing
concept but also a strategy towards green brand. In the above study consumers strongly expressed that they are
very familiar with green branding strategy of corporates. But very few disagree that, it is very difficult concept
for companies to adopt in dynamic market condition.

IJRCMEAS ISSN 2454-6593
15
The push for green marketing also affects the way companies operate. To ethically promote environmental
responsibility, a company must practice what it preaches. Therefore, companies participate in recycling, renewal
practices and reuse programs that help preserve natural resources. Sustainability of resources not only benefits
the planet, but it allows companies to rely on optimized use of these resources for production well into the
future. Green marketing also keeps environmental concerns at the forefront of the public mindset, causing other
companies to act in kind.
SUGGESTIONS
Customers and communities, have increased expectations that companies make a profit while practicing
sustainability. Therefore, it is not only beneficial to use green marketing, but customers may even have concerns
about a company's activities if they don't communicate their environmental practices. Companies that innovate
in recycling programs, green production and other ways may gain an edge with the most discerning customers.
In some cases, customers pay premium prices to companies that offer green-friendly products and services.
One of our key objectives in environmental protection is to develop highly efficient products and solutions that
are environmentally friendly and enable customers to reduce their energy usage, operational costs, carbon
emissions, and negative environmental impact. The corporates must keep in mind that the consumers are very
much concerned about the environmental issues cropping up in the country and they are very much willing
to pay a premium price for the green products.
Most of the research paper summarizes positive sign which explains the importance of green marketing.
Eco-friendly products provide an extra value to the consumers. . Companies can command a higher price if
they can enhance the products performance and offer extra product value, better functions, improved
performance, better design or taste. So green marketing is not just an environmental protection tool but also
a marketing strategy for the corporate houses.
REFEREN
CES
1. Chawla Deepak, Sondhi Neena: Research Methodology (2011): Concepts And Cases: Vikas
Publishing House Pvt. Ltd.
2. Jacquelyn A. Ottman, Edwin R. Stafford, and Cathy L. Hartman, Green marketing, myopia,
Environment.Volume 48, Number 5, pages 22—36.
3. J.A Ottman,. et al, "Avoiding Green Marketing Myopia", Environment, Vol-48, June-2006.
4. Sanjit Kumar Dash (2010) Green Marketing – Opportunities & Challenges
5. Pavan Mishra and payal sharma, green marketing in India: emerging opportunities and challenges,
Mishra etal./Journal of Engineering, Science and Management Education/Vol. 3,
2010/
9-14.
6. Babita Saini, Green Marketing In India: Emerging Opportunities And Challenges, IOSR Journal of
Business and Management (IOSR-JBM) e-ISSN: 2278-487X, p-ISSN: 2319-7668. Volume 15, Issue 6 (Jan.
2014), PP 67-73.
7. Prof. Govind Teju Rathod, Asian Journal of Management Sciences 02 (03 (Special Issue));
2014; 111-
115.
Ottman, Jacquelyn. 1993. Green Marketing: Challenges and Opportunities for the New

IJRCMEAS ISSN 2454-6593
16
Marketing Age. Lincolnwood, Illinois: NTC Business Books.
Prothero, A. (1998). Green Marketing: The 'Fad' That Won't Slip Slide Away. Journal of Marketing Management, 14(6), July, pp. 507-513.
Kilbourne, W.E. (1998). Green Marketing: A Theoretical Perspective. Journal of Marketing Management, 14(6), July, pp. 641-656.
Kotler, Philip. Marketing Management – The Millennium Edition Prentice Hall of India Private Limited, New Delhi.
Mathur, L.K., Mathur, I. (2000).An Analysis of the wealth effect of green marketing strategies, Journal of Business Research, 50(2), 193-200.
Prothero, A. & Fitchett, J.A. (2000). Greening Capitalism: Opportunities for Green Community. Journal of Macro marketing, 20(1), pp. 46-56.
D.barani kumar, Dr.r.puitha, Dr.p.gurusam P. (2014). Green marketing an exploratory.

IJRCMEAS ISSN 2454-6593
17
OPEN ECONOMY AND JOBLESS GROWTH
R.D.Nandeppanavar-Guest Lecturer
MGVC Muddebihal & GFGC B.Bagewadi, Muddebihal
It is globally accepted that India is developing and has 2nd largest economy in the World. with decreasing level
of poverty indicators Generating Decent Employment Rate is main issue of the day as this is the one of the
most contentious issue in the country.
like every country India also has different type of problems like National Income , Output development.
India also has certain goals in GDP growth and HDI but employment generation challenging issues, as
economic reforms has long journey of a Quarter century the every aspects of our economy should have Inclusive
Growth. The primary goal of our economy is to achieve a fast growing employment generation , but still today
our XI and XII (2002-2007-17) plans show the battered achievements of Low Employment Level over the two
decades(by 1991-2011) showing low level of growth signs along with that some shifts of in structural
employment growth levels. So this paper elaborates about…
1. Trends in Employment level
2. Structural changes made in the Indian Economy
3. Slow Growth Problems
4. Reasons foe Slow Growth or Jobless Growth
Inclusive Goals :
The Open Economic Reforms which are driving our economy since 1991 has different goals since then India
has been showing growth in Employment by 25.5 Million in 1993-94, by 5.1 million in 99-2000 and 27 million
job Growth in 2011-12 but the Slow Down in the Economy between 2001-09 and Growth in Population has
relative Job Loss in same time, the Job aspirants and young generation participation in productive and house
hold activities in these years has been posing great threat.
Increase in Population and Labor force (1993 to 2016-16)
Year Population Total Work Force % of Job Loss
1991 91 crores 385 Million 7.2
2001 101 ‘’ 485 ‘’ 10.6
2012 121 ‘’ 555 ‘’ 9.0
2015 131 ‘’ 618 ‘’ 10.7
• NSS-Unit Level Data
Structural Shift-1991 – 2015
In absolute terms the sector wise structure of Indian Economy has been drastically changed because the over
dependence of agriculture sector has been decreasing. This is the historic evidence that shows structural change
in all sector of economy, this kind of change should bring change in employment level also, but all in all our
economy is facing different problem. In 1991 agricultural jobs were major source of employment and after
1991 the opposite issue had been arising out of economic growth during 1993-99 , 2004-09 basis as Non-
agricultural Job Growth by 7.5mn per annum, the rapid economic growth in Industry and service segment was
not enough even 10.6 mn pa, Job Creation. Because every year 12 mn people were joining Job Force, during
2004-10 overall growth was 6.7 pa and manufacturing growth by 8.6 but still growing population and lack of

IJRCMEAS ISSN 2454-6593
18
opportunity along with shift in structural level has forced economic reforms at low level, so, what is the use of
all these Economic Reforms.? Which is the future plan for Expected Growth in Employment level.?
Structural Shift In Work Force ( in Million)
Work force 1993-94 1999-00 2009-10 2011-12 2014-15
Primary Sector 241.5 246.6 244.9 231.9 ---
Secondary ‘’ 38.5 42.8 50.7 59.8 ----
Tetris ‘’ 15.8 20.4 48.3 55.3 -----
Total Work
Force
374.0 399.5 460.2 484.8 618.2
Unemployed 7.2 9.0 9.6 10.6 10.7
• NSS-Unit Level Data
Sub – Sectors : the Driving Force
All these shifts in the economy form agricultural to service sector not only causes output of economy but also
made the shift in the employment also, there is substantial shift in Sub-sectors employment level.
Absolute Volume of Unemployment ( in Million) (During 1999-2011)
Year 1999-00 2004-05 2009-10 2011-12 2014-15
Sub –Total
(Services)
89.8
107.3
116.3
127.3
136.2
• NSS-Unit Level Data.
Informal Employment
The Informal sector consisting of timely and causal job opportunity for work force, the very objective of
providing informal jobs is to generate part time job and Income to concerned so, it has
1. No organization level Status
2. Give Indeterminate Income to Concerned persons
3. There is no Division of labor
4. The job were casual in nature rather than contractual.
Workers Engaged in Informal sectors ( 55th NSSO Data)
Informal sectors Rural-Urban sector
• Non-Agri sector -----------
• Co- Operative, Trusts, NGO etc. ------------
• Engaged in Household employment--------
• Priority sector ------------
• Partnership firms ------------
All Type Enterprises
55.0 %
1.1 ‘’
1.5 ‘’
9.1 ‘’
1.4 ‘’
26.0 ‘’
Around these Data analysis the NSSO 68th round data (201-12) shows several difficulties in Informal Job sector
those were---

IJRCMEAS ISSN 2454-6593
19
% of Difficulties Area of Difficulties
� 79 %
� 71 %
� 72 %
� 42 %
� 80 %
� Don’t have written Job Contract
� Not eligible for paid leave
� Not eligible for social Benefits
� Temporary nature of work
� Have no union or Association
Understanding The Gain and Loss dilemma ------ According these available basic data the economic Reforms all
these days has been encouraging but in accordance with Employment creation there is complete change in
Indian Context, because during these two decades there is huge growth in Indian economy we can agree but the
population growth has been halting because our Rural based agricultural economy has been losing job while the
new generation of jobs also going in Service and Informal sectors.
This growth also has huge difficulty in getting salary, job security and Labor Force participation Rate
(LFPR)level also. So, the changes are occurring because ..
• Because of Rural-Urban Division
• ‘’ ‘’ Male and Female Division
• ‘’ ‘’ Self-Employed, (SE), Regular Employer(RE), and Casual Employer Division (CL)
• ‘’ ‘’ Quantitative and Qualitative Job Division
• ‘’ ‘’ Organized and Un-organized Division
• ‘’ ‘’ Formal and Informal Job Division
Sector -Wise change in Employment
sector 1999-2000
SE CL
RE
2004-05
SE CL
RE
2009-10
SE CL
RE
2011-12
SE CL
RE
Agri 142.4 100.6 3.5 172.3 93.3 2.9 147.1 95.6 2.1 151.0 78.9 1.9
Manf’cturing 22.2 7.6 13.0 28.6 9.3 15.9 24.6 9.8 16.4 29.3 9.9 20.5
Nn-mnf’ring 3.2 14.5 2.6 4.8 21.6 3.0 5.3 38.9 4.1 5.7 44.3 5.3
Services 43.2 9.8 36.8 55.4 8.2 43.6 57.5 9.7 49.1 61.1 8.8 56.9
Total 211.1 132.5 55.9 261.2 132.5 65.4 234.6 153.9 71.7 247.7 141.9 84.7
The Gender Dimension –agriculture job loss (in Million)
Male Female
2000-05 2005-10 2010-12 2000-05 2005=10 2010-12
2.0 %
-1.2 %
-0.2
10.2 %
-10.7
-7.3
31.5 Million
23.5 Million
12.4 Million
13.9 Million
-10.7 Million
-5.5 Million

IJRCMEAS ISSN 2454-6593
20
If we see these trends , there is indication of low level and informal Job Growth patterns the autonomy or
openness in economy is only leading to disparity in different sectors along with Gender Basis. The quantity of
Employment also deteriorating because of nature of Job as Informal one as Formal Employment is(permanent)
decreasing. Around 2000 unemployment grew around 94.5 Million.
According to National commission for Employment in Un-Organized Sector(NCEUS) 60 million new
Jobs generated but, those are formal. In 1999-00 basis it was around 3.5% Rate of Growth and in 2011-12
that was 238 million but not so substantial to as big as Indian Economy.!
Sector -Wise Employment Distribution (During 2004 to 2011-12 ) (in million)
sectors Organized Un-Organized Total
formal Informal Formal Informal Formal Informal
2004-05
*Agri sector—
*manufacturing—
*service ---
-----total
0.2
5.0
2.0
26.7
4.1
10.3
10.0
31.5
0.1
0.6
1.1
1.9
264.2
38.0
76.8
399.0
0,3
5.6
20.6
28.6
268.2
48.3
86.7
430.5
2011-12
*Agri sector—
*manufacturing—
*service ---
-----total
0.5
6.1
2.7
33.5
17.7
14.6
19.7
68.1
0.1
0.4
0.3
1.3
213.6
38.7
32.7
370.8
0.6
6.5
2.9
35.4
23.3
53.3
52.3
438.9
Missing Middle class workers
The changes in structural level of Indian Employment generation is also showing sign of different class of
workers numbers in different form, the workers size, and share also asserted as follows.
Workers class 2004-05 2011-12
No of workers
(million)
% share No of workers
(million)
% share
- Less than 6
- 6 and above 10
- Above 10 to below 20
119.1
14.4
11.9
63.8
7.7
6.4
138.6
28.5
18.6
57.7
11.9
7.8

IJRCMEAS ISSN 2454-6593
21
- Above 20
- Not known
25.1
16.2
13.5
8.7
41.1
13.3
17.1
5.5
Total
186.7
100%
240.1
100%
Employment Growth and change in Demography
In these two and half decade several questions arises as, what is the Growth of Employment.? How Work
Force Development strategies were taken into consideration? as the open economic policy debate goes on
our Demographic change or population rise also come into force. Therefore the curiosity and questions
however increasing over the decade as 25 million in 93-94 to 685 million in 2014-15 the demography is an
exponential matter to consider in population causing Job loss, therefore several questions arises.
1) What are the structural changes occurred ?
2) Why our manufacturing growth is slow?
3) Why our imports are growing despite huge economy?
4) Why is agri-productivity is decreasing ?
5) What is main cause for capital-output ratio decrease?
6) Why Non- agri employment is rising.?
Etc.etc…
According to Indian Labor and Employment Report-2014(AILER) prepared by Institute for Human
Development(IHD) in collaboration with Indian Society of Labor Economics(ISLE) the report
stresses..
� Development of Labor institutions and Industrial Relations
� Securing Social Security through Employment
� Creating employment strategies and highlighting emerging challenges
a) Taking note of the emerging trend of the ‘working poor’
b) Present underemployed level and low Productive Job situation
c) Taking note of ¼ of worker are poor as poverty line at PPP is at $1.25
d) If poverty line raised to $2 PPP then also working population stands at 58% or 276 million
- The report advocates the present level of Informality in Job is not acceptable
- It also advocates ‘ Social Protection Floor’ for job creation.
Conclusion :
Around the world there is economic reforms and countries like BRICS and USA EURO level countries are
also in the grip of unemployment and economic backwardness as world economy is slowing down creation of
employment is more debatable and challenging. If India want to catch the growth leovel which it expects around
9-10 % pa growth it has to make use of Demographic Dividend or HDI development so our goal to create
employment and growth around 5.6 % Employment Generation Rate in 2040 it has to make landslide
achievements, otherwise India became Ageing society there is need for more action to solve the problem.

IJRCMEAS ISSN 2454-6593
22
How to choose the right and best mutual fund for your portfolio?
Author: Dr. Surekha S. Yendigeri.
Bhandari and Rathi college, Guledgudd.
Abstract: This research paper throws light on the selection of the best and right mutual fund scheme. The best
mutual fund scheme does not necessarily mean the best in returns. But one best suited to your investment
objective, time horizon of investment and risk appetite and the one that is good in its peer group, however the
investor makes the mistake in selecting mutual funds only on the basis of performance and that too only the
recent performance. This paper is sort of a general guide to the investors based on their investment plan, the
category of funds should be chosen from equity, debt and balanced fund. It answers and helps to select best
mutual fund within a category. The right best mutual fund can be selected based on past performance
comparison with peer set and bench mark , volatility measures and expense ratio ,scheme asset size , fund
manager tenure and experience, exit load. The hallmark of this paper is investors get relevant information to
their satisfaction of the most common queries, in the sense of- where to get information on important measures
of risk ratios? How to compare mutual fund schemes performance based on risk ratios and ultimately, one is
able to select the best suited mutual fund scheme. Readers of this article able to select right mutual fund by
following demo. The Common investor can able to select best fund without help of financial advisor and
without strain of calculating ratios. The very object of this article is to enable any layman or novice to select the
best and right mutual fund for his portfolio by reading cream part of the article.
KEYWORDS: Large cap, Mid-cap and Small cap funds
IJRCMEAS ISSN 2454-6593
23
Concept Part of Paper
Introduction to Mutual Funds
Establishing realistic financial goals is an essential first step toward successful investing.
Understanding the investments that best suits to help your achieve your goals is equally important.
Most people invest to meet long-term goals, such as ensuring a secure retirement or paying for a child’s
college education, but many also have more immediate goals.
Mutual fund can fit well into either your long or short term investment strategy, but the success of
your plan depends on fund you choose. Because all funds invest in securities markets, it is crucial to maintain
realistic expectations about the performance of those markets and choose funds best suited to your needs.
Meaning of Mutual funds
A mutual fund is an investment company that collects money from many people and invests it in a
variety of securities. . Mutual funds are an efficient way to invest in stocks, bonds, and other securities for three
reasons.
1. The securities purchased are managed by professional managers.
2. Risk is spread out or diversified, because you have a collection of different
Stocks and bonds.
3. Costs usually are lower than what you would pay on your own, since the
Fund buys in large quantities.
Definition of a Mutual Fund
The Securities and Exchange Board of India (Mutual funds) Regulations Act 1993, defines a mutual
fund “as a fund established in the form of a trust by sponsor to raise monies by the trustee through the sale of
units to the public under one or more schemes for investing in securities in accordance with these regulations
History of Mutual Fund
The Mutual fund industry can be likened to the film star of the finance business. Thought it is perhaps
the smallest segment of the industry, it is also the most glamorous and young industry where there are changes
in the how the game is played every day, and there are constant shifts and upheavals. The mutual fund is
structured around a fairly simple concept, the mitigation of risk through the spreading of investments into a
large bucket. Yet it has been the subject of perhaps the most elaborate and prolonged regulatory effort in the
history of the country.
The mutual fund industry started in India in a small way with the UTI Act creating what was
effectively a small savings division within the RBI. Over a period of 25 years this grew fairly successfully and
gave investors a good return, and therefore in 1989, as the next logical step, public sector banks and financial
institutions were allowed to float mutual funds and their success emboldened the government to allow the
private sector to foray into this area.
The initial years of the industry also saw the emerging years of the Indian equity market, when a
number of mistakes were made and hence the mutual fund schemes, which invested in lesser-known stocks and
at very high levels, became loss leaders for retail investors. From those days to today the retail investor, for
whom the mutual; fund is actually intended, has not yet returned to the industry in a big way. But to be fair, the
industry too has focused on bringing in the large investor, so that it can create a significant base corpus, which

IJRCMEAS ISSN 2454-6593
24
can make the retail investor feel more secure.. The aggressive competition in the business took its toll and two
more mutual funds bit the dust. Alliance decided to remain in the ring after a highly public bidding war did not
yield an acceptable price, while Zurich has been sold to HDFC Mutual. The growth of the industry continued to
be corporate focused barring a few initiatives by mutual funds to expand the retail base. Large money brought
with it the problems of low retention and consequently low profitability, which is one of the problems plaguing
the business.
But at the same time, the industry did saw spectacular growth in assets, particularly among the private
sectors players, on the back of the continuing debt bull run. Equity did not find favor with investors since the
market was lack-luster and performances of funds, barring a few were quite disappointing for investors. The
other aspect of this issue is that institutional investors do not usually favour equity. It is largely a retail segment
product and without retail depth, most mutual funds have been unable to tap this market.
The History of Mutual Funds in India can be Broadly Divided into Four Distinct Phases
First Phase 1964-1987
Unit Trust of India (UTI) was established on 1963 by an Act of Parliament. It was set up by the
Reserve Bank of India and functioned under the Regulatory and administrative control of the Reserve Bank of
India. In 1978 UTI was de-linked from the RBI and the Industrial Development Bank of India (IDBI) took over
the regulatory and administrative control in place of RBI. The first scheme launched by UTI was Unit Scheme
1964. At the end of 1988 UTI had Rs. 6,700 crore of assets under management.
Second Phase 1987-1993
(Entry of public Sector Funds) 1987 marked the entry of non-UTI, public sector mutual funds set by
public sector banks and Life Insurance Corporation of India (LIC) and General Insurance Corporation of India
(GIC). SBI Mutual Fund was the first non-UTI Mutual Fund established in June 1987 followed by Can Bank
Mutual Fund (Dec 87), Punjuab National Bank Mutual Fund (Aug 89), Indian Bank Mutual Fund (Nov 89),
Bank of India (Jun 90) Bank of Baroda Mutual Fund (Oct 92). LIC established its mutual fund in June 1989
while GIC had set up its mutual fund in December 1990. At the end of 1993, the mutual fund industry had assets
under management of RS. 47,004 crore.
Third Phase 1993-2003
(Entry of Private Sector Funds) With the entry of private sector funds in 1993, it was a dawn of a new
era started in the Indian mutual fund industry, enabling the Indian investors a wider choice of fund families.1993
was also the year in which the first Mutual Fund Regulations came into being, under which all mutual funds,
except UTI were to be registered and governed. The erstwhile Kothari Pioneer (now merged with Franklin
Templeton) was the first private sector mutual fund registered in July 1993. The 1993 SEBI (Mutual Fund)
Regulations were substituted by a more comprehensive and revised Mutual Fund Regulations in 1996. The
industry now functions under the SEBI (Mutual Fund) Regulations 1996. The number of mutual fund houses
went on increasing, several mergers and acquisitions. As at the end of January 2003, there were 33 mutual funds
with total assets of Rs. 1, 21,805 crores.
Fourth Phase-Since February 2003
In February 2003, following the repeal of the Unit Trust of India Act 1963 UTI was bifurcated into two
separate entities. One is the Specified Undertaking of the Unit Trust of India with assets under management of
Rs. 29,835 crores as at the end of January 2003, representing broadly, the assets of US 64 schemes, assured
return and certain other schemes. The Specified Undertaking of Unit Trust of India, functioning under an

IJRCMEAS ISSN 2454-6593
25
administrator and under the rules framed by Government of India and does not come under the purview of the
Mutual Fund Regulations. The second is the UTI Mutual Fund, sponsored by SBI, PNB, BOB and LIC. It is
registered with SEBI and functions under the Mutual Fund Regulations. With the bifurcation of the erstwhile
UTI which had in March 2000 more than Rs. 76,000 crores of assets under management and with the setting up
of a UTI Mutual Fund, conforming to the SEBI Mutual Fund Regulations, and with recent mergers taking place
among different private sector funds, the mutual fund industry has entered its current phase of consolidation and
growth.
Classification of Mutual Fund
Mutual fund schemes are of different types. They can be classified on the basis of maturity period,
investment objective, geographical coverage and other criterion.
Basis Maturity
Period
Investment
Objectives
Geographical
coverage Other Criterion
1. Open Ended
2. Close Ended
1.Growth/Equity
Oriented
2. Income/Debt
Oriented
3.Balance Fund
4.Money Market
or Liquid Fund
5.Gilt Fund
6.Index Fund
7.Load/No load
Fund
1. Domestic Fund
2.Off-shore Fund 1. Sector Specific Fund
2.Tax Saving Fund
3.Equity Linked Saving
Schemes
4.Exchange Traded Fund
5.P/E Ratio Fund
6.Assured Returns Schemes
7.Fund of Funds
Graph To Represent Growth in Assets Under Management of Mutual Fund

IJRCMEAS ISSN 2454-6593
26
The graphical representation of growth in the assets under management of mutual funds shows the
increased popularity of mutual funds since phase to phase four. Mutual funds play an important role in the
economic development of the country as they are an important source of capital to the corporate world.
Core part of the paper
How to choose the best and right mutual fund for your portfolio?
The best mutual fund scheme does not mean the best in returns. But one best suited to your investment
objectives, time horizon of investment and risk appetite and the one that is good in its peer group, but the
mistake investor makes in selecting mutual funds only on the basis of performance and that too just the recent
performance
Selecting the right and best mutual fund is like selecting right path or right life partner. Wrong decision
can wipe out your personal wealth.
Objective of the Paper
1. To enable the layman to choose the best and right mutual fund scheme for his profile.
Investment objectives:
First investor must decide investment objectives i.e., why he or she is investing? Objective might be long
term, short term or linked to any event like childrens/family marriage, child’s education etc. Secondly,
depending on investment objective, the risk factor the type of fund can be decided.
Investors Type
Investor Type Risk Taking Fund Type
Aggressive Investor High Risk Equity Fund
Balanced Investor Moderate Risk Balanced Fund
Conservative Investor Low Risk Debt Fund
It is prudent to analyze the following while selecting the best & right mutual fund scheme.
1. To analyze the past performance among same fund category.
2. To analyze volatility of returns among same fund category
3. To analyze other related parameters.
1. To analyze the past performance.
a. Past performance: The biggest mistake that mutual fund investors make is analyzing the recent
performance. The investors should critically-evaluate three years to five years returns of the scheme to
ascertain its consistency in performance. More than the long term performance of any scheme it’s
ranking among peers should be looked at.

IJRCMEAS ISSN 2454-6593
27
b. Ranking: Investors should not consider only star rating given by various research agencies. And it is
quit confusing when same fund ranked different rank by different agencies like crisil and value research
online. The best strategy is to pickup 2 rankings which you trust the most and select mutual fund within
shortlisted sub-class which are ranked 4 star or 5 star. Now check in this list which mutual funds are
common between 2 rankings. This is your final shortlist on ranking front.
2. To analyze volatility of returns.
The volatility of returns generated by mutual fund schemes can be measured by some important risk
ratios like
a. Standard deviation,
b. Beta,
c. Alpha,
d. Sharpe ratio, etc.
a. Standard deviation
Standard deviation measures volatility of the returns from the mutual fund scheme over a
particular period. It tells you how many the funds return can deviate from the historical mean return of the
scheme. If a fund has 12% average rate of return under standard deviation of 4%, its return will range from
8% - 16%
SD = √ N ∑ X - (∑ X) 2
N2
b. Beta:
It measures the fund’s volatility compared to that of a benchmark. It tells you how much a fund’s
performance would swing compared to a benchmark. A fund with a beta of 1 means, it will move as much
as the benchmark. If a fund has a beta of 1.5, it means that for every 10% upside or downside, the fund’s
NAV would be 15% in the respective direction.
β = n∑xy-(∑x) (∑y)
n∑X2-(∑X)
2
c. Alpha:
The simplest definition of an alpha would be the excess return of a fund compared to its
benchmark index. If a fund has an alpha of 10%, it means it has outperformed its benchmark by 10% during
a specified period.
Alpha = (Rp-Rf) – Beta (Rm-Rf)
d. Sharpe Ratio:

IJRCMEAS ISSN 2454-6593
28
This measures how well the fund has performed vis-à-vis the risk taken by it. It is excess return
over risk-free return (usually return from treasury bills or government securities) divided by the standard
deviation. The higher the sharpe ratio, the better the fund has performed in proportion to the risk taken by it.
Formula to Calculate Sharpe’s Measures is
St = Rp - Rf
SD
How to select the best mutual fund scheme based on
Measures of risk / volatility?
The measures of risk should ideally be evaluated among the mutual funds within the same fund
category/fund type.
How To Select The Right Mutual Fund Scheme?
Compare and select fund on the following measures of risk
Standard deviation Low
Beta Low
Alpha High
Sharpe ratio High
The measures of risk should ideally be evaluated among the mutual funds
which are from the same fund category / fund type.
Where to get information on important measures of risk ratios?
Where to find the values of these Risk Ratios? Are they any online portals which provide details on
these measures of risk?
Yes. The details are readily available on portals like value research online and morning star.
Let us compare two large cap funds
Fund Std dev Beta Alpha Sharpe ratio
Birla sun life
frontline
15.44 .99 7.64 1.12
SBI blue chip 14.22 .90 10.65 1.37
Source: value research online
Select fund which has low std. dev and beta and high alpha and sharpe ratio. i.e SBI blue chip
fund.
3. Other related parameters.
A. Expense Ratio
B. Exit load
C. AUM
D. Fund Manager tenure and experience
A. Expense Ratio: While calculating returns from the scheme, it is advisable to check the expense
ratio as expense ratio eats into return from scheme. Normally schemes with expense ratio of up to

IJRCMEAS ISSN 2454-6593
29
1.5% are considered OK as per industry experts. Higher expense ratio may not impact good
performing mutual fund schemes too much but will hit hard when fund start performing badly.
B. Exit Load: It is important to check exit load of mutual fund scheme as you might need money
before investment horizon. Investor made this mistake and invested in a debt scheme without
checking exit load. The exit load was 3%, within 365 days. Investor liquidated after 10 months. The
returns from the scheme were 4.5% and 3% was deducted as exit load. Investor should check exit
load before investment. From the shortlisted list, you may drop schemes with stringent exit load
criterion which does not suit your requirement. Try to retain the schemes with minimal exit load
requirement.
C. Assets Under Management
Net assets of any scheme give fair idea of confidence level of investors in mutual fund scheme. This
confidence is built over a period of time. Secondly, fund houses deploy their best fund managers for
flagship mutual fund schemes with high AUM. Therefore on this parameter you may drop mutual fund
schemes with below average
AUM in particular mutual fund sub-class. It will help to zero-in schemes which are there in market from
sometime and have seen complete learning cycle to make right investment decisions.
D. Fund Manager Tenure And Experience
Fund manager plays a very important role in the fund’s performance. Though it is a process oriented
approach but still fund manager is the ultimate decision maker and his experience, and view point counts a lot.
You should know who is the fund manager of the scheme and what is his past track record. You should also
look at the performance of other funds which he is managing. If the fund manager of the scheme has recently
been changed, don’t panic. Just keep a watch on his performance by looking at alpha and quarter to quarter
performance. If you find that due to change in the fund manager there is considerable effect on the fund’s
performance which does not suit your risk appetite then you may make a decision to exit.
Procedure For Selecting Better Mutual Fund Scheme.
1. Compare the returns generated by fund with other fund within the same category for at least three years
or more.
2. You can also compare the return of fund with the return of its benchmark / fund category.
3. Analyze and evaluate the volatility of return of the fund based on majors of risk ratios and other
parameters.
4. You can evaluate the majors of risk between fund with benchmark index.
Demo to compare mutual funds performance based on risk ratios
• Among the many portals visit Valueresearchonline portal and click on fund compare Let’s
compare two large cap funds 1)SBI Bluechip Fund & 2) Birla Sunlife frontline Equity Fund. You
may compare any number of funds within same category.
Fund Vs Benchmark Index Vs Fund Category

IJRCMEAS ISSN 2454-6593
30
• Click on any individual mutual fund scheme link and you can find details about risk ratios related to that
specific fund, It’s Benchmark Index and also of fund category in the same table. Below details are for SBI
Blue Chip Fund Vs Its Benchmark Vs Category.
From the above screen short it’s clear that SBI Blue Chip Funds Performance compare to Benchmark and
category is good.
1. Mean is higher than benchmark and category’s mean
2. Standard Deviation is low compared to benchmark and category’s std Dev
3. Sharpe Ratio is higher than benchmark and category’s Sharpe Ratio
Large Cap Fund
Sl.No Fund Risk Rating Expense
ratio
3 Years 5 Years Std Beta Alpha
Sharpe
Ratio
Rank Return Rank Return
1 Birla Sun Life frontline Equity Fund
Below
Avg ***** 2.27% 11/130 24.46 2/68, 16.83 15.44 0.99 7.64 1.20
2 Birla Sun Life Top 100 Fund
Below
Avg ***** 2.36% 9/130 25.47 3/68. 16.73 15.87 1 8.73 1.15
3
ICICI Prudential Focused Blue chip
Equity Fund
Below
Avg **** 2.16% 37/130 21.35 7/68, 15.04 15.12 0.96 6 1.02
4 SBI Blue chip Fund Low✓✓✓
✓ *****✓✓✓
✓ 1.99%✓✓✓
✓ 2/130✓✓✓
✓ 27.04✓✓✓
✓ 1/68, ✓✓✓
✓ 18.71✓✓✓
✓ 14.22✓✓✓
✓ 0.90✓✓✓
✓ 10.65✓✓✓
✓ 1.37✓✓✓
✓
Source: www.valueresearchonline.com
Among the randomly selected large cap funds, SBI blue chip fund fulfills all parameters. It is
considered as a best performing fund in the category of large cap fund. It gives 27.01% returns during three
years and 18.71% returns during five years.
Balanced Fund
Source: www.valueresearchonline.com
Among the randomly selected Balanced funds, Tata balanced fund-regular plan fund fulfills seven
parameters out of Eleven parameters. It is considered as a best performing fund in the category of balanced
fund. It gives 25.85% returns during three years and 17.64% returns during five years.
Mid Cap Fund
Sl.No Fund Risk Rating Expense
ratio
3 Years 5 Years Std Beta Alpha
Sharpe
Ratio Rank Return Rank Return
1 HDFC prudential fund High ** 16.91% 13/56 25.29 15 13.7 16.91 1.25 8.55 1.1
2
ICICI prudential balanced
advantage fund Low✓✓✓
✓ *** 9.99%✓
✓✓
✓ 39/56 19.62 11 15.08 9.99✓✓✓
✓ 0.76✓✓✓
✓ 7.07 1.33
3 ICICI prudential balanced fund Average ****✓✓✓
✓ 12.20% 24/56 23.74 4 16.75 12.2 0.93 9.27 1.38
4 Tata balanced fund-regular plan Average ****✓✓✓
✓ 12.93% 11/56,✓✓✓
✓ 25.85✓✓✓
✓ 1✓✓✓
✓ 17.64✓✓✓
✓ 12.93 0.97 10.27✓✓✓
✓ 1.40✓✓✓
✓

IJRCMEAS ISSN 2454-6593
31
Source : www.valueresearchonline.com
Among the randomly selected mid cap funds, UTI mid cap fund fulfills seven parameters out of Eleven
parameters. It is considered as a best performing fund in the category of mid cap fund. It gives 43.08% returns
during three years and 22.99% returns during five years.
By going through application part any layman or novice can able to choose the best and right Mutual
Fund Scheme for his/her portfolio
CONCLUSION: Performance (returns) is not everything if a funds generates high and abnormal returns but
takes too much risk, the performance may not be consistent. Mutual Fund investors invest in a mutual fund
schemes which balance risk and returns. It is advisable to analyze performance risk ratios and other parameters
before selecting the right and best mutual fund schemes. One must also bear in mind the popular saying –
“There is no scientific way to choose tomorrow’s best funds today”. So investor should review the current
selection every quarter or half yearly or at least yearly. I conclude presentation with a standard disclaimer –
‘mutual fund investments are subject to market risk. Fast performance may or may not be sustained in future.
Past performance is not indicative of future returns.’
Reference:
1. Security Analysis and Portfolio Management
By S.Kevin
2. Security Analysis and Portfolio Management
By Donald E Fischer and Ronald J.Jordan
3. Investment Analysis and Portfolio Management
By Prasanna Chandra
4. Indian Financial System
By V.A.Patil, A.B.Kalkundrikar
1. Petajisto, Antti 2013. Active share and mutual fund perfoimance,http://ssrn.com
2. Rao S. Narayan & Ravindran M. 2003. Performance evaluation of Indian mutual funds, http:ssrn.com
���� www.valueresearchonline.com
���� www.moneycontrol.com
���� www.investing.com
���� www.morningstar.com
Sl.No Fund Risk Rating Expense
ratio
3 Years 5 Years Std Beta Alpha
Sharpe
Ratio Rank Return Rank Return
1 Birla Sun Life Pure Value Fund Average **** 2.85% 6/65, 42.44 6/32 22.21 23.64 1.17 21.12 1.38
2 Fraklin india prima fund Below Avg ✓✓✓
✓ *****✓✓✓
✓ 2.36% 24/65 37.38 3/32 23.71 16.68 0.97 18.18 1.66
3 HDFC mid-cap opportunities fund Below Avg ✓✓✓
✓ **** 2.14%✓✓✓
✓ 19/65 38.44 7/32 21.89 16.87 0.94 19.32 1.69
4 ICICI prudential multicap fund Average **** 2.39% 37/65 27.15 14/32 17.06 15.08✓✓✓
✓ 0.91✓✓✓
✓ 10.55 1.29
5 UTI mid cap fund Below Avg ✓✓✓
✓ **** 2.24% 5/65,✓✓✓
✓ 43.08✓✓✓
✓ 5/32✓✓✓
✓ 22.99✓✓✓
✓ 17.87 0.95 22.8✓✓✓
✓ 1.8✓✓✓
✓

IJRCMEAS ISSN 2454-6593
32
IMPACT OF MICROFINANCE ON WOMEN EMPOWERMENT – A CASE STUDY OF
KARWARTALUK.(KARNATAKA STATE)
Sandeep S. Kotharkar
Research Scholar, Dept. of Commerce, Bharathiar University, Tamilnadu, India
ABSTRACT
Microfinance refers to the small subject of financial service to very poor families to help them in
productivity activities. Task force on Microfinance states that “It is the provision of thrift, credit and other
financial service and products of very small amount to poor in rural, semi urban areas for enabling them to raise
economic living and living standards”. Microfinance has given women in India an opportunity to become to
agents of change. Rural women who are forefront of the microfinance movement in our country, use of small
loans is a big start of growth of economy.
Micro credit has worked largely through SHGs in general and women groups in particular. Since the
SHGs is a small group of 10-20 persons drawn from relatively homogeneous background, the members who join
the group know what benefit they would attain from the group through microfinance.
SHGs are small, economically homogeneous and affinity groups of rural / urban poor
voluntary formed to save and contribute to a common fund that is to lend its members as per the group’s
decisions. It intends to work for the social and economic upliftment of their families and community. The
present study is important to assess the impact of women of SHGs in socio economic empowerment in district
of Karwar (Karnataka State).The study findings may be useful in smooth functioning of SHGs. More benefits of
SHGs may be obtained through proper functioning of these groups and extending of microfinance to develop
and promote micro enterprise.
Key words: Microfinance, Self Help Groups, Women Empowerment.
INTRODUCTION
Microfinance refers to the small subject of financial service to very poor families to help them in
productivity activities. Task force on Microfinance states that “It is the provision of thrift, credit and other
financial service and products of very small amount to poor in rural, semi urban areas for enabling them to raise
economic living and living standards”. Microfinance has given women in India an opportunity to become to
agents of change. Rural women who are forefront of the microfinance movement in our country, use of small
loans is a big start of growth of economy.
SHGs are small, economically homogeneous and affinity groups of rural / urban poor voluntary formed
to save and contribute to a common fund that is to lend its members as per the group’s decisions. It intends to

IJRCMEAS ISSN 2454-6593
33
work for the social and economic upliftment of their families and community. The present study is important to
assess the impact of women of SHGs in socio economic empowerment of Karwar. The study findings may be
useful in smooth functioning of SHGs. More benefits of SHGs may be obtained through proper functioning of
these groups and extending of microfinance to develop and promote micro enterprise
Objective of Study:
1) To assess the impact of SHGs on income level, job opportunities, literacy level etc.
2) To study the socio-economic background of Women.
3) To study the role of SHG’s in improvement of status of women.
Review of Literature:
Beena George (2014) “ Micro Finance and Women Empowerment” Basic and Applied Research, Vol 16, Iss 1,
Pp 505-522 (2014) Any strategy which aims to deal with the empowerment of the poor, that of women in
particular, must be based on an understanding of and the ability to overcome the causes of the lack of power
which lies behind it. A review of the literature suggests that there is much debate at the theoretical level as to
what constitutes empowerment and how best it can be achieved. A large number of micro level studies have
been undertaken so far by various scholars, institutions, NGOs, and sponsors of micro finance programmes
highlighting the strengths and weaknesses of the programmes at international, national, and regional levels. The
major themes of certain selected studies are reviewed in this paper. They are subdivided into four heads, viz.
empowerment: conceptual analysis, micro finance at a glance, and impact of microfinance on women
empowerment.
MudakappaGundappa (2014) “MICRO FINANCE AND EMPOWERMENT OF WOMEN: AN IMPACT
STUDY OF SHGS” Indian Stream of Research Journal Vol4. ISS 8, Pp 1-6 (2014) in his studies Microfinance
is a type of banking service that is provided to unemployed or low-income individuals or groups who would
otherwise have no other means of gaining financial services. Micro finance through Self Help Group (SHG) has
been recognized internationally as the modern tool to combat poverty and for rural development. Micro finance
and SHGs are effective in reducing poverty, empowering women and creating awareness which finally results in
sustainable development of the nation. The main aim of microfinance is to empower women. In this paper the
role played by Microfinance in women’s empowerment are considered into three dimensions namely
psychological, social and economical.
Sources of Data:
The study is based on both primary and secondary data. Primary data is collected from SHG’s
members with the help of interview and secondary data is collected from various sources viz., book, journals,
newspapers, published literature, websites and records of SwaSayahaSangha in Karwartaluk.
Scope of the study:

IJRCMEAS ISSN 2454-6593
34
The present study covers various aspects like: performance in improvement of life style in SHGs, what are
the functions of SHGs management, data analysis relating to SHGs and how it is helpful to rural women and
various other aspects.
Methodology:-
The study is based on both primary and secondary sources of data. To collect data questionnaires are
prepared and presented personally to the members of SHGs of KarwarTaluk. The collected data are analyzed by
classifying and tabulating.
Sample Design:
The contact of all SHG’s members in Karwartaluk is very difficult, the size of SHG’s and members are
very large. Hence the study is selected for 55 SHG’s and each from SHG’s ten members is taken therefore the
total size of sample 550
Data Analysis:
Analysis of data is a process of inspecting, cleaning, transforming and modeling data with the
goal of highlighting useful information suggesting conclusions, and supporting decision making. Data analysis
has multiple facts and approaches, encompassing diverse techniques under a variety of names, in different
business, science, and social science domains.
Table No 1
Ho:-There is no significant difference between savings pattern & religion.
H1:There is significant difference between savings pattern & religion.
Savings Hindu Muslim Christian
20 238 6 2
40 155 3 2
60 & above 58 1 4
100 &above 73 8 0
Total 524 18 8
table 1
Anova: Single Factor
SUMMARY
Groups Count Sum Average Variance
Column 1 4 524 131 6906
Column 2 4 18 4.5 9.667
Column 3 4 8 2 2.667

IJRCMEAS ISSN 2454-6593
35
ANOVA
Source of Variation SS df MS F P-value F crit
Between Groups 43532.667 2 21766.333 9.438 0.006 4.256
Within Groups 20755 9 2306.111
Total 64287.667 11
INTRPRETATION: since tabulated value is less than the calculated value, H0 is accepted i.e, there is no
significant difference between savings pattern & religion.
Table no 2
Ho:-There is no significant difference between savings pattern &age group .
H1:There is significant difference between savings pattern &age group.
Savings 20-30 30-40 40-50 50 & above
20 31 82 120 13
40 26 72 47 15
60 & above 12 14 17 20
100 & above 15 41 19 6
Total 84 209 203 54
table 2
Anova: Single Factor
SUMMARY
Groups Count Sum Average Variance
Column 1 4 84 21 80.666
Column 2 4 209 52.25 954.916
Column 3 4 203 50.75 2318.916
Column 4 4 54 13.5 33.666
ANOVA
Source of Variation SS df MS F P-value F crit
Between Groups 4809.25 3 1603.083 1.892 0.184 3.49
Within Groups 10164.5 12 847.041
Total 14973.75 15

IJRCMEAS ISSN 2454-6593
36
INTRPRETATION: since tabulated value is more than the calculated value , H0 is rejected i.e, there is
significant difference between savings pattern & age group.
TABLE NO 3
Ho:-There is no significant difference between satisfaction level & religion .
H1:There is significant difference betweensatisfaction level & religion.
Satisfied level Hindu Muslim Christian
High 315 7 3
Medium 205 7 5
Low 4 4 0
Total 524 18 8
table 3
Anova: Single Factor
SUMMARY
Groups Count Sum Average Variance
Column 1 3 524 174.666 24870.333
Column 2 3 18 6 3
Column 3 3 8 2.666 6.333
ANOVA
Source of Variation SS df MS F P-value F crit
Between Groups 58043.555 2 29021.777 3.499 0.098 5.143
Within Groups 49759.333 6 8293.222
Total 107802.888 8
INTRPRETATION: since tabulated value is more than the calculated value, H0 is rejected i.e, there is
significant difference between satisfaction level & religion.
Findings
1. Analysis from ANOVA it is clear that there is no significant difference between savings pattern &
religion of the members of Self Help Group.
2. There is significant difference between savings pattern & age group in SHGS.
3. There is significant difference between satisfaction level & religion, therefore our assumption that
satisfaction level is different for different religion in SHGs

IJRCMEAS ISSN 2454-6593
37
4. Most the woman belong to 30-40 age group i.e, 38%. It indicates their activeness, & their participation
in SHG and income generation activities for their development.
5. .Most of the women beneficiaries are married i.e, 89%.This shows that family responsibilities intend
them to join SHGs group
6. Most of beneficiaries are poor i.e, 44% of the beneficiaries are having below 10000 income level and
31% of the beneficiaries are having 10000-20000 income level, this clearly shows that the members
have poor income background
7. .Most of the SHG leaders said that they are experiencing good higher empowerment, i.e,71% which is
key sign of SHG’s development and this should be carried on in future & for that Govt. should
continuously frame effective policies.
Suggestions
1) Government of concerned department should organize frequent education and awareness camps to
convey about the different skills & present scenario availing in the country because most of the
beneficiaries are unaware about government skills.
2) Research must be conducted to assess the impact of micro credit through SHG’S
3) Factors responsible for poor performance of SHG’S must be examined &analysed systematically by
the government to resolve the emerging problems & difficulties faced by the SHG’S
4) The SHG’S should train their members properly so that they can improve the performance of SHG’S
5) In order to develop communication skills, leadership skills, entrepreneurship qualities of members of
SHG’S,seminars, workshops, conferences etc should be conducted by the govt.
6) Most of the training programmes are held at taluk&district level so , the govt should try to conduct
training programmes in remote areas & backward villages so that it is the convenient for all the
members in the group
7) Govt should frame some effective development policies for empowerment of rural women.
8) In order to increase or supplement the income level of women beneficiaries , the concerned authorities
must take necessary steps like quick loan facilities to start small businesses in rural areas
Conclusion
SHG’s have got tremendous attention in recent years. Microfinance is an alternative source of credit
for poor’s, this system provides credit for the society , SHG’S programme is the right participatory approach for
eradication of rural poverty & a foundation for rural development .
SHG play a significant role for the development of individual group & society asa whole. More trust needs to
be given in the promotion of SHG’s their coordination & endurance. In male dominated countries like India,
women have been discriminated by the society but now SHG’s have provided aforum to express her view’s ,
participation in decision making & interaction with each other with the help of microfinance , they have also
involved in income generation activities & earning income , through this way they are becoming self-reliant.

IJRCMEAS ISSN 2454-6593
38
References:
1. Manisha Sharma, Vishal Sarin, “Exploring the Benefits of Microfinance Organizations for Poverty
Alleviation (A Research Study conducted in Punjab)” (2011), International Journal of Multidisciplinary
Research.
2. Richard Burhauser, AlenGustman, John Laither, Olivia Mitchell, and Amanda Sonnega “Social Security
Research at the Mighigan Retirement Research” (2009) Social Security Bulletin, Vol. 69, No. 4.
3. S. Mahendra Dev., P. PadmanabhaRao, “Poverty Alleviation Programme in Andhra Pradesh – An
Assessment” (Supported by Planning Commission, Govt. of India (2002).
4. S. Galab, N. Chandrasekhar Rao “Women’s Self-Help Groups, Poverty Alleviation and Empowerment”
(2003) Economic and Political Weekly Publication.
5. NABARD Micro-Finance for SHG Dept., website : www.nabard.org

IJRCMEAS ISSN 2454-6593
39
MAKE IN INDIA
Miss. Simplina Doreswamy, Student
Department of Economics, KLE’s J.T. College, Gadag
Prof. Smt. Asha D Nidavani
• ABSTRACT
MSME sector is one of the most neglected sectors with rescpect to public policy but has immense potential.it
is because MSMEs are the backbone of any industrial economy.Across the world,most transformations have
happened on the back of robust industrial sector,and MSMEs have played a critical role in these
transformations.
• INTRODUCTION
Make in India is an initiative launched by the Government of India to encourage multi-national, as well as
national companies to manufacture their products in India. It was launched by Prime Minister Narendra Modi on
25 September 2014. India hoped to emerge, after initiation of the programme in 2015 as the top destination
globally for foreign direct investment, surpassing the United States of America as well as the People's Republic
of China. In 2015, India received US$63 billion in FDI.
HISTORY
Narendra Modi and Cabinet ministers at the concluding session of the national workshop on Make in India in
New Delhi, 10 December 2014 Prime Minister Narendra Modi launched "Make in India" on 25 September 2014
in a function at the Vigyan Bhavan.[1] On 29 December 2014, a workshop was organised by the Department of
Industrial Policy and Promotion which was attended by PM Modi, his cabinet ministers and chief secretaries of
states as well as various industry leaders.
The major objective behind the initiative is to focus on job creation and skill enhancement in 25 sectors of the
economy. The initiative also aims at high quality standards and minimising the impact on the environment.
initiative hopes to attract capital and technological investment in India
Make in India focuses on the following twenty-five sectors of the economy:
• Automobiles
• Automobile Components
• Aviation
• Biotechnology
• Chemicals
• Construction
• Defence manufacturing
• Electrical Machinery
• Electronic systems
• Food Processing
• Information Technology and Business process management
• Leather

IJRCMEAS ISSN 2454-6593
40
• Media and Entertainment
• Mining
• Oil and Gas
• Pharmaceuticals
• Ports and Shipping
• Railways
• Renewable Energy
• Roads and Highways
• Space and astronomy
• Textiles and Garments
• Thermal Power
• Tourism and Hospitality
• Wellness
As per the new Govt. Policy 100% FDI is permitted in all the above sectors, except for space (100%), defence
(100%) and news media(26%).
THE MAKE IN INDIA VISION
Manufacturing currently contributes just over 15% to the national GDP. The aim of this campaign is to
grow this to a 25% contribution as seen with other developing nations of Asia. In the process, the government
expects to generate jobs, attract much foreign direct investment, and transform India into a manufacturing hub
preferred around the globe.
The logo for the Make In India campaign is a an elegant lion, inspired by the Ashoka Chakra and
designed to represent India's success in all spheres.The campaign was dedicated by the Prime Minister to the
eminent patriot, philosopher and political personality, Pandit Deen Dayal Upadhyaya who had been born on the
same date in 1916.
• WHY PM WANTS TO MAKE IN INDIA
The Prime Minister called for all those associated with the campaign, especially the entrepreneurs and
the corporates, to step and discharge their duties as Indian nationals by First Developing India and for investors
to endow the country with foreign direct investments. The Prime Minister also promised that his administration
would aid the investors by making India a pleasant experience and that his government considered overall
development of the nation an article of faith rather than a political agenda. He also laid a robust foundation for
his vision of a technology-savvy Digital India as complementary to Make In India. He stressed on the
employment generation and poverty alleviation that would inevitably accompany the success of this campaign.
• ADVANTAGES OF MAKE IN INDIA PROJECT
1) Boost India’s Economic Growth:- The make in India campaign will lead to an increase in exports and
manufacturing. An increase in exports will improve the economy and India will be transformed into a global
hub of manufacturing through global investment using the current technology. Manufacturing will also boost
India’s economic growth and GPD.

IJRCMEAS ISSN 2454-6593
41
2) More Job Opportunities:- It will lead to the creation of many job opportunities. Around ten million people are
expected to get jobs. An increase in investment will bring employment opportunities for the skilled labor force
and this will form a job market.
The government is running a skills development programme for the people in the rural areas and those in the
urban areas who are poor. The programme will help in generating more skilled workers. The major key areas of
the training will be painting, masonries, welding and many others. Certifications will be issued in order to make
the training standard.
3) Attract More Foreign Direct Investment (FDI):- It will welcome more FDI. Since the government had
promised to improve the ease of running businesses in India, it is going to attract many FDI. At the moment it
has already received an amount of INR 20 K million from a proposal that was made on October 2014.
4) Investment In India:- Through Make In India Project more companies are looking to set up factories, a unit
known as “Invest India” is in the process of being put to place. This unit will be under the department of
commerce and will be available any time to make it easy to carry out regulatory clearance within the shortest
time possible ensuring that businesses are run in India easily.
• CRITICISM AND CONCERNS
The NDA government's Make In India campaign has till early October attracted INR 2000 crore worth
investment proposals. The campaign has, despite this,found its fair share of critics. The topmost of these
criticisms is leveled against the incumbent government. It has been felt that the government does not walk its
talk - labour reforms and policy reforms which are fundamental for the success of the Make In India campaign
have not yet been implemented. A number of layoffs in companies such as Nokia India cast long shadows over
the campaign. A number of technology based companies have not been enthused by the campaign launch and
have professed to continue getting their components manufactured by China.
• CONCLUSION
Make in india and made in india both can be beneficial for india. India can benefit temporarily from outsourced
manufacturing plants but it cannot stress it beyondm a limit.It should rather focus more on encouraging research
and development and bringing industrial innovation.Make in india should be a start to achieve the long term
goal of made in india.
SKILL INDIA
• ABSTRACT
Among fast growing developing countries, India is distinctive for the role of the service sector. However,
skeptics have raised doubts about the quality and sustainability of the increase in service sector activity and its
implications for economic development. Using national accounts, statistics and cross country data, we show that
the growth of services has been broad based.

IJRCMEAS ISSN 2454-6593
42
• INTRODUCTION :
After ‘Digital India’ and ‘Make in India, the NaMo Government has launched another program in March 2015.
This one is a revised version of programs launched earlier under the skill development policy. This new
program, called ‘Skill India’, is supposed to be a multi-skill program.
• Objectives of ‘Skill India’
The main goal is to create opportunities, space and scope for the development of the talents of the Indian youth
and to develop more of those sectors which have already been put under skill development for the last so many
years and also to identify new sectors for skill development. The new program aims at providing training and
skill development to 500 million youth of our country by 2020, covering each and every village. Various
schemes are also proposed to achieve this objective.
• FEATURES OF ‘SKILL INDIA’
• The emphasis is to skill the youths in such a way so that they get employment and also improve
entrepreneurship.
• Provides training, support and guidance for all occupations that were of traditional type like carpenters,
cobblers, welders, blacksmiths, masons, nurses, tailors, weavers etc.
• More emphasis will be given on new areas like real estate, construction, transportation, textile, gem
industry, jewellery designing, banking, tourism and various other sectors, where skill development is inadequate
or nil.
• The training programs would be on the lines of international level so that the youths of our country can
not only meet the domestic demands but also of other countries like the US, Japan, China, Germany, Russia and
those in the West Asia.
• Another remarkable feature of the ‘Skill India’ program would be to create a hallmark called ‘Rural
India Skill’, so as to standardize and certify the training process.
• Tailor-made, need-based programs would be initiated for specific age groups which can be like
language and communication skills, life and positive thinking skills, personality development skills,
management skills, behavioral skills, including job and employability skills.
• The course methodology of ‘Skill India’ would be innovative, which would include games, group
discussions, brainstorming sessions, practical experiences, case studies etc.
• How is it different from the previous skill development policies?
It’s not that we do not have any skill development program already. The Government of India has
always considered skill development as a national priority. It is just that since the ministry is new, the approach
taken for skill development is also new. Earlier, the emphasis was on traditional jobs. But this time, all kinds of
jobs will be given equal emphasis. Earlier, the responsibility was divided among various ministries, but this
time, these are being clubbed together. The ministry of skill development and entrepreneurship will be the
principal ministry which is going to coordinate with other ministries and organizations.
According to NaMo, Skill India won’t be just a program but a movement. Here, youth who are jobless,
college and school dropouts, along with the educated ones, from rural and urban areas, all will be given value
addition. The new ministry will be the certifying agency. Certificates will be issued to those who complete a
particular skill or program and this certificate has to be recognized by all public and private agencies and
entities, including overseas organizations. Skill India is a program for the entire nation.

IJRCMEAS ISSN 2454-6593
43
ADVANTAGES OF SKILL INDIA
The idea is to raise confidence, improve productivity and give direction through proper skill
development. Skill development will enable the youths to get blue-collar jobs. Development of skills, at a young
age, right at the school level, is very essential to channelize them for proper job opportunities. There should be a
balanced growth in all the sectors and all jobs should be given equal importance. Every job aspirant would be
given training in soft skills to lead a proper and decent life. Skill development would reach the rural and remote
areas also. Corporate educational institutions, non-government organizations, Government, academic
institutions, and society would help in the development of skills of the youths so that better results are achieved
in the shortest time possible.
TO SUM UP
What shape ‘Skill India’ will take and what it will do only time can tell. But no doubt it seems to be a
good initiative – providing skills to people, especially because India is one of the few countries all across the
world whose working age population will be very high, few years down the line, going by its ever-increasing
growth of population, as per the World Bank.
It is also high time now measures are taken to improve the physical and mental development of the
youths of the country so that none of them remains unemployed and the country’s unemployment problem also
gets reduced. It is time to open up avenues by which the youth accepts responsibility and no one remains idle
because an idle youth is a burden to the economy. The economy should concentrate on job creation and social
security schemes. With this new approach towards skill development, India can definitely move forward
towards its targeted results.
• Conclusion:
help countries use skills development to maximize opportunities and mitigate the negative impact of global
drivers of change such as technology, trade and climate change; integrate skills development into national and
sectoral development strategies build seamless pathways of education that connect basic education, vocationa
training, labour market entry and lifelong learning; extend access to education and training for those who are
disadvantaged in society. Connecting skills development to these broader growth, employment and development
strategies requires that governments, working with the social partners, build policy coherence in linking
education and skills development to today’s labour markets and to the technology, investment, trade and
macroeconomic policies that generate future employment growth. This places a high premium on strong social
dialogue, effective coordination among ministries, and improved communication between employers and
training providers. As the conclusions recognize, skills development will not by itself lead to improved
productivity and employment. Other critical factors include employment and productivity policies to influence
the demand side of the labour market, respect for workers’ rights, gender equality, and health and safety
standards; good labour relations and social dialogue; and effective social protection. In short, everyone has a
role to play. The conclusions help identify specific areas of action for governments, the social partners, as well
as the ILO. The Office commits to playing its part in such critical areas as research, knowledge sharing, policy
analysis, and facilitating dialogue and collaboration.

IJRCMEAS ISSN 2454-6593
44
DIGITAL INDIA
• Abstract:
Digitization and digital preservation in India and Iran are very vital to preserve cultural heritage collections, and
also make them accessible to the scholars and public. The investigator has attempted to study the digitization
and digital preservation activities in the select libraries in India and Iran. There are document resources,
especially manuscripts and rare books, which are very valuable, but they are not allowed to be accessed due to
concerns of damage to original documents. By digitization, the originals can be safely secured and the copies
used by researchers for any required information.
• MEANING OF DIGITAL INDIA
Digital India is a campaign launched by the Government of India to ensure that Government services are made
available to citizens electronically by improving online infrastructure and by increasing Internet connectivity or
by making the country digitally empowered in the field of technology.
It was launched on 2 July 2015 by Prime Minister Narendra Modi. The initiative includes plans to connect rural
areas with high-speed internet networks. Digital India consists of three core components. These include:
• The creation of digital infrastructure
• Delivering services digitally
• Digital literacy
What is Digital India?
• Digital India is an initiative by the Government of India to ensure that Government services are made
available to citizens electronically by improving online infrastructure and by increasing Internet connectivity. It
was launched on 1 July 2015 by Prime Minister Narendra Modi.
The initiative includes plans to connect rural areas with high speed internet networks. Digital India has
three core components. These include:
• The creation of digital infrastructure
• Delivering services digitally
• Digital Literacy
NOW LETS MOVE ON TO THE MAJOR ADVANTAGES:
1. Creation of Digital Infrastructure and Electronic Manufacturing in Native India.
2. Digital Empowerment of Native Indian People.
3. Delivery of all Government Services electronically (E-Governance).
4. A Digital Identification which will verify the end user.
5. A Mobile for worldwide access to all services.
6. A Bank account for Immediate Benefit Transfers of subsidies and payments.
7. The program also aims to eliminate all electronics imports from foreign countries by 2020 and make
India a electronics manufacturing super power.
OTHER ADVANTAGES:
• It will help in decreasing crime if applied on whole.
• It will help in getting things done easily.

IJRCMEAS ISSN 2454-6593
45
• It will help in decreasing documentation.
• Some of the services which will be provided through this desire effort are Digital Locker, e-education,
e-health, e-sign and nationwide scholarship portal.
• It will ostensibly create a lot of jobs.
• It will be a boost to industry; both large and small enterprises.
Digital India without a doubt is a very commendable project and deserves full support. As far no disadvantages
could be noticed as its a initiative we are talking about. However, the initiative also lacks many crucial
components including lack of legal framework, absence of privacy and data protection laws, civil liberties
abuse possibilities, lack of parliamentary oversight for e-surveillance in India, lack of intelligence related
reforms in India, insecure Indian cyberspace, etc.
• CONCLUSION:
This paper has shown the despite its lively democracy, strong tradition of press freedom and political debates,
india is in many ways struggling to find the right balance between freedom of expression online and another
concerns such as security. While civil society is becoming increasingly vocal in attempting to push this balance
towards freedom of expression.
SMART CITIES INITIATIVES
• ABSTRACT
The concept of smart city is getting more and more relevant for both academics and policy makers. Despite this,
there is still confusion about what a smart city is, as several similar terms are often used interchangeably. This
paper aims at clarifying the meaning of the word “smart” in the context of cities through an approach based on
an in-depth literature review of relevant studies as well as official documents of international institutions. It also
identifies the main dimensions and elements characterizing a smart city. The different metrics of urban
smartness are reviewed to show the need for a shared definition of what constitutes a smart city, which are its
features, and how it performs in comparison to traditional cities. Furthermore, performance measures and
initiatives in a few smart cities are identified.
WHAT IS SMART CITY :
The first question is what is meant by a ‘smart city’. The answer is, there is no universally accepted definition of
a smart city. It means different things to different people. The conceptualization of Smart City, therefore, varies
from city to city and country to country, depending on the level of development, willingness to change and
reform, resources and aspirations of the city residents. A smart city would have a different connotation in India
than, say, Europe. Even in India, there is no one way of defining a smart city. Some definitional boundaries are
required to guide cities in the Mission. I
In the imagination of any city dweller in India, the picture of a smart city contains a wish list of infrastructure
and services that describes his or her level of aspiration. To provide for the aspirations and needs of the citizens,
urban planners ideally aim at developing the entire urban eco-system, which is represented by the four pillars of
comprehensive development-institutional, physical, social and economic infrastructure. This can be a long term
goal and cities can work towards developing such comprehensive infrastructure incrementally, adding on layers
of ‘smartness’. In the approach of the Smart Cities Mission, the objective is to promote cities that provide core
infrastructure and give a decent quality of life to its citizens, a clean and sustainable environment and
application of ‘Smart’ Solutions. The focus is on sustainable and inclusive development and the idea is to look
at compact areas, create a replicable model which will act like a light house to other aspiring cities. The Smart
Cities Mission of the Government is a bold, new initiative. It is meant to set examples that can be replicated

IJRCMEAS ISSN 2454-6593
46
both within and outside the Smart City, catalyzing the creation of similar Smart Cities in various regions and
parts of the country. The core infrastructure elements in a smart city would include: i. adequate water supply, ii.
Assured electricity supply, iii. sanitation, including solid waste management, iv. efficient urban mobility and
public transport, v. affordable housing, especially for the poor, vi. robust IT connectivity and digitalization, vii.
good governance, especially e-Governance and citizen participation, viii. Sustainable environment, ix. safety
and security of citizens, particularly women, children and the elderly, and x. health and education.
What are the pros and cons of the proposed smart cities by the Modi government
"Is in the intersect between competitiveness, Capital and Sustainability. The smart cities should be able to
provide good infrastructure such as water, sanitation, reliable utility services, health care; attract investments;
transparent processes that make it easy to run a commercial activities; simple and on line processes for obtaining
approvals, and various citizen-centric services to make citizens feel safe and happy."
So a smart city is basically a city that functions properly and is run by competent people. The city will have to
have its various agencies in sync with each other to optimize standards of living.
Now that we have that defined and explained, here's the pros are plan:
• PROS
1) According to the UN, India will add the greatest number of people to it's urban population in
the next 50 years. According to the report, India will add 500 million people to it's cities by
2050. To accommodate this population, India MUST build cities to add to the existing ones
since we all know how crowded they are.
•
2) The usage of technology would allow a city to run itself efficiently and would provide a
partial solution to the various problems plaguing our cities. These include traffic, pollution,
water supply, electricity supply, industrialization etc. I'll address them in the next points.
3) Security: A smart city would theoretically use CCTV cameras , hotlines panic buttons,
Identification systems to ensure the security of it's population. A smart city would be able to
react efficiently and quickly to alarms raised in various parts of the city, direct services by
coordinating with it's traffic department.
4) Water/Waste: A smart city would ensure that water and waste management systems would
work better than they are now, leading to less environmental damage. Only 30% of India's
waste is treated and most of it is dumped directly into rivers and landfill.
CONS
1) Capital - Like all grand infrastructure plans, this one needs a critical resource , CAPITAL. India doesn't have
enough capital to produce 100 cities. I fear that if too many of these are made at once, they'll end up as half
finished Detroit’s.

IJRCMEAS ISSN 2454-6593
47
2) Corruption - A smart city wouldn't eliminate corruption. Corruption might just become more sophisticated
and lead to all the benefits being washed away. This can be changed through fostering a culture of
accountability and honesty.
3) Existing cities - There are a huge number of cities in India that could theoretically be the Smart cities we
think of. Upgrading cities like Mumbai, Delhi, Mangalore, Bhilai, Raipur, Allahabad, Kanpur, Vyzag, Pune ,
Amritsar, Cochin, Bhopal, Nagpur, Kolkata, Surat etc would be far more beneficial than creating new ones.
Extremely high rise apartment blocks should be encouraged to conserve land around these paces.
4) Gap between poor and rich : There is a risk that the gap between the poor and the rich might increase ,
especially if the working classes can't find any place in the new cities. A better solution would be to construct
affordable housing in the 2nd tier cities I mentioned above.
CONCLUSION: The wider smart city plan if we can tell it that, appears to have suffered from a heavy impact
from the hard left greens. We see a real slant in wording and content to mitigate our impact on environment
rather than a balanced view which takes all of the various aspects of a smart city into account. The only action
of recent days, as an example, has been the council insulating some of its properties. Again, a good thing to go,
however, passing this off as progress on a smart city plan.

IJRCMEAS ISSN 2454-6593
48
ROLE OF HUMAN CAPITAL IN LONG TERM GROWTH
Mr. Arun Ullagaddi,
Student, Department of Economics
Miss. Priyanka Raikar,
Student, Department of Economics
Prof. Smt. Asha D Nidavani
Faculty- Department of Economics
ABSTRACT
Recent theoretical contributions to the grow the literature emphasize the role of hum an capital in the
process of economic growth. Meanwhile, the empirical literature on the link between hum an capital and growth
has changed course several times over the last decade. On balance, the evidence now seems to indicate that
educational expansion does contribute to output growth. There also appear to be grounds for thinking that hum
an capital has a substantial im pact on technological catch-up, possibly through I am proving a country’s
capacity to adopt new technologies. However, the literature is subject to many methodological and conceptual
weaknesses, such as the inadequacy of empirical human capital proxies and reverse causality. Therefore, these
conclusions have to be considered preliminary and fragi.
INTRODUCTION
The idea that human capital plays an important role in explaining income Differences has been present
in economists’ thinking for a long time. By some accounts, it can even be traced to the work of Adam Smith and
Alfred Marshall although it was not until the middle of the 20th century that Gary Becker and others developed a
theory of hum an capital. This theory, according to which a person’s level of education and experience
determine his or her (labor) income, was originally envisaged in a microeconomic context, but has subsequently
been applied to macroeconomics. Growth accountants such as Denison and Jorgenson/Griliches examined to
what extent changes in the quality of the workforce could explain the “residual” total factor productivity (TFP)
unaccounted for by increases in labor and capital inputs.
The objectives of HRM may be as follows:
1. To create and utilize an able and motivated workforce, to accomplish the basic
Organizational goals.
2. To establish and maintain sound organizational structure and desirable working relationships among all
the members of the organization.
3. To secure the integration of individual or groups within the organization by co-ordination of the
individual and group goals with those of the organization.
4. To create facilities and opportunities for individual or group development so as to match it with the
growth of the organization.
5. To attain an effective utilization of human resources in the achievement of organizational goals.

IJRCMEAS ISSN 2454-6593
49
6. To identify and satisfy individual and group needs by providing adequate and equitable wages,
incentives, employee benefits and social security and measures for challenging work, prestige,
recognition, security, status.
7. To maintain high employees morale and sound human relations by sustaining and improving the various
conditions and facilities.
8. To strengthen and appreciate the human assets continuously by providing training and development
programs.
9. To consider and contribute to the minimization of socio-economic evils such as unemployment, under-
employment, inequalities in the distribution of income and wealth and to improve the welfare of the
society by providing employment opportunities to women and disadvantaged sections of the society.
10. To provide an opportunity for expression and voice management.
11. To provide fair, acceptable and efficient leadership.
12. To provide facilities and conditions of work and creation of favorable atmosphere for maintaining
stability of employment.
USESS OF HUMAN CAPITAL
1. BETTER EDUCATION
]
Increase in education is the major factor of human capital formation. Education is a
major form of investment in human capital, which provides as a key input in human resource
development. Education improves the quality of manpower and enables the skilled workers to
manage the developing technology of the country.
2. ON-THE-JOB TRAINING
Low literacy rate leads to low efficiency of workforce. Heavy amount of
investment is needed to provide training to the on job employees. Provisions of training facilities,
practical applications and refresher courses will lead to:
3. NON-MATERIAL CAPITAL DEVELOPMENT
More attention is given to material capital formation rather than human capital formation
in Pakistan. In fact, more concentration should be given to human capital formation because it
improves the services of engineers, technicians and administrators, which cause in economic
growth and development.
4. MANPOWER PLANNING
Rapidly growing population and improper manpower planning are resulted in
unemployment and under-employment. Due to improper labour market, there is brain drain in

IJRCMEAS ISSN 2454-6593
50
Pakistan. Availability of proper manpower planning is also a main factor of human capital
formation.
5. HEALTH AND NUTRITION
Poor population is backward also in Pakistan. Rapidly growing population has not proper
health and nutrition facilities. If a worker is not healthy and fully nourished then it is impossible
for it to maintain the efficiency.
6. HOUSING FACILITIES
Appropriate housing facilities are the basic right of the population. It is the basic
necessity of life and an important factor of human capital formation. Housing facilities are not in
a satisfactory situating in Pakistan. Effective planning of government is required to provide
proper houses and shelters to the existing population
7. WATER AND ELECTRICITY FACILITIES
Drinking water and electricity facilities in Pakistan are insufficient and irregular. There
is problem of load-shedding, which inversely affect the productivity level. These facilities are
compulsory for the human capital formation in their advanced form.
8. CO-EXISTENCE OF CAPITALS
Capital is one of the most important factors of production. But only the capital is not
enough to utilize the resources properly. Increase in saving and investment is not responsible for
the utilizations of resources. Capital without human capital has less importance in economics.
Accordingly, co-existence of both capitals is necessary for economic growth and development.
9. FULL UTILIZATION OF RESOURCES
Better utilization of available resources is impossible with the help of only saving and
investment. Human capital formation is also required for the optimal allocation of resources of a
country.
10. EFFECTIVE PLANNING
The effective planning is possible only if there are a large number of educated engineers,
trained doctors and healthy labour force etc. in the country.

IJRCMEAS ISSN 2454-6593
51
THE MAIN PROBLEMS OF HUMAN CAPITAL
1. RAPIDLY GROWING POPULATION
Growth rate of population is very fast. Increase in resources is less than increase in
population. High population growth rate of 2.1 % is a big problem in way of human capital
formation.
2. LACK OF AWARENESS
People of Pakistan are not aware of with the role of the available resources. Due to lake
of education, people are ignorant and have not enough knowledge to evaluate the hidden benefits.
3. UNEQUAL DISTRIBUTION OF WEALTH
There are various disparities in the country due to unequal distribution of income and
wealth. Only rich class can participate in economic activities and in the creation of human
capital. A little portion of population can afford the higher education, which is so costly. 20 %
poor population has control on only 6 % national resources in Pakistan.
4. INVESTMENT IN BUILDINGS AND EQUIPMENTS
People in less developed countries like to invest in building, equipment, gold and silver
ornament and other real states. They have little trend to invest in human resources that is also a
big problem to develop the human capital.
5. INAPPROPRIATE EDUCATION
Education system in developing countries is backward. Literacy rate is 57.7% and
expenditure on education is only 1.8 % of GDP in Pakistan.
6. NO PROPER TRAINING FOR EMPLOYEES
There is no availability of training facilities for the employees in Pakistan. Training
facilities are necessary for the up-dating and refreshing the knowledge. These are also some other
problems of human capital formation.

IJRCMEAS ISSN 2454-6593
52
7. LESS PROMOTION FOR EMPLOYEES
Another problem in way of human capital development is that there is high rate of
unemployment and under-employment in developing countries. On the other hand, there is less
reward of the hard work and efficiency.
8. AGRICULTURE, THE MAIN OCCUPATION
Mostly people have outdated knowledge and almost 2/3 of the population is attached
with agricultural sector. In this situation, people have no or less trend to be educated,
CONCLUSION:
Investment in human capital is also required to raise the general living standards of the
people in developing countries. This is possible when education and training make full and
rational utilization of surplus manpower by providing larger and better job opportunities in both
rural and urban areas. There is more return raise in income and improvement in living standard of
the population due to capital formation.

IJRCMEAS ISSN 2454-6593
53
RURAL ENTERPRENUERSHIP AND INCLUSIVE GROWTH
Prof. Smt. Asha D Nidavani
Associate Professor, HOD Department of Economics, KLE’s J.T. College, Gadag
� ABSTRACT
The emergence of entrepreneurs and their contribution to the national economy is quite visible in
India. The numbers of entrepreneurs have grown over a period of time, especially in the 1990s.
Entrepreneurs need to be lauded for their increased utilization of modern technology, increased
investments, finding a niche in the export market, creating a sizable employment for others and setting the
trend for other entrepreneurs in the organized sector. While entrepreneurs have demonstrated their potential,
the fact remains that they are capable of contributing more. Entrepreneurship needs to be studied
separately for two main reasons. The first reason is that, entrepreneurship has been recognized during the
last decade as an important untapped source of economic growth. Entrepreneurs create new jobs for
themselves and others and also by being different. They also provide the different solutions to management,
organization and business problems as well as to the exploitation of entrepreneurial opportunities. The
second reason is that the topic of in entrepreneurship has been largely neglected both in society in general
and social sciences.
Rural access to financial services is a key factor of successful rural development strategies for inclusive
growth. Designing appropriate financial products for to be able to save, borrow and insure is essential to
strengthen the role as producers and widen the economic opportunities available to them. For this purpose it is
essential to understand how context-specific legal rights, social norms, family responsibilities and’s access to
control over other resources shape their need for capital and their ability to obtain it. It is important that
development strategies that aim to boost rural’s productive capacity.
� RURAL CREDIT PROGRAMS
The rural credit programs have been broadly classified into self-employment programs, wage employment
programs, food safety program and social security programs. The focus is on the central government schemes
only. It is not possible to map the special programs of all the States. It must be noted here that some of the
progressive States have added additional components or given further subsidy to enhance the benefits of the
central schemes towards inclusive growth.
CREDIT FOR RURAL & INCLUSIVE GROWTH
Field experiences show that in all major activities that rural entrepreneurship are engaged in direct
access to credit could serve as an important means of enhancing their economic participation. It is generally
recognized that could be depended upon to use their earnings more sharply for family welfare (food, health,
shelter and education of children) as compared with men. However the economic role has been largely
unacknowledged and undervalued into finance and extension services. In such a context, direct provision of

IJRCMEAS ISSN 2454-6593
54
credit is considered as an important way to initiate a process of social and economic change. For that the
facilitate of transition from a life of dependency and social disadvantage to greater self confidence and self-
reliance towards the inclusive growth.
Advantages Of Rural Enterprenuership
� CREDIT SCHEMES- REPAYMENT ISSUES
Field experiences with credit schemes have shown that, in general, rural are good credit risks. Their
loan repayment record has usually been high and invariably better than that of men in similar circumstances.
They have proved to be more responsive to self-discipline in repayment, to take their loan obligations more
seriously and are more afraid of defaulting compared with men. Statistical reporting on loan recoveries,
however, is not gender disaggregated to indicate the credit worthiness. It is also generally the case that informal
saving and credit practices are more commonly prevalent among, which have provided them with useful credit
experiences. Rural, however, are often constrained in engaging production activity by several factors. Time
consuming domestic work or household chores is one constraint.
� LIVELIHOOD ACTIVITIES-CREDIT SUPPORT
They often need to spend long hours on collection of water from distant sources, on collection of
firewood and on processing and cooking food leaving, little time for income earning activity. In such
situations, credit supported new economic activities could even increase their work burden. Hence the
importance of initiatives to free the time for production activity e.g., improvement of water supply,
community woodlots, fuel-efficient stoves, time-saving technologies and awareness build-up among men to
share household work burdens. Socio cultural factors, male domination and illiteracy are further factors that
operate to constrain demand for production credit. In some traditional societies, it is not merely the wish
that counts, but also whether husbands and village leaders want to have access to loans. Their
disadvantaged position in society coupled with low educational level could adversely affect their initiatives
and they may shy away from dealing with formal credit sources. Overall demand for production credit tends
to require a longer time to develop than that of men and may need conscious promotion. Hence, direct
access to credit may also have to be phased out to stimulate interest and develop confidence in credit use.
The first stage may simply involve the formation of savings groups and pooling of resources for provision
of small loans which gives the members confidence in their ability to use and payback credit. Group based
lending, with joint-and-several-liability appears to encourage undertaking of financial risk by, which they
might not be able to assume as soon on their own. Many of the more successful credit programs use this
approach now.
� GROUPS-CREDIT SUPPORT
Much of the field experience to-date indicate that often prefer to form their own groups for obtaining access
to credit, separate and distinct from those of men. The situation in this regard would obviously differ from
one social context to another. The decision to form separate or mixed groups would depend upon the

IJRCMEAS ISSN 2454-6593
55
confidence in them and in the men who would join the group concerned, and their perceived ability operate
on equal terms with men within a mixed organization. Separate groups are often preferred to feel more
comfortable among themselves they may also acquire greater leadership skills and self- SINGAPOREAN
JOuRNAl Of buSINESS EcONOmIcS, ANd management studies.
SUGGESTIONS
1. A broadly-based Rural development strategy must therefore give high priority to enhancing the access
to financial services and recognize the need for a multipronged approach that combines corrective
measures to remove obstacles that constrain ’s participation with deliberate interventions to ensure that
rural policies and programs are planned, designed, implemented, monitored and evaluated in a gender-
sensitive way. The following are some of the development strategies.
2. All credit programs need to evolve common set of indicators for measuring progress on the
empowerment in order to assess the contribution of distinct strategies towards rural empowerment.
3. There is need to streamline government programs and to ensure convergence of schemes, so that
officials’ support for skill training, extension support, credit and other enterprise related services may
be accessed easily.
4. Offer financial literature training to ensure which can compare products and make decisions based on a
clear understanding of the characteristics and conditions of the products available.
5. There is need to accept self-employment. The Programs should be designed on the basis of the needs of
the micro level. Planning for self-employment for needs a multipronged strategy.
6. The various categories for financial institutions in rural market have exhibited different potentials in
serving rural. There is need to synchronize their efforts so the work becomes supplementary and
complementary in serving.
7. Promote and assist the creation of groups in which we can find a safe space to experiment with new
projects, technologies or economic activities and the support of which can leverage in their
interactions with their families and their communities, as well as with financial institutions, input
providers and potential buyers
Rural Entrepreneurship can do wonders by their effectual and competent involvement in
entrepreneurial activities. The rural entrepreneurship is having basic indigenous knowledge, skill,
potential and resources to establish and manage enterprise. Now the need is knowledge regarding
accessibility to loans, various funding agencies procedure regarding certification, awareness on
government welfare programs, motivation, technical skill and support from family, government and
other organization. More over Formation and strengthening of rural Entrepreneurs network must be
encouraged.

IJRCMEAS ISSN 2454-6593
56
FINANCIAL INCLUSION IN INDIA: ROLE OF BANKING SECTOR
Santosh S. Chavan
MBA, M.Com
Faculty Dept. of Commerce
Jain College of BBA, BCA & B.Com Belagavi
Abstract
As the majority of the rural population is still not included in the inclusive growth, the concept of financial
inclusion becomes a challenge for the Indian economy. Since 2005, many concerted measures are initiated by
the Reserve Bank of India and Government of India in favor of financial inclusion but the impact of these did
not yield satisfactory results. The paper aims to focus on utilizing the existing resources such as Mobile phones,
Banking Technologies, India Post Office, Fair Price Shops and Business Correspondents (BCs) thereby making
it more efficient and user friendly for the interest of the rural population as well as the formal sector.
Banking sector plays considerable role in bringing financially excluded people in to formal financial sector as
policies of the government and Reserve Bank towards financial inclusion are implemented through banking
sector.
Financial Inclusion is an important priority of the Government. The objective of Financial Inclusion is to extend
financial services to the large hitherto un-served population of the country to unlock its growth potential. In
addition, it strives towards a more inclusive growth by making financing available to the poor in particular.
There have been major reforms in the Indian Banking sector following the various schemes launched by the
present & the previous governments. In India majority of the schemes introduced by the government are
implemented through the banks.
This paper makes an attempt to assess the role of banking sector in financial inclusion process in India. Role of
banks in financial inclusion process in India is examined on the basis data available from the various schemes
made available by the government through the banks in India.
Keywords: Financial inclusion, Business correspondents, Indian economy,
Introduction
With the progress of the Indian economy, especially when the focus is on the achievement of sustainable
development, there must be an attempt to include maximum number of participation from all the sections of the
society. But the lack of awareness and financial literacy among the rural population of the country is hindering
the growth of the economy as majority of the population does not have access to formal credit. This is a serious
issue for the economic progress of the country. In order to overcome such barriers, the banking sector emerged
with some technological innovations such as automated teller machines (ATM), credit and debit cards, internet
banking, etc. Though introduction of such banking technologies brought a change in the urban society, a
majority of the rural population is still unaware of these changes and is excluded from formal banking.
Financial inclusion enables improved and better sustainable economic and social development of the country. It
helps in the empowerment of the underprivileged, poor and women of the society with the mission of making
them self-sufficient and well informed to take better financial decisions. Financial inclusion takes into account
the participation of vulnerable groups such as weaker sections of the society and low income groups, based on
the extent of their access to financial services such as savings and payment account, credit insurance, pensions
etc. Also the objective of financial inclusion exercise is easy availability of financial services which allows

IJRCMEAS ISSN 2454-6593
57
maximum investment in business opportunities, education, save for retirement, insurance against risks, etc. by
the rural individuals and firms.
The penetration of financial services in the rural areas of India is still very low. The factors responsible for this
condition can be looked at from both supply side and demand side and the major reason for low penetration of
financial services is, probably, lack of supply. The reasons for low demand for financial services could be low
income level, lack of financial literacy, other bank accounts in the family, etc. On the other hand, the supply side
factors include no bank branch in the vicinity, lack of suitable products meeting the needs of the poor people,
complex processes and language barriers.
Since 2005, the Reserve Bank of India (RBI) and the Government of India (GOI) have been making efforts to
increase financial inclusion. Measures such as SHG-bank linkage program, use of business facilitators and
correspondents, easing of Know Your Customer (KYC) norms, electronic benefit transfer, separate plan for
urban financial inclusion, use of mobile technology, bank branches and ATMs, opening and encouraging ‘no-
frill-accounts’ and emphasis on financial literacy have played a significant role for increasing the use of formal
sources for availing loan/ credit. Measures initiated by the government include, opening customer service
centers, credit counseling centers, KisanCredit Card, Mahatma Gandhi National Rural Employment Guarantee
Scheme and Aadhar Scheme. These renewed efforts are more focused than the earlier measures which were
more general in nature having a much wider scope. Though the measures were initiated earlier, their impact on
the rural population needs to be analysed and reframed in order to understand the present scenario in the rural
areas.
National focus on inclusive growth
Today, there is a national as well as global focus on inclusive growth. The Financial Stability and Development
Council (FSDC) headed by the Finance Minister is mandated to focus on financial inclusion and financial
literacy. All financial sector regulators including the Reserve Bank of India are committed to the mission. And,
very publicly, so are banks and other financial sector entities. If we are advocating any kind of stability whether
financial, economic, political or social and inclusive growth with stability, it is not possible to attain these goals
without achieving financial inclusion. Financial inclusion promotes thrift and develops culture of saving,
improves access to credit both entrepreneurial and emergency and also enables efficient payment mechanism,
thus strengthening the resource base of the financial institution which benefits the economy as resources become
available for efficient payment mechanism and allocation. Empirical evidence shows that countries with large
proportion of population excluded from the formal financial system also show higher poverty ratios and higher
inequality. Thus, financial inclusion is no longer a policy choice today but a policy compulsion. And, banking is
a key driver for financial inclusion/inclusive growth
Definition of Financial Inclusion
According to the Planning Commission (2009), Financial inclusion refers to universal access to a wide range of
financial services at a reasonable cost. These include not only banking products but also other financial services
such as insurance and equity products. The household access to financial services includes access to
contingency planning, credit and wealth creation. Access to contingency planning would help for future savings
such as retirement savings, buffer savings and insurable contingencies and access to credit includes emergency
loans, housing loans and consumption loans. On the other hand, access to wealth creation includes savings and
investment based on household’s level of financial literacy and risk perception.

IJRCMEAS ISSN 2454-6593
58
GOI (2008) defines Financial inclusion as the process of ensuring access to financial services and timely and
adequate credit where needed by vulnerable groups such as weaker sections and low income groups at an
affordable cost. The meaning of financial inclusion is delivery of financial services to the low income groups
especially the excluded sections of the population with the provision of equal opportunities. The main target is
the access of financial services for better standard of living and income.
According to Chakraborty (2011), financial inclusion is the process of ensuring access to appropriate financial
products and services needed by all sections of society including vulnerable groups such as weaker sections and
low income groups at an affordable cost in a fair and transparent manner by mainstream institutional players.
This issue started gaining importance recently in the news media.
However, as is the case with several issues in India, financial inclusion has remained a pipe dream with a
majority of Indians continuing to lack access to banking services
Dimensions of Financial Inclusion with the Banks
The level of financial inclusion in India can be measured based on three tangible and critical dimensions. These
dimensions can be broadly discussed under the following heads:
1. Credit Penetration
Credit Penetration takes the average of the three measures: number of loan accounts per one lakh population,
number of small borrower loan accounts per one lakh population and number of agriculture advances per one
lakh population.
2. Deposit PenetrationDeposit penetration can be measured as the number of saving deposit accounts per
one lakh population. With the help of this measure, the extent of the usage of formal credit system can be
analysed.
3. Branch Penetration
Penetration of a bank branch is measured as number of bank branches per one lakh population.This refers to the
penetration of commercial bank branches and ATMs for the provision of maximum formal financial services to
the rural population.
Among the three dimensions of financial inclusion, credit penetration is the key problem in the country as the all
India average ranks the lowest for credit penetration compared to the other two dimensions. Such low
penetration of credit is the result of lack of access to credit among the rural households. Therefore, the problem
of low penetration needs to be understood more deeply. An attempt has been made to study the problem by
examining the progress of financial inclusion over the years and efforts made by the government for reducing
the low penetration of credit.
The progress in the development of financial inclusion in India can be examined by understanding the stages
involved in it. The concept of examining financial access became important immediately after the All-India
Rural Credit Survey that was completed in the 1950s. The results of the survey revealed that farmers relied
heavily on money-lenders in the year 1951-52. Only the urban areas had large number of bank branches
compared to rural areas. Such a condition continued in the country until RBI started financial inclusion growth
model in the 2000s. Because the urban areas were fully concentrated with numerous bank branches, this resulted

IJRCMEAS ISSN 2454-6593
59
in the higher absorption of bank credit in the urban areas. Thus, the growth of the private business credit was
seen in the year 1957-61 from 44 percent to 60 percent in the year 1970.
Past Measures taken by the Government through Banks for Financial Inclusion
• Nationalization of banks (1969, 1980)
• Priority Sector Lending requirements
• Establishment of Regional Rural Banks (RRBs) (1975, 1976)
• Service area approach (1989)
• Self-help group-bank linkage program (1989,1990)
Pradhan Mantri Suraksha Bima Yojana:
Considered to be the cheapest accidental death cum disability insurance policy with an annual premium of just
Rs. 12, it has received a massive positive response from most of the Indians. Although the insurance cover is
small which is Rs. 2, 00, 000 for accidental death and Rs. 1, 00, 000 for partial disability but considering the fact
that nearly 80% of the country’s population do not have any insurance, the scheme has evoked a very good
response as it will further increase the insurance penetration to the remotest locations of India. Till now, due to
high annual premium by private insurance companies not everyone was able to buy policy. But this has become
possible with Suraksha Bima. Get to know the details of PMSBY.
Pradhan Mantri Jeevan Jyoti Bima Yojana:
Similar to PMSBY, PMJJBY is also the cheapest life insurance policy with an annual premium of Rs. 330 and
moreover it does not require medical examination. The cover offered under the yojana is Rs. 2, 00, 000 and the
termination of policy takes place after the policy holder reaches the age of 55 years.
Objective of both PMJJBY and PMSBY is to provide financial security to the family of policy holder in an
event of his/her death.
Atal Pension Yojana:
This pension scheme was launched with a sole purpose of providing pension to the workers from unorganized
sector after the retirement to meet their daily needs. Contribution can be done monthly/quarterly/every 6 month
and equal amount will be contributed by the government of India with an option to prematurely exit from the
scheme before the age of 60 years. Pension amount receivable would be in the range of Rs. 1,000-Rs.5, 000.
Detailed information on APY is available here.
Jeevan Suraksha Bandhan Yojana:
This scheme is a Raksha Bandhan gift and is launched with an objective to drive PMSBY and PMJJBY.
Through this yojana, brothers can gift social security schemes to their sisters by purchasing gift card worth Rs.
351 and deposit scheme worth Rs. 201 which will be used for making the premium payment for Suraksha Bima
Yojana and Jeevan Jyoti Bima Yojana. Apart from this, term deposit scheme worth Rs. 5001 can also be taken

IJRCMEAS ISSN 2454-6593
60
which will serve two purposes – premium payment for PMSBY and PMJJBY for the first year and remaining
money would be investment for term deposit for 10 years. Readdetails of Suraksha Bandhan Yojana.
Pradhan Mantri Jan Dhan Yojana:
Opening zero balance saving account for every unbanked Indian household was the main objective behind the
launch of PMJDY. Overdraft facility of Rs. 5,000 is also available provided the account is kept active for 6
months after opening. Some banks are also opening account to existing customers whereas majority of them
have restricted to only those with no bank account. Explore features of PMJDY.
Sukanya Samriddhi Yojana:
With a mission to secure the financial future of the girl child, this small savings scheme SSA – was launched
under the Beti Padhao Beti Bachao initiative. For the current year i.e. 2015-2016, the interest rate offered is
9.2%. For e.g. in this scheme if you invest Rs. 20,000 for 14 years, the maturity amount will be Rs. 10, 67, 528
(assuming 9.2% interest). Check out table containing investment amount and maturity amount for SSA.
Parents or local guardians can open account in the name of the girl child at post offices orvarious banks
designated by Reserve Bank of India. Moreover the interest income and investments are eligible for tax
deduction under section 80C of Indian income tax act, 1961 and the scheme matures once the girl child reaches
the age of 21 years. For opening the account, initial deposit of Rs. 1,000 has to be made. And next year onwards,
deposit can be made for amount ranging from Rs. 100 to Rs. 1, 50, 000. Premature withdrawal is possible only
when girl gets married before the maturity. The interest rate would be declared by the government every year.
When the scheme was launched in the year 2014-2015, the interest offered was 9.1%.
It is now our duty to further spread the awareness of these schemes so that Indians located in remotest places
can get basic access to financial services at an affordable rate
Swabhimaan
Is a campaign of the Government of India which aims to bring banking services to large rural areas. It was
launched by Smt. Sonia Gandhi, the Chairperson of theUnited Progressive Alliance party in the presence of Shri
Pranab Mukherjee, the Union Finance Minister and Shri Namo Narain Meena, the Union Minister of State for
Finance on February 10, 2011.[1] This campaign is to be operated by the Ministry of Finance, Government of
India and the Indian Banks' Association (IBA) to bring banking within the reach of the masses of the Indian
population.
An initiative which seeks better financial inclusion within India will strive for rolling out banking services in
20,000 villages without banking services with a population of 2000 by March 2012 as to improve participation
of rural folks in different plans launched by government for them. Under this plan, Banks will select business
correspondents (bank saathi). They will act as intermediaries between the rural people and the banks. The
government has targeted to cover at least 74,000 new habitations with a population of 2,000 and above and open
at least 50 million new accounts by March 2012.
The key idea is that there is need for village level presence – a customer-facing channel that is close to the
customer preferably at a walking distance of not more than three to four kilometers. For this, it is important to
have entities which are good at delivering outreach while operating in very difficult remote conditions. Besides
giving access to banking, it also enables government subsidies and social security benefits to be directly credited
to the accounts of the beneficiaries, enabling them to draw the money from the bank saathi or business
correspondents in their village itself.

IJRCMEAS ISSN 2454-6593
61
Salient recommendations
� Banks have to make special efforts to step up account opening for females, and the Government may
consider a deposit scheme for the girl child – Sukanya Shiksha - as a welfare measure.
� Given the predominance of individual account holdings (94 per cent of total credit accounts), a unique
biometric identifier such as Aadhaar should be linked to each individual credit account and the information
shared with credit information companies to enhance the stability of the credit system and improve access.
� To improve ‘last mile’ service delivery and to translate financial access into enhanced convenience and
usage, a low-cost solution should be developed by utilisation of the mobile banking facility for maximum
possible G2P payments.
� In order to increase formal credit supply to all agrarian segments, digitisation of land records is the way
forward. This should be backed by an Aadhaar-linked mechanism for Credit Eligibility Certificates to facilitate
credit flow to actual cultivators.
� To phase out the agricultural interest subvention scheme which has distorted the agricultural credit
system and ploughing the subsidy amount into an affordable technology aided universal crop insurance scheme
for marginal and small farmers for all crops with a monetary ceiling of Rs.200,000 at a nominal premium to end
agrarian distress.
� A scheme of ‘Gold KCC’ (kisan credit card) with higher flexibility for borrowers with prompt
repayment records, which could be dovetailed with a government-sponsored personal insurance, and digitisation
of KCC to track expenditure pattern.
� Encourage multiple guarantee agencies to provide credit guarantees in niche areas for micro and small
enterprises (MSEs), and explore possibilities for counter guarantee and re-insurance.
� Introduction of a system of unique identification for all MSME borrowers and sharing of such
information with credit bureaus.
� Establishing a system of professional credit intermediaries/advisors for MSMEs to help both the sector
banks in credit assessment.
� To further step up financing of the MSE Sector a framework for movable collateral registry may be
introduced.
� Commercial banks may be enabled to open specialised interest-free windows with simple products like
demand deposits, agency and participation certificates on the liability side and cost-plus financing and deferred
payment, deferred delivery contracts on the asset side.
� An eco-system comprising multiple models should be encouraged with will foster partnerships
amongst national full-service banks, regional banks of various types, NBFCs, semi-formal financial institutions,
as well as the newly-licensed payments banks and small finance banks.
� Banks’ business model to integrate Business Correspondents (BCs) with appropriate monitoring by
designated link branches and greater mix of fixed location BC outlets to win the confidence of the common
person.
� Introduction of a system of online registration of BCs, their training and monitoring their activity
including delinquency, and entrusting more complex financial products such as credit to trained BCs with good
track record.
� A geographical information system (GIS) to map all banking access points
� To step up the self help group (SHG)-bank linkage programme (SBLP) initiated by NABARD with the
help of concerned stakeholders including government agencies as a livelihood model.

IJRCMEAS ISSN 2454-6593
62
� Corporates should be encouraged to nurture SHGs as part of their Corporate Social Responsibility
(CSR) initiatives.
� Provision of credit history of all SHG members by linking with individual Aadhaar numbers to check
over-indebtedness
� To restore tax-exempt status for securitisation vehicles for efficient risk transfer.
� More ATMs in rural and semi-urban centres, interoperability of micro ATMs and use of application-
based mobiles as point- of- sale (PoS) for creating more touch points for customers.
� National Payments Corporation of India (NPCI) to develop a multi-lingual mobile application for
customers who use non-smart phones, especially for users of national unified USSD platform (NUUP).
� Permit a small-value cash-out with adequate KYC along for non-bank prepaid payment instruments
(PPIs) to incentivise usage.
� To allow PPI interoperability for non-banks.
� Levying a surcharge on credit card transactions by merchant establishments should not be allowed.
� Banks to complete the task of linking of deposit accounts with Aadhaar in a time bound manner so as
to create the necessary eco-system for social cash transfer.
� Financial Literacy Centre (FLC) network to be strengthened to deliver basic financial literacy at the
ground level. Banks to identify lead literacy officers to be trained by the Reserve Bank in its College of
Agricultural Banking (CAB) who in turn could train the people manning the FLCs.
� The Reserve Bank to commission periodic dipstick surveys across states to ascertain the extent of
financial literacy.
� All regulated entities should be required to put in place a technology-based platform for SMS
acknowledgement and disposal of customer complaints.
� To strengthen the Information Monitoring System for District Consultative Committees (DCC) and
State Level Bankers Committee (SLBC) deliberations.
� The responsibility of the SLBC/lead bank scheme to be rotated among to instil a spirit of competition.
� SLBCs to focus more on inter-institutional issues, livelihood models, social cash transfer, gender
inclusion, Aadhaar seeding, universal account opening, and less on credit deposit ratio which is a by-product.
� As a part of second generation reforms, the government can replace the current agricultural input
subsidies on fertilisers, power and irrigation by a direct income transfer scheme.
Conclusion & Way Forward
Let me conclude by repeating what I have endeavored to convey about assessment of Financial Inclusion efforts
in our country. The lower income category has been living under the constant shadow of financial duress mainly
because of the absence of savings. Still lot of efforts have to be made by the government and other institutions to
match the global average of Financial Inclusion. Only when there are proper systems in place with the necessary
education provided then and then only the Finanacial Inclusion have a meaning, the government should have
their major focus on the Rural Masses who are still deprived from any kind of financial services. This the only
way forward for the development of the economy.

IJRCMEAS ISSN 2454-6593
63
References
1. The Reserve Bank of India has today placed on its website, the Report of the Committee on Medium-
term Path on Financial Inclusion (Chairman: Shri Deepak Mohanty).
2. RBI Annual Report (2013-14).
3. Agarwal, Parul (2014), “Financial Inclusion in India: a Review and Initiatives and Achievements”,
IOSR Journal of Business and Management, Volume 16, Issue 6, June.
4. Chakrabarty K.C. (2011), Keynote address on Financial Inclusion, Mumbai, September.
5. Chakrabarty, K.C. (2012), “Financial Inclusion: Issues in Measurement and Analysis”, Keynote
address, BIS-BNM Workshop on Financial Inclusion Indicators, Kuala Lumpur, November.
6. India Post (2013), “Annual Report”.
7. Joshi, Deepali P. (2014), “Strategy Adopted For Financial Inclusion”, Speech, Workshop of
Government of Madhya Pradesh, New Delhi, January.
8. K., Divya (2014), “A Study On Impact Of Financial Inclusion With Reference To Daily Wage
Earners”, Journal of Business Management & Social Sciences Research, Volume 2, No. 6, June.
9. RBI (2014b), “Report of the Technical Committee on Mobile Banking” (Chairman: Mr. B
Sambamurthy).
10. Srikanth, R. (2013), “A Study on - Financial Inclusion - Role of Indian Banks in Reaching Out to the
Unbanked and Backward Areas”, International Journal of Applied Research and Studies, Volume 2, Issue 9,
September.
11. Subbiah, Nalini (2014), “Role of Banks in Financial Inclusion”, Research Journal of Commerce and
Behavioural Science, Volume 1, No.

IJRCMEAS ISSN 2454-6593
64
A STUDY ON HAPPINESS AND SATISFACTION IN IT JOBS
Meena. R. Kulkarni
P.hd Research Scholars, Dept of Commerce and Management, Karnataka State Women’s University
Vijaypur
ABSTRACT
It is well known that happy workers are assets of an organisation. They are more likely to improve themselves
through self-enhancement. So, the case of selfawareness is strong. It is clear to see why increased self-awareness
is an important is an important factor in an employee’s work happiness. Job satisfaction describes how content
an individual is with his or her job. The happier people are within their job, the more satisfied they are said to
be. The Information Technology (IT) sector has emerged only recently in the world market and it has assumed
centre stage both in our society and the world. The flourishing Indian economy has helped the IT sector to
maintain its competitiveness in the global market. The IT and IT enabled services industry in India has recorded
a growth rate of 22.4% in the last fiscal year. This paper analyses the satisfaction of their job vis-à-vis that of
other sectors. Job satisfaction can simply be defined as the feelings people have about their jobs. Job satisfaction
is important not just because it boosts work performance but also because it increases the quality of employees’
life. The most common technique for measurement of job satisfaction is the use of rating scales where
employees report their thoughts and reactions to their jobs. A workforce with high job satisfaction leads to an
improvement in work quality and productivity, and leads to satisfied loyal customers. In the IT Industry the
environment is quite congenial leading to motivation of employees with the result the productivity is increased
and this indicates the level of their job satisfaction.
Keywords: Information Technology, Jobs, Happiness and Satisfaction, Productivity, Economic Growth.
INTRODUCTION:
Science has worked for years to find out what keeps humans happy and satisfied. Happy people made a happy
world (Agnihotri, 2012). And happiness cannot be bought. It is a feeling that is triggered by the ‘happy
harmones’ or endorphins which are “natural hormones that your brain releases when your are relaxed, like after
a great meal, a good workout or a good laugh,” says Dr. Mini Rao, a psychologist. It is well known that happy
workers are assets of an organisation. One thing that all happiness expert agree on is that happiness is not a
destination. Rather, it is the result of a range of activities and feelings. Or to use that rather corny phrase,
happiness is a journey (Rowan, 2008). According to Aristotle, “Happiness is the meaning and the purpose of
life, the whole aim and end of human existence”.
In one’s life one comes across a lot of people who are unhappy at work. Such people can be grouped under two
categories. The first are those who are unhappy because of genuine mismatch between them as a person and the
career they have chosen. The second are those who have chosen their career path well but are still unhappy. In
many cases, they have been happy up to a certain point but have reached what is called ‘satisfaction saturation
point’. This is the point where a career that was once fulfilling and exciting has over time become dull, routine
or unsatisfactory. Happiness at work starts with self-awareness which can be defined as the act of ‘focusing
attention on oneself’. In other words, keeping an eye on how things are for himself/herself. Why is it important
to be happy at work? The answer for this is that those who are self-aware have a clear sense of where they want

IJRCMEAS ISSN 2454-6593
65
to be and how to get there. Also, self-aware people take more responsibility for their behaviour. These are all
important aspects of improving employee’s job satisfaction at work place. This, in fact, is interrelated to
improved communication which has a strong impact on an employee’s work happiness. Self-aware employees
are more inclined to identify the things in their lives that need change or improvement. Eventually, they are
more likely to improve themselves through self-enhancement. So, the case of selfawareness is strong. It is clear
to see why increased self-awareness is an important is an important factor in an employee’s work happiness.
HAPPY WORKERS
Job satisfaction describes how content an individual is with his or her job. The happier people are within their
job, the more satisfied they are said to be. Logic would dictate that the most satisfied (“happy”) workers should
be the best performers and vice versa. This is called the "happy worker" hypothesis. However, this hypothesis is
not well supported, as job satisfaction is not the same as motivation or aptitude, although they may be clearly
linked. A primary influence on job satisfaction is the application of job design, which aims to enhance job
satisfaction and performance using methods such as job rotation, job enlargement, job enrichment and job
reengineering. Other influences on satisfaction include management styles and culture, employee involvement,
empowerment, and autonomous work position. Many managers do not realize that employee performance and
morale can be adversely affected by seemingly minor problems such as frequently-broken duplicating machines,
absence of important office supplies, or poor maintenance of company property. Management inattention to
such 'little things' translates to employees as a demonstration of managerial incompetence. Employees respond
to such irritation in three stages: acceptance, tolerance, and rejection. Job satisfaction declines significantly
through each stage, and can result in employee withdrawal or resignation. Employee job satisfaction levels can
be improved by first determining present job satisfaction levels and then developing a strategy for improvement.
Techniques for improvement depend on whether employees are in the acceptance, tolerance, or rejection stages
(McAfee, et al., 1988).
DEFINITION OF JOB SATISFACTION
According to Wikipedia, job satisfaction can simply be defined as the feelings people have about their jobs. It
has been specifically defined as a pleasurable (or unpleasurable) emotional state resulting from the appraisal of
one’s job, an effective reaction to one’s job, and an attitude towards one’s job. Job satisfaction is in regard to
one's feelings or state-of-mind regarding the nature of their work. It can be influenced by a variety of factors,
e.g., the quality of one's relationship with their supervisor, the quality of the physical environment in which they
work, degree of fulfilment in their work, etc. These definitions suggest that job satisfaction takes into account
feelings, beliefs, and behaviours (Anon., 2012a). Another definition of job satisfaction by eNotes.com (Anon.,
2012b) is that job satisfaction, a worker's sense of achievement and success, is generally perceived to be directly
linked to productivity as well as to personal wellbeing. Job satisfaction implies doing a job one enjoys, doing it
well, and being suitably rewarded for one's efforts. Job satisfaction further implies enthusiasm and happiness
with one's work. The Harvard Professional Group (1998) sees job satisfaction as the keying radiant that leads to
recognition, income, promotion, and the achievement of other goals that lead to a general feeling of fulfillment.
Job satisfaction is important not just because it boosts work performance but also because it increases quality of
employees’ life. Many people spend so much time at work that when it becomes dissatisfying, the rest of their
life soon follows.

IJRCMEAS ISSN 2454-6593
66
Everyone's job is different but here are 10 factors that psychologists regularly find are important in how satisfied
people are with their jobs. They are: (1) Little hassles, (2) Perception of fair pay, (3) Achievement, (4)
Feedback, (5) Complexity and variety, (6) Control, (7) Organisational support, (8) Work-home overflow, (9)
Honeymoons and hangovers, and (10) Easily pleased? If you're a manager looking to improve satisfaction at
your workplace then start with point number 1: find out about people's little hassles and address them. It might
not look like much but people will really appreciate it (Anon., 2011).
Despite considerable interest in the study of job satisfaction and dissatisfaction, our understanding of these
phenomena has not advanced at a pace commensurate with research efforts. It is argued that a major reason for
this lack of progress is the implicit conception of causality accepted by most psychologists. It is called the policy
of “correlation without explanation.” The present approach to the topic of job attitudes emphasizes a more
conceptual approach to the problem. Using Rand's theory of emotions as a starting point, the concepts of
satisfaction, dissatisfaction, value,emotion, and appraisal, and their interrelationships are discussed. The present
theory of job satisfaction is contrasted with previous theories. Data illustrating an approach to satisfaction based
on the present theory are given. Other issues discussed are: value hierarchies; the dynamic character of values;
overall job satisfaction; the Herzberg two-factor theory; the measurement of satisfaction and values; and rational
vs. irrational values (Locke, 1969).Low job satisfaction often leads to poor employee performance and
productivity. Some facts that may affect employee job satisfaction include compensation and benefits. Job
security, along with a peaceful and safe work environment, may also help improve job satisfaction. According to
many experts, challenging and exciting work will also lead to happier employees. Open communication between
supervisors and employees can help ensure employee job satisfaction in many instances (Edwards, 2003).
HOW JOB SATISFACTION IS MEASURED?
Job satisfaction is a very important attribute and is frequently measured by organizations. The most common
technique for measurement is the use of rating scales where employees report their thoughts and reactions to
their jobs. Questions can relate to rates of pay, work responsibilities, variety of tasks, promotional opportunities,
the work itself, and co-workers. Some examinations present yes-or-no questions while others ask to rate
satisfaction using a 1-to-5 scale, where 1 represents "not at all satisfied" and 5 represents "extremely
satisfied."Job satisfaction, the dependent variable, was measured by the response to thequestion: "On the whole,
how satisfied are you with the work you do—would you say, you are very satisfied, moderately satisfied, a little
dissatisfied, or very dissatisfied?" The independent variables were the personal demographic characteristics—
income, education, occupation, age and gender. Income was measured by the response to the question: "In
which of these groups did your earnings from (the occupation identified earlier) for last year fall? That is, before
taxes and other deductions." Education was measured in terms of years of formal education completed for which
credit was received. Respondents were classified into occupations based on their answers to the questions about
the kind of work they do and what their jobs were called. Occupation was then dichotomized into blue-collar
and white-collar based on 1970 and 1980 census occupational classifications. Age was recorded in exact years
since date of birth. Gender was interviewer coded into male and female.Workforce is the most important factor
and the only sustainable long-term competitive advantage of an organization. In today’s intensely competitive
global environment, there is a strong demand for workforce participation in organizational decision making to
enable the achievement of higher productivity of an organization. One aspect of workforce participation is job
satisfaction. Job satisfaction is defined as how much, employees like or dislike their work and the extent to

IJRCMEAS ISSN 2454-6593
67
which their expectations concerning work have been fulfilled. Understanding job satisfaction is critical to the
success of an organization and continues to be a major topic of research interest.
WORKERS’ ATTITUDE AND JOB SATISFACTION
The field of industrial/organizational psychology has a long, rich, and, at times, controversial history related to
the study and understanding of employee attitudes and job satisfaction. Some of this research is very specific
and aimed primarily at other researchers, while other publications provide practical guidance on understanding,
measuring, and improving employee attitudes (e.g., Edwards and Fisher, 2004; Kraut, 1996). One likely future
direction of employee attitude research will be to better understand the interplay between the person and the
situation and the various internal and external factors that influence employee attitudes. In particular, a better
understanding of the role of emotion, as well as broader environmental impacts, is needed and has been largely
overlooked in past research. In addition, ongoing research will provide more in-depth understanding of the
effects of employee attitudes and job satisfaction on organizational measures, such as customer satisfaction and
financial measures. Greater insights on the relationship between employee attitudes and business performance
will assist HR professionals as they strive to enhance the essential people side of the business in a highly
competitive, global arena (Saari and Judge, 2004).
INFORMATION TECHNOLOGY (IT) SECTOR
The IT sector is of recent origin of about three decades old . In this era of IT, people carry out all their activities
such as bill payments, reservation for journey, social networking, bank transactions, telemedicine, applying for
jobs, getting date of birth certificates of children, etc., using Internet facility with the help of computer
byremaining at home at any time whether it is day or night. Therefore Internet has beenintertwined with the
daily life of people. It has become a part and parcel of life of a majority of people around the globe.
With the boom in IT sector India has been wired to the world which is a pre-requisite for globalisation of the
economy. According to NASSCOM the country earns around Rs. 20,000/- crores annually by way of export of
IT Enabled Services (ITES) and products. The flourishing Indian economy has helped the IT sector to maintain
its competitiveness in the global market. The IT and IT enabled services industry in India has recorded a growth
rate of 22.4% in the last fiscal year. The total revenue from this sector was valued at 2.46 trillion Indian rupees
in the fiscal year 2007. Out of this figure, the domestic IT market in India accounted for 900 billion rupees. So,
the IT sector in India has played a major role in drawing foreign funds into the domestic market (Anon., 2010).
From the foregoing discussions on the use and proliferation of IT in a short span of about three decades, its
popularity and the passion it has evoked is quite impressive.A large number of persons and professionals are
employed in this industry. The employees can be classified as casual, contingency, full-time, part-time, self
employed, independent contractor, temporary, and wage labour. India is home to a large number of IT
professionals, who have the necessary skill and expertise to meet the demands and expectations of the global IT
industry. The cost of skilled Indian workforce is reasonably low compared to the developed nations. This makes
the Indian IT services highly cost efficient and this is also the reason as to why the IT enabled services like
business process outsourcing (BPO) and knowledge process outsourcing (KPO) have expanded significantly in
the Indian job market. India has ahuge pool of English-speaking IT professionals. This is why the English-
speaking countries like the US and the UK depend on the Indian IT industry for outsourcing their business
processes.
The emergence of Indian information technology sector has brought about sea changes in the Indian job market.
The IT sector of India offers a host of opportunities of employment. With IT biggies like Infosys, Cognizant,

IJRCMEAS ISSN 2454-6593
68
Wipro, Tata Consultancy Services, Accenture and several other IT firms operating in some of the major Indian
cities, there is no dearth of job opportunities for the Indian software professionals.
The IT enabled sector of India absorbs a large number of graduates from general stream in the BPO and KPO
firms. All these have solved the unemployment problem of India to a great extent. The average purchasing
power of the common people of India has improved substantially. The consumption spending has recorded an
all-time high. The aggregate demand has increased as a result. All these have improved the gross production of
goods and services in the Indian economy. So, in conclusion it can be said that the growth of India's IT industry
has been instrumental in facilitating the economic progress of India (Anon., 2010). Therefore it is more
appropriate to deliberate on whether the employees working in this IT industry enjoy job satisfaction or not.
This aspect is discussed in the following sections.
JOB SATISFACTION IN IT INDUSTRY
Business today is dynamic, with a steadily increasing pace of change. Timely and actionable information is the
best way to combat the elements. An organization is as strong and successful as its employees are. By
measuring employee satisfaction in key areas, organizations can gain the information needed to improve their
satisfaction, motivation, retention and productivity. HR policy is one of the key steps to gain job satisfaction.
Addressing the essentials, including fair compensation policy, valuable benefits policy and the ability to balance
work and life are crucial components of an organization’s overall retention strategy. Organizations must not
only create a mix of benefits policy that retain and motivate what is often a very diverse workforce, but they
must also continually fine-tune that mix policies with the job satisfaction(Human Resource, 2012).
Some factors of job satisfaction are universal and consistent. Both employees and HR professionals note
compensation and benefits are important to employee job satisfaction. However, research has shown that there
are more important factors that contribute to job satisfaction, such as relationships with immediate supervisors,
management recognition of employee job performance, and communication between employees and senior
management. These factors have more to do with the organizational culture and working conditions in the
company.Job satisfaction in the IT industry is nearly double the UK average, research has revealed. The survey
of 200 IT professionals by Loudhouse Research found that 81% of IT professionals in the UK are happy in their
job. "Although not a complete surprise, this is a fantastic number," said Phil Cross, IT professional audience
manager at Microsoft UK, which commissioned the study. IT employment industry analyst David Foote of
Foote Partners says that while he has not seen the Conference Board report, he has personally found the biggest
correlation between job satisfaction and company size, with a higher percentage of those working for small
companies expressing job satisfaction while employees of large companies are generally less satisfied. He says
that may be exacerbated by an economic recession, like the one we are currently experiencing, because
employees of large companies who have the expectation of serving as specialists are more likely to find
themselves asked to do more work and be more of a jack-of-all-trades as their companies implement workforce
reductions (Davis, 2010). This high level of satisfaction is in contrast to only 42% of happy respondents to the
latest quarterly Employee Outlook Survey by the Chartered Institute of Personnel and Development (CIPD), he
said. The majority of those in the industry see IT as a long-term career choice, with 67% of respondents
expecting to be working in the sector in 10 years. Almost half of respondents (47%) also said that they have
ambitions to become a director or entrepreneur. "There are always new challenges, things to look forward to and
things to learn, which helps keep things interesting," said Cross.Tristram Bardrick, sales manager at the National
Computer Centre (NCC), said the survey clearly shows the motivating factors for people who work in IT. "As
an industry we should be committed to fostering this excitement and positive attitude."

IJRCMEAS ISSN 2454-6593
69
Virtualisation is ranked as the most exciting type of IT project for this year, followed by mobile and cloud
computing. "It is encouraging to see that the things the IT professionals are focused on and excited about are the
same things technology suppliers are concentrating on," said Cross. IT professionals have a positive view of
technology and believe it can help businesses during the recession, the survey found. Nearly two-thirds (63%) of
respondents said they can help their company steer through the recession and 81% said technology can change
the world for the better.Conversely, the top three dislikes were time spent fire fighting or troubleshooting,
unrealistic user expectations, and feeling permanently on call. "The technology industry is constantly trying to
address these problems, but it is likely that some or all of these elements will remain to some degree," said
Cross. Just over half of the respondents (51%) said they find their job more stressful than a year ago and 46%
said their job is more challenging and difficult than five years ago (Microsoft, 2010).
In this regard, the experience of IT professionals is on par with the national average. In the CIPD research, 41%
said they are under excessive pressure every day or at least once a week. But on the whole, the research shows
that people working in IT are positive about their career choice, which is encouraging, said Cross.
A workforce with high job satisfaction leads to an improvement in work quality and productivity, and leads to
satisfied loyal customers. A workforce who dislikes his/her job is more likely to have higher absenteeism and
turnover (Spector, 1997). In the IT Industry the environment is quite congenial leading to motivation of
employees with the result the productivity is increased and this indicates the level of their job satisfaction.
CONCLUDING REMARKS
Happy people made a happy world. According to Aristotle, “Happiness is the meaning and the purpose of life,
the whole aim and end of human existence”. Happiness at work starts with self-awareness which can be defined
as the act of ‘focusing attention on oneself’. Over a span of almost three decades IT sector turned out to be front
runner in providing jobs for a large number of people. Therefore it is imperative to deliberate on whether the
employees working in this IT industry enjoy job satisfaction or not. This aspect is discussed in this paper. The
survey of 200 IT professionals by Loudhouse Research found that 81% of IT professionals in the UK are happy
in their job. The majority of those in the industry see IT as a long-term career choice, with 67% of respondents
expecting to be working in the sector in 10 years. Almost half of respondents (47%) also said that they have
ambitions to become a director or entrepreneur. In the IT Industry the environment is quite congenial leading to
motivation of employees with the result the productivity is increased and this indicates the level of their job
satisfaction.
REFERENCES
Agnihotri, A., (2012), “What‘s Your ‘H’ Factor?” The Hindu Nxg, Chennai, Thursday, May 10, pp. 4, Feel
Good.
Anon., (2010), “Contribution of India's IT Industry to Economic Progress,” Economy Watch, April 30.
Anon., (2011), “10 Psychological Keys to Job Satisfaction,” PsyBlog Understand Your Mind, July 19.
Anon., (2012a), “Job Satisfaction,” Wikipedia the free Encyclopedia, March 29.
Anon., (2012b), “Job Satisfaction,” eNotes.com, Inc.
Davis, J., “Job Satisfaction Plummets, but Some IT Jobs Remain in High Demand,” [ci] channel insider, Ziff
Davis Enterprise Holdings Inc.
Edwards, C., “What Factors Affect Employee Job Satisfaction?” wiseGEEK Article, Conjecture Corporation,
USA.
Edwards, J. E., and Fisher, B. M., (2004), “Evaluating Employee Survey Programs,”

IJRCMEAS ISSN 2454-6593
70
In J. E. Edwards, J. C. Scott, and N. S. Raju (Eds.), The Human Resources ProgramEvaluation Handbook,
Thousand Oaks, CA: Sage, pp. 365–386.
Human Resource, (2012), “To Find out the Level of Job Satisfaction and Work Life Balance in IT Industry,”
HR Project, ProjectFever.com.
Kraut, A. I., (1996), “Organizational Surveys: Tools for Assessment and Change. San Francisco: Jossey-Bass.
Locke, E.A., (1969), “What is Job Satisfaction?” Organisational Behaviour Human and Performance, Vol. 4,
Issue 4, November 1969, pp. 309-336..
McAfee, Bruce, R., Glassman, Myron, (1988), “Job Satisfaction: It's the Little Things that Count,” American
Management Association.
Microsoft, (2010), “IT Industry Job Satisfaction Double UK Average, Survey Shows,” Wednesday, March 10,
Computer weekly.com.
Rowan, S., (2008), “Happy at Work,” Pearson Prentice Hall, Harlow, UK.
Saari, L.M. and Judge, T.A., (2004), “Employee Attitudes and Job Satisfaction,”
Human Resource Management, Winter 2004, Vol. 43, No. 4, Pp. 395–407, DOI: 10.1002/hrm.20032.
Special Correspondent, (2012), “Use IT to Expedite Cases,” The Hindu, Chennai, Vol. 135, No. 77, Friday,
March 30, pp. 11.
Spector, P.E., (1997), “Job Satisfaction: Application, Assessment, Causes, and Consequences,” Thousand Oaks,
Sage. 104p.

IJRCMEAS ISSN 2454-6593
71
E-MAIL MARKETING: ADVANTAGES, DISADVANTAGES AND OPPORTUNITIES
Iranna.B.Jaba
H.O.D, Dept. of Commerce
V.V.Sangh’s Art’s, Commerce & B.C.A College Vijayapur (Karnataka)
Prof. Kumarswamy I. Hiremath
Dept. of Commerce
Basaveshawar Commerce College, Bagalkot (Karnataka)
Abstract -E-Commerce changes the way organizations to do business. Recognizing the significance of E-
Commerce contributions to the nation’s economic growth, the Iranian government introduced some solutions to
increase the practice of E-Commerce. They effort to encourage public and private enterprises to adopt E-
Commerce as a tool to be more competitive in global markets. One of tools regarding E-commerce is E-mail
Marketing. E-mail marketing is a form of direct marketing which uses electronic mail as a means of
communicating commercial or fund-raising messages to an audience. In this paper, there is a systematic review
on its advantages and disadvantages. In addition, there are some recommendations to Iranian Marketing
Company regarding to improving E-mail Marketing. More results are subsequently explained in the paper.
Index Terms - Advantages, disadvantages, E-mail marketing, E-commerce,CRM(Customer Relationship
Management, Opportunities.
I. INTRODUCTION:
In today's world of information not only as one of the mainresources and assets are recognized
organizations but also by literature and other resources and tools for effective management of assets (Financial
resources, manpower, etc.) is also of importance and thus has special value. But this value will be achievable
only if the researcher and their data at the right time, with quality and safety acceptable to the appropriate people
and adhered to the optimal organization is established. Hence it is that the underlying information technology,
transport, handling, use and management of effective information believers in the drawer is released, has been of
crucial importance. Therefore, in line with Iran's twenty-year vision of a developed society with regard to the
impact of ICT on various aspects of human life and it is especially crucial and sensitive aspects of cultural,
economic, security, social, commercial and political, Ministry of Communications and Information Technology
on the overall development action plan designed to offer comprehensive IT plan to the country in 2003. The
agreement includes five major projects, development of large IT projects, program executive tasks in the field of
security (AFTA), create the database status information technology, information technology applications in
developing countries and provide the framework and drafting bills and legal regulations and preparing compute
crimes and E-commerce laws [1]. One application of information technology isE-commerce and E-commerce is
“a general concept coveringany form of business transactions or information exchange executed using
information and communication technology, between companies, between companies and their customers, or
between companies and public administrations. Electronic Commerce includes electronic trading of goods,
services and electronic material [2]”.E-mail marketing is one of the subsets of the following:

IJRCMEAS ISSN 2454-6593
72
E-mail marketing is a form of direct marketing which uses E-mail as a means of communicating commercial or
fund-raising messages to an audience. In its broadest sense, every E-mail sent to a potential or current customer
could be considered E-mail marketing. However, the term is usually used to refer to:
1) Sending E-mail messages with the purpose of enhancingthe relationship of a merchant with its current or
previous customers, to encourage customer loyalty and repeat business
2) Sending E-mail messages with the purpose of acquiring new customers or convincing current customers to
purchase something immediately
3) Adding advertisements to E-mail messages sent by other companies to their customers [3]. Researchers
intend in this article regarding the important role of E-commerce in IT development in Iran to introduce
advantages and disadvantages of E-mail marketing and also to introduce strategies that increase the efficiency of
this tool will pay.
E-Marketing defined:Marketing is the management process responsible for identifying, anticipating and
satisfying customers. Internet technology can be used to support these aims as follows(Kaur M, 2012)[3]
Identifying–The Internet be used for marketing research to find out customers needs and wants. Anticipating–
The Internet provides an additional channel by which customers can access information and make purchases –
understanding this demand is key to governing resource allocation to e-marketing as explained .
Satisfying – A key success factor in e-marketing is achieving customer satisfaction through the electronic
channel, this raises issues such as is the site easy to use, does it adequately.
Objectives of the e-marketing:
1) Methods of making market more effective and fulfill the needs and requirements of the customers.
2) To conduct research as to the nature e.g. demographics, preference and needs of existing and potential
customers.
3) Designing processes to provide a strong communication between businessman and clients.
4) To identify the area of quality customer service with personal attention.
E-Marketing Methods:
1) Search Engine Market (SEM)
Search engine marketing (SEM), which allows firms to target consumers by placing ads on search engines, has
proven to be an effective audience acquisition strategy. Unlike traditional online advertising, advertisers pay
only when users actually click on an ad. When successfully implemented(Chaffey et al., 2006)[5].Most online
advertising campaigns have two main objectives- brand development and direct response. Which has a two
types:-
� Pay-Par Click
� Search Engine Optimization (SEO)
2) Online PR:
PR stands for “public relations”. Online PR is managing publicity about an organization and its brands, products
or web sites through its online presence and third party web sites and other digital media. It includes providing
press releases via e-mail or on website and submitting them to online news feeds.(Hoang Tung ,2008)[6]

IJRCMEAS ISSN 2454-6593
73
� Link-building and generating editorial
� Blogs, communities and RSS
� Managing how your brand is presented on third party sites
� Creating a buzz – viral marketing
3) E-Mail Marketing:
Email marketing is a method of distributing information about product or service or for soliciting feedback from
customer about a product or service through Email. Email addresses of customers and prospective customer may
be collected or purchased. Email marketing is a form of direct marketing .(P.Linh,2008)[6] Special deals and
postcard by e-mail marketing Increase profit and sales, promote products and services, last minute special offer.
There are two major types of e-mail marketing.
� Opt–in email
� Opt – out email
4) Banner Advertisement:
Banner is a placement of ads on website for a fee. The offline equivalent of this form of online marketing would
be traditional ads on newspaper or magazines. Banner service is relatively expensive. Banner ads are graphical
presentations placed on web pages with the purpose of attracting visitors to click on the ad and visit the
advertised website. There are many standard Banner ads, each with a different Shape or size. (Smith and
Chaffey, 2007)[7]
� Banner sand Button
� Rectangles and Pop-ups
� Skyscrapers
� Floating
5) Viral Market :
Viral marketing uses email to transmit a promotional message to another potential customer. It is very useful in
reaching a large number of people rapidly like a computer virus. The contents of email can be a video clip, a TV
ad, a cartoon, a funny picture, a poem, a song, a political message or a news item which must be so interesting
and amazing that makes people pass it on. In comparison to the traditional marketing, viral marketing equals
that of a "word of-mouth"(Chaffey et al., 2006, Sana Rehman 2012)[4,5]
6) Blog Market:
Blog marketing is the process of reaching a business prospects through the use of a blog. Blog market is an act
of positioning comments, expressing opinions or making announcement in a discussion forum and can be
accomplished either by hosting your own blog or by posting comments andURL in other blogs related to your
product or service online. Blog marketing may also help improve a Website's rankings in search results and is
often used for search engine optimization (SEO) purposes.
Benefits of E-marketing:
a) Extremely low risk
b) Reduction in costs through automation and. use of electronic media

IJRCMEAS ISSN 2454-6593
74
c) Faster response to both marketers and the. End user
d) Increased ability to measure and collect data
e) Opens the possibility to a market of one through personalization
f) Increased interactivity
g) Increased exposure of products and services
h) Boundless Universal accessibility
Limitations of E-marketing:
a) Dependability on technology
b) Security, privacy issues
c) Maintenance costs due to a constantly evolving environment
d) Higher transparency of pricing and increased price competition
e) Worldwide competition through globalization
CRM(Customer Relationship Management):E-commerce and Customer Relationship Management (CRM)
jointly worked as a tool.E-commerce mainly target customers by getting closer to customers, serving them
better, cost cutting, introducing new products and services and creating new opportunities through the Internet.
In marketing CRM is a term which has an ability to understand, anticipate and manage the needs of the
customers, interaction and relationships increases the profitability through revenue and marginal growth and
operational efficiencies(Sana Rehman, 2012).[4] E-CRM benefits to customers :-
� Customer's interaction or satisfaction
� Convenience
� Speed of processing the transaction through e-response
E-market v/s Traditional market:
E – Market Traditional Market
E- Marketing is very economical and fast way to
promote product
Traditional Marketing is very expensive and takes
more time to promote product
E- Marketing is very useful for promoting product
globally[without any additional cost
It is very expensive and time consuming process for
traditional marketing
In E- Marketing, you can also work with less
employs [you can take more work with less
manpower].
In Traditional Marketing, you need more
employment with more man power which in terms
requires spending more money
In online business you can sell or buy product 24 X
7, round the year without employing any person
That is not possible in traditional marketing

IJRCMEAS ISSN 2454-6593
75
Paying Professional and Experienced E-market
Company is very economical
Paying renowned Advertising and Marketing
Company is very Costly
The four Ps:
Marketing is company centred, and is according to E. Jerome McCarthy divided into four general sets of
activities, namely product, price, promotion and place. E. Jerome McCarthy defined his four P theory in his
Basic Marketing: A Managerial Approach (McCarthy 1960). Each of the activities can be further divided into
different categories.
Figure : The 4 Ps - The Marketing Mix (source
www.freewebs.com/coachrogers/freshmanseminar.htm)
This paragraph will go through the 4P as defined by E. Jerome McCarthy and Philip Kotler, then we
will explain what enhancements/developments have been discussed, and from here we will define how the
theory applies to the discussion at hand.
The marketing mix is probably the most famous marketing term. Its elements are the basic, tactical components
of a marketing plan. Also known as the Four P's, the marketing mix elements are price, place, product, and
promotion. The concept is simple. Think about another common mix - a cake mix. All cakes contain eggs, milk,
flour, and sugar. However, you can alter the final cake by altering the amounts of mix elements contained in it.
So for a sweeter cake add more sugar! It is the same with the marketing mix. The offer you make to you
customer can be altered by varying the mix elements. So for a high profile brand, increase the focus on
promotion and desensitize the weight given to price. Another way to think about the marketing mix is to use the
image of an artist's palette. The marketer mixes the prime colours (mix elements) in different quantities to
deliver a particular final colour. Every hand painted picture is original in some way, as is every marketing mix.
Some commentators will increase the marketing mix to the Five P's, to include people. Others will increase the
mix to Seven P's, to include physical evidence (such as uniforms, facilities, or livery) and process, i.e. the whole
customer experience e.g. a visit to Disney World (Borden 1964).

IJRCMEAS ISSN 2454-6593
76
1. J Suresh Reddy26 has published article in Indian Journal of Marketing. Title ofarticle is “Impact of E-
commerce on marketing”. Marketing is one of the business function most dramatically affected by emerging
information technologies. Internet is providing companies new channels of communication and interaction. It
can create closer yet more cost effective relationships with customers in sales, marketing and customer support.
Companies can use web to provide ongoing information, service and support. It also creates positive interaction
with customers that can serve as the foundation for long termrelationships and encourage repeat purchases. Even
cyber shopping allows customers to sit in the comfort of their homes and purchases their goods. One can shop
any kind of product or service in the mind of the night and from any part of the world.
2. Vikas Bondar27 has published his article on “sales and marketing strategies”. Internet is a really good thing.
The Internet gives people a greater amount of information as we need. It is the best way to get a comparison of
the products that we need. If we are interested in buying, it is best for us to check the Web sites. Also if we
would like to make our own Web page we can do this, without paying a lot of money. From where do we set all
this information? The answer is from advertising, which we see, everywhere: on TV, on the Internet, in the
newspapers and more. Year after year we get more and more new, interesting information and in the future the
Internet use will increase more than now.
This article explains how internet is useful tool for advertisement.
3. V.Kumar and Denish Shah have published research paper entitled “Pushing and Pulling on the
Internet”The internet is fast emerging as a domain sales channel. The Internet is expanding& it influences
consumer which shifts the consumer behavior. It has changed theway product awareness is created28, developed
new modes of product consideration.It also creates new means of purchasing products. This has brought
newopportunities, challenges and threats (in the form of competition) to both existingand new business.
4. Scott F. Geld has written the article entitled “Cost savings between Traditional marketing and Internet
Marketing”.Marketing30 can be defined as 'whatever you do to promote and grow your business'including
market research, advertising, publicity, sales, merchandising anddistribution. With traditional marketing
techniques all of these things are delivered inprint format or in person. Internet marketing however, uses the
power of onlinenetworks and interactive media to reach your marketing objectives...no paper, notelephone calls,
no in person appearances. Internet marketing can save your time,money and resources.Electronic versions of
catalogs, brochures, white papers, data sheets etc. don'thave to be printed, stored or shipped to your customers
resulting in an enormoussavings in printing and storage costs. And what about manpower (or lady
power)costs?It is no longer requires as many people to handle mailing and distribution of yourmarketing
collateral...more savings.Updating catalogs, brochures and any other marketing collateral you produce canbe
accomplished as needed online and in lightning speed. There's no need to sendrevised material out to a printer
and then have to wait for a revised version, a greatsavings in time. And, time is money.More information can be
provided to customers with little if any additional cost.Adding more pages to a document online involves
virtually no expense compared tothe additional cost and space required to deliver the same thing in print format.
Youcan reach more customers than ever before and it doesn't cost a penny more. There'sno postage or courier
charges to pay. Distribution costs are the same whether youreach one or one million.

IJRCMEAS ISSN 2454-6593
77
Finally, for little or no cost you can have several electronic versions of the same catalog customized to meet the
needs of different audiences. The difference between traditional and Internet marketing is money and Internet
marketing improves your bottom line.
OPPORTUNITIES OF E – MARKETING:
• Target: allows you to target specific recipient groups and reach adefined, engaged audience.
• Penetration: overcomes geographical parameters that exist with other communication methods.
• Efficient: messages can be distributed to multiple recipients at one click.
• Cost: requires minimal investment to set up an appropriate technical system.
• Speed: messages are delivered straight to the recipients› inboxes, instantly.
Other Opportunities:
• Internationally more than 33% of surfers buy online.
• E Marketing reduces prices.
• Huge potential for growth (70% rural population).
• E Intermediaries.
• Affordable computers and internet connectivity.
• Desire of the customers.
Conclusion:
E-marketing has become an integral part of modern Marketing. This opportunities e-marketing
operation increases different levels of risks for marketing. More than ten Years of Internet marketing research
have yielded a set of important findings. Based on our review of these findings, it is clear that the Internet is
playing a more and more important role in the field of marketing. Marketers and their clients are becoming
aware of the need to measure the collaborative effects of marketing (i.e., how the Internet affects in-store sales).
In Mansa the study reveals that customers do-not use of e-marketing. They do- not have any knowledge of e-
marketing. Some study have been designed on survey .The respondent have to answer the questions on their
own. Some peoples satisfies on our views. But some peoples were not satisfies with us. Respondent have
adequate time to give well thought out answers. Respondents, who are not easily approachable, can also be
reached conveniently. This study states that Online marketing System provides greater reach to customers.
Feedback can be obtained easily as internet is virtual in nature. Customer loyalty can be gain. Personal attention
can be given by market to customer also quality service can be served. We came to know various strengths of
Online marketing system such as quality customer service, greater reach, time saving customer loyalty, easy
access to information, 24 hours access, reduce paper work,no need to carry cash easy online applications etc.
REFERENCES:
� J Suresh Reddy , “Impact of E-commerce on marketing”, Indian Journal of Marketing., May 2003, vol
xxxiii, No.5.

IJRCMEAS ISSN 2454-6593
78
� 27 VikasBondar, “Discuss how sales and marketing strategies have changed as a result of
developingtechnology. What changes have occurred in advertising with the development of computer
technology?
How has developing technology expanded the marketplace for both businesses and consumers?” –
Focus discipline projects business, ESL 91, Spring 2000
� 28V.Kumar and Denish Shah, “Pushing and Pulling on the Internet”, Marketing research, spring 2004.
� 30 Scott F. Geld “Cost savings between Traditional marketing and Internet Marketing”, Marketing
Blaster.com (2003)5
� Joseph P.T,S.J(2008)," An Indian perspective",3rd edition, E-Commerce, by PHI learning private
limited.
� Parasuramn A, "Service Quality In The Public Service", International Journal Management and Market
Research, IJMMR, Vol 3 , Nov 1, 2010
� KaurM, "E-Commerce KalyaniPublictaion", Delhi (2012)
� Kalyanam, K and McIntyre S , “The E-Marketing Mix: A Contribution ofthe E-Tailing Wars,” Journal
of the Academy of Marketing Science, 30 (4),487-499,2002
� Fill C and Jamieson B," Marketing Communications", Edinburgh Business School, Heriot –Watt
Univercity, 2011.
� Manuscript received April 16, 2012; revised June 11, 2012.
E. Fariborzi is with Faculty Member, Department of Educational Studies Islamic Azad University-
Mashhad Branch, Mashhad, Iran (e- mail:[email protected]).
� www.emarketing.com

IJRCMEAS ISSN 2454-6593
79
ROLE OF HUMAN CAPITAL IN LONG -TERM GROWTH
PROF. VIRUPAKSHI PATIL DEVARMANI
DEPARTMENT OF COMMERCE
Abstract:
The economic growth of the nation depends upon the economic development of individual citizen of
that country. Individuals differ in both inherited and acquired abilities, latter they differ among countries and
time periods. Human capital analysis deals with acquired capabilities which are developed through formal and
informal education at school and at home, and through training, experience, and mobility in the labour market.
An accumulation of personal human capital produces individual economic growth, so as to corresponding social
or national aggregates. At the national level, human capital can be viewed as a factor of production coordinate
with physical capital. This implies that its contribution to growth is greater the larger the volume of physical
capital and vice versa. The framework of an aggregate production function shows also that the growth of human
capital is both a condition and a consequence of economic growth. Human capital activities involve not merely
the transmission of available knowledge, but also the production of new knowledge which is the source of
innovation and of technical change which drive forwards all factors of production. This latter function of human
capital generates worldwide economic growth regardless of its initial geographic locus. Gathering of rapid
technical change, globalisation and economic liberalisation in recent years has prompted governments in
developed and developing countries alike to priorities skills development as a key strategy for economic
competitiveness and growth. By 2020, India is set to become the world’s youngest country with 64 per cent of
its population in the working age group. Japan and even China aging, this demographic potential offers India
and its growing economy an unprecedented edge, that economists believe it could add a significant 2 per cent to
the GDP growth rate.
Introduction:
The skill of an educated person is more worth than that of an uneducated person. Hence, the skilled
educated person is able to generate more income, than an uneducated person. Consequently the contribution of
an educated person to economic growth is more than that of an uneducated person. Education gives higher
earnings capacity to people, better social status. It stimulates innovation and encourages adoption of new
technology. Thus expansion of education opportunities in a nation accelerates the development process.
Therefore the human capital formation is required for the economic development of the country. Human capital
formation is the process of acquiring and increasing the number of persons who have skills, education and
experience which are essential for the economic development of a country. Human capital formation is
associated with investment on man that is investment on human capital; it means expenditure on education,
health, training etc. Education health, training and migration are the important factors for economic growth.
The increased productivity of human capital being contributes substantially towards increasing labour
productivity. It also stimulate innovations and creates ability to absorb new technologies, education facilitates
innovations and inventions thereby overall development the country.

IJRCMEAS ISSN 2454-6593
80
Human capital and economic growth:
Human capital and economic growth have a strong relationship. Human capital affects economic
growth and can help to develop an economy through the knowledge and skills of people.
Human capital refers to the knowledge, skill sets and motivation that people have, which provide economic
value. Human capital realises that not everyone has the same skill sets or knowledge and that quality of work
can be improved by investing in people's education.
Economic growth is an increase in an economy's ability, compared to past periods, to produce goods and
services. It can be measured by measuring the percentage in the Real Gross Domestic Product (GDP) of a
country. For example, suppose a country increased its real GDP at an annual rate of 2.5%. This country is
experiencing economic growth and has an increase in the value of all goods and services.
Human capital is directly related to economic growth. The relationship can be measured by how much
is invested into people's educations. For example, Indian government is offering free education for all children
up to the age of 14 years. The government realizes that the knowledge, people gain through education helps
develop an economy and leads to economic growth.
A company can help increase human capital and increase economic growth as well. For example,
consider a computer programmer works at a technology company, he receives on-site training, attends in-house
seminars and the company pays for part of his tuition for higher education. If he decides to stay at the firm, he
may develop new ideas and new products for the company. However, he may leave the company later in his
career and use the knowledge he attained to start a new company. This investment in human capital, then,
eventually leads to economic growth.
There are three key growth-enhancing effects of human capital:
• First- It contributes to economic efficiency.
• Second- It provides the labor resources on which growth depends.
• Third- It can reduce social inequalities and, potentially, make growth more sustainable.
The seventh five year plan says “Human resource development has necessarily to be assigned a key
role in any development strategy. Particularly in a country with large population. A large population with good
education and training can become an asset in accelerating economic growth and ensuring social change in
desired direction.”
The following Table-1 shows the relationship between Human Capital and Economic Growth
The following Table-2 shows literacy rates between Male and Female
Particulars 1991 2001 2011
• Real Per Capita Income(in Rupees) 7321 10306 38005
• Death Rate (Per 1000 Population) 9.8 8.1 7.2
• Infant Mortality Rate(Per 1000 Births) 80 63 47
• Life expectancy at birth ( in year)
Male 59.7 60.9 61.6
Female 52.21 65.20 74

IJRCMEAS ISSN 2454-6593
81
Census Year Persons Males Females Male- Female gap in literacy rate
1951 18.33 27.16 8.86 18.30
1981 43.57 56.38 29.76 26.62
1991 52.21 64.13 39.29 24.84
2001 64.83 75.25 53.67 51.59
2011 74.04 82.14 65.46 16.68
India is a developing country the per capita income of the country has been increasing since 1991. The
literacy rate is also increasing but not up to the mark. A large section of the population is living below poverty
line; a large majority of people have no access to basic education and health care facilities. Basic education is
considered as right of the citizens, keeping this in mind, both the union an state Government have been
increasing expenditure on education and health service. The Ministry of education at the union and state level,
departments of education and various organizations like National Council of Education Research and
Training(NCERT), University Grant commission(UGC) and all India Council Of Technical Education(AICTE)
play a major role in reaching higher education to the mass. This will help to reduce illiteracy rate. In India the
literacy rate between male and female is significant from the point of gender equality.
Structure of Education in India:
There are broadly four stages of school education in India, namely primary, upper primary, secondary
and higher secondary (or high school). Overall, schooling lasts 12 years, following the "10+2 pattern".
In 2002/2003, an estimated 82% of children in the age group of 6-14 were enrolled in school. The
Government of India aims to increase this to 100% by the end of the decade. To achieve this Government of
India launched Sarva Shiksha Abhiyan.
The strategies adopted by the Government to check drop-out rate are:
• Creating parental awareness
• Community mobilization
• Minimum Levels of Learning (MLL)
• District Primary Education Programme(DPEP) and National Elementary Education Mission.
Higher Education:
Higher education in India has evolved in distinct and divergent streams with each stream monitored by an apex
body, indirectly controlled by the Ministry of Human Resource Development. and funded by the state
governments. Most universities are administered by the States, however, there are 18 important universities
called Central Universities, which are maintained by the Union Government. The increased funding of the
central universities give them an advantage over state competitors.
The Indian Institutes of Technology were placed 50th in the world and 2nd in the field of Engineering
(next only to MIT) by Times Higher World University Rankings although they did not appear in the Shanghai
Jiao Tong University Academic Ranking of World Universities. Indian School of Business, Hyderabad and the
Indian Institutes of Management (IIMs) are the top management institutes in India.
Smart Education:
The Government of India has allocated US$13.95 billion in the Union Budget 2014-15 for the
education sector, up by 12.3% from the previous year.

IJRCMEAS ISSN 2454-6593
82
� Budget has allocated US$78.5 million to set-up five new IITs and five new IIMs
� The Ministry of Human Resource Development plans to have 1,000 private universities for producing
trained manpower to meet services and industry requirements
� 100% FDI allowed in the education sector
� India’s online education market size expected to be US$40 billion by 2017
World Bank Report(“India and Economy-leveraging strength and opportunities”):
World bank in its recent report “ India and Economy-leveraging strength and opportunities” states that
India should make a transition to the knowledge economy and if it uses its knowledge as much as Ireland does,
then the per capita income of India will increase from US $3000 in 2020. It further states that India has all the
key ingredients for making this transition, such as a critical mass of skilled workers, a well functioning
democracy and a diversified science and technology, infrastructure.
India can be human resource capital of the world: (National Skill Development Mission):
India’s Prime Minister, Shree Narendra Modi, launched a programme called “SKILL INDIA .” A
National Skill Development Mission, aimed at imparting skill training to more than 400 million Indians over the
next seven years “to make India the world’s human resource capital”.
With only 2.3% of the workforce having received a formal training, India currently faces a severe
shortage of well-trained, skilled workers. The “12-week training under this programme will ensure a job that 12
years of compulsory education may not. The scheme will utilize the existing network of about 12,000 industrial
training institutes along with decommissioned railway carriages and containers as mobile, makeshift classrooms
for remote areas.
The Government will also set a specific skills university in every state and hire around 60,000 retired
defence personnel for training to be skill-trainers.
For India, employment generation and skill development are the top priorities, 65 per cent of the
country’s population is under the age of 35, the key priority is to create employment opportunities for the youth
as well as create avenues to skill them in a structured manner to improve their employability. The scheme skill
India mission and make in India can convert unskilled human capital into skilled and challenging human capital
that will contribute for economic development of the country. How China is presently recognized as the
“Manufacturing Hub of the world, by 2020 India can become “human resource capital of the world.”
Pradhan Mantri Kaushal Vikas Yojana (PMKVY):
This scheme is approved for another four years (2016-2020) to benefit 10 million youth. The scheme will
be implemented through the National Skill Development Corporation (NSDC). Pradhan Mantri
Kaushal Vikas Yojana (PMKVY) is the flagship scheme of the Ministry of Skill Development &
Entrepreneurship (MSDE). The objective of this Skill Certification Scheme is to enable a large number of Indian
youth to take up industry-relevant skill training that will help them in securing a better livelihood.
Key Components of the Scheme:
1. Short Term Training- The Short Term Training imparted at PMKVY Training Centres (TCs) is expected to
benefit candidates of Indian nationality who are either school/college dropouts or unemployed.
2. Recognition of Prior Learning- Individuals with prior learning experience or skills shall be assessed and
certified under the Recognition of Prior Learning (RPL) component of the Scheme.
3. Special Projects- The Special Projects component of PMKVY envisages the creation of a platform that will
facilitate trainings in special areas and/or premises of Government bodies, Corporate or Industry bodies, and

IJRCMEAS ISSN 2454-6593
83
trainings in special job roles not defined under the available Qualification Packs (QPs)/National Occupational
Standards (NOSs).
4. Kaushal and Rozgar Mela- Social and community mobilisation is extremely critical for the success of
PMKVY. Active participation of the community ensures transparency and accountability, and helps in
leveraging the cumulative knowledge of the community for better functioning.
5. Placement Guidelines- PMKVY envisages to link the aptitude, aspiration, and knowledge of the skilled
workforce it creates with employment opportunities and demands in the market.
6. Monitoring Guidelines- To ensure that high standards of quality are maintained by PMKVY TCs, NSDC
and empanelled Inspection Agencies shall use various methodologies, such as self-audit reporting, call
validations, surprise visits, and monitoring through the Skills Development Management System (SDMS).
These methodologies shall be enhanced with the engagement of latest technologies.
Human capital - biggest strength of 'Make in India':
The Make in India program was launched by Prime Minister Narendra Modi in September 2014 as part
of a wider set of nation-building initiatives. Devised to transform India into a global design and manufacturing
hub, Make in India was a timely response to a critical situation.
Based on a survey by the Labour Bureau in Chandigarh said that one out of every three persons in the
age group 15 to 29 years who have completed at least their graduation is unemployed. These figures underscore
the fact that the human capital demand from the industry is not matched by the supply from the education sector,
leading to unemployment amongst educated youth. This deep-rooted problem of unemployment fosters a
vicious circle of social problems.
According to an Ernst &Young-FICCI report, by 2020, India will account for 28% of the world’s
workforce. However, an assessment test done by Wheebox-People Strong in association with CII states that, in
the current scenario, of our five million graduates, only 34% are readily employable. Apparently, the maximum
skill deficit will be in the manufacturing sector where the demand of skilled manpower is high.
India has the advantage of talent demographic in terms of availability of vast and young talent pool. In
order to build a strong workforce, the skill demand and supply gap needs to be bridged by investing in critical
initiatives.
• Greater collaboration between industry & academia on relevance of curricula in line with industry
developments.
• Increased internships & apprenticeship opportunities for students.
• Standardization of the competency-wage grid for the industry and aligning recruitment & systems
• Strengthening the role of a centralized skill assessment and certifying agency.
• Collaboration between the governments, industry experts.
To illustrate the importance of human capital, let us look deeper at critical sectors which are on the list
in the Make in India project - the automobile and defence.
The automotive industry in India is among the largest in the world and one of the fastest growing
globally. The growth in this sector will afford huge employment opportunities. But with the development of
technology, manufacturing units are becoming automated and this will create a demand for skilled manpower
i.e. human capital over labourers. This is where the role of specialised vocational training will be imperative.

IJRCMEAS ISSN 2454-6593
84
With the development of technology, manufacturing units are becoming automated and this will create a
demand for skilled manpower i.e. human capital over labourers.
Make in India is a project which has to be driven by the support of the local human capital across
respective states. With a track record of industrial relations in manufacturing in many regions not being healthy,
this is one of the important aspects that investors will thinks upon before channeling their funds in India.
The following are Government initiatives and industries initiatives can make human capital as biggest
strength of “make in India”
Government initiatives
• Proposed changes in the apprenticeship Act
• Development of national qualification framework
• Partnering with industries on up-gradation of certain educational institutions.
Industries initiatives
• Design and introduction of specialized courses in partnership with academia.
• Leveraging of technology and new methodologies
• Setting up of training centers to train employees as well as ecosystem partners.
Youngest country in the world:
Every third person in an Indian city today is a youth. In about seven years, the median individual in
India will be 29 years, making it the youngest country in the world. India’s large youth population, often called
a “demographic dividend,” could potentially make India the biggest consumer market and the biggest labour
force in the world. The greater political participation, engagement at a policy level and urgent attention to
improving their quality of life can ensure that India enjoys the benefits of demographic dividend.
The population in the age-group of 15-34 increased from 353 million in 2001 to 430 million in 2011.
Current predictions suggest a steady increase in the youth population to 464 million by 2021 and finally a
decline to 458 million by 2026. By 2020, India is set to become the world’s youngest country with 64 per cent
of its population in the working age group. The Japan and even China aging, this demographic potential offers
India and its growing economy an unprecedented edge that economists believe that, it could add a significant 2
per cent to the GDP growth rate.
Conclusion:
This paper has dealt with the role of human capital in the process of economic growth. The government
of India has taken many measures to reduce the illiterate rate. But the number of illiterates is more compared to
other countries. The constitution of India provides free and compulsory education for all children up to the age
of 14 years. But the country lags behind in the implementation of this constitutional framework efficiently.
The literacy rate between male and female is significant from the point of gender equality. But still
there is a need to promote education for females. There is a necessary to improve the female economic
independence and social status through women empowerment. However, if the Government of India with
increasing population implements all its plan, strategies and policies in effective manner, country could achieve
significant growth in GDP rate.
Bibliography:
• DR. H. L Ahuja; Macro Economics- Theory and Policy; 19th revised edition, 2013, S Chand
Publishing

IJRCMEAS ISSN 2454-6593
85
• DR. KPM Sundaram; Indian Economy; S Chand Publication;
• www.skillindia.com
• Economic survey of India published by government of India;
• www.makeindia.com;

IJRCMEAS ISSN 2454-6593
86
DECENTRALIZATION AND CONVERGENCE OF HUMAN RECOURSE:THE CASE OF
ADDIS ABABA CITY ADMINISTRATION, ETHIOPIA
DagnachewAdmasuAyele
Ph.D. Research Scholar
Mangalore University
And
ShripathiKalluraya. P (PhD)
Professor
Mangalore University
Abstract
The focus of this research was to show the extent of implementation of decentralized system whether brings
together leadership efforts from private sector, civil society at national and local levels to converge and focus on
available resources so as to drives the Addis Ababa City Administration of Ethiopia to build people-focused
leadership capacities to enhance socio economic development at grass root level. The research approaches
adopted in this study were both descriptive and exploratory research types based on survey method to
understand a research problem. The finding of the analysis showed that, the Addis Ababa City Administration
(AACA) has decentralized to bring effective quality service provision and autonomous self-governance at grass
root level, however, the effective implementation of the district level decentralization in AACA was
qualification and competency were unfortunately given less priority in the application process. Instead, work
experience and network with key individuals were of primary importance. The main conclusion drawn from the
study is and as this paper has explored there was poor separation of powers, ineffective professional
accountability as well as poor oversight from high officers.
Keywords: Decentralization, Leadership, Capacity development, Human Resource
Introduction Countries have decentralized by establishing federal systems, some have established decentralized systems with
strong dozes of devolution, and there are many whose decentralization is mostly dominated by de-concentration.
What is observed generally is that the process of consolidating decentralized governance is still on-going and
needs strong support. Not only because governments and people are preferring decentralization as a politico-
administrative structural arrangement for their empowerment, but also because it promises a lot on the fronts of
democratization, people empowerment, and poverty reduction. These are goals that are pertinent with the United
Nations General Assembly’s MDG Declaration.
Whichever way decentralization is looked at, when it is implemented it puts in place structures both at central
and local government levels that provide layers of leadership thus providing a field for leadership development
in terms of knowledge, skills, attitudes, networks, systems, institutions, and values. Decentralization requires a
commitment of leadership at central and local government levels, a leadership that trusts in the power of the
people at local level. At the same time local governance structures provide a training ground through which
leaders are identified and trained through a hands-on process of managing local governments in all aspects

IJRCMEAS ISSN 2454-6593
87
(problem identification, policy and strategy design and decision-making including byelaws, ensuring
transparency and accountability, and in general managing resources). Decentralized structures also provide a
structural arrangement that can bring together leadership efforts from private sector, civil society at national and
local levels to converge and focus resources to developing local communities.
This research paper examines the challenges facing local level leadership in Ethiopia particularly in Addis
Ababa city administration and argues that in local governance, leadership transcends local governments to
become a partnership activity in which central government, local governments, civil society, private sector are
all engaged. It discusses the extent to leadership supports and commitments are taken place to implement
decentralization.Finally it explores the measures that can be taken by central government authorities, local
governments, and all development partners engaged in decentralized governance to harness local governance
and develop the various leadership capacities at local level for effective grass-roots development and poverty
reduction.
Literature
Basic Concepts of Decentralization
There is no one single definition of decentralization but the World Bank, for instance, uses the term
decentralization to describe a broad range of public sector reorganizations: Decentralization is the transfer of
authority and responsibility for public functions from the central government to intermediate and local
governments or quasi-independent government organization and or the
privatesector.Thisisacomplex,multifacetedconcept.Differenttypesofdecentralizationshouldbedistinguishedbeca
usetheyhavedifferentcharacteristics,policyimplications,andconditionsforsuccess.
Types of decentralization
Types of decentralization include political, administrative, fiscal, and market decentralization. Drawing
distinctions between these various concepts is useful for highlighting the many dimensions to successful
decentralization and the need for coordination among them. Nevertheless, there is clearly overlap in defining
any of these terms and the precise definitions are not as important as the need for a comprehensive approach.
Political, administrative, fiscal and market decentralization can also appear in different forms and combinations
across countries, within countries and even within sectors (The World Bank Premnotes, 2001; BiZa, 1980).
Political Decentralization
Political decentralization aims to give citizens or their elected representatives more power in public decision-
making. It is often associated with pluralistic politics and representative government, but it can also support
democratization by giving citizens, or their representatives, more influence in the formulation and
implementation of policies. Advocates of political decentralization assume that decisions made with greater
participation will be better informed and more relevant to diverse interests in society than those made only by
national political authorities. The concept implies that the selection of representatives from local electoral
jurisdictions allows citizens to know better their political representatives and allows elected officials to know
better the needs and desires of their constituents.

IJRCMEAS ISSN 2454-6593
88
Political decentralization often requires constitutional or statutory reforms, the development of pluralistic
political parties, the strengthening of legislatures, creation of local political units, and the encouragement of
effective public interest groups (Robertson 1993, p.125).
Fiscal Decentralization
Financial responsibility is a core component of decentralization. If local governments and private organizations
are to carry out decentralized functions effectively, they must have an adequate level of revenues –either raised
locally or transferred from the central government– as well as the authority to make decisions about
expenditures. Fiscal decentralization can take many forms, including a) self-financing or cost recovery through
user charges, b) co-financing or co-production arrangements through which the users participate in providing
services and infrastructure through monetary or labor contributions; c) expansion of local revenues through
property or sales taxes, or indirect charges; d) intergovernmental transfers that shift general revenues from taxes
collected by the central government to local governments for general or specific uses; and e) authorization of
municipal borrowing and the mobilization of either national or local government resources through loan
guarantees. In many developing countries local governments or administrative units possess the legal authority
to impose taxes, but the tax base is so weak and the dependence on central government subsidies so ingrained
that no attempt is made to exercise that authority (The World Bank group, 2002).
Administrative Decentralization
Administrative decentralization seeks to redistribute authority, responsibility and financial resources for
providing public services among different levels of government. It is the transfer of responsibility for the
planning, financing and management of certain public functions from the central government and its agencies
to field units of government agencies, subordinate units or levels of government, semi-autonomous public
authorities or corporations, or area-wide, regional or functional authorities (Holtmann 2000, p.131).
According to World Bank group (2002) administrative decentralization has three major forms of
decentralization such as: - de-concentration, delegation, and devolution -- each have different characteristics
mentioned as follows.
De-concentration.De-concentration--which is often considered to be the weakest form of
decentralization and is used most frequently in unitary states-- redistributes decision making authority
and financial and management responsibilities among different levels of the central government. It can
merely shift responsibilities from central government officials in the capital city to those working in
regions, provinces or districts, or it can create strong field administration or local administrative
capacity under the supervision of central government ministries.(The World Bank group, 2002).
Delegation.Delegation is a more extensive form of decentralization. Through delegation central
governments transfer responsibility for decision-making and administration of public functions to semi-
autonomous organizations not wholly controlled by the central government, but ultimately accountable
to it. Governments delegate responsibilities when they create public enterprises or corporations,
housing authorities, transportation authorities, special service districts, semi-autonomous school
districts, regional development corporations, or special project implementation units. Usually these

IJRCMEAS ISSN 2454-6593
89
organizations have a great deal of discretion in decision-making. They may be exempt from constraints
on regular civil service personnel and may be able to charge users directly for services.(The World
Bank group, 2002).
Devolution. A third type of administrative decentralization is devolution. When governments devolve
functions, they transfer authority for decision-making, finance, and management to quasi-autonomous
units of local government with corporate status. Devolution usually transfers responsibilities for
services to municipalities that elect their own mayors and councils, raise their own revenues, and have
independent authority to make investment decisions. In a devolved system, local governments have
clear and legally recognized geographical boundaries over which they exercise authority and within
which they perform public functions. It is this type of administrative decentralization that underlies
most political decentralization. (The World Bank group, 2002).
Economic or Market Decentralization
The most complete forms of decentralization from a government's perspective are privatization and deregulation
because they shift responsibility for functions from the public to the private sector. Privatization and
deregulation are usually, but not always, accompanied by economic liberalization and market development
policies. They allow functions that had been primarily or exclusively the responsibility of government to be
carried out by businesses, community groups, cooperatives, private voluntary associations, and other non-
government organizations (Malinvaud 1998, p.751).
Privatization. Privatization can range in scope from leaving the provision of goods and services
entirely to the free operation of the market to "public-private partnerships" in which government and
the private sector cooperate to provide services or infrastructure. Privatization can include: 1) allowing
private enterprises to perform functions that had previously been monopolized by government; 2)
contracting out the provision or management of public services or facilities to commercial enterprises
indeed, there is a wide range of possible ways in which function can be organized and many examples
of within public sector and public-private institutional forms, particularly in infrastructure; 3)
financing public sector programs through the capital market (with adequate regulation or measures to
prevent situations where the central government bears the risk for this borrowing) and allowing private
organizations to participate; and 4) transferring responsibility for providing services from the public to
the private sector through the divestiture of state-owned enterprises.
Deregulation reduces the legal constraints on private participation in service provision or allows
competition among private suppliers for services that in the past had been provided by the government
or by regulated monopolies. In recent years privatization and deregulation have become more attractive
alternatives to governments in developing countries. Local governments are also privatizing by
contracting out service provision or administration.
Choosing the Most Appropriate Form of Decentralization
Under appropriate conditions, all of these forms of decentralization can play important roles in broadening
participation in political, economic and social activities in developing countries. Where it works effectively,

IJRCMEAS ISSN 2454-6593
90
decentralization helps alleviate the bottlenecks in decision making that are often caused by central
government planning and control of important economic and social activities. Decentralization can help cut
complex bureaucratic procedures and it can increase government officials' sensitivity to local conditions and
needs. Moreover, decentralization can help national government ministries reach larger numbers of local
areas with services; allow greater political representation for diverse political, ethnic, religious, and cultural
groups in decision-making; and relieve top managers in central ministries of "routine" tasks to concentrate on
policy. In some countries, decentralization may create a geographical focus at the local level for coordinating
national, state, provincial, district, and local programs more effectively and can provide better opportunities
for participation by local residents in decision making. Decentralization may lead to more creative,
innovative and responsive programs by allowing local "experimentation." It can also increase political
stability and national unity by allowing citizens to better control public programs at the local level (Andrew
N. 1995)
But decentralization is not a panacea, and it does have potential disadvantages. Decentralization may not
always be efficient, especially for standardized, routine, network-based services. It can result in the loss of
economies of scale and control over scarce financial resources by the central government. Weak
administrative or technical capacity at local levels may result in services being delivered less efficiently and
effectively in some areas of the country. Administrative responsibilities may be transferred to local levels
without adequate financial resources and make equitable distribution or provision of services more difficult.
Decentralization can sometimes make coordination of national policies more complex and may allow
functions to be captured by local elites. Also, distrust between public and private sectors may undermine
cooperation at the local level (Hage 1997, p.127).
Project and program planners must be able to assess the strengths and weaknesses of public and private sector
organizations in performing different types of functions. Before developing elaborate plans for
decentralization, they must assess the lowest organizational level of government at which functions can be
carried out efficiently and effectively and -- for functions that do not have to be provided by government --
the most appropriate forms of privatization. Even program planners who do not see ‘decentralization’ as their
primary motive, must carefully analyze the types of decentralization already present in a country in order to
tailor policy plans to existing structures (Hage 1997, p.128).
Centralization and decentralization are not "either-or" conditions. In most countries an appropriate balance of
centralization and decentralization is essential to the effective and efficient functioning of government. Not
all functions can or should be financed and managed in a decentralized fashion. Even when national
governments decentralize responsibilities, they often retain important policy and supervisory roles. They
must create or maintain the "enabling conditions" that allow local units of administration or non-government
organizations to take on more responsibilities. Central ministries often have crucial roles in promoting and
sustaining decentralization by developing appropriate and effective national policies and regulations for
decentralization and strengthening local institutional capacity to assume responsibility for new functions. The
success of decentralization frequently depends heavily on training for both national and local officials in
decentralized administration. Technical assistance is often required for local governments, private enterprises
and local non-governmental groups in the planning, financing, and management of decentralized functions
(Hage 1997).

IJRCMEAS ISSN 2454-6593
91
Methodology
The researcher has applied both descriptive and exploratory research types and has followed Concurrent Mixed
Method Approach popularly called mixed method. To consolidate the entire research, the researcher has applied
the first-hand information gathering instruments together with documents and artifacts to represent the local
knowledge as all will rich sources of contextually relevant information. Besides, the Multi-stage sampling
techniques with its probability and non-probability sampling techniques were used. Formula was employed to
determine the sample size of the public servants. And the way in which the collected data was analyzed and
interpreted was also discussed clearly in main paper in relation to the application of SPSS and Chi-square testes
were used to look into some significance level of some variables.
Results and Discussions
The Extent of Implementation of DecentralizedSystem in Bringing TogetherLeadershipEfforts The extent of implementation of decentralized system in bringing together the leadership effort was
examined in terms of convergence of human resource management in the city administration. In order to
decentralize and depoliticize the public service, government has institutionalized decentralization in light of
their HRM goals. One vital aspect of administrative decentralization in Ethiopia is the devolution of power.
With this in mind, the power to recruit, select, promote, assign, grievance hear and inspect as well as transfer
within the sub-city, Woreda or kebele; and human resource development through short, medium and long-term
training are given to the civil service Bureau and the sub-city and kebele/Woreda’s civil service .
Human Resource Management is considered one of the fundamental resources to strategically implement
the district level decentralization. This vital resource fixes the implementation of government policies and
strategies as well as the decentralization program. The City Administrations and regional government deem that
the appropriate management of this vital resource is essential to sustain socio-economic development in the city
administration and in the other regions, widen democratization and the execution of laws.
As foundation to implementing the decentralization effectively, both the federal, city administrations and
regional civil bureaus were established with merit-based HRM. The Federal Civil Servants Proclamation No.
515/2007 clearly states the merit principles. The merit-based HRM statement declares recruitment and selection
as well as promotion to be merit-based with fair and open competition, treat staff and applicants fairly and
equitably, provide equal pay for equal work and reward first-rate performance, maintain high standard of
integrity, ensure public interest, manage public servants efficiently and effectively, retain or separate public
servants on the basis of their performance, educate and train staff, and protect employees from improper
political influence, among others.
Merit Based Recruitment and Selection
As merit-based recruitment and selection is a vital feature of HRM. Therefore, as asserted by Bratton
(2007), establishing a clearly designed policy when and how to select and recruit a permanent employee is an
important precondition for HRM Merit-based systems strive to ensure the recruitment and selection of a
relatively best and most capable candidates, thereby assisting efforts to attract, secure and retain professional
and high quality civil servants.

IJRCMEAS ISSN 2454-6593
92
Many scholars agree that Merit-based recruitment and selection comprises of a set of activities and
processes used to legally obtain a sufficient number of qualified people at the right place and time so that the
people and the organization can select each other in their own best short and long term interests. The Ethiopian
Federal Civil Servants Proclamation No. 515/2007 states that, “a vacant position shall be filled only by a person
who meets the qualifications required for the position and by the candidate who scores higher than other
candidates affirms that the merit-based recruitment and selection should be done from among qualified pool of
candidates and with the aim to achieve a diversified workforce representing all segments of society.
Respondents were consulted to share their observation and opinion of the HRM implementation strategies and
the application of merit-based recruitment and selection criteria. In this regard, table 4.1 illustrates that despite
the fact that the law advocates the assurance of merit-based recruitment and selection and effective decentralized
implementation, most respondents (64.6% and 59.1%) were disagreed that qualification and competency-based
recruitment and selection criteria and a merit-based system were applied, respectively.
On the other hand, respondents believed that recruitment and selection in Addis Ababa city administration was
the primary process used for attracting candidates in accordance with human resource plan. The effort to apply
the merit-based recruitment and selection criteria was made difficult by the recruiter. The respondents validated
this bias and 70.4% of the contributor confirmed that, recruitment priority was given to experience and 82% of
them asserted entrance exam was a repeatedly applied merit criteria during recruitment in the public service.
Table 1: Merit Based Recruitment and Section Criteria
Survey Statement
Merit Criteria
SA
A
NC
D
SD
In your Sub City and Woreda/kebeleas
part of the HRM, Merit based recruitment
and section is applied by using:
Qualification 11.2% 24.2% - 46.6% 18%
Experience 1.4% 69% - 27.6% 2%
Competence 9.9% 31% - 39.8% 19.3%
Entrance Exam 16.3% 65.7% - 13.9% 4.1%
Assignment 14.1% 20% 60% 5.9%
Note: SA: Strongly Agree; A: Agree; NC: No Comment; D: Disagree; SD: Strongly Disagree
Source: Field Survey, 2015
From the above table, it is clear that the merit-based recruitment and selection criteria in Addis Ababa city
administration were not fully applied. It is known that experienced professionals and competent candidates are
vital for proper execution of government policies, strategies and effective implementation of decentralization.
Nonetheless, if qualification and competency are inadequately applied and focus is given to experience and
entrance exam results, in some sense, there is a possibility to hire unqualified applicants which is assignment
while on the other hand reject fresh professional graduates who may be competent candidates.
A good HRM is typified by its open and transparent competition-based recruitment and selection that
assures merit-based competition. Some of the interviewees and focus discussions groups pointed out that
individuals who held key hiring positions exercised personal bias defying the merit-based principles by

IJRCMEAS ISSN 2454-6593
93
forwarding favored candidates though they went through the motions of competitive procedures for the sake of
formality. Preference was given to candidates who catered to officials or to party (EPRDF) members. Such
practices seem to be deeply entrenched and difficult to stop altogether.
The other serious problem observed was in promotion of existing civil servants. In Addis Ababa, when a
public servant is upgraded due to his/her academic achievements, particularly for teachers, economists,
managers or accountants, work experiences seem to be ignored. Another concern area is that the HRM
guidelines do not include all categories of employment, such as managers and economists, giving latitude to
self-serving employers. For that reason, though some candidates studied in those fields, it was very difficult to
go through the application process and compete in vacancies that were announced in management positions and
in other similar fields. Hence, urban management positions were not managed by candidates with qualifications
in urban management and similarly most public management related positions were not filled by public
management experts in the city administration.
Merit Based Promotion
Merit-based promotion is the process of advancement of an individual civil servant from one job position
to another that has higher salary variety, higher level job position and responsibilities. As asserted by Sarah
(2010), promotion is viewed as advantageous to employees because promotion has an impact on pay, authority,
responsibility and the ability to influence broader organizational decision-making process.
The Ethiopian Federal Civil Servants Proclamation No. 515/2007 in general agree that promotion is the
assignment of a civil servant to a higher grade level and it is given for the purpose of enhancing the performance
of government institutions and to motivate employees.
Promotion as HRM discipline ought to consider all eligible public servants on equal basis. The application
of merit-based criteria in AACA was used as motivating tool to assist individuals and organizations so as to
improve their skills and abilities. As indicated in Figure 4.4 below, the merit based selection criteria to promote
high performer civil servants were inadequately applied. Civil servants were typically promoted based on their
experience. Accordingly, 50.6% of the respondents valued the fact that priority was given for experience to
promote someone. The fundamental nature of merit-based promotion is to reward and recognize higher
performers in the civil service and needs to be applied in consideration of all the merit criteria.
Nevertheless, 52% and 53.7% of the participants disagreed on the application to consider performance and
qualification, respectively as merit-based promotion criteria in AACA. The other important but ignored criterion
was the application of entrance exam. This merit principle helps to provide equal opportunity for competent
professionals. Civil servants in the study area, however, were not expected for promotion purposes.
For this reason, 92.2 percent of the respondents were avowed their rejection to the practicality of entrance
exam as a promotion measure to take positions and responsibilities in the public service organization of the city
administration. 52.3percent of the respondents were also disagreed to accept the application of competency as
promotion criteria 37.7 percentof them accepted the functional application of promotion as merit based
promotion criteria.

IJRCMEAS ISSN 2454-6593
94
Figure 1: Views of Respondents on Merit-Based Promotion
Source: Field Survey, 2015
At some point in the implementation of decentralization, there need to motivate and reward high performer
civil servants to amplify their effectiveness and efficiency. Motivation is about the internal and external forces
that influence individual’s degree of willingness and choice to engage in a certain specified behavior and action
(Reem, 2010). For this reason, civil servant respondents of the sample Sub Cities andWoredas were requested
whether the public service organizations narrate promotion as a reward and motivation or not. All the civil
servants under study accept the notion that promotion is a form of recognition for employees who make
significant and effective work contributions.
However, in practice as indicated in the table 4.2 below, 74.5 percent of the respondents revealed their
rejection to illustrate the improper application of merit based promotion as a reward in their institutions. Only
24.8 percent of them realized as promotion was properly applied to reward and motivate the civil servant. Both
male and female were victims of the poor applicability of promotion as a motivating and rewarding factor in the
study area. Hence, 72.9 percent of the male and 77.5 percent of the female respondents were replied promotion
was not applied to motivate and reward the first rated civil servant.
Table 2: Views of respondents on whether promotion is given as a reward or motivation to award the high
performer civil servants
Promotion as Reward or Motivation
Total Yes No I Don't Know
Sex Male Count 50 140 2 192
% within Sex 26.0% 72.9% 1.0% 100.0%
Female Count 23 79 0 102
% within Sex 22.5% 77.5% .0% 100.0%
Total Count 73 219 2 294
% within Sex 24.8% 74.5% .7% 100.0%
Source: Field Survey, 2015
IJRCMEAS ISSN 2454-6593
95
Focus group discussants were also consulted to share their opinion on the practical implementation of
promotion as part of merit-based HRM. As a result, some of the respondents expressed annoyance saying why
they were asked about the distorted merit principles, while party loyalists enjoyed all the civil service positions.
Some others also added, “Please leave it, it is only on the whitepaper civil servants proclamation that all merit
disciplines were correctly stated”.
To be promoted and hold some positions, the first thing to be asked is whether you are member of the
ruling party or not. Once screened in this way, the next step focuses on how civil servants accept the current
state of affairs. If one raise questions or argues on the rules and regulations stated that one would certainly be
condemned as soon as he/she left the room. Personally condemned people would be denied fair evaluation and
promotion. Promotions and desirable positions appear to be reserved for those favored by incumbent officials.
The other notorious thing is that, if you do not have the right connection with government or the ruling
party officials, no one can remember you through the merit line for promotion however industrious you may be.
This is what is in practice and for that matter; one survival mode is that you hide yourself as ‘sleeping dog’. For
sure, if you go down into and check the civil service system, this is the reality in Addis Ababa today said some
of the interviewee and focus group discussants. The rationale behind this discussion was to underscore that the
civil servant selection procedures in the region established for promotional purposes under value the most
meritorious civil servants.
Similarly, some civil service officials confirm the existence of ill network in the civil service has affected
the merit based promotion systems but it was rare. However, most of the officials claimed the civil servants
response and justified as all promotion systems were held on the bases of merit principles and competitions.
Civil service Promotion is considered as giving some high responsibility or position with high salary and better
privilege to execute government programs. With this assumption, civil service promotion programs were not
free of human bias. For this reason, the complete application of the merit principles in promotion replied by
some of the officials were far from the logic behind the human biasness. Hence, by comparing the civil servants
and officials response, we can conclude that, the merit based promotion in Tigray region lacks rational
discriminatory approach.
Performance Pay
The BSC manual in the AACA dictates that, civil service institutions need to meet the culture that supports
pay for performance, rigorous performance evaluation system, effective and fair supervisors, appropriate
training for supervisors as well as employees, and system of check and balance to ensure fairness and ongoing
system evaluation. Nevertheless, the performance evaluation and the performance pay in the study area were
applied in contrary. Table 3 below recaps this condition.
Table 3: Respondents views on whether the existing civil service pay scale is closely linked to performance
appraisal

IJRCMEAS ISSN 2454-6593
96
Civil service pay scale based
on performance appraisal
Total Yes No
Sex Male Count 35 157 192
% within Sex 18.2% 81.8% 100.0%
Female Count 13 89 102
% within Sex 12.7% 87.3% 100.0%
Total Count 48 246 294
% within Sex 16.3% 83.7% 100.0%
Source: Field Survey, 2015
As we can see from the Table 3, 83.7percent of the respondents answered that the civil service pay-scale
was not linked to the performance appraisal system. Similarly, 81.8percent of the male and 87.3percent of the
female respondents also affirmed that the two were not linked. Only 16.3percent of the participants responded
yes by confirming that the civil service pay-scale is applied based on the performance appraisal system. Under
government policy, public servant salary can be increased on the basis of length of service, but this is not based
on performance review. The recent reward and motivation related system aims to reward good performance and
‘Model’ employees. However, contrary to the plan, the recent system is highly dependent on the whims of
officials and party affiliation.
Some of the respondents also suggested that, in most cases, presumed model civil servants are not selected
by their job performance but through partisan relationships and patron network with the evaluator. In AACA,
public servant recruitment was basically systematized as permanent placement. Unless they misbehaved, public
servants can usually anticipate staying in their position permanently in-spite-of their performance. Figure
2depicts the large number of public servants who earned 1000-1999 (less than 2,000) Ethiopian Birr since 2011.
In the highly inflated age today, we can imagine how life has become unbearable for the majority of the civil
servants in the country.
Figure 2: Public Servants Salary Scale
Source: AACA CSB, HRM Core Process Owner, 2015

IJRCMEAS ISSN 2454-6593
97
It is obvious that the civil servants are suffering due to the ‘sky rocketed’ market price while in the
meantime; the government is creating new organizations as Agencies with a different salary scale that is twice
as high as that of the civil servants’. For instance, the revenue agency office at bureau level in general and at
Woreda level in particular. The employee in the agency at a process owner position earns from 6,000-8,000 Birr
a month, while the long-standing civil servant earns from 3,817-4,343 Birr per month. Hence, no need to
compare the civil service with the private sector since the discrepancy within two government agencies provides
sufficient evidence. This practice defies the provisions of the law where all positions of equal value are
supposed to earn equal base salary. All contributors claimed the salary scale.
The problem in salary scale was sensed by all the civil service officials at all levels. They appreciated the
current imbalance of market price and the civil servant earnings. However, the higher officials at bureau level
justified that as it needs to balance such salary scale vertically and horizontally across the civil service systems
and other public agencies. For this reason, some of them also replied that as currently the national government is
working on that.
De-Politicization of the Civil Service
Politicized civil service kills citizen expectation and it badly attacks professionalism. The doctrine for de-
politicization comes with the concepts of merit system. The NPM revolution also consolidated the de-
politicization agenda because the NPM movement was considered as a paradigm shift from autocracy to
democracy by creating political pluralism (Polidano, 2001).
Recognizing this scenario, in Ethiopia, there is a clearly defined proposition which publicize de-
politicization of the civil service. Both the Federal and Regional civil servants proclamation pronounced that,
‘’any civil servant shall be loyal to the public and the Constitution and devote his/her whole energy and ability
to serve the public.’’ This sentiment was introduced because of the politicized civil service failed to fulfill
public interest during the previous regimes.
The civil service experience in AACA was bear-out that, a politicized civil service lacks the essential
characters and practical capability for that it stands for. Thus, to make the civil service more successful,
transparent, service-oriented and legally responsible, De-politicization of the civil service in Ethiopia as well as
in AACA was urgently internalized to neutralize the civil service from politicization after the down-fail of the
Derg regime
However, table 4.4 below summarizes that, the promise in practice to have a neutral policy implementer
civil service, there observed unnecessary political interference against the merit based HRM in the city
administration. For this reason, 34.7% of the respondents appreciated the problem that there was a broken
promise of de-politicization in the civil service organizations. At the same time, the highest mode replied was
45.9% which was not free of this symptom because it indicated the somewhat neutral rejoinder. Nevertheless,
only 19.4% of the participants were joined to answer the civil servants in AACA were neutral policy
implementers.

IJRCMEAS ISSN 2454-6593
98
Table 4: Views of respondents on the promise for practicing civil service De-Politicization
Civil Service De-Politicization
Total
It is neutral policy implementer
It is somewhat neutral
There is a broken promise of De-Politicization
Sex Male Count 31 98 63 192
% within Sex 16.1% 51.0% 32.8% 100.0%
Female Count 26 37 39 102
% within Sex 25.5% 36.3% 38.2% 100.0%
Total Count 57 135 102 294
% within Sex 19.4% 45.9% 34.7% 100.0%
Source: Field Survey, 2015
As summarized in table 4, large numbers of female respondents (38.2%) indicated the merit practice in
AACA was violated due to the broken promises of civil service de-politicization. However, 51% of the male
participants suggested that the AACA public service was somewhat neutral in government policy
implementation. The male respondents felt that the AACA public service was not free of politicization. Some
scholars assert that the fruitfulness of democratic governance is directly proportional to the productivity of the
civil service.
For this reason, it is important to have a de-politicized civil service for better democratic governance. The
fact that political appointees assist the government of the day to pursue its policies into sector specific
implementation and oversee the execution of policy to ensure the expected outcome is pronounced.
Nevertheless, the data suggests that respondents believe there is partisan politicization for tight control over the
civil service by elected officials.
By law, in AACA public service organizations, political appointees are the Bureau head and vice head,
sub-city and Woredaoffice head and vice head or their equivalents in order to control the bureaucracy and
implement government policy as effectively as possible. In reflecting upon this, most respondents from the
sample kebeles and sub-cities concluded that this was a deliberate act employed in effect to gain political
support by controlling the bureaucracy.
Unfortunately, a competent nonpartisan civil servant who performs well on the entrance exam may not be
selected for those positions unless and until they become member of the ruling political party. Key positions
such as process coordinators at regional bureaus and the sub-cities and Woredaslevel are also reserved for only
party members. Some of the respondents confirmed that even among party members, only the favored ones and
those considered close to the appointer are selected. Beyond party loyalty, only individuals who have personal
connection with high officials benefit and survive in this current If continued, this approach not only violates the
merit principles but also the effectiveness of decentralization implementation and the political system of the
government.
In AACA, political affiliation in the public service seems to be deeply engrained. Figure 3illustrates that
the consistent increments over time of party loyalists in the sense of partisan membership.
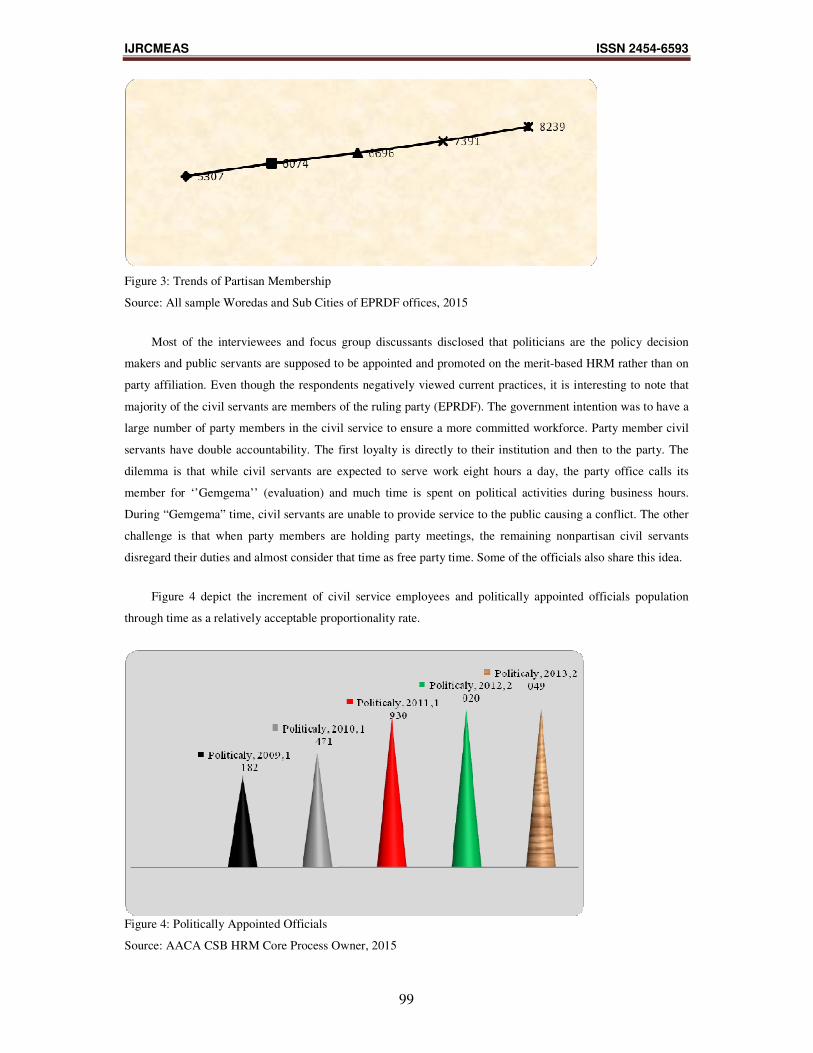
IJRCMEAS ISSN 2454-6593
99
Figure 3: Trends of Partisan Membership
Source: All sample Woredas and Sub Cities of EPRDF offices, 2015
Most of the interviewees and focus group discussants disclosed that politicians are the policy decision
makers and public servants are supposed to be appointed and promoted on the merit-based HRM rather than on
party affiliation. Even though the respondents negatively viewed current practices, it is interesting to note that
majority of the civil servants are members of the ruling party (EPRDF). The government intention was to have a
large number of party members in the civil service to ensure a more committed workforce. Party member civil
servants have double accountability. The first loyalty is directly to their institution and then to the party. The
dilemma is that while civil servants are expected to serve work eight hours a day, the party office calls its
member for ‘’Gemgema’’ (evaluation) and much time is spent on political activities during business hours.
During “Gemgema” time, civil servants are unable to provide service to the public causing a conflict. The other
challenge is that when party members are holding party meetings, the remaining nonpartisan civil servants
disregard their duties and almost consider that time as free party time. Some of the officials also share this idea.
Figure 4 depict the increment of civil service employees and politically appointed officials population
through time as a relatively acceptable proportionality rate.
Figure 4: Politically Appointed Officials
Source: AACA CSB HRM Core Process Owner, 2015

IJRCMEAS ISSN 2454-6593
100
The Neutrality Model sheds light to leave few positions at the top for political appointment and leaving the
middle positions for technocrats to help moderate the bureaucracy. The overall discussion about neutrality of the
civil service however manifests, politicization to control bureaucracy was viewed as a significant departure from
the proper application of merit criteria. The paradox in this is that, on one hand, the regional government desires
to provide a legal basis for party political control while on the other hand, the system seen to leave room for
merit-based human resource practice confusing the desire to remain neutral. If continued, this will frustrate the
civil servant defeat the purpose of HRM by encouraging poor performance in the implementation of
decentralization.
Though merit principles are more technical which might be beyond the knowledge of local people,
however, to hear public say and their intention towards the merit based HRM of the sample Woredas and Sub
Cities, sample respondents were tried to consider in the survey because they are in one way or the other service
users of the civil service organizations. To this regard, service user respondents were replied the HRM in AACA
was acceptable. For this reason, 36.7% and 46.7% of the contributors answered that the merit based HRM was
good and satisfactory. In contrast, 16.7% of them were claimed the goodness of the merit based HRM in AACA.
Though public servants turnover can be resulted due to many reasons, however, the poor conducive
working environment in government bureaucracy facilitates to leave experienced and qualified professionals
from an organization. To this regard, public servant turnover in AACA was very high in from year to year. The
following figure illustrates this logical argument. Therefore, if continued the regional government will lose its
industrious civil servant to implement it development agenda.
Figure 5: Civil Servant Turnover in AACA
Source: AACA CSB HRM core process owner, 2015
From the discussion, we can observe that the satisfactory merit system was examined by the public and as
has discussed, the civil servant themselves were at most rejected the merit based HRM of the study area.
Though it needs further research, the high turnover in the civil service was also may be due to the above poor
conducive working environment. Therefore this needs a special attention to work-on it.
Conclusion
The institutional framework in AACA was well-framed independent of the Civil Service Offices at Sub
Cities and all the way to the Kebelesat the grass-roots level. This effort helped empower local people to
participate in local development agendas and bring public services closer to the local community.

IJRCMEAS ISSN 2454-6593
101
Institutionalization of HRM as parts of DLDP also created a fertile condition for the practice of merit-based
HRM.
In AACA, qualification and competency were unfortunately given less priority in the application process.
Instead, work experience and network with key individuals were of primary importance. Given that core process
owners and program coordinators were party members, party affiliation became key consideration in the
recruitment, selection and promotion. Party loyalists were generally appointed without a semblance of open
competition or application of the merit system.
Similarly, promotions as part of the merit-based HRM were inadequately carried-out. This was due to
several reasons: the application criteria for merit-based promotion was inadequate, entrance exam results were
not considered for promotion, promotion was not used as motivational and/or rewarding tool, there was ill-fated
relationship between party loyalists and officials in charge undermining the most meritorious applicants.
The findings also show that the overall claim to de-politicize the civil service was compromised by
unnecessary political interference. Despite the institutional framework that promised to make the civil service
neutral, there was poor separation of powers, ineffective professional accountability as well as poor oversight
from high officers. In addition, civil service politicization is an old practice which may never fit modern
thinking because of the potential dangers in which politicization undermines merit-based employment and
promotion. Such practices jeopardize bureaucratic integrity and harmfully affect the professional quality of civil
servants and the decision-making processes.
Reference
Azfar, O., Kahkonen, S. and Meagher, P. (2001).Conditions for Effective Decentralized Governance: a
synthesis of research findings.The World Bank, University of Maryland.
Battaglia Michael, P., n.d.Multi-Stage Sample. Available at <http://srmo.sagepub.com/view/ encyclopedia -of-
survey- research-methods/n311.xml> [accessed on 8 September 2015]
BiZa (1980): MINISTERIE VAN BINNENLANDSE ZAKEN Decentralisatienota, Den Haag.
Brace, I. (2004). Questionnaire Design: How to Plan, Structure and Write Survey Material for Effective
Market Research. London: Market Research in Practice Series.
Brain, D.E. and Robotti, L.eds. (2007). The Theory and Practice of Local Government Reform: studies in
fiscal federalism and state – local finance. USA: Edward Elgar
CorbettaPiergiorgio, (2003). Social research: Theory, Methods and Techniques.Sage Publications, New Delhi.
Creswell John, W. (2003).Research Design: qualitative, Quantitative and Mixed Methods. London and New
Delhi: Sage Publications.
Dickovick, J.T. and TegegneGebre-Egziabher.(2010). Comparative Assessment of decentralization in
Africa: Ethiopia desk study, USAID Series.
Dollery, B.E. and Robotti, L.eds.(2008). The Theory and Practice of Local Government Reform: studies in
fiscal federalism and state – local finance. USA: Edward Elgar

IJRCMEAS ISSN 2454-6593
102
Falleti, T.G.,(2004). A Sequential Theory of Decentralization and Its Effects on the Intergovernmental
Balance Of Power: Latin American Cases In Comparative Perspective: Kellogg Institute. Available
at: http://ellogg.nd.educ /publications /wps/314.pdf [accessed 20 September 2015].
Foddy, W. (1993). Constructing Questions for Interviews and Questionnaires: Theory and Practice in Social
Research. Cambridge: Cambridge University Press.
Guney, S. (2004). Organizational identity and sense making in collaborative development of technology: An
ethnographic case study of "building the box", The University of Texas at Austin, Austin.
Manor, J. (2011).Perspectives on Decentralization.Sweden; ICLD. Available at http://www.icld.se/pdf/
ICLD_wp3_printerfriendly.pdf [accessed 16 January 2014]
Mick Dodson, (2012) ‘Indigenous governance: Self-determination in action’ Reconciliation News No 25,
December 2012, page 11
Olowu, D. and Wunsch, J.S.,(2004). Local Governance in Africa: the challenges of democratic
Decentralization. London: Lynne Rienner Publishers, Inc.
ROBERTSON, D. (1993). “Decentralization”. A Dictionary of Modern Politics, 2nd ed.
Rondinelli, D. A., McCullough, J. S., and Johnson, R.W.,(1989). Analyzing Decentralization Policies
in Developing Countries: a political-economy framework. Available at: htttp://www.worldbank.org
/public sector/decentralization/different.htm[accessed 20 September 2015].
Rosen, H.S. and Gayer, T.,(2010). Public Finance.New York, McGraw-Hill.
Seymour Anne, (2004).Focus Groups an Important Tool for Strategic Planning. Washington, D.C.
TegegneGebre-Egziabher,(2007). A Brief Review of Decentralization in Ethiopia.., Addis Ababa: Forum
for Social Studies.
World Bank,(2010). Demanding Good Governance: lessons from social accountability initiatives in Africa.
Washington: the World Bank,
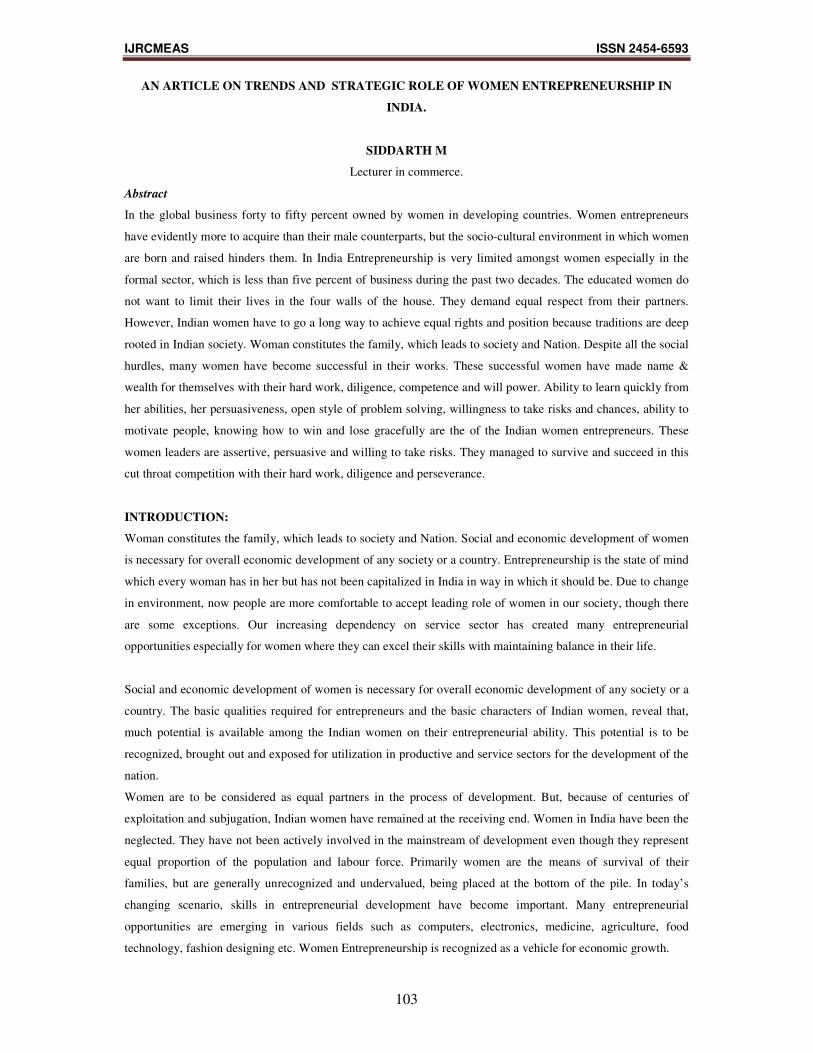
IJRCMEAS ISSN 2454-6593
103
AN ARTICLE ON TRENDS AND STRATEGIC ROLE OF WOMEN ENTREPRENEURSHIP IN
INDIA.
SIDDARTH M
Lecturer in commerce.
Abstract
In the global business forty to fifty percent owned by women in developing countries. Women entrepreneurs
have evidently more to acquire than their male counterparts, but the socio-cultural environment in which women
are born and raised hinders them. In India Entrepreneurship is very limited amongst women especially in the
formal sector, which is less than five percent of business during the past two decades. The educated women do
not want to limit their lives in the four walls of the house. They demand equal respect from their partners.
However, Indian women have to go a long way to achieve equal rights and position because traditions are deep
rooted in Indian society. Woman constitutes the family, which leads to society and Nation. Despite all the social
hurdles, many women have become successful in their works. These successful women have made name &
wealth for themselves with their hard work, diligence, competence and will power. Ability to learn quickly from
her abilities, her persuasiveness, open style of problem solving, willingness to take risks and chances, ability to
motivate people, knowing how to win and lose gracefully are the of the Indian women entrepreneurs. These
women leaders are assertive, persuasive and willing to take risks. They managed to survive and succeed in this
cut throat competition with their hard work, diligence and perseverance.
INTRODUCTION:
Woman constitutes the family, which leads to society and Nation. Social and economic development of women
is necessary for overall economic development of any society or a country. Entrepreneurship is the state of mind
which every woman has in her but has not been capitalized in India in way in which it should be. Due to change
in environment, now people are more comfortable to accept leading role of women in our society, though there
are some exceptions. Our increasing dependency on service sector has created many entrepreneurial
opportunities especially for women where they can excel their skills with maintaining balance in their life.
Social and economic development of women is necessary for overall economic development of any society or a
country. The basic qualities required for entrepreneurs and the basic characters of Indian women, reveal that,
much potential is available among the Indian women on their entrepreneurial ability. This potential is to be
recognized, brought out and exposed for utilization in productive and service sectors for the development of the
nation.
Women are to be considered as equal partners in the process of development. But, because of centuries of
exploitation and subjugation, Indian women have remained at the receiving end. Women in India have been the
neglected. They have not been actively involved in the mainstream of development even though they represent
equal proportion of the population and labour force. Primarily women are the means of survival of their
families, but are generally unrecognized and undervalued, being placed at the bottom of the pile. In today’s
changing scenario, skills in entrepreneurial development have become important. Many entrepreneurial
opportunities are emerging in various fields such as computers, electronics, medicine, agriculture, food
technology, fashion designing etc. Women Entrepreneurship is recognized as a vehicle for economic growth.

IJRCMEAS ISSN 2454-6593
104
Concept of Women Entrepreneurs
Women Entrepreneurs may be defined as the women or a group of women who initiate, organize and operate a
business enterprise. The Government of India has defined women entrepreneurs as “an enterprise owned and
controlled by women having a minimum financial interest of 51 per cent of the capital and giving at least 51 per
cent of the employment generated in the enterprise to women. According to Suresh Reddy women
entrepreneurship is a composite skill, the resultant of a mix of many qualities and traits – these include tangible
factors as imagination, readiness to take risks, ability to bring together and put to use other factors of production,
capital, labour, land, as also intangible factors such as the ability to mobilize scientific and technological
advances. Samwel (2003) viewed women entrepreneurship as a function which seeks investment and production
process by raising capital, arranging labour and raw materials, finding site, introducing new techniques and
commodities and discovering new sources for the enterprises. When we speak about the term “Women
Entrepreneurship” we mean, an act of business ownership and business creation that empowers women
economically, increases their economic strength as well as position in society.
PHASES OF WOMEN ENTREPRENEURS PRACTICE IN INDIA
PHASE I
� Established in big cities
� Having higher level technical and professional qualifications
� Nontraditional items
� Sound financial position
PHASE I I
� Established in cities and towns
� Having sufficient education
� Both traditional and nontraditional items
� Undertaking women services – kindergarten, crèches, beauty parlours, health clinic
PHASE I II
� Illiterate women
� Financially weak
� Involved in family business such as agriculture, horticulture, animal husbandry, dairy,
fisheries, agro forestry, handloom, power loom etc.
Research Methodology
Secondary data has been contributed to write this paper. From the Various report, articles, books, journals.
Limitations: This paper is based on secondary research conducted on the subject and provides a
limited view due to the short period of time.
Objectives and Research Methodology of the Study
� To portray a profile of women entrepreneurs
� To identify problems unique to women in setting up and running their enterprise
� To document existing policies, programmes, institution networks the involve support in promoting
women entrepreneurship.

IJRCMEAS ISSN 2454-6593
105
� To critically examine the problems faced by women entrepreneurs
Reasons for Women Becoming Entrepreneurs
� Innovative thinking
� New challenges and opportunities for self fulfillment
� Employment generation
� Freedom to take own decision and be independent
� Government policies and procedures
� Family occupation
� Need for additional income
� Bright future of their wards
� Success stories of friends and relatives
� Role model to others support of family members
� Education and qualification self identity and social status
� They want to assume new and fresh challenges and opportunities for self-fulfillment.
� They want to prove their personalities in an innovative, daring and competitive jobs.
� Government introduction attractive incentives, subsidies & various schemes
� Increasing standard of living
� Increasing socio-economic awareness
Major Hindrances
Support and approval of the husbands seem to be a necessary condition for women’s entry into business. Lack
of such family approvals make for a considerable hindrance for women When family members are not in favor
of supporting their ladies to take up the business, naturally they do not support with the finances required for
starting a new business unit. Banking and financial sector feel the same way and often refuse finance on the
bases of gender bias.
Many women led business enterprises have imperfect organizational set ups as compared to men.
Women and the Economy
The participation of women in the workforce, the quality of work allotted to them, and their contribution to the
GDP are indicators of the extent of their being mainstreamed into the economy. The National Skill Development
Programme (NSDP) has identified 231 modular courses for women. It is critical that the training has relevance
to the changing labour markets. Efforts are needed to link skill development programmes to the NSDP to ensure
relevance and enhance employability. An important strategy for financial inclusion of women, which is crucial
for their integration into the economy, has been micro-finance.
The model encourages access of SHGs to banks both as a means of savings and as providers of loan services.
SHGs including those formed under the SGSY had been covered under the National Bank for Agricultural and
Rural Development's (NABARD) SHG-bank linkage programme. Women Entrepreneurship in India earlier
there were 3 Ks: Kitchen, Kids & Knitting, then came 3 Ps: Powder, Pappad & Pickles, At present there are 4
Es: Electricity, Electronics, Energy & Engineering.

IJRCMEAS ISSN 2454-6593
106
The Major Barriers Encountered By Women Entrepreneurs
The greatest deterrent to women entrepreneurs is that they are women. Male chauvinism is still prevalent in
many parts of the country yet. Women are looked upon as able i.e. weak in all respects. In a male dominated
society, women are not treated equal to men that act as a barrier to woman‘s entry into business. Lack of self-
confidence, will-power, strong mental outlook and optimistic attitude amongst women creates a fear from
committing mistakes while doing their piece of work. They are even less educated, economically not stable nor
self-dependent which reduce their ability to bear risks and uncertainties involved in a business unit, The old and
outdated social outlook to stop women from entering in the field of entrepreneurship is one of the reasons for
their failure. Women's family obligations also bar them from becoming successful entrepreneurs in both
developed and developing nations. Indian women give more emphasis to family ties and relationships.
Achievement motivation of the women folk found less compared to male members. Absence of proper support,
cooperation and back-up for women by their own family members and the outside world people force them to
drop the idea of excelling in the enterprise field. Many women take the training by attending the Entrepreneurial
Development programme without an entrepreneurial bent of mind. Lack of awareness about the financial
assistance in the form of incentives, loans, schemes etc. by the institutions in the financial sector.
Credit discrimination and Non Cooperative officials Poor infrastructure and Dealing with male labourers Fear of
expansion and Lack of access to technology.
Opportunities to Women Entrepreneurs
Highly educated, technically sound and professionally qualified women should be encouraged for managing
their own business, rather than dependent on wage employment outlets. The unexplored talents of young women
can be identified, trained and used for various types of industries to increase the productivity in the industrial
sector. A desirable environment is necessary for every woman to inculcate entrepreneurial values and involve
greatly in business dealings. The additional business opportunities that are recently approaching for women
entrepreneurs are: Eco-friendly technology, Bio-technology, IT enabled enterprises, Event Management,
Tourism industry, Telecommunication , Plastic materials, Mineral water, Herbal & health care, Food, fruits &
vegetable processing.
Role of women as an entrepreneur
Considering the flow of women entrepreneurs in the traditional industries, it is often criticized that the women
entrepreneurship is engaged only in handloom and handicraft and in the nontraditional term, Now, their aspects
have broadened into new line like hotel line, Xeroxing, Beauty Parlor business, incense stick making, candle
making etc. In the last decade, there has been a remarkable shift it emphasizes from the traditional industry to
non-traditional industry and services. Based on this concept, some important opportunities are being identified,
considering the socio-economic, cultural and educational status and motivational level of women entrepreneurs,
particularly projects with low investment, low technical know-how and assured market are suggested for them
such as production of soaps, detergents, ready- made instant food products including pickles, spices, papad,
manufacturing of wooden goods, beauty parlor business, typing centre, job contracts for packaging of goods and
distribution and household provision etc.
SUCCESSFUL LEADING BUSINESS WOMEN IN INDIA
• Akhila Srinivasan, Managing Director, Shriram Investments Ltd

IJRCMEAS ISSN 2454-6593
107
• Chanda Kocchar, Executive Director, ICICI Bank
• Ekta Kapoor ,Creative Director, Balaji Telefilms
• Jyoit Naik, President, Lijjat Papad
• Kiran Mazumdar-Shaw, Chairman and Managing Director, Biocon
• Lalita D Gupte, Joint Managing Director, ICICI Bank
• Naina Lal Kidwai ,Deputy CEO, HSBC
• Preetha Reddy, Managing Director, Apollo Hospitals
• Priya Paul, Chairman, Apeejay Park Hotels
• Rajshree Pathy, Chairman, Rajshree Sugars and Chemicals Ltd
• Ranjana Kumar ,Chairman, NABARD
• Ravina Raj Kohli, Media personality and ex-President, STAR News
• Renuka Ramnath, CEO, ICICI Ventures
• Ritu Kumar ,Fashion Designer
• Ritu Nanda, CEO, Escolife
• Shahnaz Hussain, CEO, Shahnaz Herbals
• Sharan Apparao, Proprietor, Apparao Galleries
• Simone Tata, Chairman, Trent Ltd
• Sulajja Firodia Motwani, Joint MD, Kinetic Engineering
• Tarjani Vakil, former Chairman and Managing Director, EXIM Bank
• Zia Mody, Senior Partner, AZB & Partners
CONCLUSION:
It can be said that today we are in a better position wherein women participation in the field of entrepreneurship
is increasing at a considerable rate. Efforts are being taken at the economy as brought promise of equality of
opportunity in all spheres to the Indian women and laws guaranteed equal rights of participation in political
process and equal opportunities and rights in education and employment were enacted. But unfortunately, the
government sponsored development activities have benefited only a small section of women i.e. the urban
middle class women. Women sector occupies nearly 45% of the Indian population. Despite all these odds,
successful women’s entrepreneurs do exist. Women entrepreneurs have evidently more to “acquire” than their
males counterparts. This is largely due to the socio-cultural environment in which Indian women are born and
raised. Social customs, caste restriction, cultural restraints and norms leave women lagging behind men. They
are not mentally geared to slip into an entrepreneurial role becomes of their family orientation, restricted
mobility and limited access to resources. But given the opportunity, direction and guidance, they are capable of
overcoming these limitations.
Women entrepreneurs make a significant contribution to the Indian economy. There are nearly three million
micro, small and medium enterprises with full or partial female ownership. Today’s women entrepreneur
represents a group of women who have started exploring new possibilities of economic participation. Self
Confidence, self esteem, educational level and knowledge make women handle different tasks in life. Women

IJRCMEAS ISSN 2454-6593
108
entrepreneurs not only require motivation in the form of financial assistance, government permissions, they may
require support from family members and life partners.
References
� Handbook on Women-owned SMEs, Challenges and Opportunities in Policies and programmes,
International Organization for Knowledge Economy and Enterprise Development.
� Lall, Madhurima, & Sahai Shikha, 2008, Women in Family Business, presented at first Asian
invitational conference on family business at Indian School of Business, Hyderabad.
� Mathew, Viju,(2010), “Women entrepreneurship in Middle East: Understanding barriers and use of
ICT for entrepreneurship development”, Springer Science + Business Media, LLC 2010
� Moore, D. P. & Buttner, E. H. (1997). Women entrepreneurs: Moving beyond New Generation of
Women Entrepreneurs Achieving Business Success.
� Dynamics of entrepreneurial development and management–By Vasant Desai. Himalaya
Publishing House.
� Entrepreneurship Development – By David Holt
� Entrepreneurship Development –By S.S Khanka. S. Chand & Company Limited. (Ram
Nagar, New Delhi-110055).
� Women Entrepreneurship and Economic Development – By Sanjay Tiwari, Anshuja Tiwari.
� Shiralashetti A S and Hugar S S " Problem and Prospects of Women.
Entrepreneurs In North Karnataka District: A case study" The Icfai Journal of Entrepreneurship
Development Vol. 1v No. 2
� Priyanka Sharma, Jaipur National University, Jaipur, India - “Women Entrepreneurship
Development in India”.

IJRCMEAS ISSN 2454-6593
109
ECONOMIC REFORM POLICIES AND SUSTAINABLE ECONOMIC GROWTH IN INDIA
M. G. Bangari, Assistant Professor, Dept of Economics,
SVM Arts, Science and Commerce, College, Ilkal, Bagalkot(dist)
Abstract
This study explores the issues and constraints of economic reform policies in India. The main objective
of this paper is to discuss the impact of the economic reform policies of central government on Indian economy.
The present study is based on secondary data. The sources of data are books, journals, daily news papers and
websites. It draws the attention towards the reasons for economic reforms like The Fiscal Imbalance, the gross
fiscal deficit of central government which was 5.1 percent of GDP in 1981-82, rose to 7.8 percent in 1990-91,
Unsustainable Current Account Deficit, the current account deficit was 1.35% of GDP in 1980-81 rose to
3.69 percent of GDP in 1991 and Mounting inflationary pressures the rate of inflation rose to 10.3 percent in
1990-91. It examines the new central government policies which have been playing a productive and decisive
role in the growth of Indian economy. It studies the policies of the economic reforms of the central government.
The policy of the macroeconomic stabilization consists the control of inflation, BOP adjustments, and fiscal
adjustments, and the policy of structural reforms include the trade and capital flow reforms, industrial reforms,
public sector reforms and financial sector reforms. It discusses the impact of innovative policies on inflation in
the country, BOP position, fiscal deficit position, manufacturing position, food production etc. Due to the
economic reform policies, there was a massive improvement in different sectors of the economy. The
inflationary pressure was controlled, the foreign exchange was considerably recorded, the flow of foreign capital
into the country was increased, and the path of employments was attentively improved. This paper traces the
areas of weaknesses of central government policies of economic reforms consisting Lack of Fiscal
Consolidation, Poor Social Development Expenditure, Jobless Growth, Growing Disparities between
Richer and Poorer States and Lack of Preparation of State Governments
It offers the findings based on the observation of government policies and their implementation like
growing fiscal profligacy (and irresponsibility) and the unviable financing patterns of the fiscal deficit
prevailing in the 1980s and 1990s. The gross fiscal deficit of central government which was 5.1 percent of GDP
in 1981-82, rose to 7.8 percent in 1990-91. The current account deficit was 1.35 percent of GDP in 1980-81 rose
to 3.69 percent of GDP in 1991. The Government measures did help reduces the fiscal deficit of the central
government to 4.8 percent of GDP at the end of 1992-93. The performance has been impressive and satisfactory.
The Indian economy has been moving towards closer integration with the global economy and with the leading
regional trading blocs. It concludes with some suggestions for achieving sustainable economic growth viz the
co-ordination between the central government and state governments needs to be improved in controlling fiscal
deficit. The central government’s public expenditure on social services needs to be increased to achieve the
targeted annual growth rate of 8 percent. State governments are well prepared to meet the challenges posed by
globalization. The farming sector and the small-scale industrial units need to be protected from the impact of
global competition. Amalgamation of sick units with sound units should be immediately made to achieve
sustainable growth.
---------------------------------------------------------------------------------------------------------------------
1. Introduction

IJRCMEAS ISSN 2454-6593
110
The foundation of credible national security is based on the level of economic prosperity and well-
being of the population of any country. The attainment of sustained high economic growth is a necessary
condition for improving the national security and the quality of life of the people throughout the country.
Many developing countries in the Asia-Pacific region, including China and India where nearly one
third of the world’s population live, are currently going through economic transitions. The central objective of
transition through economic liberalization is to improve the competitive efficiency of the economy in the global
marketplace to sustain accelerated rates of economic growth and thereby continuously improve the security and
well being of the people.
India launched its market-oriented economic reforms in 1991. China launched similar reforms from
1978 and is now well ahead of India in integrating its national economy with the global economy. However,
India is slowly but surely catching up in this race. The contrast in the experiences of these two countries with
economic reforms under radically different political systems is remarkable.
2. Significance of the study
Indian policy-makers stuck to a path of centralized economic planning accompanied by extensive
regulatory controls over the economy. The strategy was based on an ‘inward-looking import substitution’ model
of development. This was evident from the design of the country’s Second Five-Year Plan (1956-61), which had
been heavily influenced by the Soviet model of development. Several official and expert reviews undertaken by
the government recommended incremental liberalization of the economy in different areas, but these did not
address the fundamental issues facing the economy. It is therefore necessary to study the economic reform
policies in India because of the examining of impact of such reforms and offer the suggestions to the authorities.
3. Objectives of the study
• To study the reasons for introducing economic reforms.
• To examine the new economic reform policies of the central government.
• To assess the impact of economic reform policies.
• To explore the areas of weakness.
• To offer suggestions based on the findings.
4. Research Methodology of the study
The present study is based on secondary data. The sources of data are books, journals, daily news
papers and websites.
5. The Reasons for the Launching Economic Reforms in India
India launched its massive economic reforms in 1991 under the pressure of economic crises. The root
cause of the crisis could be traced to macro-economic mismanagement throughout the 1980s as reflected in an
unsustainably high fiscal deficit, in particular the revenue deficit and the monetized deficit. Foreign-exchange
reserves dwindled to a low of US$2.2 billion (with less than 15 days’ cover against annual imports). India stared
bankruptcy in the face as it struggled to meet external debt obligations. It was therefore Indian Government
introduced economic reforms to curb these crises.
5. 1. The Fiscal Imbalance
The fiscal situation had deteriorated throughout the 1980s due to growing burden of non-development
expenditure. The gross fiscal deficit of central government which was 5.1 percent of GDP in 1981-82, rose to
7.8 percent in 1990-91. Since this fiscal deficit had to be met by recourse to borrowing, the internal debt
increased rapidly, rising from 33.3 percent of GDP at the end of 1980-81 to 49.7 percent of GDP at the end of

IJRCMEAS ISSN 2454-6593
111
1990-91.this naturally made burden of servicing the debt onerous. Interest payments which were 2 percent of
GDP and 10 percent of total central government expenditure 1980-81, rose to 3.8 percent of GDP and 22
percent of total central government expenditure in 1990-91 creates the danger of the central government falling
into debt-trap. The deficit was caused by excessive employment in the government sectors, uneconomical
pricing of goods and services by public sector enterprises, a growing interest burden, mounting subsidies, and
rising defense expenditures. Downsizing the government (through the bureaucracy or public sector enterprises
and banks) was also difficult and met staff resistance from the organized employees.
5. 2. Unsustainable Current Account Deficit
The balance of payments situation was highly precarious in1991.The current account deficit was
1.35percent of GDP in 1980-81 rose to 3.69 percent of GDP in 1991.These continuously growing deficits had
to be financed by borrowing from abroad and as a consequence India’s external debt rose from 12 percent of
GDP at the end of 1980-81 to 23 percent of GDP at the end of 1990-91.This steadily growing external debt lead
to an increase in debt service burden from 10 percent of current account receipts and 15% of export earnings in
1980-81 to 22 percent of current account receipts and 30 percent of export earnings in 1990-91.These mounting
strains during the 1980”s stretched to breaking point in 1991 due to Gulf crisis. The BOP position was on the
brink of disaster as in mid-January 1991 and again in late January 1991 the level of foreign exchange reserves
dropped to levels which were not sufficient to finance imports of even ten days.
5. 3. Mounting inflationary pressures
The price situation was apparently not alarming during the second half the 1980’s as the average rate of
inflation was 6.7 percent per annum. However the rate of inflation rose to 10.3 percent in 1990-91.Interms of
consumer price index, the rate inflation climbed to11.2 percent per annum which was certainly a cause for
concern. However the most disquieting feature of this situation was that the prices of food rose substantially in
spite of three good monsoons in arrow. The build up was unquestionable to the large deficits which were
inevitably associated with a monetization of budget deficits and an excessive growth of money supply. This
liquidity overhang, in conjunction with real disproportionalities and underlying supply demand imbalances was
bound to fuel inflation.
6. Economic Reforms Policies of the Central Government
Economic reforms refer to the introduction of innovative policies for increasing the growth rate of the
Indian economy. The fundamental objective of economic reforms is to bring about rapid and sustained
improvement in the quality of the people of India. Central to this goal is the rapid growth in incomes and
productive employment. The only durable solution to the curse of poverty is sustained growth of incomes and
employment. Such growth requires investment: in farms, in roads, in irrigation, in industry, in power and, above
all, in people. And this investment must be productive. Successful and sustained development depends on
continuing increases in the productivity of our capital, our land and our labour.
The Prime Minister Narasimha Rao government recognized in 1991 that the time had come to reshape
India’s economic policies by drawing appropriate lessons from the ‘East Asian Miracle’ based on more export-
oriented and more globally connected strategies of development, as successfully practiced earlier by Japan and
South Korea and also by the South East Asian tigers Malaysia, Singapore, Indonesia and Thailand. The East
Asian development model had been remarkably successful in achieving sustained high growth rates
accompanied by rapid growth in the living standards of the people in just two decades. India had missed on both
these fronts by relentlessly pursing import substitution and a relatively closed economy model of development.

IJRCMEAS ISSN 2454-6593
112
The government took two years to get over the immediate macroeconomic crisis, initially with the help
of a balance of payments loan facility from the International Monetary Fund. The government came out with a
clear enunciation of its vision and the objectives of its economic reforms only after regaining macro-economic
stability
6.1. Macro Economic Stabilization
This innovative policy involves following measures. Achieving macro-economic stabilization was an urgent
priority, necessitating control of intolerably high inflation. It was recognized that macro-economic stabilization
would provide a sound foundation for medium and long-term structural economic reforms and accelerate the
rate of economic growth in a sustained manner. This would be possible by removing distortions created by
controls and by improving the competitive edge for Indian goods and services in global markets as well as in the
markets of major regional trading blocs.
6.1. 1. Returning to low and stable inflation
The rate of inflation in 1990-91 was above 10 percent per annum. This could be brought down on one
hand by introducing fiscal and monetary discipline in the economy and on the other by improving output and
supply position. The central government brought down the fiscal deficit to 5.3 percent of GDP and the supply of
money (M3) would rose by 14.8 percent. These disinflationary measures did make some impact on the price
situation and the rate of inflation declined to around 7.0 percent at the beginning of 1993. The following table
shows the rate of inflation during different years.
Table: 1 shows trends in rate of inflation
Years Rate of Inflation(in percent)
1980 6.7
1990 10.3
1993 7.0
2004 5.4
2011 8.9
2013 6.0
Source: Economic Survey of India 2013-14
Table reveals the rate of inflation was high in 1990 accounting of 10.3 percent, but it was controlled after
introducing economic reforms.
6.1. 2. Sustainable Fiscal Position
Fiscal adjustment is necessary for dealing with the twin problems of high domestic inflation and large
deficits in the BOP. The root cause of the twin crisis could be traced to macro-economic mismanagement
throughout the 1980s as reflected in an unsustainably high fiscal deficit, in particular the revenue deficit and the
monetized deficit. Since 1991 several efforts have been made through the annual budget process to achieve tax
reforms. These have focused on: (i) expanding the tax base by including services (not previously taxed); (ii)
reducing rates of direct taxes for individuals and corporations; (iii) abolishing most export subsidies, (iv)
lowering import duties (covered below by us under structural reforms relating to trade policies/external sector);
(v) rationalizing sales tax and reducing the cascading effect of central indirect taxes by introducing a Modified
Value Added Tax and a soon-to-be implemented nationwide Value Added Tax; (vi) rationalizing both direct and
indirect taxes by removing unnecessary exemptions; (vii) providing for tax incentives for infrastructure and
export-oriented sectors, including setting up special (Export) Economic Zones; and (viii) simplification of

IJRCMEAS ISSN 2454-6593
113
procedures and efforts for improving the efficiency of the tax administration system especially through
computerization.
These measures did put impact on fiscal situation of the country. The central government’s fiscal
deficit alone peaked at 7.9 percent as a percentage of GDP in 1989-90. Thus growing fiscal profligacy (and
irresponsibility) and the unviable financing patterns of the fiscal deficit prevailing in the 1980s made high levels
of annual GDP growth (peaking at 5.6 percent in 1989-90) unsustainable.
Faced with the necessity of reducing the fiscal deficit in the crisis year of 1991-92, Finance Minister
Singh attempted to reduce fertilizer and food subsidies in 1991-92 and to some extent in 1992-93.
Simultaneously, he (and several subsequent finance ministers) resorted to the softer options of reducing public
investment expenditure and reducing public expenditure on social welfare services from 1991 to 1995. These
measures did help reduce the fiscal deficit of the central government to 4.8 percent of GDP at the end of 1992-
93. Meanwhile, the fiscal position of the state governments also started deteriorating. The combined fiscal
deficit of the central government and the states climbed to the unacceptably high level of 10-11 percent of GDP
in 2002-03. Some state governments have begun to address their fiscal deficit problems. The central government
has recently started linking further transfers of resources to the states to the progress of state-specific economic
reforms aimed at reducing deficits.
Table: 2. fiscal discipline in Indian economy.
year Fiscal Deficit(percent)
1990 7.9
1992 5.3
2006 3.3
2007 2.5
2011 4.8
2013 5.2
Source: Economic Survey of India 2013-14
Table explores the fiscal deficit was 7.9 percent and controlled it in years to come due to the policies initiated by
central government.
The good news for macro-economic management reforms is that the pre- 1990 pattern of ‘deficit
financing’ (that is, the printing of currency) to meet the fiscal deficit has now been effectively curbed. The
autonomy of the Reserve Bank of India in regulating the money supply to control inflation has been assured
within the limits of monetary policy. This has led the government to resort to larger and larger domestic
borrowing.
The governments of India, both at the central and state government levels, have initiated disinvestment
(Resource Generation through Disinvestment) programs to sell government equity in several public-sector
enterprises. Unfortunately, the sales proceeds have mostly been used to finance fiscal deficits rather than for
fresh public investment, social sector spending, or reducing the interest burden on ballooning public debt.
The bad news is that government borrowings have risen so high that the economy is moving towards an
‘internal debt trap’. Further growth of internal debt needs to be curbed but the government is in no mood to
close off this easy way of financing its rising fiscal deficit.
6.1. 3. Adjustments of Balance of Payments position.
The government adopted few measures to adjust the BOP imbalance. These include promotion of
exports, devaluation of rupee, and liberalization of exchange rates. These measures made Indian economy to

IJRCMEAS ISSN 2454-6593
114
move towards stable and sustainable BOP position. The following table shows the impact of reforms on BOP
position.
Table: 3 Deficits in Current Account
year Current Account Deficit(percent)
1990 3.1
2003 2.3
2007 1.3
2011 2.7
2013 5.1
Source: Economic Survey of India 2013-14
The table reveals the current account deficits in 1990 was 3.1 percent of GDP, and it was 5.1 in 2013.
6.2. Structural Reforms
Structural reforms since 1991 have been sector-specific. The sectors subjected to reform have been
carefully selected and the coverage of sectors under structural reforms has been extended over time. The major
structural economic reforms carried out since 1991 have been primarily in the following areas: Trade
Policy/External Sector; Industrial Policy; Infrastructural Sector Policies; Divestment/Privatization Policies; the
Financial Sector; and in Policies for Attracting Foreign Direct Investment.
The thrust of the reforms in all areas has been to open India’s markets to international competition,
remove exchange rate controls, encourage private investment and participation in industry and, in the finance
markets, to liberalise access to foreign capital and to ensure that foreign investment is not penalized merely for
being foreign.
Since 1991 reforms have been launched to improve the supply side of the economy. Among these the
more important are trade and capital flow reforms, Industrial regulation, Disinvestment and PSUs reforms and
financial sector reforms.
6.2.1 Trade and Capital Flow Reforms
The central government has introduced reforms in the trade sector and capital flow sector in 1991.
Among them, devaluation of rupee, introduction of the convertibility of rupee, liberalization of import,
reduction of tariff rates, decanalisation of items of trade, and to give a thrust to exports. The government has
also liberalized capital flows in the form of FDI. Foreign companies are allowed to use their trademarks, accept
appointment as a technical or management advisers borrow and accept deposits from the public and repatriate
profits.
6.2.2 Industrial Deregulation
India’s domestic economic activities have been subject to a wide array of physical controls. In the
industrial sector, such controls took various forms: delicensing, reservation of industries for public sector and
SSI sector, price controls. Limit on the size of the companies which was earlier enforced under the MRTP Act
has now been scrapped.
6.2.3 Public Sector Reforms and Disinvestment
The public sector was originally intended to be the engine of self- sustained economic growth. It was
also conceived to hold the commanding heights of the economy and to lead to technological advances. In order
to fulfill these roles, it was necessary for the public sector to generate adequate invisible surpluses. The
government has decided to give grater managerial autonomy to PSUs to enable them to work efficiently. In

IJRCMEAS ISSN 2454-6593
115
addition to this, the promotion of increased private sector competition in areas where social considerations are
not paramount and partial disinvestment of equity in selected enterprises.
6.2.4 Financial Sector Reforms
An efficient and competitive financial system is necessary to support the structural reforms in the real
economy. The government has set up Narasimham Committee on financial system and on banking sector
reforms in 1998. The committee recommended few aspects like accountability and profitability which improve
the efficiency and effectiveness, infusing greater competition to the credit needs, and effective supervision of
commercial banks and term lending institutions. The major reforms are bringing down the CRR and SLR, new
prudential norm in respect of income recognition, classification of assets, provisioning of bad debts and capital
adequacy, guidelines for setting up banks in the private sector, liberalizing interest rates, strengthening of
supervision, quicker recovery of loan arrears and flexibity of maximum permissible bank finance.
6.2.5 Reorientation of Economic Planning
Consistent with the spirit of the market-oriented and private sector-led economic reforms launched
since 1991, the government has reoriented the role of planning in India. It has been recognized that market
forces and the state should be given roles that play to their comparative advantages and that they should work
together as partners in the economic development of the nation. While private initiative should be encouraged in
most areas of business activities, the state should increasingly play a pro-active role in areas in which the private
sector is either unwilling to act or is incapable of regulating itself in the social interest. The areas in which the
state has a comparative advantage over the private sector include poverty alleviation programs; human resource
development; provision of social services such as primary health and primary education; and similar activities
categorized as building human capital and social infrastructure. The state also has a new role in setting up
independent regulatory authorities to encourage genuine competition and to oversee the provision of services by
the private sector in critical areas such as utilities, water supply, telecommunications, and stock market
operations to avoid the ill effects of speculation and to maintain a workable balance between the interests of the
producer and the consumers.
The new role assigned to planning, consistent with market-based economic liberalization, can perhaps
best be illustrated with the goals and the strategies incorporated in India’s Plans. The Plan has targeted an annual
growth rate of eight percent. Along with this growth target, the government has laid down targets for human and
social development.
Timely corrective actions will be proposed to ensure growth is accompanied by social justice. The key
indicators of human and social development targeted under this Plan include: a reduction of the poverty rate by
five percentage points by 2007; providing gainful employment to at least those who join the labor force during
2002-07; education for all children in schools by 2003; and an increase in the literacy rate to 75 percent by
March 2007.
The development strategy adopted for the Tenth plan envisages: redefining the role of Government in
the context of the emergence of a strong and vibrant private sector, the need for provision of infrastructure and
the need for imparting greater flexibility in fiscal and monetary policies. With a view to emphasizing the
importance of balanced development of all states, the Tenth plan includes a state-wise break-up of broad
developmental targets including targets for growth rates and social development consistent with national targets.
The Tenth Plan has emphasized the need to ensure equity and social justice, taking into account the fact that
rigidities in the economy can make the poverty-reducing effects of growth less effective. The strategy for equity
and social justice consists of making agricultural development a core element of the Plan, ensuring rapid growth

IJRCMEAS ISSN 2454-6593
116
of those sectors which are most likely to create gainful employment opportunities and supplementing the impact
of growth with special programs aimed at target groups.
7. State-Level Economic Reforms
To increase the effectiveness of the post-1990 economic reforms, they must be simultaneously
extended from central to state governments and below to the third tier of local governments.
The maladies afflicting the finances of the state governments are similar in nature to those afflicting the central
finances described earlier. According to the Reserve Bank of India, the Gross Fiscal Deficit of all the states of
India (including the Union Territories) was estimated at 3.3 percent in 1991-92.
Throughout the 1990s the state governments also experienced a rapid rise in their revenue expenditures
mainly through salaries, pensions, interest payments and subsidies (including free power to farmers in some
states out of political considerations). This trend has ‘severely constrained the states’ ability to undertake
development activities’ and to devote more funds to provide social services such as primary education. The
situation worsened after the states were forced to follow the center to implement generous pay increases for
government employees recommended by the Fifth Central Pay Commission in 1997-98.
Every state has recognized the need to attract private investment flows from both domestic and foreign
investors. State governments have therefore progressively liberalized their policies and procedures on a
competitive basis. Several of them have also explicitly recognized the need to improve human resource
development and have progressively expanded activities to provide a better quality of life to the population of
their states.
7.1 Incentives to State Governments
The government of India has introduced a scheme called the States’ Fiscal Reforms Facility (2000-05).
Under the Facility, the central government set up a five-year incentive fund ‘to encourage states to implement
monitorable fiscal reforms’. Additional amounts by way of ‘open market borrowings’ are allowed if the state is
faced with a structural adjustment burden. State governments may draw up a Medium Term Fiscal Reforms
Programme (MTFRP) to achieve specified targeted reductions in their consolidated fiscal deficit, especially the
revenue deficit. The coverage of the MTFRP has been extended to cover a Debt Swap Scheme in order to help
state governments reduce their growing public debt. This scheme is designed to help liquidate the burden of
high-cost loans taken from the central government through the allocation of additional market borrowings at
currently prevailing lower interest rates.
The major structural reforms carried out by several state governments include: (i) Measures to improve
quality of life through improvements in basic public services such as primary health, primary education, and
rural infrastructural services such as electricity, water, and roads. Madhya Pradesh has brought out the first
state-level Human Resource Development Report. Other states have followed suit. The Planning Commission
has also published a comprehensive National Human Development Report assessing human development
nationwide and in the major states. (ii) Clustering high-tech industries and services (for example, in software
parks). (iii) Setting up Special Economic Zones and Agri-Economic Zones to promote exports. (iv) Formulating
state-level industrial policies to attract investments. (v) Power-sector reforms that restructure state Electricity
Boards by separating generation, transmission and distribution activities, encouraging independent power
producers in the private sector to invest in the power sector, and setting up independent state Electricity
Regulatory Authorities.
8. The Performance of Indian Economy

IJRCMEAS ISSN 2454-6593
117
Despite the slow pace of implementation of the economic reforms and certain hiccups and delays
caused primarily by the compulsions of democratic politics, the performance of the Indian economy under the
reforms carried out so far shows a mixed picture of notable achievements and weaknesses. The performance has
been impressive on some fronts, satisfactory on several other fronts, and inadequate in certain respects. India has
still to launch deeper (so called ‘second-generation’) reforms in various areas to get the best results.
8.1 Areas of Impressive Performance
India overcame its worst economic crisis in the remarkably short period of two years through its
economic reforms. Through prudent macro-economic stabilization policies including devolution of the rupee
and other structural economic reforms the balance of payments crisis was clearly over by the end of March
1994. Foreign exchange reserves had risen to the more than adequate level of US $ 15.07 billion and the current
account deficit as a percentage of GDP was nearly eliminated. Export growth rate at 20.0 percent in 1993-94
over the previous year was quite encouraging.
Macro-economic stability has endured in the ten years of economic reforms to 2003. Foreign-exchange
reserves peaked at US$70 billion at the end of March 2003 (and touched US$80 billion in June 2003). The
current account ‘recorded a surplus—equivalent to 0.3 percent of GDP—in 2001- 02’. Food stocks with the
Food Corporation of India, held to ensure national food security, peaked at sixty million tons (compared to the
required twenty million tons). It took longer to control inflation but this led to relatively more enduring results
(excluding the impact of externally determined fuel prices).
Since 2002, the country has enjoyed a low interest-rate regime. These performance indicators have
helped to provide an ‘enabling environment for the macroeconomic policy stance. India has also increasingly
integrated its economy with the global economy. After half a century of inward-orientation, the share of India’s
trade as a proportion of GDP rose from 13.1 percent in 1990 to 20.3 percent in 2000. By Indian standards this is
an impressive performance. India’s economy has also successfully moved into a higher trajectory of growth and
displayed strong dynamism in selected sectors. This encouraging performance brightens the prospects for
stepping up India’s growth rate and improving the competitive edge in the years to come through further
appropriate economic reforms. The average annual growth rate of 7.4 percent achieved by the Indian economy
during the years of economic reforms since 1992 is encouraging. Currently, after China, India is among the
fastest-growing countries in Asia. Since the annual rate of population growth has slowed significantly to nearly
1.8 percent, per capita income has been growing at a healthier real rate of four percent per annum. India’s
growing middle class of more than 350 million people, with a reasonably affluent standard of living, provides a
huge market for foreign corporations, especially since April 2003, when all quantitative restrictions on imports
were lifted.
India has been successful in reducing poverty. The poverty ratio (that is, people below the poverty line
as a percentage of the population) as estimated by the Planning Commission at the national level came down
from 36 percent in 1993-94 to 19.3 percent in 2013-14. The poverty ratio during this period declined both in
rural areas and in urban areas. India’s economy under the reforms has made rapid strides in selected industrial
areas and knowledge- and skill-intensive services. These specific growth areas have experienced significant
restructuring under more competitive conditions in the marketplace through mergers and acquisitions and
technological and managerial innovations. This has led to the achievement of recognizable increases in
international competitiveness in a number of sectors including auto components, telecommunications, software,
pharmaceuticals, biotechnology, research and development, and professional services provided by scientists,

IJRCMEAS ISSN 2454-6593
118
technologists, doctors, nurses, teachers, management professionals and similar professions. India’s increasing
international competitiveness has helped in improving the rate of growth of export earnings. They have also
directly benefited Indian consumers by making better quality, lower-priced goods available.
8.2. Increasing inflows of both FDI and FII
An important indicator of gains from economic reforms, reflecting the attractiveness of India as an
investment destination, is shown by the increasing inflows of both FDI and Foreign Institutional Investment
(FII) into India. Inflows of both FDI and FII into India have increased in the decade to 2012.There has been
massive increase in foreign investment inflows into the country, shows in the table.
Table 5: Inflow of foreign capital. (US $ million)
Types of Investments 1991-92 2007-08 2011-12
Direct Investment 129 34,835 46,552
Portfolio Investment 04 27,271 17,409
Total 133 62,106 63,961
Source: India Development Report 2012-13
Table reveals the increase in inflow of capital into the country. The direct investment was 129 million US
Dollar, but in 2011-12, it was increased to 46,552 million US Dollar.
8.3. Substantial Increase in Exports
The Indian economy has been moving towards closer integration with the global economy and with the
leading trading countries. There has been massive growth in India’s exports can be seen in table.
Table 4: Developments of India’s exports (in percentage)
Trading Countries 1980-81 1990-91 2010-11 2011-12
OECD 46.6 53.5 33.2 33.8

IJRCMEAS ISSN 2454-6593
119
OPEC 11.1 5.6 21.3 19.0
Eastern Europe 22.1 17.9 1.1 1.1
Developing Nations 19.2 17.1 38.2 40.7
Others 1.0 2.9 6.2 5.4
Total 100 100 100 100
Source: Handbook of Statistics on the Indian Economy
Above table reveal that for the year 2011-12, Developing Countries were India’s largest trading partners,
accounting for 40.7 percent, OECD was 2nd largest partner accounting 33.8 and next was OPEC.
9. An Appraisal of Economic Reforms
The study has recognized few areas of weakness in implementation of policies of economic reforms, given as
follows:
9.1. Lack of Fiscal Consolidation
The most notable weakness of the reform process has been in fiscal consolidation. Indian governments
at both the central and state levels have failed miserably to reign in growing revenue deficits and reduce the
overall fiscal deficit. The foundations for a sustainable high growth rate in any economy lie in maintaining fiscal
discipline. This has not been adequately achieved by Indian policymakers. Excessive use of market borrowing to
cover budget deficits has often put upward pressure on interest rates. The structure of revenue expenditure and
political obstacles to any reduction of subsidies and downsizing the government at all levels have been primarily
responsible for the lack of progress on fiscal reforms. The real issue in restructuring government finances is
‘right-sizing’ the government by adequately increasing government expenditure on infrastructure of both the
hard and soft varieties, based upon growing resources.
9.2. Absence of Human Development
India’s record on social development expenditure has been poor considering Indian requirements and
poor also in relation to many developing countries, including some of the least developed countries in Sub-
Saharan Africa. In fact, throughout the 1990s social sector expenditure as a proportion of GDP was what it was
in the late 1980s. In western countries, expenditure on education is treated as an investment and man is
considered productive human capital.
India must bridge this social development gap by significantly increasing its public expenditure on
social services if it wishes to achieve the targeted annual growth rate of eight percent set by the country’s

IJRCMEAS ISSN 2454-6593
120
economic Plan. As Ahluwalia has remarked, larger investment in the social sectors is ‘necessary not only
because social development is an end in itself, but also as a precondition of accelerating growth’.
9.3. Jobless Growth
Another major weakness of the Indian economic reforms is the economy’s experience with ‘jobless
growth’ in the post-1990 period. Rigid labor laws relating to retrenchments have constricted growth in the
organized manufacturing sector. As a labor surplus country, there already exists a huge backlog of both ‘open’
and ‘disguised’ unemployment. With a growing population, every year adds to the labor force. Economic
reforms have accelerated growth but failed to generate adequate employment. If this disturbing trend is allowed
to continue, it will breed social unrest and add to the ranks of terrorists and other anti-social elements in the
country.
9.4. Growing Disparities between Richer and Poorer States
The reforms have led to growing disparities between richer and poorer states (more and less
developed, especially in terms of infrastructure) within India. Although the all-India average annual growth rate
in the reform era has been low, this masks wide variations in inter-state growth rates, growth of per capita
income, and social development.
9.5. Lack of Preparation of State Governments
Last but not least, most state governments are not well prepared to meet the challenges posed by
globalization. The farming sector and the innumerable small-scale industrial units are vulnerable to the impact
of global competition. The government and economic players in the private sector need to work more closely as
partners to evolve strategies to meet the challenges of global competition more effectively.
10. Findings
• Growing fiscal profligacy (and irresponsibility) and the unviable financing patterns of the fiscal deficit
prevailing in the 1980s and 1990s.
• The gross fiscal deficit of central government which was 5.1 percent of GDP in 1981-82, rose to 7.8
percent in 1990-91.
• The current account deficit was 1.35 percent of GDP in 1980-81 rose to 3.69 percent of GDP in 1991.
• The Government economic reform policies did help reduces the fiscal deficit of the central government
to 4.8 percent of GDP at the end of 1992-93.
• The performance in all sectors has been impressive and satisfactory.
• The Indian economy has been moving towards closer integration with the global economy and with the
leading regional trading blocs.
11. Suggestions
• The co-ordination between the central government and state governments needs to be improved in
controlling fiscal deficit.

IJRCMEAS ISSN 2454-6593
121
• The central government’s public expenditure on social services needs to be increased to achieve the
targeted annual growth rate of 8 percent.
• Adequately increasing government expenditure on infrastructure and reduce its size.
• State governments are well prepared to meet the challenges posed by globalization.
• The farming sector and the small-scale industrial units need to be protected from the impact of global
competition.
• Amalgamation of sick units with sound units should be immediately made to achieve sustainable
growth.
12. Conclusion
The performance of economic reforms has shown mixed results. The national income increased at the
rate of 6.6 percent in 2011-12, the industrial production was picked up, the service sector has been boosting but
the agriculture and SSI sectors have been neglected. There are few challenges ahead i.e. human development,
improvement of agriculture, rural employment and social security of BPL families. It is therefore care and
caution taken in implementation of plans by both central and state governments for achieving sustainable
economic development in India.
References
1. Baru, Sanjay (1993): 'New Economic Policy: Efficiency, Equity and Fiscal Stabilisation', Economic and
Political Weekly, Vol 28, April 10.
2. Bhagwati, Jagdish and T N Srinivasan (1993): India’s Economic Reforms, Ministry of Finance, Government
of India.
3. Broadman, Harry G and Xiaolun, Sun (1977): 'The Distribution of Foreign Direct Investment in China', The
World Economy, Vol 20, No 3, May.
4. Burgess, Robin and Nicholas, Stern (1993): 'Tax Reform in India', DEP No 45, Development Economics
Research Programme, London School of Economics. Centre for Monitoring Indian Economy (1997): Corporate
Sector, Mumbai.
5. Corbo, Vittorio and Stanley, Fisher (1995): 'Structural Adjustment: Stabilisation and Policy Reform -
Domestic and lnternational Finance' in J Behrman and T N Srinivasan (eds), Handbook of Development
Economics, Vol 3, Elsevier Science BV, Amsterdam.

IJRCMEAS ISSN 2454-6593
122
6. Domer, Evsey (1957): 'The 'Burden of the Debt' and the National Income', Essays in the Theory of Economic
Growth, Oxford University Press, New York
7. Datta and Sundram, Indian Economy, published by S Chand and Company, New Delhi,
8. Puri and Mishra , Indian Economy, published by Himalaya Publishing House, New Delhi,
9. Websites
IJRCMEAS ISSN 2454-6593
123
STATUS OF WOMEN EMPOWERMENT IN AGRICULTURE
DR.PARAMESHWARA NAIK
ASST. PROFESSOR & HOD, DEPT OF ECONOMICS, S.J.V.P.COLLEGE, AUTONOMOUS,
HARIHAR .DAVANGERE (DIST), KARNATAKA, INDIA.
Abstract
‘Woman’ is a key for success of any human being. This phrase is an everlasting principle of the
universe. The unique reason behind this is that, if we consider any personality there must be a direct or indirect
influence of woman for his/her achievement. But from the period known, the role of women is always in a
dependent position in spite of her strong support or impact on men. Women shoulder almost all responsibility
for meeting basic needs of the family, yet are systematically ignored for utilization of the resources, information
and freedom of action required for them to fulfill this responsibility. Several studies revealed that, when the
women are involved, supported and empowered in the society then entire society will flourish and the
communities become more resilient. Agriculture is the back bone of our country. More than 62-65 percent of the
people engaged in agriculture and it is the livelihood occupation for majority of the people. The role of women
in this field is highly substantial. More than eighty percent of the work has to be performed by women. They are
working as labourers in involved in different agricultural operations. Women have a bright future in the field of
agriculture as it is the evergreen profession and involves much scope for future. Science and technology in
agriculture is of very noteworthy dimension and will strengthen the women in performing agriculture. Education
is going to play a crucial role to utilize science and technology in a proficient manner. Hence there is an
indispensable need to focus on women education for their empowerment. Keeping in view the past and the
present status of the women in agriculture and also the growth and development of science and technology in
the field of agriculture, a strategic model was designed for empowerment of women through agriculture. The
strategy consists of the two ways of empowerment women in agriculture viz Employment and entrepreneurship.
The different avenues in these two areas of agriculture were projected in the model and also the challenges to be
faced by women in performing these activities were also presented in the paper.
Key words :Agriculture; Women employment; Entrepreneurship; Empowerment.
Introduction:
Progressive development of the nation is the ultimate goal of any country. The economic, social, cultural
development among the people can be achieved through designing appropriate strategies suitable to the
conditions existing in the country. A thorough analysis of the existing situation and projecting the desired and
expected situation is indispensable for any strategy. The past experiences revealed that, the women are the
powerful tools for development but their potentialities were not been properly tapped. So many studies were
taken up to in this dimension and accordingly the efforts were made to implement the same and achieved
success. The present paper is also one of the studies in the lines of women empowerment focuses on 1) Women
as powerful resource of the society 2) Women and agriculture 3) Women Empowerment 4) Agriculture and
women Empowerment 5) Strategic model for Women Empowerment through Agriculture
Women in agriculture play a vital role in wide range of activities, thereby contributing to sustainable
agricultural development. To achieve inclusive agricultural growth, empowering women by having
comprehensive understanding about work participation, gender issues, drudgery and health and nutritional status

IJRCMEAS ISSN 2454-6593
124
is necessary. Further, these issues are to be addressed through gender-friendly technology assessment,
refinement and extension methodologies. With this focus, the Directorate of Research on Women in Agriculture
is implementing research and capacity building programmes.
‘Woman’ a key for success of any human being. This phrase is an everlasting principle of the universe.
The unique reason behind this is that, if we consider any personality there must be a direct or indirect influence
of woman for his/her achievement. But from the period known, the role of women is always in a dependent
position in spite of her strong support or impact on men. Women shoulder almost all responsibility for meeting
basic needs of the family, yet are systematically ignored for utilization of the resources, information and
freedom of action required for them to fulfill this responsibility. Several studies revealed that, when the women
are involved, supported and empowered in the society then entire society will flourish and the communities
become more resilient. Think women as potential productive workers instead of reproductive mothers. Because
of the five potential features of women 1) Good managers 2) Maintain cordial affiliation 3) Hard workers 4)
Patience 5) Convincing capacity
On the other side the scenario of women in the world reveals the following facts.
• Women work two-thirds of the world’s working hours: according to the United Nations Millennium
Campaign to halve world poverty by the year 2015. The overwhelming majority of the labor that sustains
life – growing food, cooking, raising children, caring for the elderly, maintaining a house, hauling water – is
done by women, and universally this work is accorded low status and no pay. The ceaseless cycle of labor
rarely shows up in economic analyses of a society’s production and value.
• Women earn only 10 percent of the world’s income: Where women work for money, they may be limited to
a set of jobs deemed suitable for women – invariably low-pay, low-status positions.
• Women own less than 1 percent of the world’s property: Where laws or customs prevent women from
owning land or other productive assets, from getting loans or credit, or from having the right to inheritance
or to own their home, they have no assets to leverage for economic stability and cannot invest in their own
or their children’s futures.
• Women make up two-thirds of the estimated 876 million adults worldwide who cannot read or write; and
girls make up 60 percent of the 77 million children not attending primary school. Education is among the
most important drivers of human development.
Agriculture is the back bone of our country. More than 62-65 percent of the people engaged in
agriculture and it is the livelihood occupation for majority of the people. Agriculture in India has a significant
history. Today, India ranks second worldwide in farm output. Agriculture and allied sectors accounted for
16.6% of the GDP in 2007. About 50% of the total workforce and despite a steady decline of its share in the
GDP is still demographically the broadest economic sector and plays a significant role in the overall social-
economic development of India.
Women are a vital part of Indian economy. Over the years, there is a gradual realization of the key role
of women in agricultural development and their vital contribution in the field of agriculture, food security,
horticulture, processing, nutrition, sericulture, fisheries, and other allied sectors.
In rural India, agriculture and allied industrial sectors employ as much as 89.5% of the total female
labour. In overall farm production, women’s average contribution is estimated at 55% to 66% of the total labour.
According to a 1991 World Bank report, women accounted for 94% of total employment in dairy production in
India. Women constitute 51% of the total employed in forest-based small-scale enterprises.

IJRCMEAS ISSN 2454-6593
125
Women’s tremendous role in growing the world’s food supply means their participation should be
central in any program to improve farming techniques or natural resource management. Yet much work in this
area involves technological approaches–mechanized farming, emphasis on cash crops over family consumption–
assumed to be in the male realm. Women around the world are left to work harder to grow the crops and raise
the animals that sustain their families.
Empowerment: refers to increasing the spiritual, political, social, racial, educational, gender or
economic strength of individuals and communities. It often involves the empowered developing confidence in
their own capacities.Empowerment includes:
• Ability to make decisions about personal/collective Circumstances
• Ability to access information and resources for decision-making
• Ability to consider a range of options from which to choose (not just yes/no, either/or)
• Ability to exercise assertiveness in collective decision making
• Having positive-thinking about the ability to make change
• Ability to learn and access skills for improving personal/collective circumstance.
• Ability to inform others’ perceptions though exchange, education and engagement.
• Involving in the growth process and changes that is never ending and self-initiated
• Increasing one’s positive self-image and overcoming stigma
• Increasing one’s ability in discreet thinking to sort out right and wrong
Dimensions of women empowerment:
Socio-Cultural: Women’s freedom of movement; lack of discrimination against daughters;
commitment to educating daughters Women’s visibility in and access to social spaces; access to modern
transportation; participation in extra-familial groups and social networks; shift in patriarchal norms (such as son
preference); symbolic representation of the female in myth and ritual Women’s literacy and access to a broad
range of educational options; Positive media images of women, their roles and contributions
Economic: Women’s control over income; relative contribution to family support; access to and
control of family resources Women’s access to employment; ownership of assets and land; access to credit;
involvement and/or representation in local trade associations; access to markets Women’s representation in high
paying jobs; women CEO’s; representation of women’s economic interests in macro-economic policies, state
and federal budgets
Familial/ Interpersonal: Participation in domestic decision-making; control over sexual relations;
ability to make childbearing decisions, use contraception, access abortion; control over spouse selection and
marriage timing; freedom from domestic violence Shifts in marriage and kinship systems indicating greater
value and autonomy for women (e.g. later marriages, self selection of spouses, reduction in the practice of
dowry; acceptability of divorce); local campaigns against domestic violence Regional/national trends in timing
of marriage, options for divorce; political, legal, religious support for (or lack of active opposition to) such
shifts; systems providing easy access to contraception, safe abortion, reproductive health services
Legal : Knowledge of legal rights; domestic support for exercising rights Community mobilization for
rights; campaigns for rights awareness; effective local enforcement of legal rights Laws supporting women’s
rights, access to resources and options; Advocacy for rights and legislation; use of judicial system to redress
rights violations

IJRCMEAS ISSN 2454-6593
126
Political: Knowledge of political system and means of access to it; domestic support for political
engagement; exercising the right to vote Women’s involvement or mobilization in the local political
system/campaigns; support for specific candidates or legislation; representation in local bodies of government
Women’s representation in regional and national bodies of government; strength as a voting bloc; representation
of women’s interests in effective lobbies and interest groups
Psychological: Self-esteem; self-efficacy; psychological well-being Collective awareness of injustice,
potential of mobilization Women’s sense of inclusion and entitlement; systemic acceptance of women’s
entitlement and inclusion. The Government of India declared 2001 as the Year of Women’s Empowerment
(Swashakti).The National Policy for the Empowerment of Women came was passed in 2001. In 2010 March 9,
one day after International Women’s day, Rajyasabha passed Women’s Reservation Bill, ensuring 33%
reservation to women in Parliament and state legislative bodies.
Empowerment of women through agriculture :Agriculture is one of the oldest occupations of
women. Their contribution to agriculture development continues to be very crucial to the National Economy.
Many women in the agricultural sector are still in the informal sector and remain invisible in the official national
statistics. India is predominantly an agricultural country with 82% of the households still in the rural sector.
Women constitute 50.7% of the population and is considered to be a valuable resource potential needed to be
meaningfully organized and recognized in the field of entrepreneurship, especially in the rural agricultural sector
of India. In India, the empowerment of women in Agriculture has already begun.
We are now witnessing a steady improvement in the enrollment of women in schools, colleges and
Agriculture profession institutes. In this decade, women are entering into the massive agriculture job markets in
increasing numbers in both private and public. In banks, NGOs, Educational Institutions, Research Institutions,
Extension systems, Agro-based civil services women are dominating their performance. As entrepreneurs,
women are taking lead in establishing their own Agrobased industries and providing employment for their
fellow women. Being farmers, women are becoming very active in in improving their farm productivity as well
as their net income. To have better access to all the basic amenities, women are entering in to the field of
administration, politics and helping their gender for equality.
Access and control over resources: About 3-4% women had land ownership and almost the same
extent had household ownership. Their ownership was restricted mostly to ponds, fallow, pastures or rainfed
lands and marginal land-holding. On an average, 2.18% women controlled over family resources as against
48.15% men, and family resources pertaining to backyard were under the control of women. As far access over
family resources is concerned, 6.80% was by women and 34.69% was by men. Joint control and access over
family resources were 36.37% and 58.52%. Regarding domestic animals, men had more control but as far as
access was concerned, both women and men showed almost equal access (12.52% and 12.71%).
Women work-participation in inland fisheries:A participatory exercise was conducted to identify the
role of women to promote gender equity/equality for sustainable inland fisheries development at Nabadwip and
Kalna in upper stretch and Diamond Harbour and Frezarganj in lower stretch of Hooghlyestuary. The
participation of women in upper stretch was comparatively lower than in lower stretch, where women were
actively involved in fish/prawn seed collection and selling; and fish grading, vending, drying and processing.
They were also involved in other income generating activities, like agriculture and daily labour.The analysis of
their level of participation in fisheriesand other income generating activities indicated medium level for 62%,
high for 16% and low for the remaining women. This active participation of women led to socio-economic
upliftment of their families.

IJRCMEAS ISSN 2454-6593
127
Scientific livestock management by women: In India Major constraints faced by farm women in
adopting improved packages of practices were lack of grazing resources (86.7%), lack of awareness about
vaccination and deworming (83.3%), inadequate availability of veterinary services (73.3%), and inadequate
knowledge and poor appreciation for A1 services (66.6%). Women played major role in care and management
of animals; care during pregnancy (36.7%), care during and after parturition (45%), feeding animals (25%),
watering animals (48.3%), care of new borns (50%), churning of milk (56.7%), making dung cake (68.3%),
cleaning shed (41.7%) etc. Similarly, the participation of women in goat-rearing overweighed men. However,
women were not exposed to training and use of scientific rearing and management of livestock.
Gender gap in nutritional status
Study conducted in Odisha revealed that about 52% women and 40% men were undernourished with a
Body Mass Index (BMI) of less than 18.5, indicating high prevalence of nutritional deficiency. Gap between
both the genders in normal BMI was 15.55%, as 58.88% men and 45.55% women were normal as per BMI. Gap
between severe chronic energy deficiency was 6.67%, as 3% men and 7% women were under severe chronic
energy deficiency category in the rice-rice cropping pattern. Majority of men and women had normal blood
pressure. More than 60% women and about 46% men were anaemic as per hemoglobin count. Gender gap in
low haemoglobin count was about 17%.
Value-addition of murrels was taught under the NAIP project “A value chain on murrel production in
Tamil Nadu and Odisha” for empowering farm women of rural Odisha. They were trained for preparation of
murrel pickle, soup, cutlets and balls. Many of the participating farmers have shown a keen interest to take up
this technology and improve their income generation and livelihood.
Brackish water aquaculture: In order to identify the potential of aquaculture to empower coastal
women, structure and available resources and the developmental activities in villages of Tiruvallur and
Kancheepuram districts, were assessed. In 2004, the tsunami destroyed their properties and fishing boats, nets,
etc. and therefore, there was a need for an alternative livelihood for the coastal populations. Diversification of
livelihoods through the adoption of brackishwater aquaculture technologies with linkages to government
institutions, NGOs, banks, research organizations and local community provided the solution to overcome this
problem.
Women’s role in aquaculture marketing: Participation of women in the domestic fish markets, such
as road-side markets (4%), retail markets (2%), wholesale markets (2%), in 24 Parganas (South), West Bengal,
was studied. The initial investment for beginning the trade ranged from ` 200 to 2,400. Loans from private
money lenders financed the business for 89.21% of respondents and 10.52% had invested their family funds.
Majority (92.10%) of respondents sell fish outside their area of residence. Some of them (5.20%) sell in the
surrounding villages and others in rural and urban areas. The study highlighted the need for capacity building
required to enhance the benefits that women could derive from such marketing arrangements.
Gender-specific database: The disaggregated gender specific data were compiled for 124 agricultural
activities such as farming, post-harvest management, horticultural crop production, livestock management,
fisheries and homestead resources.Besides these, genderwiseinformation on participation, roles and
responsibilities, access to and control over resources in respect of agriculture, horticulture, livestock
management, fisheries and extension services was also collected. In all farming and allied activities,
independent and joint participation of farm-women was visible and they had access to resources but control over
them was lower.

IJRCMEAS ISSN 2454-6593
128
Trainers ‘training modules: Trainers’ training modules on drudgery reducing technology
interventions for women in agriculture, were tested for their effectiveness. Selected areas were: care of clothing,
entrepreneurship on sisal fibre, designing children wear, knitting, natural dyeing of wool, rug-making, macrame
techniques, block printing with natural dyes, renovation techniques of clothing, creative crafts, stain removal at
household level, appropriate clothing practice and garment designing and construction.
Drudgery reduction: Adoption of improved sickle and improved khurpi, was higher among men, and
among women (above 50%) adoption rate was higher for maize sheller and vegetable plucker, besides improved
sickle and khurpi. Cotton picking apron, groundnut decorticator, hand rake, improved cap, ring and
Trishulweeder were also adopted by 50% women. Various enterprises such as food processing enterprise,
community meal preparation by the self-help groups, bamboo-craft, quilt making, dairy and vegetable growing
were identified as drudgery-prone activities.
Health and nutritional security: Motivation campaigns were organized to inspire women for laying
nutrition garden in their homestead. To minimize iron deficiency (anaemia), each centre developed an ironrich
product named as lehyam by using locally available and underutilized green leafy vegetables. Udaipur centre
developed lehyam using lotus stem as a major ingredient with or without incorporation of green leafy
vegetables, as lotus stem has high iron. Programmes were conducted on aspects such as importance of balanced
diet in daily life, additional food requirements during pregnancy and lactation, importance of breast-feeding,
supplementary feeding for young children, preparation of nutritious weaning food at home, importance of
kitchen-garden in homesteads.
Vocational skills: Skill-oriented trainings were imparted among adolescent girls and young mothers in
Crèche management, preparation of educational play materials, soft-toy making, food preservation, preparation
of utility items, embroidery and infant garment making.
Utilization of non-degradable farm-waste: Degradable farm-waste, mostly from natural fibres such
as banana, jute, sisal, hemp, and non-degradable farm wastes such as nylon sarees, waste polyethylene bags
were used for preparing files, purse, bags, asanas, durries, tablemats, footmat, runners and photo-frames.
Livelihood security: Efforts were made to strengthen SHGs by conducting group trainings in a
systematic manner, providing continuous facilitation support by exchange of information and ideas with
successful group members, micro financing strategies by enhanced, mutual trust between banks and SHG
groups, promoting saving habit and proper use of loan by SHG members. Members were equipped with
entrepreneurial skills such as tie-and-dye, vermi-composting, dairying, flour milling, preparation of handicrafts,
embroidered products through demonstrations, video films, mahilamandals (success stories of women
entrepreneurs). Micro-enterprise units were established by many SHGs in which their skills were developed.
Conclusion
Present study concluded that women play a significant and crucial role in agricultural development but
their participation and interaction in farmers training, market visit and other organizational activities was found
very less compared to men. Women’s attachment and keenly observation more in women compare to men
regarding farm, house, animal, etc. Most of the family management activities are generally done by women.
Thus, Women contribution and competency is more in Agriculture and household activities while the Women
Empowerment in Agriculture Index (WEAI) showed disempowered situation. It means, women need specific
attention in this region regarding domains like production, resource, income & credit and leadership & time for
their empowerment.

IJRCMEAS ISSN 2454-6593
129
References
1. AnjuMalhotra, Sidney Ruth Schuler, Carol Boender Measuring Women’s Empowerment as a Variable in
International
2. Annonymous,2012. International Food Policy Research Institute study report on Bangladesh, Guatemala
and Uganda..
3. Annonymous,2012. Women’s empowerment in agriculture index, Feed the future – The U.S. Governments
global Hunger &
4. Badiger, C. and huilgal, S., 2004. Participation of farm women in Agriculture and animal husbandry,
proceedings of Ist National
5. Development Background Paper Prepared for the World Bank Workshop on Poverty and Gender: New
Perspectives
6. DARU / ICAR annual report 2011-12 empowering women in agriculture, PP-93-95.
7. Extension Edu. Congress, Sept. 03, Indian Res. J. of Ext. Edu. – Vol. 4 No. 1 & 2, Jan 7 July 2004, pp –
124-128.
8. Food Security Initiative.
9. Final Version: June 28, 2002 siteresources.worldbank.org/.../MalhotraSchulerBoender.pdf
10. PandeyHema, 2004 Role of women in Agricultural biodiversity conservation. Indian farming vol. 54, No. 8,
pp 51-52.
11. Prasad & Singh, 2011. Participatory approach of women in Agriculture : vision 2025. 6th NEEC – 2011.
12. PandeyHema, 2004 Role of women in Agricultural biodiversity conservation. Indian farming vol. 54, No. 8,
pp 51-52.
13. Prasad & Singh, 2011. Participatory approach of women in Agriculture : vision 2025. 6th NEEC – 2011.
14. Publishing House,Meerut. P.V. Satya Gopal1 and B.Vijayabhinandana2
15. Rakeshchandra Women empowerment in india – milestones & challenges Professor of
philosophy&director, institute of women’s studies university of lucknow, lucknow.
Www.empowerpoor.org/
16. Singh,A,K, and Singh,2006.Innovations in Technology Dissemination, Dimensions of Agricultural
Extension.p-346-347.Aman
17. SatyaGopal P.V. and Vijayabhinanandan (2012) Agriculture : A Tool for Women Empowerment in India,
Research Journalof extension education special issue vol-I, June-2012.
18. www.indg.in/social.../women-empowerment/women-empowerment populationcommission.nic.in/unmet-
women.htm

IJRCMEAS ISSN 2454-6593
130
CREATIVE ACCOUNTING: NATURE, INCIDENCE AND ETHICAL ISSUES
Prof. D.S. Maribashetti,
Associate professor, HOD Dept. of Commerce, Govt. First Grade College, Bagalkot.
Abstract
This paper explores the nature and incidence of creative accounting practices within the context of
ethical considerations. Creative accounting is referred to also as income smoothing, earnings management,
earnings smoothing, financial engineering and cosmetic accounting It explores several definitions of creative
accounting and the potential and the range of reasons for a company's directors to engage in creative accounting.
Later the paper considers the various ways in which creative accounting can be undertaken and summarizes
some empirical research on the nature and incidence of creative accounting. The ethical dimension of creative
accounting is discussed, drawing evidence from several empirical studies. The paper concludes with the analysis
of possible solutions for the creative accounting problem.
Introduction
According to agency theory ‘the firm is a legal fiction which serves as a focus for a complex process in
which the conflicting objectives of individuals… are brought into equilibrium within a framework of contractual
relations.’ (Jensen and Meckling, 1976). Within the agency framework, it is both logical and inescapable that
management behaviour will be self-serving. Agency can, therefore, provide a solid framework for the
understanding of creative accounting behaviour. However, it may provide an incomplete theoretical basis for
explaining or predicting management behaviour; the ethical dimension of human behaviour may provide an
important element missing from legalistic and adversarial agency relationships (Horrigan, 1987).
The informational perspective (Schipper, 1989) is a key element underpinning the study of the creative
accounting phenomenon. A conflict is created by the information asymmetry that exists in complex corporate
structures between a privileged management and a more remote body of stakeholders. Managers may choose to
exploit their privileged position for private gain, by managing financial reporting disclosures in their own
favour. The informational perspective assumes that accounting disclosures have an information content that
possesses value to stakeholders in providing useful signals. It may be difficult or impossible for individual
stakeholders to discern the fact and the effect of accounting manipulation, because of an insufficient personal
skill set, indifference or an unwillingness to engage in detailed analysis (the mechanistic or naïve investor
hypothesis, discussed by Breton and Taffler, 1995). From a market
efficiency perspective such failures in understanding may not matter. Breton and Taffler point out in the
conclusion to their study establishing that analysts’ perception of creative accounting devices is somewhat
deficient, only a small number of effective accounting experts may be required ‘for the market as a whole
appropriately to process window dressed numbers’. On the other hand, Healy and Wahlen (1999) cite studies
that find that creative accounting prior to equity issues does affect share prices, suggesting that investors do not
necessarily see through creative accounting.
Definitions of creative accounting
Creative accounting is referred to also as income smoothing, earnings management, earnings
smoothing, financial engineering and cosmetic accounting. The preferred term in the USA, and consequently in
most of the literature on the subject is ‘earnings management’, but in Europe the preferred term is ‘creative

IJRCMEAS ISSN 2454-6593
131
accounting’ and so this is the term that will be used in this paper. It should be recognized that some accounting
manipulation involves primarily balance sheet rather than earnings management. Definitions of creative
accounting vary, and include the following:
‘Is the deliberate dampening of fluctuations about “some level of earnings considered to be normal for
the firm”’. (Barnea et al. 1976) ‘Is any action on the part of management which affects reported income and
which provides no true economic advantage to the organization and may in fact, in the long-term, be
detrimental’. (Merchant and Rockness, 1994)
‘Involves the repetitive selection of accounting measurement or reporting rules in a particular pattern,
the effect of which is to report a stream of income with a smaller variation from trend than would otherwise
have appeared’. (Copeland, 1968) Schipper (1989) observes that ‘creative accounting’ can be equated with
‘disclosure management’, ‘in the sense of a purposeful intervention in the financial reporting processes.
Motivation for creative accounting
Various research studies have examined the issue of management motivation towards creative
accounting behaviour. Half a century ago, Hepworth (1953) identified several motivations including the
existence of tax levies based on income, confidence by shareholders and workers in management that is able to
report stable earnings and psychological expectations relating to increases or decreases in anticipated income.
Tax is mentioned as a significant motivator also by Niskanen and Keloharju (2000) in a Finnish context and in
Japan by Herrmann and Inoue (1996). In countries with highly conservative accounting systems the 'income
smoothing' effect can be particularly pronounced because of the high level of provisions that accumulate.
Another bias that sometimes arises is called 'big bath' accounting, where a company making a bad loss seeks to
maximise the reported loss in that year so that future years will appear better. Beidleman (1973) observes the
positive effects of income smoothing on expectations, seccurities valuation and some element of risk reduction
for analysts. Other motivations for creative accounting discussed by Healy and Wahlen (1999) include those
provided when significant capital market transactions are anticipated, and when there is a gap between the actual
performance of the firm and analysts’ expectations. A variant on income smoothing is to manipulate profit to tie
in to forecasts. This perfectly respectable, and highly conservative, accounting policy means that future earnings
are easy to predict. Company directors may keep an income-boosting accounting policy change in hand to
distract attention from unwelcome news. Collingwood (1991) reports on how a change in accounting method
boosted a company’s quarterly profit figure, by a happy coincidence distracting attention from the company
slipping back from being the largest company in the industry in the USA to the number two slot. Owners who
wish to retain control of a sizeable stake and who are therefore not interested in immediate exit strategies are
less likely to be motivated to manage earnings. Creative accounting may help maintain or boost the share price
both by reducing the apparent levels of borrowing, so making the company appear subject to less risk, and by
creating the appearance of a good profit trend. This helps the company to raise capital from new share issues,
offer their own shares in takeover bids, and resist takeover by other companies. If the directors engage in 'insider
dealing' in their company's shares they can use creative accounting to delay the release of information for the
market, thereby enhancing their opportunity to benefit from inside knowledge. It should be noted that, in an
efficient market, analysts will not be fooled by cosmetic accounting charges. Indeed, the alert analyst will see
income-boosting accounting changes as a possible indicator of weakness. Dharan and Lev (1993) report on a
study showing poor share price performance in the years following income increasing accounting changes.
Another set of reasons for creative accounting, which applies to all companies, arises because companies are

IJRCMEAS ISSN 2454-6593
132
subject to various forms of contractual rights, obligations and constraints based on the amounts reported in the
accounts.
Techniques of creative accounting
The potential for creative accounting is found in six principal areas: regulatory flexibility, a dearth of
regulation, a scope for managerial judgement in respect of assumptions about the future, the timing of some
transactions, the use of artificial transactions and finally the reclassification and presentation of financial
numbers. Even in a highly regulated accounting environment such as the USA, a great deal of flexibility is
available (Largay, 2002; Mulford and Comiskey, 2002). Taking each of the six areas in turn:
1. Regulatory flexibility. Accounting regulation often permits a choice of policy, for example, in respect of asset
valuation (International Accounting Standards permit a choice between carrying non-current assets at either
revalued amounts or depreciated historical cost). Business entities may, quite validly, change their accounting
policies. As Schipper (1989) points out, such changes may be relatively easy to identify in the year of change,
but are much less readily discernible thereafter.
2. Dearth of regulation. Some areas are simply not fully regulated. For example, there are (as yet) very few
mandatory requirements in respect of accounting for stock options. In the majority of countries, like Spain for
example, accounting regulation in some areas is limited: for example the recognition and measurement of
pension liabilities and certain aspects of accounting for financial instruments.
3. Management has considerable scope for estimation in discretionary areas. McNichols and Wilson (1988), for
example, examine the discretionary and nondiscretionary elements of the bad debts provision.
4. Genuine transactions can also be timed so as to give the desired impression in the accounts. As an example,
suppose a business has an investment at historic cost which can easily be sold for a higher sales price, being the
current value. The managers of the business are free to choose in which year they sell the investment and so
increase the profit in the accounts.
5. Artificial transactions can be entered into both to manipulate balance sheet amounts and to move profits
between accounting periods. This is achieved by entering into two or more related transactions with an obliging
third party, normally a bank. For example, supposing an arrangement is made to sell an asset to a bank then
lease that asset back for the rest of its useful life. The sale price under such a 'sale and leaseback' can be pitched
above or below the current value of the asset, because the difference can be compensated for by increased or
reduced rentals.
6. Reclassification and presentation of financial numbers are relatively under-explored in the literature.
However, the study by Gramlich et al. (2001) suggests that firms may engage in balance sheet manipulation to
reclassify liabilities in order to smooth reported liquidity and leverage ratios. A special type of creative
accounting relates to the presentation of financial numbers, based on cognitive reference points. As explained by
Niskanen and Keloharju (2000): ‘the idea behind this behaviour is that humans may perceive a profit of, say,
301 million as abnormally larger than a profit of 298 million’. Their study and others (e.g. van Caneghem, 2002)
have indicated that some minor massaging of figures does take place in order to reach significant reference
points.
Existence of creative accounting
Even though managers’ motivation for creative accounting may be established and accepted at least in theory,
establishing empirically that it takes place is a separate problem. Naser and Pendlebury (1992) questioned senior
corporate auditors about their experience of creative accounting. They were able to conclude that a significant
proportion of all categories of companies employ creative accounting techniques to some extent. Many research

IJRCMEAS ISSN 2454-6593
133
studies examine a particular aspect or technique of creative accounting. All tend towards the conclusion that
creative accounting using that particular technique does exist. McNichols and Wilson (1988) model the
nondiscretionary component of the bad debts provision (so as to identify the discretionary element of the
accrual). Barnea et al. (1976) discuss classificatory smoothing with the use of extraordinary items; their results,
based on a study of 62 US companies, indicate that classificatory smoothing does take place. A later large scale
study of classificatory smoothing (Dempsey et al., 1993) found that ‘managers showed a propensity to report
extraordinary gains on the income statement and extraordinary losses on the retained earnings statement’.
Moreover, this research found that the propensity to report in this way was significantly greater in non-owner
managed firms. Dascher and Malcom (1970) analysed data over several years for 52 firms in the chemical
industries sector relating to four income smoothing variables: pensions costs, dividends from unconsolidated
subsidiaries , extraordinary charges and credits and research and development costs. They concluded that their
results were consistent with the hypothesis that deliberate smoothing had taken place. Large provisions against
uncertain levels of future loss are highly dependent upon the judgments made by management. Healy and
Wahlen (1999) cite several studies that find ‘compelling evidence’ of income smoothing via accruals in banks
and insurers, for example, Beatty et al. (1995).
Merchant (1990) examines management manipulation of accounting information within two firms (i.e.
information used in internal reporting by divisions) drawing upon both interview and questionnaire data. The
research found that ‘managers acknowledged manipulative behaviours and short-term orientations’.Black et al.
(1998) examine non-current asset sales as creative accounting tools, using a very large dataset of observations
from Australia, New Zealand and the UK. They find that, where the relevant accounting standards are
permissive (as in the UK up till 1993) managers will exploit the potential for creative accounting via timing of
asset sales. Such behaviours are curtailed once the provisions of account ing standards are tightened. However,
amongst their conclusions, they observe that ‘there is every reason to believe that firms can “shift” creative
accounting activity among a variety of methods’. So, even if certain loopholes in regulation are eliminated,
creative accounting behaviour is likely to persist. Amat et al (2003) report about a study that identified creative
accounting practices in some of the 35 large Spanish listed companies. It should be noted that, therefore, any
creative accounting behavio ur identified in the study was relatively overt, and almost certainly legal. The
following occurrences were classified for the purposes of this study as possible indicators of creative
accounting:
-Auditor report qualifications (in Spain there is no requirement to restate the financial statements to reflect the
effect of the qualifications. The effect is, however, noted in the audit report).
-Special authorizations from regulatory agencies to adopt non-standard policy.
-Changes in accounting policy from one year to another (in Spain, such changes have to be explained and the
consequences quantified in the auditor’s report). In this study, the impact of creative accounting on reported
earnings was assessed for each of the three financial years in the 1999-2001 period. condition, the reported
earnings of 9 firms were less than adjusted earnings. However, in 2000 and 2001 when the Spanish economy
was affected by an economic downturn,
the position is reversed. A clear majority of the companies under scrutiny in both years showed reported
earnings higher than adjusted earnings. The results of the studymover a three year time period suggest that the
direction of creative accounting could be related to general economic conditions. (This possibility was flagged
by Merchant (1990).

IJRCMEAS ISSN 2454-6593
134
However, there are some unusual features of the Spanish accounting environment that merit special
attention. First, audit report qualifications are common, even in respect of major listed companies (Acerete Gil
et al, 2002, find that between in the years 1996-2000 the number of qualified audit opinions in the financial
statements of listed Spanish companies fell but the number was still high in 2000 when 92 companies had audit
qualifications). Second, a feature which is likely to elicit some surprise outside Spain, an element of creative
accounting may be carried out with the collusion of the regulatory authorities. Supervising agencies may permit
individual companies to adopt an accounting policy which contravenes current accounting regulation. Such
authorisations are provided as a result of effective lobbying by either a company or representative companies
within an industrial sector. Successful lobbying of this type demonstrates the power of influence that the
business sector may have over government or it s agencies. The practice of charging expenses to reserves rather
than to the income statement may also be permitted. All of the creative accounting behaviours identified in this
study were identified through careful analysis of the financial statements. Some of the manifestations were
easier to identify than others, but all should be observable by a reasonably well informed user of the financial
statements. The question may be asked: if the creative accounting behaviour is so obvious, can it properly be
classified as creative accounting at all? However, the extent to which users of the statements actually do observe
such relatively clear examples of creative accounting is uncertain. It has been observed that analysts’ reports in
Spain usually fail to mention the existence of audit report qualifications, special authorisations or other
manifestations of creative
accounting practices. Even quite clear signalling can be misinterpreted or ignored even by relatively
sophisticated users (Breton and Taffler, 1995). Furthermore, Dechow and Skinner (2000) argue that even if
financial statements provide sufficient information to permit users to adjust for creative accounting, there would
still be cause for concern over the value of the information content because of ‘the possibility that certain
investors rely completely on earnings numbers reported on the face of the income statement because their ability
to process more sophisticated (i.e. footnote) information is limited’. The results of these researchs show that
some elements of overt creative accounting practices are common.
The ethical perspective
Companies generally prefer to report a steady trend of growth in profit rather than to show volatile
profits with a series of dramatic rises and falls. This is achieved by making unnecessarily high provisions for
liabilities and against asset values in good years so that these provisions can be reduced, thereby improving
reported profits, in bad years. Advocates of this approach argue that it is a measure against the 'shorttermism' of
judging an investment on the basis of the yields achieved in the immediate following years. It also avoids raising
expectations so high in good years that the company is unable to deliver what is required subsequently. Against
this is argued that if the trading conditions of a business are in fact volatile then investors have a right to know
this and that income smoothing may conceal long-term changes in the profit trend.
Revsine (1991) considers the problem in relation to both managers and shareholders and argues that
each can draw benefits from 'loose' accounting standards that provide managers with latitude in timing the
reporting of income. He thinks that the prime role of accounting is as a mechanism for monitoring contracts
between managers and other groups providing finance; market mechanisms will operate efficiently, identifying
the prospect of accounting manipulation and reflecting this appropriately in pricing and contracting decisions.
The literature on the ethics of bias in accounting policy choice is reviewed at the 'macro' level of the accounting
regulator. This literature can similarly be applied to the bias in accounting policy choice at the 'micro' level of

IJRCMEAS ISSN 2454-6593
135
the management of individual companies that is implicit in creative accounting. If we consider the position
taken by Ruland (1984) and compare it to Revsine's analysis, we note that Ruland distinguishes between the
deontological view whereby moral rules apply to actual actions and the teleological view that an action should
be judged on the basis of the moral worth of the outcome. Revsine appears to take a teleological view of
accounting in the private sector, allowing managers to choose between the alternatives permitted in 'loose'
standards to achieve their desired end, but to take a deontological view of accounting in the public sector where
he calls for tighter standards to prevent such manipulation. We might ask whether the presence or absence of
market discipline justifies such ethical inconsistency. Ruland also discusses the distinction between a 'positive'
responsibility, which here would be the duty to present unbiased accounts, and a 'negative' responsibility where
managers would be responsible for states of affairs they fail to prevent. As we have seen, Ruland gives priority
to the 'positive'. Within Revsine's framework, where all outcomes are deemed to be impounded in the process of
contracting and price-setting, the distinction is not acknowledged. The 'duty to refrain' would imply avoiding the
bias inherent in creative accounting while the 'duty to act' would involve pursuing the consequences to be
achieved by creative accounting. If we take the three issues where Ruland sees the 'duty to refrain' as the more
important:
(a) Relentlessness and
(b) Certainty of outcome: Revsine's arguments, as we have seen, apply to a limited role for accounting as a
primarily contract monitoring exercise.
(c) Responsibility: Revsine seems to see compliance with GAAP as the prime responsibility, with no constraint
on choice within GAAP.
This may be a legitimate approach in the USA, but in a jurisdiction that prescribes an overriding
qualitative objective for accounts, such as the European Union with 'true and fair view', Revsine's approach is
less defensible. To the professional accountant creative accounting generally seems to be regarded as ethically
dubious. In the USA the then senior partner of Price Waterhouse observed: “When fraudulent reporting occurs,
it frequently is perpetrated at levels of management above those for which internal control systems are designed
to be effective. It often involves using the financial statements to create an illusion that the entity is healthier and
more prosperous than it actually is. An accountant, or other manager, who takes a stand against creative
accounting faces the same pressures as any other whistleblower. In extreme cases failure to act could ruin a
reputation. As one company accountant who took a firm stand put it: 'It cost me my job, but I don't think I would
have gotten another job had I been unethical' (quoted by Baldo 1995). Schilit (1997) reports the case of one
company accountant confronted with such an issue. His employer; a food wholesaler, incurred substantial costs
in paying retailers to put new lines on their shelves. This is a common practice, known as 'slotting', and the costs
are commonly written off in the year they are incurred. In order to keep within accounting ratios under loan
agreements the company president proposed to capitalise the slotting costs and amortise them over ten years.
The accountant undertook some research on other company practices, and as a result was confirmed in the view
that this was not an acceptable accounting treatment. After, he identified cost savings that would have just kept
the company inside its loan agreement and alerted the auditors to the issue, hoping 'that they would play the role
of bad cop and force the company to expense the 'slotting'. The principal investor in the company tried,
unsuccessfully, to put pressure on the auditor to support the capitalisation of the slotting costs. Shortly after the
accountant was sacked for taking this stand. The series of actions in this case are revealing: -Check that the
proposed accounting method is in fact unacceptable. As Hamilton (1991) advises: First, try to verify your
suspicions about what you think is wrong. Some accounting practices that are legal under new laws may look

IJRCMEAS ISSN 2454-6593
136
suspect to a non accountant. If you blow the whistle on something that's not illegal, you're really bare and
perhaps even vulnerable to defamation claims.
-Search for alternative legitimate ways to achieve the desired end and offer these as an alternative approach to
management.
-In the last resort, report the abuse to the appropriate monitor.
Remedial measures:
It seems clear that in general creative accounting is seen as a deceitful and undesirable practice. In this section
we analyse some measures which can help to reduce the scope for creative accounting practices, identifying,
where applicable, recent developments in International Accounting Standards (IASs) Accounting regulators who
wish to curb creative accounting have to tackle each of these approaches in a different way:
1. Scope for choice of accounting methods can be reduced by reducing the number of permitted accounting
methods or by specifying circumstances in which each method should be used. Requiring consistency of use of
methods also helps here, since a company choosing a method which produces the desired picture in one year
will then be forced to use the same method in future circumstances where the result may be less favourable. The
latest developments in International Accounting Standards are pursuing the objective of reduction in accounting
choice. (IASB, 2003).
2. Abuse of judgment can be curbed in two ways. One is to draft rules that minimize the use of judgment. At one
time, for example, company accountants tended to use the 'extraordinary item' part of the profit and loss account
for items they wished to avoid including in operating profit. Again, the present rules of the International
Accounting Standards have nearly abolished the category of 'extraordinary item'. Auditors also have a part to
play in identifying dishonest estimates. The other is to prescribe 'consistency' so that if a company chooses an
accounting policy that suits it in one year it must continue to apply it in subsequent years when it may not suit so
well.
3. Artificial transactions can be tackled by invoking the concept of 'substance over form', whereby the economic
substance rather than the legal form of transactions determines their accounting substance. Thus linked
transactions would be accounted for as one whole.
4. The timing of genuine transactions is clearly a matter for the discretion of management. However, the scope
to use this can be limited by requiring regular revaluations of items in the accounts so that gains or losses on
value changes are identified in the accounts each year as they occur, rather than only appearing in total in the
year that a disposal occurs. It is interesting to observe that the International Accounting Standards Board is
tending to move towards valuation at fair value rather than based upon historical cost in several recent
accounting standards and discussion papers.
But apart from changes in accounting regulation, ethical standards and governance codes must be
properly enforced in the corporate world. Regulation without thorough enforcement techniques is likely to be
ineffective in preventing individuals from employing misleading reporting practices. The challenge of enforcing
International Accounting Standards within a range of differing accounting cultural contexts is likely to be
especially problematic.
References
Acerete Gil, J.B, Fuertes Callén, Y. and Pascual Gaspar, E.: 2002 ‘Las salvedades en auditoria: el caso de
empresas cotizadas en España’, Partida Doble, N. 135, July- August, pp. 60-65.

IJRCMEAS ISSN 2454-6593
137
Amat, O., Gowthorpe, C. and Perramon, J.: 2003 ‘Earnings management in Spain: an assessment of the effect
on reported earnings of larger listed companies 1999-2001’,
Economic Working Paper Series, Universitat Pompeu Fabra.
Baldo, A.: 1995 'What's right? What's wrong?', Treasury and Risk Management, November.
Barnea, A., Ronen, J. and Sadan, S.: 1976 ‘Classificatory smoothing of income with extraordinary items’, The
Accounting Review, January, pp.110-122.
Beatty, A., Chamberlain, S.L. and Magliolo, J.: 1995 ‘Managing financial reports of commercial banks: the
influence of taxes, regulatory capital and earnings’, Journal of
Accounting Research, Vol. 33, No. 2, pp. 231-61. Beidleman, C. R.: 1973 ‘Income smoothing: the role of
management’.

IJRCMEAS ISSN 2454-6593
138
ROLE OF HUMAN CAPITAL IN LONG TERM GROWTH
SHRUTI C NIRALAGIHIREMATH
DEPT OF ECONOMICS
ABSTRACT
Human capital plays a pivotal role in economic growth. Without that we can’t produce a single good or
service and can be enhance value and productivity by investment in human beings that is in their education,
skills and health. But in the previous decades economists gave importance of the accumulation of man - made
physical capital for economic growth and development to the neglect of human capital. In the twentieth century
economists views are changed and realised that the importance of human resource capital for long term
economic growth.
In the modern technological world also agreed the importance of human capital. Because without
human resource we can’t operate a single tools, mechanises and technology. As mentioned above education and
health are creates effective, efficient and optimal human capital. Therefore human capital is important impact in
increasing national income.
INTRODUCTION:
Human capital plays a pivotal role in economic growth. Without that we can’t produce a single good or
service and can be enhance value and productivity by investment in human beings that is in their education,
skills and health. But in the previous decades economists gave importance of the accumulation of man-made
physical capital for economic growth and development to the neglect of human capital. In the twentieth century
economists views are changed and realised that the importance of human resource capital for long term
economic growth. However, the focus of the formation of human capital for long team growth were given really
no in depth remark, notwithstanding it is significant to address this matter as is done here.
MEANING OF HUMAN CAPITAL:
Human capital is a term popularized by Gary Becker, an economist from the University of Chicago,
and Jacob Mincer that refers to the stock of knowledge, habits, social and personality attributes, including
creativity, embodied in the ability to perform labour so as to produce economic value.
Alternatively, human capital is a collection of resources – all the knowledge, talents, skills, abilities,
experience, intelligence, training, judgment, and wisdom possessed individually and collectively by individuals
in a population. These resources are the total capacity of the people that represents a form of wealth which can
be directed to accomplish the goals of the nation.
Human capital refers to the skills, knowledge and experience possessed by an individual or population
viewed in terms of their value or cost to an organisation or a country.
HUMAN CAPITAL FORMATION
Human capital formation refers to the process of acquiring and increasing the number of persons who
have skills, education and experience which are essential for the economic development of a country. Human
capital formation is associated with investment on man, his development as a creative and productive resource.
Investment on human capital means expenditure on education, health, training etc.
SOURCES OF HUMAN CAPITAL FORMATION
1. Investment on education
2. Investment on health
3. Investment on the job training
4. Investment on migration

IJRCMEAS ISSN 2454-6593
139
5. Investment on information
1. INVESTMENT ON EDUCATION:
In modern world generally people are spending their money income on education with the main
objective of enhance their future life and its leads to promotion of economic growth. It helps to generate
working force with high level knowledge and advance technical skills. It also helps in furnishing qualitative
employment and profit making opportunities for the people.
2. INVESTMENT ON HEALTH:
Health is an important factor for the long term growth of a nation and as well as to individuals. When
we compare between a sick person and a person with good health, we can find out efficiency in who have good
health. Hence spending on health is needed to formation of human capital.
Medicines, provision for clean drinking water and good sanitation are several tools of health
expenditures. Investment on health is directly increases the supply of healthy workforce. And is, thus, a source
of human capital.
3. INVESTMENT RELATED TO THE JOB TRAINING:
The job training is an arrangement where employees develop skills while they are working. This is
useful for the workers and the institution. It reduces the burden on institution and provides a good working
experience for the trainees.
Investment relating to the job training is a source of human capital formation. Because these trainings
facilitate skilled labours and their productivity is more than the cost of it.
4. INVESTMENT ON MIGRATION:
People migrate in search of employments that bring them higher salaries than what they may get in
their native places. In India rural – urban migration is more because lack of employment opportunities in rural
area and also heavy burden on agriculture sector. Technically qualified persons, like engineers and doctors,
migrate to other countries because of higher salaries that they may get in such countries.
Migration in both cases involves transportation cost, higher cost of living and cost of adjusting with a
new socio – cultural setup. The increased money income in the migrated place is more than the expenditure of
migration, so that investment on migration is a source of human capital formation.
5. INVESTMENT ON INFORMATION:
Generally individuals spend money and time to get information regarding to the labour supply and
other markets like education, job – trainings and health. This information is needed to take decisions relating to
investment in human capital as well as for optimal usage of the earned human capital stock. Cost incurred for
getting information regarding to the labour market and other markets is also a source of human capital
formation.
� HUMAN CAPITAL IS A ASSET
Modern studies confirm the importance impact of investment in human capital on long term economic
growth. Human capital investment to be one of the more energetic engines of long term economic growth. As
compare to human capital investment is more impact than that of physical investment.
� There Are 3 Tools Of Growth – Enhancing Effects Of Human Capital
1. It contributes to economic efficiency.
2. It provides the labour resources on which growth depends
3. It can give social justification

IJRCMEAS ISSN 2454-6593
140
1. Economic Efficiency:
The facilities of education to economic efficiency show the present growth process. Modern
education, technology and smart skilled workers are complementing each other. Modern economies are
based on knowledge and less on material capital or natural resources, and knowledge spreads
effectively through strong networks.
Alternatively, the more individuals have entrance to knowledge, the higher economic returns
of knowledge. So that it is significant than ever to ensure that no groups in our societies are left isolated
by their inability to access education opportunities.
2. Labour Resources:
The second tool of growth enhancing effect of human capital lies in its provision of the labour
resources on which long term growth depends. Efficient human capital leads to higher employment and
that, in turn, provides the labour resources needed to support long term growth.
3. Social Justification:
Third important point social justification is relating to political, social and economic matters
of daily life. Human capital can help to eradicate social evils like poverty and unemployment and it
also leads to promote social welfare.
� HUMAN CAPITAL: EDUCATION AND HEALTH IN LONG TERM ECONOMIC GROWTH
Economic growth means increase in real national income of a country. As mentioned above investment on
education, health, on – the – job training, information and migration are the very important sources for long –
term economic growth. However, education and health are the very significant sources for long – term economic
growth. They increased workers abilities, productive capacity and generates higher level of income to an
individual. And also generates long – term economic growth. As shown below

IJRCMEAS ISSN 2454-6593
141
EDUCATION
Give
Knowledge
Skill Guide Awareness
CREATES EMPLOYMENT OPPORTUNITIES
Generates Individual Income
Long Term Economic Growth
HEALTH
Give
Peace Mind Physical
Capacity
Increased production
Generates Individual Income
Long Term Economic Growth
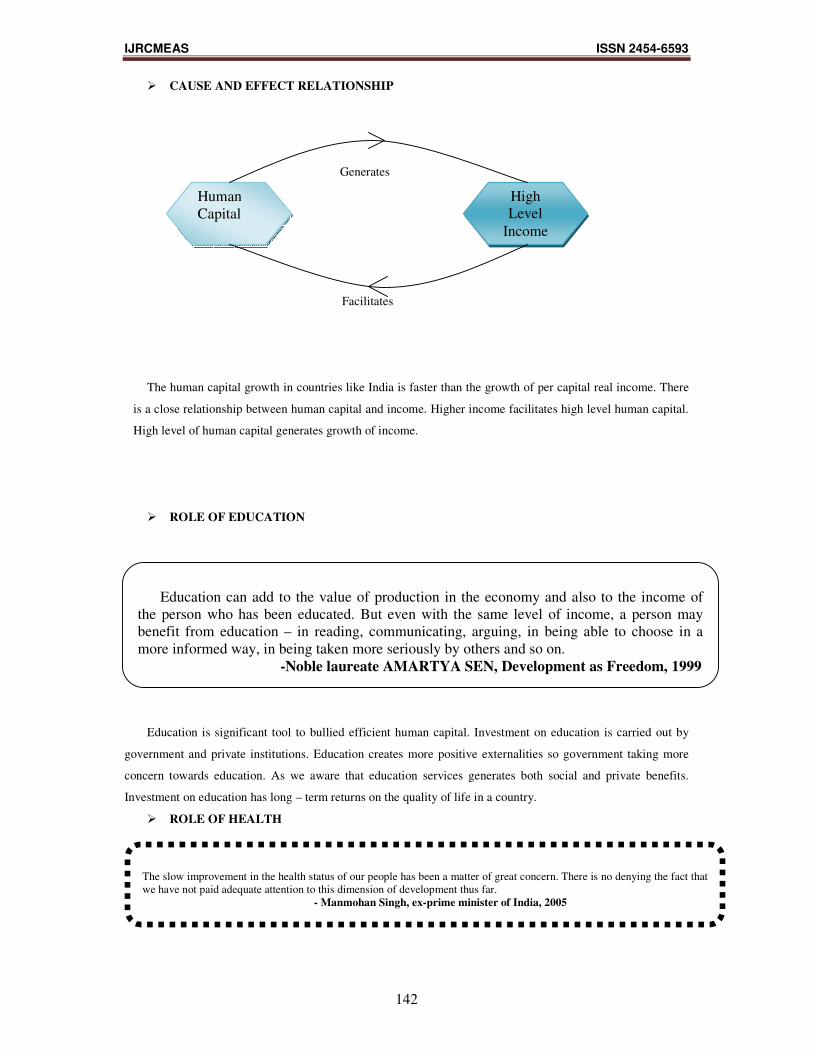
IJRCMEAS ISSN 2454-6593
142
� CAUSE AND EFFECT RELATIONSHIP
Generates
Facilitates
The human capital growth in countries like India is faster than the growth of per capital real income. There
is a close relationship between human capital and income. Higher income facilitates high level human capital.
High level of human capital generates growth of income.
� ROLE OF EDUCATION
Education is significant tool to bullied efficient human capital. Investment on education is carried out by
government and private institutions. Education creates more positive externalities so government taking more
concern towards education. As we aware that education services generates both social and private benefits.
Investment on education has long – term returns on the quality of life in a country.
� ROLE OF HEALTH
Education can add to the value of production in the economy and also to the income of the person who has been educated. But even with the same level of income, a person may benefit from education – in reading, communicating, arguing, in being able to choose in a more informed way, in being taken more seriously by others and so on.
-Noble laureate AMARTYA SEN, Development as Freedom, 1999
Human Capital
High Level
Income
The slow improvement in the health status of our people has been a matter of great concern. There is no denying the fact that we have not paid adequate attention to this dimension of development thus far.
- Manmohan Singh, ex-prime minister of India, 2005

IJRCMEAS ISSN 2454-6593
143
Health is very important asset to create physical strength. Investment on health facilitates more
productive capacity and it leads to increase in the production of more goods and services. Government goes on
increasing investment on health and provide health facilities to every individual. And it is making people as
asset of nation. Investment on health has long – term returns on the real income in a country.
CONLUSION:
In the modern technological world also agreed the importance of human capital. Because without
human resource we can’t operate a single tools, mechanises and technology. As mentioned above education and
health are creates effective, efficient and optimal human capital. Therefore human capital is important impact in
increasing national income.

IJRCMEAS ISSN 2454-6593
144
“CAUSE AND EFFECT OF WORKPLACE STRESS AMONG EMPLOYEES IN BANKING SECTOR:
AN EMPIRICAL STUDY
Prof. Brijmohan Vyas
Basaveshwar Engineering College (Autonomous), Department of Management Studies-Bagalkot-
Karnataka
Abstract:
The objective of the paper is to study about different factors creating stress and to assess the extent of stress
experienced by the employees of bank.
According to Beehr and Newman, “stress is a condition arising from the interaction of people and their jobs
and characterized by changes within people that force them to deviate from their normal functioning”
Nowadays employees have to deal with so many different demands and pressure, emotional, physical, and
administrative and management duties but also to some inconsiderate family demands and wants. Besides that
employees have to face Role-conflict, Role-Ambiguity, Team conflict, Frail Interpersonal relationships,
Motivelessness and powerlessness are some of the main contributions to the increased causes of stress among
employees.
The intention behind this paper is to find the major factors that cause stress to the employees of bank. For
achieving the objectives of study, survey was conducted. For the survey, personal interviews were conducted for
various bank employees, Personal interviews was selected as the mode of survey to make the study more
meaningful and so that maximum information could be collected. For conducting personal interviews for the
bank employees, a structured questionnaire was prepared for a sample size of 100 respondents.
According to the results of the analysis, the major parameters of causing the factors of stress is been observed,
when these parameters are compared work-overload, team conflict, role ambiguity, role conflict, frail
interpersonal relationships, motivelessness, and powerlessness have greater impact for causing stress upon
employees in banking sector.
The research findings also indicate that the major parameters of work-overload, team conflict, role ambiguity,
role conflict, frail interpersonal relationships, motivelessness, and powerlessness causes stress and thus shows
the extent of stress among employees. Most of the respondents say that stress is during whole session due to
work overload, so they have to maintain proper work plan to help reduce the work pressure, when there is
shortage of workers, they can outsource the employees to reduce the stress and work-overload.
Key Words: Stress Management, causes, factors.
1. Literature Review:
Kahn and Quinn, 1970 Factors Contributing to Job Stress of Private Bank Employees states that Workers
in an organization can face occupational stress through the role stress of the management. Role stress means
anything about an organizational role that produces adverse consequences for the individual.
Cobb 1975, Stress management with special reference to public sector bank employees in Chennai has the
opinion that, “The responsibility load creates severe stress among workers and managers.” If the individual
manager cannot cope with the increased responsibilities it may lead to several physical and psychological
disorders among them.
Materson, 1980 Work stress and employee performance in banking sector evidence from district
Faisalabad, Pakistan “Causes of stress are many like work load, cuts in staff, change at work, long work hours,

IJRCMEAS ISSN 2454-6593
145
shift work, lack of supervision, inadequate training, inappropriate working conditions, too heavy responsibilities
and poor relations with colleagues.”
Walonick , 1993 Investigating the Causes of Job Stress explained that a lot of factors are there that works as
job stressors such as role conflict, role ambiguity, work overload and work family conflict and their
consequences are work ineffectiveness, absenteeism and in extreme, turnover. All these factors make jobs more
difficult to perform and results in negative behavior at work, employees involved in theft and aggression.
Sharma S., Sharma J. & Devi A., 2012 Stress Management in it Sector The level of stress within a role
varies because of individual differences in mindset, age, gender, and their performance in job. However, various
factors that influence stress are age where the younger employees are more stressed as compared to other
employees, level of qualification, pay, and authorities of control, awards, and word of praise, improved
designations and working couples. The study recommended a reinforcement approach that should be positive in
nature so as to reduce the degree of stress at the workplace.
2. Problem Statement:
• This study attempts to explore the problem and factors relating
to stress and the in the banking industry. Although, the banking industry is important in different ways,
it seems that there are invisible problems due to stress in this industry. There are numerous common
causes some of them are:
• Work related grievances including lack of free time, job
environment problem, high workloads, low salary, unrealistic deadlines, job insecurity, lack of role
clarity, and a sense of feeling undervalued.
• Role without sufficient levels of challenge, lack of clear policies
and procedures and weakly managed organizational situation may also lead to stress.
• Whilst external causes of stress are more challenging, an
employee who receives support from his organization is more likely to limit how this impacts his work
role.
3. Objectives of the Study:
• To study about different factors creating stress.
• To assess the extent of stress experienced by the employees of
bank.
4. Scope of the Study:
• The study will help to know the actual factors that cause stress at workplace or
organisation.
• The employees who after being aware can take appropriate
steps to reduce their own stress, saving themselves from variety of health issues and also help
management to implement the stress management strategies.
• This research will assist to do further research like how to cope
up with the stress.

IJRCMEAS ISSN 2454-6593
146
5. Research Design:
• Descriptive Research:
It is used to describe characteristics of phenomenon being studied it does answer questions about how,
when, why the characteristic occurred.
• Data Collection: Sources of Data
• Primary data: Data is collected from manager and employees through questionnaire and also by
interviewing managers and employee.
• Secondary data: Data is collected from past reports, articles, literature reviews and websites.
• Tool for data collection- Structured questionnaire.
• Data Analysis Tool- SPSS and Microsoft Excel
• Sampling unit – Bank Employees (Private and Public Banks)
• Sample size- 100 respondents
SL.No. PRIVATE BANKS SL.No. PUBLIC BANKS
1. Axis Bank:12 Employees 1. Allahabad Bank: 3 Employees
2. HDFC: 13 Employees 2. Bank of Baroda: 5 Employees
3. Karnataka Bank: 7 Employees 3. Corporation Bank: 15 Employees
4. Kotak Mahindra: 7 Employees 4. Indian Overseas Bank: 9 Employees
5. State Bank of India: 14 Employees
6. Vijay Bank:5 Employees

IJRCMEAS ISSN 2454-6593
147
6. Data Analysis and Interpretation:
Data Analysis: The graph states that most of respondent’s that is 35% say they feel stress rarely when higher
authority does not pay attention over the problem pointed out by them, 35% say they feel stress rarely when
distribution of work is not according to personality, most of respondent’s that is 52% say they never feel stress
due to working for lower post, 37% say they never feel stress due to party politics of bank, 43% say they rarely
get puzzled when officers interface during working hours and 35%say they rarely fall in dilemma while carrying
out/ performing work under more than two officers.
Interpretation: From the above data and graph, it can be interpreted that among all the parameters, Role-
Conflict arises when the officers interface during working hours and employees get puzzled and causes stress
due to this.
Role Conflict
Always Many times Occasionally Rarely Never
I feel stress when higher authority does not pay attention over
the problem pointed out by me 7 23 26 35 9
I feel when distribution of work is not according to personality 7 21 20 35 17
I get de-motivated working for lower post 8 4 17 19 52
Party politics of bank creates tension for me 11 9 17 26 37
I get puzzled when officers interface during working hours 6 11 21 43 19
I am always in dilemma while carrying out/ performing work
under more than two officers 8 11 17 32 32

IJRCMEAS ISSN 2454-6593
148
Data Analysis: The graph states that most of the respondents that is 29% say that they feel stress in reaching the
targets in hurried manner in once or twice a week during the whole session, 32% respondents say that they feel
stress due to extra responsibilities of co-promotional activities in once or twice a month during selected session,
26%say they feel stress once or twice a week due to lack of sufficient time for completing/satisfying
responsibilities and 32% respondents say that they feel stress in once or twice a week during whole session they
never get frustrated when superior assigns work of others.
Interpretation: From the above data and graph, it can be interpreted that among all the parameters, Work-
overloadness arises due to reaching of targets in hurried manner that creates problem for the employees and
experience stress due to this.
Powerlessness
Always Many times
I do not feel any tension even when there is no participation in preparation of any important agenda or decisions 22 7

IJRCMEAS ISSN 2454-6593
149
Analysis: The graph states that most of the respondents that is 36% respondents say that they feel tension
occasionally when there is no participation in preparation of any important agenda or decisions, 35%
respondents say that they rarely get hurt when they do not have sufficient rights in modification of any activities
of bank, 28 % respondents say that they rarely get tensed due to lack of power to stop the unfair practices in the
bank, 34 % respondents say that their work capacities rarely get affected when they don’t have authority of
supervising the subordinates and 32 % say that they rarely feel powerlessness in removing the factors
responsible for poor system.
Interpretation: From the above data and graph, it can be interpreted that among all the parameters,
Powerlessness arises when there is no participation in preparation of any important agenda or decisions that will
lead to tense behavior and stress among employees.
I do not get hurt even when I have insufficient rights in modification of any activities of bank 21 8 26 35 10
Lack of power to stop the unfair practices in the bank makes me tense 13 25 26 28 8
My work capacities get affected when I don’t have authority of supervising the subordinates 17 19 23 34 7
I feel powerlessness in removing factors responsible for poor system 22 9 31 32 6
Role Ambiguity
Always Many times Occasionally Rarely Never
The lack of pre information about extra activities or tasks is the cause of my trouble 14 11 19 29 27
Sudden assignment of arranging for an event makes me tense 6 15 21 31 27
I do not feel any tension when due to shortage of workers, other works are also assigned to me 3 11 31 37 18
In the absence of manager the administrative work creates problem for me 5 9 13 26 47
Suggestions for effective completion of job or task makes me tension free 42 23 11 16 8
Unnecessary interference by higher authorities/officers makes me tense 13 11 30 25 21

IJRCMEAS ISSN 2454-6593
150
Analysis: The graph states that most of the respondents that is 30 % say that they occasionally feel trouble when
there is lack of pre information about extra activities, 31 % say that they rarely feel tense when there is sudden
assignment for an event, 37 % respondents say that they rarely do not feel tension when there is shortage of
workers and their work is assigned to them, 37 % say that occasionally it creates problem of administrative work
in the absence of manager, 42 % respondents say that they always feel tension free in getting suggestions for
effective completion of work and 30 % say that they occasionally feel tense when higher authority/officers
interface unnecessarily
Interpretation: From the above data and graph, it can be interpreted that among all the parameters,
Powerlessness arises when there is no participation in preparation of any important agenda or decisions that will
lead to tense behavior and stress among employees.

IJRCMEAS ISSN 2454-6593
151
Analysis: The graph states that most of the respondents that are 31 % say that they rarely feel hurt and unhappy
due to partial behavior of managers/top management,27 % say that they rarely feel uncomfortable due to harsh
behavior of the managers/top management, 46 % say that they are never worried due to jealous behavior of their
colleagues, 32 % say that they occasionally feel unhappy due to competitive climate of bank and 39 % say that
they rarely feel tense due to indiscipline behavior of subordinates.
Interpretation: From the above data and graph, it can be interpreted that among all the parameters, Frail
Interpersonal Relationship arises due to indiscipline behavior of subordinates that makes employees feel stress.
Frail Interpersonal Relationship
Alway
s
Many
times
Occasiona
lly
Rare
ly
Nev
er
I feel hurt and unhappy due to partial behavior of the
managers/ top management 8 20 22 31 19
I am uncomfortable due to harsh behavior of the managers/top
management 13 14 20 27 26
The jealous behavior of my colleagues is not the cause of my
worries 15 4 11 24 46
The competitive climate of bank makes me unhappy 4 20 32 27 17
The undisciplined behavior of subordinates makes me tense 6 12 22 39 21

IJRCMEAS ISSN 2454-6593
152
Analysis: The graph states that most of the respondents say that is 43 % say that they are always willing to
listen to other’s opinion but they also want to give their opinion, 36% say that they occasionally make
modifications in their goals to meet other people’s needs, 44 % say that they always stand on their principles
when conflicts arise, 39 % say that they never try to avoid people, who have strong opinions and 44 % say that
they always defend it strongly after they have made decisions.
Interpretation: From the above data and graph, it can be interpreted that among all the parameters, Team
conflict arises the most when employees make a decision and try to defend it strongly and that will lead to
stress.
Motivelessness
Alwa
ys
Many
times
Occasion
ally
Rar
ely
Nev
er
Less chance of promotion in bank affect my enthusiasm for work 15 14 12 17 42
I feel stress because obtained salary is much lesser than work 15 12 13 22 38
Team Conflict
Always Many times Occasionally Rarely Never
I am always willing to listen to other's opinion but I also want to give them mine 43 23 23 6 5
I often make slight modifications in my goals to meet other people's needs 25 27 27 14 7
When conflicts arise, I usually stand on my principles 44 23 16 7 10
I try to avoid people who have strong opinions 3 9 26 23 39
After I have made a decision, I defend it strongly 44 24 15 9 8

IJRCMEAS ISSN 2454-6593
153
done
I am frustrated because from last many years I am not promoted 6 11 9 24 50
If credit of my work goes to others, I feel tension 20 6 19 41 14
I am enthusiastic for work due to availability of motivation for
effective working 46 20 19 10 5
Same attitude of authorities towards hard worker and mean
worker does not make me tense 9 25 42 13 11
Analysis: The graph states that most of the respondents say that is 42 % say that they never had less chance of
promotion in bank that had affected their enthusiasm for work, 38 % say that they never feel stress because of
the salary obtained is much lesser than, 50 % say that they never feel frustration because no promotion since
from many years, 41 % say that they rarely feel tension if credit of one’s work goes to others, 46 % say that they
always feel enthusiastic for work due to availability of motivation for effecting working and 42% say they feel
stress occasionally when the higher authorities have same attitude towards hard worker and mean worker.
Interpretation: From the above data and graph, it can be interpreted that among all the parameters,
Motivelessness arises the most when the higher authorities have same attitude towards hard worker and mean
worker and hence causes stress.
7. Findings:
• 35% say they feel stress rarely when higher authority does not pay attention over the problem pointed
out by them, 26% respondents says occasionally, 23% respondents say many times, 7% respondents
say always, 9% respondents say they never feel stress.

IJRCMEAS ISSN 2454-6593
154
• 35% say they feel stress rarely when distribution of work is not according to personality, 21%
respondents says Many times, 20% respondents say Occasionally, 17% respondents say never, 7%
respondents say they always feel stress.
• 52% say they never feel stress due to working for lower post, 19% respondents says rarely, 17%
respondents say occasionally, 8% respondents say always and 4% respondents say they always feel
stress.
• 37% of respondents say they never feel stress due to party politics of bank, 26% respondents says
rarely, 17% of respondents says occasionally,11% of respondents say always and 9% respondents say
they feel stress many times.
• 43% of respondents say they rarely get puzzled when officers interface during working hours, 21% of
respondents says occasionally, 19% says never, 11% says many times and 6% says always they get
puzzled when officers interface during working hours.
• 35%say they rarely fall in dilemma while carrying out/ performing work under more than two officers,
29% respondents say never, 17% respondents say occasionally, 11% respondents say many times and
8% respondents say they are always in dilemma while carrying out/ performing work under more than
two officers.
• 29% say that they feel stress in reaching the targets in hurried manner in once or twice a week during
the whole session, 23% respondents say they feel stress once or twice a month during selected session
and 18% respondents say they never feel stress in reaching the targets in hurried manner.
• 32% respondents say that they feel stress due to extra responsibilities of co-promotional activities in
once or twice a month during selected session, 19% respondents say they once or twice a week during
the selected session and 18% respondents say they never feel stress due to extra responsibilities of co-
promotional activities.
• 26%say they feel stress once or twice a week 13% respondents say many times in a day during selected
session and 15% respondents say they never feel stress due to lack of sufficient time for
completing/satisfying responsibilities
• 32% respondents say that they feel stress in once or twice a week during whole session, 24%
respondents say that they feel stress in once or twice a month in selected session and 16% respondents
say they never get frustrated when superior assigns work of others.
• 36% respondents say that they feel tension occasionally, 23% respondents say rarely, 22% respondents
say always, 12% respondents say many times and 7% respondents say they feel tension many times
when there is no participation in preparation of any important agenda or decisions.
• 35% respondents say that they rarely get hurt when they do not have sufficient rights in modification of
any activities of bank, 26% respondents say occasionally, 21% respondents say always, 10% say never
and 8% say many times.
• 34 % respondents say that their work capacities rarely get affected when they don’t have authority of
supervising the subordinates, 23% respondents say occasionally, 19% respondents say many times,
17% respondents say always and 7% respondents say never.
• 32 % respondents say that they rarely feel powerlessness in removing the factors responsible for poor
system, 31% respondents say occasionally, 22% respondents say always, 9% respondents say many
times and 6% respondents say never.

IJRCMEAS ISSN 2454-6593
155
• 30 % respondents say that they occasionally feel trouble when there is lack of pre information about
extra activities, 27% respondents say rarely, 18% respondents say never, 14% respondents say always
and 11% respondents many times.
• 41 % say that they rarely feel tension, 20% respondents say always, 19% respondents say occasionally,
14% respondents say never and 6% say many times.
• 46 % say that they are never worried due to jealous behavior of their colleagues, 24% respondents say
rarely, 15% respondents say always, 11% respondents say occasionally and 4% respondents say many
times.
• 42% say they feel stress occasionally when the higher authorities have same attitude towards hard
worker and mean worker, 25% respondents say they feel stress many times, 13% respondents say they
rarely, 11% respondents say never and 9% respondents say they always feel stress about the same
attitude of authorities towards hard worker and mean worker.
• 46 % say that they always feel enthusiastic for work due to availability of motivation for effecting
working, 20% respondents say many times, 19% respondents say occasionally, 10% respondents say
rarely and 5% respondents say never.
8. Suggestions:
• Most of the respondents say that stress is during whole session due to work overload, so they have to
maintain proper work plan to help reduce the work pressure.
• The employees should be provided with career growth and advancement opportunities.
• As there is lot of stress, when there is shortage of workers, they can outsource the employees to reduce
the stress and work-overload.
• The attitude of higher authorities should consider the hardworking employees.
• The management should give training on team work and relationship building.
Conclusion
This study provides us information about factors and causes of stress experienced by the bank employees of
Bagalkot district. From the findings it is found that work-overload, Role-Ambiguity, Motivelessness, team
conflict, Powerlessness are the main factors causing stress among employees in banking sector. To overcome
these factors of stress, they can implement programs like Meditation, yoga and other health care programs. They
can implement other programs on relationship building and maintaining to have healthy employee relations and
work environment .Thus the objective of the study is fulfilled.
References:
• Preshita Neha Tudu and Pramod Pathak, A comparative study of Occupational Stress Among Public
and Private Sector Bank Employees of India, I J A B E R, Vol. 12, No. 3, (2014): 831-841
• K.Tamizharasi PH.D, Dr.UmaRani PhD., Work stress and job performance evaluation of bpo
employees, International Journal of Advanced Research in Computer and Communication Engineering
Vol. 3, Issue 1, January 2014.
IJRCMEAS ISSN 2454-6593
156
• Rajendran jayashree, stress management with special reference to public sector bank employees in
chennai, International Journal of Enterprise and Innovation Management Studies (IJEIMS) Vol. 1 No.
3, PP: 34-35.
• Vijay Joshi, Dr. K.A. Goyal Stress Management among Bank Employees: With Reference to Mergers
and Acquisitions International Journal of Business and Commerce Vol. 1, No. 5: Jan 2012[22-31]
(ISSN: 2225-2436)
• Taskina alii , mohammad khaleq new az, Factors Contributing to Job Stress of Private Bank
Employees in Bangladesh, East West Journal of Business and social Studies, Vol. I, January 20 I 0.

IJRCMEAS ISSN 2454-6593
157
GROWTH, DEVELOPMENT AND POLICY MEASURES ON INDIAN AGRICULTURAL SECTOR
Mr. Raghavendra Hajgolkar
ICSSR Doctoral Fellow, Department of Studies in Economics, Rani Channamma University, Belagavi-
Dr. Talwar Sabanna
Professor, Department of Studies in Economics, Rani Channamma University, Belagavi- 591 156 Email:
ABSTRACT:
Agriculture occupies a significant place in Indian economy. Majority of the people depend on it for
their livelihood. Its contribution to national income is very significant. But unfortunately, agricultural economy
of India presents a dual picture of prosperity and plenty on the one side; and poverty and misery on the other.
The new agricultural strategy has changed the face of Indian agriculture. Different aspects relating to growth
and development of Agriculture sector in India can be understood by this study. During the last two decades
Indian agriculture has been facing major challenges like deceleration in growth rate, degradation of natural
resources, inter-sectoral, inter-regional equity, declining input efficiency, etc. The growth in the agricultural
food grain production is showing a positive and remarkable improvement since 1995-96 to 2011-12 as discussed
in the study. But compared to the other developed countries like USA, Japan, China the average food grain
production per hectare is very low. Therefore, the present study is to understand that there is a need to follow
multi-dimensional model of organisation and management, which requires integration of agri-input, agri-
production and agro-processing and marketing segments of value chain, restructuring of existing institutions to
make them more responsive to the needs of users like farmers and industry, and demand driven, encourage
involvement of private investment particularly in post harvest activities including storage, food processing and
marketing.
Keywords: Agriculture sector, agriculture growth rate, compound growth rate, gross domestic product (GDP)
INTRODUCTION:
Indian agriculture sector has made considerable progress in the last few decades with its large resources
of land, water and sunshine. India produces all major crops to meet the requirement of food, fodder, fiber, fuel
and inputs for its agricultural industry. Agriculture is different from industry and plays a significant role in the
economic development of a nation. India‟s prosperity depends upon the agricultural prosperity (Vadivelu and
Kiran, 2013). This sector occupies the centre stage of India’s social security and overall economic welfare
Agriculture occupies a significant place in Indian economy. Majority of the people depend on it for their
livelihood. Its contribution to national income is very significant. But unfortunately, agricultural economy of
India presents a dual picture of prosperity and plenty on the one side; and poverty and misery on the other. The
new agricultural strategy has changed the face of Indian agriculture.
In India around 70% of the population earns its livelihood from agriculture. It still provides livelihood
to the people in our country. It fulfils the basic need of human beings and animals. It is an important source of
raw material for many agro based industries. India’s geographical condition is unique for agriculture because it
provides many favourable conditions. There are plain areas, fertile soil, long growing season and wide variation

IJRCMEAS ISSN 2454-6593
158
in climatic condition etc. India grows almost each and every crop. If we consider the varieties of crop grown
from Kashmir to Kanyakumari and western coast of Gujarat to extreme north eastern states of Arunachal
Pradesh, there would be hundreds of crops. In India there was a strong tradition of eating various millets as
staple food. But over the years majority of the population uses either rice or wheat as staple food. India has
witnessed significant increase in food grain production. Although productivity gains were sustained in the 1990s
after the liberalization process began, the yield rates for most of the agricultural products in India are far below
comparable rates in a number of other countries. If we look at the challenges faced by Indian agriculture, we can
find the problems that have been long standing and also the problems emerging from the prevailing agricultural
practices, system, changing climate and economy.
LITERATURE OVERVIEW:
There are many studies undertaken in connection with performance and development of agriculture
sector in India. Some important studies are reviewed here in relation to the present study. Renuka
Mahadevan(2003), revealed in her study that productivity gains in India were sustained in the 1990s after the
liberalization process began, the yield rates for most of the agricultural products in India are far below
comparable rates in a number of other countries. Acharya (1998) notes that the rate of growth of productivity
per hectare of all crops taken together increased from 2.07 per cent in the decade ending 1985-1986 to 2.51 per
cent per annum during the decade ending 1994-1995. Anwesha Borthakur and Pardeep Singh (2013),
Sengupta and Sonwani (2012), study revealed that the agricultural technology needs to move from production
oriented to profit oriented sustainable farming. The conditions for development of sustainable agriculture are
becoming more and more favorable. New opportunities are opening the eyes of farmers, development workers,
researchers and policy makers like agriculture related businesses, dairy farming, poultry farming castle farming
and fisheries.
OBJECTIVES OF THE STUDY:
The present study is proposed to be undertaken with the following objectives:
• To examine the contribution of agriculture sector in India.
• To look at the trends in area and production of major crops/crop groups in India.
• To suggest some policy measures to improve the conditions of agriculture sector.
DATA BASE AND METHODOLOGY:
The present study is based on secondary data. The secondary data is collected from all the Government
publications and research articles published in national and international Journals. The data so collected is
compiled and presented in suitable tables to derive appropriate findings and conclusions. Graphical representations
of some significant trends are provided to highlight the findings. Simple statistical tools such as averages,
percentages, ratios etc. are used to facilitate the data analysis.
AGRICULTURE SECTOR IN INDIA
Agriculture occupies a significant place in Indian economy. Majority of the people depend on it for
their livelihood. Its contribution to national income is very significant. But unfortunately, agricultural economy of
India presents a dual picture of prosperity and plenty on the one side; and poverty and misery on the other. The
new agricultural strategy has changed the face of Indian agriculture. Different aspects relating to growth and
development of Agriculture sector in India are discussed below.

IJRCMEAS ISSN 2454-6593
159
GROWTH RATE OF AGRICULTURE AND NON AGRICULTURE GDP IN INDIA:
Following fig. 1 gives us the details of the average growth rate of agriculture and non-agriculture GDP
during the last three decades. The results clearly show that in post-reforms era growth rate of real agricultural
GDP decelerated (5.8% in 8th Five Year Plan to about 2.5% in Tenth Plan) while that of non-agriculture GDP
increased significantly from 5.4 percent to 9.3 percent during the same period. This shows that the gap between
agriculture and non-agriculture GDP increased significantly in the post-reforms period.
The ratio of growth rate of real agricultural GDP to that of total real non-agriculture GDP was lowest
(0.27) in 10th Five Year Plan period compared to that in 8th Five Year Plan period (1.07), indicating
deceleration in agricultural growth compared with non agriculture GDP. However, there is definite growth
recovery in agricultural sector during 11th Plan.
Fig.1: Growth rate (%/year) in GDP agriculture and non-agriculture sector in different plan periods
(1999-00 prices for 8th
to 10th
Plan and 2004-05 prices for 11th
plan).
Source: CSO, 2011
The year-on-year annual growth rate during first four years of 11th Five Year Plan (2007-08to 2010-
11) averaged about 3.2 percent. The new programmes launched during the 11th Plan such as National Food
Security Mission and Rashtriya Krishi Vikas Yojna have made significant impact on food grains production in
the country.
GROWTH IN AVERAGE YIELDS OF DIFFERENT AGRICULTURE CROPS FROM 1970
TO 2010:
Table 1 gives us the details of the growth in average yields of different Agriculture Crops from 1970 to
2010. Indian farms in some regions post the best yields, for sugarcane, cassava and tea crops. It is clear from
the following table that the average yields of all the crops taken into consideration are showing a positive sign in
their yield since 1970-71 to 2010-11.

IJRCMEAS ISSN 2454-6593
160
The average yield of Rice in India during 1970-71 was 1123 kilogram per hectare which increased to
1740 kilogram per hectare in 1990-91 and 2240 kilogram per hectare during 2010-11. Similarly in connection
with wheat, average yield was 1307 kilogram per hectar during 1970-71, which improved to 2938 kilogram per
hectar in 2010-11.
Table 1: Growth in average yields of different Agriculture Crops from 1970 to 2010
Crop Average YIELD,
1970-1971
Average YIELD,
1990-1991
Average YIELD,
2010–2011
kilogram per hectare kilogram per hectare kilogram per hectare
Rice 1123 1740 2240
Wheat 1307 2281 2938
Pulses 524 578 689
Oilseeds 579 771 1325
Sugarcane 48322 65395 68596
Tea 1182 1652 1669
Cotton 106 225 510
Source: Ministry of Agriculture, GoI, Annual Report 2012
In connection with the average yield of Sugar in India during 1970-71 was 48322 kilogram per hectare
which increased to 65395 kilogram per hectare in 1990-91 and 68596 kilogram per hectare during 2010-11.
Similarly in connection with tea, average yield was 1182 kilogram per hectar during 1970-71, which improved
to 1669 kilogram per hectar in 2010-11.
AVERAGE PHYSICAL PRODUCTIVITY OF RICE, WHEAT AND MAIZE IN INDIA:
Following table 2 shows that the average productivity of all crops increased during the last three
decades but the levels of physical productivity of major crops in India are lower than the world average and the
best found in major developed countries.
The average productivity of rice (3370 kg/ha) in India is significantly lower than world average (4309
kg/ha) and about half of that in China (6556 kg/ha) and Japan (6488 kg/ha). Similarly, maize productivity is less
than half of world average and about 25 percent of that in USA. Milk productivity is also substantially lower
than world average. The slowdown in growth rate and plateauing of the productivity in major crops is a matter
of concern and efforts are needed to step up crop productivity as there is no scope for area expansion.
Table 2: Average Physical Productivity (kg/ha) of Rice, Wheat, Maize and Milk in India, World and the
Best in Developed Countries – 2008

IJRCMEAS ISSN 2454-6593
161
Crop India World Best
Rice (Kg/ha) 3370 4309 Egypt(9731); China(6556); Japan(6488)
Wheat (Kg/ha) 2802 3086 3108(USA)
Maize (Kg/ha) 2324 5109 9658(USA)
Milk (Kg/animal/year) 1145 2309 7342(Netherlands)
Source: FAOSTAT production data, www.faostat.org (accessed on October 6, 2011)
CHANGING SHARE AND GROWTH RATES OF MAJOR CROPS/CROP GROUPS IN INDIA:
The share of major crops in the total cropped area in India and also their growth rates during 1980s,
1990s and 2000s are elucidated below. Moreover this explanation also helps us to check the performance of the
agriculture sector in connection with its different crops in India.
Table 3: Changing Share and Growth Rates of Major Crops/Crop Groups in India.
Share in Total Cropped Area (%) CAGR (%) in Area CAGR(%) in Production
Crops
TE
1983-84
TE
1993-94
TE
2007-
08 1980s 1990s 2000s 1980s 1990s 2000s
Rice 22.81 22.94 22.62 0.6 0.78 -0.70 4.2 1.87 1.67
Wheat 13.24 13.2 14.24 0.36 1.4 1.3 3.39 3.11 2.45
Coarse Cereals 23.68 18.48 14.84 -1.49 -1.61 -2.14 0.72 0.36 2.94
Total Cereals 59.72 54.62 51.69 -0.29 -0.02 0.21 3.12 2.03 2.18
Pulses 13.36 12.56 12.08 0.09 -0.64 0.83 1.5 0.04 3.04
Foodgrains 73.09 67.18 63.78 -0.19 0.03 0.37 2.99 1.9 2.24
Oilseeds 9.77 14.8 14.34 3.02 -0.87 2.57 5.8 0.57 5.12
Sugarcane 1.97 2.12 2.48 1.35 1.91 1.29 2.97 2.74 2.26
Fruits and
vegetables 2.91 3.82 5.1 3.4 2.5 5.28 NA 4.96 6.76
Cotton 4.39 4.13 4.68 -0.19 2.18 3.12 3.32 0.24 14.28
Others 7.87 7.95 9.63 NA NA NA NA NA NA
Source: Ministry of Agriculture, GoI, Annual Report (2010a)
As shown in table 3, the performance of Indian agriculture decelerated significantly during the 1990s.
The compound annual growth rates of all crops were significantly lower in 1990s compared with 1980s. Rice
production which recorded a growth rate of 4.2 percent in 1980s declined to 1.87 percent in 1990s. Oilseeds

IJRCMEAS ISSN 2454-6593
162
sector was the most hit as the growth rate declined from 5.8 percent in 1980s to less than one percent in the
1990s. There has been some revival in the first decade of the 2000s. Total foodgrains production increased at an
annual growth rate of 2.24 percent compared with 1.9 percent during the 1990s.
The highest increase in growth rate was witnessed in case of cotton (14.28%), followed by fruits and
vegetables (6.76 %), oilseeds (5.12%), pulses (3.04%) and coarse cereals (2.94%). Efforts are needed to
accelerate the growth rates further to achieve 4-4.5 percent growth in agriculture sector during the 12th Plan.
ANNUAL COMPOUND GROWTH RATE OF PHYSICAL PRODUCTIVITY OF MAJOR CROPS IN
INDIA:
The trends in yield and annual compound growth rate of physical productivity of major crops are
presented in Table 4.
Table 4: Annual Compound Growth Rate of Physical Productivity
of Major Crops in India
Annual Compound Growth Rate (%)
Crop 1980s 1990s 2000s
Rice 3.57 1.08 1.45
Wheat 3.02 1.69 0.88
Coarse Cereals 2.24 2 2.93
Pulses 1.41 0.68 1.21
Foodgrains 3.18 1.87 1.7
Oilseeds 2.7 1.45 2.42
Sugarcane 1.61 0.82 0.51
Potato 2.25 1.95 -0.78
Fruits - 1.22 0.63
Vegetables - 3.04 2.09
Cotton 4.31 -1.9 11.21
Source: Ministry of Agriculture, GoI, Annual Report (2010a)
It is evident from the table that the average productivity of all crops improved between 1980s and
2000s but the increase was the highest in case of cotton (11.21%), followed by coarse cereals (2.93%) and
oilseeds (2.42%). However, growth rate of productivity of all crops decelerated during the 1990s compared with
1980s. The growth rates accelerated for cotton, rice, coarse cereals, pulses, and oilseeds during the 2000s.
SUMMARY OF FINDINGS:
On the basis of the analysis made above some important findings are derived. This sector provides
employment to around 58 percent of the total workforce of the country.. Agriculture including allied activities,
accounted for 14.1 per cent of gross domestic product (GDP) at 2004-05 prices, in 2011-12 as compared to 14.7
per cent in 2009-10. It is clear from the above analysis that the average yields of all the crops taken into
consideration are showing a positive sign in their yield since 1970-71 to 2010-11.

IJRCMEAS ISSN 2454-6593
163
The growth in the agricultural food grain production is showing a positive and remarkable
improvement since 1995-96 to 2011-12 as discussed above. But compared to the other developed countries like
USA, Japan, China the average food grain production per hectare is very low. There is no consistency in the
growth of agricultural sub sectors in either of crops, horticulture, non-horticulture, livestock and cereals sub-
sectors growth rate has not found consistency in connection with the above analysis.
SUGGESTIONS:
With the background of the above analysis and findings made in the present study, some important
suggestions are made below.
• Indian agricultural policy should best focus on improving rural infrastructure primarily in the form of
irrigation and flood control infrastructure.
• Knowledge transfer of better yielding and more disease resistant seeds.
• More importance to be given to develop agricultural sub-sectors and its allied activities by providing
skill training and technological knowledge among the farmers in the country.
• Government should take measures for transformation of mere ‘Agricultural Sector to Agricultural
Business’.
• More focus should be given to dryland agriculture.
Additionally, cold storage, hygienic food packaging and efficient modern retail to reduce waste can
improve output and rural incomes in the country.
CONCLUSION:
Since more than half of workforce is still engaged in agriculture for their livelihoods and employment,
agriculture continues to be a predominant sector of Indian economy, even though its share in national Gross
Domestic Product has declined in recent years. Rapid growth of the non-agriculture sectors, particularly
services, in post-reforms period has failed to accelerate agricultural growth or poverty reduction. During the last
two decades Indian agriculture has been facing major challenges like deceleration in growth rate, degradation of
natural resources, inter-sectoral, inter-regional equity, declining input efficiency, etc.
The slowdown in agriculture growth could be attributed to the supply side factors such as public
investment, irrigation water management, rural credit, technology, land management, agricultural research and
development including extension services, rural infrastructure like roads, electricity, marketing, post-harvest
management and so on. Reforms are needed to address these issues in order to achieve 4 - 4.5 percent growth in
agriculture, equity in terms of higher growth in disadvantageous regions like rainfed and tribal areas, small and
marginal farmers and women and sustainability. There is a need to follow multi-dimensional model of
organisation and management, which requires integration of agri-input, agri-production and agro-processing and
marketing segments of value chain, restructuring of existing institutions to make them more responsive to the
needs of users like farmers and industry, and demand driven, encourage involvement of private investment
particularly in post harvest activities including storage, food processing and marketing.
REFERENCES:

IJRCMEAS ISSN 2454-6593
164
� Renuka Mahadevan (2003), ‘Productivity growth in indian agriculture: The role of globalization and
Economic reform’ Asia-Pacific Development Journal, Vol.10,No. 2.
� Acharya, S.S. (1998), “Agricultural price policy and development: some facts and emerging issues”,
Indian Journal of Agricultural Economics, vol. 52, No. 1: 1-47.
� Nidhi Dwivedy (2011) , ‘Challenges faced by the Agriculture Sector in Developing Countries with
special reference to India’ , International Journal of Rural Studies (IJRS), Studies (IJRS) vol. 18 .
� Vijay Paul Sharma(2011); “India’s Agricultural Development under the New Economic Regime:
Policy Perspective and Strategy for the 12th Five Year Plan”, IIM Ahmadabad, India.
� Sengupta and Sonwani (2012), ‘Sustainable Development in India with Reference to Agricultural
Sector’, International Journal of Emerging Research in Management &Technology, pg 24-26.
� Anwesha Borthakur and Pardeep Singh (2013), ‘History of Agriculture in India’ Current Science,
Vol. 105, NO. 5.
� Vadivelu and Kiran (2013), “Problems And Prospects Of Agricultural Marketing In India: An
Overview”, International Journal of Agricultural and Food Science 2013, 3(3): 108-118.
� Indian Council for Agriculture Research, ‘Pursuit A N D P Romotion O F S Cience’, Chapter 26th,
(http://www.iisc.ernet.in/insa/ch26.pdf), pg258-265, information retrieved on 29 sept. 2014.

IJRCMEAS ISSN 2454-6593
165
MARKETING OF FRUITS FOCUSED ON POMEGRANATE PRODUCE
Prof. Mallikarjun M Huddar M.Com, M.Phil
Assistant Professor
Basaveshwar Commerce College,Bagalkot
INTRODUCTION
Agricultural is the back bone of Indian economy. It provides employment opportunity to the more than 68% of
the population of the country. And also its contribution towards national income is more than 28% so for that
purpose today is the right time for detailed investigation about agricultural commodities particularly
horticultural commodities like fruits.
Fruits cultivation has been practiced in India since ancient times. Indians have been lovers of fruits and flowers
from the very beginning. This art has now gradually developed in to one of the most civilized skillful and
commercial propositions. This is one of the fascinating avocations of farming profession which influences the
agricultural economy of the country in a large measure
Nutrition experts advocate consumption of at least 92gms of fruits per head per day in addition to cereal pulses
milk, vegetables, eggs etc. on account of various qualities that fruits possess. They are classified as protective
foods which supplement human diet in various ways.
The per capita consumption of fruits in India is only 46gms per day per head as against the recommended level
of 92gms per day. Based on the per capita consumption requirements India has to produce 34.18 million tonner
of fruits where as the current level of production is estimated at 26.90 million tons (1986-87) fruits are grown
over an area of 2.82 million hectare in India with a production of 26.90 million tons (1986-87) the important
fruits grown are mango, banana, citrus, guava, apple pineapple grapes and pomegranate.
India’s share in the world production of fruits
(Production in thousand metric tons)
Year Production of fruit India’s share %
India World
1989-91 28,632 3,52,026 8.13
1991-99 44,042 4,34,703 10.13
1999-00 45,496 4,57,797 9.94
2000-01 45,370 4,66,414 9.73
Pomegranate
Pomegranate belonging to the family punicaceae is one of the favorite fruit of tropical and subtropical
regions. This fruit is native of Iran and is extensively cultivated in Mediterranean countries like Spain, Morocco,
Egypt, Afghanistan and Baluchistan. Its cultivation in the recent past has also spread to countries like China,
Japan, USA, USSR, Pakistan and India though a sprinkling of pomegranate plantations are seen in states like
Gujarat, Rajasthan, Karnataka and Andhra Pradesh etc. this fruit is grown on commercial scale in Maharashtra
alone.
The best quality fruits are obtained from areas of cool winter and summer; the tree requires a hot and dry
climate for fruit development and ripening to produce sweet fruits the quality of fruits is adversely affected in
humid climate.
Marketing of pomegranate
Marketing channels:

IJRCMEAS ISSN 2454-6593
166
The pomegranate produce is marketed in two ways. The common practice was to sell the standing crop to the
pre-harvest contractors who visit the orchards before fruit maturity and enter into a contract with orchard owners
after inspecting the standing crops. Majority of the farmers sold their produce to the pre-harvest contractors.
This type of sale of the farm itself is termed as on farm sale except a few in most of the cases the agreement
with the pre-harvest contractors is only oral.
The growers received payment in installments. A normal amount was paid as advance at the time of making
the contract. A substantial part is paid just before the harvest and generally growers insisted
that the entire remaining amount will be paid before moving the last truck load of fruits out of the orchard.
The pre- harvest contractors brought the produce to the whole sale market. From this point produce passed
through the retailer to ultimate consumer.
The channel of moving the pomegranate produce from the product to the consumer is designated as channel-I
Channel – I
Even after the deal was struck it was the responsibility of the producers to arrange for security of the crop until
the crop was harvested arranging for the harvest of the crop was responsibility of the pre-harvest contractor it
was again his responsibility to transport the produce to the wholesale market and bear all the costs incidental to
these operation.
Another way followed by the pomegranate growers in marketing their produce was to sell the produce directly
in the wholesale market. From there the produce was moved to the consumers through retailers. This channel of
marketing the pomegranate fruits is designated as channel-II.
Channel II
In this channel the harvesting of the crop was the responsibility of the produces. He was also responsible for
transporting the produce to the wholesale market he had to bear the cost incurred in these operations.
In the wholesale market the functions of commission agent and wholesaler were performed by a single agent
the commission agent cum-wholesaler after sorting and grading the fruits he sold them to retailers on behalf of
Grower
Pre Harvest Contractor
Commission Agent-Cum-Wholesaler
Retailer
Consumer

IJRCMEAS ISSN 2454-6593
167
pre-harvest contractor or producer seller as the case may be, it may be noted that commission agent did not take
goods he was received commission for his services by the pre-harvest contractor or producer seller as the case
may be.
Reasons for selling the produce to pre harvest contractors
As the majority of the farmers preferred to sell their pomegranate produce to pre harvest contractors, to a certain
reasons for their decisions they are as follows
• Fees risky to take up marketing [price fluctuations absence of storage facilities
• Harvesting season coincides with operations of other crops
• High transportation cost
• Lack of proper road and inadequate transportation facilities
• Provision of credit facilities by pre harvest contractors
• Small quantity and absence of local market
Suggestions for improving marketing of pomegranate
• Farmers must themselves take up the task of marketing pomegranate in the nearby wholesale market
thereby enhancing their income from the production of pomegranate.
• A marketing co operative society should be established exclusively for the marketing of pomegranate
to resolve the farmers from the exploitation by the pre harvest contractor
• The state government should give due attention for providing proper approach roads to the villages. It
should also provide scientific storage facilities to help the farmers to store the fruits.
Conclusion
To conclude I would like to say that marketing of pomegranate can be improved by implementing the
suggestions are given in the research is said, which excellence is always….. Unlimited future lot of scope for
development

IJRCMEAS ISSN 2454-6593
168
BANKING SECTORS REFORMS IN INDIA
Dr.S.S.RAMPURE HOD and Research Guide, GFGC Shorapur, Dist: Yadgir
SUDHARANI Research Scholar, Dept of Commerce, Gulbarga University Kalaburagi
ABSTRACTS
The Indian banking Sector has witnessed wide ranging changes under the influence of the financial sector
reforms initiated during the early 1990’s.Banking sector reforms plays the efficient, dynamic and effective a
decisive role in accelerating the rate of economic growth in an economy. Narasimham committee’s
recommendation of First phase of banking sector reforms were introduced in 1991 and after its success;
government gave much importance to the second phase of banking sector reforms in 1998. In the wake of
contemporary economic changes in the world economy and other domestic crises like adverse balance of
payments problem, increasing fiscal deficits our country embarked up on economic reforms .to cope up with the
changing economic environment, banking sector needs some dose to improve its performance. the main motive
of the reforms was to improve the operational efficiency of the banks to further enhance their productivity and
profitability. The information technology (IT) has changed the Indian structure of Indian banking. Technology
has been identified by banks as an important element in their strategy to render sufficient customer service. in
banking computerization has taken place all over the world. the purpose is to bring technology to the counter
and to enable employees to have information at their fingertips technology like debit card, credit card, phone
banking, internet banking, mobile banking, ATMs, tele banking and virtual banking. Banking system is a
financial institution that provides banking and other financial services to their customers. A bank is generally
understood as an institution which provides fundamental banking services such as accepting deposits and
providing loans. There are also nonbanking institutions that provide certain banking services to customers banks
are a subset of the financial services industry. This paper is an attempt to study the reforms that has been taking
place in banking sector in India. The data and evidences are collected from various books and journals. The
study finds a detail picture of reforms that has been taking place in the Banking sector in India and also a good
overview of banking system.
[Keywords: Banking sector reforms, Information Technology, Banking systems]
INTRODUCTION
Indian banking sector reforms introduced since 1992-1993 primarily included easing of regulations that had
restricted competition. prudential norms for income recognition, asset classification, provisioning for delinquent
loans and capital adequacy, gradual reduction in the pre-emption of bank resources through statutory liquidity
ratio (SLR) and cash reserve ratio (CRR) de-regulation of the banks’ deposit and lending rates in stages, new
legislation for recovery of debt due to banks and the setting up of special recovery tribunals. liberalization of
lending norms and widening of the scope of priority sector lending, Basel norms and issuance of guidelines for
risk management systems in banks encompassing credit, market and operational risks; guidelines to set up asset-
liability management systems consistent with the international best practices; establishment of credit

IJRCMEAS ISSN 2454-6593
169
information bureau to identify bad risks and derivative products like forward rate agreements (FRAs) and
interest rate swaps (IRS), etc.
The banking system is central to a nation’s economy banks are special as they not only accept and deploy large
amounts of uncollateralized public funds in a fiduciary capacity, but also leverage such funds through credit
creation. in india, prior to nationalization, banking was restricted mainly to the urban areas and neglected in the
rural and semi urban areas. Large industries and big business enjoyed major portion of the credit facilities.
Agriculture, small – scale industries and exports did not receive the deserved attention.therefore, inspired by a
larger social purpose, 14 major banks were nationalized in 1969 and six more in 1980. Since then the banking
system in India has played a pivotal role in the Indian economy, acting as an instrument of social and economic
change. The Indian banking sector is broadly classified into scheduled banks and non-scheduled banks. The
scheduled banks are those included under the second schedule of the reserve bank of India act, 1934. The
scheduled banks are further classified into nationalized banks; state bank of India and its associates; regional
rural banks (RRBs); foreign banks and other Indian private sector banks. the term commercial banks refers to
both scheduled and non-scheduled commercial banks regulated under the banking regulation act, 1949.
Since 1991, India has undertaken comprehensive banking sector reforms which aimed to increase the
profitability and efficiency of the then 28 public sector banks that controlled about 90% of all deposits, assets,
and credit. The reforms were initiated in the middle of a “current account” crisis that occurred in early 1991.
The crisis was caused by poor macro economic performance, characterized by a public deficit of 10% of gross
domestic product (GDP), a current account deficit of 3% of GDP, inflation rate of 10%, and growing domestic
and foreign debt, and was triggered by a temporary oil price boom following the Iraqi invasion of Kuwait in
1990.
Indian banking sector has tremendous potential to grow. The last decade saw customers embracing ATM,
internet and mobile banking. India’s banking sector is currently valued at Rs. 81 trillion (US$ 1.31 trillion). It
has the potential to become the fifth largest banking industry in the world by 2020 and the third largest by 2025,
according to an industry report. The face of Indian banking has changed over the years. Banks are now reading
out to the masses with technology to facilitate greater case of communication, and transactions are carried out
through the internet and mobile device.
OBJECTIVES OF THE STUDY
To study the banking sectors reforms in India.
To study the theoretical background of banking reforms.
To study the information technologies in Indian banking structure.
To study the banking systems in India.
To study the committees of banking sector reforms.
STATEMENT OF THE PROBLEM
The main aim of banking sector reforms was to develop a diversified, efficient and competitive banking system
with the purpose of improving the distribution efficiency of funds through operational flexibility, financial
viability and intensification of institution. Reform measures were instigated and sequenced to develop and
conducive environment for banks to overcome the external irregularities in the Indian banking sectors.

IJRCMEAS ISSN 2454-6593
170
NEED FOR THE STUDY
Indian banks have delivered a significant role in shaping the financial system and thereby facilitates for
economic growth. This fundamental task of the banks in India persists even today although the inclination in
banking delivery has undergone a sea change with the development in handling of information technology as
well as design and delivery of customer centric service. The recent global financial turmoil has prompted
collapse of many strong economies; caused financial loss and created non-performing assets to banks. The
stable and vibrant banking sector is the real accelerator for the development of any economy in India.
RESEARCH METHODOLOGY
The present research article is based on the secondary data. The secondary datas are collected by different
internet websites, research journals, and reference book etc.
THEORETICAL BACKGROUND OF BANKING SECTOR REFORMS
The banking reforms since 1992, based on the recommendations of Narasimham Committee 1991 aimed at
transforming the highly regulated and directed public sector banking system into one characterized by openness,
competition, prudential and supervisory discipline. In the report on trend and progress of banking in India 1992-
1993, RBI states clearly “Commercial banks thus need to become conscious that they are entering a challenging
environment and will have to redefine their position within the financial industry. New ways and methods will
have to be determined in order to successfully respond to the new challenges particularly the growing demands
from customer for high quality services”.
NARASIMHAM COMMITTEE REPORTS ON BANKING SECTOR REFORMS IN INDIA
First generation of Narasimham committee report in 1991.
Second generation of Narasimham committee report in 1998.
First generation of Narasimham committee report - 1991
To promote healthy development of financial sector, the Narasimham committee made recommendations
Recommendations of Narasimham committee
1. Establishment of 4 tier hierarchy for banking structure with 3 to 4 large banks (including SBI) at top and at
bottom rural banks engaged in agricultural activities.
2. The supervisory functions over banks and financial institutions can be assigned to a quasi-autonomous body
sponsored by RBI.
3. Phased reductions in statutory liquidity ratio.
4. Phased achievement of 8% capital adequacy ratio.

IJRCMEAS ISSN 2454-6593
171
5. Abolition of branch licensing policy.
6. Proper classification of assets and full disclosure of accounts of banks and financial institutions.
7. Deregulation of interest rates.
8. Delegation of direct lending activity of IDBI to a separate corporate body.
9. Competition among financial institutions on participating approach.
10. Setting up asset reconstruction fund to take over a portion of loan portfolio of banks whose recovery has become
difficult.
Banking reform measures of government
On the recommendations of Narasimhan Committee, following measures were undertaken by government since
1991
Statutory liquidity ratio (SLR) and cash reserve ratio (CRR)
The high SLR and CRR reduced the profits of the banks. The SLR has been reduced from 38.5% in 1991 to
25% in 1997. This has left more funds with banks for allocation to agriculture, industry, trade etc. The cash
reserve ratio (CRR) is the cash ratio of a bank’s total deposits to be maintained with RBI. The CRR has been
brought down from 15% in 1991 to 4.1% in June 2003. The purpose is to release the funds locked up with RBI.
Prudential norms
Prudential norms include proper disclosure of income, classification of assets and provision for bad debts so as
to ensure that the books of commercial banks reflect the accurate and correct picture of financial position.
Prudential norms required banks to make 100% provision for all Non-performing Assets (NPAs). Funding for
this purpose was placed at Rs. 10,000 crores phased over2years.
Capital adequacy norms
Capital adequacy ratio is the ratio of minimum capital to risk asset ratio. In April 1992 RBI fixed CAN at 8%.
By March 1996, all public sector banks had attained the ratio of 8%. It was also attained by foreign banks.
Deregulation of interest rates
The narasimham committee advocated that interest rates should be allowed to be determined by market forces.
Since 1992, interest rates have become much simpler and freer.
Recovery of debts
The government of India passed the “recovery of debts due to banks and financial institutions act 1993” in order
to facilitate and speed up the recovery of debts due to banks and financial institutions. six special recovery
tribunals have been set up. an appellate tribunal has also been set up in Mumbai.
Competition from new private sector banks
Now banking is open to private sector. New private sector banks have already started functioning. These new
private sector banks are allowed to raise capital contribution from foreign institutional investors up to 20% and
from NRIs up to 40%. This has led to increased competition.

IJRCMEAS ISSN 2454-6593
172
Phasing out of directed credit
The committee suggested phasing out of the directed credit programme. It suggested that credit target for priority
sector should be reduced to 10% from 40%. It would not be easy for government as farmers, small industrialists
and transporters have powerful lobbies.
Access to capital market
The banking companies (acquisition and transfer of undertakings) act was amended to enable the banks to raise
capital through public issues. This is subject to provision that the holding of central government would not fall
below 51% of paid-up-capital. SBI has already raised substantial amount of funds through equity and bonds.
Freedom of operation
Scheduled commercial banks are given freedom to open new branches and upgrade extension counters, after
attaining capital adequacy ratio and prudential accounting norms. The banks are also permitted to close non-
viable branches other than in rural areas.
Local area banks (LABs)
In 1996, RBI issued guidelines for setting up of local area banks and it gave its approval for setting up of 7
LABs in private sector. LABs will help in mobilizing rural savings and in channeling them in to investment in
local areas.
Supervision of commercial banks
The RBI has set up a board of financial supervision with an advisory council to strengthen the supervision of
banks and financial institutions. In 1993, RBI established a new department known as department of supervision
as an independent unit for supervision of commercial banks.
Second generation of Narasimham committee report - 1998
To make banking sector stronger the government appointed committee on banking sector reforms under the
chairmanship of M. Narasimhan. It submitted its report in April 1998. The committee placed greater importance
on structural measures and improvement in standards of disclosure and levels of transparency.
Recommendations of Narasimham Committee
1. Committee suggested a strong banking system especially in the context of capital account convertibility
(CAC). The committee cautioned the merger of strong banks with weak ones as this may have negative effect on
stronger banks.
2. It suggested that 2 or 3 large banks should be given international orientation and global character.
3. There should be 8 to10 national banks and large number of local banks.
4. It suggested new and higher norms for capital adequacy.
5. To take over the bad debts of banks committee suggested setting up of asset reconstruction fund.
6. A board for financial regulation and supervision (BFRS) can be set up to supervise the activities of banks and
financial institutions.
7. There is urgent need to review and amend the provisions of RBI act, banking regulation act, etc. to bring
them in line with current needs of industry.

IJRCMEAS ISSN 2454-6593
173
8. Net non-performing assets for all banks were to be brought down to 3% by 2002.
9. Rationalization of bank branches and staff was emphasized. Licensing policy for new private banks can be
continued.
10. Foreign banks may be allowed to set up subsidiaries and joint ventures.
Banking reforms measures of government.
On the recommendations of Narasimham Committee, following measures were undertaken by government since
1998.
New areas.
New areas for bank financing have been opened up, such as insurance, credit cards, asset management, leasing,
gold banking, investment banking etc.
New instruments.
Greater flexibility and better risk management new instruments have been introduced such as interest rate
swaps, cross currency forward contracts, forward rate agreements, liquidity adjustment facility for meeting day-
to-day liquidity mismatch.
Risk management.
Banks have started specialized committees to measure and monitor various risks. They are regularly upgrading
their skills and systems.
Strengthening technology.
For payment and settlement system technology infrastructure has been strengthened with electronic funds
transfer, centralized fund management system, etc.
Increase inflow of credit.
Measures are taken to increase the flow of credit to priority sector through focus on micro credit and self help
groups.
Increase in FDI Limit.
In private banks the limit for FDI has been increased from 49% to 74%.
Universal banking.
Universal banking refers to combination of commercial banking and investment banking. For evolution of
universal banking guidelines have been given.
Adoption of global standards.

IJRCMEAS ISSN 2454-6593
174
RBI has introduced risk based supervision of banks. Best international practices in accounting systems,
corporate governance, payment and settlement systems etc. are being adopted.
Information technology.
Banks have introduced online banking, e-banking, internet banking, telephone banking etc. measures have been
taken facilitate delivery of banking services through electronic channels.
Management of NPAs
RBI and central government have taken measures for management of non-performing assets (NPAs), such as
corporate debt restructuring (CDR), debt recovery tribunals (DRTs) and look adults.
Mergers and amalgamation.
In May 2005, RBI has issued guidelines for merger and amalgamation of private sector banks.
Guidelines for anti-money laundering.
In recent times, prevention of money laundering has been given importance in international financial
relationships. In 2004, RBI revised the guidelines on know your customer (KYC) principles.
Managerial autonomy.
In February. 2005, the government of india has issued a managerial autonomy package for public sector banks
to provide them a level playing field with private sector banks in India.
Customer service.
In recent years, to improve customer service, RBI has taken many steps such as credit card facilities, banking
ombudsman, settlement of claims of deceased depositors etc.
Base rate system of interest rates.
RBI introduced the system of base rate since 1st July, 2010. the base rate is the minimum rate for all loans. For
banking system as a whole, the base rates were in the range of 5.50% - 9.00% as on 13th October, 2010.
BANKING SYSTEMS IN INDIA
The setting up of Assets Reconstruction Fund (ARF).
Nationalized banks Development Finance Institution (DFI) were burdened with sub – standard, doubtful and
loss assets known as non-performing assets (NPAs). Narasimham committee recommended the setting up of the
Assets Reconstruction Fund (ARF), to take over from the nationalized banks and financial institutions, a portion
of their bad and doubtful debts at a discount. All bad and doubtful debts of banks financial institutions were to
be transferred in a phased manner to ensure smooth and effective functioning of the ARF.

IJRCMEAS ISSN 2454-6593
175
Remove the Duality of Control.
The Narasimham Committee (1991) recommended that the present system of dual control over the banking
system between RBI and the Banking Division of the Ministry of Finance should end immediately and that RBI
should be the primary agency for the regulation of the banking system.
Free and Autonomous Banks.
The Narasimham Committee 1991 recommended that the public sector banks should be free and autonomous.
Every bank should go for a radical change in work technology and culture, so as to become competitive
internally and to be in step with wide ranging innovation taking place abroad. RBI should examine all the
guidelines and directions issued to the banking system in the context of the independence and autonomy of
banks.
TECHNOLOGIES IN INDIAN BANKING STRUCTURE
The important new technologies that are being used in Indian banking structure are:
Electronic fund transfer (EFT):
It is easy transfer of funds from one place to another. it enables the beneficiary to receive money on same day or
next day. the customer can transfer money instantly from one bank to another, from one bank account to another
or from one branch to other or a different bank not only within the country but also any where else the world
through electronic message.
Credit card:
Credit card (post card) is a convenient medium of exchange with the help of credit card a customer can purchase
goods and services from authorized outlets without making immediate cash payments but, within the prescribed
limit.
Debit card:
Debit card is a prepaid card and it allows customers anytime any where Access to his saving or current account.
for using debit card a PIN (personal identification number) is issued to customers. Any transaction taking place
is directly debited to the customer’s bank account.
Phone banking:
In phone banking a customer can do entire non-cash related banking services on telephone, any where at any
time. He can talk to a phone banking officer for transacting a banking business.
Tele banking:
Telebanking is a 24 hours banking facility based on the voice processing facility available on bank computers.
Here banking services or products are rendered through telephone to its customers.

IJRCMEAS ISSN 2454-6593
176
Internet banking:
Internet banking is on-line banking. it is a product of e-commerce. internet banking enables customers to open
accounts, pay bills, know account balances, view and print copies of cheques, stop payments etc.
Mobile banking:
Everybody with a mobile phone can access banking services, irrespective of their location. it is an extension of
internet banking. it provides services like account balance, mobile alerts about credit cards or debit card
transactions, mini account statement etc.
Door step banking:
In door step banking there is no need for customer to visit the branch for getting services or products from the
bank. This means banking services and products are made available to a customer at his place of residence or
work.
Point of sale (POS):
In an online environment the POS terminal is a machine that facilities transactions through swipe of a card.
ATMs:
ATMs are emerging as the most useful tool to ensure ‘any time banking’ and ‘any where banking’ or ‘any time
money’. ATMs are self services vendor machines that help the banks to provide round the clock banking
services to their customers at convenient places without visiting bank premises. The customers are provided
with ATM card
Virtual Banking:
It means rendering banking and its related services through use of IT. Some of the most important types of
virtual banking are ATMs, electronic fund transfer, phone-banking, credit card, debit card, internet banking etc.
Electronic clearing services (ECS):
It is non-paper based movement of funds. it consists of electronic credit clearing and electronic debit clearing.
CONCLUSION
Indian banking sector reforms facing the problem of adverse balance of payments, increasing fiscal deficits in
our country. Statutory liquidity ratio (SLR) and cash reserve ratio (CRR) reduced the banks profits. The main
motive of banking sectors is to improve their banking productivity, profitability and operational efficiencies.
Indian banks must cut their cost of their services another aspect to encounter the challenges is product
differentiation. Apart from traditional banking services, Indian banks must adopt some product innovation so
that they can compete in gamut of competition. Technology up gradation is an inevitable aspect to face
challenges. The level of consumer awareness is significantly higher as compared to previous years. Now-a-days
they need internet banking, mobile banking and ATM services in the technological developments of banks.
REFERENCES
“Financial Sector Reforms in India – A Descriptive Analysis”. Vol. NO.2, Issue NO.8 by Abhinav

IJRCMEAS ISSN 2454-6593
177
“Banking Reform in India”. June 2004 by Abhijit.V.Banerjee
“Indian Banking Sector – Challenges and Opportunities” Volume 16, Issue 2. Version. I (Feb. 2014), PP 52-
61 by Dr. K. Ratna Manikyam
“Impact of Banking Sector Reforms in India in the Post-Reform s Era” Volume 3, Issue: 4 April 2014 –
Indian journal of research by Dr. A. Arumugam.
“Indian Banking Sector Reforms: The Unfinished Agenda” by Dr. Rupa Rege Nitsure
“Indradhanush-Banking Sector Reforms” by Rajiv Kumar senior fellow centre for policy research January
2016
“Indian Economy” 59th Fully Revised Edition by Rudar Datta and K.P.M Sundharam
“Financial Sector Reorms in India (FSRI): Institutional and Legal Aspects.” At the Indira Gandhi Institute
of Development Research (IGIDR) may 9, 2006 by Dr. Kalpana Chandraprakash Satija
“Banking Sector Reforms and its Impact on Indian Economy” Volume 1, Issue 1 June 2011 by Pankaj
Mishra
“New Developments in Banking Sectors of India (With Special reference to State Bank of India)” ISSN
2348 – 8891- by Dr. Anoop Vyas, Sandeep Raghuwanshi
“Post 1991 Banking Sector reforms in India Policies and Impact”- by Mr.Basant Kalita
“Financial Sector Reforms in India: Policies and Performance Analysis” Reserve Bank of India Bulletin
2004 – by Rakesh Mohan
“Indian Financial Sector Reforms: A Corporate Perspective” (January-March1998) – by by Jayanth R.
Varma
“Banking Sector Reforms and NPA: A study of Indian Commercial Banks” by Meenakshi Rajeev H P
Mahesh

IJRCMEAS ISSN 2454-6593
178
SOCIAL MEDIA MARKETING
Shridhar M.Bidari
Basaveshwar Arts, Science and Commerce collage. Vidyagiri,Bagalkot
ABSTRACT
Now day’s Social Media is the best way to a brand for connecting with Valuable consumers. It is the medium to
socialize. These new media win the trust of consumers by connecting with them at a deeper level. Social media
marketing is the new technique for several brands for now days. Marketers are taking note of many different
social media opportunities and beginning to implement new social initiatives at a higher rate than ever before.
Social media marketing and the businesses that utilize it have become more sophisticated. Social media
marketing and the businesses that utilize it have become more sophisticated. One cannot afford to have no
presence on the social channels if the competitor is making waves with its products and services. The explosion
of social media phenomenon is as mind boggling as that and the pace at which it is growing is maddening.
Global companies have recognized social media marketing as a potential marketing platform, utilized them with
innovations to power their advertising campaign with social media marketing. This paper discusses about the
concepts of social media and social media marketing and other aspects like 1 the growth and benefits, role and
relevance of social media in marketing, social media marketing strategies. It also presents an overview on social
media marketing in India.
Keywords: social media, social media marketing, growth and benefits of social media, social media marketing
strategy.
Introduction:
Social media is hot n spicy. Social Media is now the trend. And for businesses it represents a marketing
opportunity that transcends the traditional middleman and connects companies directly with customers. This is
why nearly every business on the planet—from giants like Starbucks , IBM, Pepsi, Coca-cola, Gopalan
cinemas, Uday TV, 92.7 FM, Parle, and many other are exploring social media marketing initiatives. A year
ago, businesses were uncertain about social media. Now it's here to stay and companies are rapidly adopting
social media marketing. Much like email and websites first empowered businesses, social media is the next
marketing wave. Social media marketing is marketing using online communities, social networks, blog
marketing and more. It's the latest "buzz" in marketing. India is probably among the first proponents of social
media marketing. These days, the organizational cause has replaced the social cause as companies seek to
engage with their audience via the online platforms. The explosion of social media phenomenon is as mind
boggling as that and the pace at which it is growing is maddening. Trust and goodwill are the basis of social
networking, and by marketing in the realm of social media these fundamental notions need to be adhered. It is
probably the only marketing platform that encourages fool proof communication and accountability among
sellers as well as consumers. Global companies have recognized Social Media Marketing as a potential
marketing platform, utilized them with innovations to power their advertising campaign with social media
marketing.
Social Medias
1. Facebook
2. Twitter

IJRCMEAS ISSN 2454-6593
179
3. Linkedin
4. Instagram
5. Youtube
6. Dailymotion
7. Vine
8. Googlr+
9. Outlook
10. Gmail
11. Yahoo
12. Aol.mail
13. 9gag
14. Vimeo
15. Mylife
16. BuzzFeed
17. Soundcloud
18. Lifehacker
19. Fandango
20. Habbo
21. Cyworld
22. Classmates
23. Devianart
24. Fotolog
25. Last.fm
26. Twoo
27. Box
28. Netflix
29. SlackMedium
30. Yic Yak
31. Plenty of Fish
32. Photobucket
33. Yelp
34. Digg
35. Bitly
36. Match & Talk
37. Pinterest
38. Myspace
39. Tumblr
40. Flickr
41. Meetup
42. Reddit
43. Sina Weibo
44. Hi5

IJRCMEAS ISSN 2454-6593
180
45. Qzone
46. VKontakte(VK)
47. Odnoklassniki
48. We Heart It
49. Wayn
Benefits of Social media
• Cost reduction by decreasing staff time.
• Meets mass.
• Easy to operate by the people.
• Any ware at any time the people / customer can use.
• Compact device is enough to use.
• No need of separate device.
• Gives product information to the public.
• Helps to query.
• Innovative ads.
• 24/7 advertisement.
• Huge savings on advertisement.
• Educating customers.
• Creation of large number of followers.
• Direct relation with end consumers.
• Quick feedback.
• Effective communication.
• Less operating cost.
• Saving of time.
• Minimizing the pressure on marketing team.
• Savings of stationery.
• Less space is enough to operate.
• Helps for Green marketing.
• Helps to know customer need.
• Having own space.
• Flexible in nature.
• Audio, video advertisement.
• High coverage.
• Share their expertise and knowledge.
• Tap into the wisdom of their consumers.
• Enables customers helping to customers.
• Engages prospects through customer evangelism.
Social media marketing helps in:
• Generating exposure to businesses.

IJRCMEAS ISSN 2454-6593
181
• Increasing of traffic/subscribers.
• Building new business partnerships.
• Rise in search engine rankings.
• Generating qualified leads due to better lead generation efforts.
• Selling more products and services.
• Reduction in overall marketing expenses.
Companies in the west are investing increasingly in SMM to get in touch with their customers. They are
indulging in constant interaction with their prospects in order to understand their needs.
Bottlenecks for Social media
• Lack of Internet facility.
• Expensive for data pack.
• Need of smart phone, Tab and Computer.
• Lack in Literacy rate.
Social media: 2
Social media is engaging with consumers online. According to Wikipedia, social media is Internet-based tools
for sharing and discussing information among human beings. Social media is all about networking and
networking in a way that espouses trust among parties and communities involved. Any website which allows
user to share their content, opinions, views and encourages interaction and community building can be classified
as a social media. Some popular social media sites are: Facebook, YouTube, Twitter, Digg, MySpace, Stumble
Upon, Delicious, Scribd, Flickr etc. The meaning of the term ‘social media’ can be derived from two words
which constitute it. Media generally refers to advertising and the communication of ideas or information through
publications/channels. Social implies the interaction of individuals within a group or community. Taken
together, social media simply refers to communication/publication platforms which are generated and sustained
by the interpersonal interaction of individuals through the specific medium or tool. Wikipedia has a general
definition of the term: Social Media is the democratization of information, transforming people from content
readers into content publishers. It is the shift from a broadcast mechanism to a many-to-many model, rooted in
conversations between authors, people, and peers. Social media uses the “wisdom of crowds” to connect
information in a collaborative manner. Social media can take many different forms, including Internet forums,
message boards, weblogs, wikis, podcasts, pictures, and video. Social media is made up of user-driven websites
that are usually centered on a specific focus (Digg = news) or feature (del.icio.us = bookmarking). Sometimes,
the community itself is the main attraction (Face book and MySpace = networking) Social media are media for
social interaction, using highly accessible and scalable publishing techniques. Social media uses web-based
technologies to turn communication into interactive dialogues. Andreas Kaplan and Michael Haenlein define
social media as "a group of Internet-3 based applications that build on the ideological and technological
foundations of Web 2.0, which allows the creation and exchange of user-generated content." Social media is the
medium to socialize. They use web-based technology to quickly disseminate knowledge and information to a
huge number of users. They allow creation and exchange of user-generated content. Facebook, Twitter, Hi5,
Orkut and other social networking sites are collectively referred social media. Social media represents low-cost
tools that are used to combine technology and social interaction with the use of words. These tools are typically
internet or mobile based like Twitter, Facebook, MySpace and YouTube.
Social media marketing:

IJRCMEAS ISSN 2454-6593
182
Social media marketing consists of the attempt to use social media to persuade consumers that one's company,
products and/or services are worthwhile. Social media marketing is marketing using online communities, social
networks, blog marketing and more. Lazer and Kelly’s (1973) define social marketing as "concerned with the
application of marketing knowledge, concepts, and techniques to enhance social as well as economic ends. It is
also Concerned with the analysis of the social consequences of marketing policies, decisions and activities."
Social media marketing is not merely about hitting the front page of Dig or any other social news website. It is a
strategic and methodical process to establish the company’s influence, reputation and brand within communities
of potential customers, readers or supporters.
Growth of social media marketing:
A recent study, “The State of Small Business Report,” sponsored by Network Solutions, LLC and the University
of Maryland’s Robert H. Smith School of Business, points to economic struggles as the catalyst for social
media’s rapid popularity. The study results show that social media usage by small business owners increased
from 12% to 24% in just the last year, and almost 1 out of 5, actively uses social media as part of his or her
marketing strategy. In 2009,only 23% of marketers were using social media for years. Now that number has
grown to 31%.Here’s a breakdown of what the small businesses reported as the main uses of social media
marketing:
• 75% have a company page on a social networking site.
• 69% post status updates or articles of interest on social media sites.
• 57% build a network through a site such as LinkedIn.
• 54% monitor feedback about the business.
• 39% maintain a blog.
• 26% tweet about areas of expertise.
• 16% use Twitter as a service channel.
According to the study, different industries are adopting social media marketing at different rates, and while
many industries have started using social media marketing in their efforts to reach more customers, many still
have not positioned it as their top priority.
A research shows that charitable organizations are still outpacing the business world and academia in their use
of social media. In a study conducted in 2008, a remarkable eighty-nine percent of charitable organizations are
using some form of social media including blogs, podcasts, message boards, social networking, video blogging
and wikis. A majority (57%) of the organizations are blogging. Forty-five percent of those studied report social
media is very important to their fundraising strategy. While these organizations are best known for their
nonprofit status and their fundraising campaigns, they demonstrate an acute, and still growing, awareness of the
importance of Web 2.0 strategies in meeting their objectives. In just the last few months, marketers have shifted
their attitudes toward social media marketing spending. This was recently affirmed in the new study, “The CMO
Survey”, from Duke University’s Fuqua School of Business and the American Marketing Association.
A key finding:
• Social media marketing budgets continue to rise. According to the results, businesses currently
• Allocate of their marketing budgets to social media, an allotment they expect to increase.
• 10% during the next year and 18% over the next 5 years.

IJRCMEAS ISSN 2454-6593
183
• Marketers had already planned on devoting more money to social media.
• However, marketers reported that they plan to allocate one-fifth of their
• Marketing budgets to social media marketing in the next 5 years. This is a definite increase
Current status of social media:
Social network ad spending (billions)
� 2013-$11.36
� 2014-$17.74
� 2015-$23.68
� 2016-$29.91
� 2017-$35.98(expected)
Social network ad spending growth
� 2013-51.1%
� 2014-56.2%
� 2015-33.5%
� 2016-26.3%
� 2017-20.3%(expected)
Social network % 0f digital ad spending growth
� 2013-9.4%
� 2014-12.2%
� 2015-13.9%
� 2016-15.1%
� 2017-16%(expected)
It can be understood that even though many are still experimenting and learning how best to use social media
tools, these results indicate that marketers think social media marketing is here to stay and will play an
increasingly important role in their work in acquiring and retaining customers in the future.
Benefits of social media marketing:
• Significantly different from conventional marketing strategies, Social Media Marketing (SMM)
• Offers three distinct advantages. One, it provides a window to marketers to not only present
• Products / services to customers but also to listen to customers’ grievances and suggestions.
• Two, it makes it easy for marketers to identify various peer groups or influencers among various
• Groups, who in turn can become brand evangelist and help in organic growth of a brand. And,
• All this is done at nearly zero cost as compared to conventional customer outreach.
• Most of the social networking sites are free.

IJRCMEAS ISSN 2454-6593
184
Conclusion and Suggestions for Further Research
In conclusion, research has determined that retailers can increase awareness of their brand by being creative
when engaging customers on social media sites. “As more shoppers are using social media (e.g., Twitter,
Facebook, MySpace, and LinkedIn) and rely on them for marketing shopping decisions, promotion through
these media has become important, social media sites such as Facebook are better than other advertising avenues
because it stores information on all its users thus ensuring marketing reaches a retailer’s specific target market.
Social media sites are a great stage for retailers to create an experience and retailers can use information stored
on social media sites to improve user experience with their brand.
References
1. Internet.
2. Retail Management (Dr.M.L. Guledgudd, Nagashashi. K. Havanur)
3. Ibitz info tech.
4. Wikipedia.
5. http://www.ijecbs.com
6. http://dx.doi.org/10.1016/j.jretconser.2012.08.002. 25

IJRCMEAS ISSN 2454-6593
185
CUSTOMER RELATIONSHIP MANAGEMENT THE BACK BONE OF CONSULTANCY
Mr. Aniruddha R
Faculty – Chetan Business School, Hubli
Dr. Vinod N Sambrani
Associate Professor, Kousali Institute of Management Studies, Karnatak University Dharwad
Abstract
The Management consultancy help the companies to progress in their respective goals. The purpose of this
paper is to show how the relation between the client and customer is important from the point of the consultant,
of how to make the client accept the concept of consultancy and action upon it. The relationship between client
and the customer is more of a closely knit relation. Here the customer explains what he requires from the
consultancy and in return gets what is asked. And in this process how the relation is built and sustained and the
effect of this on future business.
Introduction
Customer Relationship Management (CRM) is a process companies use to understand their customer groups and
respond quickly—and at times, instantly—to shifting customer desires.
In a board sense, management consultancy is a term that refers to the activities which have been carried out by
an independent person or persons aimed at helping organizations improve their performance. This is usually
done by consultants through a thorough analysis of existing business problems or issues, followed by a
development of plans for improvement.(Institute of
Business Consulting)
Outsourcing the processes has become a boon to man and this has been followed by mid and large business
organizations. It is prevailing in India for the past 10 years or so. And this being the reason , outsourcing has a
good growth rate.
Human Resource Outsourcing refers to the process where any company or organization seeks the expertise of a
third party, usually a third party to take care of its HR functions while HR department can focus on the
strategic dimension of their function. The functions that are frequently outsourced are the functions which need
expertise, relevant experience, knowledge and best methods and practices.
In the past producers & service providers did not heed to the requirements of the clients, as the clients or
customers did not have much to choose from with respect to different low alternatives/vendors.. However the
intensifying of competition (Barr andMcNeilly, 2003), a rapidly changing marketplace (Cravens and Piercy,
1994), globalization (Buttle, 1996) and a declining public image of professional services (Vidal, 2011) has
forced professional services firms (PSFs) to take relationship marketing more seriously, this brought with it high
competition, client demanding customized requirement, with high importance to quality. This made today’s
manufacturers and service providers to shift from the traditional way of marketing to modern era marketing or
as we know it relationship marketing . Modern marketing calls for more than developing a product, pricing it,
promoting it and making it accessible to target client. It demands building trust, a binding force and value added
relationship with the clients

IJRCMEAS ISSN 2454-6593
186
Success in long run can only be established by managing the relationship with the client for a long term.
Good relationship with clients is the bed rock of lasting relationship between the consultancy and the clients. In
fact the clearer understanding of the need of the clients drive home the point that what exactly the clients need
from the consultancy agencies. Once this understanding between the consultancy and clients would work
smoothly, the clients come and place before the consultancy their demands for requisite man power to work in
their organization. It is up to the consultancy agency to find out skilled workforce who would fulfill the demand
of the clients. If this work is being done meticulously by the consultancies, further it would generate confidence
in the mind of clients. Once the facilitator (consultancy) workout in providing the work force to the clients,
automatically it would generate confidence among the clients. It is these factors which go a long way in building
up good relationship between the consultancy and the clients. Therefore, it is this aspect which is called the
power house of recruiting industry.
Literature Review
With the advent of e-commerce comes the e-customer. According to Vantive, a customer relationship
management solutions provider, the e-customer expects constant access to a company; through e- mails, call
centers, faxes and websites. They demand immediate response and a personalized touch. Meeting their needs
places new demands on the enterprise. Since traditional enterprise resource planning applications did not include
a customer management aspect, CRM was the logical next step. Vantive, for example, has been developing and
implementing customer-facing applications since 19921. Earlier studies have demonstrated a paradigm shift
away from the traditional marketing mix to a relationship marketing approach in the services industry (Levitt,
1983; Webster, 1992;Gronroos, 1994; Holmlund and Kock, 1996).
CRM is intended to provide a unified, company-wide view of the customer and to cultivate high-quality
relationships that increase loyalty and profits.( Peter Drucker and Theodore Levitt,1960). Effective CRM
requires an strong and supporting sales, marketing, service strategy, along with a software which would has the
in and out of the customers.
Customer relationship management is highly exercised in the industry like hospitality, services industry .
Keeping in mind the diversity and the innumerable opportunities that our city offers, we have devised a multiple
array of ideas and solutions that are uniquely Indian.
The CRM (customer relationship management) is an integrated effort to strengthen the network of relationship
for the mutual benefit of both the parties. The biggest management challenge in the new millennium of
liberalization and globalization for a business is to maintain good relationship with the king – the client. This
study is of great significance because a 5% increase in the client retention will increase the profit up to 125%. It
costs seven times more to attract a new client than to serve an old one. 20% of the company’s loyal clients
account for the 80% of its revenues.
Need For The Study:
It is to update the knowledge relating to client relationship. during the study some problems may develop or the
study may make us to define relationship with clients afresh.
Object ives Of The Study:
To understand the effect of Customer Satisfaction on Customer Relationship Management w.r.t consultancy.
. Methodology Used
A survey was conducted to evaluate the customers satisfaction in regards to the services rendered by the
consultancy. The primary data used was collected through the survey method.

IJRCMEAS ISSN 2454-6593
187
The sample size was arrived based on the number of total population available. The research was conducted in
Hubli and Dharwad.
Why client-relationship is called power house?
Good relationship with clients is the bed rock of lasting relationship between the consultancy and the clients. In
fact the clearer understanding of the need of the clients drive home the point that what exactly the clients need
from the consultancy agencies. Once this understanding between the consultancy and clients would work
smoothly, the clients come and place before the consultancy their demands for requisite man power to work in
their organization. It is up to the consultancy agency to find out skilled workforce who would fulfill the demand
of the clients. If this work is being done meticulously by the consultancies, further it would generate confidence
in the mind of clients. Once the facilitator (consultancy) workout in providing the work force to the clients,
automatically it would generate confidence among the clients. It is these factors which go a long way in building
up good relationship between the consultancy and the clients. Therefore, it is this aspect which is called the
power house of recruiting industry.
Challenges faced by recruitment team in fulfillment of client needs
The key to handling with irate clients is preventing problems from escalating. Defuse or solve problems as soon
as they arise so they don't turn into major crises. They should learn to recognize the warning signs of a difficult
client as soon as they appear, so they can deal with them at the outset.
Some clients may start showing eagerness, this eagerness can be tackled if they know how to deal with them.
Recognize what the client needs and how they want to be treated and act accordingly. Since they never know
how a client will influence their business in the future, approach to treat each client as the most important client
of them. This strategy will help if they grow and become successful. Sometimes it's the small, difficult clients
who turn out to be their most loyal ones and the ones who refer them the most. These clients often have
influential friends and relatives who also need services.
The best way to deal with demanding clients is to carefully listen to them, to go accordingly and try to explain
them the differences. However, if the client is being totally unreasonable, and it means the difference between
running a profitable or unprofitable job, it may make sense to walk away. Better to cut their losses before the job
than have a bigger problem later on.
Clients are one of the most important factors of starting a sustaining a successful business. Without clients,
especially those who ask to hire candidates again and again from the consultancy. This is why the more
successful they are at understanding and forming relationships with their clients, the more successful they will
be at growing their small business. Not only is developing relationships with their clients a smart move from a
marketing standpoint, but it also helps them to anticipate client needs and perform ongoing adjustments so they
can improve their business over time.
When you take time to understand the clients' needs, they will be in a better position to ensure client satisfaction
with their products or services, and align themselves for new opportunities. They may even increase the

IJRCMEAS ISSN 2454-6593
188
possibility of referrals and increased word of mouth marketing. Here are some ways you can work on strengthen
their relationships with their clients.
Findings & Analysis
Period of association with the consultants
Period Frequency Percent Valid Percent Cumulative Percent
year 21 42.0 42.0 42.0
2 years 17 34.0 34.0 76.0
4 Years 11 22.0 22.0 98.0
6 Years 1 2.0 2.0 100.0
Total 50 100.0
Exhibit 1
How often you take service from consultancy services .
Period Frequency Percent Valid Percent Cumulative Percent
Monthly 13 26.0 26.0 26.0
Quarterly 7 14.0 14.0 40.0
Biannually 11 22.0 22.0 62.0
Annually 19 38.0 38.0 100.0
Total 50 100.0 100.0
Exhibit 2
Relationship experience with consultancy services .
Rating Frequency Percent Valid Percent Cumulative Percent
Very good 24 48.0 48.0 48.0
Good 15 30.0 30.0 78.0
Average 9 18.0 18.0 96.0
Bad 2 4.0 4.0 100.0
Total 50 100.0 100.0

IJRCMEAS ISSN 2454-6593
189
Exhibit 3
Average time taken to respond to your requirements
Time Frequency Percent Valid Percent Cumulative Percent
Less than 24
Hours 18 36.0 36.0 36.0
24 Hours 23 46.0 46.0 82.0
48 Hours 8 16.0 16.0 98.0
More than 48
hours 1 2.0 2.0 100.0
Total 50 100.0 100.0
Exhibit 4
Co-ordination of consultancy services staff with the clients
Rating Frequency Percent Valid Percent Cumulative Percent
Very good 28 56.0 56.0 56.0
Good 9 18.0 18.0 74.0
Average 11 22.0 22.0 96.0
Bad 2 4.0 4.0 100.0
Total 50 100.0 100.0
Exhibit 5
Overall rating of s Consultancy service
Rating Frequency Percent Valid Percent Cumulative Percent
Highly satisfied 18 36.0 36.0 36.0
Satisfied 27 54.0 54.0 90.0
Dissatisfied 5 10.0 10.0 100.0
Total 50 100.0 100.0
Exhibit 6
Do you wish to continue the relation consultancy services in future
Response Frequency Percent Valid Percent Cumulative Percent
Yes 47 94.0 94.0 94.0
No 3 6.0 6.0 100.0
Total 50 100.0 100.0

IJRCMEAS ISSN 2454-6593
190
Exhibit 7
From Exhibit 1& Exhibit 2 we get to know that 58% companies have been seeking help of consultancy for more
then 2 years , and 62% do take support from consultancy varying from monthly to biannually.
We can understand that not only the companies have been using the consultancy services ,but also utilizing them
on a regular interval. And this is possible only if the companies are happy/satisfied with the services of the
consultant. Well lets not jump to conclusion so soon ,as some more feedback from the survey has been
collected.
From Exhibit 3 we come to know that 78% of the clients have rated the consultant service to be from Good to
Very Good. And some of the reasons to achieve this are quick response time where 98% (Exhibit)of the
feedback says that the turn around time in from 24 hours to 48 hours. And to add onto this we also took
feedback regarding the coordination of the consultant staff with the client , in which the clients have rated the
factor to 96%(Exhibit 5) ranging fro very Good to Average.
This is a good indication of the clients being Very Happy with the consultant service. From Exhibit 6 and
Exhibit 7 we understand the 90% clients are happy and 94% of the clients would like to continue with the
services of the consultant.
Now for any person or company to go back to the same service or a simple straight rebuy process their would be
reason like monopoly or the service/good provided is good in a market with many players. And when we speak
on consultancy the latter is not true, hence the clients are definitely falling in for the good service provided by
the consultancy
Conclusion
The client relationship plays an important role in present circumstances. The client is the consumer whose needs
have to be met by the consultancy. The project revolves around the client and consultancy and their relations.
The main aspect of consultancy is to attend to the needs of client industries. In the study we already know that
the consultancies have managed to satisfy the clients but not delighted them, and left alone to say that a small
group is still not happy. Consultancy is a partnering organization of client. The existence of consultancy totally
depends upon the different types of clients. The consultancy while dealing with different clients has to shape
different types of attitude, so that it would suit the client’s position and status.
The consultancy has maintained the balance of supply chain there by the consultancy has come up to the
expectation of the clients who are happy with the consultancy and wanted to keep good relations.
The consultancy adheres to the turnaround time by the clients there by it keeps clients in good humor and
maintain cordial relations.

IJRCMEAS ISSN 2454-6593
191
Reference
A Study on Customer Relationship Management Practices in Selected Organized Retail Stores in Udaipur City
Dr. Meera Mathur Sumbul Samma Pacific Business Review - A Quarterly Refereed Journal
HOW TO IMPROVE A CRM STRATEGY Lluís G. Renart & Carles Cabré
A Reflective Paper on the Management Consultancy Project for Vegapalm Ltd By Kai Jiao
Tapan K. Panda(2011), marketing management , Himalaya publications .Mumbai.
CRM Best Practices: A case study Research on SBI, Kallol Das & Renuka Garg , Journal of
Marketing & Communication Jan-Apr 2011 Vol 6 Issue 3