ISSN 1816-353X (Print) Vol. 19, No. 6 (Nov. 2017) ISSN 1816 ...
Upload
khangminh22Category
view
1download
0
Scientific Papers Series Management, Economic Engineering in Agriculture and Rural Development Vol. 14, Issue 2, 2014 PRINT ISSN 2284-7995, E-ISSN 2285-3952
Volume 14, Issue 2/2014 PRINT ISSN 2284-7995
E-ISSN 2285-3952
SCIENTIFIC PAPERS
SERIES “MANAGEMENT, ECONOMIC ENGINEERING IN AGRICULTURE AND RURAL
DEVELOPMENT”
Scientific Papers Series “Management, Economic Engineering in Agriculture and Rural Development” PRINT ISSN 2284-7995, E-ISSN 2285-3952 Volume 14, Issue 2/2014 Copyright 2014 To be cited: Scientific Papers Series “Management, Economic Engineering in Agriculture and Rural Development”, Volume 14, Issue 2/2014 Publishers: University of Agricultural Sciences and Veterinary Medicine of Bucharest, Romania. Address: 59 Marasti, District 1, 011464, Bucharest, Romania, Phone: + 40213182564, Fax: +40213182888, www.managusamv.ro S.C. Editura Ceres S.A., Address:1 Piata Presei Libere, District 1, Bucharest, 013701, Phone/Fax: +40213179023, E-mail: [email protected] All rights reserved The publishers are not responsible for the content of the scientific papers and opinions published in the Volume. They represent the authors’ point of view.
EDITORIAL BOARD
Editor in Chief: Prof. Ph.D. Toma Adrian DINU Executive Editor: Prof. Ph.D. Agatha POPESCU
Members:
Prof. Ph.D. Ioan Nicolae ALECU, University of Agricultural Sciences and Veterinary Medicine, Bucharest, Romania Prof. Ph.D. Manea DRĂGHICI, University of Agricultural Sciences and Veterinary Medicine, Bucharest, Romania Prof. Ph.D. Mihai BERCA, University of Agricultural Sciences and Veterinary Medicine, Bucharest, Romania Prof. Ph.D. H.C. Miguel Moreno MILLAN, University of Cordoba, Spain Prof. Ph.D. Doc. Svend RASMUSSEN, University of Copenhagen, Denmark Prof. Ph.D. Mogens LUND, Institute of Food and Resource Economics, Denmark Prof. Ph.D. Pascal Anton OLTENACU, Oklahoma State University, United States of America Prof. Ph.D. Rangesan NARAYANAN, University of Nevada, United States of America Senior Lecturer Ph.D. Ove MADSEN, Grinsted Agricultural Academy, Denmark Ph.D. Patrick ANGEL, US Department of the Interior, Office of Surface Mining Appalachian Regional Office, U.S.A. Prof. Ph.D. Gerhard MOITZI, University of Natural Resources and Applied Life Sciences, Vienna, Austria Prof. Ph.D. Paolo GAJO, University of Florence, Italy Prof. Ph.D. Diego BEGALLI, University of Verona, Italy Ph.D. Alistair Mc CRACKEN, Agri-Food and Biosciences Institute, Belfast, United Kingdom Prof. Ph.D. Drago CVIJANOVIC, Institute of Agricultural Economics, Serbia Prof. Ph.D. Nebojsa RALEVIC, University of Belgrade, Serbia Ph.D. Jonel SUBIC, Institute of Agricultural Economics, Serbia Associate Professor Ph.D. Zuzana PALKOVA, Slovak University of Agriculture, Slovakia Acad. Prof. Ph.D. Hab. Pavel MOVILEANU, The Agricultural State University of Moldova, Republic of Moldova Senior Lecturer Ph.D. Veronica PRISĂCARU, The Agricultural State University of Moldova, Republic of Moldova Senior Lecturer Ph.D. Veronica MOVILEANU, The Agricultural State University of Moldova, Republic of Moldova Senior Lecturer Ph.D. Mariana DOGA-MIRZAC, Moldova State University, Republic of Moldova Associate Prof. Ph.D. Rashid SAEED, International Islamic University, Pakistan Dr. Adrian TUREK-RAHOVEANU, Research Institute for Agricultural Economy and Rural Development, Bucharest, Romania Prof. Ph.D. Emilian MERCE, University of Agricultural Sciences and Veterinary Medicine, Cluj-Napoca, Romania Prof. Ph.D. Gheorghe MUREȘAN, University of Agricultural Sciences and Veterinary Medicine, Cluj-Napoca, Romania Prof. Ph.D. Nicoleta MATEOC-SÎRB, University of Agricultural Sciences and Veterinary Medicine of Banat, Romania Prof. Ph.D. Ion DONA, University of Agricultural Sciences and Veterinary Medicine, Bucharest, Romania Prof.Ph.D. Elena STOIAN, University of Agricultural Sciences and Veterinary Medicine, Bucharest, Romania Senior Lecturer Ph.D. Silviu BECIU, University of Agricultural Sciences and Veterinary Medicine, Bucharest, Romania Senior Lecturer Ph.D. Radu Lucian PÂNZARU, University of Craiova, Romania Senior Lecturer Ph.D. Gavrilă ȘTEFAN, University of Agricultural Sciences and Veterinary Medicine, Iasi, Romania Prof. Ph.D. Vasile GOSA, University of Agricultural Sciences and Veterinary Medicine of Banat Timisoara Senior Lecturer Ph.D. Tiberiu IANCU, University of Agricultural Sciences and Veterinary Medicine of Banat Timisoara Senior Lecturer Ph.D. Ioan BRAD, University of Agricultural Sciences and Veterinary Medicine of Banat Timisoara
Publication Committee:
Ph.D. Mariana Burcea, Eng. Teodora Popescu This volume includes the scientific papers presented at the International Conference “Agriculture for Life, Life for Agriculture”, June 5-7, 2014, University of Agricultural Sciences and Veterinary Medicine, Bucharest, Romania, Section 7:Management and Engineering in Rural Areas, Topics: Production economics, Farm management and marketing, Agricultural policies, Agribusiness and agricultural extension, Agritourism and Rural development, Environmental economics, Educational management in agronomic education and other connected areas.

1
Scientific Papers Series “Management, Economic Engineering in Agriculture and Rural Development“ Volume 14, Issue 2/2014 PRINT ISSN 2284-7995, E-ISSN 2285-3952
C O N T E N T S
1.AN ECONOMIC STUDY OF ESTIMATING COST FUNCTION DATES PRODUCTION IN MURZUQ, SOUTHWESTERN LIBYA Ahmad ARIDAH, F. SHALOOF..................................................................................... 2.HONEY BEE COLONY COLLAPSE DISORDER (Apis mellifera L.) - POSSIBLE CAUSES Bojana BEKIĆ, Marko JELOČNIK, Jonel SUBIĆ...................................................... 3.RESEARCH ON THE RELATION MANAGEMENT BETWEEN ROOTS AND SOIL UNDER CLIMATIC STRESS CONDITIONS IN PREMIUM WHEAT CROP Mihai BERCA, Roxana HOROIAŞ................................................................................ 4.STUDIES ON SYSTEM INFLUENCE IRRIGATED AND NON-IRRIGATED LAND MANAGING DIFFERENT DOSES OF NP, ON THE EXTENT OF ACCOMPLISHMENTS PHYSIOLOGICAL HYBRID MAIZE OITUZ Ion BOZGĂ, Olimpia PANDIA, Ion SĂRĂCIN, Daniel NIJLOVEANU ................. 5.VALINE - ISOLEUCINE AND LEUCINE THREE AMINO ACIDS ESSENTIAL FOR BODIES IN THE CORN CARYOPSIS Ion BOZGĂ, Olimpia PANDIA, Ion SĂRĂCIN, Daniel NIJLOVEANU.................. 6.PARTICULARITIES OF THE ORGANIZATIONAL CULTURE IN THE HIGHER EDUCATION ESTABLISHMENTS IN ROMANIA Alexandra Patricia BRAICA ……………………………………………………….…. 7.PRODUCTION MANAGEMENT AND BUSINESS PERFORMANCE IN AGRI-FOOD INDUSTRY FROM IAȘI COUNTY-ROMANIA Stejărel BREZULEANU................................................................................................. 8.MANAGEMENT- KEY PLAYER OR EXECUTIVE POWER OF AN ENTITY IN RURAL AREA IN THE TRANSITION PROCESS Ion CERTAN, Maria BANARI....................................................................................... 9.AGRICULTURE AND RURAL DEVELOPMENT IN ASSOCIATION AGREEMENT BETWEEN THE EUROPEAN UNION AND THE REPUBLIC OF MOLDOVA Simion CERTAN, Ion CERTAN..................................................................................... 10.RESEARCH GATE SCORE AS AN ASSESSMENT TOOL OF THE STAFF PERFORMANCE IN RESEARCH INSTITUTIONS FROM REPUBLIC OF MOLDOVA Dragoş CIMPOIEŞ, Adrian SÎRBU................................................................................ 11.GENERAL ASPECTS OF THE AGRO-CLIMATOLOGIC POTENTIAL IN MUNTENIA REGION Elena COFAS, Dana Maria (Oprea) CONSTANTIN, Iuliana ZAHARIA ................
7
13
19
27
31
35
41
47
55
63
67

2
12.ANALYSIS OF THE MAIN CLIMATIC FACTORS AND THEIR IMPACT ON CROP PRODUCTION Elena COFAS, Dana Maria (Oprea) CONSTANTIN, Iuliana ZAHARIA ................ 13.ACCOUNTING AND TAXATION ASPECTS REGARDING THE DEPRECIATION OF FIXED ASSETS IN THE AGRI-FOOD ENTERPRISES OF THE REPUBLIC OF MOLDOVA Vadim COJOCARI, Tatiana COJOCARI....................................................................... 14.SUPPLY CHAINS IN AGRICULTURE AND FOOD PRODUCTION Liliana CONDRAȚCHI................................................................................................... 15.COMPETITIVENESS ANALYSIS OF THE REPUBLIC OF MOLDOVA BY MEANS OF EFFICIENCY INDICATORS OF FOREIGN TRADE WITH AGRICULTURAL FOOD PRODUCTS Boris COREŢCHI, Olga SÂRBU, Elena MOROI........................................................ 16.RESEARCHES REGARDING WINE AS AGROTOURISTIC RESOURCE CASE STUDY: "BUDUREASCA" Romeo Cătălin CREŢU, Petrică ŞTEFAN, Sorin BIBICIOIU................................... 17.KNOWLEDGE OF POTENTIAL/ACCESSIBILITY OF FINANCIAL CREDITS IN RURAL AREAS IN OLT COUNTY Corina CRUCERU........................................................................................................... 18.HEAVY METAL POLLUTION OF SOME COMPONENTS OF FLAVOURED WINES, NAMELY THE WINE VARIETIES AND HYDROALCOHOLIC MACERATES FROM PLANTS Rodica Elena CULEA, Radiana TAMBA-BEREHOIU, Stela POPESCU, Ciprian–Nicolae POPA.................................................................................................... 19.STUDY REGARDING CONSUMPTION OF ORGANIC PRODUCTS IN ROMANIA Toma Adrian DINU, Elena STOIAN, Marius Mihai MICU, Reta CONDEI, Ioana NICULAE............................................................................................................... 20.ANALYSIS OF TOP DESTINATIONS IN TOURISM, ACCORDING TO VOLUME OF RECEIPTS DURING 2001-2011 Alexandru FÎNTÎNERU, Gina FÎNTÎNERU, Dragoș-Ion SMEDESCU.................... 21.THE MACROECONOMIC IMPACT OF ROMANIAN TOURISM Alexandru FÎNTÎNERU, Gina FÎNTÎNERU, Dragoș-Ion SMEDESCU.................... 22.GENDER MAIN STREAMING IN WATER SUPPLY AND SANITATION PROJECTS Simona FRONE, Dumitru Florin FRONE..................................................................... 23.THE INCREASING OF COMPETITIVENESS OF HIGH VALUE ADDED HORTICULTURAL PRODUCTION IN THE CONTEXT OF THE ECONOMIC GROWTH OF THE REPUBLIC OF MOLDOVA Artur GOLBAN................................................................................................................
71
77
81
89
99
105
109
113
119
123
127
133

3
24.MODERNIZATION OF WINE SECTOR IN THE CONTEXT OF INNOVATIVE ECONOMY Tatiana IAŢIŞIN, Tatiana COLESNICOVA, Aurelia ŞUŞU-ŢURCAN.................... 25.ADVANCED STUDIES ON IMPROVING SHEEP FERTILITY BY USING ARTIFICIAL MEANS OF REPRODUCTION Mostafa A.R.IBRAHIM, Stela ZAMFIRESCU, Andreea ANGHEL, Nicu DOBRIN, Ibrahim ABDELRAZEK, Mohamed E. El-SHARAWY, El Shenawy El SEIFY, Dorina MOCUTA...................................................................... 26.CONSERVATIVE CULTIVATION TECHNOLOGIES – A NEW CHALLENGE FOR THE AGRICULTURE OF THE REPUBLIC OF MOLDOVA Anatolie IGNAT, Victor MOROZ.................................................................................. 27.BERCENI VILLAGE - A SOCIAL-ECONOMICAL ANALYSIS Adina IORGA .................................................................................................................. 28.RURAL LABOR FORCE SIZE AND STRUCTURE ANALYSIS Adina IORGA, Elena TOMA, Carina DOBRE, Alexandra MUSCĂNESCU.......... 29.EFFECTS OF DEMONSTRATION AND LECTURE METHODS OF TEACHING APICULTURE ON PERFORMANCE OF AGRIC STUDENTS IN ADAMAWA STATE UNIVERSITY, NIGERIA Muhammad Rabi’u JA'AFAR-FURO, Yusuf ABDULLAHI, Buba Enoch BADGAL..................................................................................................... 30.DYNAMICS OF POVERTY, DEFORESTATION AND BEEKEEPING IN NORTHERN NIGERIA: CONCERNS FOR POLICYMAKERS – Part I Muhammad Rabi’u JA’AFAR-FURO........................................................................... 31.ANALYSIS OF THE FACTORS AFFECTING EFFECTIVENESS OF RANGELAND-DEPENDENT DAIRY CATTLE FARMS IN ERZURUM PROVINCE Abdurrahman KARA, Semiha KIZILOĞLU................................................................ 32.STUDY ON SUSTAINABLE DEVELOPMENT TRENDS OF ROMANIA AGRICULTURE Ioana NICULAE, Georgiana Melania COSTAICHE, Reta CONDEI........................ 33.ANALYSIS OF THE TRAINING NEEDS IN RENEWABLE ENERGY SOURCES FOR AGRICULTURAL SECTOR Zuzana PALKOVA, Ioannis HATZILYGEROUDIS, Sorin IONITESCU................ 34.STUDIES OF THE POSSIBILITY OF OBTAINING ECOLOGICALLY BASED CREAM CAPSAICIN IN THE TREATMENT OF RHEUMATIC Olimpia PANDIA, Ion SĂRĂCIN, Ion BOZGĂ, Daniel NIJLOVEANU...................................................................................................... 35.SECTION FOR THE SEEDLING PLANTING MACHINE IN NUTRITIVE POTS Olimpia PANDIA, Ion SĂRĂCIN, Ion BOZGĂ, Daniel NIJLOVEANU................... 36.EVOLUTION AND TRENDS IN TRADE IN AGRICULTURAL PRODUCTS Daniela POPA....................................................................................................................
141
147
159
165
169
173
179
187
195
201
207
211
215

4
37.RESEARCH ON MILK COST, RETURN AND PROFITABILITY IN DAIRY FARMING Agatha POPESCU............................................................................................................ 38.RESEARCH ON PROFIT VARIATION DEPENDING ON MARKETED MILK AND PRODUCTION COST IN DAIRY FARMING Agatha POPESCU........................................................................................................... 39.DIRECT PUBLICITY – ONE OF THE MOST MODERN METHOD FOR PROMOTION Liliana POPESCU............................................................................................................ 40.EMPLOYMENT DIFFICULTIES EXPERIENCED BY YOUNG PEOPLE IN THE RURAL AREAS OF THE REPUBLIC OF MOLDOVA Veronica PRISĂCARU, Tatiana SEVCIUC.................................................................. 41.THE ROLE OF ORGANIC AGRICULTURE IN THE CONSERVATION OF GENETIC RESOURCES AND INCREASING AGRODIVERSITY Svetlana ROLJEVIC, Predrag VUKOVIC, Biljana GRUJIC................................................. 42.GROUNDWATER QUALITY AND ITS SUITABILITY FOR DRINKING AND AGRICULTURAL USE IN A RURAL AREA FROM CLUJ COUNTY (FLORESTI VILLAGE) Cristina ROSU, Ioana PISTEA, Carmen ROBA, Monica NES, Alexandru OZUNU....................................................................................................... 43.EVALUATION OF SALES VALUE OF OBJECT TAX ON LAND AND BUILDINGS Titin RULIANA ………………………………………………………………………. 44.UNIFORM FARM OPERATIONS (UFO) ON HEMP BROOM RAPE SEED GERMINATION BY BIOLOGICAL CONTROL MANAGEMENT IN IRAN Behzad SANI,Vida JODAIAN ………………………………………………………… 45.PARTICULARITIES OF COMMUNICATION IN RURAL TOURISM Svetlana SASU, Svetlana DARII..................................................................................... 46.OPPORTUNITIES AND CHALLENGES OF THE DEVELOPMENT OF SMALL AND MEDIUM ENTERPRISES IN THE AGRICULTURAL SECTOR FROM THE REPUBLIC OF MOLDOVA Olga SÂRBU, Boris COREŢCHI................................................................................... 47.SOME ASPECTS CONCERNING THE ACCOUNTING OF THE SUBSIDIES AWARDED TO AGRICULTURAL ENTITIES Tatiana ŞEVCIUC, Veronica PRISĂCARU....................../........................................... 48.THE ACCOUNTING OF THE PLEDGED ASSETS PASSED TO THE LICENSED BANKS FROM THE REPUBLIC OF MOLDOVA FOR THE REPAYMENT OF THE GRANTED LOAN Tatiana ŞEVCIUC............................................................................................................
219
223
231
235
241
247
253
257
261
265
273
281
5
49.THE USE OF CAPITAL AND CONDITION OF ECONOMICALLY WEAK FARMS IN THE SELECTED CENTRAL AND EASTERN EUROPEAN COUNTRIES Aldona SKARŻYŃSKA, Irena AUGUSTYŃSKA-GRZYMEK, Łukasz ABRAMCZUK................................................................................................... 50.NEW APPROACHES CONCERNING THE DEVELOPMENT OF THE ECOTOURISM IN ROMANIA Petrică ŞTEFAN, Silviu GHEORGHE, Cristian CUTAŞ........................................... 51.THE METHODOLOGY OF DEVELOPING VALUE INDICATORS TO INTEGRALLY ASSESS RESOURCE POTENTIAL IN AGRICULTURAL UNITS Elena TIMOFTI............................................................................................................. 52.ANALYSIS REGARDING THE THEORETICAL KNOWLEDGE OF MANAGEMENT HELD BY RURAL ENTREPRENEURS IN SOUTH-WEST OLTENIA REGION Victor TIŢA ..................................................................................................................... 53.INNOVATION POLICY IN AGRICULTURE AND RURAL DEVELOPMENT OF THE EUROPEAN UNION: PROSPECTS FOR THE REPUBLIC OF MOLDOVA Liudmila TODOROVA, Olga SÂRBU........................................................................... 54.IMPORTANCE OF ECONOMIC KNOWLEDGE TRANSFER FOR SUPPORTING OF TOTAL ABSORTION GRANTS BY SEMI SUBSISTENCE FARMS Camelia TOMA, Crina TURTOI, Camelia GAVRILESCU..................................... 55.QUALITY - SOCIAL ACCOUNTABILITY - HEALTH AND SAFETY INTEGRATED MANAGEMENT SYSTEM AUDIT ACCORDING TO THE REQUIREMENTS OF ISO9001:2008, SA 8000:2008, OHSAS 18001:2007 AND ISO 19011:2011 STANDARDS Valentina TUDOR, Romeo DENUNTZIO, Ioan Niculae ALECU, Marius Mihai MICU, Georgeta TEMOCICO, Reta CONDEI.................................. 56.STATISTICAL INDICATORS FOR MONITORING IMPLEMENTATION OF ENVIRONMENTAL MEASURES Crina TURTOI, Camelia TOMA, Camelia GAVRILESCU........................................
285
297
303
307
311
317
325
331

6

Scientific Papers Series Management, Economic Engineering in Agriculture and Rural Development Vol. 14, Issue 2, 2014 PRINT ISSN 2284-7995, E-ISSN 2285-3952
7
AN ECONOMIC STUDY OF ESTIMATING COST FUNCTION DATES PRODUCTION IN MURZUQ, SOUTHWESTERN LIBYA Ahmad ARIDAH1, F. SHALOOF2 1 Sebha University, Faculty of Agriculture, Libya, PO Box 18758, Sebha, Libyan Arab Jamahiriya, Phone:+218 (71) 626 012, Fax: +218 (71) 627 019, Email:[email protected] 2 Omar Almukhtar University, Faculty of Agriculture, Libya, P.O.Box 991, Al-Bayda, Libya, Phone: +(218-84) 63 29 63, Fax: +(218-84) 63 22 33 Corresponding author: [email protected] Abstract The results showed that fixed cost represented (41) of the total cost of Murzuq, also the variable cost amounted to approximately (59) the total cost of Murzuq, and that the optimal size of the production of dates amounted to approximately (2.01) tons per hectare for Murzuq ,and that production was more than the average actual production of dates for the Murzuq by nearly (0.37) tons per hectare , while reported results that the production that maximize profit of dates have hit (4.25) tons per hectare for Murzuq, , and for community sample as a whole and that production is more than the actual production of dates by (2.61) tons per hectare. It also showed the results of the field study that the average price per ton of harvest dates had been hit (1293.50) dinars for the total sample respectively. Key words: cost function, economic study, production, South Western Lybia INTRODUCTION Dates are a nourishing food that can be preserved, stored, and carried easily over long distances, especially in dry climates. The date palm is one of the oldest plants cultivated by human beings and has been used as food for 6000 years (Hamidi-Esfahani, 2011, p. p.101). Date palms also provide a suitable place for the settling of nomadic people by creating shade and giving protection against desert winds. Dates are a particularly important product in arid and semi-arid regions of the world and play an important role in the economic and political life of the people in Islamic regions. Many products, including date syrup, alcohol, animal feed, date powder, different types of bread, marmalade, sweet candy, chocolate, date paste, and others, can be produced from dates. Not only does the date palm have an important role in the ecosystem of the desert, but it also has several agricultural and animal husbandry uses. Other parts of the date palm are also important in the agricultural economy in Arabic countries. For example, the trunk is used for making boats, covering the roofs of rural houses, paper and
wood industries, and making fiber. The foliage is also used for making handicrafts like fans and straw hats (Hamidi-Esfahani, 2011, p. p.101). There are many environmental advantages to planting date palm trees. Previous studies have shown that date palms have the ability to create an environmental balance in many Arab countries, including, Libya. Firstly, they play a significant role in the fight against desertification; they also contribute to the appearance of rural communities (Sharif, 2010). Moreover, date palm trees that are established as forests and oases in desert areas lead to reduced temperatures, and limit the movement of sand dunes in coastal cities. This helps combat climate change (Hussen, 2010; Khairi, 2010; Sharif, 2010). Palm trees can be grown in areas that use less water particularly in the areas of desert and semi-desert in North African countries. Palm trees only need small amounts of water compared to other plants (Sharif, 2010). Palm fibers can be used in industry as an alternative to plastic materials due to rapid decomposition this also helps preserve the environment (Abu-Sharkh & Hamid, 2004). Finally, date palms can

Scientific Papers Series Management, Economic Engineering in Agriculture and Rural Development Vol. 14, Issue 2, 2014 PRINT ISSN 2284-7995, E-ISSN 2285-3952
8
grow in different soil types, because they can bear high salt concentration. For example , Jordan has reduced the problem of heavy metal pollution in urban areas by cultivating palm trees on road shoulders and in industrial and residential areas (Al-Khlaifat & Al-Khashman, 2007). In Libya, the presence of palm trees indicates the existence of ground water in that region. Cultivation of palm trees in many areas of Libya occurs because they can withstand adverse environmental conditions. There are palm trees in the coastal areas and scattered oases also on the Libyan desert (Edongali & Aboqilh, 2005). MATERIALS AND METHODS Date palm trees are most plentiful in the interior oases of Libya. Date palms are tolerant of harsh environmental conditions as they have the ability to withstand high temperatures, drought and salinity (Ali, 2010). Despite available environmental conditions, the production of date palm farms has remained low and productivity has also been variable (El-Juhany 2010). The production of dates increased to 7.17 tons/hectare in 2002. However, there was a decrease in date production in 2005, about to 5.97 tons/hectare (FAOSTAT, 2010). The aims of this study are to: 1. To determine the productivity costs of date palm Murzuq region. 2. To assess the relationship between inputs and outputs, the cost factors used in production of dates in Murzuq South Libya. 3. To assess the efficient use of those factors in the amount produced by estimating the optimal size, size bulks for-profit and different averages of actual production of dates for optimal counterpart. 4. To assess the impact of the costs of the production of dates on the net return. Description of the study population (date farmers) and the selection of the sample: This study was conducted in the area of Murzuq in Southwestern Libya. There are many private date palm farms, oases and some government projects interested in production of dates in this area.
The sample was selected by using simple random sampling to give units equal probability of being included in the sample (Dorofeev, 2006; Thompson, 2002). A large sample provides more information than a small sample, so, statistics from a large sample size can reduce sampling errors. According to Avauda (1994), a small sample size needs to be at least 30 samples, but large sample size has to at least 100 samples (AL- Faidi, 1994) . In this study 1.5 per cent of the total farms, estimated at about 3619 (Minister of Agriculture in Murzuq, Libya, 2007, farms (Statistics, 2007), was sampled. Thus, a total of 53 farms were selected for the study from Murzuq. Data was collected between April 2007 and November 2007 from farmers in the study area. RESULTS AND DISCUSSIONS Economic indicators for farmer’s dates sample study The results of the field study show that the date crop production costs in Murzuq consist of fixed and variable costs which can be analyzed a compared as follows: Fixed costs Fixed costs for palm plantations sample study did not include investment costs that were paid on those farms since their inception, but were limited only to leased land ,labor costs and depreciation of farm equipment, given that these investments are donated from the Libyan government to achieve the benefits in the study area. The fixed costs do not change the volume of yield and include ground rent, labor and depreciation of farm equipment (McTaggart, Parkin, Parkin, & Findlay, 2006). The employees are family settled and who agricultural operations that serve the crop of dates, they estimated about 223766.90 dinars per sample farms in Murzuq. Data also showed that the highest item of fixed costs is the value of the agricultural equipment, about 93982.10 thousand dinars per farmer in the sample an estimated (42%) of the total fixed costs. The value of the fixed cost of labor was about 71605.4 dinars per farmer in the sample (an

Scientific Papers Series Management, Economic Engineering in Agriculture and Rural Development Vol. 14, Issue 2, 2014 PRINT ISSN 2284-7995, E-ISSN 2285-3952
9
estimated 32%) of the total costs. The cost of rent was about 58179.40 dinars (an estimated 26%) of the total fixed costs in the areas mentioned.
Table 1. Average Fixed costs for farms in Murzuq Items Costs %
Agricultural equipment 93982.10 42
Labor 71605.40 32
Rent 58179.40 26
Total 223766.90 100
Source: - collected and calculated from questionnaire from field for the study sample. Variable costs Variable costs are costs that vary with the amount of production and are equal to zero in the absence of production (Horngren, Datar, & Foster 2005), variable costs include: the value of seedlings, organic fertilizers, chemical pesticides, irrigation, pruning, and employment. They are estimated about million and 322006.12 dinars in Murzuq. As it turns out that the total variable costs in the average farm in Murzuq has been estimated at about 6192.4 dinars. The relative importance of each of the fixed and variable costs to Total costs Total overall costs of sample farms amounted to about 545773 dinars distributed to 223766.90 dinars for the total fixed costs, representing about 41 % of the total overall costs farms in Murzuq. While the variable costs estimated about 322006.12 thousand, representing about 59 % of the total overall costs for each of the farms in Murzuq.
Table 2. Average fixed and variable costs in Murzuq Items Costs %
Fixed costs 223766.90 41 Variable costs 322006.12 59
Total 545773 100 Source: - collected and calculated from questionnaire from field for the study sample.
Average costs The average estimate total costs for the harvest dates, average cost per ton, the average total cost of the space, farm and tree as shown in Table 3.
Revenue per season crop for the production of dates in Murzuq
Total revenue farm is a value farm production is the result of multiplying the quantity produced in the unit price of production, value of the total output farm are one of the indicators of the profitability of farm, especially, the total output is high, measured total output the number of units of the product but, this measure varies from one farm to another, where each farmer trying to get high profits by using modern methods either increase the size of the output or reduce costs even more than the value of the return. Average production per hectare and per farm The average productivity per hectare of crop dates in the field study amounted to about 1.64 tons per hectare. Results, also showed that production by a single farm of dates on average was estimated about 12.34 tons, as shown in Table (4) below.
Table 3. Total overall costs, cultivated area of dates, average total costs per hectare and tree in Murzuq (2007-2008)
Data Average costs
Units
Total overall costs 545773 Dinars Total area 392 .00 0 Hectares
Average cost of production
1392.27 Hectare /Dinars
Number of sample farms 52.000 FarmsTotal production 641.50 Tons Average cost of
production 850.70 Ton/
Dinars Average cost of
production of farm 10493.6 Dinars
Average size of each farm
7.5400 Hectares
Average number of trees 108.00 Hectare Number of fruit palm
trees for the farm 814.00 Trees
Average cost of production of the tree
12.890 Dinars
Source: - collected and calculated from questionnaire from field for the study sample.
The results showed the field study, which surveyed a sample level as a whole that the amount of production of dates amounted to about 641.50 tons (Table 4).

Scientific Papers Series Management, Economic Engineering in Agriculture and Rural Development Vol. 14, Issue 2, 2014 PRINT ISSN 2284-7995, E-ISSN 2285-3952
10
Table 4. Total production, average productivity per hectare and farm production for dates in Murzuq (2007-2008)
Data Average Units Total production 641. 00 Tons
Total area 392. 00 Hectares Average of production 1.64.00 Tons
/Hectares Number of trees 814.00 Tree Number of farm 52.00 Farm
Average of production of farm
12.34 Tons
Average production of trees
15.16 kg
Source: - collected and calculated from questionnaire from field for the study sample.
While the total revenue nearly 830 thousand dinars farms in Murzuq. The averages, total revenue from the crop of dates per ton to hectares and tree farm and in addition to net earnings are set out in Table 5. Return on invested dinar of the crop of dates per hectare, tonne farm and tree Table 5. Production, costs, revenues and averages samples farms dates in Murzuq (2007-2008)
Data Average Units Average Area cultivated 392.00 Hectares
Average productivity 1.6365 Tons/ Hectares Average cost 850.70 Dinars/Ton Selling price 1293.50 Ton
Average net return 442.800 Dinars/Ton Production of dates 641.500 Tons
Average cost 1392.20 Hectares Average revenue 2116.81 Dinars/Hectare
Average net returns 724.61.0 Dinars/Hectare Average farm production 12.34 .00 Tons
Average cost of production of farm
10495.60 Dinars
Average farm income 15961.79 Dinars Average net revenue (revenue) of the farm
5466.19 Dinars
Average production kg/tree
15.16.00 Kg
Average cost of production of the tree
12.89.00 Dinars
Average revenue tree 19.61.00 DinarsAverage net revenue of
the tree 6.72.00 Dinars
Source: - collected and calculated from questionnaire from field for the study sample.
Estimated return on invested dinar (dinar return date production costs) by dividing the average net return on average total overall costs (Table 6) where the return on invested
dinar of dates per hectare, per tonne and a farm about 0.52 in Murzuq.
Table 6. Net earnings and return on invested dinar for sample dates production farms in Murzuq (2007-2008)
Data Average Units Average net returns
dinars 724.50 Hectare
Average total overall costs
1392.20 Dinars/Hectare
Return on invested 0.52.00 Dinars/Hectare Average net returns 442.80 Dinars/Ton
Average total overall costs
850.70 Dinars/Ton
Return on invested 0.52 .0 Dinars/Ton Average net returns for
the farm 5466.19 Dinars
Average total cost of the farm
10495.60 Dinars
Return on invested dinar for farm
0.52 .00 Dinars
Average net returns tree 6.72.00 Dinars Average cost of
production of the tree 12.890 Dinars
Return on invested dinar for tree
0.52.0 Dinars
Source: - collected and calculated from questionnaire from field for the study sample.
Statistical estimate of date’s production costs function in Murzuq Input and output functions costs The dependent variable (TC) represents the total cost for the harvest dates of hectares, dinar. Independent variable (Y) represents the amount of estimated production of the crop of dates in tons per hectare. Functions production costs were estimated in linear, quadratic and cubic forms, by using all values representing the relationship between the total costs Libyan Dinars and productivity of dates in tons per hectare in (2007-2008). Selecting analyzing, presenting the best economically and statistically, the following presentation of the results of statistical estimates of production cost function dates: Statistical estimate of date’s production costs functions in Murzuq
Estimate functions total costs of production farms harvest dates in Murzuq and selecting between various forms (linear, quadratic and cubic). The result shows that the best from the standpoint of statistical and economic is the squared cost function, based on the value of

Scientific Papers Series Management, Economic Engineering in Agriculture and Rural Development Vol. 14, Issue 2, 2014 PRINT ISSN 2284-7995, E-ISSN 2285-3952
11
the coefficient of determination rate (R2) ,test value (F) and (t) ,as described equation (1) the following: TC1 = 989.97-784.66Y1 + 244.317Y2 1 ... (1) (2.2) (-5.08) ** (2.19) ** F =39.38 R2 =0.60 DW = 2.13 N =52 TC1 = represents the total estimated total costs per hectare farm in Murzuq. Y1 = represents the amount of crop production dates, tons per hectare in sample farms in Murzuq (linear form). Y2 1= represents the amount of crop production dates in tons per hectare in sample farms in Murzuq (quadratic form). Figures in parentheses represent values t, ** statistically significant at the level of significance 0.01. * Statistically significant at the 0.05 level of significance. Show of the equation achieve significant (significance) statistical estimates obtained, indicates the value (F) calculated to moral model to express the relationship between the dependent and independent variables, the value indicates the coefficient of determination rate R2 about 60 % of changes in the overall costs of production per hectare of this region explained by changes in production per hectare of dates from one farm to another, the remaining 40% refers to other variables. The functions can be derived marginal costs and the middle of the equation (1) as follows:
ATC1 = -784.66+ 989.97/Y1 + 244.31Y1 ... (2)
MC1 = -784.66+ 488.63Y1 ………........... (3)
When total costs average functions (ATC1) per hectare Equality to equation (2) marginal cost functions (MC1) equation (3). it can get on the amount of productivity best achieved than the lowest point on trend average total costs to date producers in the region, and that the optimal size of the production of dates amounted to approximately (2.01) tons per hectare for Murzuq, while the average productivity of the crop of dates in this region around 1.63tons per hectare less than the average actual production of dates for the Murzuq by nearly (0.37) tons per hectare, as
seen there are nine farmers only achieved the optimal size of dates. Through equality marginal costs function equation (3) with an average price production hectare about (1293.5) dinars per ton (assuming a constant price, crop is sold in the market fully competition), it is possible to obtain the production that maximize profit of dates have (4.25) tons per hectare for Murzuq, and for community sample as a whole and that production is more than the actual production of dates by (2.61) tons per hectare, there are also only seven farmers was reached to maximize profit of dates and low cost . CONCLUSIONS Results that have been obtained by descriptive and quantitative statistics from the questionnaire of date palms farmers in Murzuq, can provide some recommendations that may contribute to reducing the costs of production of dates in that region as following: 1.To provide inputs to farmers for example, pesticides and fertilization. Prices have increased significantly after adjusting the Libyan dinar exchange rate against foreign currencies, where they have had a negative impact on production costs. 2.To activate and expand the role of agricultural extension in Murzuq region to develop plans and possible solutions to avoid the problems of production costs more by encouraging farmers to grow varieties of date palms that cost less and are appropriate for the environment. 3.Establishment of a database for costs of production and income to improve the agricultural sector. This would lead to improved production and food security. 4.Encouraging economic studies to provide a baseline for database-related studies and research in date palm production, which will help researchers and authorities in applying field studies. REFERENCES [1] Abu-Sharkh, B., Hamid, H., 2004, Degradation study of date palm fibre/polypropylene composites in natural and artificial weathering: mechanical and

Scientific Papers Series Management, Economic Engineering in Agriculture and Rural Development Vol. 14, Issue 2, 2014 PRINT ISSN 2284-7995, E-ISSN 2285-3952
12
thermal analysis. Polymer Degradation and Stability, 85(3), 967-973. [2]Al-Khlaifat, A. L., Al-Khashman, O. A., 2007, Atmospheric heavy metal pollution in Aqaba city, Jordan, using Phoenix dactylifera L. leaves. Atmospheric Environment, 41(39), 8891-8897. doi: 10.1016/j.atmosenv.2007.08.028 [3]Ali, H. G., 2010, Development of Date Palm Cultivation and Its Role in Sustainability of Agriculture in Oman. Paper presented at the Proceedings of the Fourth International Date Palm Conference, Abu Dhabi, United Arab Emirates. [4]AL-Faidi, M. A., 1994, Research Methods and Social Sciences ( Applications on the Rural Community). El-beida-Libya: Omare Al- Mukhtar University. [5]Dorofeev, S., 2006, Statistics for real-life sample surveys : non-simple-random samples and weighted data / Sergey Dorofeev and Peter Grant.: Cambridge : Cambridge University Press [6]Edongali, E. A., Aboqilh, O., 2005, The economic implications of infection dates (the central region and Southern Libya ). Egyption journal of applied sciences, 20(11), 528-537. [7]FAOSTAT, F., 2010, Statistical Databases: Food and Agriculture Organization of the United Nations: Rome, Italy. [8]Hamidi-Esfahani, Z. A. a. Z., 2011, Date and Date Processing: A Review. Food Reviews International, 27(2), 101–133. doi: 10.1080/87559129.2010.535231 [9]Hussen, A., 2010, Potential of Date Palm Plantation in Afar Region, Ethiopia and Its Market. [10]Horngren, C. Datar. S, Foster,G., 2005, Cost Accounting: Pearson Education Australia. [11]Khairi, E., Bashab, 2010, The Status of Date Palm Cultivation and Date Production in Sudan. Paper presented at the Proceedings of the Fourth International Date Palm Conference, Abu Dhabi, United Arab Emirates. [12]McTaggart, D. F., Parkin, M. T. F., Parkin, M., Findlay, C. C., 2006, Microeconomics + MyEconLab: Pearson Education Australia. [13]Minister of Agriculture in Murzuq, Libya, 2007. [14]Sharif, S. a. T. , 2010, The Date Palm and Its Role in Reducing Soil Salinity and Global WarmingPaper presented at the Proceedings of the Forth International Date Palm Conference, Abu Dhabi,United Arab Emirates. [15]Statistics, L., 2007, Atlas of the Final Results of the agricultural census in Libya. Tripoli - Libya. [16]Thompson, S. K., 2002, Sampling Second Edition. Canada.

Scientific Papers Series Management, Economic Engineering in Agriculture and Rural Development Vol. 14, Issue 2, 2014 PRINT ISSN 2284-7995, E-ISSN 2285-3952
13
HONEY BEE COLONY COLLAPSE DISORDER (Apis mellifera L.) - POSSIBLE CAUSES Bojana BEKIĆ, Marko JELOČNIK, Jonel SUBIĆ Institute of Agricultural Economics, Volgina 15, Belgrade, Serbia, Phone/Fax: +381 11 6972 858, E-mails: [email protected] ; [email protected] ; [email protected] Corresponding author: [email protected] Abstract Honey bee (Apis mellifera L.) is the most studied insect pollinator in the world, due to its extremely important role in the plant reproduction. More than 80% of agricultural crops in the world are being pollinated by the honey bee. Prior to appearance of CCD syndrome, i.e. syndrome of Colony Collapse Disorder of honey bee colonies, bees have been disappeared en masse. Since the late 60’s of the XIX century, there were about twenty recorded cases of large honey bee colony loses, caused by various diseases. However, since 2006, the phenomenon never seen before in the world appeared which was called CCD syndrome. The difference between this „disease” and previous cases of honey bee disappearances lies in the fact that there are no dead bees as evidence of disease. Beekeepers find empty, abandoned hives with only queen bee, brood and very small number of adult workers, where the largest part of worker bees had left the colony. There is a lot of food, honey and pollen, left in the hive. Mentioned syndrome was firstly appeared in the USA, where, for only one week, certain number of large beekeepers reported losses of 50-90% of their bee colonies. Soon, syndrome was noticed in Europe, where in many countries larger disappearance of honey bees were reported. Exact cause of CCD syndrome appearance is not known, but assumptions include individual impact of more factors or, more likely, their synergistic effect. Hypothesis related to causes of mentioned syndrome include the impact of traditional honey bee diseases caused by varroa mites and other parasites, excessive pesticides consumption in agricultural production, genetically modified organisms, electromagnetic radiation, poor honey bee nutrition, crops growing in monoculture and biodiversity loss. Nowadays, a number of researchers think that it is a synergy of many factors, so that the bees as a bio-indicator reflect current state of environment in the world. Economic estimations of damages caused by potential disappearance of this species count billions dollar, where the consequences do not consider just monetary loss, but the impact on agro food safety of the world population. Key words: causes, CCD syndrome, honey bee, synergistic effect of factors INTRODUCTION The most important role of bees in the nature is plant pollination which provides the reproduction continuity of plant species and by that functioning of ecosystems. Of all bee species (about 20,000 species are known today), honey bee (Apis mellifera L.) is the most important pollinator of crops in the world. This species, studied more than any other insect pollinator in the world, provides ecosystem service of enormous significance, for crops and wild plant species in nature. In Europe, about 84% of agricultural crops are being pollinated by insects among which honey bee is dominant. From 127 main agricultural crops about 70% is being pollinated by insects. In USA, bees are responsible for 1/3 of produced food. It is estimated that each year in America, more
than 2 million bee colonies are rented for pollination of agricultural crops [4]. Honey bee is highly specialized insect with morphological - anatomical differences between castes in the colony, as well as differences in their behavior and function. One honey bee colony is consisted of one queen bee, few hundred drones and more thousand workers; so the honey bee colony is multigenerational and multiannual society. From the late 60s of XIX century, there were about twenty cases of large losses of bees due to bee diseases [6].Winter losses of bees are not news. However, since 2006 until today, in the USA is recorded loss of bee colonies much larger than average losses in previous years (before 2006). Although some American beekeepers reported loss of 50-90% of bee colonies within only a week, average loss of bee colonies is about 30% [2]. In the

Scientific Papers Series Management, Economic Engineering in Agriculture and Rural Development Vol. 14, Issue 2, 2014 PRINT ISSN 2284-7995, E-ISSN 2285-3952
14
period between 2007 and 2011 about 30% of bees died in USA due to CCD (Colony Collapse Disorder), so they did not managed to successfully pollinate agricultural crops. MATERIALS AND METHODS Method used in this research paper was Desktop study. Analysis was based on data available from relevant publications regarding the research topic. Material was collected from scientific journals and electronic data sources. RESULTS AND DISCUSSIONS This section presents the main possible causes of honey bee Colony Collapse Disorder. Main factors of honey bee death in the USA and Europe, till appearance of CCD, were two parasitic species: varroa mites and tracheal mites. Next to them, and very present today, are diseases American foulbrood, nosema and chalkbrood. However, during time, science enabled successful fighting with these diseases and continuum of professional beekeeping, although expenses of beekeeping significantly increased. However, the reasons of present large loss of bee colonies, mainly in the USA, are not known. Only symptoms are known, which numbers of hypothesis are trying to explain. Generally speaking, main symptoms of CCD are complete absence of adult workers in the hive, where dead bees cannot be found near the hive, there is a capped brood and stocks of food (honey and bee bread) in the hive. Colonies which are affected by this phenomenon have very few adult bees needed for maintenance of the brood; work force is presented with small number of workers, while queen bee is present in the hive. In Europe, significant loss of bee colonies was observed in the fall of 2009 in Switzerland [1] and soon European beekeepers observed the same phenomenon in Belgium, France, Greece, Italy, Portugal, Spain, Germany and Northern Ireland. Colonies affected by this “disease” may appear healthy for weeks prior to leaving the hive, and in the moment of manifestation of
this phenomenon, adult bees suddenly leave the hive full of honey, pollen, closed brood, queen bee and some worker bees. Beekeepers which experienced this phenomenon, say that nowhere around the hive bees cannot be found and that in the hive there are no dead bees. Main cause of this phenomenon is not known, but there are some hypotheses which try to explain why there is mass disappearance of bees: -phenomenon caused by traditional bee pests and diseases (American foulbrood, nosema, chalkbrood etc.); -growing of genetically modified crops; -narrowing of genetic variability of the queen bee; -usage of agro-chemistry in agricultural production and poor apiary management; -poor nutrition of bees; -impact of undiscovered pests and diseases; -synergy of all previously stated factors. According to research of Van Engelsdorp et al. [7], it cannot be stated that there is only one pathogen primarily responsible for CCD syndrome. Still, pathogens and parasites have critical role in creation of this phenomenon (although not the main role), considering that in his research “diseased“ colonies had much larger amount of pathogens in bodies, compared to control colonies. One of the possible ways on which bees regulate the number of pathogens and parasites in the hive might be departure of highly infected individuals from the hive. The most researched possible causes of this syndrome are traditional bee diseases and agricultural chemicals, and partially electromagnetic waves, genetically modified organisms and poor nutrition. 1. Traditional bee diseases The most serious candidates, possible causes of this phenomenon, are diseases American foulbrood and varroa. American foulbrood is infectious disease of closed brood caused by bacteria, which is spread by spores through the hive. In time, colony becomes less in number and eventually all bees die. The disease is spread with spores which are very resistant on environmental factors and chemicals. Spores can also be spread by varroa mite as well as wax moth. Beekeeper

Scientific Papers Series Management, Economic Engineering in Agriculture and Rural Development Vol. 14, Issue 2, 2014 PRINT ISSN 2284-7995, E-ISSN 2285-3952
15
can infect the colonies by buying infected swarms, by borrowing infected beekeepers equipment, by independent preparation of foundations from unsterilized wax, etc. Infected brood is irregular (scattered), and by removing the wax caps one can see changes in the larvae (instead of white, larvae are pearly white, yellow-white, dark brown or chocolate). Larva loses clear shape and turns into a soggy formless amorphous mass. Varroa is a disease that affects brood and adult bees and it is caused by a mite. When colonies become infected, varroa mite is spread very fast and untreated colonies die very quickly, usually in winter. A higher percentage of varroa infestation in Europe, compared to the rest of the world, can be attributed to cold winters and viruses that cause secondary infection of bees, and which are transmitted by mites. Source of varroa mite can be infected colonies, packet swarm of bees, contact with diseased bees, natural swarms, queen bees and brood. Initially, the disease runs smoothly and seamlessly, and does not reflect the productivity of bee colonies. But with time, it reduces the immunity of bees and weakness the strength of colony. The symptoms of the disease manifest if infected more than 20% of the bees. During winter time, bees are agitated, they are buzzing, they have diarrhea and eventually they die. In spring and summer there is a mortality of pupae and the weakening of colony, which is the result of performance of progeny incapable of survival. Drones cannot mate with queens whose fertility, due to varroa, is extremely reduced. Mites are located mainly on the worker brood, which leads to a large number of damaged bees which are unable to fly. The aforementioned claims are related to the so - called secondary viral infections. The most damage, at least in Europe, is caused by virus of acute bee paralysis, which latently infects bees causing visible damage to their bodies. Larvae which have sufficient amount of the virus die before their cells are closed. Survivors continue to evolve in latently infected adult bees. Virus of acute bee paralysis can sometimes be found in pollen collected by bees which appear healthy, as
well as in their thoracic salivary glands. There is a strong correlation between the presence of the viruses transmitted by mites and the appearance of CCD [4]. As one of the possible causes of the Colony Collapse Disorder is nosema disease. It is a widespread disease of adult bees caused by parasitic protozoa. This parasite attacks the cells of the midgut, leading to disturbances in digestion, and then the damage of other organs. Infected bees live shorter compared to the uninfected bees, because the infection reduces the length of life of bees between 25% - 58%. In addition to shortening the life span of bees, one of the consequences is replacement of queen bee, latter orientation flight of young workers, lower or complete absence of nectar and pollen gathering, bee exhaustion and loss of colony. All of these diseases are taken as a possible cause of honey bee disappearance. However, it should be noted that in each mentioned disease there are clearly visible signs of illness, prior to death of the bees. On apiaries affected by CCD, the bees appeared healthy and there were no clear signs of the presence of traditional bee diseases. 2. Genetically modified organisms Genetically modified seeds are produced and distributed by major biotechnology companies mainly based in the USA. Corporations are investing a lot of money into research and development of genetically modified seed using genetic engineering, and such seed can be further propagated only under certain conditions. Research papers about the impact of genetically modified seeds (plants) on the occurrence of CCD are very scarce and contradictory. One thing is certain, the bees cannot distinguish between genetically modified crops and crops of conventional or organic production. Pollen, which is collected from genetically modified plants, can be detected in honey which, from an economic point of view, may affect trade of these products. Exploring the impact of GMOs on bees’ health and its possible connection with the appearance of the colony collapse should be conducted by independent and competent scientific research institutions, and research results should be known to the general public.

Scientific Papers Series Management, Economic Engineering in Agriculture and Rural Development Vol. 14, Issue 2, 2014 PRINT ISSN 2284-7995, E-ISSN 2285-3952
16
Narrowing of the queen bee genetic variability Narrowing of the queen bee genetic variability is caused by the existence of a smaller number of queen breeders in the USA that produce millions of queen bees for the whole territory of the USA, which may be linked to the collapse of bee colonies. Increased genetic uniformity of the queen bee can be a cause to greater susceptibility to diseases or pests that attack the bee colonies [2]. Impact of agrochemicals and poor apiary management Pesticides are also listed as a possible cause of CCD, such as insecticides from the group of neonicotinoids (they contain the active component imidacloprid) whose residues can be found in the plants nectar. Difficulty in assessment of the chemicals impact on the CCD appearance lies in the fact that there are many different chemicals in use, within the countries where mentioned phenomenon emerged, so it's hard to simultaneously conduct tests for all of them. Besides that, transport of honey bees on long distances, which is common practice in the USA, exposures honey bees to the number of different pesticides within the territories intended for honey bee pasture. Also, bees store pollen and honey for the longer period, which means it can take a long time (days - months) before the contaminated product is used as a food, so that hinders linking of symptoms appearance with the actual time of exposure to pesticides. Active substances in agrochemicals that are used for the control of crops’ pests and diseases affect the mortality of the useful insects in agro-ecosystems, where it should be underlined that they can stay in nature for a long time, through the accumulation into the bodies of living organisms, i.e. their products. It is assumed that the agricultural chemicals, combined with the other stressors, contribute to the worldwide disappearance of honey bees. Pesticides toxic to honey bees include: organophosphate pesticides, chlorinated hydrocarbon pesticides, carbamate pesticides, organic pesticides, pyrethroids and neonicotinoids. Most of the pesticides toxic to
honey bees, affect the bees’ nervous system. After the exposure, bees’ vital organs paralyze. Behavior of complete colony is changing. Imidacloprid, insecticide that belongs to the group of neonicotinoids, affects the honey bees foraging success [3]. Its sub-lethal doses adversely affect the longevity of honey bees, brood forming, development of hypo- pharyngeal glands and queen bee activity. Considering that adult honey bees eat relatively small amount of pollen, if agricultural chemicals are the cause of CCD, they are probably accumulated in nectar (main symptom of CCD is the disappearance of adult honey bees). Imidacloprid can also cause immunodeficiency of honey bees through the chronic intoxication with low doses. In April 2013, EU has proclaimed a two - year ban on the use of neonicotinoids. Chemicals are also used in the treatment of Varroa mites, such as the coumaphos and fluvalinate, and they may be one of the causes of the Colony Collapse Disorder. Life length of a worker bee can be reduced if it is exposed to sub-lethal doses of coumaphos in the stage of larva or pupa [1]. If worker bees are dying at the rate that exceeds the ability of colony to replace them, reduction of brood size occurs and finally the entire colony collapses. One more chemical, fipronil, was accused in 2010 for the emergence of Colony Collapse Disorder phenomenon, when French researchers found that a very small non-lethal dose of mentioned pesticide affects the ability of honey bees to locate the hive. Poor honey bee nutrition The cause of Colony Collapse Disorder may also be the poor quality of nutrition. Poor diet is the only common factor in all recorded cases of CCD [8]. This means that there is a possibility that the appearance of mentioned phenomenon is correlated with the stress caused by poor nutrition, so it will manifest itself less in healthy, well-nourished colonies. Problem related to honey bee nutrition can be pasture on monocultures (bees need more diverse diet, i.e. pollen and nectar of larger number of flowering plants). Related to this is the assumption that the local and the global decline of biodiversity may be linked to the

Scientific Papers Series Management, Economic Engineering in Agriculture and Rural Development Vol. 14, Issue 2, 2014 PRINT ISSN 2284-7995, E-ISSN 2285-3952
17
emergence of the colony collapse disorder. Bees that were fed with pollen of various plants have healthier immune systems compared to honey bees which were pastured only on monocultures. Impact of undiscovered pests and diseases Some new bee pests can be the cause of CCD. In fact, during the 2006 scientists have identified, beside the usual type of Nosema apis, a new type of nosema - Nosema ceranae, in the digestive tract of honey bees, which can be one of the factors that causes CCD [5]. However, collapse of honey bee colonies is probably a consequence of the synergy of all above mentioned factors. Theoretically, combination of all underlined stressors can significantly weaken the immune system of honey bees and lead to its disappearance (extinction). CONCLUSIONS Economic consequences of the bee colonies collapse around the world are incalculable. Due to the decline of bees number in the world main consequence would be a reduction in the yield of main agricultural crops that will dramatically increase the price of all food products. This phenomenon could affect the crop production but also livestock production, by reducing the yield of forage crops. Larger loss of bee colonies would cause the disorder of the world market, i.e. trade between the countries affected by this phenomenon, and those in which still there is no collapse of bee colonies. Also, due to the inability of the natural crops pollination, labor costs would drastically increase. People would have to be hired to simulate the bees by manual pollination of agricultural crops. This case has already been reported in the southern Chinese province of Sichuan, famous for the production of pears, where due to excessive use of pesticides bees are extinct, so people have to manually pollinate fruit trees. One bee colony can pollinate up to 3 million flowers per day, while a man can pollinate about thirty trees per day. This is a difficult and expensive process, and bees do it for free. It is estimated that hand pollination, in the USA would cost more than $ 90 billion annually. However, it
is believed that this method of pollination is not sustainable, given the trend of emigration from rural areas to the cities, which is present in most developed countries. In this regard, there have been attempts to create a device that would have a role in the pollination of plants, however, it was determined that no device even comes close to be as efficient as bees. The role of honey bees in the provision of ecosystem services of pollination is of enormous importance for the survival of biodiversity as we know it, and hence human survival as a species. ACKNOWLEDGMENTS This paper is part of project III 46006: „Sustainable agriculture and rural development in terms of achieving the strategic goals of Republic Serbia within Danube region“ and project no. 179028: „Rural labor market and rural economy of Serbia - Diversification of incomes and reduction of poverty“, both financed with the support of the Ministry of Science and technological development of Republic of Serbia. Projects period 2011-2014. REFERENCES [1]Dainat, B., Van Engelsdorp, D., Neumann, P., 2012, Colony Collapse Disorder in Europe, Environmental Microbiology Reports, 4(1):123-125, available at: http://onlinelibrary.wiley.com/doi/10.1111/j.1758-2229.2011.00312.x/abstract [2]Ellis, J., 2007, Colony Collapse Disorder in Honey Bees, Institute of Food and Agricultural Science, University of Florida, IFAS Extension, available at: http://edis.ifas.ufl.edu/in720 [3]Jeroen P. van der Sluijs, Noa Simon - Delso, Dave Goulson, Laura Maxim, Jean - Marc Bonmatin, Luc P. Belzunces, 2013, Neonicotinoids, bee disorders and the sustainability of pollinator services, Current Opinion in Environmental Sustainability, 5(3-4):293-305, available at: http://dx.doi.org/10.1016/j.cosust.2013.05.007 [4]Jonhnson, R., 2010, Honey Bee Colony Collapse Disorder, Congressional Research Service, available at: http://www.fas.org/sgp/crs/misc/RL33938.pdf [5]Paxton, R. J., 2010, Does infection by Nosema ceranae cause „Collony Colapse Disorder“ in honey bees (Apis meliffera)?, Journal of Apicultural Research, 49(1):80-84, available at: http://www.ibra.org.uk/articles/Nosema-ceranae-and-CCD [6]Rucker, R. R., Thurman, W. N., 2012, Colony Collapse Disorder: The Market Response to Bee

Scientific Papers Series Management, Economic Engineering in Agriculture and Rural Development Vol. 14, Issue 2, 2014 PRINT ISSN 2284-7995, E-ISSN 2285-3952
18
Disease, Perc Policy Series, No. 50, available at: http://perc.org/sites/default/files/ps50.pdf [7]Van Engelsdorp D, Evans JD, Saegerman C, Mullin C, Haubruge E, et al., 2009, Colony Collapse Disorder: A Descriptive Study. PLoS ONE 4(8): e6481, available at: http://www.plosone.org/article/info%3Adoi%2F10.1371%2Fjournal.pone.0006481 [8] http://news.bbc.co.uk/2/hi/science/nature/8467746.stm

Scientific Papers Series Management, Economic Engineering in Agriculture and Rural Development Vol. 14, Issue 2, 2014 PRINT ISSN 2284-7995, E-ISSN 2285-3952
19
RESEARCH ON THE RELATION MANAGEMENT BETWEEN ROOTS AND SOIL UNDER CLIMATIC STRESS CONDITIONS IN PREMIUM WHEAT CROP Mihai BERCA1, Roxana HOROIAŞ2 1University of Agronomic Sciences and Veterinary Medicine of Bucharest, 59 Mărăşti Blvd, District 1, 011464, Bucharest, Romania, Phone: +4021.318.25.64, Fax: + 4021.318.25.67, E-mail: [email protected] 2AGROVET SA, 20 Siriului Street, District 1, 014354, Bucharest, Romania, Phone: +4021.20.80.300, Fax: + 4021.20.80.310, E-mail:[email protected] Corresponding author: [email protected] Abstract The present study was conducted in order to highlight a big problem that breeders are facing with nowadays, namely the relations which are formed between the plants root system and the soil, that constitutes their living and development environment. There were identified three main ways through which the breeding of the roots-soil system can be achieved for its optimization: the factors related to soil, the soil technologies and, finally, the breeding, genetics and molecular genetics path. Taking into account all the principles mentioned above, were evaluated the yields obtained at Premium wheat in two agricultural years, years that were totally different from climatic point of view (2011-2012 and 2012-2013). The importance of the connection between plant roots and soil was especially visible in 2011-2012, when were registered extreme drought conditions. The phenomenon was also extended to neighboring plains (The Pannonian Plain in Austria, Hungary, examples being conclusive in this sense). Data obtained from our own experimental lots, where have been taken into account elements like soil amelioration, farm management, seed quality and varieties used in culture, are indicating significantly positive differences compared to those plots that were planted randomly, without taking into account all these aspects. In the same time, this paper presents the correlations between the wheat root system development and the yields level. Researches were performed in several areas of the country, making the relevance of the study and of its results even greater, while its utility for farmers increases directly proportional to the demonstrated importance. Key words: abiotic factors, breeding, Premium wheat, root system, yield INTRODUCTION The studies on the relationships between roots of the cultivated plants and soil are, generally, less known and almost all the manuals is resumed to the fixing and supplying function with water and mineral elements [8]. Even today most of the specialists are judging a plant by its appearance from the soil surface, forgetting that, in its entirety, the plant also has a root, often more developed than the outside part and with multiple features, delicate and mostly unknown [2] [3] [4]. On wheat roots are extremely numerous and long. According to Schweiger et al. (2009) [7] the total length of roots may reach 100-180 cm/plant. The experiment included two varieties (Capo and Saturnus) and there were no differences between them. Method used was the one with PVC tubes.
More complex researches were performed in 1995-1996 and published in 1999 by Schmid et al. [6]. These were carried out on different soils from the Munich area and with various crop systems. Results indicated a high sensitivity of root development depending on the precipitation regime and fertilization level. Behaviour of roots depending on soil stress has been studied and presented by Merotto Jr. and Mundstock [5] in 1999. They demonstrated that a normal or good growth is conditioned by the hardness of the soil and they agree that roots don’t increase at all at more than 3.5 MPa (35 kgf/cm2). In Romania, Berca M. (2011) [1] shows that on Burnas Plateau the hardpan layer located at 30-40 cm completely blocks the formation and penetration of roots into the soil. Therefore, the biological activity of the soil and the plant development are badly affected

Scientific Papers Series Management, Economic Engineering in Agriculture and Rural Development Vol. 14, Issue 2, 2014 PRINT ISSN 2284-7995, E-ISSN 2285-3952
20
and so is the wheat yield. For these reasons, in the mentioned area was conducted a whole program of soil ecology, reaching today to obtain in autumn wheat plant with small foliage, but strongly developed roots. The autumn of 2007 was extremely dry and allowed wheat emergence of only later. Because of the organic soil, roots were formed much better than stems, so that 2008 has led to high and good quality yields. As can be seen (Fig. 1) the depth of the roots exceeded 20 cm. It is what is necessary for the agronomists to wish for their crops.
Fig. 1. Barley plants sprouted in November 2007, whose roots are extremely developed at 3.12.2007 (original) MATERIALS AND METHODS Aim of this paper was to follow the development of roots, but especially their effect on plant and yield components development on 15 wheat varieties in the Calarasi, Alexandria, Dobrogea areas. Due to the lack of equipment it wasn’t pursued the measuring of biomass amount formed in the wheat plants root system, but were rather used techniques like visual tracing and photographing of roots in autumn and spring, until the end of tillering. The work was performed in years and areas with different amounts of rainfall and it was observed the effect caused by the water stress on the formation of roots, tillers and some production components at 15 wheat varieties,
mostly premium type. For this purpose soil monoliths were collected from the experimental fields, which initially were cleaned of the surplus of earth, then the roots and the plants were washed and measured. There have been also numbered the tillers for 150 plants and at harvest the ears were measured and weighed and it was calculated the grain weight per ear. The work was carried out in 2 precipitation regimes, namely: for the period from September to June:
o 530 mm precipitation; o 370 mm precipitation;
for the period from April to June: o 281 mm precipitation; o 141 mm precipitation.
For the results interpretation was used the calculation of variance analysis, of correlations and functions. RESULTS AND DISCUSSIONS In Fig. 2, at Josef variety it is seen, on the left, the water stress effect in Modelu conditions on 23.04.2012, while on the right it is shown a plant that received the needed water accordint to the consumption curve.
Fig. 2. Josef variety wheat plants in water stress (left) and without stress (right) – original, 23.04.2012, Modelu

Scientific Papers Series Management, Economic Engineering in Agriculture and Rural Development Vol. 14, Issue 2, 2014 PRINT ISSN 2284-7995, E-ISSN 2285-3952
21
In Fig. 3, both left and right side, plants come from plots experienced water stress. Similarly stress condition is presented in Fig. 4, the photo being made to a later date.
Fig. 3. Balaton wheat plants grown under conditions of water stress in Alexandria – 25.03.2013 (original)
Our estimation shows that the root system under water stress was around 40-50 % lower than in the conditions of plants without stress. It will be noticed that between reducing root system and other parameters there are positive correlations, more or less significant. From Fig. 4 it is seen that the number of tillers in the version without water stress is almost double than in the case with stress.
Fig. 4. Balaton wheat plants grown under different conditions of stress in Alexandria – 24.04.2012 (original)
The tillering analysis depending on varieties and moisture regime (Fig. 5) gives back the variability of the average tillers number, but generated by the studied varieties behavior.
Fig. 5. Variability of the tillers number in relation to the variety (original)
As the evolution of the curve for the risk of 5% is inside the confidence interval, we can say, on average, that the variation of tillers formation in relation to the variety is insignificant. On the contrary, judging only the calculations generated by the precipitation factor, it follows that an extra amount of rainfall during the wheat growing season brings a difference of 14% from the average and 26% among active variants. The quantity of additionally rainfall is of 530 – 370 = 160 mm.
Fig. 6. Water stress effect on the formation of wheat tillers – Modelu 2012-2013

Scientific Papers Series Management, Economic Engineering in Agriculture and Rural Development Vol. 14, Issue 2, 2014 PRINT ISSN 2284-7995, E-ISSN 2285-3952
22
Appearance of a larger number of tillers in the version without or with low stress is primarily due to the formation of a vigorous root system, to the water conservation in the ecologized soil and to its optimal use, especially in spring, at the completion of twinning (also see Fig. 6). The bifactorial effect, water stress and varieties, on tillers’ number variation it’s shown in Fig. 7, so we deduce that, taking the average as control, both curves move within the confidence interval, the differences being insignificant both horizontally and vertically in each curve, but frequently to very significant if taking into account differences between them.
Fig. 7. Influence of rainfall and wheat varieties on the
tillers’ number variation on plants - Modelu 2012-2013
Variation of the data is greater in the stress-free variant than in the one with stress, in the last the varieties manifesting the tendency of tillers production standardization. Analysis of the ears weight in relation to varieties and precipitation The root system is the multifunctional component of the plant, its representative in the soil intimacy. It equally takes over the plant reaction in relation with the evironment. If the environemnt enter into water stress, the root system is the first that feels and transmits defense commands to the aeria part, although there are also sensors that record and transmit the phenomenon gravity to the roots. The root system has the task to solve the problem, if possible. If not, it send to the aerial part the effort necessity to reduce
production by reducing the production components. In wheat the crop is achieved in the ear and it’s correlated with their weight (Fig. 8). Excluding the first two varieties, where the weight of ears fits, on average, in the significantly negative field, there are also four varieties (Midas, Philipp, Astardo and Pedro) which have ears whose weight positively significantly exceeds the confidence interval for the risk of 5%. The other varieties are
within the limits of the interval m DL5% .
Fig. 8. Changes in the weight of a ear in relation to the cultivated varieties
Fig. 9. Ear weight average decrease for 15 varieties by reducing to half the amount of water from April to July
The stress effect caused by the water scarcity brutal attack ear weight (Fig. 9), reducing it from 2.65 g to 2.36 g, ie with 11%, a very significant reduction taking into account the fact that are 500-600 spice/m2. This implies a
Scientific Papers Series Management, Economic Engineering in Agriculture and Rural Development Vol. 14, Issue 2, 2014 PRINT ISSN 2284-7995, E-ISSN 2285-3952
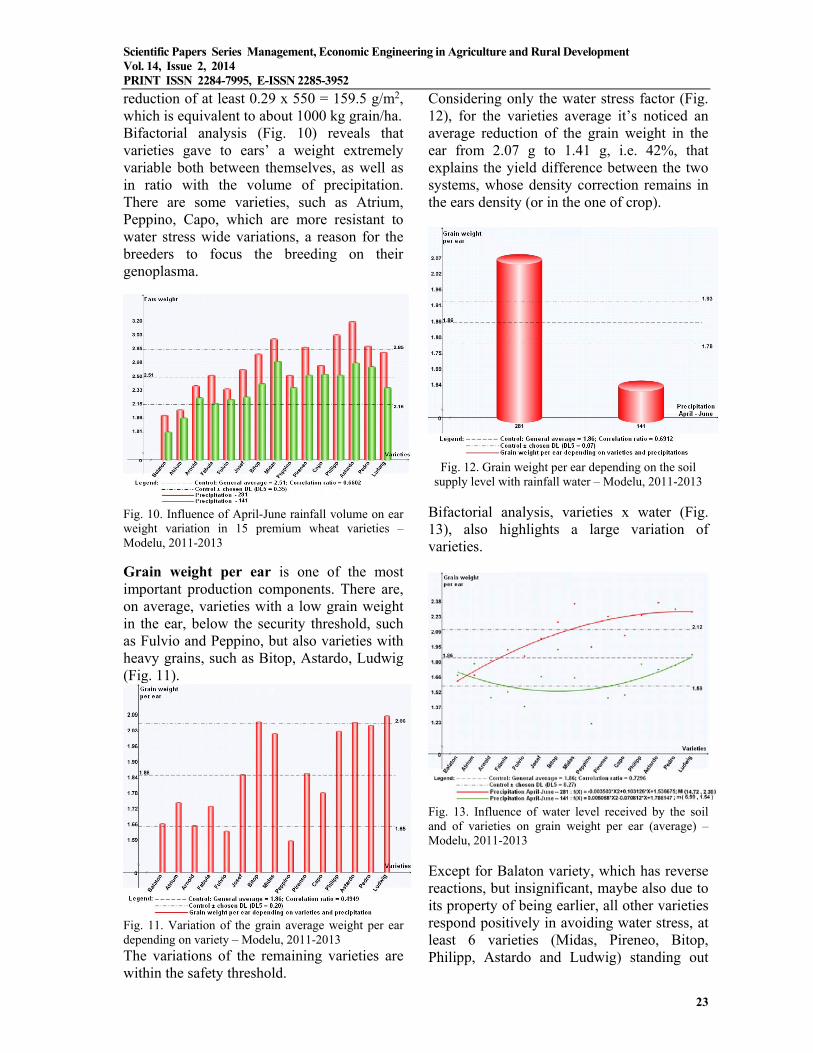
23
reduction of at least 0.29 x 550 = 159.5 g/m2, which is equivalent to about 1000 kg grain/ha. Bifactorial analysis (Fig. 10) reveals that varieties gave to ears’ a weight extremely variable both between themselves, as well as in ratio with the volume of precipitation. There are some varieties, such as Atrium, Peppino, Capo, which are more resistant to water stress wide variations, a reason for the breeders to focus the breeding on their genoplasma.
Fig. 10. Influence of April-June rainfall volume on ear weight variation in 15 premium wheat varieties – Modelu, 2011-2013
Grain weight per ear is one of the most important production components. There are, on average, varieties with a low grain weight in the ear, below the security threshold, such as Fulvio and Peppino, but also varieties with heavy grains, such as Bitop, Astardo, Ludwig (Fig. 11).
Fig. 11. Variation of the grain average weight per ear depending on variety – Modelu, 2011-2013 The variations of the remaining varieties are within the safety threshold.
Considering only the water stress factor (Fig. 12), for the varieties average it’s noticed an average reduction of the grain weight in the ear from 2.07 g to 1.41 g, i.e. 42%, that explains the yield difference between the two systems, whose density correction remains in the ears density (or in the one of crop).
Fig. 12. Grain weight per ear depending on the soil
supply level with rainfall water – Modelu, 2011-2013
Bifactorial analysis, varieties x water (Fig. 13), also highlights a large variation of varieties.
Fig. 13. Influence of water level received by the soil and of varieties on grain weight per ear (average) – Modelu, 2011-2013
Except for Balaton variety, which has reverse reactions, but insignificant, maybe also due to its property of being earlier, all other varieties respond positively in avoiding water stress, at least 6 varieties (Midas, Pireneo, Bitop, Philipp, Astardo and Ludwig) standing out
Scientific Papers Series Management, Economic Engineering in Agriculture and Rural Development Vol. 14, Issue 2, 2014 PRINT ISSN 2284-7995, E-ISSN 2285-3952
24
significantly positive by the confidence
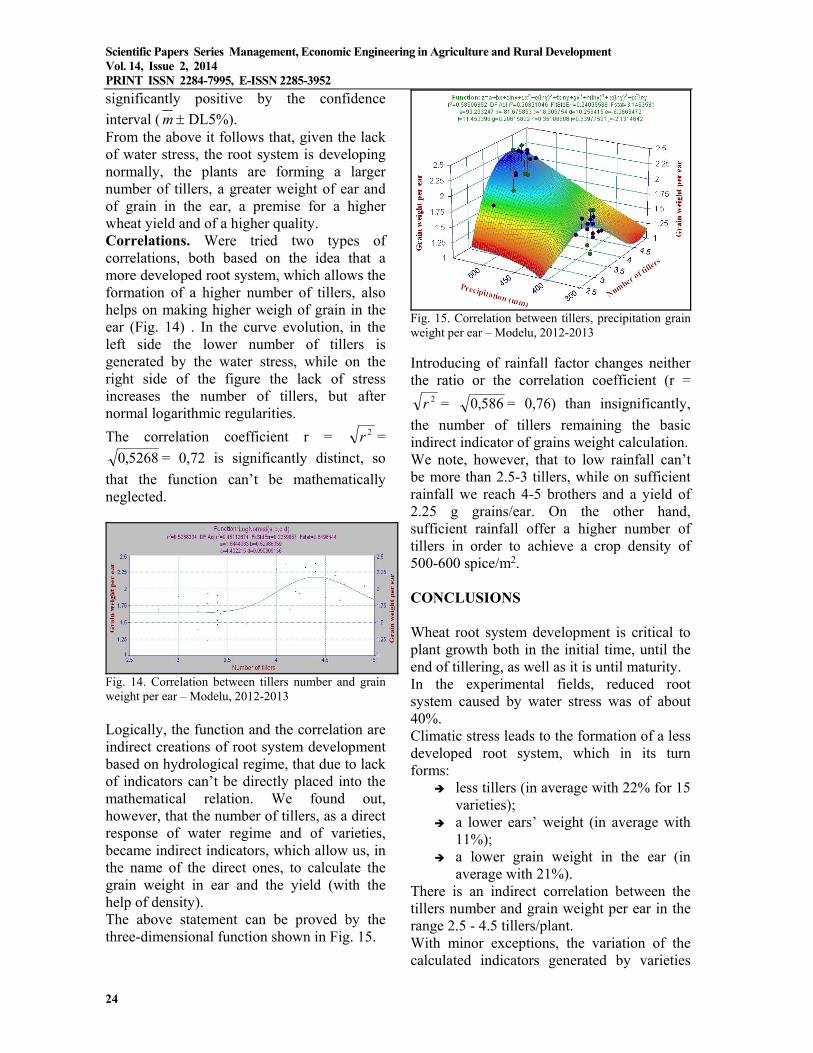
interval ( m DL5%). From the above it follows that, given the lack of water stress, the root system is developing normally, the plants are forming a larger number of tillers, a greater weight of ear and of grain in the ear, a premise for a higher wheat yield and of a higher quality. Correlations. Were tried two types of correlations, both based on the idea that a more developed root system, which allows the formation of a higher number of tillers, also helps on making higher weigh of grain in the ear (Fig. 14) . In the curve evolution, in the left side the lower number of tillers is generated by the water stress, while on the right side of the figure the lack of stress increases the number of tillers, but after normal logarithmic regularities.
The correlation coefficient r = 2r =
5268,0 = 0,72 is significantly distinct, so
that the function can’t be mathematically neglected.
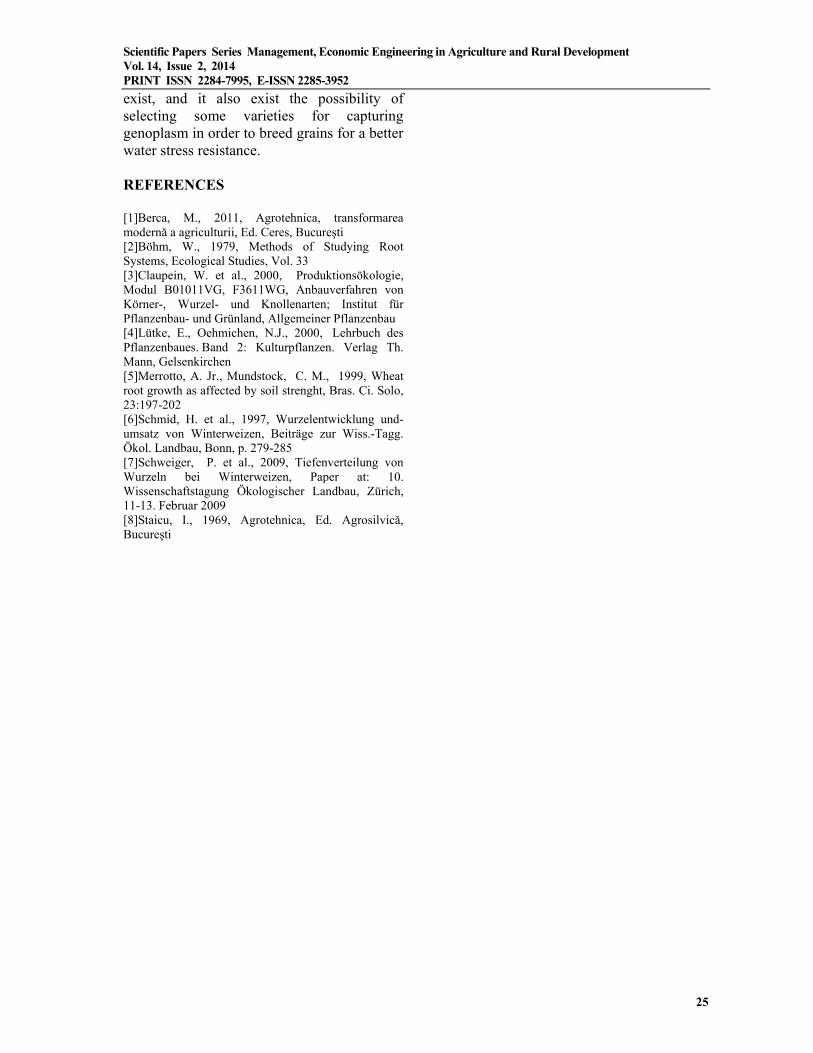
Fig. 14. Correlation between tillers number and grain weight per ear – Modelu, 2012-2013 Logically, the function and the correlation are indirect creations of root system development based on hydrological regime, that due to lack of indicators can’t be directly placed into the mathematical relation. We found out, however, that the number of tillers, as a direct response of water regime and of varieties, became indirect indicators, which allow us, in the name of the direct ones, to calculate the grain weight in ear and the yield (with the help of density). The above statement can be proved by the three-dimensional function shown in Fig. 15.
Fig. 15. Correlation between tillers, precipitation grain weight per ear – Modelu, 2012-2013 Introducing of rainfall factor changes neither the ratio or the correlation coefficient (r =
2r = 586,0 = 0,76) than insignificantly,
the number of tillers remaining the basic indirect indicator of grains weight calculation. We note, however, that to low rainfall can’t be more than 2.5-3 tillers, while on sufficient rainfall we reach 4-5 brothers and a yield of 2.25 g grains/ear. On the other hand, sufficient rainfall offer a higher number of tillers in order to achieve a crop density of 500-600 spice/m2. CONCLUSIONS Wheat root system development is critical to plant growth both in the initial time, until the end of tillering, as well as it is until maturity. In the experimental fields, reduced root system caused by water stress was of about 40%. Climatic stress leads to the formation of a less developed root system, which in its turn forms:
less tillers (in average with 22% for 15 varieties);
a lower ears’ weight (in average with 11%);
a lower grain weight in the ear (in average with 21%).
There is an indirect correlation between the tillers number and grain weight per ear in the range 2.5 - 4.5 tillers/plant. With minor exceptions, the variation of the calculated indicators generated by varieties
Scientific Papers Series Management, Economic Engineering in Agriculture and Rural Development Vol. 14, Issue 2, 2014 PRINT ISSN 2284-7995, E-ISSN 2285-3952
25
exist, and it also exist the possibility of selecting some varieties for capturing genoplasm in order to breed grains for a better water stress resistance. REFERENCES [1]Berca, M., 2011, Agrotehnica, transformarea modernă a agriculturii, Ed. Ceres, Bucureşti [2]Böhm, W., 1979, Methods of Studying Root Systems, Ecological Studies, Vol. 33 [3]Claupein, W. et al., 2000, Produktionsökologie, Modul B01011VG, F3611WG, Anbauverfahren von Körner-, Wurzel- und Knollenarten; Institut für Pflanzenbau- und Grünland, Allgemeiner Pflanzenbau [4]Lütke, E., Oehmichen, N.J., 2000, Lehrbuch des Pflanzenbaues. Band 2: Kulturpflanzen. Verlag Th. Mann, Gelsenkirchen [5]Merrotto, A. Jr., Mundstock, C. M., 1999, Wheat root growth as affected by soil strenght, Bras. Ci. Solo, 23:197-202 [6]Schmid, H. et al., 1997, Wurzelentwicklung und-umsatz von Winterweizen, Beiträge zur Wiss.-Tagg. Ökol. Landbau, Bonn, p. 279-285 [7]Schweiger, P. et al., 2009, Tiefenverteilung von Wurzeln bei Winterweizen, Paper at: 10. Wissenschaftstagung Ökologischer Landbau, Zürich, 11-13. Februar 2009 [8]Staicu, I., 1969, Agrotehnica, Ed. Agrosilvică, Bucureşti

Scientific Papers Series Management, Economic Engineering in Agriculture and Rural Development Vol. 14, Issue 2, 2014 PRINT ISSN 2284-7995, E-ISSN 2285-3952
26

Scientific Papers Series Management, Economic Engineering in Agriculture and Rural Development Vol. 14, Issue 2, 2014 PRINT ISSN 2284-7995, E-ISSN 2285-3952
27
STUDIES ON SYSTEM INFLUENCE IRRIGATED AND NON IRRIGATED LAND MANAGING DIFFERENT DOSES OF NP, ON THE EXTENT OF ACCOMPLISHMENTS PHYSIOLOGICAL HYBRID MAIZE OITUZ Ion BOZGA1, Olimpia PANDIA1, Ion SARACIN2, Daniel NIJLOVEANU1 1University of Agricultural Sciences and Veterinary Medicine, Bucharest, Romania Faculty of Management, Economic Engineering in Agriculture and Rural Development, Slatina Branch , 150, Strehareti Street, Zip Code: 0500, Slatina City, Olt County, Romania , Phone: 0788391615, E-mail: olimpia_pandia@yahoo, Phone:0745752957, Email: [email protected], Phone:0726148524 2University of Craiova, Faculty of Agriculture and Horticulture, 19 Libertatii Street, Craiova City, Romania, Phone:0744162539, E-mail: ion_saracin@yahoo
Corresponding author: [email protected] Abstract The present work tries to establish the role of irrigation and applying variable doses of Nitrogen and Phosphorous, it also tries to ground, from the physiological point of view, the contribution of each factor in achieving high quantitative and qualitative productions. Within the experimental filed an important moment was followed, respective the 8 full-grown leaves phase, and lab tests were kept in order to perform physiological determinations. After lab determinations of physiological processes which took place in the case of this hybrid in two different systems and after applying different doses of fertilizers, the results were also graphically represented. Key words: assimilation, carotene, photosynthesis, respiration, transpiration INTRODUCTION For field crops,corn(Zea Mays), is one of the most common crops, with a rich dowry genetic and a wide use both for humans as well as food, medicine and pharmacy. Corn, is an important source of energy used as human food,w ith a high content in kilocalories, include: proteins, fats, carbohydrates, vitamins. Therefore, it is recommended to use the seeds of maize both for healthy individuals and especially for those with cardiovascular disease, those who are likely to get fat, diabetes, etc. Because of its high capacity of adaptation to soil and climate conditions as well as because of the ample improvement process, maize culture has a spreading area that guarantees the satisfaction of all requirements of every county in our country, and, in many counties –mainly the southern and the western ones – may accomplish important availability in the case of our national economy. [2]
The importance of fertilizers within maize culture logically come from the great production capacity of this culture for which important quantities of nutritive elements extracted from soil are necessary. [1] The research that took place in the last two years emphasized the powerful impact of chemical fertilizers combined with applying an adequate technology upon the carried out physiological processes, that is assimilating and dissimilating and the repartition of dry substance in the plant. MATERIALS AND METHODS The study was performed using an Oituz maize hybrid, when the 8 full-grown leaves became visible and this hybrid was cultivated in the north-western part of Dolj District, at Dobreşti chernozem, and both irrigated and non-irrigated systems were a used, after a precursory wheat culture in 2012, and physiological analysis were performed in order to point out the changes of the chemical

Scientific Papers Series Management, Economic Engineering in Agriculture and Rural Development Vol. 14, Issue 2, 2014 PRINT ISSN 2284-7995, E-ISSN 2285-3952
28
composition of plants when applying different dosage of NP. Analysis were performed by using variants disposed in four repetitions having as an example one row graduated multi-staged plots of land method. The sowed area of the variant is of 22.4 m², and its density is of 50,000 plants/hectare. Analyses of soil were effectuated at 0-25 cm and 23-34 cm. depth. The experiment pursues three factors: I. Factors A - Oituz hybrid; II. Factors B - irrigation system; non-irrigated; III. Factors C - the application of fertilizing dosage. RESULTS AND DISCUSSIONS By combining the graduations of the three factors resulted 20 variants disposed in 4 repetitions using the divided one row multi-stage parcel method. The disseminated area of the variant is 22,4 m², having a 50 000 plants/hectare density. Within the experimental field two calendaristic important moments were pursued, 8 leave stage, withholding assays for laboratory analysis for an estimation regarding physiological processes. Utilized work methods for physiological determinations regarding maize plants: - determination of photosynthesis; - determination of net effective power of assimilation; - determination of chlorophyll pigmies; - determination of foliated surface parameter; - determination of absorption capacity was performed by using the gravimetric method; - determination of suction force. Mathematic calculation used for the interpretation of experimental results. In the interpretation and presentation of experimental results, the analysis of variation represents one of the first important systematization of information, of distinguishing the contribution of different sources of variability. [4] A study of the relation between variables can be performed by means of a statistical modern
method as correlation, simple linear regression, quadric regression, etc. The correlation coefficient is a relative quantity which does not depend on pints used for the respective variants. The expenditure of fertilizers reared during the last decades as fertilizers are acquired by using high fossil energy consumption, and this is one of the reasons why the way of administrating the production process in order to acquiring maximum efficiency is of great interest. For a correct application of chemical fertilizer before sowing have been carried out determinations to the ground to avoid any excess of doses and ground pollution. Acquired results regarding vegetable biomass in 2013 Oituz hybrid The evolution of the photosynthesis process (Table 2), expressed in CO/dm² mg determined at the beginning, on June, the 20th, presents a clear development between the non-irrigated variant and the irrigated one, and a development within the same variant also. An increase of photosynthesis process by 20% toward the control in the case of irrigated variant against the non-irrigated control is perceivable. The optimum dosage, as we notice in Fig.1. is recorded in the case of irrigated variant, as maize doesn’t react when using a significant dosage of Nitrogen and Phosphorus (N120P100).
Table 1.Chemical properties of the argicchernosiomusn from the Dobrești Dolj
Gen
etic
ho
rizo
n
Dep
th (
cm)
The
val
ue P
h (H
2O)
S.B
. m
.e/1
00g
S.H
. m
.e
Hum
us
%
N to
tal
%
P
p.p.
m.
Ap1 0-25 7.08 24.26 3.48 2.76 0.135 22.6 Ap2 25-34 7.21 26.84 2.31 29.18 0.137 28.2
For the same irrigated variant the intensity of photosynthesis rises over 270 mg CO/dm² when using the same fertilizer dosage presented earlier. Regarding the respiration process, expressed in CO2/100 g.m.v. mg unimportant values are recorded on June, 20 th, in non-irrigated and irrigated system also, the eliminated dioxide quantity being of no interest in the case of studied variables (Fig.3). The absorption capacity determined by using g/H20 presents minimum values in
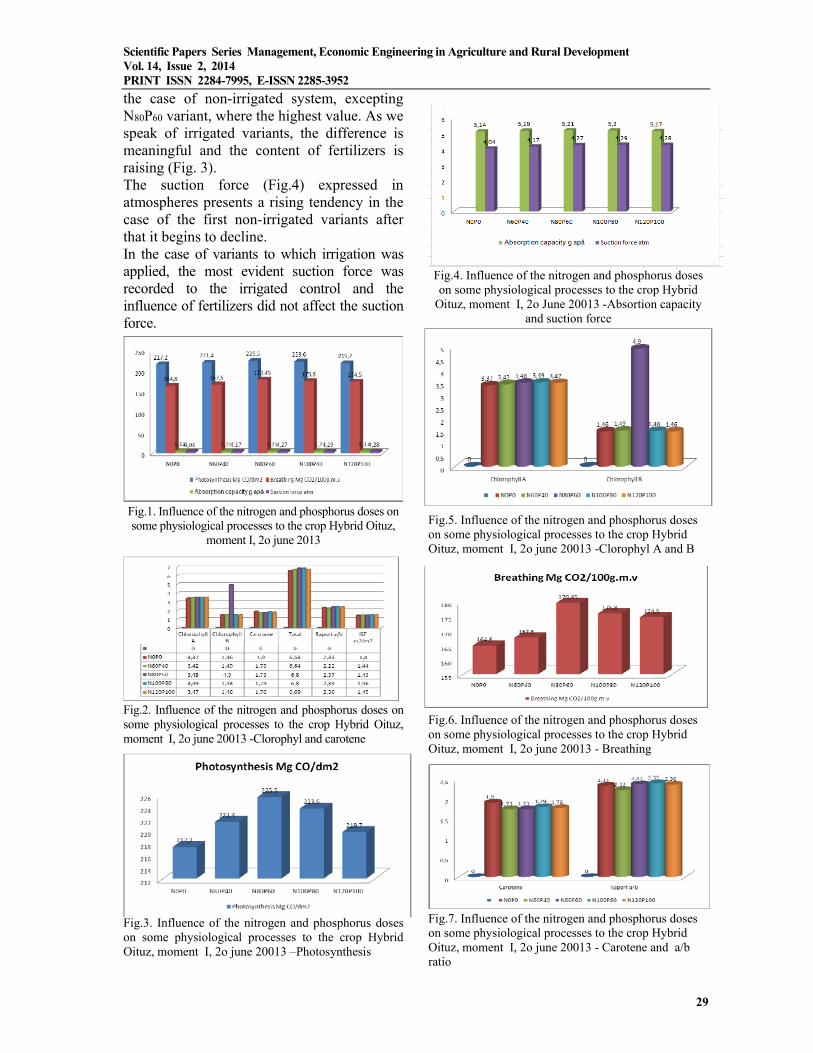
Scientific Papers Series Management, Economic Engineering in Agriculture and Rural Development Vol. 14, Issue 2, 2014 PRINT ISSN 2284-7995, E-ISSN 2285-3952
29
the case of non-irrigated system, excepting N80P60 variant, where the highest value. As we speak of irrigated variants, the difference is meaningful and the content of fertilizers is raising (Fig. 3). The suction force (Fig.4) expressed in atmospheres presents a rising tendency in the case of the first non-irrigated variants after that it begins to decline. In the case of variants to which irrigation was applied, the most evident suction force was recorded to the irrigated control and the influence of fertilizers did not affect the suction force. Fig.1. Influence of the nitrogen and phosphorus doses on some physiological processes to the crop Hybrid Oituz,
moment I, 2o june 2013 Fig.2. Influence of the nitrogen and phosphorus doses on some physiological processes to the crop Hybrid Oituz, moment I, 2o june 20013 -Clorophyl and carotene Fig.3. Influence of the nitrogen and phosphorus doses on some physiological processes to the crop Hybrid Oituz, moment I, 2o june 20013 –Photosynthesis
Fig.4. Influence of the nitrogen and phosphorus doses on some physiological processes to the crop Hybrid
Oituz, moment I, 2o June 20013 -Absortion capacity and suction force
Fig.5. Influence of the nitrogen and phosphorus doses on some physiological processes to the crop Hybrid Oituz, moment I, 2o june 20013 -Clorophyl A and B
Fig.6. Influence of the nitrogen and phosphorus doses on some physiological processes to the crop Hybrid Oituz, moment I, 2o june 20013 - Breathing Fig.7. Influence of the nitrogen and phosphorus doses on some physiological processes to the crop Hybrid Oituz, moment I, 2o june 20013 - Carotene and a/b ratio

Scientific Papers Series Management, Economic Engineering in Agriculture and Rural Development Vol. 14, Issue 2, 2014 PRINT ISSN 2284-7995, E-ISSN 2285-3952
30
Fig.8. Influence of the nitrogen and phosphorus doses on some physiological processes to the crop Hybrid Oituz, moment I, 2o june 20013 - ISF and Net assimilation CONCLUSIONS The combined influence between the variety and technology of culture (applying irrigation and administering proper dosage of fertilizers) determines modifications of the main physiological features which may lead to an optimization of technologies, viz. obtaining maximum productions by rationally applying the dosage of fertilizers. The simultaneous effects of applying irrigation by using variable dosage of fertilizers were also studied; in the case of the main physiological processes their effects are dependent on them. The combined influence of the system of culture (irrigated, non-irrigated) as well as the applied dosage of fertilizers determined noticeable quantitative differences in the case of all qualitative features of Oituz hybrid. We recommend for production Oituz hybrid, in condition of irrigation and by applying the maximum dosage of N120P100, and N100P80 for an economic efficiency. REFERENCES [1]Goian, M., Sala, F., Berbecea Adina, Radulov Isidora, Gherban, C., 2000,The effect of mineral fertilizers upon the bean production of maize, on cambic chernozem within the Timisoara Didactic Research Station, between 1997 and 1999. Scientific research U.S.A.M.V. [2]Hera, C., 1972, The influence of fertilizers upon certain maize hybrids sowed on different types of soils in Romania. An. ICCPT, Fundulea XXXVII.
[3]Pandia Olimpia, 2006, Research Regarding the Effect of Fertilizers upon Maize Production and Quality. Doctoral dissertation, Timisoara, 2006. [4]Sima, E., 2002, Ecological Agriculture and Changing Perception in the Case of Quantity and Quality, The Information and Economic Reference Material Center, Bucharest

Scientific Papers Series Management, Economic Engineering in Agriculture and Rural Development Vol. 14, Issue 2, 2014 PRINT ISSN 2284-7995, E-ISSN 2285-3952
31
VALINE - ISOLEUCINE AND LEUCINE THREE AMINO ACIDS ESSENTIAL FOR BODIES IN THE CORN CARYOPSIS Ion BOZGA1, Olimpia PANDIA1, Ion SARACIN2, Daniel NIJLOVEANU1 1University of Agricultural Sciences and Veterinary Medicine, Bucharest, Romania Faculty of Management, Economic Engineering in Agriculture and Rural Development, Slatina Branch , 150, Strehareti Street, Zip Code: 0500, Slatina City, Olt County, Romania , Phone: 0788391615, E-mail: olimpia_pandia@yahoo, Phone:0745752957, Email: [email protected], Phone:0726148524 2University of Craiova, Faculty of Agriculture and Horticulture, 19 Libertatii Street, Craiova City, Romania, Phone: 0744162539, E-mail: ion_saracin@yahoo
Corresponding author: [email protected]
Abstract In this paper, were analyzed three essential amino acids for our body that are found and take the corn kernels in different proportions depending on the quality of the harvest. Since maize occupies large areas in our country and it is important to protein production per hectare and destabilization hybrids because of the sensitivity to various pathogens or smaller ecological plasticity in the study were hybrids Start and Olt where they were pursued concentrations of the three essential amino acids, the laboratory performed not only to kernels ground but taking into account the influence of culture technology applied three. Key words: respiration, transpiration, photosynthesis, assimilation, carotene INTRODUCTION
Because most essential amino acids are in different quantities in the food composition of a group where some nutrient factors are in large quantities, while others are in small quantity or missing, therefore in order to have a balanced diet it is necessary to eat food from different groups. Thus, in this paper, we study three of these essential amino acids taken from corn grains, besides other existing therein and required for the daily ratio supplement of amino acids useful to humans, such as valine - isoleucine and leucine. [4] Proteins are strictly necessary for human nutrition, but amino acids are the bases of proteins and the lack of one essential amino acid or its presence in smaller quantities than required leads to more reduce effectiveness of others. The amounts of protein needed by the body vary from one individual to another, depending on the health, weight and age and the daily dose of protein for adults is 0.75 to 0.8 grams per kilogram of body weight. [1, 3].
Amino acids are divided into two categories namely essential amino acids and non-essential amino acids. Because all amino acids are necessary, and the non-essential ones are not without importance, having their role in the body, but the essential amino acids cannot be entirely produced by the body in sufficient quantities to ensure protein synthesis, thus these must be supplemented daily by food where essential amino acids are found in different proportions. [5] For the body to be able to synthesize and effectively utilize all proteins, all amino acids must be present in adequate proportions. MATERIALS AND METHODS In order to determine amino acids, which have an important role in terms of quality of production of grain, in the study were taken two hybrids Olt and Start, which according to the culture technology and obtained grains production were determined the most important amino acids. The technology used, respectively non irrigated system as well application of chemical fertilizers on the two hybrid under

Scientific Papers Series Management, Economic Engineering in Agriculture and Rural Development Vol. 14, Issue 2, 2014 PRINT ISSN 2284-7995, E-ISSN 2285-3952
32
study (Olt on Start) definitely influence the total of amino acid, so the content of amino acids is expressed in kg / ha, in function of corn production. The two hybrids were sown in non irrigated system, under differentiated dosage of NP fertilizers, on chernozem soil in the village Dobreşti, in a familial association in 2013, after a preceding wheat, where in addition to other essential and nonessential amino acids, were studied three essential amino acids valine - isoleucine and leucine, important for organism, which can’t be synthesized and must be taken from aliments. Before corn crop establishment were made soil analysis. RESULTS AND DISCUSSIONS For determining soil reaction in the years of experimentation chemical soi analyzes were performed determining soil pH in aqueous suspension of the ground , these soils fall into the category of soil weak acid and neutral with pH values from 6.3 to 6.42 , These soils are preferred by maize plants.
Table 1. Agrochemical determinations the ground before sowing Table 2. Influence of the employed non irrigated system and of the applied fertilizers on the production of crop frails at the Olt hybrid, in 2013
Table.3.The contents in amino acids expressed as kg/ha (a function of the crop grains production) and Olt hybrid, in 2013 Fig.1.The contents in amino acids expressed as kg/ha (a function of the crop grains production) and Olt hybrid, in 2013 Fig.2. Influence of the employed non irrigated system and of the applied fertilizers on the production of crop frails at the Start hybrid, in 2013
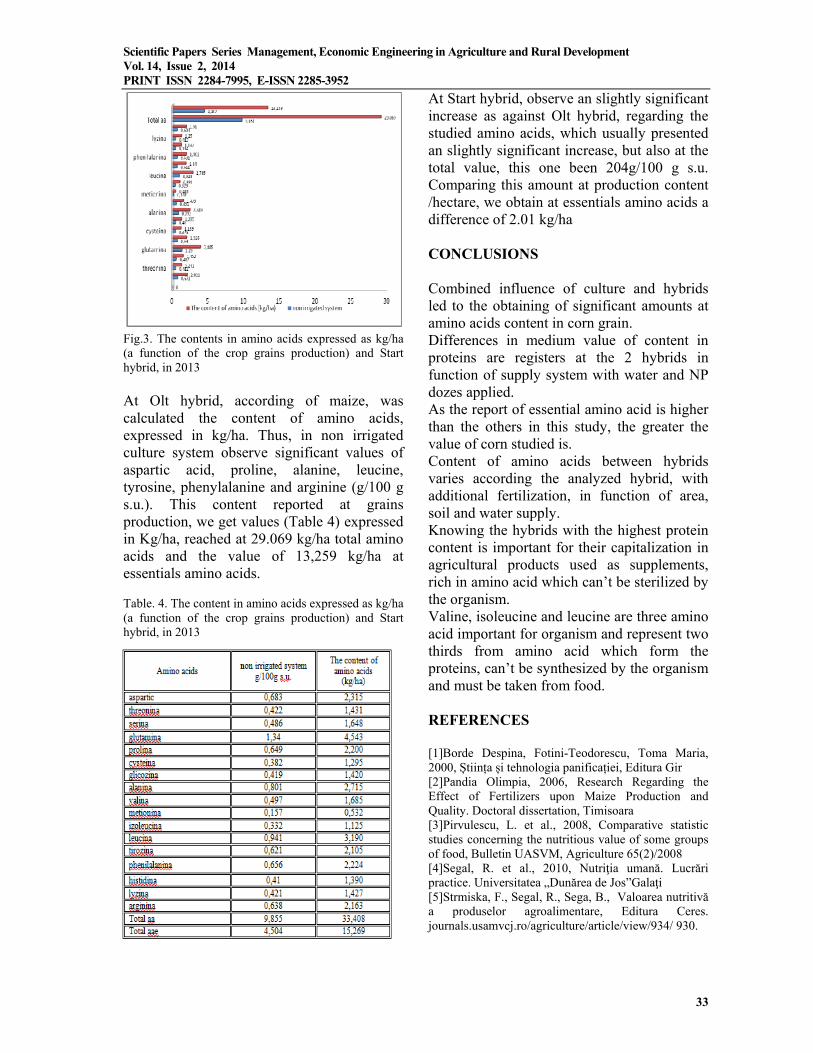
Scientific Papers Series Management, Economic Engineering in Agriculture and Rural Development Vol. 14, Issue 2, 2014 PRINT ISSN 2284-7995, E-ISSN 2285-3952
33
Fig.3. The contents in amino acids expressed as kg/ha (a function of the crop grains production) and Start hybrid, in 2013 At Olt hybrid, according of maize, was calculated the content of amino acids, expressed in kg/ha. Thus, in non irrigated culture system observe significant values of aspartic acid, proline, alanine, leucine, tyrosine, phenylalanine and arginine (g/100 g s.u.). This content reported at grains production, we get values (Table 4) expressed in Kg/ha, reached at 29.069 kg/ha total amino acids and the value of 13,259 kg/ha at essentials amino acids. Table. 4. The content in amino acids expressed as kg/ha (a function of the crop grains production) and Start hybrid, in 2013
At Start hybrid, observe an slightly significant increase as against Olt hybrid, regarding the studied amino acids, which usually presented an slightly significant increase, but also at the total value, this one been 204g/100 g s.u. Comparing this amount at production content /hectare, we obtain at essentials amino acids a difference of 2.01 kg/ha CONCLUSIONS
Combined influence of culture and hybrids led to the obtaining of significant amounts at amino acids content in corn grain. Differences in medium value of content in proteins are registers at the 2 hybrids in function of supply system with water and NP dozes applied. As the report of essential amino acid is higher than the others in this study, the greater the value of corn studied is. Content of amino acids between hybrids varies according the analyzed hybrid, with additional fertilization, in function of area, soil and water supply. Knowing the hybrids with the highest protein content is important for their capitalization in agricultural products used as supplements, rich in amino acid which can’t be sterilized by the organism. Valine, isoleucine and leucine are three amino acid important for organism and represent two thirds from amino acid which form the proteins, can’t be synthesized by the organism and must be taken from food. REFERENCES [1]Borde Despina, Fotini-Teodorescu, Toma Maria, 2000, Știința și tehnologia panificației, Editura Gir [2]Pandia Olimpia, 2006, Research Regarding the Effect of Fertilizers upon Maize Production and Quality. Doctoral dissertation, Timisoara [3]Pirvulescu, L. et al., 2008, Comparative statistic studies concerning the nutritious value of some groups of food, Bulletin UASVM, Agriculture 65(2)/2008 [4]Segal, R. et al., 2010, Nutriţia umană. Lucrări practice. Universitatea „Dunărea de Jos”Galaţi [5]Strmiska, F., Segal, R., Sega, B., Valoarea nutritivă a produselor agroalimentare, Editura Ceres. journals.usamvcj.ro/agriculture/article/view/934/ 930.

Scientific Papers Series Management, Economic Engineering in Agriculture and Rural Development Vol. 14, Issue 2, 2014 PRINT ISSN 2284-7995, E-ISSN 2285-3952
34

Scientific Papers Series Management, Economic Engineering in Agriculture and Rural Development Vol. 14, Issue 2, 2014 PRINT ISSN 2284-7995, E-ISSN 2285-3952
35
PARTICULARITIES OF THE ORGANIZATIONAL CULTURE IN THE HIGHER EDUCATION ESTABLISHMENTS IN ROMANIA Alexandra Patricia BRAICA Vasile Goldiș Western University of Arad, Revoluției, No. 94-96, Arad, Romania, Phone +40213148422 Email: [email protected] Corresponding author: [email protected] Abstract The university is a small nation which has it’s own beliefs and values. The culture, image and the personality of each and every higher education establishment are created in the first place by the people that compose the establishment. The study of the culture of an higher education establishment is essential because an organization can’t be ruled without knowing it’s values. The university is a center of research and innovation which forms the professional competences according to the national and European market demands of labor by taking over and applying the evolved knowledge as a source of inventions, innovations and development in the technological and socioeconomically plan, provider of specialized services for the community. The culture of the organization exerts a very powerful influence on everyone which compose it: teachers and non-teachers, beneficiaries teachings thus meaning the whole academic community. It’s effects are not directly quantifiable, but they create a frame which allows to mend the obtained results, the efficiency of the activity and of the academic demarches as well as it’s effective evolution. In order to succeed and resist in the future, in the context of European integration, of the rank of the higher education institutions, they will be needed to utilize direct methods, strategies and structures adapted to the labor market, but also some indirect methods which can have behavior influences, especially in enhancing or if it’s the case, systematic transformation of the culture of the organization. To successfully transform a university in Romania with bureaucratic accents, mostly protected and isolated, inside a flexible institution, frequent able and opened if time is needed, trust and perseverance, but also of an adequate legislation that can answer to the needs of the contemporary society in the context of allegiance to the European space. Surely a change program won’t solve the situation without being accompanied by changes at the structural levels. Key words: culture of organization, future, history, university, values. INTRODUCTION The culture, image and personality of everyone single one of the higher education establishments are created by the people that compose it in the first place. In this domain there is a great diversity in describing the elements which compose the culture of the organization in this type of institution [1]. The notion of “the culture of the organization” tends to be included more often in the study of organizations and to become a new variable of the contemporary management. In order to succeed and resist in the future, in the context of European integration, of higher education establishments hierarchy, these will have to utilize direct methods, strategies and adapted structures to the labor market and also indirect methods, which can influence the behavior, especially placing it in systemic value of the organization’s culture [2].
In Romania, the study over the organization’s culture is at it’s beginning. The results are characteristic to the prolonged state of transition which left her finger prints on mentalities, values and attitudes. With all these, they are important through their prism of alignment to the theories in international literature and through the fact that cultural profiles were drawn based on the real situation of the Romanian organizations, profiles to which we can associate the corresponding types of management [3]. The defining and evolution of the concept of organizational culture. The development of the concept of organizational culture was favorized also by the major reconsideration of the part which the human resources has it in the evolution of the organization [4]. Starting from the definitions found in the specialized literature, the term of culture could be defined as a system of social behaviors of

Scientific Papers Series Management, Economic Engineering in Agriculture and Rural Development Vol. 14, Issue 2, 2014 PRINT ISSN 2284-7995, E-ISSN 2285-3952
36
the way of thinking and feeling learned and transmitted through other mechanisms other than those biological, generation after generation, integration and those from within a society. The term of “culture” comes from anthropology. It was used to represent it in a larger sense, the physical and spiritual elements that a human collectivity passed from a generation to another [5]. The word “culture” has among others, three acceptations of interest in the addressed theme: “developing some faculties of the spirit through appropriate intellectual exercises, respectively the aggregate of all the knowledge’s accumulated which allow the development of the critic spirit and judgment. The aggregate of the intellectual aspects of a civilization [6]. “The ensemble of the phenomenas acquired of the behavior in the human societies.” In the American Heritage Dictionary, “culture” is being defined as “the totality of beliefs, values, behaviors of the institutions and other results of human thought and work that are passed down socially inside a collectivity [7].” Ovidiu Nicolescu, defines culture as: “the organizational cultures reside in the aggregate of values, beliefs, expectations and behaviors contoured in time individually in each organization which predominates within itself and which conditions directly and indirectly it’s functionality and performances [8].” Le Petit Larousse defines the enterprise culture as the ensemble of structural traditions and savoir-faire which assures an implicit behavioral code and the internal cohesion of the enterprise. MATERIALS AND METHODS The notion of culture allows reaffirmation in a new perspective that can be usefully resourced considering the informal role towards the formal, the human towards the structure, of the behavior and experience towards rationality and methods. RESULTS AND DISCUSSIONS In time four types of cultural phenomena’s appeared in rapport with the organizations, in general: the influence of the national culture
and of the local one accomplished with the help of the members of the organization. a)The influence of the professional community (by social standing, relationships, way of thinking). b)The culture of the group that’s inside the organization (preoccupations, socio-professional categories, way of thinking which determines the apparition of subcultures). c)The culture of the organization characterized through the ensemble of behaviors and elements that give some internal coherence, as well as some practices that are not random at all [9]. Through “culture”, we understand among under things, the ensemble of behavior forms appropriated by the human communities. In this acceptation the organizational culture is an aggregate. This assumes a certain internal coherence, relationships between the elements that compose it and not a desperate collection of diverse habits [10]. The culture of an organization forms a total in which every element answers to the other ones. This aggregate is exclusive only to the organization. There can be some come common traces of the same culture, they can be alike, but they can’t be confused. Exactly this type of uniciti offers importance and makes from the organizational culture a domain of interest for the theorists and practicing of management [11]. The elements of the culture are “ways” of behavior. This means that the elements are not singular, ephemeras or accidentals. Regularities, types, stable characteristics and general that last and reproduce can be recognized. The organizational culture is a phenomena that lasts and which ca be modified, transformed, but in general through slower evolutions that after some sudden changes of situation. The “ways” of behavior are appropriated by inviduals. In dissimilarity of the organizational structure, the organizational culture is not supported, defined, explained through organigrams and procedures. As well as the habitants of a country wear with themselves the national culture so is the organizational culture, is being weared by the individuals that compose an organization. It can be found
Scientific Papers Series Management, Economic Engineering in Agriculture and Rural Development Vol. 14, Issue 2, 2014 PRINT ISSN 2284-7995, E-ISSN 2285-3952
37
inside the individuals by their levels of conciousness. If 500-1000 persons can find themselves in the same place at the exact same hour, even if they share the same emotions following a course, a conference or a concert, they form an assembly, but they don’t have their own culture. Attributing a culture is a slow process which assumes not only a physical presence but an interaction and a continuous and intense learning. On the other side, the “culture” once attributed becomes the source of the appurtenance feeling [12]. The behaviors are not the only elements of a culture, they are rather the consequences of the culture. An organizational culture induces some behaviors to the members of the organization and discourages others. But the ways through which the individuals follow or not the “instructions” of the culture puts in the spotlights some other elements: images, beliefs, symbols, phantasms. An organizational culture has more elements of different nature. In the context of what the universitary managers should do, it would be necessary to remark the impact of the organizational culture and also the impact of the national one. Regarding the first aspect, the most popular essay is that of Peters Waterman. Probably a useful interpretation of the impact of the organizational culture on the managers formation are linked to the four types of cultures identified by him: the culture of power, the culture of the role, the culture of the talk and the culture of the person. Also the national cultural differences are important in every higher education establishments. In it’s interior the universitary organization can be perceived as to having four components that interact with each other: the tasks, structures and organizational systems, the culture and the people, as members of the organizations, where: Tasks, they form the primary component of the universitarian organizational system. They include the activities that must be accomplished, the characteristics of those activities, the quantity and quality of the educational services and products provided by the respective higher education establishment.
The structures and organizational systems, within a higher education establishment include: responsibilities and subordonary lines, informational systems, the monitoring and control mechanisms, the management contracts, post files, the formal systems of reallocation and premieres, the structures of the sessions, the functioning procedures, etc. Even if these traits of the educational organization are relatively easy to describe, they often get to be outdated, incapable to answer to the waiting and the complexity of the universitary environment which is as well in a continuous change and evolution. The organizational culture, it refers to the values, rituals and power sources, rules and loyalties from within the organization, as well as the informal system of recommendation or penalization, which determines the way in which the respective universitary organization works and acts. The people, they come with their different skills, knowledge, experiences, personalities, values, attitudes and behavior. It is necessary that the organization to adopt changes in order to survive in a concurential environment, somewhat imprevisible. The organization must consider the change a favorable occasion, because it helps it to develop and prosper. The elements of the organization’s cultures in the higher education establishments in Romania The organizational culture is composed of a set of values, significations, behaviors and organizational practices. Adatapted to he needs and realities within a certain higher education establishment this would be composed off: a.Founders and circumstances in which it was founded. b.The founding and the founder represent the first moments of the institution (first choice, first experience). The strong personality of the founder, the principles established initially. Most of the time these principles are specific characteristics that can be refunded in the culture of an organization as long as it will exist. At this step the historic personality and resonance of the one that names the

Scientific Papers Series Management, Economic Engineering in Agriculture and Rural Development Vol. 14, Issue 2, 2014 PRINT ISSN 2284-7995, E-ISSN 2285-3952
38
educational establishment can be assimilated. History The history of an higher education establishment can’t be torn apart from it’s external environment. The history that has the most interest, is the once that explains the collectives mechanisms of functioning. To study the history of such an organization it is necessary to start from: A list of activities and products accomplished by the institution: training areas, faculties, specializations, levels (universitary, post-universitary, doctorates, post-doctorales, etc). A list of the researched technologies, utilized, abandoned (to understand what were their competences and have a vision about their evolutions). The “internal” structures will be determined starting from the evolution of the organigrams, the apparition and evolution of the universitary functions, the raise and their decline, the influence upon the management. The “external “structures, the evolution of the universitary instruction by the founding of new faculties, specializations, material acquisitions, fusions, branches, etc; these can be analyzed showing the instruction’s reports with it’s activities( financial reports, etc). Managers and their portraits, professional experience, education, the function, occupation and the carrier it follows, etc. The strategies and how they succeeded: the evolution of the computational positions, specialization/diversification, internationalization, the relationships with other providers of education, with the preuniversitary environment, with the labor market, the strategies for the integration of the graduates on the labor market. The difficulty of studying the culture of an organization, through the prism of her history is generated by: The institutions without history(or recent history). Some institutions of this kind are proud to exist totally in the present and to prepare their future without looking back. There can be educational establishments that have a well prepared and straight forward plan without them being interested to revendicate any traditions or to have a certain history.
by the existence of many histories, they exist because of some reorganizations, some reorientations of the management or because of some inaccurate data. By the existence of unreal histories. Their truth was altered in time. Here are some examples from the Romanian universitary environment: -The University of Bucharest was founded through the Decree nr. 765 of 4 / 16 of July 1864 of the Reigning Alexandru Ioan Cuza and reclaiming itself as the successor of the higher education structures inaugurated by the Royal Academy (1694). -The University of Agronomical Sciences and Veterinary Medicine of Bucharest (USAMVB) is one of the oldest education establishments in Romania. It’s founding is due to the initiative of the Romanian Country Ruler, Barbu Dimitrie Ştirbei who, in the year 1852, takes the decision to found the “Institute of Agriculture in Pantelimon”. On the school’s seal it was represented a hawk that was holding in it’s claws a bunch of gleans. This old symbol of the school stands at the root of the actual seal of the USAMVB. After only three years, in 1855, was taking place the founding of “The school for Veterinary Teachings”, the precursor of the actual Faculty of Veterinary Medicine. -The Babeş-Bolyai University in Cluj-Napoca was founded in the September- October of 1872 through the law nr. XIX, adopted by the Hungarian Parliament on 17 of September and sanctioned by the Emperor Franz Iosif at 12 of October, it takes place the founding of the University in Cluj (with teachings in the Hungarian language). On 4th of January the Emperor Franz Iosif issues the official document of inception of the University in Cluj and accepts that this institution to wear his name. At 12 of september 1919 through the royal edict nr. 4090, signed by the King Ferdinand the First of Romania, it’s decided that the “Hungarian University in Cluj transforms on the first day of october 1919 in the Romanian University”. In 1927 the University in Cluj officialy adopts the name of the king Ferdinand the First. Between 1927 and 1984, the clujean university will be named the “The University King Ferdinand I”. On 28

Scientific Papers Series Management, Economic Engineering in Agriculture and Rural Development Vol. 14, Issue 2, 2014 PRINT ISSN 2284-7995, E-ISSN 2285-3952
39
may 1945 through the royal edict nr. 207, in Cluj takes place the founding “on the date of 1 June 1945, a state university with the teaching in hungarian, with the faculties: “Letters and Philosophy; Law and Political Economy; Sciences; Human Medicine”. The new institution will obtain the name of the University “Bolyai”. In January 1948 – The University “King Ferdinand I” changes its name in The University “Victor-Babeş”. Between march-july 1959 it takes place the process of unification of the Romanian University in Cluj with the hungarian University which will wear the name of University „Babeş-Bolyai”. The first rector of the last University was the profesor Constantin Daicoviciu (arheolog). -The University „Alexandru Ioan Cuza” in Iaşi is the oldest establishment of higher education in Romania, founded by the ruler that achieved the Union of the Principates which name it bares from 1860 to present. -The University “Polytechnic” in Timişoara, was founded in the year 1920, at a period after the Union of the romanian territories, in a european context marked by the statal redifining and the dares of the First World War. At the beginning it was named The Polytechnic School in Timişoara. It formed the answer for one of the requests formulated by romanian society of that time: the forming of engineers. c) The occupation(profession) The object of activity of the higher education establishment in the context of alignment at the Process in Bologna and that of the european integration can be found at the crossroads between education, culture, scientific research and innovation and strategy because the input/output of the institution can evolve and even transform radically. The higher education establishment is a center of research and innovation which forms the adequate professional competences, requested by the national and European market of labor by taking and applying of the advanced knowledge. It’s the source of inventions, innovations and development technological and socio-
economical, provider of specialized services for the community. This offers it’s own resources in order to hire for the civil rights, social justice and promotion of the universal values in the social and human development, it’s the source of promotion for the identities of the national culture, in the context of European and international space of knowledge and of that of the multicultural. An institution of advanced education achieves her role through: -Forming specialists with superior training, capable of integrating efficiently on the labor market and adequate in report with the European standards. -The providing of forming services continues through conversion, reconversion and professional perfectioning programs. -The initiation and the ongoing of fundamental scientific research activieties and applied with the involvement of the teachers, students, masterands and doctorants. -The participation through the results of the scientific research, to the perfectioning of the technologies, socio-economical and cultural activities. -The involvement in the development of civic consciousness, through which the values of pluralism of the state in law founded by respecting the fundamental rights of the man and citizen are promoted. Knowing the competitive advantages of the market of Romanian providers for education, the critical steps, the success factors, the weak points and the strong ones. It allows creating a strategy for the future which means a possible change (diversity of the educational offers). The profession most of the time associated with the competence and savoir-faire-up are not reduced to knowledge. It refers to the capacity of coming to a solution for the problems, to challenge situations, to treat the reality. CONCLUSIONS The need of studying the culture of an institution of superior education is imperative in these days because an organization can’t be

Scientific Papers Series Management, Economic Engineering in Agriculture and Rural Development Vol. 14, Issue 2, 2014 PRINT ISSN 2284-7995, E-ISSN 2285-3952
40
lead without knowing its values, the university being a small nation that has its own beliefs and values. Only by knowing the culture of the institution it can be acted accordingly with it and only by considering this we will be able to change, transform or modernize it. The powerful cultures often have a certain grade of rigidity and inflexibility and are often threatened with the loss of sensibility to internal or external changes fact that creates an danger for the “health” of the educational institution. As far as that goes, the changes determined by the external environment are fast and we cannot say that there are ideal cultures, but we can affirm with conviction that for the future the ideal cultures are the flexible ones. It’s also being imposed a budgetary autonomy and not only. This fact is partially given by the universitary autonomy at the state universities and at the private ones. Considering that they benefit or not of funds from that state. Often a lot of courage is needed to impose drastic personal and organizational measures linked to the change. Sometimes is a management close to the human resources of the organization is beneficial, creating new cultural cells at inferior hierarchy levels, allowing to galvanize the wanted change. The whole process of intervention upon the culture can be helped through behavior according to the wanted culture and by recompensating those who act in accordance with it. Even if it’s true that many leaders are not capable to manipulate the symbolic actions and the indirect means. It’s indispensible, to redefine the positions periodically, to observe the changes that he made and eventually to give new impulses. Because in general it’s difficult, if not impossible for a manager to analyze objectively the culture of his own organization, it is preferably that this work to be done by specialists outside of it. Within the intervention upon the culture, the experience of a consultant can be of big help both in the plan of the method as well as to maintain the evolution of the process of intervention.
REFERENCES [1]Alecu, S., 2007, Development of the scholar organization, the collection Pedagogical contemporary ideas, Didactic and pedagogical Publishing, Bucharest [2]Alexandrescu, I., 1982, Personality and vocation, Publishing Junimea, Iasi [3]Bogathy, Z., coord., Manual of techniques and methods in the Labor and Organizational Psichology [4]Braica, A. P., 2009, The management of human resources, Publishing “Vasile Goldis” University Press, Arad [5]Braica, A.P., 2009, Perfectioning the management of human resources and the gestioning of personnel in the institutions of superior education, Doctorate thesis, The University from West, Timisoara [6]Braica, A.P, 2011, The management of human resources, support ID, Publishing “Vasile Goldis”, University Press, Arad [7]Bratianu, C., Atanasiu, G., Oprean, C., Nica, D., Rinderu, P., Popescu, L., 2000, The management of quality in the superior education, Publishing “Vasile Goldis” University Press [8] Bratianu C., Lefter V., 2001, Strategic universitary management, Publishing Rao, Bucharest [9]Danaiata, I., Bibu, N.A., Prediscan, M., 2006, Management. Theoretical bases, Publishing Mirton, Timisoara [10]Ghergut, A., 2007, General and strategic management in education, Publishing Polirom, Iasi [11]Hofstede, G., Bollinger, D., 1986, Les différences culturelles dans le management, Les éditions d’organisation [12]Ilies, L., Ostoian C., Petelean, A., 2002, The management of human resources, Publishing Dacia, Cluj-Napoca.

Scientific Papers Series Management, Economic Engineering in Agriculture and Rural Development Vol. 14, Issue 2, 2014 PRINT ISSN 2284-7995, E-ISSN 2285-3952
41
PRODUCTION MANAGEMENT AND BUSINESS PERFORMANCE IN AGRI-FOOD INDUSTRY FROM IAȘI COUNTY-ROMANIA Stejărel BREZULEANU1 1 University of Agricultural Sciences and Veterinary Medicine, 3 Mihail Sadoveanu Alley, 700490, Iaşi, Romania, Phone/Fax:0232/407516; E-mail: [email protected] Corresponding author: [email protected] Abstract Solutions and development proposals for agriculture and for increasing of business performance must be sustained by an analysis of the factors involved in agriculture, of the causes which affects the development of agriculture in normal conditions, of the advantages offered by the natural and economical conditions. First of all must be analysed the possibility of agriculture development function of human resources involved in this sector. In establishing the research plan we have in mind the development level of agri-foods units from Romania and in the studied area, Iași County, Romania and also the strategic priorities of this domain in the context of creating of new jobs in rural areas. As gathering technique for the information presented in the current paper we utilised the explicative case study, because we wanted a deep and complex investigation at Societatea Agricola Moldova (Moldova Agricultural Society) from Ţigănaşi village, Iaşi County. From the main indicators of the agricultural production were analysed for a period of three consecutive years the physical main production and merchandise production, and from economical indicators were analysed: turnover, added value, revenues, expenses and profit. Based on this system of indicators could be identified organizational structures, activity domains and products at which were recorded an unfavourable dynamics of profitability or a favourable dynamics, but which is not at the level of competitiveness degree requested by the domestic and foreign market, giving the possibility of applying of some measures for increasing of profitability of the whole economical-financial activity at a high level. At the end of the current study the conclusion is that the society have a profitable activity obtaining profit in all three analysed years, respectively 2010, 2011, 2012 resulting that the performance is a synthetic form of expressing the efficiency of the whole economical activity of the firm. Key words: business, Iași County, performance, Romania, Societatea Agricola Moldova (Moldova Agricultural Society) Tigănași, INTRODUCTION Agriculture represents one of the most sensitive sectors of Romanian economy. To alleviate and correct the blockages which affect the development of agri-food industry to new standards must be made huge efforts by state institutions and business community [2]. Solutions and proposals for development of agriculture must be related to an analysis of factors involved in agriculture, of causes which affect the development of agriculture in performing conditions, of advantages determined by natural and commercial conditions. [6] First of all must be analysed the development possibility of agriculture function of the human resources involved in this sector. Analysing the evolution of the active population involved in agriculture after 1990 could be mainly observed the following
aspects [7]: active population in agriculture is elder, works with rudimentary equipments, generally it is not realised an agriculture which use new and modern technologies and equipment. MATERIALS AND METHODS The utilised research methods in the current study were structured in connection with the steps taken, starting with elaboration of a plan for analyse till drawing the conclusion and elaboration of solutions for this field of activity. Calculus of economical advantageousness indexes still has numerous lacks at the level of agricultural societies from Romania. This could be illustrated through the following aspects: in agricultural farms still exists a real carelessness for determination of advantageousness; nowadays, as a consequence of the deficiencies existed in
Scientific Papers Series Management, Economic Engineering in Agriculture and Rural Development Vol. 14, Issue 2, 2014 PRINT ISSN 2284-7995, E-ISSN 2285-3952
42
bookkeeping are missing the statistical data in the great majority of agricultural societies. So it is mandatory, that on the basis of operative and account data, to be realised a concretion of the indexes which to allow a general view regarding this aspect for the management board of society and implicitly, effectuation of profitability analysis because still exists the idea that important is the obtained quantity, for a immediate selling and obtaining a greater profit, no matter if this one is obtained or not in advantageousness conditions [3] For elaborating the research plan we have in view the development level of agri-food societies in Romania and in the studied area, Iași County, Romania, and also the strategic priority of this field of activity in the context of creating new jobs in rural area. [10] Were consulted data bases from Romania (National Institute of Statistics) and scientific papers or public institutions reports. As collecting technique of obtained information in the current paper we utilised an explicative case study, because we aimed to realise a complete and profound investigation at Societatea Agricola Moldova from Ţigănaşi community, Iaşi County. Realization of a performing management in agriculture, as in any branch of the national economy, is possible only with a good knowing of the evolution of different economical-financial phenomenon during one year of activity, their variation face to prediction and dynamics and also the correct diagnosis of the period. [1] Based on these data, could be establish the correction measures for the observed negative aspects and the extension of the positive ones, to improve the advantageousness of the whole economical-financial activity of agricultural exploitations, at the competitiveness level imposed by the market economy demands and exigencies [4] RESULTS AND DISCUSSIONS General data regarding agricultural exploitation Societatea Agricola Moldova has the headquarters in Ţigănaşi community, Iaşi County, being situated at 25 km from Iaşi
City. Unit is situated in the North-East part of county in the hydrographical basin of middle Prut representing the ending part of inter-river Jijia–Prut. Under the geo-morphological conditions the territory of society is placed in the South-East part of Moldova Plain. Predominant relief is hilly and plain, maximal altitude being 142 meters and minimal 40.5 meters. Clime is specific to South-Eastern European hilly silvo-steppe area. Regarding soils, the analysed unit is placed in the area of levigate chernozems from a slightly more arid silvo-steppe. In according with EC 1257/1999 regulation were delimitated 3 types of unfavourable areas, Ţigănaşi community being part of unfavourable area by specific natural conditions. The main activity of society is cultivation of cereals (excluding rye), vegetables and plants with oleaginous seeds (CAEN 0111), and as secondary activities we could enumerate: joint exploitation of land, production of seeds and planting material for cereals and technical plants, animal rearing, processing and capitalization of agricultural products, handcrafts, production storage and keeping and technical-material supply. Societatea Agricola Moldova is enrolled at Seed Control Inspectorate from Iaşi for seed production in according with Directive EEC 66/402 and Council Directive 2002/57/EC transposed in national legislation by Law 266/2002 regarding producing, processing, control and quality certification, capitalization of seeds and planting material, as also as enrolling of plants kinds and Orders nr. 1262, 1263, 1264/2005 for approving the rules and technical norms regarding producing for selling, control, quality certification and capitalization of cereals seeds, fodder plants, textile plants and modified oleaginous plants. Nowadays society activity is organized in four vegetal farms, one animal farm, a unit for processing-conditioning of cereals’ seeds and technical plants. Indexes of agricultural production From agricultural production indexes we calculate for a number of three consecutive years, primary physical production and commodity production (table 1).

Scientific Papers Series Management, Economic Engineering in Agriculture and Rural Development Vol. 14, Issue 2, 2014 PRINT ISSN 2284-7995, E-ISSN 2285-3952
43
Table 1.Dinamycs of production on crops during 2010-2012[9]
Crop
Cultivated area (ha)
Mean production per
hectare
Total production (tons)
Deviations(+,-) tons
2010 2011 2012 2010 2011 2012 2010 2011 2012 2012/2010
Wheat 500 600 450 5000 4800 4850 2500 2880 2182.5 -317.5
Barley 200 300 300 5500 5200 5600 1100 1560 1680 +1580
Sun flower
600 400 250 2500 2650 2800 1500 1060 1540 +40
Rape 700 700 600 2100 2200 2100 1470 1540 1260 -210
Mustard 200 150 250 1900 2000 1950 380 300 487.5 +107,5
Peas 200 300 350 4300 4100 4000 860 1230 1400 +540
Two-row barley
300 250 300 5400 5100 5600 1620 1375 1680 +60
In table 1 are presented data regarding the dynamics of crop production Societatea Agricola Moldova Ţigănaşi. From the table could be observed a major ascendant dynamics in 2012 face to 2010 only at barley and pea crops, at the other crops being recorded decreasing of production due to decrease of cultivated surfaces but especially due to natural causes (lack of precipitations during summer). At Societatea Agricola Moldova Ţigănaşi commodity production realised during the analysed three years is presented in table 2. Table 2. Dynamics of commodity production during 2010-2012
Crops Commodity production in
analysed period (tons) Recorded
differences (tons)
2010 2011 2012 2012/2010 Wheat 2487 2876 2173.5 -313.5 Barley 1095 1553 1676.5 +581.5 Sun flower 1503.5 1059.5 1533 +29.5 Rape 1465 1535.5 1253 -212
Mustard 378.5 295 488 +109.5 Peas 849 1403.5 1398.5 +549.5 Two-row barley 1608 1374.5 1674.5 +66.5
Recorded differences in the analysed period in case of commodity production at Societatea Agricola Moldova Ţigănaşi are due both to variations of inputs, quantity of agricultural products varying from year to year due to modifications of cultivated surfaces, natural causes and also due to stock variations, recorded losses and internal consumption of society.
Table 3. Utilization efficiency dynamics of fixed assets at Societatea Agricola Moldova Ţigănaşi[9]
Indexes Analysed period
Recorded differences
2010 2011 2012 2010/ 2011
2011/ 2012
Mean value of fixed assets (lei)
5,107,201 5,534,504 5,721,200 +427,303 +186,696
Turnover (lei) 18,519,949 20,351,370 21,237,158 +1,831,421 +885,788 Added value (lei)
5,279,840 5,173,342 5,098,201 -106,498 -75,141
Profit (lei) 1,737,938 1,388,855 1,678,935 -349,083 +290,080 Turnover for 1 leu fixed assets (lei)
3.626 3.677 3.712 +0.051 +0.035
Added value per 1 leu fixed assets (lei)
1.033 0.934 0.891 -0.099 -0.043
Profit per 1 leu fixed assets (lei)
0.340 0.250 0.293 -0.09 +0.043
Could be observed from the data presented in table 3 the accentuated dynamics of technical endowment of agricultural exploitation, but due to unfavourable economical conditions in which is at the moment Romanian agriculture and due to unfavourable natural conditions which had a negative influence on vegetal sector, a part of the analysed indexes had negative values. Societatea Agricola Moldova Ţigănaşi, from own funds but also with support from EU, realised in the last years numerous investments regarding achievement of modern machines and equipments to be able to confront the concurrency. Analysis of incomes and turnover Turnover represents a fundamental synthetic indicator which defines the activity of an enterprise and expresses the totality of obtained incomes from ordinary commercial activities, measuring in this way the economical performances of enterprise. [5]
Fig. 1. Evolution of turnover during 2010-2012
Study of turnover on a long period of time offers information regarding enterprise activity and its tendencies by placing it or

Scientific Papers Series Management, Economic Engineering in Agriculture and Rural Development Vol. 14, Issue 2, 2014 PRINT ISSN 2284-7995, E-ISSN 2285-3952
44
activity domain in one of the products’ life cycle: launch, growing, maturity and decline. From figure 1, could be observed an increase of turnover with 14.67% in 2012 face to year 2010, as a consequence of agricultural technological development for seed production. Incomes of agricultural society represent the sums or values to be cashed, from: goods deliveries, realised works, services and from advantages which society consent to receive after realization of some legal or contractual obligations from thirds, exceptional incomes, which are not connected with the current activity and refer to management operations (chased damages and fines, donations, prescribed unclaimed wages and other incomes), or turnover operations (share-parts from subventions for investments, selling price or disposal of fixed assets disposed, excluding VAT, etc.) [8] Incomes include both incomes from current activities and also the gains from any other sources. Incomes from current activities could be found on different names, such as selling, commission, interests, dividends, royalties and rents. Exploitation incomes (VE) include turnover (CA), incomes from stored production (Vps), incomes from immobilized production (Vpi) and other incomes from exploitation (AVe). VE = CA + Vps + Vpi + AVe Turnover includes the value of sold products, realised works and services, at which are added (at firms with commercial activity) incomes from goods selling. Stored production includes variation of stock of finished goods, semi-finished and unfinished products, at the end of a certain period of time face to its beginning. Immobilized production includes the value of fixed assets realized by enterprise in direct labour operations, for own purposes. Stored production and immobilized production are evaluated in production costs, which means that incomes to be equal with related costs. Financial incomes includes: interest received, incomes from participation and other financial investments, and also other financial incomes. Exceptional incomes include those incomes which are not connected with the current
activities of enterprise. Summing all these income categories for Societatea Agricola Moldova Țigănași total incomes recorded the values presented in table 4. Table 4. Total incomes (RON)
Nr.Denomination of
indicators Realizations
2010 2011 2012 Total incomes, from
which: 20,458,439 23,059,914 25,172,023
1. -Exploitation incomes 18,237,342 21,023,438 24,043,5272. - Financial incomes 2,221,097 2,036,476 1,128,496 3. -Exceptional incomes 0 0 0
Expenditure analysis Expenditures are defined like decreases of recorded economical benefits during a certain accounted period under the form of exits or decreasing of share value or increasing of debts, which determine the decrease of own capital, others than the ones resulted by their distributions to stock-holders. Recognition of expenditures took place simultaneously with recognition of debts’ increasing or reducing of assets (for example, wages or amortisement of fixed assets). To obtain utilization values enterprise use material, human and financial resources, and their consumption is materialized through expenditures. So, expenditures of an enterprise reflects under a value form the whole consumption of production factors or material, human and financial resources, realised for processing and selling of production. The level, dynamics and structure of those expenditures reflect in a synthetic way the activity of industrial enterprises regarding the efficient utilisations of their own resources, and decreasing of their level must be a primordial target for all economical agents, for increasing the efficiency of the whole activity. Total expenditures of an enterprise (Ct) could be grouped on several criteria [8]. An important criterion, for grouping also in profit and losses account, is their nature. In according with this criterion total expenditures (Ct) include: exploitation expenditures (Ce), financial expenditures (Cf) and extraordinary expenditures (Cex). Ct = Ce + Cf + Cex.

Scientific Papers Series Management, Economic Engineering in Agriculture and Rural Development Vol. 14, Issue 2, 2014 PRINT ISSN 2284-7995, E-ISSN 2285-3952
45
Exploitation expenditures represent the reflection in bookkeeping of the costs recorded by company after whole activities in according with activity domain. Exploitation expenditures include: expenditures with raw materials and consumable materials, expenditures with energy and water, cost of sold merchandise, expenditures with external services, expenditures with taxations, fees and other assimilated taxes, expenditures with wages, adjustment of corporal immobilization value and current assets and also other exploitation expenditures. Table 5. Exploitation expenditures - RON
Denomination of indicators Realizations
2010 2011 2012 Total expenditures, from which: 18,389,456 21,440,260 22,538,472Exploitation expenditures 17,642,472 19,281,396 20,297,142
Financial expenditures refer to that costs supported by a company in connection with decisions of funding, investment, exposure to fluctuations of exchange rate or supply. Financial expenditures include: interests of loans contracted, losses from selling investment securities, adjustment of financial immobilization value, and other exploitation expenditures. Table 6. Financial expenditures – RON
Denomination of indicators Realizations
2010 2011 2012 Total expenditures, from which: 18,389,456 21,440,260 22,538,472Financial expenditures 746,984 2,188,864 2,241,330
Extraordinary expenditures or exceptional represent the expenditures generated by situation with a low frequency during activity and/or are due to some unusual situations. In this category enters gains and losses from assets selling (when selling of those assets is not a part of society activity) or costs of “one-off” type (presumed not to repeat) such as significant depreciations of assets, restructuration costs. Exceptional expenditures include those costs which are not connected with the current activity of enterprise (calamity losses). In analysed period at Societatea Agricola Moldova Țigănași weren’t recorded extraordinary expenditures.
Analysis of net return in period 2010-2012 Determination of profit in the analysed period could be graphically presented because permit a faster observation of total incomes and expenditures evolution during the analysed period.
Fig. 2. Evolution of economical indicators during 2010-2012 Could be observed that 2011 wasn’t a good year for enterprise activity, because in period 2010-2011 was recorded a decrease of gross profit with 449,329 RON and immediately in period 2011-2012 society recorded an increase of 1,013,897 RON, the highest value of gross profit being 2,633,551 RON in 2012. Structural analysis of profit To realise a structural analysis of profit we will need the incomes and expenditures values from all three activity domains during 2010-2012 period. Result of exploitation – profit or losses from exploitation is determined as being the difference between exploitation incomes and exploitation expenditures. Graphically the exploitation result is shown in figure 3.
Fig. 3. Result of exploitation It could be observed that society records profit from exploitation activities, the best value being recorded in 2012.

Scientific Papers Series Management, Economic Engineering in Agriculture and Rural Development Vol. 14, Issue 2, 2014 PRINT ISSN 2284-7995, E-ISSN 2285-3952
46
After the realised analysis the conclusion is that society had a rentable activity, obtain profit in all three analysed years, respectively 2010, 2011, 2012 resulting that return is a synthetic form of expression for the efficiency of the whole economical activity at Societatea Agricola Moldova Țigănași, Iași County. CONCLUSIONS To be able to have an efficient and competitive production, agricultural exploitations, no matter of their type, must enrol in the tendencies at the nowadays world agriculture, to promote qualitative factors such as knowledge development, managerial training, technical improvement, utilization of modern technologies, IT, etc. For increasing the society performances is recommend achievement of new agricultural machines, optimization of fixed costs, accessing of new European funds and a better information on the new products launched on agricultural market (herbicides, pesticides, fertilizers, etc). Also it is necessary a very good knowing of market for selling the products at advantageous prices and quite easy. All those conditions could be realised only by implementation of a performing management system for agricultural exploitation. All the successes and realizations of Societatea Agricola Moldova Țigănași, Iași County are presented with several occasions (interviews, participation at fairs and exhibitions) in mass-media by firm managers and this fact offers a credibility and a certain „weight” of the information. We recommend the allowance of all the necessary resources for development, implementation, maintaining and continuous improvement of management system which coordinates production activity, environmental preservation, labour security and health. REFERENCES [1]Alecu, I. et al., 2001, Managementul exploatațiilor agricole. Editura Ceres, București [2]Brezuleanu, S., 2010, Sisteme de producție în agricultură. Editura Alfa, Iași
[3]Brezuleanu, S., 2009, Underlying the decision by the calculus of maximum economic effects for the optimization of some production processes. Lucrări Ştiinţifice 2009, Seria I, vol XI (2) [4]Brezuleanu S., Brezuleanu Carmen Olguța, Iațco C., 2013, Fundamentation of human resources in agricultural exploitations on the basis of labour productivity indicators, Environmental engineering and management journal, April 2013, 4:763-767 [5]Cojocaru C.C., 2000, Analiza economico-financiară a exploatațiilor agricole și silvice. Editura Didactică și Pedagogică, București [6]Elliott H., 1994, Applying the agricultural technology systems approach: Lessons from ISNAR's experience. In R. M. A. Loyns & F. Datepa-Mupondwa (Eds.), Management for researchers. Department of Agricultural Economics and Farm Management, University of Manitoba. Winnipeg, Manitoba: Friesen Printers [7]Râmniceanu Irina, 2004, Problemele structurale ale agriculturii românești în perspectiva aderării la UE. Editura IER, București [8]Vlad Mihaela Cristina, Toma Elena, 2007, Aspecte privind analiza tehnico-economică în exploataţiile agricole vegetale, Editura Cartea Universitară, Bucureşti [9] Database of SC Agricola Moldova Țigănași Iași [10]www.pndr.ro, Programul Național de Dezvoltare Rurală

Scientific Papers Series Management, Economic Engineering in Agriculture and Rural Development Vol. 14, Issue 2, 2014 PRINT ISSN 2284-7995, E-ISSN 2285-3952
47
MANAGEMENT- KEY PLAYER OR EXECUTIVE POWER OF AN ENTITY IN RURAL AREA IN THE TRANSITION PROCESS Ion CERTAN1, Maria BANARI2 1Moldova State University, 60 Alexe Mateevici St., MD-2009, Chisinau, Republic of Moldova, Phone: +37322 57 78 03, Fax: +37322 24 42 48; E-mail: [email protected] 2City Hall of the Chisinau Municipality, Prima Casa Program, 83 Stefan cel Mare Ave., MD-2012, Chisinau, Republic of Moldova, Phone: +37322 20 17 14, Fax: +37322 20 16 39; Email: [email protected] Corresponding author: [email protected] Abstract Since independence, Republic of Moldova aligns among the developed countries and this process is related to the transition from the command to market economy. This process is lengthy, laborious and often contradictory, especially in rural areas. In the given article we consider the process of transition in rural areas from kolkhozy/collective farms to market economy entities through the prism of organizational policies, activities, staff of contemporary agricultural enterprises based on example of Brinzenii Vechi village, Telenesti, Moldova. That will be followed by some conclusions on the role of management as well as the impact on sustainability of local development. Key words: development, management, market economy, policy, rural area INTRODUCTION As it is known, agriculture is the main branch of economy in all the world countries. Republic of Moldova passed in the last two decades through a difficult and controversy process from the command to market economy, which affected the development of farming itself and rural areas as a whole. The purpose of the present investigation is to consider the evolution of changes of the economic entities in rural areas from kolkhozes to market economy institutions and the role of management, making reference to the socio-economic development based on Brinzenii Vechi village. The transition from the command to market economy is a topic under a continuous study especially with a focus on countries in transition, such as the CIS ones. Transition economies undergo economic liberalization, trade barriers are removed and the creation of fundamentally different or brand new public institutions focused on the promotion of private-owned and market oriented entities. [10] Usually, this is done by developed countries, like: USA, Japan and EU, through international and local financial institutions,
aiming the achievement of best practices policies and standards. Moldova, after the collapse of the Soviet Union, was hassled by a turbulent restructure characterized by an economic decline, followed by stabilization and further growing process, as a result of consecutive reforms and projects, implemented due to technological and financial assistance of different international and developed countries institutions. MATERIALS AND METHODS The materials used in the research are national legal acts, policies and mechanisms on market economy, agricultural enterprises and management related to our country that tends to the European integration. The study of statistical information on Brinzenii Vechi village has provided us relevant information on the evolution of agricultural institutions and the rural area development after the soviet period. In the research were applied specific methods and techniques of economic investigations.

Scientific Papers Series Management, Economic Engineering in Agriculture and Rural Development Vol. 14, Issue 2, 2014 PRINT ISSN 2284-7995, E-ISSN 2285-3952
48
RESULTS AND DISCUSSIONS With almost 300 years ago Moldova was devastated by Turks and Tatars, so that the natives could not lead a stable life and often changed their place of residence. Groups of people from Acherman parts, which were the center of Turkish domination, by the beginning of the 16th century they left the homeland, and went with herds of cattle and flocks of sheep toward the North reaching the shore of river Raut. Here, finding places away from oppressors and good pasture for cattle, settled down permanently. At first, there were only a few family clans, namely: Banari, Morari, Bolocan, which practiced sheep breeding and fishing and were skilled craftsmen in preparation of cheese. People from the neighbour settlements were coming to the cheese-makers brinzarii from Raut and bought cheese, hence the name of the village Brinzeni. The village is attested documentary as being founded on April, 20, 1555 in district Orhei. The residents became shortly servants for boyar Uvaliu, who had land in the nearby territory Cazanesti. [1] Thus, the village Brinzenii Vechi began to develop and enhance the status of the community. The settlement is located on 26 ths ha in the center region of Moldova, along the national road M2, on the right side of river Raut, being just 40 km away from district Telenesti and 100 km from the capital city Chisinau, as seen on Map 1. There are 3150 inhabitants, of which: 1580 women and 1570 men with a population density of 83.6 inhabitants per m2. The 1921 agrarian reform through the institution "Our House" allotted the villagers with over 3000 ha of land from the estate of Borodin, Calinescu and Uvaliu. Until 1940 there was a cooperative farming. The village suffered greatly as a result of overall massive collectivization process and other factors. In the village was formed a kolkhoz. Data from the end of the 20th century indicate that villagers are working in the local agricultural cooperative "Brinzeni". In the village had appeared the first appropriated peasants, working either individually or in the peasant association "Fountain of Musteata".
The village registered development during the late 80s, being on the 2nd place in the country, due to the activity and productivity of the poultry factory “Avicola” that recorded revenues of over 1 mil rubles. As the production quality was poor, this was not lasting and led to the rapid collapse of the farm. The kolkhoz from Brinzeni was average efficient as to the functioning of the cattle, sheep and pork farms, apiculture and pomiculture. While Moldova achieved independence in 1991 as a middle–income country, it is now one of the poorest countries in Europe, with GDP per capita significantly below the average of the Central European countries. Moldova is ranked 117th in the 2009 Human Development Report, with a Human Development Index (HDI) value of 0.72. Thus, Moldova is one of the lowest ranking countries, in terms of HDI, covered by the European Neighborhood Policy. With a per capita income of US$ 880 (GNI Atlas method, 2005) Moldova is the poorest country in Europe and the only one currently classified as a low-income country by the World Bank. [8] Many of those who recently moved out of poverty are just above the poverty line and are vulnerable to an economic downturn. Thus massive land privatization and institutionalization of National Castrate System fertilized the land for local development. The evolution of the entities after 90s declined continuously due to the inefficiency of institutions and their activities that lead to social exclusion. Social exclusion is a complex phenomenon, dynamic and multidimensional, linking various dimensions of life from which people are excluded. There is no single, agreed definition, mainly due to the difficulty in defining an ideal referenced state of inclusion. Social exclusion refers to marginalization from employment, income, social networks such as family, neighborhood and community, decision making and from an adequate quality of life. The problems of social exclusion are often linked and mutually reinforcing. It is often difficult to disentangle the causes and consequences. The risk of

Scientific Papers Series Management, Economic Engineering in Agriculture and Rural Development Vol. 14, Issue 2, 2014 PRINT ISSN 2284-7995, E-ISSN 2285-3952
49
social exclusion is highest for those with multiple disadvantages. [7] However, unemployment is the major factors contributing to social exclusion, as employment and job security promise an income to satisfy basic needs and provide social integration and social identity at the same time. Financial exclusion can be described as the inability of individuals, households or groups to access necessary financial services in an appropriate form. The causes and consequences of financial exclusion can contribute to social exclusion. Those unable to access finance for enterprise development or personal consumption have greater difficulty in integrating economically through employment and self-employment. Eastern Europe has experienced dramatic economic change in the past 17 years where in the former communist countries structural reasons for social exclusion prevail. These reasons are first of all unemployment caused by the collapse of state owned industry and farms followed by significant social welfare cuts. [6] In Western Europe social exclusion is also linked to unemployment. Here, however, unemployment is in part the result of the shift from an industrial based economy to a service oriented and technology dominated economy. And although the welfare state is under pressure, when compared to Eastern Europe, it continues to provide significant benefits in the form of income support, national health and retirement payments. The fight against social exclusion has been a major concern of EU policy since the early 1990s. Facilitating participation in employment and access to resources, rights, goods and services for all have become key European goals. In order to increase transnational policy cooperation, all Member States have been asked to prepare national action plans on social inclusion. During the soviet period, a branch of the saving bank existed in almost every village, mobilizing important amounts of savings from the population. Low interest credit facilities allowed young families to start off a new livelihood; this concerns especially credits for the construction of houses. The system
collapsed because of high inflation during the early 1990’s, in the first years after the proclamation of independence of the Republic of Moldova. This led to the loss of all savings. Because peasants have lost their life savings, it was difficult for financial institutions to start new saving activities, even in the self-managed saving and credit associations. This is why the collection of deposits by commercial banks was highly insignificant during 1998-2002. Farmers lost their trust in these institutions, so whenever there was cash, it was immediately invested in assets or consumed. Trust in financial institutions had to be regenerated. After 1991, with the start of market economy relations, a process of informal lending has been developed in rural areas. In the villages, the money lending process was not being conducted on a constant basis. Farmers used to borrow money when there was an urgent need, and they lent money to others when they were able to.
Table 1. Comparative analyze of donors approaches Approaches WB group GTZ
Management Project implementation unit with local experts combined with short-term visits of international experts teams (1-2 week/visit)
Established office in Moldova with a permanent international experts team based on mid-term assignment (3-4 years)
Transfer of Knowledge
Sort-term trainings of trainers and SMEs developers
On-job training on a day by day base
SMEs development
Use of trained NGO developers with a seldom site visits
Trained NGOs together with international expert
Institutional development
Built from scratch Use of local existing ones, selected through tender
Financing Creation of intermediary non-banking financial institution
Use of local banking system,
SMEs assistance
Permanent tuition since the first founders meeting
Initial support up to the first month of activity and after Jungle rule – The strongest will survive is applied
Consultancy Permanent On demand
Source: Developed by author based on ex-post evaluation Nowadays, the financial sector still resists to the effects of the financial crisis, but its capacity to credit the economy, in the current circumstances, is seriously affected, thus

Scientific Papers Series Management, Economic Engineering in Agriculture and Rural Development Vol. 14, Issue 2, 2014 PRINT ISSN 2284-7995, E-ISSN 2285-3952
50
determining the transition economic process of the country. Following the collapse of the Soviet-era supply and trade links, agriculture experienced a downturn in terms of yields and trade volume. Kolkhozy (the large collective farms) and sovkhozy (the Soviet farm or collective management) were the two components of the socialized farm sector that began to emerge in Soviet agriculture as an antithesis to individual or family farming. The Soviet farms were gradually broken up into more than 1 million small, private holdings. [9] Since independence the land was divided into allowances, so that some peasants gave their land on lease, others decided to work it out by themselves, while another part formed their own enterprise. Once with the privatization process, which started in 1998, replacing the soviet kolkhoz, in the village appeared several economic entities, as are indicated in the bellow table: Table 2. Economic agents in Brinzenii Vechi Economic agents 2002 2003 2004 2005 2006 Individuals, including: - Individual enterprises
3 4 5 6 6
- Patent holders 1 1 2 3 4
- Stock companies 1 1 1 1 1
Enterprises eligible to legal entities, including: joint stock companies
0 0 0 1 1
Total 5 6 8 11 12
Source: Authors’ analysis on the basis of data from Brinzenii Vechi Local Council Decision, 2007 The intravilan resources of the village Brinzenii Vechi in 2002-2006 were of 3940.01 ha, including reserves of 3.92 ha and land under construction of 11.29 ha, while the agricultural land resources of the village of the total 3806.57 ha in 2002, including arable land (2398.72), perennial plantings, such as vineyards, orchards (37.91 ha and 163.05 ha), pastures and meadows (613.22 ha) and fallow land (22 ha), recorded indicators of 2178,37 ha - arable land, 141.20 ha - perennial plantings, 553.22 ha - pastures and meadows and 75 ha for fallow land. [4] These data changed over the time, because some lands
were transformed into pastures, rented by the economic agents or given under construction usage. The main economic agents in the village are: LTD “Brinzeni Agro” - 744.4 ha of rented farmland, LTD “Export-Agro Stincari” - 41.7 ha of apple orchard, LTD “Marodinal” - abator for slaughter of the animals, LTD “Iurinic Prod” - breeder for youth poultry, LTD “Alina&Roberto”, COOP “Cazanesti”, IE “Prenco Gr.St.” - 598.61 ha of agricultural land. [2] These agents solve the problem of animal breeding of the village, since in the late years the locals cannot afford to grow animals, because of the lack of resources and high cost of their maintenance. According to data provided by the State Registration Chamber [3], in district Telenesti are recorded 1614 individual enterprises and legal status in 2012, of which in Brinzenii Vechi are as shown in Table 3. Table 3. Enterprises in district Telenesti and Brinzenii Vechi
Enterprises Telenesti Brinzenii
Vechi Industrial enterprises: 118 0 Constructions enterprises 35 0 Commercial enterprises: 1187 12 Fuel Stations 18 1 Crop production purchasing enterprises
9 2
Livestock production purchasing enterprises
17 2
Transport enterprises 31 2 Production cooperatives 24 3 Agricultural enterprises 123 2 Other services 81 2
Source: Authors’ analysis on the basis of data from Brinzenii Vechi Local Council Decision, 2007 and Telenesti District Council Decision Nr. 1/1, March, 14, 2013. For the Republic of Moldova, agriculture was, is and, in the nearest future, will remain the most important segment of our national economy. That is why the leading economic agents in the village are oriented towards the agricultural aspect. The first integration stage subsequent to the privatization process, involved the program “Leader” implemented by USAID, according to which the villagers were encouraged to unite around a leader. Such was the case of the individual enterprise founded by Cotlau Nicolae in 1999. This leader gained an experience of a good management practice

Scientific Papers Series Management, Economic Engineering in Agriculture and Rural Development Vol. 14, Issue 2, 2014 PRINT ISSN 2284-7995, E-ISSN 2285-3952
51
when he worked as a mechanical engineer in the Association of Agricultural Land Improvement from Telenesti. The main duties of the company were to rent peasants land and to provide processing and maintenance services. The LTD “Brinzeni Agro” was founded in August 2011 and collaborates with CB "Moldova Agroindbank" SC. The workforce of the company is stable, relying on the people from the village as full-time employees, and recruiting people from the neighboring villages for seasonal work (harvest gathering from orchards in spring-summer seasons). Throughout its development, the revenue growth of the company influenced the wage growth. The leader Mr Cotlau Nicolae participated in 2003 at an exchange program experience held in the Netherlands and in 2009 at a forum in Turkey. Meanwhile, during the years 1999 – 2000, in the village were instituted two micro-financing organizations, and namely the Savings and Credit Associations: “Rusu Veaceslav” and “Condrea Svetlana”, a fact that gave the inhabitants the opportunity to take out a loan for their several necessities. Microfinance refers to the provision of financial services - micro-loans, savings, insurance or transfer services - to low income households. It is widely seen as improving livelihoods, reducing vulnerability and fostering social as well as economic empowerment. Microcredit refers to provision of micro-loans for microenterprise development and can be a tool for social as well as financial inclusion, as it helps to prevent and redress all the areas of exclusion – poverty, low income, lack of employment - which are evidenced as a major component and reason for social exclusion. Moreover, programs that provide training, advice and networking opportunities enhance skills and social empowerment of underprivileged groups, further contributing to inclusion. The question of how best to provide financial services to the poor has fueled intensive debates worldwide. The debate can be summarized into two different schools of thought: the institutionists and the welfarists.
Although both view poverty alleviation as their prime objective, each camp defines poverty differently, and, consequently, each has a different view of what is the best means of helping the poor gain access to financial services. The institutionists believe that microfinance will make a significant and permanent dent in poverty only if microfinance is significantly scaled up through its integration into formal financial systems which can guarantee permanent and financially self-sufficient services for large numbers of poor people. Welfarists do not believe that full financial self-sufficiency is a prerequisite for them to be able to reach poor people. They fear that the need to be financially self-sufficient (profitable) in order to attract private capital, will divert the industry from its paramount goal of poverty alleviation. Microcredit programs implemented in the most of the East European countries generally fall into the institutionists’ school of thought and those implemented in the West generally fall into the welfarists approach. This difference is the result of historical, structural and legal factors. This difference creates excellent opportunities for cross regional sharing of best practices but also potential conceptual as well as practical difficulties in their application. [5] The Republic of Moldova is the only place were two approaches met at the same time, from 1998 to 2004. Institutionists were represented by World Bank group and Welfarists by German Technical Assistance (GTZ) and Brinzenii Vechi village is one of the places that benefit from both international donors, which explains the existence of two microfinance institutions within a limited geographic area. As a result, appeared various economic agents that activate in trade, such as those 544 peasant households - 767.89 ha and the individual enterprises “Bunescu Nicolae”, “Bulmaga Vladislav”, “Morari Ludmila”, “Morari Serghei”, “Darii Gheorghe”, “Deleu Raisa”, “Stincari Ludmila”, “Comerzan Veaceslav”, “Berliba Lilia”, TC “Agrospic Service”, 2 offices for artificial insemination of animals, 2 milk collection points –

Scientific Papers Series Management, Economic Engineering in Agriculture and Rural Development Vol. 14, Issue 2, 2014 PRINT ISSN 2284-7995, E-ISSN 2285-3952
52
providers for the three large companies: JSC "Incomlact" - Balti, LTD "Lapmol" – Calarasi and JSC "JLC" from Chisinau, and in the associative sector activates the association PA (Producers Association) “Prometheus Brinzenii Vechi” supporting the educational process. [2] Even though, the kolkhoz was disbanded, each individual maintained according to specific forms and has been reorganized. This fact allowed stopping migration phenomenon of the years 1995 – 2003. Nowadays, the management role lies both to the local administration and each economic asset entity in the locality. The public administration management is the science that studies how public administration bodies work, how they respond to social needs, how they use them rationally material and financial resources are entrusted, as serving the people and also provide solutions to ensure the optimal functioning of the administrative apparatus at all levels, because it can solve in a short time with minimal costs faced problems, improve style, methods and techniques of leadership, managing people. The public administration is a system with a well-defined structure, which represents the overall connections between all its elements: the central and respective local councils and mayoralties. The mayoralty became the main key player in the transition by the activity process rules and principles that ensure effectiveness and legality of its actions. In the period after independence, Brinzenii Vechi was led by 2 mayors, who were elected for 2 consequent mandates each. The stability of the public function of the mayors’ states about the confidence the villagers had in the leaders and in the fact that they deploy efficiently the public administration tasks. Thus, the management functioned more as a key player than an executive power in the transition process in this rural area, for example along the last decade in the village the following projects were implemented and developed by the local administration: MSIF 1 (Moldova Social Investment Fund)
- Capital repair of the school building (2003)
Ecological Fund - Water supply (2012)
FRMI (Forest Research and Management Institute) - Landscaping of meadows (2006)
2 KR ( Japan - Moldova Project) – Supply with modern agricultural machinery (2006) [11]
MSIF2 - repair of the cultural house building (2005)
MSIF 3 - repair of the central road connecting the villages Brinzenii Vechi and Brinzenii Noi (2010)
the construction of a mini football field in the village center (2013)
central street lighting (2013) The local public administration has few skills to communicate openly and honestly with their citizens on solving existing problems relying on mutual trust. Mobilizing community resources to address demanding issues is a business activity that should be possessed by the local institutions. The entrepreneurship spirit should dominate in society, because without this component the local development is impossible. The relationship between local authorities and the citizens that serve them is the most important factor in assessing local democracy. From our point of view, this relationship depends heavily on the experience of both parties and their willingness to collaborate. The people cooperate and contribute to the positive development of their village, either by financial way or the labor force. The experienced leaders of the local management know very well that effective leadership means first successful cooperation with all local agencies. Once local authorities have managed to convince businesses and community representatives to participate in the process of local economic development, cooperation and contribution is required to be recognized and appreciated. Besides, the legal framework should define clearly the responsibilities of the central public authorities regarding rural development issues that will set the criteria for inter-institutional cooperation. Gaps in rural area development regulation and the delineation of powers among the main central public authorities can affect the attention paid to rural development

Scientific Papers Series Management, Economic Engineering in Agriculture and Rural Development Vol. 14, Issue 2, 2014 PRINT ISSN 2284-7995, E-ISSN 2285-3952
53
and the effectiveness of related policies in continuing to focus on a narrow sectorial approach, ignoring the need for coordination, as well as damage the importance of rural development and focusing on other economic sectors. Local public administration depends on its well-defined structure, but it also is influenced by the local development and the improvement of the entities activity effectiveness. CONCLUSIONS Analyzing the evolution of SMEs system in the Republic of Moldova mainly focused on Brinzenii Vechi village we can observe the tremendous role of management in its development. During the last ten years huge amendments occurred, fact that come to support the thesis of management as a live body, reacting to major external changes and enable the vitality of the system through time. Definitely a lot of qualities such as adjustability, compatibility, uniformity, unity, etc. are characteristic for “set of rules” of this sector, being at the same time integrated and incorporated in the management system of a country. In our opinion this is one of the most relevant examples of two major ways of system export with a lot of pros and contras. Probably the institutionist approach is relevant for countries in transition as well as for less developed countries in terms of time and is very important to find out the most appropriate moment to shift towards welfarists one. In conclusion we have to state that the durable development of rural space in our country may be assured by development of institutional system and efficient usage of: Mobilization and thought-through use of
human, natural and material capital; Promoting and support of economic
activities in the rural space; Protection of environment and cultural
patrimony specific to the rural localities; Preservation and transmission of specific
traditional professions;
Improvement of business climate and provision of support to the small agricultural producers;
Assurance of a favorable investment climate for the development of business environment;
Vocational education of human resources in the rural space.
Generally, the role of the local public administration implies: to create conditions for a better living
environment; to form and attract new private economic
agents to maintain a dynamic entrepreneurial
culture, create partnerships with different sectors in terms of local development process
to adapt the local comparative advantage to local economic activities, which lead to a level of economic prosperity according the expectations of the population.
It is necessary that the local authorities to constantly promote the concept of sustainable development, to preserve and create new jobs in the village, which will generate new income statement for raising the living standards of citizens, will strengthen the tax base to support local management. Each community depending on the economic conditions and the specific of the region, adopts its own development strategy, taking into account certain principles and laws. REFERENCES [1]Belâi Liviu, 2000, Localities of the Republic of Moldova: documentary-publicist illustrated itinerary, Vol. 2, Chisinau [2] Strategic plan for social and economic development of the community Brinzenii Vechi, years 2007 – 2012, Brinzenii Vechi Local Council Decision, 2007. [3] Telenesti District Council Decision Nr. 1/1, March, 14, 2013. [4] Statistical Yearbook of the Republic of Moldova, years 2000-2010. [5]Certan Ion, 2012, The role of international institutions in sustainable local development on example of establishing microfinance in Republic of Moldova, Agrolife Scientific Journal, Vol. 1 [6]Silver Hillary, 2007, Social exclusion. Comparative Analysis of Middle East Youth, Nr. 1, Brookings [7]The World Bank, 2013, Inclusions matters. The fooundation for shared prosperity

Scientific Papers Series Management, Economic Engineering in Agriculture and Rural Development Vol. 14, Issue 2, 2014 PRINT ISSN 2284-7995, E-ISSN 2285-3952
54
[8]The World Bank, 2002, Rural Investment and Services Projects 1 [9]The World Bank, 2007, Integrating Environment into Agriculture and Forestry Progress and Prospects in Eastern Europe and Central Asia, Vol. 2, Moldova Country Review [10] http://en.wikipedia.org/wiki/Transition_economy [11] http://www.2kr.md/

Scientific Papers Series Management, Economic Engineering in Agriculture and Rural Development Vol. 14, Issue 2, 2014 PRINT ISSN 2284-7995, E-ISSN 2285-3952
55
AGRICULTURE AND RURAL DEVELOPMENT IN ASSOCIATION AGREEMENT BETWEEN THE EUROPEAN UNION AND THE REPUBLIC OF MOLDOVA Simion CERTAN1, Ion CERTAN 2 1State Agrarian University of Moldova, 42 Mircesti St., MD-2049, Chisinau, Republic of Moldova, Phone: +37322 57 78 03, Fax: +37322 31 22 58; E-mail: [email protected] 1Moldova State University, 60 Alexe Mateevici St., MD-2009, Chisinau, Republic of Moldova, Phone: +37322 57 78 03, Fax: +37322 24 42 48; E-mail: [email protected] Corresponding author: [email protected] Abstract After the approval of the Declaration of Independence (August 27, 1991), Moldova lives hoping to strengthen its place among the democratic nations of the world and to build a new socio-economic system which among other things passes through a difficult phase in the conjugation of its own efforts with the international community. Our country has an identical history and shares common values with the European Union Member States, a thing that inspired the initialing of the Association Agreement between the EU and the Republic of Moldova. The article reflects on Moldova's European choice and impacts on agriculture and rural development in the country. Key words: agriculture, association, cooperative, economics, efficiency, policy INTRODUCTION The association is a complex process of integration, deepening the interdependences among the countries that are based on the free movement of goods, people and capital under the formula "leave things to go on their natural course". The integration vector of the national economy, stated by the public authorities and accepted by most of the population of our country is the European Union. For our country the European economic integration has become an ambitious concern being influenced by the historical conditions and the forms of economic development of both our state and the European Union. This trend is fueled by the experience gained in the process of the Partnership and Cooperation Agreement which was developed within the European Neighborhood Policy and the Eastern Partnership and the mutual desire of the Parties to develop, strengthen and expand the relations further. The impact of the association agreement between the EU and Moldova [1] on agriculture and rural development determines the relevance of this material.
The study of various aspects of association, cooperation and economic integration was done both in the country and abroad. However, even if the matter was investigated, discussed at various official meetings, addressed to the scientific sessions, exhibited in several national and international publications, integration of agriculture and rural development in terms of our country's EU association is less studied, a fact that urged us to meditate on the model, methods of association, the possible consequences for agriculture and rural development in our country. MATERIALS AND METHODS In the research we used the Association Agreement between the European Union and the Republic of Moldova, initialed in late November 2013, the national and international laws, textbooks, monographs and other publications specific to the theme. The survey is realized on selected data and processed by the authors based on statistical yearbooks of the Republic of Moldova, Eurostat, and other publications that provided us meanings and explanations relevant in relation to the phenomena and processes that

Scientific Papers Series Management, Economic Engineering in Agriculture and Rural Development Vol. 14, Issue 2, 2014 PRINT ISSN 2284-7995, E-ISSN 2285-3952
56
currently occur. In the research were applied methods and techniques which are specific to economic investigations. RESULTS AND DISCUSSIONS Agriculture in the national economy Gross domestic product of the Republic of Moldova (current prices) is reduced from $ 3,592.9 million in 1990 to $ 1,288.4 million in 2000 (Table 1) or by 2.79 times, followed by an increase up to $ 7,252.8 million in 2012 or by 5.63 times. GDP - calculated in comparable prices is reduced from $ 5,960.8 million in 1990 to $ 2,122.5 million in 2000 or by 2.8 times, and then increased to 3,726.0 in 2011 or by 1.76 times and is slightly reduced reaching $ 3,696.1 million in 2012. Table 1. Gross domestic product of the Republic of Moldova
1990 1995 2000 2005 2010 2011 2012 GDP total, mil $ current
3592.9 1753.0 1288.4 2988.2 5811.4 7015.2 7252.8
GDP mil $(comp.2005)
5960.8 2389.7 2122.5 2988.2 3501.4 3726.0 3696.2
GDP growth,% pa
-2.4 -1.4 2.1 7.5 7.1 6.4 -0.8
GDP per capita, $ current
972.1 476.0 354.0 831.2 1651.5 1970.1 2037.6
GDP per capita, PPP, current international $
3330.3 1514.7 1475.3 2362.0 3073.4 3335.9 3368.3
Agriculture, value added (% of GDP)
36.1 33.0 29.0 19.5 14.4 14.8 13.1
Industry, value added (% of GDP)
36.7 32.2 21.7 16.3 13.2 16.8 16.8
Services etc., Value added (% of GDP)
27.2 34.8 49.3 64.2 72.4 68.4 70.2
Source: http://data.worldbank.org/indicator If in 1990,the GDP in comparable prices exceeded the calculated one in current prices by 1.66 times, than in 2012 it made up only about 50 percent, which shows that the GDP - increases on prices account. Besides, the largest annual increase in GDP (7.5%) was registered in 2005, and the most pronounced annual reduction - in 1990. Basically the same dynamics is present at the GDP calculated per capita. If GDP per capita in $ current is reduced from $ 972.1 in 1990 to $ 354 in 2000, or by 2.7 times then it
increase to $ 2,037.6 in 2012 or 76 times. Being calculated according to PPP it decreases from $ 3,330.3 in 1990 to $ 1,475.3 current in 2000 or by 2.26 times then increases to $ 3,368.3 in 2012 or by 2.28 times. In 1990 in the GDP structure dominated by 36.7% the value added formed in industry, followed by 36.1% of value added in agriculture and by 27.2% of value added services formed in services. In 2012 with 70.2% dominates the value added formed in services, followed by 16.8% of the industry and 13.1% of value added in agriculture. Even though the share of agriculture in GDP generally tends to decrease from 36.1% in 1990 to 13.1 percent in 2012 and by 2.75 times this branch remains very important for the economy of the Republic of Moldova because it is the most practiced activity in space areas of the country, where by January 1, 2013 there were 2,067,332 people established with the living which forms 58.1% of the population of our country [2]. Moreover, even under the decreasing share of value added formed in agriculture, national food products are the most exported goods in our country. Firstly, the domestic market of the Republic of Moldova is limited to those only about 4.3 million consumers and subject to their purchasing capacity [3]. The average monthly income available compared to the average cost of living per person even if increased from 51.4% in 2001 to 99.9% in 2012, while those in agriculture were 62.3% it was not enough. Moreover, the national economy does not have sufficient resources, particularly energy, in order to ensure the continuous production of goods. Thus, Moldova is sentenced to trade with other countries. The export of goods and services decreased from $ 795.0 million in 1996 to $ 471.5 million in 2000 (Table 2) or about 1.7 times, and then grows to $ 2216.8 million in 2011, or by 4.7 times, falling slightly to $ 2,161.9 million in 2012. Imports of goods and services decreased from $ 10,723.3 million in 1996 to $ 776.4 million in 2000 and increased to $ 5,212.9 million in 2012 or by 6.7 times. Commercial debt is steadily increasing from $
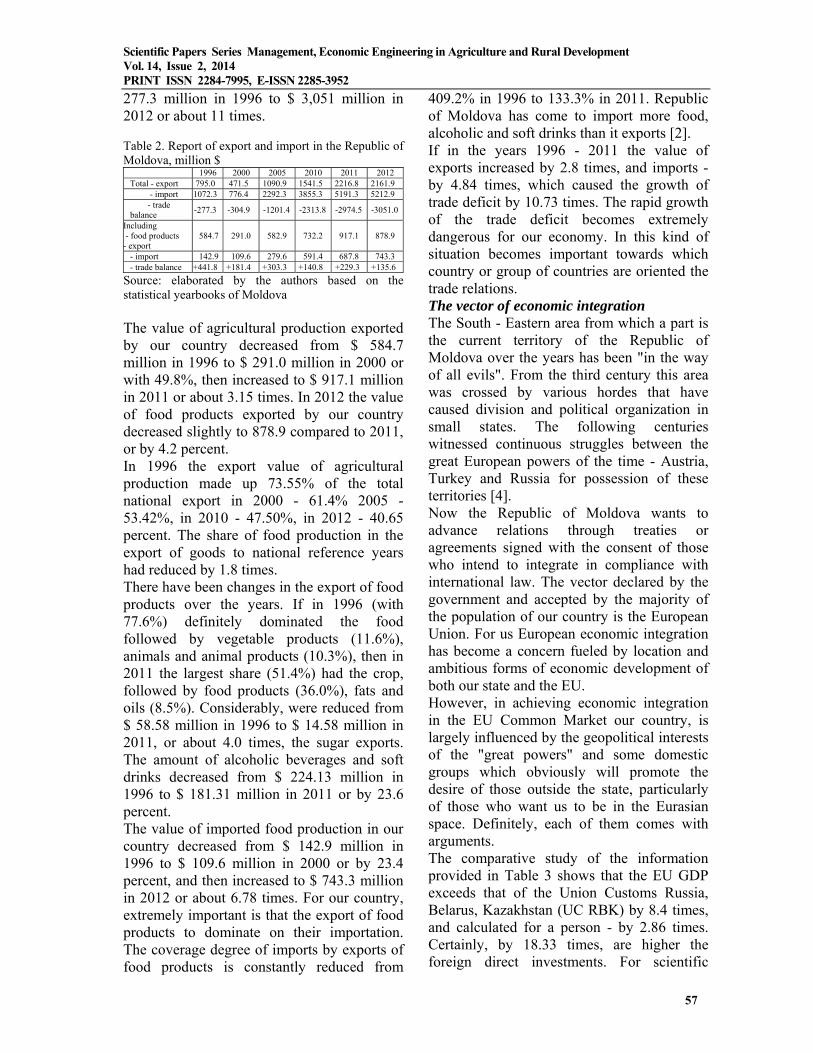
Scientific Papers Series Management, Economic Engineering in Agriculture and Rural Development Vol. 14, Issue 2, 2014 PRINT ISSN 2284-7995, E-ISSN 2285-3952
57
277.3 million in 1996 to $ 3,051 million in 2012 or about 11 times. Table 2. Report of export and import in the Republic of Moldova, million $
1996 2000 2005 2010 2011 2012 Total - export 795.0 471.5 1090.9 1541.5 2216.8 2161.9 - import 1072.3 776.4 2292.3 3855.3 5191.3 5212.9 - trade balance
-277.3 -304.9 -1201.4 -2313.8 -2974.5 -3051.0
Including - food products
- export 584.7 291.0 582.9 732.2 917.1 878.9
- import 142.9 109.6 279.6 591.4 687.8 743.3 - trade balance +441.8 +181.4 +303.3 +140.8 +229.3 +135.6
Source: elaborated by the authors based on the statistical yearbooks of Moldova The value of agricultural production exported by our country decreased from $ 584.7 million in 1996 to $ 291.0 million in 2000 or with 49.8%, then increased to $ 917.1 million in 2011 or about 3.15 times. In 2012 the value of food products exported by our country decreased slightly to 878.9 compared to 2011, or by 4.2 percent. In 1996 the export value of agricultural production made up 73.55% of the total national export in 2000 - 61.4% 2005 - 53.42%, in 2010 - 47.50%, in 2012 - 40.65 percent. The share of food production in the export of goods to national reference years had reduced by 1.8 times. There have been changes in the export of food products over the years. If in 1996 (with 77.6%) definitely dominated the food followed by vegetable products (11.6%), animals and animal products (10.3%), then in 2011 the largest share (51.4%) had the crop, followed by food products (36.0%), fats and oils (8.5%). Considerably, were reduced from $ 58.58 million in 1996 to $ 14.58 million in 2011, or about 4.0 times, the sugar exports. The amount of alcoholic beverages and soft drinks decreased from $ 224.13 million in 1996 to $ 181.31 million in 2011 or by 23.6 percent. The value of imported food production in our country decreased from $ 142.9 million in 1996 to $ 109.6 million in 2000 or by 23.4 percent, and then increased to $ 743.3 million in 2012 or about 6.78 times. For our country, extremely important is that the export of food products to dominate on their importation. The coverage degree of imports by exports of food products is constantly reduced from
409.2% in 1996 to 133.3% in 2011. Republic of Moldova has come to import more food, alcoholic and soft drinks than it exports [2]. If in the years 1996 - 2011 the value of exports increased by 2.8 times, and imports - by 4.84 times, which caused the growth of trade deficit by 10.73 times. The rapid growth of the trade deficit becomes extremely dangerous for our economy. In this kind of situation becomes important towards which country or group of countries are oriented the trade relations. The vector of economic integration The South - Eastern area from which a part is the current territory of the Republic of Moldova over the years has been "in the way of all evils". From the third century this area was crossed by various hordes that have caused division and political organization in small states. The following centuries witnessed continuous struggles between the great European powers of the time - Austria, Turkey and Russia for possession of these territories [4]. Now the Republic of Moldova wants to advance relations through treaties or agreements signed with the consent of those who intend to integrate in compliance with international law. The vector declared by the government and accepted by the majority of the population of our country is the European Union. For us European economic integration has become a concern fueled by location and ambitious forms of economic development of both our state and the EU. However, in achieving economic integration in the EU Common Market our country, is largely influenced by the geopolitical interests of the "great powers" and some domestic groups which obviously will promote the desire of those outside the state, particularly of those who want us to be in the Eurasian space. Definitely, each of them comes with arguments. The comparative study of the information provided in Table 3 shows that the EU GDP exceeds that of the Union Customs Russia, Belarus, Kazakhstan (UC RBK) by 8.4 times, and calculated for a person - by 2.86 times. Certainly, by 18.33 times, are higher the foreign direct investments. For scientific

Scientific Papers Series Management, Economic Engineering in Agriculture and Rural Development Vol. 14, Issue 2, 2014 PRINT ISSN 2284-7995, E-ISSN 2285-3952
58
researches and development of new technologies EU spends by 15.67 times more than the UC RBK. In addition, according to the authors of the study conducted by the Independent Analytical Center EXPERT - GROUP joining the Deep and Comprehensive Free Trade Area (DCFTA) will bring net economic and social benefits for Moldova, while the Customs Union of Russia-Belarus-Kazakhstan will have adverse effects. Joining DCFTA does not exclude multilateral free trade with CIS countries and UC RBK joining is not compatible with DCFTA. Joining UC RBK will force the Republic of Moldova to surrender Russia the autonomy on setting tariff policy and align to the rates of UC RBK. Moreover, the adherence to UC RBK will lead to the monopoly on Russian energy sector of Moldova. Integration in the Eurasian energy politics by joining the UC RBK will cause the abandonment of the Energy Community. Besides, the prices reduction for natural gas supplied by "Gazprom" with about 30% anticipated after the joining to the UC RBK is uncertain because of the lack of a clear legal framework that would regulate this issue. Joining the UC RBK will cause reduction of about 9% of total exports and increase the economic dependence on the CIS market, especially the Russian Federation. Instead, joining the DCFTA will boost export growth by over 11% and contribute significantly to their diversification. Expert estimates show that if adhering DCFTA, Moldovan economy will expand by about 6.4%, while the UC RBK option will determine its contracting by 4 percent. Joining UC RBK will result in the loss of domestic producers on the Community market, which attracts about 45% of total exports both from the right and on the left bank of the Nistru river. An eventual join to UC RBK would have adverse effects on the business environment by reducing the competitiveness of the national economy. Definitely, joining DCFTA will cause some risks. Since the advent of Community, Europe has chosen the path of free trade that requires common commercial policy. It should not be
forgotten, as Maurice Bye noted that if a common trade policy is the first step of a common economic policy, it can only be a means to achieve broader agreements[5]. Currently, the EU trade policy tends to be focused on removing barriers, including non-tariff trade barriers. According to Article 207 of the Consolidated Version of the Treaty on the Functioning of the European Union [9] the common commercial policy shall be based on uniform principles, particularly in regard to changes in tariff rates, the concluding of tariff and trade agreements relating to trade in goods and services and the commercial aspects of intellectual property, foreign direct investments, uniformity in liberalization measures, export policy and measures to protect trade, such as those to be taken in the event of dumping or subsidies. The competition rules according to the Article 42 of the Consolidated Version of the Treaty on the Functioning of the European Union [9] shall be applied to the production and trade of agricultural products only to the extent determined by the law approved by the European Parliament and the Council under the procedure referred to in paragraphs 2 and 3 of Article 43. According to Article 44, "if, in a Member State, a product is subject to a national market organization or to internal rules having equivalent effect which affect the competitive position of similar production in another Member State, the Member States apply a countervailing duty on the import of this product coming from state where such organization or rules exists, unless that State applies a countervailing charge on export. The extra EU exports [6] in 2011 dominated (80% of their share) the processed products, following a downward trend in recent years. Processed products have accounted for about 56% of extra EU imports. In 2011 the EU had positive balances of trade balances for 14 product groups and negative balances for seven groups of the Combined Nomenclature, which generated a deficit of about 160 billion euros. The agricultural products imported by EU countries range from 78712 mil Euro for the

Scientific Papers Series Management, Economic Engineering in Agriculture and Rural Development Vol. 14, Issue 2, 2014 PRINT ISSN 2284-7995, E-ISSN 2285-3952
59
year 2007 to 90,224 mil Euros in 2008, and their export increased from about 78,031 mil Euro in 2007 to reach a value of over 95 billion Euros in 2010. If in 2007 the export of food products in the European Union yields insignificantly to the import with 681 mil Euros (0.9% of exports) and then in 2010 exports exceed imports food products by the EU Member States with little more than 7.7 billion Euros or with 8.1% of the export. Currently, agricultural exports are almost all without refund (385 mil Euros in 2010 compared with 6000 mil Euros in 2000). The import exceeds the export in the following EU Member States: Belgium, Cyprus, Greece, Germany, the Netherlands, United Kingdom, Portugal, Romania and others. Export is higher in relation to imports in Austria, Denmark, France, Spain, Hungary and other EU countries. Finished products represent 64 percent of this volume, on the first place with 16%, being spirits and wine products. One of the risks for our country is related to the decline that will occur in the food sector, where production is expected to decrease by about 3%. These costs will be offset by benefits from other more competitive sectors such as industrial, wage growth and revenues. Based on the theory of comparative advantage that argues that potential superiority in exchange relations depends on differences in comparative costs, our country should form a production structure so that costs correspond to the most efficient foreign operators. The comparative advantage in national agriculture is projected on the market demand. Thus, the benefits of the national economy integration in the European Union Common Market space is practically indisputable. However, the geographic targeting towards the EU Common Market requires adjustment of national economic policies to the Community ones, market selection, an appropriate logistics training (opening trade offices, missions of Moldovan businessmen on the respective potential markets, the participation a greater extent in fairs and international exhibitions, etc.) and time and, most importantly, to gain innovative activity. The cooperation, including agriculture and rural development are specified
in the Association Agreement between the EU and the Republic of Moldova. Cooperation in agriculture and rural development According to Article 67 of the initialled version of the Association Agreement between the European Union and the Republic of Moldova [1], "Parties shall cooperate to promote the development of agriculture and rural development, particularly by the progressive convergence of policies and legislation". Cooperation between the Parties in the development of agriculture and rural development, referred to Article 68 of the Agreement will include the following areas: (a)facilitate mutual understanding of agricultural and rural development policies; (b) strengthen the administrative capacity at central and local level in the planning, evaluation and implement policies in accordance with regulations and best practice in the EU; (c)promote the modernization and sustainability of agricultural production ; (d)exchange of knowledge and best practices on rural development policies to promote the economic welfare of rural communities; (e) improve the competitiveness of agriculture and market efficiency and transparency; (f)promote policies on quality and their control mechanisms, in particular geographical indications and organic farming; (g) disseminate knowledge and promote agricultural advisory and extension services for farmers; and (h) enhance harmonization issues addressed in the organizations to which the Parties are members. The Republic Moldova, according to Article 70, shall harmonize its legislation with EU laws and international instruments referenced in Annex VII of the Agreement. We should mention that in the agreement also with reference to agriculture are specified such relationships as data protection regarding Plant Protection. Thus, Article 316 states: 1. The Parties shall establish requirements for safety and efficacy before authorizing the placing on the market of plant protection products.

Scientific Papers Series Management, Economic Engineering in Agriculture and Rural Development Vol. 14, Issue 2, 2014 PRINT ISSN 2284-7995, E-ISSN 2285-3952
60
2. The Parties recognize the right of the author of a temporary test or study report presented for the first time to obtain a marketing authorization of a plant protection product. For any country or business that intends to improve the competitive position against rival bidders for stronger innovation activity. Under Article 127 of the Association Agreement between the European Union and the Republic of Moldova "Parties shall promote cooperation in all fields of civil scientific research, technological development and demonstration activities (RTD) on the basis of mutual benefit and under appropriate protection of intellectual property rights effectively ". Article 128 of the Agreement specifies "Cooperation in RTD will include: (a) policy dialogue and exchange of scientific and technical information; (b)to facilitate adequate access to those programs of the Parties; (c)to enhance research and research institutions participation of the Republic of Moldova in the Programme - Framework for EU Research; (d) to promote the joint research projects in all areas of RTD; (e) training activities and mobility programs for scientists, researchers and other professionals involved in research RTD activities on both sides; (f) facilitating, under applicable law, the free movement of workers that are participating in research activities under this Agreement and border circulation of goods intended for use in such activities; and (g) other forms of cooperation in the field of RTD (including regional approaches and initiatives), based on mutual agreement. The innovation activity can be expressed by the number of patents or plant variety patents issued, the number of drawings/designs and trade mark protection titles released. The number of applications for patent has a decreasing trend. Firstly, it ranges from 246 in 2000 to 401 in 2005 (Table 3) then it reduces to 108 in 2011, or by 3.7 times and has a slight increase to 115 in 2012. The situation is identical to the requests of the national applicants. Even if the share of patent
applications for plant variety increases from 4.88 % in 2000 to 17.39 % in 2012 their number remains unacceptably low for an agricultural country like Moldova. The same downward trend from 269 in 2005 to 63 in 2011 we found in the patents issued. The number of patent titles is reduced from 1316 in 2012 to 613 in 2000 or about 53 percent. Table 3. The evolution of applications for protection of inventions and plant varieties
1995 2000 2005 2010 2011 2012Requests submitted for patent
299 246 401 143 108 115
including national applicants
270 240 390 139 97 93
Patent for plant varieties
- 12 22 18 15 20
Including, national applicants
- 11 22 18 15 20
Patents were issued
227 234 269 132 63 51
including national applicants
124 200 261 125 61 47
Patent for plant varieties
- - 3 25 15 20
including national applicants
- - 2 25 15 20
Valid invention patent titles
266 1316 1108 1018 799 613
Titles patent for plant varieties
- - 13 74 86 104
Source: elaborated by the authors based on the statistical yearbooks of Moldova The total of titles patent for plant varieties increased from 13 in 2005 to 104 in 2012, or by 8 times, but remains too poorly accounted for only 17% of the total number of patent titles in our country. The categorical decline patents correlates perfectly with the situation in the national economy. The agricultural activity is required to ensure biological diversity. Under Article 368 "Parties recognize the importance of ensuring the conservation and sustainable use of biological diversity as a key element for achieving sustainable development and reaffirms their commitment to conserve and sustainably use biological diversity under the Convention on Biological Diversity and other international instruments they are part. To this end, the Parties undertake: (a) to promote trade in natural resource-based products produced using biological resources and contribute to biodiversity conservation; (b)to ensure the exchange of information about actions on trade in natural resource-based products that is focused on halting the loss of biodiversity and reduce pressures on

Scientific Papers Series Management, Economic Engineering in Agriculture and Rural Development Vol. 14, Issue 2, 2014 PRINT ISSN 2284-7995, E-ISSN 2285-3952
61
biodiversity and, where relevant, to cooperate to maximize the impact and provide mutual support for their respective policies; (c)to promote the list of species covered by the Convention on International Trade in Endangered Species of Wild Fauna and Flora (CITES), where the conservation status of these species is considered at risk; and (d) to cooperate regionally and globally in order to promote conservation and sustainable use of biological diversity in natural and agricultural ecosystems, including endangered species, their habitat, protected natural areas and genetic diversity, ecosystem restoration and removal or reduce negative environmental impacts of resource use and non-living natural living or ecosystems. The agreement includes provisions on trade, customs duties, etc. which is an important fact given that during the years our country's trade relations have undergone major changes. Thus, the export to the Commonwealth of Independent States (CIS) increased from $ 543.1 million in 1996 (Table 4) to $ 928.1 million in 2012 or by 1.7 times. Table 4. Foreign trade, million $
1996 2000 2005 2010 2011 2012 Total - export 795.0 471.5 1090.9 1541.5 2216.8 2161.9 - import 1072.3 776.4 2292.3 3855.3 5191.3 5212.9 - trade balance -277.3 -304.9 -1201.4 -2313.8 -2974.5 -3051.0 Including: CIS - export
543.1 276.1 551.2 624.0 919.3 928.1
- import 652.7 259.8 905.2 1256.9 1713.4 1623.7 - trade balance -109.6 16.3 -354.0 -632.8 -794.2 -695.6 UE-27 - export
78.1 102.2 443.2 728.9 1083.0 1013.4
- import 177.2 226.0 1038.8 1704.2 2256.3 2318.6 - trade balance -99.1 -123.8 -595.6 -975.3 -1173.3 1305.2
Source: elaborated by the authors based on the statistical yearbooks of Moldova[7] However, the share of exports to CIS countries is reduced from 68.3% of total exports in 1996 to 42.9% in 2012. During the respective years the national export of goods in the EU-27 increased from $ 78.1 million to $ 1013.4 million or about 13 times and their share in the total exports increased from 9.8% in 1996 to 46.9 percent in 2012. The imports of goods from the CIS increased from $ 652.7 million in 1996 to $ 1,713.4 million in 2011 and by 2.62 times, and their share in the total imports decreased from 60.86% in 1996 to 31.1% in 2012. The imports of goods by our country from the EU-
27 increased from $ 177.2 million in 1996 to $ 2,318.6 million in 2012 or by 13.1 times, while their share in the total imports increased from 16.5% in 1996 to 44.5% in 2012. Thus the trade exchanges of our country with EU exceed those with CIS. A particular interest for our country represents the commercial exchanges geography with foodstuffs. The most important food products intended for export have been and remain the grapes and grape products. The decline in the volume of grapes harvested from 82,500 tonnes in 1990 to 40,100 tonnes in 2000 caused the reduction of fresh grapes exports from 16,600 tonnes in 1991 to 5,400 tonnes in 1999. The 7,300 tonnes of grapes harvested in 2010 do not cover the domestic demand. Table 5. Export and import of wine from grape Indicators 2009 2010 2011
ths dal mil $ ths dal mil $ ths dal mii $
Export Wine andgrape must
9633.0 128.70 12606.8 137.87 12118.1 132.49
Including in:- EU
1079.4 19.39 1122.4 18.32 1470.0 20.64
- CIS 8014.0 103.99 10729..2 110.64 9864.1 100.93
-other countries
539.5 5.32 755.2 8.91 784.0 10.92
Sparkling wine, total
286.4 6.88 318.5 7.00 428.9 10.21
Including in:- EU
19.1 0.57 14.6 0.39 21.3 0.54
- CIS 246.2 5.84 281.0 6.13 362.6 8.65 -other countries
21.1 0.47 22.9 0.47 45.0 1.02
Import Wine andgrape must
47.3 0.93 425.2 3.16 273.9 2.43
Including in:- EU
3.2 0.30 294.9 1.81 237.1 2.02
- CIS - - 3.9 0.08 - - -other countries
44.1 0.63 126.4 1.27 36.8 0.41
Sparkling wine, total
2.3 0.24 5.9 0.38 7.4 0.53
Including in:- EU
2.3 0.24 3.6 0.33 6.2 0.50
- CIS - - 2.3 0.05 1.2 0.03
Source: Foreign Trade of the Republic of Moldova, 2011 The export of wine and grape must in the EU Member States-27 increased from 9,633.0 dal in 2009 to 12,118.1 dal in 2011 (Table 5), or by 25.8%, and the value of the wine and grape exported in those years increased by 6.45 percent. The export of wine and grape must in CIS countries increased from 8,014.0 thousand dal in 2009 to 9,864.1 dal in 2011 or by 23.08%, but the value of exports in 2011 formed 97% of the export value of these products in 2009.

Scientific Papers Series Management, Economic Engineering in Agriculture and Rural Development Vol. 14, Issue 2, 2014 PRINT ISSN 2284-7995, E-ISSN 2285-3952
62
Wine and grape must export to other countries increased from 539.5 thousand dal in 2009 to 784.0 thousand dal in 2011, or by 45.32%, and their value in those years increased by 2.05 times. The import of wine and grape must from the EU-27 changes from 47,264.6 ths dal in 2009 to 425,177.7 ths dal in 2010 and 273,899.9 ths dal in 2011. The value of the wine and grape must exported in those years had similar behaviour. The import of wine and grape must to CIS occurred only in 2010 when it formed 1.3% of imports of these products in the EU-27. The import of wine and grape must from other countries increased significantly from 44,079.6 ths dal in 2009 to 126,332.9 ths dal in 2010 and by 387 times, then it reduces to 36,769.1 ths dal in 2011 or by 3.43 times. The export of sparkling wine in the EU Member States increased from 19.1 ths dal in 2009 to 21.3 ths dal in 2011. However, the amount of sparkling wine varied. A greater amount of sparkling wine exported to CIS countries from 246.2 ths dal in 2009 to 362.6 ths dal in 2011, or by 47.28%, and the sparkling wine exported to CIS countries increased by 48.12 percent. The import of sparkling wine from EU Member States increased from 2,338.8 ths dal in 2009 to 6,226.6 ths dal in 2012 or by 2.66 times and its value - 2.12 times. The main consumer of our wines has been and remains the Russian Federative Republic. On its markets in 1999 we sold more than four fifths of wine grapes and more than 90 percent of sparkling wines. Still, in 2009 on the Russian market were exported 2886.7 thousand dal forming only 30% and in 2011 – 20.9% of total wine exports. In the reference years increasingly important for our country becomes the Common Market[9]. Thus, the export of wine and grape must in 2009 constituted 11.2% or 1,079.4 mln dal in 2011 – 1,470.0 mln dal or 12.1 percent of the total of wine and grape exported. In the last years is intensified the import of alcoholic beverages, including those made from grapes. If in 2009 was imported 47.3 thousand dal, which formed 4.9% of the exported wine and grape, then in 2011 it rose to 273.9 thousand dal or by 5.8 times, already
forming 27.4 percent over exported wine. The import of wine from grapes dominates categorically, forming 95.3% in 2009, 98.6% in 2010 and 97.3% of the total imported wine. If in 2009, mostly (93.3%) was imported from countries that do not belong neither to the CIS nor the EU then in 2010 – 68.5% and in 2011 – 84.3% of the total imported wine resides for the Member States. CONCLUSIONS The situation created in trade relations, in the ratio of export and import of goods and services may be changed for the better through major modifications in the structure of the national economy, effective and efficient implementation of modern technologies and other measures, which in considerable proportions depend on the vector of economic integration and of clear rules as specified in the Association Agreement between the EU and the Republic of Moldova. The agreement will contribute to the consolidation of the relations between the EU and Republic of Moldova, to gradual economic integration and leaves open the way for further progressive developments in EU - Republic of Moldova relationships. REFERENCES [1]Association Agreement between the European Union and the Republic of Moldova, 2014. [2]Certan Simion, Certan Ion, 2013, Economic integration in the European Union, CEP, Chisinau [3]Certan Simion, Comparative Study on the organization of agricultural markets, TACIS, Chisinau, 2002 [4]Moldovanu Dumitru (coordinator), 2009, European Integration of the Republic of Moldova: premises, Avantage and lost opportunities, Science, Chisinau [5]Pelkmans Jaques, 2003, European Integration, Methods and Economic Analysis, European Institute of Romania [6]http: //ec.europa.eu/ [7]Statistical Yearbooks of the Republic of Moldova, Statistics, Chisinau, 2003 – 2011 [8]The Activity Program of the Government. European Integration: Freedom, Democracy, Welfare 2011 - 2014, Chisinau, 2011. [9]The Consolidated Version of the Treaty on European Union [10]Wallace Helen et al., 2011, Policymaking in the European Union, European Institute of Romania, Bucharest

Scientific Papers Series Management, Economic Engineering in Agriculture and Rural Development Vol. 14, Issue 2, 2014 PRINT ISSN 2284-7995, E-ISSN 2285-3952
63
RESEARCH GATE SCORE AS AN ASSESSMENT TOOL OF THE STAFF PERFORMANCE IN RESEARCH INSTITUTIONS FROM REPUBLIC OF MOLDOVA Dragoş CIMPOIEŞ, Adrian SÎRBU
The State Agrarian University of Moldova, 44 Mirceşti, Chişinău, Republic of Moldova, Phone: + 373 22 432 395, E-mail: [email protected] Corresponding author: [email protected] Abstract The positioning of research institutions from Republic of Moldova through Research Gate score will be analyzed in this paper. The aim of Research Gate score ranking is to help researchers and scientists to measure and leverage their standing within the scientific community. Research Gate provides the researchers with a metric that is calculated based on how all of their research is received by their peers, not just the work that have been published. The Research Gate Score focuses on scientists, an ever-growing community of specialists. By opening up the idea of what the research institutions can gain credit for and handing the power to evaluate it, the Research Gate Score puts reputation back into the hands of researchers. The Research Gate Score provides scientists and research institutions with an alternate way to measure its reputation and performance. In this context, it is a useful tool for assessing the research activity of Moldovan universities, but also of comparing the research activity of universities from the Republic of Moldova with those from neighborhood countries. Keywords : assessment, evaluation, management, performance, rating score, research gate INTRODUCTION The performance management should be understood as a continuous process, reflecting the normal management practices, not "special techniques" imposed by leaders. Its conceptual framework includes terms such as "performance management", "performance", "performing organization". The performance management is a strategic and integrated approach to ensure lasting success in the institutions of higher education, improving its performance, research teams and teaching staff. MATERIALS AND METHODS During the investigation there were used such research methods as: analysis, monographic, statistic as well as other methods and procedures that allowed revealing the essence of the investigated problem. RESULTS AND DISCUSSIONS In 1998 the Institute of Personnel and Development instigated another programme
of research Armstrong and Baron 1998. Using a survey and a number of practice-based case studies, this work concluded that performance management was most likely to be viewed as a continuous process rather than an annual activity. However, this process was still largely a collection of interlinked tools rather than a single system to manage performance. Moreover, it was apparent that there was a significant schism between performance management that was led by the desire to develop individuals, and performance management that was driven by the desire to pay individual rewards linked to outcome performance. The research was also able to identify a number of underlying trends, such as the shift of ownership of performance management from human resource to line managers and the rejection of bureaucracy with emphasis on minimizing paperwork. Assessment of the professional performances has become, is and will be an important link in intelligent management of higher education institutions. A large part of labor disputes and the decline of some institutions of such kind with primary cause a defective management printed of insufficiency knowledge from the

Scientific Papers Series Management, Economic Engineering in Agriculture and Rural Development Vol. 14, Issue 2, 2014 PRINT ISSN 2284-7995, E-ISSN 2285-3952
64
vast field human resources management. We are dealing here with the clichés originating on the result of longstanding practice of uniform of staff policies or simply a lack of information in this field. It is true that the staff policies characteristic of a capitalist society are very diverse, developing into a particular culture and organizational climate, an economic structure and specific political orientation. In addition to these complex problems of socio-economic transition and the trends becoming more pervasive of the phenomenon of internationalization or globalization. The spreading area knowing appreciation or staff or professional performance evaluation is very wide. A number of statistics mention that the rhythm of participation in organizational life of assessment practices of staff has known a dynamics that few experts have suspected it. This development resulted from the fact that higher education institutions face more and more need to increase the number of students, masters and PhD that in conditions in which they have limited options. In this sense, one of the least exploited ways to increase the number of students, masters and PhD would be the human performance improvement performance is analyzed starting from performances obtained by a teacher, by a group of teachers or higher education institution. The requirement to evaluate the staff of higher education institutions is required and other factors such as the accelerated rhythm of scientific-technical development, of the implementation of new technologies, and of course, the internationalization of the competitive market. The performance evaluation of teachers in higher education institutions is a rather complex process in which is analyzed the dynamic participation of personality components within those institutions and its reflection in the final results of the activity of each teacher individually. This evaluation has an important emotional charge for the teaching staff because it highlights to themselves and the other collaborators who works daily. In situations where the hierarchical superior (rector, dean, head of department) expresses
an assessment of a subordinate (assistant lecturer) based on his /her observations accruing over time, describing him/her as very good, good or weak, the method is called as informal suitable method, with a certain degree of subjectivity part. This method is used more often in higher education institutions with a low share of teaching staff. But higher education institutions with a large number of teaching staff, although not completely eliminate the informal method, pays special attention to formal method. Formal method is characterized by the fact that is conducted on a formally adopted methodologies which apply in a uniform way in all cases. Performance evaluation of teaching staff is, in many cases, the compulsory and necessary condition for making decisions on knowledge and the quality of those who are subject to evaluation, their training needs, their opportunities for development and promotion, rewards merits, and situations where deviations are detected partially or totally of individual study plans followed by enforcement, reprimands and even the possibility of dismissal. The performance assessment can play an important role in furthering the development teaching staff: and reinforces self-confidence forces, and can bring immediate material benefits through salary increases and awards, and scope for promotion and certain clarifying career goals and increases the ambition to increase the level of training. The hierarchical superior plays a very stimulating part in the process for raising the performance of his subordinates. Praising their remarkable achievements and criticizing them with kindness their gaps, increase the confidence of subordinates in the competence and objectivity of the hierarchical superior. It creates a favourable fluid in collective for raising the performance level characteristic satisfaction in the working process of teachers regardless of the position held at the time of evaluation. Formal performance evaluation shall be made periodically, usually annually, at the evaluation meetings. . These meetings, make it possible the opportunity to participate in

Scientific Papers Series Management, Economic Engineering in Agriculture and Rural Development Vol. 14, Issue 2, 2014 PRINT ISSN 2284-7995, E-ISSN 2285-3952
65
discussions on long-term career goals and possibly establish a plan of evolution. both as teaching staff and as superiors. Based on performance from the previous period the hierarchical superior has the opportunity to make some suggestions for the evaluated teaching staff on the short-term on improving their work in order to achieve the goals that they proposed for long term. These suggestions have a strong mobilizing impact constituting a guarantee that you can count on superior objectivity. Concerning teacher’s preparation, performance evaluation, may indicate some requirments and implicitly the necessity to complete the training. Teachers shall be assigned, therefore, in some form of training, courses which is organized within the institution of higher education or in other higher education institutions. A teacher who has achieved good performance can be enrolled in a program, project development that will prepare them for promotion to a senior post. Evaluate performance also provides useful information for the preparation of the development programs training other employees whose performance is considered low. Performance management is forward-looking. It focuses on planning for the future rather than dwelling on the past. But it also takes into account when making these plans what has been achieved and, more importantly, how it has been achieved. Performance needs to be analyzed prior to planning. And the analysis has to be based on reliable evidence, not opinion or hearsay. Performance management is therefore an analytical process, especially when its purpose is developmental. But when its purpose is to provide an aid to decision making – on pay, promotion or retention – performance needs to be assessed and this often involves some form of rating. Much of this chapter therefore deals with rating through the use of rating scales but alternative approaches are also discussed. However, introductory sections examine the concept of evidence-based performance management and the analytical nature of performance management to provide a background to the
more detailed review of assessment methods. These are followed by sections on: • the process of rating; • the rationale for rating; • rating scales. The e-reward 2005 survey of performance management found that 70 per cent of respondents used overall ratings. Since the days of merit rating and then performance appraisal rating still reigns supreme. To many people it was and is the ultimate purpose and the final outcome of performance appraisal. Academics, especially American academics, have been preoccupied with rating – what it is, how to do it, how to improve it, how to train raters – for the last 50 years. Many problems with rating have been identified but it doesn’t seem to have occurred to them that these could readily be overcome if rating weren’t used at all. The theory underpinning all rating methods is that it is possible as well as desirable to measure the performance of people on a scale accurately and consistently and categorize them accordingly. As DeNisi and Pritchard (2006) comment: ‘Effective performance appraisal systems are those where the raters have the ability to measure employee performance and the motivation to assign the most accurate ratings.’ Murphy and Cleveland (1995) distinguished between judgment and ratings. A judgment is a relatively private evaluation of a person’s performance in some area. Ratings are a public statement of a judgment evaluation that is made for the record. But ratings do not always correspond with judgments and raise other issues as discussed later. Research conducted on rating has produced a number of findings that supplement this theory. Pulakos, Mueller-Hanson and O’Leary (2008) noted that ratings for decision making (eg on performance pay) tend to be higher than ratings for development, which tend to be variable, reflecting both employee strengths and development needs. They also commented that if the system is used for decision making, numerical ratings are important. If a system is strictly developmental, there is less need for ratings and in fact they may detract from

Scientific Papers Series Management, Economic Engineering in Agriculture and Rural Development Vol. 14, Issue 2, 2014 PRINT ISSN 2284-7995, E-ISSN 2285-3952
66
development. This is because employees tend to be more concerned about their ‘score’ than their understanding of their development needs. From a development perspective, narratives tend to provide more useful information than numerical ratings. Even when performance is rated against defined standards the ratings do not convey what the employee did or did not do in sufficient detail. Jawahar and Williams (1997) reported that performance evaluations such as ratings obtained for administrative purposes (eg pay or promotions) are more lenient than those for research, feedback or employee development purposes. Rating scales indicate the level of performance or competency achieved or displayed by an employee. This is done by selecting the point on a scale that most closely corresponds with the view of the assessor on how well the individual has been doing. A rating scale is supposed to assist in making judgments and it enables those judgments to be categorized to inform performance or contribution pay decisions or simply to produce an instant summary for the record. Rating scales indicate the level of performance or competency achieved or displayed by an employee. This is done by selecting the point on a scale that most closely corresponds with the view of the assessor on how well the individual has been doing. A rating scale is supposed to assist in making judgments and it enables those judgments to be categorized to inform performance or contribution pay decisions or simply to produce an instant summary for the record. Research gate was built by scientists, for scientists. It started when two researchers discovered first-hand that collaborating with a friend or colleague on the other side of the world was no easy task. Founded in 2008, research gate today has more than 4 million members. Web site strives to help them make progress happen faster. New metric makes every stage of research process count. Research gate score works as addition to traditional publishing model, especially for scientists starting their careers. Although the traditional scientific publishing model has brought countless innovations and
advancements to light, the speed of discovery is often hindered by the lack of speed in publishing. Research gate full fills the need for a new system that reflects the ever-increasing pace of science. Researchers are now able to publish their results in real-time, benefit from the immediate feedback of their peers and, through the research gate score, turn all of their work into a source of reputation. CONCLUSIONS In conclusion, it should be noted again that the performance management is not a form of appreciation to the people, applied in hindsight. There is no simple method for generating information for remuneration decisions. The performance management is future oriented and towards development, providing a conceptual framework in which managers are able to support their team members, rather than dictate. The impact of performance management on the results will be more significant if it is viewed more as a process transformer than an evaluation process. REFERENCES [1]Novac Carmen, 2006, “Evaluarea performanţei angajaţilor”, Bucureşti, p/. 21-32. [2]Armstrong Michael, 2009, “Performance management”, 4th edition, London and Philadelphia,p. 142-151. [3]Burloiu Petre, 2001, “Managementul resurselor umane” Bucureşti, p. 598-626. [4]www.cipd.co.uk/.../performance_management. [5]www.researchgate.net.

Scientific Papers Series Management, Economic Engineering in Agriculture and Rural Development Vol. 14, Issue 2, 2014 PRINT ISSN 2284-7995, E-ISSN 2285-3952
67
GENERAL ASPECTS OF THE AGRO-CLIMATOLOGIC POTENTIAL IN MUNTENIA REGION Elena COFAS1, Dana Maria (Oprea) CONSTANTIN2, Iuliana ZAHARIA1
1University of Agricultural Sciences and Veterinary Medicine of Bucharest, 59 Mărăşti Blvd, District 1, 011464, Bucharest, Romania, Phone: +4021.318.25.64, Fax: + 4021.318.25.67 2University of Bucharest, Faculty of Geography, Meteorology – Hydrology Department, 1 Nicolae Balcescu Blvd, District 1, 010041, Romania, Phone: 00 40 723 389970
Corresponding author: [email protected] Abstract As knowing the impact of weather phenomena and their effects on agriculture represents a primary necessity, at present the importance of agro-meteorological information for economy, in general, and for the agriculture sector, in particular, involves a complex approach of the relation environment–plant. The agro-climatologic resource’s assessment is multi-way needed: to choose the product and to cultivate varieties; for different phyto-technical interventions used to improve soil fertility; it is also economically fundamental in order to obtain optimum yields. This article frames an analysis and a synthesis of the main agro-climatic parameters, the air temperature and the precipitation for the region of Muntenia, considering the period between 1961- 2009. As this region has the largest agricultural land in Romania, is it useful and necessary for everyone who aims to carry on agricultural business or studies to be well informed on the agro-climatologic potential that characterizes it. Key words: agro-climatological potential, air temperature, precipitation, crops, Muntenia INTRODUCTION The role of meteorological phenomena on human and economic activities is increasingly evident. Agriculture is directly affected by these weather phenomena, so the meteorological information involves a complex approach. Romania is already experiencing an increase in intensity and frequency of droughts, floods, heat, heat wave, freeze, frost etc. and all of these meteorological phenomena are causing significant losses in agriculture, which is the economy sector mainly dependent on weather developments. The physical, chemical and biological processes which cause the crop’s growth and development are regulated by climatic requirements, and any deviation from these requirements can produce a large variability in the agricultural production [8]. The data on the climatic and agro-climatic characteristics of various regions from a country aim to arrange rationally the land in accord with the agricultural vocations, to optimize the distribution of crops and farm animals in relation to the agro-climatic conditions and agricultural diversification foundation based
on introducing new species, varieties and breeds using agro-climatic in-depth studies [4]. In this context, the article proposes an analysis of the main agro-climatic factors, air temperature and rainfall, which is closely linked to the vital activity of the plants [9]. The analysis is performed for the historical region Muntenia, the region with the largest arable land in Romania, durring 1961 – 2009. MATERIALS AND METHODS The database used in the analysis of air temperature and rainfall is the agro-climatic data series from the agro-climatic stations of Muntenia region, time interval 1961 - 2009. The analysis of these agro-climatic elements will be in terms of average monthly and annual and frequency of dry years [1]. Statistical methods are used, with the addition of graphics and map data. RESULTS AND DISCUSSIONS Muntenia is the historical region in southern Romania, a part of the former Romanian Country. It is situated between the Carpathian

Scientific Papers Series Management, Economic Engineering in Agriculture and Rural Development Vol. 14, Issue 2, 2014 PRINT ISSN 2284-7995, E-ISSN 2285-3952
68
Mountains, the rivers Olt, Milcov, Putna, Siret and Danube. Its administrative-territorial structure includes counties of Argeș, Brăila, Buzău, Călărași, Dâmboviţa, Giurgiu, Ialomița, Ilfov, Prahova, the capital-city Bucharest and sides of Olt, Vâlcea, Vrancea and Brașov counties (figure 1). Fig.1 Geographical location of Muntenia in Romania (processing www.google.ro)
In terms of relief, Muntenia overlaps the Romanian Plain, the Getic Plateau and the Sub-Carpathian [10]. Holding a large part of the Romanian Plain, its agricultural potential is predominantly focused on cereals, vegetables, vine and livest ock [2]. On the territory of Muntenia the weather stations are located on: Câmpulung, Argeș, Câmpina, Pătîrlagele, Râmnicul Sărat, Pitești, Târgoviște, Ploiești, Buzău, Brăila, Stolnici, Titu, Urziceni, Bucharest, Băneasa and Filaret, Fundulea, Slobozia, Feteşti, Călărași, Oltenița, Videle, Roșiorii de Vede, Alexandria, Giurgiu, Zimnicea and Turnu Măgurele (figure 2).
Fig.2 Weather stations on Muntenia (processing www.google.ro)
Air temperature influences the processes of growth and development, photosynthesis, respiration and transpiration of plants. These are produced in a heat register, and this heat register is specific for the different life periods of each vegetal species and crops. In terms of heat register, the plants’ vegetation season is characterized by: thresholds at the beginning and the end of the vegetal growing period, maximum value, minimum value, the optimum temperature, a curve determined by the air’s temperature variation in the vegetation season and the amount of temperatures necessary for crossing the entire vegetation period, which corresponds to most of the hot season, represented by monthly interval from April to September [6]. In the thermal analysis, the average multi-annual for the period 1961 - 2009 is 10.6˚C, by 0.2˚C higher than the reference period 1961-2000. Within this interval, the coldest year was 1985, with an annual average of 9.6˚C, and the warmest was 2007, registering an annual average of 12.6˚C.
Table 1. Air temperature process on decades (˚C) in Muntenia (1961 – 2009)
Decade Multi‐annual average
1961 – 1970 10,6
1971 – 1980 10,3
1981 – 1990 10,6
1991 – 2000 10,9
2001 ‐ 2009 11,3
Source: own processing on the basis of data from http://www.meteoromania.ro
Considering the process by decades, there is an increase of 0.7˚C between the first decade of the period whose average is 10.6˚C and the last decade whose thermal value is 11.3˚C (Table 1). The analysis of the air temperature considering average monthly multi-annual finds that the monthly average temperature increases since January, from -1.5°C to 22.4°C in July and then decreases until December, when it records 0.1°C (figure 3).

Scientific Papers Series Management, Economic Engineering in Agriculture and Rural Development Vol. 14, Issue 2, 2014 PRINT ISSN 2284-7995, E-ISSN 2285-3952
69
-1.50.4
5.2
11
16.9
20.322.4 21.7
16.8
11.1
5.4
0.1
-5
0
5
10
15
20
25
I II III IV V VI VII VIII IX X XI XII
months
average montly temperature
Fig.3 Average monthly annual on temperature (˚C) in Muntenia (1961 – 2009) Considering seasons, the average multi-annual values are 11.3˚C for spring, 21˚C for summer, 11.1˚C for autumn and -0.3˚C for winter. Precipitations show variation from one month to another, from one season to another and from one semester to another, driven by the general circulation of the atmosphere and the intensity of thermal convection [3]. Concerning average yearly precipitation for Muntenia between years 1961 – 2009, it is 592.8 l/m², which means a moderate rainfall drought. For the same period, the wettest agricultural year was 2004 – 2005, when it was recorded the amount of 886.1 l/m², which means excessive rainfall rainy, and the lowest value was recorded in the agricultural year 2006 – 2007, respective 463.9 l/m², meaning a dry rainfall. By decades it is recorded an increase of 19.3 l/m² between the first decade of the period, when there was the amount of 609.0 l/m² and the last decade when it equaled 628.3 l/m² (table 2). The analysis of the precipitation’s distribution on the territory of Muntenia for each month highlights the rainfall potential. It was a rainfall increase starting from January (33.2 l/m²) until June, when it recorded 77.4 l/m², and after this month the quantities decrease until December up to 43.9 l/m² (figure 4). In the warm half of the year, rainfall totals with the highest percentage of all the year, registering 363.6 l/m², with 134.4 l/m² more than in winter.
Table 2. Precipitation process on decades (l/m²) in Muntenia (1961 – 2009)
Decade Multi‐annual average
1961 – 1970 609,0
1971 – 1980 634,8
1981 – 1990 518,0
1991 – 2000 568,8
2001 ‐ 2009 628,3 Source: own processing on the basis of data from http://www.meteoromania.ro
The amount of rainfall depends on the air temperature, being necessary to analyze the distribution of these quantities on semesters, especially since the warm semester coincides largely with the vegetation.
Fig.4. Average monthly annual on precipitation (l/m²) in Muntenia (1961 – 2009) The frequency of dry years is an agro-climatic parameter that reflects the impact of agricultural drought. This impact is varied and extremely complex, and the effects on the vegetation and crop productivity are multiple. The analysis of the dry years’ frequency, as case number for Muntenia during 1961 – 2009, is 29 years, with an excessively dry year, with the annual amount between 251.0 and 350.0 l/m², 5 years dry with recorded quantities between 351.0 to 450.0 l/m², 23 years moderately dry between 451.0 to 600 l/m². The remaining years of the period under review were optimal rainfall years (11 years) with quantities ranging from 601.0 to 700.0 l/m² and 9 years with precipitation amounts between 701.0 and 800 l/m². Extreme drought years were: 1962-1963, 1964-1965, 1973-1974, 1975-1976, 1982-1983, 1985-1986, 1987-1988, 1992-993,

Scientific Papers Series Management, Economic Engineering in Agriculture and Rural Development Vol. 14, Issue 2, 2014 PRINT ISSN 2284-7995, E-ISSN 2285-3952
70
1999-2000, 2000-2001, 2001-2002, 2002-2003, 2006-2007, and wet years were: 1972, 1974, 1975, 1976, 1981, 1990, 1991, 1997, 2004, 2005 and 2006. The agricultural year 2004 - 2005 is the year excessively rainy, with an annual average amount of 886.1 l/m² registered in Muntenia, compared to the annual average of 592.8 l/m². The deviation is positive, being 49.5%. July 2005 was the wettest month, with an average amount of 168.3 l/m². For the same year, the highest annual value was recorded at the meteorological station Tîrgovişte and it was 1184.2 l/m², followed by that recorded on Curtea de Argeș with 1153.8 l/m². On the opposite side there is the agricultural year 2006 - 2007, more precisely the monthly period from September 2006 to August 2007, whose average annual amount was for Muntenia 463.9 l/m², registering a negative deviation of 27.8 l/m². April 2007 was the driest month, registering only 8.7 l/m². The lowest annual rainfall amount for the Muntenia is registered at Slobozia, respective 276.6 l/m², followed by Griviţa with 291.1 l/m². The year 2007 was the warmest in the last 107 years in Romania [7]. CONCLUSIONS In order to optimize an agricultural land (an operation whose value and complexity increases with the technical development), it is absolutely necessary a crops’ allocation on regions depending on the weather, depending on crops’ condition and the forecast for the end of the crop life cycle. The organisation of the ground consists in a set of actions (e.g. equipment works, drainage, leveling, planting, terracing etc.) in order to achieve the appropriate set of functions and destinations [5]. Concluding, in the areas with agricultural potential it is imperative to achieve agro-climatologic analysis necessary to value this
potential. Regarding Muntenia region, the agro-climatologic analysis of the main elements (air temperature and precipitation), for the period 1961 – 2009, allows us to highlight: during the 2001 – 2009, the average annual temperature has increased by 0.7˚C, the amount of annual rainfall increased on average by 6% and the rainfall during the critical period, from May to June, considering the species of barley and autumn wheat, shows the predominance of agricultural areas with values below 150.0 l/m² (except for the decade 1971-1980), and considering sun-flower, soya and other kinds of such species, during July-August, the amount of rainfall indicates poor values of below 150.0 l/m² for each decade of the period, the driest decade being 1981-1990. REFERENCES [1]Administrația Națională de Meteorologie, 2008, Clima României, Ed. Academiei Române, București. [2]Cucu, S., 2001, România – Geografie Umană și Economică, Ed. Oraj, Tîrgoviște. [3]Dragotă, C., 2006, Precipitațiile excedentare în România, Editura Academiei Române, București. [4]Lungu, M., 2013, Agrometeorologie, Ed. Universitară, București. [5]Matei E., 2007, Ecosistemele Umane – o abordare din perspectivă geografică, Ed. Universitară, București. [6]Pătru, I., Zaharia, L., Oprea, R., 2006, Geografia Fizică a României – climă, ape, vegetație, soluri, Ed. Universitară, București. [7]Sandu, I., Mateescu, E., 2008, Fenomene meteorologice extreme în România – implicațiile asupra agriculturii, a V-a ediție Forum, București. [8]Sandu, I., Mateescu, E., Vătămanu, V., 2010, Schimbările climatice în România și efectele asupra agriculturii, Editura Sitech, Craiova. [9]Săndoiu, I., 2001, Agrometeorologie, Ed. Ceres, București. [10]Geografia României, 1992, Vol. IV and vol. V, Ed. Academiei Române, București

Scientific Papers Series Management, Economic Engineering in Agriculture and Rural Development Vol. 14, Issue 2, 2014 PRINT ISSN 2284-7995, E-ISSN 2285-3952
71
ANALYSIS OF THE MAIN CLIMATIC FACTORS AND THEIR IMPACT ON CROP PRODUCTION Elena COFAS1, Dana Maria Constantin (Oprea)2, Iuliana ZAHARIA1
1University of Agricultural Sciences and Veterinary Medicine, Romania, 59 Marasti, District 1, 011464, Bucharest, Romania, Phone: +40213182564, Fax:+40213182888, Mobile:+ 40 744 6474 10, Email: [email protected] 2The University of Bucharest, Faculty of Geography, 1, Nicolae Balcescu Boulevard, District 1, 010041, Bucharest, Romania, Phone: +4021/3143508, Fax: 021/3153074
Corresponding author: [email protected] Abstract The data records of crop productivity shows wide fluctuations from one year to another, these being influenced significantly by the conditions climate variability. In general, climate variability affects all sectors of the economy, but, in particular, the agricultural sector it is the most exposed. This study aims an statistical analyze the effects induced by climatological factors on the main agricultural crops, quantified in agroclimatic risks at local and regional levels, for the period 1990-2000, in Ialomita county. Thus, we used statistical data relating to the two groups of variables: 1) agricultural productions (for the main crops – wheat and rye, corn, sunflower, sugar beet, potatoes, vegetables) and 2) climatology data (for the main climatological factors – average temperatures, rainfall, the sunshine duration and the nebulosity) and we analysed the possible correlations for those major variables.
Key words: agriculture, average, climatic, crops, production, temperatures INTRODUCTION Impact of climate phenomena on soils are either direct (due to rising temperatures, changing rainfall volume and intensity and carbon dioxide concentration) or indirectly as a result of changes which bring climate change vegetation or soil biota [5]. Climate change is causing increases erosion of soil's fluid and nutrient leaching, soil structure and texture changes (due to increased tendency of disintegration under the influence of climatic excess), amplifying wind erosion (due to higher summer temperatures and reducing rainfall in summer), reducing the amount and quality of soil organic matter, soil biota biodiversity loss, soil salting etc [6]. In terms of soil, limiting factors of agricultural production are: average annual temperature average annual rainfall gleyzation soil soil salinization textured Ap (0-20cm) groundwater depth slightly alkaline soil reaction humus reserve stagnant excess
moisture (surface). [4]
MATERIALS AND METHODS Considering the existence of a long line of statistics (both from National Meteorological Agency archives, and field data from meteorological stations and rainfall stations) observations at each station Ialomita is analyzed, from existing documentation and computer sites was used for a comparative analysis and verification of these phenomena correlations.[7] To achieve a climatological study it is envisaged the regime and distribution of meteorological parameter for which requires the application of a scientific method of processing and interpretation of climatological data: analyzing the expression in time and
space of the weather phenomena; determining average characteristics of
each analyzed climatic' s parameter; compute the average climatic
parameters in order to show deviations, that difference method; calculate the frequency deviations
between different limits;

Scientific Papers Series Management, Economic Engineering in Agriculture and Rural Development Vol. 14, Issue 2, 2014 PRINT ISSN 2284-7995, E-ISSN 2285-3952
72
analysis of recorded values, averages and extreme analysis, variability in time and space, deviations etc. RESULTS AND DISCUSSIONS The effect of climate factors in Ialomita county Ialomita climate is temperate continental and is characterized by very hot summers and very cold winters with annual thermal amplitude, relatively high daytime and low precipitation
from monthly and annual values of key climate elements: temperature, precipitation, cloudiness and sunshine duration. Temperature: according to records, the average annual temperature is distributed fairly evenly across the county, ranging approximately between 10.5˚C (Armăşeşti) in the north-west and 11˚C in the lowlands adjacent (Feteşti). During the year, the temperature variation is continental, with a minimum in January and a maximum in July (fig.1).
Fig. 1. Monthly average temperatures during 1990-2000 (Ialomita county) Data source: MARS climate database [10] In the first half of the year, from February to July temperatures are rising and inter-monthly differences are positive and between 4 and 6°C, due process air heating, high values of radiation balance and the development of thermal convection. From year to year
between 1990-2000, temperature values ranged between 9.8 and 14°C. Lowest average annual temperature varied during the same period, between 10 and 11.5°C. Nebulosity: mean values of cloud in Ialomita, from 1990-2000, varies relatively little.
Fig. 2. Spatial distribution of cloud during 1990-2000 (Ialomita county) Data source: MARS climate database [10] Evolution of the maximum cloudiness during December-January, influenced the intense
activity air circulation and cooling of the lower layers of air in winter, but also increase

Scientific Papers Series Management, Economic Engineering in Agriculture and Rural Development Vol. 14, Issue 2, 2014 PRINT ISSN 2284-7995, E-ISSN 2285-3952
73
of the cyclone activity and persistence of layered clouds and fog, cloud lowest total of the year is found in July-August (fig.2). On cloud frequency is observed as the lowest frequency of days with overcast sky meets the warm period of the year (July to September). Duration of bright sunshine: this is the amount of time during the day, when the sun shines and is generated by air masses flow conditions. By analyzing the recorded values was obtained as the average annual insolation, as a direct result of the predominance of continental air is between 2100 and 2200 hours, the annual number of days with clear
sky is approximately 110, with 120 cloudy sky and 130 days with overcast sky (fig.3). As a result, this area is a good place to grow vegetables and cereal. Rainfall: climate influences the amount of rainfall, which - Ialomita - decrease from west to east and from north to south. The average monthly quantities have very different values from one month to another, but generally are low, so the annual average rainfall for the period 1990-2000 is 445 mm/year, but thr trend shows a sharp decrease of the sum of annual values (fig.4).
Fig. 3. Duration of bright sunshine durring 1990-2000 (Ialomita county) Data source: MARS climate database [10]
Fig. 4. Spatial distribution of rainfall during 1990-2000 (Ialomita county) Data source: MARS climate database [10] Analyze the correlations between climatic factors and production of main crops The vegetable production sector in Ialomita county presents a great variability in terms of
average production, but the climate of this region favors the development of agriculture, because plain profile of this county.[3] Ialomita agriculture is represented by the

Scientific Papers Series Management, Economic Engineering in Agriculture and Rural Development Vol. 14, Issue 2, 2014 PRINT ISSN 2284-7995, E-ISSN 2285-3952
74
leading private sector, as a consequence of the laws of the land, over 331,000 hectares, or 95% of the agricultural area of the county. The region produces annually, on average, almost 900,000 tons of grains, 140,000 tons of technical plants, around 90,000 tonnes of vegetables etc. Regarding the share of main crops, cereal grains are occupying over two-thirds of the arable land, followed by technical plants and fodder plants. Cultivation of cereals prints a characteristic note of the agriculture in this plain county,
where wheat and corn continues to occupy the main place in crop production, as this cover the consumption needs of the population. Cultivation of cereals has a different character, in accordance with the particular conditions of the two large subunits of relief: field and meadow (pond).[8] Thus, in the field the preferred is wheat and forage crops, and in poon areas are found mainly maize, sunflower, alfalfa and vegetables. However, wheat and maize occupies most of the arable land area of the county, followed by sunflower, rapeseed, soybeans, rye.
Table 1. The evolution of agricultural production to the main crops during the period 1990-2000
Data source: www.insse.ro, Tempo-online [9] Table 2. Paired Samples Correlations
Table 2 contains Pearson correlation test (own calculation, developed by the authors), measuring the degree of Association for each
of the pairs of variables analysed: 1. climatic factors (average temperatures, rainfall, duration of bright sunshine, nebulosity); 2. agricultural productions of major crops (wheat and rye, corn, sunflower, potatoes, vegetables, sugar beet). In this context, it was calculated Pearson's coefficients for correlation between all the components of the two groups of variables, as well as significance tests (sig) of these coefficients. Basically, the analysis refers to the degree and the sense of simultaneous values' variation of the variable relative to the other variables, using a linear model type (N represents the total number analyzed variables).[2] Evaluation of the intensity of linear association between each of the two variables is legitimate in this context, but offers a information different than the difference test between average (t test).[1] Thus, table 3 shows the test “t” results, which permits evaluation of the significance of a certain characteristic changes in the same variable in two different situations and is used to examine the effects of independent variables on one or more dependent variables, are calculated also mean, standard deviation

Scientific Papers Series Management, Economic Engineering in Agriculture and Rural Development Vol. 14, Issue 2, 2014 PRINT ISSN 2284-7995, E-ISSN 2285-3952
75
and standard error for each of the two groups of variables. Table 3. Paired Samples Test From the analysis of calculated values, it can be seen that the reported amount is not very high, and the level of significance is not very deep (the usual comparison level is .05 or .01), what we suggest that presumption of
homogeneity variant has been not breached, more precisely as the climatic factors approximately group is equal to the group represented by the main crop productions (homogeneity variant).
Data source: own calculation on the basis of data from www.insse.ro, Tempo-online , developed by the authors

Scientific Papers Series Management, Economic Engineering in Agriculture and Rural Development Vol. 14, Issue 2, 2014 PRINT ISSN 2284-7995, E-ISSN 2285-3952
76
CONCLUSIONS Analyzing the influence of climate on agricultural production in Ialomita County, we may conclude that the importance of climatic parameters, climate characteristics and clime resultant over a long period of time. The results did not suggest good correlation between all climatic factors and all crops analyzed, but there should not be neglected others factors that contribute to increasing agricultural productivity. Thus, of particular importance to raise the production potential of the soil resources of the county Ialomiţa are land improvement works floodplain soils affected by excess moisture, erosion and salinization or compensation arrangement works for water deficit (irrigation). Also, by doing agricultural works in time and of good quality by using fertilizers, amendments and pesticides by conducting land reclamation (irrigation, drainage and soil erosion), by improving technology and culture through permanent change in the structure and crop rotation agricultural soil productivity increases providing growing crops. REFERENCES [1]Grama A, Jaba E., 2004, Analiza statistica cu SPSS sub Windows, Editura Polirom, Iasi [2]Kuhn M, Johnson K.., 2013, Applied predictive Modeling, Springer Publishing New York Heidelberg [3]Lungu M., 2013, Agrometeorologie, Editura Universitară, București [4]Neitsch, S.I., Arnold, J.G., Kiniry, J.R., Wiliams, J.R., 2001, Soil and Water Assessment Tool- Theoretical Documentation Version 2000. Grassland Sol and Water esearch Laboratory, ARS Temple, Texas, USA [5]Sandu I., Mateescu E., Vătămanu V., 2010, Schimbările climatice în România și efectele asupra agriculturii, Editura Sitech, Craiova [6]Thornthwaite, C.W., Mather, J.R., 1957, Instructions and Tables for Computing Potential Evapotranspiration and the Water Balance. Drexel Institute of Technology. Laboratory of Climatology – Publications in Climatology Volume X, Number 3, Centerton, New Jersey, USA [7]Vasilescu G., 2002, Analiza si statistica economico-financiara, Editura Didactica si Pedagogica, București [8]National Administration of Meteorology, 2008, Clima României, Editura Academiei Române, București
[9]MARS climate database – http://www-mars.lmd.jussieu.fr [10]National Institute for Statistics, Statistical databases-Tempo-Online – https://statistici.insse.ro.

Scientific Papers Series Management, Economic Engineering in Agriculture and Rural Development Vol. 14, Issue 2, 2014 PRINT ISSN 2284-7995, E-ISSN 2285-3952
77
ACCOUNTING AND TAXATION ASPECTS REGARDING THE DEPRECIATION OF FIXED ASSETS IN THE AGRI-FOOD ENTERPRISES OF THE REPUBLIC OF MOLDOVA Vadim COJOCARI, Tatiana COJOCARI
The State Agrarian University of Moldova, 44 Mirceşti Street, MD-2049, Chişinău, the Republic of Moldova, Phone: + 37322432064, E-mail: [email protected] Corresponding author: [email protected] Abstract
If accounting issues concerning the calculation of fixed assets depreciation are considered by most economists as rational and appropriate to the requirements of market changes, then, when it comes to the interpretation of this problem for tax purposes the situation becomes much more contradictory and unusual. In addition, the differences between accounting and taxation rules concerning the determination of amortization amounts are so significant, that it seems, voluntarily or involuntarily, that there is a lack of a unique approach at the state level to solve this issue, and the unwillingness of competent bodies to harmoniously combine the interests of society as a whole and partially those of economic agents.
Key words: accounting, depreciation, fixed assets, taxation INTRODUCTION A special role in the costs of the agri-food sector enterprises is given to the amortization of fixed assets calculated using the methods fixed by the accounting policies of a certain enterprise. On the one hand, the amortization of production fixed assets is included in the cost of manufactured products and through the distribution expenses, it directly influences the size of gross profit, the level of profitability and investment attractiveness of the processing enterprises for local and foreign capital. On the other hand, the information regarding the calculated amortization of fixed assets owned by enterprises or taken by them in financial leasing (lease) that serves for the elaboration of the Income Tax Declaration and related Annexes, shall be recalculated in accordance with the requirements of Articles 26 - 27 of the Tax Code (2007), and due to all consequences generated by the taxable temporary and deductible differences it modifies the current debts of taxpayers to the state budget, which under certain conditions can have a positive impact on their financial situation. But so far most accountants and managers haven’t still realized the purpose of the amortization policy is conditions of inflationary market economy, what are the advantages provided by the accelerated
calculation of fixed assets amortization, who or what influences the selection of one or another method and how to combine the accounting methodology with the basic objectives of any enterprise - cost minimization and profit maximization. Therewith, it should be mentioned that along with the increase of fixed assets’ prices, there will be an enhancement of the amortization policy role in the product cost formation and insurance of their competitiveness both on the local and foreign markets. MATERIALS AND METHODS The determination of fixed assets depreciation is carried out by the economic agents according to the provisions of the Tax Code (2007), Register of fixed assets and intangible assets (2004), NAS „Intangible and tangible assets” (2013), General Plan of accounts (2013) and other normative acts. As empirical basis and initial material we took the data from accounting records, value of corrections, value base of the inventory items and other information agents. In the study, priority was given to the monographic method of the economic events description applying elements of comparison, induction and deduction.

Scientific Papers Series Management, Economic Engineering in Agriculture and Rural Development Vol. 14, Issue 2, 2014 PRINT ISSN 2284-7995, E-ISSN 2285-3952
78
RESULTS AND DISCUSSIONS The paragraph 22 of NAS „Tangible and intangible assets” (2013) stipulates the use of the following methods to calculate the amortization: the straight line depreciation method, units-of-production depreciation method and the declining balance method. The approach to determine the amortization value according to each method and its influence on the amount of enterprise costs/expenses don’t generate objections or uncertainties. The problem lies elsewhere. If the accounting aspects concerning the calculation of fixed assets amortization are considered as a whole by most economists as rational and appropriate to current requirements, then at the chapter of interpreting this problem for tax purposes the situation is much more contradictory and unordinary. When drafting the Tax Code provisions regulating the rules and conditions to deduct the amortization of material property under taxpayers balance, used over a period longer than one year and exceeding the value of 6000 MDL (2007), one took as a basis the USA experience regarding the tax system reform. In accordance with the laws of 1981 and 1986, adopted by the US Congress, all the firms and companies have switched to calculate the amortization for tax purposes according to the Accelerated Cost Recovery System (ACRS) (Alborov,1998). The essence of this system consists summarily in the following: the items that have the same destination and natural features or similar materials (for example, automobiles, machinery, buildings, etc.) are classified in homogeneous groups. In addition, all the items from a group or another must have the operating period and the same operating year; the term „liquidation value” which is similar with „residual value” used in the local accounting system is not taken into account when determining the amortization value; as a basis to calculate the amortization one can use the input cost which is determined according to financial accounting data. Later this cost does not change; the time limits set by law to recover the value of fixed assets are more reduced then the
operating period of these objects determined by the enterprises in financial accounting; the amortization is calculated gradually using the declining balance method; the amortization norms are differentiated not only by groups but also by years. For example, for the items with the 5 year amortization period these norms are established as follows: 20% - for the first year, 32% - for the second, 19.2% - for the third, 11.52% - for the fourth, etc. Simultaneously, the traditional norm expected for uniform (linear) value recovery is doubled; the norms for the item’s operating year (i.e. the first year of usage) and for the year following the expiration of the calculated amortization period is taken at a rate of ½; the norms for the amortization period (except the first year) are determined as the multiplication of doubled linear norm and the difference between 100% and the amortization norms for previous years; for the items with relatively high amortization period (5 years or more), after the input value recovery of the prevailing part the norms does not change. As in the USA, the national system of fixed assets value recovery for tax purposes is based on the accelerated calculation of the wear using the declining balance method, grouping of the items into categories of merged property (a total of 5) and the application of unique amortization norms for all the assets from one or another category. However, the mechanism of using these criteria and especially the set of used accounting data differ considerably from the international experience thus, complicating largely the achievement of established objectives. For example, the size of a criterion reporting to a specific category of property for sugar industry equipment with the operating period of 12 years (Register of fixed assets and intangible assets, 2004) constitutes 16.67 % (AC = 200:12). Since the result is higher than N3 = 10% but it does not exceed N4 = 20%, the mentioned equipment refers to the fourth category of property with a unique amortization norm of 20% for all years. This means that the amortization period is 5 years (100:20) and during this period the input cost of the equipment should be divided fully to the expenses established as deductions. Actually,

Scientific Papers Series Management, Economic Engineering in Agriculture and Rural Development Vol. 14, Issue 2, 2014 PRINT ISSN 2284-7995, E-ISSN 2285-3952
79
however, because of the abandonment of the two most important principles of ACRS system (differentiation of the amortization norms by years and switching to the straight-line depreciation method at a particular moment), the calculation of equipment wear for tax purposes takes usually more than the official period of amortization. In practice, depending on the concrete conditions of enterprises, the real period of fixed assets value recovery for tax purposes can be extended multiple times, thereby increasing labour expenses of accountants and discrediting the fundamental rule of amortization policy promoted by the State (the reduction of the amortization period compared to actual duration of the operating period of fixed assets in order to stimulate the scientific and technical progress). In addition, the calculated period of amortization for tax purposes increases as the input cost of items included in one category of property or another increases. For example, each subsequent doubling of the fixed asset value with the operating period of 3 years and the wear norm of 30%, causes a 2 year increase of the calculated wear term. Consequently, one can create an absurd situation when certain fixed assets are no longer in an enterprise (because they were deducted or sold), but their amortization for tax purposes continues to be calculated. Thus, the Tax Code, as correctly noted T. Prisacar, „... are just declared, but do not contribute to accelerated depreciation of the fixed assets value compared to their depreciation in the financial accounting” (Prisacar, 2006). The way of determining assets amortization that should be deducted from the calculation of taxable income is sophisticated too. Therefore, in order to complete each line of the Fixed Assets Register by categories of property for tax purposes, the accountants or financial workers are forced to perform many arithmetic operations and simultaneously to make multiple selections from the files (registers) of financial or management accounting in order to obtain information about bypassing various limits and restrictions. For comparison, we can mention that in the USA, in order to determine fixed assets amortization for tax purposes it is
necessary to perform only one operation – to multiply the patrimony input cost, which is not subject to corrections, to the amortization norm differentiated by years. Thus, although the conceptual basis of the calculation method of fixed assets amortization stipulated in Article 26 of the Tax Code is a progressive one, stimulating investments in tangible assets, the mechanism of its achievement is still artificially sophisticated and complicates the accomplishment of pursued objectives. In connection with this fact, it would be rational for the ministry to reinterpret some key moments of the current system of the patrimony value recovery for tax purposes, making it simpler, more affordable and more illustrative. One of the possible directions to solve this problem can be the implementation of the method used in the USA for tax purposes, the one that provide real economic benefits. In order to confirm the above-mentioned facts, there was calculated (in Table 1) the amortization of the sugar beets chopping machine which is part of the fourth category of property and has an amortization period of 5 years, while determining the possible tax effect of the implemented new method (Table 2) . Table 1.Calculating the amortization of the sugar beets chopping machine using the method implemented in the USA for tax purposes, MDL
Year Amortization value for deduction
Accounting value at the end of the period
1 2
210000 x 20 : 100 = 42000 168000
210000 x 32 : 100 = 67200 100800
210000 x 19,2 : 100 = 40320
60480
210000 x 11,52 : 100 = 24192
36288
210000 x 11,52 : 100 = 24192
12096
210000 x 5,76 : 100 = 12096
–
Note. Input cost of the machine constitutes 210000 MDL, while the operating period is 12 years.
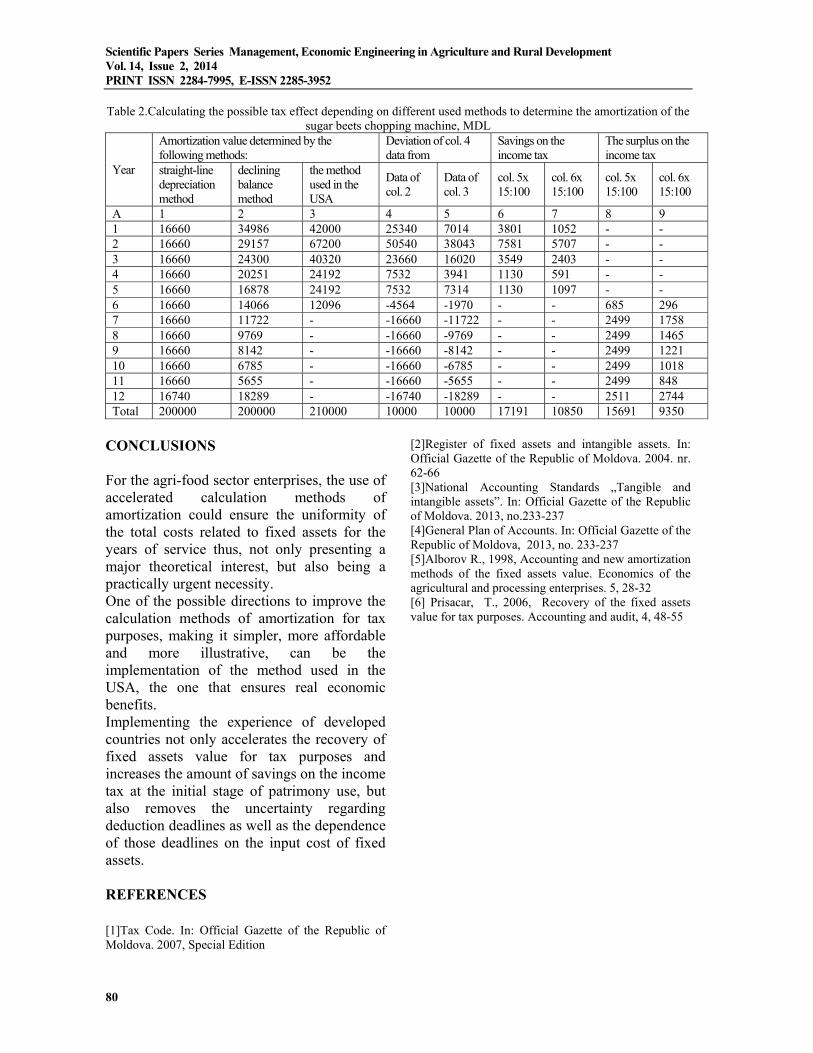
Scientific Papers Series Management, Economic Engineering in Agriculture and Rural Development Vol. 14, Issue 2, 2014 PRINT ISSN 2284-7995, E-ISSN 2285-3952
80
Table 2.Calculating the possible tax effect depending on different used methods to determine the amortization of the
sugar beets chopping machine, MDL
Year
Amortization value determined by the following methods:
Deviation of col. 4 data from
Savings on the income tax
The surplus on the income tax
straight-line depreciation method
declining balance method
the method used in the USA
Data of col. 2
Data of col. 3
col. 5x 15:100
col. 6x 15:100
col. 5x 15:100
col. 6x 15:100
A 1 2 3 4 5 6 7 8 9 1 16660 34986 42000 25340 7014 3801 1052 - - 2 16660 29157 67200 50540 38043 7581 5707 - - 3 16660 24300 40320 23660 16020 3549 2403 - - 4 16660 20251 24192 7532 3941 1130 591 - - 5 16660 16878 24192 7532 7314 1130 1097 - - 6 16660 14066 12096 -4564 -1970 - - 685 296 7 16660 11722 - -16660 -11722 - - 2499 1758 8 16660 9769 - -16660 -9769 - - 2499 1465 9 16660 8142 - -16660 -8142 - - 2499 1221 10 16660 6785 - -16660 -6785 - - 2499 1018 11 16660 5655 - -16660 -5655 - - 2499 848 12 16740 18289 - -16740 -18289 - - 2511 2744 Total 200000 200000 210000 10000 10000 17191 10850 15691 9350
CONCLUSIONS For the agri-food sector enterprises, the use of accelerated calculation methods of amortization could ensure the uniformity of the total costs related to fixed assets for the years of service thus, not only presenting a major theoretical interest, but also being a practically urgent necessity. One of the possible directions to improve the calculation methods of amortization for tax purposes, making it simpler, more affordable and more illustrative, can be the implementation of the method used in the USA, the one that ensures real economic benefits. Implementing the experience of developed countries not only accelerates the recovery of fixed assets value for tax purposes and increases the amount of savings on the income tax at the initial stage of patrimony use, but also removes the uncertainty regarding deduction deadlines as well as the dependence of those deadlines on the input cost of fixed assets.
REFERENCES [1]Tax Code. In: Official Gazette of the Republic of Moldova. 2007, Special Edition
[2]Register of fixed assets and intangible assets. In: Official Gazette of the Republic of Moldova. 2004. nr. 62-66 [3]National Accounting Standards „Tangible and intangible assets”. In: Official Gazette of the Republic of Moldova. 2013, no.233-237 [4]General Plan of Accounts. In: Official Gazette of the Republic of Moldova, 2013, no. 233-237 [5]Alborov R., 1998, Accounting and new amortization methods of the fixed assets value. Economics of the agricultural and processing enterprises. 5, 28-32 [6] Prisacar, T., 2006, Recovery of the fixed assets value for tax purposes. Accounting and audit, 4, 48-55
Scientific Papers Series Management, Economic Engineering in Agriculture and Rural Development Vol. 14, Issue 2, 2014 PRINT ISSN 2284-7995, E-ISSN 2285-3952
81
SUPPLY CHAINS IN AGRICULTURE AND FOOD PRODUCTION Liliana CONDRAȚCHI Academy of Economic Studies of Moldova, 59 Banulescu Bodoni Street, Chisinau, Republic of Moldova; Phone: (+373) 69274228; E-mail: [email protected] Corresponding author: [email protected] Abstract The role of production and supply chain is increasing worldwide due of the growing consumer concerns over food safety and quality together with retailer demands for large volumes of consistent and reliable product. In developed countries, product losses (post harvest losses) are generally small during processing, storage and handling because of the efficiency of the equipment, better storage facilities, and control of critical variables by a skilled and trained staff. Recently, the concept of Agricultural and Food production has been under development as more effective and efficient management system is required for the food production planning, physical collection of primary produce from fields and homesteads, processing and storage at various levels, handling, packaging, and distribution of final product. Key words: agriculture, competitive farmers, food productions, logistical activity, supply chains INTRODUCTION During the recent two decades, goods flow has been tremendously increased, even though the amount of goods remains at the steady state. Increased variety of goods, the just-in-time delivery system, low load rate, specialization and centralization of production systems globalization of marketing and seasonal variations are among the main challenges of logistics system which may lead to the necessity of developing effective logistics in the sector. Effective logistics and technologies are a critical success factors for both manufacturers and retailers. Effective logistics requires delivering the right product, in the right quantity, in the right condition, to the right place, at the right time, for the right cost (and it has a positive impact on the success of the partners in the supply chain [13]. Food chain logistics is a significant component within logistics system as a whole. The food sector plays a significant role in economy being one of the main contributors to the GNP of many countries, particularly in developing countries. According to the European Commission (2010), the food and drink industry is one of Europe's most important and dynamic industrial sectors consisting of more than 300.000 companies
which provide jobs for more than 4 million people. The current trend in food value chain is characterized by three overriding features: -greater concentration of farms, food industries, and wholesalers into smaller number with large sizes; -the evolution of integrated supply chains linking producers and other stakeholders; -ever increasing consumers demand for food quality and safety (food that is fresh, palatable, nutritious and safe) and animal welfare. However, to date, the linking between logistics systems of the stakeholders in the agriculture and food supply chain is rather loose and fragmented. Even within individual firms, the vertical and internal integration as related to freight and logistics is loose, and therefore they are both economically and environmentally inefficient and not sustainable. In this regard effective and efficient logistics will be a critical success factor for both producers and retailers. In addition to the increase in transport of agricultural and related goods in the recent decades, empty haulage is common in agricultural sector and the load capacity utilization level of vehicles is very low (it varies between 10 and 95%) [11]. Therefore, efficient use of vehicles could be among the
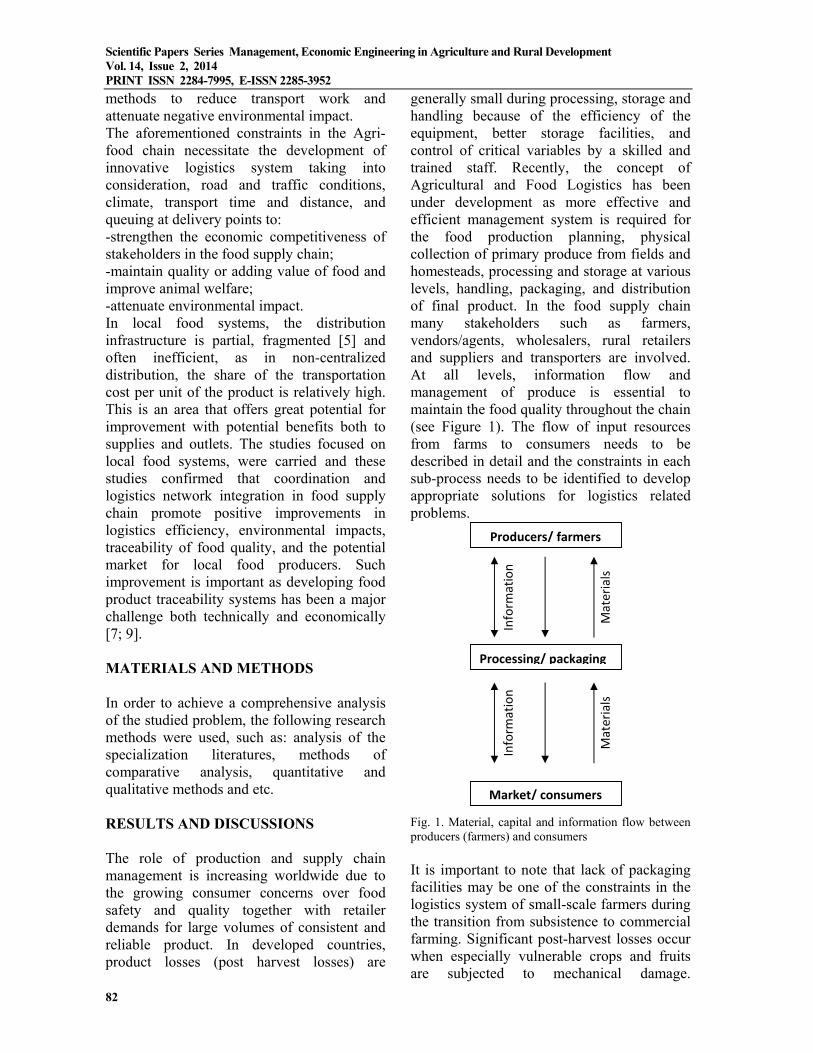
Scientific Papers Series Management, Economic Engineering in Agriculture and Rural Development Vol. 14, Issue 2, 2014 PRINT ISSN 2284-7995, E-ISSN 2285-3952
82
methods to reduce transport work and attenuate negative environmental impact. The aforementioned constraints in the Agri-food chain necessitate the development of innovative logistics system taking into consideration, road and traffic conditions, climate, transport time and distance, and queuing at delivery points to: -strengthen the economic competitiveness of stakeholders in the food supply chain; -maintain quality or adding value of food and improve animal welfare; -attenuate environmental impact. In local food systems, the distribution infrastructure is partial, fragmented [5] and often inefficient, as in non-centralized distribution, the share of the transportation cost per unit of the product is relatively high. This is an area that offers great potential for improvement with potential benefits both to supplies and outlets. The studies focused on local food systems, were carried and these studies confirmed that coordination and logistics network integration in food supply chain promote positive improvements in logistics efficiency, environmental impacts, traceability of food quality, and the potential market for local food producers. Such improvement is important as developing food product traceability systems has been a major challenge both technically and economically [7; 9]. MATERIALS AND METHODS In order to achieve a comprehensive analysis of the studied problem, the following research methods were used, such as: analysis of the specialization literatures, methods of comparative analysis, quantitative and qualitative methods and etc. RESULTS AND DISCUSSIONS The role of production and supply chain management is increasing worldwide due to the growing consumer concerns over food safety and quality together with retailer demands for large volumes of consistent and reliable product. In developed countries, product losses (post harvest losses) are
generally small during processing, storage and handling because of the efficiency of the equipment, better storage facilities, and control of critical variables by a skilled and trained staff. Recently, the concept of Agricultural and Food Logistics has been under development as more effective and efficient management system is required for the food production planning, physical collection of primary produce from fields and homesteads, processing and storage at various levels, handling, packaging, and distribution of final product. In the food supply chain many stakeholders such as farmers, vendors/agents, wholesalers, rural retailers and suppliers and transporters are involved. At all levels, information flow and management of produce is essential to maintain the food quality throughout the chain (see Figure 1). The flow of input resources from farms to consumers needs to be described in detail and the constraints in each sub-process needs to be identified to develop appropriate solutions for logistics related problems. Fig. 1. Material, capital and information flow between producers (farmers) and consumers It is important to note that lack of packaging facilities may be one of the constraints in the logistics system of small-scale farmers during the transition from subsistence to commercial farming. Significant post-harvest losses occur when especially vulnerable crops and fruits are subjected to mechanical damage.
Producers/ farmers
Inform
ation
Materials
Processing/ packaging
Market/ consumers
Inform
ation
Materials

Scientific Papers Series Management, Economic Engineering in Agriculture and Rural Development Vol. 14, Issue 2, 2014 PRINT ISSN 2284-7995, E-ISSN 2285-3952
83
Therefore management of packaging should be taken into consideration in the development of agricultural logistic systems. The development of smallholder agriculture in developing countries is very sensitive to transport strategies. Many isolated farmers have little opportunity to escape poverty, as their potential marketing activities are hampered by inadequate or poor transport facilities. The rural transport planning must address the needs of people, as much as possible at the household level. Such well planed transport system enables smallholders make the transition from subsistence to small-scale commercial farming. This helps them to harvest and market crops more efficiently, reduces drudgery and, by facilitating communication, helps stimulate social integration and improve quality of life. Availability of road infrastructure (that includes feeder roads, tracks, and paths), storage facilities and transport services increases mobility and encourages production [10]. In agricultural systems of developing countries, animal power is used to replace human power and facilitate transport tasks. Animals are used to pull carts or sledges and as pack animals. At least ten species have been so domesticated, and their (absolute) capabilities depend primarily on body size. In relative terms, pack animals can carry 12 to 30 % of their body weight and can pull horizontally 40 to 60% of their body weight. These values depend on species, but field observations have returned higher values, probably at some cost of animals' well being. In rural agricultural transport, in developing countries, special emphasis should be on collection, packaging, storage and distribution of agricultural primary products. Among the urgent tasks that formulated by the 8th plenary meeting of General Assembly of United Nation in June 1986, regarding transport and related infrastructure in developing countries, were improving and expanding the storage capacity, distribution and the marketing system; and development of transport and communications. Training of farmers (producers) may reduce loss due to harvest and temporarily storage, while other
stake holders (for examples service providers) should take the responsibility to minimize loss. Loss in processing, storage and handling is high because of poor facilities and frequently inadequate knowledge of methods to care for the produce. Post-harvest losses run up to 40% varying from 15 to 25% on farm and 10 to 15% in trade. The high losses in developing countries represent not only a severe economic loss for the regions but also a major loss of nutrients to already malnourished populations [16]. The basic concept described in Figure 1 is also applicable for small-scale farmers in developing countries. However, the challenges of rural transport may be promoting the application of the concept of rural logistics; developing rural infrastructure (storage and packaging facilities, collection points and centers); developing efficient and effective management of product and information flow; developing strategies to promote best transport services. Some of the main issues that require immediate attention are: encouragement of private entrepreneurs to take the responsibility of service provider in storage, packaging and transport services; development of collection centre systems to promote marketing possibilities by facilitating coordinated transport services. Constraints associated with the flow and storage of produce and services in food and agribusiness exist in developing countries include lack of adequate storage facilities and knowledge of handling; poor processing, management and transport services. In the absence of coordinated product delivery system, farmers themselves transport most of the produce, either as head loading or using pack animals, to both nearby and long distance markets. There are many constraints of such transport conditions: Amount of produce that can be transported by head loading or pack animals is limited; Transport time and distance is long; Drudgery on farmers; and Spoilage of produce during transport, etc. These constraints may result in reducing production and marketing opportunities for farmers, and consequently shortage of food for consumers. The reduction of spoilage and damages that could improve
Scientific Papers Series Management, Economic Engineering in Agriculture and Rural Development Vol. 14, Issue 2, 2014 PRINT ISSN 2284-7995, E-ISSN 2285-3952
84
the marketing value of the produce may necessitate the availability of adequate processing, packaging and storage facilities and management for each varieties of produce [10]. Logistics in abattoir chains: Animal supply and meat distribution From effective logistics management point of view, an integrated approach from farm-to-table is required for effective control of food hazards which is a shared responsibility of producers, packers, processors, distributors, retailers, food service operators and consumers. This is important issue, because the increase in world population and improvement of living standard increase the meat consumption and, especially in developed countries, consumers prefer food with no additives or chemical residues; food exposed to minimal processing; safe and economic food. The increasing interest in transparency of food supply chain leads food industries to develop, implement and maintain traceability systems that improve food supply management with positive implications for food safety and quality [15]. As animals stressing may damage meat quality, and lead to more contamination with pathogens, humane treatment of animals is getting more attention. Tracking slaughter animals from birth to finished products and tracking food shipments are becoming area of focus recently [15]. This helps to control the risk of animal disease, to reduce risk of tampering, to generate detail information on country of origin and animal welfare in the global food supply systems . Animal identification and traceability as well as meat processing and distribution are some of the issues related to meat safety challenges. In the process of establishment of animal identification and tracking systems, countries should take the following into consideration: Selection of appropriate technology and precision requirements, maintenance of confidentiality, payment of costs, premises number and animal identification number, livestock feed and meat safety. Meat spoilage may occur during processing, transportation and storage in market. An
important aspect of fresh meat distribution and consumption is effective monitoring of time/ temperature conditions that affect both safety and overall meat quality. Appropriate packaging, transporting and storage of meat products are important, since meat products spoil in a relatively short time. Scientific attention on meat spoilage increased when shipment of large amounts of meat products started [7]. The EU legislation requires a maximum final meat temperature of 7°C before transport and the vehicle for meat transport must be provided with a good refrigerated system. The meat transport from cold storage to retail outlet and then to the consumer refrigerator are critical points for meat quality and safety. Animal collection from many farms and transporting to abattoirs requires a dynamic planning process taking into consideration stress inducing factors such as road conditions, climate and traffic conditions transport distance and time, queuing at the gate of abattoir for unloading [3]. Coordination and optimization in food distribution is a potential strategy to promote economically effective and environmentally sustainable food distribution. Some of the major possibilities for improved coordination and transport planning of agricultural goods transport are: possible coordination of meat and dairy product distribution through combined loading; possible coordination of fodder transport and grain transport through back-haulage; and partial or total optimization of vehicle fleet [11]. Uncoordinated and non optimum food transport systems are not energy efficient in local food systems, although there is considerable potential to increase the efficiency of energy use by organizing the food delivery system in new ways [2], using more energy efficient vehicles and/or introducing the production of biofuel in the region, increasing the utilization level of vehicles' capacity [11] and planning optimum routes for food collection and distribution systems. Logistics in milk supply and dairy product distribution

Scientific Papers Series Management, Economic Engineering in Agriculture and Rural Development Vol. 14, Issue 2, 2014 PRINT ISSN 2284-7995, E-ISSN 2285-3952
85
Milk is an important agricultural produce that livestock keepers use for both consumption and market. The marketing of milk, surplus to family and farm needs, improves farm income, creates employment in processing, marketing and distribution and contributes to food security in rural and urban communities [10]. From transport services point of view, marketing of milk is difficult for producers who are living in scattered and isolated areas. These farmers can only sell butter to the urban areas and the remaining milk products are for home consumption. Delivery of fresh milk from long distance to urban by small-scale farmers is difficult for two main reasons. Firstly, the daily milk produce is relatively small to deliver to urban area and transporting perishable commodity over long distance is difficult. Secondly, milk quality deteriorates as it is transported over longer time without processing. The only available traditional processing is fermentation. To promote marketing of milk for small-scale farmers, it is necessary to develop strategies for on-farming chilling and collection of milk. In developed nations, transport companies collect the milk from farms to collection points and thereafter transport to dairy plants [7]. The dairy industry provides a special milk container in which the farmers store the milk before the transporters collect the milk. Usually tank Lorries and tank trailers are used for collecting milk from farms and deliver to the nearest dairy. The milk supplied to dairy companies is processed and distributed to consumers. The dairy products such as milk, powder, edible fat and cheese are distributed by dairy product distributors. In such a process, the tank Lorries collect milk up to their full capacity and pump to the tank trailer which is usually placed in the best place as illustrated in Figure 2. Optimizing the routes of milk collection enables to improve the transport distance and time. The European Union (EU) limits the maximum level of milk production of member countries [11; 4]. The domestic consumption of dairy products in EU is as high as 90% of its milk production. And still, EU is a major
player on the world dairy market and the EU dairy sector is expected to be market oriented in the future [4]. Fig. 2. Schematic presentation of possible way of milk collection from farms and delivery to the dairy industry In developing countries individual traders or small scale agencies collect milk from producers and supply to collection centers. Milk may be carried to the collection points as shoulder slings, on bicycles, animal carts or small boats [10]. Advanced milk collection process found in developing countries begins with the producer delivering milk to a collection point where the volume is measured, or the milk weighed, recorded, and sometimes it is sampled and checked for quality. The milk is later transported, to a larger collection centre where, if possible, it is chilled. The collected milk is subsequently sent in bulk to a processing plant by truck. The time-delay from milking to delivery at the processing plant often exceeds five hours and is negatively affecting the quality of non-refrigerated milk, which is often rejected by dairy processing plants and is also not acceptable by consumers [10]. Logistics in grain supply chain During the recent 20 years, goods flow has been tremendously increased, mainly not due
Dairy
Collection
point

Scientific Papers Series Management, Economic Engineering in Agriculture and Rural Development Vol. 14, Issue 2, 2014 PRINT ISSN 2284-7995, E-ISSN 2285-3952
86
to the increase in the amount of goods, but due to other factors such as specialization and centralization of production systems and globalization of marketing [11]. Agricultural goods transport is a significant component within such increasing goods transport. For example about 13% of the international sea-borne trade is grain transport. Grain transport is the main component in agricultural transport in general and it includes grain transports from farm to depot/terminals, between farms, between terminals, from farms and terminals to fodder industries and mills and from terminals to ports for export. Due to the legal limit of total weight of a lorry, the drivers have to estimate the load weight and it is not unusual that the actual loads exceed the legal maximum loads due to overloading. In grain transport systems, back-hauling can be used for the delivery of fodder to farms [11]. Although the grain transport from farms is concentrated during the harvesting season, there is a possibility to coordinate the delivery of fertilizers and other means of production with grain transport i.e. the farmers can dry their grain and keep it at the farm till the time of delivery of means of production. The intensity of grain delivery at the harvest season causes capacity problems for vehicle resources and transport planning. Planning of production and orders at farm level, to minimize the seasonal effects, would improve the conditions for transport planning and coordination. In developing countries, grain collectors are responsible for commercializing the grain within the country and exporting surplus. Even though, these grain collectors are considered as informal by the government body in some countries, they served an important role in the grain supply chain. For commercializing grain, it can be collected from individual farmers to a critical size that can be transported cheaply for retail locally, and the surpluses can be exported at premium prices elsewhere [10]. Logistics in local food supply chain In the agriculture sector, globalization of food production has considerably influenced the food supply system by increasing distance the food has to be transported to reach consumers.
This situation not only has increased emissions of greenhouse gases but also has reduced the relationship between local food producers and consumers, affecting local food producers, their environment and culture. In terms of distance, locally produced food can be characterized by the proximity of production place to the consumers and usually there is a limit. In addition to geographical distance, locally produced food is also considered as food which meets a number of criteria such as animal welfare, employment, fair trading relations, producer profitability, health, cultural and environmental issues [3]. Currently it is observed that customers have been motivated (to purchase the local food) by contributing positively to the ecosystem (a more altruistic reason) and by food quality and pleasure (a more hedonistic reason) [6;3]. Coordination and network integration in local food supply chain increases logistics efficiency, potential market, access to information and reduces environmental impact [3;11]. In the food distribution system of local food producers, logistics is fragmented and inefficient compromising the sustainability of localized systems and this requires improvement. Therefore forming the best collection and distribution centers for locally produced food is very important. Such location decisions should be supported technically since the location decisions have the dynamic implication over time [7]. Therefore, in the process of developing improved logistics systems in the local food supply chain, detailed location analysis (mapping and clustering producers and determining optimum location of collection and/or distribution centers) and route analysis (creating optimized routes for product collection and distribution, simulating route distance and delivery time) are very essential [3]. Potential producers of local food want to expand their sales area. However, increasing sales of locally produced food, on small scale bases, needs to overcome the main problems such as low size of production and more volatility of market price and high seasonality of food products on market, inadequate packing and storage facilities, limited or no

Scientific Papers Series Management, Economic Engineering in Agriculture and Rural Development Vol. 14, Issue 2, 2014 PRINT ISSN 2284-7995, E-ISSN 2285-3952
87
means of transport and limited knowledge of potential market. These problems can be overcome mainly if the local food systems can be embraced by dominant food supermarket and superstore chains and this can be facilitated by integrating the local food system into large scale food distribution channels. Such integration in local food systems plays a key role in sharing information and scarce/expensive resources as it enables the stake holders get access to the right information at the right time. Well organized information concerning local food is important to satisfy the increasing demand of consumers to have good knowledge and information of the food origin and how it is handled and transported. The logistics network integration is also helpful in creating favorable situation for interested researchers. For example, well established data management might come into existence which in turn helps to conduct more detail studies on the logistics activities enabling further improvements that increase the sustainability of local food systems [3]. The integration also facilitates improved traceability system which depends on information connectivity and provides an added layer of food security which might be established more easily within integrated systems [9;1]. One apparent advantage of such a co-ordination and logistics network integration is that each stakeholder in the network concentrates on its specialty and improves its productivity in both quality and quantity [2]. Studies [3] indicate that in local food systems, producers of local food run mostly their own vehicles and about half of the vehicle capacity is unutilized. Therefore, the coordination and logistics network integration in local food system leads towards positive environmental impact by: (I) Reducing number of vehicles to be deployed for produce collection and distribution of local food products; (II) Increasing the utilization level of vehicle loading capacity; (III) Reducing travel distance, time and fuel by following optimized routes where possible; (IV) Reducing green house gas emissions (as the consequence of the facts mentioned above).
CONCLUSIONS From effective logistics management point of view, an integrated approach from farm-to-table is required for effective control of food hazards which is a shared responsibility of producers, packers, processors, distributors, retailers, food service operators and consumers. Therefore, tracking slaughter animals from birth to finished products and tracking food shipments are becoming area of focus recently. Studies indicated that, in the food and agriculture supply chains, there are potential area of logistics related improvements in terms of reducing transport routes, distance and time; reducing emission from vehicles; improving the packaging of food products and improving transport services. This can be implemented in collecting, storing and transporting slaughter animals, meat products, milk and dairy products, grain and related products. Agriculture and food supply chain is specific and complex area with important responsibilities. There are two main demands: a. Maintaining food quality and safety including animal welfare along the supply chain, and b. Reducing logistics cost. The concept of Agricultural and Food Logistics is slowly emerging as one of the important types of logistics to reach the requirements for maintaining quality of raw materials for food and food products or even to perform value adding activities in the food supply chain. The questions related to post harvest loss, which ranges up to 70% in developing countries, animal welfare during transport, and the concern of origin of food staffs and how they are produced and processed are societal questions. In relation to globalization of marketing system, it is a vital for all stakeholders to reduce logistics cost in order to increase their economic competitiveness. Therefore, development of effective and efficient Agricultural and Food Logistics is necessary and essential.

Scientific Papers Series Management, Economic Engineering in Agriculture and Rural Development Vol. 14, Issue 2, 2014 PRINT ISSN 2284-7995, E-ISSN 2285-3952
88
REFERENCES [1]Bontham, A., Oldham, C.2003, Creating value through traceability. Solution. Food Origins, Illinous, SUA [2]Beckeman, M, Skjoldebrand, C., 2007, Clusters/Network promote food innovations, Journal of food Engineering, No. 79 [3]Bosona, T., Gebresenbet, G., Nordmark, I., Ljungberg D., 2011, Integrated logistics network for supply chain of locally produced food. Part I. Location and route optimization analysis. Journal of service science and management. No. 4 [4]Bouamra – Mechemache, Z., Requillanrt, V., et. al., 2008, Demand for dairy products in the EU. Fppd policy. No.33. [5]Brewer, A. M., Button, K. J., Hensher, D. A., 2001, Handbook of logistics and supply chain management. Firs Edition. The Netherlands [6]Brown, E., Dury, S., Holtherlands, M., 2009, Motivations of consumers that use local organic fruits and vegetable box scheme in central England and southern France. Journal Appetite. No. 53 [7]Condratchi, L., Siscanu, T. et al., 2013, Supply chains in agriculture and food production. Lucrări științifice, Vol. 37, Cisinau [8]Constantin M., Chiran A. ewt al., 2009, Marketingul producției agroalimentare. Ed. Agrotehnica, București [9]Engelseth P., Food product tranceability and supply network integration. Journal of Business and industrial marketing, No. 24 (5) [10]Gebresenbet, G., Oodally, G., 2005, Review and analysis of rural agricultural transport and logistics in developing countries. Tehnical Guidelines. Report. Swedish University of Agricultural Sciences [11]Gebresenbet, G., Ljungberg, D., 2001, Coordination and route optimization of agricultural goods transport to attenuate environmental impact. Journal of agricultural engineering research. DOI: 10.1006/Jaer.2001.0746 [12]Gebresenbet, G., 2001, Logistics and rural agriculture systems. Workshop on agricultural rural transport, October 15 – 17, Nairobi [13]Gillesz, P., Thierry, S., 2010, La logistique: enjeur strategiques, 2-e Edition, Paris [14]Russell, R.S., Taylor, B. W., 2009, Operations management along the supply chain, 6th Edition, ISBN: 978-0470-23379-5. John Wiley and Sons Ltd., Chichester [15]Smith, G. C., Tatum, J. D., Belk, K. E., et. al., 2005, Tranceability from a US pperspective. Meat science, No. 71 [16]Urraburu, J., 2000, Milk collection, preservation and transport. Discution paper 1.2. E-mail conference on ”Small Scale Milk Collection and processing in developing countries”, 29 may – 28 july, FAO, 2000

Scientific Papers Series Management, Economic Engineering in Agriculture and Rural Development Vol. 14, Issue 2, 2014 PRINT ISSN 2284-7995, E-ISSN 2285-3952
89
COMPETITIVENESS ANALYSIS OF THE REPUBLIC OF MOLDOVA BY MEANS OF EFFICIENCY INDICATORS OF FOREIGN TRADE WITH AGRICULTURAL FOOD PRODUCTS Boris COREŢCHI, Olga SÂRBU, Elena MOROI State Agrarian University of Moldova, Chisinau, 42 Mircesti, MD-4224, Chisinau, Republic of Moldova, Phone: +373 22 432387, E-mail: [email protected], E-mail: [email protected], E-mail: [email protected] Corresponding author: [email protected]
Abstract An old traditional form of foreign economic relations is represented by foreign trade. Republic of Moldova, Featuring a geographical position that represents the area of intersection the numerous trade routes and regional connotation communications, should use these advantages in order to extend the export-import relations; there for, Republic of Moldova follows to use the internal potential in intensive and effective way. Competitiveness of external trade with agricultural food products has a particularly important role which is steadily increasing, it determine the increasing or decreasing of the national income produced outside depending upon the ratio between the national and international amount of goods. Ensuring the economic efficiency of production requires a certain minimum volume of its. If the volume exceeds the absorption capacity of the internal market, ensuring efficient production requires a call to the external market. On the other hand, certain products can not be obtained either domestic production or isn’t justified from the economic point of view can be obtained only from the external market. Keywords: agricultural food products, competitiveness, economic efficiency, external trade, market, profit INTRODUCTION In a market economy, the decisive factor in the successful trade on the agri-food products market is the competitiveness, which means the obedience of product market conditions, specific requirements of consumers, not only the quality but also the economic, ecological and other commercial requirements necessary to be implemented (cost, delivery, distribution channels, advertising, etc.). The agri-food market has specific significant features and forms of market organization (real demand, integrated, local and state market, raw material and finished product). At present, food security problem is one of the main systems of human life insurance and has a crucial importance together with the objectives of general economic security and security of the whole country. Food security – first of all, ensures a certain level of local production or self-insurance complexity (for the countries with precocious development conditions and highly integrated in the world economy) and keeps the minimum maintenance level [1, p. 89].
Trade integration requires also an improvement in terms of food safety and quality control systems. It is also necessary to develop a strategy on food safety related to chemical and biological safety of the food products of animal and plant origin. As a response to these changes, the diversification of foreign markets becomes a key factor in reducing the dependency of Moldovan agricultural products on CIS markets. Improving access to markets and market infrastructure development must be addressed taking into account three major constraints: 1. Farmers’ inability to implement the standards of food quality and safety; 2. Lack of modern facilities for internal trade such as the networks of regional wholesale markets; 3. Underdeveloped post-harvest infrastructure. Customs office data regarding the countries importing in CIS states were examined and most cases of goods rejection from those markets are related to the changes in regulatory practices (e.g.: the adoption of Acquis Communautaire by Romania in

Scientific Papers Series Management, Economic Engineering in Agriculture and Rural Development Vol. 14, Issue 2, 2014 PRINT ISSN 2284-7995, E-ISSN 2285-3952
90
anticipation of its adherence to the European Union in 2007) or to state policies motivated by offenses relating to sanitation and phyto-sanitation measures (e.g.: In September 2005, Russia banned the export of fruits and vegetables from the Republic of Moldova and in 2008, it partially banned the export of alcoholic beverages (wine)). The main interest areas of the sanitary and phyto-sanitary system regarding the export are: controlling the microbiological hazards transmitted through food and water, controlling the zoonotic diseases and pesticide residue testing. Country’s information about pesticide residues is very limited, but the general consensus is that during several decades, Moldova’s agriculture was focused on reducing the use of chemicals and on the fact that the amounts of pesticide residues must be very small both in the livestock sector and phyto-technical cultures. Also, the failures related to obsolete pesticide packaging and leaking and persistent organic pollutants stored in warehouses in different regions of the country could become a danger of acute pesticide poising in humans. The relevant approach to the problem of food security as the key factor of trade development involves the use of suitable tools together with efficient management in conditions of increased efficiency of multiple processes that ensure people’s access to qualitative agri-food products at affordable prices, such as: informing farmers about the evolution of agricultural markets so that they can plan their production in advance and to adjust it to market demand; informing farmers about the market prices in urban areas so that they can negotiate with traders on equal terms; effective management of the agri-food trade in terms of market diversity etc. Also the need to evaluate the compliance of the sanitary and phyto-sanitary control systems and customs procedures in the Republic of Moldova with WTO non-discrimination rules concerns the development of an action plan to modernize these systems in accordance with international requirements, according to need.
The increasing requirement for the use of security and quality control systems, such as HACCP and ISO standards, has resulted in the transfer of responsibilities to the private sector. Government may focus on the provision of public services such as enforcement of laws and regulations, infrastructure and development of human skills [2]. Elaborating a support program for the food industry modernization. Modernization projects of the private sector may include renovation of old factories, quality management, water supply, waste management and distribution network organization. The support should include comprehensive improvement plans in order to meet EU principles of hygiene in food processing, accompanied by funding programs and plans. Increasing the role of agricultural production management in relation to the objective trends of competition, liberalization of economic relations and improvement of the selective consumers. Therefore, the management of agricultural production must be processed by the administrative marketing, which aims to identify the prospective areas and marketing activities that provide advantageous competition using resources at minimal cost [3, p. 87]. Two categories interact in the process of evaluating product competitiveness: the category of consumers and the one of producers. The competitiveness of agri-food products is determined by the adequate degree of its use and it also must meet the criteria and indicators of consumer demand because the consumption value of the agricultural production has a special significance as physiological and human needs cannot be delayed (Figure 1). When evaluating the competitiveness of local producers one can note different features and groups of indicators that characterize market share, profits and competitive advantages. For this purpose, there are used different analytical methods, expert methods, integrated indicators of quality and competitiveness.

Scientific Papers Series Management, Economic Engineering in Agriculture and Rural Development Vol. 14, Issue 2, 2014 PRINT ISSN 2284-7995, E-ISSN 2285-3952
91
Fig. 1. Evaluation criteria of the agricultural market competitiveness Source: elaborated by the author
Both for producers and consumers, the competitive products – do not represent an abstract figure but one having a definite quantitative magnitude of production, a high yield or profitability of the finished products, and in the presence of competition and under the control of general quality requirements, they can be directly expressed in units of value.
MATERIALS AND METHODS
Research aspirations, in the field of Moldova’s competitiveness through the prism of efficiency indicators of the foreign agri-food trade, made use of various methods and procedures such as: analysis, induction, deduction and synthesis which allowed to research the essence of the topic and draw conclusions that we believe will present interest for the economic science. The final result consists in drawing conclusions and scientific argumentation of the main aspects related to the prospects and increased efficiency of Moldova’s foreign trade. RESULTS AND DISCUSSIONS
The measurable component of foreign trade efficiency typically lies in the macroeconomic perspective. At this level, one can determine a great number of indicators/indices of country’s economic/financial efficiency based on statistical data on foreign trade, as well as the exports and imports, respectively, in a given period, usually during a year. The
financial situation of a country’s exports is reflected periodically in the components of the external payments balance, and these components include: 1.Trade balance, expressing the import or export of tangible goods; 2.The balance of services expressing the import or export of services. Usually, we calculate distinct groups of statistical indicators of foreign economic transactions in a country involved in the global economic cycle. There are four main groups of indicators that quantify foreign trade efficiency: 1.The indicators expressing the international economic openness or the development level of foreign trade and/or integration in the foreign trade or the indicator of foreign trade intensity; 2.The indicators expressing the dynamics of trade with foreign countries, i.e. the indicators showing the situation in the current year compared to reference year or basic period; 3.The indicators showing the geographical distribution of the foreign trade of a country, or showing the evolution of the partner country regarding the import/export; 4.Indicators expressing a country’s terms of trade. Further, we’ll relate about the categories of quantification indicators/indices of Moldova’s foreign trade. This suggests that this analysis approach corresponds to the macroeconomic evolution compared to foreign trade efficiency:
Producer Concumption value of products Consumer
Labour productivity in the agricultural sector
Offer price (purchase price)
Standards of food consumption
Volume of agricultural production
Quality
The share of food expenditure in the income structure
Life quality
Degree of needs satisfaction by food
products
Optimal income for expenditure
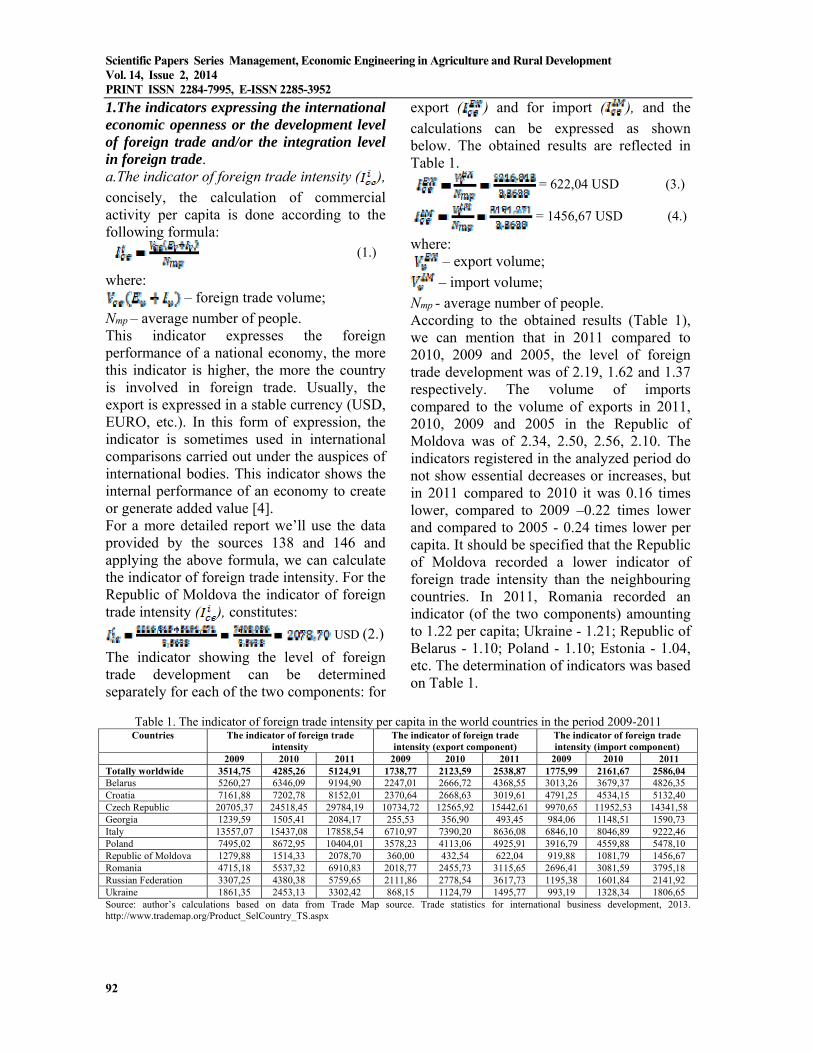
Scientific Papers Series Management, Economic Engineering in Agriculture and Rural Development Vol. 14, Issue 2, 2014 PRINT ISSN 2284-7995, E-ISSN 2285-3952
92
1.The indicators expressing the international economic openness or the development level of foreign trade and/or the integration level in foreign trade. a.The indicator of foreign trade intensity ( ), concisely, the calculation of commercial activity per capita is done according to the following formula:
(1.)
where: – foreign trade volume;
Nmp – average number of people. This indicator expresses the foreign performance of a national economy, the more this indicator is higher, the more the country is involved in foreign trade. Usually, the export is expressed in a stable currency (USD, EURO, etc.). In this form of expression, the indicator is sometimes used in international comparisons carried out under the auspices of international bodies. This indicator shows the internal performance of an economy to create or generate added value [4]. For a more detailed report we’ll use the data provided by the sources 138 and 146 and applying the above formula, we can calculate the indicator of foreign trade intensity. For the Republic of Moldova the indicator of foreign trade intensity ( ), constitutes:
USD (2.)
The indicator showing the level of foreign trade development can be determined separately for each of the two components: for
export ( ) and for import ( ), and the
calculations can be expressed as shown below. The obtained results are reflected in Table 1.
= 622,04 USD (3.)
= 1456,67 USD (4.)
where: – export volume;
– import volume; Nmp - average number of people. According to the obtained results (Table 1), we can mention that in 2011 compared to 2010, 2009 and 2005, the level of foreign trade development was of 2.19, 1.62 and 1.37 respectively. The volume of imports compared to the volume of exports in 2011, 2010, 2009 and 2005 in the Republic of Moldova was of 2.34, 2.50, 2.56, 2.10. The indicators registered in the analyzed period do not show essential decreases or increases, but in 2011 compared to 2010 it was 0.16 times lower, compared to 2009 –0.22 times lower and compared to 2005 - 0.24 times lower per capita. It should be specified that the Republic of Moldova recorded a lower indicator of foreign trade intensity than the neighbouring countries. In 2011, Romania recorded an indicator (of the two components) amounting to 1.22 per capita; Ukraine - 1.21; Republic of Belarus - 1.10; Poland - 1.10; Estonia - 1.04, etc. The determination of indicators was based on Table 1.
Table 1. The indicator of foreign trade intensity per capita in the world countries in the period 2009-2011
Countries The indicator of foreign trade intensity
The indicator of foreign trade intensity (export component)
The indicator of foreign trade intensity (import component)
2009 2010 2011 2009 2010 2011 2009 2010 2011 Totally worldwide 3514,75 4285,26 5124,91 1738,77 2123,59 2538,87 1775,99 2161,67 2586,04 Belarus 5260,27 6346,09 9194,90 2247,01 2666,72 4368,55 3013,26 3679,37 4826,35 Croatia 7161,88 7202,78 8152,01 2370,64 2668,63 3019,61 4791,25 4534,15 5132,40 Czech Republic 20705,37 24518,45 29784,19 10734,72 12565,92 15442,61 9970,65 11952,53 14341,58 Georgia 1239,59 1505,41 2084,17 255,53 356,90 493,45 984,06 1148,51 1590,73 Italy 13557,07 15437,08 17858,54 6710,97 7390,20 8636,08 6846,10 8046,89 9222,46 Poland 7495,02 8672,95 10404,01 3578,23 4113,06 4925,91 3916,79 4559,88 5478,10 Republic of Moldova 1279,88 1514,33 2078,70 360,00 432,54 622,04 919,88 1081,79 1456,67 Romania 4715,18 5537,32 6910,83 2018,77 2455,73 3115,65 2696,41 3081,59 3795,18 Russian Federation 3307,25 4380,38 5759,65 2111,86 2778,54 3617,73 1195,38 1601,84 2141,92 Ukraine 1861,35 2453,13 3302,42 868,15 1124,79 1495,77 993,19 1328,34 1806,65 Source: author’s calculations based on data from Trade Map source. Trade statistics for international business development, 2013. http://www.trademap.org/Product_SelCountry_TS.aspx

Scientific Papers Series Management, Economic Engineering in Agriculture and Rural Development Vol. 14, Issue 2, 2014 PRINT ISSN 2284-7995, E-ISSN 2285-3952
93
b.The share of exports in GDP or economic openness degree (EOD) means the total value of exports in foreign currency (USD, EURO, etc.) and the GDP value in the same unit of measurement. The calculation is as follows:
(5.)
For the Republic of Moldova the degree of economic openness constitutes:
(6.)
This indicator shows the ability of a country to commercialize on foreign markets in conditions of increased global competition. EOD also reveals the relative dependency level of a country on the foreign sale markets, and namely the ability to valorize its own commodity production [4]. c.The share of a country in world exports (Pe):
(7.)
The share of the Republic of Moldova in the world exports constitutes:
(8.)
The values of this indicator are similar to those of the previous one and this could be explained by the fact that it was used the approach of the world economy. It can also be compared to the share of that country in total world population, total world production or world GDP. For comparison it could be noted that in 2011 the share of Ukraine in world exports was of 0.38%, Romania - 0.35%, Turkmenistan - 0.41%, Belarus - 0.23%, Armenia - 0.007, Russian Federation - 2.87, USA - 8.22%, while the Republic of Moldova ranges currently between 0.01 and 0.02% in the total world exports. d.Completion rate of the GDP with the import of goods (PiPIB) is calculated as the percentage ratio of imports to GDP:
(9.)
For the Republic of Moldova the completion rate of GDP with the import of goods will constitute:
(10.)
This indicator shows country’s dependency on the foreign supply markets and/or on economy’s orientation towards import [5]. Also, it shows the GDP share achieved via
imports, which means that payment depends on the currency obtained from the export of goods, export of services, attracted FDI or other similar sources. Strong dependency of a country on the import of goods and raw materials can induce a fragile character of the long-term economic development and growth model. e.The share of a country in the international imports (Pe):
(11.)
The share of the Republic of Moldova in the international imports constitutes:
(12.)
This indicator offers the opportunity to highlight the relative size of national markets for potential market entrants. For example, in 2011, Ukraine’s share in world imports constituted 0.45%, Romania - 0.41%, Turkmenistan - 0.036%, Republic of Belarus - 0.25%, Armenia - 0.022%, Russian Federation - 1.67%, USA - 12.34%, while in the Republic of Moldova, this indicator constituted 0.028% in total world imports. f.Trade balance (SBC).It could be determined in absolute and/or relative sizes and it shows the balance between total export and import of tangible goods. In 2011, for the Republic of Moldova, it constituted: in absolute size:
(13.) in relative size divided to GDP:
(14.) in relative size divided to the total value of foreign trade:
(15.) This indicator allows estimating payment risks in the future transactions with business partners from this country. In mathematical ratio, we are interested in SBC share in total GDP:

Scientific Papers Series Management, Economic Engineering in Agriculture and Rural Development Vol. 14, Issue 2, 2014 PRINT ISSN 2284-7995, E-ISSN 2285-3952
94
(16.) It should be noted that, if the absolute value of the indicator has a value below 2.5% (-2,5%….+2,5%), it is relatively acceptable because in the context of trade balance disequilibrium it will not significantly affect the overall SBC balance. Thus, for the Republic of Moldova this indicator is 18 times higher than the mentioned value. g.Export propensity of a country or rate of coverage of imports by exports. It was determined as the percentage ratio between the export value (Vex) and import value (Vim). Therefore, the rate of coverage of imports by exports in the Republic of Moldova constitutes:
(17.) The previous indicator can be calculated for a given category of goods or for all categories of exported or imported products. It also indicates the degree to which the funds necessary for the import of goods are secured by the export of goods of that country. It obviously depends on the trade balance and theoretically, it is desirable that the value of this indicator would be at least 100%, which corresponds to an equilibrated trade balance. 2.The indicators expressing the dynamics of foreign trade. This indicator shows the evolution in the current year t1 compared to another reference year or basic period t0. It means that one can estimate country’s export or import in two different periods, i.e.:
(18.)
where: V – EX or IM volume, showing the value in currency units (USD, EURO, etc.); q –EX or IM quantity; p – the price of an exported or imported unit of product. Dynamics of foreign trade indicators is estimated at current prices of each year as the volume of the current year value is expressed in the prices of basic period, and therefore, it
is difficult to quantify it. In this context, the value index IV of EX or IM is quantified at current prices based on the following ratio:
(19.)
The above indicator is frequently influenced by changes in the IM or EX prices, therefore, in order to avoid such influences it is usually compared the value index of EX/IM with the value index of GDP, according to the ratio:
(20.)
It should be mentioned that that the sub-unitary value of this indicator shows a sharp increase in imports or exports compared to the GDP. In the Republic of Moldova, in 2011, this indicator did not record growth rates that have exceeded GDP growth, as shown by the following values:
(21.)
3.The indicators showing the geographic distribution of a country’s foreign trade. a.This indicator shows the EX/IM evolution of a country [4]. In the groups of indicators we should include the indicators that reflect the share of primary commodity groups in the total EX/IM of the analyzed country. Based on the classification of goods, it is established the share (Pi) for each category of goods:
(22.)
Using the above ratio, we can determine the share of commodity groups both in export and import. Normally, the shares of the product categories are summed up with the highest values in export in order to observe product diversification level of the analyzed country; also it can be used to determine the dependency of a certain country on certain groups of imported goods. b.The coefficients of territorial concentration are used in the research of geographical distribution of EX/IM of a partner country in the total exports/imports of the analyzed country. For example, for the Republic of Moldova, the top 20 countries that have the largest share in its foreign trade and the main partners from the EU and CIS are shown in Table 2. In 2011, the largest share in total export was recorded by the Russian Federation

Scientific Papers Series Management, Economic Engineering in Agriculture and Rural Development Vol. 14, Issue 2, 2014 PRINT ISSN 2284-7995, E-ISSN 2285-3952
95
and namely 28.2%, Romania - 17%, Italy - 9.8%, Ukraine - 6.9%, Germany - 4.8, UK - 4 6%, etc. Also, in 2011, the largest share in imports was recorded by the Russian Federation which had a share of 15.9%, followed by
Romania with 14.1%, Ukraine - 12.4%, China - 7.7%, Turkey - 7.4%, etc. A more detailed presentation of the top 10 countries that have the largest share in Moldova’s foreign trade is reflected in Table 2.
Table 2. The top of 10 countries which had the largest share in the foreign trade of the Republic of Moldova, in the period 2007-2011
Nr. d/o
Trade partners IMPORT EXPORT 2007 2008 2009 2010 2011 2007 2008 2009 2010 2011 100 100 100 100 100 100 100 100 100 100
Russian Federation 13,5 13,6 11,4 15,2 15,9 17,3 19,7 22,3 26,2 28,2 Romania 12,2 12,1 9,5 10 14,1 15,7 21,1 18,7 16 17 Ukraine 18,6 17,1 14 13,7 12,4 12,5 9 6,3 5,9 6,9 China 5,5 6,6 7,5 8,3 7,7 0,1 0,1 0,1 0,1 0,2 Turkey 4,5 4,7 5,3 5,3 7,4 2,4 2,1 2,5 4,4 3,3 Germany 8,7 7,4 7,7 7,6 7,3 6,4 4 5,9 4,9 4,8 Italy 7,3 6,3 7,1 7 6,7 10,4 10,6 10,8 9,8 9,8 R. Belarus 3,2 4,1 4,2 3,1 3,8 6,1 5,8 6,3 5,2 3,4 Poland 2,4 2,5 2,7 2,7 2,6 3,6 3,5 2,6 3 3,9 Austria 1 1,5 1,7 1,5 1,6 2,3 0,8 0,6 0,7 0,6
Source: author’s calculations based on data from Trade Map source. Trade statistics for international business development, 2013. http://www.trademap.org/Product_SelCountry_TS.aspx If we analyze the structure of countries that have the largest share in exports and imports, from one year to another, we can see that trade share recorded essential changes, but generally the main partners remain the same. Here we should mention that previously remarked indicator could be determined in a more rigorous manner based on Hirschmann coefficient, which is most widely used in international statistics provided by UNCTAD, its value ranging between 0-100. c.Index of trade intensity between two countries (Tij), is used to analyze geographic distribution and diversification of trade in goods. It is used to observe if the value of bilateral trade is higher or lower than the expected value based on the relative importance of the two countries in the foreign trade. This index is obtained in the conflagration of a country’s i share of exports to another country j, marked by (eij) in total exports of the country i and marked by (Eij), i.e. eij /Eij, with the share of total world exports to country j marked (emj) in total world exports marked by (Emt), i.e. emt /Emt [6, p. 453].
(23.)
It should be noted that if a sub-unitary value of this index records a higher intensity of the
foreign bilateral trade between the two countries i and j compared with the average value existing at international level, then this index has a diversifying aspect. d.The number of categories of goods sold abroad is an indicator that highlights the diversification process of foreign economic relations and foreign trade efficiency therefore providing the image on structural diversification of national economy. e.Diversification coefficient or index (Sj). This coefficient expresses the absolute deviation of a country’s export structure from the structure of world exports.
(24.)
where: Sj –structural deviation of a country’s j exports from the structure of world exports; hij – the share of a product or a category of products i in country’s j exports; hmj – the share of a product or a category of products i in the world exports. f. Grubel-Lloyd index (IGLk) is formed on the assumption that the preponderance of industrial trade in a particular branch of activity expresses the competitiveness of that branch in the foreign market. The preponderance of the inter-industry trade highlights the specialization of economy, and namely that the imported products, specific to

Scientific Papers Series Management, Economic Engineering in Agriculture and Rural Development Vol. 14, Issue 2, 2014 PRINT ISSN 2284-7995, E-ISSN 2285-3952
96
a certain branch, are paid with exported products specific to any branch [4]. At the industry level k, out of a number n of industrial branches in a country, this index is expressed as follows:
(25.)
where: IGLk = 0 – inter-industry trade, when the country imports or exports only industrial goods k; IGLk = 1 – intra-industry trade, when the exchange of industrial goods k is perfectly balanced i.e. when exports equal to imports for k. g. Revealed comparative advantage (ACR) or Balassa index [7, p.101], of the merchandise t is calculated according to the following ratio:
(26.)
where: Xkt = merchandise value k, exported by the Republic of Moldova; Xwkt = merchandise value k, exported by all countries on the EU market; Xk = total export volume of the Republic of Moldova on the EU market; Xw = total volume of world exports on the EU market. Two equivalent interpretations of this index will result based on two equivalent calculating methods of this index presented in the previous formula. If the index value is higher than one, there is a relevant revealed comparative advantage of the given sector or product. Certainly, this index caused much criticism and required improvements, but the popularity of this index was not affected too much. Further, we shall analyze the most frequently used indicators regarding foreign trade evolution in different countries: 1.Gross or quantitative barter terms of trade index (IRSB) is determined as the percentage ration between the physical volume index of exports ( ) and imports ( ) [5],
according to the following formula:
(27.)
For the Republic of Moldova, in 2011 compared to 2010, it constituted:
(28.)
The situation is advantageous when IRSB < 100%, because for each unit of imported product, a quantitatively reduced export must be done. When IRSB > 100%, it means that for each unit of imported product, one should pay more than a unit of exported product. 2.Net or value barter terms of trade (IRSN), also named terms of trade index [5], is determined as the percentage ratio between the export unit value index (Ipe) and import unit value index (Ipi).
% (29.)
In other words, the ratio between prices reflects foreign trade evolution at the moment t1 compared to the moment t0. However, this index shows the ratio of the average unit value of exports to the average unit value of imports. It should be noted that if the value is higher than 100%, it means that export prices have increased more than import prices compared to the basic period. Otherwise, it means that import prices have increase compared to the basic period. When IRSN>100% is equivalent to IRSN >1 there is a favorable situation, as it reflects an increase in the purchasing power of the country whose foreign trade is analyzed. And for the situation when IRSN < 100% is equivalent to IRSN<1, it means that there is an increase of import prices compared to the basic period. 3.Foreign trade price scissors (FPCE), is determined only if IRSN<100%, and it will be calculated according to the following formula: FPCE = 100 - IRSN (30.) 4.Gross exchange rate on exports (CRBEX), is determined as the ratio of the internal export price in MDL to the external price obtained at FOB (Free in Board/Franco la bord), expressed in currency:
(31.)
After obtaining the CRBEX value, it is compared with the reference exchange rate existing at the moment in the analyzed country. For the Republic of Moldova 1 Euro = 17,02; 1 USD = 12,78. 5.Net exchange rate on exports (CRNEX), is calculated as the ratio of total internal export

Scientific Papers Series Management, Economic Engineering in Agriculture and Rural Development Vol. 14, Issue 2, 2014 PRINT ISSN 2284-7995, E-ISSN 2285-3952
97
price (FOB), expressed in MDL, decreased by a sequence (Cmp1 + Cmp2). This price is compared to the foreign price expressed in currency, decreased by a sequence (Cmp1 - Cmp2), i.e.:
(32.)
where: Cmp1 – the equivalent value of an imported raw material which is included in the exported merchandise; Cmp2 – the equivalent value of the local raw material which is included in the exported merchandise but which could be exported independently; Economic development level of the country depends more and more on its capacity to absorb quickly and effectively what is new and modern in terms of achievements made by other countries and also on the ability to highlight the effects of globalization and integration results in the world economy. The multidimensional aspect of the task to increase the agricultural export potential of the Republic of Moldova requires undertaking legal efforts at state, regional and local levels related to: 1.general economic problem in terms of country’s high vulnerability to the inconsistency of external economic flows; 2.the lack of production capacity use in agriculture and the need to reorient from the
extensive methods assets’ use to the intensive ones; 3.the lack of investment in general and especially of the synergistic effect of management practices, marketing strategies and technological know-how that complete the insertion of investments in the agricultural sector; 4.the harmonization of legislation through the creation of enabling conditions for export. But, here, the problem is much deeper and it consists in poor law enforcement practices including the delay concerning the implementation of international standards (EU market is extremely sensitive to aspects regarding the quality and safety of imported products); 5.the implementation of specific export stimulating methods such as: insurance funds, export credit funds, credit insurance funds, agricultural risk insurance funds and others; 6.the implementation of modern equipment and technology in order to manage the assets of agricultural farms by practical trainings, shared experiences, etc. In order to elucidate the positive effects and especially the negative ones on the agri-food sector in general and on trade in particular, we’ll present the SWOT analysis. This analysis will allow us to highlight the strengths and weaknesses of Moldova’s agri-food trade, existing at present, but also the opportunities and risks that meanwhile could arise [9, p. 48].
Table 3. SWOT analysis of the agri-food trade in the Republic of Moldova ( elaborated by author) Strengths Weaknesses Agri-food exports to the EU represent 50-55% of total exports, thus confirming the dominance of the agri-food sector in country’s economy; There is a persistent export level of the high added value products: wine and strong drinks, fresh and processed fruits and vegetables. Country’s classification in the top 10 world countries specialized in the export of wine and top 20 world countries specialized in the export of fruits, vegetables and walnuts. The elimination of customs duties; The elimination of export quotas.
Providing poor assortment of agri-food products for export; Failure of national exporters to provide product assortment in the required quantities and terms; Non-compliance with international quality and food safety standards of the agricultural and other products; Limited production volume of the agri-food enterprises provide increased product quality and compliance with international standards. Exported agri-food products are mainly situated in the lowest segment of the target markets. The huge gap between exports and imports of agri-food products denotes that national food industry meets less and less local consumers’ demands.
Opportunities Risks Diversifying the assortment of export-oriented agri-food products; Penetrating new markets; Increasing the volume and value of transactions with high added value products; Accelerating the adjustment of the regulatory framework on foreign trade to international requirements; Simplifying the procedures of commercial transactions;
Legislative instability; Financial deficiency to adjust the sanitary and phytosanitary systems of food security to international standards; Strong competition between the countries producing and exporting similar agri-food products on the market, and suppression of Moldovan exporters; Increasing demand for high quality food products on the local market will substitute a part of local products by the imported ones, thus leading to the bankruptcy of some producers activating in the food industry sector. Significant increase in imports, especially of the animal origin products;

Scientific Papers Series Management, Economic Engineering in Agriculture and Rural Development Vol. 14, Issue 2, 2014 PRINT ISSN 2284-7995, E-ISSN 2285-3952
98
SWOT analysis allows to focus on the key segments and to make assumptions about the segments that offer less detailed information. Due to this analysis, one could opt for penetrating international markets. Therefore, if the agri-food trade records successful penetration on the international markets, there will be an increase in the export volume and value of local agri-food products, enhanced attraction of investment and new technologies in order to increase agricultural productivity and finally, all influencing the increase of farmers’ income and wealth. The strengths and weaknesses are related to the development level of the agri-food sector and its potential, but also to its level of competitiveness. The opportunities and risks come from the market environment and competition (Table 3). CONCLUSIONS Performing the analysis of indicators expressing the development level of foreign trade, we can see that trade development level decreased in 2011 compared to the years 2010, 2009 and 2005 constituting 2.19, 1.62 and 1.37 respectively. In the Republic of Moldova, the volume of imports compared to the volume of exports in 2011, 2010, 2009 and 2005 was 2.34, 2.50, 2.56, 2.10 times higher. The indicators calculated in the analyzed period do not record essential deviations when comparing 2011 to 2010 and were 0.16 times lower; when compared to 2009 they were 0.22 times lower and compared to 2005 they were 0,24 times lower per capita. It should be noted that the Republic of Moldova recorded a lower indicator of trade intensity than the neighbouring countries. In 2011, Romania recorded an indicator (of the two components) in the amount of 1.22 per capita, Ukraine - 1.21, Republic of Belarus - 1.10, Poland - 1.10, Estonia - 1.04, etc. Analyzing the share of exports in GDP or the economic openness degree in the Republic of Moldova, we found that this indicator constitutes 32.91%. The indicator of economic openness degree reveals country’s capacity to commercialize on a foreign market
in terms of increasing global competition. Simultaneously, the indicator of the economic openness degree, reveals the relative level of country’s dependency on the foreign sale markets, and namely the ability to valorize its commodity goods. Making the calculation and analysis of Moldova’s GDP completion rate by the imported goods, we could note that it constituted 77.07%. Its relevant share represents country’s dependency on the foreign supply markets and/or orientation of its economy towards import. Also, it shows GDP share achieved via imports, which means that payment depends on the currency obtained from the export of goods, export of services, attraction of FDI or other similar sources. Strong dependency of a country on the import of goods and raw materials can induce a fragile character of the long-term economic development and growth model. After estimating the share of world imports, we can mention that they provide the opportunity to highlight the relative size of national markets for potential market entrants. For example, in 2011, Ukraine’s share in the world imports was of 0.45%, Romania - 0.41%, Turkmenistan - 0.036%, Belarus - 0.25%, Armenia - 0.022%, Russian Federation - 1.67%, USA - 12.34%, while the share of the Republic of Moldova constituted 0.028% in total world imports. REFERENCES
[1]Chivu, L., 2002, Competitivitatea în agricultură, analize și comparații europene. București: Editura Expert, 272 p. [2]Legea privind securitatea generală a produselor nr. 422 - XVI din 22.12.2006. In: Monitorul Oficial al Republicii Moldova. 2007, nr. 36-38/145. [3]Gavrilescu, D., Giurcă, E., 2000, Economia agroalimentară. București: Expert, 211 p. [4]Ilie G. Indicatori specifici comerțului internațional. http://biblioteca.regielive.ro/download-14727.html [5] Patriche, D., Felea, M., Anghel, L. Comerț și globalizare. http://www.biblioteca-digitala.ase.ro/ biblioteca/ carte2.asp?id=283&idb=9 [6]Burciu A. et. al., 2010, Tranzacții comerciale internaționale. Iași: Polirom, 616 p. [7]Balassa, B., 1965, Trade Liberalisationand ‘Revealed’ Comparative Advantage, The Manchester School, 33, p. 99-123.

Scientific Papers Series Management, Economic Engineering in Agriculture and Rural Development Vol. 14, Issue 2, 2014 PRINT ISSN 2284-7995, E-ISSN 2285-3952
99
RESEARCHES REGARDING WINE AS AGROTOURISTIC RESOURCE CASE STUDY: "BUDUREASCA" Romeo Cătălin CREŢU, Petrică ŞTEFAN, Sorin BIBICIOIU University of Agricultural Sciences and Veterinary Medicine of Bucharest, 59 Mărăşti Blvd, District 1, 011464, Bucharest, Romania, Phone: +4021.318.25.64, Fax: + 40213182567, Email: [email protected], [email protected] Corresponding author: [email protected] Abstract In regions that today form the Romanian space, vines grew wild thousands of years ago. Vitis Silvestris, native Carpathian oak forests, was the basis of the famous Dacian vines. In Prahova, wine road reissuing older segment of the wine road used by the Romans, which traversed Europe. It goes through the famous vineyards of the county and includes stops at the mansion, court and monasteries. The road passes through villages: Filipeştii Fair, Băicoi, Boldeşti, Bucov, pleasant Valley Călugărească, Iordăcheanu, Urlati, Ceptura, Fântânele Tohani, Gura Vad, and to exploit fully, liquid gold, it was introduced tourist circuit wine cellars from Urlaţi and Azuga which are offered for tasting exceptional wines and sparkling wines, with traditional rustic menu. Key words: agro touristic resources, vine, vineyard, tourism potential INTRODUCTION
History Gustave Glotz noted since 1925, the book "Civilisation Egeenne": "Long before it was consecrated by Dyonysos, vines formed joy prehistoric peoples." even the ancient Greek mythological traditions attributed Thracians and Pelasgians introduction of vines in Hellada. "Greek warriors went into Thrace to find wine," reads a line from Homer's Iliad. Later, the Latin poet Ovid describes how the Dacians practiced viticulture and wine freeze concentration, achieving what today is called cognac. Vineyard „Big Hill" called: „Red Wines Patria" vineyard in Curvature Carpathians is the Romanian wine rennet space with climatic conditions very similar to those from the Bordeaux region because it is on the same latitude. Vineyard vines centers of Great Hill are: Boldeşti, Valley Călugărească, Urlati-Ceptura, Tohani-Mizil, Cricov. Birth, growth and education in the seven wine cellar is located in the vineyard „Big Hill " from Păuleşti, Valley Călugărească to Tohani. (Honţuş A., 2005).
MATERIALS AND METHODS
The paper describes Budureasca Vineyard based on the information collected directly
from its book-keeping and also from the company managers. The presentation reflects the authors' opinion regarding the potential of the vineyard as an agrotrouristic resource. RESULTS AND DISCUSSIONS
In areas of „Big Hill" vineyard, one can practice a special type of tourism, including visits to vineyards and orchards, as well as assisting at grape processing into wines (Tindeche C., 2004). Big Hill. The Wine Road, an oasis of calm, sunny hills’ of vineyard rises Hill Great historical source of exceptional wines. In this area blessed - a microclimate similar to the well-known Bordeaux wine-growing areas, our specialists have chosen to put into work mastery grape-growers and wine producers and vineyard already succeeded: in just two years these hills have proven to be worth the reputation. They skilfully exceptional wines that, although young, have won over 10 medals in national and international competitions in the field. Grapes are taken from the 300 hectares of own vineyard, planted with varieties of grape vines selected, which allows very strict control on quality (Bran, 2005).

Scientific Papers Series Management, Economic Engineering in Agriculture and Rural Development Vol. 14, Issue 2, 2014 PRINT ISSN 2284-7995, E-ISSN 2285-3952
100
Fig.1. Prahova County map
Fig. 2. Wine Road
Our wines are targeted to both connoisseurs and collectors, and those who want to drink good wine at a fair price, balanced, both in the domestic and foreign markets. Vineyard Budureasca. With its location on the parallel 45"3' and 38 km to east longitude meridian, it has a temperate continental climate with an average annual temperature of 10.6 degrees C (Creţu R., 2012). Sunshine duration is 15 h 23 ', at the summer solstice and 8 h 49' at the winter solstice. The amount of active ranks vegetation period is 3318. The landscape is generally flat, with an elevation ranging from 100 to 417.3 m long and exhibition southern slopes with inclination of 15 to 25%. Groundwater level is between 10 to 12 m, at the foot of the slope and 50-60 m, on top of it. All this combined with rainfall of 524 mm and leached chernozem soils, pseudorendzine and renzdine explain why Dealu Mare has wines of exceptional quality, get rewarded with dozens of medals in competitions both national and international ones (Antonoaie, 2002).
Wine as lifestyle. Magic potion is more than natural companion to food lunch, dinner and libations of any kind, either diurnal or nocturnal. Wine is a true way of life, a philosophy in itself. Self-esteem and aspiration to better intervene when you want a high quality wine, not a sprit impersonal that can be achieved with any wine, in most cases of questionable quality and origin. One of the secrets of a bon viveur is the quality of ingredients that make up a happy epicurean existence. We of Dealu Mare vineyards Budureasca strongly believe in the triumph of quality over quantity. Competitive advantages “We are a small producer, but with a well diversified portfolio. Our range includes wines for all tastes and this is where our competitive advantage. We put our heart and passion in wine, which leads us to maintain a high quality standard extreme. We have full control of the grapes used in the wine. Our philosophy is to limit and control the amount of quality in order to obtain the guarantee of a superior wine quality. Bottles coming off the production line in glasses bring our customers the best wines in price and quality and experience and passion that brings oenologist our place in the production process are found in the superior quality of each assortment of brand Origini and Budureasca.
Fig.3. Budureasca Wine
Budureasca Cellar Currently underway is the construction of a new winery project with hotel service, in which you will be able to stay and taste those wines. Also in the near future will be a launch of a new brand, namely 101-102. Wines Budureasca addresses both audiences connoisseur, passionate blend of cuisine and fine wines, and those who want to have a

Scientific Papers Series Management, Economic Engineering in Agriculture and Rural Development Vol. 14, Issue 2, 2014 PRINT ISSN 2284-7995, E-ISSN 2285-3952
101
table wine with which to spoil your senses. We recommend joining a wine but foods like beans with sausage, tripe soup or cabbage. The combination of wine and food is purely subjective and you taste. A good fit would be one in which both highlighted the nuances that favor food and wine. It is recommended wine pairing light with light dishes and those with strong foods with the same type of character. Such light wine pairing should be done with food cooked by boiling and those with a high alcohol content and dry to cooked dishes from the grill. Also in a preferred serving wine tasting is a low alcohol and sweet, before those with high alcohol content and therefore a stronger taste. As recommended food to be served with a good wine, the category of the Budureasca, we can mention: steak, Rolls, spaghetti, pizza, hamburgers, chili, pork chops, beef kebab, etc. Budureasca Company-Breif presentation SC Budureasca LLC was bought by Rotherfield Jersey Properties Ltd - United Kingdom, which started business in Romania in 1995. By the time of acquisition, the company has vinified for another company owned by the same group of shareholders who bought the company under the name of Rotherfield Properties Romania SRL. Takeover was retained as employees, with about 20 specialists and the winemaker Stephen Donnelly, who has already shown that it is an inspired winemaker in full international consecration. Initial investment of over 1 million and were added and others (currently reaching over 6 million euro), such as increased storage capacity, allowing storage of larger batches of wine and new bottling lines bottles of 75 cl. and Bag-in-Box system. The tourism potential of the area and the unique beauty of places led naturally to the project of building a resort in the middle of the vineyard. With a suitable design - respect for the history of the area, it will be the destination for those wishing to taste fine wines (Ştefan P., 2012).
Table 1. Undertakings with the unique identifier 12647770 Payer name: BUDUREASCA Address 472 Gura Vadului County PRAHOVA Number in the commercial register
J29 /1123 /2001
Authorization - Zip Code - Phone 0244253299 Fax 0244253321
Society condition: REGISTERED dated December 17, 2001
Remarks concerning the company
-
Date of last statements ( * ) April 18, 2012 Last processing ( ** ) April 23, 2012 Income tax ( date of registration ) 01-01-2008 Microenterprise income tax (date of registration )
NOT
Excise (date of registration ) 01-02-2004 Value added tax (date of registration )
08-02-2000
Social insurance contribution (date of registration )
01-01-2008
The contribution of insurance for work accidents and occupational diseases caused by the employer (date of registration) :
-
Unemployment insurance contribution (date of registration)
01-01-2008
Employer's contribution to the Guarantee Fund for the payment of social debts -date of registration
01-01-2008
Contribution for health insurance (date of registration )
01-01-2008
Contributions Medical leave from natural or legal persons (date of registration )
01-01-2008
Gambling tax (date of registration)
NOT
Tax on income from wages and salaries equivalent (date of registration )
01-01-2008
Tax on oil and natural gas from domestic production (date of registration )
NOT
Mining royalties / revenues from concessions and leases (date of registration )
NOT
Petroleum Royalties (date of registration )
NOT

Scientific Papers Series Management, Economic Engineering in Agriculture and Rural Development Vol. 14, Issue 2, 2014 PRINT ISSN 2284-7995, E-ISSN 2285-3952
102
Table 2. Indicators in the annual financial statements at December 31, 2011 filed with the local offices of the Ministry of Finance cf. Order no. 52/2012
Indicators Balance Sheet LEI Assets - Total 5389499 Current Assets- Total, of which 8654638 Stocks (Materials, production inprogress, semi-products, finishedgoods, goods etc)
4840068
Claims 2977970 Cash and Bank Deposits 836600 Prepaid Expenses 10543
Liabilities - Total 10800837 Deferred Revenue - Provisions - Equity- Total, of which: 3253843 Capital paid 1908000 Patrimony - Public domain - Profit and Loss Net Turnover 8101072 Total Income 8570402 Total Expenses 8493854 Gross profit or Loss -Profit 76548 -Loss 0 -Net profit or loss for thefinancial year -Profit 50415 -Loss 0 Indicators from the information data Average number of employees 33 Type of activity, according toCAEN classification
Manufacture of winefrom grapes
Fig.4. Vineyard Budureasca
Fig.5. Vineyard Budureasca
Fig.6. Honors and Awards
Fig.7. Honors and Awards
CONCLUSIONS Romania was and it still is a country with a strong tradition of vine growing and wine producing the highest class. Romanian wines have competed successfully compete with the famous vineyards of Bordeaux wines, Madeira, Tokai to. Unfortunately after 1989, both quantitatively and qualitatively, the wine sector in Romania has suffered a strong decline (Tindeche C., 2004).
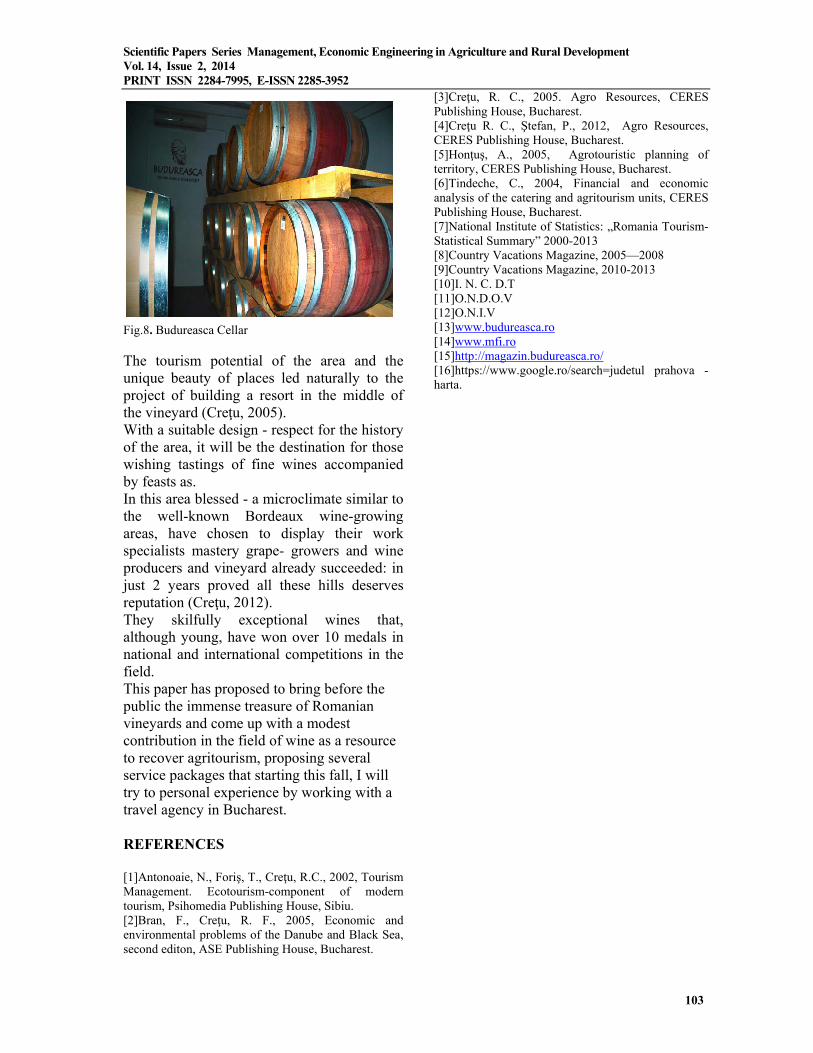
Scientific Papers Series Management, Economic Engineering in Agriculture and Rural Development Vol. 14, Issue 2, 2014 PRINT ISSN 2284-7995, E-ISSN 2285-3952
103
Fig.8. Budureasca Cellar
The tourism potential of the area and the unique beauty of places led naturally to the project of building a resort in the middle of the vineyard (Creţu, 2005). With a suitable design - respect for the history of the area, it will be the destination for those wishing tastings of fine wines accompanied by feasts as. In this area blessed - a microclimate similar to the well-known Bordeaux wine-growing areas, have chosen to display their work specialists mastery grape- growers and wine producers and vineyard already succeeded: in just 2 years proved all these hills deserves reputation (Creţu, 2012). They skilfully exceptional wines that, although young, have won over 10 medals in national and international competitions in the field. This paper has proposed to bring before the public the immense treasure of Romanian vineyards and come up with a modest contribution in the field of wine as a resource to recover agritourism, proposing several service packages that starting this fall, I will try to personal experience by working with a travel agency in Bucharest. REFERENCES [1]Antonoaie, N., Foriş, T., Creţu, R.C., 2002, Tourism Management. Ecotourism-component of modern tourism, Psihomedia Publishing House, Sibiu. [2]Bran, F., Creţu, R. F., 2005, Economic and environmental problems of the Danube and Black Sea, second editon, ASE Publishing House, Bucharest.
[3]Creţu, R. C., 2005. Agro Resources, CERES Publishing House, Bucharest. [4]Creţu R. C., Ştefan, P., 2012, Agro Resources, CERES Publishing House, Bucharest. [5]Honţuş, A., 2005, Agrotouristic planning of territory, CERES Publishing House, Bucharest. [6]Tindeche, C., 2004, Financial and economic analysis of the catering and agritourism units, CERES Publishing House, Bucharest. [7]National Institute of Statistics: „Romania Tourism-Statistical Summary” 2000-2013 [8]Country Vacations Magazine, 2005—2008 [9]Country Vacations Magazine, 2010-2013 [10]I. N. C. D.T [11]O.N.D.O.V [12]O.N.I.V [13]www.budureasca.ro [14]www.mfi.ro [15]http://magazin.budureasca.ro/ [16]https://www.google.ro/search=judetul prahova - harta.

Scientific Papers Series Management, Economic Engineering in Agriculture and Rural Development Vol. 14, Issue 2, 2014 PRINT ISSN 2284-7995, E-ISSN 2285-3952
104

Scientific Papers Series Management, Economic Engineering in Agriculture and Rural Development Vol. 14, Issue 2, 2014 PRINT ISSN 2284-7995, E-ISSN 2285-3952
105
KNOWLEDGE OF POTENTIAL/ACCESSIBILITY OF FINANCIAL CREDITS IN RURAL AREAS IN OLT COUNTY Corina CRUCERU University of Agricultural Sciences and Veterinary Medicine, Bucharest, Romania, Faculty of Management, Economic Engineering in Agriculture and Rural Development, Slatina Branch, 150, Strehareti Street, Zip Code: 0500, Slatina, Olt County, România, Email: [email protected] Corresponding author: [email protected] Abstract The orientation of research activity of present situation regarding the current level of financial credit in rural areas of the Olt county required to carry out investigations on both the borrowers (farms) and the lenders (banks, financial institutions) in the county. As working methods were used questionnaires, questions being designed specifically for borrowers and lenders. The questionnaire contained 32 questions. There have been investigated households from Slatina and Caracal rural areas in Olt county. All elements presented for rural areas in the Olt county revealed the local,s attitude and behavior In taking loans, with insignificant differences between Slatina and Caracal rural areas. Key words: activities, agricultural, county, financial, rural areas INTRODUCTION The orientation of research activity of present situation regarding the current level of financial credit in rural areas of the Olt county, required to carry out investigations on both the borrowers (farms) and the lenders (banks, financial institutions) in the county. The working methods were systems and forms of using questionnaires in financial lending in rural areas in the Olt county. The investigation aimed at knowing the characteristics of financial credit, that is why the questionnaire was focused on two main points: intrinsic knowledge of forms of credit and identifying opportunities of such loans for both borrowers and lenders. The objectives of the study were related to the need for knowledge and quantitative and qualitative assessment of the credited impact on suitable development in the Olt county and on the perception of these services. These objectives have resulted in the following major targets: knowledge of the current situation, the perception of credit, needs assessment of current and potential beneficiaries of credit and recording their expectations, suggestions and ideas in order to improve the future financial credit activity. [2]
MATERIALS AND METHODS The questionnaire has watched priority issues on lending as a tool for rural development in this county. The most significant aspects targeted: - precise understanding of loan applicants, demands and needs: - analyzing of loan application: - loan amounts delimitation; - credit sources and reasons for their choice; - loan security; - existence/use of private savings and bank credit implications in rural households (borrowers); - use of credit for certain areas; - identify the main reasons for the low level of credit application. The number of questions (as order and form for all subjects) was defined according to the objectives previously mentioned and information was obtained using a questionnaire. The questions were structured in two sections, namely for borrower (rural household) and lender (bank), focused on the following aspects: a) for the borrower there were released questionnaires watching potentials/credit

Scientific Papers Series Management, Economic Engineering in Agriculture and Rural Development Vol. 14, Issue 2, 2014 PRINT ISSN 2284-7995, E-ISSN 2285-3952
106
offers for the persons interested in that, in the Olt county, according to the following aspects: - socio-demographic characteristics of population, professional knowledge and territorial spacing households - knowledge of the main activities of the households - offer and interest in financial credit and its accessibility -diversity and level of the agricultural/non-agricultural activities carried out after crediting - membership in the local association of households b)for lenders, the target aspects were forms/characteristics/possibilities of credit supply of banks for rural applicants the main aspects regarding: - how the credit services in rural areas in the Olt county were accepted; - specific problems in knowing and promoting financial education for credit consumers in rural areas in the Olt county; - forms of lending and consulting on loans; - results of lending programs undertaken by banks. The purpose of the research was: a) to find out the main characteristics of the households that accessed the funds; b) to estimate the resulted income obtained in the households after accessing the funds. There have been investigated twelve households from two areas in the Olt county, Slatina and Caracal. Then, there has been investigated the potentiality of credit offer for every of the twelve households. [7] RESULTS AND DISCUSSIONS The information collected allowed knowing the present situation but also the tendency for the credit offer in the area. The questionnaire included 32 questions and the answers collected showed the following aspects: a)socio-demographic characteristics, professional knowledge and territorial spacing households revealed that: - there are more than two persons in each household, most of them having middle school or high school education,
- the active population is of maximum 2 persons in each household, but in many cases one of them is working elsewhere, - most households are at less than 1 km from the center of the village and the distance from the nearest town is of 5-20km, - the villages have means of transport and an asphalt main road. b) the main activities of the households are as follows: - agricultural activities, the agricultural area being of 1000 to 5000 metres, - the main species of domestic animals in the households are cows, sheep and poultry, - the products obtained are used for their own consumption or retailed, - the energy for non-agricultural activities is mechanical and manual, c) the offer and the interest on lending and credit availability for rural households reveal: -sources of money required for an initiative or expansion of non-agricultural activities are their own or obtained from grants and programs, - most householders are willing to take loans as they are familiar with investment credits, - the destination of the loans is acquisition of agricultural equipment, - the products obtained from credit fructification are sold wholesale or retailed, - most respondents disagree with the restrictions in lending imposed by banks. d) professional knowledge, interest and membership in local forms of association of the surveyed households revealed: - in most households there is great interest in practicing agricultural and non-agricultural activities for which the production capacities are existing, - practicing these activities is desired but it is also desired a form of payment, - it is considered only partially that non-agricultural activities can be a way of economic development for rural communities. The results of the study allow to identify the socio-demographic and financial aspects and characteristics for lending in rural areas in the Olt county. These aspects can be outlined as follows:

Scientific Papers Series Management, Economic Engineering in Agriculture and Rural Development Vol. 14, Issue 2, 2014 PRINT ISSN 2284-7995, E-ISSN 2285-3952
107
- expansion of credit levels is desired for all forms of agricultural/non-agricultural activities in rural areas of the county. In an early form, this can be done through objective knowledge of payment capacity of potential borrowers. Financial liquidation is not a predominant element in the system of rural credit anymore but some aspects related to conditions of loan which could not been met by the applicants still persist, such as: lack of guarantees, insufficient income, lack of property title to their land or of other documents, outstanding debts, etc. [5] - in the system of rural credit, banks are very much interested in customer`s solvency/credit worthiness namely certainty of term repayment maturities. That is the reason why banks do not give loans if: the loan conditions are not met, procedure is considered too complicated when grants. [4] - the main problem for the rural household is the possibility of payment of the loan, knowledge of pre-calculated interest when the loan is purchased and especially knowledge of post-calculated interest (which includes borrowing interest according to movements interest for loans). There are situations when the applicant has enough money but he is reluctant to take a loan because of the low level of associative phenomenon in rural areas or the interest rate is considered too high or the applicant does not trust the bank or does not want to have a credit. [6] - projects in various programs revealed that State supports farms foundation, including on UE recommendations and regulations. The respondents are thus aware of lending possibilities with an affordable level of reimbursement. - risk assessment has been an important issue for both borrower and lender, they have different points of view but the same main aim –profitable activities. - credit impact on the area and on the business environment is a positive one. Access to credit is an obvious opportunity in the development of the rural area (development and modernizing of infrastructure through effects of urbanization boosts lending). There is also the possibility of increased comfort in the households, clean
environment, objectives and local traditional attractions, etc. - both borrower and lender are thus interested in increasing production capacity and, as a result, increased use of workforce and increased production for the market. It is planned establishment of farms designed to gradually replace the small households based on self-consumption. This plan is also supported by legislation. [1] - opportunity for production/investment loans is quite obvious, thus diminishing the negative influence of self-consumption production of small households. This can be achieved by applying intensive production system instead of extensive one and by investment allocation which allow better production conditions. CONCLUSIONS All elements presented for the rural areas in the Olt county show the locals attitude and behavior in taking loans, with insignificant differences between areas of Slatina and Caracal. [9] There may refer to the level of professional training of people working outside the households, which is higher for Slatina area; subsidies, as financial sources for non-agricultural activities, are more required in Slatina area than in Caracal area; the type of guarantee required by the bank is a priority criterion in accessing credit by rural households in Caracal area; there is a clear tendency of non-agricultural activities to become a chance for growth and economic development of the households in the area and this is also the direction of orientation in activity for most respondents in Slatina area. [8] All these aspects require knowledge of the behavior on financial market of loan applicants in rural areas. Some obstacles have also been encountered in the practical application of lending actions, obstacles which decreased the growth rate of lending activity in rural areas of Slatina and Caracal. REFERENCES [1]Credit – the necessity and his role in modern economy;

Scientific Papers Series Management, Economic Engineering in Agriculture and Rural Development Vol. 14, Issue 2, 2014 PRINT ISSN 2284-7995, E-ISSN 2285-3952
108
[2]The forms of credit; www.library.ase.ro/ services/library [3]Agricultural Credit Act; 150/2003 [4]Alecu Ioan, 2007, The Management in agriculture, Publishing Ceres, Bucharest, p. 149 [5] Barbulescu Gheorghe, 1993, 120 years of credit for Romanian agriculture, Publishing Cons, Bucharest, [6]Brendea Constantin, 2001, The Risk, the performance of bank credit in Romania [7]Basno Cezar, Coin, Credit, Banks, Didactic and Pedagogic Publishing House, Bucharest [8]Capraru Bogdan, The activity of banks, Beck Publishing House, Bucharest [9]Dedu Vasile, 2001, Banking management, Bucharest, ASE Publishing House, pp. 83

Scientific Papers Series Management, Economic Engineering in Agriculture and Rural Development Vol. 14, Issue 2, 2014 PRINT ISSN 2284-7995, E-ISSN 2285-3952
109
HEAVY METAL POLLUTION OF SOME COMPONENTS OF FLAVOURED WINES, NAMELY THE WINE VARIETIES AND HYDROALCOHOLIC MACERATES FROM PLANTS
Rodica Elena CULEA1, Radiana TAMBA-BEREHOIU1, Stela POPESCU1, Ciprian–Nicolae POPA2
1University of Agricultural Sciences and Veterinary Medicine, 59 Marasti, District 1, 011464, Bucharest, Romania, Phone: +40 21 318 25 64/232, Fax: + 40 21318 28 88, E-mails: [email protected], [email protected], [email protected] 2FARINSAN S.A. Gradistea, Comana, Giurgiu district, E-mail:[email protected] Corresponding author: [email protected] Abstract The aim of this research, in order to meet the quality standards of drinks derived from wines, was the establishment of heavy metals pollution (Pb , Cd and Cu) of some varieties of wine from the 2007 harvest, in the Ostrov vineyard, namely: Fetească Albă , Sauvignon Blanc and Riesling Italian. We also analyzed the heavy metal content of hydroalcoholic macerates of plants in 45 % and 60 % alcohol (2 recipes: recipe I with 16 plants taken from Romanian native flora and recipe II with 6 ingredients containing especially bitter substances), used subsequently to obtain flavoured and vermouth type wines from the studied varieties. Heavy metals were determined by atomic absorption spectrometry (AAS ). The research results show that the Italian Riesling variety had the highest values for heavy metals, ie 51.9 ppb Pb, 1.60 ppb Cd and 12.2 ppb Cu. The less " polluted " variety of wine with Cd (0.10 ppb) and Cu ( 9.4 ppb) was Fetească Albă. Regarding the hydroalcoholic macerates, the one obtained from the plants in recipe I had a higher content of Pb , Cd and Cu (15.6 ppb Pb , 0.78 ppb Cd and 355 ppb Cu) and macerates in 60 % alcohol had higher concentrations of heavy metals as compared with the macerates in 45 % alcohol. In conclusion , although heavy metals were found in both wines and in hydroalcoholic macerates, the pollution with heavy metals did not exceed the limits allowed by law. Key words: Fetească Albă, heavy metal pollution, hydroalcoholic macerates of plants, Riesling Italian, Sauvignon Blanc. INTRODUCTION Although there are certain regulations regarding the toxic potential of chemicals, many studies have revealed the presence of such “pollutants" in food [4]. Regarding the wines and wine-based drinks, we should emphasize that, beyond with physical and chemical parameters, the presence of toxic substances and their quantity determines their quality [5, 6, 7]. Among the toxic compounds mentioned by law, there are heavy metals which are known for the negative physiological effects produced in living organisms, when above certain concentrations (cardio-vascular, pulmonary, nervous system or bone damage, liver damage, cancer etc.) [2, 3]. Our research aimed determining the heavy metals (which are listed by specific health legislation on vine products, namely wine and
plant hydroalcoholic macerates used to obtain flavored drinks), as Pb , Cd and Cu [3]. Lead and cadmium present in wine derive from soil, insecticides, yeast, equipment, storage containers, bottles, corks , herbs (flavored wines). Copper in wine appears particularly because of phytosanitary treatments with pesticides, by using copper sulphate present in equipment and storage containers or in herbs (in flavored wines). There are currently rather few studies on the determination of heavy metals present in the local wines, as well as in vermouth type flavored wines. It is necessary a research on the effect of different macerating recipes on the nutraceutical qualities flavored wines, but also on the possible risks to consumer safety. Approach is warranted to support the processors of wine, given the need of increasing the neccessity of the

Scientific Papers Series Management, Economic Engineering in Agriculture and Rural Development Vol. 14, Issue 2, 2014 PRINT ISSN 2284-7995, E-ISSN 2285-3952
110
competitiveness of Romanian products on the EU market and the increase of their added value. . The originality of this work consists in directing research towards a toxicology study on the quantitative determination of heavy metals in order to establish the quality of treated food drinks (wines, flavored wines). MATERIALS AND METHODS In order to determine the heavy metals Pb, Cd and Cu, we used for analysis three samples wine from the Fetească Albă, Riesling Italian and Sauvignon Blanc. The analyzed samples were wines obtained from the SC Ostrov SA wine center, from wine production of the year 2007. Also, we analyzed four samples of plant hydroalcoholic macerates, used for flavouring the vermouth type wines. The four samples of macerates derived from two plant recipes derived from indigenous flora, which have been macerated in 2 hydroalcoholic solutions of different concentrations (ie 45% to 60%). The mixtures of plants used for the two recipes are as follows: - recipe I containing 16 plants (anise, caraway, thyme, yarrow, coriander, cloves, fennel, hyssop, rosehips, marjoram, mint, chamomile, nutmeg, wormwood, lemon balm, shock); - recipe II containing six herbs (wormwood, anise, rosehips, nutmeg, orange peel, lemon peel) [3]. We prepared macerates by introducing the plant mixtures (own recipes) in alcoholic solutions of 45% vol (IA and IIA), respectively 60% vol (IB and IIB recipes), in alcohol / plant ratio of 10:1. The extraction of biologically active compounds was made by cold extraction, from plants stirred for 14 days at 220 C in the dark [2]. The scheme of obtaining four hydroalcoholic macerates samples is shown in Table 1. After the maceration process followed the separation of plant extract by repeated pressing and filtering operations. The alcoholic extract we obtained was rich in bio-active compounds (dyes, terpene and
derivatives thereof) and it was placed in storage containers. Table 1.The scheme of obtaining alcoholic macerates
No. Sample
Plants mixture (g) Alcohol
(ml)
Recipe I
Recipe II
45 % vol. alc
60 % vol. alc
1. I A 45 - 450 - 2. I B 45 - - 450 3. II A - 45 450 - 4. II B - 45 - 450
The detection and dosage method of heavy metals in wine and hydroalcoholic macerates recommended by the OIV and used by us is based on atomic absorption spectrometry (AAS) in flame (FAAS - for determination of heavy metals in ppm range) and in the oven graphite (GFAAS - for determinations in ppb range) [1, 8, 9]. We used a Zeenat 700 Analytik Jena Germany atomic absorption spectrometer, double moduled, FAAS, GFAAS. The wine samples and macerates were acidified and readings were made at wavelengths characteristic for each analyzed element: 283,3 nm for Pb, 228.8 nm for Cd and 324.8 nm for Cu. The measurements were carried out on liniar field. On the base of obtained values we draw the absorbance curve (correlation coefficient r = 0.997). The software of the equipment enables automatic display of the element concentration. The calculation method is based on the standard addition method [2]. RESULTS AND DISCUSSIONS The values on the content of Pb, Cd and Cu in wine samples and macerates for subsequently preparating flavored wine and vermouth, are presented in Table 2. From the obtained data we can notice that none of the basic wines (Fetească Albă, Italian Riesling and Sauvignon Blanc) exceed the maximum limits provided in the Romanian legislation regarding the content of Pb (up to 200 ppb), Cd (max 10 ppb) and Cu (max 1000 ppb) or in the international law Pb (up to 150 ppb), Cd (max 10 ppb) and Cu (up to 1000 ppb).

Scientific Papers Series Management, Economic Engineering in Agriculture and Rural Development Vol. 14, Issue 2, 2014 PRINT ISSN 2284-7995, E-ISSN 2285-3952
111
Table 2.Concetrations of Pb, Cd and Cu in basic wines and plants alcoholic macerates
Sample Pb (ppb) Cd (ppb) Cu (ppb) Basic wines
Fetească Albă
29.8 0.10 9.4
Riesling Italian
51.9 1.60 12.2
Sauvignon Blanc
8.9 0.17 10.0
Alcoholic plant macerates Recipe I A
(45%) 12.2 0.58 250
Recipe I B (60%)
15.6 0.78 355
Recipe II A (45%)
6.2 0.35 38.7
Recipe II B (60%)
9.6 0.25 63.9
In addition, the obtained data are much lower compared to the maximum, namely the 3 to 16 fold lower in the case of lead, from 6 to 100 times less than in the case of cadmium, up to 80 to 100 times lower in the case of copper. Regarding the lead content, the highest value is recorded for the variety Riesling Italian (51.9 ppb), followed by Fetească Albă, while Sauvignon Blanc has the lowest content of Pb (8.9 ppb). Regarding the content of cadmium, the highest value recorded also the variety Riesling Italian (1.60 ppb), the lowest content of cadmium occurring in Fetească Albă (0.1 ppb). Copper content is seen that the highest value is found also in the Riesling Italian variety (1.60 ppb), while Fetească Albă has the lowest copper content (9.4 ppb). Determination of lead, cadmium and copper in alcoholic macerates from plants indicates that they do not exceeded the maximum limits provided in the Romanian legislation for wine. Making a comparison between the samples obtained from two different recipes plant, it is observed that in the case of recipes IA (45 % alc.) and IB (60 % alc.), derived from the mixture of 16 plants, the content of lead, cadmium and copper is much bigger than in the case of II A macerate recipes (45 % alc.) and II B ( 60 % alc.), which contain citrus peel and a small number of herbs. This result is normal taking into account the fact that the first two macerates contain each 16 plants, compared to 4 plants for the macerates
II A (45 % alc.) and II B (60 % alc.), herbal remedies coming with their intake of heavy metals; it is known that plants have the ability to accumulate heavy metals in tissues (situation due to their possible cultivation in areas with medium and high degree of pollution) . Also, the content of lead, cadmium and copper was higher in the samples from the macerates with 60 % alcohol , demonstrating further that the extraction power production of the hydro-alcoholic solution with a higher alcohol content is bigger than in the case of alcohol 45 %. Thus, we can say that although in the wine samples and the hydroalcoholic macerates prepared by us, the pollution with heavy metals (Pb , Cd and Cu) did not exceed the limits allowed by law, yet they are found in the final product, their source being as well the basic wines and the flavoring plants. Since the oenological products represent a major sector of human consumption, the investigation field in this area is particularly important and practically unlimited. The main research should focus on maintaining the quality of flavored wines from the perspective of the sustainable agriculture concept and on their particular nutraceuticals characteristics, in accordance with the European principles on healthy diet. CONCLUSIONS In the analyzed samples (3 wines basic 4 hydroalcoholic macerates), there were no exceedances of the maximum limits provided in the Romanian legislation for Pb, Cd and Cu; In the three varieties of wines, the basic data on the content of Pb, Cd and Cu, shows that the variety Riesling Italian has the highest values for heavy metals : 51.9 mg / l Pb, 1.60 mg / l Cd and 12.2 mg / l Cu; The less "polluted" wine with cadmium (0.10 mg / l) and copper (9.4 mg / l), is derived from the Fetească Albă variety; The wine with the lowest lead content (8.9 mg /l) is derived from Sauvignon Blanc; The hydroalcoholic macerates IA (45 % alc.) and IB (60 % alc.), derived from recipes from

Scientific Papers Series Management, Economic Engineering in Agriculture and Rural Development Vol. 14, Issue 2, 2014 PRINT ISSN 2284-7995, E-ISSN 2285-3952
112
the 16 plants have a higher content of Pb, Cd and Cu, towards macerates II A (45 % alc.) and II B (60 % alc.) derived from 4 plants and citrus recipes, fact which confirms that medicinal plants can accumulate heavy metals; Heavy metal pollution in the analyzed samples did not exceed the limits allowed by law, which gives the user the opportunity to obtain flavored wines free of toxic potential. ACKNOWLEDGEMENTS
This research work was carried out with the support of the analysis laboratory staff from the wine-growing centre Ostrov and the Biotechnology Faculty from University of Agronomical ScienceS and Veterinary Medicine Bucharest. REFERENCES
[1]Artimon M., Dumitrescu V., Tănase I. G.., Pele, M., Nedelcu R., 2009, The optimization of the methods for Cu, Zn and Pb content determination in Roumanian wines by AAS after dry or microwave mineralization, Romanian Biotechnological Letters, 14 (2), 4319-4325. [2]Barceloux, D. G., 2008, Medical toxicology of natural substances, New Jersey. [3]Culea, R. E., 2009, „Flavouring compounds used for improving the quality of Albă superior wines, in Ostrov Wine Center”, Doctoral Thesis, University of Agricultural Sciences and Veterinary Medicine, Bucharest. [4]Danukar, S.A, Kulkarni, R. A., Rege, N.N., 2000, Pharmacology of medicinal plants and natural Products, Indian Journal of Pharmacology, vol 32, p 81-118. [5]Gomez, M., Cerutti, S., Sombra, L., Silva M., Martinez L.,2007, Determination of heavy metals for the quality control in argentinian herbal medicines by ETAAS and ICP-OES, Food and Chemical Toxicology, Volume 45, Issue 6, June 2007, Pg 1060–1064. [6]Hague, T., Petroczi, A., Andrews, P., Barker, J., Naughton D., 2010, Determination of metal ion content of beverages and estimation of target hazard quotients: a comparative study,Chemistry Central Journal 2010, 4:2. [7]Rui, YK, Yu QQ, Jin YH, Guo J, Luo YB, 2007, Application of ICP-MS to the detection of forty elements in wine, PubMed - indexed for MEDLINE, College of Food Science and Nutritional Engineering, China Agricultural University, Beijing, 27(5):1015-7. [8]Directory of commented Romanian standards / Methods of analysis, 1997, I.R.S. Romanian Institute for Standardization, Bucharest.
[9]Compendium of International methods of wine and must analysis, 2007, Organization Internationale de la vigne et du vin.

Scientific Papers Series Management, Economic Engineering in Agriculture and Rural Development Vol. 14, Issue 2, 2014 PRINT ISSN 2284-7995, E-ISSN 2285-3952
113
STUDY REGARDING CONSUMPTION OF ORGANIC PRODUCTS IN ROMANIA Toma Adrian DINU1, Elena STOIAN1, Marius Mihai MICU1, Reta CONDEI1, Ioana NICULAE1 1 University of Agricultural Sciences and Veterinary Medicine Bucharest, 59 Marasti, District 1, 11464, Bucharest, Romania, Phone/Fax: 00 40 744 6474 10; Corresponding author: [email protected] Abstract The recent statistical data and market studies have shown that the organic products market is on a continuously upward trend in Europe and globally. For Romania, organic agriculture represents a market niche that is still insufficiently exploited, with a definite and real development potential of the agricultural sector. The role of the consumer is decisive for the evolution trends and future prospects of any market. A questionnaire based quantitative research was done to find out the Romanian consumers’ behaviour related to organic products, which allowed the establishment of the weight of organic products consumers within the population interviewed, the extent to which the characteristics of organic products, brands and categories known and consumed are acknowledged. The study also pursued the evaluation of motivational factors which determine the purchase, market appraisal between the alleged favourable attitude towards organic products and product consumption, the evaluation of the way in which the Romanian organic products’ quality is perceived in relation with their price. The study shows an increase in consumer interest for “healthy” products, so that the change according to their behaviour shall generate an increase in the organic products market in Romania. Key words: consumption, organic products, Romania INTRODUCTION The interest for such studies is explained as organic production, in contrast to other segments of the agricultural activity, is growing. The annual growth rate is estimated at 20-30% while the organic products market is constantly expanding [3]. Organic farming is currently practiced in more than 100 countries, over a total estimated area of about 23 million hectares, the largest areas being held by Australia, with 10.5 million hectares and Argentina, with 3.2 million hectares [1]. The European Union organic farming has faced a very rapid growth in the 90s. During this period the share of agricultural land intended for organic farming in the EU countries increased from 0.6% to 3.3% (4.4 million hectares). Seven of the EU-15 were positioned above average in terms of areas intended for organic farming: Austria (8.5% of the usable arable land), Italy (8%), Denmark, Finland and Sweden (6.5%), the United Kingdom of Great Britain (4%) and Germany (3.5%) [1].
In Romania, a first systematic assessment of consumer preferences for organic products aimed for consumers’ availability to purchase organic bread [7]. The study was followed by an assessment of resources, opportunities and constraints of fresh organic vegetables production and sale within the producer-distributor-consumer chain developed in vegetable farms from pre-urban areas (especially individual producers) and fresh vegetable markets from Bucharest [5]. The need to develop this work is related to the elaboration of certain conclusions and recommendations consistent with the reality on the consumption of organic products for various interest groups (local administrative authorities, farmers, distributors, processors, consumers, etc.). The explorations on the consumption of organic products are a relatively new topic and the number of studies is increasingly growing as the market demand increases together with the rapid social and economic transformations in Central and Eastern Europe. Researches were reported on organic products and the consumer; product demand; dietary, perception

Scientific Papers Series Management, Economic Engineering in Agriculture and Rural Development Vol. 14, Issue 2, 2014 PRINT ISSN 2284-7995, E-ISSN 2285-3952
114
and consumer attitudes changes; consumer concern regarding the ethics of production and marketing; the environment; welfare; public health, etc. Within these monitoring systems, testing consumer opinion and reaction on the quality of food is one of the most effective tools. Researches in this field have an interdisciplinary character and involve a wide variety of approaches, and quantitative and qualitative techniques for data collection and analysis. Compared to the aspects above mentioned, the paper aims to analyse the consumption of organic products in Romania, as well as the perception and the attitude of the consumer. MATERIALS AND METHODS The purpose of this marketing research is to identify the consumption of organic products in Romania, specifically consumer attitudes towards organic food. For this purpose quantitative research was used to describe the behaviour of a population related to the studied matter, using quantification methods and statistical analysis in interpreting the results. The quantitative research may also be described as “a findings research, based on representative samples, on a numerical rating of variables and statistical analysis methods, and the findings obtained may be used to recommend a final course of action.” [5]. The survey is the most used method in socio-economic research, being the most popular and sometimes identified with the sociological research itself. As a method of data collection, the survey may provide information on the socio-economic characteristics, concerning attitudes, opinions background, intentions and behaviours, so it may be used in quantitative research as well as in qualitative research. Conducting a survey implies asking questions to a certain number of people, representing either the entire population or a sample drawn from this population [2]. The purpose of the survey of consumer attitudes toward organic products is that of making estimates, based on the results from the processing of obtained data and using the
principles of the probability theory, the appropriate parameters of the total population, elements that are included in the name of the statistic survey. The questionnaire has been chosen as tool for gathering the information necessary for the research, for the purpose of reaching the goals and performing the study, as well as for economic reasons. Using the survey shows that the representativeness of a sample primarily depends on the proper choice of methods and selection types. There are opinion polls, SWOT surveys, surveys on the quality of products and services, surveys on product sales and information, etc. [4]. RESULTS AND DISCUSSIONS The questionnaires on organic products consumption have been applied to a number of 488 respondents. Given their distribution within the country it may be noted that these have been applied over 25 counties and in Bucharest, with the proviso that of the total number of questionnaires applied - 488, 57 respondents did not specify the county of origin.
IF 47 B 203
BT
GR33
SV1 IS
NT 1
VS
GL 2
BC
VR 1
TL 3
CT 2
BR 4
MM
BN
MS2
HG
BV1
AG3 DB
15
PH 22
CV 7
BZ 17
IL 10
CL 24 TR26
OT 3 DJ
MH1
VL GJ1
SM1
BH 2
SJ
AR
TM
CS
CJ1
AB 5
HD
SB1
Fig. 1. Distribution of respondents by counties of Romania Consequently most questionnaires were applied in Bucharest (203) followed by the counties: Ilfov (47), Giurgiu (33) Teleorman (26), Călărași (24), Prahova (22), Buzău (17), Dâmbovița (1), Ialomița (10) and Covasna (7). For other counties where the questionnaires were applied, 17 in number, the respondents per county were between the range of 1-4 questionnaires (Fig. 1).

Scientific Papers Series Management, Economic Engineering in Agriculture and Rural Development Vol. 14, Issue 2, 2014 PRINT ISSN 2284-7995, E-ISSN 2285-3952
115
Analysing the data obtained using questionnaires, by gender of the respondents, it can be observed that these were applied to 62.7% males, and to 37.3% females. Depending on the age of the respondents it was found that most of them were between the ages of 18-25 years (55.8%), followed by those between the ages of 26-35 years (26%), afterwards by the respondents between the ages of 36-45 years, 13.1%, finding at the opposite pole the respondents with ages under 18 (0.4%) and those with ages over 46 years (1.1 %) (Table 1). Table 1. Distribution of respondents by age depending on gender
under 18 years
18-25 years
26-35 Years
36-45 years
46-55 years
56-65 years
Total
Female 0.2% 22.2% 7.3% 4.9% 2.2% 0.4% 37.3%
Male 0.2% 33.6% 18.7% 8.2% 1.8% 0.2% 62.7%
Total 0.4% 55.8% 26.0% 13.1% 4% 0.7% 100.0%
As the educational level of the respondents is concerned it was found that the majority of those with secondary education (high school) with a ratio of 71.4%, followed by those with graduate studies (college / university) with a ratio of 22.8 %, finding at the opposite pole respondents having postgraduate studies, 4.9%, as well as those with primary education (middle school) with 0.8% (Table 2). Table 2. Distribution of respondents by age depending on educational level
Middle school
High School
College / University
Postgraduate studies
Total
under 18 years 0.2% 0.0% 0.0% 0.0% 0.2%
18-25 years 0.4% 45.9% 8.4% 1.1% 55.9%
26-35 years 0.2% 16.6% 8.2% 0.9% 25.9%
36-45 years 0.0% 6.7% 5.1% 1.6% 13.3%
46-55 years 0.0% 2.2% 0.9% 0.9% 4.0%
56-65 years 0.0% 0.0% 0.2% 0.4% 0.7%
Total 0.8% 71.4% 22.8% 4.9% 100.0%
Regarding the occupation of the respondents it was observed that 61.9% are represented by employed / self-employed individuals, followed at a great distance by students, with a ratio of 27.3%. At the opposite pole there were people who have other professions, with a ratio of 9.3%, followed by the unemployed, with 1.6% (Table 3).
Table 3. Distribution of respondents by age depending on occupation
Employee / Self-employed
Student Unemployed Other Total
under 18 years 0.0% 0.0% 0.0% 0.2% 0.2%
18-25 years 28.4% 23.5% 0.9% 3.1% 55.9%
26-35 years 19.3% 2.2% 0.2% 4.2% 25.9%
36-45 years 10.4% 0.9% 0.4% 1.6% 13.3%
46-55 years 3.3% 0.4% 0.0% 0.2% 4.0%
56-65 years 0.4% 0.2% 0.0% 0.0% 0.7%
Total 61.9% 27.3% 1.6% 9.3% 100.0%
In terms of declared income of the respondents it was found that 41.97% of them have an income in the range of LEI 1,000-2,000, followed by those with income below LEI 1,000 in the share of 22.71%, and those with income in the range of LEI 2,001-3,000 in the share of 11.89%, while at the opposite pole there are those with income exceeding LEI 4,000 in the share of 10.78%, as well as those with income in the range of LEI 3,001-4,000 in the share of 6.65% (Table 4). Table 4. Distribution of respondents by age depending on income < LEI
1,000 LEI
1,000-2,000 LEI
2,001-3,000 LEI
3,001-4,000 > LEI 4,000
Total
under 18 years 0.00% 0.23% 0.23% 0.00% 0.23% 0.69%
18-25 years 16.28% 24.31% 7.80% 1.61% 5.28% 55.28%
26-35 years 3.67% 10.55% 5.50% 3.67% 2.52% 25.92%
36-45 years 2.06% 4.36% 3.21% 1.15% 2.52% 13.30%
46-55 years 0.46% 2.52% 0.92% 0.23% 0.00% 4.13%
56-65 years 0.23% 0.00% 0.23% 0.00% 0.23% 0.69%
Total 22.71% 41.97% 11.89% 6.65% 10.78% 100.0%
Analysing the distribution on income categories by age it was observed that in the age range of 18-25 years 24.31% of the respondents have an income between LEI 1,000-2,000 and 16.28% have an income below LEI 1,000. Whereas in the age range of 26-35 years, 10.55% have an income between LEI 1,000-2,000 and only 3.67% have an income below LEI 1,000. A constant income level was recorded for the other age groups subject to the survey. (Table 4). However, considering the origin of those interviewed it was observed that 69.1% come from urban areas, while only 30.8% come from rural areas (Table 5).

Scientific Papers Series Management, Economic Engineering in Agriculture and Rural Development Vol. 14, Issue 2, 2014 PRINT ISSN 2284-7995, E-ISSN 2285-3952
116
Table 5. Distribution of respondents by age depending on origin Rural Urban Total
under 18 years 0.2% 0.0% 0.2%
18-25 years 21.1% 34.8% 55.9%
26-35 years 4.7% 21.3% 25.9%
36-45 years 3.1% 10.2% 13.3%
46-55 years 1.6% 2.4% 4.0%
56-65 years 0.2% 0.4% 0.7%
Total 30.8% 69.1% 100.0%
On the question regarding the information respondents know about the organic products, 45% of those surveyed replied that they have little information about this type of products, 34.4% responding that they have enough information, while only 12% admitted to have insufficient information, 6.2% have a lot of information and 2.4% said they know nothing about this type of products. It is noted that the proportion of those who know nothing or have little information about the organic products reaches nearly 60%, compared to 40% who have such information (Table 6). Table 6. Distribution of respondents’ opinion on the information held about organic products depending on age A lot Many Few
Very few
Nothing Total
under 18 years 0.0% 0.2% 0.0% 00% 0.0% 0.2%
18-25 years 2.4% 19.3% 25.5% 6.9% 1.8% 55.9%
26-35 years 2.2% 7.8% 12.0% 3.5% 0.4% 25.9%
36-45 years 0.4% 5.8% 6.4% 0.7% 0.0% 13.3%
46-55 years 1.1% 0.9% 1.1% 0.9% 0.0% 4.0%
56-65 years 0.0% 0.4% 0.0% 0.0% 0.2% 0.7%
Total 6.2% 34.4% 45.0% 12.0% 2.4% 100.0%
Analysing the distribution of information held by gender of the respondents it is noted that 20.44% of all males have enough information, while of the total number of females only 14% have enough information about this type of products. Consequently, 30.22% of the total males have little information about such products, while of the total number of females; only 14.67% have little information about the organic products (Fig. 2).
Fig. 2. Distribution of respondents’ opinion on the information held about organic products depending on gender
Depending on the availability of information about organic products, it is observed that 56.3% of the total population interviewed believe that this type of information is accessible, while 16.4% believe that this is hardly accessible and similarly 16.2% believe that this information is easily accessible. On the opposite pole there are those who believe that this type of information is very accessible, in a proportion of 9.2%, as well as those who believe that the information is not accessible, in a proportion of 2% (Table 7).
Table 7. Distribution of respondents’ opinion on organic products information accessibility depending on age
Not
accessible Hardly
accessible Accessible
Easily accessible
Very accessible
Total
< 18 years 0.0% 0.0% 0.2% 0.0% 0.0% 0.2%
18-25 years 1.1% 6.0% 32.6% 11.8% 4.4% 55.9%
26-35 years 0.2% 5.3% 15.7% 2.2% 2.4% 25.9%
36-45 years 0.7% 3.8% 6.0% 1.3% 1.6% 13.3%
46-55 years 0.0% 1.1% 1.6% 0.7% 0.7% 4.0%
56-65 years 0.0% 0.2% 0.2% 0.% 0.0% 0.7%
Total 2.0% 16.4% 56.3% 16.2% 9.1% 100.0%
Analysing the distribution of accessibility to information about organic products by age it was noted that in the age group between 18-25 years, 32.6% respondents believe that the information is accessible, while 11.1% believe that the information is easily accessible. Regarding the age group between 26-35 years it was observed that 15.7% believe the information is accessible, while 2.2% say that the information is easily accessible (Table 7). When asked about the consumption of organic products it was noted that 93.3% said they had consumed this range of products, while only

Scientific Papers Series Management, Economic Engineering in Agriculture and Rural Development Vol. 14, Issue 2, 2014 PRINT ISSN 2284-7995, E-ISSN 2285-3952
117
6.6% said they had not consumed such products before (Table 8). Analysing the distribution of organic products consumption by age it was found that in the age group between 18-25 years 51% of the respondents consumed these products, while only 4.4% said that they have not consumed this type products. Simultaneously in the age range between 26-35 years 25.1% of the respondents answered that they consumed this type of products and only 0.9% have so far never consumed such products (Table 8). Table 8. Distribution of respondents’ opinion on the consumption of organic products depending on age Yes No Total
under 18 years 0.2% 0.0% 0.2%
18-25 years 51.0% 4.8% 55.9%
26-35 years 25.1% 0.9% 25.9%
36-45 years 13.1% 0.2% 13.3%
46-55 years 3.5% 0.4% 4.0%
56-65 years 0.4% 0.2% 0.7%
Total 93.3% 6.6% 100.0%
Analysing the distribution of organic products consumption, taking into account the respondents’ gender, it was identified that 35.3% of the females said they had consumed this type products, while only 1.8% said they had not. Among males it was observed that 58.2% consumed organic products and only 4.2% have so far never consumed this type of products (Fig. 3).
Fig. 3. Distribution of respondents’ opinion on the consumption of organic products depending on gender Depending on the frequency of consumption of organic products it is observed that 38.6% of the respondents occasionally consume this type of products, 30.4% consume these products weekly and 19.9% consume these products daily, while on the opposite pole
there are those who consume this product range on a monthly basis, with 6.7%, and those who have never consumed such products, with 4.4% (Table 9). Table 9. Distribution of respondents’ opinion on the frequency of organic products consumption depending on age
Daily Weekly Monthly Occasionally Never Total
under 18 years 0.2% 0.0% 0.0% 0.0% 0.0% 0.2%
18-25 years 10.0% 14.9% 4.0% 23.7% 3.3% 55.9%
26-35 years 4.4% 10.4% 1.8% 8.6% 0.7% 25.9%
36-45 years 4.2% 4.0% 0.7% 4.4% 0.0% 13.3%
46-55 years 0.9% 0.9% 0.2% 1.6% 0.4% 4.0%
56-65 years 0.2% 0.2% 0.0% 0.2% 0.0% 0.7%
Total 19.9% 30.4% 6.7% 38.6% 4.4% 100.0%
Analysing the distribution frequency of organic products consumption by age it was found that in the age range between 18-25 years 23.7% of the respondents are occasional consumers, 14.9% are weekly consumers and 9.8% are daily consumers of organic products. In the age range between 26-35 years 10.4% of the respondents are weekly consumers, 8.6% occasional consumers and 4.4% daily consumers of this type of products (Table 9).
Fig. 4. Distribution of respondents’ opinion on the frequency of organic products consumption depending on their income Analysing the distribution of frequency of organic food products consumption by income levels it was noted that those with incomes ranging between LEI 1,000-2,000 are occasional consumers, in a proportion of 15.37%, while 14.68% are weekly consumers and 8.28% are daily consumers. Those with incomes below LEI 1,000 have responded that they are occasional consumers, in a proportion of 10.78%, while 5.5% are weekly consumers and 3.21% are daily consumers. Nonetheless,

Scientific Papers Series Management, Economic Engineering in Agriculture and Rural Development Vol. 14, Issue 2, 2014 PRINT ISSN 2284-7995, E-ISSN 2285-3952
118
those with incomes ranging between LEI 2,001-3,000 are occasional consumers in a percentage of 7.8%, while 5.5% are weekly consumers and 2.75% consume these products daily (Fig. 4). CONCLUSIONS Analysing the distribution of the sample depending on gender, age and origin we observed that most of the respondents have been males, the majority of respondents were included in the age interval of 18 and 25 years, taking into consideration the origin of the population interviewed it was observed that the majority came from the urban area. Following the questionnaire data interpretation it was observed that the majority of respondents have secondary education level, and as their occupation is concerned it was observed that the majority of the respondents are employed. In terms of income declared by the population interviewed it was found that the majority has an income ranging between LEI 1,000 and LEI 2,000 and their age interval is of 18-25 years. Referring to the information held by the population interviewed about organic products it is underlined that of the total interviewed population most of the respondents have little information about this type of products. Corroborating this aspect with those who say they have insufficient information and with those who know nothing about organic products, we have found that over half of all respondents have limited information about these products. Although it is noted that the majority of respondents have little information about organic products, these consider in fact, that the information about these products could be accessible. Therefore, we find that there is a reluctance or disinterest of the consumers to be more informed about these products. Corroborating the previously mentioned aspects with the respondents’ consumption of organic products we note that approximately all respondents have used such products, even though they have little information about these. Given the distribution of the organic
products consumption by age categories it was observed that most of the people who have consumed such products range between the age interval of 18 and 25 years. Depending on the frequency of organic food consumption, cumulating the answers about the daily and weekly consumption, it was observed that the vast majority of respondents frequently consume this type of products. Given the above it is emphasised that the Romanian market for organic products is an unconsolidated market in terms of customers, although there is a high frequency of consumption, customers do not have much awareness about these products, hence about the advantages they may benefit from the use of such products; also they consider that the information about these products is accessible, making a clear point for the need to continue studying the buying behaviour of organic products and of the factors that determine purchase of these products. REFERENCES [1]Bucată, I.V., Diaconescu Şt., Gieraths, J, Weiller, W, 2003, Agricultura ecologică, Alma Mater Press, Bucharest [2]Constantin, M.V., 2010, Eficienţa acţiunilor antropice asupra dezvoltării rurale durabile în centrul şi nord-vestul Transilvaniei, Doctoral Thesis, UASVM Cluj-Napoca [3]Florian Violeta, Rusu Marioara, Stefanescu Sorin Liviu,, Dumitrascu Monica, Panait Radu, 2005, Comportamentul consumatorului de produse ecologice: determinanți socio-economici, Arvin Press, Bucharest. [4]Micu, M.M., 2012, Researches on the Association of Agricultural Producers with a view to Increase Production and Rentability. Case study Arges County, Doctoral Thesis, Unpublished [5]Nedița Gabriela, Niţu, A., Martinoff Ioana, Stoian Mirela, 2003, Studiu de piaţă privind cererea şi oferta de produse agroalimentare ecologice româneşti, Fermierul Magazine no. 122, February, 11-13 [6]Plăiaş, I., 2005, Comportamentul consumatorului, Risoprint Press, Cluj-Napoca [7]Ştefănescu, S.,L., Unteşu Fineta, 2004, Resurse, oportunităţi şi constrângeri în producerea şi desfacerea legumelor ecologice proaspete pe piața municipală, Estfalia Press, Bucharest

Scientific Papers Series Management, Economic Engineering in Agriculture and Rural Development Vol. 14, Issue 2, 2014 PRINT ISSN 2284-7995, E-ISSN 2285-3952
119
ANALYSIS OF TOP DESTINATIONS IN TOURISM, ACCORDING TO VOLUME OF RECEIPTS DURING 2001-2011 Alexandru FÎNTÎNERU1, Gina FÎNTÎNERU1, Dragoș-Ion SMEDESCU1 1University of Agricultural Sciences and Veterinary Medicine Bucharest, 59 Marasti, District 1, 11464, Bucharest, Romania, Phone/Fax: 00 40 767 3316 93; Email: [email protected], [email protected], [email protected] Corresponding author: [email protected] Abstract More significantly, tourism has emerged as a distinct and definite branch in national economies of many countries, being a pleasant way to pass the free time, has engaged in providing services in various fields adjacent to. Characterized by mobility and adapt to the requirements of demand and supply, it is from this point of view the most dynamic sector and, all at once, the most important generator of jobs, acting as a global economic system more dynamic, involving and stimulating the production of other areas. The paper aimed is to analyze the top ten destination in tourism, by volume of receipts, during 2001-2011, plus Hungary, Bulgaria and Romania, according to Data World Bank, from 172 countries, when global tourism, has evidenced by the following amounts: 1.256 billion $ in tourism receipts in 2011 to 563 billion $ in 2001 and about 1 billion tourist arrivals recorded at end of 2011, compared to 680 million tourist arrivals in 2001. Key words: global economic, receipts, tourism, tourist arrivals INTRODUCTION One of the most complex in the business activities of our days is considered tourism activity, an activity that manages not only to collect, but also to bring together common elements tourism phenomenon in all economic sectors, using, however, gears and some other systems outside the economic and the political, banking or law [1]. That's also contrary to many opinions, the tourist infrastructure is not the only important factor that underpins tourism phenomenon, adding them into a whole amalgam of elements, of which, experts say, we noticed at least one, that carrier decisive, namely, culture, whose fingerprint is found everywhere, in all its forms and aspects. Characterized by mobility and adapt to the requirements of demand and supply, it is from this point of view the most dynamic sector and, all at once, the most important generator of jobs, acting as a global economic system more dynamic, involving and stimulating the production of other areas. Compared to the national economy, acting as a stimulating element not only for the economic, but also social, global, through the
deployment of its assuming a more specific demand of goods and services that create growth in those spheres of production, the their background and character practically inexhaustible resource that holds long-term tourism is one of the sectors with real growth prospects [2]. Important source of foreign exchange earnings growth of a state, tourism can contribute to the balance of external payments may constitute a promotion benefiting from aggressive foreign market as the exploitation and utilization of tourism resources complex. MATERIALS AND METHODS In order to characterize the evolution of top destination in tourism according to volume of receipts we have used the next indicators: international tourist receipts, international tourist arrivals for the period 2001-2012. As methods we have used the statistical indicators used to determine the significance of average: Average achieved during the review (x)=(x)/n: where in X=productions of the years and n=number of years. The standard deviation (x), which gives us the

Scientific Papers Series Management, Economic Engineering in Agriculture and Rural Development Vol. 14, Issue 2, 2014 PRINT ISSN 2284-7995, E-ISSN 2285-3952
120
degree of dispersion around the average, annual growth rate:
11 1p1/p0Π2011r2001 r2001-2011 average annual growth rate, ∏p1/po = growth indicators linked. The data have been provided by World Tourism Organization (UNWTO) and Data World Bank. RESULTS AND DISCUSSIONS Accordin to the informations provided by World Tourism Organization, turismul ocupă primul loc în comerțul mondial şi în asigurarea veniturilor din export. Worldwide, the average revenue from tourism represents 1.80% of global GDP, annual growth for the period 2001-2011 is positive but very low, only 0.24%. Also GDP contribution that tourism has differed between states, depending on the level of development and economic structure of the countries. The main countries analyzed are part of the top 10 countries that have experienced the highest grossing tour in the 2001-2011 periods to which we added Romania, Hungary and Bulgaria, considered as the main countries that we are in competition. In most countries around the world, tourism is in an uptrend. In the last decade, according to data provided by the World Bank, global tourism, evidenced by the following amounts: 1.256 billion USD $ in tourism receipts in 2011 to 563 billion $ in 2001 and about 1 billion tourist arrivals recorded at end of 2011, compared to 680 million tourist arrivals in 2001. The start of our analysis is given by the United States, the country which is on the first position on receipts from tourism receipts contribution to achieving GDP instead represent only 1.06% of. Remains the leader of the largest countries in tourism receipts recorded average for the period 2001-2011 was 137 billion $ representing 15% of those registered global 900 billion $ with an annual growth rate of 5.37%; Spain still holds second place with 54 billion dollars, registering an annual growth rate of 7.16%, which represents 6% of the global media, The third position, a small difference in Spain is occupied by France with averaged just under
54 billion $, registering a growth rate of 5.44%, which represents around 6% of the total, Germany ranks number 4 with an average of 45 billion $, representing 4.61% of the total, with a rate annual increase of 8.25%. With an average of nearly 39 billion $ representing 4.32% of the global total, Italy ranks number 5, with a significant increase compared with 2010, with a growth rate of 5.36% year. If in 2002, the top five destinations were represented by the USA, Spain, France, Italy and China, countries in terms of tourism receipts, accounted 38% of global revenues for the period 2001-2011, we find the same order, almost unchanged: USA, Spain, France, Germany and Italy, accounting, however, a smaller percentage, 36.2% of those registered worldwide. Recording almost the same values with Italy, England ranks 6, with an average receipts for the period 2001 to 2011, slightly below the value of 39 billion dollars (38.618) its growth rate was 5.80%; given on the seventh position, we meet China, with an average volume of tourism receipts 35 billion $, which is 3.91% of the world average, but with a very strong annual growth of 10.86%; position number 8 is occupied by Australia, with an average revenue of 23 billion $, which represents 2.55% of the average in the last 11 years, with a rate of 10.31% year; Turkey ranks number nine, with an average of 19 billion $ a year rate of growth of 10.79%, represents 2.15% of the world average, the top 10 is closed from Austria with an average revenue of 18.5 billion $ and a growth rate of 6.90% for the year, representing 2% of global average for the period 2001-2011. Following three countries included in the top, are part of another category of placing them in the world rankings, one of them being Romania and the other two, Hungary and Bulgaria, neighboring countries with which we are constantly competing to win tourists and thus increase revenue. The best placed of the three is Hungary, which ranks number 38, with an average revenue of 5.3 billion $ represents only 0.6% of the world average, its rate of growth year, being 5.15%. Position 53 is situated Bulgaria, with an approximate average of just 3.3 billion $, which is 0.36%

Scientific Papers Series Management, Economic Engineering in Agriculture and Rural Development Vol. 14, Issue 2, 2014 PRINT ISSN 2284-7995, E-ISSN 2285-3952
121
of the world average, but with above average annual growth rate of 13.69%. Romania, unfortunately, ranks last in the "top" of neighboring countries and ranked 72 in the world rankings, with an average annual volume of tourism receipts of approximately 1.4 billion $, representing the lowest score of the average worldwide, only 0.15% [3]. A very pleasing is the growth rate year, Romania topping from this point of view, the first position in the top 13 countries listed, with a rate of 17.40%. The economic crisis
seems to have its say in the case of Romania, a country which, in 2007, upon accession, together with Bulgaria, the European Union recorded a total value of tourism receipts of 2.07 billion $ in 2010, registered a negative growth, the total value of only 1.6 billion $, down 500 million $ compared to 2007. In 2011 the total revenue recorded in Romanian tourism were 2.1 billion $, in 2001 compared with revenues of $ 419 million were up 1.6 billion $ (Table 1.).
Table 1. Top countries by average annual receipts from tourism, for the period 2001-2011
Place in the World
Country Years Average Annual
growth rate 2001 ...2007… 2010 2011 (2001-2011)
UM mil $ mil $ mil $ mil $ mil $ % %
World 563231 1042123 1120079 1256155 900416 100 8.35
1 SUA 109103 148448 165149 185886 137227 15.24 5.47
2 Spain 33829 65020 59042 67538 54140 6.01 7.16
3 France 38385 63701 56282 65172 54086 6.01 5.44
4 Germany 24175 49332 49126 53411 41467 4.61 8.25
5 Italy 26916 46144 40058 45368 38895 4.32 5.36
6 England 26137 48193 40746 45940 38618 4.29 5.8
7 China 19006 41126 50154 53313 35230 3.91 10.86
8 Australia 12804 25624 32336 34168 22957 2.55 10.31
9 Turcia 10067 20719 24784 28059 19318 2.15 10.79
10 Austria 11511 21088 20931 22432 18508 2.06 6.9
38 Hungary 4191 5628 6338 6928 5327 0.59 5.15
53 Bulgaria 1262 4181 4035 4554 3252 0.36 13.69
72 Romania 419 2073 1631 2084 1368 0.15 17.4 Source: Processed after: ***International tourism, receipts, current US $, 2013, http://search.worldbank.org/data?qterm=tourism&language=EN [5] For the year 2012, according to UNWTO, international tourist arrivals (ITA) grew by 4% despite continued volatility around the world, reaching 1.035 million tourists, up from 995 million in 2011, celebrating the historic 1 billion milestones, UNWTO have lunched the campaign One Billion Tourists: One billion Opportunities. Europe which accounts more than half from world’s total, increase with 18 million more arrivals (3%), the fastest growth across all regions, have been Asia and Pacific with 7% increase or 16 million more international arrivals.
International tourism receipts (ITR) also grew in 2012 with 4% and confirms the strong correlation between the two key indicators used in monitoring international tourism trends. Same, by UNWTO regions, Asia and the Pacific grew by 6% but also Americas and Africa confirmed growth by 6%, while in Europe, receipts grew with only 2% [4]. In 2012, most tourists travel by air (52%) while 48% choose to travel by surface (40% - Road, 6% - Water, 2% - Rail) and the by purpose most tourists travel for leisure, recreation and holidays (52% - 536 million),

Scientific Papers Series Management, Economic Engineering in Agriculture and Rural Development Vol. 14, Issue 2, 2014 PRINT ISSN 2284-7995, E-ISSN 2285-3952
122
14% reported travelling for business and professional purposes and 27% travelled for other purposes (visiting friend or relatives,
religious reasons, health treatment, etc.) rest of 7% haven’t been specified (Fig.1).
Fig.1. International tourist’s arrivals and receipts by UNWTO regions, 2013 CONCLUSIONS The evolution of international tourism, which was analyzed in the paper are the following specific aspects of the application of services: development, continuous upward trend, which, after all prerequisites will be lengthy, although in perspective, the growth rates will probably be slower than the last decade; continuous diversification of demand as a result of the tourist development and change age groups, on the one hand and the transformation of tourism into a full-table, on the other hand; recorded considerable differences from one country to another and from one geographical area to another, the pace of tourism development. Regarding the share of different geographic regions, international tourist traffic, there is a high concentration both in terms of receiving countries, and especially the countries issuing the Europe first.
REFERENCES [1]Fîntîneru, Gina, 2005, Agri-tourism economy, Ceres Publishing, Bucharest, p.64 [2]Minciu, Rodica, 2004, Tourism economy, Uranus Publishing, Bucharest, p.26 [3]Smedescu, D., 2013, Researches on promoting and capitalizing agritourism in South=West Oltenia Region, Phd thesis UASVM Bucharest, p. 51 [4]World Tourism Organization UNWTO, 2013 Edition, Tourism Highlights, pp. 3-5 [5]International tourism receipts, US $, 2013, http://search.worldbank.org/data?qterm=tourism&language=EN

Scientific Papers Series Management, Economic Engineering in Agriculture and Rural Development Vol. 14, Issue 2, 2014 PRINT ISSN 2284-7995, E-ISSN 2285-3952
123
THE MACROECONOMIC IMPACT OF ROMANIAN TOURISM Alexandru FÎNTÎNERU1, Gina FÎNTÎNERU1, Dragoș-Ion SMEDESCU1 1University of Agricultural Sciences and Veterinary Medicine, Bucharest, 59 Mărăsti, District 1, 011464, Bucharest, Romania, Phone: +40 767331693, Email: [email protected], [email protected], [email protected] Corresponding author: [email protected] Abstract Tourism is an important driver of global economic system, playing a leading role both in the economic life and social action contributing to the tourism potential of each individual country and economic growth, improving living conditions. Romania has a huge tourism potential represented by the natural environment and natural resources, human resources, customs and traditions, a potential which unfortunately is not used to the wholes value. The paper aimed to analyze the evolution of Romanian tourism receipts in GDP, by share, positioning on the place 151 and by evolution of tourism receipts per capita in Romania compared to World average, positioning Romania on the place 103 out from 172 countries during the time 2003-2011, according to the information’s provided by Data World Bank . Key words: economy, GDP, Romania, tourism receipts INTRODUCTION Certificate somewhere at the beginning of the twelfth century as spontaneous form of expression, tourism, such activity to pay money to go from one place to another, and see various objectives represents, at present, an act of a civilized life. Tourism is an important driver of global economic system, playing a leading role both in the economic life and social action contributing to the tourism potential of each individual country and economic growth, improving living conditions. Over time, Dracula was the most important tourism product exported, together with the Romanian seaside and the monasteries in northern Moldavia. Today, Romania is trying to make itself known by discovering the fascinating wisdom Romanian village, the past and present [1]. For Romania tourism means business sector - from all sectors - endowed with the most valuable development potential, which is the richest resource of the country in its portfolio being natural and cultural heritage of great diversity and a smooth distribution in the territory, allowing multiplication of forms of tourism that can be practiced [2]. This potential that has not received proper operation remains and can still be an attractive
source for both Romanian investor and for the stranger, and for the great group of tourists are constantly in search of new sights [3]. Romanian tourism operates within certain limits somewhat normal landing only a few segments of its established drivers of the Romanian tourism industry, these segments are: agritourism, tourism, spa and mountain, tourism and event circuit. Significant tourism potential in terms of the natural, cultural and historical, is owned by the historical regions with significant differences, however, between regions capitalize on this potential differences determined by historical conditions of development (characteristic of each), but and implementation of infrastructure projects overall national who "failed" certain areas of attractiveness, reducing their availability and preventing their development. It is known that an area difficult to access - from all points of view - even if it has a real potential, it will have a certain development and will be difficult or impossible to enter into a tourism circuit [4]. MATERIALS AND METHODS The comparative analysis aimed to describe as played by the characteristics differences registered in tourism, in the dynamic period

Scientific Papers Series Management, Economic Engineering in Agriculture and Rural Development Vol. 14, Issue 2, 2014 PRINT ISSN 2284-7995, E-ISSN 2285-3952
124
2003-2011. As methods there were used the statistical indicators specific to determine the significance of average: average achieved during the review (x)=(x)/n: where in X=productions of the years and n=number of years. The standard deviation (x), which gives us the degree of dispersion around the average, annual growth rate:
09 1p1/p0Π2011r2003
r2003-2011 average annual growth rate, ∏p1/po = growth indicators linked. The data used in this analyse have been provided by Data World Bank. RESULTS AND DISCUSSIONS Depending on the level of development and economic structure of the country concerned: high values for small countries dependent tourism over 50% example Maldives, Macao and with modest values in countries where tourism is not developed properly, here we mention Romania, with direct contribution shared in GDP under 2% and total contribution in tourism shared in GDP around 5%, information’s according to World Travel and Tourism Council [5]. As we mentioned above, we have the structure of countries according to their share in national GDP from tourism revenues on average over the period 2003-2011: the first group of countries with a share between 50 and 70% of GDP and the Maldives, Macao and Palau, occupying a percentage of 1.7% of the total (3 from 176 countries) between 20-40% in the number of 9 countries representing 5.1% of the total, 15-20% in the number of 10
countries by 5.7%, 10-15% with 5 countries and 2.8 % of total, 5-10% in the number of 28 countries, representing 15.9% of the total, this recall and Bulgaria and Hungary 3-5% a number of 36 countries accounted for 20.5% of the total, this fits Spain and Turkey, 2-3% in the number of 24 to 13.6%, this being found France and Italy, 1-2% with a total of 36 countries and a share of 20.5% here meet the United States, Germany, England, China and Romania, less than 1% of a total of 25 countries is about 14.2% of the 176 country. The share of tourism receipts to GDP varies from country to country, depending on the level of development, so, in 2003, the Romanian tourism receipts were accounted for 0.88% of GDP, well below the value recorded worldwide 1.72%. The best years were registered in Romania in 2007, 2008 when tourism receipts accounted for 1.22% and 1.28% of GDP, the global rise in tourism receipts also recorded peak of 1.87% and 1.88% of GDP worldwide. The evolution of tourism receipts in GDP in Romania during 2003-2011 averaged 1.11% of GDP, below the average for the same period world where the share of tourism receipts accounted for 1.81% of global GDP, Romania ranked on position 151 out of a total of 172 countries surveyed, the rate of growth being one happy year of 56%, supporting the idea that Romanian tourism is on the right track. Another contribution of tourism that is generating jobs, build such a rate as low unemployment, the labor absorption (Table 1, Table 2).
Table 1. The evolution of tourism receipts in GDP, during 2003-2011 No. crt.
Country Specification UM 2003 ...2007... 2010 2011 Average
2003-2011 Place in
the World 1
World Share in GDP % 1.72 1.87 1.77 1.79 1.81 Out of 172
countries surveyed 2
Annual growth rate of share in GDP
% 1.02 1.00 1.01 0.50
3
Romania Share in GDP % 0.88 1.22 0.99 1.10 1.11 151
4 Annual growth rate
of share in GDP % 0.90 0.97 1.11 2.82 56
Source: Processed after: ***International tourism, current US $, 2013, http://search.worldbank.org/data?qterm=tourism&language=EN.

Scientific Papers Series Management, Economic Engineering in Agriculture and Rural Development Vol. 14, Issue 2, 2014 PRINT ISSN 2284-7995, E-ISSN 2285-3952
125
Table 2. Structure of countries according to their share in national GDP from tourism receipts averaged over the period 2003-2011 No. crt.
Main countries Share in % from GDP
Countries No. %
1 Maldives,Macao SAR,Palau 50 la 70 3 1.7 2 Seychelles,Barbados,Bahamas,Cape Verde 20 la 40 9 5.13 Samoa,Jamaica, Croatia, Cyprus 15 la 20 10 5.74 Jordan,Albania, Republica Dominicana,Cambodjia, Granada 10 la 15 5 2.8
5 Bulgaria, Estonia, Muntenegru, Tunisia,Austria, Grecia, Slovenia, Portugalia, Ungaria,Singapore etc
5 la 10 28 15.9
6 Spania,Georgia, Moldova, Armenia, Irlanda, Uruguai, Turcia,Ucraina, Elveția, Australia, Letonia,etc
3 la 5 36 20.5
7 Belgia, Danemarca, Polonia, Franța,Slovacia, Italia, Macedonia, Israel, Olanda, etc
2 la 3 24 13.6
8 Statele Unite, Germania, Anglia, Finlanda, Peru, Emiratele Arabe, Serbia, Mexic, Canada, Norvegia, China, Rusia, România etc
1 la 2 36 20.5
9 Brazi, India, Japonia, Venezuela, Algeria, Pakistan, Kuveit, Guineia, Mauritania, etc
under 1 25 14.2
10 Total 176 100.0 11 World average by sharing in GDP of tourism receipts 1.81 X X
Source: Processed after: ***International tourism, current US $, 2013, http://search.worldbank.org/data?qterm=tourism&language=EN. Analyzing revenue from tourism per capita, we see that in the case of Romania, in 2003, it was 4 times lower than cashing registered worldwide. Until 2008, the collections per capita in Romania, has been positive at the end of 2008, compared to 2003, registering an increase of almost 100 USD $, whereas worldwide growth was only 70 $, but the collection reached the end of 2008 to 171 $. Then came the global economic crisis has caused a major decline in revenue, so that at
the end of 2009, revenue from tourism per capita in Romania was only 79 $, whereas global of 151 $ and the end of 2011, Romania recorded value of 97 $ / per capita, average receipts per capita tourism registered during 2003-2011, being 73 $, with an annual growth rate of 18%, the average global being 146 $ and the annual growth rate of 7.35 %, Romania finishing in 103rd place among 172 countries composed of (Table 3).
Table 3. The evolution of tourism receipts per capita in Romania, during 2003-2011
No. crt.
Country Specification UM 2003 ...2007... 2010 2011 Average
2003-2011
Place in the World
1 World
Receipts per capita
USD /cap
102 157 163 180 146 Out of 172 countries surveyed 2
Revenue growth rate
% 1.14 1.07 1.11 7.35
3 Romania
Receipts per capita
USD /cap
24 96 76 97 73 103
4 Revenue
growth rate % 1.24 0.97 1.28 19.11 18
Source: Processed after: ***International tourism, current US $, 2013, http://search.worldbank.org/data?qterm=tourism&language=EN. CONCLUSIONS Tourism worldwide is found in an area continued expanding job creator for countries
that enjoy attention and a good development, and an important factor of economic growth, an increase in GDP implications those countries.

Scientific Papers Series Management, Economic Engineering in Agriculture and Rural Development Vol. 14, Issue 2, 2014 PRINT ISSN 2284-7995, E-ISSN 2285-3952
126
For Romania, considered as a country with great tourism potential reception conclusions drawn from the analysis of the evolution of tourism in the world have a special significance, serving the tourism industry development orientation based on a policy adequate, relevant and continuous investment diversification and specialization of services offered to tourist’s potential. To enjoy international competitiveness, Romanian tourism should increase both quantitatively and qualitatively, the number of care facilities, catering units but also the places of leisure. By achieving these goals, we have a recovery to a higher grade of tourism resources, leading to increasing number of tourists, length of time of residence and employment, and thus to increase profits and Romania's competitiveness in the international market tourism. REFERENCES [1]Albuț, A., 2012, Controversies in establishing a tourism development strategy, Romanian rural tourism in the context of sustainable development – Volume I – Issue 3 (July 2012), Iaşi, p. 111-122 [2]Minciu, Rodica, 2000, Tourism economy, Uranus Publishing, Bucharest, p.24 [3]Smedescu, D., 2013, Researches on promoting and capitalizing agritourism in South=West Oltenia Region, Phd thesis UASVM Bucharest, p. 70 [4]Snak, O., 1976, Economy and tourism organization, Sport – Tourism Publishing, p.77 [5]World Travel and Tourism Council,2013, Travel and Tourism Economic Impact 2013 Romania, p. 7.

Scientific Papers Series Management, Economic Engineering in Agriculture and Rural Development Vol. 14, Issue 2, 2014 PRINT ISSN 2284-7995, E-ISSN 2285-3952
127
GENDER MAIN STREAMING IN WATER SUPPLY AND SANITATION PROJECTS Simona FRONE1, Dumitru Florin FRONE2 1Institute of National Economy, at the Romanian Academy, 13 Calea 13 Septembrie, District 5, 050711, Bucharest, Romania, Phone: +4021/318.24.67, Fax: +4021/318.24.71, Email: [email protected] 2University of Agricultural Sciences and Veterinary Medicine, Bucharest, 59 Marasti, District 1, 011464, Bucharest, Romania, Phone: +40 21 318 25 64/232, Fax: + 40 21 318 28 88, E-mail: [email protected] Corresponding author: [email protected] Abstract As we have stated in the previous year conference paper, the human right to water and sanitation entitles everyone to water and sanitation services which are available, accessible, affordable, acceptable and safe. Development programs for water and sanitation services, as many other socio-economic development programs have often been assumed to be neutral in terms of gender. However, sometimes there can be failures in the implementation and harnessing of such projects because of errors arising from lack of adequate integration of gender equality. In this paper are highlighted some aspects and issues of gender mainstreaming in water supply and sanitation development projects, including conclusions from a case study conducted by an NGO in a commune of Romania and own recommendations. Key words: development projects, gender analysis, gender mainstreaming, public utilities, water supply and sanitation INTRODUCTION The equal visibility, opportunities and participation of women and men in all spheres of public and private life is often guided by a vision of human rights, which incorporates acceptance of equal and inalienable rights of women and men. Gender equality is not only crucial for the wellbeing and development of individuals, but also for the evolution of societies and the development of countries. As we have stated in the previous year conference paper (Frone Simona, Frone D.F., 2013) the human right to water and sanitation entitles everyone to water and sanitation services which are available, accessible, affordable, acceptable and safe. Access to water and sanitation is one of the vital and stringent issues of sustainable socio-economic and human development, in most of the world, so there is a strong need to state and promote this issue as much as possible. Therefore, the relationship between access to water and sanitation and gender equality has been more approached, since there are some
specific international instruments that are relevant for ensuring a gender perspective in this area. MATERIALS AND METHODS Since usually ‘gender’ denotes the socially constructed ideas a man or woman in society and includes the social relationships between women and men, we shall first try to find out a practical definition of gender mainstreaming. Then we shall point out some of the main dimensions of gender mainstreaming in water supply and sanitation (WSS), by recommending gender analysis of these projects. The benefits of gender analysis in development projects depend on some careful and useful baselines. As well, the concept of sustainable sanitation is introduced and analysed, also from the viewpoint of gender mainstreaming. As based on the case study from a Romanian village, some conclusions and recommendations may be drawn.

Scientific Papers Series Management, Economic Engineering in Agriculture and Rural Development Vol. 14, Issue 2, 2014 PRINT ISSN 2284-7995, E-ISSN 2285-3952
128
RESULTS AND DISCUSSIONS The process to thoroughly integrate a gender perspective in institutions and operations is called gender mainstreaming. According to the ECOSOC definition gender mainstreaming is: “the process of assessing the implications for women and men of any planned action, including legislation, policies or programmes, in any area and at all levels. It is a strategy for making the concerns and experiences of women as well as of men an integral part of the design, implementation, monitoring and evaluation of policies and programmes in all political, economic and societal spheres, so that women and men benefit equally, and inequality is not perpetuated. The ultimate goal of mainstreaming is to achieve gender equality.” (ECOSOC, 1997) As we shall try to further emphasize, adequate gender mainstreaming in water supply and sanitation projects should have significant implications also for socio-economic and rural development. This is now defined at the international level, and obliges Governments to take concrete steps towards ensuring access to safe water and sanitation for all, without discrimination. The Convention on the Elimination of All Forms of Discrimination against Women CEDAW 1979 is the most important legally-binding international instrument for the protection of women’s rights. While addressing the living conditions of women in rural areas, CEDAW mentions in its article 14(2) (h), that States parties shall ensure women “the right to enjoy adequate living conditions, particularly in relation to housing, sanitation, electricity and water supply, transport and communication.” The Millennium Development Goal (MDG) 3, calls for the promotion of gender equality and women’s empowerment. Four main indicators – relating to education, literacy, wage employment and political representation are commonly used to monitor progress. The European Union (EU) also supports proactively the goal of gender equality. The Lisbon Reform Treaty considers ‘equality between women and men’ among its values
and objectives (European Union, 2007: article 1a and 2) and, since1996, the EU has committed itself to mainstreaming gender considerations into all aspects of its operations and policies. „This involves not restricting efforts to promote equality to the implementation of specific measures to help women, but mobilising all general policies and measures specifically for the purpose of achieving equality by actively and openly taking into account at the planning stage their possible effects on the respective situations of men and women (gender perspective). This means systematically examining measures and policies and taking into account such possible effects when defining and implementing them: thus, development policies, the organisation of work etc. may have significant differential impacts on the situation of women and men which must therefore be duly taken into consideration in order to further promote equality between women and men.”(COM, 1996). The strategy of gender mainstreaming seeks to ensure that all measures and actions affecting the general society take into account openly and actively - during planning, implementation, monitoring and evaluation - different effects they can have on women and men. In society women and men do not have the same roles, resources, needs and interests and do not participate equally in decision making. The values assigned to "women's work" and "men's work" are not the same, these differences vary from one society to another, from one culture to another and are called "gender differences". Many policies and programs do not take into account these differences (are "gender-blind"). The result is that today the public and private services and facilities, and areas such as employment, training, business and political environment are not always created taking into account the specific needs of women and men (most often taken into account the male standard). Gender mainstreaming leads to benefits that go beyond good water and sanitation performance, including, economic benefits,

Scientific Papers Series Management, Economic Engineering in Agriculture and Rural Development Vol. 14, Issue 2, 2014 PRINT ISSN 2284-7995, E-ISSN 2285-3952
129
empowerment of women, more gender equality. Therefore, there is an urgent need to bring a gender perspective into the sanitation and hygiene sector, to involve and address both women and men in these efforts. Gender mainstreaming works best through an adaptive approach, that is participatory and responsive to the needs of the rural poor. Often, specific institutional arrangements are necessary to ensure that gender is considered an integral part of efficient and effective planning and implementation. This encompasses, for example, the development of gender policies and procedures, commitment at all organisational levels, the availability of – internal or external - gender expertise. Gender must be addressed in policy formulation and by-laws. (GWA, 2006) A gender analysis helps in understanding the socioeconomic and cultural concerns in a project area. Gender analysis builds understanding of the demands and needs of women and men, their respective knowledge and expertise, attitudes and practices, and it draws light on the constraints for women’s and men’s participation in activities. In order to make such an analysis, gender disaggregated data and involvement of women and men in sanitation planning, construction and maintenance are needed. An example will be presented in the case-study below. It is also important to assess the impact of policies and programmes on women and men, of different social and age groups. There the question should be raised who benefits and who bears the burdens/face drawbacks of these policies and programmes. (Asia Water Watch 2015, 2006) Project development teams in the field of water supply and sanitation should take care for a gender balance and be sensitive to gender and related cultural concerns. This can be enhanced by selecting field team members with gender awareness, local knowledge, cultural understanding and willingness to listen. (ADB, 1998) Gender analysis is an essential tool for understanding the local context in which the program. It is especially useful in planning
projects, since it helps planners to identify local constraints and structure projects so that objectives can be achieved and measured properly. Using gender analysis throughout the entire life cycle of the project provides information about: -the different perspectives, roles, needs and interests of women and men from the project area, country, region or institution, including practical needs and strategic interests of women and men; -relations between men and women on which depends the access to and control over resources, benefits and decision-making processes; -the potential impact of different interventions program / project on women and men, on girls and boys; -the social and cultural constraints and opportunities for promoting relations of equality between women and men; -the institutions capacity to program actions for gender equality. In developing a program / project of public investment, it is important to apply a gender analysis to enable for a further integrated strategic approach. Gender mainstreaming for water supply and sanitation services Experience shows that if water supply projects can be considered truly neutral in terms of gender, the physiological needs for potable water consumption being similar for both women and men, in terms of access to proper and private toilets, the need of women are much bigger and more important due to their sensitivity and their physiological and socio-cultural features. Often, the design, location and construction of toilets or latrines, does not pay sufficient attention to the specific needs of women and men, girls and boys. Development programs for sanitation services, as well as many other social and economic development programs have often been assumed to be neutral in terms of gender. Therefore, sometimes there can be failures in the implementation and adequate harnessing of such projects because of errors arising from la lack of adequate gender analysis (absence

Scientific Papers Series Management, Economic Engineering in Agriculture and Rural Development Vol. 14, Issue 2, 2014 PRINT ISSN 2284-7995, E-ISSN 2285-3952
130
of facilities for hygiene and safety of women, heavy duty access for girls, or even too small boys, etc.). The chosen solution in most rural areas of the world is pit latrines. They do not comply with the criteria for sustainable sanitation (see below). Pit latrines tend to be bad smelling and lead to unhygienic conditions, and pose additional gender problems. In general, women use the pit latrines several times a day whereas men are not similarly dependent on them as they can easily relieve themselves outside. Therefore, men might be less interested in changing the toilet situation. There are many important factors such as discrimination, lack of political will or gender concerns, and the lack of appropriate legal structures which combined result in: -neglecting the specific needs of women, on the one hand; -Absence of women in planning and implementation of water supply and sanitation on the other hand. The vast majority of people globally (one billion) living in poverty are women, and the overall trend is the enhancement of a feminisation of poverty, especially for the households headed by women. At the World Water Forum (2006 World Water Forum Mexico City) were presented some initiatives, actions and local projects that address gender analysis in developing countries including our country (Armenia, Bulgaria, Romania, Ukraine and Mexico). They have demonstrated that a stronger involvement of civil society groups, particularly women and minority groups in decision-making on sanitation and wastewater management is often necessary to truly achieve progress in this sector. Apart from the gender-specific issues mentioned, the gender perspectives of sustainable sanitation projects, have to be better explored. This is an interesting issue, since women are actively involved in food crop production and food security in many parts of the world, and would be directly affected by increased soil nutrients provided through ecological sanitation, for their rural and urban agriculture.
Therefore, sustainable sanitation is a most interesting issue of sustainable rural development. The main objective of a sanitation system is to protect and promote human health by providing a clean environment and breaking the cycle of diseases. Basic principles when planning and implementing a sanitation system were endorsed by the Water Supply and Sanitation Collaborative Council and Sandec, (2000) in the Bellagio Principles for Sustainable Sanitation: -Human dignity, quality of life and environmental security at household level should be at the centre of any sanitation approach. -In line with good governance principles, decision making should involve participation of all stakeholders, especially the consumers and providers of services. -Waste should be considered a resource, and its management should be holistic and form part of integrated water resources, nutrient flow and waste management processes. -The domain in which environmental sanitation problems are resolved should be kept to the minimum practicable size (household, neighbourhood, community, town, district, catchments, and city). In many cases, such as the village Gârla Mare in Romania (see case study), women accept sustainable sanitation by UDDT ecosan toilets while men prefer flush toilets with water. Therefore, women and children (through school programs) could play an important role in motivating, educating and convinced others to use ecosan projects UDDT. Ecosan toilets that produce compost is an innovation or alternative eco-economic nature sewer service in order to ensure both manure and environmental sanitation, both water saving and obtaining natural compost fertilizer. Moreover, a supporter of the technology is Lester Brown himself (Brown L, 2009), who argues that these toilets that produce compost "deserve attention for several reasons," the last being "the increase in capital costs for wastewater discharge systems". Case Study - The village Gârla Mare, Romania

Scientific Papers Series Management, Economic Engineering in Agriculture and Rural Development Vol. 14, Issue 2, 2014 PRINT ISSN 2284-7995, E-ISSN 2285-3952
131
In Gârla Mare, a typical Romanian village of 3,500 citizens without a central water supply, ecosan school toilets UDDT (urine dry diverting) were introduced by Women in Europe for a Common Future (WECF), Medium et Sanitas and Hamburg University of Technology, replacing the old school pit latrines, which were in an unacceptable state. The ecosan school toilets were built for demonstration and proved to be clean and cheap, and produced excellent fertilizer, that has been used to grow corn and peppers. Both men and women contributed to the development of the toilets in their traditional roles, men were the builders and women were those teaching their children about how to use the toilets and hygiene. After a year of operation, a survey that was undertaken in the village among 40 respondents (21 women/19 men) showed the following results (WECF, 2006): -Only 3% of women were willing to invest in a (new type of) toilet; for men this percentage was 20%. -10% of women were willing if it would fit into their budget. This is understandable as the income level of most families is extremely low and they can hardly afford to buy enough food for themselves. But is also shows that more investigation is needed round the financial aspects, and the fact that men feel there are enough financial options, and women do not. -74% of women as opposed to 58% of men want dry urine diverting toilets for the school; whereas 32% of the men and 17% of the women would prefer a water flush toilet. The arguments women mentioned were that the toilets are good for children’s health, there is less bad odour, and children are happy with them. -More schoolgirls, who were interviewed separately would like to have such toilets at home, then schoolboys. Apparently girls feel that they benefit more from clean toilets. Also, the case study revealed that women would like to have the toilets in the house, as that would reduce walking distances also during bad weather conditions, but often there is not enough room in the house. They are
also more willing to use the fertilizer in their fields and gardens. Women and children (via schools) could play an important role in motivating and educating others to use UDDT projects. CONCLUSIONS Using the variation coefficient for comparing the price volatility of vegetables, we can draw the conclusion that tomato price had the highest volatility in the period 2004-2010. Yet it is worth noticing that tomato price had a maximum level in June 2006 in the region N-E, which overall contributed to an extremely high volatility in the respective year. Onion lies at the opposite pole, with a lower and more constant variation coefficient, which reached 4% in 2009. The prices of green peppers are also less volatile compared to the tomato and cabbage prices. However, it can be concluded that throughout the investigated period, the prices had an increasing trend. This sector lacked a coherent strategy in the last two decades, being characterized by the diminution of the capacity to face the competition market. At the same time, as a result of Romania joining the EU, its competitors from the EU both in the production and processing sector are testing the Romanian market; in case the Romanian sector is not able to get reorganized and benefit from the established intervention measures, it will not be able to face the strong competition coming from the Single Market and not only. The price volatility is reflected at all chin stages level and especially at the production stage and to a lesser degree at the marketing and processing levels. ACKNOWLEDGMENTS This paper was supported by the project "Post-Doctoral Studies in Economics: training program for elite researchers - SPODE" co-funded from the European Social Fund through the Development of Human Resources Operational Programme 2007-2013,Contract no. POSDRU/89/1.5/S/61755”.

Scientific Papers Series Management, Economic Engineering in Agriculture and Rural Development Vol. 14, Issue 2, 2014 PRINT ISSN 2284-7995, E-ISSN 2285-3952
132
REFERENCES [1]Commodity Price Volatility: international and EU perspective; Directorate-General for Agriculture and Rural Development, L5. Agricultural trade policy; Brussels, 2010 [2]Aksoy, M.A., Beghin, J.C., 2005, Global Agricultural Trade and Developing Countries (The World Bank, Washington D.C.) [3]Bielza Maria, Diaz-Caneja, Conte C., Dittmann, C., 2008, Agricultural Insurance Scheme, IPSC, JRC, European Union [4]Hertel,T.W., Brokmeier, M., Padma, V. Swaminathan, 1997, Sectorial and economy wide analysis of integrating Central and Eastern European Countries into the EU: Implication of alternative strategies, European Review of Agricultural Economics, 24:3-4 [5] Swinnen, J.F.M., 2005, When the market comes to you - or not. The dynamics of vertical coordination in agro-food chains in Europe and Central Asia, World Bank: Washington, D.C. [6] Swinnen, J., Maertens, M., 2007, Globalization, Privatization, and Vertical Coordination in Food Value Chains in Developing and Transition Countries. Agricultural Economics, 37(2):89-102 [7]National Institute for Statistics, Results and performance of industrial and trade companies, tome 2001

Scientific Papers Series Management, Economic Engineering in Agriculture and Rural Development Vol. 14, Issue 2, 2014 PRINT ISSN 2284-7995, E-ISSN 2285-3952
133
THE INCREASING OF COMPETITIVENESS OF HIGH VALUE ADDED HORTICULTURAL PRODUCTION IN THE CONTEXT OF THE ECONOMIC GROWTH OF THE REPUBLIC OF MOLDOVA Artur GOLBAN
The State Agrarian University of Moldova, 42 Mircești Street, Chișinău, Republic of Moldova Email: [email protected] Corresponding author: [email protected] Abstract This scientific work reveals the place of the horticultural sector at the economic growth of the Republic of Moldova. In today’s competitive marketplace, succesfull companies develop value added strategies to build and sustain important customer-supplier relationships that rise above the traditional confines of both product and price. It is very important to concentrate the attention to the development of competitive high value added horticultural products by using high technologies, know-how, inovations which will give us the possibility in the future to speak about a modern high value added horticultural sector which will be competitive in the international markets. High value added horticultural products means high value revenues, high value wages, the development of the country. Key words: competitiveness, credit costs, economic growth, high value added horticultural products, subsidies INTRODUCTION Transition to market economy and continuos process of economic integration of the Republic of Moldova in the World Economy significantly increases the degree of opening of the national economy compared to the world economies. In conditions of competitive sales markets of agricultural products, those companies will have succes which will develop „Value Added Strategies” to establish baselines and develop important business relations between buyers and suppliers. Value Added Strategies are based on the suppliers competencies and other areas of expertise as an organization. They are designed to provide high value to a selected customer’s bottom line, versus merely seeking to „add value” to the individual products and services it sells. It is a supplier’s organizational value rather than its product or service value that is at the core of Value-Added Strategies [3]. From other perspective, the „customer value” reflects the relationship between the benefits customers receive from and the price they pay for a product. The more benefits relative to the price, the higher the customer value.
„Value” is usually created by focusing on the benefits associated with the agribusiness product or service that arrise from: Quality – Does the product or service meet or exceed customer expectations? Functionality –Does the product or service provide the function needed of it? Form – Is the product in a useful form? Place – Is the product in the right place? Time – Is the product in the right place at the right time? Ease of possession – Is the product easy for the customer to obtain? A product must have one or more of these qualities to generate additional value [1]. In the Republic of Moldova the horticultural sector has a special place in the economy of the country, ensuring with horticultural high value added products both the customers inside and outside the country. According to the programme of the horticultural development 2013-2020, the fresh and processed horticultural production provided in 2011 about 13% of export revenue (mln USD 282,5). In the last 10 years, the export value of the horticultural sector increased about 4,3 times, exceeding the rate of total exports [10].

Scientific Papers Series Management, Economic Engineering in Agriculture and Rural Development Vol. 14, Issue 2, 2014 PRINT ISSN 2284-7995, E-ISSN 2285-3952
134
The main purpose of this scientific work consists of: highlighting the role played by the horticultural products at the economic growth of the Republic of Moldova; the analyze of the situation and of the existent problems of the horticultural sector and also the main objective of the scientific work is to propose ways of increasing the competitiveness of the horticultural products from Moldova. MATERIALS AND METHODS This scientific article was elaborated after the analyze of the literature from the agri-food sector of the Republic of Moldova. The research has been conducted on the basis of the official statistics collected from the National Bureau of Statistics, the NBM, and the Minister of Agriculture and the Food Industry of Moldova. In this scientific work are used the following methods of research: synthesis, induction, deduction, graphical method and others RESULTS AND DISCUSSIONS The agricultural sector is the traditional branch of the Republic of Moldova, which contributed in 2013 with 11,9% to GDP, which represents an increase comparing to 2012 with 1,0% and a decrease comparing to 2011 with 0,4%, when this economic index constituted 12,3% (See the table 1). In 2013 was a favourable agricultural year comparing to 2012, when the drought negatively influenced the agricultural production [12,14]. Table1. The structure of GDP by categories of resources in 2011 -2013 Years
Goods
2011 2012 2013
Deviations of 2013 with
2011 2012
Agriculture, hunting, forestry
12,3 10,9 11,9 -0,4 +1,0
Industry 13,6 14,0 13,9 +0,3 -0,1 Constructions 3,3 3,5 3,9 +0,6 +0,4 Wholesale and retail trading 13,5 14,0 13,7 +0,2 -0,3 Transports and communications
10,9 10,8 10.4 -0,5 -0,4
Other activities 31,3 32,3 31,5 +0,2 -0,8 Financial intermediary services indirect calculated
-2,2 -2,0 -1,7 +0,5 +0,3
Net taxes on products 17,0 16,5 16,4 -0,6 +0,1
Source: Elaborated by the author based on the data from National Bureau of Statistics of the Republic of Moldova
In 2013 the share of the vegetal production from the whole agricultural production constituted 72% (in 2012 this index was 62%), from which cereals and grain legumes constituted – 29.0% (more than in 2012 with 11%), technical crops – 17.6% (less than in 2012 with 3.1%), vegetables and melons – 8% (more than in 2012 with 0.7%), fruits, nuts and berries – 5.4% (in 2012 - 6.7%), grapes – 9.1% (in 2012 - 10.4%) [14]. The increase of the vegetal production (respectively the share of the vegetal production in the whole agricultural production) in 2013, comparatively with the previous year was generated by the increase of the average harvest for all agricultural crops. Thus, the average production per ha of corn increased by 2,5 times, of soybean – increased by 1,9 times, sunflower and sugar beet – respectively increased by 1,8 times, wheat- increased by 1,7 times, barley- increased by 1,6 times, potatoes – increased by 1,3 times. Nowadays, more and more agricultural producers are oriented to high value added agricultural products. In general, adding value is the process of changing or transforming a product from its original state to a more valuable state [9]. According to the data of the study performed by fourteen farmers in the Southern US conducted by ATTRA and the Southern Sustainable Agriculture Working Group were identified 10 key points in developing a high value added agricultural business [13]. These include: starting small and growing naturally; making decisions based on good records; creating a high-quality product; following demand-driven production; getting the whole family or partners involved; keeping informed; planning for the future; continuing evaluation; persevering and having adequate capitalization [2,8]. In Republic of Moldova high value added products can be considered horticultural products, especially fruits and vegetables, which are very useful for health, being a rich source of vitamins Horticulture is the main source of income for the majority of the population of the country

Scientific Papers Series Management, Economic Engineering in Agriculture and Rural Development Vol. 14, Issue 2, 2014 PRINT ISSN 2284-7995, E-ISSN 2285-3952
135
(about 28%) employed in agriculture, playing a multiplicator role for economy. Agricultural production structure in all categories reveals that horticultural production in 2013 constituted about 33% (from which: grapes - 14%, vegetables and mellons – 8%, potatoes – 6%, fruits and berries – 5%), this means that from the whole agricultural production, one third of the production is horticultural production, and the remaining agricultural production consists of: animal production – 18%, cereal crops production – 18%, sunflower crops – 8%, other vegetal production – 9% [14].
Other vegetal
production
9%
Sunf lower
8%Cereal crops
18%
Animal
production
32%
Horticultura
l production
33%
Fig.1. Agricultural production structure, in all categories of households (2013) Source: Elaborated by the author based on the data from www.maia.md
Although horticultural production constitutes a third from the total agricultural production, the development of the high value added horticultural production in the Republic of Moldova, faces many problems: including excessive fragmentation of agricultural lands. The utilised agricultural area, on average, for an agricultural unit is 2,2 ha. Farms with legal status, on average, have approximately 247.9 ha, those which haven’t legal status have 0.8 ha [10]. Excessive fragmentation of the agricultural lands underlines series of problems for the horticultural sector of the Republic of Moldova. In particular, the division of lands in small parcels does not permit application of the intensive methods of work, the manifestation of the effect of scale when agricultural technologies are used, the supply of inputs, the processes of transportation, storage, processing and marketing of the agricultural products. The state have been taken many measures regarding the Programme of Land consolidation (Government Regulation nr 1075 from
01.10.2007), but which unfortunately doesn’t registered expected results [5,6]. According to the Subsidies Regulation of the agricultural producers, one of the additional measures introduced in 2013, provided agricultural land consolidation subsidizing, according to which the costs of the sale-purchase transactions, donations or change and registration of lands will be compensated in proportion of 50% of costs [11]. According to the report of the Agency of interventions and payments in the agricultural sector for 2013, the number of the requests for land consolidation subsidizing was not very relevant in 2013 and constituted 6 requests in total amount of 0,1 mln. MDL. For payment was authorised 6 requests in total amount of 0,05 mln MDL which is less than other subsidizing measures like crediting the agricultural sector – 1014 files, stimulation of risk ensuring in agriculture – 81 requests, etc. The analyze of the relation between the evolution of the production and the surface of fruits plantations from the Republic of Moldova, reveals that in the period during 1986-1990 the total surface of orchards constituted 220 thousands ha, orchards in bearing constituted approximately 150 thousands ha (which represents 60% from the total surface of orchards from USSR) with a total production of 1043 thousands tons [10]. From the beginning of ’90 of the previous century, was registered a decrease of the orchards surfaces from 251 thousands ha in 1993 to 116 thousands hectares in 2013 [fig.2]. But, transition to market economy, the development of the private property influenced in a positive way the process of foundation new orchards, respectively from less than 1000 ha in 2002 to 2882 ha in 2013 (but less than in 2012, when this index constituted more than 4000 ha) from which [fig.3]: apple orchards – 1392.65 ha, plum plantations – 704.56 ha nuts plantations – 530.86 ha, apricot tree plantations – 320.99 ha, cherry plantations – 296.39 ha, sour cherry plantations – 112.74 ha. AIPA paid subsidies to agricultural producers which founded new fruit plantations in 2013 in total amount of 56.9 mln. MDL.

Scientific Papers Series Management, Economic Engineering in Agriculture and Rural Development Vol. 14, Issue 2, 2014 PRINT ISSN 2284-7995, E-ISSN 2285-3952
136
Figure.2. Relation between global production of fruits and fruit plantations surface
181,6 116119,6
251
946,6
249,1
1087,3
521,3
303277,2327,1
617,2
370,5308136,3
477378,4
0200400600800
10001200
1961
-196
5
1986
-199
0
1993
1994
1995
1996
1997
1998
1999
2000
2001
2002
2003
2004
2005
2006
2007
2008
2009
2010
2011
2012
2013
Surface of fruit plantations, thousands ha Global production of fruits, thousands tons
0
1000
2000
3000
4000
5000
6000
7000
2002 2003 2004 2005 2006 2007 2008 2009 2010 2011 2012 2013
Figure 3. The dynamics of founding new fruit plantation in the Republic of Moldova during 2002-2013, ha
Table 2. The results of the cost-benefit analysis to remove the constraints of the Republic of Moldova horticultural
sector development [7] Constraints for
Export and Production
Operational benefits
Current costs
Net operational
Benefits
Regulate investments
costs
Extra investments
costs
Total investment
costs
Redemption
period A B C=A-B D E F=D+E G=F/C Land consolidation 1936 1936 2500 2500 Irrigation 6454 1760 4694 35203 35203 Packaging 3227 3520 -293 0 Pre-cooling 5385 1096 4289 17700 17700 Refrigerated rooms 11120 2950 8170 59000 59000 Calibration and packaging for new channels
9311
3319
5993
10800
10800
Engineering network 8750 8750 Subsidies -11200 -11200 Banking finance 23333 23333 The association capacity
2500 2500
Post harvest and sales producers cooperation
2500 2500
State support of exports
5600 5600
TOTAL 37434 12646 24788 122703 33983 156687 6,32

Scientific Papers Series Management, Economic Engineering in Agriculture and Rural Development Vol. 14, Issue 2, 2014 PRINT ISSN 2284-7995, E-ISSN 2285-3952
137
The cost-benefit analysis to remove the constraints of the horticultural sector development generated the following findings [7]: -The ineficiencies from the horticultural sector lead to uncovered losses and lost margins for export sales in total value of USD mln. 37,4 each year.The basic elements of this losses are lost margins for the sales out of the season because of the absence of the refrigerated rooms (30%), lost margins at new export channels – supermarkets from Russia and new markets from EU (25%), losses because of the insufficient irrigation (17%), losses of the absence of the pre-cooling methods for fruits vegetables (14%), losses of the packaging of production (9%).
Figure 4. The moldavian horticultural losses because of constraints for export
Export channels;
25%
Land consolidati
on; 5%
Irrigation; 17%
Pre-cooling;
14%
Packaging; 9%
Refrigerated rooms;
30%
-To avoid these losses must be made investments in irrigation and post-harvest equipments. The necessary investments is close to USD mln. 122 at the current level of investments.The major part of investments will be for refrigerated rooms (48%). The current costs necessary for the equipment operating represents USD mln. 12,6 per year.
Figure 5. Necessary investments for constraints e limination of the horticultural development
Pre-cooling14%
Calibration and
packaging for channels
9%
Refrigerated rooms
48%
Irrigation29%
-The horticultural producers must invest more than USD mln 122 because of the sectorial inefficiences. Extra investments costs will constitute about USD mln 34, which is linked
more than 50% with the expensive banking financing, engineering networks – 19%, state support at exports – 12%, association capacities – 6%,post harvest and sales producers cooperation – 6% etc. -According to the cost-benefits analysis, the redemption period will be about 6,3 years. This short redemption period will give posibility to develop the infrastructure. In the last decade there were registered several qualitative enhancements in the sector of producing high value added horticultural products determined by: -The increasing popularity of intensive and super-intensive methods of fruits producing; -The increasing number of orchards equipped with irrigation and anti hail systems -The increasing number of the assortment of machines, equipments and instruments necessary for the proceess of production etc. Although there was registered several qualitative enhancements in the horticultural sector, at the same time exists series of problems of producing high value added horticultural products, among which we can mention: -The producers are not sufficient informed about the advantages of founding intensive fruits plantations and about the application in production of the advanced technologies, which will ensure a higher productivity of intensive plantations in comparison to traditional plantations; -The costs of credits to buy modern equipments, necessary for founding intensive plantations are very high, which determines the agricultural producers to found traditional plantations; -Foreign investors bypass Republic of Moldova because of the uncertainty in tomorrow, bureaucracy and corruption; -The production and processing equipments are outdated; -Small-scale irrigation of orchards because of high costs and incomplete regulation of the water basins use for irrigation purposes; -A particularity of the horticultural sector is the seasonal harvest production. In some parts of the country is registered labor deficit in the agricultural sector. If in 2004 in the agricultural sector were employed about 533

Scientific Papers Series Management, Economic Engineering in Agriculture and Rural Development Vol. 14, Issue 2, 2014 PRINT ISSN 2284-7995, E-ISSN 2285-3952
138
thousands persons, than in 2012 the number of population employed in agriculture decreased with 230 thousands persons and constituted 303 thousands persons. Thus it is necessary to develop the infrastructure and to create attractive living conditions in the rural areas to diminish the migration of the population from rural areas. From the mentioned above, we can point out that the development of high value added horticultural production is facing many problems, but besides the existent problems, a separate problem is to ensure a stable marketplace. In the Republic of Moldova prevails outdoor markets, where often are not offered conditions to ensure product quality and safety. This fact determines the commercialization of the vast majority of high value added horticultural products during the harvest season, sometimes directly from the field at low prices, and only a small quantity is stored in refrigerated rooms and commercialized out of the season at higher prices. The analyze of the external market of horticultural products, reveals that with the accession of Ukraine (2008) and Russian Federation (2012) to WTO diminished the export of horticultural products from the Republic of Moldova to these countries. Thus in 2012, the export of apples from Moldova in Russian Federation diminished by 30% in comparison with 2011. The biggest competitor on Russian Federation market was Poland, which exported in 2012, about 128 thousands tons of apples. But in six months of 2013-2014 Moldova increased the volume of apples supplies on Russian Federation market by 13% in comparison with the similar situation of 2012. In generally, according to the statistical information, in the current season the apples supplies on the russian market are countinuously decreasing. Thus in december 2013, Russia imported 117 thousands tons of apples, which is less than in 2012 by 6%. In the first half of 2013-2014 there were exported in Russian Federation 446 thousands tons of apples, which is less than in july-december 2012 by 11%.
The dicreasing trade trend of the Republic of Moldova with the Russian Federation and the countries from the Customs Union (Kazakhstan-Belarus), are reflected by the descending evolution of the Intraregional Trade Intensity Index (ITII) [4]. ITII is an indicator which reveals the ratio of the intra-regional trade share to the region’s share in the world’s total trade:
,
,
,
,
,
i t
i t
i t
i t
w t
IT
TIT II
T
T
(1)
where: ITi,t denotes region i’s intra-regional trade in year t, Ti,t denotes region i’s total trade in year t (i’s total imports plus total exports), Tw,t denotes the world’s total trade in year t (world’s total imports plus total exports). This indicator is used to determine whether the value of intra-regional trade is greater or smaller than would be expected on the basis of the region’s importance in world trade. This value is: equal to zero in the case of no intra-regional trade; equal to one if the region’s weight in its own trade is equal to its weight in world trade (geographic neutrality); higher than one if intra-regional trade is relatively more important than trade flows with the rest of the world. In figure 6 the value of ITII is higher than one, which reveals that between the states from the Customs Union, intraregional trade has high importance compared to the weight held in the world trade. The Republic of Moldova must maintain the commercial relations with the Customs Union states which is an important economic partner, and to try to find out new trade markets for high value added horticultural products. The trade with the countries from the Customs Union among advantages generates several risks for Moldova, from which we can mention: dependence of one market, the increasing of the geographical concentration contradiction with the general economic policy of the state which has the purpose to

Scientific Papers Series Management, Economic Engineering in Agriculture and Rural Development Vol. 14, Issue 2, 2014 PRINT ISSN 2284-7995, E-ISSN 2285-3952
139
support the competitiveness of the national production.
Figure 6. The ITII with the Customs Union member states
0
2
4
6
8
10
12
14
2000 2001 2002 2003 2004 2005 2006 2007 2008 2009 2010 2011 2012 2013
The biggest problems of moldavian exported fruits and vegetables on foreign markets are the image of the products, the quality certification, the absence of a country branding strategy etc. Therefore the prerogative of the horticultural products sector relates to mentaining competitiveness through:
General increasing of the horticultural products quality;
Unitary costs reducing; Consolidation of horticultural products
commercialized volumes for facilitating the cooperation with the networks and the big importers;
Clear differentiation from the basic competitors;
Improvement of sanitary and phytosanitary official control on exports to prevent crisis situations;
Creation of storage conditions of the horticultural products during the cold period of the year;etc. An opportunity in increasing the competitiveness of the high value added horticultural products will be signing the Deep and Comprehensive Free Trade Agreement with the European Union. Signing this agreement will open new markets (characterized by high potential of absorption) for local producers, high purchase power and relative stability of prices.
Figure 7. The ITII with the EU member states
0
0,05
0,1
0,15
0,2
0,25
0,3
2000 2001 2002 2003 2004 2005 2006 2007 2008 2009 2010 2011 2012 2013
According to the figure 7, we can reveal that the ITII with the EU member states has a positive evolution in time, which shows the faster growth of intraregional trade, compared to the weight of the EU region in the world trade. The Export volume trend to the EU (figure 8), from 2001 till 2012, increased constinuously, European Union remains the main commercial partner of the Republic of Moldova [14].
Figure 8. Export volume trend to the EU, 2001=100
0
50
100
150
200
250
300
350
2001 2002 2003 2004 2005 2006 2007 2008 2009 2010 2011 2012
After Moldova will sign the DCFTA with the EU, the attractiveness of foreign investors in RM will increase, estimated by the increased flow of FDI in the country's economy, fact which will contribute to the modernization of agriculture and to the enhancing of the competitiveness of high value added agricultural production [15]. CONCLUSIONS Horticultural sector of the Republic of Moldova has a special place in the economy of the state, ensuring with high value added

Scientific Papers Series Management, Economic Engineering in Agriculture and Rural Development Vol. 14, Issue 2, 2014 PRINT ISSN 2284-7995, E-ISSN 2285-3952
140
horticultural products both the internal markets and the external markets. The competitiveness increasing of the horticultural production will influence in a positive way the economic growth of the Republic of Moldova. This will be possible only by: ensuring with advanced equipments the production process, storage conditions creation of production, the infrastructure development in the rural area, informing the agricultural producers about the advantages of founding intensive plantations and the most important to find out new sales markets for high value added horticultural products. According to the Intraregional Trade Intensity Index was stated that in the last years the trade with the countries from the Customs Union have a descending trend, but the value of ITII is higher than one, which reveals that between the states from the Customs Union, intraregional trade has high importance compared to the weight held in the world trade. The Republic of Moldova must maintain the commercial relations with the Customs Union states, which is an important economic partner, and to try to find out new trade markets because the dependence of one market generates risks regarding the increasing of competitiveness of the country. The analyze of the ITII with the EU member states reveals a positive evolution of this index during the last years, which shows the faster growth of intraregional trade, compared to the weight of the EU region in the world trade. An opportunity in increasing the competitiveness of the high value added horticultural products will be signing the Deep and Comprehensive Free Trade Agreement with the European Union. Signing this agreement, on the one hand, will open for local producers new markets, characterized by high potential of absorption, high purchase power and relative stability prices, and on the other hand will be a challenge for producers with low level of competitiveness.
REFERENCES [1]Anderson D.P., Hanselka D., 2000, Adding value to agricultural products. Texas Agricultural Extension Service, Texas A& M University Systm. [2]Born H., 2001, Keys to success in value-added agriculture, January 2001. National Center for Appropriate Technology, ATTRA Project [3]Caslione, J. A., Value-added strategies: How to compete against price in www.caslione.com [4]Clipa, V., Stratan, A., 2013. Republic of Moldova: challenges and prospects of the accesion to the Customs Union Russia-Kazakhstan-Belarus vs.concluding the Deep and Comprehensive Free Trade Agreement with the European Union. IEFS. [5]Government Decision nr 554 from 22.05.2006 regarding the approval of the Program on agricultural lands consolidation. [6]Government Decision nr 1075 from 01.10.2007 regarding the approval of the Regulation on agricultural lands consolidation. [7]Grushevsky, A., Vulpe, D., 2013, Bariere la exportul fructelor şi legumelor proaspete din Republica Moldova. [8]Matthewson, M., 2007, Exploring value added agriculture. Summer 2007, Vol II, No2. in http://smallfarms.oregonstate.edu/book/export/html/175602 [9]Roland. M., What is value-added agriculture? in http://www.agmrc.org/business_development/getting_prepared/valueadded_agriculture/articles/ [10]The horticultural development program for 2013-2020 (preliminary version) in www.maia.md [11]http://aipa.md/ [12]http://bnm.md/ [13]http://smallfarms.oregonstate.edu/book/export/html/175602 [14]http://statistica.md/ [15]http://unimedia.info/stiri/Lazar-Semnarea-Acordului-de-creare-a-Zonei-de-Liber-schimb-va-oferi-oportunitai-dar-i-provocari-63325.html

Scientific Papers Series Management, Economic Engineering in Agriculture and Rural Development Vol. 14, Issue 2, 2014 PRINT ISSN 2284-7995, E-ISSN 2285-3952
141
MODERNIZATION OF WINE SECTOR IN THE CONTEXT OF INNOVATIVE ECONOMY Tatiana IAŢIŞIN, Tatiana COLESNICOVA, Aurelia ŞUŞU-ŢURCAN National Institute for Economic Research, Moldovan Academy of Sciences, 45, Ion Creanga Street, Chisinau, Republic of Moldova, MD-2064, E-mail: [email protected], E-mail: [email protected], E-mail: [email protected] Corresponding author: [email protected] Abstract The sustainable agriculture contributes to resolve some social problems of rural areas: employment, infrastructure development, conservation and enhancement of cultural heritage, development of roads and communications. Scientists and politicians vigorously discuss modern agriculture as characterized by developing technologies that rely on external inputs created, which is the best way for agricultural development. The global situation of the wine sector and its prospects in the context of Moldovan orientation towards innovative economy is analyzed in the article. Key words: knowledge economy, innovation, modernization, paradigm, research, sustainable agriculture, wine sector INTRODUCTION The sustainable agriculture contributes to resolve social problems of rural areas: employment, infrastructure development, conservation and enhancement of cultural heritage, development of roads and communications. Scientists and politicians vigorously discuss modern agriculture as characterized by developing technologies that rely on external inputs created, which is the best way for agricultural development. International institutions such as the World Bank, FAO and the Consultative Group on International Agricultural Research have suggested that the way to feed the population is agriculture modernization. The new paradigm of modernization is moved by agricultural technologies and people. Its novelty is that the combination of policies for agriculture, financial policy, economic and technological, to introduce a new component, social policies, to improve human capital in agriculture. The theory of modernization is justification for global development policy of civilization, the transition from traditional to modern societies as an inevitable trend of development in modern politics. The modernization of agriculture is based on the features that are
part of the industry: concentration, intensification and specialization. At the same time, the agricultural sector has become substantially dependent on modern inputs, externalities and industrial values. Modernizing agriculture aimed at improving the conditions of production and marketing, focusing on main areas: training of farmers, farm technical support to improve production methods, improving plant varieties planted (introduction hybrids) using doses significant (and rational) of fertilizers and chemicals for treatment, development planning works and farm equipment (irrigation, drainage, sanitation, amendment, etc.). This modernization program as it deems Professor P. Roux, "requires a considerable investment effort' [8]. Agriculture is an important sector for any country, a balancing factor in harmonized economic development. The importance of the agricultural sector in Moldova is quite high despite the fact that this sector contributed only about 12.3% of GDP in 2011. Agriculture is the main occupation for Moldovan population. The transition to a market economy in agriculture implies the implementation of mechanisms characteristic of free market economy. Since then, "Why and for whom is it produced?" is dictated by

Scientific Papers Series Management, Economic Engineering in Agriculture and Rural Development Vol. 14, Issue 2, 2014 PRINT ISSN 2284-7995, E-ISSN 2285-3952
142
market forces. In a market economy, agricultural production is not easy, it requires multiple support mechanisms. It plays an important role in our economy, and the state should focus its efforts to the development of agriculture. The total area of agricultural land in 2011, made up 2.4983 million ha or 73.8% of the total land area, including ± 1.8127 million ha of arable land and perennial plantings ± 298 800 ha (of which 133 orchards, 3000 ha, vineyards 149 600 ha, 350 400 ha pastures, meadows 2200 ha and fallow 34 200 ha) [1]. Agriculture remains a defining sector of the economy in the Republic of Moldova, because about 27.5% of the employed population is engaged in agriculture. Overall volume of agricultural production in comparable prices in 2011 increased by 4.8% over the previous year, and exports of food products increased by approximately 33.3%. However, agro-industrial policies have allowed a 14.5 percent increase in agricultural productivity per ha in 2011 compared to the results obtained in 2009 [9]. Share of agriculture in GDP in 2011 was 11.9%, 0.4 p.p. more than in 2010 (12.3%). According to the data from the National Bureau of Statistics, global agricultural production in all categories in 2011 marked an increase of 4.6 percent from 2010. Increase of global agricultural production in 2011 was driven by increased crop production by 6.7 percent, while livestock production recorded a moderate growth of 0.4 percent.
Fig.1. Agricultural production and the share of agricultural products in total exports Source: http://www.mf.gov.md/common/middlecost/ cctm2013/Anexe/Anexa_20_Agricultura.pdf In 2011, the share of crop production in total agricultural production was 68% compared to 66% in 2010, including cereals and grain,
technical cultures, potatoes, vegetables, legumes, fruits, nuts and berries, grapes.
Fig.2. The sector’s share in GDP and in total employed population, % Source: http://www.mf.gov.md/common/middlecost/ cctm2013/Anexe/Anexa_20_Agricultura.pdf MATERIALS AND METHODS In this paper, time series have been used with regard to the evolution of agricultural production and economic development data from the National Bureau of Statistics and Ministry of Agriculture and Food Industry MAFI online database RESULTS AND DISCUSSIONS Ministry of Agriculture and Food Industry estimated production volume food industry, beverages and tobacco increased by 4.6 percent more than in 2011, up from 12.4 billion lei, compared to 2010. Agricultural production is quite volatile, which is due to increased vulnerability to natural hazards sector and to market influence. Viticulture is one of the most important and profitable branches of agriculture in the world. Over the years the wine has become more wide spread, conquering entire continents. To better understand the impact of the draft technical regulation shall require characterization and recognition of global wine situation than the national one. In recent years, viticulture and wine making in Moldova were said economic and strategic sectors of major importance, bringing a more significant contribution to the development of national economy. Moldova's growing real insight into our country. Moldova ranks as 19th in the world in annual production volume

Scientific Papers Series Management, Economic Engineering in Agriculture and Rural Development Vol. 14, Issue 2, 2014 PRINT ISSN 2284-7995, E-ISSN 2285-3952
143
of grapes, as of (2007) UN Found for Agriculture. Several years Moldovan wine sector faces to problems that are felt at all levels. To solve these problems, the wine sector needs reform. Reform is required for entry into new markets other than the traditional ones. For the wine industry must first review the internal rules of operation to ensure a favorable business environment, normal conditions, fair, modern European all participants. In the same vein, we must ensure competitive products in line with market requirements which aims to conquer. Modernization of the wine production is made according to the Wine Sector Restructuring Program (Program) that was designed by the Government and the European Investment Bank (EIB) to address structural vulnerabilities Moldovan wine industry. European Investment Bank granted a loan of Moldova 75 million Euros for a period of 12 years, to achieve the program [6]. Responsible for implementing the Ministry of Agriculture and Food Industry (MAFI) via" Consolidated Unit for the Implementation and Monitoring Program Restructuring wine" (PCU - RSVV). The program is one of the strategic priorities of the 2012-2015 MAFI. The overall objective is to modernize and correcting structural deficiencies of the Moldovan wine industry and to contribute to improving the enabling environment for producing quality wine and protected geographical indications and protected designations of origin (PDO and PGI) to improve competitiveness on the national and export. The specific objectives of this program are: -Improving and creating a system for collecting, storing and processing in the wine sector and consequently political system in wine. -Improving access to funds in order to improve the financial position of operators in the wine sector (including growers, winemakers and associated industries) to facilitate the investment needed to produce high quality wine, including "Protected Designation of Origin" or "Tip Protected Geographic".
-Improve productivity vineyards and wines of high quality. -Restructuring of the wine industry (eg. Rationalization, cooperation and consolidation) to optimize the economic balance between scale and quality. -Improve the quality and consistency of all aspects of wine production in Moldova, the vineyards and to the final packaging and commercialization. -Develop legal environment, institutional and infrastructure for the production of bottled wines with "Protected Designation of Origin" or "protected geographical indication". -Support of fair balance of the wine market relations with wineries. -Increase capacity and facilitate investment in technical capacity, as well as education and training , inspection and verification organs. -Improve marketing effectiveness and quality Moldovan wine as its recognition on the main existing and new markets. -Stimulate national demand for quality wine. -Develop organic wine production and wine tourism. In the implementation of the restructuring program, Moldovan wine sector will apply zero VAT by local suppliers (subject to the imposition of VAT) for delivery within the country of goods and services and import them [4]. At the national level body of state administration is the Department of Agriculture wine "Moldova-Vin" of the Government of the Republic of Moldova. The Department develops the necessary legal framework for the efficient activity of economic agents, coordinates and directs the sustainable development of the wine macroeconomic provide scientific and technical assistance, support manufacturers (including financial), manages the state extra-budgetary fund to revitalize viticulture and wine making. For better functioning within the industry and overcome the difficult situation of the wine sector, according to the Ministry of Agriculture and Food Industry Report for 2010 and 2011, legislative and regulatory basis has been enhanced. In this context, draft laws have been developed and promoted:

Scientific Papers Series Management, Economic Engineering in Agriculture and Rural Development Vol. 14, Issue 2, 2014 PRINT ISSN 2284-7995, E-ISSN 2285-3952
144
-Amendment of art. 31 of Law No. vine and wine. 57-XVI of 10 March 2006 that the cancellation fee and switching to another viticulture revitalization grant mechanism in viticulture (Law no. 109 of June 4, 2010 "On amending art. 31 of Vine and Wine Law no. 57 - XVI of 10 March 2006 "On amending some legislative acts"); -Amending of some legislative acts, which expected improvement of Vine and Wine Law no. 57-XVI of 10 March 2006, Law no. 1100-XIV of 30 June 2000 on the production and circulation of ethyl alcohol and alcohol products tax code no. 1163 - XIII of 24 April 1997 Contravention Code no. 218-XVI of 24 October 2008 and the Penal Code no. 985 of 18 February 2002 (submitted to the Government for review). [10]. Under the plan approved in 2002 for restoration and development of viticulture and wine making in 2011-2020 was provided to 80,000 ha of plantations replacing old, with 70,000 hectares of new vineyards. Root stocks and cuttings concerned must be imported or manufactured locally. The objective of the program is that all vines grown today to be renewed and equipped with modern drip irrigation and hail, as well as management and harvesting equipment. In 2004-2008, according to the program of revitalization were planted between 4500 and 5600 ha annually, with a sharp decrease in 2009 due to financial difficulties. In 2010, about 1,500 ha of vineyards were established with modern varieties, including about 1200 ha of table varieties. Also, in 2011 about 13.0 million vine cuttings were produced compared with 8 million grafted cuttings in 2010 [7]. Currently there are over 100 companies that produce wine in the four wine regions, Balti (Northern Region), Cahul (Southern Region), High forest (Central Region) and Transnistria (Southeast Region). Some wineries require full or partial modernization are wineries that have already started investment programs and some farmers are considering the creation of the first centers for the collection and processing of grapes. Alcoholic and soft drinks industry in 2011 felt an increase compared to 2010 namely distilled alcoholic beverages - 23.3%, wine - by 2.3%, mineral
water and soft drinks - 51% [1]. Only 25% of Moldovan vineyards produce more than 8 tons/ha/year and are considered good, most of these areas have been planted in recent years were about 60 wineries operated embedded (about 25 000 ha in total). About 35% of the vineyards producing on average 3-5 t/ha/year, while 40% are classified as unsatisfactory. Agriculture provides employment and sources of income for many households and businesses. The share of the total employed population is steadily declining from about 50 percent in 1999-2002 to 27% in 2011 (NBS, 2012). The wine sector provides employment for a large part of the rural population, particularly important in the current alarming increase in unemployment. Compared to other crops, vines require more labor (about 100 days labor / ha). In addition, juices sector requires significant labor also. There is little precise information on the number of employees in the wine sector. The only official information on employment in the sector relate to staff at wineries. Industry estimates also indicate that about 4500 people are employed in support services such as wine trade, marketing, manufacturing bottles and cans, transportation, wine tourism and other services in the wine value chain [3]. A large part of these jobs are due to the country's exports. Namely, export of alcoholic and soft drinks (which together form a single group in the reports of the National Bureau of Statistics) is the main export item of the national economy. Moldovan wine is exported all over the world. Main markets include CIS (especially Russian Federation, Belarus and Ukraine), the EU (Poland, Czech Republic, Germany and Romania), the United States and China. Any further significant decline in exports would therefore have a disproportionate effect not only on the economy but also on the structure of society as a whole [10]. The financial situation of growers and wineries was significantly weakened trade restrictions imposed in various forms in recent years at the main export market, Russia. After the ban by the Russian Federation in 2006 Moldovan winemakers received a heavy blow, but this had some positive
Scientific Papers Series Management, Economic Engineering in Agriculture and Rural Development Vol. 14, Issue 2, 2014 PRINT ISSN 2284-7995, E-ISSN 2285-3952
145
consequences, namely, encouraged producers to shift to other markets. However, Moldovan winemakers are still addicted to the CIS, with 75% of exports. Meanwhile we see a significant increase in exports to the U.S., and, especially, to China. In 2011, the export of Moldovan alcoholic in the European Union increased by 59 400 hectoliters, compared to 2010. It is however difficult to penetrate the European market, both under recital strong traditions that EU Member States have own wine and the fact that we fail to offer an alternative to their wines. Examining all aspects of the wine industry value chain, comparing manufacturers Moldovan winemakers its regional competitors and producing countries leading wine offers some opportunities that the state can implement and promote in order to adapt to the realities of market and best practice. All this led to the need to consider legislative and regulatory framework aimed at addressing a state policy options facing the effective use of market instruments and common understanding facing the wine sector. Analysis has revealed some aspects of the wine sector: -Many parties involved in the wine sector are financially poor, with high levels of inventories and receivables assets (money owed to them) and market relations between banks and operators in the wine sector is sometimes asymmetrical. -Priority direction in the development of quality wine is to promote and stimulate the production of quality wines (VCS), including designation of origin (psr), requested the markets. -Rational use of land, the first of the slope, suitable for effective cultivation of the vine, which, after their fertility are less attractive to other crops as well as the current status and potential development of viticulture in country. -Expansion of cultivated vineyards by selecting and delimiting land less productive cropping cereals, technical etc., without jeopardizing the overall crop production. -Economically, improving assortment involves the introduction , along with the most precious varieties classical perspective
variety of new selection with resistance to low temperatures , diseases that require minimal cost of cultivation and quality which meets the requirements for table grapes or consumer winemaking , grape juice and other products. -Planting varieties with high biological value (with a backup planting material), and selecting the most valuable clones of classic varieties grown in vineyards powerful countries who used the establishment of new plantations will enable increased productivity and their longevity. -Establishment of irrigation land in crop rotation vines and building school workshops and forcing grafting cuttings grafted to the successful development of the sector Nurseries. -Founding plantations graft and rootstock, the southern areas of the country where the climatic conditions are more favorable for maturing propagating material. Production base grafted vines will be concentrated in specialized households that have adequate material and technical basis. -Better cooperation between winemakers and viticulturists. -Organic wine and wine tourism are under-developed. CONCLUSIONS In conclusion, lack of funding, technical and material production sector is outdated, especially in wine making and ensuring the maintenance of machinery and equipment for vineyards and planting material production is low. To enable the modernization of production and processing of grapes, manufacture and marketing of finished wine with greater efficiency is needed to revitalize the entire wine sector requires investment in processing, bottling and labeling, and transport, quality control and training of the workforce the creation of various types of agro-industrial formations. Along with financial support from the state, reviving wine-growing branch must: be based on well reasoned scenarios of consolidation and vertical integration of domestic producers of alcoholic beverages to implement

Scientific Papers Series Management, Economic Engineering in Agriculture and Rural Development Vol. 14, Issue 2, 2014 PRINT ISSN 2284-7995, E-ISSN 2285-3952
146
procedures bankrupt insolvent enterprises. The issue of integration must extend successful practices of firms on their respective concentration in the growth process, processing, storage (maturation) and marketing the wines of controlled origin. Aimed at increasing the competitiveness of domestic wine and vine near their quality standards by the respective indicators in the European Union, the state must be involved in the investment aspect of branch development through the development and practical implementation of efficient economic mechanisms, including by continuing the mortgage subsidy allocated for planting new vineyards. REFERENCES [1]Anuarul statistic al Republicii Moldova, 2011, Biroul Naţional de Statistică al Republicii Moldova. Chişinău, 2011, 572 pag. ISBN 978-9975-78-932-5 [2]Bajura, T., Gaina, B., 2013, Economia ramurii viti- vinicole a Republicii Moldova în contextul asocierii cu Uniunea Europeană. [Accesat 02.03.2013] Disponibil: http://www.akademos.asm.md [3]Evaluarea situaţiei curente a sectorului vinicol al Republicii Moldova în scopul elaborării strategiei lui de dezvoltare. Chişinău, 2007. [Accesat 22.02.2013] Disponibil: http://www.vinifera.md/files/Studii/sectorulvinicolmoldova.pdf. [4]HG a RM nr. 246 din 8 aprilie 2010. Regulamentul privind modul de aplicare a cotei zero a TVA la livrarea pe teritoriul ţării a mărfurilor şi serviciilor destinate proiectelor de asistenţă tehnică şi investiţională, precum şi la importul acestora. Publicat: 14.04.2010 în Monitorul Oficial Nr. 52-53 [5]HG a RM nr. 1313 din 07.10.2002 cu privire la aprobarea Programului de restabilire şi dezvoltare a viticulturii şi vinificaţiei în anii 2002-2020. Publicat: 17.10.2002 în Monitorul Oficial Nr. 142 [6]Programul de restructurare a Sectorului Vitivinicol. [Accesat 27.02.2013] Disponibil: http://www.winemoldova.md/despre.php?lng [7]Priorităţile strategice pentru activităţile Ministerului Agriculturii şi Industriei Alimentare al Republicii Moldova în anii 2011-2015. [Accesat 02.04.2013] Disponibil: http://www.maia.gov.md/ [8]Raport. România şi Politica Agricolă Comună. [Accesat 27.02.2013] Disponibil: http://www.ecoruralis.ro/storage/files/Documente/RaportPAC.pdf [9]Raportului privind rezultatele Guvernului în perioada 14.01.2011-14.01.2012. [Accesat 12.03.2013] Disponibil: http://www.gov.md/homepage.php?l=ro
[10]Raportului Ministerului Agriculturii şi Industriei Alimentare pentru anul 2010 şi 2011. [Accesat 12.03.2013] Disponibil: http://www.maia.md

Scientific Papers Series Management, Economic Engineering in Agriculture and Rural Development Vol. 14, Issue 2, 2014 PRINT ISSN 2284-7995, E-ISSN 2285-3952
147
ADVANCED STUDIES ON IMPROVING SHEEP FERTILITY BY USING ARTIFICIAL MEANS OF REPRODUCTION Mostafa A.R. IBRAHIM1, Stela ZAMFIRESCU2, Andreea ANGHEL2, Nicu DOBRIN2, Ibrahim ABDELRAZEK1, Mohamed E. El-SHARAWY1, El Shenawy El SEIFY3, Dorina MOCUTA4
1KafrelSheikh University, Egypt, El-Gaish Street, 33516 Kafr El-Sheikh, Egypt, E-mail: [email protected]. 2Ovidius University in Constanta, Romania, 144 Mamaia Avenue, Constanta, Romania, E-mail:[email protected] 3Animal Production Research Institute, Nady El Seid St., Dokki, Giza Cairo, Egypt, E-mail: [email protected] 4University of Agricultural Sciences and Veterinary Medicine of Bucharest, 59 Marasti, District 1, 11464, Bucharest, Romania, [email protected] Corresponding author: [email protected] Abstract Artificial insemination (AI) in livestock is used to optimize reproduction efficiency. Compared to other semen preservation methods, cryopreservation is an established industry used worldwide for performing AI. Adequate protocols for semen collection and freezing and then for the use in the AI are set up for all the animal species. In sheep, AI with frozen-thawed semen resulted low fertility rate, which limits the practical application of this technique. Progressive sperm motility, sperm viability, sperm plasma membrane integrity and NAR were significantly (P < 0.05) higher for BIOX, MILK, and TEY extenders. Progressive motility increased significantly (p < 0.01) using licorice extract 10, 50 and 100 g/ml. Diluter type had a significant effect (p < 0.01) on sperm motility. The percentage of progressive motility in all extenders media containing LDL was also higher compared with 20% EY (control) during dilution and equilibration stages. All extenders containing LDL reduced the percentages of abnormalities after dilution as compared to control 20% egg yolk. The percentages of intact Acrosome in all other extenders containing LDL were significantly higher than 20% egg yolk extender. The highest percentage of post-thaw progressive motility was recorded in extender containing 20mm glutamine. After dilution and equilibration, supplementation of glutamine at concentration of 40 and 60mm caused a significant increase in plasma membrane intact compared with control and all other concentrations tested. No significant difference between the control and the irradiated samples for viability However, the semen samples irradiated with 6.12 J/cm2 showed a slight increase in sperm progressive motility, viability, osmotic resistance, Acrosome and DNA integrity, respect to the semen samples irradiated at low energy doses and control semen samples. Cysteine effected on the ultra-structure of the ram sperm cell within the freezing- thawing dynamics. The positive effect of Cysteine could be a result of its interraction with membranes phospholipids during the freezing, giving it a better Cryopreservation. Key words: acrosome, cryopreservation, cysteine, freezing-thawing dynamics, ultra-structure INTRODUCTION Reproduction is directly affected by various management related factors. Manipulation of these factors can cause changes in reproductive performance. The control and manipulation of the sheep reproduction has been the objective of scientists around the world for many years. High levels of reproductive performance can only be achieved under optimum management conditions, (including nutrition), [17]. This is one factor that determines the dramatic
differences in reproductive efficiency between the developed and the developing countries (where the nutrition and general management of the flocks are not quite good). The factors affecting improving fertility in sheep are genetics (breeds and crossbreds), heat stress and management, food nutrition and energy supply, semen dilution and using some additives and cryopreservation methods [2, 16] Artificial insemination (AI) in livestock has made it possible to optimize reproduction efficiency. AI is undoubtedly the management

Scientific Papers Series Management, Economic Engineering in Agriculture and Rural Development Vol. 14, Issue 2, 2014 PRINT ISSN 2284-7995, E-ISSN 2285-3952
148
technique that has most contributed to the genetic improvement of livestock in modern animal production. By comparison to the other currently available preservation methods of semen, cryopreservation is an established industry used worldwide for performing AI, as it can preserve cells life un definitely [21] and [20] The main disadvantage of semen cryopreservation is that freezing and thawing induce several forms of cellular lesions, which dramatically reduce the quality and subsequent fertilizing ability of the semen. Sperm motility, viability, membrane integrity and biochemical parameters are all routinely used tests to assess the quality of frozen-thawed semen [14, 19]. However, acceptable motility and viability of spermatozoa do not necessarily lead to acceptable conception rates. By this research project, we aim at increasing the conception rate in ewes following AI, by using frozen-thawed semen. In order to achieve this goal, we have the following objectives: to improve the freezing technologies, to evaluate the cytological and cryobiological indexes of the spermatozoa, to obtain accurate biochemical and electro microscopically profiles of the cryopreserved cells, and to test, in vivo, the efficiency of different preserving and AI technologies, on the cryobiological parameters and reproductive indexes. The low fertility registered in AI when used cryopreserved semen is due to the harmful processes during freezing. Between 10 and 50 % of the spermatozoa die because of the processes. When natural mating occurs, the sperm is exposed to anaerobic conditions, which limits the production of ROS. This does not happen with the cryopreserved sperm, which is exposed to oxygen and to other harmful processes during freezing (e.g. seminal plasma dilution, enzymatic damage), that lead up to an increase in ROS production and lower the antioxidative defense of cells. MATERIALS AND METHODS The following tasks were conducted in Kafrelshiekh University farm in Egypt, using the same methods and technique (tasks 1, 2, 3
and 4), while tasks 5 and 6 were conducted at Ovidius University. The project researches included the following: Task 1.1: Obtaining diluting/freezing extenders with the addition of different doses of antioxidants Task 1.2: In vitro assessment of the added antioxidants’ effect on certain cytological parameters of cryopreserved spermatozoa, such as motility, structural and functional integrity of plasmatic membrane – vitality, and functional integrity of the membrane Task 1.3: In vivo assessment of the added antioxidant influences on the reproductive parameters (fecundity, fertility). Task 1.4: Sperm cryopreservation with different extenders, in straws and glass vials. Task 2.1: The quality of ram semen cryopreserved according to different procedures coming from the FEAS biobasis, will be evaluated by qualitative tests, by using phase contrast and fluorescent microscopy. The scope is to assess some important functional and structural parameters such as motility, viability, osmotic-resistance, Acrosomeial and DNA intactness. Some biochemical parameters like energy charge and COX activity, assumed to be correlated with sperm motility, will be also investigated. Task 2.2: Samples of cryopreserved ram semen was irradiated post-thawing with Helium-Neon laser at different energy doses. Functional, structural and biochemical parameters was investigated, in order to find the mechanism by which the laser acts on the mitochondria and the cellular membranes, and whether laser irradiation might improve the quality of semen compared to the control (non-irradiated). Task 3.1: Ram semen was collected and frozen according to the technology developed within the laboratory. Freezing technology of ram semen comprises 9 stages. The technology starts with sperm collection and finishes with liquid nitrogen storage of the straws or the glass vials. After collection, the semen was diluted and cooled at 4 c. In order to protect the spermatozoa against cooling damage, the semen was diluted in a saline extender supplemented with egg yolk. The

Scientific Papers Series Management, Economic Engineering in Agriculture and Rural Development Vol. 14, Issue 2, 2014 PRINT ISSN 2284-7995, E-ISSN 2285-3952
149
lipid fraction from egg yolk, mainly lipoproteins of LDL type, ensures a degree of membrane equilibrium when the cells are set at low temperatures. The cryopreserved (glycerol) will be then included into the semen. Since glycerol is toxic for spermatozoa when used at 37oC, this stage will be performed at 4oC. Task 3.2: The quality of thawed semen was evaluated, using modern techniques of analysis, in order to assess viability and functional integrity of the mitochondria. Light microscopy (fluorescence and phase contrast microscopy) was used Viability was assessed by using flow cytometry and viability of the thawed spermatic cells was studied with the method of double staining, using 2 fluorochromes to dye nuclear acids: SYBR-14 and propidium iodide (PI). SYBR-14 dyeds spermatozoa, which are alive and have intact membranes, whereas, PI dyeds dead cells with damaged membranes. Quantitative analysis of the fluorescent –marked cell populations was performed by using flow cytometry. Functional integrity of the mitochondrial chain was studied by using the Rhodamine and PI marking method with fluorescence microscopic and flow cytometric analyses. The parameters of spermatozoa established through these methods, was statistically correlated with the reproduction indexes. Task 4.1: A study on the biochemical profile of the cryopreserved semen. In order to establish the biochemical profile of the cryopreserved semen, there were two evaluated parameters of the oxidative stress, malondialdehyde (MDA) and total antioxidative capacity (TAC), as well as, the concentrations of calcium, sodium and potassium ions. The study of the two parameters focused on the seminal plasma, diluting/freezing extenders and the cryopreserved spermatozoa. The concentrations of MDA and of other substances which react with tiobarbituric acid (TBARS) were determined by using the TBARS method, described by [18]. TAC was evaluated on fresh seminal plasma before freezing and on seminal plasma following freezing-thawing, into different diluting-
freezing extenders. The activity was accomplished by using the ABTS method of spectrophotometer [13] Task 5.1: Characterization of the membrane changes observed at the head, Acrosome and flagel levels (the intermediate, principal and terminal pieces). Ultra structural changes of the cell membranes following thawing was assessed by transmission electron microscopy (TEM), using the classical technique [14] and [23] Task 6.1: In vivo testing of the tested semen, by using AI. This activity was conducted on ewes with known reproductive cycle (which gave birth 5-6 months before testing). In order to identify the estrus, the ewes were evaluated 2 times a day, in the morning and in the evening. The insemination was performed at around 18 hours from the beginning of estrus. AI was performed intracervically or laparoscopically, using as witness sample diluted fresh semen 1:1. The diluents should be the same used for preparing the cryopreserved semen [12]. RESULTS AND DISCUSSIONS Progressive sperm motility, sperm viability, sperm plasma membrane integrity and NAR were significantly (P < 0.05) higher for BIOX, MILK, and TEY extenders at 1st, 3rd and 5th day of storage compared to EYC extender. Table 1. The integrity of plasmatic membrane and Acrosome (%, medium±es, n=10), after freeze-thaw process (Merinos of Palas ram, the meat line).
Version n Plasmatic membrane Head Flagellum
Acrosome
Witness 10 37,2±1,65 39,25±1,59 42,40±3,18 Cysteine 10,0mM
10 49,0±3,02 49,90±2,36 52,70±3,82
Moreover, progressive sperm motility, sperm viability and sperm plasma membrane integrity were not affected up to third day of storage in BIOX extender and at 5th day of storage the values for these parameters remained significantly (P<0.05) higher in BIOX compared to other extenders. Sperm abnormalities (head, mid piece and tail) did not differ among the different extenders at 1st, 3rd and 5th day of storage1, 5, Progressive
Scientific Papers Series Management, Economic Engineering in Agriculture and Rural Development Vol. 14, Issue 2, 2014 PRINT ISSN 2284-7995, E-ISSN 2285-3952
150
motility increased significantly (p < 0.01) in levels of using licoric extract 10, 50 and 100 .g / ml in both diluters as antioxidant, during all storage periods. The means of progressive motility were 72.5 ± 1.02 %, 72.08 ± 1.05, 70.90 ± 2.05 % and 66.25 ± 3.15 % respectively, compared to the control (0) 61.45 ± 16.2 %. . Levels 1, 5 and 10 .g /ml were superior (p < 0.01) to levels 50 and 100 .g /ml (fig1). Diluter type had a significant effect (p < 0.01) on sperm motility. Overall the percentage of motile sperm in EYT diluter (66.48 ± 1.21 %) was higher than that in yolk-glucose citrate diluter (64.37± 1.44 %). Sperm motility tended to decline significantly (p < 0.01) as the length of storage period increased. The means of progressive motility were 80.00 ± 2.04 % after dilution (0h), 68.75 ±3.15 % 61.25 ± 4.27% and 50.62 ±4.61 %, at 24, 48 and 72 h after cooling [10] respectively. Three experiments also were conducting as follows: Experiment 1: Assessment of the cryoprotective effect of LDL on the freezing of Buffalo semen [11]. Experiment 2: Assessment of the cryoprotective effect of Glutamine on the Buffalo semen. Experiment 3: Assessment of the cryoprotective effect of the best low concentration of Glutamine when combined with 12 % LDL on the freezing of Buffalo semen [15]. The percentage of progressive motility in all extenders media containing LDL was higher compared with 20% EY (control) during dilution and equilibration stages [12]. The percentage of post-thaw progressive motility was twofold higher (P<0.05) in 12% LDL extender than control extender containing 20% EY (63.3 vs. 35%, respectively). The post-thaw motility after 30 days storage were more twofold higher in 10, 12 and 15% LDL (51.67, 61.67 and 52.5%, respectively) than control extender (20% EY, 26.67%). In cooling semen at 5C, the percentage of progressive motility in 8, 10 and 12% LDL stayed approximately constant between 0 h and 24 h. The percentage of progressive motility in Ram spermatozoa preserved at
room temperature (20 - 25oC) was significantly (P<0.05) different among different storage periods and the rate reduction of progressive motility was: 1.Significantly smaller (P<0.05) in LDL extenders as compared to control 20% EY. [13] 2.The percentage of live spermatozoa did not differ between dilution and after equilibration stages in extenders containing 8, 10 and 12% LDL, and significantly (P<0.05) lower in control and other extenders containing LDL (4, 6 and 15%) after equilibration [14]. The percentage of post-thaw live sperm in 12% LDL extender was twofold higher (P<0.05) than extender with 20% EY (76.0 vs. 38.67%, respectively). In cooling semen at 5 C, after 96 h of storage, the percentage of live spermatozoa significantly decreased. The highest value was recorded in 12% LDL when compared to control extender containing 20% EY. The percentage of live spermatozoa in all LDL extenders were significantly (P<0.05) higher compared to control at any storage period at room temperature and the highest values of livability were recorded in 12% LDL [15]. 3-All extenders containing LDL reduced the percentages of abnormalities after dilution as compared to control 20% egg yolk in a buffalo semen extender and continued in low levels after equilibration, freezing and after one month storage in liquid nitrogen. In cooling semen at 5 C for 4 days, the greatest improvement rate due to LDL replacement was recorded in 10 and 12 % LDL followed by 8 and 15% LDL. The percentage of sperm abnormalities in extenders containing LDL especially 8, 10 and 12% LDL, was significantly (P<0.05) lower than control 20% EY in any storage period at room temperature [15]. The percentages of intact Acrosome in all other extenders containing LDL were significantly higher than 20% egg yolk extender. Also, intact Acrosome was superior in medium containing 12 % LDL (P<0.05) than either control 20% EY or other extenders containing different concentrations of LDL. Percentage of Ram abnormal spermatozoa

Scientific Papers Series Management, Economic Engineering in Agriculture and Rural Development Vol. 14, Issue 2, 2014 PRINT ISSN 2284-7995, E-ISSN 2285-3952
151
1.Stored in extender containing 20% EY was significantly (P<0.05) higher than spermatozoa stored in all extenders containing different LDL concentrations at any storage period at 5oC. [15] 2.The highest membrane integrity value was recorded in 12% LDL followed by 10%, 15%, 8% and 6% LDL after dilution. The sperm membrane integrity in 12% LDL was 87.67, 84.67, 71.33 and 68.50% after dilution, equilibration, freezing and 30 days of storage in liquid nitrogen, respectively. In cooled semen at 5o C, the percentage of plasma membrane integrity of Buffalo spermatozoa decreased over time on to 96 h and all values were significantly (P<0.05) better in different LDL concentrations than control 20% EY and significantly (P<0.05) higher in all extenders containing LDL compared to control egg yolk at any storage period in buffalo semen stored at room temperature. The effects of He-Ne laser at various energy doses, on the quality of cryopreserved ram semen Fig.1. COX activity and Energetic charge of cryopreserved and irradiated ram semen. The lower dose of laser energy resulted to be ineffective (P<0.05) than other irradiated samples and control. No significant difference between the control and the irradiated samples for viability (47.96 ± 2.18 vs 45.77 ± 1.81 and 49.06 ± 1.66), osmotic resistance (37.94 ±3.08vs 36.45 ± 2.85 and 39.43 ± 1.87), Acrosome integrity (37.89 ± 2.83 vs 36.68 ± 2.68 and 40.68 ± 1.07) and DNA integrity (98.50 ± 0.29 vs
97.79 ± 0.35 and 98.74 ± 0.20) was found. However, the semen samples irradiated with 6.12 J/cm2 showed a slight increase in sperm progressive motility, viability, osmotic resistance, Acrosome and DNA integrity, respect to the semen samples irradiated at low energy doses and control semen samples. In parallel, the effect of irradiation on biochemical parameters of samples was evaluated by measuring the activity of cytochrome oxidase (COX) and the energetic charge (Fig 1) [9]. As for parameters reported, no significant difference in mean values for both COX activity and Energetic charge between control and laser treated sperm samples was found. This could be mostly due to the extreme variability of semen samples which resulted in an unpredictable effect of laser treatment [10]. “Effect of glutamine supplementation to extender on frozen-thawed buffalo semen” 1-When compared with the control, and the 20, 40 and 60mm Glutamine significantly improved occurred in progressive motility (P<0.05) after different stages of cryopreservation of semen. The highest percentage of progressive motility was recorded at concentrations of between 20 and 40 mm Glutamine at any stage of cryopreservation of ram semen. Post-thaw motility decreased when the Glutamine concentration increased from 60 to 80 and 100mm. At any stage of storage after cooling at 5o C, the use of 20mm Glutamine caused an increase of progressive motility than control extender. Glutamine at concentrations of 20 and 80mm caused a slightly improvement in sperm motility at any storage period at room temperature (18 – 20o C) compared with the control. 2-Addition of 20, 40 and 60mm Glutamine resulted in significant (P<0.05) increase in live spermatozoa after different stages of cryopreservation compared with control. At concentration between 80 and 100mm glutamine significantly (P<0.05) reduced the percentage of live spermatozoa compared with concentrations of 20 and 40mm at any
COX activity
0
20
40
60
80
100
120
140
160
CTRL 3.96 J/cm2 6.12 J/cm2
Vmax (%CTR
energetic charge
0
20
40
60
80
100
120
140
CTRL 3.96 J/cm2 6.12 J/cm2
EC (%CTR
Scientific Papers Series Management, Economic Engineering in Agriculture and Rural Development Vol. 14, Issue 2, 2014 PRINT ISSN 2284-7995, E-ISSN 2285-3952
152
stages of cryopreservation. Moreover, at 100mm concentration, the live spermatozoa decreased significantly (P<0.05) compared with the control at any stage of cryopreservation. The highest percentage of live Buffalo spermatozoa was obtained at 40mm for glutamine at any storage period at 5 C, while, at room temperature was achieved in the presence of 40 and 60mm glutamine but, at concentration of 100mm significantly (P<0.05) reduced compared to the control. 3-Glutamine improved sperm abnormalities at all concentrations tested (20 to 100mm) and at any stage of cryopreservation (after equilibration and post-thawing process. 4-At concentrations of between 20 and 80mm, Glutamine significantly (P<0.05) decreased the sperm abnormalities compared with the control from 24 to 96 h of preserved at 5oC and at room temperature ( 18-20 C) from 24 to 48 h . 5-The percentage of Buffalo spermatozoa with an intact Acrosome after stage of equilibration, was significantly (P<0.05) lower in extenders [3] 6.Containing glutamine at concentration of between 20 and 80mm compared to the control extender, and also after freeze-thawing process the highest value were at 20 and 40mm glutamine. In preserved semen at 5 C the Acrosome integrity of semen supplemented with glutamine at concentration of 20, 40 and 60mm were significantly (P<0.05) higher than in the control-without glutamine and 100mm glutamine at any storage period. At room temperature, addition of glutamine to control extender from 20 to 60mM significantly (P<0.05) increased Acrosome integrity after 0 h and 24 h. 6-After dilution and equilibration, supplementation of glutamine at concentration of 40 and 60mm caused a significant increase in plasma membrane intact compared with control and all other concentrations tested. 7-Also, after freezing, the post-thaw plasma membrane integrity percentage was significantly (P<0.05) higher in 20, 40 and 60mm glutamine compared with control and other extenders. In cooling semen at 5 C, the rate damage of membrane integrity was
lowest in 60, 40 and 20mm respectively; while, glutamine at 100mm was ineffective and plasma membrane integrity was slightly lower than that in control. At room temperature, only 40 and 60mm glutamine significantly (P<0.05) improved intact plasma membrane when compared with the control. Effect of LDL and glutamine supplementation to the extender on frozen-thawed buffalo semen 1-The low concentrations of Glutamine used showed that 10mm, 20mm and 30mm glutamine +12% LDL were significantly (P < 0.05) better than 50mm or 60mm Glutamine and non significant with 40mm after 30 days of storage in LN. The highest percentage of post-thaw progressive motility was recorded in extender containing 20mm glutamine (68.33%). In preserved semen at 5 C at 24, 48, 72 and 96 h, the mean forward motility of Ram spermatozoa was highest (P < 0.05) due to addition of Glutamine at 10 and 20mm as compared to control and other Glutamine concentrations. The forward motility of buffalo spermatozoa diluted in 10mm and 20mm Glutamine. Was significantly (P < 0.05) higher than in the control at any storage period at room temperature, while, 60mm led to decrease sperm motility in comparison with the control [4]. 2-The post-thaw live spermatozoa and After 30 days of storage in liquid nitrogen, for 10 and 20mm glutamine were significantly (P < 0.05) higher compared with the other concentrations tested respectively). After 30 days of storage in liquid nitrogen, the post-thaw live spermatozoa for 10 and 20mm glutamine were significantly (P < 0.05) higher compared to the other concentrations. The highest live spermatozoa of ram-cooled semen at 5ºC was recorded for 10 and 20mm glutamine with 12% LDL at each of storage periods in comparison with control except 6mm Glutamine at 96 h, which it significantly (P < 0.05) decreased compared to the control. The addition of glutamine at concentrations 10, 20, 30, 40 and 50mm led to improve live spermatozoa compared to the control and 60mm Glutamine this difference was significant (P < 0.05) at 24, 48 and 72 h of storage.

Scientific Papers Series Management, Economic Engineering in Agriculture and Rural Development Vol. 14, Issue 2, 2014 PRINT ISSN 2284-7995, E-ISSN 2285-3952
153
3-The percentage of sperm abnormalities of ram spermatozoa slightly improved due to supplementation of glutamine at different concentration after dilution compared to the control, but differences were not significant. When compared to the control, only 10, 20 and 30mm glutamine + 12 % LDL significantly (P < 0.05) decreased sperm abnormalities of spermatozoa after equilibration and the lower value was observed in 10mm Glutamnie + 12% LDL. The highest sperm abnormalities of spermatozoa (P<0.05) were observed for 60mm Glutamine + 12% LDL compared with all medium tested after freeze-thawing process or following 30 days of storage in LN . It was observed that the addition of Glutamine at different concentrations led to reduce sperm abnormalities percentage in comparison to the control-without glutamine at each storage period at 5 C. At room temperature glutamine at 10 and 20mm significantly (P < 0.05) improved the percentage of sperm abnormalities at any storage time when compared to the control. 4-The highest number of Acrosome integrity of Buffalo spermatozoa, even if not significant, was obtained at 10 and 20mm Glutamine + 12% LDL after equilibration stage comparison with the control. The 20mm Glutamine + 12% LDL medium gave the highest (P < 0.05) number of Acrosome integrity of post-thawed Buffalo spermatozoa following freezing or 30 days of storage in LN in comparison with other media. The medium containing 10 and 20mm Glutamine +12% LDL provides the best protection of Acrosome integrity in comparison with other extenders tested at any stage of storage at cooling semen at 5 C and at room temperature (15 – 18 C). 5-After equilibration, glutamine at concentrations of 10 and 20mm gave the best rate of membrane integrity in comparison with the other concentrations tested. The 20mm glutamine +12% LDL gave the best percentage of post thawed plasma membrane integrity of frozen. Spermatozoa following thawing and 30 days of storage in LN in comparison with all other concentrations tested. At 5 C, the percentage of intact
plasma membrane in extenders containing 10mm and 20mm Glutamine+ 12% LDL was significantly (P < 0.05) higher compared with the control and other concentrations tested at any storage time. In addition, the percentage of membrane integrity in 60mm Glutamine +12% LDL was significantly lower (P < 0.05) than control at any storage time. At room temperature, the highest percent of intact plasma membrane for buffalo spermatozoa was at 20mm Glutamine +12 %LDL compared with other extenders tested and the effect of storage period on the membrane integrity was significant in all extenders used in the current study. Effects of Licorice Extract (Anti Oxidant) on Sperm Motility of Chilled Progressive motility Increased significantly (p < 0.01) in levels of licorice extract 1, 5, 10, 50 and 100 .g / ml in both diluters, during all storage periods. The means of progressive motility were 72.5 ± 1.02 %, 72.08 ± 1.05, 70.90 ± 2.05 % and 66.25 ± 3.15 % respectively, compared to the control (0) 61.45 ± 16.2 %. (fig1). Levels 1, 5 and 10 .g /ml were superior (p < 0.01) to levels 50 and 100 .g /ml (fig1). Diluter type had a significant effect (p < 0.01) on sperm motility. Overall the percentage of motile sperm in EYT diluter (66.48 ± 1.21 %) was higher than that in yolk-glucose citrate diluter (64.37± 1.44 %). Sperm motility tended to decline significantly (p < 0.01) as the length of storage period increased. The means of progressive motility were 80.00 ± 2.04 % after dilution (0h), 68.75 ±3.15 % 61.25 ± 4.27% and 50.62 ±4.61 %, at 24, 48 and 72 h after cooling, respectively [11] and [22]. Cysteine effect on the ultra-structure of the ram sperm cell within the freezing- thawing dynamics The ultra-structure of freeze-thaw spermatozoa in Tris medium Generally, all the head sections have membranes with corrugations; sometimes they are excessively bloated and only a percentage of 37.2% of the cells have at their head unlysate plasmatic membranes (fig. 1 and 2). In some areas small vacuoles appear under the internal double membrane (fig. 1). The Acrosome has an intact structure at 42%

Scientific Papers Series Management, Economic Engineering in Agriculture and Rural Development Vol. 14, Issue 2, 2014 PRINT ISSN 2284-7995, E-ISSN 2285-3952
154
of the cells, and the Acrosome external membrane is generally, unaffected. At the flagellum, the plasmatic membrane has a jigsaw aspect and it is partial detached or is completely broken (Photo 2 and 3). In the intermediate piece, the mitochondria has a normal appearance.
Photo 1. Head sagittal section (x11500) Ram form the meat line, Tris media
Photo 2. Ram sperm cells frozen into the Tris medium (x11500) Head Sagittal section; the Acrosome contain an Acrosome matrix with electronodens layout Where one may see the “puncher” (apical ridge) Cross section of the intermediate piece, the Mitochondria are unaffected.
Photo 3. Cross section through sperm cells
One may observe only small parts of the plasmatic membrane through sperm cells of the intermediate and final piece, frozen into the Tris medium.
Photo 4. Cross section of the intermediate piece (x29000)
Photo 5. Ram sperm cells freeze into the Tris medium-Cysteine (x5400)
57% of the cells have an intact Acrosome.

Scientific Papers Series Management, Economic Engineering in Agriculture and Rural Development Vol. 14, Issue 2, 2014 PRINT ISSN 2284-7995, E-ISSN 2285-3952
155
Photo 6. Ram sperm cells freeze into Tris medium- cysteine (X 23500)
Cross section at the middle piece and through Acrosome at ram. The plasmatic membrane has small vacuolations without interruptions.
Photo 7. Ram sperm cells freeze into the Tris medium- cysteine, (x23500)
Longitudinal section of the intermediate and main pieces The plasmatic membrane is attached to internal structures. Mitochondria and axoneme are not changed. During the cryopreservation process the spermatozoa have ultra-structural changes (of plasmatic, mitochondrial, Acrosome), biochemical and functional [24]. The damages can occur in any stage of the process, but to a bigger extent during cooling periods at 0oC and in the thaw case and less, during storage -180°C. The structures and sperm organelles respond differently to osmotic or environment temperature changes in process’ diverse stages. Ultra-structural deteriorations are accompanied by biochemical changes or even by the loss of cell’s vital content. The plasmatic membrane integrity and the
mitochondrial function are the main characteristics of a spermatozoon to fertilize an ovule. The deterioration of plasmatic membrane and the mitochondrial function may lead to membrane destabilization and impairment of mitochondrial and energetic metabolism, as well as the one of cell’s viability [7]. After freeze-thaw process one may observe filament mitochondrial alterations and in a lower percentage in the axoneme, filaments and flogging fibrils. However the main target of damages caused by cryopreservation is the spermatozoa plasmatic membrane. Because of the temperature’s variation and the osmolarity, both the 7 freezing and thawing induce alternations in the cells volume of water, generating a huge mechanical stress onto the cell membranes [8]. Since only spermatozoa with intact membranes may suffer empowerment and Acrosome reaction, it is very important to know the type and the place of changes to optimize the freezing technologies. The plasmatic membrane surrounds the whole sperm cell and it has the role to protect the cell organelles, and by semi-permeability properties it maintains ions chemical gradient and other soluble components. Specific membrane proteins facilitate the transport of glucose and fructose from the extracellular medium into the cell. These transporters are essential in providing energetic substrates because into the mature spermatozoid 90% of the ATP is provided by glycolysis (anaerobe). If the plasmatic membrane is non functional, the sperm is considered to be damaged because in vivo it is not capable to fertilize. For mammals, the sperm cell membrane has particular lipids content, different from the one of other cells. It has high levels of phospholipids, sterols, saturated and unsaturated fatty acids, plasmalogens and sphingomyelins. This specific structure is responsible for the fluidity, flexibility and functionality ability of sperm cell. An important role in ensuring fluidity and regulating spermatogenesis is the one of the polyunsaturated fatty acids have [1]. Spermatozoa’s plasmatic membrane has a heterogeneous structure, in 5 specific fields:

Scientific Papers Series Management, Economic Engineering in Agriculture and Rural Development Vol. 14, Issue 2, 2014 PRINT ISSN 2284-7995, E-ISSN 2285-3952
156
Acrosome, equatorial segment, basal segment, intermediate piece and the final one. The differences between these regions are related to different physiological functions. Before and after semen the plasmatic membrane suffers some changes regarding the lipids integrity, the modification in the fatty acids degree of saturation and the loss of cholesterol from its composition, which leads to a marked decrease of cholesterol/ phospholipids report. Different regions of membranes are different concerning this report. Cholesterol content of membranes is not different only between species, but also between ejaculates of the same individual, [5]. These differences are the basis of some different capacity processes regarding the fertility and suitability for freezing a male ejaculates. Microscopic examination of ram sperm labeled with a membrane integrity mark demonstrated that exposure to low temperatures followed by heating, affect in different ways the plasmatic membrane, especially the middle piece and the head’s one [7]. Ultra-structural analysis results show that the head’s plasma membranes are more affected the flagellum ones. While one may identify several cytoskeleton proteins, their role in maintaining 8 the integrity of plasmatic membrane remains unclear. In our ultra-structural evaluation studies of the ram sperm cells membranes we obtained similar results, on the head membrane being recorded more cells with damaged membranes. Also, the research shows that the Acrosome is less affected, although the plasmatic membrane surrounding the spermatozoid’s head has major detachments, vacuolation and even interruptions. Similar results were found [5] that, the plasmatic membrane surrounding the sperm head is considerably more labile than the flagellum’s one, and the external Acrosome membrane is more vulnerable than the domestic one. CONCLUSIONS The effect of irradiation on biochemical parameters of samples was evaluated by measuring the activity of cytochrome oxidase
(COX) and the energetic charge. Freezing- thawing leads to plasma membrane alterations including rupture, especially at head level, and membrane detachment or vacuolation at head or flagellum part [25], [26] and [27]. Results regarding the damage degree of plasmatic membrane after freezing-thawing process in different environments with addition of antioxidants are similar when cells were frozen in Tris medium and with addition of cysteine as antioxidant. The analysis of micro photography shows that the Acrosomes were partially affected by the freezing-thawing process. Although many cells have a swollen Acrosome, the internal Acrosome membrane is intact. The plasmatic membrane has several degenerative changes at head in comparison with the flagellum [18]. REFERENCES [1]Alvarez, J.G., Storey, B.T., 1993, Evidence that membrane stress contributes more than lipid peroxidation to sublethal cryo damage in cryopreserved human sperm: glycerol and other polyols as sole cryo protectant, Journal of Andrology 14(3):199-209 [2]Baril, G., Chemineau,, P., Vallet, J.C., 1993, Manuel de formation pour l' insemination artificielle chez les ovins et les caprines, FAO Paper [3]Celeghini, E.C.C., Arruda, R.P.D., Andrade, A.F.C.D., Nascimento, J., Raphael, C.F., Roderigues, 2008, P.H.M., 20 Effects that bovine sperm cryopreservation using two different extenders has on sperm membranes and chromatin. Anim. Reprod. Sci. 104, 119-131 [4]El Shamaa, I.S., Metwally, A.M., Ibrahim, M.A., Abd El Razek, I.M., El Saidy, B.E., Al Gindy, M.E., 2008, Effect of Sephadex Filtration of Ram Semen on its Freezability and Fertitilty, Proceedings of the 16 th International Congress on Animal Reproduction. Budapest Hungary 13-17 July, 2008 [5]Gadella, B.M, Flesch, F.M., Van Golde, L.M., Colenbrander, B, 1999, Dynamics in the membrane organization of the mammalian sperm cell and functionality in fertilization, The veterinary quarterly, 21(4):142-146 [6]Gill, J., Lundeheim, N., Soderquist, L., Rodriguez-Martinez, H., 2003, Influence of extender, temperature, and addition of glycerol on post-thaw spermatozoa parameters in ram semen. Theriogenology a, 59, 1241-1255. [7]Holt, W.V., North, R.D., 1994, Effects of Temperature and Restoration of Osmotic Equilibrium during Thawing on the Induction of Plasma Membrane Damage in Cryopreserved Ram Spermatozoa, Biology Of Reproduction , 51: 414-424

Scientific Papers Series Management, Economic Engineering in Agriculture and Rural Development Vol. 14, Issue 2, 2014 PRINT ISSN 2284-7995, E-ISSN 2285-3952
157
[8]Hammerstedt, R.H., Graham, J.K., Nolan, J.P., 1990, Cryopreservation of mammalian sperm: what we ask them to survive, Journal of Andrology, 11(1):73–88 [9]Iaffaldano, N., Meluzzi, A., Manchisi, A., Passarella, S. 2005, Improvement of stored turkey semen quality as a result of He-Ne laser irradiation. Animal Reproduction Science 85 (3-4) , pp. 317-325 [10]Iaffaldano, N., Rosato, M.P., Paventi, G., Pizzuto, R., Gambacorta, M., Manchisi, A., Passarella, 2010, The irradiation of rabbit sperm cells with He-Ne laser prevents their in vitro liquid storage dependent damage. Animal Reproduction Science 119 (1-2) , pp. 123-129 [11]Al- Haitham, 2010, Effects of Licorice Extract on Sperm Motility of Chilled Stored Ram Semen J. For pure & Appl. Sci. Vol.23 [12]Ibrahim, M.A,R, L. Kovacs, 1982, Effects of deep-freezing of boar sperm. Acta Veterinaria Hungarica, 30/4/243-252 [13]Ibrahim, M.A.R, Gobr, M.G., Sallam, A.A., 1997, The improvement success of crossbreeding between Ossimi and Finnish landrace lambs on some productive performance 48th Annual Meeting of the European Association of Animal Production, Vienna, Austria. [14]Ibrahim, M.A.R, 1982, Studies of detecting the morphological alteration, defective Acrosomes and heads of Bulls spermatozoa VIIth Int. Cong. Mexico City. [15]El-Sharawy, M., Salam A.A, Ibrahim, M.A.R., El-Shamaa, I.S,, 2012, Impact of zinc methionine and zinc oxide on enzymes and quality of ram semen, Egyptian J. Nutrition and feeds, 15 (1) special issue: 59-66, 2012 [16] El-sharawy M., El-shamaa I, Ibrahim, M.A.R, El-shenawy El-seify, 2012, Using of Low Density Lipoproteins and Glutamine to Improve Frozen Buffalo Bull Semen and Fertility, 17th International Congress on Animal Reproduction, to be held in Vancouver, BC from July 29 to August 2 [17]Ibrahim, M.A.R, 2013, Studies on improving local sheep breeds fertility in Egypt. Romania, Bucharest, Agriculture for life and life for Agriculture Conference. [18]Nagy, J., Jansen, J., Topper, E.K., Gadella, B.M., 2008, A triple-stain flow cytometric method to assess plasma and Acrosome membrane integrity of cryopreserved bovine sperm immediately after thawing in presence of egg yolk particles. Biol. Reprod. 68, 1828-1835. Oxidation. Free Radic. Bio. Med., 23:302-313 [19]Pesch, S., Hoffmann, B., 2007, Cryopreservation of Spermatozoa in Veterinary Medicine, Journal für Reproduktionsmedizin und Endokrinologie, 4 (2):101-105 [20]Rao, B., Soufir, J.C., Martin, M., David, G., 1989, Lipid oxidation in human spermatozoa as related to midpiece abnormalities and motility, Gamete Res, 1989, 24: 127-34 [21]Re, R., Pellegrini, R., Proteggente, A., Pann, Yang, M, Rice-Evans, C., 1999, Antioxidant Activity Applying Improved year ABTS radical cation decolorization assay, Free Rad Biol Med 1999, 26:1231-37
[22]Vaya, J., Belinky, P.A, Aviram, M., 1997, Antioxidant constituents from licorice roots: isolation, structure elucidation and antioxidatives capacity toward [23]Zamfirescu, S., Şonea, A., 2004, Reproduction biotechnologies in small ruminants (Biotehnologii de reproducţie la rumegatoarele mici), Ed Ex Ponto, Constanţa [24]Zamfirescu, S., Caloianu, M., 2000, Changes in structure of plasmalema in ram sperm cells upon cryo treatment, Vol. Abstracte Primul Congres de Biologie Celulară şi Moleculară, Iaşi, pp. 35 [25]Zamfirescu, S., Ciupina, V., Nadolu, D., 2001, Using the hypo-osmotic test for assessing the functional integrity of ram spermatozoa membrane after the freezing- thawing process. Buletinul SNBC, 29: 248 [26]Zamfirescu, S, Nadolu, D., Ciupină, V., Coprean, D., 2003, The biochemical and electron microscopic research of ram semen before and after freezing various extenders, National Congress of Biotechnology (Biotechnology present and outlook in the third millennium), Abstract of paper: pp.23 [27]Zamfirescu, S., Anghel, A, 2010, Researches regarding the ultra-structural modifications of sperm cells before and after freezing in different media, Lucrări ştiinţifice, Seria Zootehnie, 53 (15):67-74

Scientific Papers Series Management, Economic Engineering in Agriculture and Rural Development Vol. 14, Issue 2, 2014 PRINT ISSN 2284-7995, E-ISSN 2285-3952
158

Scientific Papers Series Management, Economic Engineering in Agriculture and Rural Development Vol. 14, Issue 2, 2014 PRINT ISSN 2284-7995, E-ISSN 2285-3952
159
CONSERVATIVE CULTIVATION TECHNOLOGIES – A NEW CHALLENGE FOR THE AGRICULTURE OF THE REPUBLIC OF MOLDOVA Anatolie IGNAT, Victor MOROZ National Institute for Economic Research, 45 Ion Creangă str., MD 2064, Chisinau, Republic of Moldova, Phone: +(37322) 501119, Fax: +(37322) 743794, Email: [email protected], [email protected] Corresponding author: [email protected] Abstract The agriculture of the Republic of Moldova is particularly prone to natural risks, especially droughts. The purpose of this paper is to present the state of sustainable development of the agricultural sector and opportunities for implementation of the innovative land cultivation technologies. There are a number of socio-economic constraints for increasing the productivity in the traditional agricultural systems. In order to meet the growing competition on the regional markets of agricultural products, modernization of agriculture in the Republic of Moldova is very important. For investigation of the actual state of implementation of the conservative land cultivation technologies were used specific methods and techniques such as statistical and economic analysis of economic indicators, case study approach, semi-structured interviews of agricultural producers. The study is also based on the statistics received from the National Bureau of Statistics and the Ministry of Agriculture and Food Industry of Moldova. Economic analysis confirms that implementation of the No Till technology will reduce essentially the direct production costs compared to traditional technology. However a more visible effect occurs starting with the 5-6 year of the conservative land cultivation technologies’ implementation. Key words: climate change, conservative agriculture, no-till technologies INTRODUCTION Recent approaches to agricultural development, including food production and food security, have largely failed to reduce the absolute numbers of the food insecure or to ensure environmental sustainability. From other side the community of farmers is more and more concerned regarding production respecting the environment, and they are changing some of their ways of production choosing more environmental friendly systems and technologies (Marta-Costa and Silva, 2013, Pretty et al., 1996). In the Republic of Moldova the conservative agriculture is practiced by a limited number of agricultural farms. Among most experienced one can mention “Civea Agro”, Edinet, that is involved in conservative agriculture since 2002. The largest area is cultivated under No-till technologies by the agricultural company “We trade” that use it since 2010. Another large agricultural company that practices conservative agriculture is the “Kelly Grains” (Jigau, 2011).
More recently four demonstration plots were implemented in different regions of the country in order to further promote de development of the conservative agriculture in the Republic of Moldova. This article provides a description of the implementation of the conservative agriculture technologies in the Republic of Moldova and Ukraine, comparative analysis of the conventional and conservative agricultural systems and results of discussions with the key stakeholders on the most recent evolutions in the farm modernization. MATERIALS AND METHODS In order to present the state of sustainable development of the agricultural sector and opportunities for implementation of the conservative land cultivation technologies in the Republic of Moldova and neighboring countries, the following research methods were used, such as: time series, analysis of the economic indicators, methods of comparative analysis and the case study approach. The

Scientific Papers Series Management, Economic Engineering in Agriculture and Rural Development Vol. 14, Issue 2, 2014 PRINT ISSN 2284-7995, E-ISSN 2285-3952
160
quantitative methods of data analysis were completed with qualitative methods such as focus group discussions and interviews with key stake holders from the Republic of Moldova. Participatory approach was used in order to take into account different perceptions and views of the problem. For the analysis were used data provided by the Ministry of Agriculture and Food Industry, National Bureau of Statistics, and also data presented by private agricultural companies from the Republic of Moldova and Ukraine. RESULTS AND DISCUSSIONS As mentioned by Northern Territory Government, Australia (2014), "Conservation farming is any system or practice which aims to conserve soil and water by using surface cover (mulch) to minimize runoff and erosion and improve the conditions for plant establishment and growth. It involves planting crops and pastures directly into land which is protected by a mulch using minimum or no-tillage techniques". According to authors such as (Basch et al., 2012), the major contribution to enhancing farm incomes and competitiveness in the future must be attained through: (i) a reduction of production factor inputs and costs, i.e. an improved efficiency of the resources used, and (ii) an improvement of the quality of the resource base that can maintain or improve farm output and also harness a range of environmental services needed by the society. Both outcomes are achievable concomitantly only through farming practices based on an alternate paradigm that enhances soil quality and its productive capacity, while maintaining or improving yield levels at reduced input levels. In conditions of the Republic of Moldova a competitive commercial agriculture can be developed only with the condition of the mechanization of agricultural works. For the mechanized farmer, the concept of a conservative agriculture implies the need to
have access to more specific and, as rule, more expensive equipment. This equipment encompasses but is not limited to seed drills, fertilizer applicators, some other sophisticated equipment and harvesters. In other circumstances the additional tillage equipment such as subsoiler, a chisel plough, and other implements, depending on the type of soil and the climate is needed. The information collected from discussions with agricultural producers revealed that the necessity in such equipment is rather limited during the agricultural year, but also much of this equipment will not even need to be used every year. This implies that farmers will have a very high level of investment tied up in his machinery. That creates one of the major barriers in implementation of the conservation technologies. These changes are important and above all, expensive and risky for the farmer. Without specific financial and technical assistance and other incentives, it will be difficult to initiate the process of transfer from conventional to conservation agriculture. That is why it is expected that farmers will change their production and soil management systems practiced for many years only gradually, and according to their priorities. The farm size and the level of production have a great impact over the implementation of the conservative agriculture technologies due to the fact that they require large initial investments in machinery and so are not feasible for small scale farmers with low levels of income. Possibilities to successfully introduce new production systems are reduced also due to the shortage of economic resources, difficulties in obtaining necessary inputs and low crop prices. Another problem is access to credits and other financial resources. The possibility to introduce conservative technologies is influenced by the marketing opportunities for the cultivated crop. The availability and costs of the qualified labor force will influence also the selection and profitability of production and soil management systems.

Scientific Papers Series Management, Economic Engineering in Agriculture and Rural Development Vol. 14, Issue 2, 2014 PRINT ISSN 2284-7995, E-ISSN 2285-3952
161
Farmer organizations could play an important role in agricultural modernization and implementation of the conservative technologies through access to technical assistance, and technical services provided to the members. In case of the Republic of Moldova land tenure problems are among the most difficult to overcome and have a considerable influence on the soil management systems. The main reason of this is that land rent contracts are concluded for a period of 3-5 years that is not sufficient in case of conservative cultivation technologies because they yield benefits only over the long period of time. Agriculture is the sector of the national economy with the highest exposure and vulnerability to natural risks and climate change. The main factor that determines the amount, the quality and stability of the agricultural production in the Republic of Moldova are the agricultural and climate conditions of the territory, particularly the lack or surplus of humidity, largely conditioned by the current climate changes. Short-term droughts have transformed in some places in a dangerous phenomenon and became almost chronic. At the same time, every 2-3 years, agriculture becomes a subject of intense droughts, which cover almost the entire territory of the Republic of Moldova. In such a way, the damage of the drought from 2007 that affected agriculture can be estimated, according to some sources, between 600 million USD to 1 billion USD. The negative effect of the drought from 2012 has been recorded during the whole vegetation period (Ministry of Agriculture and Food Industry of the Republic of Moldova, 2012). Recent trends of the global agricultural production in Republic of Moldova are characterized by high fluctuations of the global agricultural product, depending first of all to changing climate and weather conditions (Fig. 1).
77,6
138,3
105,0
107,9
90,8
132,1
76,9
98,9
70
90
110
130
2006 2007 2008 2009 2010 2011 2012 2013
Fig. 1. Index of the Global Agricultural Product (previous year=100) Quite unfavorable climatic conditions in recent years caused considerable losses to many farmers all over the country (see table 1). Table 1. The average yield per hectare and variation coefficient for selected agricultural crops, 1981-2011, quintals Agricultural crops
1981-1990 1991-2000 2001-2011AVG
(q) Var. coef.
AVG (q)
Var. coef.
AVG (q)
Var. coef.
Wheat 35,9 12,8 28,5 24,7 22,5 32,8 Corn 37,7 16,7 31,3 27,0 28,0 26,4 Sun flower 19,0 10,5 11,7 15,1 12,7 20,2 Grapes 63,6 22,6 40,3 30,9 41,7 15,4 Vegetables 157,1 5,8 85,7 23,4 86,4 18,3 Source: own calculation on the basis of data from National Bureau of Statistics, 2014
The biggest problem in this regard is the shortage of rainfalls which are very uneven distributed during the agricultural year. Another problem for Moldovan agriculture as well as in other countries is the high temperatures during the agricultural year, which in recent years exceeded the annual average with 3-4 CO (Jigau, 2011). Besides of these, increasing prices for fuel and other agricultural inputs is another challenge faced by agricultural producers. From this point of view, farming systems are faced with a double challenge to be successful: socio-economic performance has to be maximized, while environment and natural resources need to be protected in order to assure the sustainable growth of the agricultural production. Adoption and implementation of soil conservation technologies are followed by three major economic benefits, namely: a) saving time and thereby reducing the needs in labor force, b) reducing costs for fuel, holding and maintaining the technology and farm

Scientific Papers Series Management, Economic Engineering in Agriculture and Rural Development Vol. 14, Issue 2, 2014 PRINT ISSN 2284-7995, E-ISSN 2285-3952
162
equipment and for labor, and c) higher efficiency in the sense of higher yields with lower costs. Analysis of data collected from the agricultural company “Agro-Soyuz”, Ukraine, shows that during the period of 15 years since the implementation of conservative agricultures started, the consumption of diesel fuel per hectare of cultivated land was reduced by almost 5 times (Fig. 2). In the same time the yield of agricultural crops shows a steady increase during the same period despite of changing climate conditions. Thus comparing with the average yield in other agricultural farms from this region the average yield of wheat in the agricultural company “Agro-Soyuz” was more than twice higher (Fig. 3).
0
1
2
3
4
5
6
7
1996 1997 19981999 20002001 2002 20032004 2005 20062007 20082009 2010 2011
Tonns/ha
AgroSoiuz Average per region
Fig. 3. Comparative yield of winter wheat in the agricultural company, Agro-Soyuz, Ukraine and average per region, 1996-2011, tons per ha. However it is worth to mention that this difference is increasing specially during the most recent years, when long term effects from the implementation of the No-till technologies became more evident.
Analysis of the economic indicators from this company shows an increase in labor productivity for field crops, that being associated with less consume of labor force, fuel, and other expenditures gives strong arguments for implementation of these technologies in other regions with similar conditions. Moreover, another positive indicator is the increase of the humus content in fields of this company (Table 2). Table 2. Economic results for field crops in the agricultural company “Agro-Soyuz”, 1998-2011 Indicators 1998 2001 2007 2011
Labor productivity, $/man/hour 25 37 57 204Consume of labor force per 1 ha, man/hour
29 16 4,5 4,4
Consume of diesel fuel, kg/ha 83 44 18,9 18Expenditures for spare parts and reparations, $/ha
32 24 17,5 14
Depreciation, $/ha 105 76 58 46
Humus content in soil , % 4,41 4,48 4,51 4,54Source: Agro-Soyuz Holding, 2014
Comparing differences in cost structures for conventional and No-till technologies one can see the significant reduction of costs for fuel and lubricants, depreciation, spare parts and reparations, while costs for seeds, fertilizers and plant protection means has increased (Table 3). Table 3. Cost differences between conventional and no-till technologies in the agricultural company, Agro-Soyuz, 2011 Technologies
Conventional
No till
Difference
Fuel and lubricants, $/ha 72 24 48 Depreciation, $/ha 60 45 15 Spare parts and reparations, $/ha 22 10 12 Seeds, $/ha 20 40 -20 Fertilizers, $/ha 10 20 -10 Plant protection, $/ha 5 20 -15 Total costs per ha, $/ha 189 159 30Number of technological operations 13 3 10Source: Agro-Soyuz Holding, 2014
Implementation of the conservative agriculture technologies in the Republic of Moldova The legal framework for the practice of conservation agriculture in the Republic of Moldova is provided by the Government Decision no. 1157 from 03.10.2008 regarding the approval of the Technical Regulation "Measures of soil protection in agricultural
93
83
6458
4438
33 3024
19 19 19 19
0
10
20
30
40
50
60
70
80
90
100
1997 1998 1999 2000 2001 2002 2003 2004 2005 2006 2007 2008 2011
Kg / ha
Fig. 2. Diesel fuel consumption in the agricultural
company “Agro-Soyuz”, Ukraine, 1997-2011, kg/ha

Scientific Papers Series Management, Economic Engineering in Agriculture and Rural Development Vol. 14, Issue 2, 2014 PRINT ISSN 2284-7995, E-ISSN 2285-3952
163
practices", published in the Official Monitor Nr. 193-194, Article No. 1195 of 28.10.2008. This regulation foresees the use of such measures to prevent the degradation and restore the soil structure as: -priority practicing of the minimal soil tillage system, which consists in the plowing once in 4-5 years and reduction of the mechanical pressure on the soil during the growing season; -practicing of the varied crop rotation, with the long term crop rotation (5-7 years), which include improvement crops such as perennial grasses and legumes; -applying annual crop rotation and incorporation of the fresh organic matter in order to ensure a positive balance of humus and enhance the activities of living organisms in the soil; -using low pressure tires and tires with large width, which increases the area of contact with the ground; -covering irrigated area with crop residues, manure, sawdust and other organic material of natural origin harmless to the soil and the environment; Thus all these stipulations present the important elements of the conservative agriculture. Agriculture results during the last years, when droughts and other climate risks seriously affected the agri-food production demonstrated clearly the need to shift from the conventional system of land cultivation to the conservative techniques. The Ministry of Agriculture and Food Industry of the Republic of Moldova recognized this problem as one of a major importance and established as a major objective the promotion and implementation of conservative tillage technologies. To achieve these objectives under the direct support the Rural Financial Services and Agribusiness Development Project (PSFRDBA) financed by the International Fund for Agriculture Development (IFAD) in 2012 was planned to set up several demonstration plots in agricultural companies located allover the country. Based on these demonstration plots during the period of 2013-2015 have been implementing
in field conditions, minimum soil processing technologies. Experience from these demo plots have been used to train a local team of experts that disseminates it through other agricultural companies. In the framework of this project were carried out such activities as: -Economic analysis of agricultural activities on demonstration plots during the agricultural year; -Analysis of the effectiveness of the production capacity utilization; -Analysis of the effectiveness of utilization of plant protection means and fertilizers; -Developing methods and descriptions of primary evidence of expenses incurred during the agricultural year and training of the beneficiaries of demonstration plots in keeping track of expenses. -Monitoring economic indicators from business plans for each demonstration plot separately; -Dissemination of the results obtained through seminars, roundtables, media, conferences, scientific publications, etc. As a result of implementation of this project under the auspices of the Consolidated Implementation Unite of the IFAD Program in the Republic of Moldova have been created four demonstration plots in Edinet, Făleşti, Orhei and Cantemir regions with a total area of 350 hectares for a period of three years. Experience gained from these demonstration plots is used for training and promotion of modern conservative land cultivation technologies. Despite the limited period of the project implementation and scarce data collected from agricultural companies involved in the project one can mention the increase of the yield of field crops in selected agricultural farms. Discussions with farmers revealed that conservative soil cultivation technologies have several economic advantages the main of which are: -Reduced soil erosion and improved soil fertility -Improved water infiltration, moisture efficiency and lower soil temperatures -Reduction of costs

Scientific Papers Series Management, Economic Engineering in Agriculture and Rural Development Vol. 14, Issue 2, 2014 PRINT ISSN 2284-7995, E-ISSN 2285-3952
164
-Reduction of the number of agricultural works -Increasing the wage of employees without increasing the payroll -Increase and stabilize the crop yields In the same time they mentioned a range of specific disadvantages of the conservative agriculture technologies, the most specific being the followings: -Implementation of the conservative land cultivation technologies requires a set of specific agricultural machinery and equipment that essentially differs from those used in conventional agriculture; -The high costs of the specific agricultural machinery and equipment; The period necessary to obtain visible results out of the implementation of the No-till technologies is pretty long, e.g in case of the “Agro-Soyuz” it was 5-6 years; -The increased consume of herbicides during the yearly phase of the conservative technologies implementation and necessity in specific filed crop varieties resistant to high dosage of herbicides; -The conservative soil cultivation technologies are more appropriate to be implemented in large scale agricultural companies with an acreage larger than 1000 ha and which are specialized predominately in cultivation of filed crops. CONCLUSIONS As main conclusion one can state the necessity of new approaches in assuring the sustainable development of crop production. Their importance is obvious in conditions of increasing instability in the agriculture production of the Republic of Moldova. Conservative agriculture technologies could be a real opportunity for natural risk alleviation. However implementation of these technologies requires a set of sustained activities, namely: Promoting sustainable agriculture and resource-conserving technologies and practices; Supporting implementation of the national policies and strategies for conservative agriculture;
Implementation of the conservative agriculture requires longer term planning and commitment to sustainability; Conservative agriculture needs more specific and deep skills in soil management and crop protection; It also requires more active information campaign in rural communities about opportunities offered by conservative agriculture; Supporting land consolidation in order to assure larger areas for implementation of the conservative agriculture technologies. REFERENCES [1]Agro-Soyuz Holding, 2014, Official Web page. Accessed: http://www.agrosoyuz.com/en/holding/ [2]Basch, G. et al., 2012, Making sustainable agriculture real in CAP 2020. The role of conservation agriculture, The European Conservation Agriculture Federation (ECAF) [3]Jigau, G., 2011, Sistemul agricol conservativ. Situaţia la zi şi condiţii de implementare. IFAD, Chişinău [4]Marta-Costa, A. A., Silva, E. eds., 2013, Methods and Procedures for Building Sustainable Farming Systems. Application in the European Context, Springer, Dordrecht [5]Ministry of Agriculture and Food Industry of the Republic of Moldova, 2012, Comprehensive assessment to evaluate the impact of the 2012 drought in Moldova. Accessed: www.maia.gov.md [6]National Bureau of Statistics, 2014, Official data base “Statbank”. Accessed: http://statbank.statistica.md/pxweb/Database/RO/databasetree.asp [7]Northern Territory Government, Australia, 2014. Official Web page. Accessed: http://www.nt.gov.au/ [8]Pretty, J.N., Thompson, J., Hinchclieffe, F., 1996, Sustainable Agriculture: Impacts on Food Production and Challenges for Food Security. International Institute for Environment and Development
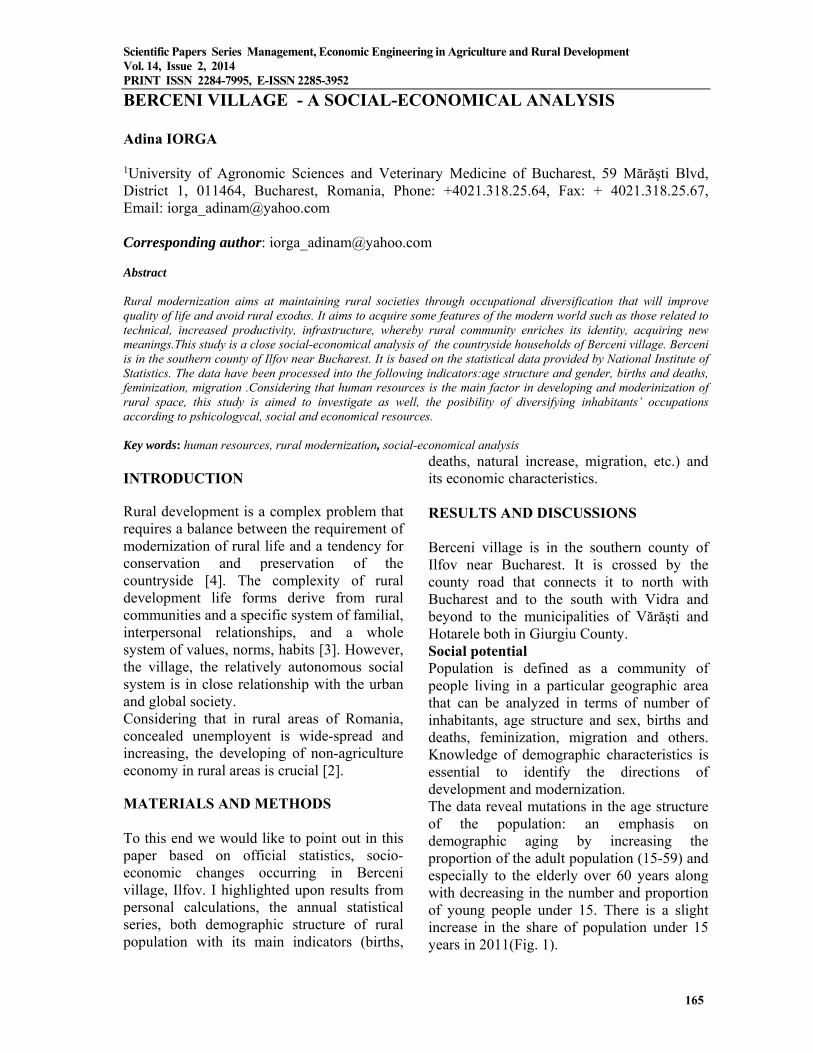
Scientific Papers Series Management, Economic Engineering in Agriculture and Rural Development Vol. 14, Issue 2, 2014 PRINT ISSN 2284-7995, E-ISSN 2285-3952
165
BERCENI VILLAGE - A SOCIAL-ECONOMICAL ANALYSIS
Adina IORGA 1University of Agronomic Sciences and Veterinary Medicine of Bucharest, 59 Mărăşti Blvd, District 1, 011464, Bucharest, Romania, Phone: +4021.318.25.64, Fax: + 4021.318.25.67, Email: [email protected] Corresponding author: [email protected] Abstract Rural modernization aims at maintaining rural societies through occupational diversification that will improve quality of life and avoid rural exodus. It aims to acquire some features of the modern world such as those related to technical, increased productivity, infrastructure, whereby rural community enriches its identity, acquiring new meanings.This study is a close social-economical analysis of the countryside households of Berceni village. Berceni is in the southern county of Ilfov near Bucharest. It is based on the statistical data provided by National Institute of Statistics. The data have been processed into the following indicators:age structure and gender, births and deaths, feminization, migration .Considering that human resources is the main factor in developing and moderinization of rural space, this study is aimed to investigate as well, the posibility of diversifying inhabitants’ occupations according to pshicologycal, social and economical resources. Key words: human resources, rural modernization, social-economical analysis INTRODUCTION Rural development is a complex problem that requires a balance between the requirement of modernization of rural life and a tendency for conservation and preservation of the countryside [4]. The complexity of rural development life forms derive from rural communities and a specific system of familial, interpersonal relationships, and a whole system of values, norms, habits [3]. However, the village, the relatively autonomous social system is in close relationship with the urban and global society. Considering that in rural areas of Romania, concealed unemployent is wide-spread and increasing, the developing of non-agriculture economy in rural areas is crucial [2]. MATERIALS AND METHODS To this end we would like to point out in this paper based on official statistics, socio-economic changes occurring in Berceni village, Ilfov. I highlighted upon results from personal calculations, the annual statistical series, both demographic structure of rural population with its main indicators (births,
deaths, natural increase, migration, etc.) and its economic characteristics. RESULTS AND DISCUSSIONS Berceni village is in the southern county of Ilfov near Bucharest. It is crossed by the county road that connects it to north with Bucharest and to the south with Vidra and beyond to the municipalities of Vărăşti and Hotarele both in Giurgiu County. Social potential Population is defined as a community of people living in a particular geographic area that can be analyzed in terms of number of inhabitants, age structure and sex, births and deaths, feminization, migration and others. Knowledge of demographic characteristics is essential to identify the directions of development and modernization. The data reveal mutations in the age structure of the population: an emphasis on demographic aging by increasing the proportion of the adult population (15-59) and especially to the elderly over 60 years along with decreasing in the number and proportion of young people under 15. There is a slight increase in the share of population under 15 years in 2011(Fig. 1).

Scientific Papers Series Management, Economic Engineering in Agriculture and Rural Development Vol. 14, Issue 2, 2014 PRINT ISSN 2284-7995, E-ISSN 2285-3952
166
Fig.1. Structure of Berceni village population by age groups, in the period 2007-2011 Gender structure. Percentage of female population in the population structure Gender structure of the population in 2007-2011 shows an increase in the proportion of the female population in the total population of Berceni village, which shows the feminization of rural population. Demographic structure is marked by the aging of the female population (overall the 60 years and over population reached 30% in 2011) (Fig. 2).
Fig. 2. Gender structure of population, in the period 2007-2011 Factors of of human resources dynamics 1.Birth rate Birth rate of a population or subpopulation characterizes the set of live births in a given human collectivity. In 1997 there was recorded a minimum rate (4.65% o), while the period 2007-2012 shows a steady increase of it (Fig. 3).
2. Mortality rate Gross mortality rate is calculated by dividing the set of deaths occurred in population considered during a calendar year, to the average number of population. Year 1996 marks the maximum mortality rate of 27.23% o. In the period 2006-2011 there has been a sharp decline in it. The natural increase in the
period is negative, with a slight recovery in 2012 (- 1.89% o) (Fig. 4).
Fig.3. Gross mortality rate in the period 1990-2011
Fig.4. Gross mortality rate in the period 1990-2011 Migration An extremely important factor for configuration of human resources in Berceni village, migration has seen large swings in the last 22 years. Migration of rural population to urban areas (Bucharest) has implications for gender and age structure of the population left to live and work in rural areas. It appears that migration flows of individuals who changed residence occurred after 1990 with different intensities. Although the flow of rural to urban migration has been the main direction of migration after 1992 is an increase in the flow of residence changes favored by measures over land ownership. This phenomenon is positive in the short term, for the purposes of disposal of urban space by massive unjustified inputs. In the long term, however, the effects can be contrary to the negative impact on revitalizing farms. The explanation is that there is a large labor force, not skilled enough, with outdated technical equipment and household size, far from optimal, are too small to be performing to the parameters close to those from Western

Scientific Papers Series Management, Economic Engineering in Agriculture and Rural Development Vol. 14, Issue 2, 2014 PRINT ISSN 2284-7995, E-ISSN 2285-3952
167
Europe [1]. Migration to Berceni village was done, especially after 2006 more for residential than for productive purposes (Fig. 5).
Fig. 5. Migration in the period 1990-2008 Different evolution of the population in the last decade is due to both the decrease in natural growth and the changes in migration flows. Economic potential In terms of number of employees, the evolution is erratic, with a maximum in 2004 and minimum in 2001. In the past four years there has been a slight decrease in the number of employees (Fig. 6).
Fig. 6. Evolution of number of employees in the period 1990-2012 From the perspective of the agriculture surface structure in the period 2010-2013, there was a slight decrease in arable area, while the area of meadows, vineyards and vine nurseries is very low (0.007%). In terms of non-agricultural land area we noticed a slight increase in the period under review due to increasing surface occupied by constructions (5.83%).
Table 1. The agriculture surface structure in the period 2010-2012(Ha)
Way of use for the agricultural area
Years
Year 2010
Year 2011 Year 2012
UM: Ha
Hectares Hectares Hectares
Agricultural 2389 2378 2370
Arable 2371 2360 2357
Vineyards and vine nurseries 16 16 13
Orchards and fruit tree nurseries 2 2 :
Total non agricultural land 343 354 363
Occupied by water, ponds 75 76 75
Occupied by constructions 179 190 198
Ways for communication and railways 62 61 63
Degraded and unproductive lands 27 27 27
Source: Own calculation on the basis of data from Tempo on line data base 2010-2012, NIS
In contrast, during 2000-2003 from the total arable land, in average only 0.63% of the area was cultivated, the rest was left as fallow. It is registered though a slight increase in cultivated area (Table 2). Table 2. Land fund area by usage, in the period 2000-2003(Ha)
Way of use for the agricultural area
Years
Year 2000
Year 2001 Year 2002 Year 2003
UM: Ha
Hectares Hectares Hectares Hectares
Agricultural 2489 2489 2489 2496
Arable 2450 2450 2450 2450
Meadows 21 21 21 21
Vineyards and vine nurseries 15 15 15 15
Orchards and fruit tree nurseries
3 3 3 10
Total cultivated area 1466 1612 1740 1415
Source: Own calculation on the basis of data from Tempo on line data base 2000-2003, NIS
From the perspective of crop structure the largest cultivated area is for maize (0.69%), followed by sunflower (0.18%), wheat and rye (0.08). Vegetable crops are is slightly higher, while the area cultivated with potatoes and sugar beet is insignificant (Table 3). In the studied period an increases in livestock is recorded for birds (300%) and cattle (0.67%). On the other hand, the pig stock fell by 0.07%. Sheep share in the herd is insignificant (Table 4).

Scientific Papers Series Management, Economic Engineering in Agriculture and Rural Development Vol. 14, Issue 2, 2014 PRINT ISSN 2284-7995, E-ISSN 2285-3952
168
Table 3. Crop structure, in the period 2000-2003 UM: Ha
Main crops Year 2000 Year 2001 Year 2002
Year 2003
Wheat and rye 121 495 479 455
Maize 1021 830 856 689
Sunflower 269 238 345 172
Sugar beet : : : 34
Potatoes 3 3 3 5
Vegetables 52 46 57 60
Source: Own calculation on the basis of data from Tempo on line data base 2000-2003, NIS
Table 4. Livestock stucture, in the period 2000-2003
UM: number
The main categories of animals
Year 2001
Year 2002
Year 2003
Cattle 1170 1158 1722
Swine 1278 1027 1187
Sheep : : 23
Birds 5200 9500 15600
Source: Own calculation on the basis of data from Tempo on line data base 2001-2003, NIS
Other sectors of activity Construction The construction sector has experienced an important development in the period 2009-2012 with a 15% increase in the number of private properties. Unfortunately, the number of buildings with a public character is reduced (Table 5). Table 5. Existing homes at the end of the year by forms of ownership
Year 2009
Year 2010
Year 2011
Year 2012
Total 1689 1807 1872 1951
Public property 0 0 1 1
Private property 1689 1807 1871 1950 Source: Own calculation on the basis of data from Tempo on line data base 2009-2012, NIS
Tourism The data indicate a slight increase in the number of bungalows. Development of tourism infrastructure show reduced tourism potential failure recovery (Table 6).
Table 6. Types of tourist accommodation structures
Year 2006
Year 2007
Year 2008
Year 2009
Year 2010
Year 2011
Year 2012
Year 2013
Total 2 2 5 5 5 12 10 10
Motels 0 0 1 1 1 1 1 1
Villas 0 0 2 2 2 2 2 2
Bungalows 1 1 1 1 1 8 6 6
Tourist stops 1 1 1 1 1 1 1 1
Source: Own calculation on the basis of data from Tempo on line data base 2006-2013, NIS
CONCLUSIONS Emphasys of the aging process by increasing the proportion of the adult (15-59) and elderly (over 60 years) population; Demographic structure is marked by the aging female population tendency; The natural increase in the period is negative, with a slight recovery in 2012 (-1.89%o); Migration to Berceni village was done, especially after 2006 for residential purposes more than for productive ones. Decrease of arable area while increasing the area occupied by construction; Developing non-agricultural occupations by valorizing the tourism and construction potential. REFERENCES [1]Bădescu Ilie, Cristea Darie, 2003. Elemente pentru un dicţionar de sociologie rurală, Editura Mica Valahie, Bucureşti; [2]Davis, Jr., Pearce, D., 2000, The Rural Non-farm Economy in Central and Eastern Europe. Discussion Paper, Natural Resources Institute, UK [3]Fulea Maria, 1996, Coordonate economice şi socio – demografice ale satului românesc în tranziţie, Editura Academiei Române, Bucureşti [4]Palicica Maria, Palicica Laura Ioana, 2005, Resursele umane si pregatirea fortei de munca din mediul rural, Editura Orizonturi Universitare, Timisoara.

Scientific Papers Series Management, Economic Engineering in Agriculture and Rural Development Vol. 14, Issue 2, 2014 PRINT ISSN 2284-7995, E-ISSN 2285-3952
169
RURAL LABOR FORCE SIZE AND STRUCTURE ANALYSIS Adina IORGA1, Elena TOMA1, Carina DOBRE1, Alexandra MUSCĂNESCU1 1University of Agricultural Sciences and Veterinary Medicine of Bucharest, 59 Mărăşti Blvd, District 1, 011464, Bucharest, Romania, Phone: +4021.318.25.64, Fax: + 4021.318.25.67, Emails: [email protected], [email protected]
Corresponding author: [email protected] Abstract The paper aimed to analyse the main characteristics of Romania’s rural labour force by concentrating on dynamics and structure of economically active population in the period 2007-2012. We analysed the main labour market indicators provided by statistical surveys like active population, unemployment, activity rate, unemployment rate, etc. by age, educational level and group of occupations. Our analysis points out the current dimensions of labour force from rural areas, and more importantly the main problems on this market (lack of jobs, the increase of unemployment, the aging process of population (the continuous reduction of young population) and the low level of education) and also the real necessity of SME development support and training opportunities for economically active rural population. Key words: age, economically active population structure, education, group of occupations, rural population
INTRODUCTION The Romanian rural labour market was in the last decades virtually mono-sectored, the majority of population being occupied in the agricultural sector, while the commercial and informal sectors are of small-scale development (Chaves, 2001). This fact is due to the high number of workers released from the industry after 1990 and the net migration to the rural area which resulted in the increase of labour force employed in agriculture, hunting and fishery and to the development of subsistence economy (Dachin, 2008). Due to this labour market structure, the rural areas are characterized by many problems like: the people aging; the lack of jobs, low training level and low productivity. Also the lower developments of non-agricultural sectors oblige mainly young people to look for jobs in the cities or to emigrate in other EU countries (Popescu, 2013). The most important problem is that unemployment ratio is higher because it is very difficult to find new jobs especially if we take into consideration that most unemployed people are middle aged, and they continue their unemployment registration so that they may receive unemployment benefits or assistance (Yoshii, 2000). The majority of
the employed rural people which lose their job become self-employed and the only options are in the agriculture sector due to the lack of jobs in other sectors (Dostie et al., 2006). MATERIALS AND METHODS The statistical data on Romania’s labour force were provided by the National Institute for Statistics (AMIGO studies) and refer to the period 2007-2012. To analyze this data we used the index, share and comparison methods based on the main labour force indicators. Calculation and analysis of labour force structure by age, sex and education levels was also another method used within this paper. RESULTS AND DISCUSSIONS Rural population, due to urban and external migration and also to the changes in its structure, had in the last years a decreasing trend, especially regarding to the active and occupied population. In 2012, in rural areas lived 9.65 mil people, with 0.3% lower than in 2007. After the integration in EU and on the background of financial crisis the occupied population decreased with 2.2% and the

Scientific Papers Series Management, Economic Engineering in Agriculture and Rural Development Vol. 14, Issue 2, 2014 PRINT ISSN 2284-7995, E-ISSN 2285-3952
170
unemployment increased with 3.3% (Table 1). In these conditions the activity rate and the occupancy rate decreased with over 1.5 percentage points. Table 1. Main indicators regarding Romanian population (2007-2012)
2007 2012 2012/2007
%
Rural population 9687881 9654223 99.7
Population 15 years of age and over 7992400 8066731 100.9
Share in total population - % 82.5 83.6 -
Economically active population 4499860 4410994 98.0
Share in total population - % 46.4 45.7 -
Occupied population 4280783 4184635 97.8
Unemployed population 219076 226359 103.3
Economically inactive population 5188021 5243229 70.5
Share in total population - % 53.6 54.3
- Activity rate 56.3 54.7
Occupancy rate 53.6 51.9
Unemployment rate 4.9 5.1
Table 2 Main indicators regarding Romanian population
by age (2007-2012)
2007 2012 2012/ 2007
Total population Population 15 years of age and over 7992400 8066731 100.9
Young (15-24 year) 1367254 1294300 94.7
Share in total population - % 14.1 13.4 -
Share in population 15 years of age and over - % 17.1 16.0
Working age population (15-64 year) 6182298 6306398 102.0
Share in total population - % 63.8 65.3 -
Share in population 15 years of age and over - % 77.4 78.2
Elderly (55-64 year) 1048285 1101297 105.1
Share in total population - % 10.8 11.4 -
Share in population 15 years of age and over - % 13.1 13.7
Economically active population Population 15 years of age and over 4499860 4410994 98.0
Young (15-24 year) 525913 478273 90.9
Share in population 15 years of age and over - % 11.7 10.8 -
Working age population (15-64 year) 4022737 4051428 100.7
Share in population 15 years of age and over - % 89.4 91.8 -
Elderly (55-64 year) 605971 613541 101.2
Share in population 15 years of age and over - % 13.5 13.9 -
Occupied population Population 15 years of age and over 4280783 4184635 97.8
Young (15-24 year) 440387 402118 91.3
Share in population 15 years of age and over - % 10.3 9.6 -
Working age population (15-64 year) 3803930 3825321 100.6
Share in population 15 years of age and over - % 88.9 91.4 -
Elderly (55-64 year) 598527 603457 100.8
Share in population 15 years of age and over - % 14.0 14.4 -
Unemployed population Population 15 years of age and over 219076 226359 103.3
Young (15-24 year) 85526 76155 89.0
Share in population 15 years of age and over - % 39.0 33.6 -
Working age population (15-64 year) 218807 226107 103.3
Share in population 15 years of age and over - % 99.9 99.9 -
Elderly (55-64 year) 7444 10084 135.5
Share in population 15 years of age and over - % 3.4 4.5 -
The largest rural population group, with a functional economic-social activity, respectively the 15-64 year old population (working age people), increases its share from
63.8% to 65.3% in the total population (Table 2). We may also observe a reduction in young people group in favour of the elderly people group, a tendency that is more and more evident in our country in the last decades. The observed trend has direct implications on the economic development of rural areas due to the implications on the labour force dimension in the future. These mutations occurring in the age structure of the population emphasis the demographic aging population process, demonstrated by the increase of the proportion of older adult population, the decreasing in number and proportion of young people under 15 years and also to the increasing life expectancy. This process is important if we take into consideration that over 40% of elderly people live in rural areas (working or inactive people). Economically active population from rural areas worked in 2012 in proportion of 58.2% in agricultural sector and 12.5% in the industry sector (Table 3). From this population 37.4% are employees, 33.6% are self-employed and 25.7% are unpaid family workers.
Table 3. Active population by professional status in 2012
Active population Employee Employer
Self-employed
Unpaid family worker
Agriculture 2566409 140986 0 1301678 1120464 Structure - % 100.0 5.5 0.0 50.7 43.7
Share - % 58.2 8.6 0.0 87.7 98.8
Industry 553531 532645 0 14472 0.0 Structure - % 100.0 96.2 0.0 2.6 0.0
Share - % 12.5 32.3 0.0 1.0 0.0
Construction 283018 179600 0 97590 0.0 Structure - % 100.0 63.5 0.0 34.5 0.0
Share - % 6.4 10.9 0.0 6.6 0.0
Commerce 265352 231322 9253 22039 0.0 Structure - % 100.0 87.2 3.5 8.3 0.0
Share - % 6.0 14.0 38.3 1.5 0.0
Public services 367590 355536 0 0 0.0 Structure - % 100.0 96.7 0.0 0.0 0.0
Share - % 8.3 21.6 0.0 0.0 0.0
Other services 204564 176220 0 11735 0.0 Structure - % 100.0 86.1 0.0 5.7 0.0
Share - % 4.6 10.7 0.0 0.8 0.0
Others sectors 47534 24018 0 22554 0.0 Structure - % 100.0 50.5 0.0 47.4 0.0
Share - % 1.1 1.5 0.0 1.5 0.0
Rural population (including unemployed people)
4410994 1648518 24132 1483408 1134069
Share - % 100.0 37.4 0.5 33.6 25.7
We mention another aspect which is that 87.9% of the working places from rural areas are in the private sector (3879193 persons), drawing

Scientific Papers Series Management, Economic Engineering in Agriculture and Rural Development Vol. 14, Issue 2, 2014 PRINT ISSN 2284-7995, E-ISSN 2285-3952
171
attention on the importance of public policy to sustain SME sector in rural areas. The analysis of rural population by professional status and occupation categories revealed that employed people are in proportion of 25.5% qualified workers, 18.5% have a qualifications for the services sector (especially sellers) and 33.1% have another occupation (from which 66.5% are unqualified workers). Also, if we analyze the rural active population by professional status and groups of occupations (Table 4) we may observe that the unskilled workers (without qualifications) are in proportion of 63.4% in agriculture and 11.2% in the industry sector. Actually in the industry sector only 44.0% of workers are artisans and skilled workers in handicraft, machinery and equipment regulation and maintenance and less than 10% have a higher preparation. In construction and services sectors the number of qualified workers is higher reaching 63.2% and respectively 56.6%. Table 4.Active population by professional status and groups of occupations in 2012
Number
Structure%
Share %
Agriculture Experts with intellectual and scientific occupations 9041 0.4 5.9 Farmers and skilled workers in agriculture, forestry and fishing 2062254 80.4 99.0 Artisans and skilled workers in handicraft, machinery and equipment regulation and maintenance 16664 0.6 3.3 Others categories of occupations, from which: 461861 18.0 45.4 Unskilled workers 429075 16.7 63.4
Industry Experts with intellectual and scientific occupations 11587 2.1 7.5 Technicians, foremen and assimilated 11690 2.1 12.7 Administrative clerks 8730 1.6 12.9 Workers in services and trade and assimilated 8970 1.6 2.7Farmers and skilled workers in agriculture, forestry and fishing 8977 1.6 0.4 Artisans and skilled workers in handicraft, machinery and equipment regulation and maintenance 243426 44.0 47.7 Others categories of occupations 250412 45.2 24.6 Unskilled workers 75730 13.7 11.2
Construction Artisans and skilled workers in handicraft, machinery and equipment regulation and maintenance 178932 63.2 35.1 Others categories of occupations, from which: 85172 30.1 8.4 Unskilled workers 66101 23.4 9.8
Commerce Members of legislative, executive, senior officials of public administration, managers and clerks of economic, social and political units 12661 4.8 32.3 Technicians, foremen and assimilated 16621 6.3 18.0 Administrative clerks 8826 3.3 13.1 Workers in services and trade and assimilated 150170 56.6 45.8 Artisans and skilled workers in handicraft, machinery and equipment regulation and maintenance 27709 10.4 5.4 Others categories of occupations, from which: 44601 16.8 4.4 Unskilled workers 22658 8.5 3.3
Public services Experts with intellectual and scientific 93987 25.6 61.2
Number
Structure%
Share %
occupations Technicians, foremen and assimilated 28265 7.7 30.7 Administrative clerks 12689 3.5 18.8 Workers in services and trade and assimilated 101775 27.7 31.0 Artisans and skilled workers in handicraft, machinery and equipment regulation and maintenance 12456 3.4 2.4Others categories of occupations, from which: 58417 15.9 5.7Unskilled workers 33174 9.0 4.9
Other services (Transport and storage, hotels and restaurants, information and communication,
financial intermediation and insurance, professional, scientific and technical sectors)
Experts with intellectual and scientific occupations 8765 4.3 5.7Technicians, foremen and assimilated 8035 3.9 8.7Administrative clerks 17070 8.3 25.3Workers in services and trade and assimilated 33844 16.5 10.3 Farmers and skilled workers in agriculture, forestry and fishing 8902 4.4 0.4 Artisans and skilled workers in handicraft, machinery and equipment regulation and maintenance 7339 3.6 1.4 Others categories of occupations, from which: 75798 37.1 7.5 Unskilled workers 8114 4.0 1.2
Others sectors Members of legislative, executive, senior officials of public administration, managers and clerks of economic, social and political units 26494 15.5 67.7 Experts with intellectual and scientific occupations 30238 17.7 19.7 Technicians, foremen and assimilated 27494 16.1 29.9Administrative clerks 20155 11.8 29.9Workers in services and trade and assimilated 33068 19.4 10.1Farmers and skilled workers in agriculture, forestry and fishing 2974 1.7 0.1 Artisans and skilled workers in handicraft, machinery and equipment regulation and maintenance 23376 13.7 4.6 Others categories of occupations, from which: 40789 23.9 4.0 Unskilled workers 42322 24.8 6.2
This distribution of labour force between economy sectors is mainly due to the educational levels of rural population (Table 5). Table 5.Active population by professional status and groups of occupations in 2012
Total
15-24 years
25-34 years
35-44 years
45-54 years
55-64 years
65 years and over
Higher education (ISCED 5) 4.6 4.0 8.7 3.8 3.8 3.3 0.0 Medium 53.5 50.8 54.8 67.5 63.5 38.1 11.5
Post high school specialty or
technical foremen
(ISCED 4) 3.0 0.0 4.0 1.9 2.5 5.3 0.0 High school (ISCED 3) 42.1 64.8 49.0 39.9 35.5 26.2 25.7 Vocational, complementary or apprenticeship (ISCED 3) 48.5 33.7 47.0 46.4 50.9 67.9 62.9 High school first cycle (ISCED 3) 6.4 0.0 0.0 11.7 11.1 0.0 0.0
Low 41.9 45.2 36.5 28.7 32.8 58.6 87.7 Gymnasium (ISCED 2) 81.4 88.0 89.7 91.4 89.7 82.6 48.1 Primary (ISCED 1) 17.1 10.3 8.7 6.9 9.2 16.7 49.5No education 1.5 0.0 0.0 0.0 0.0 0.0 2.4
The economically active population from rural areas has in proportion of only 53.5% a medium education level. From these people

Scientific Papers Series Management, Economic Engineering in Agriculture and Rural Development Vol. 14, Issue 2, 2014 PRINT ISSN 2284-7995, E-ISSN 2285-3952
172
only 48.5% have a vocational, complementary or apprenticeship form of education (level of education that offer a skilled labour form of education which permits a more direct integration on the labour market) and 42.1% are at high school level (which offer a general theoretical preparation needed to be followed by a specialisation level like post high school, technical specialisation or higher education). But the more important aspect is that, even in the present, 41.9% of rural population has a low level of education (ISCED 0-2) and this situation is observable in all categories of age. Having this kind of educational structure, on the labour market the opportunities remain low. The rural population with low education are employed only as skilled agricultural, forestry and fishery workers based on experience or are used for various works (elementary occupations, services and other occupations) (Table 6). Table 6. Employed and unemployed people structure by group of occupations and educational level
% ISCED 5 4 3 2 1 0
Employed people Managers 0.8 41.0 5.5 48.0 5.6 0.0 0.0 Professionals 3.1 72.2 8.1 19.3 0.3 0.2 0.0Technicians and associate professionals 1.9 20.4 18.1 59.1 2.4 0.0 0.0 Clerical support workers 1.3 16.5 5.9 72.4 4.8 0.3 0.0 Service and sales workers 6.5 3.6 2.2 76.0 16.8 1.2 0.1 Skilled agricultural, forestry and fishery workers 42.9 0.7 0.6 38.8 48.1 11.2 0.6 Craft and related trades workers 10.2 0.8 0.9 82.9 14.5 0.8 0.2 Other categories of occupations 20.0 0.8 1.0 58.0 32.2 6.7 1.3 Elementary occupations 13.2 0.5 0.5 46.1 41.6 9.4 1.9
Unemployed people - 5.3 1.2 58.0 29.0 5.2 1.3
Concerning the unemployed population, the majority of demand is characterized by people with ISCED 2-3 level of education, and 6.7% of people with higher education. CONCLUSIONS Rural labour market in Romania after EU integration is characterized by a decrease of activity rate and an increase of unemployment. Also in rural areas we observe a continuous process of reduction in number of young people group in favour of the elderly people group with direct implications on the economic development. This process is important if we take into consideration that over 40% of elderly people live in rural areas.
The majority of labour was concentrated in 2012 in agriculture (58.2%), only 12.5% in industry and 29.3% in other sectors. Also from the rural population, 37.4% are employees, 33.6% are self-employed and 25.7% are unpaid family workers. The active population is represented in proportion of 25.5% by qualified workers, 18.5% have a qualification for services sector (especially sellers) and 33.1% have another occupation (from which 66.5% are unqualified workers). The unskilled workers (without qualifications) are in proportion of 63.4% working in agriculture. Also, in the industry sector only 44.0% of workers are skilled workers and in the construction and services sectors the number of qualified workers is reaching 63.2% and respectively 56.6%. Taking all these aspects into consideration and the fact that 41.9% of the rural population has a low level of education (maximum ISCED 2) we may conclude that all rural areas need policies of development of SME in non-agricultural sectors and more importantly training programs to increase the skills of population of working age. REFERENCES [1]Chaves, R. (Ed.), 2001, Financial markets, credit constraints, and investment in rural Romania (Vol. 499). World Bank Publications [2]Dachin, A., 2008, Rural development – a basic condition for narrowing regional disparities in Romania. Romania, 44(58.8), 30-5 [3]Dostie, B., Sahn, D. E., 2006, Labour market dynamics in Romania during a period of economic liberalization (No. 2511). IZA Discussion Papers [4]Yoshii. M., 2000, An Overview of Labour Market in Romania in Transition Department of Economics, Kobe University, available online at http://www.econ.kobe-u.ac.jp/~yoshii/e/laborseminar/yoshii.pdf [5]Popescu Agatha, 2013, Considerations on the rural population as a resource of labour force in Romania. Scientific Papers. Series "Management, Economic Engineering in Agriculture and rural development", Vol. 13(3):229-236

Scientific Papers Series Management, Economic Engineering in Agriculture and Rural Development Vol. 14, Issue 2, 2014 PRINT ISSN 2284-7995, E-ISSN 2285-3952
173
EFFECTS OF DEMONSTRATION AND LECTURE METHODS OF TEACHING APICULTURE ON PERFORMANCE OF AGRIC STUDENTS IN ADAMAWA STATE UNIVERSITY, NIGERIA Muhammad Rabi’u JA'AFAR-FURO1, Yusuf ABDULLAHI2, Buba Enoch BADGAL3
1Adamawa State University, Department of Agricultural Economics and Extension, PMB 25, Mubi, Nigeria, Email: [email protected] 2Adamawa State Polytechnic, College of Engineering and Environmental Studies, Department of Mechanical Engineering, Yola, Nigeria, Email: [email protected] 3Adamawa State Polytechnic, College of Science and Technology, Department of Pure Science, Yola, Nigeria, Email: [email protected] Corresponding author: [email protected] Abstract A study was conducted using two (2) sets of 400 levels students to determine the effects of a combined demonstration and lecture methods of teaching apiculture on one hand, and lecture method on another, on performance of learners in the Faculty of Agriculture, Adamawa State University (ADSU), Mubi, Nigeria. Data were collected by observation of students’ scores, and personal verification of records/files to obtain information on age, gender and qualification at admission of both sets of students, whereas cost of instructional materials were determined through the Departmental Store Invoice (DSI). Descriptive statistics, computed cost components and correlation analyses were employed in the analyses of the data. Results revealed that while majority (52.00%) of the Conventional Students (CS) fell within the age range of 20-25 years, a larger proportion of the Sasakawa Students (SS) were within 31-35 years. Gender-wise, males accounted for the bulk of the students with 68.00% and 78.26% for CS and SS, respectively. In spite of the fact that Lecture Method (LM) had lower cost implication, it was found to be more efficient as a method of instruction among the students than a combined Demonstration and Lecture Methods (DLM). The male students slightly (0.456) performed better than their female (0.246) counterparts, with both coefficients significant at P<0.05. Its concluded that the application of LM of instruction was slightly more efficient than a combined DLM among the agriculture students of ADSU. Also, the male students were found to perform slightly better than the females. While the DLM could be more appropriate at primary and secondary schools, the LM is being recommended at tertiary level based on the findings of this study. Key words: apiculture, demonstration, lecture, methods, Mubi, Nigeria INTRODUCTION Scholars the world over have now recognized that there are better methods of learning than through the conventional ways of instruction [1]. Post-secondary institutions and specifically universities are beginning to realise the relevance of utilisation of appropriate methods through which students can learn [2]. Further, several methods of teaching have been proved to be relatively ineffective on students’ ability to master and then retain important concepts. Some renowned researchers [3] noted that learning through some methods of teaching is passive rather than active. The applications of the traditional methods like lecture, memorizing, recitation, etc. do not seem to aid critical and
creative thinking, and collaborative problem-solving. Two imminent authors [4] reported that the challenge in teaching therefore, is to create experiences that involve the students and support their own thinking explanations, evaluations, communications and applications of scientific models needed to make sense of these experiences. Several studies [4, 5, 6, and 7] have indicated that science subjects are more affected in this trend of development. Agriculture, which is purely science based, is more of practically-oriented learning experiences than mere theories. For instance, it was reported [5] that in spite of the frantic efforts made by the government to enhance teaching of science/agricultural science syllabus, by employment of qualified graduate teachers,

Scientific Papers Series Management, Economic Engineering in Agriculture and Rural Development Vol. 14, Issue 2, 2014 PRINT ISSN 2284-7995, E-ISSN 2285-3952
174
provision of facilities and prompt payment of salaries, among others, the recent students’ results at external examinations show a decline in performance. The choices of appropriate pedagogies for application then become imperative [8]. While lecture method of instruction largely involves telling as teacher-centered, the demonstration method of learning entails teaching through learning by doing in addition to telling. To further stress the relevance of participation of learners as a facilitating factor in concretising learning experiences, an educationist [9] observed that the demonstration method has been found to be extensively used in sciences, and by extension should be applied in teaching agricultural courses. This investigation, a study of the effects of demonstration and lecture methods of teaching apiculture on performance of agricultural students in Adamawa State University, Mubi, Nigeria, is an attempt towards finding an appropriate method of aiding effective learning not only among agriculture students but science in general. However, specifically, it focused on determining the performance of students in apiculture study using demonstration and lecture methods of instructions, assessing the costs implication and efficiency in using these two methods of teaching apiculture, and determining the effect of gender difference on application of demonstration and lecture methods of teaching apiculture in the Faculty of Agriculture of the University. MATERIALS AND METHODS Sampling techniques and data collection Two sets of 400 level students were purposely selected for the study. The students were put into three groups based on their performance referred to as Cumulative Grade Point Aggregate (CGPA). The stratification is as follows: First stratum = 1.5-2.0; second stratum = 2.1-3.4 and third stratum = 3.5 & above. The total number of the two sets of students was 48, comprising 25 and 23 of 400 levels of Conventional and Sasakawa students, respectively.
The Conventional group was taught using a combination of demonstration and lecture teaching methods, whereas the second group was instructed using lecture teaching method for comparison of learning outcomes. Data were collected by observation of students’ scores, and personal verification of records/files to obtain information on age, gender and qualification at admission of both sets of students, whereas cost of instructional materials were determined through the Departmental Store Invoice (DSI). Instructional materials for the study The instructional materials utilised for the experiment include the following:
1. Projector/PowerPoint 2. Notebook computer 3. Green laser pointer 4. Extension cord wire 5. Kenya top-bar beehive 6. Beehive stand 7. Plastic funnels 8. Beehive tool/knife 9. Bees suit (set) 10. A pair of hand gloves 11. A pair of rain boots 12. Binta Sudan/scent 13. Honeycomb/honey
The data collected were analysed using descriptive statistics (percentage, mean and frequency distribution), computation of cost components, and multiple correlation analysis. The latter was implicitly specified as: Y = f(X1; X2; X3; X4; X5) Where: Y = performance X1 = age of student X2 = male student X3 = female student X4 = learning method X5 = level of education at admission This was used to specifically analyse how the selected variables correlated with the performance of the students using the two methodologies RESULTS AND DISCUSSIONS Distribution of the selected variables of the students studied
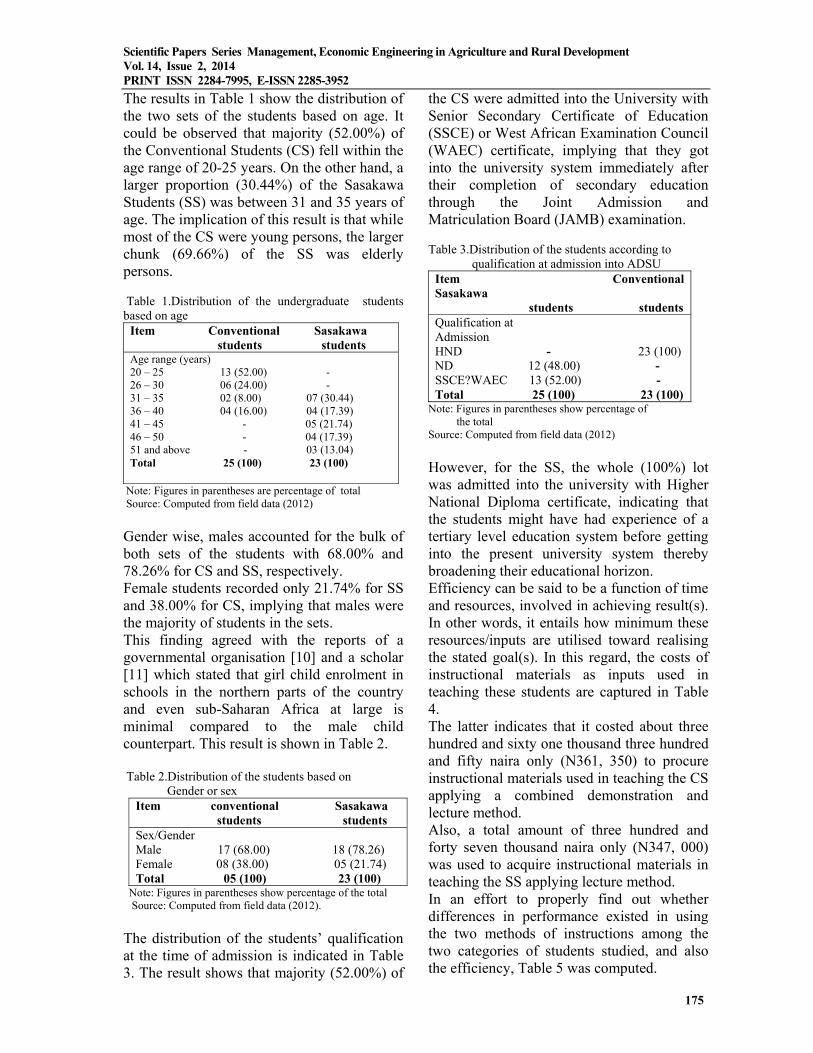
Scientific Papers Series Management, Economic Engineering in Agriculture and Rural Development Vol. 14, Issue 2, 2014 PRINT ISSN 2284-7995, E-ISSN 2285-3952
175
The results in Table 1 show the distribution of the two sets of the students based on age. It could be observed that majority (52.00%) of the Conventional Students (CS) fell within the age range of 20-25 years. On the other hand, a larger proportion (30.44%) of the Sasakawa Students (SS) was between 31 and 35 years of age. The implication of this result is that while most of the CS were young persons, the larger chunk (69.66%) of the SS was elderly persons. Table 1.Distribution of the undergraduate students based on age
Item Conventional Sasakawa students studentsAge range (years) 20 – 25 13 (52.00) - 26 – 30 06 (24.00) - 31 – 35 02 (8.00) 07 (30.44) 36 – 40 04 (16.00) 04 (17.39) 41 – 45 - 05 (21.74) 46 – 50 - 04 (17.39) 51 and above - 03 (13.04) Total 25 (100) 23 (100)
Note: Figures in parentheses are percentage of total Source: Computed from field data (2012)
Gender wise, males accounted for the bulk of both sets of the students with 68.00% and 78.26% for CS and SS, respectively. Female students recorded only 21.74% for SS and 38.00% for CS, implying that males were the majority of students in the sets. This finding agreed with the reports of a governmental organisation [10] and a scholar [11] which stated that girl child enrolment in schools in the northern parts of the country and even sub-Saharan Africa at large is minimal compared to the male child counterpart. This result is shown in Table 2. Table 2.Distribution of the students based on Gender or sex
Item conventional Sasakawa students students Sex/Gender Male 17 (68.00) 18 (78.26) Female 08 (38.00) 05 (21.74) Total 05 (100) 23 (100)
Note: Figures in parentheses show percentage of the total Source: Computed from field data (2012).
The distribution of the students’ qualification at the time of admission is indicated in Table 3. The result shows that majority (52.00%) of
the CS were admitted into the University with Senior Secondary Certificate of Education (SSCE) or West African Examination Council (WAEC) certificate, implying that they got into the university system immediately after their completion of secondary education through the Joint Admission and Matriculation Board (JAMB) examination. Table 3.Distribution of the students according to qualification at admission into ADSU
Item Conventional Sasakawa students students Qualification at Admission HND - 23 (100) ND 12 (48.00) - SSCE?WAEC 13 (52.00) - Total 25 (100) 23 (100)
Note: Figures in parentheses show percentage of the total Source: Computed from field data (2012)
However, for the SS, the whole (100%) lot was admitted into the university with Higher National Diploma certificate, indicating that the students might have had experience of a tertiary level education system before getting into the present university system thereby broadening their educational horizon. Efficiency can be said to be a function of time and resources, involved in achieving result(s). In other words, it entails how minimum these resources/inputs are utilised toward realising the stated goal(s). In this regard, the costs of instructional materials as inputs used in teaching these students are captured in Table 4. The latter indicates that it costed about three hundred and sixty one thousand three hundred and fifty naira only (N361, 350) to procure instructional materials used in teaching the CS applying a combined demonstration and lecture method. Also, a total amount of three hundred and forty seven thousand naira only (N347, 000) was used to acquire instructional materials in teaching the SS applying lecture method. In an effort to properly find out whether differences in performance existed in using the two methods of instructions among the two categories of students studied, and also the efficiency, Table 5 was computed.

Scientific Papers Series Management, Economic Engineering in Agriculture and Rural Development Vol. 14, Issue 2, 2014 PRINT ISSN 2284-7995, E-ISSN 2285-3952
176
Table 4.Cost implication of using instructional materials on the two methodologies of teaching
Instructional Unit cost Qty Total cost materials (₦) (₦) applied
1.DLM (n:25) Projector/PowerPoint 250,000 1 250,000 Notebook Computer 90,000 1 90,000 Green Laser Pointer 4,000 1 4,000 Extension Cord Wire 1,500 2 3,000 Kenya Top-bar Beehive 6,000 1 6,000 Beehive Stand 2,500 1 2,500 Plastic Funnel 150 4 6,000 Beehive Tool/Knife 250 1 250 Bee-suit (set) 2,000 1 2,000 Hand Gloves 300/pair 1 pair 300 Rain Boot 1,800/pair 1 pair 1,800 Binta Sudan/scent 200 2 bottles 400 Honeycomb/Honey 100/100ml 500ml 500 Total 361,350 2.LM (n23) Projector/PowerPoint 250,000 1 250,000 Notebook Computer 90,000 1 90,000 Green Laser Pointer 4,000 1 4,000 Extension Cord Wire 1,500 2 3,000 Total 347,000
Note: ₦160 = US$1 Source: Computed from field data (2012)
As earlier stated, the Table 5 shows that while it costed N361, 350 to teach a total of 25 CS, a sum of N347, 000 was involved in teaching 23 SS. Therefore, the use of the combined methods of demonstration and lecture in teaching the students was slightly expensive than lecture method only. Table 5.Assessment of efficiency of the two methods in determining performance of the two sets of the students
Item Cost Number Cummu- Averag implication of lative -e score of using a students score of of method students students (₦) (%) 1.DLM ₦361,350 25 1381 55.24 Cost of training per student = 1381 x 25 = ₦6, 541.46 361,350 1 2.LM ₦347,000 23 1308 56.87 Cost of training per student = 1308 x 23 = ₦6, 101.68 347,000 1 Difference in cost and performance of the students in the two methods = ₦439.78 & 1.63%
Note: ₦160 = US$1 Source: Computed from field data (2012) Extrapolating from the available data in Table 5, it could be said that it cost a total sum of six thousand five hundred and forty one naira
forty six kobo only (N6, 541.46) to instruct a student in apiculture using a combined demonstration and lecture methods, passing with a mean score of 55.24%. Similarly, it amount to a sum of six thousand one hundred and one naira sixty eight kobo only (N6, 101.68) to instruct a student in apiculture using lecture method, and at the end of assessment, having a mean score of 56.87%. While it cost higher (N439.78) to teach using a combination of demonstration and lecture methods, instruction with only lecture method yielded higher (1.63%) learning outcome among the agriculture undergraduate students of Adamawa State University, Mubi, Nigeria, contrary to apriori expectation. The above result is similar to the findings of some authors [5] in which the educationists investigated the effects of programmed instruction and demonstration methods on students’ academic performance in science in Esan West LGA of Edo State, Nigeria. The authors discovered that there was a significant difference in the academic achievement of the two groups of students Used. Those exposed to programmed instruction method achieved better than those exposed to demonstration method. Also, a famous author [12] made similar conclusion, that programmed instruction method is more effective than demonstration method in helping students gain understanding of concrete observable phenomenon. Be that as it may, it is necessary to state that costs are incurred virtually in all facets of education ranging from acquisition of human resource, erection of buildings to procurement of instructional materials. However, the type of methodology applied in teaching determines the cost to be involved and to a greater extent the learning outcome. The pooled correlation coefficient matrix of selected factors influencing performance among the two sets of the students is shown in Table 6. Although a factor, level of education at admission, has been added, gender as a variable is being split into male and female for the purpose of determining the effect of each sex in facilitating learning among the groups of learners.

Scientific Papers Series Management, Economic Engineering in Agriculture and Rural Development Vol. 14, Issue 2, 2014 PRINT ISSN 2284-7995, E-ISSN 2285-3952
177
These variables include age, male, female, learning method and level of education at admission. Of these five variables in Table 6, gender seemed to have slight influence. Table 6.Pooled correlation coefficient matrix of selected factors influencing performance among the two categories of students
Y X1 X2 X3 X4 Age (X1) 0.115 Male (X2) 0.456* 0.312 Female (X3) 0.246* 0.188 0.241 Learning Method (X4) 0.092 0.913** 0.257 0.325 Level of education at admission (X5) -0.046 -0.973**-0.115 -0.873 -0.576
Note: * value is significant at P<0.05 **value is significant at P<0.01 Source: Computed from field data (2012) Pooling from the results of descriptive statistics on gender of the students in Table 2, most (72.92%) of the learners were males with minority (27.08%) as females. Also, from the findings of the pooled correlation analysis in Table 6, the male gender had slight significance (0.456) in positively influencing learning outcomes than the female gender (0.246) which were both significant at P<0.05. This finding is in line with some famous investigators’ report [13] that stated that at a probability of P<0.05, no statistically significant difference existed between the adjustive performance of male and female students. The male mean GPA was 68.4% and the female’s counterpart was 67.8%, indicating that the latter was slightly higher with a value of 0.6%. But for one imminent author [14], his findings revealed trends of mixed results, where for instance, the females were at par with males in completed coursework, and the former surpassed the latter in mastery of content. However, the finding of this study disagreed with a group of authors [15] who documented the effect of gender on performance of undergraduate dental students at the University of Jordan, Amman. The imminent authors reported that the Cumulative Gross Point Aggregates (CGPA) of the female
graduated students were significantly higher than those of the male students. Based on the aforementioned, it could be stated that although generally the male gender has an insignificant positive effect in enhancing the learning outcomes of students, there are also areas where the female gender surpass the male counterpart. Therefore, further in-depth investigation is required towards documenting appropriate findings for these differences for utilisation by the education world. CONCLUSIONS Its concluded that the application of LM of instruction was slightly more efficient than a combined DLM among the agriculture students of ADSU. Also, the male students were found to perform slightly better than the females. While the DLM could be more appropriate at primary and secondary schools as being cited by several studies globally, the LM is being recommended at tertiary level based on the findings of this study. ACKNOWLEDGMENTS The authors wish to sincerely thank the management of the Adamawa State University, Mubi, Nigeria, for allowing the use of the institution’s instructional materials for the study, and the students for their cooperation. REFERENCES [1] Achor, E. E.; Imoko, B. I. and Uloko, E. S. (2009). Effect of ethnomathematics teaching approach on senior secondary students’ achievement and retention in locus. Education Research and Review. 4(8): 385-390 [2]Ajiboye, J. O. and Ajitoni, S. O. (2008). Effect of full and quasi-participatory learning strategies on Nigerian senior secondary students’ environmental knowledge: Implication for classroom practice. International Journal of Environmental and Science Education. 3(2): 58-66 [3] Bello, T. O. (2011). Effect of group instructional strategy on students’ performance in selected physics concepts. Journal of the African Educational Research Network. 71(11): 1-9

Scientific Papers Series Management, Economic Engineering in Agriculture and Rural Development Vol. 14, Issue 2, 2014 PRINT ISSN 2284-7995, E-ISSN 2285-3952
178
[4]Colbum, M. (2005). In: Uhumuavbi, P. O. and Mamudu, J. M., 2009. Relative effects of programmed instruction and demonstration methods on students’ academic performance in science. College Student Journal. 1-13 [5]Daniel, O. I. and Bimbola, O. (2010). Effect of constructivist-based teaching strategy on academic performance of students in integrated science at junior secondary school level. Educational Research and Reviews. 5(7): 347-353 [6] Mbanefoh, N. (1994). Access of girls to primary and basic education in Nigeria. Published by the UNESCO Regional office in Dakar. [7]National Primary Education Commission, NPEC/Special Programme Unit, SPU (1991). Monitoring and evaluation report on primary education in Nigeria, federal ministry of education, Kaduna. [8] Olatoye, R. A.; Aderogba, A. A. and Aanu, E. M. (2011). Effects of co-operative and individualized teaching methods on senior secondary school students’ achievement in organic chemistry. The Pacific Journal of Science and Technology. 12(2): 310-319. [9] Rampacher, A. and Peterson, C. (1999). Effects of gender and age on adjustive technique class performance. The Journal of Chiropractic Education. 13(2): 114-130 [10] Sawair, F. A.; Baqain, Z. H.; Al-Omari, I. K.; Wahab, F. K. and Rajab, L. D. (2009). Effect of gender on performance of undergraduate dental students at the University of Jordan, Amman. Journal of Dental Education. 73(11): 1313-1319 [11]Tretter, T. R. (2003). Gifted students speak: mathematics problem-solving insights. Gifted Child Today, 26(3), 22-33. [12] Uhumuavbi, P. O. and Mamudu, J. M. (2009). Relative effects of programmed instruction and demonstration methods on students’ academic performance in science. College Student Journal. 1-13 [13] Wood, W. B. and Gentle, J. M. (2003). Teaching in a research context. Science. 302-1510. [14] Zimrot, R. and Guy, A. (2007). Interactive lecture demonstrations: A tool for exploring and enhancing conceptual change. Chemistry Education Research and Practice. 8(2): 197-211

Scientific Papers Series Management, Economic Engineering in Agriculture and Rural Development Vol. 14, Issue 2, 2014 PRINT ISSN 2284-7995, E-ISSN 2285-3952
179
DYNAMICS OF POVERTY, DEFORESTATION AND BEEKEEPING IN NORTHERN NIGERIA: CONCERNS FOR POLICYMAKERS – Part I Muhammad Rabi’u JA’AFAR-FURO Adamawa State University, PMB 25, Mubi, Nigeria, Email: [email protected] Corresponding author: [email protected] Abstract The study examines the role of beekeeping amidst condition of abject poverty among the majority of the population in northern Nigeria, and the much popularised Afforestation Programmes of the public sector. Data were collected both from primary and secondary sources. The findings indicated that while the activities/livelihood of the people had devastating effects on the environment (felling of trees) of which massive adoption of low-technology beekeeping would play immense role in reviving the situation, the attitude of the government towards promoting tree planting campaign in the area has not been encouraging. Its concluded that the livelihoods of the poor majority of the people of northern Nigeria had devastating effects on the Afforestation efforts in the area, and beekeeping enterprise could be used as a bridge between the two (poverty and afforestation). It is therefore, strongly recommended that policymakers should address the dynamics between poverty, deforestation and beekeeping with the hope of stabilising the economic situation of the people of northern Nigeria and by extension improves their incomes and livelihoods. Key words: afforestation, beekeeping, dynamics, Northern, Nigeria INTRODUCTION It was recently documented that the three poorest States in Nigeria are located in the north namely, Sokoto, Yobe and Adamawa in descending order, where the majority (74.0%) of the population live on less than US$1 per day [1]. In addition, desertification proceeds at the rate of one kilometer of tillable land per year, with most people heavily relying on wood/felled trees as source of energy (for cooking) in a country that has been ranked the sixth in the world in terms of petroleum and gas production. While several efforts of the Federal Government towards addressing these inadequacies through Programmes like Better Life for Rural Women (BLRW), National Poverty Eradication Programme (NAPEP), National Land Development Authority (NALDA) and Fadama Development Programme could not yield any desirable effects [2], the idea of promotion of tree planting and massive beekeeping have very much been relegated to the background. However, its widely documented in the literature that apart from serving as a reliable source of income to the rural farmers [3] through production and marketing of beehive
crops, bees potentially serve as good pollinators and also as conservators of biological biodiversity. Statistically, it was documented [4] that globally, about 2.4 billion people burn biomass fuel on a daily basis to boil water and cook food. By implication, up to 2 million tonnes of biomass are being burnt every day, posing great threat to the areas where the demand for the population surpassed the forest resources. In China, further noted the report, forest plantations were rendered unproductive as a result of illegal felling of trees in the 1990s. Similarly, in Latin America and South-East Asia, alarming rates of deforestation are leading to land degradation and desertification. More worrisome is the case of the sub-Saharan Africa, where over three quarters of forests of many countries suffered depletion due to rampant utilization of forest resources for fuel. In Nigeria, its reported [5] that about 262, 783 metric tonnes of fuel wood is being consumed annually, compared with 7, 210 tonnes for South Africa and 35, 313 tonnes for Thailand. While the trend had declined in these countries, Nigeria is still experiencing an upsurge in desertification. Failure to curb the development may result in its forests

Scientific Papers Series Management, Economic Engineering in Agriculture and Rural Development Vol. 14, Issue 2, 2014 PRINT ISSN 2284-7995, E-ISSN 2285-3952
180
converting to savannah grasslands and even desert. Some authors [6] associated this sharp development to hike in prices of petroleum products, availability of same and its affordability. According to a report [7], the utilization of wood as fuel has a direct link with the poverty status of the people of Nigeria. The authors sufficiently established that there is a high correlation (0.771) between level of poverty and wood consumption. This has been more pronounced in the northern parts of the country than in the southern or south eastern parts of the country. As majority (70.4%) of the people cannot afford other sources of fuel, the easiest way of meeting their domestic requirements is through the use of felled wood, thereby massively leading to depletion of the forests in the affected regions. The fastest way to regain the vegetation cover of degraded land is through massive Afforestation. This is the process of planting trees with the intention of improving or regaining the degraded form of land. Various studies across Africa have shown that Afforestation had been used to improve vegetation cover and by extension the livelihoods of the communities in that area. For instance, a study adequately documented [8] the role of integrating biodiversity in the national Afforestation planning programme of Zimbabwe and, clearly stated the links between the factors and the resultant successes. Also, an international organisation [9] reported the contribution of forests and reforestation to the livelihoods and the national economy of Tanzania, highlighting the legal, policy, and regulatory framework for forest management in the country. Similarly, findings of group of researchers [10] sufficiently highlighted the usefulness of household tree planting to the communities of Tigrai in northern Ethiopia, specifically taking into account the species, purposes, and the socio-economic determinants. However, in Nigeria, although forest management system started in 1889 and Forest reservation was virtually completed in the high forest areas by 1940, presently, forest reserves are not maintained while management plans are either non-existent or
abandoned [11]. Efforts made by previous researchers [12] to assess land reclamation programmes through Afforestation indicated that although the previous Afforestation programmes in the country had positive effects on the environment and the livelihoods of the communities, there are no appropriate sustainability measures put in place for these Afforestation projects and shelterbelt programmes. It was established [13] that the consequences of these are more pronounced in the northern parts of the country where the diverse activities of the communities on forests, as a result of poverty level, remove the very much needed vegetation cover leading to desertification, soil erosion, and other land degradation features. The three tiers of governments (Federal, State & Local) in Nigeria are now committed towards Afforestation Programmes/Projects in an attempt to curb the sharp desertification and soil erosion in the northern Nigeria and gulley erosions in the southern parts of the country. The role of beekeeping as a very strong link between the livelihoods of the poor majority of the people of northern Nigeria, and the Tree Planting Programme (TPP) as a very much publicised remedy of the government towards correcting this anomaly, is central to fast improvement of the economy of the region. Firstly, it has been widely documented [14; 15; 16] that keeping bees is a very profitable venture and by implication serves as source of viable income to the rural poor resource farmers through the sale of hive products (honey, beeswax, probolis, bee venom, royal jelly, bee pollen). Secondly, as honeybees depend totally on plants for food by making thousands of visits to flowers for collection of nectar and pollen grains, they pollinate these plants and by implication contribute immensely to the maintenance of ecosystems and agricultural production [17]. Therefore, the introduction of beekeeping into any Afforestation Programme/Project would not only improve the vegetation cover of the communities but also directly improve their livelihoods by serving as viable source of income as well as source of food and medication.
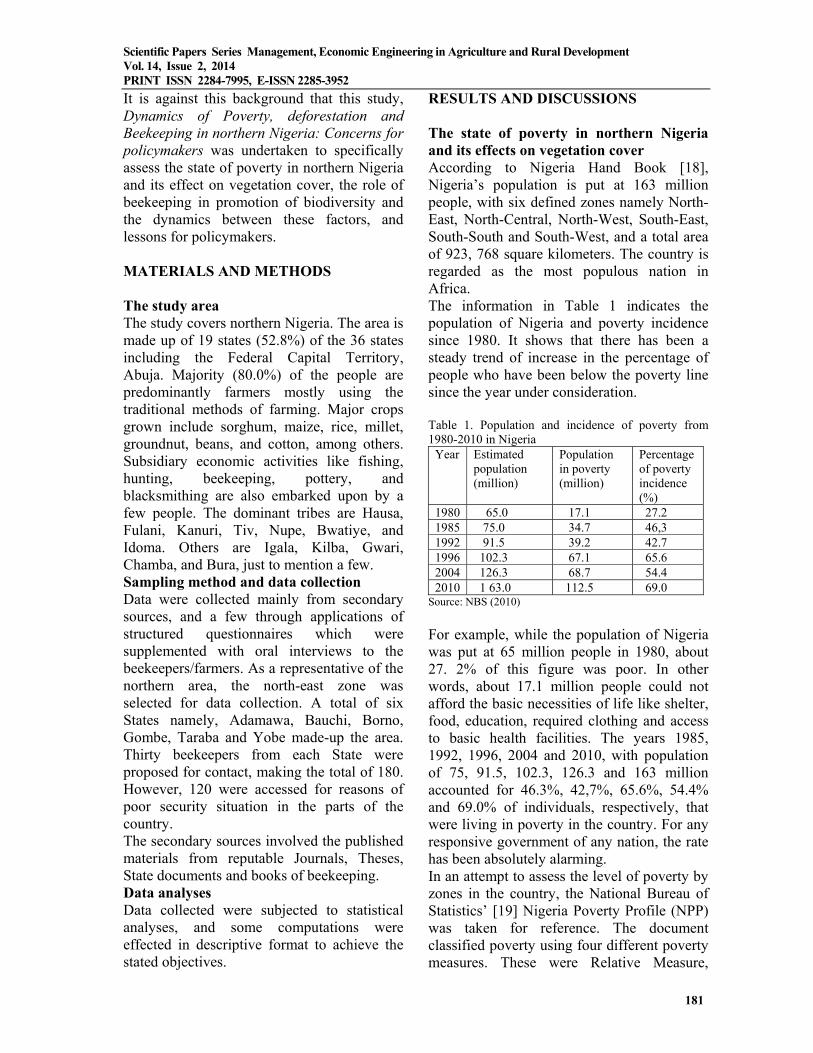
Scientific Papers Series Management, Economic Engineering in Agriculture and Rural Development Vol. 14, Issue 2, 2014 PRINT ISSN 2284-7995, E-ISSN 2285-3952
181
It is against this background that this study, Dynamics of Poverty, deforestation and Beekeeping in northern Nigeria: Concerns for policymakers was undertaken to specifically assess the state of poverty in northern Nigeria and its effect on vegetation cover, the role of beekeeping in promotion of biodiversity and the dynamics between these factors, and lessons for policymakers. MATERIALS AND METHODS The study area The study covers northern Nigeria. The area is made up of 19 states (52.8%) of the 36 states including the Federal Capital Territory, Abuja. Majority (80.0%) of the people are predominantly farmers mostly using the traditional methods of farming. Major crops grown include sorghum, maize, rice, millet, groundnut, beans, and cotton, among others. Subsidiary economic activities like fishing, hunting, beekeeping, pottery, and blacksmithing are also embarked upon by a few people. The dominant tribes are Hausa, Fulani, Kanuri, Tiv, Nupe, Bwatiye, and Idoma. Others are Igala, Kilba, Gwari, Chamba, and Bura, just to mention a few. Sampling method and data collection Data were collected mainly from secondary sources, and a few through applications of structured questionnaires which were supplemented with oral interviews to the beekeepers/farmers. As a representative of the northern area, the north-east zone was selected for data collection. A total of six States namely, Adamawa, Bauchi, Borno, Gombe, Taraba and Yobe made-up the area. Thirty beekeepers from each State were proposed for contact, making the total of 180. However, 120 were accessed for reasons of poor security situation in the parts of the country. The secondary sources involved the published materials from reputable Journals, Theses, State documents and books of beekeeping. Data analyses Data collected were subjected to statistical analyses, and some computations were effected in descriptive format to achieve the stated objectives.
RESULTS AND DISCUSSIONS The state of poverty in northern Nigeria and its effects on vegetation cover According to Nigeria Hand Book [18], Nigeria’s population is put at 163 million people, with six defined zones namely North-East, North-Central, North-West, South-East, South-South and South-West, and a total area of 923, 768 square kilometers. The country is regarded as the most populous nation in Africa. The information in Table 1 indicates the population of Nigeria and poverty incidence since 1980. It shows that there has been a steady trend of increase in the percentage of people who have been below the poverty line since the year under consideration. Table 1. Population and incidence of poverty from 1980-2010 in Nigeria
Year Estimated population (million)
Population in poverty (million)
Percentage of poverty incidence (%)
1980 65.0 17.1 27.2 1985 75.0 34.7 46,3 1992 91.5 39.2 42.7 1996 102.3 67.1 65.6 2004 126.3 68.7 54.4 2010 1 63.0 112.5 69.0
Source: NBS (2010)
For example, while the population of Nigeria was put at 65 million people in 1980, about 27. 2% of this figure was poor. In other words, about 17.1 million people could not afford the basic necessities of life like shelter, food, education, required clothing and access to basic health facilities. The years 1985, 1992, 1996, 2004 and 2010, with population of 75, 91.5, 102.3, 126.3 and 163 million accounted for 46.3%, 42,7%, 65.6%, 54.4% and 69.0% of individuals, respectively, that were living in poverty in the country. For any responsive government of any nation, the rate has been absolutely alarming. In an attempt to assess the level of poverty by zones in the country, the National Bureau of Statistics’ [19] Nigeria Poverty Profile (NPP) was taken for reference. The document classified poverty using four different poverty measures. These were Relative Measure,

Scientific Papers Series Management, Economic Engineering in Agriculture and Rural Development Vol. 14, Issue 2, 2014 PRINT ISSN 2284-7995, E-ISSN 2285-3952
182
Absolute (Objective) Measure of Poverty, Dollar per Day, and Subjective Poverty Measure (see appendix 1). The findings in Table 2 show that by all standards mentioned therein the northern zones (north-east, north-central & north-west) of the country ranked the highest. Table 2.Zonal incidence of poverty by four measures in Nigeria
Zone Food Poor (%)
Absolute Poor (%)
Relative Poor (%)
Dollar Per day (%)
North – central
38.6 59.5 67.5 59.7
North – east
51.5 69.0 76.3 69.1
North – west
51.8 70.0 77.7 70.4
South – east
41.0 58.7 67.0 59.2
South – south
35.5 55.9 63.8 56.1
South – west
25.4 49.8 59.1 50.1
Source: NBS (2012) For instance, while up to 51.8% were found to be food poor in northern Nigeria, the highest recorded for the southern part was 41.0%. Similarly, while as much as 70.0% were found to be in absolute poverty in part of the north, the southern counterparts recorded 58.7% as the highest. The condition of relative poverty reached 77.7% for the people of the north against 67.0% for the people of the south. The dollar per day measure which is more conventional in application accounted for up to 70.4% for parts of northern Nigeria against 59.2% for the southern parts. These findings are shown in Table 2. In order to determine the effect of poverty on utilisation of forest resources as wood fuel, information applied by a group of authors [20] were found relevant. These are presented in Table 3. It could be observed that the poverty rate had a very positive correlation with the consumption of forest resources as fuel. This was more pronounced in the northern parts of Nigeria (north-east, north-central & north-west) than the southern counterparts (south-east, south-south & south-west).
Table 3. Poverty rate and percentage of utilisation of wood as source of fuel by zone in Nigeria
Zone Poverty rate Percentage of wood as fuel source
North –east 72.2 95.9 North –west 71.2 95.3 North –central
67.2 86.4
South –west 43.0 54.9 South –east 26.7 78.0 South –south
35.1 72.7
Source: NBS (2007) [37]
The implication of the above finding is that as the trend of poverty increases so will be the utilisation of wood as fuel. This would definitely lead to extreme removal of vegetation cover in the northern parts of the country resulting in unbalanced ecosystems. However, this can be improved through massive Afforestation/tree planting exercise in the region, and also by improving the livelihoods of the people especially by introducing the use of kerosene and/or gas as sources of fuel for domestic purposes. The role of beekeeping in the promotion of biodiversity The immense role beekeeping plays in pollination of crops and other plants in the ecosystem thereby enhancing biological diversity, and by extension promoting the conservation of the environment has been advanced by several authors. For example, a scholar [21] noted that honeybee workers make thousands of visits to flowers in order to collect nectar and pollen, and by doing so help in improving fruit and seed-setting both in the wild and in cultivated plants. In a similar fashion, another two researchers [22] estimated the value of increased yield and quality of crops as a result of pollination by honeybees in the United States of America (USA), for the year 2000, at US$14.6. However, in Nigeria, this very important service of the honeybees has not been established let alone quantifying the benefits, except for pockets of attempts made by very few authors [23; 24] By the above explanation, it could be inferred that honeybees can be used to improve the diverse species of wild plants which will lead to the development of forest, and also enhance agricultural production. Therefore, the
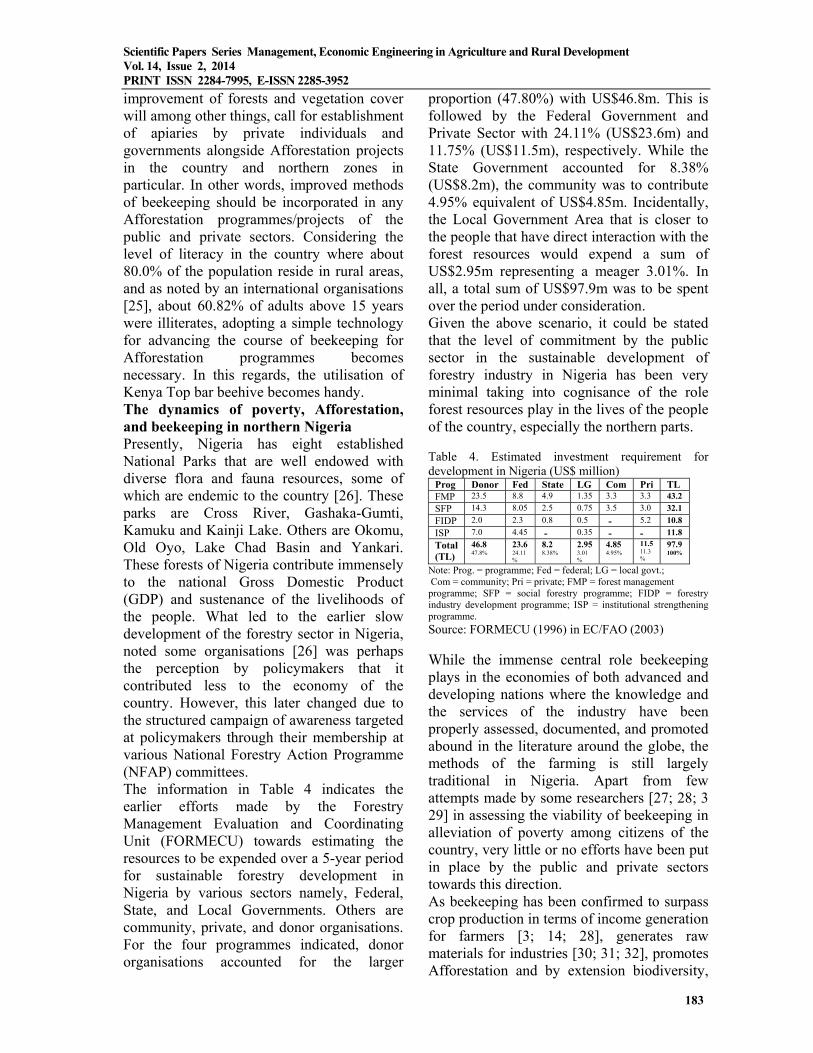
Scientific Papers Series Management, Economic Engineering in Agriculture and Rural Development Vol. 14, Issue 2, 2014 PRINT ISSN 2284-7995, E-ISSN 2285-3952
183
improvement of forests and vegetation cover will among other things, call for establishment of apiaries by private individuals and governments alongside Afforestation projects in the country and northern zones in particular. In other words, improved methods of beekeeping should be incorporated in any Afforestation programmes/projects of the public and private sectors. Considering the level of literacy in the country where about 80.0% of the population reside in rural areas, and as noted by an international organisations [25], about 60.82% of adults above 15 years were illiterates, adopting a simple technology for advancing the course of beekeeping for Afforestation programmes becomes necessary. In this regards, the utilisation of Kenya Top bar beehive becomes handy. The dynamics of poverty, Afforestation, and beekeeping in northern Nigeria Presently, Nigeria has eight established National Parks that are well endowed with diverse flora and fauna resources, some of which are endemic to the country [26]. These parks are Cross River, Gashaka-Gumti, Kamuku and Kainji Lake. Others are Okomu, Old Oyo, Lake Chad Basin and Yankari. These forests of Nigeria contribute immensely to the national Gross Domestic Product (GDP) and sustenance of the livelihoods of the people. What led to the earlier slow development of the forestry sector in Nigeria, noted some organisations [26] was perhaps the perception by policymakers that it contributed less to the economy of the country. However, this later changed due to the structured campaign of awareness targeted at policymakers through their membership at various National Forestry Action Programme (NFAP) committees. The information in Table 4 indicates the earlier efforts made by the Forestry Management Evaluation and Coordinating Unit (FORMECU) towards estimating the resources to be expended over a 5-year period for sustainable forestry development in Nigeria by various sectors namely, Federal, State, and Local Governments. Others are community, private, and donor organisations. For the four programmes indicated, donor organisations accounted for the larger
proportion (47.80%) with US$46.8m. This is followed by the Federal Government and Private Sector with 24.11% (US$23.6m) and 11.75% (US$11.5m), respectively. While the State Government accounted for 8.38% (US$8.2m), the community was to contribute 4.95% equivalent of US$4.85m. Incidentally, the Local Government Area that is closer to the people that have direct interaction with the forest resources would expend a sum of US$2.95m representing a meager 3.01%. In all, a total sum of US$97.9m was to be spent over the period under consideration. Given the above scenario, it could be stated that the level of commitment by the public sector in the sustainable development of forestry industry in Nigeria has been very minimal taking into cognisance of the role forest resources play in the lives of the people of the country, especially the northern parts. Table 4. Estimated investment requirement for development in Nigeria (US$ million)
Prog Donor Fed State LG Com Pri TL FMP 23.5 8.8 4.9 1.35 3.3 3.3 43.2
SFP 14.3 8.05 2.5 0.75 3.5 3.0 32.1
FIDP 2.0 2.3 0.8 0.5 - 5.2 10.8
ISP 7.0 4.45 - 0.35 - - 11.8
Total (TL)
46.8 47.8%
23.6 24.11 %
8.2 8.38%
2.95 3.01 %
4.85 4.95%
11.5 11.3 %
97.9 100%
Note: Prog. = programme; Fed = federal; LG = local govt.; Com = community; Pri = private; FMP = forest management programme; SFP = social forestry programme; FIDP = forestry industry development programme; ISP = institutional strengthening programme.
Source: FORMECU (1996) in EC/FAO (2003)
While the immense central role beekeeping plays in the economies of both advanced and developing nations where the knowledge and the services of the industry have been properly assessed, documented, and promoted abound in the literature around the globe, the methods of the farming is still largely traditional in Nigeria. Apart from few attempts made by some researchers [27; 28; 3 29] in assessing the viability of beekeeping in alleviation of poverty among citizens of the country, very little or no efforts have been put in place by the public and private sectors towards this direction. As beekeeping has been confirmed to surpass crop production in terms of income generation for farmers [3; 14; 28], generates raw materials for industries [30; 31; 32], promotes Afforestation and by extension biodiversity,

Scientific Papers Series Management, Economic Engineering in Agriculture and Rural Development Vol. 14, Issue 2, 2014 PRINT ISSN 2284-7995, E-ISSN 2285-3952
184
noted two imminent researchers [33; 17], and earns foreign exchange for countries that export the hive crops (34; 28\), then certainly the beekeeping industry can play a vital role in the livelihoods and economies of both rural and urban communities. Since among the various farming options available to man, beekeeping is the simplest, most affordable and capable of being undertaken by the most poor resource farmers [35], then adopting the enterprise by policymakers as a bridging instrument between balancing the environment through Afforestation and livelihoods of the communities becomes imperative. A report by the News Agency of Nigeria [36] indicated that the Federal Government of Nigeria (FGN) has now resuscitated the Council for Shelterbelt and Afforestation (CSA) with the mandate of ensuring that all issues regarding ecological problems are rapidly resolved in the country. Specifically, it is charged with halting the southward movement of the Sahara Desert and mitigating its effect on the integrity of the environment. Although the CSA was initially set-up in 2004, the establishment of a similar outfit, the Great Green Wall (GGW) initiatives, in 2005 led to its dormancy. The latter was saddled with the responsibility of establishing regional Afforestation projects that span about 1500 km from the east to west and two-km wide from north to south using both economic and non-economic tree species to be based on community-driven and integrated rural approach. These are all laudable projects that would definitely restore the degraded land and vegetation cover if implemented properly. But thorough awareness campaigns for rural community members and absolute commitment on the part of the policymakers are necessary requirements for the success of the programmes. In this regard, integrating a rural-based community enterprise into the programmes like beekeeping would further strengthen the income of the people, and enhance Afforestation, thereby reducing the scourge of desertification. The status of beekeeping in Northern Nigeria
Information in Table 5 shows the general status of beekeeping in northern Nigeria. Table 5.The status of apiculture/beekeeping in North-East Nigeria
State No. to be inter- viewed
No. inter- viewed (No. / %)
Type of beehive in use
Frequently/ percentage of beehives (No. / %)
Adamawa 30 25 (20.83) Log 132 (47.83) Bauchi 30 20 (16.67) Woven
straw 55 (19.93)
Borno 30 15 (12.50) Earthen pot
27 (9.78)
Gombe 30 22 (18.33) Pit 09 (3.26) Taraba 30 27 (22.50) Gourd 46 (16.66) Yobe 30 11 (9.17) Plastic
bowl 07 (2.54)
Total 180 120 (100) 276 (100)
Note: Values in parentheses are percentage of the total Source: Computed from field data (2013)
The apiculture practice or beekeeping in northern Nigeria and particularly the north-east has been described by several authors [28; 35; 29]. This is basically determined by the types of beehives in use in a locality, be it improved or native. All these scholars documented that beekeeping in the northern parts of Nigeria is largely traditional. In other words, most beehives in use have been the native (Log, Pot, Woven straw, etc.). The findings in Table 5 revealed that almost a decade or more from the time of these authors’ reports, the situation has not significantly changed. It could be observed from the Table 5 above that although a total number of 180 beekeepers were scheduled for interview, only 120 were accessed. This was not unconnected with the poor security situation experienced in the north-eastern parts of the country, with Borno and Yobe States as most hit. The Table (5) also shows that, of all the beehives in use by the beekeepers/apiarists, majority (97.46%) were native-make otherwise known as traditional, with Log beehives accounting for the larger proportion (47.83%). Woven straw, gourd, earthen pot and the use of pit recorded 19.93%, 16.66%, 9.78% and 3.26%, respectively. Plastic bowl which is neither traditional nor improved, but an improvised material, accounted for only 2.54%. With the types of beehives still in use in the study area, it could be stated with some

Scientific Papers Series Management, Economic Engineering in Agriculture and Rural Development Vol. 14, Issue 2, 2014 PRINT ISSN 2284-7995, E-ISSN 2285-3952
185
significant level of perfection that beekeeping is largely traditional in the northern parts of the country. Given the above situation and if beekeeping should maximally be of benefit to the people and afforestation projects or programmes of the government, the methods must be improved. In this regard, a low-technology beekeeping in the form of Kenya top-bar beehive is recommended for its simplicity. CONCLUSIONS Based on the findings of this study, it could be stated that the livelihoods of the poor majority of the people of northern Nigeria had devastating effects on the Afforestation efforts in the area, and beekeeping enterprise could be used as a bridge between the two (poverty and Afforestation) factors. Also, all the three tiers of governments (Federal, State and Local) in the country in the past had not invested adequate resources towards the development of the forestry sector. Similarly, both the private and public sectors had not recognized the role of beekeeping industry in improving the livelihoods of the poor resource people as well as enhancing Afforestation programmes. It is therefore, strongly recommended that policymakers should address the dynamics between poverty, Afforestation and beekeeping with the hope of stabilising the economic situation of the people of northern Nigeria and by extension improves their incomes and livelihoods. Specifically, both the private and public sectors should intensify efforts in the allocation and expenditure of adequate resources rationally towards the development of Afforestation programmes, and beekeeping enterprise should be integrated in these programmes as a bridging force. ACKNOWLEDGMENTS I sincerely thank the management of the Adamawa State University, Mubi, Nigeria, for allowing me time to conduct this study, and Professor W. B. Ndahi, Drs. P. V. Kwaghe and B. H. Gabdo, of the Faculty of
Agriculture of the University, for their valuable advice. REFERENCES [1]Ayodele, I. A., Onyekuru, J. E., 1999, Essentials of Beekeeping. Sam Bookman Publishers. 45pp [2]Babanyara, Y. Y., Saleh, U. F., 2010, Urbanisation and the Choice of Fuel Wood as a Source of Energy in Nigeria. Journal of Human Ecology. 31(1): 19-26 [3]Dalang, M., 2001, Apiculture and Poverty Alleviation. Plateau Agricultural Development Programme, PADP, Newsletter 4 (5): 6 -9 [4] Dashe, N. V., 2006, Economics of Beekeeping and Use of Bee Products. Papers Presented at a Beekeeping Training Workshop Organised for Farmers by SMJ Ventures, Jos Plateau State. Held at Ministry for Women Affairs, Yola, Nigeria. 14th-15th December [5]Dukku, U. H., 2001, The Role of beekeeping in Poverty Alleviation and Environmental Protection. Paper Presented at the Monthly Technology Review Meeting (MTRM). Held at MTRM Hall, Bauchi State Agricultural Development (BSADP) Headquarters. 28th February. 4pp [6]Dukku, U. H., 2013, Identification of plants visited by the honeybee, Apis mellifera L. in the Sudan Savanna zone of northeastern Nigeria. African Journal of Plant Science. 7(7): 273-284 [7]Eluagu, L. S., Nwali, L. N., 1999, An Economic Appraisal of an Improved Method of Beekeeping in Nigeria: A Case Study of Apiculture Unit, Federal College of Agriculture, Umudike. Nigerian Agricultural Journal. 30: 99-144 [8]European Commission/Food and Agriculture Organisations, EC/FAO, 2003, Experience of Implementing National Forest Programmes in Nigeria. EC-FAO Partnership Programme. EC Tropical Forestry Budget Line Project B7 6201/98-08/VIII/FOR Project GCP/RAF/354/EC. Pp74 [9]Farinde, A.J., Soyebo, K.O., Oyedokun, M.O., 2005, Exploration of Beekeeping as a Copping Strategy in a Deregulated Economy. Journal of Agricultural Extension.8:76–83. [10]Gebreegziabher, Z.; Mekonnen, A.; Kassie, M. and Kohlin, G., 2010, Household Tree Planting in Tigrai, Northern Ethiopia: Tree Species, Purposes, and Determinants. Environment for Development, Discussion Paper Series-EfD DP 10-01. Pp26 [11]Ja’afar-Furo, M. R., Sulaiman, A., Hong, E. S., 2006, A Comparative Analysis of Beekeeping and Crop Production in Adamawa State, Nigeria. Apiacta. 41: 44-53 [12]Ja’afar-Furo, M. R., 2007, Appraising the perception of farming communities towards adoption of apiculture as a viable source of income in Adamawa State, Nigeria. The Apiacta. 42: 1-15 [13]Ja’afar-Furo, M. R., 2007, Economic Effects of Bee Pollination on Maize Yield in Furo, Fufore Local Government Area, Adamawa State, Nigeria. Global Journal of Agricultural Sciences. 6(2): 149-152
Scientific Papers Series Management, Economic Engineering in Agriculture and Rural Development Vol. 14, Issue 2, 2014 PRINT ISSN 2284-7995, E-ISSN 2285-3952
186
[14]Lemessa, D., 2007, Beekeeping: A Livelihood Strategy in Pastoral and Agro-Pastoral Dry Land Areas of Southern Oromia (Liban District) and Somali Regional States (Filtu and Dollo Ado Districts). [15]Medugu, N. I., Majid, M. R., Johar, F., Choji, I. D., 2010, The role of afforestation programme in combating desertification in Nigeria. International Journal of Climate Change Strategies and Management. 2(1): 35 – 47 [16]Morse, R., Calderone, N., 2000, The value of honeybees as pollinators of US crops in 2000. Bee Culture.1-15. [17]National Bureau of Statistics, NBS, 2007, Annual Abstract of Statistics. National Bureau of Statistics, Abuja, Nigeria. [18]National Bureau of Statistics, NBS, 2010, The Nigeria Poverty Profile 2010. National Bureau of Statistics, Abuja, Nigeria. 30pp [19]National Bureau for Statistics, NBS, 2012, Nigerian Poverty Profile 2012. [20]News Agency of Nigeria, NAN, 2013, Nigeria Inaugurates Council on Shelterbelt and Afforestation. Retrieved from - http://premiumtimesng.com, on 21/09/2013 [21]Nigeria Hand Book, NHB, 2010, The Nigeria Hand Book, 14th Edition. [22]Ojeleye, B., 1999, Foundation of Beekeeping in the Tropics. Published by CEBRAD Press, Ibadan, Nigeria. 225pp [23]Olagunju, D., 2000, Alleviating Poverty through Beekeeping. Charli-Tonia Publishers, Osogbo, Nigeria. 190pp [24]Olusegun, K. N., 2009, Threats to Nigerian Environment: A Call for Positive Action. Paper Presented at the 7th Chief S. L. Edu Memorial Lecture held at Ondo Town Hall. 13th August. [25]Saliu, O. J., Alao, J. S., Oluwagbemi, T., 2010, An Evaluation of Farmers’ Participation in Afforestation Programme in Kogi State, Nigeria. Journal of Agricultural Science.2(3): 248-257 [26]Shumba, E. M., 2001, Biodiversity and Planning Support Programme: Zimbabwe Case Study. Paper Prepared for an International Workshop on Integration in National Forestry Planning programme. Held in CIFOR Headquarters, Bogor, Indonesia. August 13th-16th [27]Ugoh, S. C. and Ukpere, W. I., 2009, Appraising the Trend of Policy on Poverty Alleviation Programmes in Nigeria with Emphasis on a National Poverty Eradication Programme (NAPEP). African Journal of Business and Management. 3(12): 847-854 [28] Winrock International (2006). The Contribution of Forests to local Livelihoods and the Tanzanian National Economy: A Summary of Case Study. Pp24 [29]World Bank (2011). Literacy Rates in Nigeria. www.admiralmarkets.com.ng. Accessed 15/09/2013 [30]World Health Organisations, WHO, 2006, Fuel for Life: Household Energy and Health- stripping our forests, heating our planet. P22 [31] Zaku, S. G., Kabir, A., Tukur, A. A., Jimento, I. G., 2013, Wood Fuel Consumption in Nigeria and the Energy Ladder: A Review of Fuel Wood Use in
Kaduna State. Journal of Petroleum Technology and Alternatives Fuels. 4(5): 85-89 Appendix 1: The NBS (2012) classified poverty into the following: i) Food Poverty line is N39, 759.49. This Food Poverty is an aspect of Absolute Poverty Measure which considers only food expenditure for the affected Households. ii) Absolute Poverty line is N54, 401.16. This is the second step in Absolute (Objective) Poverty measure. Here, this method considers both food expenditure and non- food expenditure using the per capita expenditure approach. (iii) The Relative Poverty line is N66, 802.20. This line separates the poor from the non-poor. All persons whose per capita expenditure is less than the above are considered to be poor while those above the stated amount are considered to be non-poor. iv) The Dollar Per day Poverty line is N54, 750. This measures, consider all individuals whose expenditure per day is less than a dollar per day using the exchange rate of Naira to Dollar in 2009/2010. v) The Subjective Poverty Measure is the perception of the citizenry. It is neither related to Per Capita Expenditure of household nor the Country adult – equivalent scale. From the survey result, the core poor is 46.7 percent, Moderate poor is 47.2 percent while the non-poor is 6.1 percent vi) Another critical measure of poverty is the Gini Coefficient (Inequality Measurement). This measure can explain the spread of Income or expenditure yet cannot explain increase or decrease of individuals or persons in poverty. In 2004, the Gini Coefficient was 0.4296 whereas in 2010 it was 0.4470 indicating that inequality increased by 4.1 percent nationally.

Scientific Papers Series Management, Economic Engineering in Agriculture and Rural Development Vol. 14, Issue 2, 2014 PRINT ISSN 2284-7995, E-ISSN 2285-3952
187
ANALYSIS OF THE FACTORS AFFECTING EFFECTIVENESS OF RANGELAND-DEPENDENT DAIRY CATTLE FARMS IN ERZURUM PROVINCE Abdurrahman KARA1, Semiha KIZILOĞLU2 1 Dicle University, 21280 Sur District Diyarbakır, Turkey, Phone: +904122488509, Internal: 8563, Fax: + 904122488153, Email: [email protected] 2Ataturk University, 21280, Yakutiye District, Erzurum, Turkey, Phone: +904422312584, Fax: +904422312678, Email: [email protected] Corresponding author: [email protected] Abstract With a special emphasis on the rangeland condition, factors affecting effectiveness of the farms were researched in this study. Study area covers Erzurum Province, Turkey. Villages were purposively selected from those of which rangeland conditions had been studied previously. Stratified sampling method was employed in determination of the sample size. Data were collected from the randomly selected farmers through face to face interviews, resulted in 99 completed questionnaires. Collected data by structured questionnaires were of 2004-2005 production year. Farms were studied under three farm size groups of 0-12, 12,1-25 and 25+ ha. In analysis of the data stepwise regression and multiple linear and log-linear regression models were used. As farm success criteria, net product and gross margin were calculated for every studied farm. According to the results, rangeland condition, stable type, number of cattle, size of cultivated land, amount of labour per farm and small ruminant flock existence in the village and number of small ruminant were found to be the most important factors affecting farm effectiveness. It was concluded that more robust and long-term studies should be conducted using a wider variation in rangeland condition to confirm the study findings. Key words: dairy cattle farms, Eastern Anatolia, Erzurum, farm effectiveness, rangeland condition, Turkey INTRODUCTION Composed of a wide variety of plant species, natural vegetations, pastures and meadows, are the most important biological sources of wealth for the nations. With their ecological functions, they preserve the soil and water while producing feed for a considerable part of animal kingdom [1]. So, rangeland biodiversity contributes to a number of commercially immeasurable outcomes such as ecosystem functions like elasticity to environmental disorders, soil and water quality and rural tourism [17]. Eastern Anatolia region of Turkey comes first among the other 6 regions with 57% and 36% of the total natural meadow and pasture assets respectively (Table 1). Hence, rangeland dependent extensive animal production has been a way of life for rural populations in this part of country for centuries. This region encompasses the easternmost provinces of Turkey. It has the highest
average altitude of all other regions and consequently, it has a more severe climate but greater precipitation than the Anatolian plateau. Climate limits the production pattern. Main crops are cool season cereals, forage crops, sugar beet, potato and sunflower. Cereals and forages are the dominant crops of the farming system. Due to the rugged nature of the geography, arable land is limited. Only 19% of the total land is arable and mostly allocated to cereals. Acreage of other crops is limited [26]. However, economy is based on agriculture which keeps its traditional ways of production. Mainly low yielding local crop varieties are used and farmers are generally unaware of suggested new agronomic techniques [20]. Animal sheds are mostly primitive, unhygienic constructions without sufficient ventilation and illumination [9],[19]. Farm animals have to be kept inside for 6 months during very long and harsh winter.

Scientific Papers Series Management, Economic Engineering in Agriculture and Rural Development Vol. 14, Issue 2, 2014 PRINT ISSN 2284-7995, E-ISSN 2285-3952
188
Table 1. Natural rangeland and meadow asset in the study area, Eastern Anatolia and Turkey
Geographic Unit
Meadow Rangeland
Amount (ha) Share in the Region (%)
Share in Turkey (%)
Amount (ha) Share in the Region (%)
Share in Turkey (%)
Erzurum 9.732,9 11,8 6,7 135.113,8 28,3 10,3 Eastern Anatolia 82.776,6 100,0 57,1 476.839,4 100,0 36,2 Turkey 144.931,3 100,0 1.316.737,5 100,0 Source: [36] Large ruminant population of the region is made of indigenous cattle breeds and their crosses which are hardy to local environmental conditions and utilize the regional grazing lands more efficiently. Small ruminant population, on the other hand, is composed of local sheep and goat breeds. Up to now, regarding the studies related to rangelands mostly vegetation studies have been conducted but the relationship between animal production and rangeland attributes have not been touched and investigated adequately. In recent years, natural rangeland improvement studies have gained importance in Turkey. For their sustainability and expansion their importance and future benefits should be touched in various aspects. So, in this paper were investigated the rangeland condition and other socioeconomic factors possibly affecting the farm effectiveness in the rangeland dependent dairy cattle farms to provide information for regional agricultural development studies. MATERIALS AND METHODS Study material was collected with questionnaires from the randomly selected farms. Also, records of the public organizations were used as secondary material. Study villages were purposively selected to make sure rangeland condition data were known. Sample size was calculated with stratified sampling method [7] at 90% confidence interval with a standard error of 10% of population mean. Strata were determined as 1-12 ha, 12.1-25 ha and 25.1 ha and higher. Data collected through face to face farmer interviews were of 2004-2005 production year and all of 99 questionnaires were evaluated. Rangeland conditions of the villages were determined previously
according to Resource and Environmental Data Interpretation System (REDIS) [11], using Integrated System for Plant Dynamics (ISPD) software package [4]. Village rangeland conditions varied between 30.8% and 52.1% (Table 2).
Table 2. Distribution of the villages by their rangeland condition values
No Name of the Village
Rangeland Condition (%)
Rangeland Condition Groups
1. Yayladağ 30,8 1 2. Pekecik 36,0
3. Taşağıl 36,7 4. Demirdöven 39,2
2 5. Gerek 45,1 6. İncedere 45,5 7. Yeniköy 48,4
3 8. Tipili 49,4 9. Şehitler 52,1
Household labour supply was calculated in adult male equivalent and farm family labour force was calculated in family labour workdays [10]. Ten hours of daily work was assumed [16],[22]. Prices stated by respondents were considered in evaluation of the farm products in economic analysis of the farms. Average wages paid to off-farm labour were taken into account in valuing the wages of household labour. In dairy cattle and sheep production, production unit (PU) was considered and one PU was calculated according to the data collected from the farms [10]. One PU comprises 1 head cow, 0.95 head calf, 0.80 head yearling and 0.77 head two yearling (of which 0.20 head to be preserved and 0.57 head to be sold). In sheep production 1 PU calculated to be 1 head sheep, 0.05 head ram, 1 head lamb, 0.12 head female yearling and 0.02 head male yearling in the light of primary and secondary data [2]. In depreciation of the farm assets the rates reported by [15],[16],[21] and [24] were

Scientific Papers Series Management, Economic Engineering in Agriculture and Rural Development Vol. 14, Issue 2, 2014 PRINT ISSN 2284-7995, E-ISSN 2285-3952
189
employed. Factors determining the effectiveness and success of the farms are classified as size, productivity and financial or economic indicators [23]. In this study, economic (financial) indicators were considered, and so, net product and gross margin were calculated for each farm. Moreover, amount of cultivated land, labour, number of cattle and sheep as scale indicators were given place as variables in the models. Also, animal breed and stable type, which are effective on productivity, education level and age of farmer, which are effective on farm effectiveness [3],[22],[26],[27],[33] were the variables included in the models. The differences among the farm enterprises were investigated with multiple linear regression models using Ordinary Least Squares approach [8],[13] Categorical variables were represented with dummy variables [28],[32]. Accordingly, net product and gross margin are thought to be separate functions of the following continuous and discrete variables. Y = α+β1X1+β2X2+β3X3+β4X4+β5X5+β6X6+
β7X7+β8X8+β9X9+α2D2+α3D3+α4D4+α5D5+ (1) α6D6+α7D7+α8D8+α9D9+ α10D10+ α11D11
Where: Y (NetProduct/
GrossMargin) : Net Product or Gross Margin (TRY)
X1 (RangeCond) : Rangeland Condition (%) X2 (NoofCattle) : Number of Cattle (PU) X3 (NoofSheep) : Number of Sheep (PU) X4 (FLabour) : Family Labour (AME) X5 (TCultLand) : Total Cultivated Land (ha)
X6 (ForAcreage) : Forage Acreage (ha) X7 (AgeofFarmer) : Age of Farmer (year) X8 (DtoRangeland) : Distance to Rangeland (m) X9 (StockingRate) : Stocking Rate in the Village Rangelands (AU.ha-1) Di (CattleBreed) : Cattle Breed (local/cross/purebred) D2 (Crossbred) : Crossbred (1=crossbred, 0=others) D3 (Purebred) : Purebred (1=purebred, 0=others) D4 (WaterSpot) : Water Spot in Rangeland site (1= near, 0=far) D5 (RotGrazing) : Rotational Grazing (1=yes, 0=no) D6 (Supplement) : Feed Supplement in Grazing Season (1=yes, 0=no) D7 (SRexistence) : Small Ruminant Flock Existence in the Village (1=exist, 0=not) Dk (EducLevel) : Education Level of the Farmer (illiterate, literate, primary, higher) D8 (Literate) : Literate (1=literate, 0=others) D9 (Primary) : Primary (1=primary, 0=others)D10 (Higher) : Higher (1=higher, 0=others) D11 (CattleShed) : Type of Cattle Shed (1=concrete, 0=traditional) e : Error term
In obtaining the regression models, the most explanatory variables were determined with stepwise regression technique. F test was employed to test the significance of models as a whole. Normality of the dependent variables was controlled with Skewness and Curtosis test as heterokedasticity was tested with Breusch-Pagan test. Moreover, multicollinearity was checked with variance inflation factor (VIF) [5],[13],[28]. In statistical analysis STATA 10.0 software package was used. According to Skewness-Curtosis test distribution of Gross margin is not normal as normality assumption was met for net product (Table 3).
Table 3. Skewness/Kurtosis tests for normality diagnostics for the dependent variables
Variable Pr(Skewness) Pr(Kurtosis) adj chi2(2) Prob>chi2 NetProduct 0.344 0.144 3.11 0.2115
GrossMargin 0.000 0.050 17.71 0.0001 Log-GrossMargin 0.166 0.538 2.36 0.3069
Table 4. Multicollinearity diagnostics for net product model
Multicollinearity Diagnostic Variable VIF 1/VIF
NoofCattle 1.30 0.767416 RangeCond 1.27 0.785697 TCultLand 1.25 0.800117
SRexistence 1.19 0.837189 FLabour 1.18 0.848272
CattleShed 1.13 0.882987Mean VIF 1.22
Table 5. Heteroskedasticity diagnostic for net product model
Heterokedasticity Diagnostic Breusch-Pagan/Cook-Weisberg test for Heterokedasticity Ho: Constant variance Variables: Fitted values of Milkyield Chi2(1) = 1.43 Prob > chi2 = 0.2321

Scientific Papers Series Management, Economic Engineering in Agriculture and Rural Development Vol. 14, Issue 2, 2014 PRINT ISSN 2284-7995, E-ISSN 2285-3952
190
In order to cure non-normality of gross margin log-linear transformation procedure was applied using natural logarithm. As seen from Table 4, 5, 6 and 7, VIF and Breusch-Pagan tests proved that net product and log-linear gross-margin models do not have multicollinearity and heterokedasticity problems [5],[13],[28]. Table 6. Multicollinearity and heteroskedasticity diagnostics for log-linear gross margin model
Multicollinearity Diagnostic Variable VIF 1/VIF
RangeCond 1.16 0.8646 NoofCattle 1.14 0.8745 NoofSheep 1.09 0.9214 CattleShed 1.07 0.9338 Mean VIF 1.11
Table 7. Multicollinearity and heteroskedasticity diagnostics for log-linear gross margin model
Heterokedasticity Diagnostic Breusch-Pagan/Cook-Weisberg test for Heterokedasticity Ho: Constant variance Variables: Fitted values of Milkyield Chi2(1) = 0.280 Prob > chi2 = 0.598 RESULTS AND DISCUSSIONS Gross margin and net product were given by farm size groups (strata) in Table 8. In all groups, net product is positive but is the highest in second group and the lowest in the
first group of farms. On the other hand, gross margin was increased parallel to the farm size groups. Table 8. Success and effectiveness criteria for the farms studied (TRY.farm-1).
Farm Success Criteria
Farm Size (ha) Average Mean 1-12 12,1-25 25,1+
Net Product 2.508,5 5.073,7 2.826,2 3.214,3Gross Margin 12.010,4 16.508,3 20.207,1 14.019,6 Considering the farm effectiveness per unit cultivated land, both of the success criteria decreased by farm size groups. It suggests that small farms are the most successful compared to the larger ones (Table 9). Table 9. Success and effectiveness criteria per hectare of farm land (TRY.ha-1)
Farm Success Criteria
Farm Size (ha) Average Mean 1-12 12,1-25 25,1+
Net Product 667,9 624,6 130,4 478,8Gross Margin 3.197,7 2.032,3 932,5 2.088,4 Of the 16 variables investigated for the multiple regression models given and explained above, according to the stepwise regression analysis 6 variables were placed in the net product model as 4 variables entered into the gross margin model. The findings for the net product and gross margin models were given in Table 10 and 11 respectively.
Table 10. Regression analysis results for the factors effective on gross margin
Source SS df MS Number of obs = 99 Model 16.2487 4 4.0622 F(4, 94) = 14.15
Residual 26.9843 94 0.2871 Prob > F = 0.0000Total 43.2330 98 0.4412 R squared = 0.3758
Adj.R.squared = 0.3493 Root MSE = 0.53579
Loggmargin Coef. Std. Err T P>ǀtǀ [95% conf. Interval] RangeCond 0.1157 0.0663 1.75 0.084 -0.0159 0.2472 NoofCattle 0.1288 0.0252 5.11 0.000 0.0787 0.1789 NoofSheep 0.0102 0.0047 2.18 0.032 0.0009 0.0194 CattleShed 0.3216 0.1237 2.60 0.011 0.0760 0.5673 Constant 8.4992 0.1546 54.99 0.000 8.1923 8.8061
Despite of higher t and F values normal and adjusted R2 values fall between 27.5 and 34.9 in the models. The reason for this is the cross sectional data used in the study and their nature of higher variation [39]. However, low R2 does not so much matter and it can be
claimed that the coefficients of factors in the models were estimated quite accurately since the aim is to estimate the effect of the factors on the farm income instead of estimating the farm income itself [14].

Scientific Papers Series Management, Economic Engineering in Agriculture and Rural Development Vol. 14, Issue 2, 2014 PRINT ISSN 2284-7995, E-ISSN 2285-3952
191
According to the results given above, rangeland quality, cattle shed type and number of cattle (in production unit) entered both models. Total cultivated land, labour force and small ruminant existence in village were only represented in net product model as number of small ruminants (in production unit) was only found place in log-linear gross margin model (Table 8 and 9).
The models suggest that rangeland condition, number of cattle and type of cattle shed are the most important factors affecting farm success and effectiveness since they entered both models. The importance of rangeland condition in farm effectiveness can clearly be seen from Fig. 1.
Table 11. Regression analysis results for the factors effective on net product
Source SS df MS Number of obs = 99 Model 3.1173e+09 6 519546346 F(6, 92) = 7.20
Residual 6.6426e+09 92 72202336 Prob > F = 0.0000 Total 9.7599e+09 98 99590744 R squared = 0.3194
Adj.R.squared = 0.2750 Root MSE = 8497.2
Netproduct Coef. Std. Err t P>ǀtǀ [95% conf. Interval] RangeCond 2343.9770 1102.2570 2.13 0.036 154.7993 4533.1540NoofCattle 877.7842 426.9417 2.06 0.043 29.8413 1725.7270TCultLand -31.4931 13.1008 -2.40 0.018 -57.5123 -5.4739FLabour -604.8077 372.1199 -1.63 0.108 -1343.8700 134.2544
CattleShed 6265.1900 2017.9380 3.10 0.003 2257.3910 10272.9900SRexistence -3560.6230 1871.391 -1.90 0.060 -7277.3670 156.1209
Constant 1054.7450 3683.111 0.29 0.775 -6260.2320 8369.7220
Fig. 1. Farm success and effectiveness indicators by farm size and rangeland condition groups When mentioned about the trampling damage of the grazing animals to rangelands it is reported that 10-15% of the feed produced by the pastures could be lost due to trampling and trampling damage varied by the type of grazing animals [25], cited in [12]. For example, it was reported that sheep grazed 33% and trampled 27% as cattle grazed 50% and trampled 13% on the same vegetation. However, negative effects of the grazing are much more obvious in the villages where small ruminant flocks exist since cattle are more disadvantageous than sheep when grazing together under heavy grazing conditions [12] and rangelands have been subject to misuse and exploitation in an
opportunistic manner in the region as is the case throughout the country [37]. In proving this, the dummy variable “existence of small ruminant flock in the village” entered to the net product model which is significant at 90% confidence level (Table 9). As stated above, this result suggests that rangelands are damaged more in the villages where small ruminants exist due to higher trampling damage. Another reason for this is that small ruminants can better utilize the rangelands with their special mouth structure than large ruminants [6]. Of course, this result should not be interpreted as the necessity of abandonment from small ruminant production because this result may arise from disorganized and haphazard grazing. As a matter of fact, mix grazing, grazing with two or more kind of animals, is suggested for better utilization of the rangelands [12],[29],[30], since pasture plants preferred by different kind of animals vary. So, small ruminant existence in the villages is necessary for better utilization of the pastures. Trampling damage could be minimized through grazing fitting well to carrying capacities of the pastures.

Scientific Papers Series Management, Economic Engineering in Agriculture and Rural Development Vol. 14, Issue 2, 2014 PRINT ISSN 2284-7995, E-ISSN 2285-3952
192
Like rangeland condition, stable type found place in both regression models. This implies that it is one of the most important factors affecting farm effectiveness since physiological characteristics of dairy cattle are negatively affected under insufficient ventilation conditions [34]. In order to increase the performance of the farm animals, housing conditions should meet the most basic behavioural and physiological requirements [18],[30],[31]. It is obvious that farms with concrete stables have superiority to the others regarding the effectiveness indicators although concrete stables are not fully equipped to fulfil the animal welfare issues as well. This implies million TRYs of economic losses each year due to unfavourable animal housing conditions (Table 11). Arising public sense and EU legislation on animal welfare in case of a possible membership will bring important limitations. Rehabilitation of animal housing conditions is of great importance in increasing animal production oriented farm income and achieving the higher animal welfare standards in the region. Since animal production has an important share in total farm income in the region number of cattle per farm entered to each model. Considering the gross margin model in Table 10, one PU of increment in number of cattle will result in an increase in average gross margin per farm by 13.8%1 as this increment is 877.8 TRY for net product model (Table 11). Total cultivated land placed in net product model and appeared to be the factor affecting farm effectiveness negatively. A similar finding was also reported by [38] for the Polish private farm enterprises. The size of the cultivated land is a size indicator used in analysis of the farm enterprises and in making
1 In interpreting the coefficients of log-linear models, we should consider that each one unit increase in X multiplies the expected value of Y by . So, the coefficient of variable number of cattle ( ) (0.1288 in Table 10) means that one unit increase in number of cattle brings about 13.8% (= ) more gross margin.
comparisons with other farms [23]. Contrary to the expectations, the reason for this effect of the total cultivated land can be explained with over fragmentation of the farm land which increases with farm size in this study. Another reason bears in mind that bigger farms are not managed well. Because it is naturally expected that unit costs will decrease due to the higher effectiveness of the production factors with increases in farm size resulting in higher profitability compared to the smaller farms. Labour force, on the other hand, was determined to be another factor having negative effect on farm effectiveness in net product model. A similar finding was also reported by [35] as well. The reason for this negative effect can be explained with the higher idle labour in the farms (82%) determined in present study and the managerial failure in the bigger farms. CONCLUSIONS Eastern Anatolia region is suitable for extensive animal production due to its vast natural rangeland and meadow asset. Study results revealed that rangeland and housing conditions had significant effects on farm income. This suggests the necessity of rangeland improvement studies and supportive measures for animal production with a special emphasis on housing conditions in order to better utilize the natural resources of the region. However, it should be remembered that this study is the first example investigating the relationship between rangeland condition and farm effectiveness in the region. Yet, a narrow range of rangeland condition data (%30.8-52.1) was used in present study. For that reason, the magnitude of the effect of rangeland condition on farm income may be much more than the findings of the present study. So, repetition with a dataset for about three production year in the villages carefully selected according to rangeland condition classes will be of beneficial.

Scientific Papers Series Management, Economic Engineering in Agriculture and Rural Development Vol. 14, Issue 2, 2014 PRINT ISSN 2284-7995, E-ISSN 2285-3952
193
ACKNOWLEDGMENTS We would like to express our gratitude and extend our thankfulness to the Rangeland Team of Eastern Anatolia Agricultural Research Institute who carried out vegetation surveys and determined rangeland conditions of the study villages previously. REFERENCES [1] Altın, M.A., Gökkuş, A., Koç, A, 2005, Pasture and Meadow Improvement. General Directorate of Agricultural Production and Development, Ministry of Agriculture and Rural Affairs. Ankara, Turkey, 466 p. [2] Anonymous, 2009, Small Ruminants On-Farm Breeding Scheme: Morkaraman Sheep 2008 Development Report. Eastern Anatolia Agricultural Research Institute, Erzurum, Turkey. [3] Ansaloni, F, 1995, Success factors for dairy farming in the North Italy, Proceedings of the 10th International Farm Management Congress, 10-16th July, Reading, UK. pp.307-317. [4] Bosch, O.J.H., Gauch, H.R., Boysen, J., Stols, S.H.E., Gouws, G.A., Nel, M.W., Van Zyl, E, 1992, ISPD, An Integrated System for Plant Dynamics (Computer Software Package and Users Guide). Department of Plant and Soil Sciences, Potchefstroom University for Christian Higher Education, Potchefstroom, South Africa. 101 p. [5] Callaghan, K. J., Chen, J., 2008, Revisiting the Collinear Data Problem: An Assessment of Estimator ‘III-Conditioning’ in Linear Regression. Practical Assessment Research & Evaluation, 13 (5):1-5. [6] Çakır, A., Aksoy, A., Haşimoğlu, S., 1995, Animal feeding operations. Erzurum: Atatürk University Press. No: 179, Erzurum, Turkey, 413 p. [7] Çiçek, A., Erkan, O., 1996, Research Sample and Sampling Methods in Agricultural Economics, Gaziosmanpaşa University Faculty of Agriculture Publications:12, Tokat, Turkey, 118 p. [8] Düzgüneş, O., Kesici, T., Kavuncu, O., Gürbüz, F., 1987, Research and Experimental Methods (Statistical Methods-II), Ankara University Faculty of Agriculture Publications: 1021, Textbook: 295, Ankara, Turkey, 381 p. [9]Emsen, H., 1997, Principles of Animal Husbandry (Third Edition), Ataturk University Publications No.720, Faculty of Agriculture Publications No: 310, Textbook Serials No: 62, Ataturk University Faculty of Agriculture Press, Erzurum, Turkey, 231 p. [10]Erkuş, A., Demirci, R., 1996, Agricultural Enterprises and Business Planning. Ankara University Publications: 1435, Faculty of Agriculture Textbooks: 417, Ankara, Turkey, 120 p. [11] Gibson, R. S., Allen, W.J., Bosch, O.J.H,, 1995, Condition assessment concepts and their role in facilitating sustainable range management. In: Annals of Arid Zone, 34 (3): 179-189.
[12] Gökkuş, A., Koç, A., 2001, Range and Pasture Management, Atatürk University Faculty of Agriculture Publications No:228, Erzurum, Turkey, 329 p. [13] Gujarati, D. N., 1995, Basic Econometrics (Third Edition). McGraw-Hill, New York, USA, 838 p. [14] Gujarati, D. N., 2011, Econometrics By Example,
McGraw-Hill, USA. [15] Gülten, Ş., 1975, Valuation, Ataturk University Publications No:425, Faculty of Agriculture Publications: 202, Textbook No: 29, Baylan Press, Ankara, Turkey, 144 p. [16] Hatunoğlu, T., 1973, Economic Analysis of the Sugarbeet Growing Farm Enterprises Operating in Upper Pasinler Plain Using Linear Programming Method. Ataturk University Publications No: 302, Faculty of Agriculture Publications: 147, Research Series No: 84, Sevinç Press, Ankara, Turkey, 98 p. [17]Hopkins, A., Holz, B., 2006, Rangeland for agriculture and nature conservation: production, quality and multi-functionality. Agronomy Research, 4 (1): 3-20. [18]Hristov, S., Stankovic, B., Zlatanovic, Z., Todorovic, M.J., Davidovic, V., 2008, Rearing conditions, health and welfare of dairy cows. Biotechnology in Animal Husbandry, 24 (1-2): 25-35. [19]Kara, A., 2000, Agricultural enterprises in Erzurum and Kars provinces: Capital structure and comparison of agricultural activity results. MSc thesis (Unpublished), Ataturk University Graduate School of Natural and Applied Sciences, Erzurum, Turkey. [20] Kara, A., Kadıoğlu, S., Küçük, N., Günay, G., 2002, Determination of Farmer Problems and the Factors Limiting Agricultural Production in Farming Systems Dependent on Meadow, Pasture and Forage Crops in Erzurum, Kars, Ardahan and Ağrı provinces, Project Final Report, Project No: TAGEM/TA/98/11/ 01/002, Eastern Anatolia Agricultural Research Institute, Erzurum, Turkey. [21] Karacan, A.R., 1975, Economic Analysis of the Farm Enterprises Operating in Elazığ Central District, Problems Related to Agricultural Credit Cooperatives and the Role of Agricultural Credit and Cooperatives in Community Development, Ataturk University Publications No: 372, Faculty of Agriculture Publications No: 176, Research Series No: 107, Sevinç Press, Ankara, Turkey, 188 p. [22]Karagölge, C., 1973. Econometric Analysis of the Farm Enterprises in Erzurum According to Tenure Rights, Ataturk University Publications No: 312, Faculty of Agriculture Publications No: 153, Research Series No: 90, Sevinç Press, Ankara, Turkey, 112 p. [23]Karagölge, C., 1996, Agribusiness, Ataturk University Publications No: 427, Faculty of Agriculture Publications No: 326, Textbook No: 107, Erzurum, Turkey, 127 p. [24]Kızıloğlu, S., 1989, The Rotation-Farm Activity Relationship and Determination of Optimum Production Plan in Farm Enterprises of Oltu District, PhD thesis (Unpublished), Ataturk University Graduate School of Natural and Applied Sciences, Erzurum, Turkey.

Scientific Papers Series Management, Economic Engineering in Agriculture and Rural Development Vol. 14, Issue 2, 2014 PRINT ISSN 2284-7995, E-ISSN 2285-3952
194
[25]Laycook, W.A., Harniss, R.O., 1974, Trampling damage on native forb-grass ranges grazed by sheep and cattle, XII. International Grassland Congress Proceedings, Grassland Utilization-1, 11-20th June, Moscow, Russia, 349-354. [26] Lionberger, H.F., 1960, Adoption of New Ideas and Practices. The Iowa State University Press, Ames, Iowa. [27]Lockheed, M. E., Jamison, D.T., Lau, L.J., 1980, Farmer Education and Farm Efficiency: A Survey. In: T. King /Ed), Education and income: A background study for World Development Report, World Bank, Washington D.C, pp. 52-111. [28] Neter, J., Wasserman, W., Kutner, M.H., 1989, Applied Linear Regression Models, Second Edition, Richard D Irwin, Boston, USA, 667 p. [29] Nolan, T., 1982, Meat production in efficient grassland farming. Proceedings of the 9th General Meeting of the European Grassland Federation Occasional Sympozium No:14, British Grassland Society, 5-9 September, Reading, UK. [30] Nolan, T., Connolly, J., 1989, Mixed v. mono-grazing by steers and sheep, Animal Production. 48 (3): 519-533. [31]Özlütürk, A., Kopuzlu, S., Dursun, E., 2002, Improvement of Beef Production From Local Cattle (Eastern Anatolian Red Cattle) Through Beef Bulls (Charolais and Simmental), Project Final Report, Project No: TAGEM/HAYSÜD/98/09/05/010, Eastern Anatolia Agricultural Research Institute, Erzurum, Turkey. [32] Park, H.M, 2009, Linear regression models for panel data using SAS, Stata, LIMDEP, and SPSS. Working Paper. The University Information Technology Services (UITS), Center for Statistical and Mathematical Computing, Indiana University, Available: http://www.indiana.edu/~statmath/stat/all/panel [33] Rogers, M.E., 1983, Diffusion of Innovations. The Free Press, New York, USA, 453 p. [34] Sabuncuoglu, N., Akbulut, O., Çoban, O., Lacin, E., Yıldız, A., Sağsöz, Y., Ceylan, Z.G., 2007, Effect of barn ventilation on some physiologic and milk traits of dairy cows. Journal of Animal and Veterinary Advances 6 (2): 190-193. [35]Topçu, Y., 2008, Analysis of Success Factors in Dairy Farms: Case Study of Erzurum Province, Journal of Faculty of Agriculture, Ondokuz Mayıs Universitesi, 23 (1): 17-24. [36]TURKSTAT, 2010, General Agricultural Census, 2001. Prime Ministry Turkish Statistical Agency, www.tuik.gov.tr [37] Unal, S., Karabudak, E., Ocal, M.B., Koç, A., 2011, Interpretations of vegetation changes of some villages rangelands in Çankırı province of Turkey, Turkish Journal of Field Crops, 16 (1): 39-47. [38] Wasilewski, M., 2005, Effectiveness and financial condition of private farms in relation to agricultural land area, Electronic Journal of Polish Agricultural Universities (EJPAU), 8 (4), Available: http://www.ejpau.media.pl/volume8/issue4/art-83.html
[39]Yavuz, F., Dağdemir, V., Altunkaynak, A., 2002, An Econometric Analysis of the Factors Affecting Winter Food Storage in Erzurum Central District. Atatürk Üniversitesi Ziraat Fakültesi Dergisi, 33 (3): 323-330.

Scientific Papers Series Management, Economic Engineering in Agriculture and Rural Development Vol. 14, Issue 2, 2014 PRINT ISSN 2284-7995, E-ISSN 2285-3952
195
STUDY ON SUSTAINABLE DEVELOPMENT TRENDS OF ROMANIA AGRICULTURE Ioana NICULAE, Georgiana Melania COSTAICHE, Reta CONDEI University of Agricultural Sciences and Veterinary Medicine Bucharest, 59 Marasti, District 1, 11464, Bucharest, Romania, Phone/Fax: 00 40 744 6474 10, Email: [email protected], [email protected] Corresponding author: [email protected] Abstract The purpose of this paper is to highlight the progress of Romania on sustainable agriculture and what are the prospects for this type of development, given the possibilities and restrictions it has. For Romania, European Union member state, sustainable development represents a rational national perspective, resulting in a new paradigm of development, to establish the confluence of economic, social and environmental. To highlight the development of sustainable agriculture in Romania was taken into account a number of indicators, and calculate the indices fixed-base. The calculations were based on data provided by the Romanian Statistical Yearbooks 2008-2013, and the data provided on the website of the Ministry of Agriculture and Rural Development. To achieve sustainable development, Romania has important strengths such as: the soil that allows the practice of ecological agriculture, but there is also problems, of which the most important are: scientific research in agriculture is low, the number of researchers is declining due to financial problems. Key words: Romania, sustainable agriculture, trends INTRODUCTION Agriculture is a main branch of the national economy, through its contribution to the economy and the share of employment, a path of economic development, a key area of current research of our country and abroad. Romania's potential of the land fund, has a relative stability, which can be an essential support for achieving a competitive agriculture, in terms of economic management and organizational competitiveness. [6] “Sustainable development is development which aims to meet the needs of the present without compromising the ability of future generations to meet their own needs”, as defined in the Brundtland Report. [8] For Romania, European Union member state, sustainable development represents a rational national perspective, resulting in a new paradigm of development, to establish the confluence of economic, social and environmental.[7] EU Council adopted on June 9, 2006, the renewed Sustainable Development Strategy for an enlarged Europe, aimed at continuously
improving the quality of life for present and future generations through the creation of sustainable communities able to manage and use resources efficiently to capitalize on the ecological and social innovation potential of the economy a view to ensuring prosperity, environmental protection and social cohesion.[7] Sustainable agriculture constitutes a vast and highly complex problem, aimed at achieving and maintaining a balance between the need to preserve the material and moral landscape and pace of change caused by the modernization of the sector.[2] Sustainable development has the role of contribute to the improvement of the Romanian agriculture so that they can achieve economic objectives, to ensure accountability on environmental protection and promote social equity in terms. [2] Sustainable agriculture integrates three main goals--environmental health, economic profitability, and social and economic equity.[10] In short Sustainable Agriculture is:[12] -Economically Viable: If it is not profitable, it is not sustainable.

Scientific Papers Series Management, Economic Engineering in Agriculture and Rural Development Vol. 14, Issue 2, 2014 PRINT ISSN 2284-7995, E-ISSN 2285-3952
196
-Socially Supportive: The quality of life of farmers, farm families and farm communities is important. -Ecologically Sound. We must preserve the resource base that sustains us all.
Fig. 1. Schematic diagram of various views of agriculture, represented by shaded areas. Sustainable agriculture is the intersection of economically sound, ecologically viable, and socially responsible approaches (A); some agriculturists fear that they will be forced to achieve environmental and social goals at the expense of economics (B); a negative perception of agriculture views it as achieving economic goals at the expense of environment and society (C); a desirable future would include expansion of the area that achieves all three goals through improved research and practical experience (D). [11] The purpose of this paper is to highlight the progress of Romania on sustainable agriculture and what are the prospects for this type of development, given the possibilities and restrictions it has. MATERIALS AND METHODS To highlight the development of sustainable agriculture in Romania was taken into account a number of indicators (share of rural population in the total population, the share of agriculture in total rural population), and calculate the indices fixed-base to determine the evolution of cultivated areas, the evolution of number of livestock. The calculations were based on data provided by the Romanian Statistical Yearbooks 2008-2013, and the data
provided on the website of the Ministry of Agriculture and Rural Development. RESULTS AND DISCUSSIONS Sustainable development involves a multidimensional approach, taking into account the economic dimension, socio-cultural and environmental.[1] This is possible by controlling in the time and space of the following five categories of factors and their relationships: population, natural resources and environment, agricultural production, industrial production, pollution.[3] Table 1: The evolution of the rural population in total population Specification
Share of rural population in
total population
Fixed base indices (%)
The evolution of
rural population
(%) 2007 45.14 2008 45.94 2008/2007 101.76 2009 46.11 2009/2007 102.13 2010 46.05 2010/2007 102.01 2011 46.01 2011/2007 101.91 2012 45.99 2012/2007 101.87
Source: own calculations based on data from Statistical Yearbooks of Romania 2008-2013 Analyzing the table 1 it can be seen that the rural population in the total population has a share of around 46% during 2007-2012. Analyzing the evolution of rural population in the period 2008-2012 compared with 2007 notes that the growth is 1-2%. Table 2: Rural population and agricultural population of Romania Specific
ation Rural
population Population
from agriculture
The share of agriculture in the rural population
2007 9,427,486 2,462,000 26.12 2008 9,435,046 2,407,000 25.51 2009 9,390,879 2,411,000 25.672010 9,324,629 2,440,000 26.17 2011 9,269,558 2,442,000 26.34 2012 9,242,268 2,10,000 27.16
Source: Romanian Statistical Yearbooks 2008-2013, own calculations based on data from Statistical Yearbooks of Romania 2008-2013 So it can be concluded that in the period under review there are large differences in population trends by area of residence.

Scientific Papers Series Management, Economic Engineering in Agriculture and Rural Development Vol. 14, Issue 2, 2014 PRINT ISSN 2284-7995, E-ISSN 2285-3952
197
According to Table 2, the share of employment in agriculture in the rural population show a slight decrease in 2008 and 2009 compared with 2007; in the years 2010, 2011 and 2012 is an increase compared to 2007. Share of population from agriculture increased from 26.12% in 2007 to 27.16% in 2012. Increasing the share of rural population (Table 1) and population working in agriculture may be due to direct subsidies to producers, the support mechanism of the economy and environmental protection areas. The infrastructure development programs in rural areas contributed to increased quality of life in this environment. It can be observed according to the table No. 3 that the share of total agricultural land area is 61.7%. According to Figure 1, structure of the agricultural land in 2012 was: 64% arable land, 22% grassland area, 11% area with meadows, 2% area with vineyards and nurseries and 1% area with orchards and tree nurseries. The surface cultivated with cereals has the largest share of the total area, 67% in 2012 and in 2008-2012 compared with 2007, recorded increases of up to 3.9% in 2011. Table 3. The fund land by use type (thousand ha) Specification 2007 2008 2009 2010 2011 2012 The total area of the land fund
23,839.1 23,839.1 23,839.1 23,839.1 23,839.1 23839,1 The agricultural area
14,709.3 14,702.3 14,684.9 14,634.5 14,621.5 14615,1
Arable 9,423.3 9,415.1 9,422.5 9,404.0 9,379.5 9392,3 Pastures 3,330.0 3,333.0 3,313.8 3,288.7 3,279.3 3270,6 Hayfields 1,531.4 1,532.4 1,528.0 1,529.6 1,554.7 1544,9 Vineyards and vine nurseries
218.0 214.5 215.4 213.6 211.3 210,5 Orchards and tree nurseries
206.6 207.3 205.2 198.6 196.7 196,8
Source: Romanian Statistical Yearbooks 2008-2013[4] The effective use from the point of view of economic agricultural land assume the existence of functional land market, respectively the ability to transfer land from less productive users on the most productive. Land reform of 1991 had a negative effect on the dimensional structure and organization of farm land.[6]
64%
22%
11%2%1%
structure of the agricultural area in 2012
Arable
Pastures
Hayfields
Vineyards and
vine nurseries
Orchards and tree
nurseries
Fig 2. Structure of the agricultural area in 2012
67%0%3%
16%
3%
11% 0%
surface with main crops in 2012
Cereals for grain
Grain legumes
Root crops
Industrial plants
vegetables
Green fodder
from arable land
Strawberries
Fig.3. Surface with main crops in 2012 Surface cultivated with industrial crops represented by: flax fiber and oil, hemp, sunflower, rapeseed, soybeans, tobacco and medicinal plants represented 16% in 2012, and in 2008-2012 compared with 2007, are recorded decreases approximately 7%, with the exception of 2010 and 2011 when there are increases of 5.6% and 9.9%.

Scientific Papers Series Management, Economic Engineering in Agriculture and Rural Development Vol. 14, Issue 2, 2014 PRINT ISSN 2284-7995, E-ISSN 2285-3952
198
Table 4. Evolution of the cultivated area in Romania (%) Specification 2008/
2007 2009/ 2007
2010/ 2007
2011/ 2007
2012/ 2007
Total area cultivated 100.27 101.37 100.39 103.91 103.61 Cereals for grain 101.59 102.99 98.27 101.86 106.07 Grain legumes 83.98 88.10 86.04 96.57 102.29 Root crops 93.22 92.78 88.19 87.29 83.01 Industrial plants 92.36 93.68 105.64 109.99 93.93 vegetables 106,00 105,41 103,67 103,95 102,17
Green fodder 107.83 107.54 110.81 114.19 113.64
Strawberries 86.67 83.33 90.00 90.00 76.67
Source: Romanian Statistical Yearbooks 2008-2013, own calculations based on data from Statistical Yearbooks of Romania 2008-2013 Surface cultivated with grain legumes in the period 2008-2011 compared to 2007, show production decrease, but in 2012 compared to 2007 is an increase. The areas planted with root crops and strawberries do not have important weights, and decreases in the period analyzed. The areas planted with vegetables and green fodder although not significant share, in 2008-2012 compared to 2007 is increasing by 6% in 2008 at vegetables and 14% at the green fodder in 2011. (table 4 and figure3) The surface cultivated with vegetables in Romania in the period 2007-2012 increased, but consumption demand is not provided. Table 5. Evolution of cultivated surface in ecological system (%)
Specification 2008/ 2007
2009/2007
2010/2007
2011/2007
2012/2007
crops on arable land
132.8 168.9 227.3 226.6 268.2
pastures and meadows
79.8 68.1 54.8 135.7 183.7
orchards and vineyards
159.1 195.9 324.2 436.7 815.6
The total area 108.3 122.2 147.7 185.9 233.1
Source: own calculations based on data from http://www.madr.ro/ro/agricultura-ecologica/dinamica-operatorilor-si-a-suprafetelor-in-agricultura-ecologica.html As shown in Table 5 we can see that ecological cultivated surface in 2008-2012 compared to 2007 shows a gradual increase, reaching 133.1% in 2012. It can be observed that arable crops are growing constantly in 2008-2012, while the area cultivated with
orchards and vineyards, recorded explosive growth, reaching 715.6% in 2012. Surface cultivated with pasture and meadow has an trending descending in the 2008, 2009 and 2010 compared with 2007, followed by an upward trend in 2011 and 2012 compared to 2007. Table 6. Evolution of livestock (%)
Specification
2008/ 2007
2009/2007
2010/2007
2011/2007
2012/2007
Cattle 95.2 89.1 70.9 70.5 71.2 Swine 94.0 88.2 82.6 81.7 79.7 Sheep 104.8 107.9 99.3 100.7 104.3 Goats 103.8 106.1 143.4 142.8 146.3 Horses 95.1 88.6 70.8 69.1 66.7 Poultry 102.8 102.2 98.5 97.3 97.6
Bees 101.6 107.6 129.8 127.2 127.7 Source: own calculations based on data from Statistical Yearbooks of Romania 2008-2013 Although cattle farming is a traditional activity of the rural population and the potential for making productions covering domestic needs and export, the livestock in the period 2008-2012 compared to 2007 is down by up to 30% in 2010 and 2011. In the growth of pigs can be seen the same downward trend in the period 2008-2012 compared with 2007, although pork consumption in Romania is high, particularly during the holiday season. There is a tendency to reduce the number of pigs, caused by new demands on the welfare of pigs. The growth of sheep and goats has revitalized livestock sector in the period 2008-2012 compared with 2007, given the trend of this period. Flocks had an upward trend between 2008 and 2009 compared to 2007, followed by a downward trend in 2010, 2011 and 2012 compared to 2007. Also can see the upward trend of bee populations, given the obtainable products: honey, pollen, beeswax, bee venom, royal jelly, and positive influences on agricultural production, ensuring pollination of plants. Beekeeping is one of the oldest occupations of the local population, which has developed in our country due to favorable natural conditions: climate, topography and vegetation. [6]

Scientific Papers Series Management, Economic Engineering in Agriculture and Rural Development Vol. 14, Issue 2, 2014 PRINT ISSN 2284-7995, E-ISSN 2285-3952
199
CONCLUSIONS Development of sustainable agriculture requires medium and long term investment in strengthening agricultural holdings and food processing enterprises, in advanced technologies, in appropriate equipment agricultural land through irrigation systems, drainage, erosion, protective forest field systems anti floods.[7] Development of sustainable agriculture involves ensuring internal demand products. The analysis can draw the following conclusions: -Share of rural population and population employed from agriculture has increased, as contrary to the objective 2013 of the National Strategy for Sustainable Development of Romania, which provides for the reduction of employment in agriculture in conjunction with the creation of viable farms. -Increasing the ecological cultivated surface, is a positive aspect of sustainable agriculture development, given that organic farming involves the use of technologies that includes more labor, is a system that ensures quality products, controlled and certified. -Low areas of orchards, vineyards and vegetables can not provide the necessary of domestic consumption, which hinders sustainable development. -Decreased the livestock, may have negative consequences for sustainable development agriculture, and to provide grants to improve the situation. To achieve sustainable development, Romania has important strengths such as: the soil that allows the practice of ecological agriculture, workforces, the existence of EU funds. But there is also problems, of which the most important are: scientific research in agriculture is low, the number of researchers is declining due to financial problems. REFERENCES [1]Beciu, S., 2013, Dezvoltarea rurală durabilă: Tendințe actuale și perspective ale regiuniide Nord Est a României, Editura Ceres [2]Borza Mioara, Dificultăţi în realizarea agriculturii durabile în România, Lucrări Ştiinţifice – vol. 51, seria
Agronomie, Universitatea de Ştiinţe Agricole şi Medicină Veterinară Iaşi [3]Stănilă, S., Roş, V., Molnar, A., Ranta, O., 2003, Using global positioning system in agriculture, Buletin USAMV-CN, 59/2003, Editura AcademicPres, Cluj-Napoca, 2003 [4]*** Anuarele Statistice ale Romaniei 2008-2013 [5]***Analiza socio-economică în perspectiva dezvoltării rurale 2014-2020, iulie 2013. [6]***Cadrul național strategic pentru dezvoltarea durabilă a sectorului durabilă a sectorului agroalimentar și a spațiului rural în perioada 2014 - 2020 – 2030 [7] ***Strategia Națională pentru dezvoltare durabilă a României, perspective: 2013,2020,2030, București, 2008. [8]***United Nations World Commission on Enviroment and Development, Brundtland Report, 1987 . [9]***http://www.madr.ro/ro/agricultura-ecologica/dinamica-operatorilor-si-a-suprafetelor-in-agricultura-ecologica.html [10]*** http://www.sarep.ucdavis.edu/about-sarep/def [11]***http://californiaagriculture.ucanr.org/landingpage.cfm?article=ca.v048n05p7&fulltext=yes [12]***http://www.westernsare.org/About-Us/What-is-Sustainable-Agriculture

Scientific Papers Series Management, Economic Engineering in Agriculture and Rural Development Vol. 14, Issue 2, 2014 PRINT ISSN 2284-7995, E-ISSN 2285-3952
200

Scientific Papers Series Management, Economic Engineering in Agriculture and Rural Development Vol. 14, Issue 2, 2014 PRINT ISSN 2284-7995, E-ISSN 2285-3952
201
ANALYSIS OF THE TRAINING NEEDS IN RENEWABLE ENERGY SOURCES FOR AGRICULTURAL SECTOR Zuzana PALKOVA1, Ioannis HATZILYGEROUDIS2, Sorin IONITESCU3 1Slovak university of Agriculture in Nitra, Tr. A. Hlinku 2, 949 76 Nitra, Slovakia, Phone: +421 917 913 793, E-mail: [email protected] 2University of Patras, Greece, E- mail: [email protected] 3University “Politehnica” of Bucharest, Romania, E-mail: [email protected] Corresponding author: [email protected] Abstract Global climate changes, the greenhouse gas emissions and reduced sources of traditional fossil fuels are one of the most serious environmental problems of present time. This fact was the starting point for Directive 2009/28/EC, which defined two objectives in the area of RES, the mandatory 20% share of RES in gross final energy consumption in the European Community and the mandatory 10% share of RES in transport, which all Member States must achieve by 2020. In 2011 was the share of renewable energy sources in total energy production in the European Union 13%. Promoting the use of renewable sources for electricity, heat, hot water, as well as promoting the use of biomass energy and construction of energy efficient buildings brings, in addition to environmental aspects, the development of innovative technologies, the transition to an energy-efficient economy and increase employment opportunities. Development in clean technologies becomes a strategic not only in terms of ecology, but has a significant impact on economic development and employment. This paper presents an analysis of training needs in clean technologies and renewable energy sources and through the Leonardo da Vincis’ projects – AVARES and C-TEST – supported by European Commission to show how to increase the attractiveness and accessibility of vocational education and training for employees in agricultural sector in the European Union. Key words: AVARES, C-TEST, clean technology, Leonardo da Vinci, need analysis, renewable energy sources, vocational education and training INTRODUCTION Vocational education and training (VET) aims to develop knowledge, skills, jobs’ habits and other competences of learners. The final effect of a graduation is the qualification, which enables them to engage in the working process as a skilled workforce or continue their studies. According to the Bruges Communiqué [2] it is essential to adapt the content of vocational training in favour of changing needs of labour market. Integration of needs of the changing labour market into the content of the vocational education and training requires better understanding of skills of new created sectors and related changes within more and more integrated Europe. VET students and VET-level employees currently have insufficient knowledge about Clean Technologies and sustainability and have lack of skills how to implement these broad themes in to the practice. The EU has
made it clear that investing in these qualities is important for a sustainable Europe. The European Council stated in Dec 2010 that this basis in VET-education is weak in its “Council conclusions on education for sustainable Development”. Likewise, the European Ministers for Vocational Education and Training stated in the same Bruges Communiqué: “Just as information and communications technology skills are essential for everybody today green skills will be important to almost every job in the future”. MATERIALS AND METHODS In the frame of the project C-TEST – “Clean Tech Employees & Students” the needs analysis has been realized between participants from Netherlands, Ireland, Slovakia, United Kingdom, Sweden and Hungary.

Scientific Papers Series Management, Economic Engineering in Agriculture and Rural Development Vol. 14, Issue 2, 2014 PRINT ISSN 2284-7995, E-ISSN 2285-3952
202
The need analysis focused on identifying of participants training needs in terms of the current situation in the field of clean technologies. Implementation of the need analysis was conducted in two stages. The first involved the creation of questionnaires focused on the signification of clean technology and sustainable development between managers of small and medium enterprises (SME). The second phase of the survey focused on the new methods of education in the learning process and relations of SMEs’ employees with the modern technologies. In the first quarter of 2013 around 100 questionnaires were distributed in the partner’s countries amongst SME companies – managers and employees. Structure of addressed SMEs was:
- clean technologies, - agrosector, - vocational education and training in
the agrosector, - heat and energy management, - building industry.
All the addressed organisations were more or less active in the field of agriculture therefore all the addressed institutions declared employees with agriculture oriented education. The two following graphs show that knowledge of renewable energy sources and clean technologies are important for more than 80% of managers within addressed SMEs.
Fig.1.Is it important for your organisations employees to possess knowledge in the field of renewable energy & clean technologies?
Fig.2.Is it important for your organisations employees to be aware of the importance of renewable energy & clean technologies?
Based on the results of the needs analysis we can say that most interesting topics for SMEs in agriculture are energy efficiency, waste management and energy from biomass (Figure 3). This fact comes from the structure of addressed SMEs – energy efficiency seems to be an interesting topic in time of energy crisis and agriculture oriented companies try to use the biomass for energy purposes.
Fig.3.Which of the following topics do you consider to be relevant for your employees to have knowledge about? Knowledge of traditional RES is relatively wide spread today. Results of the research confirm the worse situation in modern “green” technologies. Managers complied that their employees have the poorest knowledge especially of (Figure 4):
- energy efficiency, - waste management, - transportation/logistics, - fundraising for sustainability, - green construction (building), - energy from biomass.

Scientific Papers Series Management, Economic Engineering in Agriculture and Rural Development Vol. 14, Issue 2, 2014 PRINT ISSN 2284-7995, E-ISSN 2285-3952
203
Fig.4.What knowledge do you feel that your employees lack in the field of sustainability?
One of the last questions for managers considered support of education process by computers and other information and communication technologies. Positive answer gave us 88% of managers (Fig.5).
Fig.5.PC and ICT tools within the teaching process To receive feedback on the new methods of education in the learning process and to make the process more attractive, a group of questions have been prepared with the purpose to study the relationship of employees with the ICT, web 2.0 technologies and new forms of education, as well as getting their views on working with learning multimedia by the means of the so-called Smart devices. The results of the questionnaire survey show that participants - employees in agrosector - are familiar with ICT and that they use these technologies. An interesting finding is the fact that 100% of respondents use the Internet, but only 94% use PC.
Fig.6.What ICT tools do you use? (Multiple choose) This fact documents the assumption that traditional usage of computers falls and usage of smart devices is rising (smartphones, iPads, iPhones, etc.).
Fig.7.What are the e - learning and blended learning disadvantages? (multiple choose)
Fig.8.What are the e - learning and blended learning advantages? (multiple choose) Regarding the evaluation of e-learning as a form of learning process (Error! Reference source not found., Error! Reference source not found.), the biggest drawback seems to be dependence on technology (92%), lack of personal contact and interaction between learners and tutors as well as among learners

Scientific Papers Series Management, Economic Engineering in Agriculture and Rural Development Vol. 14, Issue 2, 2014 PRINT ISSN 2284-7995, E-ISSN 2285-3952
204
themselves. On the other hand, the greatest benefits of the implementation of ICT and e-learning methods in the learning process can be easy access to information (84%) and greater attractiveness of education (63%). 49% of respondents reported another advantage which is less time of learning and 37% of respondents reported an easy update of instructional materials. As disadvantages were reported: self-discipline (15%) and limited options to gain manual skills (14%). RESULTS AND DISCUSSIONS Results of the presented survey help to partners from Slovakia, Greece, Bulgaria, Germany, Portugal and Lithuania to identify the didactical and training needs for vocational education and training in terms of the current situation in the field of clean technologies and renewable energy sources and to develop learning courses for specific topic of learning. The project AVARES – “Enhance attractiveness of renewable energy training by virtual reality”, is a project supported by the European Commission under the Leonardo da Vinci Transfer of Innovation grant scheme. It aims to develop a Virtual Reality Environment and innovative learning methodologies for vocational education and training with the emphasis on improve attractiveness of vocational education in the field of renewable energies and clean technologies. The project integrates a developed virtual world with a traditional Learning Management System (LMS), represented by Moodle, for more attractive learning in the challenging field of Renewable Energy Sources (RES).
Outcomes of the project Virtual learning environment, which contains learning materials in a structured way. At the present “social network” time, it is a social place. As in a real classroom, the students can communicate between them and with the teacher and collaborate in learning experience. A hybrid education platform developed in the project combines traditional educational practices, provided via learning management
system (LMS) Moodle (Fig. 9 and Fig.10) and a virtual world (3D RES Park).
Fig.9.Virtual learning environment combines the advantages of LMS Moodle and virtual reality
Fig.10.The Solar Energy module in the Virtual Learning Environment LMS Moodle focuses on the learning process management and delivers to students a theoretical background for the RES field. Students can explore and learn about RES domain through 5 courses:
– Solar Energy, – Water Energy, – Wind Energy, – Geothermal Energy, – Energy of Biomass.
Students can register to the Virtual Learning Environment (VLE) platform and create personal accounts. After that, they can anytime access the platform with their credentials. The course material mainly consists of presentations that the students can download and study on their own pace. Learning materials also include textbooks, web-pages, animations and videos. The 3D Virtual RES Park offers an environment that allows shifting the traditional educational process to the new way of learning that is interactive and more visual (see Fig.10). Virtual reality offers an

Scientific Papers Series Management, Economic Engineering in Agriculture and Rural Development Vol. 14, Issue 2, 2014 PRINT ISSN 2284-7995, E-ISSN 2285-3952
205
attractive and effective way of learning where students can learn through experimentation and interactions in the virtual world.
Fig.11.The virtual world gives students the ability to communicate with other students or interact with the objects
The AVARES 3D RES Virtual Park consists of:
– sub-Areas dedicated to each course with 3D models,
– 3D Auditorium, – classrooms/Meeting Rooms.
Fig.12.Interactive 3D models allow understanding the principles of their operation The learning materials stored in the VLE (Moodle) are via Sloodle [14] available in the 3D RES Virtual Park as well. Specific activities and presentations can be
displayed as posters or boards at various areas of the 3D Virtual RES Park.
Fig.13.An auditorium and classroom in the Virtual Word. As depicted in Figure 12, adjacent to 3D models representing RES systems users can read the corresponding learning material from VLE. Trainers/teachers can give their lectures in the 3D Auditorium where they are able to load learning materials from the VLE or even upload their own slides. CONCLUSIONS The European Union, en bloc, is more than 50% dependent on imports of the primary energy sources, often from politically or economically not very stable regions. Therefore, the EU strategy on energy is primary focused on energy efficiency, clean technologies and renewable energy sources. From this point of view it is very important to focus education and training on the acquirement expertise and knowledge of the technologies that relate to this area. The paper describes a process of creation the multimedia learning materials for vocational education and training in the field of renewable energies. Realized survey and developed courses give possibility to: -shift from the “passive” book paradigm to a new “active” e-learning content,

Scientific Papers Series Management, Economic Engineering in Agriculture and Rural Development Vol. 14, Issue 2, 2014 PRINT ISSN 2284-7995, E-ISSN 2285-3952
206
-integrating measurement and control elements into the digital content and thus improve the efficiency of the VET process, -in accordance with a deputy of Bruges Communiqué “… green skills will be important to almost every job in the future.” improve knowledge and skills for employees of SMEs in agrosector in the progressive area of clean technologies and renewable energy sources. ACKNOWLEDGMENTS This project has been founded with support from the European Commission. The content of this document does not necessarily reflect the view or legislation of the European Commission. Neither the European Commission nor the project partners or any person acting on behalf of the Commission is responsible for the use that might be made of the information in this document.
a) b)
REFERENCES [1] http://appsso.eurostat.ec.europa.eu/nui/show.do?dataset=nrg_ind_335a&lang=en [2]Supporting vocational education and training in Europe: the Bruges Communiqué, http://ec.europa.eu/education/vocational-education/doc/bruges_en.pdf [3]http://eur-lex.europa.eu/LexUriServ/LexUriServ.do?uri=CELEX:32009L0028:EN:NOT [4]http://www.mhsr.sk/ext_dok-energeticka-politika/133566c [5]Palková, Z., 2009. Renewable energy sources for landscape development - project Resnet. In: Scientific papers. series "management, economic engineering in agriculture and rural development". - Bucharest: University of agricultural sciences
and veterinary medicine, 2009, Vol. 10(1):159-162. [6]Palková, Z., Schwarczová, L., Roháčiková, O., 2011. Enhancing the attractiveness of renewable energy training in the green sector. In: Scientific papers Series "Management, economic engineering in agriculture and rural development". Bucharest, University of agricultural sciences and veterinary medicine. Vol. 11, (1): 165-169 [7]AVARES, 2014. AVARES LdV TOI project web site (http://www.avares.org) [8]Bartle, R. A., 2004. Designing Virtual Worlds. New Riders Publishing. [9]Bronack, S., Cheney, A., Riedl, R. E. and Tashner, J. H., 2008. Designing Virtual Worlds to Facilitate Meaningful Communication: Issues, Considerations, and Lessons Learned. Technical Communication, 55(3), pp. 261-269. [10]Kluge, S. and Riley, L., 2008. Teaching in Virtual Worlds: Opportunities and Challenges. Issues in Informing Science & Information Technology, 5, pp. 127-135. [11]McKerlich, R., 2007. Virtual Worlds for Learning: An Analysis in the Use of Immersive Environments for Training. Brandon Hall Research. [12]Miah, A. and Jones, J., 2011. Virtual Worlds, in Barnett, G. A., ed, Encyclopedia of Social Networks, SAGE Publications, pp. 930-935. [13]OECD, 2011. Virtual Worlds: Immersive Online Platforms for Collaboration, Creativity and Learning. OECD Digital Economy Paper, No 184, OECD Publishing. [14]Sloodle, 2014. Simulation Linked Object Oriented Dynamic Learning Environment (http://www.sloodle.org).

Scientific Papers Series Management, Economic Engineering in Agriculture and Rural Development Vol. 14, Issue 2, 2014 PRINT ISSN 2284-7995, E-ISSN 2285-3952
207
STUDIES OF THE POSSIBILITY OF OBTAINING ECOLOGICALLY BASED CREAM CAPSAICIN IN THE TREATMENT OF RHEUMATIC DISEASE
Olimpia PANDIA1, Ion SARACIN2, Ion BOZGA1, Daniel NIJLOVEANU1
1University of Agricultural Sciences and Veterinary Medicine, Bucharest, Romania Faculty of Management, Economic Engineering in Agriculture and Rural Development, Slatina Branch, 150, Strehareti Street, Zip Code: 0500, Slatina City, Olt County, Romania, Phone: 0788391615; E-mail: olimpia_pandia@yahoo, Phone:0745752957, Email: [email protected], Phone:0726148524 2University of Craiova, Faculty of Agriculture and Horticulture, 19 Libertatii Street, Craiova, Romania, Phone:0744162539, E-mail: ion_saracin@yahoo,
Corresponding author: [email protected] Abstract Since herbal medicine makes strides to improve or cure of diseases or serious diseases to human, where preparations obtained by chemical are replaced successfully with herbal preparations obtained herbs, aromatic or those of spontaneous. Thus, in this paper, several attempts are made to prepare a capsaicin based creams ant rheumatic. This product is an environmentally friendly product, 100% vegetable produced in the laboratory as a base flossing a chilli extract obtained from private household, beeswax, distilled water, alcohol and peppermint oil. By obtaining this cream was intended to improve or cure people suffering from rheumatism, to relieve pain caused by arthritis, you know, is a readily available even at home, easy to manage, with immediate good results without side effects. Key words: capsaicin, ecologically based cream, rheumatism, treatment INTRODUCTION
The pepper (Capsicum annuum L) originates from Central America and South America. Christopher Columbus found the pepper in Haiti, where it was brought from, to Europe. [2] The pepper is grown in Europe for the first time mid way through the 16th Century in Spain and Portugal, followed by Germany, England and Hungary. The pepper reached Romania much later, being brought here by Bulgarian gardeners in the 18th Century. It was fist grown in the south of the country, and was later taken to other more favourable regions. [1] Ascorbic acid is found in large quantities in the fruit of the pepper, this varies according to species, variety or the maturity of the fruit, reaching levels of 139-160mg/100g of raw substance for fruits arriving at technological maturity and 211-300mg/100g of raw substance for fruits arriving at physiological maturity, some species of the Capsicum
variety may reach higher levels up to 400mg/100g of raw substance – for the Capsicum frutescent species. [1] Food, cosmetics and pharmaceutical industry successful attempts replacing all products obtained chemically by natural food. Modern agriculture today's together with all related sectors and spontaneous flora from our country, make researchers to do various studies and implement results obtained to promote natural food both in alimentation and herbal medicine, but also cosmetic medicine. [5] Today exists on the market various natural products derived from herbs, vegetables, fruits, etc. who started to be in high demand by consumers being healthier and easier to get. [4] This study showed how to obtain a cream base which by adding pepper and other components, to be able to obtain a cream in the house for the relief of conditions and can be easy to prepare mainly for rheumatic pains.

Scientific Papers Series Management, Economic Engineering in Agriculture and Rural Development Vol. 14, Issue 2, 2014 PRINT ISSN 2284-7995, E-ISSN 2285-3952
208
Capsaicin, in modern medicine is used to obtain some medications, ointments, creams, salves having an analgesic effect and circulatory stimulant. Quickness of pepper fruits is given by concentration of capsaicin from seeds and less from pepper pulp. MATERIALS AND METHODS To achieve the first cream was used hot pepper from the local populations harvested from own yard, at physiological maturity. Also was necessary harvesting mint plant (Menthe viridis) for extracting the mint oil which is rich in beneficial chemical compounds like menthol. Menthol signals feeling cold by stimulating receptors and inhibit the receptors which react to painful stimuli (muscle pain and arthritis). The oil extract from mint plant contains a number of beneficial chemical compounds. To give consistency to natural cream beeswax was used, distilled water and alcohol. In order to obtain the second cream other amounts of used pepper were used from the same local population instead of peppermint oil, menthol crystals and base for cream poultry fat, distilled water and alcohol. RESULTS AND DISCUSSIONS When hot peppers have reached full ripeness, were harvested and minced in particular in the seed spot where the capsaicin is present up to 80-90%. Material obtained sits in clean trays in thin layers to dry naturally for 10 days. During this time always moving trays for ensure uniform drying.
Photo 1. Preparation of hot pepper to obtain the cream ant rheumatic When hot pepper fruits were dried, transfer in a glass container than put alcohol 960, containers are closed tightly and composition obtained leave to soak for 14 days, during which the container is shaken daily. After the soaking period, the composition obtained filtered wit filter paper to obtain a brown-red liquid.
Photo 2. Preparation tincture the chili powder and mint oil In order to obtain oil of peppermint in household, fresh mint plant gather (leaves, flowers and stems) and boiled in a steel pot, glass or copper, which is fitted to the top where cover is 1 winding where vapors pass being copper or heat-resistant glass placed in a flask where cold oil pass.

Scientific Papers Series Management, Economic Engineering in Agriculture and Rural Development Vol. 14, Issue 2, 2014 PRINT ISSN 2284-7995, E-ISSN 2285-3952
209
At the end of the coil is a valve which is open when the pot boiling occurs and reaches T 105-1100 C (principle of distillation). The liquid obtained is form by distilled water and mint oil which float over the water from the collection vessel. The oil obtained must be stored in small glass containers. If you do not have in house this special dish made spearmint oil can be obtained placing plant mass on a stainless steel grid over which passes a steam. Liquid composed of oil and condensed steam is cooled and can be separated easily
Photo 3. Fat pussy cream base
Another component of the cream is beeswax which offers consistency to the cream and can be purchased from the honeycombs of bees or trade. Also distilled water is needed which can be used on the one resulted from spearmint oil and gives a pleasant smell or boiled water and leave to cool. In order to obtain 100 g of cream used for rheumatic pains in the house, use 20 g of beeswax and 80 ml of mint oil is heated in a tank with water at low heat. Separately, 20 ml of warm distilled water on which are placed 20 ml of the concentrate from pepper. When the beeswax and oil were homogenized, the remaining water was separated and the remaining contents add a little chili concentrate. The product obtained was allowed until cool, and to give more feeling cool and calming effects of menthol oil we can add 20-25 drops of it. After mixing last component of the cream obtained it is stored in cool places. The
product obtained is rich active principles, 100% naturals, pleasant smell, and removes burning sensation produced by capsaicin. For the preparation of cream based on fat bird is easier to make. The grease collected from slaughtered birds melts; cream obtained is cooled and filtered. Take 30 grams of chicken fat to melt mix. From concentration of alcohol and pepper take 30 ml and heat slightly, alcohol evaporation does not occur but menthol crystals 8g dissolve, after that you can add to 20 ml of distilled water. The composition obtained was mixed with poultry fat until they mix, after is put in recipes and it is let at cold temperature. CONCLUSIONS Treatment with capsaicin first time must be applied with caution, because each individual has a different reaction at a new therapeutic product, or may be allergic given the allergenic potential of capsaicin. To obtain rapid effects for rheumatic pains, after applying the cream on the affected place applying a thermal insulator, and after a short time the place is heated and pains disappear. Treatments with obtained cream is shown to be made of 2-3 times per day for 4-5 weeks After using the cream, hands should be washed with soap and water, because as contact with eyes and lips are affected by burning (hot). Use protective gloves for cream application for people with high sensitivity, with injuries, cuts and recent manicure done, or those that suffer from diabetes. These creams made in house are cheap, can be prepared easily and quickly, have a period of six months use if they are kept properly and they are 100 % natural, and the results obtained in the treatment of rheumatic diseases is high. REFERENCES
[1]Andronicescu, D., Angelescu, H., 1968, Paprika, Agro Bucharest Publishing. [2]Bereşiu Ileana, Voinea, M, 1977, Culture peppers and pepper paint production technology, Ceres Publishing House Bucharest.

Scientific Papers Series Management, Economic Engineering in Agriculture and Rural Development Vol. 14, Issue 2, 2014 PRINT ISSN 2284-7995, E-ISSN 2285-3952
210
[3]Mougou, A., Filali, N., Verlodt, H., Harbaoui, Y., 1988, Capsicum Newsletter, 7:44-47 [4]Olimpia Pandia., Sărăcin, I., Dinu Mariana, Chiriac, A., 2010, Variation content in vitamin C, carotene and protein depending on the local population of pepper in study. Analele Universităţii din Craiova, seria Agricultură- Montanologie – Cadastru, vol. XL/1:536 – 541

Scientific Papers Series Management, Economic Engineering in Agriculture and Rural Development Vol. 14, Issue 2, 2014 PRINT ISSN 2284-7995, E-ISSN 2285-3952
211
SECTION FOR THE SEEDLING PLANTING MACHINE IN NUTRITIVE POTS Olimpia PANDIA1, Ion SARACIN2, Ion BOZGA1, Daniel NIJLOVEANU1
1University of Agricultural Sciences and Veterinary Medicine, Bucharest, Romania Faculty of Management, Economic Engineering in Agriculture and Rural Development, Slatina Branch, 150, Strehareti Street, Zip Code: 0500, Slatina City, Olt County, Romania, Phone: 0788391615; E-mail: [email protected], Phone:0745752957, E-mail: [email protected], Phone:0726148524 2University of Craiova, Faculty of Agriculture and Horticulture, 19 Libertatii Street, Craiova, Romania, Phone:0744162539, E-mail: [email protected] Corresponding author: [email protected] Abstract The section is equipped with a mechanism for the movement transmission of several elements which are pot bearers, whose position to the soil in vertical plan remains constant to the slope of the terrain. It receive the rotation movement by Gall chain from a wheel which copies the soil and it presents the possibility of the adjustment of the distance between the plants in the row. The section may be a component of a seedling planting machine in pots in 1 – 2 rows, when the terrain is covered with foil mulch or from 1 to 6 rows on uncovered terrain. It may be a component of an agricultural aggregate for soil processing, for mounting foil mulch, for mounting hose for watering by processing. The transmission of the movement from the copy wheel presents the possibility of the adjustment of the revolution for the adjustment of distance between the rows, and the elements that support the pots bearer’s parts present the possibility of the length modification in the same purpose. Key words: nutritive pots, seedling, planting machine INTRODUCTION As a link of the technology of vegetable plants, the planting represents the most expensive part, which consumes time, power costs and quality of work. The time means the planting of the seedlings of the same species and age in the optimal term and in a short time. The power costs represent the mechanization of all the works represented by seedbed preparation and the avoidance of the manual planting. The quality of the planting represents the keeping of the distance between rows, the distance between pots in the row, the planting depth of the pots, the slight compaction of these and the watering, if necessary. All these requests can be fulfilled by the mechanization of the planting process of the seedlings sown in the pots. [1, 2] Several rules of the seedlings planting are presented in the literature. Thus: The seedlings are planted on prepared soil; The seedlings must have approximately 45 days of vegetation, must be vigorous, healthy
and weather-beaten in the moment of the plantation. [3] The temperature in the soil must exceed 10 Celsius degrees at 10 – 15 cm in the depth; The planting distance between the pots in the row and between the rows depends on the characteristics of the species and of the soil. The planting depth of the pot is 7 – 15 cm depending on the species. Table 1. Distance drills
All the seedlings are planted in the same level where they were used as seedlings, except for the tomatoes and the eggplants.
The species Distance between plants in row(cm)
Distance between
rows Cabbage 30-60 90-100
Eggplant 45-75 60-120
Pepper 30-60 90-100
Tomatoes 45-120 90-120 Melons 60-90 180-240
Scientific Papers Series Management, Economic Engineering in Agriculture and Rural Development Vol. 14, Issue 2, 2014 PRINT ISSN 2284-7995, E-ISSN 2285-3952
212
The plantation is made with the planter, a little garden shovel or any other object that can make a hole large enough for the seedling not to be forced to enter. The last rule is the avoidance of the effectuation of a planting section of the seedlings grown in pots MATERIALS AND METHODS The work presents a continuation of the studies and researches made for the obtaining of the seedlings in pots by direct sowing presented in the article „Studies regarding the effectuation of an pneumatic equipment for the sowing of little seeds in alveoli”, published at the Internaţional Symposium ISB-INMA TEH 2013 by Saracin Ion and collaborators, which is the object of patent request registered at OSIM nr. A/00816/2013 in which the authors propose to effectuate a machine for the sowing of the little seeds in pots at depths between 0.6 and 3.3 mm depending on the species. [4] RESULTS AND DISCUSSIONS The seedling obtained in the pots must be planted after approximately 45 days from the emergence in the optimal period in conditions requested by the greenhouse, solar or in field culture technology in shorts periods of time not to influence the instalment growth of the plants. The idea of the effectuation of the planting section started from the process of the operation of the reel which equips the aggregates for the cereal harvesting. The pallets of the reel are equipped with fingers for the elevation and supporting in vertical position of the plants and have fixed position in vertical plan to the soil. The supporting part of the pallets equipped with two rotating elements mounted eccentric is used for the execution of the section. Their eccentricity may represent the operation depth of the section. From a constructive point of view the section is formed of: framework, equipped with the possibility of the attachment to a grip device to a tractor by articulation which permits the copy of the soil, a pneumatic
wheel in the posterior part articulated at the framework of the section with the possibility of the adjustment in vertical plan and of its constant maintenance, the device with eccentric formed from two octagonal elements articulated at the corners between them, mounted to a arbour which receive the movement by Gall chain and notched wheels from the soil copy wheel which also effectuate the slight compaction of the soil next to the pots planted in the soil. The cups are mounted on the eight corners of the device with eccentric and they are formed of a fixed part which makes the depth in the soil and a mobile part (the bottom of the cup) articulated at the fixed part and equipped with a leverage where an special construction arch can be found which keeps the bottom on closed position. During the operations the leverage is acted by a cam fixed in the inferior side of the eccentric device which opens the cup, leave the seedling and after the elevation (above the height of the seedling) the cam releases the leverage of the mobile bottom which is brought in closed position with a precise velocity effectuating the elimination of the possible residues left in the cup in this way. The transmission of the machine, which is also simple, may assure at least two rapports of transmission of the movement towards the planting device. In this way, the adjustment of the distance between the plants can be obtained between 20 and 40 cm by the removal of some cups or, for bigger distances, by modifying the transmission ratio. The construction of the section and the operations process The section is equipped with an arbour on which 3 rosettes sustained by a metallic plate fixed on the arbour are mounted. The rosettes assure the eccentricity of one of the octagons to the arbour of the section. This receives the rotation movement from the soil copy wheel and its compaction next to the pots. The two octagons are linked by articulation elements equipped with squared-section holes inside. In these holes the cups which transport the pots can be mounted and realizes the hole where the pot is left in vertical position.

Scientific Papers Series Management, Economic Engineering in Agriculture and Rural Development Vol. 14, Issue 2, 2014 PRINT ISSN 2284-7995, E-ISSN 2285-3952
213
The cups have two movements during the process: a V translation movement, given by the displacement velocity of the section and a rotation movement to the arbour of the section which has the angular velocity ω.
(1)
where n is the speed of the arbour. The trajectory described by a cup mounted on the articulation element between the two octagons depends on the ratio between Vt and Vc. Where, Vc=Rω, R being the distance from the center of the section arbour to the grip point of the cup on the articulation element and the Vc the peripheral velocity of the cup. The ratio Vc/Vt=1, because at the entrance and the exit from the soil the cup must have a vertical position, as well as on the whole circumference of 360 o. The movement of a cup to the soil is analysed for the study of the section functioning. We consider the cup A a point on the circumference of the circle described by it during the operations. The trajectory pf the point A in plan can be described at a random point by the next equations: x=Vt·t+R cos ωt (2) y=H+h-R sin ωt Where: H is the height of the axis of the section to the soil R Is the radius of the circle described by the cup h is the planting depth ωt=φ, represents the rotation angle of the cup after a random time t. The equations of the velocity components are: Vx - ωR sin ωt (3)
Vy - ωR cos ωt
Vx represents the horizontal component of the cup in horizontal plan. Given the fact that the ratio between Vc/Vt=1, results that Vt=Vc= R·ω or from the equation: Vx - ωR sin ωt, the term ωR sin
ωt=0. For the plant to be left in vertical position in the soil, the projection of the absolute speed on the displacement direction of the section
when the cup enters in the soil must be null, so:
-Vc·sinφ1=0 (4) Where: φ1 is the penetration angle of the cups in the soil.
or: sin φ1= -Vc=1 (5) Taking into account that φ1= ωt1 results that: ωt1=arcsin1, which is equal with 90. The speed of the octagons is determined by the peripheral velocity of the cups which must be correlated with the velocity of the section displacement, so that the ratio remains
constant on every point of the trajectory. The variation of the distance between the plants in the rows depending on the transmission ratio from the operation wheel and the arbour of the planting device at the peripheral velocity of 1.5m/min is presented in Table 2. Table.2.The variation of the distance between the plants in the rows depending on the transmission ratio from the operation wheel and the arbor of the planting device at the peripheral velocity of 1.5m/min.
Note: By reducing the number of cups of the planting device (symmetrically) the distances between the plants, presented in Table 1, doubles as values for the same transmission ratio. Table.3.The variation of the peripheral velocity of the cups depending on the speed of the arbour
No. The speed of the arbour
rot/min]
The peripheral velocity [rot /min]
1 30 1,5 2 35 1,85 3 40 2,05 4 50 2,6 5 55 2,8 6 60 3,2
Note: The peripheral velocity influences the uniformity of the plantation by the way of feeding of the cups with seedling
No. Transimssion ratio [%]
The distance between plants in the row [cm]
1 1 20 2 0,6 33 3 0,5 40 4 0,4 50 5 0,3 66 6 0,2 100
Scientific Papers Series Management, Economic Engineering in Agriculture and Rural Development Vol. 14, Issue 2, 2014 PRINT ISSN 2284-7995, E-ISSN 2285-3952
214
CONCLUSIONS The seedling produced in pots planting section assures the planting uniformly on the row regarding the distance between plants and the depth of sowing. The uniformity of the planting depends on the peripheral velocity of the cups and the reaction rate of the user. The seedling produced in pots planting section can be a component of a planting machine equipped with two, four or six sections. The planting device has the possibility of the adjustment of the cup position in vertical plan during the operations. The soil copy wheel has the possibility of the resumption of the planting depth. The cups present the possibility of planting pots of different shapes and sizes due to their form. The mechanized planting reduces the plantation time, assures high productivity with minimal costs, and assures the possibility of mechanized effectuation of other operations in the vegetation period of the culture. REFERENCES [1]Bădescu, M., et al., 2003, Maşini agricole, Ed.Sitech, Craiova [2]Glodeanu, M., Alexandru, T., Sărăcin, I., 2001, Îndrumător privind utilizarea maşinilor şi echipamentelor agricole, Ed.Aius, Craiova [3]Marinescu, A., 1989, Tehnologii şi maşini pentru mecanizarea lucrărilor în cultura legumelor de camp, Ed. Ceres, Bucureşti [4]Saracin, I., et al., 2013, Studies regarding the effectuation of pneumatic equipment for the sowing of little seeds in alveoli Internaţional Symposium ISB-INMA TEH, is the object of patent request registered at OSIM nr. A/00816/2013

Scientific Papers Series Management, Economic Engineering in Agriculture and Rural Development Vol. 14, Issue 2, 2014 PRINT ISSN 2284-7995, E-ISSN 2285-3952
215
EVOLUTION AND TRENDS IN TRADE IN AGRICULTURAL PRODUCTS Daniela POPA1
1State Agrarian University of Moldova 44, Mircesti St., MD – 2049, Chisinau, Republic of Moldova, Phone: +373 795 74 780, Fax: (+373 22)31-22-76, E-mail: [email protected] Corresponding author: [email protected] Abstract Moldova's foreign trade value will exceed 10 billion U.S. dollars, exports increased by 12 percent annually and imports by about 9, 4 percent in the years 2014 to 2016, according to preliminary forecasts prepared by the Ministry of Economy. For 2013, an increase of 7,5 percent and 6 percent of exports imports. The foreign trade trends may come back in 2011, when supplies of Moldovan goods to foreign markets grew faster than imports. In 2012 exports fell by 2,5%, while imports rose 0,4%. Key words: competitiveness, export, food products, import, trend, trade balance INTRODUCTION The main sector of economy of the Republic of Moldova represents, of course, agriculture. In this sector almost half of the working population. The author believes that the research topic is very timely given the following three reasons: first, the development of agricultural sector directly influences the living standards of people employed in agriculture, or in other words, the economic development of agriculture depends on the welfare of more than half the population of our country. Secondly, the development of agriculture depends largely on the possibilities for agricultural production in foreign markets, foreign trade. MATERIALS AND METHODS At the basis of this scientific paper served the information from the Statistics National Bureau of Republic of Moldova, Ministry of Economy of Moldavian Republic, different groups of national and international experts and also our own researches in this domain, were applied the following methods: selective, comparison and tabular methods. RESULTS AND DISCUSSIONS Compared to the previous year 2013, national production has experienced more support
from external demand, in January-May of 2013, exports increasing by 8.9 %, becoming more pronounced role of non-traditional partners - eg . Turkey. However, since April increase reserves began to run out, tempering it exports two important markets Russian Federation and Italy. Reducing global prices for a range of products including energy , decreased volumes of imported products in the country for processing and reduced demand for exported products , maintained a moderate growth in imports. Although external factors seem to make the situation a moderation of both exports and imports this year, at the end we could have a slight improvement in the current account is estimated revitalization of agrifood exports. Restoring external demand, increasing the quality of exports, mainly due reânnoirea investments in expansion and technological base are factors that will lead to higher exports during 2014-2016. The increase in imports will be subject to re-establish domestic demand, particularly for raw materials imported from the business environment, increase investment flows in machinery, electrical appliances, mineral products. During the period January-October 2013 most types of economic activities recorded progress. After the recession last year , Moldova's economy entered a period of stabilization , GDP grew at 4.9 % (amounting

Scientific Papers Series Management, Economic Engineering in Agriculture and Rural Development Vol. 14, Issue 2, 2014 PRINT ISSN 2284-7995, E-ISSN 2285-3952
216
to 43.4 billion lei ) compared to the same period in 2012 . A self- determined growth and accelerating inflation process , so the October 2013 inflation rate was 3.6 % during the same period of 2009-2013, according to the National Bureau of Statistics, with a 0.38 % average annual fluctuation [4,5]. The external report, the Moldovan leu depreciated due remittances inflows and fluctuations in the U.S. dollar on international currency markets, which led to an increase in consumer prices by about 3.6 % . Food prices in October 2013 rose by 4.8 %, mainly due to the seasonal nature of the economy. The price of non-food products increased by 3.7 % due to currency depreciation , higher excise duties and the dynamics of world oil prices . Data from the National Bureau of Statistics show that in 2011 the value of foreign trade of the Republic of Moldova has exceeded $ 7.4 billion, after the largest increase in trade in the last decade, more than 35 percent [4]. Evaluation Moldovan agro export competitiveness in the EU market: ► Natural resources and human capital are the main competitive advantages of Moldova. ► Potential international competitiveness can be measured by comparing costs agricultural production costs in foreign markets. ► Competitiveness and farm subsidies Quality management systems: ISO, HACCP, EuroGAP. ► Moldova's agro exports constitute 50-55% of the country's exports, confirming the dominance of agri-food sector in the economy. ► Exports of high added value: wine and strong drink, fresh and processed fruits and vegetables. ► Positioning the country in the top 10 countries in the world specializing in the export of wines and top 20 in the fruits, vegetables and nuts. Moldova exported most commodities in the European Union, the National Bureau of Statistics data show. According to statistics, in 2013, Moldova has made exports worth over one billion 500 million dollars, almost 13 percent more than the same period last year. In the period January-August, Moldova
exported to European countries goods worth over 700 million dollars, nine percent more than the same period last year. Meanwhile, exports to CIS countries amounted to over 600 million dollars, and in other countries, more than 200 million dollars. Statistics show that Moldova exported to Russia nearly 30 percent of totate goods, which corresponds to more than 400 million dollars. In second place is Romania, where export goods worth nearly 300 million dollars.Followed by Italy and Turkey - with exports worth over 100 million dollars, and Ukraine with nearly $ 90 million. Moldovan economy with an agricultural area of 2.5 million hectares, five times lower than in Romania, managed in six of the past seven years to be a net exporter of agricultural products in Romania [3]. In the first ten months of this year, Romania imported from Moldova agrifood 35.2 million and recorded a trade deficit this line of 9.5 million. In 2012, imports from Moldova amounted to 46.6 million and 18.3 million deficit. Romania had trade surplus in trade of agricultural products to Moldova only in 2010 when exports 24 million were only 2.4 million higher than imports. In the past seven years the cumulative trade deficit for these product categories was 72.3 million. In the first nine months of 2013 year, Romania has managed to become a net exporter of agricultural products for the first time in 24 years, with a surplus of about 3 million. Evolution of exports, imports and the trade deficit or surplus food products between Romania and Moldova in the period 2007-2012 and in the first ten months of 2013 (Table 1). Table 1. Deficit in six of the past seven years
Year Exports ( million)
Imports ( million)
Deficit / Excendent (
million)2007 21,5 32,5 -11 2008 27,4 41,2b -13,8 2009 22 28,9 -6,9 2010 24 22,4 2,4 2011 25,4 40,6 -15,2 2012 28,3 46,6 -18,3 2013 25,7 35,2 -9,5
Source: Eurostat, 2013 data are for the first ten months According to the National Bureau of Statistics, most were exported electrical

Scientific Papers Series Management, Economic Engineering in Agriculture and Rural Development Vol. 14, Issue 2, 2014 PRINT ISSN 2284-7995, E-ISSN 2285-3952
217
equipment, furniture and clothing, accounting for over 20 percent of total exports. Also, exports of food and live animals were ranked second and the value exceeds 100 million dollars. However, among the most exported goods are found to transport machinery and equipment, alcoholic beverages, tobacco, inedible crude materials and fuels. Both adverse weather conditions and background of a crisis that seems to have no end , generates a steady rise in the price of agricultural products. It is, of course, and the Republic of Moldova. However , in addition to price uncertainty , better felt in the place where we should do shopping. Market, its classical form, as we know it for decades , is more embarrassed than retail networks, especially in conditions which require more stringent monitoring conditions to have a marketing and regulatory agro-food prices. Among the key prerequisites for the positive development of agri-food trade represents efforts to boost the agriculture with high added value, creating marketing infrastructure for producers, joint efforts liberalization and export promotion of these products. Additionally, point out that the share of exports to the EU market is growing compared to the same period last year, which is a huge advantage in terms of profit and stability for local producers and exporters. For the near future, the Ministry of Agriculture estimates of export growth in wine production given the European Commission's permission to double quotas for these products in the EU market. CONCLUSIONS Prospects for agriculture in Moldova are clearly positive because: export demand is high - manifested by the fact that most of the production is exported which gives farmers and investors opportunities to gain significant, the cost of labor, land and the capital is still lower than in the countries of origin of potential investors , the local market is a relatively young market with many opportunities for exploitation. Would also be
recalled here that are still insufficient regulations to ensure proper traceability and authenticity of organic products in particular and that of the local consumer often has an accurate perception of what really means an ecological product with although it claims to be the actual consumer of organic products. Agri-food sector in Moldova has greatly expanded in recent years, and there is a constant interest in encouraging this area, interest should develop into a competitive advantage for local agriculture in the next period if all EU conditions quality assurance, harmonized standards, product safety and consumer protection are met. As we conclude the paper synthesizing information, it outlines the idea that global economic globalization and the enlargement of the European Union to achieve the desire linked to the attainment of a quality culture based on a common infrastructure, eliminating technical barriers barriers to trade, certification and food quality certification have an increasingly important role in consumer protection policies. REFERENCES [1]Popa Daniela, Timofti Elena, 2009, Eficienţa mecanismului economic în sectorul agrar. Monografie. Chişinău: Complexul Editorial al IEFS, 2009, 343 p. [2]Ştefan Gavril, Dan Bodescu, Adrian Dinu Toma, Radu Lucia Pânzaru. Economia şi filiera produselor agroalimentare. Bucureşti: Editura Alfa, 598 p. [3]Comerțul exterior al Republicii Moldova// 30.11.2013 [4]www.statistica.md [5]www.bnm.md

Scientific Papers Series Management, Economic Engineering in Agriculture and Rural Development Vol. 14, Issue 2, 2014 PRINT ISSN 2284-7995, E-ISSN 2285-3952
218

Scientific Papers Series Management, Economic Engineering in Agriculture and Rural Development Vol. 14, Issue 2, 2014 PRINT ISSN 2284-7995, E-ISSN 2285-3952
219
RESEARCH ON MILK COST, RETURN AND PROFITABILITY IN DAIRY FARMING Agatha POPESCU University of Agricultural Sciences and Veterinary Medicine Bucharest, 59 Marasti, District 1, Zip code 011464, Bucharest, Romania, Phone: +40 213182564/232, Fax:+40213182888, Email:[email protected] Corresponding author: [email protected] Abstract The paper aimed to the relationship between milk cost in terms of material cost and labor cost and estimate the influence of these costs on returns coming from milk and profitability in 5 small dairy farms from the Southern Romania. The main economic indicators taken into consideration were: material cost, Xi, (feeding cost, replacing heifer, equipment and shed depreciation, electricity and water cost, fuel and lubricants cost) , labour cost, Y, and income coming from milk, Z. The Cobb-Douglas regression function Z= a xα yβ was used to determine the variation of the studied economic indicators and relationships between them. Taking into account the close relationship between income from marketed milk and material cost and labor cost, it is enough to use it as the only criterion in farm classification. Profitability in dairy farms depends both on cost input and milk output as well as milk market price. Key words: income from marketed milk, labor cost, material cost, milk cost, profitability, return INTRODUCTION Milk production cost is influenced by a large range of environment factors, but the main ones are represented by feeding cost, labor cost, heifer for replacing the culled cow, medicines and veterinary services, frozen semen from the highest breeding value bulls and artificial insemination service, depreciation of sheds and specific equipment, water and electricity cost, rental value of land owned by dairy farmer [ 11,12]. The highest share in milk production cost is represented by feeding, labor and veterinary services cost [2,6] A higher milk yield requires a higher production cost, an aspect that farmers should take into consideration and handle in the most efficient way. Returns in dairy farming are deeply determined by variable cost and production cost and the correlations existing between farm size, milk yield, variable cost, total cost and milk price are important to be studied and keep under control by farmers. [3]. Profit, as a measure of economic efficiency in dairy farming is the difference between income coming from milk and milk
production cost including all the cost items [14]. Taking into account that milk production depends on various farm inputs in terms of variable costs, profit could be considered a function of milk yield and input prices [ 1]. An increased milk price by 1 % increased milk profit by 8.27 % in India while an increased labor by one person decreased profit by 1.8 %. The profit margin in the dairy farming is considered the difference between milk production cost and farm gate milk price [7]. In Romania, the highest share in milk production cost is represented by feeding (69 %), replacing heifer (7.5 %) and labor cost (4.5 %) [8,9]. The main role in milk production cost is played by feeding cost, which is more sensitive to variation than average milk cost. Therefore, milk economics deeply depends on feeding cost. [4]. The relationship between milk production cost and return is studied using various methods such as cost-benefit analysis [5] and multiple regression functions [10,13]. In this context, the purpose of this paper was to examine the relationship between milk cost

Scientific Papers Series Management, Economic Engineering in Agriculture and Rural Development Vol. 14, Issue 2, 2014 PRINT ISSN 2284-7995, E-ISSN 2285-3952
220
in terms of material cost and labor cost and estimate the influence of these costs on returns coming from milk and profitability. MATERIALS AND METHODS This study is based on the data collected in the period 2011-2013 in 5 small dairy farms from the Southern Romania. The main economic indicators taken into consideration were: material cost, Xi, (i=1,2, ..6), where X1 = material cost, X2 = feeding cost, X3 = biological material (replacing heifer), X4 = equipment and shed depreciation, X5 = electricity and water cost and X6 = fuel and lubricants cost, labour cost, Y, and income coming from milk, Z. In order to study the relationship between these indicators, the variables were used in terms of logarithms and the coefficients of simple and multiple linear regression were calculated. Also, Fisher Test for P=0.05, P=0.01 and P=0.001 was used for pointing out the significant differences. The Cobb-Douglas regression function having the formula Z= a xα yβ was also used with its solution: log Z=α log x + log y + log a, that is the multiple linear regression between X = log x, Y = log y and Z = log z. The parameters α and β were determined using the formulas:
21 XY
XYYZXZ
r
rrr
21 XY
XYXZYZ
r
rrr
and log a = - X - . The regression functions, Zi, were determined for various items of material cost Xi, (i=1,2, ..6), so that to assure a minimum residual variance. Also, the influence of the variation of X and Y factors on the variation of Z factor was also calculated as follows: A(X,Y)= total influence of the pair of factors material cost (Xi) and labor cost (Y), A(X,Y) = the partial influence of the variation of Xi when Y = constant, A(Y,X)= the partial influence of Y when Xi = constant, A(XY)= the influence of the variation of the interraction between Xi and Y, AE= the influence of other factors.
RESULTS AND DISCUSSIONS Coefficients of simple linear regression between material cost, labour cost and income from milk are presented in Tabel 1. As one can see the sense and intensity of correlation coefficients varied from a pair of indicators to another. Income coming from marketed milk was closely correlated to material cost, r = 0.660, and by item of material cost r = 0.680 for current and main equipment repairs, r = 0.622 for fuel and lubricants cost, r = 0.524 for feeding cost, and r = 0.549 for depreciation of fixed assets. A closer positive relationship it was found between income coming from milk and labor cost, r = 0.802.(Table 1). Table 1. Coefficients of simple linear correlation between material cost, labor cost and income coming from milk
Indicator Labor cost Income from marketed milk
Material cost 0.945 0.660 Feeding cost 0.864 0.524
Medicines and biological material (replacing heifer)
0.343 0.172
Equipement current repairs and maintenance cost
0.729 0.680
Depreciation cost 0.772 0.549 Fuel and lubricants
cost 0.786 0.622
Income from marketed milk
0.802 -
Source: Own calculations Coefficients of multiple linear correlation are given in Table 2 and reflect that there is a close and postive relationship between income coming from marketed milk, material cost and labor cost. The Fisher statistic registered lower values than the quantiles for F P=0.05= 19, reflecting that the indicators are not linearlly correlated. Partial coefficients of multiple linear correlation are presented in Table 3.Their values between theincome frommarketed milk and various material cost items, on one side, and labor cost, on the other side, reflected weak links and of oposite sense in most of cases ( -0.5 < r Z.XY < 0).

Scientific Papers Series Management, Economic Engineering in Agriculture and Rural Development Vol. 14, Issue 2, 2014 PRINT ISSN 2284-7995, E-ISSN 2285-3952
221
Table 2.Coefficients of multiple linear correlation ( r Z.XY) between material cost, labor cost and income coming from milk
Indicator r Z . XY F Material cost 0.947 9.10 Feeding cost 0.864 3.59
Medicines and biological material (replacing heifer)
0.343 2.34
Equipement current repairs and
maintenance cost
0.729 2.39
Depreciation cost 0.772 2.32 Fuel and lubricants
cost 0.786 2.31
Source: Own calculations But one can easily notice that between income from marketed milk and labor cost,on one side, and various material cost items, on the other side, it is a strong positive correlation. The calculated F values < F0.05 =18.51 reflected that these indicators are not partially linearlly correlated when labor cost is constant. Table 3.Partial coefficients of multiple linear correlation ( r Z.XY) between material cost, Xi, (i=1,2, ..6), labor cost, Y, and income coming from marketed milk, Z
Indicator r ZX . Y r ZY . X F Material cost - 0.497 0.726 2.23 Feeding cost - 0.573 0.818 4.04
Medicines and biological material
(replacing heifer)
- 0.183 0.804 3.65
Equipement current repairs
and maintenance
cost
0.234 0.611 1.19
Depreciation cost
-0.184 0.695 1.87
Fuel and lubricants cost
-0.021 0.648 1.45
Source: Own calculations The influences of factors variation of material cost (Xi), and labor cost (Y) on the variation of income from marketed milk (Z) are presented in Table 4. One can notice that the total influence of the simultaneous variation of the pair factors material cost and labor cost on the variation of income from marketed milk was a substantial one.
When labor cost was constant, the influence of the material cost variation as a whole and also by cost item on income could be ignored, because it had a low value. When material cost was considered a fixed factor, the influence of the labor cost variation had a considerable value and for this reason it deserves to be taken into account (30%) when we analyze its influence on income. Other factors cumulated in the term of error had an influence of 10-35 % on income from marketed milk. Table 4.The influences of the factors variation of material cost (Xi), labor cost (Y) to the variation of income from marketed milk
Indicator A(X ,
Y)
A(X . Y) A(Y .
X) A(XY) A(E)
Material cost 0.89 0.09 0.30 0.02 0.11 Feeding cost 0.75 0.12 0.49 0.32 0.25 Medicines
and biological material
(replacing heifer)
0.65 0.01 0.63 0.67 0.35
Equipment current
repairs and maintenance
cost
0.66 0.02 0.20 0.23 0.34
Depreciation cost
0.65 0.01 0.34 0.40 0.35
Fuel and lubricants
cost
0.64 0.001 0.26 0.35 0.36
Source: Own calculations The Cobb-Douglas regression functions reflecting the variation of income in relation to material and labor cost are presented in Table 5. Table 5. Cobb-Douglas regression functions of income (Z) in relation to material cost (Xi), and labor cost (Y)
Material cost items Zi= a xiα yβ (i-1,2,...6)
Material cost (X1) Z1 = 1.44 x1 -0.91 y1.67
Feeding cost (X2) Z2 = 2.64 x2 -0.69 y1.37
Medicines and biological material (replacing heifer)
(X3)
Z3 = 1.55 x3 -0.12 y0.85
Equipment current repairs and maintenance cost (X4)
Z4 = 4.76 x4 0.20 y0.65
Depreciation cost (X5) Z5 = 2.50 x2 -2.88 y3.02
Fuel and lubricants cost (X6)
Z6 = 2.02 x6 -0.02 y0.82
Source: Own calculations

Scientific Papers Series Management, Economic Engineering in Agriculture and Rural Development Vol. 14, Issue 2, 2014 PRINT ISSN 2284-7995, E-ISSN 2285-3952
222
CONCLUSIONS Material cost and labor cost represent the most important cost item in total milk production cost. They are closely correlated with income from marketed milk. For the same level of labor cost in dairy farms, material cost has a negative influence on income. In the dairy farms where material cost is similar and constant, labor cost is deeply correlated with income coming from marketed milk. The existence of some nonlinear relationships among various financial indicators involves the establishment of corresponding production functions which should be used in order to determine the optimum level where income is maximized and material cost and labor cost are minimized. Income coming from marketed milk represents a significant economic indicator for establishing the optimum farm size. Taking into account its close relationship with material cost and labor cost, it is enough to use only income from milk as a criterion for farm classification. The evaluation of profitability in dairy farms requires to take into account both cost input and milk output as well as milk market price. ACKNOWLEDGMENTS The author thanks the five farmers for their kindness to provide the data from the farm book-keeping as this paper to be set up and finalized. REFERENCES [1]Ahmad, S., Haq., Z. U., Shah, M., Muhammad, Y., Khan, I., Khan, M., 2013, Profitability of dairy farming in Peshwar Valley, The Journal of Animal and Plant Sciences, 23(1 Suppl.): 2013, Page: 94-97 [2]Chamberlain, A., 1993, Milk Production in the Tropics. Educational low priced book Scheme. Longman Scientific and Technical Publishers.UK. [3]Dhuyvetter Kevin, 2010, Factors Impacting Dairy Profitability: An Analysis of Kansas Farm Management Association Dairy Enterprise Data [4]Kalmar Sandor, 2003, Some Aspects for Raising of Economic Competitiveness of Dairy Farming,
Agriculturae Conspectus Scientificus, Vol. 68 (3):169-172 [5]Mburu, L. M. , Gitu, K.W., Wakhungu, J. W., 2007, A cost-benefit analysis of smallholder dairy cattle enterprises in different agro-ecological zones in Kenya highlands, Livestock research for rural development 19(7)/2007 [6]Jayaweera, T.S.P., Ruwandeepika, H.A.D., Kendaragama, K.M.S.B., 2007, Analysis of cost of milk production in Ratnapura District, The Journal of Agricultural Sciences, 2007, Vol.3(1):24-33 [7]Payne, W.J.A., 2001, An introduction to Animal husbandry in the tropics. 4th edition. Educational low priced book scheme. Longman Scientific and Technical Publishers. UK. [8]Popescu Agatha, 2008, A comparative study concerning the economic efficiency for various levels of milk yield, Scientific Papers, Vol.52, Series Animal Production [9]Popescu Agatha, 2009, Analysis of milk production and economic efficiency in dairy farms, Animal Sciences and Biotechnology, Vol.42(1) [10]Popescu Agatha, 2010, Research Concerning the Use of Regression Function in Gross Margin Forecast, Bulletin UASVM Horticulture, 67(2)/2010 [11]Sarkerer Debnarayan, Ghosh Bikash Kumar, 2008, Economics of Milk Production in West Bengal: Evidence from Cooperative and noncooperative Farms, Journal of Economics and Business, Vol. XI – 2008, No 1 & No 2 [12]Schulte Kristen, Dhuyvetter Kevin, 2010, Factors Impacting Dairy Profitability:, An Analysis of Kansas Farm Management Association Dairy Enterprise Data , Department of Agricultural Economics, Kansas State University January 2010, http://www.agmanager.info/livestock/budgets/production/dairy/KCD_DairyEnterpriseAnalysis%28Jan2010%29.pdf [13]Slawomir Juszczyk, 2005, Milk production profitability-Multiple regression analysis, Institute of Agribusiness, Swietokrzyski University of Kielce, Poland, Electronic Journal of Polish Agricultural Universities, Vol.8(4), Topic: Economics, [14]Varian, H. R., 1992, Microeconomic Analysis. Norton, New York, USA.

Scientific Papers Series Management, Economic Engineering in Agriculture and Rural Development Vol. 14, Issue 2, 2014 PRINT ISSN 2284-7995, E-ISSN 2285-3952
223
RESEARCH ON PROFIT VARIATION DEPENDING ON MARKETED MILK AND PRODUCTION COST IN DAIRY FARMING Agatha POPESCU University of Agricultural Sciences and Veterinary Medicine Bucharest, 59 Marasti, District 1, Zip code 011464, Bucharest, Romania, Phone: +40 213182564/232, Fax:+40213182888, Email:[email protected] Corresponding author: [email protected] Abstract The paper aimed to analyze the effect of marketed milk production and milk production cost on profit in dairy farming in Romania. In this purpose, the data from 10 dairy farms situated in the Southern Romania were collected in the period 2011-2013. The average marketed milk per cow accounted for 5,507 kg with a variation coefficient of 10.90 %. The average milk production cost registered Lei 1.07/kg milk, while the average milk price was Lei 1.23/kg. The average profit coming from marketed milk accounted for Lei 984.89 per cow and yaer with a variation between Lei 2,375/cow/year, the highest level and Lei 314.4/cow/year, the lowest level. The variation coefficient, 69.90 % reflected a large variation from a farm to another. Based on the equation of the regression plan, Z = 1.187 x +11.46 y - 4,262 which assured the minimum residual variance, three variants of simulation were set up. A constant milk production cost, Y= Lei 1.07/kg, and a 100 kg growth of marketed milk could determine Lei 18.7 additonal profit per cow and year. For a constant marketed milk of 5,507 kg, and an increased milk production cost by Lei 0.02/kg has no influence on profit level. When marketed milk increases by 100 kg and milk production cost by Lei 0.02 per kg, farmers' profit could increase by Lei 118.9/cow and year. Marketed milk and milk price have a positive impact on profit, while production cost has a negative impact. Key words: income from marketed milk, labor cost, material cost, milk cost, profitability, return INTRODUCTION Economic efficiency in dairy farming is in close relationship with farm size. Small sized farms are not so efficient because they are not able to replace their capital, while larger farms are able to reduce production cost and assure a higher profit [6]. Profit is directly influenced by marketed milk and milk price and, indirectly by milk production cost, according to the formula: Pr=Qm(p-c), where, Pr= profit, Qm=marketed milk, p = milk price and c= milk production cost [9]. Marketed milk depends on milk yield per cow and year, the number of dairy cows, total milk production, calves consumption [10]. Milk yield per cow depends on: (a) genetic factors: breed, individuality, cow age, body shape and development, constitution, udder size and shape, temperament, milk production potential, breeding program, the use of frozen semen from high breeding value bulls, and (b) environmental factors such as: feeding, watering, movement, milking, daily program,
lactation length, calving interval, age at the 1st calving, cow health, comfort factors: temperature, air humidity, wind currents, weather status, hygiene etc [7]. Milk production cost varies according to the geographical position of the dairy farm, feeding conditions, heifer for replacing the culled cow, artificial insemination service, frozen semen from high value bulls, veterinary services, medicines, depreciation of fixed assets ( sheds, equipment etc), electricity, water, fuel and lubricants, land rental, repairs of equipment [14,15] The three highest cost in a dairy farm are feed costs, replacement costs and labor cost. All these cost items should be kept under control in order to get a higher profit in dairy farming [13] A study regarding production cost estimates in Romania mentioned that in a farm of 200 dairy cows, for instance, only the annual milking, milk filtering and cooling cost accounted for Euro 210.57/cow/year for 9,150 kg average yield per cow [1].

Scientific Papers Series Management, Economic Engineering in Agriculture and Rural Development Vol. 14, Issue 2, 2014 PRINT ISSN 2284-7995, E-ISSN 2285-3952
224
Another study in a smaller farm of 50 dairy cows producing 500 kg milk/day and spending Lei 190.5 per day for feeding, electricity, water etc and selling milk at Lei 0.95/kg, mentioned that the farmer could get Lei 475 income/day and a profit of Lei 284.5 per farm. This means that the milk yield was 10 kg/cow, milk production cost was Lei 0.381/kg and cost per cow and day accounted for Lei 1.45 per head. This means Lei 5.69 profit/cow/day and Lei 0.56 profit per kg milk [16] In Romania milk production cost are lower than in other EU countries such as Hungary, Poland and Slovakia [11]. In Romania, an increase by 1,000 kg milk per cow and year from 5,000 to 6,000 kg average milk production could bring an additional variable cost of Lei 767. Therefore, the higher the milk yield, the higher variable cost [8]. Milk price is directly linked to milk quality which has to fulfill the market standards regarding acidity, density, fat percentage, protein percentage, number of somatic cells, number of pathogenic germs. Milk quality depends on cow feeding and season. [17]. Milk price has also a direct influence on profit, because it is important to be higher than milk cost in order to assure a positive financial result. In Romania, milk which meets the quality standards from a microbiological point of view, with 3.2 % fat and 3.7 % protein content was sold at Euro 0.30-0.33 per kg in average in the year 2011 compared to milk price in other EU countries where farmers received Euro 0.33-0.34 per kg milk. Therefore, Romanian farmers received a quite similar milk price at farm gate [12]. Therefore, profit is directly proportional with marketed milk and milk price and inversely proportional with milk production cost. To increase profit, farmers should grow the amount of milk delivered in the market, improve milk quality and keep under control milk production cost. In this context, the purpose of this paper was to analyze the relationships between marketed milk, milk production cost and financial result in term of profit using the simple and multiple correlations and regression function, as well
as the effect of each factor on profit in dairy farming in Romania. MATERIALS AND METHODS In order to carry out this research work, the data were collected from 10 dairy farms situated in the Southern Romania. The data regarding the economic indicators: marketed milk, milk production cost and milk price were picked up for the period 2011-2013 from each farm book-keeping. The average and variation coefficient were calculated for each indicator accoridng to the formulas:
Average, n
XXXA n...21 , (1)
where n = number of years and X= economic indicator (marketed milk, milk production cost, milk price) Standard Deviation, S, S=
1
)( 2
1
n
XXn
ii
(2)
Variation Coefficient, V%
X
SV % x 100
(3) The coefficients of simple linear correlation were estimated using the formula: rxy = Sxy /Sx . Sy, calculating the Student variables in order to test the significance of differences as follows:
txy= (rxy/ 21 xyr ) . 2n and the estimated
values were compared with the corresponding quantiles for t2.5 %, t0.5% and t0.05% with n-2 degrees of liberty. The coefficient of the total multiple liner correlation was determined using the formula:
rz.xy= )1/()..2( 222xyyzxzxyyzxy rrrrrr
and the partial coefficients of multiple linear correlation were calculated using the formula:
rzx.y=( xzr - yzr . xyr )/ )1)(1( 22xyyz rr
The test of significance was carried out by calculating the Fisher variables which were

Scientific Papers Series Management, Economic Engineering in Agriculture and Rural Development Vol. 14, Issue 2, 2014 PRINT ISSN 2284-7995, E-ISSN 2285-3952
225
compared with the quantiles for F5%, F1%, and F0.1%, according to the formula: Fx= [r2
z.xy /(1- r2z.xy)]x (n-3).
Because the linear regression function between a factor Z and other two factors X and Y is the regression plan having the formula: Z= ax + by +c, the parameters a, b, and c were calculated so that the residual variance to have a minimum value ( the least square method), according to the formula: S2
s.xy=(Z1 - ax1 - by1 - c)+...+(Zn - axn - byn - c)2/(n-1)= minimum. It results that the partial derivates of S2
s.xy in relation to the parameters a, b, and c should be zero. Therefore, it is created the system of normal equations given below: a x2
i +b xiyi +c xi = xizi
a xiyi + b y2i +c yi= yizi
a xi +b yi +nc = ni This system of normal equations whose unknowns are a, b and c has the following solutions: a= rzx.y . Sz.y/ Sx.y ; b= rz.xy . Sz.x/ Sy.x and c= - a - b The formula presented below was used for the confidence strip of the regression plan:
Sα/2 = Snnrn xyz .)3(/)1)(1( 2. z .tα/2
The contribution of the factors x, y to the variation of z were calculated using the formulas: A(X,Y)= r2
zx.y ; A(X.Y)= r2zx.y (1-r2
zy) A(y.x)= r2
zy.x ; A(XY)= r2zx + r2
zy -r2z.xy
and the contribution of the error: A(E)= 1-A(X,Y) Based on Z function of profit, three simulations were made considered, one by one, (a)marketed milk as a variable factor and milk production cost as a constant factor, (b) marketed milk as constant factor and milk production cost as a variable factor and (c) both marketed milk and milk production as variable factors. In this way, there were presented the impact of the variation of these two factors on profit coming from marketed milk. RESULTS AND DISCUSSIONS The average and the variation coefficients for the studied economic indicators are presented in Table 1.
The average marketed milk per cow in the studied farms accounted for 5,507 kg with a variation coefficient of 10.90 %. Marketed milk varied between 6.250 kg per cow and year, the maximum level and 4,285 kg/cow/year, the minimum level. The average milk production cost registered Lei 1.07/kg milk, but its value varied between Lei 1.19/kg milk, the highest milk cost and Lei 0.98/kg, the lowest level. The variation coefficient for this indicator was 7.85 %. The cost items with the highest share in the milk production cost were: feeding cost, energy cost, fuel cost, medicines and veterinary services. Feeding cost was on the top position taking into account as a cow consumed about 40 kg forage per day and forage price is enough expensive ( hay price=Lei 0.7/kg, maize price = Lei 0.7/kg etc). The average milk price registered Lei 1.23/kg and varied between Lei 1.4/kg, the highest level and Lei 1.1/kg, the lowest level. Its variation coefficinet accounted for 7.64 %. The average profit coming from marketed milk/cow/year recorded Lei 984.89 with a variation between Lei 2,375/cow/year, the highest level and Lei 314.4/cow/year, the lowest level. The variation coefficient was 69.90 % reflecting a large variation from a farm to another. The main factor determining this variation was the amount of marketed milk, but also, production cost and milk price at farm gate. Table 1. Averages and the variation coefficients for the economic indicators Indicator MU
S
V%
Marketed milk
Kg/cow/year 5,507 600.59 10.90
Milk production
cost
Lei/kg 1.07 0.084 7.85
Milk price Lei/kg 1.23 0.094 7.64 Profit Lei/cow/year 984.89 688.504 69.90
Source: Own calculations Coefficients of simple linear correlation are presented in Table 2. Between the amount of marketed milk and milk production cost it was found a negative and low correlation, r = - 0.023. Therefore, these two indicators are not correlated between them, and the estimated

Scientific Papers Series Management, Economic Engineering in Agriculture and Rural Development Vol. 14, Issue 2, 2014 PRINT ISSN 2284-7995, E-ISSN 2285-3952
226
Student value was -0.064 < 2.31, the quantile for t2.5%. Also between milk production cost and profit from marketd milk, the correlation coefficient was a negative one (r = - 0.376), reflecting that between these two economic indicators there is not a linear correlation. The Student estimated value was -1.145 < 2.31, the quantile for t2.5%. Between marketed milk and profit from milk sold to processors it was found a strong and position correlation, r = 0.918, highly significant. Therefore, these two economic indicators are strongly correlated, as atested by the estimated Student value 6.537 >0.505, the quantile for t0.05%. Table 2. Coefficients of simple linear correlation between the economic indicators
Indicator Milk production cost
Profit from marketed milk
Marketed milk -0.023 0.918***Milk production
cost - -0.376
Source: Own calculations
Coefficients of multiple linear correlation are presented in Table 3. Table 3. Coefficients of multiple linear correlation between the economic indicators
Correlation type Coefficient of correlation
Total coefficient of multiple linear correlation between profit from marketed milk/cow/year and the pair of indicators: marketed milk/cow/year x milk production cost
0.984 ***
Partial coefficient of multiple linear correlation between the pair of indicators: profit from marketed milk/cow/year x milk prodfuction cost, considered constant
0.981***
Partial coefficient of multiple linear correlation between the pair of indicators: profit from marketed milk/cow/year x milk prodfuction cost, when marketed milk was considered constant
-0.895
Source: Own calculations
It was found a strong and substantially significant correlation, F =30.50 > 21.69 for F0.1%, between profit coming from marketed milk/cow/year and the pair of economic indicators: marketed milk and milk production
cost, as well as between profit from marketed milk and marketed milk/cow/year, when milk production cost was considered constant. When marketed milk was constant, the partial multiple correlation between profit from marketed milk/cow/year and milk production cost was very low, not significant and of a negative value. The equation of the regression plan which assured the minimum residual variance was: Z = 1.187 x +11.46 y - 4,262 having the confidence interval ɗα/2 = 309.40. The contributions of the variation of the factors marketed milk and milk production cost to the variation of profit from marketed milk/cow/year are given in Table 4. The main factor with a deep influence on profit from marketed milk is the amount of milk sold to processors, because its contribution to the variation of this indicator of economic efficiency was AX = 82.6 %, under a constant milk production cost. Table 4. The contributions of the variation of marketed milk and milk production cost to the profit variation
Contribution factor Contribution %
The total contribution of the pair of economic indicators: marketed milk/cow/year and milk production cost
96.8
The partial contribution of the variation of marketed milk, when milk production cost was considered constant
82.6
The partial contribution of the variation of milk production cost, while marketed milk was considered constant
12.6
The partial contribution ofthe variation of the interraction between marketed milk/cow/year and milk production cost
1.6
The contribution of the error variation 3.2 Source: Own calculations When marketed milk was considered a fixed factor, milk production cost had a negative influence, but a weak one on profit from marketed milk per cow. Simulation of the variation of the profit from marketed milk Taking into account these aspects, it was established by simulation the profit variation depending on marketed milk and milk

Scientific Papers Series Management, Economic Engineering in Agriculture and Rural Development Vol. 14, Issue 2, 2014 PRINT ISSN 2284-7995, E-ISSN 2285-3952
227
production cost, considered one by one, firstly, as variable indicators and then, secondly, as fixed indicators ( Table 5). (a)Considering marketed milk production, X, a variable factor and milk production cost, Y, a constant factor and equal to Lei 1.07/kg milk, the average milk production cost registered by the 10 dairy farms involved in this study, one can notice that a growth of marketed milk by 100 kg could determine an increased profit from milk by Lei 18.7 per cow and year in average from a marketed milk production level to another. Table 5.Profit variation (Z) depending on marketed milk (X), considered a variable indicator and milk production cost (Y), considered a constant factor X-Marketed
milk, a variable indicator Y-Milk
production cost, a
constant factor = Lei
1.07/kg
Z=Profit from
marketed milk
X-Marketed milk, a variable indicator Y-Milk
production cost, a
constant factor= Lei
1.07/kg
Z=Profit from
marketed milk
4,000 498.26 5,600 2,397.464,100 616.96 5,700 2,516.16 4,200 736.66 5,800 2,634.86 4,300 854.36 5,900 2,753.56 4,400 973.06 6,000 2,872.26 4,500 1,091.76 6,100 2,990.96 4,600 1,210.46 6,200 3,109.66 4,700 1,329.16 6,300 3,228.36 4,800 1,447.86 6,400 3,347.06 4,900 1,566.56 6,500 3,465.76 5,000 1,685.26 6,600 3,584.46 5,100 1,803.96 6,700 3,703.16 5,200 1,922.66 6,800 3,821.86 5,300 2,041.36 6,900 3,940.56 5,400 2,160.06 7,000 4,059.26 5,500 2,278.76
Source: Own calculations The difference between a farm where a cow gives 7,000 kg marketed milk and a farm where a cow produces 4,000 kg marketed milk, in terms of profit from marketed milk is Lei +3,561 per cow and year. The difference in terms of profit, between the farm where a cow produces 7,000 kg marketed milk and a farm where a cow achieves 5,000 kg marketed milk is Lei +2,374/cow/year. And the additonal profit coming from milk sold to
processors got by a farm where a cow produced 7,000 kg marketed milk compared to a farm where a cow produced 6,000 kg marketed milk is Lei +1,187 per cow and year. Therefore, for an additional amount of 1,000 kg milk marketed to processors, a farmer could get Lei 1,187 additional profit per cow and year. (b)Considering marketed milk, X, a constant factor and equal to 5,507 kg, the average marketed milk registered by the 10 dairy farms considered in this study and milk production cost, Y, a variable factor, one can notice that a growth by Lei 0.02/ kg production cost can not affect profit level, than in a very low measure, Lei 0.229/cow and year, practically by 0.01 %, which means nothing ( (Table 6). Table 6.Profit variation (Z) depending on marketed milk (X), considered a constant factor and milk production cost (Y), considered a variable factor X-Marketed
milk, a variable indicator Y-Milk
production cost, a
constant factor =5,507
kg/cow/year
Z=Profit from
marketed milk
X-Marketed milk, a variable indicator Y-Milk
prodcution cost, a
constant factor=5,507 kg/cow/year
Z=Profit from
marketed milk
1 2,286.266 1.22 2,288.790 1.02 2,286.498 1.24 2,289.019 1.04 2,286.727 1.26 2,289.248 1.06 2,286.956 1.28 2,289.477 1.08 2,287.185 1.30 2,289.707 1.10 2,287.415 1.32 2,289.936 1.12 2,287.644 1.34 2,290.165 1.14 2,287.873 1.36 2,290.394 1.16 2,288.102 1.38 2,290.623 1.18 2,288.331 1.40 2,290.852 1.20 2,288.561
Source: Own calculations (c)Considering marketed milk, X, a variable factor and milk production cost also a variable factor, one can notice that profit could grow by Lei 118.9/cow and year for each 100 kg increase of marketed milk and every additional Lei 0.02 for milk production cost (Table 7).

Scientific Papers Series Management, Economic Engineering in Agriculture and Rural Development Vol. 14, Issue 2, 2014 PRINT ISSN 2284-7995, E-ISSN 2285-3952
228
Table 7.Profit variation (Z) depending on marketed milk (X), considered a variable factor and milk production cost (Y), considered also a variable factor
X-Marketed milk, a variable
factor
Y-Milk production cost, a variable factor
Z-Profit from marketed milk
X-Marketed milk, a variable
factor
Y-Milk production cost, a variable factor
Z-Profit from marketed milk
4,000 1 497.46 5,600 1.32 2,400.327 4,100 1.02 616.38 5,700 1.34 2,519.256 4,200 1.04 735.31 5,800 1.36 2,522.1814,300 1.06 854.24 5,900 1.38 2,757.1144,400 1.08 973.17 6,000 1.40 2,876.044 4,500 1.10 1,092.106 6,100 1.42 2,994.973 4,600 1.12 1,211.035 6,200 1.44 3,113.901 4,700 1.14 1,3289.96 6,300 1.46 3,199.456 4,800 1.16 1,448.89 6,400 1.48 3,351.760 4,900 1.18 1,567.82 6,500 1.50 3,470.69 5,000 1.20 1,686.752 6,600 1.52 3,589.61 5,100 1.22 1,805.681 6,700 1.54 3,708.54 5,200 1.24 1,924.620 6,800 1.56 3,827.47 5,300 1.26 2,043.539 6,900 1.58 3,946.406 5,400 1.28 2,162.468 7,000 1.60 4,065.336 5,500 1.30 2,281.398
Source: Own calculations CONCLUSIONS Marketed milk represents one of the key factors for increasing profit in dairy farms. At a constant level of milk production cost, Y= Lei 1.07/kg, an 100 kg growth of marketed milk could determine an additonal profit from milk accounting for Lei 18.7 per cow and year in average, When marketed milk is constant and equal to 5,507 kg,and milk production cost would grow by Lei 0.02/kg, its influence on profit coming from sold milk could be neglected because is very small. When both marleted milk and milk production cost were variable factors, profit increased by Lei 118.9/cow and year for each 100 kg increase of marketed milk and every additional Lei 0.02 production cost. The large variety of dairy farms regarding farms size and production potential, feeding and raising conditions it isnot possible to set up a model available for any farm. Howeverm what is impportant for practice is the fact that farmers should peridically analyze production records, production costs and profit in order to identify the favorable factors of influence which could increase their profit. In this respect, it is important to identify and decide which pair of marketed milk and prodcution
cost shoudl adopt in order to get a higher and higher profit. Froma technical point of view, farmers should keep in thier mind that the harminization of all the factors determining marketed milk per cowmis very important for producing a kilogram of milk with lower production costs. An increased milk yield requires an optimal feeding and selection pressure by high breeding value bulls, besides the selection of the primiparous cows. An increased marketed milk requires an increased average milk and also a reduced milk consumption by calves, but also a higher milk quality. Farmer should keep under control milk production costs looking for solutions to reduce them as mush as they can in order to balance the relationship between milk cost and milk price in the benefit of a higher profit from marketed milk. ACKNOWLEDGMENTS The author thanks the ten dairy farmers for their kindness and all their support to provide the data from the farm book-keeping as this paper to be carry out.

Scientific Papers Series Management, Economic Engineering in Agriculture and Rural Development Vol. 14, Issue 2, 2014 PRINT ISSN 2284-7995, E-ISSN 2285-3952
229
REFERENCES [1]Badulescu Ovidiu, Annual cost estimation calculus in a dairy farm of average size (200 dairy cows) http://www.bovismagazin.com/arhiva/prezentari/324-calculul-estimativ-anual-al-costurilor-dintr-o-ferma-de-vaci-de-dimensiuni-medii-200-capete [2]Ceapoiu, N, 1968, Statistical methods applied in agricultural and biological experiments, AgroSilvica Press House, Bucharest [3]Ene, D., 1985, Biological Mathematics and Statistics, IANB Bucuresti Press House [4]Ene, D., 2004, Mathematics (I), Ceres Press House [5]Ene, D., 2005, Mathematics (II), Ceres Press House 1. [6]MacDonald James M., O’Donoghue Erik J., McBride William D., Nehring Richard F., Sandretto Carmen L., Mosheim Roberto, Profits, Costs, and the Changing Structure of Dairy Farming, USDA, Economic Research Report No.47 [7]Munteanu Liviu, Factors influencing production, http://www.ojcacs.ro [8]Pirvutoiu, I., Popescu Agatha, 2012, Research concerning Standard Gross Margin depending on Yield in Dairy Farming, Scientific Papers Animal Science and Biotechnologies, Vol.45(2):339-342 [9]Popescu Agatha, 1990, Variation of financial result per cow depending on marketed milk and milk production cost, Proceeding of the Symposium on Novelties and Expectations in Animal Breeding, Agricultural Institute Cluj-Napoca, November 9-10, 1990, pp.389-396 [10]Popescu Agatha, 2006, Financial Management in Dairy Farms, Dominor Publishing House, Bucharest [11]Popescu Mihaela, Romania in top 10 UE countries for milk production, but only one of five liters arrives at the processing plants, http://www.zf.ro/companii/romania-in-top-zece-la-productia-de-lapte-in-ue-insa-doar-unu-din-cinci-litri-ajunge-in-fabrici-7467177 [12]Prevenda Mihaela, 2011, Milk market at the end of the year, 25 December 2011, http://www.revistafermierului.ro/zootehnie/piata-laptelui-la-final-de-an-2512.html [13]Salfer Jim, 2010, Know the drivers of dairy farm profitability, Dairy Star September 3, 2010 [14]Sarkerer Debnarayan, Ghosh Bikash Kumar, 2008, Economics of Milk Production in West Bengal: Evidence from Cooperative and noncooperative Farms, Journal of Economics and Business, Vol. XI – 2008, No 1 & No 2 [15]Schulte Kristen, Dhuyvetter Kevin, 2010, Factors Impacting Dairy Profitability:, An Analysis of Kansas Farm Management Association Dairy Enterprise Data , Department of Agricultural Economics, Kansas State University January 2010 [16]How to get Euro 1,650 monthly raising dairy cows in a shed established with minimum costs? http://www.cresterea-bovinelor.ro/
[17]Food safety starts at farm, The Friesian and AgroConsultancy, The Bilateral Romanian Dutch Project, Quality Control along milk chain in Romania,

Scientific Papers Series Management, Economic Engineering in Agriculture and Rural Development Vol. 14, Issue 2, 2014 PRINT ISSN 2284-7995, E-ISSN 2285-3952
230

Scientific Papers Series Management, Economic Engineering in Agriculture and Rural Development Vol. 14, Issue 2, 2014 PRINT ISSN 2284-7995, E-ISSN 2285-3952
231
DIRECT PUBLICITY – ONE OF THE MOST MODERN METHOD FOR PROMOTION Liliana POPESCU University of Agricultural Sciences and Veterinary Medicine Bucharest, 59 Marasti, District 1, 11464, Bucharest, Romania, Phone/Fax: 00 40 213182888; Email: [email protected] Corresponding author: [email protected] Abstract This writing paper suggests tracing out a field that the public in our country approached much more at least in the last years: “Direct advertising”. All through this field of promotion, they lay stress on the preferential relations with clients and firms like IBM, American Airlines practice many relations since the end the eighties. Direct advertising covers a large area of activities starting with the informing of the consumers and the conclude of the transaction. For a better understanding of the notion this work is given with a few special studies. Key words: advertising, clients, direct publicity, relations INTRODUCTION In order to "push" products and services for consumers, most companies rely mainly on advertising, the promotion, the sales promotion and personal selling. They use their advertising to inform consumers about the existence of the product and to awaken their interest and sales promotion to encourage them to buy the product and sell direct to end transaction effectively [1]. Direct advertising - content, features, advantages Direct advertising trying to compress those elements into one to make a sale without using intermediary. The person who came in contact with an advertisement through a catalog, mail, the telephone, magazines, newspapers, television or radio - can place an order via a free phone number, indicating the card number credit that will be paid, or launch mail order, indicating in writing his credit card number or by sending a check in the same envelope equivalent order value [2]. MATERIALS AND METHODS Direct advertising is an interactive system that uses one or more advertising media to achieve a measurable response or transaction in one place.
RESULTS AND DISCUSSIONS Over the years, companies Citicorp, AT & T, Ford and American Airlines used to direct advertising and create profitable customer relationships. Colgate-Palmolive, Procter & Gamble, Quaker Oats, General Foods and other suppliers of consumer goods have begun to use advertising techniques directly since the late 80's in order to ensure customer loyalty and to "kidnap" the targeted clients of competing brands. Retailers such as Saks Fifth Avenue and Bloomingdale's, consumers regularly send catalogs to supplement effectuate sales in stores. Direct advertising companies like LLBean, Land's End, EddieBauer, Spiegel's, Franclin Mint and Sharper Image, made a fortune practicing direct advertising based on ordering by mail or by phone. Many of them have opened retail shops as managed through direct advertising, impose strong market brand name [3]. Emphasis is placed on creating preferential relations with clients. Airlines, hotels and other businesses create strong relationships with their customers through programs consisting in offering prizes to those who use more of their services and use their databases about customers to help launch offers "targeted" by individual customers . They do offer those customers and potential customers

Scientific Papers Series Management, Economic Engineering in Agriculture and Rural Development Vol. 14, Issue 2, 2014 PRINT ISSN 2284-7995, E-ISSN 2285-3952
232
who are the most capable, most ready to buy your product or service. To the extent that they succeed, companies will get much higher response rates from their promotional actions. Effectuate sales by means of direct advertising have grown rapidly. While retail sales annual growth of 6% base sales catalog by mail or meet an annual growth of about 10%. In 1988 sales by catalog or mail were estimated at $ 164 billion [4]. Direct advertising is used by manufacturers, retailers, service organizations, trade catalog and nonprofit organizations. Development that has taken the consumer market is largely a reaction to the fact that the market has lost its homogeneity, which has led to an increasing number of market niches that have needs and preferences singled.Direct advertising has grown rapidly in the sphere of marketing business. One of the main reason is the high cost and increasing the penetration markets business through sales agents [5]. Advertising Direct offers customers many benefits. Buyers who use the channels of goods by mail order states that making purchases using postal orders is fun, convenient and is hassle free. This method allows you to save time. They can make comparisons between different goods just sitting on the couch and browse the catalogs of commercial presentation. Can I come in contact with a wide variety of goods and new lifestyles. Can I order gifts to be sent directly to certain recipients without being forced to leave the house. And industrial customers they recognize this method a number of advantages, one of which deserves to be noticed opportunity to receive information about the many products and services without being forced to waste time meeting with salespeople. Direct advertising offers a number of advantages and sales. It allows a more accurate selection of potential customers. A practitioner of this technique can buy a mailing list that contains only the names of persons who belong to a well-defined group, whatever it may be, for example: persons clumsy, millionaires, newborns etc. The message can be customized and adapted to the needs of each client. Direct advertising
practitioner can bild an ongoing relationship with each of its clients. Direct advertising organization allows a precise time activities, so you can make contact with potential customers exactly at the right time. Advertising materials enjoy more attention from the public as they reach, potentially customers have greater interest in dose products. Advertising allows direct comparison and test different messages and communication techniques (news releases, letters of welcome advantages other prices and the like) in search of the most effective economically approaches . Ensure confidentiality through direct advertising that offer and strategy remain hidden practitioner competitors. Finally, the practicant of direct advertising knows when the company is profitable or not, because it has the ability to gauge public reaction [6]. The main tools of Direct advertising Catalogue. Those selling ships annually based catalog by mail more than 12.4 billion copies 8500 different catalogs. On average, a family receives in a year, at least 50 catalogs. The catalogues are sent by large general retailers - JC Penney, Spiegel - which sells a comprehensive range of goods. Specialized stores such as Neiman-Marcus and Saks Fith Avenue, sending catalogs to maintain middle-class market. These catalogs shows the goods expensive, often exotic jewelry and gourmet refinements. Many corporations have acquired and have created specialized divisions mail order. There are thousands of small firms who publish catalogs, especially in the field of specialized goods such as electronic items, gardening equipment, women's clothing, household items, etc.. Among the most innovative home based mail order catalog waters are Land's End (sportswear), LL Bean (sportswear) and Sharper Image (electronic items). They hold positions in the creation of attractive assortment of products and their presentation using leaflets - well done color. They offer their clients a toll free telephone number for 24 hours a day, accept payment by credit card and ships the goods immediately. The success of the mail order business depends largely on

Scientific Papers Series Management, Economic Engineering in Agriculture and Rural Development Vol. 14, Issue 2, 2014 PRINT ISSN 2284-7995, E-ISSN 2285-3952
233
the company's ability to keep their records effectively address lists and lists of customers to market and create an image of "company that offers various benefits for the customers." Some companies that sell based on catalog that are distinguished by their catalogs inserted in literature or media information, send customers samples of materials, hold a "hotline" through which to respond to questions, send gifts to loyal customers and donates a part of profits to charities. A small part of the most famous houses orders - Sharper Image, Land's End - have opened outlets retail to attract and through other channels both old clients as well and along the newcomers to do business with them. Some houses orders based catalog - Neiman-Marcus, Spiegel - experience a new form, video catalog, which he sent by post so the best clients and the most promising prospects. Post. Advertising by posting is huge business, which runs the annual amount of tens of billions of dollars. Merchants mailed individual materials such as letters, flyers, brochures and other "salespeople with wings". Some merchants send audio tapes, videos and even computer diskette. A company specialized in producing home gym equipment sent by post a videotape containing a film which shows both how to use a home gym machine, called "Nordic Track Cardiovascular Exerciser" and health benefits that it shows it. Ford sends people respond to her ads for automotive magazines published in a computer diskette called "Disk Drive Test Drive". Disk menu allows the customer to read a convincing advertising material, to obtain technical data and see an attractive graphic material, all relating to a particular model of car, and to get answers to the most frequently asked questions in the field. CONCLUSIONS The popularity of direct mail is growing because it makes it possible to select the precise target market can be personalized, is flexible and allows the testing and measuring of results to be made early. The cost per
thousand people reached is higher than when using mass media, but it is more likely that people who come into contact actually become customers. In 1991, more than 45% of Americans have bought through direct mail. It turned out that direct mail is more successful in promoting books in subscription magazines and insurance field. It is increasingly used in the MODAS selling gift items, clothing, specialty food and industrial products. It is also much used in the case of charitable activities through its succeeding, in 1990, collecting $ 49 billion (24 in total funds collected by charities). Moreover, in 1990, provided funds to charity represented 25% of total revenues due to its posting. REFERENCES [1]Balaure, V., 1985, Marketing in alimentative publica sI turism, Publishing House ASE, Bucharest [2]Berbecaru, I., 1976, Strategia promotional in turism, Publishing House Sport-Tourism, Bucharest [3]Engel, J.F., Warshaw, M.R., 1987, Promotional strategy. Managing the marketing communications process, Illinois [4]Florescu, C., 1992, Marketing, Publisng House Marketer, Bucharest [5]Lanquar, R., Hollier, R., 1993, Le marketing touristique, Paris [6]Morrison, A.M., 1989, Hospitality and travel marketing, New York

Scientific Papers Series Management, Economic Engineering in Agriculture and Rural Development Vol. 14, Issue 2, 2014 PRINT ISSN 2284-7995, E-ISSN 2285-3952
234

Scientific Papers Series Management, Economic Engineering in Agriculture and Rural Development Vol. 14, Issue 2, 2014 PRINT ISSN 2284-7995, E-ISSN 2285-3952
235
EMPLOYMENT DIFFICULTIES EXPERIENCED BY YOUNG PEOPLE IN THE RURAL AREAS OF THE REPUBLIC OF MOLDOVA
Veronica PRISĂCARU, Tatiana SEVCIUC
State Agrarian University of Moldova, 44 Mircesti Street, MD-2049, Chisinau, Republic of Moldova, Phone:00 373 22 22 44 27, E-mail: [email protected] Corresponding author: [email protected] Abstract The basic aim of our investigation was to elucidate the problems of young people as part of the human potential of rural areas. As a result of processing statistical data related to the evolution of the labour market in the Republic of Moldova, there were highlighted the differences between the average indicators of the labour market in the country, both in urban and rural areas, putting a particular emphasis on young people. Also, according to the generalization of a survey data there were found the causes that repress the desire of graduates of agricultural education institutions to find jobs in rural areas. The final conclusion is that even if in the country at governmental level, certain attempts are made to attract young people to work in villages, their efficiency is still insufficient. Key words: labour market, rural area, unemployment, young people INTRODUCTION It is well known the essential role of young people in ensuring country’s economic and social potential. The level of young people employment represents a key factor in the future development of society. Therewith, a qualitative job offers a number of advantages to young people, and namely: - the opportunity to enhance their knowledge and professional skills; - the opportunity to grow intellectually; - psychological benefits manifested by getting satisfaction from a certain social status in the work group, from the performed duties and responsibilities etc. According to the Youth Legislation of the Republic of Moldova, the notion of young people designates those aged 16-30 years (1999). The Article 46 of the Labour Code of the Republic of Moldova stipulates that the individual acquires the capacity to work at the age of 16. Also, it is stated that the conclusion of the individual employment contract is possible from the age of 15 years provided the written consent of parents or guardians (2003). According to the definition of the International Labour Organization, the youth
comprises the population aged 15-24 years (Ministry of Labour, Social Protection and Family. Stimulating the employment of young people. Proposals of public policies. April 2012). MATERIALS AND METHODS As material for this investigation we took the publication of the Ministry of Labour, Social Protection and Family „Stimulating the employment of young people”, data on young people employment and unemployment presented in the edition of the National Bureau of Statistics of the Republic of Moldova „Labour force in the Republic of Moldova. Employment and unemployment. 2013”, a series of statistics that show the evolution of labour market indicators in the period 2008-2012 taken from the official site of the National Bureau of Statistics of the Republic of Moldova, the results of a questionnaire involving 210 students of State Agrarian University Moldova in the last academic year, 1st Cycle. The used methodological tools included: critical analysis of the problem, dynamics evaluation of the labour market indicators, comparative analysis of these indicators by areas, identification of trends and issues

Scientific Papers Series Management, Economic Engineering in Agriculture and Rural Development Vol. 14, Issue 2, 2014 PRINT ISSN 2284-7995, E-ISSN 2285-3952
236
related to youth employment, highlighting the gap between the average indicators in the country and those related to rural areas. RESULTS AND DISCUSSIONS Making a study of basic indicators characterizing the labour market in the Republic of Moldova in the period 2008-2012 (Table 1), we found out that there was an
essential gap between the national average indicators and the indicators related to young people (15-24 years). Thus, if the average activity rate in 2012 was 40.7%, then the activity rate of the young population was only 20.2%. A similar situation was also observed when examining the employment rate: the national average rate was 38.4%, while the employment rate of young people reached only 17.6%.
Table 1. Evolution of the labour market indicators in the Republic of Moldova in the period 2008-2012
Indicators 2008 2009 2010 2011 2012 Average activity rate, % 44,3 42,8 41,6 42,3 40,7 Youth activity rate,% 20,8 21,5 21,9 22,3 20,2Average employment rate, % 42,5 40,0 38,5 39,4 38,4Youth employment rate, % 18,5 18,1 18,0 18,9 17,6 Average unemployment rate, % 4,0 6,4 7,4 6,7 5,6 Youth unemployment rate, % 11,2 15,4 17,8 14,9 13,1 Source: Labour force in the Republic of Moldova. Employment and unemployment, 2013; Statistics by areas. Labour force.
The problem of the low level of youth employment is also confirmed by the fact that the unemployment rate of youth exceeds considerably the average unemployment rate in
the country. The situation is getting worse because there were no improvement trends in the analyzed period (Figure 1).
Fig.1. Comparative evolution of the average indicators of the labour market and of the indicators related to the
young population in the Republic of Moldova in the period 2008-2012
When examining labour market indicators by areas we noticed that the problems of youth segment are more acute in the rural areas. Thus, examining the evolution of the
following indicators: the activity rate and the employment rate (Figure 2), we found out the following:

Scientific Papers Series Management, Economic Engineering in Agriculture and Rural Development Vol. 14, Issue 2, 2014 PRINT ISSN 2284-7995, E-ISSN 2285-3952
237
- the activity rate of young people in rural areas in 2012 was by 8.1 percentage points lower than in urban areas; - the employment rate of young population from rural areas in the same year was lower than in urban areas by 6.5 percentage points; - compared to 2008, the gap between the mentioned indicators in 2012 was higher. Thus, if in 2008 the difference between the
activity rates by areas constituted 2 percentage points, the same difference for the year 2012 increased by 6.1 percentage points. The absolute increase of the difference between the employment rates by areas in this period was of 5.7 percentage points.
Fig.2. The evolution of activity and employment rates of the young population of the Republic of Moldova by areas
in the period 2008-2012
An apparently better situation can be found in the comparative examination of the unemployment rate. Thus, if in 2012 the unemployment rate of young people in urban areas was 14.6 %, then in the rural areas it was only 11.8%, i.e. by 2.8 percentage points less (Figure 3). It seems that the increased rate of youth unemployment is a normality that could be explained by the lack of experience, lack of social relationships etc. Compared to European statistics, the unemployment rate of young population in the Republic of Moldova is even lower (in the EU every seventh young person is unemployed, while in the Republic of Moldova - every fifth). If, however, we make an objective assessment of the situation, there can be highlighted the following aspects: the study of the Ministry of Labour, Social Protection and Family states that every fifth young person looking for a job is unemployed (2012).
Therefore, the statistics considers only the young people who have legalized the status of unemployed. It is well known, however, that the number of unemployed people is much higher in the Republic of Moldova, a great part of them being gone abroad. On the other hand, it is obvious that in conditions of low activity and employment rates, the actual unemployment rate of young people cannot be at such a low level. Thus, we conclude on a situation which is actually more serious than the one officially presented. The low level of youth employment rate leads to a smaller share of this category of employees in the total employed population. n addition to the low percentage of young people in the total employed population, it can be also noticed a very small share in the segment of young employees with higher and specialized secondary education (Table 2). However, when comparing the data by areas, one can notice that there is a significant gap in

Scientific Papers Series Management, Economic Engineering in Agriculture and Rural Development Vol. 14, Issue 2, 2014 PRINT ISSN 2284-7995, E-ISSN 2285-3952
238
this regard: in 2012, there were 2.76% of employed young people with higher education and 0.97% with specialized secondary
education while in the rural areas these indicators were respectively 0.91 and 0.67%.
Fig.3. The evolution of the youth unemployment rate in the Republic of Moldova by areas in the period 2008-2012
Table 2. The share of young people, young people with higher education and young people with specialized secondary education in the employed population of the Republic of Moldova in the period 2008-2012
Indicators 2008 2009 2010 2011 2012 The share of young people in the employed population, %
9,94 10,24 10,3 10,23 9,3
The share of young people with higher education in the employed population, %
1,64 1,85 1,72 1,95 1,81
including: In urban areas 2,91 2,94 2,68 3,18 2,76 In rural areas 0,59 0,91 0,89 0,84 0,91 The share of young population with specialized secondary education in the employed population, %
0,70 0,71 0,93 1,08 0,82
including: In urban areas 0,97 0,86 1,08 1,17 0,97 In rural areas 0,49 0,60 0,78 1,01 0,67 Source: Labour force in the Republic of Moldova. Employment and unemployment, 2013; Statistics by areas. Labour force.
The low level of the mentioned indicators in the rural areas and the lack of growth trends in the analyzed period are factors that hinder not only the economic growth, but also attest a reduction of the cultural and intellectual potential in those areas. Simultaneously, we can conclude with certainty that the actions undertaken so far by the Government to attract young people in rural areas didn’t reach the expected effectiveness. Among these actions we can enumerate the amenities granted to teachers, pharmacists and doctors who get employed in rural areas, providing free housing to young specialists etc. One of
the reasons is related to the problem of difficult implementation of the mentioned actions. Thus, it can be stated that in 2009, for example, 24 young specialists received free housing (Ministry of Labour, Social Protection and Family. Stimulating the employment of young people. Proposals of public policies. April 2012)which is an indicator denoting more failure than success in solving the problem of attracting young people in rural areas. There are also essential reserves in the superficial and inadequate methodology used by the competent bodies to make the

Scientific Papers Series Management, Economic Engineering in Agriculture and Rural Development Vol. 14, Issue 2, 2014 PRINT ISSN 2284-7995, E-ISSN 2285-3952
239
diagnostic of the problem. Thus, according to the Ministry of Labour and Social Protection [3], one of the main reasons for youth unemployment is the low quality of studies within the education system, conclusion
drawn based on the opinions of employers, who, in turn, explain by this the refusal to employ young specialists.
Table 3. The share of young people with higher and specialized secondary education in the employed population of the Republic of Moldova by areas in the period 2008-2012
Indicators 2008 2009 2010 2011 2012 The share of young people with higher education in the employed population in urban areas, %
2,91 2,94 2,68 3,18 2,76
The share of young people with higher education in the employed population in rural areas, %
0,59 0,91 0,89 0,84 0,91
The share of young people with specialized secondary education in the employed population in urban areas, %
0,97 0,86 1,08 1,17 0,97
The share of young people with specialized secondary education in the employed population in rural areas, %
0,49 0,60 0,78 1,01 0,67
Source: own calculation on the basis of data from Statistics by areas. Labour force.
They also say that hiring young specialists requires additional investment in order to increase their productivity. But the subjective nature of these affirmations can be confirmed by the following facts: - It is clear that in conditions of severe competition on the labour market, employers prefer to hire experienced professionals and the argument submitted by them is just a justification. A graduate of an educational institution, regardless of his/her academic success and acquired potential needs time to adjust to the organization where he/she was employed, because no education system, regardless its high performance and efficiency degree, cannot guarantee full compliance of the knowledge and skills with the specific features of each enterprise. On the other hand, employers’ assertion about making additional investment in young specialists is only a declarative one. In practice, such situations practically don’t happen – if the young people are motivated to activate in a certain enterprise, they find themselves various ways to improve their knowledge and skills in the necessary area; - It can be given an assessment of specialists’ training in the educational institutions based only on the synthesized opinions of employers, even more; one cannot
identify this one as one of the most important reasons of youth employment problems and neglect a series of other factors. It is obvious that the educational system of the Republic of Moldova is not a perfect one and needs improvement, but we must also recognize that the problem of youth employment opportunities, especially in rural areas, represents a high complexity problem caused by a number of factors and requires a more rigorous diagnostic, using more efficient research methodologies and tools. By generalizing the results of a questionnaire conducted among the students of the final academic year at State Agrarian University of Moldova it was found that 83% of respondents prefer to seek employment in the city, including 95% of economic specialities, 80% of technical specialities and 70% of agricultural specialities. Among the most frequently indicated reasons to find employed in the city we can mention: - greater opportunities to make a career - 75% of respondents; - better conditions for living and rest - 35% of respondents; - the opportunity to continue the studies - 30% of respondents; - higher wages offered by employers - 23% of respondents.

Scientific Papers Series Management, Economic Engineering in Agriculture and Rural Development Vol. 14, Issue 2, 2014 PRINT ISSN 2284-7995, E-ISSN 2285-3952
240
However, 50% of those who prefer to seek employment in the village indicated as the basic reason the housing provided by parents. When asked „What is, according to you, the reason of high unemployment rate among young people in the Republic of Moldova?”, most respondents (70%) indicated low wages offered by employers. 27 % of them believe that one of the reasons for this problem is high requirements of employers, while 25% of respondents consider that the country lacks effective levers that would motivate the enterprises to hire young specialists. It is significant that 73% of respondents, among the factors that would help them to get a job easier, gave preference to additional skills obtained individually (the study of advanced computer software, learning foreign languages, etc.). Thus, according to the results of the questionnaire, there is an urbanization trend among young people even within the agricultural specialities, this trend being substantiated by several opportunities to grow professionally, completion of studies, as well as by the possibility to obtain greater material benefits. At the same time, even during their studies at the university, the future graduates realize the absence of an effective state mechanism that would facilitate youth employment. CONCLUSIONS In the Republic of Moldova there is a substantial gap between the labour market indicators in the country and those related to young people. Thus, we found significant differences between the following indicators: employment rate, activity rate and unemployment rate with respect to the whole labour market and to the young population segment (aged 15-24 years). Although the rate of youth unemployment in the Republic of Moldova is lower than the EU average, but the real situations more serious because the number of unemployed people registered at the employment offices is much lower than the actual number of unemployed young people.
The problem of youth employment in rural areas is much worse than in urban areas, this conclusion being argued by the lower share of young people in the employed population, lower levels of the activity and employment rates, as well as by lower percentage of young people with higher and specialized secondary education in the total number of employed population. Despite the fact that the Government of the Republic of Moldova has implemented a series of actions in order to attract the young professionals in rural areas, they did not reach the expected effectiveness so far. As a result of an opinion poll conducted among the final year students of SAUM we concluded that the preference for a job in the city persists even among those who study at agricultural specialities and this choice is argued by more opportunities to grow professionally, completion of studies and by the chance to obtain greater material benefits. The high complexity problem of youth employment, including in the rural areas, requires the implementation of more advanced diagnostic methodologies and effective governmental actions in order to solve it. REFERENCES [1]Labour Code of the Republic of Moldova. Nr. 154 of 28.03.2003. www.lex.justice.md. [2]Labour force in the Republic of Moldova. Employment and unemployment, 2013, National Bureau of Statistics of the Republic of Moldova, Chisinau, 24-31. [3]Ministry of Labour, Social Protection and Family. Stimulating the employment of young people. Proposals of public policies. April 2012. www.scribd.com. 3-11. [4]Statistics by areas. Labour force. www.statistica.md. [5]Youth Legislation Nr.279-XIV of 11.02.1999. www.mts.gov.md.

Scientific Papers Series Management, Economic Engineering in Agriculture and Rural Development Vol. 14, Issue 2, 2014 PRINT ISSN 2284-7995, E-ISSN 2285-3952
241
THE ROLE OF ORGANIC AGRICULTURE IN THE CONSERVATION OF GENETIC RESOURCES AND INCREASING AGRODIVERSITY Svetlana ROLJEVIC, Predrag VUKOVIC, Biljana GRUJIC Institute of Agricultural Economics 15, Volgina Street, 11060 Belgrade, Serbia, Phone: +381 (0) 11 69 72 842, Fax: +381 (0) 11 69 72 858, E-mail: [email protected] Corresponding author: [email protected] Abstract Organic agriculture is an ecological form of production that promotes natural processes and biological diversity, legally regulated and is subject to inspection, which guarantees quality and health safety of food produced. Except producing healthy and quality food, the adoption of organic agriculture in recent decades has been indirectly established for saving species and varieties of cultivated plants which is due to lack of use threat disappearance.This paper analyzes the state of the global and national soil area under organic agriculture, as well as state of soil under organic production of grain crops as crucial for the food security of almost all countries in the world.Furthermore, paper work presents the state of genetic resources of cereals and show importance that organic agriculture has in process of preservation agro-diversity. Key words: agrodiversity, genetic resources, grains, organic agriculture INTRODUCTION Safety in the food supply, quality and health safety of food products vary around the world which makes achieving these three objectives a major challenge for the near future. The survival of industrialized agriculture is increasingly called into question since the contamination of the global food chain and water residues of persistent pesticide, nitrates, and all inferior organoleptic and nutritional properties of food is taking place. Organic farming excludes the use of synthetic inputs and largely relies on the respect of crop rotation, selection of varieties adapted to local conditions, the use of biological agents for crop protection, and use of organic and natural fertilizers. Prohibited use of chemical pesticides in organic agriculture is a very important standard in terms of land, water, biodiversity and health of both producers and consumers of food. Test conducted in Italy in the period 2002-2005 at the 3,500 samples of food of plant origin, found that the majority (97.4 %) of organic agricultural products do not contain detectable pesticide residues (Tasiopoluou et al., 2007). In the past, agriculture has played an important role in maintaining genetic diversity. However, due to the resulting economic and environmental changes replacing a large number of species with a small number of superior performance of high and uniform varieties and hybrids, has caused a
significant loss of agro-diversity. More than 40 % of the land is used for agriculture, making it a great responsibility to protect biodiversity. Many species and varieties that have played an important role in human nutrition practically disappeared over the past century. Rahmann (2011) states that during the twentieth century, a lost about 75 % of plant genetic diversity is recorded mainly by farmers and many local varieties replacing a few genetically uniform hybrids. MATERIALS AND METHODS The paper points out the role of organic agriculture in the biodiversity preservation. The paper is structured into three parts. The first part provides an overview of the state of the area under organic agriculture at the global level, the level of the European Union and the Republic of Serbia in the period 2007-2011.The second part gives an overview of the state of genetic resources of cereals as crops that have a key role in the diet of most of the global population, while in the third part of the paper on the role of organic agriculture in the preservation of biodiversity and genetic resources, the increasing diversity on farms "on farm "conservation. The paper use data from Research Institute of Organic Agriculture FiBL and the International Federation of Organic Agriculture Movements IFOAM, which are then processed and presented in graphical and tabular

Scientific Papers Series Management, Economic Engineering in Agriculture and Rural Development Vol. 14, Issue 2, 2014 PRINT ISSN 2284-7995, E-ISSN 2285-3952
242
form, and then analyzed. Besides the statistical data used are relevant domestic and foreign literature sources. RESULTS AND DISCUSSIONS Area under organic production globally and in the Republic of Serbia Since the beginning of the twentieth century, organic farming has grown rapidly worldwide, so the area under the land management significantly increased. According to the data available from the 2011.the organic production is performed in over thirty seven million hectares worldwide, which represents 0.9 % of global agricultural areas (Tables 1 and 2).In relation to the data from 2007,areas under organic production have increased by almost 30 %. Studies have shown that more than one-quarter of the global area under organic farming is in developing countries. These are mainly countries with under-developed industry in which agricultural production is characterized by low investment and high levels of natural resource use. Low consumption of chemicals and fertilizers has contributed to the preservation of the main natural media resources on which is possible to grow organic food. About 37 % of the global area under organic production is in Australia. Based on the data in Table 1 it can be observed that the continent has the largest share of organic in the total of agricultural area. On the European continent,28.6 % of the world area is under organic production, and the share of the total agricultural land in the European level was 2.2 %. Most land under organic production on the European continent have Germany (1 million hectares) and Italy (1 million hectares), while the largest share of total agricultural land are in Liechtenstein (29.3%), Austria (19.7%) and Estonia (14.8 %). Compared with developed countries, organic production in Serbia has been applied recently, and from areas covered by this way the food is not coming in a big amounts. According to the 2011 data, under organic production in Serbia was 6,238 ha, which represents only 0.1 % of total agricultural land. If we bear in mind that the total agricultural area covers 5,096,267 ha , of which 64 % are arable land, it is clear that the current scope of practice of organic farming is much smaller than the real potential.
Table 1. Share of area under organic farming in total agricultural land in the period 2007-2011., in %
2011 2010 2009 2008 2007
Africa 0.1 0.1 0.1 0.1 0.1
Asia 0.3 0.2 0.3 0.2 0.2
Europe 2.2 2.1 1.9 1.7 1.6
South America 1.1 1.2 1.2 1.1 0.9
NorthAmerica 0.7 0.7 0.7 0.7 0.6
Oceania 2.9 2.9 2.8 2.8 2.7
World 0.9 0.8 0.8 0.8 0.7 Source: http://www.organic-world.net/statistics-data-sources.html Business associations and national non-governmental organizations in the sector of organic production, and the support of the relevant ministry and increase awareness of producers and consumers of environmental protection have contributed to the spread of the idea of organic food production in Serbia. Comparing to 2007, an area dedicated to organic production in 2011has been increased by seven times (Table 2).
Table 2. Share of total agricultural land 2011 2010 2009 2008 2007
WORLD 0.9 0.8 0.8 0.8 0.7 EUROPE 2.2 2.1 1.9 1.7 1.6
REPUBLIC OF SERBIA
0.1 0.2 0.2 0.1 0.0
Source: http://www.organic-world.net/statistics-data-sources.html Agro - biodiversity is an important part of global biodiversity, but people use in their nutrition a very small number of species. Agricultural areas in the world were planted with 12 species of grain, 23 species of field and vegetable crops, and about 35 kinds of fruit, which is to say that about 1440 million hectares are planted with no more than 70 species (Altieri, 1999). Not more than 30 varieties of plants produces 95 % of the calories of plant origin at the global level, with only three species (rice, wheat and maize) constituting 50 % of the total amount (Rahmann, 2011). Wheat, real ones andmillet, are an important factor of food security of almost all countries of the world. According to estimates, the annual consumption of grain per capita globally is about 150 kg. Although the production of these crops during the period 1961/63 to 2005/2007 have increased to 1,225

Scientific Papers Series Management, Economic Engineering in Agriculture and Rural Development Vol. 14, Issue 2, 2014 PRINT ISSN 2284-7995, E-ISSN 2285-3952
243
million tons, it is expected to increase to 940 million, and even before the 2050it will be around three billion tones (Alexandratos and Bruinsma, 2012). According to the World Bank statistics and predictions for the period 2010-2012 the grains are covering 703,114.5 hectares, with only 0.4 % of the surface of the grain grown in the principles of organic agriculture. This participation at the European level is much higher and amounts to 1.4%, which was expected since in Europe about 70 % of the world area is under organic production of cereals (Table 3). Because of the importance of grain in the diet of the global population, increasing the volume of production of these crops on the principles of organic agriculture would greatly contribute to improving the quality of nutrition of the global population. The importance of grain in the daily diet of the population of Serbia is the fact that the consumption of bread per capita is more than 100 pounds during the year, which is three times higher than in Western developed countries. The major part of agricultural production is the production of grain covering the largest part of the arable land, grown on 1,911,166 ha, or 58 % of arable land, dominated by the cultivation of corn (66 %) and wheat (26 %), and considerably less barley (4 %), triticale (2%) and oats (1.7%). However, organic crop production is practiced on only 737 ha of concentrated mainly in the northern parts of the country.
Table 3.Share of the total area under cereals
2011 2010 2009 2008 2007 WORLD 0.4 0.4 0.3 0.3 0.3 EUROPA 1.4 1.4 1.3 1.1 1.0
REPUBLIC OF SERBIA
0.0 0.0 0.0 0.0 0.0
Source: http://www.organic-world.net/statistics-data-sources.html In recent years there has been a loss of diversity of cultivated plants, thus the grain, due to the increase in world population and the creation of new high-yielding and intensive varieties, but also because of the associated economic and environmental changes. For this reason, throughout the world numerous gene - banks of germplasm collections of various crops were formed, so genetic resources will be preserved and made available for future generations. As in all
countries of the world, the Republic of Serbia is working intensively to preserve resources of genetic most important agricultural plants, the involvement of a large number of Institution - the collection, storage, copying, distribution, and evaluation of germplasm, but also the creation of new varieties. Genetic resources of grains in the world and the Republic of Serbia Genetic diversity is a necessary basis for human life and for economic development, and therefore policies to preserve genetic resources, is a core component of the global economy (Roljević et al., 2011). In order to preserve the diversity of species that currently have great significance for nutrition and diversity of species that are always regarded to have an economic impact in the future, around the world it is formed a number of gene - banks in which the genetic material of different species are preserved and multiplied. Gen - bank, and ex situ conservation, are the most convenient way of storing germplasm of domesticated plants and their wild relatives, and the in situ conservation in their natural habitat on farms and their storage and use eases considerably. In the seventies of the 20th century the first ex situ collections by international organizations such as FAO, the International Board for Plant Genetic Resources (IBPGR) and International Institute for Plant Genetic Resources (IPGRI) were promoted. According to its purpose, collections are classified into several groups (the basic collection, the active collection, core collection, gene collection). According to FAO more reports from 2010. at the global level, there are 1,750 gene -banks that preserve the genetic material of plants relevant to food and agriculture. It is estimated that the global ex situ maintain 7.4 million of plant genotypes, and samples. According to the nature of the material to be preserved, the local population (44 %)are mostly used, followed by inbred line (22 %), modern varieties (17 %), and wild and weed species (17 %). Analysis of genetic material, indicate that approximately 30 % of total plant genotypes different from each other (or 1,9-2,2 million samples), while the rest are the duplicates. The gene - banks, the most common are collections of grain and leguminous crops (Figure 1).

Scientific Papers Series Management, Economic Engineering in Agriculture and Rural Development Vol. 14, Issue 2, 2014 PRINT ISSN 2284-7995, E-ISSN 2285-3952
244
Figure 1. Percentage of different groups of plants in the total number of samples at the global level Source: The Second Report on the State of the World’s PGRFA, The state of ex situ conservation, Chapter 3, FAO, 2010 Collections have grain with 35 % of the total number of samples, whereby the largest number of wheat genotypes (856 168), rice (773 948), barley (466 531), and maize (327 932)are preserved. Genotypes oats (130 653), the genera Aegilops (40.926) and Triticosecale (37,440) are underrepresented in the collection of grain (FAO, 2010). Institutions dealing with preservation of plant genetic resources at the national level, pay more attention to collection and preservation of neglected and under- cultivated crops. Neglected crops in the past were much more cultured and had a great importance in the diet of the population. However, replacement of major agricultural crops or the disappearance of the environments in which they are grown, brought us
to the fact that these species began to disappear. In addition, there is a great concern for the survival of wild relatives of cultivated plants as their natural habitats are disappearing due to changes caused by man and climate. Great value of genetic resources of wild relatives is reflected in the possession of resistance or tolerance to biotic and abiotic stress and these properties are important for the adaptation of major crops to changing environment. Cultivation of field crops on farms, in centers of origin, plays a key role in preserving genetic diversity. In this way it is allowed to express the genetic variability of the population to changing environmental conditions and the sustainability of agricultural production adapting. In Serbia, the largest number of samples to be preserved in situ and ex situ collections is "wheat and corn" a total of 8,646. In situ, or breeding farms, held about 32% of genotype, while the remaining 68 % is kept in research institutions and gene - banks. In this collection, maize samples was highest (74 %), followed by wheat (17.5 %), barley (5.2%), oat (3 %), and rye (0.5 %). According to the National Report of the Republic of Serbia (2010) In situ has preserved and cultivated 1,058 samples of cereals, with most samples of wheat, followed by barley, oats and rye. The largest number of genotypes grown in situ belongs to domestic varieties, while the local population and relatives of the main types of cereals can only be found on farms in marginal agricultural areas. Among the neglected species of grain crops in the country are classified as Triticum durum and Triticumspelta. The ex situ collections, most of the samples are old varieties and landraces, while the old commercial varieties are under-represented.
Table 4. Number of genotypes of small grains that are stored and grown in situ in the Republic of Serbia
TYPE OF COLLECTION WHEAT BARLEY OATS RYE
INSTITUTS CULTIVARS 200 70 10 1 BREEDS 500 100 20 5
OTHERS LANDRACES 50 10 5 5 RELATIVES 50 20 10 2
TOTAL 1,058 800 200 45 13 Source: The Second Report on the State of the World’s Plant Genetic Resources for Food and Agriculture was launched at FAO (SoWPGR-2), Country report on the state of plant genetic resources for food and agriculture country report, Republic of Serbia, Headquarters, Rome on 26 October, 2010
Collected genetic material is kept in the Institute "ZemunPolje" Plant Gene Bank and the Ministry of Agriculture, Forestry and Water Management.
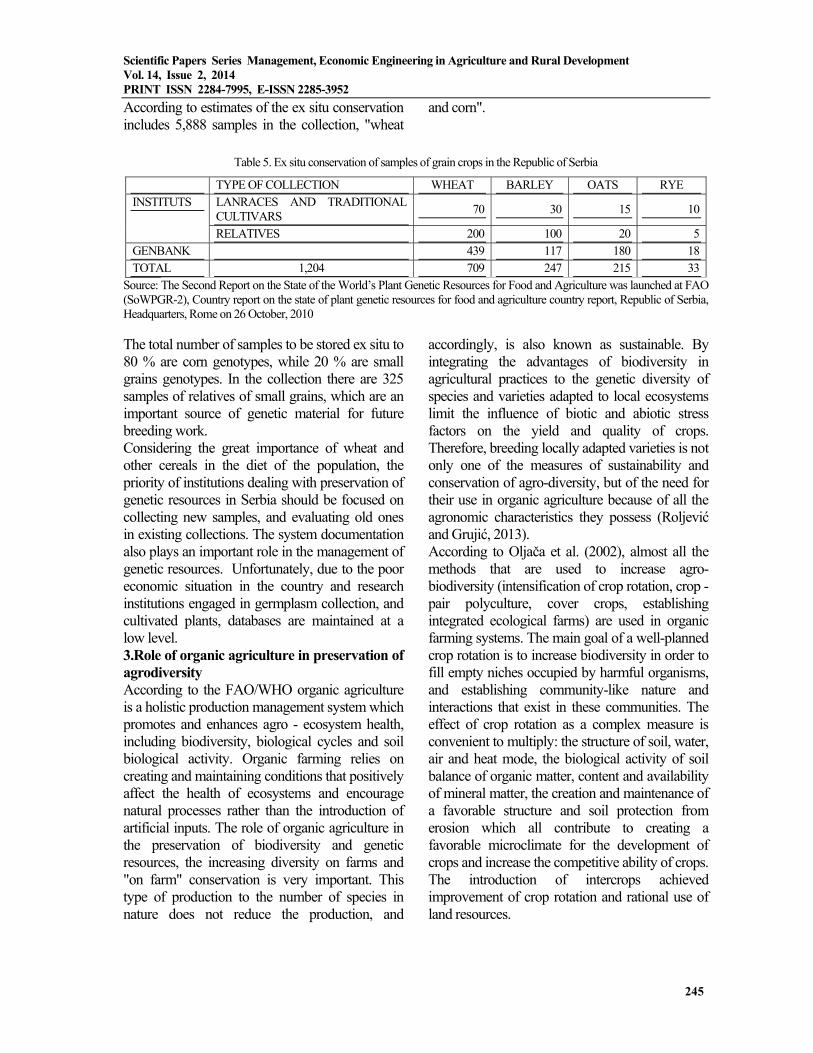
Scientific Papers Series Management, Economic Engineering in Agriculture and Rural Development Vol. 14, Issue 2, 2014 PRINT ISSN 2284-7995, E-ISSN 2285-3952
245
According to estimates of the ex situ conservation includes 5,888 samples in the collection, "wheat
and corn".
Table 5. Ex situ conservation of samples of grain crops in the Republic of Serbia
TYPE OF COLLECTION WHEAT BARLEY OATS RYE INSTITUTS LANRACES AND TRADITIONAL
CULTIVARS 70 30 15 10
RELATIVES 200 100 20 5 GENBANK 439 117 180 18 TOTAL 1,204 709 247 215 33
Source: The Second Report on the State of the World’s Plant Genetic Resources for Food and Agriculture was launched at FAO (SoWPGR-2), Country report on the state of plant genetic resources for food and agriculture country report, Republic of Serbia, Headquarters, Rome on 26 October, 2010 The total number of samples to be stored ex situ to 80 % are corn genotypes, while 20 % are small grains genotypes. In the collection there are 325 samples of relatives of small grains, which are an important source of genetic material for future breeding work. Considering the great importance of wheat and other cereals in the diet of the population, the priority of institutions dealing with preservation of genetic resources in Serbia should be focused on collecting new samples, and evaluating old ones in existing collections. The system documentation also plays an important role in the management of genetic resources. Unfortunately, due to the poor economic situation in the country and research institutions engaged in germplasm collection, and cultivated plants, databases are maintained at a low level. 3.Role of organic agriculture in preservation of agrodiversity According to the FAO/WHO organic agriculture is a holistic production management system which promotes and enhances agro - ecosystem health, including biodiversity, biological cycles and soil biological activity. Organic farming relies on creating and maintaining conditions that positively affect the health of ecosystems and encourage natural processes rather than the introduction of artificial inputs. The role of organic agriculture in the preservation of biodiversity and genetic resources, the increasing diversity on farms and "on farm" conservation is very important. This type of production to the number of species in nature does not reduce the production, and
accordingly, is also known as sustainable. By integrating the advantages of biodiversity in agricultural practices to the genetic diversity of species and varieties adapted to local ecosystems limit the influence of biotic and abiotic stress factors on the yield and quality of crops. Therefore, breeding locally adapted varieties is not only one of the measures of sustainability and conservation of agro-diversity, but of the need for their use in organic agriculture because of all the agronomic characteristics they possess (Roljević and Grujić, 2013). According to Oljača et al. (2002), almost all the methods that are used to increase agro-biodiversity (intensification of crop rotation, crop - pair polyculture, cover crops, establishing integrated ecological farms) are used in organic farming systems. The main goal of a well-planned crop rotation is to increase biodiversity in order to fill empty niches occupied by harmful organisms, and establishing community-like nature and interactions that exist in these communities. The effect of crop rotation as a complex measure is convenient to multiply: the structure of soil, water, air and heat mode, the biological activity of soil balance of organic matter, content and availability of mineral matter, the creation and maintenance of a favorable structure and soil protection from erosion which all contribute to creating a favorable microclimate for the development of crops and increase the competitive ability of crops. The introduction of intercrops achieved improvement of crop rotation and rational use of land resources.

Scientific Papers Series Management, Economic Engineering in Agriculture and Rural Development Vol. 14, Issue 2, 2014 PRINT ISSN 2284-7995, E-ISSN 2285-3952
246
Growing crops after harvesting small grains with rides causes stress (irrigation) in the warmest part of the year, and can greatly influence the overall productivity of agricultural land with far less investment. Pairing crops is mode of growing two or more crops at the same time in the same place. Increased diversity in cultivated plant communities contributes to a better redistribution and use of natural resources, increasing production of biomass and yield, reduces damage from the attack of weeds, pests and diseases and provide socio - economic benefits (greater system stability, secure income, better and more varied diet). However, many difficulties in the wider application of this system of cultivation in large areas can be found in the fact that the means of high technology (agro - chemicals, varieties, machinery) adapted the system of growing a single plant species. With the application of the above mentioned and many other measures that are consistent with the preservation of natural resources, in the system of organic farming to the conservation of agro-biodiversity and genetic resources, encouraging natural processes and relationships in ecosystems is available. CONCLUSIONS Organic farming represents a system of safe food in accordance with environmental protection, maintaining soil fertility, ecosystem and human health. Because of the role it plays in the preservation of natural resources, organic farming as an alternative to conventional one, is gaining in importance. The adoption of organic farming in recent decades has been established indirectly saving species and varieties which is due to lack of use obese disappearance. On the other hand, the genetic diversity of cultivated plants in organic agriculture contributes to easier stability of production and yields establishing, which emphasizes the dependence of organic agriculture and biodiversity. Cereals are the main source of food globally, both for direct consumption in the human diet and as input in livestock production. Organic grain production in the world is still very poorly represented since this area covers 0.4 % of the total area under cereals. The annual consumption of wheat globally per capita is 150 k, which indicates the importance of increasing the production of these
crops to the principles of organic farming practices in order to increase the quality of the food of the global population. ACKNOWLEDGMENTS Paper work is part of the project research 46006 – “Sustainable agriculture and rural development in function of Republic of Serbia strategic goals achievement within the Danube region”, and project 179028 „Rural work market and rural economics of Serbia - diversification of income and decrease of rural poverty“ financed by the Ministry of Education and Scence Republic of Serbia, member of researching team, period 2011-2014 REFERENCES [1]Alexandratos, N., Bruinsma, J., 2012, World agriculture towards 2030/2050, The 2012 Revision, Global Perspective Studies Team, ESA Working Paper No. 12-03, Agricultural Development Economics Division, Food and Agriculture Organization of the United Nations [2]Altieri, A., M., 1999, The ecological role of biodiversity in agroecosystems, Agriculture, Ecosystems & Environment, Volume 74, Issues 1–3, pp. 19–31 [3]Oljača Snežana, Kovačević, D., Dolijanović, Ž., 2002, Agrobiodiverzitet u organskoj poljoprivredi. Zbornik radova sa savetovanja „Organska proizvodnja – zakonska regulativa“ Subotica, septembar 2002., Savezno ministarstvo privrede i unutrašnje trgovine SR Jugoslavije, Beograd, 83-92 [4]Rahmann, G., 2011, Biodiversity and organic farming: what do we know?, Agriculture and Forestry research, vol. 3, pp. 189-208 [5]Roljević Svetlana, Cvijanović, D., Sarić, R., 2011, Genetički resursi pšenice u svetu i Srbiji, Zbornik naučnih radova Instituta PKB Agroekonomik, vol. 17, br. 1-2, str. 27-33 [6]Roljević Svetlana, Grujić Biljana, 2013, Productivity of old type and grains of genetic resources preservation, Thematic proceedings of International Scientific Conference „Sustainable agriculture and rural development in terms of the Republic of Serbia strategic goals realization within the Danube region“ - achieving regional competitiveness, December, 5-7th 2013, Topola, Institute of agricultural economics Belgrade, pp. 1230-1247 [7]Tasiopoulou, S., Chiodini, A.M., Vellere, F., Visentin, S., 2007, Results of the monitoring program of pesticide residues in organic food of plant origin in Lombardy (Italy), J. Environ. Sci. Health B 42, 835-841 [8]The Second Report on the State of the World’s Plant Genetic Resources for Food and Agriculture was launched at FAO (SoWPGR-2) (2010): Country report on the state of plant genetic resources for food and agriculture country report, Republic of Serbia, Headquarters, Rome on 26 October, 2010; [9]The Second Report on the State of the World’s PGRFA, The state of ex situ conservation, Chapter 3, FAO, 2010 [10]http://www.organic-world.net/statistics-data-sources.html
Scientific Papers Series Management, Economic Engineering in Agriculture and Rural Development Vol. 14, Issue 2, 2014 PRINT ISSN 2284-7995, E-ISSN 2285-3952
247
GROUNDWATER QUALITY AND ITS SUITABILITY FOR DRINKING AND AGRICULTURAL USE IN A RURAL AREA FROM CLUJ COUNTY (FLORESTI VILLAGE) Cristina ROSU1, Ioana PISTEA1, Carmen ROBA1, Monica NES1, Alexandru OZUNU1 1 “Babeș Bolyai” University, Faculty of Environmental Science and Engineering, 30 Fantanele, 400294, Cluj-Napoca, Romania, Phone: +0264 30 70 30; Fax: +40264 30 70 32; Email: [email protected] Corresponding author: [email protected] Abstract In the present study, a hydrochemical investigation was conducted in a rural area from Cluj County, Romania, in order to determine the chemical composition of groundwater and to evaluate if the investigated water sources can be used for drinking or agriculture purposes. Several groundwater samples were collected from fifteen wells in order to analyze the major dissolved ions (Na+, K+, Mg2+, Ca2+, F-, Cl-, Br-, NO2
-, NO3-, PO4
3- and SO42-). The
analyzed waters proved to have a low level of sodium (0.27 - 41.87 mg/l), magnesium (0.11 – 25.17 mg/l), calcium (0.59 – 117.30 mg/l), chloride (3.33 – 97.68 mg/l) and sulphate (4.42 – 132.80 mg/l), and a high level of potassium (0.22 – 22.59 mg/l), nitrites (detected only in one sample - 1.36 mg/l), nitrate (6.58 – 92.96 mg/l), fluoride (0.24 – 1.40 mg/l) and phosphate (12.44 –18.26 mg/l). The possibility of using these waters for agricultural purposes has been assessed by calculating the sodium adsorption ratio (SAR). The results of the present study indicate that the use for agricultural purposes of some of the analyzed groundwater represent no threat for vegetation, as the SAR level was lower than 3.0. Key words: Cluj County, Floresti village, groundwater, major ions, sodium adsorption ratio INTRODUCTION In the rural areas, the groundwater is the major source of drinking and irrigation water. Due to human activity, groundwater composition and quality is changed, directly or indirectly, so much that it can be no longer safe for drinking or agriculture purposes. In the present study, a hydrochemical investigation was conducted in a rural area (Floresti village) from Cluj County, Romania, in order to determine the chemical composition of groundwater and to evaluate if the investigated water sources can be used for drinking or agriculture purposes. Several groundwater samples were collected from fifteen wells in order to analyze the phisyco-chemical parameters (temperature, pH, redox potential – ORP, electrical conductivity – EC, total dissolved solids – TDS, salinity, dissolved oxygen – DO and turbidity) and the major dissolved ions (Na+, K+, Mg2+, Ca2+, F-, Cl-, Br-, NO2
-, NO3-, PO4
3- and SO42-). The
phisyco-chemical parameters were measured in situ using a portable multi parameter
(WTW inolab 350i) and a portable turbidimeter (WTW pHotoFlex Turb), while the major ions were analysed by an ion chromatograph (IC1500 Dionex). The possibility of using these waters for agricultural purposes has been assessed by calculating the sodium adsorption ratio (SAR). Sodium is a unique cation because of its effect on soil as it causes adverse physico-chemical changes in the soil, particularly to the soil structure. SAR is calculated based on the sodium, calcium and magnesium concentrations. SAR is a simple method to evaluate the danger of high-sodium irrigation water use. If water used for irrigation is high in sodium and low in calcium, the cation-exchange complex may become saturated with sodium which can destroy the soil structure leading to dispersion of clay particles [1,2]. Usually, when SAR is lower than 3.0 there is no threat to vegetation, while a SAR level greater than 12.0 is considered a real threat for the survival of vegetation by increasing soil swelling (dispersion) and reducing soil permeability [1,3,4].

Scientific Papers Series Management, Economic Engineering in Agriculture and Rural Development Vol. 14, Issue 2, 2014 PRINT ISSN 2284-7995, E-ISSN 2285-3952
248
The study area is located in Floresti village, which is situated at 5 km from Cluj Napoca town and it is part of the Cluj-Napoca metropolitan area (Fig. 1). The European road E60 is passing through Floresti village. The village is located on the right bank of the Somesul Mic River at the junction of the Apuseni Mountains and Transylvania Plateau. The total area of the Floresti village is 6300 hectares and almost 2000 hectares is arable land [5]. The population of Floresti increased considerably since 2003, when it was approximately 2% of the population of Cluj, reaching almost 8% of Cluj population in 2011 (Fig. 2). Now the stable population of Floresti represents 22,818 of inhabitants. The Floresti village has a relief of depression; surrounded by hills with an average elevation of about 400-500 m. Floresti village has a continental climate, characterized by warm dry summers and cold winters.
Fig.1. Location of the study area
Fig.2. The stable population of the Cluj-Napoca town and Floresti village, during 2003-2011 [6]
MATERIALS AND METHODS Groundwater samples were collected from fifteen wells located in a rural area (Floresti village) from Cluj County, Romania, in November 2013 (Fig. 3). The water from wells is used for drinking, cooking, bathing and for agricultural purpose. In order to compare the quality of the groundwater from the investigated wells and the quality of water distributed to the public network from the village, a tap water sample was also collected.
Fig.3. Study area with sampling points The unstable phisyco-chemical parameters (temperature, pH, redox potential – ORP, electrical conductivity – EC, total dissolved solids – TDS, salinity, dissolved oxygen – DO and turbidity) were measured in situ using a portable multiparameter (WTW inolab 350i) and a portable turbidimeter (WTW pHotoFlex Turb). The water samples used for major dissolved ions analysis were collected in polyethylene bottles; the water samples were filtered in situ using 0.45 µm syringe filters. The samples were then shipped to the laboratory, stored at dark and 4ºC, and analyzed within 48 hours from sampling. The major dissolved ions (Na+, K+, Mg2+, Ca2+, F-, Cl-, Br-, NO2
-, NO3-, PO4
3- and SO42-) were
analyzed in the Environmental Laboratory from the Faculty of Environmental Science and Engineering, by ion chromatography (IC1500 Dionex). RESULTS AND DISCUSSIONS The physico-chemical and chemical parameters of the analyzed water samples are presented in Table 1 and Table 2. The analyzed waters proved to be slightly acidic to

Scientific Papers Series Management, Economic Engineering in Agriculture and Rural Development Vol. 14, Issue 2, 2014 PRINT ISSN 2284-7995, E-ISSN 2285-3952
249
neutral, having the pH between 6.32 and 7.41. Two of the investigated wells (W1 and W2) have the pH lower than 6.5, the limit imposed for drinking waters. With the exception of W1 and W2, the water from the other wells had a negative redox potential, between -52.3 and -1.2 mV. Water samples with a lower (more negative) redox potential have a tendency to lose electrons and to be oxidized by reducing processes. As a consequence the majority (75%) of the analyzed water samples had the dissolved oxygen level lower than 5 mg/l, the limit imposed for the drinking water. The water turbidity had a low level (0.04 – 1.76 NTU) with the exception of well W3 were a very high turbidity was registered (65.1 NTU). The levels of EC and TDS were within the permissible limits for all the analysed water samples (Table 1). The analyzed waters proved to have a low level of sodium (0.27 - 41.87 mg/l), magnesium (0.11 – 25.17 mg/l), calcium (0.59 – 117.30 mg/l), chloride (3.33 - 97.68 mg/l) and sulphate (4.42 – 132.80 mg/l), lower than the maximum contaminant level set by the Romanian legislation (Low 458 from 08.07.2002) (Fig. 4 and 5). On the other hand there were recorded exceeding of the maximum contaminant level for the fallowing dissolved ions: potassium (for 25% of the samples), nitrites (only for one sample – the tap water), nitrate (for 56% of the samples) and fluoride (for 19% of the samples). The phosphate was detected in three of the investigated wells (W3, W5 and W6), and the level ranged between 12.44 and 18.26 mg/l. The level of phosphate is very high, considering that the maximum contaminant level for phosphate is 0.1 mg/l for 1st class of water quality (which is used for drinking water – Order 161 from 16.02.2006), respectively >0.9 mg/l for 5th class of waters quality (very bad ecological status). The phosphate is not toxic, but has negative effects on the aquatic environment like the water eutrophication. The presence of high levels of nitrates, nitrites and phosphates in the analyzed waters is a consequence of agricultural activities in the area. Some of the lands located close to these wells are cultivated with vegetables and are treated with
fertilizers based on nitrogen and phosphorus. Another important source for nitrates, nitrites and phosphates in the analyzed waters is the presence in the close vicinity of chicken farms. The residual waters generated by these farms and an inadequate management of manure can lead to high contamination of groundwater with nitrates, nitrites and phosphates. Table 1.Physico-chemical parameters of the analyzed water samples
Sample T
(ᵒ C) pH ORP (mV)
EC (µS/cm)
TDS (mg/L)
OD (mg/L
Turbidity (NTU*)
W1 17.3 6.48 2.5 493 318 5.96 0.74 W2 17.1 6.32 10.2 470 301 4.96 1.47 W3 17.4 7.41 -52.3 423 272 4.95 65.1 W4 17.2 7.26 -40.8 286 182 4.82 0.05 W5 16.3 6.88 -22.1 625 401 4.42 0.5 W6 15.8 6.66 -9.5 565 356 4.37 0.04 W7 15.1 6.56 -3.8 575 368 4.57 0.61 W8 15.2 6.67 -9.9 654 422 4.31 0.38 W9 15.8 6.7 -11.9 578 371 4.8 0.56
W10 15.2 6.51 -1.4 546 349 4.3 0.7 W11 15.9 6.84 -19.3 135 87 4.47 0.08 W12 15.4 6.74 -13.1 218 140 5.05 1.76 W13 15.9 6.67 -9.7 448 287 4.81 0.23 W14 16.8 6.58 -4.9 439 281 4.73 0.38 W15 17.2 6.51 -1.2 486 312 5.12 0.21 TAP 17.1 7.36 -48.6 54 35 5.61 0.81 MCL - 6.5-9.5** - 2500** 500*** >5** ≤5**
*NTU-nephelometric turbidity units; **MCL-Maximum Contaminant Level according to Romanian legislation for drinking water (Low 458 from 08.07.2002); ***MCL-Maximum Contaminant Level according to BC Health Act Safe Drinking Water Regulation–Canada [8] and World Health Organization [9] Table 2.Chemical parameters of the analyzed water samples
SampleNa+ Mg2+ K+ Ca2+ Cl- NO3
- F- SO42-
(mg/l) W1 0.27 0.13 nd* 0.84 59.16 47.42 1.10 65.92W2 0.37 0.12 0.22 0.70 52.99 55.15 1.14 56.31W3 0.28 0.11 nd 0.59 49.98 76.19 0.96 43.29W4 19.38 12.23 5.72 53.80 21.63 44.07 0.93 33.44W5 40.75 21.00 14.51 111.30 89.06 61.39 nd 110.61W6 41.87 19.43 21.71 85.90 86.35 55.06 nd 65.16W7 39.52 21.25 22.59 88.00 86.79 69.19 1.32 70.07W8 40.84 22.41 10.51 117.30 97.68 92.96 nd 132.80W9 33.50 25.17 9.87 108.40 65.30 54.57 1.40 97.29
W10 31.20 22.74 8.17 102.50 47.54 64.37 1.29 68.16W11 4.37 4.96 1.85 28.95 50.10 60.1 1.11 79.30W12 8.76 7.35 3.11 45.12 11.13 17.43 0.48 33.17W13 37.22 17.19 2.74 66.20 82.11 31.9 1.10 46.72W14 38.77 16.57 3.21 66.10 84.01 30.74 0.93 44.39W15 40.14 18.28 7.22 71.80 88.59 33.45 1.11 51.72TAP 1.75 2.25 0.64 11.27 3.33 6.58 0.24 4.42MCL 200** 50*** 10*** 200*** 250** 50** 1.2** 250**
*nd-not detected; **MCL-Maximum Contaminant Level according to Romanian legislation for drinking water (Low 458 from 08.07.2002); ***MCL-Maximum Contaminant Level according to BC Health Act Safe Drinking Water Regulation–Canada [8] and World Health Organization [9]
The present study showed that the pollution with nitrate, nitrite, phosphate, fluoride and potassium of the drinking water in the area

Scientific Papers Series Management, Economic Engineering in Agriculture and Rural Development Vol. 14, Issue 2, 2014 PRINT ISSN 2284-7995, E-ISSN 2285-3952
250
may pose high potential health risks to local residents. The possibility of using these waters for agricultural purposes has been assessed by calculating the sodium adsorption ratio (SAR). Sodium is a unique cation because of its effect on soil as it causes adverse physico-chemical changes in the soil, particularly to the soil structure.
Fig.4. The level of major dissolved cations
Fig.5. The level of major dissolved anions SAR was calculated based on the sodium, calcium and magnesium concentrations, according to the fallowing formula [1,3,4]:
SAR =
2
22
MgCa
Na
where, all ionic concentrations are expressed in milliequivalent per liter. The level of SAR for each of the investigated water source is presented in Fig. 6. The SAR values ranged from 0.06 to 1.10. According to the Richards (1954) classification based on SAR values (Table 3), all the water samples belong to the excellent category.
Fig.6. The level of sodium adsorption ratio (SAR) for the investigated water sources Usually, when SAR is lower than 3.0 there is no threat to vegetation, while a SAR level greater than 12.0 is considered a real threat for the survival of vegetation by increasing soil swelling (dispersion) and reducing soil permeability [1,3,4]. Table 3. Water classification based on SAR values
Sodium adsorption ratio (SAR) Status <10 Excellent
10-18 Good 18-26 Doubtful >26 Unsuitable
SAR can indicate the degree to which irrigation water tends to enter cation exchange reactions in soil. The replacement of calcium and magnesium by sodium is hazardous because it causes damage to the soil structure by making the soil compact and impervious [2]. The %Na was also calculated, based on sodium, potassium, calcium and magnesium concentrations, using the fallowing formula [1,3,4]:
%Na =
KNaMgCa
KNa22
100)(

Scientific Papers Series Management, Economic Engineering in Agriculture and Rural Development Vol. 14, Issue 2, 2014 PRINT ISSN 2284-7995, E-ISSN 2285-3952
251
where, all ionic concentrations are expressed in milliequivalent per liter. The %Na ranged between 16.73 and 61.56 (Fig. 7). According to the Wilcox (1955) classification, which is based on %Na values, 12.5% of the samples belong to the excellent category, 25% belong to the good category, 50% belong to the permissible category and 12.5% belong to the doubtful category [7].
Fig.7. The percent of sodium for the investigated water sources In conclusion, considering the low level of SAR and %Na, the investigated waters do not pose threat to vegetation and can be safely used in agricultural purposes as irrigation water. A special attention should be paid to the waters taken from wells W2 and W6, considering that according to %Na level these waters belong to the doubtful category. CONCLUSIONS The analyzed waters proved to have a low level of sodium (0.27 - 41.87 mg/l), magnesium (0.11 – 25.17 mg/l), calcium (0.59 – 117.30 mg/l), chloride (3.33 - 97.68 mg/l) and sulphate (4.42 – 132.80 mg/l), lower than the maximum contaminant level set by the Romanian legislation (Low 458 from 08.07.2002). On the other hand there were recorded exceeding of the maximum contaminant level for potassium (for 25% of the samples), nitrites (only for one sample – the tap water), nitrate (for 56% of the samples) and fluoride (for 19% of the samples). The phosphate was detected in three of the investigated wells (W3, W5 and W6), and the level ranged between 12.44 and 18.26 mg/l.
The presence of high levels of nitrates, nitrites and phosphates in the investigated water samples is a consequence of agricultural activities in the area (the use of fertilizers based on nitrogen and phosphorus) and the presence in the close vicinity of chicken farms (residual waters, inadequate management of manure). The present study showed that the pollution with nitrate, nitrite, phosphate, fluoride and potassium of the drinking water in the area may pose high potential health risks to local residents. Considering the low level of SAR (0.06 to 1.10) and %Na (16.73 to 61.56), the investigated waters do not pose threat to vegetation and can be safely used in agricultural purposes as irrigation water. REFERENCES [1]Karanth, K.R.,1987, Groundwater assessment, development and management (p. 720). New Delhi: Tata McGraw Hill. [2]Raju, N.J., 2007, Hydrogeochemical parameters for assessment of groundwater quality in the upper Gunjanaeru River basin, Cuddapah District, Andhara Pradesh, South India. Environmental Geology, 52, p. 1067-1074. [3]Richards, L.A., 1954, Diagnosis and improvement of saline alkali soils: Agriculture, vole 160. Handbook 60. Washington: US Department of Agriculture. [4]Wang, S., 2013, Groundwater quality and its suitability for drinking and agricultural use in the Yanqi Basin of Xinjiang Province, Northwest China, Environmental Monitoring Assessment, published online 2013. [5]Wilcox, L.V., 1955, Classification and use of irrigation waters, US Dept of Agricul Cir 969. Washington, DC. [6]www.floresticluj.ro , accessed on 11 December 2013. [7]www.cluj.insse.ro/cmscluj/rw/pages/statReg.ro (Regional Statistics Department of Cluj Napoca)

Scientific Papers Series Management, Economic Engineering in Agriculture and Rural Development Vol. 14, Issue 2, 2014 PRINT ISSN 2284-7995, E-ISSN 2285-3952
252

Scientific Papers Series Management, Economic Engineering in Agriculture and Rural Development Vol. 14, Issue 2, 2014 PRINT ISSN 2284-7995, E-ISSN 2285-3952
253
EVALUATION OF SALES VALUE OF OBJECT TAX ON LAND AND BUILDINGS Titin RULIANA University of August 17th, 1945 in Samarinda, Jl. Ir. H. Juanda No.80 Samarinda City, postcode no. 1052, Phone (0541) 761113, East Kalimantan, Indonesia. Contact person: +6281346272281, Email: [email protected] Corresponding author: [email protected] Abstract Tax revenue today become the backbone of the State reception in the State Budget ( Budget ) . One of the tax revenue is land and building tax . Basis of property tax is the Sales Value of Object Tax. Sales Value of Object Tax is the average price obtained from the market price , and the price is based on the Decree of the Mayor [3]. Determination Sales Value of Object Tax based on Laws number 12 of 1985 amended by Laws number 12 of 1994 [1]. Determination Sales Value of Object Tax based Formulation of the problem in this paper is as follows : "Is it the Sales Value of Object Tax on Land and Building Tax in Year 2012 in accordance with Laws number 12 of year 1994". This research used a sample of fifty one taxpayers from Income Tax Payable in 2012. Target of research is Sales Value of Object Tax on land and building by comparing the Sales Value of Object Tax contained in the Notification Letter of Tax Payable to the actual situation. Based on the background and formulation of the problem, that : "Calculation Sales Value of Object Tax on Land and Building of 2012 in the District Palaran of Samarinda City not in accordance with Law Number 12 of 1994" . I was concluded that the calculation Sales Value of Object Tax on Land and Buildings in the District Palaran been calculated in accordance with Law on number 12 of 1994 . Difference in the amount of Land and Building Tax to be paid based on The Notification Letter of Tax Payable with the results of research in the field due to lack of public understanding about The Land and Building Tax, so that the taxpayer did not immediately report the wide changes to the tax object owned by the Office of Tax services. Key words: sales value of object tax on land and buildings, sales value of object tax, and land and buildings tax INTRODUCTION According to Law No. 32 of 2004 [2], there are three sources of local revenue is the original income regional, Fund Balance, and other legitimate receipt. Fund Balance can be obtained from the reception area of the land and building tax. Basis for the imposition of Land and Building tax is a Value Object Sales Tax (SVTO) [2]. Tax Object Sales Value is average prices obtained from market prices, and based on the Decree of the Mayor [3]. Determination of Sales Value Object of tax based on Law no. 12 of 1985 as amended by Law no. 12 of 1994.[1] Along with the development of the Subdistrict Palaran, it is expected to taxpayers in order to submit the data to tax in accordance with the actual situation. Data of objects tax can be delivered by way of fill the Tax Object Notification Letter (SPOP) is clearly in accordance with the actual situation, such as the area of land and or buildings, years and acquisition cost.
The calculation of the value sold of the object of land and building tax should be done properly so that the payment of the Land and Building Tax in accordance with the actual situation. Land and Building Tax in calculation compared with the amount of land and building tax in the field. If there is a difference, it makes the analysis of the causes of the difference in magnitude of the Land and Building Tax. Formulation of the problem in this paper is as follows : "Is it the Sales Value of Object Tax on Land and Building Tax in Year 2012 in accordance with Laws number 12 of year 1994. MATERIALS AND METHODS Based on the data in the Subdistrict Palaran, the population of the Subdistrict of Palaran amounts to approximately 45.734 people, the number of taxpayers as much as 11.792

Scientific Papers Series Management, Economic Engineering in Agriculture and Rural Development Vol. 14, Issue 2, 2014 PRINT ISSN 2284-7995, E-ISSN 2285-3952
254
people [4]. Data are presented as a sample of 51 taxpayers. This study compared the calculation determining the Sales Value Tax Object on Income Tax Payable with soil conditions and building on field. The process of land and building tax calculation applied by the Subdistrict Palaran based on a form Income Tax Payable issued by the Tax Office of Samarinda City. RESULTS AND DISCUSSIONS Based on the calculations in accordance with Income Tax Payable - Sales Value of Tax Object over Taxpayer and research in the field, presented data based Income Tax Payable - Land and Building Tax. Data of Land and Building Tax for Year Results. Here is presented a comparison payable of land and building tax in accordance with Income Tax Payable - Land and Building Tax with research results that: Table 1: Payable of Land and Building Tax
No Name
Taxpayers
Research Data (IDR)
Research Results
(IDR)
Comparison (IDR)
1 Sample No. 1 43.630 47.491 3.861 2 Sample No. 2 19.450 23.950 4.500 3 Sample No. 3 74.250 54.000 20.250 4 Sample No. 4 54.086 55.014 928
Source : Taxpayers sample Based on the analysis and calculations have been performed that calculation Sales Value of Object Tax imposed on taxpayers has been carried out in accordance with Law no. 12 of 1985 as amended by Law no. 12 of 1994 [1]. Calculation of Tax Object Sales Value of land and buildings is influenced by several factors. Tax Objects affected by the location of the land, land use, land use, environmental conditions of land, and land area. To calculate the amount of land and building tax to be paid then it should be known classification of soil (earth) and / or the building which is the object of tax. Classification of Tax Object Sales Value earth is divided into two classifications Sales Value of Tax Object for tax of the plantation sector, forestry, and mining, as well as object classification for tax
Sales Value of Tax Object for tax of rural and urban sectors. Classification of Tax Object Sales Value building is also divided into two classifications Sales Value of Tax Object for the building for the plantation sector, forestry, and mining, and classification Sales Value of Tax Object for the building for rural and urban sectors. Based on data from 51 samples of research that the 47 samples of research has performing calculations Sales Value of Tax Object on Land and Buildings in the District Palaran Samarinda in accordance with Law no. 12 of 1994 ", while the 4 samples is not in accordance with Law no. 12 of 1994 in calculating Sales Value of Tax Object on Land and Buildings. This can be explained by: Sample No.1 : classification of land and Sales Value of Tax Object 082 at IDR 48.000.00 /m2, Classification of buildings 027 at IDR 429,000.00 /m2, the Land and Buildig tax owed at IDR 43.630.00. Based on the study results of the building owned by Sample no. 1 has been developed so that the building area to 79 m2, so that the amount owed the land and building tax payable should be IDR. 47.491.00. Sample No.2 : classification of land 083 and Sales Value of Tax Object at IDR 36.000.00 / m2. Classification of building 031, Sales Value of Tax Object at IDR 225,000.00, land and building tax payable at IDR 19.450.00. Based on the results of extensive research building owned by Sample no.2 has developed into a 70 m2, so that the amount of land and building tax that should be paid is IDR 23.950.00. Sample No. 3 : classification of land and Sales Value of Tax Object 084 at IDR 27.000.00 / m2, yet there is no a building, land and building tax payable at IDR 74.250.00. Based on the results of extensive research in the field of land owned by Mr. Martorejo reduced to 2000 m2, so the Pajak Bumi dan Bangunan terutang is supposed to be paid the amount of IDR 54.000.00, but because the buyer has not reported to tax so that the burden of payment owned land and building tax is borne by Mr. Martorejo.

Scientific Papers Series Management, Economic Engineering in Agriculture and Rural Development Vol. 14, Issue 2, 2014 PRINT ISSN 2284-7995, E-ISSN 2285-3952
255
Sample No. 4 : classification of land and Sales Value of Tax Object 084 at USD 27.000.00 / m2, the classification of building 035, Sales Value of Tax Object at IDR 116,000.00, the amount payable land and building tax at IDR 54.086.00. Based on the results of research in the field of building owned by Mr. Warjan has been developed so that the extent to 40 m2. The land and building tax is supposed to be paid is IDR 55.014.00. 1. Difference in the amount of land and building tax to be paid by Notice of Tax Payable with the results in the field of research due to lack of public awareness about the land and building tax so that taxpayers are not immediately reported to the tax office about changes to tax owned. CONCLUSIONS Calculation Sales Value of Object Tax on Land and Building of 2012 in the District Palaran of Samarinda City not in accordance with Law Number 12 of 1994, for the following reasons: Basic imposition of Land and Building Tax is Value Object Sales Tax, in determining Value Object Sales Tax Directorate General of Tax to consider the opinions of local governments as well as observe the principle of self-assessment. To calculate the amount of land and building tax to be paid then it should be known in advance the class of ground (earth) and / or the building that became the object of land and building tax so that it can be calculated Value Object Sales Tax for Land and Building Tax. Calculation of the Tax Object Sales Value of the land based on the average price of the market price, and the price in accordance with the Decree of the Mayor [3]. The low level of public understanding of the land and building tax, so the tax payers do not immediately report changes or extensive of land and buildings to the Tax Office by completing the Tax Object Notification Letter.
REFERENCES [1]Anonymous, The Law on Republic of Indonesia, Number 12 year 1994, on Land and Building Tax [2]Anonymous, The Law on Regional Autonomy Republic of Indonesia, Number 32 year 2004, On Local Government, Cemerlang Publishing, Jakarta. [3]Anonymous, List of Association Assessment and Payment of Tax on Land and Building, Revenue Office of Samarinda, Samarinda City. [4]Anonymous, Monograph District of Palaran, Samarinda City 2010 – 2011

Scientific Papers Series Management, Economic Engineering in Agriculture and Rural Development Vol. 14, Issue 2, 2014 PRINT ISSN 2284-7995, E-ISSN 2285-3952
256

Scientific Papers Series Management, Economic Engineering in Agriculture and Rural Development Vol. 14, Issue 2, 2014 PRINT ISSN 2284-7995, E-ISSN 2285-3952
257
UNIFORM FARM OPERATIONS (UFO) ON HEMP BROOM RAPE SEED GERMINATION BY BIOLOGICAL CONTROL MANAGEMENT IN IRAN
Behzad SANI1,Vida JODAIAN2 1Islamic Azad University, Department of Agriculture, Shahr-e-Qods Branch, Tehran, Iran, E-mail: [email protected] 2 Islamic Azad University, Department of Chemistry, Islamshahr branch, Tehran, Iran, E-mail:[email protected] Corresponding author: [email protected] Abstract Weeds are a constant problem in agronomy and they not only compete with crops for water, nutrients, sunlight, and space but also harbor insect and disease pests; clog irrigation and drainage systems; undermine crop quality; and deposit weed seeds into crop harvests. In order to the microbial herbicide (Orocide) influence on seed germination in Orobancheramosa L., this experiment was conducted in 2011 at Islamic Azad University Shahr-e-Qods Branch in Tehran by a completely randomized design with four replications. The factor studied included use of Orocide (0(T1), 2(T2), 4(T3) and 6(T4) percentage). The results showed that the effect of microbial herbicide (Orocide) was significant on germination percentage of Orobancheramosa. Mean comparison showed that the highest germination percentage (79%) was achieved by non-application of Orocide and lowest germination percentage (8%) was achieved by application of 4% Orocide.The results of this experiment showed that the use of Orocide can decreased the germination in Orobancheramosa L. that is uniform farm operations (UFO) very important for weed biological control management at Iran. Key words: microbial herbicide, Orobancheramosa L, Orocide, seed germination INTRODUCTION A weed in a general sense is a plant that is considered by the user of the term to be a nuisance. The word is normally applied to unwanted plants in human-controlled settings, especially farm fields and gardens, but also lawns, parks, woods, and other areas. More specifically, the term is often used to describe any plants that grow and reproduce aggressively [1]. Orobancheramosa is a species of broomrape known by the common names hempbroom rape and branching broomrape. It is native to Eurasia and North Africa, but it is known in many other places as an introduced species and sometimes a noxious weed. It is a pest in agricultural fields, infesting crops including tobacco, potato and tomato. The plant produces many slender, erect stems from a thick root. The yellowish stems grow 10 to 60 centimeters tall and are coated in glandular hairs. The broomrape is parasitic on other plants, draining nutrients from their roots, and it lacks leaves and chlorophyll. The inflorescence bears several flowers, each in a
yellowish calyx of sepals and with a tubular white and blue to purple corolla [2],[3],[4]. The basidiomycete fungus, Chondrostereumpurpureum Fr. Pouzar, has been found to be a good potential bioherbicide candidate for control of hardwood vegetation in forests. However, its interaction with some agrochemicals that are normally employed in forest protection was not known. Employing two concentrations (0.01% v/v and 0.1% v/v) of several agrochemicals, a laboratory study was conducted to assess their impacts on the infective mycelia. Except for Bond, and Suntan gel-2, most adjuvants, sunscreen agents, and pesticides (herbicides, fungicides, and insecticides) were fungi toxic at 0.1%. Fungi toxicity was concentration dependent and the results indicate that the possibility of tank-mixing the basidiomycete with agrochemicals appears limited and the possibility of agrochemical residue effects on survival of the basidiomycete is implied [5].The overriding principle of the bioherbicide approach has been that a host-specific, coevolved natural enemy can be used

Scientific Papers Series Management, Economic Engineering in Agriculture and Rural Development Vol. 14, Issue 2, 2014 PRINT ISSN 2284-7995, E-ISSN 2285-3952
258
as a bioherbicide when applied in simple formulations at inundative levels; however, two decades of research has effectively disproven this principle. Although research has revealed weaknesses in the bioherbicide approach, it has also revealed potential in a number of areas. A number of niche situations will remain in which host-specific plant pathogens can be developed as bioherbicides, such as for parasitic weeds and narcotic plants, but more research should be conducted with virulent, broad host range organisms, and more effort should be devoted to developing techniques for the cultural and genetic enhancement of bioherbicidal organisms [6]. Therefore, the objective of this study was to evaluate the microbial herbicide influence on seed germination in Orobancheramosa for weed biological control management (WBCM) at Iran. MATERIALS AND METHODS In order to carry out the microbial herbicide (Orocide) influence on seed germination in Orobancheramosa, this experiment was conducted in 2011 at Islamic Azad University Shahr-e-Qods Branch in Tehran by a completely randomized design with four replications. The factor studied included use of Orocide (0, 2, 4 and 6 percentage). Orobanche ramose seeds were collected from Shahr-e-Qods zone and were transported to the laboratory. Then in each Petri dish 100 seeds were placed between two layers of paper culture and added Orocide (0(T1), 2(T2), 4(T3) and 6(T4) percentage) and then Petri dishes were placed in Germinator for 20 days at 18 to 20C. Finally, percent germination for Orobanche ramose by following formula: (Number of Seeds Germinated/Total Number of Seeds on Petri Dish) * 100 Data were subjected to analysis of variance (ANOVA) using Statistical Analysis System [SAS, 1988] and followed by Duncan's multiple range tests. Terms were considered significant at P < 0.05.
RESULTS AND DISCUSSIONS The results showed that the effect of microbial herbicide (Orocide) was significant on germination percentage of Orobancheramosa. Mean comparison showed that the highest germination percentage (79%) was achieved by non-application of Orocide and lowest germination percentage (8%) was achieved by application of 4% Orocide.
a
b
0
30
60
90
(%)
T1 T2
Fig.1. Germination compression in Orobanche ramose at T1 and T2 levels of Orocide
a
b
0
30
60
90
(%)
T1 T3
Fig.2. Germination compression in Orobanche ramose at T1 and T3 levels of Orocide
a
b
0
30
60
90
(%)
T1 T4
Fig.3. Germination compression in Orobanche ramose at T1 and T4 levels of Orocide

Scientific Papers Series Management, Economic Engineering in Agriculture and Rural Development Vol. 14, Issue 2, 2014 PRINT ISSN 2284-7995, E-ISSN 2285-3952
259
a
b
0
10
20
30
40
50
(%)
T2 T3
Fig.4. Germination compression in Orobanche ramose at T2 and T3 levels of Orocide
a
b
0
10
20
30
40
50
(%)
T2 T4
Fig.5. Germination compression in Orobanche ramose at T2 and T4 levels of Orocide
aa
0
3
6
9
12
(%)
T3 T4
Fig.6. Germination compression in Orobanche ramose at T3 and T4 levels of Orocide
0
15
30
45
60
75
90
T1 T2 T3 T4
(%)
Fig.7. Germination variations in Orobanche ramose in levels of Orocide
Our findings showed that Orocide microbial herbicide decreased germination percentage in Orobancheramose sorely that is very important in agronomy without this dangerous weed. An isolate of the fungus Dactylariahigginsii obtained from purple nutsedge in Florida was highly pathogenic to Cyperus spp. The potential of this isolate as a bioherbicide was field tested in natural populations of purple nutsedge in Gainesville and Jay, FL. The fungus was applied in 0.5% Metamucil as a carrier, and the treatments were: carrier only, 105 conidia/ml + carrier, and 106 conidia/ml + carrier. Treatments were applied as single, double, or triple postemergence (POST) sprays at biweekly intervals. The disease and secondary infections developed in about 5 and 15 d after inoculation, respectively, killing most of the infected leaves. All weed growth parameters and disease progress rates were affected by inoculum dosage and inoculation frequencies. Three inoculations, each at 106 conidia/ml, provided effective control of purple nutsedge compared to a single inoculation, as measured by shoot dry weight, tuber numbers, and tuber dry weight. Higher rates of disease progress and disease levels, defined by the area under the disease progress curve (AUDPC), occurred with three inoculations at 106 conidia/ml. Disease progress was slower and the level of weed control was lower at 105 conidia/ml compared to the higher inoculum level. Three applications of 106 conidia/ml provided > 90% nutsedge control. Dactylariahigginsii appears to be an effective bioherbicide candidate deserving further development for commercial use [7].Velvetleaf (Abutilon theophrastiMedik) is difficult to control with existing weed control strategies. Some measure of control can be obtained with a fungus, Colletotrichumcoccodes (Wallr.) Hughes, used as a bioherbicide, but when the bioherbicide application was combined with the plant growth regulator thidiazuron (N-phenyl-N′-1,2,3-thidiazol-5-yl-urea), weed control was substantially improved. Thidiazuron alone interfered with normal development of velvetleaf, causing stunting and initiation of axillary bud growth. Tank

Scientific Papers Series Management, Economic Engineering in Agriculture and Rural Development Vol. 14, Issue 2, 2014 PRINT ISSN 2284-7995, E-ISSN 2285-3952
260
mix applications of C. coccodes and thidiazuron acted synergistically to increase velvetleaf mortality. When C. coccodes was applied 10 days after thidiazuron as a split application, weed control was less than for tank mix applications. However, two applications of C. coccodes plus thidiazuron were more effective than equivalent single tank mix applications. Under laboratory conditions, high concentrations of thidiazuron (2× field application rates) inhibited growth of C. coccodes, but at field application rates thidiazuron did not reduce disease development. Combinations of thidiazuron and C. coccodes may provide effective control of velvetleaf in the field [8].The suitability of a bioherbicide as a component of an integrated weed management program not only relies on its field efficacy, but also on its compatibility with other pest control measures that may be employed during the cropping season. The effects of selected pesticides applied according to label rates on Dactylariahigginsii, a biological control agent for purple nutsedge, were determined using mycelial growth on pesticide-amended potato dextrose agar (PDA) and conidial germination as indicators of pesticide sensitivity. Among the pesticides tested, the herbicides oxyfluorfen and sethoxydim and the fungicides fosetyl-Al and thiophanate methyl inhibited D. higginsiimycelial growth and reduced or completely inhibited conidial germination; the herbicide diuron, the fungicides metalaxyl and copper hydroxide, and the insecticide cyromazine reduced mycelial growth but did not reduce conidial germination. The miticidedicofol reduced mycelial growth and completely inhibited conidial germination while the herbicide imazapyr had no adverse effect on either the mycelial growth or conidial germination of D. higginsii[9]. CONCLUSIONS The highest germination percentage (79%) was achieved by non-application of Orocide and lowest germination percentage (8%) was achieved by application of 4% Orocide. The results of this experiment showed that the use
of Orocidecan decreased the germination in Orobancheramosa L. that is very important for weed biological control management (WBCM) at Iran. ACKNOWLEDGMENTS This paper was supported by the shahr-e-Qods Branch, Islamic Azad University (IAU) and Islamshahr Branch, Islamic Azad University. REFERENCES [1] Jules, J., 1979, Horticultural Science (3rd ed.). San Francisco: Freeman WH., 308 [2] Karkanis, A., 2007, Tobacco (Nicotianatabaccum) infection by branched broomrape (Orobancheramosa) as influenced by irrigation system and fertilization, under East Mediterranean conditions. Journal of Agronomy 6: 397-402 [3]Haidar, M.A., 2005, Selective control of Orobancheramosa in potato with rimsulfuron and sub-lethal doses of glyphosate. Crop Protection, 24: 743-47 [4]Mauromicale, G., 2008, Effect of branched broomrape (Orobancheramosa) infection on the growth and photosynthesis of tomato. WeedScience, 56: 574-81 [5] Prasad, R., 1994, Influence of Several Pesticides and Adjuvants on Chondrostereumpurpureum: A Bioherbicide Agent for Control of Forest Weeds. WeedTechnology, 8: 445-449 [6]Hallett, S.G., 2005, Where are the Bioherbicides.WeedScience, 53: 404-415 [7] Kadir, J.B., Charudattan, R.., Stall, W.M., Brecke, B.J., 2000, Field Efficacy of Dactylariahigginsii as a Bioherbicide for the Control of Purple Nutsedge (Cyperusrotundus). WeedTechnology,14: 1-6 [8]Wymore, L.A., Watson, A.K., Gotlieb, A.R., 1987, Interaction between Colletotrichumcoccodes and Thidiazuron for Control of Velvetleaf (Abutilon theophrasti). Weed Science, 35: 377-383 [9]Yandoc, C.B., Rosskopf, E.N., Pitelli, R.L.C.M., Charudattan, R., 2006, Effect of Selected Pesticides on Conidial Germination and Mycelial Growth of Dactylariahigginsii, a Potential Bioherbicide for Purple Nutsedge (Cyperusrotundus). Weed Technology, 20: 255-260

Scientific Papers Series Management, Economic Engineering in Agriculture and Rural Development Vol. 14, Issue 2, 2014 PRINT ISSN 2284-7995, E-ISSN 2285-3952
261
PARTICULARITIES OF COMMUNICATION IN RURAL TOURISM Svetlana SASU, Svetlana DARII State Agrarian University of Moldova, 44 Mircesti str., MD 2049, Chisinau, Moldova, Phone/Fax:373/22432136; E-mail: [email protected], [email protected] Corresponding author: [email protected] Abstract The social aspect of rural tourism enhances its value as a communicative process because Tourism is an industry with a difference. There is an undeniable exchange between places and people. This exchange is what is meant by communication. Communication happens at many levels (even for one single action), in many different ways, and for most beings, as well as certain machines. Communication requires a sender, a message, and an intended recipient, although the receiver need not be present or aware of the sender's intent to communicate at the time of communication; thus communication can occur across vast distances in time and space. Communication requires that the communicating parties share an area of communicative commonality. The communication process is complete once the receiver has understood the sender. Thus, communication is a two- way process. The interaction of the tourist with the places he visits and the people he meets is therefore, a form of communication in which both the visitor and the visited form a communication cycle. A considerable amount of weight age is given to the power of impressions on the mind of a person living in the twenty-first century. One of the most important aspects of rural tourism is the communication of the impressions created in the minds of tourists. These include non-verbal aspects -- sights and sounds communicate a general impression-- and the verbal aspect of communication-- language plays an important role in creating impressions. Key words: communications, language plays, recipient, sender INTRODUCTION Tourism is an important sector of the global economy and it has a permanent upward trend both nationally and internationally. The tourism industry align a varied range of public and private enterprises, which are generating economic and social benefits, new jobs for different categories of employees, providing more opportunities. The touristic industry is highly fragmented and consists of various small and large businesses, both public and private sector. Its evaluation requires coordination, investment, training and marketing and all this lead to coordination between the Government, local authorities, companies and travel agencies[1]. Tourism is an economic activity which reflects on most social sectors. This fact should realized by target institutions and the entire population. It became imminent to denote that the tourism is not related just to persons who spend their yearly holidays, but by provided services it can have a positive impact on the society. The necessity of the sustainable economic development reveals
more the importance of a strategy developing and agreeing, of which ultimate goal is to not affect negatively the natural and anthropic tourism potential, but to be protected for the future generations’ common well. The country's touristic product is a complex environment, both natural and created by humans (heritage, culture, activities, and services for visitors). Rural tourism enjoys a great popularity. Rural agricultural communities and picturesque villages are an important source of provided services of traditional, rural accommodation, of providing opportunities for involving visitors in rural activities and pursuits, for folklore, entertainment and traditions acquaintance. It also deals with the presentation of handicrafts, with the possibility of participation in the work process and offers opportunities to purchase handicrafts[2]. A tourism enterprises success correlated with a lasting costumer’s and other beneficiaries satisfaction is all-in-one connected to the communication process. In tourism, the effective communication with customers is

Scientific Papers Series Management, Economic Engineering in Agriculture and Rural Development Vol. 14, Issue 2, 2014 PRINT ISSN 2284-7995, E-ISSN 2285-3952
262
essential for a successful business. Hence, the most worldwide popular touristic companies are faithful in keeping to customers’ communication stages, omitting to do it, just to satisfy their own desires. According to the role and importance of communication in tourism, we can mention that advertising or promotional communication is the most important form of communication that connects the emitter - travel agent and receiver - the customer. MATERIALS AND METHODS The papers is based on the actual legislation, literature, report on the strategic development of tourism published by the Agency of Tourism of the Republic of Moldova, other sources and our opinions regarding particularities of communication in rural tourism. RESULTS AND DISCUSSIONS Within rural tourism, there are varied groups of people who are involved in the communication of touristic activity, such as: tourists, whose behavior can be analyzed by themselves unto other travelers or to the local population; habitants or local population; touristic activity trader; abet organizations, etc[3]. Communication represents many forms: written, verbal, nonverbal. An important form of communication in rural tourism is represented by visual and auditory messages within the environment[4]. Guest houses, hotels, motels, travel agencies owners can use various communication techniques to delight customers. For an effective communication, it must be kept within a proper function, even if sometimes it is imperiled by some bottoming, barriers, which create a big problem. This is asserted by the impossibility to convey what we want to express, or by incapacity of picking-up the correct message by the receiver. For a problem to be solved is necessary to know, indentify, compliance, accept it and to pass some levels and strategies for situation optimization. It
expresses the base of human relations, expressed by the ability of decoding the meaning of achieved social contacts. This relationship is achieved through language, because language is the function of language use in regard to other people[5]. Effective communication between travel agents and customers should keep to truth, accuracy and honesty, which are the most important features, thus it will encourage the mutual respect within messages. Advertising or promotional communication is the most important form of communication in tourism. The rural tourism approaches all kinds of advertising. It is one of the five important tools which are used by travel companies for a fully persuasive communication orientation to customers and other target audiences. We define advertising as any form of transpersonal presentation and ideas, goods or services promotion, which are paid by a well-determined sponsor[6]. Those who spend money for advertising include not only companies, but also museums, social and professional organizations, which use the advertising to promote their ideas and principles to inform various targeted audiences. Advertising is used within all countries and in all spheres of activity. In tourism, it conveys the information about tourism, about products and services offered by travel companies. Advertising takes many forms (national, regional, expendable, industrial, retail, by product, by brand, institutional, etc.), being intended to ensure varied goals achievements (immediate sales achieving, brand recognition procurement, particular brand strengthening preference). Making decisions on advertising is a multi-stage process and consists of assessing aims, decisions-making on the budget, on the message one, decisions-making on the means of advertising sharing and advertising efficiency evaluating. Advertising users have to define clear objectives, namely to assess whether the advertising role is to inform and determine the customers. Decision-making regarding advertising means, involves a clearly definition of objectives related to the sphere of activity, the frequency of occurrence

Scientific Papers Series Management, Economic Engineering in Agriculture and Rural Development Vol. 14, Issue 2, 2014 PRINT ISSN 2284-7995, E-ISSN 2285-3952
263
and impact; the main means choosing of advertising, specific tools selecting[7]. Thus, we can mention that an advertising campaign evaluation involves effect assessing of communication between tourism companies and customers. Character of rural tourism advertising is unstable and even invisible, which makes advertising to take a permanent character due to imposed changes. It is preponderant symbolic than descriptive, present an emotional image and means of suggestion. It also expects to convert people's dreams into action. Ideas visualization is very important for advertisements. The image has an important role in advertising oration: well chosen models, the suggestively framework, blazes, positive mood, and bright graphics. Possible targets of advertising in rural tourism are: to inform the market about a new particular tourism product apparition, to acquiesce the market with price changes, to describe available services to travel or other agencies, to emendate erroneous impressions. Among the main objectives of advertising, also there can be notice the buyer’s fears, the positive images creation of touristic companies, consumer preferences inducing for specific tourism, and also the reorientation consumers encouragement for claimed products. It can be also included in the list of objectives the modified perceptions of product attributes, buyer’s persuasion in an instant product purchasing and to accept a salesperson visits. Any advertiser aims to remind buyers that they might need this product in the near future, could inform them where they can purchase the product, and not least at all, he/she could maintain the buyers attention on the product, also out of season. Travel companies prefer to use different advertising channels, in order to get on desired audience: outdoor - billboards, LEDs; mass media - radio, TV; print - catalogs, magazines; on-line - on specialized or most popular sites[8]. Press advertising is the most requested by sponsors, and it has following advantages, such as: the credibility, accessibility, low prices and negotiability.
Radio is a short-lived advertising, auditory memory is less than the visual one. It applies to a receiver intense imagination. The first 3 seconds are very important for a message and the content, for those who hear the advertisement or the commercial. TV advertising is the most effective advertising method. It uses a complex of communication means. This is one of the effective forms of wholesale communication, the best one for distributers and consumers. Within this type of advertising is taken into account during spot manufacturing, several crucial aspects, specially: the audience cleverness, its high level of culture, its rich imagination and taste. In order to achieve this, the public must be seriously informed about the presented products and about choosing the ways of displaying. The televiewer should be perceived as a potential buyer. TV advertising should emphasize the individuality or the mark, has more advantages for the buyer, and invokes even emotions. For rational and emotional public involvement, the advertising should have a brief message, avoiding overloaded information, and before being launch, the spot must be tested. Posters and billboards existing a very long time and they have become an industry after printing invention. They should be exhibited in special places. They should have large sizes, concise, and with great impact on the audience. Posters, billboards and flyers advertising is used in order to catch an ample public attention on the target products. Chastity is their particularity. Text’s message advertising necessarily contains, a set of arguments applied to features and benefits prominence of the touristic product. Expressions which are used are prescript to be simple, suggestive, directly, emphasizing the clichés and collocations. The advertisement must fill up the image which is able to catch the attention and make the message to be comprehended, giving a bidding competence. The slogan is also very important and it must be concise, expressive, attractive and exiting. Main promotional communication’s elements are: who are going to be the advertising

Scientific Papers Series Management, Economic Engineering in Agriculture and Rural Development Vol. 14, Issue 2, 2014 PRINT ISSN 2284-7995, E-ISSN 2285-3952
264
campaign aim; which will be the message; what is the main psychological motivation and how it will be displayed; where the advertising will be placed, when it will be broadcasted and quite how the aim was achieved[9]. CONCLUSIONS In conclusion, we can say that rural tourism should become an essential element not only for economic society development, but also for its cultural and social advancement. It can create the opportunity of unemployment allowance and can broaden among inhabitants’ point of you, becoming "a window to the world", educational factor and not lastly - a source of means of subsistence. Compliance of rigors mentioned above, are establishing a successful communication subject in tourism, otherwise it will not be achieved. It is well known fact that the basis of any successful human interaction is good communication. But there are situations where communication is difficult or impossible, because of language, culture and ethnic big differences. In these situations we must be pervious to other signals diffuse by the emitter during a conversation: mimics, gestures, voice tone, postures, etc. An accurate perception of these signals can be compared with the interpreting of indices that will lead to the desired result. In these cases, nonverbal language comprehending will surely facilitate the communication process[10]. The communication rules keeping within rural tourism will be one of the most important components of comprehending and collaboration between customers, employees, support organizations and suppliers. Overtaking barriers in communication is the way toward professional success of touristic agencies. The efficiency with which travel agents will manage to overcome these barriers depends on each agent in part, on wishes, on the will, on aspirations and each client personality. Regardless of the outcome, we must not forget that the success secret is possible for
everyone to get and it comprise in good communication. REFERENCES [1]Belch, G., 1993, Introduction to Advertising and Promotion, Ed. MA. [2]Carnegie, Dale,1997,Secretele succesului, ed. Curtea Veche, Bucuresti. [3]Dinu Mihai,1997,Comunicarea, Ed. Stiintifica, Bucuresti [4] Nedelea Alex, 2003, Politici de marketing in turism, Ed.economica, Bucuresti. [5] Nedelea Alex, 2003, Piata touristica, Ed. Didactica si Pedagogica, Bucuresti. [6]Nistoreanu Puiu, 2003, Ecoturism si turism rural, Bucuresti [7]Popa Alin Constantin,2001, Comunicare si manipulare prin publicitate, Ed. Universitatea Lucian Blaga. [8]Strategia de dezvoltare a turismului “Turism 2020”, Touristic Agensy of Republic of Moldova. [9]Tigu Gabriela,2005, Etica afacerilor in turism, Ed. Uranus, Bucuresti. [10]Van Deik, 1989, Iazic, poznanie, comunicatia, Ed. Progres, Moscow.

Scientific Papers Series Management, Economic Engineering in Agriculture and Rural Development Vol. 14, Issue 2, 2014 PRINT ISSN 2284-7995, E-ISSN 2285-3952
265
OPPORTUNITIES AND CHALLENGES OF THE DEVELOPMENT OF SMALL AND MEDIUM ENTERPRISES IN THE AGRICULTURAL SECTOR FROM THE REPUBLIC OF MOLDOVA Olga SÂRBU, Boris COREŢCHI
Agrarian State University of Moldova, Chisinau, 42 Mircesti, sector Rascani, MD-4224, Chisinau, Republic of Moldova, Phone: +373 22 432387, E-mail: [email protected], E-mail: [email protected] Corresponding author: [email protected] Abstract It is currently widely known that small and medium enterprises are a major force for ensuring the stability of economic development, increasing the mobility and adaptability of the national economy to internally and externally changing conditions, also are a factor for diversification of the economy. Small business is oriented to satisfy the local market needs and it uses the local workforce and resources, having a substantial contribution also in solving the problem of unemployment. Therefore, further diversification and expansion of the SMEs sector is seen as a sign
of healthy economy. Key words: business, economic agents, small and medium enterprises INTRODUCTION
The SME sector plays a significant role in the economy of the European countries in the last decade. It generates new jobs, produces goods and creates added value, contributes to the economic structure improvement, develops and implements innovations, is involved in the export of goods, etc. However, the contribution, made by the Moldavian SMEs to the economic development of the country is lower than in the most EU countries. For example, the indicator that characterizes the "density" of SMEs – the number of SMEs per 1,000 inhabitants – is on average 41.4 units in the EU and 12.8 units in the Republic of Moldova [1]. Targeted measures, realized by the state and the business community are necessary to develop the SME sector in the Republic of Moldova. The rationale of these measures requires the understanding of SMEs qualitative and quantitative features as well as the identification of the specific character of some SMEs groups and entrepreneurs operating in the Republic of Moldova. The SME sector plays an important role in ensuring the stability of economic development, increased mobility and adaptability of the national economy to the changing conditions of both internal and
external character; it is also a diversification factor of the economy. The presence of a well developed SMEs sector in the economy is particularly important in terms of the structural reform of the economy and the increased structural unemployment which accompany this process. The SME sector is being increasingly developed in economically developed countries, especially in the sphere of services and production of consumer goods. Small enterprises are less flexible and react quicker to the changing business and market requirements. Therefore, small business investments bring higher incomes than investments in large companies. Moreover, the latter benefit from the services provided by small enterprises and are somehow dependent on them. Small business is oriented to the satisfaction of local market needs and uses local resources and labour, with a substantial contribution in solving the unemployment problem. The small business sector has created 40,000 jobs or 70% of the total 59,000 jobs in the Moldavian economy during the past two years. However, small business offers real opportunities to implement the entrepreneur’s creative skills, as well as inventiveness and leadership ability which are very necessary and useful qualities.

Scientific Papers Series Management, Economic Engineering in Agriculture and Rural Development Vol. 14, Issue 2, 2014 PRINT ISSN 2284-7995, E-ISSN 2285-3952
266
The SME sector is called the "backbone of the economy" in the world due to its largest contributions to the creation of new jobs, stimulation of competitiveness, promotion of innovations and technologies. However, we cannot talk about an exhaustive definition of small business. One may say that small business comprises micro-enterprises and small enterprises. Despite the significant role of SMEs and the attention, paid to it nowadays, many basic theoretical concepts necessary for their research, are insufficiently developed and do not still have a univocal determination. Only a few characteristics of small enterprises, SMEs and small entrepreneurs are usually analyzed in scientific publications. Almost every author uses his own definition of SMEs [6]. Today, "there is no single reliable source" to identify the key categories that are important for the SME research [7]. This is largely due to the predominantly applied orientation of SMEs research, which are primarily addressed to the politicians trained to regulate the entrepreneurial activity, business community representatives who participate in the SME strengthening and implementation of their lobby and the institutions that provide business services to entrepreneurs. As a result, theoretical problems of SMEs are often addressed only to the extent that helps to solve practical needs.
MATERIALS AND METHODS
Works from journals and articles from both national and international conferences were used as the theoretical support. The examined data were selected from the papers of the National Bureau of Statistics. Methods of abstraction, induction and deduction, synthesis, quantitative and qualitative analysis and comparison were used to study this problem. RESULTS AND DISCUSSIONS The modern economy development is based on the activity of enterprises of different sizes - large, medium and small – whose role has radically changed in recent decades. Until the 60 - 70s of the last century small enterprises
were considered as a temporary phenomenon caused by the insufficient level of economic development. The strengthening of big companies in the economic life was considered as an indicator of growth: statistics data reflected the increasing pace of industrial concentration in almost all industrialized countries. Eminent scientists have shared the opinion of the transitional character of small enterprises over many years. Thus, J. Schumpeter, a famous economist and sociologist, wrote at the beginning of the 20th century that large monopolistic companies with the scientific, manufacturing and financial potential will eventually absorb small enterprises [11]. In the second half of the 20th century one of the leading economists, J. Galbraith, noted the advantages of big enterprises over small ones regarding the higher capacity of financial resources, price control and the appropriate awareness about the enterprise in society [10]. The majority considered that only a large enterprise can be efficient because of the lower conventionally permanent costs and so- called "economy of production capacities" [9]. The SME sector is of particular importance for the development of the Republic of Moldova. During the period of market relations establishment the role of SMEs was determined not only by the created economic structure, where types of activities preferred by small enterprises had the biggest share, but also by the existence of human resources that remained unemployed, unused machinery that could be best used by small enterprises. The increased role of small business enterprises in society also had psychological causes, based on the growing needs of citizens, the educated and materially assured in self - realization. When there is a favourable business environment, entrepreneurship is seen as a possibility to achieve professional and life plans, not just as a required source of income [6; 8]. The SME development has led to the fact that now it is an indispensable part of the economy, playing an important role and having a positive impact on many aspects of the economic, social, scientific and technical, innovation and regional development.

Scientific Papers Series Management, Economic Engineering in Agriculture and Rural Development Vol. 14, Issue 2, 2014 PRINT ISSN 2284-7995, E-ISSN 2285-3952
267
The economic analysis and the support of the SME sector development need a clear definition of its boundaries. Therefore, governing bodies of every country approve qualitative and quantitative criteria concerning enterprises in the SME sector. All criteria have both advantages and restrictions [3; 6]. The volume of annual sales and the number of employees are the most common criteria to assess the enterprise size in the world. Besides these indicators, according to the law of the Republic of Moldova, the value of assets is also taken into consideration. Table 1. Quantitative criteria of SMEs in the Republic of Moldova
The SME size
The number of
employees, people
The sales volume, lei
The assets, lei
Micro 1-9 up to 3 million lei up to 3 million lei
Small 10-49 up to 25 million
lei up to 25 million
lei
Medium 50-249 up to 50 million
lei up to 50 million
leiSource: The Law of the Republic of Moldova on the support of small and medium enterprises sector [4] Thus, the firms with a number of employees of 1-9 people, the annual sales volume up to 3 million lei and the value of assets up to 3 million lei are qualified as micro-enterprises according to the Moldavian legislation; the enterprises with 10-49 employees and the value of assets and the annual sales volume of up to 25 million lei are called small enterprises and the enterprises with 50-249 employees, the value of assets and the annual sales volume of up to 50 million are classified as medium-size enterprises. The mentioned limits differ from one country to another. The quantitative impact of SMEs on the economic growth is assessed by the share of SMEs in GDP. The share indicator of SMEs in GDP significantly varies in different countries. The SME sector generates 58.4% of GDP in the EU and 43.4 % in the USA (2010). The share of SMEs in GDP is less than 50% in 10 of 12 countries-members of the Organization of the Black Sea Economic Cooperation (BSEC), in 5 countries – less than 30%. In 2012 the share of Moldavian SMEs in GDP was 28.3%. The share of SMEs
in GDP is relatively lower than the sector share in employment in all countries. This reflects a lower level of labour productivity in the SME sector compared to big companies. During the last 20 years the SME sector of the Republic of Moldova has grown both in a quantitative and qualitative ways. The global economic and financial crisis has had a negative impact on SMEs. The study of the crisis impact on this sector results and some SME groups allows to more precisely consider their possibilities and restrictions under unfavourable external environment and to argue their regulatory policy improvement. Moldavian SMEs constitute a significant part of the total number of enterprises, provide work places and a modest level of income, ensure the market saturation with goods, participate in GDP formation. In 2012 the number of SMEs in the Republic of Moldova was 49.4 thousand enterprises or by 2.1 thousand enterprises (4.4%) more than in 2011. The SME sector occupies about 97.5% of the total number of enterprises. Thus, the dynamics of the SME number in 2008-2012 can be presented in the following way:
Fig. 1 The dynamics of small and medium-sized enterprises in the Republic of Moldova The source: Developed by the author based on the National Labour
Union Block, the Statistical Yearbook of the Republic of Moldova in
2013 [2]. The development of SMEs in the Republic of Moldova is an increasing trend from 41.1 thousand enterprises in 2008 to 49.4 thousand enterprises in 2012, or by 32.8%. However, the percentage of small and medium-sized enterprises in the total number varied within 97-98% in the analyzed dynamics. A more detailed analysis of the SME sector activity in our country can be carried out,

Scientific Papers Series Management, Economic Engineering in Agriculture and Rural Development Vol. 14, Issue 2, 2014 PRINT ISSN 2284-7995, E-ISSN 2285-3952
268
being based on the study of the sector by the number of employees and sales revenues
according to the table given below.
Table 2. The dynamics of small and medium enterprises share in the total number of all enterprises in the Republic of Moldova
Years The number of enterprises, thousand
The number of employees, thousand people
Sales revenue, thousand lei
Total SME The share
of SME, % Total SME
The share of SME, %
Total SME The share of
SME, % 2008 42.1 41.1 97.6 572.1 328.1 57.3 175058.4 64984.1 37.1 2009 44.6 43.7 97.8 539.2 316.2 58.7 146447.0 57480.0 39.2 2010 46.7 45.6 97.7 526.2 309.4 58.8 177503.2 65263.2 36.8 2011 48.5 47.3 97.5 510.2 294.2 57.7 207676.8 71887.6 34.6 2012 50.7 49.4 97.5 519.9 300.2 57.7 211759.3 73057.0 34.5
The source: Developed by the author based on the National Labour Union Block, the Statistical Yearbook of the Republic of Moldova in 2013 [2].
The analysis of the SMEs development shows the reduced average size of the companies in this sector. In 2012 the average sales revenues per enterprise were 1,478 thousand lei or by 41 thousand lei (2.7%) less than in 2011. The average sales revenue per employee was 243,300 lei or by 1 thousand lei (0.4%) less than in 2011. In 2012 the average number of employees per enterprise amounted to 6 people, i.e. as many as in 2011. The number of people who worked at small and medium enterprises in the reference period was 300,200 people, or 57.7 % of the total number of employees. In this period the sales revenues of small and medium enterprises amounted to 73057.0 million lei or 34.5 % of the total sales revenue in the economy.
The analysis of SMEs classification by types of activity is also interesting. This classification primarily depends on the classifier officially used in the country or region. The EU adopted the Statistical classification of economic activities in the European Community, common to all member states. At present the same classifier is used in the Republic of Moldova. To more generally analyze SMEs by sectors, types of SMEs activities are classified in European studies and Eurostat as follows: industry, agriculture, construction, trade, services, etc. The dynamics of the SMEs number by the main types of activity is presented in the Republic of Moldova as follows:
Table 3.The dynamics analysis of SMEs by the main types of activity in the Republic of Moldova
Name
2011 2012
2012 in % compared to 2011
SMEs (thousand)
The share of SMEs in:
SMEs (thousand)
The share of SMEs in:
The total number of
enterprises, %
The total number of SMEs, %
The total number of enterprises,
%
The total number of SMEs, %
Total 47.3 97.5 100 49.4 97.5 100 104.4 Including the main types of enterprise activity: Agriculture, economy, hunting and forestry
2.4 97.4 5.1 2.5 97.6 5.0 104.2
Processing industry 4.8 95.9 10.2 4.9 95.8 9.8 102.1 Electricity, gas and water 0.2 84.4 0.4 0.2 86.8 0.5 100.0 Construction 2.6 97.0 5.5 2.7 96.9 5.5 103.8 Wholesale and retail trade 19.4 97.7 41.0 20.0 97.8 40.5 103.1 Hotels and restaurants 1.5 99.2 3.2 1.7 99.4 3.4 113.3 Transport and communication 3.2 98.0 6.8 3.3 98.1 6.7 103.1Real estate transactions, rent and services provided by enterprises
7.9 98.4 16.6 8.5 98.4 17.2 107.6
Other activities 5.4 97.1 11.3 5.7 97.1 11.5 105.6 The source: Developed by the author based on the National Labour Union Block, the Statistical Yearbook of the Republic of Moldova in 2013 [2].

Scientific Papers Series Management, Economic Engineering in Agriculture and Rural Development Vol. 14, Issue 2, 2014 PRINT ISSN 2284-7995, E-ISSN 2285-3952
269
The majority of SMEs in Moldova are involved in trade, amounting about 20 thousand enterprises in 2012, or 40.5% of all SMEs. 4,900 enterprises or 9.8 % of all SMEs worked in manufacturing industry. There has increased the number of SMEs that are involved in real estate, renting and service rendering (from 16.6 % in 2011 to 17.2% in
2012). The share of SMEs which operate in agriculture, hunting and forestry remained at the level of 5% in the analyzed period. Another criterion for SME classification is by the SMEs sales revenue related to the main types of activity. The SMEs sales revenues related to the main types of activity are presented as follows:
Table 4. The dynamics of sales revenues of small and medium enterprises by the main types of activity in the Republic of Moldova
Name
Year 2011 Year 2012
Total, million
lei
SMEs, million
lei
The share of sales revenues of SMEs in:
Total, million
lei
SMEs, million
lei
The share of sales revenues of SMEs in:
The total number of enterprises,
%
The total number
of SMEs,%
The total number of enterprises,
%
The total
number of
SMEs,% Total 207676.8 71887.6 34.6 100.0 211759.3 73057.0 34.5 100.0
Including by the main types of enterprise activity:
Agriculture, hunting and forestry
8307.8 5613.5 67.6 7.8 7257.6 4930.3 67.9 6.7
Processing industry 31203.6 9316.4 29.9 13.0 33265.7 9522.8 28.6 13.0 Electricity, gas and water
19995.8 258.7 1.3 0.4 22355.2 261.8 1.2 0.4
Construction 9144.7 5555.2 60.7 7.7 8439.8 5349.9 63.4 7.3 Wholesale and retail trade
97530.5 35319.2 36.2 49.1 98590.9 36299.0 36.8 49.7
Hotels and restaurants
1602.8 1115.6 69.6 1.6 1830.5 1365.8 74.6 1.9
Transport and communication
19881.6 6464.9 32.5 9.0 19423.7 6885.1 35.4 9.4
Real estate transactions, rent and services provided by enterprises
8434.4 5100.7 60.5 7.1 8021.7 5177.2 64.5 7.1
Other activities 11575.8 3143.4 27.2 4.4 12574.2 3265.0 26.0 4.5 The source: Developed by the author based on
If we compare the share of SMEs with the share of sales revenues in this sector, we can mention that despite the share of more than 97 % of all enterprises in the country, the share of sales revenues of SMEs is only 34.5%. This demonstrates a low level of this sector development. The highest sales revenues are noticed by the SMEs that operate in wholesale and retail trade (49%), manufacturing (13%), transport and communication (9%), construction (7.5%), real estate transactions,
rent and services provided by enterprises (7.1%), agriculture, hunting and forestry (6.7%). We can also classify SMEs by the sum of profits/losses before taxation, received by this sector. The analysis of the profits/losses amount before taxation earned by small and medium enterprises in the Republic of Moldova is presented in the table given below.
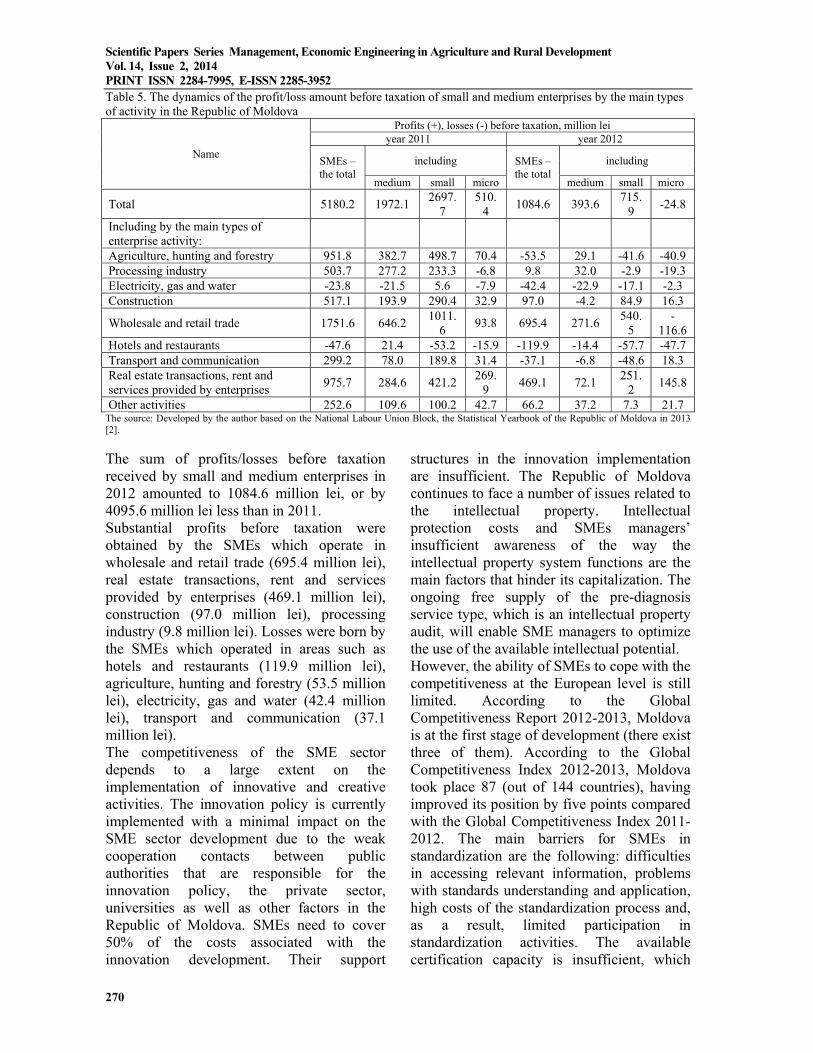
Scientific Papers Series Management, Economic Engineering in Agriculture and Rural Development Vol. 14, Issue 2, 2014 PRINT ISSN 2284-7995, E-ISSN 2285-3952
270
Table 5. The dynamics of the profit/loss amount before taxation of small and medium enterprises by the main types of activity in the Republic of Moldova
Name
Profits (+), losses (-) before taxation, million lei year 2011 year 2012
SMEs – the total
including SMEs – the total
including
medium small micro medium small micro
Total 5180.2 1972.1 2697.
7 510.
4 1084.6 393.6
715.9
-24.8
Including by the main types of enterprise activity: Agriculture, hunting and forestry 951.8 382.7 498.7 70.4 -53.5 29.1 -41.6 -40.9 Processing industry 503.7 277.2 233.3 -6.8 9.8 32.0 -2.9 -19.3 Electricity, gas and water -23.8 -21.5 5.6 -7.9 -42.4 -22.9 -17.1 -2.3 Construction 517.1 193.9 290.4 32.9 97.0 -4.2 84.9 16.3
Wholesale and retail trade 1751.6 646.2 1011.
6 93.8 695.4 271.6
540.5
-116.6
Hotels and restaurants -47.6 21.4 -53.2 -15.9 -119.9 -14.4 -57.7 -47.7 Transport and communication 299.2 78.0 189.8 31.4 -37.1 -6.8 -48.6 18.3 Real estate transactions, rent and services provided by enterprises
975.7 284.6 421.2 269.
9 469.1 72.1
251.2
145.8
Other activities 252.6 109.6 100.2 42.7 66.2 37.2 7.3 21.7The source: Developed by the author based on the National Labour Union Block, the Statistical Yearbook of the Republic of Moldova in 2013 [2].
The sum of profits/losses before taxation received by small and medium enterprises in 2012 amounted to 1084.6 million lei, or by 4095.6 million lei less than in 2011. Substantial profits before taxation were obtained by the SMEs which operate in wholesale and retail trade (695.4 million lei), real estate transactions, rent and services provided by enterprises (469.1 million lei), construction (97.0 million lei), processing industry (9.8 million lei). Losses were born by the SMEs which operated in areas such as hotels and restaurants (119.9 million lei), agriculture, hunting and forestry (53.5 million lei), electricity, gas and water (42.4 million lei), transport and communication (37.1 million lei). The competitiveness of the SME sector depends to a large extent on the implementation of innovative and creative activities. The innovation policy is currently implemented with a minimal impact on the SME sector development due to the weak cooperation contacts between public authorities that are responsible for the innovation policy, the private sector, universities as well as other factors in the Republic of Moldova. SMEs need to cover 50% of the costs associated with the innovation development. Their support
structures in the innovation implementation are insufficient. The Republic of Moldova continues to face a number of issues related to the intellectual property. Intellectual protection costs and SMEs managers’ insufficient awareness of the way the intellectual property system functions are the main factors that hinder its capitalization. The ongoing free supply of the pre-diagnosis service type, which is an intellectual property audit, will enable SME managers to optimize the use of the available intellectual potential. However, the ability of SMEs to cope with the competitiveness at the European level is still limited. According to the Global Competitiveness Report 2012-2013, Moldova is at the first stage of development (there exist three of them). According to the Global Competitiveness Index 2012-2013, Moldova took place 87 (out of 144 countries), having improved its position by five points compared with the Global Competitiveness Index 2011-2012. The main barriers for SMEs in standardization are the following: difficulties in accessing relevant information, problems with standards understanding and application, high costs of the standardization process and, as a result, limited participation in standardization activities. The available certification capacity is insufficient, which

Scientific Papers Series Management, Economic Engineering in Agriculture and Rural Development Vol. 14, Issue 2, 2014 PRINT ISSN 2284-7995, E-ISSN 2285-3952
271
provides exporting companies with little choice and external certification services are very expensive. To assess the SME sector one uses the SWOT analysis too, which is one of the most common forms of business analysis. The impact of internal strengths and weaknesses,
opportunities and threats coming from the external environment are analyzed by means of SWOT. Listing and assessment of these strengths and weaknesses are the main part of this analysis. The analysis of strengths and weaknesses, opportunities and threats of the SME sector are presented in the table below.
Table 6. The SWOT Analysis of the SME sector in the Republic of Moldova
Strengths Weaknesses • The legal framework for the SMEs development that is created
and continuously improved; • Simple procedures for SME registration; • - The implementation of state strategies, programs and
mechanisms to support SMEs; • - The favourable geographical position of the country, situated
between the EU and CIS countries; • The positive attitude of the population towards SMEs and the
desire to have their own business; • The labour force with foreign language skills; • New skills acquired and transferable thanks to the emigrants that
return home; • International cooperation in the field (the Advisory Council to
support and develop SMEs from the CIS and the Working Group on SMEs BSEC);
• A well-developed telecommunication system, including internet access;
• Highly qualified personnel in the ICTsector; • Favourable trade regimes (CIS, CEFTA, EU Turkey).
• The reduced efficiency of the legal framework implementation;
• The unbalanced development of the SME sector; • The inefficient dialogue and cooperation between
entrepreneurs and public authorities; • The limited financial capacity of the state to support
SMEs; • The lack of financial support instruments for innovation
projects; • A low level of innovation development and absorption; • The monopolization of the national economy sectors and
unfair competitiveness; • The infrastructure of business support and the under-
developed capital market; • A low level of entrepreneurial culture and professional
training; • Poor knowledge of export/access techniques to enter
foreign markets and the reduced rate of SMEs export; • A low level of SMEs competitiveness.
Opportunities Threats • The increased state attention to the problems and needs of the
SME sector; • The establishment of the AdvisoryCouncil for SMEs; • The investment development of the public-private partnership; • The pro-European vector in national development; • The extension of the international cooperation, cross-border
cooperation for SMEs and regional infrastructure with the consolidation of contact points;
• The continued development of the SME sector internationalization;
• The continued development of technologies and innovations and their absorption capacity;
• The continued reform of the educational system in the field of entrepreneurship and professional training;
• The development and continuous improvement of intellectual property rights;
• The development of the consulting services market; • Supporting the development of credit history bureaus; • The ongoing simplification of the process of SMEs activity
registration and regulatory.
• The existence of the territorial conflict; • The significant migration of young people and the lack
of young professionals specialized in entrepreneurial activities;
• The increased shadow economy; • The international competitive pressure; • The energy dependence of the country; • The slow adaptation of the education system to the
labour market demand; • The poor participation of entrepreneurs in
entrepreneurship education programs; • A tend to increase the tax burden; • The instability of the legal framework.
The SWOT analysis indicates the existence of advantages and opportunities for SME development, but weaknesses and threats in relation to SMEs remain substantial. Therefore, there is a need to support the SME sector by creating stable legal and economic conditions, favourable for the development of entrepreneurial activity.
CONCLUSIONS The role of SMEs has significantly increased in contemporary conditions as a result of the increased need for services, demand diversification, production and implementation of new technologies, the increased share of the unemployed,

Scientific Papers Series Management, Economic Engineering in Agriculture and Rural Development Vol. 14, Issue 2, 2014 PRINT ISSN 2284-7995, E-ISSN 2285-3952
272
implementation of specific public policies to support SME development, etc. SMEs are qualitatively different phenomena, which differ not only by the small business size, but also by the uniqueness of ownership and management, personalized relationships between the owner/manager and employees, which caused the initiation of a business activity, the limited access to all types of resources, the high level of risk, etc. The economic analysis and state support of the SME sector requires a clear definition of its quantitative criteria. The criteria selection for SMEs in each country primarily depends on the existing possibilities of the state to support it, the sector structure of the economy, the leaders’ intention to integrate the country into the regional association of states, which allows to apply various standards, norms and other indicators used in the association. The SME sector brings together a large number of business activities and entrepreneurs that significantly differ according to various classifications. The most common are the SMEs categories, which differ by the size of the business activity, by its type and form of ownership, by the region and business location, etc. The classification of SMEs is very important both theoretically – for a more detailed study of SMEs and for development policies of this sector. In order to increase the competitiveness of SMEs one needs to improve and develop technical and innovative capabilities of SMEs, to facilitate the development of SME grouping in business incubators, to promote intellectual property for SMEs, to facilitate SMEs access to both national and foreign markets, to implement management systems based on international and European standards.
REFERENCES [1]Aculai, E., 2012, Contribuția sectorului întreprinderilor mici și mijlocii la dezvoltarea economică regională. În: Dezvoltarea întreprinderilor mici și mijlocii: contribuție, provocări și direcții de perspectivă / Aculai E., Vinogradova N., Percinschi N., Novac A., Clipa V. – Chișinău, IEFS, 2012. [2] Biroul Național de Statistică al Republicii Moldova. Anuarul Statistic al Republicii Moldova. Chișinău, 2013, 556 p. [3] Grigore Ana-Maria. 2011, Managementul micilor afaceri. Universitatea “Hyperion” din București. Ministerul Educației, Cercetării, Tineretului și Sportului. 2011. [4] Legea privind susținerea sectorului întreprinderilor mici și mijlocii: nr. 206 din 07.07.2006. În: Monitorul Oficial al Republicii Moldova. 2006, nr. 126-130. [5]Nicolescu O., Nicolescu, C., 2008, Antreprenorialul și Managementul întreprinderilor mici și mijlocii, Editura Economică, București, 2008, p.23. [6]Nielsen ,S. L., Klyver, K., Evald, M. R., Bager, T., 2013, Entrepreneurship in Theory and Practice. - Edward Elgar Publishing Inc., UK-USA [7] Storey, D.J., 1982, Entrepreneurship and the new firm. – L., Croom Helm, 1982. [8]Блинов, А., 1998, Малое предпринимательство. Организационные и правовые основы деятельности. – Москва [9]Браун, Г., 1997, Малые и средние предприятия в странах с переходной экономикой. – В кн.: Малый бизнес в СНГ и Восточной Европе: трудности роста (середина - вторая половина 90-х гг.) - Москва [10]Гэлбрэйт, Дж., 1976, Экономическая теория и цели общества. М. Прогресс- 390с. [11]Шумпетер, Й., 1982, Теория экономического развития. (Исследование предпринимательской прибыли, капитала, кредита, процента и цикла конъюнктуры). М.: Прогресс, 455 с.

Scientific Papers Series Management, Economic Engineering in Agriculture and Rural Development Vol. 14, Issue 2, 2014 PRINT ISSN 2284-7995, E-ISSN 2285-3952
273
SOME ASPECTS CONCERNING THE ACCOUNTING OF THE SUBSIDIES AWARDED TO AGRICULTURAL ENTITIES Tatiana ŞEVCIUC, Veronica PRISĂCARU The State Agrarian University of Moldova, 44 Mirceşti Street, MD-2049, Chişinău, the Republic of Moldova, Phone: + 37322432815, E-mail: [email protected] Corresponding author: [email protected] Abstract Subsidizing is the method that is argued by the followers of the free change. Anyway it is necessary as the means of orientation, adjustment and stimulation of some products and as the means of producers and consumers protection. The subsidies are given by the state in order to encourage those branches and sub-branches that are important for the state's economy. The biggest part of the budget expenses for subsidizing is given to agriculture. The subsidies are more oriented to agriculture because this branch is very important in the macroeconomic balance and in providing food security. This research aims to show some aspects concerning the accounting of the subsidies given to agricultural entities taking into account the provisions presented in NAS "Equity and liabilities" and in NAS "Accounting peculiarities in agriculture". To achieve this aim we'll expose the accounting of the subsidies related to biological fixed assets, the subsidies related to biological depreciable fixed assets. We will also examine the situations in which the subsidizing conditions don't comply with the prescribed rules. Key words: agricultural producers, biological fixed assets, income, reimbursement, subsidy INTRODUCTION
Subsidizing is a complex and coherent system of measures and practices used to stimulate economic growth and to protect national interests and local businesses. According to NAS "Equity and liabilities" (2013) subsidies are assistance offered by the Government, other public authorities, national and international organizations and institutions in the form of some transfers under the condition that the entity will respect certain requirements [3]. Today the conditions and the way of granting to agricultural entities are regulated by a number of legislative and regulatory acts, their requirements are to be respected unconditionally and to be reflected properly in the accounts system. Among these acts are the following: Vineyards and wine law (2006 with the completions and amendments to the Law no. 262 of 16.11.2012), National Accounting Standard "Equity and liabilities" (2013), National Accounting Standard "Accounting peculiarities in agriculture" (2013), The Regulation on the distribution of the funds to subsidize farmers (2013), etc. [2, 3, 5, 6]
However, the existing accounting methodology doesn't reveal the peculiarities of subsidies accounting because it doesn't correlate sufficiently with the actual organic law and it requires improvement. MATERIALS AND METHODS The researches in the field have been performed on the basis of the generalization of the problems, difficulties and uncertainties that appear when highlighting the economic transactions related to subsidies granting in the agricultural sector of the Republic of Moldova. The research pays special attention to the subsidies related to the assets that include the stimulation of the investments in the establishment and maintenance of perennial plantations of vineyards, orchards, fruit shrubs, wine and fruit nursery including nuts using modern technologies before putting them to service, agricultural machines and equipment, irrigation systems, frost and hail equipment, technological renovation of livestock farms, etc. We mostly used the monographic method of describing the accounting objects also

Scientific Papers Series Management, Economic Engineering in Agriculture and Rural Development Vol. 14, Issue 2, 2014 PRINT ISSN 2284-7995, E-ISSN 2285-3952
274
applying elements of comparison, induction and deduction. RESULTS AND DISCUSSIONS In the Republic of Moldova according to "The Regulation on the distribution of the funds to subsidize farmers"(2013) the distribution of the funds to subsidize farmers is carried out to support the following actions: to stimulate the lending to farmers by financial institutions, to stimulate production risk insurance in agriculture; to stimulate the investments in clearing perennial plantations that are subject to scrapping, in the establishment of perennial plantations and the promotion of wine production; to stimulate the investments in vegetable production on the protected land (winter greenhouses, solariums, tunnels); to stimulate the investments in the purchase of agricultural machinery and equipment, irrigation system equipment, frost and hail equipment; to stimulate the investments in technological renovation of livestock farms; to stimulate the purchase of animals for breeding and their genetic background maintenance; to stimulate the investments in post harvest and processing infrastructure; to stimulate land consolidation; to stimulate land irrigation (2013).By allocating fund resources the following objectives are to be obtained: 1) the increase of agricultural productivity and competitiveness; 2) the stimulation of the technological transfer and extension services; 3)the revenue increase of agricultural producers and poverty reduction; 4) extensive attraction of young farmers in the initiation and the development of agricultural activities in rural areas; 5) the efficient use of natural resources and the environment protection. A subsidy is recognized and is evaluated according to the provisions NAS "Equity and liabilities"(2013). An agricultural unit can benefit from the subsidies related to: a) the assets that include the stimulation of the investments in: - the establishment and maintenance of perennial plantations of vineyards, orchards,
fruit shrubs, wine and fruit nursery including nuts using modern technologies before putting them to service; - agricultural machines and equipment, irrigation systems, frost and hail equipment; - technological renovation of livestock farms; - the purchase of animals for breeding and their genetic background maintenance; - post harvest and processing infrastructure development; - vegetable production on the protected land (winter greenhouses, solariums, tunnels). b) the incomes as stimulus of: - ecological agriculture promotion and development; - agricultural producers compensating energy costs for irrigation and drainage; -the users of plant protection products (pesticide) and fertilizers (mineral fertilizers). c) partial or total pay off of the debts related to the stimulation of: -the lending to farmers by commercial banks, microfinance organizations and savings and loan associations; - risk insurance in agricultural production; - mandatory state social insurance, etc. An unconditional subsidy is recognized as a profit when it becomes a debt and is accounted by increasing the debt and special purpose financing. A conditional subsidy is recognized as income when the conditions imposed by the subsidy are met. The subsidies related to assets can be received in non-monetary form (fixed assets of biological and non-biological origin) or in monetary form. In any form the related subsidies can be received in order to create depreciable or non-depreciable assets. The subsidies related to biological fixed assets [4] are accounted as incomes based on the principle of concordance [1] with the depreciation amount accounted as expenses in one and the same time period during the life of the asset. So, the entity accounts: -the transfer of the expected long-term revenues conditioned by the subsidies into the expected current revenues by decreasing the expected long-term revenues and increasing the expected current revenues; - the calculation of the depreciation of the subsidized asset as costs increase and the

Scientific Papers Series Management, Economic Engineering in Agriculture and Rural Development Vol. 14, Issue 2, 2014 PRINT ISSN 2284-7995, E-ISSN 2285-3952
275
increase of the depreciation the biological fixed assets; -the recording of current revenues coming from subsidies as the decrease of the expected current revenues and the increase of the current revenue. The way of the accounting of the subsidy related to biological fixed assets (2013) is presented in the following critical examples: Example 1. In April 201N an entity established an orchard of apple grafted on vegetable rootstock of medium vigor with the density of 700 trees/ hectare on the surface of 8 hectare. The cost of orchard establishment and its nursing in the first year constitutes 161600 leis. In August 201N the agricultural entity receives the subsidy of 120000 leis. In December 201N+6 the orchard is received in service, the costs of trees nursing during the period 201N+1 - 201N+6 constitute 362500 leis. In the years 201N +5 and 201N+6 before receiving in service apples were harvested, they were evaluated at the net realizable value of 34100 leis. The exploitation period of the orchard was 25 years, the way of depreciation calculation- linear, the residual value-8500 leis. According to the example's data the entity will account: - 201N-201N+6: the recording of the costs related to the establishment and the nursing of the orchard equal to 524100 leis (161600 leis+362500 leis) as the increase of tangible assets under execution and the decrease of the stocks, indirect production costs, costs of ancillary activities, the increase of current liabilities and of the depreciation of fixed assets; - August 201N: the receipt of the subsidy of 120000 leis by increasing the cash, receivables and special purpose financing; - 201N+5-201N+6: entries registration of the obtained crop from young trees - 34100 leis as the products increase and the decrease of tangible assets under execution; - December 201N+6: entries registration at the category bearing apple orchard equal to 490000 leis (524100 leis -34100 leis) as the increase of biological fixed assets and the decrease of tangible assets under execution;
- December 201N+6: the transfer of special purpose financing and receivables in the expected long-term revenues equal to 120000 leis as the decrease of special purpose financing and receivables and the increase of the expected long-term revenues; - December 31 201N+6: the transfer of the share of the expected long-term revenue equal to 4800 leis (120000 leis 25 years) in the expected current revenue by the decrease of the expected long-term revenue and the increase of the expected current revenue; - 201N+7: the calculation of the orchard's depreciation from the subsidized amount at 4800 leis (120000 leis ÷25 years), unsubsidized 14460 leis [(490000 leis -120000 leis -8500 leis) 25 years] as the increase of current expenses and of the costs of orchard nursing at the respecting amounts and of the depreciation of biological fixed assets at the total amount -19260 leis [(490000 leis -8500 leis) 25 years]; - 201N+7: the registration of the revenue which comes from subsidy at the amount of 4800 leis as the decrease of expected current revenue and the increase of other current revenues. The subsidies related to biological non-depreciable assets (animals for breeding: primiparous cows, junks older than 12 months, boars and gilts aged 6-8 months, rams and he-goats, sheep and she-goats aged 6-20 months) are accounted as uniform income during the period occurred from subsidization without taking in consideration the correspondence principle between the expenses and the revenues. Example 2. On 1.04.201N an entity purchases 5 primiparous cows for breeding with the live weight of 2050 kg with the purchase value of 123000 leis, the cost of transports, accompanying and food during transportation constitute 2000 leis. On 1.07.201N the entity receives a subsidy at the amount of 82000 leis (2050 kg 40 leis). A subsidy beneficiary has no right to alienate the grant subject for 4 years. Let's accept that the entity has met all the subsidization conditions. According to the data of the example the subsidy beneficiary will account:

Scientific Papers Series Management, Economic Engineering in Agriculture and Rural Development Vol. 14, Issue 2, 2014 PRINT ISSN 2284-7995, E-ISSN 2285-3952
276
- 1.04.201N. The entry registration of primiparous cows at the amount of 125000 lei (123000+2000) as the increase of biological fixed assets, the decrease of stocks and the increase of current liabilities; - 1.07.201N. The receipt of the subsidy means at the amount of 82000 leis as the increase of the numbers and special purpose financing and receivables; - 1.07.201N. Subsidy recognition as expected revenues by decreasing special purpose financing and receivables to 82000 leis, the increase of the expected current revenues to 10250 leis (82000 leis 48 months 6) and the increase of the expected long-term revenues to 71750 leis, where 48- the number of months in 4 years; -1.07.201N-31.12.201N. The transfer of the expected current revenue to current revenue at the amount of 10250 leis as the decrease of the expected current revenue and the increase of the current revenue; -31.12.201N. The transfer of the share of the expected long-term revenue at the amount of 20500 leis (82000 leis 48 months 12) to the expected current revenue. In the year 201N+1 the amount of 20500 leis will be recognized as the current income of the business period. The subsidies related to revenues are accounted as revenues on the basis of the correspondence to the costs size (expenses) incurred during the previous, current or future periods. So, the entity will account: a) the receipt of the subsidy cash by increasing the cash and the expected current revenues; b) the recognition of the revenue in the amount of the costs (expenses) partially or totally subsidized and incurred as the decrease of the expected current revenues and the increase of the current revenues; c) the recognition of the expenses related to subsidization by increasing the expenses and the decrease of the costs. Example 3. In July 201N an entity consumed electricity to pump water from the centralized irrigation systems at the amount of 22000 leis excluding VAT to grow vegetable crops. In September 201N the entity receives a subsidy
amounting to 50% of the cost of the energy consumed - 11000 leis. According to the data of the example the entity will account: - July 201N. The registration of the electricity to the irrigation costs of the vegetable crops amounting to 22000 leis as the increase of the basic costs and of the current liabilities; - September 201N. The receipt of the granted subsidy amounting to 11000 leis as the cash increase and the increase of the expected current revenues; - September 201N. The recognition of the income from the subsidy as the decrease of the expected current revenues and the increase of the current revenues to 11000 leis; - September 201N. The registration of the expenses related to the subsidy to 11000 leis as the increase of the current expenses and the decrease of the basic activity costs. The subsidies related to partial or total payment of some debts are accounted as revenues in the amount prescribed by law in accordance with the amount of the expenses related to the subsidies. These subsidies are accounted as the decrease of the current liabilities and the increase of the current revenues. Simultaneously, the expenses related to the subsidy are also recognized as the increase of the current expenses and the decrease of the basic activity costs. Example 4. In 201N an entity ensured multiannual plantations and the expected harvest of vegetables for which insurance premiums are to be paid in the amount of 25000 leis. According to the law the entity pays 40% of the insurance premiums from its own means and 60% of the insurance premiums are paid by the state. According to the data of the example the entity will account: 1.The calculation of the insurance premiums in the amount of 25000 leis as the increase of the basic activity costs and of the current liabilities; 2.The payment of insurance premiums amounting to 10000 leis (25000 leis 0,4) as the decrease of the cash and the current liabilities; 3.Partial subsidization of the liabilities regarding the insurance premiums amounting

Scientific Papers Series Management, Economic Engineering in Agriculture and Rural Development Vol. 14, Issue 2, 2014 PRINT ISSN 2284-7995, E-ISSN 2285-3952
277
to 15000 leis (25000 leis-10000 leis) as the decrease of the liabilities related to the insurance and the increase of the current revenues; 4.The recognition of the expenses related to the subsidy for the insurance premiums amounting to 15000 leis as the increase of other current expenses and the decrease of the basic activity costs. The farmers, who alienated (sold, donated, exchanged, etc.), sacrificed the animals or grubbed the perennial plants by the established deadline, must repay the amount of the subsidy except the force majeure situations (floods, land slides, frost), anomalies confirmed in documents as established. The repayment of a subvention related to an asset is recorded as the decrease of the balance of the expected revenue with the repayable amount. The difference between the subsidy amount which is repaid and the expected revenues balance is immediately recognized as expenses. So, the repayment of a subsidy will be accounted as the decrease of the expected revenues, the increase of the current expenses and the cash decrease. Example 5. Using the data from the previous example let's suppose that the entity didn't meet the established conditions (sold 3 cows) and on 1.08.201N+3 it totally repays the subsidy amounting to 82000 leis. On this date the balance of the expected long-term revenues constitutes 11250 leis and the balance of the expected current revenues – 8541,70 leis. According to the data of the example the subsidy repayment will be accounted as: - the decrease of the expected long-term revenues-11250 leis; - the decrease of the expected current revenues-8541,70 leis; - the increase of the current liabilities-62208,30 leis; - the decrease of the cash to the total amount-82000 leis. The repayment of a subsidy related to revenues is accounted as the decrease of the expected current revenues. The difference that overcomes this postponed credit or in its absence- the subsidy amount that is to be
repaid is immediately recognized as current expenses. Example 6. In March 201N an entity purchases fertilizers, ammoniac powder-8000 kg amounting to 64000 leis, including VAT- 10667 leis and 6000 kg of mineral fertilizers „Nitrofosca” amounting to 84000 leis, including VAT – 14000 leis. In May the entity receives a subsidy in the amount of 10% of the fertilizers value without VAT which is 12333 leis [(64000 leis -10667 leis)+(84000 leis-14000 leis)] 0,1. In 201N the entity used for phytotechnical crops ammoniac ponder -5000 kg amounting to 33335 leis and mineral fertilizers „Nitrofosca” – 4000 kg amounting to 46668 leis, in total 80003 leis. The stock of the unused fertilizers was sold at a higher price than it was bought. As the entity didn't meet the subsidy conditions, the fertilizers, that were partially subsidized, were not used entirely to grow phytotechnical crops in August 201N, the granted subsidy was repaid. According to the data from the example the entity will account: 1.The entry recording of the purchased fertilizers as the stocks increase without VAT amounting to 123333 leis [(64000 leis –10667 leis)+(84000 leis -14000 leis)] and the increase of the current liability; 2.The receipt of the subsidy amounting to 12333 leis as the cash increase and the increase of the expected current revenues; 3.Fertilizers used for soil incorporation amounting to 80003 leis as the increase of the basic activities costs and the stocks decrease; 4.The recognition of the current revenue that comes from the subsidy amounting to 8000,30 leis (80003 leis 0,1) as the decrease of the expected current revenue and the increase of the current revenue; 5.The recognition of the expenses related to the subsidy amounting to 8000,30 leis by increasing current expenses and decreasing the basic activities costs; 6.August 201N. The subsidy repayment amounting to 12333 leis as: - the decrease of the expected current revenues 4332,70 leis (12333 leis -8000,30 leis);

Scientific Papers Series Management, Economic Engineering in Agriculture and Rural Development Vol. 14, Issue 2, 2014 PRINT ISSN 2284-7995, E-ISSN 2285-3952
278
- the increase of the current expenses - 8000,30 leis; - the cash decrease - 12333 leis. When putting in operation a vineyard (Vine and Wine Law, 2006with the completions and amendments to the Law no. 262 of 16.11.2012), irrigation systems, frost and hail installations (according to the documents), the share of the expected long-term revenue related to the subsidy attributable to the first year of operation, determined by the depreciation method, is transferred to the expected current revenues as the decrease of the expected long-term revenues an the increase of the expected current revenues. The revenues and the expenses related to the subsidy, previously recorded, are accounted as current revenues and current expenses at one and the same amount in one and the same reporting period the following way: 1) revenue- as the decrease of the expected current revenues and the increase of the current revenues; 2) expenses- as the simultaneous increase of the current expenses and the depreciation of biological fixed assets and the depreciation of tangible fixed assets(The regulation on receiving and recording revenues in the first year of perennial plantations vegetation, 1995.). Example 7. In April 201X an entity planted the vines, table grapes, on a surface of 10 hectares. On the 1st of August 201X the entity receives a subsidy of 250000 leis (10 hectares×25000 leis). On the 1st of July 201X+2 the entity receives in service the espalier installed at the price of 346500 leis. The vineyard is transferred to the category of fruit bearing on the 31st of December 201X+4 at the entry cost of 635700 leis. The entity establishes the useful life of the vineyard of 20 years and of the espalier-22,5 years, the residual value of the vine equals to zero, the residual value of the espalier is 69300 leis, and the depreciable amount is 277200 leis (346500 leis-69300 leis). The entity specified in its accounting politics the linear method of calculation of the vine and espalier's depreciation, beginning with the month when these assets were put in operation. The entity doesn't have frost and hail installations.
According to the data from the example the entity accounts: - In the period 201X-201X+4:the recording of the vine establishment, growing and caring costs at 635700 leis -as the increase of the biological fixed assets in progress, the increase of the depreciation of tangible and intangible assets, the increase of current liabilities and the decrease of stocks, auxiliary activities costs and indirect production costs; - On the 1st of July 201X+2: the entry record of the espalier at the price of 346500 leis- as the increase of tangible fixed assets and the decrease of the tangible assets in progress; the calculation of the monthly depreciation of the espalier amounting to 1026,67 leis [(277200 leis÷22,5 years)÷12 months] – as the increase of the biological fixed assets in progress and of the tangible assets depreciation. Totally, before the vine is put in exploitation the amount of the espalier's depreciation, included in its cost, constitutes 30800 leis (1026,67 leis×30 months), the not calculated depreciable value of the espalier at the moment, when the vine is transferred to the fruit bearing category, is of 246200 leis (277200 leis - 30800 leis). - On the 1st of August 201X+2: the receipt of the subsidy amounting to 250000 leis - as the increase of the cash and of the expected long-term revenues; - On 31.12.201X+4: the recording of the vine in exploitation amounting to 635700 leis – as the increase of the biological fixed assets and the decrease of the biological fixed assets in progress. There are determined: the depreciable value of the vine and of the espalier amounting to 881900 leis (635700 leis+246200 leis); the subsidy's share in the depreciable value of the vine and of the espalier (the law doesn't provide separate subsidization of these assets) – 0,28348 (250000 leis÷881900 leis); the depreciable value of the vine: - unsubsidized - 455492 leis [635700 leis - (635700 leis×0,28348)]; - subsidized - 180209 leis (635700 leis×0,28348).

Scientific Papers Series Management, Economic Engineering in Agriculture and Rural Development Vol. 14, Issue 2, 2014 PRINT ISSN 2284-7995, E-ISSN 2285-3952
279
the depreciable value of the espalier: - unsubsidized -176407 leis [246200 leis - (246200 leis×0,28348)]; - subsidized – 69793 leis (246200 leis - 0,28348). the transfer of the expected long-term revenue into the expected current revenue in the amount of 12500,04 leis (9010,44 leis + 3489,60 leis) – as the decrease of the expected long-term revenue and the increase of the expected current revenue; the recognition of the income from the subsidy in the amount of 1071,67 leis (750,87 leis+290,80 leis) – as the decrease of the expected current revenue and the increase of the current revenue. the calculation of the monthly depreciation of: - the vine– 2648,75 leis (635700 leis ÷ 20 years ÷ 12 months), including from the unsubsidized value – 1897,88 leis (455492 leis ÷20 years ÷12 months), from the subsidized value - 750,87 leis (180208 leis ÷ 20 years ÷12 months) - as the simultaneous increase of the basic activities costs - to 1897.88 leis, of the current expenses - to 750,87 leis and of the depreciation of the biological fixed assets - 2648,75 leis; - the espalier - 1025,83 leis (246200 leis ÷ 20 years ÷ 12 months), including from the unsubsidized value – 735,03 leis (176407 leis ÷20 years ÷12 months), from the subsidized value - 290,80 leis (69793 leis ÷ 20 years ÷12 months) – as the simultaneous increase of the basic activities costs - to 735,03 leis, of the current expenses - 290,80 leis and of the depreciation of the tangible assets - to 1025,83 leis. CONCLUSIONS An unconditioned subsidy is recognized as income when it becomes a debt and it is accounted by increasing the debt and the special purpose financing. A conditioned subsidy is recognized as income when the conditions of subsidy granting are met. The subsidies related to assets can be received in non-monetary form (biological and non-biological fixed assets) or in monetary form. Regardless of the form, the subsidies related
to assets can be received in order to create depreciable and non-depreciable assets. The subsidies related to biological fixed assets are accounted as incomes based on the compliance with the principle of consistency of the amount of depreciation calculated as expenses during one and the same business period over the useful life of the asset. The repayment of a subsidy related to revenues is accounted as the decrease of the expected current revenues. The difference that overcomes this postponed credit or in its absence- the amount of the subsidy, that is repaid, is immediately recognized as current expenses. REFERENCES [1]The Accounting Law no. 113-XVI of 27 April 2007. In: The Official Monitor of the Republic of Moldova no. 90-93 art. no: 399 (with the following completions and amendments). [2]Vine and Wine Law no. 57-XVI of 10 March 2006 with the completions and amendments to the Law no. 262 of 16.11.2012. In: The Official Monitor of the Republic of Moldova no. 75-78 art. no: 314. [3]National Accounting Standard „Equity and liabilities”. In: The Official Monitor of the Republic of Moldova. 2013, no. 233-237 (special edition). [4]National Accounting Standard „Accounting peculiarities in agriculture”. In: The Official Monitor of the Republic of Moldova. 2013, no. 233-237 (special edition). [5]The regulation on receiving and recording revenues in the first year of perennial plantations vegetation of 20 October 1995. In: The Official Monitor of the Republic of Moldova, no. 073. [6]The regulation on the distribution of the fund to subsidize farmers of 27.02.2013. In: The Official Monitor of the Republic of Moldova , no. 41, art. no. 184

Scientific Papers Series Management, Economic Engineering in Agriculture and Rural Development Vol. 14, Issue 2, 2014 PRINT ISSN 2284-7995, E-ISSN 2285-3952
280

Scientific Papers Series Management, Economic Engineering in Agriculture and Rural Development Vol. 14, Issue 2, 2014 PRINT ISSN 2284-7995, E-ISSN 2285-3952
281
THE ACCOUNTING OF THE PLEDGED ASSETS PASSED TO THE LICENSED BANKS FROM THE REPUBLIC OF MOLDOVA FOR THE REPAYMENT OF THE GRANTED LOAN
Tatiana ŞEVCIUC The State Agrarian University of Moldova, 44 Mirceşti Street, MD-2049, Chişinău, the Republic of Moldova, Phone: + 37322432815. E-mail: [email protected]
Corresponding author email: [email protected] Abstract In banking practice the pledge plays an important role, it is often used to denote the pledge agreement, as well as the real right that is the result of the pledge agreement conclusion and the good that is the object of the pledge. The pledge is the only real security interest in the range of bank guarantees. Actually, each obligation can be guaranteed by the pledging. Assets diversification and trade needs have led to the development of a new pledge form. Anyway, regardless of the number and content of the economic material, the licensed banks from the Republic of Moldova attach importance to the correctness of pledge accounting taking into account the deadline. Thus, this research aims to present the accounting of the pledged assets passed to the licensed banks from the Republic of Moldova for the repayment of the granted loan, taking into account the enforcement of the obligation secured by the pledge deadline, the right to possession of the pledged asset and not the least of its value. In the research there was mainly used the method of monographic study applying elements of observation, selection, induction and deduction. Key-words: bank, deadline, loan, pledge, value INTRODUCTION
Pledge is the only real estate guarantee in the range of bank guarantees. Each obligation may be guaranteed by forming a pledge. First of all a pledge is “the insured sequester of the poor people” [3]. Today in the Republic of Moldova the majority of licensed banks cannot give loans for a building built in the proportion of 30-40% because there is the risk to lose their investments. Another reason would be a different interpretation of the Law regarding pledge (2001, with subsequent amendments and supplements) and other legislative and normative acts, that is why judicial decree is delayed for years [3]. In addition, the population doesn’t trust real estate firms which often don’t commission the lodgings at the time stated by the contract. Thus, the way of accounting of the pledged goods, passed in the possession of the licensed banks of the Republic of Moldova in order to pay off the pledge, plays an important role. Accounting aspects aren’t researched and reflected in specialty literal sources, that’s why their opportunity is necessary and undisputed.
MATERIALS AND METHODS The researches have been carried out on the basis of problems and conflicts generalization appeared when implementing the actions plan which allows passing to the International Standards of Financial Reporting (IFRS)(2008, with subsequent amendments and supplements) of the Republic of Moldova. The methodological support of the researches is the Accounting Law no.113-XVI of the 27th of April 2007 (with the following amendments and supplements) (2007, with subsequent amendments and supplements), Financial Institutions Law no 550-XIII (1995, with subsequent amendments and supplements), the Law regarding pledge no 449 (2001, with subsequent amendments and supplements) [1,2, 3]. The information presented by the licensed banks JSC “Banca de Economii”, CB"Victoria Bank" JSC have served empirical basis of the researches. We mostly used the monographic method also applying elements of analysis, observation, selection, induction and deduction.

Scientific Papers Series Management, Economic Engineering in Agriculture and Rural Development Vol. 14, Issue 2, 2014 PRINT ISSN 2284-7995, E-ISSN 2285-3952
282
RESULTS AND DISCUSSIONS According to the Law regarding pledge, a pledge is a real guarantee on which basis the creditor pledger may track the pledged goods having priority over other creditors and over the state when satisfying the secured debt. The validity of the pledge depends on the validity of the liability secured by pledge, it is established on a mobile good or on a real estate good or an a university of mobile goods and real estate goods. The pledge of real estate goods is called mortgage. According to the legislation of the Republic of Moldova the object of the pledge may be money means in national currency and in foreign currency deposited to open accounts in banks, as well as in the form of jubilee and memorial metallic money (including the money that contains precious metal). The pledge of money means may be formed only by storing them (pawn). The creditor pledger has the right to be satisfied from the insurance indemnities for the destruction, loss or damage of the pledged goods and it doesn’t matter in whose favor this good has been pledged, unless the destruction, loss or damage happen, because of the creditor’s fault or if the pledge contract stipulates otherwise. The procedure of the pledge registration starts with the submission of a registration application to any notary who deals with Pledge Register. The registration application must contain: a)The identity of the debtor pledger and of the creditor pledger: first name, address and the identity card data – for natural persons; full name, headquarters and registration data – for legal persons; b)The identity of the pledge manager if there is one: first name, last name, address and the identity card data – for natural persons, full name, headquarters and registration data – for legal persons; c)Express agreement of the debtor pledger to form a pledge in creditor’s favor; d)The description of the pledged good; e)The essence, volume and the due date of the liability secured by the pledge and its maximum value without interests and expenses;
f)The pledge type; g)The prohibition to form the following pledge on the same good if the parties have agreed on that; h)The date of application submission; i)The signatures of the debtor pledger and the creditor pledger or of their representatives. Neither the debtor pledger nor the owner of the pledged good can destroy or damage the pledged good or diminish its value unless this happens naturally or in case of necessity. In case there is the danger of destruction or damage of the pledged good, the party, which owns it, is obliged to inform immediately the other party, the other party having the right to examine the good. According to the Law regarding the pledge (2001, with subsequent amendments and supplements), when the term of the pledged liability’s execution expires, the bank solves the problem concerning the orientation over the pledged object applying to the court or not. Having obtained the right of possession of the pledged good, the bank reflects these objects in group 1800 “Other assets”(The accounts plan of the accounting records in the licensed banks in the Republic of Moldova, with subsequent amendments and supplements, 1997) [4,5]. In case the credit has been passed to the decrease from the reduction account for the depreciation losses, the registration of the pledge as the bank’s possession is reflected by the following accounting formulas: Debit account 1811 “The assets passed in possession/ purchase for sale”. Credit account 5860 “The expenses for the depreciation of the credits and the payments related to credits”. So, the accounting registration of the pledge in the bank’s possession takes place at the least value of the assets passed as the exchange of the credits payment between the aggregate value of the debtor’s debt (credit’s balance, the interests calculated and reflected in the balance sheet, allowances, penalties and other debts related to the credit) and the real value (market value stated by a professional value) of the mentioned assets minus the actual costs generated by the sale (independent valuation, voluntary/ forced transmission, press

Scientific Papers Series Management, Economic Engineering in Agriculture and Rural Development Vol. 14, Issue 2, 2014 PRINT ISSN 2284-7995, E-ISSN 2285-3952
283
announcements, assets maintenance expenses etc.). Simultaneously, with the records mentioned below there are reflected: Coming out: account 7201 “Credits passed to decreases”, Coming out: account 7202 “Interests and allowances calculated at credits passed to decreases”, Coming out: account 7204 “Penalties calculated at credits passed to decreases”, Coming out: account 7205 “Penalties calculated at interests and allowances calculated at credits passed to decreases”, Coming out: account 7102 “Liabilities in the form of pledge agreements”, account 7103 “Pawn received”, account 7121 “Guarantees, securities and transfers received” – in the corresponding amounts of the insurances received according to the contracts. Coming out: account 7754 “Goods passed in possessions/ purchased for sale” – in the amount of the property taken in possession. In case when the credit hasn’t been passed before to the decreases from the reduction for depreciation losses account, the recording of the object of pledge to bank’s possession occurs by using the following accounting formulas in the following order: 1) Debit account 1811 “Assets passed in possession/purchased for sale”, credit respectively from groups accounts 1230-1530 – in credit’s amount; 2) Debit account 1811 “Assets passed in possession/ purchased for sale”, credit corresponding account of group 1700 “Calculated interest and other incomes that are to be received” – in the amount of the interest calculated and not paid; 3) Debit account 1811 “Assets passed in possession/ purchased for sale”, credit account 1758 “Calculated allowances related to interests” – in the amount of the allowances calculated and not paid; 4) Debit account 1811 “Assets passed in possession/ purchased for sale”,credit on account “Adjustment of credits value to depreciation cost”; 5) Debit account 1811 “Assets passed in possession/ purchased for sale”,credit account 4951 “Fines, penalties and other sanctions” -
in the amount of penalties to the interest calculated and not paid; 6) Debit account of group 1700 “Calculated interest and other incomes that are to be received”, credit account corresponding to groups 4230-4530 of the incomes related to interests for credits – in the amount of the increased interest calculated, not paid and simultaneous; 7) Debit account 1811 “Assets passed in possession/ purchased for sale”, creditaccount of group 1700 “Calculated interest and other incomes that are to be received”. As in the previous case, in this case the recording of the pledged goods passed in bank’s possession is carried out at the smallest amount (accounting value of the credit or real value minus the costs generated by pledge sale). Simultaneously with the mentioned above records, there are recorded: Coming out: account 7102 “Liabilities in the form of pledge agreements”, account 7103 “Pawn received”, account 7121 “Guarantees, securities and transfers received” – in the corresponding amounts of the insurances received according to the contracts. Entry: account 7754 “Goods passed in possession/ purchased for sale” – in the amount of the property taken in possession. According to the legislative provisions, in case when the means taken in possession don’t satisfy all the debts, the bank has the right to obtain the missing means by capitalizing other goods that belong to the debtor. In case it is impossible to obtain the amounts mentioned above by taking the debtor’s other property, the part not paid for credit debt is passed to decreases from the depreciation of granted credits account: Debit on account of the reduction for losses of the depreciation of the granted credit of the corresponding groups 1230-1530, credit account corresponding to groups 1230-1530 of the granted credits, credit account of group 1700 “Calculated interest and other incomes that are to be received”, credit account 1758 “Calculated allowances related to interests”, credit on account “Adjustment of credits value to depreciation cost”. Simultaneously, the amounts of the debts from the credit are reflected at the entry in

Scientific Papers Series Management, Economic Engineering in Agriculture and Rural Development Vol. 14, Issue 2, 2014 PRINT ISSN 2284-7995, E-ISSN 2285-3952
284
accounts memorandum 7201 “Credits passed to decreases”, 7202 “Interests and allowances calculated at credits passed to decreases”, 7204 “Penalties calculated at credits passed to decreases”, 7205 “Penalties calculated at interests and allowances calculated at credits passed to decreases”. For all the mentioned above cases, only when the debtor’s debts to the bank are paid completely, the following accounting record is made: Coming out: account 7101 “Liabilities in the form of credits agreements” – in the amount of the credit contract. The originals of the corresponding contracts are to be passed to credits department to be archived. CONCLUSIONS When the term of the pledged liability’s execution expires, thelicensed bank solves the problem concerning the orientation over the pledged object applying to the court or not. The licensed bank gets the right of the pledged object possession; it reflects these objects in group 1800 “Other assets”. In case when the credit has been already passed to decreases from the reduction account for the depreciation losses, the registration of the pledge as the bank’s possession is reflected by the accounting formulas. The accounting registration of the pledge in the bank’s possession takes place at the least value of the assets passed as the exchange of the credits payment between the aggregate value of the debtor’s debt (credit’s balance, the interests calculated and reflected in the balance sheet, allowances, penalties and other debts related to the credit) and the real value (market value stated by a professional evaluator) of the mentioned assets minus the actual costs generated by the sale (independent valuation, voluntary forced transmission, press announcements, assets maintenance expenses etc.). In case when the means taken in possession don’t satisfy all the debts, the licensed bank has the right to obtain the missing means by capitalizing other goods that belong to the debtor. In case it is impossible to obtain the amounts mentioned above by taking the debtor’s other property, the part not paid for
credit debt is passed to decreases from the depreciation of granted credits account. ACKNOWLEDGMENTS This research was worked out with the support of the Methodology Department representatives within the licensed banks JSC “Banca de Economii" and CB"VictoriaBank" JSC. REFERENCES [1]Accounting Law no. 113 – XVI from 27 April 2007. In: The Official Monitor of the Republic of Moldova, no. 90-93/399 from 29.06.2007 (with subsequent amendments and supplements). [2]Law on Financial Institutions no. 550 – XIII from 21 July 1995. In: The Official Monitor of the Republic of Moldova, 2011, no.78-81/199. [3]The Law regarding pledge no 449 from 30.07.2001. In: The Official Monitor of the Republic of Moldova, no. 120, art. No 863. [4]International Financial Reporting Standards. In: The Official Monitor of the Republic of Moldova, 2008 [5]The accounts plan of the accounting records in the licensed banks in the Republic of Moldova, 1997, no. 33-34/54 (with the subsequent amendments and supplements).

Scientific Papers Series Management, Economic Engineering in Agriculture and Rural Development Vol. 14, Issue 2, 2014 PRINT ISSN 2284-7995, E-ISSN 2285-3952
285
THE USE OF CAPITAL AND CONDITION OF ECONOMICALLY WEAK FARMS IN THE SELECTED CENTRAL AND EASTERN EUROPEAN COUNTRIES Aldona SKARŻYŃSKA, Irena AUGUSTYŃSKA-GRZYMEK, Łukasz ABRAMCZUK Institute of Agricultural and Food Economics – National Research Institute (IAFE-NRI), ul. Świętokrzyska 20, 00-950 Warsaw 1, E-mail: [email protected], [email protected], [email protected] Corresponding author: [email protected] Abstract This paper shows the economic situation of economically weak farms in 8 countries of Central and Eastern Europe (CEE) in 2010. The data were obtained from the survey on EU farms carried out under the FADN system. The study included countries in which economically weak farms were the dominant farm type (i.e. Bulgaria, Estonia, Hungary, Latvia, Lithuania, Poland, Romania and Slovakia). The aim of the study was to assess the economic performance of those farms and indicate advantages of the competing farm types. The analysis was performed in terms of total factor productivity, income levels, assets and debt level. The influence of CAP instruments on management efficiency was also demonstrated. The study found a high diversity in terms of production potential as well as financial condition of farms in particular countries, whereas one point of correspondence between farms is the prevalence of fixed assets, i.e. an excessive assets-to-area ratio, and the dominance of own capital in financing those assets. Romanian, Polish and Bulgarian farms are characterised by the highest efficiency of use of current outlays and, in turn, a lower cost of the production unit, which accounted for 66%, 86% and 87% of the output value respectively. In Latvia, Estonia and Slovenia, the costs exceeded the output value by 6%, 7% and 23% respectively and, as a result, the income of those farms was generated exclusively due to subsidies. Key words: asset structure, asset utilisation efficiency, income of economically weak farms INTRODUCTION According to the FADN study [1], the majority of Central and Eastern European (CEE) countries have an unfavourable farm structure in terms of economic power. The dominant farm types are very small and small farms, i.e. of economic size from EUR 2 thousand to EUR 25 thousand. In Poland, farms of these two classes of economic size amounted to 79.6% in 2010. Even higher percentages were recorded in Bulgaria (90.6%) and Romania (97.5%). These types did not constitute the majority of farms only in Slovakia and the Czech Republic. In those countries, only the second economic size class was represented, i.e. farms from EUR 8 thousand to EUR 25 thousand, accounting for 21.3% and 39.6% of farms in Slovakia and in the Czech Republic, respectively. The EU accession of Poland and other countries revitalised the economy of the entire agricultural sector. Considerable funds were allocated to agriculture. However, in
spite of numerous support schemes, farms from first two economic size classes (i.e. very small and small ones) faced a rather difficult situation [2]. The income levels of those farms are often too low to maintain satisfactory living standards for their users [3]. It is often possible to receive income only with subsidies to operating activity of farms. Consequently, farms reduce expenses on current assets but, most importantly, they reduce investment expenditure [4]. Economic weakness of those farms causes difficulties in obtaining investment credits. Little inclination of landholders towards external sources of financing (credits) is also noted in other countries, e.g. Romania or Bulgaria. High and fluctuating interest rates, strict requirements of banks concerning credit collateral and too short repayment period inconsistent with the specifics of agricultural production are believed to be main barriers to the use of investment credits by agricultural producers [5], [6], [7].

Scientific Papers Series Management, Economic Engineering in Agriculture and Rural Development Vol. 14, Issue 2, 2014 PRINT ISSN 2284-7995, E-ISSN 2285-3952
286
The study revealed that assets used for farm production are immobilised to a high degree. This is one of major barriers limiting possibilities of an effective use of assets owned. An asset structure dominated by current assets is more favourable for farms, as it improves their liquidity and, in turn, contributes to the increase of income [8], [9], [10]. Thus, management decisions should lead to an optimised use of current and fixed assets to achieve high economic performance and competitive advantage. As the farm asset value increases, so does the significance of asset management. As a result of the increasing mechanisation and the resulting increase in capital value per employee as well as the implementation of new technologies, making right decisions requires increasingly more expertise [11]. Unfortunately, some researchers indicate that CEE agriculture lacks appropriate qualifications and management skills, which is one of its weaknesses [12]. Sound asset management is particularly important in the case of economically weak farms, which are exposed to flawed performance to a greater extent than other farms. After the EU accession, numerous farmers from new Member States, including Poland, purchased many machines regardless of the size of the farm and potential capacity of the machinery. The majority of small farms in terms of utilised agricultural area (UAA) invested in used machinery, while farmers from larger farms purchased modern and expensive equipment [13]. In most cases, large farms in terms of UAA have a higher capital-to-labour ratio and lower assets-to-area ratio. Accordingly, their labour and land profitability rates are higher. Small farms, on the other hand, are characterised by a less favourable capital structure, which results in a lower profitability of own capital and lower asset management efficiency. As a result, the competitiveness of those farms is impaired [14]. Veveris et al. [15] proved that an unfavourable capital structure, combined with an expected increase in cost intensity of production, may cause a considerable decline
in the competitiveness of economically very small and small farms. Farmers should primarily seek more efficient utilisation of assets owned. The aim of this study was to show differences in productive capacity between economically very small and small farms in eight CEE countries. The study assessed economic performance of those farms, capital utilisation and development capacities, in particular propensity to invest. The remaining part of the paper is organised in the following manner. The Materials and Methods section presents data sources and methods employed in the analysis of results. The Results and Discussion section contains the findings of the study and their synthetic analysis. The final section of the paper, Conclusions, presents main conclusions arising from this study. MATERIALS AND METHODS The sample consisted of farms with the economic size of EUR 2 thousand to EUR 25 thousand (i.e. economically very small and small farms), which were deemed economically weak. The analysis employed data from 2010 (most up-to-date and accessible), collected and processed within the EU Farm Accountancy Data Network (FADN) [1]. FADN information is aggregated into the Standard Results Database, including the average values for groups of farms selected by economic size. Results for previous years are not presented due to the modification of Community Typology for Agricultural Holdings parameters. The study covered economically weak farms in eight CEE countries, i.e. Bulgaria, Estonia, Hungary, Latvia, Lithuania, Poland, Romania and Slovenia. The countries were selected due to the dominant share of economically weak farms (from EUR 2 thousand to EUR 25 thousand) in the total number of FADN sample (the share of those farms was from 69.0% in Estonia to 97.5% in Romania). Additional criteria included close proximity of the countries to Poland, which indicated similar conditions for agricultural

Scientific Papers Series Management, Economic Engineering in Agriculture and Rural Development Vol. 14, Issue 2, 2014 PRINT ISSN 2284-7995, E-ISSN 2285-3952
287
production, as well as the exact or similar date of the EU accession. Results of economically weak farms are shown for each country in tabular form. Particular items are to be interpreted as average results for two joint classes of economic size, i.e. very small and small farms. This means that calculations included the number of farms from both classes of economic size. The study employed the horizontal analysis, comparing parameters typical of economically weak farms in particular countries. The assessment covered farm resources i.e. utilised agricultural area, assets and labour. The study also analysed the capital-to-area ratio and capital-to-labour ratio, expressed by the relation of machinery and equipment value to UAA and the number of full-time workers respectively (AWU – Annual Work Unit, total labour input expressed in full-time person equivalents = 2200 hours/year). Total factor productivity, i.e. land, labour and capital, was the indicator of farm efficiency [16]. Total factor productivity was calculated as the relation of the output value to utilised agricultural area, the number of full-time workers and the total asset value of farms. The basic measure of economic performance and competitiveness of farms was farm income. However, in order to carry out the study according to the established aim, other data were also analysed, i.e. farm assets, its utilisation and debt level. The study employed the following indicators: fixed assets to current assets [ratio] =
fixed assets current assets
(1) the indicator of debt structure [%] =
long-term liabilitiesliabilities in total
(2)
Debt-to-equity [ratio] = liabilities in total
own capital
(3) Fixed assets to current assets ratio shows the degree of immobilisation of assets used for farm production. The higher the indicator
value, the longer the period of the immobilisation of the assets. If the indicator value exceeds 1.0, that indicates that the fixed asset value is higher than the current asset value. In that case, farms are less flexible in terms of restructuring and adapting to market transformations [17]. The debt structure indicator is a percentage ratio of the long-term liability value to the total liability value. The higher the indicator value, the more financially stable farms are [17]. The debt-to-equity ratio shows a percentage relation of the total liability value to the own capital value, i.e. total assets reduced by total liabilities. This indicator shows the financial risk of conducted activity. For small enterprises, including economically weak farms, the limit value is the ratio of 3:1, otherwise the risk is too high [18]. The assessment also included investment activity of farms, expressed by gross investment value (gross investment is the value of purchased and produced fixed assets, reduced by the value of assets sold and transferred) per 1 ha of UAA and EUR 100 of the total output value. The assessment also covered the rate of farms’ dependence on support in the form of subsidies. Thus, the impact of the CAP on economic performance of farms was determined. RESULTS AND DISCUSSIONS Analysis of farm resources Resources of a farm determine its productive capacity. In market economy conditions, in order to face new challenges farmers need to analyse occurring phenomena and properly manage their assets, i.e. farm resources. Data concerning agricultural land, farm assets and labour input were utilised to assess the differences between the farms studied in terms of the resources owned. The data shown in Table 1 imply that economically weak farms in eight CEE countries were characterised by a great diversity with regard to agricultural area (variation coefficient was 64.4%). The smallest farms in terms of UAA were found in Romania (5.2 ha) and Bulgaria (5.5 ha),

Scientific Papers Series Management, Economic Engineering in Agriculture and Rural Development Vol. 14, Issue 2, 2014 PRINT ISSN 2284-7995, E-ISSN 2285-3952
288
whereas the largest farms were in Estonia (33.6 ha) and Latvia (34.1 ha). There were also different types of ownership, with the highest share of own land in the total
agricultural area recorded in Poland (84.4%), Slovenia (76.1%) and Romania (74.6), and the lowest – in Bulgaria (28.2%). See Table 1.
Table 1. Characteristics of basic resources of economically weak farms in selected CEE countries in 2010
Specification
Utilised agricultural area (UAA) Assets Labour input
total area own land share
to total agricultural land
Total fixed assets to
total assets total input
hired labour to total input
[ha] [%] [EUR thousand] [%] [AWU] [%]
Bulgaria 5.5 28.2 23.23 60.5 1.8 30.3
Estonia 33.6 56.2 52.65 84.5 1.1 8.5
Hungary 17.6 69.0 62.40 66.8 0.8 23.4
Latvia 34.1 67.6 41.74 67.4 1.5 8.5
Lithuania 23.0 62.7 56.99 70.7 1.5 4.2
Poland 10.7 84.4 92.29 90.8 1.4 3.6
Romania 5.2 74.6 26.54 80.0 1.3 6.7
Slovenia 8.4 76.1 168.79 95.0 1.6 1.8
Source: Own compilation based on FADN EU (Farm Accountancy…, 2013). There is also a great diversity between countries in terms of asset value. The total asset value per farm reached from EUR 23.23 thousand in Bulgaria to EUR 168.79 thousand in Slovenia (the difference was 7.3-fold). In all countries, economically weak farms maintained higher fixed asset value than current asset value. The fixed asset to total asset ratio reached from 60.5% in Bulgarian farms to 95.0% in Slovenian farms. Such a high share of fixed assets is unfavourable, it generates high overhead costs and constitutes one of major barriers to efficient use of resources (for comparison, the fixed asset to total asset ratio for non-agricultural manufacturing companies is ca. 60%, and for service companies ca. 30% [16]). The adaptability of such farms to market situation changes is also lower. Their asset structure, however, stems from investment decisions taken much earlier. Some researchers stress the fact that there is an increased demand in fixed assets in agriculture, which entails a relatively high share of fixed assets, buildings as well as machinery and equipment in the asset structure [19]. Their total share [B+M] in the farms studied reached from 38.4% in Poland to 63.6% in Romania – Table 2. The specifics of agricultural production in particular countries also results in different
levels of farms' current assets. A higher number of production activities involve maintaining larger resources, whereas farm specialisation helps optimise their volume. In the farms studied, the current asset to total asset ratio reached from 5.0% in Slovenia to 39.5% in Bulgaria. While analysing the levels and structure of farm assets, it should be noted that they are determined by the natural character of cultivation and breeding processes in particular countries. As new technologies develop due to the scientific and technological progress, this dependence is declining. Nevertheless, it affects significantly the type of resources needed to conduct business activity. Fixed assets of farms consist of four basic groups, namely land [L], buildings [B], machinery [M] and breeding livestock [S] – Table 2. The higher the share of land and breeding livestock in the fixed asset structure, the better the chances of achieving a high output value, since land and breeding livestock constitute the productive part of farmers’ assets. The results indicate that in the majority of countries studied, the share of land remained high, amounting to 53.2–59.8%. The only exceptions were Lithuania and Romania (30.2%) and Bulgaria (34.1%), whose land share was considerably lower. All countries recorded a low share of

Scientific Papers Series Management, Economic Engineering in Agriculture and Rural Development Vol. 14, Issue 2, 2014 PRINT ISSN 2284-7995, E-ISSN 2285-3952
289
breeding livestock in the asset structure, reaching from 1.6% in Slovenia to 12.5% in Bulgaria. Table 2. Fixed asset structure of economically weak farms in selected CEE countries in 2010 (%)
Specification Land [L]
Buildings [B]
Machinery [M]
Livestock [S]
Bulgaria 34.1 27.2 26.2 12.5
Estonia 53.3 21.9 20.9 3.9
Hungary 53.2 23.3 20.8 2.7
Latvia 54.4 16.7 22.9 6.0
Lithuania 30.2 18.3 47.5 4.0
Poland 59.8 26.5 11.9 1.8
Romania 30.2 52.7 10.9 6.2
Slovenia 56.2 29.4 12.8 1.6
Legend: L – land, permanent crops and production quotas, B – buildings and fixed equipment, M – machinery, equipment and transport equipment, S – breeding livestock, female animals. Source: See Table 1. Labour force is another important farm resource. Expressed as the number of full-time workers (AWU), the highest employment was recorded in Bulgaria (1.8 AWU), and the lowest – in Hungary (0.8 AWU). Hired labour was used by farms to varying degrees, with the lowest share in the total employment in Slovenia (1.8%), and the highest – in Bulgaria (30.3%). See Table 1. In order to provide a more detailed analysis of differences in productive capacity between farms, the volume of selected resources was compared to utilised agricultural area and
labour input. The analysis used indicators concerning the assets-to-area ratio as well as capital-to-labour and capital-to-area ratios – Table 3. The highest total asset value per 100 ha of UAA was noted by economically weak farms in Slovenia (EUR 2000.93 thousand), followed by Polish farms (EUR 858.60 thousand). Those countries also recorded the highest capital-to-area ratio, which reflects the value of machinery and technical equipment per 100 ha of UAA. The values for Slovenia and Poland were EUR 243.39 thousand and EUR 93.09 thousand respectively, whereas in Latvia, where the ratio was the lowest, the value amounted to EUR 18.02 thousand. When set beside, the difference between the extremes was 13.5-fold. It should be added that the order of countries was identical in terms of total assets owned and the value of buildings with fixed equipment. In terms of the capital-to-area ratio, two countries changed their prior positions. Lithuania ranked among the group of countries with a higher capital-to-area ratio, while Romania joined the countries with a lower one. This is a favourable change for Lithuania, reflected by a high capital-to-labour ratio, which influences labour productivity.
Table 3. Assets of economically weak farms in selected CEE countries in 2010
Specification
Per 100 ha of UAA Per 1 AWU
total assets machinery and
technical equipment
buildings and fixed equipment
utilised agricultural area
machinery and technical
equipment
buildings and fixed equipment
[EUR thousand] [EUR thousand] [EUR thousand] [ha] [EUR thousand] [EUR thousand]
Bulgaria 422.11 64.60 67.27 3.1 2.02 2.10
Estonia 156.49 27.83 29.13 31.2 8.69 9.09
Hungary 355.07 49.09 55.02 21.1 10.37 11.62
Latvia 122.56 18.02 13.13 22.4 4.04 2.94
Lithuania 248.09 82.27 31.71 15.7 12.93 4.98
Poland 858.60 93.09 206.92 7.5 7.00 15.55
Romania 506.41 42.37 205.73 4.1 1.73 8.41
Slovenia 2000.93 243.39 557.40 5.3 12.86 29.44 Source: See Table 1.

Scientific Papers Series Management, Economic Engineering in Agriculture and Rural Development Vol. 14, Issue 2, 2014 PRINT ISSN 2284-7995, E-ISSN 2285-3952
290
The capital-to-labour ratio is the value of machinery and equipment per 1 full-time worker (1 AWU). This indicator confined within EUR 1.73 thousand in Romania and EUR 12.93 thousand in Lithuania, the difference was 7.5-fold. The capital-to-labour ratio corresponds to the share of machinery and other technical equipment in the fixed asset structure. This share was the lowest in Romanian farms (10.9%) and the highest in Lithuanian farms (47.5%). It should be added that the difference between the capital-to-labour ratio extremes is nearly two times lower than in the case of the capital-to-area ratio. Utilised agricultural area per 1 AWU was also assessed. This indicator did not exceed 10 ha in four countries (Bulgaria, Romania, Slovenia and Poland), whereas it amounted to 15.7–31.2 ha in the remaining ones (Lithuania, Hungary, Latvia and Estonia). The difference in farm area between the extremes was 10.1-fold – Table 3. The indicators utilised in the analysis helped to assess the capital-to-labour ratio, the level of which influences labour productivity. The study revealed that labour productivity measured by net value added (EUR thousand) per full-time worker was the highest in Hungary (7.72) and Estonia (6.25), and lower in Lithuania (4.17), Latvia (3.85), Poland (3.76) and Romania (3.26), while the lowest labour productivity was recorded in Slovenia (1.46) and Bulgaria (2.57). Generally, it may be stated that more favourable results were obtained in those countries, where utilised agricultural area per 1 AWU was higher. However, it is a much more complex problem in reality. The results of the study show that economic performance of farms is affected not only by the level of resources, but also by relations between them. Adequate production factors combined with inadequate relations do not guarantee good financial performance. Furthermore, excessive manufacturing component (machinery, buildings) leads to an increased cost intensity of production, as was the case with Slovenian farms, which, despite the highest productivity per ha (EUR 1,691 per 1 ha of UAA), achieved very low profitability
(EUR 241 per 1 ha of UAA). The key factor of the situation was high cost intensity of production (EUR 100 of the output value cost EUR 123), which primarily resulted from an excessive use of fixed assets in the production process – Table 4 and 5. A common phenomenon in agriculture is an asset structure incompatible with farming conditions. This may stem from the seasonal character of many farm works, whereby certain machines are only used for a few days per year. Hence, in order to increase production efficiency, one should aim for low unit costs to operate machinery by means of high annual operation, e.g. by collective use of machines. Similarly, if livestock buildings are not utilised rationally, leasing them may be a solution. A high assets-to-area ratio is not always favourable, it may be a sign of overinvestment, which leads to decreased management efficiency. Total factor productivity and farm income The findings shown in Table 4 prove that economically weak farms differ substantially in terms of land productivity, which was the highest in Slovenia (EUR 1,691 per 1 ha of UAA) and the lowest in Estonia (EUR 314 per 1 ha of UAA). The difference between the extremes was 5.4-fold. It is believed that land productivity was heavily influenced by technical capacity of plant and animal production. In the majority of the countries, the structure of the total output value was dominated by plant production (between 53.2% in Estonia and 76.9% in Hungary). Only three countries recorded a similar share of plant and animal production, namely Bulgaria (48.9 and 50.3% respectively), Latvia (46.5 and 46.0%) and Romania (49.3 and 50.4%). The difference between the extremes of the asset productivity indicator (output value per EUR 100 of assets in total) was 4.5-fold. The highest indicator value was noted in Bulgaria (EUR 36) and the lowest – in Slovenia (EUR 8). Farm assets had the greatest influence on the value of this indicator. Their value was the lowest in Bulgaria (EUR 23.23 thousand) and the highest in Slovenia (EUR 168.79 thousand).

Scientific Papers Series Management, Economic Engineering in Agriculture and Rural Development Vol. 14, Issue 2, 2014 PRINT ISSN 2284-7995, E-ISSN 2285-3952
291
The output value per full-time worker, which was the measure of labour productivity, showed the slightest variation – only 3.7-fold. The highest labour productivity was recorded in Hungary (EUR 17.64 thousand) and the lowest in Bulgaria (EUR 4.77 thousand). Labour input was the main differentiating factor in the farms studied – Table 4. Farm income is the economic result of agricultural activity. It determines the level of
satisfaction of consumption needs of the farmer’s family and farm development capacities. However, agricultural production is a complex process, and farm development, regardless of internal conditions arising from the quality and utilisation of productive capacity, i.e. land, labour and capital resources, is also determined by external factors arising from external impact on agriculture.
Table 4. Productivity and income of economically weak farms in selected CEE countries in 2010
Specification
Output value per: Farm income (including subsidies) per: Subsidies per:
1 ha of UAA
1 AWU EUR 100 of total assets
farm 1 ha of UAA
1 FWU EUR 100 of total costs
1 ha of UAA
1 FWU EUR 1 of
farm income
[EUR] [EUR thousand] [EUR] [EUR thousand] [EUR] [EUR thousand] [EUR] [EUR] [EUR thousand] [EUR]
Bulgaria 1528 4.77 36 2.90 527 2.36 40 329 1.47 0.62
Estonia 314 9.79 20 6.17 183 6.26 55 191 6.51 1.04
Hungary 835 17.64 24 5.08 289 7.98 38 239 6.58 0.83
Latvia 379 8.50 31 5.32 156 3.83 39 186 4.55 1.19
Lithuania 520 8.17 21 7.84 341 5.62 73 207 3.41 0.61
Poland 1050 7.89 12 4.96 462 3.60 51 336 2.62 0.73
Romania 1648 6.74 33 3.75 715 3.13 66 172 0.75 0.24
Slovenia 1691 8.93 8 2.03 241 1.30 12 673 3.62 2.79 Source: See Table 1. External impact has increased considerably since the EU accession of respective countries. Increase in farmers’ revenue is one of the objectives of the Common Agricultural Policy, it determines the achievement of competitive advantage as a precondition for the existence of farms in the future. In this regard, it should be stated that the most competitive were economically weak farms in Lithuania, where farm income (including subsidies) amounted to EUR 7.84 thousand. They were followed by farms from Estonia and Latvia, with farm income of EUR 6.17 thousand and EUR 5.32 thousand respectively. Bulgarian and Slovenian farms were the least competitive, with farm income of EUR 2.90 thousand and EUR 2.03 thousand respectively. Subsidies have a major influence on the income level of farms. However, their impact is determined by the value of economic surplus and the amount of subsidies granted. In this context, it should be noted that the relatively high competitiveness of Estonian
and Latvian farms was ensured entirely by subsidies. In both countries, farm income reduced by subsidies was negative (EUR -241 per farm in Estonia and EUR -1,006 per farm in Latvia), which means that costs were higher than the generated output value. Subsidies covered the production loss, while the remaining surplus generated some level of farm income. The amount of subsidies per EUR 1 of farm income was EUR 1.04 in Estonia and EUR 1.19 in Latvia. The situation was even more difficult for economically weak farms in Slovenia, where the amount of subsidies per EUR 1 of farm income amounted to as much as EUR 2.79. Accordingly, farmers’ loss at the income level reduced by subsidies was EUR 3,642, and the amount of subsidies was 2.8 times higher than farm income including subsidies. There are also wide variations in terms of farm income per 1 ha of UAA, as the measure of land profitability. The highest was achieved by farms in Romania (EUR 715). Compared to the lowest level in Latvia (EUR 156), the difference was 4.6-fold. High land profitability

Scientific Papers Series Management, Economic Engineering in Agriculture and Rural Development Vol. 14, Issue 2, 2014 PRINT ISSN 2284-7995, E-ISSN 2285-3952
292
of Romanian farms results from its high productivity (EUR 1,648 per 1 ha of UAA) and the lowest, when set beside the other countries, cost intensity of production (EUR 66 per EUR 100 of the output value). In Latvia, on the other hand, land productivity was relatively low (EUR 379), whereas the cost-to-output ratio was high (EUR 106) – Table 4 and 5. Farm income determines competitive advantage of farms, but at the same time, its value per 1 unit of full-time family labour (FWU) indicates the potential amount of expenditure on work of the farmer and the family members. According to the study, the highest income per 1 FWU was obtained in Hungary and Estonia (EUR 7.98 thousand and EUR 6.26 thousand respectively), and the lowest – in Bulgaria and Slovenia (EUR 2.36 thousand and EUR 1.30 thousand respectively). The results presented in Table 4 show that, depending on the country, the significance of subsidies received by the farmers differs as regards income generation of economically weak farms. They also indicate that the amount of subsidies is dependent on farm area. Subsidies for large farms in terms of UAA, e.g. in Estonia, Hungary or Lithuania, calculated per 1 unit of full-time family labour (1 FWU – Family Work Unit, labour input expressed in full-time workers = 2,200 hours/year), were a few times higher than in the case of smaller farms in terms of UAA i.e. in Bulgaria, Romania and Slovenia.
Therefore, subsidies are not equally profitable for all farms. Farm asset utilisation The calculation results shown in Table 5 describe production efficiency and asset utilisation efficiency. Costs are an important decision element in the production process, and their level depends mainly on the farmer. The farmer must decide how to use production factors in order to provide optimal output. The study revealed that the cost of generating a production unit in the countries analysed varies greatly depending on the country. The total costs of generating EUR 100 of the output value amounted to EUR 66 in Romania, and as much as EUR 123 in Slovenia. Similar was the case of Estonia and Latvia – the total costs exceeded the output value by 7 and 6%, respectively. Situation of economically weak farms in those countries was extremely poor, farmers sustained losses and, as mentioned before, the income was generated entirely by subsidies. It is estimated that the situation was heavily influenced by indirect costs incurred due to operating activity of farms, in particular the cost of fixed assets depreciation. The analysis of the share of depreciation cost in the total output value indicates that the cost of tangible assets amortisation had a relatively high share in both output value and total costs. This is indicative of excessive manufacturing component (buildings, machinery) – Table 5.
Table 5. Selected financial indicators of economically weak farms in selected CEE countries in 2010
Specification
Costs per EUR 100 of the output value
Depreciation cost to output value
Depreciation cost to total costs
Gross investment per: Fixed assets
to current assets
Debt structure indicator
Debt-to-equity
total direct 1 ha of UAA
EUR 100 of the output
value
[EUR] [EUR] [%] [%] [EUR] [EUR] [ratio] [%] [%]
Bulgaria 87 37 10.0 11.5 241 16 1.5 72.9 6.20
Estonia 107 36 20.1 18.8 66 21 5.4 56.5 13.88
Hungary 90 37 12.9 14.3 37 4 2.0 50.8 12.82
Latvia 106 47 16.9 15.9 3 1 2.1 74.8 11.70
Lithuania 90 34 24.9 27.6 226 43 2.4 51.2 5.44
Poland 86 35 22.4 26.1 76 7 9.8 66.4 2.21
Romania 66 35 9.6 14.6 67 4 4.0 82.9 0.03
Slovenia 123 45 40.5 33.1 574 34 18.9 97.7 0.88
Source: See Table 1.

Scientific Papers Series Management, Economic Engineering in Agriculture and Rural Development Vol. 14, Issue 2, 2014 PRINT ISSN 2284-7995, E-ISSN 2285-3952
293
Economically weak farms in all examined countries were characterised by small capacity to restructure and, consequently, to adjust to the changes in the surrounding. These points to the assets immobilization ratio, i.e. the relation between the fixed and current assets. The higher is the fixed assets to current assets ratio, the greater the amount of capital is engaged in a farm in a more or less fixed manner. Thus the higher is the relation of fixed costs to variable costs, known also as the operating leverage. This leads to a significant income variability, which means higher risk of running a farm. In the case of the examined farms the value of fixed assets exceeded the current assets 1.5-fold in Bulgaria to 18.9-fold in Slovenia. This relation is known as fixed assets to current assets ratio which was high also in Poland (9.8), Estonia (5.4) and Romania (4.0). Prevalence of fixed assets over current assets seriously hinders decision-making process concerning adjustments corresponding to the market signals. The essence of the problem lies in the right organisation of mutual proportions between both groups of assets to maximise expenditure on current assets with the use of the owned resources of fixed asset. Financial resources are necessary to restructure farms, including to make investments. In the researched farms investments were in general implemented from own capital, but it sometimes happened that necessary resources came also from credits. To assess the level of debt an indicator calculated as the relation between liabilities and the value of total assets was used. The highest level of debt per farm was noted in Estonia (12.2%), Hungary (11.4%) and Latvia (10.5%). It is evident that there is a positive correlation between the average UAA and debt level of farms (in countries of higher debt ratios of assets the average farm, in general, had at its disposal a greater UAA), this may prove that greater farms show greater capacity to diversify the sources of financing. It also proves the creativity of managers as regards obtaining external resources. Whereas in three countries, i.e.: Romania (0.03%), Slovenia (0.9%) and Poland (2.2%), where farmers used loans to a very limited degree
the debt level of farms was small. The fact that farmers only occasionally use loans is evidenced also by the indicators showing debt level of own capital of farms – Table 5. In all countries from the research sample the structure of liabilities was predominated by long-term loans that are usually used for investments. This may mean that there is a drive at development of farms since investment activity is one of the determinants of economic condition. It also points to adjustment of farms to the changing surrounding and new conditions. The share of long-term loans in total liabilities is from 50.8% in Hungary to 97.7% in Slovenia. The level of investment activity of researched farms was determined by referring gross investments to the UAA and the value of a farm's output. The studies showed that the value of investments per 1 ha of utilised agricultural area was the highest in the economically weakest farms of Slovenia (EUR 574), Bulgaria (EUR 241) and Lithuania (EUR 226), while the lowest in Latvia (EUR 2). It should be noted that Latvian farms had one of the highest levels of long-term debts, and thus potentially high skills in obtaining resources for investments. This means that this had to be investments of small value as compared to relatively significant area of farms (34.1 ha). As regards investment activity Lithuanian farms should be mentioned as they have considerable area (23.0 ha), but the value of investments per 1 ha of agricultural land was high – Table 5. Referring gross investments to the output value confirms the advantage of Lithuanian farms, per EUR 100 of output value there was EUR 43 investment expenditure. Slovenia was ranked second (EUR 34) and it was followed by Estonia (EUR 21) and Bulgaria (EUR 16). In the remaining countries this measure was significantly lower. In all countries there was less than EUR 100 investment expenditure per EUR 100 of output value. This situation shows market risk (price and cost) accompanying agricultural output. High output value does not guarantee satisfactory incomes, thus investment activity of farmers was not significant.

Scientific Papers Series Management, Economic Engineering in Agriculture and Rural Development Vol. 14, Issue 2, 2014 PRINT ISSN 2284-7995, E-ISSN 2285-3952
294
CONCLUSIONS In 2010, very small and small in economic terms farms, termed as economically weak farms, prevailed in the total number of farms represented in FADN surveys among eight countries of CEE (i.e. Bulgaria, Estonia, Hungary, Latvia, Lithuania and Poland, Romania and Slovenia). Economic condition of these farms was very different. This is partly caused by geographical location of respective countries, which is responsible for different climate and soil conditions to develop agricultural output, but external conditions of the agricultural sector surrounding and management skills of farmers also contributed thereto. The conducted studies allow to formulate final conclusions. The studies showed significant differentiation in the field of output potential that is at the disposal of farms in individual countries and in the area of financial results. Whereas excess of fixed assets in the assets of farms and clear dominance of the share of own capital in financing of the assets is their common trait. The structure of assets of Bulgarian, Hungarian, Latvian and Lithuanian farms was more advantageous than in the remaining countries given the lower share of own capital. This favours greater effectiveness of its use. The transformation capacity of Polish and Slovenian farms was several times lower, they were characterised by the greatest level of immobilization of assets engaged in output activity of farms, which means low efficiency of assets use. There is a clear dependency between the UUA and debt level of farms. Larger farms were more willing to diversify their sources of financing, which is an evidence of creativity of farmers as regards winning external resources. The highest level of debts of farms was noted in Estonia (12.2%), Hungary (11.4%) and Latvia (10.5%). Farms from Bulgaria (5.8%) and Lithuania (5.2%) had lower debt level, while in Poland (2.2%), Slovenia (0.9%) and Romania (0.03%) the level was the lowest. Low level of use of
external sources of financing is often caused by low credit worthiness of farms, but it may also follow from unwillingness of farmers to run a debt which is linked to legalities that need to be tackled and also from little sense of economic stabilisation of farms. Long-term loans most often intended for investments prevailed in the structure of liabilities of economically weak farms of all countries. This may imply a drive at further development and adjustment to new conditions. Lithuanian farms stand out as regards investment activity. This is evidenced by the high level of gross investments per 1 ha of UAA (EUR 226) and per EUR 100 of output value (EUR 43). Economically weak farms in Bulgaria, Poland and Romania are marked by the highest effectiveness of using current inputs and, consequently, lower cost of producing one output unit. It amounted, respectively, to 87, 86 and 66% of the output value. Whereas in Latvia, Estonia and Slovenia the costs exceeded the output value by 6, 7 and 23%, respectively. In three countries, i.e. Estonia, Latvia and Slovenia the income of economically weak farms was generated only due to subsidies to operational activity of farms. In Estonia there was EUR 1.04 of payments per EUR 1 of farm income (including payments), in Latvia – EUR 1.19, and in Slovenia as much as EUR 2.79. The highest income per family member employed full-time (1 FWU) was reached by farmers from Hungary and Estonia (EUR 7.98 thousand and EUR 6.26 thousand, respectively), and the lowest – from Bulgaria and Slovenia (EUR 2.36 thousand and EUR 1.30 thousand). In two last countries the level of payment per work of a farmer and his family members was several times lower. Economically weak farms in Estonia, Latvia and Lithuania were characterised by the highest level of absorption of subsidies available under CAP by unit of farm’s economic power. In large, in terms of area, Estonian farms the cost of producing one unit of economic power was funded by subsidies to operational activity of farm in 57%, in

Scientific Papers Series Management, Economic Engineering in Agriculture and Rural Development Vol. 14, Issue 2, 2014 PRINT ISSN 2284-7995, E-ISSN 2285-3952
295
Latvian farms in 46% and in Lithuanian – 44%. Whereas the lowest share of subsidies in costs of producing one unit of economic power was noted in small Bulgarian and Romanian farms, 25 and 16% respectively. This means that profitability of payments is not the same across all farms. In Estonia, Latvia and Lithuania the level of financing was much higher than in Bulgaria and Romania. The economic condition of small, in terms of area, farms is in general more difficult, since they are more prone to changes in the economic situation on the market. Thus actions should be flexible which will be manifested in readiness to make decisions concerning production and development that would be tailored to the market situation. Common trait of economically weak farms in all countries were characterised by too high assets-to-area ratio, which is an evidence of overinvestment. This stimulates increase in costs and, consequently, leads to deteriorating efficiency of farming. Farmers who want to earn their income from agricultural output in a long term should concentrate on implementing the low output costs strategy, at the same time, keeping the specific quality level of manufactured products. This statement is based on guidelines of the positioning school of management, whose most notable representative is Michael E. Porter (born 1947) – American economist, expert in the field of organisation and competition strategy. The representatives of this school paid special attention to the drawing up of competition strategy, which mainly consists in achieving the selected competitive advantage in order to reach the targeted competitive position. The competitive advantage is based on the resources of the enterprise and the ability to use them. REFERENCES [1]Farm Accountancy Data Network, 2013. http://ec.europa.eu/agriculture/rica (accessed: November 2013) [2]Klepacki B., 2010. The forms of supporting development in Agriculture and rural areas in Poland. Postępy Nauk Rolniczych, 2:5-10
[3]Zegar J.S., 2009. Struktura polskiego rolnictwa rodzinnego pod koniec pierwszej dekady XXI wieku [Strusture of the Polish family farming at the end of the first decade of the 21st century]. IERiGŻ-PIB, Warszawa [4]Józwiak W., 2009. Efektywność polskich gospodarstw rolnych. Problem czy nadzieja? [Efficiency of Polish farms. Problem or Hope?]. Wieś i Rolnictwo 1 (142):35-43 [5]Hertz T., 2009. The effect of nonfarm income on investment in Bulgarian family farming. Agricultural Economics, vol. 40, No 2:161–176 [6]Pfeiffer L., Lopez-Feldman A., Taylor E., 2009. Is off-farm income reforming the farm? Evidence from Mexico. Agricultural Economics, vol. 40, No 2:125–138 [7]Safavian M.S., Breitschopf B., Nagarajan G., Meyer R.L., 1998. Rural finance for private farm sector in Romania: Obstacles and Opportunities (Economics and Sociology, Occasional Paper No. 2514). Columbus, Ohio: The Ohio State University [8]Augustyńska-Grzymek I., Skarżyńska A., Abramczyk Ł., 2013. The pluriactive development of agricultural holdings in Poland with regard to the living standards of their users. Studies in Agricultural Economics, 115:26-24 [9]Skarżyńska A., Abramczuk Ł., Augustyńska-Grzymek I., Żekało M., Stalgiene A., 2013. The conditions of the development of dairy farms in Poland and Lithuania. Transformations in Business & Economics. vol. 12, No 1 (28):91-107 [10]Skarżyńska A., 2013. The opportunities of generating income at the parity level by farms specialising in milk production in Poland. Journal of Central European Agriculture, vol. 14(3):149-165. [11]Kay, R.D., Edwards W.M., Duffy P.A., 2012. Farm Management, McGraw-Hill, Singapore [12]Baum S., Weingarten P., 2004. Developments of rural economies in Central and Eastern Europe: an overview. Rural Areas and Development, 2:8-29 [13]Davidova S., Gorton M., Ratinger T., Zawalińska K., Iraizoz B., 2005. Farm productivity and profitability: A comperative analysis of selected new and existing EU member states. Comparative Economic Studies, 47:652-674 [14]Poczta W., Średzińska J., 2007. Wyniki produkcyjno-ekonomiczne i finansowe indywidualnych gospodarstw rolnych według ich wielkości ekonomicznej (na przykładzie regionu FADN Wielkopolska i Śląsk), [Production, economic and financial results in individual agricultural holdings according to their economic size (basing on example of Wielkopolska and Śląsk FADN region)]. Zeszyty Naukowe SGGW, 2 (17):433-443 [15]Veveris A., Leminae I., Krievina A., 2007. Efficiency analysis of agricultural sector in Latvia compared to other EU countries, based on FADN data. Economic Science for Rural Development Conference Proceedings, Issue 13:13-19 [16]Kozera M., Stefko O., Jąder K., 2009. Relacje majątkowe w gospodarstwach o zwierzęcych typach

Scientific Papers Series Management, Economic Engineering in Agriculture and Rural Development Vol. 14, Issue 2, 2014 PRINT ISSN 2284-7995, E-ISSN 2285-3952
296
rolniczych. [Assets relations in animal-type farms] Journal of Agribusiness and Rural Development, 4(14):115-124 [17]Nowak E., 2008. Analiza sprawozdań finansowych. [Analysis of the financial statements]. Polskie Wydawnictwo Ekonomiczne, Warszawa. [18]Sierpińska M., Jachna T., 1999. Ocena przedsiębiorstwa według standardów światowych. [Assessment of companies by world standards] Wydawnictwo Naukowe PWN, Warszawa [19]Stefko O., Jąder K., Kozera M., 2008. Relacje wybranych składników majątku i kapitału w gospodarstwach prowadzących produkcję roślinną w Polsce. [Relationships between selected property elements and capital in plant producing holdings in Poland] Ekonomika i Organizacja Gospodarki Żywnościowej, 69:135-142

Scientific Papers Series Management, Economic Engineering in Agriculture and Rural Development Vol. 14, Issue 2, 2014 PRINT ISSN 2284-7995, E-ISSN 2285-3952
297
NEW APPROACHES CONCERNING THE DEVELOPMENT OF THE ECOTOURISM IN ROMANIA Petrică ŞTEFAN, Silviu GHEORGHE, Cristian CUTAŞ University of Agronomic Sciences and Veterinary Medicine of Bucharest, 59 Mărăşti Blvd, District 1, 011464, Bucharest, Romania, Phone: +4021.318.25.64, Fax: + 4021.318.25.67. Corresponding author: [email protected] Abstract The hereby study undertakes to introduce the certification procedure in ecological tourism, as well as the criteria that must be fulfilled by the lodging units that wish to voluntarily adhere to this modern form of tourism. In our country, the Certifying System in the Ecotourism is used by the Romanian Association of Ecotourism (AER) and this adjusts the international experience to the Romanian context. This has been developed in conformity with the Accreditation Program in Nature and Ecotourism promoted by the Australian Association of Ecotourism (NEAP being the first accreditation system in ecological tourism) and in conformity with Nature’s Best of the Swedish Association of Ecotourism (the first accreditation system in Ecotourism in the northern hemisphere). A key element in the certification procedure consists of drawing up a plan of sustained development which should answer the entirety of certification requirements. The hereby study shows a model of sustained development plan that can be used by managers and owners of lodging units that wish to acquire the certification in tourism. Key words: action plan, certification system, ecotourism, management, principles of ecological tourism INTRODUCTION According to the Global Organization of Tourism, Ecotourism is a form of tourism where the tourist’s main motivation consists of observing and appreciating nature and local traditions related to nature that should fulfil the following conditions: -Nature conservation and protection; -Using the local human resources; -Educational character, consideration for nature – tourists and local communities’ alertness; -A minimal negative impact on the natural and social-cultural environment. We consider the development of a Certification System in Ecotourism as being imperatively needed – a mechanism that puts into practice the basic principles of Ecotourism in order to ensure the nature preservation and the sustained development of local communities through tourism. This is an important step taken forward given the fact that, starting with March, 2003, the Global Organization of Tourism has made a recommendation to governments to support initiatives that promote the certification in a sustained tourism (Bran, 2007). The Principles of Ecotourism
These principles are approved and promoted by the Romanian Association of Ecotourism (AER) and they are based on two international models: Nature and Ecotourism Accreditation Program developed by the Australian Ecotourism Association and Nature’s Best, the accreditation system promoted by the Swedish Ecotourism Association. These principles (as shown under Figure no. 1) must be put into practice both by those that develop ecotouristic products, as well as by those that plan the development of a certain area based on ecotourism.
Fig.1. The Principles of Ecotourism
THE PRINCIPLES OF ECOTOURISM
1.1. Focusing on natural areas
1.2. Interpretation of the ecotouristicproducts
The principle of durability
1.3. Contribution to preserving nature
Contribution to the development of local
communities
1.4. Tourists’ level of satisfaction
1.5. Adequate marketing

Scientific Papers Series Management, Economic Engineering in Agriculture and Rural Development Vol. 14, Issue 2, 2014 PRINT ISSN 2284-7995, E-ISSN 2285-3952
298
MATERIALS AND METHODS Focusing on natural areas – Ecotourism focuses on direct and personal experience in nature, in a natural environment and it is based on using it, respectively of its geo-morphological, biological, physical and cultural characteristics. Therefore, the accent on the natural area is fundamental in ecotourism planning, developing and management. Interpretation of the ecotouristic product – Ecotourism offers opportunities of experiences in the middle of nature that lead to a better understanding, appreciation and joy to discover and protect nature and local traditional culture, both for visitors, as well as for the local community. Ecotourism products are attractive to those tourists who are willing to interact with the natural environment and who wish to broaden their knowledge, comprehension, appreciation and pleasure to various levels. Those who develop and coordinate ecotouristic activities must offer an adequate level of comprehending the natural and cultural values of the visited areas, most commonly by using properly trained tourist guides and providing accurate information both prior as well as during the experience. The interpretation level and type are planned, designed and offered in such a manner so that it answers the customer’s interests, needs and expectations, by including a wide range of both personal and non-personal interpretation possibilities. Therewith, as far as the destination and the ecotouristic products are concerned, it is important to create the opportunity for the members of the local communities to gain access to information and interpretation offered by the ecotouristic program developed in the respective area (Creţu, 2012). The principle of durability seen from the perspective of protecting the natural habitat – The ecotourism activities and their planning must provide the best tourism and planning practices from the perspective of nature preservation and sustained development. The tourism activity must be planned and progressed so that it reduces the impact produced on nature. The ecotouristic
product unfolds and is administrated so that it preserves and capitalizes the natural and cultural environment where it exists, by acknowledging and putting into practice the practices that characterize the sustained tourism (Bran, 2005). Contribution to preserving nature – Ecotourism contributes in a positive manner to preserving natural areas. Ecotourism involves the participation to preserving the visited natural areas, by offering constructive possibilities for a reliable management and preserving these natural areas (e.g.: offering financial support within rehabilitation programs of natural areas, gathering waste left behind by tourists or contributing to preservation organizations). Constructive contribution to the development of local communities – Ecotourism offers durable contributions regarding local communities. Local community is often part of the ecotouristic product. Benefits of ecotourism must be allocated in their vast majority also to local communities. Local benefits can come from using local tourist guides, purchasing local goods and services and using local facilities. The ecotourism activities and their planning must ensure am attenuation of the negative impact on the local visited community and on their life style, by supplying in the same time long term constructive contributions for these communities. As a consequence, ecotourism must equally bring out the cultural component of the visited area and contribute to preserving this component (Honţuş, 2005). RESULTS AND DISCUSSIONS Tourists’ level of satisfaction – Ecotourism answers tourists’ expectations. In developing ecotouristic products, one should take into account that, generally speaking, potential tourists in this field have a high level of education and expectations. Therefore, the satisfaction level related to the ecotouristic product is essential, the experience offered fulfilling or even surpassing the tourists’ level of satisfaction. Adequate marketing – This regards carrying out an adequate marketing which results into

Scientific Papers Series Management, Economic Engineering in Agriculture and Rural Development Vol. 14, Issue 2, 2014 PRINT ISSN 2284-7995, E-ISSN 2285-3952
299
realistic expectations. Ecotourism marketing offers customers complete and accountable information which result into increasing respect for the cultural and natural environment of the visited areas and of tourists’ level of satisfaction. The Certification System in Ecotourism The Certification System in Ecotourism is enforced depending on two categories: -Ecotourism programs offered by tour-operators or tourist guides (maximum 15 participants); -Small guesthouses located in rural and natural areas (maximum 25 rooms). As far as guesthouses are concerned, the Certification System in Ecotourism involves the fulfilling of general principles and then of criteria which are checked and scored on site (Table 1). Table 1.The Certification System in Ecotourism GENERAL PRINCIPLES
CRITERIA
Principles of sustained management of the guesthouse
The criterion of demonstrating a sustained/long-lasting and efficient management of the guesthouse The criterion of implementing a sustained management system The criterion of observing the national and international relevant laws The criterion of personnel’s continuous training
Product focused principles
The criterion of focusing on natural areas The criterion of interpreting the ecotouristic product The durability criterion seen from the perspective of protecting the natural habitat The criterion of contribution to conservation The criterion of constructive contribution to developing local communities The sensitivity criterion towards culture and local traditions The criterion regarding the tourists’ level of satisfaction The criterion of adequate marketing
Source: http://eco-romania.ro - The Romanian Ecotourism Association Sustained Management Plan (PMD) – Content proposal
Vision - The guesthouse offers touristic services with a minimal impact on nature and aims for increasing the quality of life in the community to which it belongs by an adequate behaviour towards employees and promoting products, culture and local traditions. (The vision and goals of the guesthouse are part of PMD. The guesthouse has a vision which is in conformity with the principles of ecotourism.)
Fig.2. Elements of the sustained management plan
Goals: -Preserving natural resources and reducing the environmental impact; -Stimulating the development of the local community by hiring personnel from local communities and by promoting local traditions and culture; -Providing secure and good quality services; -Employees and tourists not only benefit of the confidence in their jobs, but also of the one in the activities they undertake. A.Preserving natural resources and diminishing the environmental impact can be achieved by cutting down water consumption, reducing the quantity of waste and garbage, lowering the energy consumption, reducing the impact on air, ground and water (Bran F., 2007). -In order to reduce the water consumption we suggest the following: the use of buttoned faucets and shower heads with low streaming; toilets to have recipients with controllable water stream; showers to be installed in bathrooms; using a small quantity of water for watering plants (water dripping systems or watering plants mainly during mornings or
Action plan
Goals
Vision
Sustained
management
plan

Scientific Papers Series Management, Economic Engineering in Agriculture and Rural Development Vol. 14, Issue 2, 2014 PRINT ISSN 2284-7995, E-ISSN 2285-3952
300
evenings); collecting rain water and using it for various activities; adopting other measures of cutting down the quantity of used water; displaying written warning for reducing the water consumption; encouraging customers to use towels over several days; connecting all touristic facilities to a draining system or introducing a water collecting, storing and treatment system or a system for evacuating residual waters towards a water treatment plant. -Diminishing the quantity of waste and garbage: purchasing materials so as to avoid packages in excess; try as much as possible to use bio-degradable packages; use only recipients which are re-usable or bio-degradable (e.g. glasses); use disposable items (utensils or recipients) only in special situations, maximum one time/person/stay; encourage both employees and tourists to take part in programs for collecting, recycling and diminishing the quantity of waste; collect and remove all noticed garbage; make composts of the organic waste; organize and subsidize (finance, labour, etc) cleaning days (at least once a year). -Reducing the energy consumption: use fluorescent light over 90% instead of incandescent light; rooms to be naturally ventilated; during day light, use exclusively the natural light (as much as possible); use solar energy; the waste of heat through windows and doors is diminished by an adequate sealing, the use of double windows and insulation strips; an employee trained in this direction is delegated with making the energy consumption more efficient; heat is produced and distributed through centralized installations; electrical equipment belongs to energy class A “energy efficient”; at least 50% of the building is made in wood or other natural material; tours, itineraries and schedules are planned so that the travel time and distances are diminished (including by avoiding crowded areas and rush hours); encourage tourists to use efficient transport from a fuel point of view (e.g. supplying information regarding public transportation, providing bikes for visiting tourist attractions); encourage employees to go on foot, by bike or by public transportation in
order to get to work; all vehicles are well maintained (technical check-up to date); when picking and/or buying vehicles we will make efficient choices from the fuel point of view; we will use vehicles that do not consume more than 10 litres/100 km (Tindeche, 2004). -Reducing the impact on air, ground and water: improvements and touristic activities (e.g. buildings, pathways) do not lead to remodelling the ground, changes of the rivers' courses, complete termination of vegetation, etc; we will use fences, undergrowths, barriers or other corresponding signs for maintaining traffic in the areas designated for various categories of users; waste is not stored away anywhere else but in special designated places; the regular level of the noise produced by the ensemble of activities related to the product (including telephones, public communication systems, transport operations, concerts, music, equipments and mechanical installations) does not significantly exceed the background noise of the area; servicing and maintenance units producing noise are placed at a distance from the quiet areas or they are soundproof. Note: Quiet areas are defined as the ones developed for recreation (e.g. bedrooms, parks, gardens, swimming pools, public baths); tourists are offered the possibility of enjoying the "nature's peace"; there are no annoying scents associated with polluting emissions in the air; the waste cremation is done only in a controlled manner and does not produce a visible degradation of the air. B.Stimulating the development of the local community by hiring personnel from the local communities and by promoting local traditions and culture. Stimulating the development of the local community is done by the following actions: The use of local tourist guides' services for showing off the significant local tourist attractions and for systematically training other tourist guides; The use of other natural persons' services on a local level (e.g. kitchen staff, transport, etc.); Encouraging the purchase of local products and souvenirs;

Scientific Papers Series Management, Economic Engineering in Agriculture and Rural Development Vol. 14, Issue 2, 2014 PRINT ISSN 2284-7995, E-ISSN 2285-3952
301
Using other local services: guesthouses; renting bikes, carts etc; Contributing financially for creating the local infrastructure and local events (e.g. festivals and other local traditional holidays); Offering the students/youngsters that live in the area the possibility for practising, in order to gain work experience in the ecotourism field. Promoting local traditions and culture: Informing tourists about the behaviour code that needs to be adopted inward the local community; Showing tourists the traditions of the area, encouraging the participation in traditional festivals; Serving specific food for the respective area especially; Buying local products as much as possible: souvenirs, food drinks, etc. (Beciu, 2011) C. Providing secure and good quality services: we have carried out a risk analysis that comprises the activities impacting on the environment and on the safety of work, as well as identifying the measures to counteract these risks; in unforeseen situations, there is a person responsible for removing the problem as soon as possible; tourists have access to a list of contact persons in case of emergencies that comprises: the fire fighting department; the administration of the natural habitat, mountain rescue, hospital and others; all the company's employees wear the "safety equipment" in cases when it is required; the correct use of the equipment is explained by the company's manager or by specialized companies/persons; at least one company employee is trained for giving the first aid and takes part in the activities that involve giving the first aid. The first aid set is available at any moment and it is located in an easily accessible place. D. Employees and tourists benefit both of the confidence in their jobs, as well as of the activities that they undertake: the company the all employees have insurances in conformity with the type of activities they undertake; participants in all activities get clear information about the insurances included in the company's product.
CONCLUSIONS The hereby study has shown the certification procedure in ecotourism, as well as the criteria that must be fulfilled by the lodging units that voluntarily wish to adhere to this modern type of tourism. In our country, the Certification System in Ecotourism is used by the Romanian Ecotourism Association (AER) which adapts the international experience to the existing context in Romania. A key element of the certification procedure is represented by drawing up a sustained management plan that should answer all certification requirements. The present study has shown a sustained management plan as a model that can be used by managers or owners of the lodging units that wish to acquire the certification in tourism. Guesthouses that implement the certification in tourism are presented with a series of benefits, such as: it allows customers to identify better those products that can offer amazing experiences related to nature and rural culture; contributes to increasing the level of confidence in Romanian ecotourism products on the international market; becomes a marketing instrument for tour-operators and guesthouses owners; guarantees a higher quality level of services; contributes actively to preserving nature and long-lasting development at a local level; supports local administrations in the protected areas with developing a form of tourism with a minimal impact; provides a platform for shared activities between the entrepreneurial sector and the nature preserving organizations. REFERENCES [1]Beciu, S., Popa, O.E., Nistor, Ş., Olteanu V., 2011, The Socio-Economic Dimension Of Rural Development For The North - East Region Of Romania. African Journal of Agricultural Research, ISSN 1991-637X.0 [2]Bran F., Bran P., Rădulescu C. V., Ioan I., Bran A. G., Creţu R. F., 2007, Models of economic and social development of the Romanian cities riparian of Danube, ASE Publishing House, Bucharest. [3]Bran, F., Creţu R. F., 2005, Economic and environmental problems of the Danube and Black Sea, ediţia a II-a, ASE Publishing House, Bucharest.

Scientific Papers Series Management, Economic Engineering in Agriculture and Rural Development Vol. 14, Issue 2, 2014 PRINT ISSN 2284-7995, E-ISSN 2285-3952
302
[4]Creţu, R. C., Ştefan, P., 2012, Agro Resources, CERES Publishing House, Bucharest. [5]Honţuş A., 2005, Agrotouristic planning of territory, CERES Publishing House, Bucharest. [6]Tindeche, C., 2004, Financial and economic analysis of the catering and agritourism units, CERES Publishing House, Bucharest. [7]National Institute of Statistics: „Romania Tourism-Statistical Summary” 2000-2013 [8]Country Vacations Magazine, 2005—20 [9]Country Vacations Magazine, 2010-2013 [10]http://eco-romania.ro [11]http://www.gov.ro/ministerul-mediului-si-schimbarilor-climatice [12]http://www.gov.ro/ministerul-dezvoltarii-regionale-i-administra-iei-publice.

Scientific Papers Series Management, Economic Engineering in Agriculture and Rural Development Vol. 14, Issue 2, 2014 PRINT ISSN 2284-7995, E-ISSN 2285-3952
303
THE METHODOLOGY OF DEVELOPING VALUE INDICATORS TO INTEGRALLY ASSESS RESOURCE POTENTIAL IN AGRICULTURAL UNITS
Elena TIMOFTI State Agrarian University of Moldova, 44 Mircesti St., MD - 2049, Chisinau, Republic of Moldova, Phone: +373 767 15 222, Fax: (+373 22) 31-22-76, E-mail:[email protected]
Corresponding author: [email protected] Abstract The problem of increasing the economic efficiency of resource use in agricultural production is very important. Its solution directly depends on the economic security of the country and its constant supply with agricultural products. There are three basic factors in agricultural production: nature (land), labour and capital, which have different measure units. Comparability is necessary to express the value of the integral potential that gives the possibility to take into account the main resources involved in producing and obtaining results from the agricultural sector. Key words: capital, indicators, integrated values, labour, land, potential resources INTRODUCTION The systematic approach to the economy presupposes the development of a system of indicators that reflect the main types of economic activities. The systematic nature of the approach provides coordination, coherence and harmonization of multiple indicators used to describe and analyze various aspects of the economic process. Management tools, techniques and methods should be selected according to their ability to provide research and use of some cognitive, decision making and communication competences that would facilitate the development of some organizational policies in accordance with the real complexity of the phenomenon of space management intervention.
MATERIALS AND METHODS Investigations on this topic have been focused on generalizing the opinion of scientific and practical solution of the problem: how to assess the integral resource potential in agricultural units. The method of estimating the value of the resource potential was preferred the most. We have also used the method of medium and relative values, the table method, etc. in our research.
RESULTS AND DISCUSSIONS Currently, when the competitive ENvironment is intensified and the corresponding agricultural units are adjusted to it, there appears the necessity to use a system of indicators specific to every activity branch, which leads to the promotion of innovative ideas with the positive influence on the whole agricultural unit activity. The quality of the indicator system and its ability to provide useful information in making decisions at the microeconomic level is essential in obtaining a comprehensive and effective diagnosis. The dynamics change of resource insurance: land, labour, fixed and current assets under the market economy conditions are different in each agricultural unit. Thus, they have different production directions and development branches. At present, the change of the size of the production potential in agricultural establishments in the Republic of Moldova largely depends on the influence of different trends to change production resources: firstly, it depends on the reduced efficiency of labour resources and agricultural parcels; secondly, it depends on the quantitative and qualitative changes of fixed and current production assets, etc. According to Petru Pantiru, D. Moldovanu, D. Ciucur, I. Gavrila, C. Popescu and N. Dobrota, production resources are represented

Scientific Papers Series Management, Economic Engineering in Agriculture and Rural Development Vol. 14, Issue 2, 2014 PRINT ISSN 2284-7995, E-ISSN 2285-3952
304
by the natural, material, financial and human potential which an agricultural unit has at a specific date and which are taken and used in the agricultural production process [6, p. 99; 5, p. 59; 3, p. 59; 4, p.94]. We agree with this opinion and it is worth noticing that the essence of management lies in the efficient use of scarce resources and protection of unlimited resources by using some combination and substitution methods and techniques based on the application of agricultural scientific research and economic rationales. The theoretical and methodological approach to assess the potential of agricultural units, which is discussed in the agricultural economic literature, allows to conclude that the production potential of agricultural units is the economic category that expresses the systematic feature of production forces as a totality of various combinations of production resources: land, capital (both fixed and current assets) and labour resources. However, the authors include only agricultural parcels, labour resources and production means in the resource potential. As to the composition of the resource potential, we believe that it would be rational to include material resources as well, which make significant part in the production potential and are extremely important within the outcome indicators. The authors propose different methods to scientifically and practically treat the problem of assessing the integral resource potential, such as: the one based on the calculation of statistical indicators, the method of values as well as economic-mathematical methods, which can help to determine the exact percentage of every resource. We would like to state our own point of view, taking into account the fact that partial resources are assessed in different measure units (the agricultural land – in hectares, fixed and current assets – in monetary units and labour resources – in natural indicators (people). To compare them (the area of the agricultural land and labour) one needs to assess them in value units. To assess the value of agricultural lands one should take into consideration the
quantification of their productive capacity by land evaluation. According to the Law on the normative price and land purchase and sale nr. 147-149 of 2001 [1], the value of agricultural land in the Republic of Moldova was assessed at a normative price of 289.53 lei per hectare. Therefore, the value of agricultural land at the republican level can be assessed as follows:
,
where: is the area of agricultural land
expressed in value (the value of agricultural land), thousand lei;
is the area of agricultural land expressed in hectares; B is the average grade of evaluation, hectares; P is the normative price for a hectare, lei. The studies on agricultural land zoning and evaluation have shown that production potential in the Republic of Moldova is assessed by an average grade of natural evaluation which equals 63 per hectare [2]. Due to the fact that regions, districts and agricultural units are located in different natural-climatic conditions, with the different soil fertility, we have determined the average grade of evaluation for every developing region of the country. Thus, agricultural lands in the North were marked with the highest average grade of evaluation – 70.0 per hectare, followed by the municipality of Chisinau – 64 per hectare, the Central region – 59.9 per hectare, the South – 59.2 per hectare and Gagauzia – 56 per hectare. We propose the following methodology to determine the value of agricultural land for every agricultural unit, district and region:
,
where: is the area of the agricultural cadastral land, i is an agricultural unit (district, region);
is the grade of evaluation (per hectare), i is an agricultural unit (district, region); The calculation of the differentiated agricultural land value by the proposed method takes into account the following main

Scientific Papers Series Management, Economic Engineering in Agriculture and Rural Development Vol. 14, Issue 2, 2014 PRINT ISSN 2284-7995, E-ISSN 2285-3952
305
components for every region (district, enterprise): -the absolute size of the agricultural land in each studied unit; -the soil quality; -the price of every differentiated hectare depending on the soil quality. The assessment of labour resources is possible through the annual average labour remuneration of a worker employed at the studied agricultural unit. This is explained by the fact that the increased level of labour remuneration should be subject to a greater amount of agricultural products. Therefore, the higher the level of annual labour remuneration of an average worker, the higher the value of human resources, so that of the corresponding potential. To assess the value of the integral resource potential there has been developed and is proposed to be implemented the following methodology in agricultural units expressed by the relation:
,
or + MF +
FR + Cm where: is the value of the integral
resource potential, thousand lei; is the value of agricultural land,
thousand lei / hectare; is the value of production means,
thousand lei; is the salary fund (the value
equivalent of the labour potential), thousand lei;
is material consumption, thousand lei. The value determination of the integral resource potential gives us the opportunity to consider the main resources involved in producing and obtaining results in the agricultural sector. According to the effect/effort relationship, the profitability of production factors is presented as the return of every separate resource or the total resource potential. According to the effect/effort relationship, the return of production factors is presented in the
form of resource capacity and expresses the resources needed to achieve a production unit (income, profit). Further, we have developed and propose for practical application the following activities of agricultural units: the indicator determination system, the use and analysis of the integral resource potential expressed in value as following: assuring companies and labour force with the integral resource potential, returns and the capacity of the resource potential, presented in Table 1. Table 1. The integral resource potential expressed in value and its indicators in Moldavian enterprises that have been developed and recommended
The indicators which act as
resources
Integral (global) indicators of using the resource potential
The value of agricultural land, thousand lei (Sa.v.) The value of production means, thousand lei (VMF) The labour remuneration fund, thousand lei (FR) (value equivalent of the labour potential) Material consumption, thousand lei (Cm) Value assessment of the integral resource potential in agriculture, thousand lei (VPR)
1. The integral intensity level in agriculture (assurance with the integral resource potential of an enterprise, thousand lei / ha (Nt))
2. The labour force assurance with the
integral resource potential, thousand lei / people (Îp)
3. The return of the integral resource
potential, lei (Rp)
4. The average capacity of the integral
resource potential, lei (Cp)
The source: developed by the author
CONCLUSIONS Research results allow us to determine the benefits of the developed methodology to assess the value of the integral resource potential: -The method in question is based on the comprehensive approach of assessing the potential of the resources used at enterprises;

Scientific Papers Series Management, Economic Engineering in Agriculture and Rural Development Vol. 14, Issue 2, 2014 PRINT ISSN 2284-7995, E-ISSN 2285-3952
306
-The assessment is performed based on the data published in specialized forms of enterprises, which are used in the traditional practice of resource assessment; -It is possible to assess the share of every resource in the total amount of the used resources; -It gives the possibility to identify the outcome level by the level of the integral resource use; -The overall comparability of indicators is preserved, because the latter are assessed in one and the same measure unit (value). REFERENCES [1]The Law on the normative price and land purchase and sale nr. 147-149 (with subsequent changes and annexations). – Chisinau, 2001, p. 9. [2]Land cadastre of the Republic of Moldova of November 1, 2005. Agentia Relatii Funciare si Cadastru a Republicii Moldova, Chisinau, 2006. [3]Ciucur, D., Gavrila, I., Popescu, C., 1999, Economia, Manual universitar, Editura Economica, Bucuresti, 321 p. [4]Dobrota, N., 2000, Economie politica, Bucuresti: Editura Economica, 495 p. [5]Moldovanu, D., 2005, Capitalism subteran sau economie de piata, Chisinau, 123 p. [6]Pantiru, P., 2003, Economie si politica agrara, Galati, 260 p.

Scientific Papers Series Management, Economic Engineering in Agriculture and Rural Development Vol. 14, Issue 2, 2014 PRINT ISSN 2284-7995, E-ISSN 2285-3952
307
ANALYSIS REGARDING THE THEORETICAL KNOWLEDGE OF MANAGEMENT HELD BY RURAL ENTREPRENEURS IN SOUTH-WEST OLTENIA REGION Victor TIŢA University of Agricultural Sciences and Veterinary Medicine Bucharest, Faculty of Management, Economic Engineering in Agriculture and Rural Development, Slatina Branch, 150 Strehareti Street, 230088, Slatina, Olt, Romania, Phone: 00 40 767 911 444. E-mail: [email protected] Corresponding author: [email protected] Abstract Investing in human capital and social infrastructure represents the most important concern for the great entrepreneurs in Romania, aiming to use the complete potential of women and men. The studies in this paper were performed in 2012 on a sample of 207 rural entrepreneurs, men and women, where there were pursued with management experts, their knowledge of the values, behavior and entrepreneurial motivations, about management knowledge and experience about mutual perceptions of business people. The information obtained was processed and stored electronically in order to improve the deficiencies found in rural areas, and to identify their trends in the labor market. Differences between regions of training, knowledge, perception, adaptation and acceptance of entrepreneurship training through courses made this research to be beneficial in order to take appropriate measures to increase the effectiveness of entrepreneurship in rural SW Oltenia. Key words: business, capital, entrepreneurship, labor market, management INTRODUCTION The rural economy of Romania is poorly diversified and depends too heavily on agriculture, dominated by subsistence farming and semi-subsistence farms producing mainly for own consumption and only marginal for market. The main demographic trends in Romanian rural population is declining and aging, due to both decreasing natural growth and migration phenomenon from rural to urban or abroad for young people.[1] In the country side, businesses are born heavier than in cities and die faster. [2] Low opportunities reinforce that managerial training occupies a minor place in order to acquire success. Therefore, the readings are even rare, and time which people from cities provide for their professional training, in rural areas is busy by work in the household.[3] Lack of entrepreneurship education is visible in the fact that there are very few rural people writing projects, accessing funds/capital and developing high level business.[4] When it comes to job instability we do not refer exclusively to the employment or
unemployment rate but rather we consider employment status, type of employment relationship, the level of job security, wage and economic dependency ratio. Thus, there are differences between regions with high standard of living which have a high share of employees and entrepreneurs and disadvantaged areas where there are few who have the courage to be entrepreneurs, managers, and business people in rural areas. MATERIALS AND METHODS For this research to be possible, there were selected 207 rural people, women and men who agreed to complete questionnaires about the entrepreneurial values, behavior and motivations, management knowledge and experience, mutual perceptions of business people.[5] To select the sample, it was taken into account the weight of the rural population in SW Oltenia region and agreed to provide a larger territorial dispersion. For each village chosen for research it was compiled a list of local entrepreneurs and potential entrepreneurs, based on the information

Scientific Papers Series Management, Economic Engineering in Agriculture and Rural Development Vol. 14, Issue 2, 2014 PRINT ISSN 2284-7995, E-ISSN 2285-3952
308
collected where it was studied entrepreneurial training needs which were combined with quantitative and qualitative research. Thus, a team of experts in local research was formed and along with the expert management team led to the completion of sociological study, where the first sample was divided as follows: 167 participants for quantitative research and 40 people for qualitative research, conducted by the focus group. The qualitative research was conducted in specially equipped rooms and was moderated by the authors of this report. The selection criteria for participants in the focus groups were random and participation was voluntary. Of the 207 participants interviewed 35% were women, and the level of preparedness/schooling of these participants was: - 27% are people with higher education; - 73% are persons with secondary education. RESULTS AND DISCUSSIONS As a result of completion of the questionnaires, suggested as questions, emerged problems faced by small businesses in rural areas. To the question: “Which is the main factor considered to prevent rural people, who start a business, to get rich?” the responses obtained were different, as follows:
Chart 1. The answer to the first question
To the question: ”How do you find most
business people of your county?”, responses were:
- 37.11% perceive them corrupt; - 46.54% perceive them doing business
with public money; - 45.28% considering them dependent
on politicians.
What is surprising is that potential entrepreneurs excel in allegations of corruption brought to businessmen, to those in whose guild they wish to enter.
Chart 2. The answer to the second question
Polling training needs through appropriate training program led to the question: “How would you rate your preparation in the following areas? Do you think you have information, very much, much, little or very little knowledge regarding ...?” Theoretical knowledge held by the target group in the fields of business management, highlighted by the responses to questions about personal training assessment in these areas, reveals unequivocal the need for improvement through adequate training program.
Chart 3. The answer to the third question
To the following question: ”In case of following courses, how much do you have used the knowledge acquired?”, the result of the survey was:

Scientific Papers Series Management, Economic Engineering in Agriculture and Rural Development Vol. 14, Issue 2, 2014 PRINT ISSN 2284-7995, E-ISSN 2285-3952
309
Chart 4. The answer to the fourth question
We are dealing with a little concerned group about the courses/trainings on entrepreneurial or management topics. The fact that 18,86% of the participants in the quantitative research have experienced a course/training on entrepreneurial topics relieve their perfecting entrepreneurial desire, so that the fifth question about: ”Have you attended training courses concerning entrepreneurial or management topics?”, the answers received were not satisfactory.
Chart 5. The answer to the fifth question
The entrepreneurs are inclined to consider themselves very trained in computer use and information technology, to believe that they know enough about drafting a business plan, about planning production/commercial activities and about what we consider to be financial management: earnings schedule, cost calculation, tracking stocks and production. Potential entrepreneurs are more inclined to assert ignorance in most investigated areas: the elaboration of a business plan, ways of contracting credit, financial management, the
planning of production/trade activities, strategic management and use of IT&C. Those with higher education tend to declare that they are very well trained in the ways of contracting credits, in terms of financial management, the access to EU funds and the use of IT&C, as well as developing a business plan, planning production/commercial activities and strategic management. Those with secondary education are more inclined to believe that they have little knowledge about the development of a business plan, a credit contraction and computer use. They tend to believe that they have very little or no knowledge about project management and accessing EU funds. From the perspective of the affiliation to a category, there aren’t many statistical associations with the degree of training on the various fields of management. However, men rather tend to consider their knowledge about planning the production/commercial activities as being very good and those about the ways of contacting a commercial credit and planning production/trade activities as being insufficient. Women tend to consider they have a very few knowledge about earnings schedule, the calculation of costs, tracking stocks and very low on the ways of contacting a commercial credit and the planning of production/trade activities.[6] An important factor in the assessment of entrepreneurial knowledge is the educational support given by abilities besides the managerial ones. CONCLUSIONS 1. Research highlights the fact that each person is unique. People, whether they are employers, potential entrepreneurs or managers, have different experiences, have lived different life situations, see the concepts in different ways, have knowledge more or less grounded, but all of them follow the success in life and by initiating and developing their own business they may obtain it. 2. Taking into the consideration the answers given by the target groups of the project, the distribution within each theme is different. The significance tests show that, beyond the

Scientific Papers Series Management, Economic Engineering in Agriculture and Rural Development Vol. 14, Issue 2, 2014 PRINT ISSN 2284-7995, E-ISSN 2285-3952
310
percentages, we have some association between the knowledge degree of the topics and respondents. 3.All those who have already entered the business world and all potential entrepreneurs who knock at the door of this world, have learned from experience to adapt to the changes, but the main key to the long-termed success, noticed by the participants in the sample survey, is the desire to continuously invest in their own training. 4.It is also necessary to adopt concrete measures conducive to reconciling professional work with private and family life, and men should be encouraged to take over some of the duties of family life. 5.The ensuring of long-term sustainability is made by encouraging the establishment or development of profitable non-farm businesses and improving the quality of human resources in rural areas/countryside. 6.The initiation of entrepreneurial courses concerning the possibility of the countryside to acquire theoretical and practical knowledge related to a specific field by using an innovative model will also develop the initiative and the ability to find new opportunities, to become pro-active and to act in response to unforeseen events. REFERENCES [1] Publications of EUROSTAT and National Institute for Statistics [2]“High job satisfaction but insecurity about pay and retirement” – European Foundation for the Improvement of Living and Working Conditions [4]“Romania Poverty Monitoring Analytical and Advisory Assistance Program” – World Bank [3] “Gender balance in work and family life” - European Foundation for the Improvement of Living and Working Conditions [5]Research Report - "Caravan of Rural Entrepreneurship", 2012 [6] “Measuring Gender (in)Equality: Introducing the Gender, Institutions and Development Data Base (GID)” – OECD, “Global Employment Trends for Women “ – ILO, “Women and men in OECD countries” – OECD.

Scientific Papers Series Management, Economic Engineering in Agriculture and Rural Development Vol. 14, Issue 2, 2014 PRINT ISSN 2284-7995, E-ISSN 2285-3952
311
INNOVATION POLICY IN AGRICULTURE AND RURAL DEVELOPMENT OF THE EUROPEAN UNION: PROSPECTS FOR THE REPUBLIC OF MOLDOVA Liudmila TODOROVA, Olga SÂRBU
State Agrarian University of Moldova, 42 Mircesti, District Rascani, MD-4224, Chisinau, Republic of Moldova, Phone: +373 22 432387, E-mail: [email protected], E-mail: [email protected] Corresponding author: [email protected] Abstract The future of the rural world has been the subject of much research in Europe and a large number of reports have been written on this subject. For the European Union, which aims to support rural development, it is essential to precisely define what a rural area is and even distinguish several different types of rural area. Rural areas are facing major challenges today which arise mainly from globalization, demographic change and the rural migration of young, well-trained people. Policies for rural areas aim to contribute to recognizing and making use of strengths and opportunities. Innovations have a direct influence on the level of welfare and satisfaction of each rural citizen and whole society. EU policies concerning innovations are aimed at transforming the European Union into a leading economy based on knowledge.
Key words: agricultural innovations, sustainable development, rural economy INTRODUCTION Agriculture continues to play an important role in rural areas, and in some regions it also contributes to economic growth. Small and medium-sized companies are certainly of even greater relevance, but many of them are again closely linked with agriculture in both upstream and downstream processes. In the member states of the European Union, over 90% of the agro-food production and processing is still done in a conventional (industrial) way. The European Commission, recognizing the social and environmental dysfunction of this solution (confirmed in the Eurostat research) promotes organic farming and the so-called integrated agriculture (modern extensive agriculture). It is this second model, more strongly linked to innovation and to some extent – at least in terms of applying innovative solutions – similar to the idea of “precision agriculture”, ultimately, can and should become a dominant in the integrated Europe. MATERIALS AND METHODS For revealing the problem scientific literature was used, Global Innovation Index and EU
official data, the National Bureau of Statistics of the Republic of Moldova data and data derived from research conducted by author. Based on accumulated data calculations were performed for analysis of the main directions of European innovation policy to support agricultural development. For data interpretation collected and calculations made analytical method was applied, calculation was made with tabular method and graphical method. RESULTS AND DISCUSSIONS In order to counter the negative trends of development, heightened by the world financial crisis of 2007, the European Commission at the beginning of 2010 proposed for the member countries of the European Union to adopt the Program Europe 2020, which inherently is a vision of a modern, social market economy in the 21st century. The new development strategy has a chance to provide a fast and stable social and economic development in Europe with high rates of employment, including building a modern, innovative and globally competitive European economy. Putting its essence

Scientific Papers Series Management, Economic Engineering in Agriculture and Rural Development Vol. 14, Issue 2, 2014 PRINT ISSN 2284-7995, E-ISSN 2285-3952
312
briefly, it should be emphasized that the Program Europe 2020 includes three interrelated priorities: Fig.1. Main directions of the European program "Europe 2020"[1] The European Commission proposed in this document the demarcation of several superior, measurable objectives of the EU to ensure the implementation of the following priorities [1]: -the employment rate of people aged 20–64 age group should be 75%, -on investment in research and development (R&D) it is appropriate to devote 3% of GDP of the Union, -to achieve the objectives of the climatic-energy package – ‘20/20/20’ (including the optional limit of carbon dioxide emissions by up to 30%), -the number of those leaving school early should be limited to 10% and at least 40% of the people of the younger generation should earn higher education, -number of people at risk of poverty must be reduced by 20 million. In the opinion of the European Commission, with which do not necessarily agree all the EU member countries, the social, economic and territorial cohesion policy can effectively contribute to solving the major problems lying at the sources of the poor performance of the European Union in the field of innovation. The Commission is publishing today a study analyzing the value of the EU name protection scheme for all food and agricultural products
("geographic indications" or "GIS"), including wines and spirits. [2] 60% of sales of European GI products took place in the country where these products originate, while 20% took place in other EU countries and a further 20% were exported outside of the EU. Extra-EU exports represented some €11.5 billion, mainly destined to the US (30%), Switzerland and Singapore (7% each), Canada, China, Japan and Hong-Kong (6% each). [6] Over the period 2005-2011, wines accounted for 56% of all sales of food and agricultural products with a protected name produced in the European Union (€30.4 billion), agricultural products and foodstuffs for 29% (€15.8 billion), spirit drinks for 15% (€8.1 billion) and aromatized wines for 0.1% (€31.3 million). As the European Commission underlines, the independent evaluations show that this policy had had previously a significant and generally positive macroeconomic impact, particularly in the less developed regions, with multiplier effect for the EU as a whole. In the opinion of the Commission, by mobilizing the existing growth potential in all regions, the cohesion policy influences the more balanced economic growth in geographical terms and the increase in the growth potential of the Union. [5] Table 1. Rural development in the EU – examples of actions to improve innovation in the European countryside Austria
The diversification of production – processingflax fiber
The received aid for the cultivation, harvesting and processing of fiber for the manufacture of thermal and sound insulation plates.
Denmark Competitiveness – the investment in the quality of the dairy production
The received aid for a dairy cooperative helped to modernize buildings, provide new devices and improve the quality control and the working environment.
France The diversification of farms – ecologic cultivation of aromatic and medicinal plants
The study work and investment aid allowed the creation of specialized agricultural holding with the cultivation of plants, processing and marketing and educational activities.
Germany The diversification of farms and local services – creating a home for children
The received aid for the conversion of barns into the house, providing social services, as well as creating alternative agricultural company.
The Netherlands The countryside renewal and diversification of rural area – bakery
The aid for the restoration of buildings and the creation of local bakeries: additional employment for the local population and improvement of amenities of life in the countryside.
Program “Europe 2020”
Intelligent development
Sustainable development
Development conducive to
social inclusionIntelligent
The development of a knowledge-based economy and innovation
Supporting the economy more efficiently using resources, more friendly and to the environment and more
Supporting the economy with a high level of employment, ensuring social and territorial cohesion.

Scientific Papers Series Management, Economic Engineering in Agriculture and Rural Development Vol. 14, Issue 2, 2014 PRINT ISSN 2284-7995, E-ISSN 2285-3952
313
If the European Union in the next decade is to achieve the ambitious objectives of the Program Europe 2020 [2], all its regions must contribute to it, and in particular those that have a higher potential for productivity growth and employment. The following EU schemes encourage diverse agricultural production, protect product names from misuse and imitation and help consumers by giving them information concerning the specific character of the products [3]: PDO - covers agricultural products and foodstuffs which are produced, processed and prepared in a given geographical area using recognized know-how. PGI - covers agricultural products and foodstuffs closely linked to the geographical area. At least one of the stages of production, processing or preparation takes place in the area. TSG - highlights traditional character, either in the composition or means of production Moreover – according to the Commission – this policy contributes to the strengthening of the economic and political integration, e.g. through the development of infrastructure network, improving the access to services of public interest, raising the level of professional skills in the Union population, increasing the accessibility of outermost regions (peripheral) and supporting of cooperation. An integral part of the European program of development for 2014 - 2020 years is the close cooperation with neighboring countries in the field of agricultural production and innovation. The agro-food sector plays a crucial role in Moldova, accounting in 2011 for 52 percent of total exports and 32 percent of exports to the EU, while the food processing industry ensures around 40 percent of country’s total industrial production. [4] Besides its economic role, the sector has a central social function, especially in rural areas having limited economic opportunities and more difficult living conditions: more than half of the rural population is employed in agriculture, which reveals its fundamental importance for human development of the
country. Due to its numerous social and economic ramifications and the possible negative competitive shocks on some local producers, farmers and workers, the liberalization of agricultural imports should be scheduled to take place over a longer period of time than in other sectors and even other countries, so that the producers will have more time to adjust and enhance their competitiveness. Low productivity and poor competitiveness on the European market magnify the economic and social vulnerability of the Moldovan agriculture. Despite the fact that its share in total employment is about 27.5 percent, the agricultural sector accounts for only around 12 percent of GDP. [4] Table 2. Competitiveness of the Moldovan agro-food Products on the EU market, RCA indexes in figures, year 2011 Products with competitive
advantages Products with competitive
disadvantages
Sunflower seeds 37.4Cigarettes containing tobacco
0.9
Sunflower seed oil 10.5Other food preparations containing cocoa
0.7
Edible nuts fresh, dried
8.0 Bread, pastry, cakes, biscuits and other bakers
0.5
Juices, other than citrus
5.3 Sugar confectionery (+ white chocolate)
0.5
Fruits, fresh, dried 4.8 Butter and other fats and oils derived from milk
0.3
Maize seed 4.2 Waters 0.3 Rape, colza, mustard seeds
3.3 Synthetic rubber 0.3
Molasses 3.0 Bulbs, cuttings, live plant
0.3
Grapes, fresh or dried 2.9 Food preparations containing cocoa
0.2
Bovine, equine hides, skin
1.6 Seeds, etc., for sowing 0.2 Milk concentrated of sweetened
0.1
Surprisingly, most of the agro-food products for which Moldovan firms are least competitive in comparison with European ones have a relatively high processing level (butter, pastry, cakes, biscuits, food preparations, sugar confectionery). This may pinpoint to the problems related to scarce capital, limited domestic production capacities and know-how, as well as poor compliance with international quality standards. Nevertheless, it is important to bear in mind that not all agro-food products lack competitiveness. Moldovan agro-food

Scientific Papers Series Management, Economic Engineering in Agriculture and Rural Development Vol. 14, Issue 2, 2014 PRINT ISSN 2284-7995, E-ISSN 2285-3952
314
products with high revealed comparative advantages are exported at a lower processing stage, serving in many cases as raw materials at the lower end of the production chains (e.g. maize seed, grapes, fruits, bovine skin). [6] Two important agro-food sectors are worth pointing out as they have significant unexplored potential: animal products and honey. Currently, Moldovan animal products are banned on the European markets, while honey products have been banned until 2012, due to non-compliance with sanitary and phytosanitary standards. However, once the domestic quality system are upgraded and the standards – adjusted, these products are most likely to display much higher revealed comparative advantage on the European market. This is going to be a costly and time consuming process, requiring consolidated efforts and frank commitment from Moldovan policy makers. Moldovan farmers should therefore acquire a good understanding of the production models of their peers in these countries in order to adopt the most competitive production and marketing strategies. The markets where Moldova will meet the fiercest competition are in wheat, barley, fresh fruits, jams, fruit jellies, marmalades, fruit or nut pastes, juices, spirits, skin of bovine, rape, colza and mustard seeds. Besides EU countries, Moldovan producers will face strong competition from several non-EU states: Ukraine, Turkey, China, USA, Australia, South Africa and New Zealand. Additionally, exporters of wines of fresh grapes, which are considered strategic for Moldova, compete with Bulgaria, France, Italy, Luxembourg, Portugal, Spain, Australia, Chile and South Africa. [5] Besides the fact that it squeezes the profit margins, such a tough competition on the European market serves as a strong entering barrier for small producers due to financial and technological constraints and higher unit costs. Since price is one of the crucial components of export competitiveness, it is worth comparing the export prices of the Moldovan producers with that of the main foreign exporters to the European market. For most of the top-10 exported items, Moldovan export
prices are lower in comparison with their European competitors. However, this does not necessarily mean that Moldovan exports are more competitive. Some of them indeed may benefit of lower production costs, given the cheaper domestic labor force and other inputs. At the same time, smaller prices may reveal lower quality of these products in comparison with their European counterparts. Additionally, in some cases, this might be the result of the marketing strategies of Moldovan firms aimed at stabilizing their segments on the European market. Table 3. Comparison of main Moldovan agro-food products exported to EU, year 2011
Commodity
Share in total
agro-food exports, %
Main export destinations,
% of total
Fresh and dried nuts
22.10 France (49.4), Greece (17.8), Austria (10.1)
Sunflower seed oil 12.60 Romania
(83.5)
Sunflower seeds 11.10 UK (39.3),
Romania (14.5)
Wine of fresh grapes
7.80 Poland (42.7),
Czech Rep. (22.1), Romania (10.1)
Other wheat and muslin
7.00 Romania (31,8),
UK (18,7) Barley, unmilled 6.10 Romania (54.2)
Fruit juices 5.90 Germany (37.8), Poland (28.3), Austria (24.7)
Rape, colza and mustard seeds
3.80 UK (63,8)
Maize, other 3.10 Italy (37,3),
Greece (29.5)
Dried fruit 1.70 Austria (43.7), Greece (19.5)
Table 3 reveals important changes in the structure of main items exported to the EU-27 in recent years. One can notice the decrease in wines share from 19.7 percent in 2006 to 7.8 percent in 2011, owing to Romania’s accession to EU in 2007, as well as to the rather modest sector performance over these years. [7] This is also the result of too many domestic structural and institutional barriers hampering the competitiveness of wine producers, as well as the intense competition on the European market, making the

Scientific Papers Series Management, Economic Engineering in Agriculture and Rural Development Vol. 14, Issue 2, 2014 PRINT ISSN 2284-7995, E-ISSN 2285-3952
315
diversification of exports away from Eastern markets a challenging task. However, the competition that Moldovan producers face on the European market is by far more intense with firms from the non-EU countries. [4] For instance, Chinese exporters have a price advantage in exporting apple juice to the EU markets; US export prices are lower for walnuts, as well as for hides and skins of cattle; Ukraine has an advantage in producing refined sunflower seed or safflower oil and has the same prices as Moldovan producers for crude sunflower seed or safflower oil, wheat and rape or colza seeds. The trade liberalization for the agro-food sector may bring both benefits and costs. In order to maximize the former and minimize the latter, the Government has to switch its policy priorities from protecting the domestic producers to enhancing their competitiveness through a better investment climate and higher compliance with EU standards. Additionally, a number of sub-sectors exist for which the trade liberalization should be much smoother in order to prevent eventual job cuts and foreclosures as a result of stronger competition with the European exporters. From the economic side, the Moldovan agricultural sector is mostly represented by micro-enterprises which face low competitiveness and productivity; from the social point of view, there are no viable alternatives for raising revenues in rural areas, except for agriculture, which exposes hundreds of thousands of people to a significant poverty risk. CONCLUSIONS The agricultural and rural policy of the EU in order to ensure an increase in its productivity in relation with the activities for the improvement of its quality and the protection of the ecosystem will require, which gives little doubts, significant subsidies also in the new financial perspective for the European Union for the years 2014–2020. A similar assertion concerns the cohesion policy resources used for the modernization and rural development of the European countryside.
The realization of the ambitious objectives of the Program Europe 2020 cannot and should not therefore be held at the expense of reducing the expenditure on the agricultural and cohesion funds, because its main objectives related to innovation can be successfully implemented in agriculture and in rural areas in Europe. So the relationship between the realizations of the ambitious objectives of the Program “Europe 2020” first exists, and second it is of bilateral nature. Indeed, it is difficult to imagine a vision of a modern European economy based on knowledge without taking into account the living and working conditions of millions of people employed in agriculture, agro-food processing industry or other professions of the countryside. Their proper development could in turn significantly affect the growth of aggregate GDP of the Communities. To harness the development potential of the deeper economic links with the EU, while reducing the related risks, the Moldovan Government and businesses have to consider a number of actions: -Despite the large amount of financial and technical resources, as well as time necessary to make the agro-food sector to align its international SPS standards, policy makers should consider as immediate priorities the adjustments of the quality standards for fruits and vegetables, which are among the most economically and socially important sectors. Introducing SPS in these sectors should not be financially very difficult, as standards are not very demanding. -Moldovan trade policy should concentrate on enhancing the competitiveness of Moldovan agro-food producers, rather than protecting domestic markets through tariff barriers under an indefinitely long time-horizon. Bringing the domestic standards in line with the international ones and enforcing the domestic quality infrastructure are the key actions necessary for tapping the export potential of Moldova’s agro-food sector. This is particularly related to SPS standards for meat products, dairy and live animals that are currently banned on the European market. As this is mainly related to low investments in the agro-food sector, increasing the

Scientific Papers Series Management, Economic Engineering in Agriculture and Rural Development Vol. 14, Issue 2, 2014 PRINT ISSN 2284-7995, E-ISSN 2285-3952
316
investment attractiveness of these sectors should be a key policy objective. -On a more technical, but still important aspect, it is necessary to relax the requirements for meeting the criteria of rules of origin for the EU market, which would have a significant contribution to the exploration of industrial sector’s export potential. This issue becomes even more crucial given the high importance of re-exports for the sector, especially for clothing and clothing accessories - the most important exported product category to EU. Therefore, it is necessary for Moldova to adhere to the Pan-Euro-Med cumulating of origin system, which could ease the access of Moldovan producers on the European market. -In the case of agricultural goods, Moldova can accept quite short transition periods of up to 3 years for such products like cereals, hides, skins, furs, oilseed, and oleaginous fruits. The longest transition periods (around 10 years) are advisable for some agro-food products, including butter, pastry, cakes, biscuits, food preparations and sugar confectionery. And there is a group of in-between products, which are quite competitively produced by Moldova but at the same time are going to meet equally competitive products originating from the EU, including wine, spirits, vegetable preparations, tobacco products, jams and other products. For these products, a transition period towards full trade liberalization should be shorter than for those with comparative disadvantages, but longer than for products with comparative advantages and target the interval of 4-7 years. REFERENCES [1] Babiak, J., Baczko, T., 2011, European Innovation: Theory and Practice. Warsaw – Brussels, 2011, p. 90 – 109 [2]Making public support for innovation in the EU more effective. Commission Staff Working Document, 2009. [3]Reinvent Europe through innovation. European Commission Report. Enterprise and Industry, 2010. [4] European Aspirations and Human Development of the Republic of Moldova: National Human Development Report. ed.: Alison Mutler. – Chisinau, 2012, p. 52 - 58
[5]The Global Innovation Index 2011: Accelerating Growth and Development, INSEAD, 2011. [6] World Investment Report 2011: Non-Equity Modes of International Production and Development. [7]National Bureau of Statistics of the Republic of Moldova, 2010 - 2011.

Scientific Papers Series Management, Economic Engineering in Agriculture and Rural Development Vol. 14, Issue 2, 2014 PRINT ISSN 2284-7995, E-ISSN 2285-3952
317
IMPORTANCE OF ECONOMIC KNOWLEDGE TRANSFER FOR SUPPORTING OF TOTAL ABSORTION GRANTS BY SEMI SUBSISTENCE FARMS Camelia TOMA, Crina TURTOI, Camelia GAVRILESCU Institute of Agricultural Economics, Romanian Academy, 13, Calea 13 Septembrie, District 5, 050711,Bucharest, Romania, Phone/fax: +40213182411, Email: [email protected], http: //www.eadr.ro Corresponding author: [email protected] Abstract In Romania semi-subsistence agriculture prevails and is rich in rural human resources, in terms of numbers, but still poor in terms of their quality and professionalism. Therefore, increasing the competitiveness of semi-subsistence farms may be achieved also through the educational enhancement (technological, economic and managerial) of the small farmers. Measure 141 "Supporting semi – subsistence farms" aims to increase the production volume for marketing and diversification of the production according to market requirements and, as well, to introduce new products, in the endeavors for semi-subsistence farms to become economically viable. This research study is based on a brief analysis of the official data on the progress of Measure 141, as well as on a quantitative and qualitative analysis of a sample of over 1,000 farmers involved in semi-subsistence farming, who are carrying out projects under this measure and have attended lectures on information and professional training in economics. The sample was stratified by various socio-professional criteria and selected by statistical step, representing 30% of the studied population segment. All these criteria were correlated and analyzed according to the minimum initial knowledge of farmers at the beginning of the course, in the single-entry bookkeeping, after a period of at least two years after implementation. Due to the highly heterogeneous level of education, in many cases non-agricultural and without economic knowledge, small authorized farmers were forced by the newly created circumstances to adapt and cope on-going, more or less correctly and thoroughly, to the new accounting, tax and management requirements. For many farmers, information and professional training, especially in the single-entry bookkeeping, were provided often too late, in the third year of the project, so they it marked the proper use of the financial support and the quality of the farm management and marketing of agricultural products. From data and information analysis it resulted that a large part of farmers who accessed Measure 141 failed to meet intermediate verification of project implementation, especially in the absence of part or all of the simple-entry bookkeeping needed for transposing the business plans for the first three years and lead to the early finalizing of the financing projects. Key words: Measure 141, professional training, semi-subsistence farms, simple-entry bookkeeping INTRODUCTION The objectives targeting agricultural and forestry yields and market potentiality increase can be also met, together with the investments in irrigations and other production factors, by educational (technological and managerial) improvements of small farmers from the semi-subsistence farms. Taking into consideration that the farming sector and the rural economy are exposed to the competition pressure of the single market, under NRDP 2007-2013, Measure 141 “Support of semi-subsistence agricultural farms” targets the increase of competitiveness of agricultural holdings under restructuring,
expressed by the increase of production that goes to marketing, production diversification according to the market needs and introducing new products, so that the semi-subsistence farms can become economically viable. In Romania, out of a potential of 350 thousand semi-subsistence farms of 2-8 ESU, (Gross Margin value from 2400 € to 9600 €), more than 20% benefit from financial support under Measure 141, having in view their transformation into commercially-oriented farms. One of the conditions imposed by the authorities for having access to EU funds under this Measure is the authorization as non-legal entities of farmers according to Government’s Ordinance 44/2008, under one of the following organization forms: certified

Scientific Papers Series Management, Economic Engineering in Agriculture and Rural Development Vol. 14, Issue 2, 2014 PRINT ISSN 2284-7995, E-ISSN 2285-3952
318
natural persons (CNP), individual enterprises (IE), family enterprises (FE). The eligible projects benefit from financial support worth 7500 €, (1500 €/year) with complying with certain criteria that have to be met, among which a viable 5-year business plan fulfillment. The non-fulfillment of business plan on the first 3 years does not entail any financial responsibility as regards repaying the first 4500 € spent by the farmers. Yet, for obtaining the other 3000 € for the years 4 and 5, farmers are subject to rigorous technical and financial checkups of the activity in the first three years. These have to prove entrepreneurial skills in increasing the farm economic viability, in conformity with the business plan, by increasing the marketed production by at least 20% and/or the enlargement of operated areas and/or of livestock herds. At the same time, farmers have to participate to an information and vocational training course in the first 3 years. In case these criteria are not met, the projects will be interrupted, and farmers will not receive the tranches for years 4 and 5. Farmers’ certification according to Government’s Ordinance 44/2008 also presupposes the utilization of technical-economic and fiscal knowledge for the organization and management of single-entry bookkeeping, which should reflect the fulfillment of business plan. Up to the present moment, there are no exhaustive statistical information with public character in the concrete aspects with regard to: (i) minimum socio-professional skills necessary for the initiation and implementation of projects from the economic and managerial point of view, (ii) farmers’ interest in increasing their activity competitiveness and efficiency on the market, (iii) the number of projects that met all the necessary criteria to qualify for funding years 4 and 5 or who completed the projects. The paper attempts to investigate and interpret some of the presented problems. MATERIALS AND METHODS The paper is based, on one hand, on an analysis focused on the statistical data regarding the implementation and funding of
Measure 141, presented in the Report on NRDP 2007-2013 progress and current situation of payments effected by the Agency of Payments for Rural Development and Fisheries under the Ministry of Agriculture and Rural Development; on the other hand, it is based on a quantitative and qualitative analysis of a sample of 1000 semi-subsistence farmers from Dâmbovița county, who accessed Measure 141 and who attended information and vocational training course in the field of economics. The purpose of the analysis was to obtain additional and complementary information on the farmers’ socio-professional and behavioral potential, which could help the investigation and data interpretation. The sample was stratified according to different criteria: activity field, gender, different age groups of farm heads, agricultural or non-agricultural training level, education, skills, etc. All these criteria were correlated and analyzed I relation to the minimum levels of farmers’ accountancy knowledge, after at least two years from the beginning of project implementation. The sample was constructed on a random basis by statistical step, from the lists designed by the organizers of the course, depending on the order in which the farmers concluded the funding contracts RESULTS AND DISCUSSIONS The restructuring of semi-subsistence farms and the stimulating the sale on the market of a significant part from the obtained production are the main objectives of the non-refundable financial support from EU funds under Measure 141. For a better monitoring of the efficient utilization of EU funds and of farmers’ stimulation and getting aware of their involvement in the market economic environment, it was necessary to condition the carrying out of projects on the obligativity of small farmers’ certification, be they young or less young. This new position of the small farmer as economic operator, even as a non-legal entity, presupposed an ongoing adaptation through self-taught efforts or through the consultation of an accountant, as the

Scientific Papers Series Management, Economic Engineering in Agriculture and Rural Development Vol. 14, Issue 2, 2014 PRINT ISSN 2284-7995, E-ISSN 2285-3952
319
independent economic activity needs the utilization of some minimum economic knowledge in single-entry bookkeeping, in taxation rules and basic managerial accountancy rules. In the period 2009-2012, out of total 82000 farmers certified at the National Trade Register Office (NTRO), 80% are farmers who accessed EU funds through Measure 141 (82%) and Measure 112 (18%) (fig.1).
0
20000
40000
60000
80000
ANP,IE,FE in agriculture (NTRO) Measure 141- no. ANP, IE, FE
Measure 112- nr. ANP, IE Fig.1. Evolution of the total number of certified natural persons at NTRO for agricultural activities and farmers who carry out projects with non-refundable funds under
Measures 141 and 112 The efforts made by the authorities in project management, as well as by the farmers and advisory firms led to accessing the EU funds through an increasing number of eligible projects from one session to another. In the period 2009-2012, 6 sessions of project submitting and selection under Measure 141 were organized. 88,846 projects were submitted, out of which 60,779 projects were selected for which funding contracts/funding decisions were concluded, accounting for 68.4% of total (fig. 2).
0,00
20,00
40,00
60,00
80,00
100,00
120,00
140,00
0,00
2,00
4,00
6,00
8,00
10,00
12,00
14,00
16,00
18,00
S1-2009 S2 -2010 sem .I
S3-2010 sem .II
S4-2011 S5-2012
millioan euro
No.financing decisions-thou-
Project submission sessions
No. f inancing decisions Value of contracts Payments made Figure2. Situation of projects and effected payments on
13.02.2014 under Measure 141
The period of implementation and funding of projects totals 9 years, beginning with the year 2009, with the first year of the first session and ending up with the year 2017, with the last year of the 6th session. The total value allocated for funding the contracted projects, if they were fully completed, should be 455.84 million euro. The payments effected until 13.02.2014 for the 6 sessions (MARD, 2014), found in different implementation stages, totaled 216.32 million euro, accounting for 47.5% of the total allocated value and 54.6% respectively of the effectively contracted value. A total value of effective payments by the year 2017 is uncertain, as we do not know the number of farms that will be entitled to receive tranches 4 and 5, after the rigorous checkups at the end of the third project year. As it results from the reports, in early 2014, 75.3 % of the farmers from Session 1 and 20.4% of the farmers from Session 2 had successfully gone through the checkups and were qualified to continue the projects and receive funding (tab. 1).
Table1. Diagram of project progress and of payments effected under Measure 141 in the period 2009-2017
(thousand projects)
Sesi-uni pro- iecte 2009 2010 2011 2012 2013 14 15 16 17
S1 5,6 5,6 5,6 4,2 4,2
S2 11,7 11,7 11,7 2,4
S3 15,5 15,5 12,1
S4 13,5 12,4
S5 12,5
The project promotion rate in the 3rd year was only 38% for the first two sessions, and this is probably due to multiple causes: - lack of certain technical documents; - incorrect modality of making investments from own funds; - non-reaching the necessary physical size (ha, number of animals, number of bee families, etc.); - lack of justifying documents or single-entry bookkeeping evidence in order to prove the volume of products sold on the market and the production expenses made according to the yearly targets from the business plans etc.

Scientific Papers Series Management, Economic Engineering in Agriculture and Rural Development Vol. 14, Issue 2, 2014 PRINT ISSN 2284-7995, E-ISSN 2285-3952
320
As there are no public information so far with regard to the concrete causes of project non-promoting, we established a few working hypotheses, among which the level of single-entry bookkeeping knowledge with which the farmers came to the information-vocational training courses, after at least two years of own projects implementation. Out of this reason, a brief survey was conducted in a sample of 1000 farmers from Dâmbovița county, who attended such courses under Measure 111. Certain information was used provided by farmers, as well as the results of tests for checking up the initial accountancy knowledge, after the completion of the two accounting years. Out of total sample, 59% men farmers and 41% women farmers were identified. As regards the working time allocated to farming activities, 48% are working full-time, out of which 32% men and 16% women. The young farmers under 40 years old represent 49% of total (two-thirds men and one-third women), getting closer as share to the national share, i.e. 52%. The farming activity is well-represented in the sample. Following the farming specificity of the county, 52% of the farmers who applied for funding under Measure 141 are specialized in fruit-tree farming, out of which women represent more than half. Vegetable farming comes next, in the southern area of the county, with 15% of farmers, and bee-keeping, distributed throughout the area, with 14%. The crop mixes (cereals, potatoes, cabbages, onions, etc.) and the mixed activities (crops and livestock) are found in equal proportions as activities in the sample. Sample analysis by educational level, by gender and by farming or non-farming profile reveals the high share of non-agricultural education (61%), out of which 59% men and 41% women, with young people under 40 years old in this category accounting for 46%. By educational levels, medium education prevails (40%), out of which 57% men and 43% women. One-third of the farmers who accessed Measure 141 in Dâmbovita county graduated higher education, out of which the share of women (58%) is higher than that of
men (42%). All the farmers who graduated vocational schools are men, while farmers who graduated 8-10 grades represent 10% equally divided between men and women. An analysis of the initial level of minimum theoretical and practical single-entry bookkeeping knowledge, by age groups and gender, revealed the following aspects (Figure 3 and 4).
67
6
6
76
7
7
6
0
2
4
6
8
1020-24 years
25-29 years
30-34 years
35-39 years
40-44 years45-49 years
50-54 years
55-59 years
60-64 years
Note the initial test of simple bookkeeping (B) The maximum score
Fig.3. Average scores obtained by men-farmers on the
initial Accountancy tests, before the beginning of training courses, by age groups
6 6
8
7
56
8
7
5
0
2
4
6
8
1020-24 years
25-29 years
30-34 years
35-39 years
40-44 years45-49 years
50-54 years
55-59 years
60-64 years
Note the initial test of simple bookkeeping (F) The maximum score
Fig. 4. Average scores obtained by women-farmers on the initial Accountancy tests, before the beginning of
training courses, by age groups
Poor average scores were obtained in both genders (58 scores of 90 possible scores). However, women from the age groups 30-34 and 50-54 years obtained better scores, with a weighted average of 8, compared to men, where this average was not obtained in any age group. An analysis of scores obtained by genders on an individual basis and not as weighted averages by age groups revealed 19% of men and 17% of women with scores over 8 and

Scientific Papers Series Management, Economic Engineering in Agriculture and Rural Development Vol. 14, Issue 2, 2014 PRINT ISSN 2284-7995, E-ISSN 2285-3952
321
20% of men and 22% of women with scores under 5. Hence, we can draw the conclusion that more than 60% of farmers received scores from 5 to 7.9. This is the domain with the poorest scores received. Taking into consideration that most farmers were in the 3rd project year, it is presumed that they had already gone through two full accounting years and they should have had a minimum level of accounting knowledge or they should have consulted and learnt certain accounting and fiscal rules from a professional accountant; yet, on the contrary, many of them proved that they were not concerned at all with the organization and keeping a primary accounting evidence. Probably they waited to learn this from the courses, not knowing that the accounting activity cannot be performed on a retroactive basis. At the same time, another problem was to justify the sold production, in the case of certified farmers who sold directly on the free peasant market, to final consumers. Although these do not have the same status as the non-certified natural persons any longer, the legal possibility to use the producer certificates on the free market, by all farmers, regardless of their statute, favoured the certified farmers’ option to sell agricultural products in the absence of justifying documents (cash register receipts), although their production was obtained under CNP or IE status. If certain legal provisions existed by which the certified farmers would not be allowed to use the producer certificates and these should have had to be replaced by other legal documents, resulting in their CNP/IE status, these would have had to sell their products on the markets only with cash registers, which would have enabled them to obtain justifying documents for the registration into the accounting system of the quantities and incomes from the sale of farm production. Even though the farmers were aware of the precarious legality, they tried to profit from the lack of a strict legislation and they opted for an unfiscalized, poorly controlled modality to sell their products.
Another explanation for the lack of interest in accounting comes from the fact that in the Fiscal Code, until February 1, 2013, the livestock production activity, the sericiculture activity, bee-keeping and the incomes from sale of animal products under natural form (Art.42, letter k, Law 571/2003 corroborated with Government’s Decision 44/2004 and with the subsequent modifications and completions) were non-taxable activities. Yet the compulsory condition of certification as CNP, IE or FE in real system for the farmers who had eligible projects under Measure 141, had to determine them to keep “accounting evidence with no fiscal purpose” and to meet only the APDRP requirements of EU finance monitoring and of projects differentiation between the 3rd and 4th year. Thus confusion appeared both at the level of authorities and of farmers, who found out that their activity has no fiscal interest and hence it will not be controlled by the representatives of the National Fiscal Administration Agency in the territory. Another cause that in early 2013 confused the certified farmers (CNP, IE, FE) with projects under Measure 141 was the change of fiscal legislation (Government’s Ordinance 8/2013), by which the taxpayers, who obtain agricultural incomes on individual basis or under association form, without legal status, have no longer accounting obligations; their activities are excluded from the sphere of “independent activities” (Title III, Chapter 2 from the Fiscal Code) and they shift from the real system (based on single-entry bookkeeping) of farm income taxation to income taxation based on “farm income norms” (Title III, Chapter 7 of the Fiscal Code). These fiscal modifications with regard to the lump-sum taxation of agricultural incomes obtained by non-certified natural persons are welcome, taking into consideration the fact that the non-legal entities – agricultural producers as natural persons have contributed to the national budget only to a very low extent in recent years. However, these new fiscal provisions also included the certified natural persons and the individual agricultural enterprises, which

Scientific Papers Series Management, Economic Engineering in Agriculture and Rural Development Vol. 14, Issue 2, 2014 PRINT ISSN 2284-7995, E-ISSN 2285-3952
322
should have previously kept or they kept accounting evidence. This is also the situation of farmers who accessed Measures 141 and 112, who represent almost 80% of total certified entrepreneurs in agriculture. This results in an alarming aspect with regard to the scope and expected results of NRDP 2007-2013 for the semi-subsistence farming: a great part of farmers who accessed Measure 141, either did not have any other interest besides receiving financial support in the first three years, knowing that there will be no punitive effect, or they could not manage by themselves, if we take into consideration the training level or the activity field of the project titulars (education, industry, culture, arts, etc.) or the lack of full time farmers’ previous experience in accounting evidence. After farmers participated to the accounting course, many declared that it would not have been difficult for them to keep single-entry bookkeeping evidence if they had been informed and trained since the first project year and not when they were in the middle or close to the completion of the 3rd project year. They also declared that few advisory firms, who had helped them to prepare the application file for Measure 141, continued to help them throughout project implementation. CONCLUSIONS Hence, we consider that besides certain farmers’ “ill will”, the lack of information in due time and the lack of previous experience or the organization of course at the wrong moment, these modifications of the application norms in terms of tax are in contradiction with the rules required to be obeyed by the farmers who applied for non-refundable EU and national funds. On the other hand, these farmers will have difficulties in the relations with other honest economic operators or the tax evasion will increase along the “producer to consumer” chain in the sphere of farm products acquisition by intermediaries, there will be more difficult relations with the banks and other financial bodies, there will be an increasingly decreased willingness to get
associated on the market into professional associations or producer groups, etc. The government will be satisfied to receive taxes on income norms (lump-sum taxes) from all the small farmers who exceed a certain number of hectares (for instance: over 2 ha in cereals, over 2 ha in oilseeds, over 2 ha in potatoes, over 1.5 ha orchards, over 0.2 ha in vegetables grown under protected areas, etc.) or a certain number of animals (for instance: over 2 dairy cow heads, over 50 sheep, over 25 goats, over 6 pig heads, over 75 bee families), f=be they certified or not, regardless if they obtain production or not, of they sell on the basis of justifying documents or not, registered in the accounting system or not. There are still about 40 thousand projects by the end of the year 2017, which will be completed, more or less, which will be overlapped by other projects under similar measures from NRDP 2014-2020. In order to avoid such unclear situations in the future, we make the following proposals: -coming back in the Fiscal Code to certified farmers in agriculture being included in the category of “independent activities” with the legal obligations resulting from this; - establishing the obligativity for certified farmers to sell the production on the peasant markets only with cash registers receipts, and not on the basis of producer certificate, like in the case of the non-certified persons; -the future projects under NRDP 2014-2020 to be accessed only by the farmers who can prove that they work full time in agriculture; -the information and vocational training courses to be organized in the first project year and to dedicate more time to training in bookkeeping; -the advisory firms should support farmers throughout the implementation period, giving them advice and information on a free of charge basis; -the local fiscal authorities should get more involved in checking up the application and respect of single-entry bookkeeping legislation on the farms. It is only in this way that the small semi-subsistence farms will become commercial farms and they will get adapted and get

Scientific Papers Series Management, Economic Engineering in Agriculture and Rural Development Vol. 14, Issue 2, 2014 PRINT ISSN 2284-7995, E-ISSN 2285-3952
323
integrated to the market economic environment. REFERENCES [1]Romania, Department of Rural Development of MARD, (2014), Annual reports on the progress of implementation of Measure 141 by the Agency of Payments for Rural Development and Fisheries, available at: www.madr.ro, last accessed 2014, Feb. 19. [2]Romania, Ministry of Finance, National Agency for Fiscal Administration, the Tax Code at: www.anaf.static.ro , last accessed 2014, Feb.28 [3]Romania, National Trade Register Office, (2013), Statistical synthesis, available at: www.onrc.ro, last accessed 2013, Sept, 13. [4]Government’s Ordinance 44, (2008), on the carrying out of economic activities by authorized persons, individual enterprises and family enterprises. Official Gazette 328 of April 25, 2008

Scientific Papers Series Management, Economic Engineering in Agriculture and Rural Development Vol. 14, Issue 2, 2014 PRINT ISSN 2284-7995, E-ISSN 2285-3952
324

Scientific Papers Series Management, Economic Engineering in Agriculture and Rural Development Vol. 14, Issue 2, 2014 PRINT ISSN 2284-7995, E-ISSN 2285-3952
325
QUALITY - SOCIAL ACCOUNTABILITY - HEALTH AND SAFETY INTEGRATED MANAGEMENT SYSTEM AUDIT ACCORDING TO THE REQUIREMENTS OF ISO9001:2008, SA 8000:2008, OHSAS 18001:2007 AND ISO 19011:2011 STANDARDS Valentina TUDOR1, Romeo DENUNTZIO1, Ioan Niculae ALECU1, Marius Mihai MICU1, Georgeta TEMOCICO1, Reta CONDEI1 1University of Agricultural Sciences and Veterinary Medicine Bucharest, 59 Marasti, District 1, 11464, Bucharest, Romania, Phone/Fax: 00 40 744 6474 10; Corresponding author: [email protected] Abstract The purpose of this paper is to present a method of perfecting the audit of the social requirements of the quality-social accountability-health and safety integrated management system with the social requirements of Business Social Compliance Initiative (BSCI) and Supplier Ethical Data Exchange (SEDEX). The method used was to supplement the social requirement of SA 8000:2008 standard with the additional requirements of BSCI and SEDEX. The results are based on a correspondence between the requirements of SA 8000:2008 standard and the requirements of BSCI and SEDEX codes of conducts, because some of BSCI and SEDEX requirements are more detailed than SA 8000:2008 standard requirements which are the base for the implementation of social requirements of the quality-social accountability-health and safety integrated management system. A check list was elaborated with the integrated social requirements of SA 8000:2008, BSCI and SEDEX. The check list is related to child labour, forced and compulsory labour, health and safety, freedom of association & right to collective bargaining, discrimination, disciplinary practices, working hours, remuneration and management system. The conclusion of the paper is that the elaborated check list allows the quality-social accountability-health and safety integrated management system audit to match to the requirements of BSCI and SEDEX. Key words: audit, business social compliance initiative (BSCI), management system, occupational health and safety, quality, social accountability, supplier ethical data exchange (SEDEX). INTRODUCTION
One of the important audit tools of the quality-social accountability-occupational health and safety integrated management system is the check list which has to enable the auditor the evaluate all the requirements of the integrated management system included the social requirements [2]. Because the SA 8000 standard which establishes the social requirements of the integrated management system is considered the best practice both for the Business Social Compliance Initiative (BSCI) and for the Supplier Ethical Data Exchange (SEDEX), it is important that the check list for the social requirements of the integrated management system should also contain the explicit requirements of BSCI and SEDEX codes of conduct which are implicit requirements of the SA 8000 standard.
MATERIALS AND METHODS
The methods used are to compare the requirements of SA 8000 standard with the requirements of BSCI Code of Conduct and SEDEX code of conduct and to supplement the check list of the social requirements of SA 8000 standard with the explicit requirements of BSCI Code of Conduct and SEDEX code of conduct. RESULTS AND DISCUSSIONS The check list contains questions to audit the prerequisites of the social requirements from the SA 8000 standard and also questions to audit the explicit social requirements of the BSCI and SEDEX codes of conducts which are implicit requirements of the SA 8000 standard. The questions related to the BSCI code of conduct are specified in the check list with BSCI abbreviation and the questions

Scientific Papers Series Management, Economic Engineering in Agriculture and Rural Development Vol. 14, Issue 2, 2014 PRINT ISSN 2284-7995, E-ISSN 2285-3952
326
related to SEDEX codes of conduct are specified in the check list with SEDEX abbreviation. Check list for social requirements Clause from SA 8000 standard/ Question/ Evaluation 1.Child labour [4]. 1.1.What method does the organization employ not to engage in or support the use of child labour? 1.2.How are the policies and written procedures for the children’s remediation established, documented, maintained and communicated? Are the financial support and other support provided to enable the children to attend and remain in school until childhood ends? 1.3.How is it guaranteed that the young workers are able to work only outside the compulsory education school hours? ow is it guaranteed that the young worker’s school, work and transportation time does not exceed a combined total of 10 hours a day? Do the young workers work more than eight hours a day? Do the young workers work night hours? 1.4.Are the children and young workers exposed to any situations - inside or outside the workplace- that are hazardous and unsafe to their physical and mental health and development? Are there work conditions which are slavery-like conditions? (BSCI) [1]. 2.Forced and compulsory labour [4]. 2.1.How is it guaranteed that the company does not engage in or support the use of forced and compulsory labour? Does the company require the personnel to pay deposits with the company upon commencing employment? Did the company require the personnel to lodge identification papers with the company upon commencing employment? Are forced, bonded or involuntary prison labour forbidden? (SEDEX) [3]. 2.2.How is it guaranteed that the company doesn’t withhold any part or any personnel’s salary, benefits, property, or documents in order to force such personnel to continue working for the company?
2.3.Does the personnel have the right to leave the workplace premises after completing the standard workday? Did the personnel have the right to terminate their employment provided that they gave reasonable notice to their employer? 2.4.How is it guaranteed that the company doesn’t engage in or support the trafficking in human beings? 3.Health and safety [4]. 3.1.Does the company provide a safe and healthy workplace environment? How did the company identify the hazards, evaluate the risks and establish the controls? Is there satisfactory evidence that the special needs of pregnant women, young workers and other particularly vulnerable employees are taken into account in the risk assessment? Is there satisfactory evidence that transmittable and non-transmittable diseases are particularly regarded in the risk assessment? (BSCI) [1]. Is there satisfactory evidence that the company takes serious measures to avoid endangering workers’ health by work processes? (BSCI) [1]. 3.2.Who is the management representative for occupational health and safety? How is the management representative for occupational health and safety made accountable for the implementation of health and safety requirements? 3.3.Has the company prepared the health and safety instructions? Did the company conduct the health and safety and emergency situations trainings? Did the company conduct the trainings for the new employees, reassigned employees and in the case of work accidents and work-related sickness? Is there satisfactory evidence that workers have been properly trained in using personal protective equipment? (BSCI) [1]. Is there satisfactory evidence that workers handling and/or administering hazardous substances including but not limited to chemicals, disinfectants, crop protection products or biocedes, have been properly trained? (BSCI) [1]. 3.4.How did the company perform the health and safety operational control? Is there satisfactory evidence that the company implements engineering and administrative

Scientific Papers Series Management, Economic Engineering in Agriculture and Rural Development Vol. 14, Issue 2, 2014 PRINT ISSN 2284-7995, E-ISSN 2285-3952
327
control measures to avoid or minimize the release of hazardous substances into the work environment keeping the level of exposure below internationally established or recognized limits? Is there satisfactory evidence that electrical installations and equipment are checked periodically by a competent person? (BSCI) Is there satisfactory evidence that the early warning systems are installed and properly functioning? Is there satisfactory evidence that adequate amount of fire fighting equipment is installed and properly working? (BSCI) [1]. Is there evidence that emergency lights and any other evaluation signals are correctly installed, properly functioning and maintained by a competent person? Is there satisfactory evidence that the number of emergency exits are appropriate to secure evacuation of the work force in emergency cases? (BSCI) [1]. Is there satisfactory evidence that an machine part, function, or process which may cause injury to workers is adequately safeguarded? Is there satisfactory evidence that escape routes, aisles and emergency exits are not blocked, easily accessible and conspicuously marked? Is the satisfactory evidence that evaluations plans are in line with the legal requirements and properly posted in relevant places so they are visible and understandable for workers? (BSCI) [1]. Is there satisfactory evidence that hazardous machinery and/or vehicles are properly marked and related precautionary measures are understandable for workers? (BSCI) [1]. How did the company record the work accidents? Is there evidence that accident and emergency procedures exist and are properly implemented? (BSCI) [1]. 3.5.Did the company provide free personal protection equipment? Is there satisfactory evidence that proper maintenance is given to the PPEs, including but not limited to cleaning, replacement when damaged and appropriate storage? (BSCI) [1]. Is there satisfactory evidence that use of PPEs is enforced to provide protection to workers in
conjunction with other facility controls and safety systems? (BSCI) [1]. Did the company assure the first aid and assist the workers in getting follow-up medical treatment? Does the company have written emergency procedures in place for dealing with cases of trauma or serious illness up to the point at which the patient care can be transferred to an appropriate medical facility? (BSCI) [1]. 3.6.Did the company identify the hazards, evaluate the risks and establish the controls for new and expectant mothers arising from their work activity? 3.7.Did the company provide for use by all personnel access to clean toilet facilities, access to drinking water, and where applicable, sanitary facilities for food storage? Are the work conditions adequate for all the workplaces? Is there satisfactory evidence that the company provides workers with washing facilities, changing rooms and toilets in adequate number according to the workforce population? (BSCI) [1]. 3.8.Were the dormitory facilities provided for personnel by the company clean, safe and did they meet the basic needs of the personnel? Is there satisfactory evidence that location of the dormitories are chosen in a way that users are not exposed to natural hazards or affected by the operational impacts of the worksite? (BSCI) [1]. 3.9.Do the personnel have the right to remove themselves from imminent serious danger without seeking permission from the company? 4.Freedom of association & right to collective bargaining [4]. 4.1.Do all the personnel have the right to freedom of association and collective bargaining? Did the company effectively inform the personnel that they were free to join an organization of their choosing? How is it guaranteed that the company does not interfere with the establishment, operation, or administration of workers’ organisations or collective bargaining? How does the employer adopt an open attitude towards the activities of trade unions and their organizational activities? (SEDEX)

Scientific Papers Series Management, Economic Engineering in Agriculture and Rural Development Vol. 14, Issue 2, 2014 PRINT ISSN 2284-7995, E-ISSN 2285-3952
328
Is there satisfactory evidence that workers are aware who is their representative towards management? (BSCI) [1]. 4.2.In situations where the right to freedom of association and collective bargaining is restricted by law, how does the company allow workers to freely elect their own representatives? 4.3 .Were the workers’ representatives subject to discrimination, harassment, intimidation, or retaliation for reason of their being members of a union or participation in trade union activities? How does the company assure the free access of workers representatives to their members in the workplace? 5.Discrimination [4]. 5.1.What method does the organization use not to engage in or support discrimination? Is there satisfactory evidence that questions regarding health conditions are not used for discrimination during employment? (BSCI) (3) 5.2.How does the company allow the personnel to exercise the rights to observe tenets or practices, or to meet needs relating to condition that could trigger discrimination? 5.3.How does the company prevent harassment? 5.4.Are the personnel subject to pregnancy or virginity tests under any circumstances? 6.Disciplinary practices [4]. 6.1.Is it forbidden, within the company, to use corporal punishment, mental or physical coercion, or verbal abuse of the personnel and harsh or inhuman treatment? Are the disciplinary measures recorded? (SEDEX) [3]. 7.Working hours [4]. 7.1.Does the company comply with applicable laws and industry standards on working hours and public holidays? Does the company respect the normal work week of 48 hours (40 hours in Romania)? 7.2.Is the personnel provided with at least one day off following every six consecutive working days (two days off after five consecutive working days in Romania) ? Are legal exceptions to collective bargaining permitted?
7.3.Does the company respect the overtime work of maximum 12 hours per week (8h in Romania) and not on a regular basis? 7.4.Does the company request overtime work in order to meet short-term business demands on collective bargaining? 8.Remuneration [4]. 8.1.Does the company respect the personnel’s right to a living wage and respect the legal requirements related to the minimum salary? 8.2.Did the company make deductions from wages for disciplinary purposes? Are there legal exceptions to collective bargaining? Are illegal, unauthorized deductions from wages for disciplinary purposes forbidden? (BSCI) [1]. How does the company assure that the deductions from wages which are not provided by law are not made without the express permission of the related worker? (SEDEX) [3]. 8.3.Did the company provide payslips? Did the company respect the legal requirements related to remuneration? Did the company render the remuneration in a manner convenient to the workers? Did the workers receive written information about the salary before employment? (SEDEX) [3]. 8.4.Is overtime work compensated at a legal premium rate? 8.5.How does the company assure that it doesn’t use methods to avoid fulfilling its obligations to personnel under applicable laws? How does the company assure that it doesn’t use work outside the legal frame? (SEDEX) [3]. How does the company assure that it uses only workers with legal right to work? (SEDEX) [3]. How does the company validate the legal right to work of all the workers including employment agency staff reviewing the original documentation? How does the company assure that the employment agency provides only the employees registered by them? (SEDEX) [3]. How does the company assure the control over the employment agency with regards to the above points and related legislation? (SEDEX) [3].

Scientific Papers Series Management, Economic Engineering in Agriculture and Rural Development Vol. 14, Issue 2, 2014 PRINT ISSN 2284-7995, E-ISSN 2285-3952
329
9.Management systems [4]. Policy 9.1.Is the policy for social accountability and labour conditions written in the workers’ own language? Is the policy for social accountability and labour conditions and the SA 8000 standard displayed in a prominent, easily viewable place on the company’s premises? Is the policy available in an effective form upon request? Did the company establish an anti-corruption and anti-bribery policy in all business activities? (BSCI) [1]. Management representative 9.2.Who is the management representative for social accountability management system? SA 8000 worker representative 9.3.Is the workplace dialogue facilitated by trade union? Where there aren’t trade unions, are the workers able to elect a worker as SA 8000 worker representative to facilitate communication with senior management in matters relating to SA 8000? Is the SA 8000 worker representative seen as a substitute for trade union representation? Management review 9.4.Did the top management conduct the management review? Were there amendments and improvements that got implemented? Did the SA 8000 worker representative participate in the management review? Planning and implementation 9.5.Are the requirements of SA 8000 standard understood and implemented at all levels of the organization? 9.5.a.Did the company provide a clear definition of all parties’ roles, responsibilities and authorities? 9.5.b.Did the company perform the training of new, reassigned, and/or temporary personnel upon hiring? 9.5.c.Did the company develop training and awareness programmes for existing personnel? 9.5.d .Did the company conduct monitoring of activities and results including internal audits? 9.6.Did the company consult the SA 8000 Guidance document for interpretative guidance?
Control of Suppliers/Subcontractors and Sub-Suppliers 9.7.Did the company ask for written commitment from Suppliers/Subcontractors and Sub-Suppliers? Did the company collect appropriate records of suppliers/subcontractors’ (and where appropriate sub-suppliers’) commitments to social accountability? 9.8.Were there written procedures for the evaluation and selection of suppliers/ subcontractors (and where appropriate sub-suppliers)? How does the company assure that outsourcing is permitted only with the main client consent? (SEDEX) [3]. 9.9.Did the company make reasonable efforts to ensure that the requirements of SA 8000 standard are being met by suppliers and subcontractors within their span of control and influence? 9.10.Do the home workers have the same level of protection as the directly employed personnel? Addressing concerns and taking corrective action 9.11.Does the company provide confidential means for all personnel to report non-compliances with SA 8000f standard to the company management and the worker representative? Did the company resolved the concerns of employees and others interested parties? Did the company refrain from disciplining, dismissing, or otherwise discriminating against any personnel for providing information concerning observance of the SA 8000 standard? 9.12.Did the company implement corrective and preventive actions? Outside communication and stakeholder engagement 9.13.Are there procedures for communication? Did the company regularly communicate to all interested parties including the results of management review and monitoring activities? 9.14.How did the company participate in dialogues with all stakeholders?

Scientific Papers Series Management, Economic Engineering in Agriculture and Rural Development Vol. 14, Issue 2, 2014 PRINT ISSN 2284-7995, E-ISSN 2285-3952
330
Access for verification 9.15.Did the company ensure access to its premises and to reasonable information required by the auditor in the case of announced and unannounced audits? Records 9.16.Did the company keep appropriate records to demonstrate compliance with the requirements of SA 8000 standard? CONCLUSIONS The check list contains the integrated requirements of SA 8000 standard and BSCI and SEDEX codes of conduct and can be used in auditing the integrated management system in order to ensure that the quality-social accountability-health and safety integrated management system audit corresponds to all the requirements of BSCI and SEDEX codes of conduct. REFERENCES [1]Code of conduct, 2009, BSCI Code of conduct, Business Social Compliance Initiative, www.bsci-intl.org. [2]Denuntzio R., 2008, Integration of the Quality Management System with the Social Accountability Management System and the Occupational Health and Safety Management System according to the requirements of ISO/DIS 9001:2007, SA 8000:2008 and BS OHSAS 18001:2007, 11th International Conference Quality and dependability, ISSN 1842-3566, Societatea Română pentru Asigurarea Calității, Sinaia. [3]Guide, 2012, Guide to completing a Sedex Members Ethical Trading Audit, Supplier Ethical Data Exchage,www.sedexglobal.com. [4]Standard, 2008, Social accountability 8000, New York, Social Accountability International.

Scientific Papers Series Management, Economic Engineering in Agriculture and Rural Development Vol. 14, Issue 2, 2014 PRINT ISSN 2284-7995, E-ISSN 2285-3952
331
STATISTICAL INDICATORS FOR MONITORING IMPLEMENTATION OF ENVIRONMENTAL MEASURES Crina TURTOI, Camelia TOMA, Camelia GAVRILESCU
Institute of Agricultural Economics, Romanian Academy, 13, Calea 13 Septembrie, District 5, 050711, Bucharest, Romania, Phone/fax: +4021318.24.11, E-mail: [email protected], Email: [email protected]
Corresponding author: [email protected] Abstract Most agri-environmental indicators subscribe to the general principles of sustainable development, in which economic, social and environment are interrelated. Measuring sustainable development must be based on indicators that indicate: (i) the pressure of society on the environment, (ii) the resulting environmental conditions (particularly changes) and (iii) response to human activities, especially in terms of socio- economic decisions, respectively the agricultural and agri-environmental policies adopted. These indicators must be consensual and should provide a representative picture of the three dimensions of sustainable development: society, economy and environment. Equally, it is necessary that they should be very clear, robust and reliable in statistical terms and they should derived from the best data sources, harmonized in terms of methodology with international standards. Agri-environmental indicators must guaranty comparability for EU Member States and provide the opportunity for comparability in accordance with the methodologies used by the United Nations and the OECD. At the same time, the selected indicators must be able to be collected timely and easily to be revised and update further on. In Romania, the design of the system of indicators to monitor sustainable development is closely linked to the objectives and targets set out in : (i) National Strategy for Sustainable Development of Romania Horizons 2013-2020-2030 (ii) Reports on the millennium development goals (iii) Development Strategy of Romania "Horizon 2025". The paper aims both at defining statistical indicators for monitoring implementation of agri-environmental measures and identifying possible sources of data for quantifying them. Key words: agri-environmental indicators, agricultural policy, rural development INTRODUCTION The Common Agricultural Policy (CAP) serves many purposes: it helps farmers not just to produce food, but also to protect the environment, improve animal welfare and sustain viable rural communities. Agri-environmental indicators are a useful tool for analyzing the relationship between agriculture and the environment and for tracking the integration of environmental concerns into the Common Agricultural Policy (CAP) at EU, national and regional levels. Covering about 40 % of the EU’s farmed land area, agriculture has a substantial impact on the natural environment, on one side favorable, as farming activity, over time, has created and maintained a variety of semi-natural habitats on which a wide range of wildlife depend for their survival, and on the other side critical, having in view the potential adverse impact of the farming
practices on natural resources, such as pollution of soil, water and air, fragmentation of habitats, and a loss of wildlife. This relationship between agriculture and the environment has to be taken into account when integrating environmental concerns and safety measures into the CAP, which emphasises: (i) reducing the risks of environmental degradation and (ii) enhancing the sustainability of agro-ecosystems through: -Cross-compliance criteria on agricultural market measures − as a condition of receiving direct payments, farmers must comply with certain requirements, including some related to environmental protection -Targeted agri-environmental measures − as part of Rural Development programmes, agri-environmental payments are available to farmers who commit to agri-environmental management schemes for a minimum 5-year period.

Scientific Papers Series Management, Economic Engineering in Agriculture and Rural Development Vol. 14, Issue 2, 2014 PRINT ISSN 2284-7995, E-ISSN 2285-3952
332
MATERIALS AND METHODS The study is based on the assessment of agri-environment indicators and their data sets, by considering the basic issues that are important for their usefulness and future development. Indicator-based environmental analysis needs to be complemented by further background information and scientific studies. General limited resources for data collection and analysis resulted in the selection of a limited set of indicators, relevant from the methodological and agri-environment policy perspective. Agri-environmental indicators have to cover positive and negative effects of agriculture and should be sufficiently differentiated to be able to capture regional differences in environmental conditions. A streamlined set of 28 basic indicators were developed, in close cooperation with the Member States. In the context of the Renewed EU Sustainable Development Strategy, these indicators serve to: -provide information on the farmed environment and track the impact of agriculture on the environment; -assess the impact of agricultural and environmental policies on environmental management of farms; -inform agricultural and environmental policy decisions and illustrate agri-environmental relationships to the broader public. The set of agri-environmental indicators serves the following purposes: -provide information on the state of the environment in agriculture, -understand and monitor the linkages between agricultural practices and their effects on environment, -assess the extent to which agricultural and rural development policies promote environment friendly farming activities and sustainable agriculture, -inform the global assessment process of agricultural sustainability. In the Commission Communication, indicators are identified under the DPSIR (Driving forces - Pressures and benefits - State/Impact - Responses) analytical framework:
Table 1. Driving forces - Pressures and benefits - State/Impact - Responses Domain Sub-domain Nr Title
Responses
Public policy1
Agri-environmental commitments
2 Agricultural areas under Natura 2000
Technology and skills
3 Farmers’ training level and use of environmental farm advisory services
Market signals and attitudes
4 Area under organic farming
Driving forces
Input use
5 Mineral fertiliser consumption
6 Consumption of pesticides
7 Irrigation
8 Energy use
Land use
9 Land use change
10.1 Cropping patterns
10.2 Livestock patterns
Farm management
11.1 Soil cover
11.2 Tillage practices
11.3 Manure storage
Trends
12 Intensification/extensification
13 Specialisation
14 Risk of land abandonment
Pressures and benefits
Pollution
15 Gross nitrogen balance
16 Risk of pollution by phosphorus
17 Pesticide risk
18 Ammonia emissions
19 Greenhouse gas emissions
Resource depletion
20 Water abstraction
21 Soil erosion
22 Genetic diversity
Benefits 23
High Nature Value farmland
24 Renewable energy production
State/ Impact
Biodiversity and habitats
25 Population trends of farmland birds
Natural resources
26 Soil quality
27.1Water quality - Nitrate pollution
27.2Water quality - Pesticide pollution
Landscape 28 Landscape - state and diversity
In the DPSIR, the components are: -Driving Force - human activities, processes and patterns that impact on sustainable development

Scientific Papers Series Management, Economic Engineering in Agriculture and Rural Development Vol. 14, Issue 2, 2014 PRINT ISSN 2284-7995, E-ISSN 2285-3952
333
-State - the "state" of sustainable development -Response - policy options and other responses to changes in sustainable development The potential application of agri-environmental indicators for assessing progress in the integration of environmental concerns into the CAP is more limited. This limitation is due to the complex links between policy measures, changes in farming practices and environmental improvements, and other numerous other intervening factors. Agri-environmental indicators (AEIs) can make a valuable contribution to policy evaluation, but they have to be supplemented, on a case-by-case basis, by additional policy-relevant information. With the help of agri-environmental indicators it is possible to show developments over time and to provide quantitative information. Still a number of limitations need to be overcome to arrive at a fully operational set of agri-environmental indicators. Further work is needed with respect to: -conceptual and methodological improvement, -deficiencies in the data sets, -extension of the system of indicators among all Member States. However, the level of development of these indicators differs. Some are already operational, their concepts and measurement are well-defined and data are available at national and, where appropriate, at regional level. Other indicators are well-defined but they lack regional or harmonised data or their modelling approaches are weak. There are also indicators that still need substantial improvements in order to become fully operational. Therefore, not all indicators can be disseminated for the time being.
RESULTS AND DISCUSSIONS Indicators are a key-tool in agri-environmental reporting by offering a broad picture of the complex agri-environmental relationships and facilitating the communication of the research results. Initially many approaches to describing the environment were limited to information
describing environmental quality and quality change, in terms of pollutant load or some other biochemical or biophysical indicator. By providing a meaningful contribution to agri-environmental reporting they contribute to the following objectives:
Simplified description of a complex reality
Better communication with non-specialist
Analysis of environmental trends in longer time series
Building a common basis for discussions and
Identifying priorities in political decision making.
The DPSIR framework is a useful analytical framework for developing an overall picture of the environmental circumstances and particularly helpful for explaining agri-environmental links. However, differences in data reliability and spatial resolution (precise spatial referencing of relevant data sets in a geographical information system) between indicators limit the possibilities for cross-referencing that is needed for a regional environmental analysis. The analysis of the data requirements for calculating the AEIs has identified a total of 97 different types of data, of which 25 are related to area. Twenty types of data can be obtained from the Farm Structure Survey (FSS) and 12 from the Survey on Agricultural Production Methods (SAPM). The relatively high number of data available from SAPM indicates that the AEI data collection system could be improved considerably if SAPM were carried out at regular intervals rather than as a one-off survey. In addition to FSS and SAPM, 43 other different data sources have been identified. The results of the review are presented in uniform factsheets for each of the 28 AEIs. Finally, the 28 AEIs capture the main agri-environmental interactions. They are of extreme importance for the EU agri-environmental policy reporting, but the AEIs are not yet institutionalized in agri-environmental policy.

Scientific Papers Series Management, Economic Engineering in Agriculture and Rural Development Vol. 14, Issue 2, 2014 PRINT ISSN 2284-7995, E-ISSN 2285-3952
334
Environmental statistics collected and processed by the Romanian National Institute of Statistics is covering the following: -Statistical data on investment and current expenditure on environmental protection, by activities of the national economy and by development regions, statistics on environmental factors, by types of producers of environmental services; -Statistical data on the volume of collected wastewater, statistical data on the capacity of treatment spaces, statistical data on the volume and quality of treated wastewater and the quality of the discharged water; -Statistical data on industrial waste generated, recovered and disposed, by economic activities and development regions, statistical data on the amount of municipal waste collected, recycled and disposed, at national level and by region, statistical data on the composition of municipal waste, statistical data on the number of number of special facilities for composting, thermic treatment and waste disposal, by economic activities and development regions. There are many challenges ahead in terms of improving data sets, spatial referencing and insure the timely delivery of indicators to policy makers. The farm typology approach could be further explored as a means to relate indicators to different sectors of agricultural production and to integrate this information with other indicators. This would facilitate the interpretation of indicator results and may allow decision makers to focus on particular farm types. CONCLUSIONS Indicators are selected to provide information about the functioning of a specific system, for a specific purpose - to support decision making and management. An indicator quantifies and aggregates data that can be measured and monitored to determine whether change is taking place. But in order to understand the process of change, the indicator needs to help decision makers understand why change is taking place. For time-series to be useful for environmental analysis, they have to be comparable through
years, For instance the change in unit of observation and land use categories starting with carrying out the Farm Structure Surveys data collection in Romania since 2002 has diminished the comparability of 1990 and years after 2002 data. It would make data series analysis much easier if data prior to the change in statistical system could be adapted to the new definitions and methodologies. Geo-referenced statistical farm registers are a good tool for further work, as attributes relevant to rural development issues and environmental analysis, such as information on production methods, started to be collected since the 2010 Farm Structure Survey. Administrative data sets can fill important gaps, but efforts should be done to improve such data sets in line with statistical and geo-referencing principles to obtain more added value. However, administrative data are by their nature not as stable as official statistical data sets. Incorporating the Common Agricultural Policy requirements within the Romanian agriculture development programs, according to the sustainable development principles should be complemented by a comprehensive quantitative and qualitative evaluation of the phases crossed, so that to enable monitoring and analysis of development process of agriculture. REFERENCES [1]Eurostat (2011), Farm data needed for agri-environmental reporting, Theme: Agriculture and fisheries, Collection: Methodologies and working papers, European Union, 2011. [2]Romania, Department of Rural Development of MARD, (2014), Strategia Nationala pentru Dezvoltare Durabila a Romaniei, Orizonturi 2013-2020-2030, Bucharest, 2008.

Scientific Papers Series Management, Economic Engineering in Agriculture and Rural Development Vol. 14, Issue 2, 2014 PRINT ISSN 2284-7995, E-ISSN 2285-3952
335

Scientific Papers Series Management, Economic Engineering in Agriculture and Rural Development Vol. 14, Issue 2, 2014 PRINT ISSN 2284-7995, E-ISSN 2285-3952
336
Copyright © 2022 FDOKUMEN


![Starbucks Am Sci 2021;17(4):37-47]. ISSN 15451003 (print)](https://static.fdokumen.com/doc/165x107/6334af9f62e2e08d4902bbea/starbucks-am-sci-202117437-47-issn-15451003-print.jpg)