NMIT_MRI 2303 General Ship Knowledge_Ch 2. Ship Construction_3.ship drawing
Upload
khangminh22Category
view
0download
0
ISSN 2303-1174 M.F.Ghiffari., P.Kindangen., F.Tumewu. The Causality Relationship of Down Jones……
445 Jurnal EMBA Vol.5 No.2 Juni 2017, Hal. 445 - 454
THE CAUSALITY RELATIONSHIP OF DOW JONES INDUSTRIAL AVERAGE (DJIA) AND NIKKEI 225 TOWARDS JAKARTA COMPOSITE INDEX (JCI) PERIOD 2011 – 2016
HUBUNGAN KAUSALITAS DOW JONES INDUSTRIAL AVERAGE (DJIA) DAN NIKKEI 225 TERHADAP
JAKARTA COMPOSITE INDEX (JCI) PERIODE 2011 - 2016
by Muhammad Fadhlan Ghiffari1
Paulus Kindangen2 Ferdinand Tumewu3
Faculty of Economics and Business
International Business Administration, Management Program Sam Ratulangi University, Manado
E-mail: [email protected]
[email protected] [email protected]
Abstract: The openness of information between countries around the world is easier in this Globalization era, one country can share information through the internet as well as the economic condition of a country. A study about how is the influence of DJIA and NIKKEI 225 towards the JCI during 2011 to 2016 may help to identify the factors that make these indices related. The study aims to analyze the change of DJIA and NIKKEI 225 may influence the JCI during 2011 to 2016. The methodology used explanatory research which studying a situation to explain the relationship between variables. The sample used is the index historical data during 2011 to 2016 of the indices. The data analysis method using Granger’s Causality test with Vector Auto Regressive basis analyzed in EViews 9. The study found that there is no significant influence of DJIA towards the movements of JCI during 2011 to 2016, and NIKKEI 225 was significantly influenced the JCI in the period. There are several factors affecting these results such as trade ties between these countries, currency, foreign exchange reserve and the investment grade which affecting investors investment decision. For further research, the author recommend to add other global indices variables.
Keywords: Stock Market, DJIA, NIKKEI 225, JCI, IHSG, Vector Auto Regressive, Granger’s Causality, Indonesia Stock Exchange.
Abstrak: Pada zaman ini, dengan keterbukaan informasi antar setiap negara di seluruh dunia semakin mudah dengan adanya era Globalisasi, sebuah negara bisa membagikan informasi melalui internet bersamaan juga dengan kondisi ekonomi dari negara terebut. Penelitian ini adalah tentang bagaimana pengaruh dari Dow Jones Industrial Average (DJIA) dan NIKKEI 225 terhadap Indeks Harga Saham Gabungan (IHSG) selama 2011 sampai 2016. Penelitian ini menggunakan metode explanatory research dimana mempelajari sebuah situasi atau masalah untuk dapat menjelaskan hubungan antara variabel – variabel. Dalam penelitian ini, data yang digunakan adalah data historis selama 2011 sampai 2016 yang diambil dari harga penutupan setiap bulannya. Data kemudian dianalisis menggunakan metode Granger’s Causality dengan berdasarkan Vector Autoregressive yang dianalisa menggunakan EViews Student Version. Penelitian ini menemukan bahwa tidak ada pengaruh yang signifikan dari DJIA terhadap JCI sedangkan NIKKEI 225 berpengaruh signifikan terhadap JCI. Adapun beberapa faktor yang mempengaruhi hal tersebut adalah kebijakan perdagangan antar kedua negara adalah mata uang, cadangan devisa dan Investment Grade yang mempengaruhi keputusan dalam berinvestasi. Sebagai rekomendasi untuk penelitian selanjutnya sebaiknya menambahkan beberapa indeks global lainnya. Kata kunci: Pasar Modal, DJIA, NIKKEI 225, JCI, IHSG, Vector Auto Regressive, Granger’s Causality, Bursa Efek
Indonesia.

ISSN 2303-1174 M.F.Ghiffari., P.Kindangen., F.Tumewu. The Causality Relationship of Down Jones……
446 Jurnal EMBA Vol.5 No.2 Juni 2017, Hal. 445 - 454
INTRODUCTION Research Background
Investing in stock market is the chance to circulate money of investors in order to keep the purchasing power in future. However, in the stock market frequently exercise volatility that has impact on its price movements and could be risky for investors. Therefore, volatility of a market can influence the investment decisions of investors and funds manager, risk management, market regulations and economic policy. Gatfaoui (2013) stated that high volatility levels tend to be followed by other high volatility levels, the same principle applies to low volatility levels. Therefore, volatility is a time-varying risk measure. In stock market, the more noise trading there is, the more liquid the markets will be, in the sense of having frequent trades that allow us to observe prices (Black, 1986). For instance, the liquidity of market can makes the market volatile.
Nowadays, the opennes of information between countries around the world is more easier in this Globalization era, one country can share the information through the internet as the economic condition of a country. So that, the economic activities around the globe has become interconnected and dependent to each other, due to there is an interaction between countries in the economic activities that related to both sector; Real sector and Monetary sector. In a research conducted by Yang and Hamori (2014) based on the data taken from January 1990 to December 2012, as they have observed the highest return and volatility is in Indonesia stock market. Indonesia Stock Exchange claimed that for the past 10-year, return of Indonesia Stock Exchange (IDX) is the highest in the world. And for the past 10-year growth 317 percent, or 15 percent per year compared to Deposit Yield that only has 7 percent return in a year.
As the data from the latest July 2016 from Indonesia Capital Securities Depository (KSEI) documented that based on stock holding percentage Foreign Investors hold 64 percent of company’s stocks listed in Indonesia Stock Exchange. While the locals only hold 36 percent. With the result, we assumed that if most of foreign investors hold the stocks in IDX it will automatically impacted to the performance of Jakarta Composite Index, and even can causing the volatility of this index in case of if there is a Net Buy and a Net Sell by the foreigners that makes the JCI can run into high volatility. In 2008 to 2009, Subprime Mortgage Crisis in the United States affected the world, including Indonesia and specifically impacted to Indonesia’s Capital Market (IDX) that makes the bank faces a failed payment by its debtor (the developer and Housing Finance Company) (Bank of Indonesia, 2013). This crisis causes a significant decreasing of U.S. stock market index. And as an impact, it is impacting to Indonesia’s Capital Market Index, IHSG.
The abundance of global liquidity post global crisis makes the international capital flow in form of portfolio investment to Indonesia become challenge in terms of the application of monetary policy. As the other emerging market country, Indonesia has strong economic growth as well as the higher interest rate where in the other hand, the developed country applied loose monetary policy with low interest rate. These factors made the international capital flow towards the emerging markets which have higher return and supported by the economics performance improved as well as the risk level (Bank of Indonesia, 2013). Furthermore, the capital inflow towards Indonesia showed the internationals confidence to Indonesia’s economic fundamentals which strengthened by the enhancement of Indonesia’s rating to become Investment Grade. The capital flow affects the domestic liquidity and could be used as alternative source of investment financing and could push investment activities as well as pushing the domestic economy. Research Objectives
Based on research problem, the objectives of this research to know the influence of Dow Jones Industrial Average (DJIA) and NIKKEI 225 towards Jakarta Composite Index (JCI) from 2011 to 2016.
THEORITICAL FRAMEWORK Stock Market
Capital market is a market where bridging between those whom needed long-term funds (company) and those (investors) who are needed investment instruments on financial products such as stocks, bonds, mutual funds and others. In the other hand, stock markets are where government and industry can raise long-term capital and investors can purchase and sell securities (Masoud, 2013). Not only government institutions but also private companies can raise log-term capital through capital market.

ISSN 2303-1174 M.F.Ghiffari., P.Kindangen., F.Tumewu. The Causality Relationship of Down Jones……
447 Jurnal EMBA Vol.5 No.2 Juni 2017, Hal. 445 - 454
Global Stock Indices A stock market index is the composite value of a group of secondary market-traded stocks. Movements
in stock market index provide investors with information on movements of broader range of secondary market securities (Saunders & Cornett, 2009). An equity index is a portfolio of stocks, chosen according to simple, predefined rules, and designed to capture a particular investment style (Broby, 2011). A composite stock index functioned to know the rate of market performance in terms of its price movements. It also reflects the level of return of stocks (Wauran & Tumbuan, 2017). Factors Influence Global Stock Indices
The higher oil price increases, the higher revenue that can made by the companies listed in any exchange caused people purchasing power increase. This will stimulate the investors both institutional and retail to accumulating the ownership of shares due to its company’s earning promising, which will lead to increasing the trading volume and impacting to increasing the stock price of related companies. As a consequence, if most of the share price in exchange increase, the index also will perform well (Liembono & Mulyana, 2016). Domestic Stock Index
In Indonesia, the capital market in the country has known as Bursa Efek Indonesia (IDX). As well as the others country’s capital market, in Indonesia Stock Exchange also has index which represents the price movements, called index. In addition, the index that represents the entire stock price movements is known globally as Jakarta Stock Exchange, or in Indonesian terms known as Indeks Harga Saham Gabungan (IHSG). Factors Influence IHSG Index
International portfolio inflows are slightly positively correlated across countries and are more strongly correlated within regions. The correlation of flows in most regions, and particularly within Asia, rises strongly during the Asian crisis subsample, but not during the Mexican crisis subsample (Froot, O’Connell, & Seasholes, 2001). The research conducted by Griffin, Nardari, & Stulz. (2002), found that the foreign investment flow has significant effect towards several developing markets. The money inflow pushes price increase, and as the opposite, the money outflow will affect price decreasing. Market Volatility
The term volatility itself is widely agreed by finance academicians as percentage changes in price or rates of return (Schwert, 1989). Basically, volatility refers the risk in the financial markets, in other words it measures how much of the uncertainty is priced in the market (Ozbekler, 2017). Volatility is globally become a major concern of investors decisions moreover, market volatility has become the top list of greatest concern for some institutional investment i.e. public pensions plans, insurances and others. Previous Research
Ibrahim (2005) has conducted a study about the international linkage of stock prices with the case of Indonesia. The study found in short-run dynamics, the there is substantial interactions among the ASEAN markets. However, it seems that the Indonesian market becomes more segmented from other ASEAN markets during the post-crisis period. Additionally, while most ASEAN markets respond quickly to shocks in the U.S. regardless of the sample period and seem to be less influenced by the Japanese market post-crisis, the Indonesian market becomes more responsive to the developed markets of the U.S. and Japan during the post-crisis period.
Gatfaoui (2013) conducted a research about the translation financial integration into correlation risk: a weekly reporting’s viewpoint for the volatility behavior of stock markets. The research applied the multivariate of GARCH-type models in order to assess the systematic and systemic risks as well as the joint volatility behaviors of the U.S. and three European financial markets.
Hatemi (2004) conducted a research about the multivariate tests for autocorrelation in the stable and unstable VAR models. The results of conducted simulations show that all three tests platform relatively well in stable VAR models without ARCH. In unstable VAR models the portmanteau test exhibits serious size distortions. LM and Rao tests perform well in unstable VAR models without ARCH.

ISSN 2303-1174 M.F.Ghiffari., P.Kindangen., F.Tumewu. The Causality Relationship of Down Jones……
448 Jurnal EMBA Vol.5 No.2 Juni 2017, Hal. 445 - 454
Conceptual Framework
Figure 1. Conceptual Framework Source: Conceptual Theory (2017)
Hypothesis From the overall explanation in the previous parts, there two main hypothesis that can be drawn and further examined, which are: H0: There is no significant influence of DJIA and NIKKEI 225 toward JCI H1: There is significant change of DJIA influence the JCI H2: There is significant change of NIKKEI 225 influence the JCI
RESEARCH METHODOLOGY Type of Research
This research used explanatory research that focuses on studying a situation or a problem in order to explain the relationships between variables (Saunders & Cornett, 2009). The explanatory research used in this research purposed to obtain data that explains the relationships between global indices towards Indonesia Stock Exchange where reflected in its index, Jakarta Composite Index. This research involved an individual data observing (collecting) historical data from all global indices purposed in this proposal and also Jakarta Composite Index (JCI) in order to find out the relation between them. Place and Time of Research
This study is conducted in Indonesia Stock Exchange Branch Representative Manado and also the Laboratorium Pasar Modal dan Galeri Investasi of Indonesia Stock exchange in Sam Ratulangi University during September to October 2017. Research Procedure
The procedure of this research is proposing the application letter to branch manager of Indonesia Stock Exchange branch representative Manado, and to the chief of Laboratorium Pasar Modal dan Galeri Investasi of Indonesia Stock exchange in Sam Ratulangi University where the author collecting the data used in order to conducting thesis which are the IDX Annual reports from 2011 to 2016, Jakarta Composite Index (IHSG) performance from 2011 to 2016 and the data of global stocks indices provided in Indonesia Stock Exchange and others related data that will support the research variables. Data Collection Method
Secondary data from this research which is a company IDX index annual performance reports, U.S. Dow Jones index annual performance, and Japan NIKKEI 225 index, theoretical review, and documentation data gathering method from library and internet.
DJIA (X1)
NIKKEI 225 (X2)
JCI
(Y)
ISSN 2303-1174 M.F.Ghiffari., P.Kindangen., F.Tumewu. The Causality Relationship of Down Jones……
449 Jurnal EMBA Vol.5 No.2 Juni 2017, Hal. 445 - 454
Operational Definition of Research Variable DJIA has become one of major benchmark index around the world. The index represents the values of 30
large (in terms of sales and total assets return) corporations selected by the editors of The Wall Street Journal. NIKKEI 225 is Japanese stock exchange index which represents 225 domestic common stocks listed in the first section of Tokyo Exchange. This index is one of major benchmarking index in Asia’s markets. The Jakarta Composite Index (JCI) locally known as Indeks Harga Saham Gabungan is an index which represent the entire listed-companies. The index is calculated based on daily price movement. Data Analysis Method
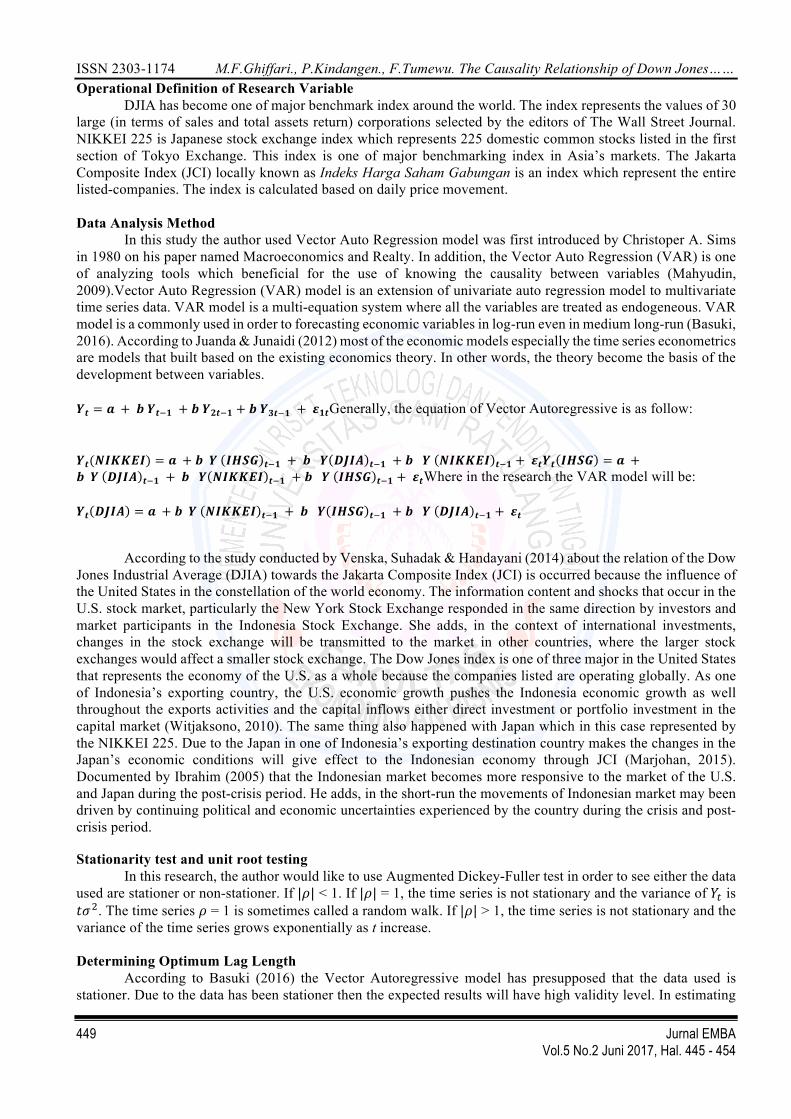
In this study the author used Vector Auto Regression model was first introduced by Christoper A. Sims in 1980 on his paper named Macroeconomics and Realty. In addition, the Vector Auto Regression (VAR) is one of analyzing tools which beneficial for the use of knowing the causality between variables (Mahyudin, 2009).Vector Auto Regression (VAR) model is an extension of univariate auto regression model to multivariate time series data. VAR model is a multi-equation system where all the variables are treated as endogeneous. VAR model is a commonly used in order to forecasting economic variables in log-run even in medium long-run (Basuki, 2016). According to Juanda & Junaidi (2012) most of the economic models especially the time series econometrics are models that built based on the existing economics theory. In other words, the theory become the basis of the development between variables. 𝒀𝒕 = 𝒂 + 𝒃𝒀𝒕(𝟏 + 𝒃𝒀𝟐𝒕(𝟏 + 𝒃𝒀𝟑𝒕(𝟏 + 𝜺𝟏𝒕Generally, the equation of Vector Autoregressive is as follow: 𝒀𝒕(𝑵𝑰𝑲𝑲𝑬𝑰) = 𝒂 + 𝒃𝒀 𝑰𝑯𝑺𝑮 𝒕(𝟏 + 𝒃 𝒀 𝑫𝑱𝑰𝑨 𝒕(𝟏 + 𝒃 𝒀 𝑵𝑰𝑲𝑲𝑬𝑰 𝒕(𝟏 + 𝜺𝒕𝒀𝒕 𝑰𝑯𝑺𝑮 = 𝒂 +𝒃𝒀 𝑫𝑱𝑰𝑨 𝒕(𝟏 + 𝒃 𝒀 𝑵𝑰𝑲𝑲𝑬𝑰 𝒕(𝟏 + 𝒃 𝒀 𝑰𝑯𝑺𝑮 𝒕(𝟏 + 𝜺𝒕Where in the research the VAR model will be: 𝒀𝒕 𝑫𝑱𝑰𝑨 = 𝒂 + 𝒃𝒀 𝑵𝑰𝑲𝑲𝑬𝑰 𝒕(𝟏 + 𝒃 𝒀 𝑰𝑯𝑺𝑮 𝒕(𝟏 + 𝒃 𝒀 𝑫𝑱𝑰𝑨 𝒕(𝟏 + 𝜺𝒕
According to the study conducted by Venska, Suhadak & Handayani (2014) about the relation of the Dow Jones Industrial Average (DJIA) towards the Jakarta Composite Index (JCI) is occurred because the influence of the United States in the constellation of the world economy. The information content and shocks that occur in the U.S. stock market, particularly the New York Stock Exchange responded in the same direction by investors and market participants in the Indonesia Stock Exchange. She adds, in the context of international investments, changes in the stock exchange will be transmitted to the market in other countries, where the larger stock exchanges would affect a smaller stock exchange. The Dow Jones index is one of three major in the United States that represents the economy of the U.S. as a whole because the companies listed are operating globally. As one of Indonesia’s exporting country, the U.S. economic growth pushes the Indonesia economic growth as well throughout the exports activities and the capital inflows either direct investment or portfolio investment in the capital market (Witjaksono, 2010). The same thing also happened with Japan which in this case represented by the NIKKEI 225. Due to the Japan in one of Indonesia’s exporting destination country makes the changes in the Japan’s economic conditions will give effect to the Indonesian economy through JCI (Marjohan, 2015). Documented by Ibrahim (2005) that the Indonesian market becomes more responsive to the market of the U.S. and Japan during the post-crisis period. He adds, in the short-run the movements of Indonesian market may been driven by continuing political and economic uncertainties experienced by the country during the crisis and post-crisis period. Stationarity test and unit root testing
In this research, the author would like to use Augmented Dickey-Fuller test in order to see either the data used are stationer or non-stationer. If |𝜌| < 1. If |𝜌| = 1, the time series is not stationary and the variance of 𝑌< is 𝑡𝜎?. The time series 𝜌 = 1 is sometimes called a random walk. If |𝜌| > 1, the time series is not stationary and the variance of the time series grows exponentially as t increase. Determining Optimum Lag Length
According to Basuki (2016) the Vector Autoregressive model has presupposed that the data used is stationer. Due to the data has been stationer then the expected results will have high validity level. In estimating

ISSN 2303-1174 M.F.Ghiffari., P.Kindangen., F.Tumewu. The Causality Relationship of Down Jones……
450 Jurnal EMBA Vol.5 No.2 Juni 2017, Hal. 445 - 454
the VAR, should first determining the correct optimum lag length in the analysis. The determining of the correct VAR lag length is very important due to if the lag length input is too short, the estimation result cannot explain model dynamism comprehensively. Causality Test
The causality test did in order to know either an endogenous variable can be treated as an exogenous variable. The Granger Causality test was first come from the nescience of impacts between variables. If there are two variables, Y and Z, so which one is impacting another. Whether Y influenced Z, Z influenced Y or both have influenced and may even the both not influence to each other. When the Y influenced Z, then how much is the value of Z in current period can be explained by Z in the previous period and Y value in the previous period (Basuki, 2016). RESULT AND DISCUSSION Stationarity test Table 1. JCI test – Stationer
Source: Data Processed 2018
After running the test in 1st Difference ADF test, the Table 1. shows that the data is stationer. It was tested at the 1st difference level which shows that the t-Statistic (-7.680) value is more than 5% critical values which equals to -3.475 and the probability less than 𝛼 = 0.05 which equals to 0.00. So, it can be concluded that the data is stationer in the 1st Difference (Juanda & Junaidi., 2012). Table 2. DJIA test – Stationer
Source: Data Processed 2018
After running the test in 1st Difference ADF test, the Table 5.4. shows that the data is stationer. It was tested at the 1st difference level which shows that the t-Statistic (-9.159) more than 5% critical values in the amount of -3.475 and the probability less than 𝜶 = 𝟎. 𝟎𝟓 which equals to 0.00. So, the data is stationer in the 1st Difference (Juanda & Junaidi, 2012).
Table 3. NIKKEI test – Stationer
Source: Data Processed 2018
Augmented Dickey-Fuller test statistic
t-Statistic Probability -7.680035 0.0000
Test Critical Values 1% Level -4.094550 5% Level -3.475305 10% Level -3.165046
Augmented Dickey-Fuller test statistic
t-Statistic Probability -9.159561 0.0000
Test critical values: 1% Level -4.094550 5% Level -3.475305 10% Level -3.165046
Augmented Dickey-Fuller test statistic
t-Statistic Probability -7.545077 0.0000
Test critical values: 1% Level -4.094550 5% Level -3.475305 10% Level -3.165046

ISSN 2303-1174 M.F.Ghiffari., P.Kindangen., F.Tumewu. The Causality Relationship of Down Jones……
451 Jurnal EMBA Vol.5 No.2 Juni 2017, Hal. 445 - 454
After running the test in 1st Difference ADF test, the Table 5.6. shows that the data is stationer. It was tested at the 1st difference level which shows that t-Statistic value is -7.545 more than 5% critical values in the amount of -3.475 and the probability less than 𝛼 = 0.05 which equals to 0.00. So, it can be concluded that the data is stationer in the 1st difference (Juanda & Junaidi, 2012). Determining Optimum Lag Length Table 4. Determining Optimum Lag Length
Lag LR FPE AIC SC HQ 0 NA 35.0811* 43.59564 43.70222* 43.63716* 1 10.23447 35.20146 43.71646 44.14276 43.88251 2 15.99748 35.20146 43.71313 44.45915 44.00372 3 20.08471 35.10409 43.60504 44.67079 44.02017 4 5.331355 35.30424 43.79691 45.18239 44.33658 5 9.098992 35.42254 43.89062 45.59581 44.55482 6 5.050427 35.63405 44.07146 46.09638 44.86021 7 6.974599 35.79439 44.18807 46.53271 45.10136 8 6.212893 35.97624 44.31014 46.97451 45.34797 9 12.35205 35.95705 44.20875 47.19284 45.37112 10 13.36304 35.88164 44.02417 47.32799 45.31107 11 5.521924 36.10531 44.10444 47.72797 45.51588 12 18.52902* 35.7205 43.53245* 47.47571 45.06843 13 4.913854 36.00203 43.56980 47.83279 45.23032 * Indicates lag order selected by the criterion LR: Sequential modified LR test statistic (each test at 5% level) FPE: Final prediction error AIC: Akaike Information Criterion SC: Schwarz Information Criterion HQ: Hanan-Quinn Information Criterion
Source: Data Processed 2018 Based on Table 4., shows that by the criteria, the FPE, SC and HQ criteria suggested the use of lag 0.
Where the LR and AIC criteria suggested the use of lag 12th. So, in this case we already have 2 candidates of optimum lag. Hereinafter, in order to know the best lag to be used in this VAR system, the author return to the first step which is running the VAR estimation with 0 Lag and VAR estimation using 12 Lags. After that the author compares the biggest number of Adj. R-squared of each resulted VAR estimation with both lags suggested criteria.
Table 5. VAR with 0 lag
Source: Data Processed 2018 Table 6. VAR with 12 lags
Source: Data Processed 2018 As the data presented in Table 5. and Table 6 the biggest Adj. R-squared number is in VAR estimation
with the use of 12 lags. Which means that the optimum lag length that can be used in the stable VAR estimation
D(JCI) D(DJIA) D(NIKKEI) Adj. R-squared 0.000000 0.000000 0.000000
D(JCI) D(DJIA) D(NIKKEI) Adj. R-squared 0.123376 0.082907 0.016950

ISSN 2303-1174 M.F.Ghiffari., P.Kindangen., F.Tumewu. The Causality Relationship of Down Jones……
452 Jurnal EMBA Vol.5 No.2 Juni 2017, Hal. 445 - 454
is 12 lags. Furthermore, the final step of this research is to finding out whether there is causality relationship between the global indices (DJIA and NIKKEI 225) and local indices, Jakarta Composite Index (JCI) during 2011 to 2016 period.
Causality test Table 7. Causality Test
Source: Data Processed 2018 Based on the hypothesis, the author presents that DJIA is positively influence the JCI during 2011 to 2016 (H1) and NIKKEI 225 is also positively influence the JCI during 2011 to 2016 (H2). By using the 𝛼 =< 5%, it is definitely show that DJIA’s probability value is 0.2416 towards JCI and NIKKEI 225 probability value towards JCI is 0.0005. According to the results, DJIA index is not significantly influence the JCI during period of 2011 to 2016, and NIKKEI 225 is significantly influence the JCI during period of 2011 to 2016. So, the hypothesis (H1) is rejected while the hypothesis (H2) is accepted. In addition, there is no causal relationship between JCI to DJIA, JCI to NIKKEI 225, as well as NIKKEI 225 to DJIA and DJIA to NIKKEI 225. Discussion
The author found the estimation result shows that during 2011 to 2016 period there is no significant influence of Dow Jones Industrial Average (DJIA) towards the Jakarta Composite Index (JCI). The reason behind was the monetary policy in the United States. During 2011 to 2016 the Fed increase the interest rate from 1.16% in 2011 and reach 2.20% in 2016. So that makes the investors would prefer to keep the money in the United States rather than invest the funds in other countries especially Indonesia. Meanwhile, the investors from the United States either institutions or retails are unable to influence the movements of Jakarta Composite Index because not only the U.S investors who invest in Indonesia but also there are many international investors inside. In addition, the data of Indonesia’s balance of 2015 is Surplus. However, the surplus condition during the period is caused by the import value is decreasing significantly. Meanwhile, in the other hand the export of commodity also dropped significantly during the period of 2015 compared to the period of 2014.
Further, during last 6-year, the DJIA is not significantly influenced the JCI. It is only market sentiment that influenced the investors psychology in Indonesia. Then, when the market (DJIA index) going ups and downs it will not affect the Indonesia capital market especially the IHSG index in long-term, because the macroeconomics in Indonesia still shows in good performance such as low inflation rate, low interest rate and foreign exchange reserve is around 125,97 billion U.S. Dollar (Bank of Indonesia, November 2017). These things are the main factor that keep the optimism of investors to keep investing in Indonesia capital market. Moreover, another factor that makes Indonesia attractive is the investment grade of Indonesia has raised by S&P from BB+ to BBB- (Bloomberg.com). Based on the theory, in short-term, the market seems to be volatile if the bad news e.g. DJIA falls, spreading among the traders that makes the market very liquid (volatile), while on the other hand, in long-term period, the investors will tend to keep their ownership of the stocks because the information is just temporary to affects the price movements (Black, 1986).
So, what caused the NIKKEI 225 affecting the Indeks Harga Saham Gabungan (IHSG) is because investment flows from Japan towards Indonesia. Besides the foreign direct investment increased in Indonesia, it also increasing the employment. As the implication the economic growth between these countries increased in accordance of the income per capita also increased. When the income per capita increased, it is definitely their purchasing power increase which lead to the sales of goods and services liven up so that makes the companies able to generates profits more which presented on the financial statements. These was supported by theory that explaining about what makes the stock price rises and impacted to the index
No. Null Hypothesis Observations Probability
1. Dow Jones Industrial Average (DJIA) Index Influenced Jakarta Composite Index (JCI)
60 0.2416
2. NIKKEI 225 Index Influenced Jakarta Composite Index (JCI)
60 0.0005

ISSN 2303-1174 M.F.Ghiffari., P.Kindangen., F.Tumewu. The Causality Relationship of Down Jones……
453 Jurnal EMBA Vol.5 No.2 Juni 2017, Hal. 445 - 454
CONCLUSION AND RECOMMENDATION
Conclusion 1. There is no significant influence of Dow Jones Industrial Average (DJIA) towards Jakarta Composite Index
(JCI) during 2011 to 2016 period. 2. There is significant influence of NIKKEI 225 index towards the Jakarta Composite Index (JCI) during 2011
to 2016 period. 3. Simultaneously, only NIKKEI has positive influence to JCI during 2011 to 2016, where the other variables
such as JCI to DJIA, JCI to NIKKEI as well as DJIA to NIKKEI and NIKKEI to DJIA have no influenced or negative to each other.
Recommendation 1. In subsequent studies, suggested to extend the sample period to 10-year behind which probably resulted
different causality relationship between variables. 2. The use of another estimation model to measure the volatility of each variables. 3. Adding more variables, in this case adding others global indices and control variable such as capital flow for
the clearer results of interaction between market globally.
REFERENCES
Bank of Indonesia, January. 2013. Bulletin Ekonomi Moneter dan Perbankan. Basuki, Agus T. 2016. Analisis Regresi Dalam Penelitian Ekonomi dan Bisnis. Raja Grafindo Persada. Black, F. 1986. Noise. Journal of Finance.Vol. 41. https://doi.org/10.1111/j.1540-6261.1986.tb04513.x.
Accessed August 20th 2017. Broby, D. 2011. Equity Index Construction. Journal of Index Investing. https://doi.org/10.3905/jii.2011.2.2.036.
Accessed August 19th 2017. Filbert, R. 2016. Bandarmology Membeli Saham Gaya Bandar Bursa. Penerbit Elex Media Komputindo.
Jakarta Froot, K. A., Paul G. J. O’Connell, Mark S. Seasholes. 2001. The Portfolio Flows of International Investors.
Journal of Financial Economics. Vol. 59. http://www.nber.org/papers/w6687. Accessed May 12th 2017. Gatfaoui, H. 2013. Translating Financial Integration Into Correlation Risk: A Weekly Reporting's Viewpoint for
the Volatility Behavior of Stock Markets. Economic Modelling. http://www.sciencedirect.com/science/journal/02649993. Accessed August 10th 2017.
Griffin, J.M., F. Nardari, R. Stulz. 2002. Daily Cross-border Equity Flows: Pushed or Pulled? Working paper.
The Ohio State University. Hatemi-J, Abdulnasser. 2004. Multivariate tests for autocorrelation in the stable and unstable VAR models.
Journal of Economic Modelling. https://doi.org/10.1016/j.econmod.2003.09.005. Accesses June 10th 2017.
Ibrahim, M. H. 2005. International Linkages of Stock Prices: The case of Indonesia. Management Research
News. http://dx.doi.org/10.1108/01409170510784823. Accessed June 20th 2017. Juanda, Bambang & Junaidi. 2012. Ekonometrika Deret Waktu. Teori dan Aplikasi. Penerbit IPB Press.
Bandung Liembono, R. H. & A. R. Mulyana. 2016. Analisis Fundamental 2. Briliant Publisher. Surabaya

ISSN 2303-1174 M.F.Ghiffari., P.Kindangen., F.Tumewu. The Causality Relationship of Down Jones……
454 Jurnal EMBA Vol.5 No.2 Juni 2017, Hal. 445 - 454
Mahyudin, A. 2009. Analisis Vector Auto Regression (VAR) Terhadap Korelasi Antara Belanja Pulblik dan
Pertumbuhan Ekonomi di Sulawesi Selatan, Tahun 1985-2005. Jurnal Ekonomi Pembangunan Vol. 10. http://journals.ums.ac.id/index.php/JEP/article/download/805/531. Accessed June 20th 2017
Marjohan, M. 2015. Effect of Stock Price Index in Global Stock against Composite Stock Price Index (CSPI)
Study on the Indonesia Stock Exchange. Journal of Economics and Finance.Volume. http://www.iosrjournals.org/iosr-jef/papers/Vol6-Issue2/Version-3/C06231523.pdf. Accessed June 20th 2017.
Masoud, N. M. H. 2013. The Impact of Stock Market Performance upon Economic Growth. International Journal
of Economics and Financial Issues. Vol. 3, No. 4, pp.788-798 ISSN: 2146-4138 Ozbekler, A. G. 2017. Volatility: As Causing Factor of Stock Market Co-Movement. Working Paper. Saunders, A., M. M. Cornett. 2009. Financial Markets and Institutions. Fifth Edition. McGraw-Hill.
Pennsylvania. Schwert, G. W. 1989. “Why Does Stock Market Volatility Change Over Time?”. The Journal of Finance.
Volume XLIV. https://onlinelibrary.wiley.com/doi/abs/10.1111/j.1540-6261.1989.tb02647.x. Accessed August 19th 2017.
Sims, C. A. 1980. Macroeconomics and Realty. Econometrica. Volume. 48, No. 1, p. 1-48.
http://www.jstor.org/stable/1912017. Accessed August 21st 2017. Tulung, Joy Elly dan Ramdani, Dendi (2016). “The Influence of Top Management Team Characteristics on BPD
Performance”. International Research Journal of Business Studies, Volume 8 Nomor 3, 155-166. http://irjbs.com/index.php/jurnalirjbs/article/view/1147
Tulung, Joy Elly (2017). "Resource Availability and Firm’s International Strategy as Key Determinants Of Entry Mode Choice." Jurnal Aplikasi Manajemen-Journal of Applied Management 15.1. http://jurnaljam.ub.ac.id/index.php/jam/article/view/916
Tulung, Joy Elly, and Dendi Ramdani.(2018) "Independence, Size and Performance of the Board: An Emerging Market Research." Corporate Ownership & Control, Volume 15, Issue 2, Winter 2018. http://doi.org/10.22495/cocv15i2c1p6
Venska, D. A. K., Suhadak, Handayani S. R. 2014. The Effect of Global Stock Indices (Dow Jones Industrial Average, NIKKEI 225, Hang Seng, and Strait Times) on Jakarta Composite Index at Indonesian Stock Exchange (period 2010 – 2012). Jurnal Administrasi Bisnis. Vol. 9 No. 2. Brawijaya University.
Wauran, P. & W. J. F. Tumbuan. 2017. Bank & Pasar Modal. Buku Ajar. Fakultas Ekonomi dan Bisnis
UNSRAT. Manado. Witjaksono, A. A. 2010. Analisis Pengaruh Tingkat Suku Bunga SBI, Harga Minyak Dunia, Harga Emas Dunia,
Kurs Rupiah, Indeks NIKKEI 225, dan Indeks Dow Jones terhadap IHSG (Studi Kasus Pada IHSG di BEI Selama Periode (2000-2009). Jurnal Ekonomi. eprints.undip.ac.id/24025. Accessed March 16th 2018.
Yang, L., & S. Hamori 2014. Spillover effect of US Monetary Policy to ASEAN Stock Markets: Evidence from
Indonesia, Singapore, and Thailand. Pacific- Basin Finance Journal. https://pdfs.semanticscholar.org/10f8/9f88eeb971a88c8a843d309ef7114b0db917.pdf. Accessed August 20th 2017.
Copyright © 2022 FDOKUMEN