ISSN 2564-016X - Grassroots Journals
129
ISSN 2564-016X 01(01) ⚫ August 2021 | ISSN 2564-212X
-
Upload
khangminh22 -
Category
Documents
-
view
0 -
download
0
Transcript of ISSN 2564-016X - Grassroots Journals

ISSN 2564-016X
01(01) ⚫ August 2021 | ISSN 2564-212X

JOURNAL OF POLICY & GOVERNANCE
ISSN 2564-212X | 01(01) ⚫ August 2021 www.grassrootsjournals.org/jpg
ii
Journal of Policy & Governance. This work is licensed under the Creative Commons Attribution International License (CC BY 4.0). http://creativecommons.org/licenses/by/4.0/
Journal of Policy & Governance is comprehensively covering the subjects of policy and governance in interdisciplinary and multidisciplinary approach. By bridging both
academic and professional domains, the journal provides professionals, practitioners, researchers, students, and policymakers, and any other persons with information on
developments in the field of policy and/or governance.
Published by: The Grassroots Institute
548 Jean Talon Ouest Montreal, Quebec Canada H3N 1R5
Contact:
Dr. Hasrat Arjjumend Executive & Managing Editor
Copyright without Restrictions
Journal of Policy & Governance allows the author(s) to hold the copyright without restrictions and will retain publishing rights without restrictions. The submitted papers
are assumed to contain no proprietary material unprotected by patent or patent application; responsibility for technical content and for protection of proprietary
material rests solely with the author(s) and their organizations and is not the responsibility of our journal or its editorial staff. The main (first/corresponding) author is responsible for ensuring that the article has been seen and approved by all the other authors. It is the responsibility of the author to obtain all necessary copyright release permissions for the use of any copyrighted materials in the manuscript prior to the submission. Further information about the Copyright Policy of the journal can be
referred on the website link https://grassrootsjournals.org/credibility-compliance.php#Copyright Journal of Policy & Governance by The Grassroots Institute is licensed under a Creative Commons Attribution 4.0 International License based on a
work at www.grassrootsjournals.org.

JOURNAL OF POLICY & GOVERNANCE
ISSN 2564-212X | 01(01) ⚫ August 2021 www.grassrootsjournals.org/jpg
iii
Journal of Policy & Governance. This work is licensed under the Creative Commons Attribution International License (CC BY 4.0). http://creativecommons.org/licenses/by/4.0/
EDITOR-IN-CHIEF
Prof. Dr. Valeriy Tertychka Professor & Chair, Kyiv-Mohyla School of Governance (KMSGov),
National University Kyiv-Mohyla Academy, Ukraine
DEPUTY EDITOR-IN-CHIEF
Prof. Dr. Santosh Kumar Professor of Public Policy & Executive Dean, Institute of Liberal Arts & Humanities,
Chandigarh University, India
EXECUTIVE & MANAGING EDITOR
Dr. Hasrat Arjjumend Senior Legal Research Fellow, Centre for International Sustainable Development Law
& Founder President, The Grassroots Institute, Canada
EDITORIAL BOARD
Prof. Dr. George Mavrotas Full Professor, Institute of Development Policy, University of Antwerp, Belgium
Dr. Sigrid Pauwels
Full Professor & Assistant Administrative Judge, Government & Law Research Group, Faculty of Law, University of Antwerp, Belgium
Prof. Dr. Houchang Hassan-Yari
Full Professor & Head, Department of Political Science, Sultan Qaboos University, Oman
Prof. Dr. Honor G. Fagan Professor of Sociology, Maynooth University Social Sciences Institute,
National University of Ireland, Ireland
Dr. Romeo Balbutin Pacudan Associate Professor, Institute of Policy Studies, Universiti Brunei Darussalam, Brunei Darussalam
Dr. Margarita Cheshmedzhieva
Associate Professor, Department of Public Law, Faculty of Law and History, South-West University, Bulgaria
Dr. Lesya Ilchenko-Syuyva
Associate Professor & Academic Director (Government Communications Program), Andriy Meleshevych Kyiv-Mohyla School of Governance, National University of “Kyiv-Mohyla Academy”, Ukraine
JOURNAL OF POLICY & GOVERNANCE
ISSN 2564-212X | 01(01) ⚫ August 2021 www.grassrootsjournals.org/jpg
iv
Journal of Policy & Governance. This work is licensed under the Creative Commons Attribution International License (CC BY 4.0). http://creativecommons.org/licenses/by/4.0/
Dr. Rinata Kazak Assistant Professor, Department of Legal History, Yaroslav Mudryi National Law University, Ukraine
Stephen J. Ternyik
Economist, Educator, Ecologist, Techno-Logos, Germany
Dr. Scott Valentine Research Promotions Office, Kyushu University, Japan
Dr. Bashir AbulQaraya
Associate Professor, College of Humanities and Social Sciences, Zayed University, United Arab Emirates
Dr. Amany A. El Anshasy Associate Professor of Economics, College of Business and Economics, United Arab Emirates University,
United Arab Emirates
Dr. Sasidaran Gopalan Assistant Professor, Innovation in Government & Society, College of Business and Economics, United
Arab Emirates University, United Arab Emirates
Dr. Sumaia A. Al Kohlani Assistant Professor, Department of Government and Society, United Arab Emirates University, United
Arab Emirates
Dr. Amani Abdullatif Omer Assistant Professor, Department of Humanities and Social Sciences, Khalifa University, United Arab
Emirates
Dr. Riham Khafagy Assistant Professor, College of Humanities and Social Sciences, Zayed University, United Arab Emirates
Dr. Sabiha Alam
Assistant Professor, Academy of International Studies, Jamia Millia Islamia (Central University), India
Dr. Jatswan Singh Executive Director & Associate Professor, Asia-Europe Institute (AEI)
& Department of International & Strategic Studies, University of Malaya, Malaysia
Prof. Dr. Shakila Yacob Executive Director & Professor of Business History, International Institute of Public Policy and
Management, & Department of History, Faculty of Arts & Social Sciences, University of Malaya, Malaysia
Dr. Raja Noriza Raja Ariffin Deputy Director & Associate Professor, International Institute of Public Policy and Management, & Department of Administrative Studies and Politics, Faculty of Economics & Administration,
University of Malaya, Malaysia
JOURNAL OF POLICY & GOVERNANCE
ISSN 2564-212X | 01(01) ⚫ August 2021 www.grassrootsjournals.org/jpg
v
Journal of Policy & Governance. This work is licensed under the Creative Commons Attribution International License (CC BY 4.0). http://creativecommons.org/licenses/by/4.0/
TABLE OF CONTENTS
M-00226 Policy and Conservation: Inaugural Editorial Valeriy Tertychka (Editor-in-Chief, Journal of Policy & Governance)
vi-vii
M-00227 Systematic Literature Review of Walkability and the Built Environment Raja Noriza Raja Ariffin, Nur Hairani Abd Rahman, Rustam Khairi Zahari
1-20
M-00228 Municipal Bonds as a Financial Component of the Development of Territorial Communities in Ukraine Volodymyr Ivanyshyn, Alla Pecheniuk
21-29
M-00229 Community Forestry Governance in Federal System of Nepal Binita Dahal, Rajeev Joshi, Bishow Poudel, Manoj Panta
30-45
M-00230 Foundation of the Digital Global Economy Bhavya Walia, Siddhant Saggar
46-53
M-00231 International Legal Regulation and Supranational Interaction in Counteracting the COVID-19 Pandemic: Challenges and Proposals Ievgenii Shulga, Zoryana Skaletska, Olena Kalaianova, Oleksandra Shynkaruk
54-62
M-00232 Comparative Analysis of Ukrainian and Canadian Legislation Regulating the Land Management Valeriia Borzenkova
63-68
M-00233 West Bengal Assembly Election 2021: An Analysis Onkar Singh
69-121

M – 00226 | Inaugural Editorial ISSN 2564-212X 01(01) | August 2021
Policy and Governance
Valeriy Tertychka Kyiv-Mohyla School of Governance (KMSGov), National University "Kyiv-Mohyla Academy", 324, Build. 4, Volos'ka street, 8/5, Kyiv 04070, Ukraine. Email: [email protected] | ORCID: 0000-0002-9301-7973
INAUGURAL EDITORIAL Dear colleagues,
Welcome to the “Journal of Policy & Governance”! In my opinion, an editorial may reflect the general direction of the journal, values, strategy, priorities,
goals and objectives, and so on. This is the first edition of the Journal of Policy & Governance where I act as the Editor-in-Chief. The title of the journal includes two key concepts, the "Policy" and the "Governance", and they are crucial for the target audience of the journal. That is, the field of "Policy Science": policy cycle, problem identification for analysis, policy environment, resources, stakeholders’ analysis, communications (strategic, multilevel, etc.), policy tools and evaluation, etc. Also, these are values, objectives and methodology of the research and policy analysis, policy as the process and reasons for state intervention, evidence-based policy, quantitative and qualitative methods of data processing and the formation of evidence in the policy process and so on.
The field of governance is also valuable for research: democratic, good, sensitive, multilevel, digital, and so on: Service State, public consultation, and interaction between government, business and civil society in the policy-making process. Common decisions, power and out of power policy makers, leadership, analysts and policy actors also require semantic and empirical content in the articles of the journal.
……Cont.
__________________________________________________________________________________________________________________ How to cite this editorial: Tertychka, V. (2021). Inaugural Editorial. Journal of Policy & Governance, 01(01), vi-vii.
https://doi.org/10.33002/jpg010100
Copyright © 2021 by author(s). This work is licensed under the Creative Commons Attribution International License (CC BY 4.0). http://creativecommons.org/licenses/by/4.0/

ISSN 2564-212X | Journal of Policy & Governance| 01(01) August 2021 | https://doi.org/10.33002/jpg010100
vii
Tertychka | Inaugural Editorial
Promising areas of research would be multilevel governance and balanced social development, cohesion policy, vertical-horizontal interaction and networks in the multilevel governance, digital multilevel governance, etc. An interesting example would be benchmarking of global and multilevel governance: supranational, national, regional and local levels in their interaction. Also, the "Spiral of Success" as a follow-alternative to linear model of policy making is worth mentioning. As an applied aspect it would be desirable to show different types of policy documents in the articles. Public administration, gender aspects, microeconomics for policy analysis, finance and budgeting, local self-government, administrative behavior, policy paradoxes, urban planning, etc. are important areas of research in the articles of this journal. Special emphasis should be placed on policy and governance monitoring and evaluation, performance audit, governance forecasting and diagnosis, and policy measurement indicators. Multidisciplinarity and interdisciplinarity are the basic and main components for promising cross-researches of "Policy" and "Governance" areas. Ethics and morality as well as effectiveness, efficiency, economy, balance and publicity of policy are necessary components of research in the published articles. These are promising and urgent directions for studying in the articles of our journal.
I believe that strategic public management in the context of governance would be an innovative area for research in future articles. Moreover, such threads would be important, such as strategic public management, planning, forecasting, target programming and public policy, governance and operational management, research of information and technical support for policy-making, change management and public policy and governance.
Of course, the above thoughts only clarify the formulated purpose of the journal. Innovation, interdisciplinary benchmarking and a cross-cultural approach to public policy and governance will contribute to the quality of the journal. I hope that this first edition of “Journal of Policy & Governance" and subsequent editions will meet the high standards of quality articles and content of promising research. I would like to wish the authors bring a sustainable and evidence-based content to the future articles. The Editorial Board, following the principles of the academic integrity, will support and encourage authors for innovative and promising articles. I wish all the success and inspiration to the authors and journal staff. Prof. Dr. Valeriy Tertychka Editor-in-Chief Journal of Policy & Governance

M – 00227 | Lead & Research Article ISSN 2564-212X 01(01) | August 2021
Systematic Literature Review of Walkability and the Built Environment
Raja Noriza Raja Ariffin*1, Nur Hairani Abd Rahman2, Rustam Khairi Zahari3
1Department of Administrative Studies and Politics, Faculty of Economics and Administration, University of Malaya, 50603 Kuala Lumpur, Malaysia. Email: [email protected] | ORCID: 0000-0002-8754-5294 2Department of Administrative Studies and Politics, Faculty of Economics and Administration, University of Malaya, 50603 Kuala Lumpur, Malaysia. Email: [email protected] | ORCID: 0000-0002-0046-3588 3Kulliyyah of Architecture & Environmental Design, International Islamic University Malaysia, Malaysia. Email: [email protected] | ORCID: 0000-0002-5864-1703 *Corresponding author
ABSTRACT Walking is the most sustainable form of transportation. It is the socially equitable, economically viable and environmentally friendly mode of transportation. However, transportation technology has caused the desertion of the pedestrian space due to excessively motorized transport. Consequently, the pedestrian environment has degraded. In many cities, the abandonment of the pedestrian space has created a socially unfriendly environment. Walkability is a measure of how friendly an area is to walk. In measuring walkability, several criteria are considered, which include inter alia, the quality of pedestrian facilities, roadway conditions, land use patterns, community support, security and comfort for walking. Findings from studies are mixed; some stated that improving the built environment does not encourage people to walk more; however, there are other studies that indicated otherwise. The aim of this paper is to review the built environment characteristics that promote walking. A literature review of studies that focused on walking, walkability, the built environment, pedestrian and urban design was conducted. This study has searched the electronic databases that intertwined with the Web of Science database. The choice was made due to the comprehensiveness of quality academic studies indexed in the database, thus providing reliable sources of body of work. The database integrates numerous sub-databases such as Web of Science Core Collection, Derwent Innovations Index, KCI Korean Journal Database, Russian Science Citation Index and SciELO Citation Index. The data are then thematically coded. The fields of urban planning, urban design, geography, transportation, sociology, and other related areas were included in the research. The result of this review offers evidence to the criteria that promote walking. The review found that three criteria are somewhat constant in promoting walking, namely, population and building density, land use and land use mixes, and safety. In short, by making an area perceived as safe with the presence of land use mixes and density are the best combination to create a walkable environment. Keywords: Walking; Walkability; Built environment; Pedestrian; Urban planning
Received: 15 July 2021 Reviewed: 30 July 2021 Accepted: 31 July 2021 Published: 10 August 2021
__________________________________________________________________________________________________________________ How to cite this paper: Ariffin, R.N.R., Rahman, N.H.A, & Zahari, R.K. (2021). Systematic Literature Review of Walkability and the
Built Environment. Journal of Policy & Governance, 01(01), 1-20. https://doi.org/10.33002/jpg010101
Copyright © 2021 by author(s). This work is licensed under the Creative Commons Attribution International License (CC BY 4.0). http://creativecommons.org/licenses/by/4.0/

ISSN 2564-212X | Journal of Policy & Governance| 01(01) August 2021 | https://doi.org/10.33002/jpg010101
2
Ariffin, Rahman, & Zahari | Systematic Literature Review of Walkability and the Built Environment
1. INTRODUCTION
Walking is the most sustainable form of transportation. It is the socially equitable, economically viable and environmentally friendly mode of transportation most accessible to the masses. However, advancement in transportation technology has caused the desertion of the pedestrian spaces due to the availability of primarily motorized transport. Consequently, this phenomenon has caused a degradation of the pedestrian environment (Kim & Mateo-Babiano, 2018). A vibrant pedestrian environment has been found to contribute to a more livable urban area (Shamsuddin et al., 2012). Jacobs (1961) in her book, “The Death and Life of Great American Cities (1961)” advocated a vibrant urban life that promotes pedestrian activity. This seminal book emphasizes cities as social connector, a hub where people can enjoy each other and appreciate the vitality of the community. Alas, in many cities, the abandonment of the pedestrian space has created a socially unfriendly environment (Yassin, 2019). It is reiterated in many studies that sense of community would be stronger in individuals living in pedestrian-friendly neighborhoods (French, 2014; Tsai, 2014). As an example, the finding in a study by Lund (2002) showed that pedestrian environment factors significantly influence sense of community. The surveys for the study were conducted in one pedestrian-oriented neighborhood and one automobile-oriented neighborhood in Portland, Oregon. Another study undertaken in Seoul, Korea showed that residents of pedestrian-oriented neighborhood were more likely to feel a sense of community in their neighborhood than were residents of auto-oriented neighborhood (Jung et al., 2015). Furthermore, the results of the study also revealed that social interaction factors and walkability among pedestrian environment factors positively influence a sense of community. These findings are in line with the New Urbanists’ belief that a high-quality pedestrian environment will enhance sense of community by increasing opportunities for interaction among neighbors.
The pollution caused by motorized vehicles and accidents involving pedestrians are issues faced by cities when the built environment that support walking is neglected (Zhang et al., 2014; Peng & Bongard, 1999). The World Health Organization (2018) estimated that almost 12 million pedestrian road traffic injuries occurred annually. While Khan et al. (2020) found in their study on pedestrian road traffic injuries that globally, although the mortality rate is decreasing, the incidences of pedestrian injuries increased by 3.31% in 2017 compared to 1990. Compared to other road injuries, pedestrian injuries carry the highest risk of a person being severely injured, leading to significant morbidity, disability, and death (Kim et al., 2008; Mayou & Bryant, 2003). Acknowledging the importance of road safety issue, the United Nations has included this as among their main concern in Goal 11 of the Sustainable Development Goals (United Nations, undated).
Walkability is the basis of a sustainable city and a fundamental concept in sustainable urban design (Rafiemanzela et al., 2017). It is a measure of how friendly an area is to walk. In measuring walkability, several criteria are considered, which include among others, the quality of pedestrian facilities (Blečić et al., 2014; Lo, 2009), roadway conditions (Lee et al., 2013; Wang et al., 2012), land use patterns (Cowen et al., 2018), community support, security and comfort for walking (Devarajan et al., 2019; Ranasinghe et al., 2015). Findings of several studies indicated that improving the built environment did not cause people to walk more (Forsyth et al., 2009). However, there are evidence from other studies that stated otherwise (Park et al., 2014; Pearce et al., 2011). Generally, studies on walkability have several basic attributes that are cited as antecedents to walking. Some listed proximity, comfort, and aesthetic, while others have included public security and pavement safety, among others. Amidst this background, this paper aims to review the built environment characteristics that promote walking. 2. METHODOLOGY 2.1 Research Design
The systematic literature review (SLR) methodology was applied in this study to disclose the criteria of built environment that could promote walking. Preliminary step to understand this context is through conducting systematic literature review. This step is a fundamental aspect of an academic research. Initially, systematic literature review was done on healthcare research (Nightingale, 2009), and later developed and grew in other areas of research. Systematic literature review has become an established methodology to investigate the accumulated knowledge from various fields (Al-Tabbaa et al., 2019). Prior to starting any research, literature review must be conducted to understand the breadth and depth of the existing body of work and this process led to better understanding of the research field (Liu

ISSN 2564-212X | Journal of Policy & Governance| 01(01) August 2021 | https://doi.org/10.33002/jpg010101
3
Ariffin, Rahman, & Zahari | Systematic Literature Review of Walkability and the Built Environment
et al., 2020). The procedure of literature review must be valid, reliable and repeatable (Xiao & Watson, 2019). Besides that, systematic literature review helps avoid research bias and errors (Smith & Noble, 2014; Dada, 2018) and reduce implicit prejudice and discrimination towards a subject matter (Sirelkhatim et al., 2015). Systematic literature review aims to synthesize all available and accessible sources of topic or research (Tight, 2019). It provides powerful strategies to collect and combine the evidence from many studies (Mertens, 2018). This gives advantage of providing totality of evidence by incorporating and judging positive and negative studies in the literature analysis (Torgerson, 2003). Hence, it produces robust comprehension of the topic of research, which subsequently will be useful for designing robust research framework and identifying the research gap, the important pillars in any research. 2.2 Search Strategy
First step in operating systematic literature review is to decide and determine the search strategy (Carvalho et al., 2013) in order to obtain all relevant studies (Guo et al., 2016). With that, this study has searched the electronic databases that intertwined with Web of Science database. The choice was made due to the comprehensiveness of quality academic studies indexed in the database, thus providing reliable sources of body of work. The database integrates numerous sub-databases such as Web of Science Core Collection, Derwent Innovations Index, KCI Korean Journal Database, Russian Science Citation Index and SciELO Citation Index. This study adopts systematic search strategy proposed by Bramer et al. (2018), which consists of the following steps: Table 1: Systematic search strategy procedure
Step Activity Description 1 Determine a clear and
focused question Research questions must be well-defined, not too broad or too vague or too specific.
2 Describe the articles that can answer the question
Find the answer for the research question in the published studies.
3 Decide which key concepts address the different elements of the question
Key concepts refer to topics or themes that should be derived from the research questions, depending on the focus and context of the study. Important to also consider relevant synonyms to all key concepts.
4 Decide which elements should be used for the best results
Do not strict search strategy to research questions elements. Consider taking all relevant elements (important and less important) into the strategy. This may avoid obtaining limited results and maximizing number of related articles to be included in the study. Consider and be careful with bias and overlapping elements in the search strategy.
5 Choose an appropriate database and interface to start with
Important to consider all relevant synonyms to all key concepts. Some areas of study may have its own specific jargons to explain about something, phenomenon or activity, which most of the time will not be used in everyday language. Some studies will also use words that refer to the same thing interchangeably in the title, abstract and content.
6 Document the search process in a text document
Record each step in search strategy taken during the process in a log document. Besides reporting this information in methodology part, it would also help other researchers to follow and reproduce the steps for other research areas or in the same research area in the future to see the development or trend of the area / discipline.
7 Identify appropriate index terms in the thesaurus of the first database
Index all terms and arrange them from most appropriate to less appropriate to the context of study. The index can also be updated while searching for the studies.

ISSN 2564-212X | Journal of Policy & Governance| 01(01) August 2021 | https://doi.org/10.33002/jpg010101
4
Ariffin, Rahman, & Zahari | Systematic Literature Review of Walkability and the Built Environment
8 Identify synonyms in the thesaurus
Most databases will usually provide structure of search with options and levels. This can be utilized if the words have a few equal important meanings.
9 Add variations in search terms
Skill for searching is not lest important here. Variation in search terms should be identified such as spelling difference (e.g., UK English or US English), abbreviations (e.g., World Health Organization or WHO) and relevant opposite words of the terms (e.g., integrity and corruption). In this stage also, truncation would be helpful in searching relevant studies (e.g., organization, institution*)
10 Use database-appropriate syntax, with parentheses, Boolean operators, and field codes
Utilizing parentheses and Boolean operators such as “AND” “OR” and “NOT” would help a lot in finding the right and relevant articles. For example, this can be done by combining the concepts and the context (e.g., Walkability AND built environment). Many databases provide selection of these functions.
11 Optimize the search Step 3 to 10 should be optimized at this stage. Search strategy should combine different terms, synonyms with parentheses/ Boolean operators. At this stage also, there are several functions that can be utilized for year of publication, open access articles, languages and types of sources. Selection of these functions will affect the results.
12 Evaluate the initial results After applying up to step 11, the initial results will be obtained. At this evaluation stage, examine all articles. Most of the time, the researcher will know which articles are considered as most important articles (for example by analyzing the most cited articles or the authors who are the expert in that specific areas). Several databases also have functions to sort it to researcher preferences such as the most relevant and oldest to newest or vice versa.
13 Check for errors Errors sometimes not easy to be detected. However, it can be done by doing initial screening to the titles. It is also important to pay attention to irrelevant articles that appear in the search result.
14 Translate to other databases Similar process should be done for each selected database to ensure the same procedure is conducted in maximizing the number of search results. Besides that, it is also part of the protocol of methodology to avoid bias and guarantee the research ethics.
15 Test and reiterate It is important to carefully take note what has been done for each step, so that it can be replicated in the next cycles for different databases. Usually, the first cycle is very vital to set the ground rule for the whole search strategy.
Source: Adopted and adapted from Bramer et al. (2018) 2.3 Inclusion and Exclusion Criteria
It is important to establish inclusion and exclusion criteria based on the research objectives or questions (Kitchenham & Charters, 2007). There were few inclusion criteria set for searching the articles. The criteria are the articles that published in English language, published from January 2014 until January 2019, and the abstract is accessible. Whereas the exclusion criteria of searching articles were non-English articles and published outside the year range set for the study. These criteria were set based on the followings:
(a) English language: Majority of the articles were written and published in English and most importantly all reviewers can read and understand English to do the identification and screening process.

ISSN 2564-212X | Journal of Policy & Governance| 01(01) August 2021 | https://doi.org/10.33002/jpg010101
5
Ariffin, Rahman, & Zahari | Systematic Literature Review of Walkability and the Built Environment
(b) Published from January 2014 until January 2019: The period was chosen because this period is the second half of Decade of Action for the implementation of UN GA Resolution 64/255. The main aim of this resolution is to improve road safety at the global level through various aspects, including improving walkability. Thus, it is important to review what have been done to achieve this in the second half of its implementation through literature and empirical studies. This objective is also in line with the aim of the present study where the study purposes is to review the built environment characteristics that promote walking.
(c) Abstract is accessible: Screening the abstract is part of the main element in PRISMA protocol. Therefore, it is important to include articles that provide abstracts.
In addition to this, the study follows suggestions by Cauwenberg et al. (2018) to exclude several types of articles published in the database such as conference proceeding and expert opinion. All these criteria were set to ensure the context of the study reflecting the current trend of the study area. To search for articles, the study has used several combinations of key terms, which were related to the objective of this study. The combinations of key terms are Walk* AND Built Environment. The study found 133 articles resulted in search based on the set key terms. However, only 20 articles were included in the study. Three reviewers have screened the articles’ title and abstract in order to ensure the articles meet the inclusion and exclusion criteria that were set earlier. Summary of the selection criteria is presented in table 2 and pathway of articles included and excluded in review is shown in figure 2. 2.4 Data Extraction and Quality of Scoring
Data extraction from the reviewed studies should follow pre-established guidelines. For this purpose, this study adopts Preferred Reporting Items for Systematic Reviews and Meta-Analyses for Protocol 2015 (PRISMA-P 2015) to guide the process. The PRISMA-P consists of a 17-item checklist in facilitating the preparation and reporting systematic review (Moher et al., 2015). This guideline helps to improve the reporting and screening of systematic review (prisma-statement.org, 2015). Three researchers conducted data extraction process using similar format to ensure relevant studies are included while minimizing bias and reducing errors (Munn et al., 2014). Screening process of each article was not only to determine the suitability of the articles with the context of this study, but also aims to extract information from each article. Data extraction flow diagram is presented in figure 1.
The extracted data consist of the details on the type of information such as title of the articles, first authors, year of publication, research objectives, study design, sample characteristics and study findings. Extraction of the data using a piloted form (table in excel document) is used to ensure that the information generated from each article is placed in the same self-created database, to create an easy screening process, especially, in identifying replicate articles, and to do contextual analysis by reviewing and analyzing all selected articles. During this screening process, the study also conducted assessment for quality of scoring for each included study. The quality indicators are adopted and adapted from Buckley et al. (2009), which are indicated in table 3. 3. RESULTS
The following results are based on analysis of the included studies, where the assessment investigated the characteristics of the articles, themes network and main theme. 3.1 Characteristics of Included Studies
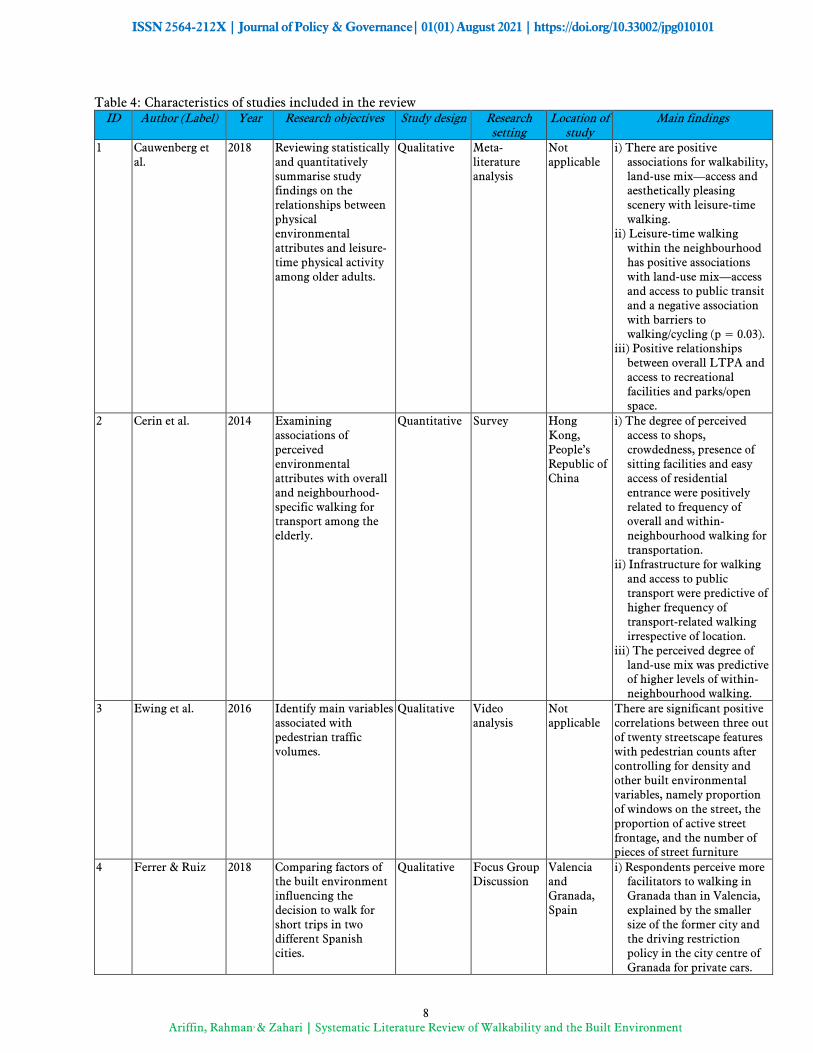
There are 20 articles included in the study. The range of the year of publication is between 2014 to 2018. Out of 20 articles, 7 were using qualitative approach, 12 articles were quantitative works, and 1 article adopted mixed-method approach. The research settings are various namely meta-literature analysis, survey, video analysis, focus group discussion, street connectivity, interview, and streetscape photo evaluation. In the included study, the location of the studies involved 12 countries. Details for each article can be referred to in table 4.
Table 2: Summary of study selection criteria
Criteria Limit to Main keywords Walk* AND Built
environment
Access type Open access
Year January 2014 until January 2019
Document type Article
Publication stage Published
Source type Journal
Language English

ISSN 2564-212X | Journal of Policy & Governance| 01(01) August 2021 | https://doi.org/10.33002/jpg010101
6
Ariffin, Rahman, & Zahari | Systematic Literature Review of Walkability and the Built Environment
Figure 1: Pathway of articles included and excluded in the review
Table 3: Quality Indicators
Indicator Detail Research question Is/are the research question(s) clearly stated?
Note: If the study has not stated the research question, the research will look for the research objectives.
Study subjects Is the study group appropriate (size, characteristics, selection)? Note: For some studies, especially from qualitative social science disciplines, the information is not available for example the size, but those studies will still be included during selection process.
Data collection methods Are the methods reliable and valid?
Completeness of data What is the drop-out / response rate? Note: Most quantitative studies do not have issues in terms of presenting drop-out or the response rate. However, oftentimes, this information is not presented in studies using qualitative approach.
Control for confounding Have confounding variables been removed / minimized / accounted for?
Analysis of results Are the methods of analysis appropriate?
Conclusions Can the data justify the conclusions?
Reproducibility Could the study be repeated by another group?
Prospective Is the study prospective (forward looking), as opposed to retrospective?
Ethical issues Were ethical issues addressed adequately?
Triangulation Are the results supported by data from other studies?
Source: Adopted and adapted from Buckley et al. (2009)

ISSN 2564-212X | Journal of Policy & Governance| 01(01) August 2021 | https://doi.org/10.33002/jpg010101
7
Ariffin, Rahman, & Zahari | Systematic Literature Review of Walkability and the Built Environment
3.2 Themes Network Mapping Analysis
The study employed Gephi Software Tools to map the key findings to show the linkages between themes and selected studies. Fahimnia et al. (2015) proposed that Gephi Software Tools can be utilized to implement literature metric analysis for systematic literature review. Prior to conducting themes network mapping analysis, the keywords co-occurrence analysis was constructed using Excel file. Relevant information namely sources, year of publication and themes were keyed-in in the file. A generated .csv file format was then imported into Gephi Software Tool to map themes co-occurrence network. The contraction layout algorithm has been used to position the themes that are linked to each selected article. The results of themes network analysis mapping are presented in figure 2. Based on figure 2, it indicates that population and building density, safety as well as land use and land use mixes have the most linkages towards the selected studies compared to the other four identified themes. This analysis presents that these three themes received much attention from the literature, which also demonstrates that the importance of these three themes to be examined in walkability and built environment research.
Figure 2: Themes network mapping analysis of walkability and built environment
ISSN 2564-212X | Journal of Policy & Governance| 01(01) August 2021 | https://doi.org/10.33002/jpg010101
8
Ariffin, Rahman, & Zahari | Systematic Literature Review of Walkability and the Built Environment
Table 4: Characteristics of studies included in the review ID Author (Label) Year Research objectives Study design Research
setting Location of
study Main findings
1 Cauwenberg et al.
2018 Reviewing statistically and quantitatively summarise study findings on the relationships between physical environmental attributes and leisure-time physical activity among older adults.
Qualitative Meta-literature analysis
Not applicable
i) There are positive associations for walkability, land-use mix—access and aesthetically pleasing scenery with leisure-time walking.
ii) Leisure-time walking within the neighbourhood has positive associations with land-use mix—access and access to public transit and a negative association with barriers to walking/cycling (p = 0.03).
iii) Positive relationships between overall LTPA and access to recreational facilities and parks/open space.
2 Cerin et al. 2014 Examining associations of perceived environmental attributes with overall and neighbourhood-specific walking for transport among the elderly.
Quantitative Survey Hong Kong, People’s Republic of China
i) The degree of perceived access to shops, crowdedness, presence of sitting facilities and easy access of residential entrance were positively related to frequency of overall and within-neighbourhood walking for transportation.
ii) Infrastructure for walking and access to public transport were predictive of higher frequency of transport-related walking irrespective of location.
iii) The perceived degree of land-use mix was predictive of higher levels of within-neighbourhood walking.
3 Ewing et al. 2016 Identify main variables associated with pedestrian traffic volumes.
Qualitative Video analysis
Not applicable
There are significant positive correlations between three out of twenty streetscape features with pedestrian counts after controlling for density and other built environmental variables, namely proportion of windows on the street, the proportion of active street frontage, and the number of pieces of street furniture
4 Ferrer & Ruiz 2018 Comparing factors of the built environment influencing the decision to walk for short trips in two different Spanish cities.
Qualitative Focus Group Discussion
Valencia and Granada, Spain
i) Respondents perceive more facilitators to walking in Granada than in Valencia, explained by the smaller size of the former city and the driving restriction policy in the city centre of Granada for private cars.

ISSN 2564-212X | Journal of Policy & Governance| 01(01) August 2021 | https://doi.org/10.33002/jpg010101
9
Ariffin, Rahman, & Zahari | Systematic Literature Review of Walkability and the Built Environment
ID Author (Label) Year Research objectives Study design Research setting
Location of study
Main findings
ii) The main common barriers to walking in the two cities were insecurity from crime. (absence of people, a poor street lighting or walking along a conflictive area), a high density of traffic lights and walking along large avenues.
5 Forsyth 2015 Reviewing the range of walkability definitions and conceptualising the area by identifying relevant themes.
Qualitative Meta-literature analysis
Not applicable
There are six themes identified related to walkability definitions, namely, lively and sociable, sustainable transport option, exercise-inducing, proxy definitions, multidimensional and measurable and holistic solution.
6 French et al. 2014 Investigating the influence of neighbourhood built form on sense of community.
Quantitative Street connectivity
Perth, Australia
Sense of community was positively associated with walking for transport and positive perceptions of neighbourhood quality, and negatively associated with residential density.
7 Hajrasouliha & Yin
2015 Investigating the impact of street network connectivity on pedestrian volume
Quantitative Street connectivity
New York, United States
The conventional metric-based measure of physical connectivity and geometric based measure of visual connectivity has significant positive impacts on pedestrian volumes, together with job density and land use mix.
8 Jabbari et al. 2018 Assessing a pedestrian network by combining multi-criteria and space syntax
Quantitative Street connectivity
Oporto, Portugal
i) The city centre offers various conditions, but overall, they are poor for pedestrians.
ii) The streets, which scored best, are not integrated into the network.
9 Jack & McCormarck
2014 i) Comparing self-reported measures of the neighborhood built environment between objectively-determined low, medium, and high walkable neighborhoods. ii) Estimating the relative associations between self-reported and objectively-determined neighborhood characteristics and walking. iii) Examining the extent to which the objectively-determined
Qualitative Phone interview
Canada i) Respondents positively perceived access to services, street connectivity, pedestrian infrastructure, and utilitarian and recreation destination mix, but negatively perceived motor vehicle traffic and crime related safety.
ii) Majority of the respondents who live in high walkable neighbourhoods participate in and spend more time per week on walking. iii) Perceived access to services, street connectivity, motor vehicle safety, and mix of recreational destinations were also

ISSN 2564-212X | Journal of Policy & Governance| 01(01) August 2021 | https://doi.org/10.33002/jpg010101
10
Ariffin, Rahman, & Zahari | Systematic Literature Review of Walkability and the Built Environment
ID Author (Label) Year Research objectives Study design Research setting
Location of study
Main findings
built environment moderates the association between self-reported measures of the neighbourhood built environment and walking.
significantly associated with transportation walking.
10 Lai & Kontokosta
2018 Bridging in-situ observations of pedestrian counts and urban computing by integrating high-resolution, large-scale, and heterogeneous urban datasets and analysing both fixed attributes of the urban landscape with dynamic environmental and socio-psychological factor.
Quantitative Street connectivity
New York, United States
i) Overall pedestrian count increase over the last seven years.
ii) Relative stable local pedestrian volumes regardless of season.
iii) Places with high building density, large local populations, and well-connected transit have large intra-day fluctuations in pedestrians.
iv) Complex interaction between pedestrian activity, urban context, and situational factors
iv) Building density, transit access, and the proportion of local residents are found to drive pedestrian activity regardless of the specific day or time of day.
11 Lamíquiz & López-Domínguez
2015 Analysing the influence of the built environment on the decision to walk
Quantitative Street connectivity
Madrid, Spain
Configuration of the urban grid can influence the proportion of pedestrians (as a part of total trips in any transport mode) who choose to walk on single-journey trips
12 Lee et al. 2017 Examining the impact of the multidimensional concepts of the built environment on pedestrian volume in a high-density urban environment.
Quantitative Survey Seoul, Korea.
i) Most built environment variables such as density, diversity, distance, connectivity, and design have statistically significant associations with pedestrian volume.
ii) Relationships between some built environment measures and pedestrian volume have different associations depending on whether they are in residential or commercial zones

ISSN 2564-212X | Journal of Policy & Governance| 01(01) August 2021 | https://doi.org/10.33002/jpg010101
11
Ariffin, Rahman, & Zahari | Systematic Literature Review of Walkability and the Built Environment
ID Author (Label) Year Research objectives Study design Research setting
Location of study
Main findings
13 Marquet & Miralles-Guasch
2015 Analysing proximity travel in Barcelona.
Quantitative Street connectivity
Barcelona, Spain
i) Proximity is more related with personal activities than professional ones and strongly links neighborhood utilization with the personal and domestic realm.
ii) Density acts both as a precondition and a facilitator of proximity uses. However, in highly homogeneous environment it cannot provide the sole explanation for the intensity of local-scale uses.
14 Mouada et al. 2018 Investigating the different urban environments in the hot, dry city of Sidi Okba, (Biskra) during the summer season.
Quantitative Street connectivity
Sidi Okba, Algeria
i) The results show that urban morphology (building density, height/width ratio and tree density) is significantly associated with the outdoor thermal conditions and potential pedestrians over short distances.
ii) In order to provide a comfortable climate and to increase pedestrian choice in the urban environment, the public space should include high building density, combined with deep streets with a high connection between them, and a large amount of vegetation along the lower parts of streets.
15 Oreskovic et al. 2014 Assessing the impact of specific form-related attributes of the built environment have on perceived walkability using cognitive methods
Qualitative Streetscape photo evaluation
Massa-chusetts, United States
The results showed that perceived walkability varied according to the degree to which a particular design attribute was present, with the presence of ground-floor windows and a street focal point most consistently associated with a space's perceived walkability.
16 Ruiz-Padillo et al.
2018 i) Determining the importance of the urban environment characteristics to encourage walking trips from the point of view of the pedestrian using Fuzzy Analytic Hierarchy Process (FAHP). ii) Comparing the values obtained by FAHP with those from other, simpler multi-
Qualitative Meta-literature analysis
Porto Alegre city, Brazil
i) The three most important walkability attributes were: Public Security, Traffic Safety and Pavement Quality. ii) The most important aspect is public security, which closely related with urban violence such as thefts, robberies, and assaults.
ii) The second most important attribute is traffic safety, which is motivated by the

ISSN 2564-212X | Journal of Policy & Governance| 01(01) August 2021 | https://doi.org/10.33002/jpg010101
12
Ariffin, Rahman, & Zahari | Systematic Literature Review of Walkability and the Built Environment
ID Author (Label) Year Research objectives Study design Research setting
Location of study
Main findings
criteria decision analysis techniques. iii) Analysing the existence of differences between various population strata in the walkability evaluation.
high importance attributed to the security/safety criterion.
iii) The aspects considered less important by the individuals are slope and connectivity. Majority of the respondents are more concern about their safety and the convenience of the route.
17 Singh 2018 Identify factors that contribute to increase urban walkability in order to improve neighbourhood sustainability and public life
Quantitative Survey New Delhi, India,
The most important factors affecting pedestrians' perception of walkability were related to the built envelop on either side of the streets. Factors relating to urban morphology like enclosure block length and edge conditions were found crucial in creating the perception of a walkable neighbourhood.
18 Tsiompras & Photis
2017 Present a weighted approach of a GIS-based walkability index, adapted to the Greek urban environment and either for utilitarian or recreational walking trips.
Quantitative Survey Greece Majority respondents choose walking / cycling to their daily destinations. The study also found that proximity to basic urban destinations is assigned the highest weight and population density is the lowest value.
19 Wilson et al. 2014 (i) Examining the feasibility of using a simple survey instrument to assess the quality of street-connecting walkways (ii) Determining whether such walkways would be suggested routes on a commonly used internet-based service (Google Maps)
Quantitative Street connectivity
Welling-ton, New Zealand
Walkways are very feasible for and favourable by the respondents.
20 Zandieh et al. 2016 Examining inequalities in perceived built environment attributes and its possible influences on disparities in older adults’ outdoor walking levels in low- and high-deprivation areas
Mixed method
Survey and interview
Birming-ham, United Kingdom
Inequalities in perceived neighbourhood safety, pedestrian infrastructure and aesthetics in high- versus low-deprivation areas. The attributes influence disparities in participants’ outdoor walking levels.

ISSN 2564-212X | Journal of Policy & Governance| 01(01) August 2021 | https://doi.org/10.33002/jpg010101
13
Ariffin, Rahman, & Zahari | Systematic Literature Review of Walkability and the Built Environment
3.3 Thematic Analysis of the Systematic Literature Review The following sub-sections present the details explanation of the systematic literature review
results. The results have been divided into seven sections, based on themes constructed through analysis of literature. 3.3.1 Population and Building Density
Several literatures have mentioned density as a very fundamental precursor for walking. Using a multi-variate model, Lamíquiz and López-Domínguez (2015) found density as one of the five indices that consistently influence the preference for walking. While the findings from a research undertaken by Mouada, Zemmouri and Meziani (2018) show that building density and tree density, which is known as urban morphology, are among the attributes that are significantly associated with the outdoor thermal conditions and potential pedestrian activity over short distances. This finding is supported by a study by Lai and Kontokosta (2018) who found building density to drive pedestrian activity regardless of the specific day or time of day.
The result of a study undertaken by Lee et al. (2017) in Seoul, Korea indicates that density has statistically significant association with pedestrian volume in Seoul. Meanwhile, a study involving adults in Calgary, Canada shows that a high walkable (HW) neighborhood has high population density compared to medium and low walkable neighborhood (Jack & McCormark, 2014). Although density is considered fundamental in promoting walking, some studies have shown that it has limitation. As an example, a research by Marquet and Miralles-Guasch (2015) suggests that beyond a certain level of density, income and sociological factors gained dominance in determining walkability at a local level. 3.3.2 Land Use and Land Use Mixes
Lamíquiz and López-Domínguez (2015) in their study found land use as one of the indices that influence walking. Different land use attracts different characteristic of people, which is then very much associated with the usage of the type of transport mode. Many studies have shown the importance of land use mix in attracting walking. Land use mix is the level of integration among different land use types in an area, which means that it shows the spatial intensity of heterogeneous land use types (Tsiompras & Photis, 2017). In their study, Tsiompras and Photis (2017) found that other than proximity, land use mix is the next most popular motivation for walking. Another related study associated to land use mix was undertaken by Jack and McCormack (2014) who found that utilitarian and recreation destination mix is positively perceived as an inducer to walking in HW neighborhood. The findings from the two studies are consistent with a study by Hajrasouliha and Yin (2015) who suggest that land use mix has significant positive impacts on pedestrian volumes.
There is a growing body of literature on the elderly, ageing and their relationship with walkability. In this context, many a times, it is related to the importance of mobility as a precursor to a healthy lifestyle for the elderly. A study of the elderly in Hong Kong shows that the perceived degree of land use mix was predictive of higher levels of within neighbourhood walking (Cerin et al., 2014). A systematic review and meta-analysis study of relationships between neighbourhood physical environmental attributes and older adults’ leisure-time physical activity observes that there are positive associations for walkability and land-use mix-access (Cauwenberg et al., 2018). 3.3.3 Safety
Many studies show that the lack of safety is a key barrier to walking. This is true of safety from crime as well as traffic (Forsyth, 2015). For instance, a study of a random cross-section of 1875 Canadian adults found that respondents in HW neighbourhood have a negative perception on motor vehicle traffic and crime related safety (Jack & McCormack, 2014). Meanwhile, the finding in another study undertaken in two cities, Granada and Valencia, shows that the main common barriers to walking were insecurity from crime (Ferrer & Ruiz, 2018). The insecurity was due to the absence of people, a poor street lighting or walking along a conflictive area. According to Wilson et al. (2014), perceptions of safety may also impact walking levels.
Local crime events have a constant negative impact on pedestrian activity (Lai & Kontokosta, 2018). On similar note, a study by Ruiz-Padillo et al. (2018) in Porto Alegre, Brazil found that the most important aspect in promoting walkability is the public security. They further stated that the result is not surprising, as urban violence, related mainly to thefts, robberies, and assaults, is one of the principal social

ISSN 2564-212X | Journal of Policy & Governance| 01(01) August 2021 | https://doi.org/10.33002/jpg010101
14
Ariffin, Rahman, & Zahari | Systematic Literature Review of Walkability and the Built Environment
problems in Brazil. The next important aspect after public security or safety from crime, according to the study, is traffic safety. 3.3.4 Aesthetics and Streetscape Feature
Aesthetic refers to a sense of beauty and visual appearance of a neighbourhood (Zandieh et al., 2016), while streetscape feature is the micro features of the street environment (Ewing et al., 2016). A study by Ewing et al. (2017) in New York found significant positive correlation between three out of twenty streetscape features with pedestrian counts. The significant streetscape features are the proportion of windows on the street, the proportion of active street frontage, and the number of pieces of street furniture. The street furniture is defined as all kinds of signs, benches, parking meters, trash cans, newspaper boxes, bollards, streetlights, and other things related to this category. The next feature is the percentage of active uses, which are defined as shops, restaurants, public parks, and other uses that generate significant pedestrian traffic. The final feature is ‘windows as a percentage of ground floor façade’. According to the study, the last feature is a common operational definition of transparency. A high level of transparency at the ground level can facilitate interaction between adjacent buildings, which has been known to promote street vitality.
Cauwenberg et al. (2018) in a systematic review observes that there is a positive association for walkability and aesthetically pleasing scenery with leisure time walking. Among the elements that can contribute to aesthetically pleasing scenery are greeneries and street furniture. A study by Jabbari et al. (2018) shows that green spaces are linked to higher walkable scores. They further stated that the green spaces create more attractive walking environments and have positive impact on the microclimatic conditions at the pedestrian level. 3.3.5 Street Network and Connectivity
Many studies have shown the importance of street network in motivating walking. Network design has been said to help in determining the ability of pedestrians to reach their destinations. Grid networks with short blocks allow for relatively direct routes, while long blocks and curvilinear streets lengthen pedestrian trips by requiring circuitous routes. A study by Singh (2016) in India concluded that block length and perceived walking distance are directly proportional to each other. He further stated that shorter block lengths make the streets more walkable as people perceive the distances to be shorter and prefer taking such routes, thus increasing street activity.
Finding in a study by Hajrasouliha and Yin (2015) suggests that physical connectivity has significant positive impacts on pedestrian volumes. Similarly, Jack and McCormack (2014) found in their study that respondents in HW neighborhoods positively perceived street connectivity. This is in line with the suggestion by Lamíquiz and López-Domínguez (2015) that the design of a street network configuration could insert multiple activities along the routes, and thus shorten distances if done appropriately. The findings introduce the idea that the configuration of the urban grid can influence the proportion of pedestrians who choose to walk on single-journey trips. 3.3.6 Visual Connectivity
Visual connectivity has significant positive impacts on pedestrian volumes (Hajrasouliha & Yin 2015). The results of a study by Oreskovic et al. (2014) show that perceived walkability varied according to the degree to which a particular design attribute was present. According to the study, the presence of ground-floor windows and a street focal point are two attributes that most consistently associated with a space's perceived walkability. The presence of a window at the eye-level of pedestrian, which indicate retail presence is an important attribute towards promoting walkability. This idea is similar to the study by Ewing (2016) that mentioned the importance of windows at the ground floor façade. A study by Singh (2016) also has a parallel concept with the above two studies where he found most of the recorded answers from the respondents stated that the presence of blank walls was the factor they thought made them feel unsafe or claustrophobic on the street. This factor discourages pedestrians to be on the roads and, as a result, decreased the walkability of that area. 3.3.7 Proximity
Basically, many definitions of walkable places are places that support short walking trips to essential facilities and services for running daily errands. Studies have shown that proximity to destinations supports active transport and mobility (Tsiompras & Photis, 2017). The results of a survey

ISSN 2564-212X | Journal of Policy & Governance| 01(01) August 2021 | https://doi.org/10.33002/jpg010101
15
Ariffin, Rahman, & Zahari | Systematic Literature Review of Walkability and the Built Environment
by Tsiompras and Photis (2017) indicate that proximity (up to 400 m) to urban destinations is the main motivation for people to walk. This finding is consistent with a study by Lamíquiz and López-Domínguez (2015) that found distance, either real or perceived, is one of the most principal barriers for travelling on foot. In general, smaller cities are more walkable because distance between different activity locations is shorter than in larger cities (Ferrer & Ruiz, 2018). Therefore, Ferrer and Ruiz (2018) suggested for large cities to pay more attention to the provision of mixed land uses as an important characteristic of the built environment in encouraging walking for transport. They suggested that proximity to destinations in conjunction with the land use mix seems to be the fundamental keys for walkability. Their result also show that participants perceive more facilitators to walking in Granada than in Valencia due to the smaller size of the former city. 4. DISCUSSIONS
Walking relies not only on the infrastructure but also on the state of the built environment (Cauwenberg, 2018). While pedestrian infrastructure is an imperative to fulfil certain pedestrian needs, others such as proximity, safety or aesthetics, depend not so much on the pavements, but on the surrounding environment. In this context, how pedestrian-friendly buildings are, or the type of land use found in the area, do influence walking. Some discourses on walkability focus on environmental features or means of making walkable environments. These environmental features include areas being passable, compact, physically enticing, and safe, while others are more concerned with the outcomes fostered by such environments (Forsyth, 2015). Among the potential outcomes are making the places lively, enhancing sustainable transportation options, and encouraging the physical exercise.
Many of the criteria found to be the antecedents to walking are not a detached or unconnected element. Many of them must be combined to create a walkable environment. For instance, a study by Mouada, Zemmouri and Meziani (2018) shows that to provide a comfortable condition and to increase pedestrian choice in the urban environment, the public space should include high building density, combined with deep streets with a high connection between them, and an abundance of vegetation along the lower parts of streets. This example shows that density is combined with street network, connectivity and aesthetic or pleasing scenery to encourage walking (Raja Noriza et al., 2019).
The review found that three criteria are somewhat constant in promoting walking, namely, population and building density, land use and land use mixes, and safety. Mixed or different uses in the same place tend to strengthen the identity of the place according to Jacobs (1961), while density or proximity of the mixed uses strengthen the economy of the place and enable people to travel less distance to access daily needs. Undoubtedly, safety is a very fundamental precursor to walking. Studies have indicated that people are very much reluctant to walk in the absence of safety. It means that although they are presented with pleasing scenery and good infrastructure, people do not want to jeopardize their safety by walking. 5. CONCLUSION
Jacobs (1961), who triggers the concept of New Urbanism that advocated pedestrian-friendly design, mixed land use, and transit-oriented development has championed the ‘eye on the street’ concept, which emphasized the needs of having high pedestrian volume in an area. The presence of pedestrian, according to her, can deter crime and increase sense of community. There is an element of safety in promoting walking in this concept. In short, the literature review shows that by making an area perceived as safe and the presence of land use mixes and density are the best combination to create a walkable environment. Hence, cities need to consider these three fundamental criteria in formulating policy towards creating a friendly pedestrian environment. This review has some limitations. It does not differentiate between walking for leisure, walking for public transit or any other reasons for walking, such as commuting, going to work, running errands and others. Nor does it differentiate between the Eastern and Western countries. There may exist variance between the East and the West due to the environment, cultural and behavioral differences. Thus, we recommend that future systematic review to differentiate between these fundamental attributes.

ISSN 2564-212X | Journal of Policy & Governance| 01(01) August 2021 | https://doi.org/10.33002/jpg010101
16
Ariffin, Rahman, & Zahari | Systematic Literature Review of Walkability and the Built Environment
ACKNOWLEDGEMENTS
This work was supported by the Research University Grant – Faculty Program funded by University of Malaya, Malaysia under grant number GPF016P-2018. REFERENCES Al-Tabbaa, O., Ankrah, S., & Zahoor, N. (2019). Systematic literature review in management and business
studies: A case study on university–industry collaboration. SAGE Research Methods Cases, https://www.doi.org/10.4135/9781526467263
Blečić, I., Cecchini, A., Congiu, T., Fancello, G., & Trunfio, G. A. (2014). Walkability explorer: An evaluation and design support tool for Walkability. Computational Science and Its Applications – ICCSA, 2014, 511-521. https://doi.org/10.1007/978-3-319-09147-1_
Bramer, W. M., de Jonge, G. B., Rethlefsen, M. L., Mast, F., & Kleijnen, J. (2018). A systematic approach to searching: an efficient and complete method to develop literature searches. Journal of the Medical Library Association (JMLA), 106(4), 531–541. https://doi.org/10.5195/jmla.2018.283
Buckley, S., Coleman, J., Davison, I., Khan, K.S., Zamora, J., Malick, S., Morley, D., Pollard, D., Ashcroft, T., Popovic, C. & Sayers, J. (2009). The educational effects of portfolios on undergraduate student learning: a Best Evidence Medical Education (BEME) systematic review. BEME Guide No. 11. Med Teach, 31, 282e98. https://doi.org/ 10.1080/01421590902889897
Carvalho, M.M., Fleury, A., & Lopes, A.P. (2013), An overview of the literature on technology roadmapping (TRM): contributions and trends. Technological Forecasting and Social Change, 80(7), 1418-1437. https://doi.org/10.1016/j.techfore.2012.11.008
Cauwenberg, J., Nathan, A., Barnett, A., Barnett, D. W., & Cerin, E. (2018). Relationships Between Neighbourhood Physical Environmental Attributes and Older Adults’ Leisure-Time Physical Activity: A Systematic Review and Meta-Analysis. Sports Medicine, 48(7), 1-26. https://doi.org/10.1007/s40279-018-0917-1
Cerin, E., Sit, C. H., Barnett, A., Johnston, J. M., Cheung, M. C., & Chan, W. M. (2014). Ageing in an ultra-dense metropolis: perceived neighbourhood characteristics and utilitarian walking in Hong Kong elders. Public Health Nutrition, 17(1), 225-232. https://doi.org/10.1007/s40279-018-0917-1
Cowen, C., Louderback, E. R., & Roy, S. S. (2018). The role of land use and walkability in predicting crime patterns: A spatiotemporal analysis of Miami-Dade County neighborhoods, 2007–2015. Security Journal, 32(3), 264-286. https://doi.org/10.1057/s41284-018-00161-7
Dada, O. (2018). A model of entrepreneurial autonomy in franchised outlets: a systematic review of the empirical evidence. International Journal of Management Reviews, 20(2), 206-226. https://doi.org/10.1111/ijmr.12123
Devarajan, R., Prabhakaran, D., & Goenka, S. (2019). Built environment for physical activity—An urban barometer, surveillance, and monitoring. Obesity Reviews, 21(1), e12938. https://doi.org/10.1111/obr.12938
Ewing, R., Hajrasouliha, A., Neckerman, K. M., Purciel-Hill, M., & Greene, W. (2016). Streetscape Features Related to Pedestrian Activity. Journal of Planning Education and Research, 36(1), 5-15. https://doi.org/10.1177%2F0739456X15591585
Fahimnia, B., Sarkis, J., Davarzani, H. (2015). Green supply chain management: A review and bibliometric analysis. Int. J. Prod. Econ, 162, 101–114. https://doi.org/10.1016/j.ijpe.2015.01.003
Ferrer, S. & Ruiz, T. (2018). The Impact of the Built Environment on the Decision to Walk for Short Trips: Evidence from Two Spanish Cities. Transport Policy, 67(1), 111-120. https://doi.org/10.1016/j.tranpol.2017.04.009
Forsyth, A. (2015). What is a walkable place? The Walkability Debate in Urban Design. Urban Design International, 20(4), 274-292. https://doi.org/10.1057/udi.2015.22
Forsyth, A., Michael Oakes, J., Lee, B., & Schmitz, K. H. (2009). The built environment, walking, and physical activity: Is the environment more important to some people than others? Transportation Research Part D: Transport and Environment, 14(1), 42-49. https://doi.org/10.1016/j.trd.2008.10.003
French, S., Wood, L., Foster, S.A., Giles-Corti, B., Frank, L., & Learnihan, V. (2014). Sense of Community and Its Association with the Neighborhood Built Environment. Environment and Behavior, 46(6), 677-697. https://doi.org/10.1177/0013916512469098

ISSN 2564-212X | Journal of Policy & Governance| 01(01) August 2021 | https://doi.org/10.33002/jpg010101
17
Ariffin, Rahman, & Zahari | Systematic Literature Review of Walkability and the Built Environment
Guo, P., Watts, K., & Wharrad, H. (2015). An integrative review of the impact of mobile technologies used by healthcare professionals to support education and practice. Nursing Open, 3(2), 66–78. https://doi.org/10.1002/nop2.37
Hajrasouliha, A. & Yin, L. (2015). The impact of street network connectivity on pedestrian volume. Urban Studies, 52(13), 2483-2497.
Jabbari, M., Fonseca, F., & Ramos, R. (2018). Combining Multi-Criteria and Space Syntax Analysis to Assess a Pedestrian Network: The Case of Oporto. Journal of Urban Design, 23(1), 23-41. https://doi.org/10.1080/13574809.2017.1343087
Jack, E., & McCormack, G. R. (2014). The Associations between Objectively-Determined and Self-Reported Urban Form Characteristics and Neighborhood-Based Walking in Adults. International Journal of Behavioral Nutrition and Physical Activity, 11(1), 71-82. https://doi.org/10.1186/1479-5868-11-71
Jacobs, J. (1961). The Death and Life of Great American Cities. London, UK: Penguin Random House. Jung, E., Lee, J., & Kim, K. (2015). The Relationship Between Pedestrian Environments and Sense of
Community in Apartment Complexes in Seoul, Korea. Journal of Asian Architecture and Building Engineering, 14(2), 411-418. https://doi.org/10.3130/jaabe.14.411
Khan, M. A., Grivna, M., Nauman, J., Soteriades, E. S., Cevik, A. A., Hashim, M. J., Govender, R., & Al Azeezi, S. R. (2020). Global incidence and mortality patterns of pedestrian road traffic injuries by Sociodemographic index, with forecasting: Findings from the global burden of diseases, injuries, and risk factors 2017 study. International Journal of Environmental Research and Public Health, 17(6), 2135. https://doi.org/10.3390/ijerph17062135
Kim H.M. & Mateo-Babiano I. (2018). Pedestrian Crossing Environments in an Emerging Chinese City: Vehicle Encountering, Seamless Walking, and Sensory Perception Perspectives. Sustainability, 10(7), 2200. https://doi.org/10.3390/su10072200
Kim, J.K., Ulfarsson, G.F., Shankar, V.N., & Kim, S. (2008). Age and pedestrian injury severity in motor-vehicle crashes: A heteroskedastic logit analysis. Accid. Anal. Prev., 40, 1695–1702. https://doi.org/10.1016/j.aap.2008.06.005
Kitchenham, B., & Charters, S. (2007). Guidelines for Performing Systematic Literature Reviews in Software Engineering. In EBSE Technical Report, Software Engineering Group, School of Computer Science and Mathematics, Keele University, Department of Computer Science, University of Durham
Lai, Y., & Kontokosta, C. E. (2018). Quantifying Place: Analyzing the Drivers of Pedestrian Activity in Dense Urban Environments. Landscape and Urban Planning, 180(1), 166-178. https://doi.org/10.1016/j.landurbplan.2018.08.018
Lamíquiz, P. J., & López-Domínguez, J. (2015). Effects of Built Environment on Walking at the Neighbourhood Scale. A New Role for Street Networks by Modelling Their Configurational Accessibility? Transportation Research Part A: Policy and Practice, 74(1), 148-163. https://doi.org/10.1016/j.tra.2015.02.003
Lee, C., Kim, H. J., Dowdy, D. M., Hoelscher, D. M., & Ory, M. G. (2013). TCOPPE school environmental audit tool: Assessing safety and Walkability of school environments. Journal of Physical Activity and Health, 10(7), 949-960. https://doi.org/10.1123/jpah.10.7.949
Lee, S., Sung, H., & Woo, A. (2017). The Spatial Variations of Relationship Between Built Environment and Pedestrian Volume: Focused on the 2009 Seoul Pedestrian Flow Survey in Korea. Journal of Asian Architecture and Building Engineering, 16(1), 147-154, 2017. https://doi.org/10.3130/jaabe.16.147
Liu, A. G., Schuler, K., & Herberman Mash, H. B. (2020). Using a systematic literature review to assess the utility of mobile applications in disaster health settings. SAGE Research Methods Cases. https://www.doi.org/10.4135/9781529722741
Lo, R.H. (2009). Walkability: what is it? Journal of Urbanism: International Research on Placemaking and Urban Sustainability, 2(2), 145-166. http://doi.org/10.1080/17549170903092867
Lund, H. (2002). Pedestrian Environments and Sense of Community. Journal of Planning Education and Research, 21(3), 301-312.
Marquet, O., & Miralles-Guasch, C. (2015). The Walkable City and the Importance of the Proximity Environments for Barcelona’s Everyday Mobility. Cities, 42(1), 258-266. https://doi.org/10.1016/j.cities.2014.10.012

ISSN 2564-212X | Journal of Policy & Governance| 01(01) August 2021 | https://doi.org/10.33002/jpg010101
18
Ariffin, Rahman, & Zahari | Systematic Literature Review of Walkability and the Built Environment
Mayou, R.; Bryant, B. (2003). Consequences of road traffic accidents for different types of road user. Injury, 34(3), 197–202. https://doi.org/10.1016/s0020-1383(02)00285-1
Mertens, D. (2018). Mixed methods evaluation designs for systematic reviews. In Mixed methods design in evaluation. Thousand Oaks, CA: SAGE Publications, Inc. https://www.doi.org/10.4135/9781506330631
Moher, D., Shamseer, L., Clarke, M., Ghersi, M., Liberati, M., Petticrew, M., Shekelle, P., Lesley A Stewart, L.A.; PRISMA-P Group (2015). Preferred reporting items for systematic review and meta-analysis protocols (PRISMA-P) 2015 statement. Syst Rev, 4(1). https://doi.org/10.1186/2046-4053-4-1
Mouada, N., Zemmouri, N., & Meziani, R. (2018). Urban Morphology, Outdoor Thermal Comfort and Walkability in Hot, Dry Cities. International Review for Spatial Planning and Sustainable Development, 7(1), 117-133. http://dx.doi.org/10.14246/irspsda.7.1_
Munn, Z.; Tufanaru, C. & Aromataris, E. (2014). JBI's Systematic Reviews. American Journal of Nursing, 114(7), 49-54. https://doi.org/10.1097/01.NAJ.0000451683.66447.89
Nightingale, A. (2009). A guide to systematic literature reviews. Surgery, 27(9), 381-384. https://doi.org/10.1016/j.mpsur.2009.07.005
Oreskovic, N. M., Charles, S. L., Roth, P., Tsigaridi, D., Shepherd, K., Nelson, K. P., & Bar, M. (2014). Attributes of Form in the Built Environment that Influence Perceived Walkability. Journal of Architectural and Planning Research, 31(3), 218-232.
Park, S., Kang, J. & Choi, K. (2014). Finding determinants of transit users’ walking and biking access trips to the station: A pilot case study. KSCE J Civ Eng, 18, 651–658. https://doi.org/10.1007/s12205-014-0073-6
Pearce, J.R. & Maddison, R. (2011). Do enhancements to the urban built environment improve physical activity levels among socially disadvantaged populations? Int. J. Equity Health, 10(28). https://doi.org/10.1186/1475-9276-10-28
Peng, R.Y. & Bongard, F.S. (1999). Pedestrian versus motor vehicle accidents: an analysis of 5,000 patients11No competing interests declared. Journal of the American College of Surgeons, 189(4), 343-348. https://doi.org/10.1016/s1072-7515(99)00166-0
PRISMA Statement. (2015). PRISMA Statement. Retrieved on 14 February 2021 from http://www.prisma-statement.org/
Rafiemanzelat, R., Emadi, M. I., & Kamali, A. J. (2017). City sustainability: The influence of walkability on built environments. Transportation Research Procedia, 24, 97-104. https://doi.org/10.1016/j.trpro.2017.05.074
Raja Noriza Raja Ariffin, Rustam Khairi Zahari & Nur Hairani Abd. Rahman (2019). Walkability and the Built Environment: A Literature Review. 6th International Multidisciplinary Scientific Conference on Social Sciences and Arts 2019, 6(6.1), 649 – 656. https://doi.org/10.5593/sgemsocial2019V/6.1/S17.077
Ranasinghe, G., Amarawickrama, S., Rathnayake, R., Randeniya, T., & Rathnasiri, S. (2015). A model for assessing the level of Walkability in urban neighborhoods in Sri Lanka. International Journal of Built Environment and Sustainability, 2(4). https://doi.org/10.11113/ijbes.v2.n4.97
Ruiz-Padillo, A., Pasqual, F. M., Uriarte, A. M. L., & Cybis, H. B. B. (2018). Application of Multi-Criteria Decision Analysis Methods for Assessing Walkability: A Case Study in Porto Alegre, Brazil. Transportation Research Part D: Transport and Environment, 63(1), 855-871. https://doi.org/10.1016/j.trd.2018.07.016
Shamsuddin, S., Hassan, N. & Bilyamin, S. (2012). Walkable Environment in Increasing the Liveability of a City. Procedia - Social and Behavioral Sciences, 50(1), 167 – 178. https://doi.org/10.1016/j.sbspro.2012.08.025
Singh, R. (2016). Factors Affecting Walkability of Neighborhoods. Procedia-Social and Behavioral Sciences, 216(1), 643-654. https://doi.org/10.1016/j.sbspro.2015.12.048
Sirelkhatim, F., Gangi, Y. and Nisar, T. (2015). Entrepreneurship education: a systematic literature review of curricula contents and teaching methods. Cogent Business and Management, 2(1), 1052034. https://doi.org/10.1080/23311975.2015.1052034
Smith J. & Noble H. (2014). Bias in research evidence-based. Nursing, 17, 100-101. https://dx.doi.org/10.1097%2FPRS.0b013e3181de24bc
Tight, M. (2019). Systematic reviews and meta-analyses. In Documentary research in the social sciences (pp. 85-94). London: SAGE Publications Ltd, https://www.doi.org/10.4135/9781529716559

ISSN 2564-212X | Journal of Policy & Governance| 01(01) August 2021 | https://doi.org/10.33002/jpg010101
19
Ariffin, Rahman, & Zahari | Systematic Literature Review of Walkability and the Built Environment
Torgerson, C. (2003). Systematic Reviews (Continuum Research method): a very accessible and readable guide to systematic reviews. London: Bloomsbury Publishing.
Tsai, T. (2014). Strategies of Building a Stronger Sense of Community for Sustainable Neighborhoods: Comparing Neighborhood Accessibility with Community Empowerment Programs. Sustainability, 6(1), 2766-2785. https://doi.org/10.3390/su6052766
Tsiompras, A. B., & Photis, Y. N. (2017). What Matters When It Comes to “Walk and the City”? Defining A Weighted GIS-Based Walkability Index. Transportation Research Procedia, 24(1), 523-530. https://doi.org/10.1016/j.trpro.2017.06.001
United Nations (undated). 17 Goals to Transform Our World. Retrieved from https://www.un.org/sustainabledevelopment/ (accessed on 28 February 2021).
Wang, L., Jiang, Y. L., & Li, Z. J. (2012). The Walkability assessment of Lishan road: A case study in Jinan, China. Applied Mechanics and Materials, 178(181), 1838-1841. https://doi.org/10.4028/www.scientific.net/amm.178-181.1838
Wilson, N., Brander, B., Mansoor, O. D., & Pearson, A. L. (2014). Building a Reliable Measure for Unobtrusive Observations of Street-Connecting Pedestrian Walkways. Journal of Urban Health, 91(6), 1129-1135. https://doi.org/10.1007/s11524-014-9891-6
World Health Organization. (2018). Global Status Report on Road Safety 2018: Summary; (WHO/NMH/NVI/1820). World Health Organization: Geneva, Switzerland, 2018. Retrieved from https://apps.who.int/iris/bitstream/handle/10665/277370/WHO-NMH-NVI-18.20-eng.pdf?ua=1 (accessed on 28 February 2021).
Xiao, Y., & Watson, M. (2019). Guidance on Conducting a Systematic Literature Review. Journal of Planning Education and Research, 39(1), 93-112. https://www.doi.org/10.1177/0739456X17723971
Yassin, H. (2019). Livable city: An approach to pedestrianization through tactical urbanism. Alexandria Engineering Journal, 58(1), 251-259. https://doi.org/10.1016/j.aej.2019.02.005
Zandieh, R., Martinez, J., Flacke, J., Jones, P., & Van Maarseveen, M. (2016). Older Adults’ Outdoor Walking: Inequalities in Neighbourhood Safety, Pedestrian Infrastructure and Aesthetics. International Journal of Environmental Research and Public Health, 13(12), 1179-1203. https://dx.doi.org/10.3390%2Fijerph13121179
Zhang, G., Yau, K. K., & Zhang, X. (2014). Analyzing fault and severity in pedestrian–motor vehicle accidents in China. Accident Analysis & Prevention, 73, 141-150. https://doi.org/10.1016/j.aap.2014.08.018

ISSN 2564-212X | Journal of Policy & Governance| 01(01) August 2021 | https://doi.org/10.33002/jpg010101
20
Ariffin, Rahman, & Zahari | Systematic Literature Review of Walkability and the Built Environment
AUTHORS’ DECLARATIONS AND ESSENTIAL ETHICAL COMPLIANCES Authors’ Contributions (in accordance with ICMJE criteria for authorship)
Contribution Author 1 Author 2 Author 3 Conceived and designed the research or analysis Yes Yes Yes
Collected the data No Yes No
Contributed to data analysis & interpretation Yes No Yes
Wrote the article/paper Yes Yes No
Critical revision of the article/paper Yes No Yes
Editing of the article/paper Yes Yes No
Supervision No Yes No
Project Administration Yes No No
Funding Acquisition Yes No No
Overall Contribution Proportion (%) 40 40 20
Funding The funding for this research was made available by the Research University Grant – Faculty Program funded by University of Malaya, Malaysia under grant number GPF016P-2018. Research involving human bodies (Helsinki Declaration) Has this research used human subjects for experimentation? No Research involving animals (ARRIVE Checklist) Has this research involved animal subjects for experimentation? No Research involving Plants No plant was used to conduct this research. Research on Indigenous Peoples and/or Traditional Knowledge Has this research involved Indigenous Peoples as participants or respondents? No
(Optional) PRISMA (Preferred Reporting Items for Systematic Reviews and Meta-Analyses) Have authors complied with PRISMA standards? Yes Competing Interests/Conflict of Interest Authors have no competing financial, professional, or personal interests from other parties or in publishing this manuscript. RIGHTS AND PERMISSIONS Open Access. This article is licensed under a Creative Commons Attribution 4.0 International License, which permits use, sharing, adaptation, distribution and reproduction in any medium or format, as long as you give appropriate credit to the original author(s) and the source, provide a link to the Creative Commons license, and indicate if changes were made. The images or other third-party material in this article are included in the article's Creative Commons license, unless indicated otherwise in a credit line to the material. If material is not included in the article's Creative Commons license and your intended use is not permitted by statutory regulation or exceeds the permitted use, you will need to obtain permission directly from the copyright holder. To view a copy of this license, visit http://creativecommons.org/licenses/by/4.0/.

M – 00228 | Research Article ISSN 2564-212X 01(01) | August 2021
Municipal Bonds as a Financial Component of the Development of Territorial Communities in Ukraine
Volodymyr Ivanyshyn1, Alla Pecheniuk*2 1Rector, State Agrarian and Engineering University in Podilya, Ukraine. Email: [email protected] | ORCID: 0000-0003-1255-1638 2Department of Economics, Entrepreneurship, Trade and Exchange Activities, Faculty of Economics, State Agrarian and Engineering University in Podilya, Ukraine. Email: [email protected] | ORCID: 0000-0002-3582-9236 *Corresponding author
ABSTRACT The world economic thought has a number of tools, the use of which helps attract financial investment and helps accumulate additional funds for infrastructure and social projects of municipalities. The issue of municipal bonds as a financial component of the development of territorial communities is considered vital for this research in which the factors that determine the ability to borrow are highlighted. The advantages and disadvantages of using municipal bonds by local governments are also identified. It is realized that the world experience in the application of municipal bonds is contradictory and ambiguous. It is established that the best results from the use of bonds have been the municipalities of countries with a high level of development and municipal management, which determines the demand for this type of securities from investors. The use of municipal bond in countries with economies in transition has led to a number of municipal defaults, resulting in severe restrictions on their issuance by central authorities. The united communities of Ukraine require additional financial resources. Smaller municipalities are characterized by a high rate of budget subsidies and low average income per community. Ukrainian territorial communities’ municipal bonds are used insufficiently in comparison to developed industrial countries. Factors that shape the risks of implementing a system of local borrowing in Ukraine are identified and include lack of recognition and registration of local governments as legal entities under public law, imperfection of legislation, lack of experience in local borrowing, lack of clear information about the available resources of local communities and their valuation. Keywords: Financial resources; Municipal bonds; Territorial communities; Securities; Financial market
Received: 13 June 2021 Reviewed: 29 June 2021 Accepted: 11 July 2021 Published: 10 August 2021
__________________________________________________________________________________________________________________ How to cite this paper: Ivanyshyn, V. & Pecheniuk, A. (2021). Municipal Bonds as a Financial Component of the Development of
Territorial Communities in Ukraine. Journal of Policy & Governance, 01(01), 21-29. https://doi.org/10.33002/jpg010102
Copyright © 2021 by author(s). This work is licensed under the Creative Commons Attribution International License (CC BY 4.0). http://creativecommons.org/licenses/by/4.0/
ISSN 2564-212X | Journal of Policy & Governance| 01(01) August 2021 | https://doi.org/10.33002/jpg010102
22
Ivanyshyn & Pecheniuk | Municipal Bonds as a Financial Component of the Development of Territorial Communities in Ukraine
1. INTRODUCTION
The active phase of implementation of decentralization reform in Ukraine is accompanied by a number of challenges and uncertainties. A typical problem of municipalities in developing countries is their issues surrounding the financial security, weak fiscal base, low creditworthiness, and lack of experience in fulfilling their debt obligations, which leads to the search for ways to solve the financial crises.
The relevant economic theory tends to show developments concerning the municipal loan market, the main component of which is the issuance of debt obligations by municipalities in the form of bonds. Their issuance allows to provide local territorial communities with the additional financial resources enabling the implementation of socio-economic and infrastructural programs on the ground. In practice of local governance of Ukraine, municipal bonds have not received due attention and are characterized by low quotations compared to other types of loans. However, statistics show a fairly high level of popularity of this type of securities worldwide among a wide range of investors. Given that the decentralization of power in Ukraine should result into a new economic base for the development of its regions, an important aspect of solving a number of problems. It pertains to the creation of an effective financial market system in which municipal bonds can occupy a niche.
With the above backdrop, purpose of this article is to highlight trends of and prospects for the municipal bonds as a source of financial pool for strengthening the local governance and delivering development good.
2. REVIEW OF LITERATURE
The issues related to municipal bonds are reflected in the works of many scholars. In particular, Howard (2020) emphasizes on municipal bonds and identifies their types and characteristics as collateral. Kopanyi (2018) explores the issues of bond issuance, their financial security and the definition of prohibitions and restrictions on their issuance, which are specific to individual countries. Roberts (2020) highlights the impacts of pandemic on the financial condition of companies and governments, arguing that the world expects significant depressions and predicts the negative development of financial markets. Ukrainian researchers, in particular, Rekunenko (2014), Savenko (2020), Iorgachova and Kovalova (2019) indicate need of the development of the infrastructure of financial market in Ukraine and note the urgent need for infrastructure modernization and its harmonization with international standards. Scientific research by Zolotukhin (2017) highlights international experience of the functioning of local borrowing markets and how those conclusions can be adapted in Ukraine. 3. RESULT AND DISCUSSION
Aware of the existing scientific developments, authors believe that in-depth research requires finding the optimal concept of financing and raising funds in modern scenario from the standpoint of the use of municipal bonds by local governments.
What are the characteristics and global trends of municipal bonds? A significant growth in the municipal bond market occurred in the 1990s. It was triggered by the high rate of urbanization in Latin America and other developing regions. During this period, many municipalities issued bonds to ensure the inflow of financial resources and refinancing. The process at that time ended in municipal and regional defaults, forcing national governments to absorb municipal debts and increase public debt. As a result, many countries have legally banned or severely restricted the borrowings. In table 1 are summed up some generalized restrictions on borrowings.
As evident from the experience of many countries around the world, not all local governments can issue bonds. Exceptions to the rules are municipalities with significant investment programs and good ratings. For small municipalities, loans from commercial banks may be the best alternative. Important in this analysis of debt capacity is the question of whether local authorities will be able to pay outstanding and new debt on time. In this regard, the following factors that determine the ability to borrow should be considered: the prospects of the municipality (economic and financial); offer of new loans or bonds, which includes the amount of interest, form, maturity; existing debt obligations, their structure and size; and the presence of restrictions at the national or regional level. The significant attractiveness in the financial market of municipal bonds issued by the cities of South Africa should be noted. These are cities

ISSN 2564-212X | Journal of Policy & Governance| 01(01) August 2021 | https://doi.org/10.33002/jpg010102
23
Ivanyshyn & Pecheniuk | Municipal Bonds as a Financial Component of the Development of Territorial Communities in Ukraine
that carry out effective budget management. Municipal bonds are often attractive to investors looking to reduce income tax bills. Usually, the payment of interest on them is exempt from federal tax. These securities are used by local and State authorities in order to create a positive environment for financing government projects or municipal governments: construction of schools, roads, repairs, etc. Table 1: Municipal loan aspects of individual countries
Country Fiscal base Austria Borrowing is allowed only to cover extraordinary expenses.
Brazil Annual targets of income, expenses, primary balance changes in debt composition. Failure to comply with fiscal targets leads to sanctions and high risks for officials.
Colombia Loan permission depends on the rating territorial governments based on liquidity ratios and solvency.
Czech Republic No obvious restrictions.
Finland Borrowings are coordinated by municipal organizations and are not guaranteed by the State.
France Loans are allowed to finance capital investments in the absence of an operating deficit.
Source: Kopanyi (2018) Municipal bonds are divided into two categories: general obligation bonds (GOs) and income
bonds. The difference is in providing them. The first is provided by the total income of the issuing municipality, and the second is supported by a specific source of income. GOs account for 28% of the investment market and are issued by most local governments to fund the specific projects. The characteristics and types of GO bonds are illustrated in table 2.
Table 2: Types and characteristics of GO bonds
Types of bonds Characteristics of collateral GO is supported by unrestricted tax regulation and special tax
Secured by property tax, they can be supported by other taxes or state support. These bonds are a very strong collateral.
GO is supported by without special tax
They are provided with the general income of the issuer, including taxes, but do not have a clearly defined tax from which they must return. Bondholders are paid out of total income, and if they are insufficient to cover debt service, the issuer usually has to raise taxes. These bonds are a strong collateral.
GO is supported by limited tax regulation
Provided by the general income of the issuer, including taxes. However, the issuer does not have the opportunity to increase taxes for an unlimited amount to return the bonds. The limit on the amount of tax increase allowed is usually described in the bond supply report, and the bonds are clearly marked. Bonds are strong collateral, but tax restrictions reduce their security.
Source: Kopanyi (2018)
The advantages of municipal bonds include receiving money in advance, long term commercial banking, income stability and cheaper resources. The main disadvantages of bonds are the complexity of the preparatory process for the issue, as well as the high cost of service and implementation. It should be noted that there are different degrees of State control over the debt policy of local governments (Zolotukhin, 2017), dialogue-oriented cooperation (coordination of control over borrowing), regulatory (formation of fiscal rules to limit local debt), administrative (central government manages local debt). Municipal bonds are common in the United States, and bank loans predominate in Europe. The composition of creditors also differs. In the United States, investors in municipal securities are households, whereas in Europe (including Ukraine), local governments are credited with funds from financial institutions. In order to determine the volume of municipal bond issues, we use the data in table 3.

ISSN 2564-212X | Journal of Policy & Governance| 01(01) August 2021 | https://doi.org/10.33002/jpg010102
24
Ivanyshyn & Pecheniuk | Municipal Bonds as a Financial Component of the Development of Territorial Communities in Ukraine
Table 3: Dynamics of the issue of US municipal bonds, $ billion
Bond Type
2011 2012 2013 2014 2015 2016 2017 2018 2019 2020 The relative
deviation of 2020
from 2011, %
GO 106 136 128 136 159 179 165 124 164 200 189
Revenue 189 247 208 203 246 272 284 223 263 285 151
Average maturity, years
15.5 15.6 16.2 16.0 16.4 16.8 17.5 18.1 18.1 17.4 112.2
Source: US Municipal Bonds Statistics
These statistics indicate a significant increase in the issuance of municipal bonds in the United States. In terms of total liabilities, GO bonds during the period of study increased by 89%, income bonds by 51% (refer Table 3). It should be noted that the issue of yield bonds, which have a higher risk of default over time, but provide a higher rate of return for investors, significantly exceeds the issue of GO. In addition, the average maturity of securities increased by 12.2% (Table 3). Municipal bonds can be purchased by individual investors both through an organization that issues securities and through a mutual fund. The results described by Horton (2020) were used giving 5 highest ratings of municipal funds, which were relevant in December 2020 (Table 3).
Table 4: The highest rated funds of municipal bonds
Name of the fund Characteristic features American High-Income Municipal Bond Fund
Much of the assets ($ 7.8 billion) are invested in debt bonds of city bonds. It has a 10-year annualized yield of 5.46%. The cost ratio of the mutual fund is 0.67% with advance sales of 3.75% when buying shares. The minimum investment is $ 250.
Nuveen High Yield Municipal Bond Fund I
It invests at least 80% of the mutual fund's assets in municipal bonds. It brings a 10-year yield of 6.62% per annum. The mutual fund has a cost ratio of 0.99%. Ir targets at investors with higher net worth, with an initial investment of $ 100.000.
Vanguard Intermediate-Term Tax-Exempt Fund Investor Shares
It is one of the longest mutual funds of municipal bonds in the market. It invests at least 75% of its $ 78.2 billion in municipal bonds. The weighted average maturity is 6 to 12 years. 10-year profitability is 3.59% with a low-cost ratio of 0.17%. The initial investment required is $ 3.000.
T. Rowe Price Maryland Tax-Free Bond Fund
It invests in at least 80% of assets in debt securities. It brings a 10-year annual return of 3.78% at a cost ratio of 0.48%. The initial investment required is $ 2.500.
Oppenheimer Rochester High Yield Municipal Fund Class A
It invests at least 80% of its net assets in high-yield municipal bonds issued throughout the United States. 10-year yield is 6.89%. The cost ratio of the mutual fund is 0.95%, and total sales are 4.25%. The initial investment required is $ 1.000.
Source: Horton (2020) A common feature of these funds is that they provide investors with a high level of current income,
which is exempt from the regular federal income tax and has a fairly high annual rates, which determines their attractiveness. Roberts (2020) in his study suggests that, in a crisis caused by a pandemic, cheap loans may be a thing of the past, despite attempts by the Federal Reserve. The world is facing a wave of debt default, which will have a negative impact on financial markets.

ISSN 2564-212X | Journal of Policy & Governance| 01(01) August 2021 | https://doi.org/10.33002/jpg010102
25
Ivanyshyn & Pecheniuk | Municipal Bonds as a Financial Component of the Development of Territorial Communities in Ukraine
3.1 Features of Transformations in Ukraine
Decentralization reform in Ukraine has revealed rather acute social problems and contradictions. Undoubtedly, those territorial communities that have significant economic potential have found themselves in better conditions and will be able to achieve good financial results with the right organization of their management activities. A major problem today is that these entities have low infrastructure development, low index of financial capacity, and, consequently, insufficient working capital, which should be attracted in order to strengthen the competitive position of the community.
The conclusions of scientists Rekunenko (2014), Savenko (2020), and Iorgachova and Kovalova (2019) is logical in the sense that the financial market of Ukraine and its infrastructure must be modernized in accordance with international standards. At the same time, the creation and development of financial market infrastructure should be accompanied by the formation of its own development concept with appropriate mechanisms for implementing strategic and tactical objectives. An important issue concerning the study of municipal bonds and the opportunities or challenges that may arise from their issuance and implementation in financial markets, is to identify the financial preconditions of the newly formed united communities and the feasibility of attracting this type of financing. In the Ukrainian reality, this issue requires serious analytical research and relevant conclusions.
The data in table 4 is used to estimate the financial capacity of the united communities of Ukraine. It should be noted that the above information only partially reflects the real state of budget subsidies, as statistical base and information on newly created territorial communities do not exist at the end of 2020 and their financial indicators due to lack of relevant targeted state subvention and their economic activity in the new borders.
Table 5: Incomes of the united territorial communities of Ukraine, 2020
The criteria for grouping
communities
The number of UTCs in the
group
The average amount of own
income received by 1 UTC of the corresponding group, UAH
million
Average income per capita in the
corresponding UTC group, UAH
The highest indicator of
budget subsidy by group, %
Population over 15 thousand people
110.0 95.9 4,453.7 54.4
Population from 10 to 15 thousand people
134.0 55.9 4,600.1 61.5
Population from 5 to 10 thousand people
77.0 32.8 4,669.3 64.0
Population up to 5 thousand people
110.0 16.7 4,888.4 60.6
UTC - cities of regional significance
23.0 505.7 6,412.6 22.0
Source: Ventsel, Gerasymchuk and Onyschuk (2021)
These data indicate that the highest rates of profitability and the lowest level of budget subsidies are formed by those communities that are created around cities of regional importance. In worst prospects are those having a population of less than 10,000. These groups are characterized by a high rate of budget subsidies (more than 60%), as well as low average income per community. This situation can lead to a deepening financial crisis and a reduction in number of basic social programs and services in the local community, which will determine the impossibility of its existence in the future. A research by Ivanyshyn, Pecheniuk and Pecheniuk (2019) described a similar negative situation in the field of education in terms of obtaining an educational subvention for these purposes. Undoubtedly,

ISSN 2564-212X | Journal of Policy & Governance| 01(01) August 2021 | https://doi.org/10.33002/jpg010102
26
Ivanyshyn & Pecheniuk | Municipal Bonds as a Financial Component of the Development of Territorial Communities in Ukraine
decentralization reform in Ukraine creates new challenges and opportunities for communities. In practical terms, there is a chance to obtain significant income from their own physical assets through strategic management of the sale, lease and acquisition of land and property by using land valuation tools.
Modern decentralization processes are accompanied by heated discussions on the feasibility of acquiring the status of a legal entity under public law by territorial communities of Ukraine. World experience shows that in European countries, communities have been legal entities for hundreds of years, and in the countries of the so-called Eastern bloc, such a reform took place after the overthrow of totalitarian regimes. Sometimes legal entities are not only territorial communities, but also all levels of their management. Upon registration, the community-legal entity receives the right to enter into agreements with individuals and legal entities, can obtain full credit ratings for loans and credits. In this case, the property, that the community has, belongs directly to the community - a legal entity. At the same time, the legal entity community is becoming the only centre of responsibility (Hurin, 2020).
Debt financing can expand infrastructure and facilitate community development. In the context of this study, it is worth considering the issue of maximum use of local assets by local governments. One of the important sources of replenishment of the local budget is the sale or lease of land or buildings. Given the growing demand for land resources and the limited limitations of the latter, administrations may resort to the conversion of agricultural land to urban use1, which increases the value of urban land, respectively, the price of rent and sale, resulting in additional funding. However, the practice of local governments in Ukraine shows that municipal administrations often do not have an accurate idea of their ownership and value of assets. According to the Resolution of the Cabinet of Ministers of Ukraine2 (Resolution, 2020), in pursuance of the Presidential Decree (Decree of the President of Ukraine, 2020), a mechanism of full transfer of agricultural lands to all united territorial communities was introduced. According to the document, more than 2 million hectares of agricultural land will be transferred to local governments. This will allow to develop registers of property holdings and to establish the market value of important land plots, to make strategic decisions on better development of land resources, and to take into account their financial contribution.
The second aspect is how municipal governments can effectively issue debt. Undoubtedly, bank loans and bonds are common debt instruments that have been tested in developed countries, but municipal governments in developing countries face significant problems due to weak fiscal base, low debt capacity, lack of experience in preparing investment plans, payments debt obligations. In Ukraine, it has traditionally been the case that most communities rely on the central government. This was facilitated by public policy, in which a significant part of the funds was distributed centrally through transfers and subsidies to finance investment needs. The practice of local governments considers these resources to be insufficient to provide financing for long-term investments.
In case of the financial analysis that determines the need for borrowing, lending options may be considered: bank loans or bond issues. Other ways could be grants or public-private partnerships. Some countries (Colombia, Mexico, Czech Republic) have developed segmented markets, where the smallest cities have the right to borrow from subsidized government agencies, and medium-sized cities - from commercial banks and bond markets. In addition, Municipal Development Funds can be established as specific financial intermediaries to assist cities in capital planning, financial structuring and project evaluation.
Brus (2017) highlights the main features of the Ukrainian municipal bond market, which includes high budget centralization that makes the local borrowing risky and illiquid, unsystematic entry into the market of municipal loans, insignificant volumes of trading in the stock market, the complexity of the procedure for entering both domestic and foreign markets for borrowed resources. However, the Ukrainian authorities are also taking some steps to improve the use of municipal bonds as possible collateral for loans. In particular, the National Bank of Ukraine (2020) extended the terms of refinancing of banks and the list of acceptable collateral, which includes municipal bonds. Their inclusion is aimed at expanding the tools of banks to regulate their own liquidity. It will also contribute to the development of regional infrastructure projects, which should have a positive impact on the securities market in general.
1 This has negative impact from sustainable development point of view. World over, the urbanization is seen as negative
phenomenon, particularly when it is changing land use from agriculture to concrete built areas. However, we present this
solution in the theoretical context of replenishment of local budgets. 2 https://www.kmu.gov.ua/npas/deyaki-zahodi-shchodo-priskorennya-reform-u-sferi-zemelnih-vidnosin-i161120-1113

ISSN 2564-212X | Journal of Policy & Governance| 01(01) August 2021 | https://doi.org/10.33002/jpg010102
27
Ivanyshyn & Pecheniuk | Municipal Bonds as a Financial Component of the Development of Territorial Communities in Ukraine
4. CONCLUSION
World economic opinion has developed a number of mechanisms through which municipalities can provide financial investment and accumulate additional funds for infrastructure and social projects. One of them is the issue of municipal bonds. The experience of their application in the financial markets of different countries is quite wide and contradictory. For countries that traditionally have high development rates and effective municipal management, the use of bonds is characterized by positive effects. The use of this type of securities in countries with economies in transition has been accompanied by a number of municipal defaults, which has led to the accumulation of debt by the governments of these States.
At this stage of development of Ukrainian territorial communities, this form of attracting financial resources is used insufficiently and inefficiently compared to developed industrial countries. In addition, imperfect legislation, lack of experience in local borrowing, lack of recognition and registration of local governments as legal entities under public law, lack of clear information on available resources and their valuation, create significant risks to the implementation of local borrowing in Ukraine. Areas of recommended further research include the development of mechanisms for effective property management of territorial communities and finding the optimal concept of financing projects for economic and social development of regions, taking into account the best world practices of using municipal bonds.
REFERENCES Brus, S.I. (2017). Municipal bonds in Ukraine in the context of the prospect of use. Zbirnyk naukovykh
prats Universytetu derzhavnoi fiskalnoi sluzhby Ukrainy. № 2. р. 67-85 (Ukrainian) Decree of the President of Ukraine (2020). Decree № 449/2020 on some measures to accelerate reforms in
the field of land relations (15 October 2020). Retrieved from: https://zakon.rada.gov.ua/laws/show/449/2020#Text
Horton, M. (2020). Municipal Bond Funds for 2021. Retrieved from: https://www.investopedia.com/articles/investing/010716/top-5-municipal-bond-funds-2016.asp (accessed on 1 March 2021)
Howard, C. (2020). Understanding general obligations of municipal bonds. Retrieved from https://www.schwab.com/resource-center/insights/content/understanding-general-oligation-municipal-bonds (accessed on 20 March 2021).
Hurin, D. (2020). To be a legal entity in the community or not? Retrieved from: https://decentralization.gov.ua/admin/articles/12990.html (accessed on 10 March 2021).
Ivanyshyn, V., Pecheniuk, A., & Pecheniuk, A. (2019). Financial and educational inclusiveness of rural territorial groups. Innovatsiina Ekonomika, 1-2 (78), 156-161.
Kopanyi, M.E.F.M. (2018). Asset and Debt Management for Cities. IGC International Growth Centre, London School of Economics and Political Sciences. Retrieved from: https://www.theigc.org/publication/asset-debt-management-cities/ (accessed on 23 April 2021).
Korniiaka, O. V. (2016). The role of municipal bonds in the development of municipalities in the second half of the XIX - early XX century. Ukrainskyi Sotsium, 1 (56), 138-145 (Ukrainian).
Iorgachova, M., & Kovalova, O. (2019). Investment and innovative model of the market of Ukraine in the conditions of transformation. Investytsiyi: praktyka ta dosvid, 10, 22-26. Doi: 10.32702/2306-6814.2019.10.22 (Ukrainian).
National Banks of Ukraine (2020). The method of valuation of municipal bonds as a possible collateral for refinancing loans is determined. Retrieved from: https://bank.gov.ua/ua/news/all/viznachena-metodika-otsinki-munitsipalnih-obligatsiy-yak-mojlivoyi-zastavi-za-kreditami-refinansuvannya (accessed on 11 May 2021).
Rekunenko, I. (2014). Methodological bases of research of processes of formation and development of infrastructure of the financial market of Ukraine. Ekonomika ta derzhava, 12, 10-13 (Ukrainian).
Resolution of the Cabinet of Ministers of Ukraine (16 November 2020). Some measures to accelerate reforms in the field of land relations. № 1113. Retrieved from: https://www.kmu.gov.ua/npas/deyaki-zahodi-shchodo-priskorennya-reform-u-sferi-zemelnih-vidnosin-i161120-1113 (accessed on 2 March 2021).
Roberts, M. (2020). Pandemic Economics. Crisis Critique, 7 (3), 299-321.

ISSN 2564-212X | Journal of Policy & Governance| 01(01) August 2021 | https://doi.org/10.33002/jpg010102
28
Ivanyshyn & Pecheniuk | Municipal Bonds as a Financial Component of the Development of Territorial Communities in Ukraine
Savenko, D. (2020). Formation and development of financial market infrastructure of Ukraine. Investytsiyi: praktyka ta dosvid, 4, 81–85. Doi: https://doi.org/10.32702/2306-6814.2020.4.81 (Ukrainian).
US Municipal Bonds Statistics. Retrieved from: https://analytics.clickdimensions.com/forms/?visitor=contact (accessed on 30 April 2021).
Ventsel, V., Herasymchuk, I., & Onyshchuk, I. (2021). With what financial indicators did the united communities end 2020 - rating. Retrieved from: https://decentralization.gov.ua/news/13333 (accessed on 30 March 2021).
Zolotukhin, Ye. (2017). Comparative analysis of foreign experience in the functioning of local borrowing markets: lessons for Ukraine. Investytsii: praktyka ta dosvid, 11, 55-60 (Ukrainian).

ISSN 2564-212X | Journal of Policy & Governance| 01(01) August 2021 | https://doi.org/10.33002/jpg010102
29
Ivanyshyn & Pecheniuk | Municipal Bonds as a Financial Component of the Development of Territorial Communities in Ukraine
AUTHORS’ DECLARATIONS AND ESSENTIAL ETHICAL COMPLIANCES Authors’ Contributions (in accordance with ICMJE criteria for authorship)
Contribution Author 1 Author 2 Conceived and designed the research or analysis Yes Yes
Collected the data No Yes
Contributed to data analysis & interpretation Yes No
Wrote the article/paper Yes Yes
Critical revision of the article/paper Yes No
Editing of the article/paper No Yes
Supervision No Yes
Project Administration Yes No
Funding Acquisition No No
Overall Contribution Proportion (%) 50 50
Funding No funding was available for the research conducted for and writing of this paper. Research involving human bodies (Helsinki Declaration) Has this research used human subjects for experimentation? No Research involving animals (ARRIVE Checklist) Has this research involved animal subjects for experimentation? No Research involving Plants No plant was used to conduct this research. Research on Indigenous Peoples and/or Traditional Knowledge Has this research involved Indigenous Peoples as participants or respondents? No
(Optional) PRISMA (Preferred Reporting Items for Systematic Reviews and Meta-Analyses) Have authors complied with PRISMA standards? No Competing Interests/Conflict of Interest Authors have no competing financial, professional, or personal interests from other parties or in publishing this manuscript. RIGHTS AND PERMISSIONS Open Access. This article is licensed under a Creative Commons Attribution 4.0 International License, which permits use, sharing, adaptation, distribution and reproduction in any medium or format, as long as you give appropriate credit to the original author(s) and the source, provide a link to the Creative Commons license, and indicate if changes were made. The images or other third-party material in this article are included in the article's Creative Commons license, unless indicated otherwise in a credit line to the material. If material is not included in the article's Creative Commons license and your intended use is not permitted by statutory regulation or exceeds the permitted use, you will need to obtain permission directly from the copyright holder. To view a copy of this license, visit http://creativecommons.org/licenses/by/4.0/.

M – 00229 | Research Article ISSN 2564-212X 01(01) | August 2021
Community Forestry Governance in Federal System of Nepal Binita Dahal1, Rajeev Joshi*2, Bishow Poudel3, Manoj Panta4
1Institute of Forestry, Tribhuvan University, Hetauda, Nepal. Email: [email protected] | ORCID: 0000-0002-7390-3732 2Forest Research Institute, Dehradun, UK, India; Programme Coordinator, Amity Global Education (Lord Buddha College), CTEVT, Tokha -11, Kathmandu, Nepal. Email: [email protected] | ORCID: 0000-0003-1106-9911 3Faculty of Forestry, Amity Global Education (Lord Buddha College), CTEVT, Tokha -11, Kathmandu-44600, Nepal. Email: [email protected] | ORCID: 0000-0003-10987-5666 4School of Environmental Science and Management, PU, Kathmandu, Nepal; Faculty of Forestry, Amity Global Education (Lord Buddha College), CTEVT, Tokha -11, Kathmandu-44600, Nepal. Email: [email protected] | ORCID: 0000-0003-1983-2432 *Corresponding author
ABSTRACT This research was conducted to find out the relationship between Community Forests User Groups (CFUGs), local government, and provincial government concerning monitoring and management ownership. The benefit-sharing mechanism in community forestry has always been a point of discussion to deal with, that follows the share given by law and constitution. In this study, different stakeholders were interviewed to record the actual views of CFUGs, local political leaders, forest officials and others on forest use and management responsibility in the context of federal restructuring of Nepal. CFUGs along with local political leaders were found favoring to hand over the monitoring and management responsibility to the local government, whereas the forest officials were reluctant on this proposed arrangement. The forest officers considered that giving the functions of monitoring and management responsibilities to the local government would destroy the past successful history of community forestry in Nepal, and it would turn to massive deforestation along with degradation of forests in the name of development. Being the policy formulation process occurring on a provincial and local levels, a lack of coordination among local governments and CFUGs may create a major challenge in the forest management and utilization of resources. The benefit-sharing mechanism in both the scientifically managed and traditionally managed forests was found not following the provisions of the Forest Act, 2019 and 1993. In particular context of pro-poor livelihood activities and coordination with local government during the community development activities reflect weak governance. Proper coordination and cooperation among three tiers of government are necessary through involving the CFUGs in the local government planning process and support to CFUGs. Keywords: Forest User Groups; Coordination; Federal system; Governance; Province
Received: 04 June 2021 Reviewed: 22 June 2021 Accepted: 09 July 2021 Published: 10 August 2021
__________________________________________________________________________________________________________________
How to cite this paper: Dahal, B., Joshi, R., Poudel, B., & Panta, M. (2021). Community Forestry Governance in Federal System of Nepal. Journal of Policy & Governance, 01(01), 30-45. http://dx.doi.org/10.33002/jpg010103
Copyright © 2021 by author(s). This work is licensed under the Creative Commons Attribution International License (CC BY 4.0).
http://creativecommons.org/licenses/by/4.0/
ISSN 2564-212X | Journal of Policy & Governance| 01(01) August 2021 | https://doi.org/10.33002/jpg010103
31
Dahal, Joshi, Poudel & Panta | Community Forestry Governance in Federal System of Nepal
1. INTRODUCTION
Forest, the most important natural resource, has become the central point of attraction due to the modernization and urbanization that lead to global warming and other several changes in the world (Tsiantikoudis et al., 2019; Joshi et al., 2020). Nowadays, most of the developed countries have focused on the promotion of the protection and conservation of forest resources in developing countries by providing funding and other awareness programme (Rijal et al., 2021). Developing countries like Nepal have focused on conserving and managing the forest through different forest management modalities. This has resulted an increase in forest areas of Nepal. In the year 1957, the government enforced the Private Forest Nationalization Act, 1957 and nationalized privately owned forests within the country. Many scholars suggest the deforestation in Nepal can be traced to the nationalization of communal forest lands in the 1950s by the government, thereby alienating local people from their ancestral institutions and controls (Bhattarai, 2016). The Master Plan for Forestry Sector (MPFS), 1988 was developed and approved in 1989 that recognized community and private forestry as priority programs in the forestry sector and encouraged the transfer of forest access with management rights to the local community (Pokharel et al., 2012). Forestry institutions can be considered as main actors to lead the sustainable management of forest, especially for forest policy formulation, implementation, and analysis (Schusser et al., 2016); where government agencies, community-based institutions, Federation of Community Forest Users in Nepal (FECOFUN) and other agencies are main forestry institutions (Gautam et al., 2004). The FECOFUN is a non-government organization established in 1995 to complement government initiatives related to the development of community forestry.
The community forestry (CF) is considered as one of the most successful models addressing forest management and governance challenges in the developing world (Sapkota et al., 2020). It is also rewarded as the most successful participatory approach all over the world (Baral et al., 2019). In fact, community forest management in Nepal is managed by the community themselves through Community Forest User Groups (CFUGs), which were evolved after the late 1970s when massive deforestation happened in state-controlled forests (Joshi et al., 2020; Joshi et al., 2021). The community forest management approach ensures and encourages the active participation of local people in the forest management where local communities are provided with a certain degree of responsibility and authority for the forest management is regarded as the most effective way of addressing the subsistence needs of local people (Khadka et al., 2021; Bijaya et al., 2016). The total funds collected in the CF account are to be allocated in such a way that 25% of it should contribute the forest development, conservation, and management, 35% of the funds should be invested in women, dalits1, Indigenous and underprivileged groups considering the well-being ranking of CF members (Poudel et al., 2015; Rijal et al., 2021). The rest of the funds can be spent on community development activities with community consent during general assembly (Community Forestry Division, 2014). The timber and non-timber forest products extracted from the community forests, such as fuelwood, fodder/grass, leaf litter, etc., are part of the local people’s subsistence, and help strengthen the local economy improving the livelihoods of local people (Khanal & Devkota, 2020). In addition, the Government of Nepal provides the rights to the CFUGs to access, use, and manage according to their needs, but retain ownership through the community forestry (Paudel, 2018). The main goal of the community forestry program in Nepal is to increase the participation of the local user in the decision-making of forests and gaining benefits (Adhikari et al., 2016). Moreover, this program has been facing some shortcomings in some CFUGs due to poor record management, lack of technology, excessive politicization of the local issues, and others (Chhetri et al., 2013).
For a long, the terms of governance and good governance are being used increasingly in development literature wherein government acts as one of the main actors. Governance is described as the process of decision making and is perceived as the process of establishing, promoting, and supporting a specific type of liaison between governmental and non-governmental bodies by which decisions are implemented (Howlett et al., 2009). It includes both formal and informal actors involved in decision-making and in implementing the decisions. Additionally, governance is viewed in donor circles as the bedrock on which economic growth, poverty reduction, and the improvement in the quality of life and social well-being rest (Hyden et al., 2008). The problems associated with achieving targeted developmental goals are understood to be a result of poor governance. Conversely, good governance is seen as one way of achieving such goals. In fact, some consider it as a prerequisite for sustainable development and economic growth (Roberts et al.,
1 Dalit is a name for people belonging to the lowest caste in Nepal, characterised as "untouchable”.

ISSN 2564-212X | Journal of Policy & Governance| 01(01) August 2021 | https://doi.org/10.33002/jpg010103
32
Dahal, Joshi, Poudel & Panta | Community Forestry Governance in Federal System of Nepal
2007). The key elements of good governance include transparency, accountability, and participatory decision-making (UNDP, 1997; Choudry, 2002; Pasape et al., 2015). FAO (2020) has defined governance as the processes through which public and private actors articulate their interests; frame and prioritize issues; and make, implement, monitor, and enforce the decisions.
The forest governance is defined as the way in which public and private actors, including formal and informal institutions, smallholder and indigenous organizations, small, medium-sized and large enterprises, civil-society organizations and other stakeholders negotiate, make and enforce the binding decisions about the management, use and conservation of forest resources from local to global (Piabuo et al., 2018). The analysis of forest governance in community forestry helps provide the condition of forest in respect of elements as participation, transparency, gender equality, and other things that determine the path towards sustainability. Community forestry governance has always been a top prioritized issue in Nepal that provides four decades of successful history of community forestry.
The political system has always become the major turning point for forest policy reform in Nepal. Nepal’s forest management modalities are major departures from the state-centric, centralized, and expert-led approaches to decentralized and community-led forest management regimes with political change (Banjade et al., 2017); however, the land tenure was always controlled by the central government. The first time, the Constitution of Nepal, 2015 has introduced three layers of government (i.e., federal, provincial and local level) and forest has come under concurrent powers of federal, provincial, and local government (Muni, 2015). The recently approved Local Government Operation Act, 2017 has provided the responsibility of environment and biodiversity conservation to the local government. The national budget related to community forest has also been allocated under local government. However, the recently approved organizational and management arrangement of the Ministry of Forest and Environment has not recognized the local government during the organizational restructure of the Ministry of Forest and Soil Conservation. There is no unit within the local government of Nepal (Chaudhary, 2018). This unclarity in rights and powers of the hierarchical federal government has put community forests in dilemma (Rijal et al., 2021). Community forestry and good governance are interlinked; however, the federal system’s obscurity in powers over community forestry has put governance at high risk (McDermott & Schreckenberg, 2009). The accountability and responsiveness principles of governance are the main considerations in this research.
Till now, only 663 sub-divisions have been authorized and managed in Nepal, but there are altogether 753 local bodies administered in the country (Acharya, 2018). The natural resource is regarded as the major revenue source for provincial and local government; however, community forest user groups have rights to get full benefits generated from the community forest (Bijaya et al., 2019). Local and provincial governments may feel pressure to over-exploit natural resources to raise revenues (Thakali et al., 2018). Similarly, there is no spatial linkage between the territory of local governments and forest sub-divisions. This has created ambiguity with regard to forest management modality and the authority to facilitate the community forestry process at the grassroots level. The provisions of the Constitution and the Forest Act 1993 have created debate among the stakeholders having rights over community forestry management, monitoring, and benefit-sharing. Being a new structure, no study has been conducted on forest tenure, revenue sharing mechanism, and the effects of forest administration restructuring in relation to community forest governance. Therefore, this research was conceived to focus on the issues that would further help in policy planning. 2. MATERIALS AND METHODS 2.1 Study Area
This study has been conducted in the territory of four local governments representing two different provinces and two different economic settings (Figure 1). Two local governments were selected from Chitwan district (Bagmati province) representing Inner Terai2 and Siwalik region. Similarly, two local governments were selected from the Gorkha district (Gandaki province) representing mid-hill and high Himalayan physiographic zone. The Chitwan district represents low land with high-value timber forest and a highly sensitive biological corridor. Likewise, Gorkha represents mid-mountain and high Himal that is highly dependent on forest resources for local people’s livelihoods. Among the selected local government in
2 Terai is a lowland belt of southern Nepal, mainly characterised by tall grasslands, scrub savannah, Sal forests and clay
rich swamps.

ISSN 2564-212X | Journal of Policy & Governance| 01(01) August 2021 | https://doi.org/10.33002/jpg010103
33
Dahal, Joshi, Poudel & Panta | Community Forestry Governance in Federal System of Nepal
each district, one represents the rural area, and another represents the urban municipality, so that the findings of this research can represent different socio-economic settings. Two CFUGs from each of the local governments were selected; one being connected to CF implemented with Scientific Forest Management (SFM), and another linked to the CF with Traditional Forest Management (TFM). From Chitwan district, Kankali Community Forest managed scientifically, and Panchakanya Community Forest managed traditionally were selected. From the Gorkha district, Ghaledada-Ranakhola Community Forest managed scientifically, and Birinchowk Community Forest managed traditionally were selected (Table 1).
Figure 1: Map of the study area
Table 1: The main characteristics of selected CFs
Name Panchakanya
CFUG Kankali CFUG
Ghaledada-Ranakhola CFUG
Birinchowk CFUG
Address Ratnanagar
municipality-11, Chitwan
Khairahani municipality-4,
Chitwan
Sahid Lakhan rural municipality-7,
Gorkha
Gorkha municipality-10,
Gorkha
Date of handover
20/09/2010 20/06/1995 28/02/1999 23/12/1994
Area (ha) 198.73 749.13 475.8 114.82
Altitude (masl) 200-500 220-580 1100-1500 700-1200
Type of Forest Natural forest Natural forest Natural forest Natural forest
Dominant species
Shorea robusta Shorea robusta Shorea robusta,
Castanopsis indica, Schima wallichi
Shorea robusta, Schima wallichi
Forest protection
Household rotation & bars
Household rotation & bars
Household rotation Household
rotation
No. of households
2,127 2,098 531 202
Office building Own Own Own Own
Management approach
TFM SFM SFM TFM
Total population 10,635 11,802 1,139 1,038

ISSN 2564-212X | Journal of Policy & Governance| 01(01) August 2021 | https://doi.org/10.33002/jpg010103
34
Dahal, Joshi, Poudel & Panta | Community Forestry Governance in Federal System of Nepal
2.2 Data Collection 2.2.1 Primary Data Collection
Primary data were collected using Participatory Rural Appraisal (PRA) tools such as an interview with stakeholders, key informant interviews, questionnaire surveys, formal and informal discussions, focus group discussions, and direct observation. To gather the information, firstly, key informant interviews were conducted to know the status of the socio-economic context and the condition of forest management and governance prevailing in community forests. Key informants having detailed information about community forests were chosen for an interview, and they included local political leaders, ex-presidents of community forests, schoolteachers, ward presidents, forest guards, and so on. A total of 25 forest officials were interviewed using an open and close-ended questionnaire to access the view of officers regarding monitoring and management responsibility of the forest. 12 forest officials from the Gorkha district and 13 forest officials from the Chitwan district were interviewed who represent the provincial government. The unstructured questionnaire was developed and used to access the views regarding management responsibility of forests from 15 FECOFUN members. The representative sample of 5% (i.e., 248) was drawn from total forest user households (4,958) of four CFs to conduct the questionnaire interviews. A stratified random sampling method was exercised for this study where proportionate samples of interviewees from each category of well-being were selected. The questionnaire survey method was used to collect data on various aspects affecting governance, such as income source, fund mobilization, transparency, forest tenure, revenue sharing mechanisms, effects of forest administration restructuring, and decision-making process prevailing among community forest user groups. Minute review of Operational Plan and Constitutions and official records were collected from each of the sampled CFUGs. The audit reports of the year 2016/17, 2017/18, 2018/19, and 2019/20 were collected to understand the benefit-sharing mechanism of CFUGs. Focus group discussion with the forest users was conducted focusing on the role of local government for the management of forest resources and the response of the users to fulfill their basic requirement of forest products from the existing forest management system. The most important five pillars of effective governance, i.e. the people, the land, laws & jurisdiction, governing systems, and resources, were investigated through key informant interviews and focus group discussions involving the local peoples, political leaders, elders, ward president, academics, CFUGs members, etc. These five pillars were developed to blend the traditional values of respective Indigenous peoples’ nations with the modern realities of federal governance. The main principle of these five pillars was to develop and deliver tools and services to help transform the nations in federal system.
2.2.2 Economic Analysis
The economic analysis was done employing Net Present Value (NPV), Benefit-Cost Ratio (BCR), and Profitability Index (Schwab & Lusztig, 1969). Net Present Value (NPV): Formulas and calculation
The first step involved in the calculation of NPV is the estimation of net cash flows from the project over its life. The second step is to discount those cash flows at the hurdle rate.
The net cash flows may be even (i.e., equal cash flows in different periods) or uneven (i.e., different cash flows in different periods). When they are even, the present value can be easily calculated by using the formula for the present value of an annuity. However, if they are uneven, we need to calculate the present value of each net cash inflow separately.
Once we have the total present value of all project cash flows, we subtract the initial investment on the project from the total present value of inflows to arrive at net present value.
Thus, we have the following two formulas for the calculation of NPV:
When net cash flows are even, i.e., when all net cash flows are equal:
NPV = R × 1 − (1 + i)-n
− Initial Investment i
In the above formula, R is the net cash inflow expected to be received in each period;

ISSN 2564-212X | Journal of Policy & Governance| 01(01) August 2021 | https://doi.org/10.33002/jpg010103
35
Dahal, Joshi, Poudel & Panta | Community Forestry Governance in Federal System of Nepal
i is the required rate of return per period (i.e., the hurdle rate, discount rate); n is the number of periods during which the project is expected to operate and generate cash inflows. When net cash flows are uneven, i.e. when net cash flows vary from period to period:
NPV = R1
+ R2
+ R3
+ ... − Initial Investment (1+i)1 (1+i)2 (1+i)3
Where, i is the hurdle rate (also called the discount rate); R1 is the net cash inflow during the first period; R2 is the net cash inflow during the second period; R3 is the net cash inflow during the third period, and so on.
Benefit-Cost Ratio (B/C Ratio)
It is the ratio of the present worth of benefit stream to the present worth of cost stream. The investment is said to be profitable when the BCR is one or greater than 1. This method is widely used in economic analysis and not in private investment analysis. Profitability Index
Profitability Index = (Net Present Value + Initial Investment) ÷ Initial Investment (Schwab & Lusztig, 1969). Therefore:
• If the PI > 1, the project generates value and the company may want to proceed with the project.
• If the PI < 1, the project destroys value and the company should not proceed with the project. • If the PI = 1, the project breaks even and the company is indifferent between proceeding and
not proceeding with the project. 2.2.3 Secondary Data Collection
Secondary data were collected for institutional information about the community forest user groups registered, forest conditions for the study area from the divisional forest office and local government office. The CFs’ nominal and functional policies were reviewed to understand the constitutional provisions regarding forest resource management, federal government policy, state government policy, and local government policy. The Constitution, operational plan, minute register of CFUGs and Division Forest Office (DFO) records were reviewed to retrieve the information. 2.3. Data Analysis
Methods of both qualitative and quantitative analyses were applied to analyze the data. Information collected from the field was carefully recorded, compiled, categorized, coded, tabulated, and analyzed. Simple statistical tools, such as bar diagrams and pie charts, were used to analyze results with the help of MS-Excel.
3. RESULT AND DISCUSSIONS 3.1 Result 3.1.1 Response of People on Intergovernmental Relationship
The relationship between the local and provincial government (one representative is the Division Officer) determines the further path of community forest in the production and sustainable management of forests. However, the findings of this study reveal that majority of respondents (70%) fully sought that the monitoring and management responsibility should be of local government; whereas 19% of respondents said that the monitoring and management responsibility should be given to provincial government; and 11% of the respondents answered that management and monitoring responsibility should be delivered by the coordination of both provincial and the local government (Figure 2). Government officers, such as DFO (Divisional Forest Officer) and rangers, wanted that the responsibility of monitoring and forest management should be given to the provincial government, while some officers said that this responsibility needs to be delivered in coordination of both the parties. FECOFUN also gave the opinion that the monitoring and management responsibility of community forest should be

ISSN 2564-212X | Journal of Policy & Governance| 01(01) August 2021 | https://doi.org/10.33002/jpg010103
36
Dahal, Joshi, Poudel & Panta | Community Forestry Governance in Federal System of Nepal
fulfilled through the coordination of both the parties, while all respondent CFUGs wanted that the local government should be given this responsibility.
Figure 2: Monitoring and management responsibility of forest
3.1.2 Intergovernmental Relationship
Local government can also play a leading role in forest management by providing financial and technical support. The findings of this study show very good relationship between local leaders and CFUGs in Bagmati Province, mostly in Kankali CF. This relationship is seen in financial support and technical works such as trainings, tourism development, construction work, etc. (Figure 3). This kind of the relationship was absent in Panchakanya CF area. However, technical support such as trainings, plantation activities, were carried out in Ghaledada-Ranakhola CF, whereas this kind of support was not existing in Birinchowk CF.
3.1.3 CFUG Involvement in Planning Process of Municipality
Lack of coordination and cooperation has been seen in the local government and CFUGs. 72% of the respondents were not involved in any planning process of the municipality. Those who participated (i.e 28%) in the activities of municipality were also not actively involved, rather they were just present passively in the meetings (Figure 4). This seems to be an issue of concern for the forest management activities. It is apprehended that this can evolve later as the main point of dispute between CFUG and the local government.
Future collaboration among Local government and CFUGs: Almost all members from four CFUGs sought collaboration of the local government in the future in financial affairs and development activities. The CFUG members are highly attracted towards revenue from tourism development and promotion rather than production of the forests. In contrast, local political leaders perceived the environmental conservation as an area of collaboration in the future. These results show diversity of perceptions regarding the collaboration.
3.1.4 Income from Different Sources
Table 2 shows various sources of the income of all four CFUGs in the year 2016/17, 2017/18, 2018/19, and 2019/20 (Table 2). In the year 2019, Kankali and Ghaledada-Ranakhola CFUGs earned the highest income, which was calculated as USD 163028.93 and USD 14708.18, respectively. In 2016, they earned the lowest income i.e., USD 66031.04 and USD 9704.12, respectively. Likewise, in the year 2017, Panchakanya CFUG earned the highest income of USD 88879.99, while, in the year 2016, it had the least income (USD 62747.93). In 2017, Birinchowk CFUG earned the maximum income, which was recorded as USD 14564.91 and the minimum income was recorded in the year 2018 i.e., USD 4498.13. From this table, it can be said that CFUGs from the Terai region have a higher income from fuelwood i.e., Kankali and Panchakanya CFUGs. Likewise, the CFUGs from mid-hill region have a high source from timber
70%
19%
11%
Response of People on Intergovernmental Relationship
Local Government
Provincial Government
Both

ISSN 2564-212X | Journal of Policy & Governance| 01(01) August 2021 | https://doi.org/10.33002/jpg010103
37
Dahal, Joshi, Poudel & Panta | Community Forestry Governance in Federal System of Nepal
i.e., Ghaledada-Ranakhola and Birinchowk CFUG. The table also shows that CFUGs with scientific forest management has a high income in comparison to traditionally managed CFUGs.
Figure 3: Support from the local government to forest management in CF
Figure 4: Involvement of CFUG in planning of municipality
0
5
10
15
20
25
30
35
Yes No
No
. o
f re
spo
nd
ents
Response
Support to CFUG
28%
72%
Involvement in planning process
Yes
No

ISSN 2564-212X | Journal of Policy & Governance| 01(01) August 2021 | https://doi.org/10.33002/jpg010103
38
Dahal, Joshi, Poudel & Panta | Community Forestry Governance in Federal System of Nepal
Table 2: Sources of income of all CFUGs in different years Particulars Income generation of Kankali CFUG (USD) Income generation of Ghaledada-Ranakhola CFUG (USD)
2016/17 2017/18 2018/19 2019/20 2016/17 2017/18 2018/19 2019/20
Timber 10421.58 38088.86 5102.22 16714.36 172.17 481.95 3166.96 1229.42
Fuel wood 36944.23 10782.44 69099.93 37466.36 944.33 1200.08 3792.47 1899.20
Non wood 625.52 645.40 1518.29 889.94 12.28 581.13 0.00 183.11
Donation 888.79 917.03 10050.27 3821.62 46.53 2304.59 0.00 725.47
Tourism 14358.07 14814.43 14383.83 13796.70 0.00 0.00 0.00 0.00
Other 2792.85 2881.62 7376.20 4166.93 8528.80 6871.05 7748.75 7342.87
Total 66031.04 114956.45 163028.93 109275.99 9704.12 11438.79 14708.18 11380.08
Particulars Income generation of Birinchowk CFUG (USD) Income generation of Panchakanya CFUG (USD)
2016/17 2017/18 2018/19 2019/20 2016/17 2017/18 2018/19 2019/20
Timber 228.01 576.02 2422.08 1034.87 43369.38 48137.56 128749.60 70354.98
Fuel wood 3116.80 963.65 1496.70 1773.74 75.94 13625.10 8369.93 6937.41
Non wood 4.75 288.07 0.00 90.34 160.82 1574.80 74.95 561.07
Donation 3804.14 12193.20 0.00 4970.40 10946.95 23125.53 68422.43 32781.50
Tourism 0.00 0.00 0.00 0.00 0.00 0.00 0.00 0.00
Other 358.32 543.96 579.34 469.44 8194.83 2416.99 4900.83 4940.45
Total 7512.02 14564.91 4498.13 8338.80 62747.93 88879.99 81768.14 73863.61
3.1.5 Expenditure
Table 3 shows the expenditure on administrative work, forest conservation, tourism, and social development in the year 2016/17, 2017/18, 2018/19 and 2019/20. Among the four CFUGs, in 2018, Kankali CFUG spent the highest amount of budget in the field of administration, forest conservation, tourism, and social development, which was USD 68733.00. While in the year 2017, Birinchowk CF had the least spending on administration, forest conservation, tourism, and social development, which was estimated to be USD 1255.49.
Forest conservation has got high priority in all CFUGs, while social development and pro-poor upliftment were almost negligible in Kankali, Birinchowk and Panchakanya CF areas. Tourism development was highly focused in Kankali CF, which showed distraction from production forestry. In contrast, Panchakanya CF with a traditional forest management module seemed to be better than Kankali CF having scientific forest management. Likewise, Ghaledada-Ranakhola CF with scientific forest management seemed to be better managed than Birinchowk with traditional forest management. 3.1.6 Benefits Earned by Community Forests
Table 4 shows the benefits earned by Kankali, Ghaledada-Ranakhola, Birinchowk, and Panchakanya CFUGs. Kankali CFUG has the highest benefit in the year of 2018 that was recorded as USD 94295.93, while, in 2016, Ghaledada-Ranakhola CFUG has the lowest income from the various sources which was estimated as USD 1917.53. The average benefit of Kankali CFUG and Panchakanya CFUG was calculated to be USD 55524.21 and USD 46698.00, respectively. But Ghaledada-Ranakhola CFUG and Birinchowk CFUG earned only USD 4282.53 and USD 6014.74 of benefit, respectively. Among these, all four CFUGs, Kankali CFUG and Panchakanya CFUG earned a good income in the year 2016, but Birinchowk CFUG and Ghaledada-Ranakhola CFUG were not able to gain good benefit from the community forests. Therefore, the hilly region has the least amount of benefit from community forest management in comparison with the Terai forest.

ISSN 2564-212X | Journal of Policy & Governance| 01(01) August 2021 | https://doi.org/10.33002/jpg010103
39
Dahal, Joshi, Poudel & Panta | Community Forestry Governance in Federal System of Nepal
Table 3: Amount of income spent in different activities of the community forest in percentage
Particular Expenditure of Kankali CF (USD) Particular Expenditure of Ghaledada-Ranakhola CF (USD)
2016/17 2017/18 2018/19 2019/20 2016/17 2017/18 2018/19 2019/20
Administrative 4437.29 8115.93 9618.71 7168.51 Forest conservation 1339.16 2476.49 2343.01 1949.02
Forest conservation 8709.49 21623.31 16710.47 15389.7 Social activities 3218.85 983.736 2843.09 2317.74
Tourism 13397.7 21864.72 36860.84 22554.56 Pro poor 3228.56 3351.56 2922.51 3127.24
Social activities 18290.6 7276.74 5542.98 13634 Total
7786.58
6811.8
8108.61
7394.01
Total 44835.08 58880.7 68733 58746.77
Particular Expenditure of Birinchowk CF (USD) Particular Expenditure of Panchakanya CF (USD)
2016/17 2017/18 2018/19 2019/20 2016/17 2017/18 2018/19 2019/20
Forest conservation 1870.494 308.77615 1903.607 1927.375 Administrative 12204.47 16176.16 5069.62 10796.4
Pro poor 493.2395 466.0772 365.6977 497.4374 Social activities 4894.34 7021.52 899.45 4136.36
Social activities 1253.757 480.64212 452.5115 835.2701 Forest conservation 6939.92 12061.01 26288.46 13979.92
Total 3617.49 1255.4955 2721.816 3260.083 Total 24038.73 35258.69 32257.53 28912.68
Table 4: Total Benefits earned by community forests
S.N. Total Benefits 2016/17 (USD) 2017/18 (USD) 2018/19 (USD) 2019/20 (USD)
1 Kankali CFUG 21195.96 56075.76 94295.9 50529.2
2 Ghaledada-Ranakhola CFUG
1917.53 4626.99 6599.56 3986.06
3 Birinchowk CFUG 3894.53 13309.42 1776.31 5078.72
4 Panchakanya CFUG 38709.2 53621.3 49510.6 44950.9
3.1.7 B/C, NPV, and Profitability Index of Community Forests
The investment is said to be profitable when the Benefit-Cost Ratio (B/C) is one or greater than 1. Data in table 5 shows that all four CFUGs are making a profit. Among them, Panchakanya CFUG has more B/C and Ghaledada-Ranakhola CFUG has the lowest B/C which was calculated as 2.61 and 1.1.25, respectively. Likewise, Kankali CFUG has a maximum net present value (NPV) i.e., USD 143452.02, and Ghaledada-Ranakhola CFUG has minimum NPV, which is USD 8823.89. Birinchowk CFUG has highest Profitability Index (PI) and Ghaledada-Ranakhola CFUG has least PI, which was calculated as 6.46 and 2.73, respectively (Table 5). Higher profitability index means it is more attractive for investment.
Table 5: B/C, NPV and profitability index of community forests
S.N. CFUGs B/C NPV PI
1 Kankali CFUG 0.96 143452.02 4.96
2 Ghaledada-Ranakhola CFUG 0.57 8823.89 2.73
3 Birinchowk CFUG 2.22 17363.97 7.21
4 Panchakanya CFUG 1.55 130285.34 6.46
3.1.8 Subsidy from Different Organisations
Table 6 shows subsidies received by CFUGs from various organizations, such as Division Forest Office, Municipality and others (Table 8). The CFs from the Terai regions are getting priority from local government and provincial government, whereas CFs seems to be weak in mid-hills i.e., Ghaledada-Ranakhola and Birinchowk community forests. Subsidy plays a great role in the upliftment of the rural livelihood through infrastructure development.

ISSN 2564-212X | Journal of Policy & Governance| 01(01) August 2021 | https://doi.org/10.33002/jpg010103
40
Dahal, Joshi, Poudel & Panta | Community Forestry Governance in Federal System of Nepal
Table 6: Subsidy given to CFUGs from different organisations
Organizations 2016/17 2017/18 2018/19 2019/20
Subsidy to Birinchowk CF (USD)
Division Forest Office 3469.33 - - -
Municipality 2730.07 - - -
Ward 5618.19 770.74 - -
Subsidy to Panchakanya CF (USD)
Division Forest Office 1628.66 7487.91 56005.5 -
Rural Municipality 3722.66 15637.62 12219.5 -
Subsidy to Kankali CF (USD)
Division Forest Office - 1436.53 913.99 -
Municipality 888.79 4585.17 11046.19 -
Subsidy to Ghaledada-Ranakhola CF (USD)
ICIMOD 46.53 - - -
3.2 Discussion
The history of Nepal shows a gradual shift in the policy and management model of the forest. It is elaborated in the following discussion points.
3.2.1 Intergovernmental Relationship and Support
The study shows that the management and monitoring responsibility of the community forest should be vested in local government. Most of the CFUG members and local political leaders are in favor of the local government, whereas provincial government members strongly disagree with this view. The power in local government can lead to misleading the successful history of community forest towards deforestation and degradation in the name of infrastructure and tourism development. In contrast to this, the Forest Act 2076 has given provision of forest management and monitoring of CF to local government if approved by the provincial government.
The policy planning involves perceptions and suggestions from all tiers of the government. Merely a participation in the planning process cannot provide effectiveness and sustainability in policy formulation and implementation. Local Government Operational Act, 2017 has the clear provision that all CBOs within the boundary of local government should be involved in the local government planning process.
As the federal structure is the new provision of Nepal, limited research has been conducted on the community governance model. However, some research has identified local government for governance strengthening in the rural areas (Acharya, 2018). The study conducted by Thakali et al. (2018) has identified the increased role of local government for local resource management. The present research shows the main role of local government in fund mobilization for resource management mostly in the case of Panchakanya and Kankali CF; the other two CFs are quite lacking on this part.
3.2.2 Fund Mobilization and Benefit Sharing
This study indicates fuelwood and subsidy as sources of income generation in Kankali and Panchakanya CFUG. Tourism has become the main attraction point in all CFUGs except Ghaledada-Ranakhola CF. Community forestry guideline has a clear provision of at least 35% expenditure for the pro-poor’s livelihood activities; however, the expenditure has no connection with the provision. The study finds a very weak benefit-sharing mechanism in all CFUGs except Ghaledada-Ranakhola CF. The Forest Act, 2019 has provision to expend up to 25% for forest development, conservation and management, while remaining 25% for pro-poor livelihood, women empowerment, industry development, and establishment in coordination with the local members, which is not found being implemented practically in all CFUGs.
Community forestry user groups seem to stop looking after forests if all three levels of government imposes taxes on them (Mandal, 2019). The Intergovernmental Fiscal Arrangement Act, 2017 has proposed that 15% tax collected from the sale of timber of Shorea robusta (Sal) and Acacia catechu

ISSN 2564-212X | Journal of Policy & Governance| 01(01) August 2021 | https://doi.org/10.33002/jpg010103
41
Dahal, Joshi, Poudel & Panta | Community Forestry Governance in Federal System of Nepal
(Khayar) should be distributed among local, provincial, and federal governments. Likewise, the Local Government Operation Act, 2017 has stated that community forests will have to contribute 10 percent from their product sales to the Reserved Fund at the local level. Heavy taxes from three layers of government have created great stress on community forestry user group to conserve and protect the forest. Various enforced and proposed taxes at all three levels of government are estimated up to 90% of CFUG’s annual transactions, and the FECOFUN has been protesting against this (Mandal, 2019). Focused Group Discussion during this study supports the same view of FECOFUN. There are presently 528 forest sub-divisions and 753 local bodies. As per the constitutional provision, national forests will be under the provincial government while CFs will be under local government (Acharya, 2018). The CFUGs and local government bodies are in favour of this, while forest officers are afraid of this.
3.2.3 Benefit Cost Ratio, Net Present Value and Profitability Index
Assessing the economic contribution of the community forest products and the inequality of the subsequent income are the significant steps towards the sympathetic role of community forestry in local people’s day-to-day life (Chhetri, 2005). The study finds that the Kankali CFUG and Panchakanya CFUGs earned more benefit in comparison to Ghaledada-Ranakhola CFUG and Birinchowk CFUG. This means Terai forests are more productive than hilly forests due to various factors i.e., topographic, edaphic, climatic and management practice adopted in such regions. Community forests have very good potential to contribute to the local economy (Gilmour & Fisher, 1991). It helps fulfill the subsistence needs and improve the condition of natural resource management practice, supporting the conservation of an ecosystem and its biodiversity (Acharya, 2001). The majority of rural households depend upon the community forest resources for their daily needs i.e., fuelwood, timber, fodder, leaflitter, etc., which also play vital role in the local economy (Gharti-Chhetri et al., 2016). This study shows that the Net Present Value of Kankali CFUG and Panchakanya CFUG is higher than that of Ghaledada-Ranakhola CFUG and Birinchowk CFUG. The community forests are not only providing the forest products but also serving the user groups to generate the income.
The management of community forest is a good source of income (Lama, 2010; Gharti-Chhetri et al., 2016). The economic analysis of community forests is foremost part of transparency in any institution; however, the community forest user groups are not profit-oriented institutions (Iversen et al., 2006). The economic analysis of the community forest user group is used to carry out the income and expenditure (Richards et al., 2003). The economic analysis comprises the benefit-cost ratio analysis (B/C) and net present value (NPV). It is a very important part of the community forest to show how the forest users have been benefited and how they have been managing the forest in the situation of economic valuation. The benefit-cost ratio of these four CFUGs was found to be good, all CFUGs are said to be profitable because it has more than 1 B/C value. However, the amount of NPV is less but the Profitability Index of Birinchowk CFUG is found to be highest, while Ghaledada-Ranakhola CFUG has the lowest value of profitability index. More profitability index means a low risk of losses from investment (Mandal & Neupane, 2020).
4. CONCLUSION
The federal structure of government is somehow new in the case of Nepal. Lack of policy formulation has led to a communication gap between all three tiers of governance. The increased support to CFUG funds from the local government after a federal model has identified the need for increased role of local government in monitoring of community forests. The CFUGs and local political leaders support the view of community forestry monitoring rights should be given to the local government; however, forest officials were found reluctant on this. Lack of coordination, awareness, and cooperation among local government and CFUGs members has created some ambiguity on forest resource management at the local level. Benefit-sharing pattern has not followed the provision of the existing Forest Act and CF Guidelines. No coordination was found with local government during CF fund expenditure that is beyond the provision of Nepal Forest Policy 2019 and the law. An area of interest for future collaboration somehow seems to be a mismatch between local leaders and CFUGs. The findings show that the scientifically managed forests of mid-hills are highly dependent on donors, which triggers and provides weak efficiency and efficient principle of good governance. The weak benefit-sharing mechanism shows poor governance. Finally, it is recommended to conduct an orientation program for forest officials and
ISSN 2564-212X | Journal of Policy & Governance| 01(01) August 2021 | https://doi.org/10.33002/jpg010103
42
Dahal, Joshi, Poudel & Panta | Community Forestry Governance in Federal System of Nepal
CFUGs on new forest provisions to involve local government. Similarly, CFUGs plan should be incorporated in the local government planning process for sustainability.
REFERENCES Acharya, K. K. (2018). Local governance restructuring in Nepal: From government to
governmentality. Dhaulagiri Journal of Sociology and Anthropology, 12, 37-49. https://doi.org/10.3126/dsaj.v12i0.22178
Acharya, K. P. (2001). Should community forest be taxed? Department of Forest Research and Survey, Nepal.
Adhikari, S., Kingi, T., & Ganesh, S. (2016). Incentives and community participation in the governance of community forests in Nepal. Small-Scale Forestry, 15(2), 179-197. https://doi.org/10.1007/s11842-015-9316-8
Banjade, M. R., Paudel, N. S., & Mwangi, E. (2017). Political economy of forest tenure reform implementation in Nepal: evolution, contestation, outcomes and challenges. Journal of Forest and Livelihood, 15(1), 1-14.
Bijaya, G. D., Cheng, S., Xu, Z., Bhandari, J., Wang, L., & Liu, X. (2016). Community forestry and livelihood in Nepal: A review. Journal of Animal and Plant Sciences, 26(1), 1-12.
Bijaya, G. D., Jyoti, B., Zengrang, X., & Can, L. (2019). Contribution of Community Forestry in Poverty Reduction: Case Study of Multiple Community Forests of Bajhang District, Nepal. Journal of Resources and Ecology, 10(6), 632-640. https://doi.org/10.5814/j.issn.1674-764x.2019.06.008
Binod, B. B. (2016). History of forestry and community forest in Nepal. Imperial Journal of Interdisciplinary Research, 2(11), 424-439.
Chaudhary, D. (2019). The decentralization, devolution and local governance practices in Nepal: the emerging challenges and concerns. Journal of Political Science, 19, 43-64. https://doi.org/10.3126/jps.v19i0.26698
Chhetri, B. B. K. (2005). Community forestry program in the hills of Nepal: determinants of users participation and household dependency. MSc thesis, Norwegian University of Life Sciences.
Chhetri, B. B. K., Johnsen, F. H., Konoshima, M., & Yoshimoto, A. (2013). Community forestry in the hills of Nepal: Determinants of user participation in forest management. Forest Policy and Economics, 30, 6-13. https://doi.org/10.1016/j.forpol.2013.01.010
Choudry, A. (2002). The Asian Development Bank— “Governing” the Pacific. ZNet Commentary. Retrieved from http://www.zcommunications.org/the-asian-development-bankgoverning-the-pacific-by-aziz-choudry
Community Forestry Division (2014). Guidelines for Community Forestry Development. Department of Forest, Kathmandu.
FAO (Food and Agriculture Organization) (2020). The state of world fisheries and aquaculture 2020. FAO Fisheries and Aquaculture Department, Food and Agricultural Organisation of the United Nations, Rome; 2020. Retrieved from http://www.fao.org/state-of-fisheriesaquacultur
Gautam, A. P., Shivakoti, G. P., & Webb, E. L. (2004). A review of forest policies, institutions, and changes in the resource condition in Nepal. International forestry review, 6(2), 136-148. https://doi.org/10.1505/ifor.6.2.136.38397
Gharti-Chhetri, D. B., Cheng, S., Xu, Z., Bhandari, J., Wang, L., & Liu, X. (2016). Community forestry and livelihood in Nepal: a review. The Journal of Animal and Plant Sciences, 26(1), 1-12.
Gilmour, D. A., & Fisher, R. J. (1991). Villagers, forests, and foresters: The philosophy, process, and practice of community forestry in Nepal.
Howlett, M., Rayner, J., & Tollefson, C. (2009). From government to governance in forest planning? Lessons from the case of the British Columbia Great Bear Rainforest initiative. Forest Policy and Economics, 11(5-6), 383-391. https://doi.org/10.1016/j.forpol.2009.01.003
Hyden, G., Mease, K., Foresti, M., & Fritz, V. (2008). Governance assessments for local stakeholders: What the World Governance Assessment offers. Overseas Development Institute, Working Paper 287.
Iversen, V., Chhetry, B., Francis, P., Gurung, M., Kafle, G., Pain, A., & Seeley, J. (2006). High value forests, hidden economies and elite capture: Evidence from forest user groups in Nepal's Terai. Ecological economics, 58(1), 93-107. https://doi.org/10.1016/j.ecolecon.2005.05.021

ISSN 2564-212X | Journal of Policy & Governance| 01(01) August 2021 | https://doi.org/10.33002/jpg010103
43
Dahal, Joshi, Poudel & Panta | Community Forestry Governance in Federal System of Nepal
Joshi, R., & Singh, H. (2020). Carbon sequestration potential of disturbed and non-disturbed forest ecosystem: A tool for mitigating climate change. African Journal of Environmental Science and Technology, 14(11), 385-393. https://doi.org/10.5897/AJEST2020.2920
Joshi, R., Chhetri, R., & Yadav, K. (2019). Vegetation Analysis in Community Forests of Terai Region, Nepal. International Journal of Environment, 8(3), 68-82. https://doi.org/10.3126/ije.v8i3.26667
Joshi, R., Pangeni, M., Neupane, S.S., & Yadav, N.P. (2021). Regeneration Status and Carbon Accumulation Potential in Community Managed Sal (Shorea robusta) Forests of Far-Western Terai Region, Nepal. European Journal of Ecology, 7(1), 26-39.
Joshi, R., Singh, H., Chhetri, R., & Yadav, R. (2020). Assessment of Carbon Sequestration Potential in Degraded and Non-Degraded Community Forests in Terai Region of Nepal. Journal of Forest and Environment Science, 36(2), 113-121. https://doi.org/10.7747/JFES.2020.36.2.113
Joshi, R., Singh, H., Chhetri, R., Poudel, S., & Rijal, S. (2021). Carbon sequestration potential of community forests: A comparative analysis of soil organic carbon stock in community managed forests of Far-Western Nepal. Eurasian Journal of Soil Science, 10(2), 96-104. https://doi.org/10.18393/ejss.825066
Khadka, D., Aryal, A., Bhatta, K. P., Dhakal, B. P., & Baral, H. (2021). Agroforestry Systems and Their Contribution to Supplying Forest Products to Communities in the Chure Range, Central Nepal. Forests, 12(3), 358. https://doi.org/10.3390/f12030358
Khanal, Y., & Devkota, B. P. (2020). Farmers' responsibilization in payment for environmental services: Lessons from community forestry in Nepal. Forest Policy and Economics, 118, 102237. https://doi.org/10.1016/j.forpol.2020.102237
Lama, G. K. (2010). Contribution of Community Forestry on Livelihood of Local Users. A case study from Study from Sunsari District, Nepal. (Master Thesis (Unpublished), Tribhuwan University, Institute of Forestry, Office of the Dean, Pokhara, Nepal).
Mandal, R. A. (2019). Carbon Sequestration Potential in Community Managed Forests in Mahottari District of Central Nepal. A Thesis Submitted to the Central Department of Botany Institute of Science and Technology, Tribhuvan University, Nepal for the Award of Doctor of Philosophy in Botany by Ram Asheshwar Mandal, January, (Doctoral dissertation).
Mandal, R. A., & Neupane, S. Economic Analysis of Community Forests in Terai Nepal. International Journal of Advanced Research in Botany, 6(1), 1-8.
McDermott, M. H., & Schreckenberg, K. (2009). Equity in community forestry: insights from North and South. International Forestry Review, 11(2), 157-170.
MUNI, S. (2015). Nepal's New Constitution: Towards Progress or Chaos? Economic and Political Weekly, 50(40), 15-19. Retrieved June 2, 2021, from http://www.jstor.org/stable/24482618
Pasape, L., Anderson, W., & Lindi, G. (2015). Good governance strategies for sustainable ecotourism in Tanzania. Journal of Ecotourism, 14(2-3), 145-165. https://doi.org/10.1080/14724049.2015.1065834
Paudel, J. (2018). Community-managed forests, household fuelwood use and food consumption. Ecological Economics, 147, 62-73. https://doi.org/10.1016/j.ecolecon.2018.01.003
Piabuo, S. M., Foundjem-Tita, D., & Minang, P. A. (2018). Community forest governance in Cameroon. Ecology and Society, 23(3). https://doi.org/10.1126/science.1155369
Pokharel, R. K., Rayamajhi, S., & Tiwari, K. R. (2012). Nepal’s community forestry: need of better governance. Global perspectives on sustainable forest management. InTech, Shanghai, China, 43-58.
Poudel, M., Thwaites, R., Race, D., & Dahal, G. R. (2015). Social equity and livelihood implications of REDD+ in rural communities–a case study from Nepal. International Journal of the Commons, 9(1).
Richards, M., Maharjan, M., & Kanel, K. (2003). Economics, poverty and transparency: measuring equity in forest user groups. Journal of Forest and Livelihood, 3(1), 91-106.
Rijal, S., Subedi, M., Chhetri, R., & Joshi, R. (2021). Good Governance Assessment in Community Forest of Nepal. Journal of Forest and Environmental Science. 37(3), in Press.
Roberts, S. M., Wright, S., & O’Neill, P. (2007). Good governance in the Pacific? Ambivalence and possibility. Geoforum, 38(5), 967-984. https://doi.org/10.1016/j.geoforum.2007.04.003
Sapkota, L. M., Dhungana, H., Poudyal, B. H., Chapagain, B., & Gritten, D. (2020). Understanding the barriers to community forestry delivering on its potential: An illustration from two heterogeneous districts in Nepal. Environmental management, 65, 463-477. https://doi.org/10.1007/s00267-019-01224-0
ISSN 2564-212X | Journal of Policy & Governance| 01(01) August 2021 | https://doi.org/10.33002/jpg010103
44
Dahal, Joshi, Poudel & Panta | Community Forestry Governance in Federal System of Nepal
Schusser, C., Krott, M., Movuh, M. C. Y., Logmani, J., Devkota, R. R., Maryudi, A., & Salla, M. (2016). Comparing community forestry actors in Cameroon, Indonesia, Namibia, Nepal and Germany. Forest Policy and Economics, 68, 81-87. https://doi.org/10.1016/j.forpol.2016.03.001
Schwab, B., & Lusztig, P. (1969). A Comparative Analysis of the Net Present Value and the Benefit-Cost Ratio as Measures of the Economic Desirability of Investments. The Journal of Finance, 24(3), 507-516. https://doi.org/10.2307/2325349
Thakali, S., Peniston, B., Basnet, G., & Shrestha, M. (2018). Conservation and Prosperity in New Federal Nepal: Opportunities and Challenges. Australian Aid.
Tsiantikoudis, S., Zafeiriou, E., Kyriakopoulos, G., & Arabatzis, G. (2019). Revising the environmental Kuznets Curve for deforestation: an empirical study for Bulgaria. Sustainability, 11(16), 4364. https://doi.org/10.3390/su11164364
United Nations Development Programme (Ghana). (1997). Ghana Human Development Report. United Nations Development Programme.
ISSN 2564-212X | Journal of Policy & Governance| 01(01) August 2021 | https://doi.org/10.33002/jpg010103
45
Dahal, Joshi, Poudel & Panta | Community Forestry Governance in Federal System of Nepal
AUTHORS’ DECLARATIONS AND ESSENTIAL ETHICAL COMPLIANCES Authors’ Contributions (in accordance with ICMJE criteria for authorship)
Contribution Author 1 Author 2 Author 3 Author 4
Conceived and designed the research or analysis Yes Yes Yes Yes
Collected the data Yes No No No
Contributed to data analysis & interpretation Yes Yes Yes Yes
Wrote the article/paper Yes Yes Yes Yes
Critical revision of the article/paper No Yes No No
Editing of the article/paper Yes Yes Yes Yes
Supervision No Yes No No
Project Administration Yes Yes Yes Yes
Funding Acquisition No No No No
Overall Contribution Proportion (%) 30 30 20 20
Funding No funding was available for the research conducted for and writing of this paper. Research involving human bodies (Helsinki Declaration) Has this research used human subjects for experimentation? No Research involving animals (ARRIVE Checklist) Has this research involved animal subjects for experimentation? No Research involving Plants No plant was used to conduct this research. Research on Indigenous Peoples and/or Traditional Knowledge Has this research involved Indigenous Peoples as participants or respondents? No
(Optional) PRISMA (Preferred Reporting Items for Systematic Reviews and Meta-Analyses) Have authors complied with PRISMA standards? No Competing Interests/Conflict of Interest Authors have no competing financial, professional, or personal interests from other parties or in publishing this manuscript. RIGHTS AND PERMISSIONS Open Access. This article is licensed under a Creative Commons Attribution 4.0 International License, which permits use, sharing, adaptation, distribution and reproduction in any medium or format, as long as you give appropriate credit to the original author(s) and the source, provide a link to the Creative Commons license, and indicate if changes were made. The images or other third-party material in this article are included in the article's Creative Commons license, unless indicated otherwise in a credit line to the material. If material is not included in the article's Creative Commons license and your intended use is not permitted by statutory regulation or exceeds the permitted use, you will need to obtain permission directly from the copyright holder. To view a copy of this license, visit http://creativecommons.org/licenses/by/4.0/.

M – 00230 | Review Article ISSN 2564-212X 01(01) | August 2021
Foundation of the Digital Global Economy Bhavya Walia*1, Siddhant Saggar2 1Economics Department, Maharaja Agrasen Institute of Management Studies, Rohini, New Delhi 110018, India. Email: [email protected] | ORCID: 0000-0002-0548-7474 2Economics Department, Maharaja Agrasen Institute of Management Studies, Rohini, New Delhi 110018, India. Email: [email protected] | ORCID: 0000-0001-8000-6768 *Corresponding author
ABSTRACT A medium to facilitate the exchange of value has been the sole necessity for the mere existence of currency. As the civilization moved from using metals, paper, and plastic to facilitate exchange, our requirements from a currency became refined. Some of those requirements were the prevention of counterfeiting and accountability. As the human civilization moves forward, the solution to some of the problems faced by us are discovered by humans. Cryptocurrency is a decentralized form of currency mined by computers by solving complex equations in exchange for a reward of the very same commodity. This article aims to study the major cryptocurrencies and the concept of blockchain, how they operate, how it will be affecting India, and what are the consequences of banning this form of currency. This research is carried out by evaluating white papers of Bitcoin and Ethereum (the two main cryptocurrencies of present time) along with research papers and news articles found with the help of search engines and online discussion threads. Keywords: Cryptocurrency; Blockchain; Bitcoin; Ethereum
Received: 18 June 2021 Reviewed: 05 July 2021 Accepted: 15 July 2021 Published: 10 August 2021
__________________________________________________________________________________________________________________
How to cite this paper: Walia, B. & Saggar, S. (2021). Foundation of the Digital Global Economy. Journal of Policy & Governance, 01(01), 46-53. https://doi.org/10.33002/jpg010104
Copyright © 2021 by author(s). This work is licensed under the Creative Commons Attribution International License (CC BY 4.0).
http://creativecommons.org/licenses/by/4.0/

ISSN 2564-212X | Journal of Policy & Governance| 01(01) August 2021 | https://doi.org/10.33002/jpg010104
47
Walia & Saggar | Foundation of the Digital Global Economy
1. INTRODUCTION
The difference between money and currency is merely a tangibility. The money is an intangible concept, while currency until now has been used to describe the notes or coins issued by the governments. The difference between these two words stands crystal clear with the advent of cryptocurrency being adopted across the world. This intangible form of currency is mined by computers through solving complex mathematical problems. The Bitcoin, for example, holds value simply because of its scarcity. In case of cryptocurrency, a government is not required to instruct the citizens about what holds value and what does not; community choice prevails. As of now, a community choice is observed thriving in terms of cryptocurrency. It can be examined how cryptocurrency operates. What are its limitations? How shall it provide a reliable and robust mechanism best suited for the economic needs of modern civilization? A special emphasis shall be on blockchain technology, which serves as the foundation of the technology. Here is an in-depth study of cryptocurrency’s potential and problems it would help to solve. How does Indian government look at it? Whether Indian government will ban it; and, if it is banned, what are the consequences of banning cryptocurrency?
The purpose of this article is to establish an understanding of blockchain technology and how it has been used to establish two major cryptocurrencies of present time: Bitcoin1 and Ethereum2. The implications of blockchain technology are the prevention of financial de-platforming3 as well as de-platforming of social media, which are some of the advantages of blockchain technology. Here, this article looks into India’s stand on cryptocurrency and its implications as well as drawbacks of banning cryptocurrency.
The scientific basis of this article can be explained in accordance with the purpose of the study as follows. Blockchain works as blocks of data arranged systematically in a chronological order. This chain of data is replicated by mining servers working as nodes on the network replicating and verifying transactions/events in a ledger accessible to everyone. The nodes can verify transactions by showing proof of work i.e., solving complex hashing algorithms; therefore, putting their computing power on stake. The former is the basic working of the Bitcoin blockchain as well as the native Ethereum blockchain. Blockchain platforms not only provide the technology to run peer-to-peer currencies, but also provide the possibility of building social media platforms completely independent and free of any intervention from major technological corporations. 2. METHODOLOGY
In the present article, secondary data were collected from well-known cryptocurrency platforms, for example, Binance. The research was conducted with the help of white papers, research papers and new articles found with the help of search engine and online discussion threads to look into the current scenario of cryptocurrency and blockchain technology. 3. CRYPTOCURRENCY
Individual coin ownership records are kept in a ledger that exists in the form of a computerized database employing strong encryption to protect transaction records. This regulates the production of new currencies and validates ownership transfers. It is usually not supplied by a centralized authority and does not exist in a physical form (like paper money). Cryptocurrencies, in contrast to centralized digital currencies and central banking institutions, are often decentralized. If a cryptocurrency is coined or manufactured prior to release, or if it is issued by a single issuer, it is classified as centralized. Each decentralized cryptocurrency makes use of distributed ledger technology, most often a blockchain, to function as a public financial transaction database. Bitcoin was the first decentralized cryptocurrency
1 Bitcoin, launched in 2009 is a decentralized blockchain platform meant to facilitate the exchange of value. The first
successful implementation of a cryptocurrency. 2 Ethereum, launched in July 2015, is a decentralized platform that runs so-called “smart contracts”. Smart contracts are
“self-executing” contracts or applications that run exactly as programmed without any possibility of downtime (i.e., the
blockchain is never down, it is always running), censorship, fraud or third-party interference. 3 Deplatforming is the act of boycotting an individual or a group of individuals from availing the services of a platform (In
this case financial and social media) by denying access to the said platform.

ISSN 2564-212X | Journal of Policy & Governance| 01(01) August 2021 | https://doi.org/10.33002/jpg010104
48
Walia & Saggar | Foundation of the Digital Global Economy
launched in 2009 as open-source software. Following Bitcoin's debut, several cryptocurrencies have surged in value. 4. BITCOIN
Bitcoin is a decentralized digital currency which can be sent directly from one user to another over its peer-to-peer network. There is no single administrator or central bank. Cryptography is used by network nodes to verify transactions, which are then recorded in a blockchain, which is a distributed ledger that is not centralized. As a result of this mining process, Bitcoins are created. According to a research performed by the University of Cambridge, the most popular cryptocurrency is Bitcoin (Houben, 2015). In 2017, there were 2.9 to 5.8 million unique users of cryptocurrency wallets (Bryans, 2014). It was founded in 2008 by an unknown person or group of individuals under the pseudonym Satoshi Nakamoto. It was implemented in 2009 when the currency's implementation was released as open-source software (Bryans, 2014).
Nakamoto (2008) proposed an electronic commerce system that is not dependent on trust. He began with the traditional technique of digital signature coins, which allows for enough ownership control but does not prevent duplicate spending. To address this, he suggested a proof-of-work peer-to-peer network that keeps a public history of transactions that becomes computationally impossible to alter when nodes control the majority of the CPU power. Due to its unstructured simplicity, the network is stable. The nodes work in unison, with very little coordination. Since messages are not directed to a specific destination and must be delivered quickly, they are not needed to be tagged. Nodes may leave and rejoin the network at any time, with the proof-of-work chain proving what happened while they were gone. They function by extending valid blocks while refusing to deal with incorrect blocks. This consensus method may be used to create any necessary rules and incentives.
Almost all online commerce today relies on banking institutions to handle electronic payments as trusted third parties. While the framework is adequate for the majority of transactions, it is vulnerable to the trust-based paradigm's basic flaws. Fully irreversible transactions are impractical due to financial institutions' inability to resolve disputes. Mediation costs raise transaction costs by reducing the minimum transaction size and eliminating the possibility of small informal transactions, as well as a wider cost connected with the inability to make irreversible payments for irreversible services. As the likelihood of a reversal grows, so does the need for confidence. Customers should be cautious of merchants that badger them for information they do not need. Fraud is generally seen as an unavoidable part of life. While these costs and risks of payment may be avoided in person by using real money, payments cannot be made without the help of a trustworthy partner via a communication channel. 5. ETHEREUM
Ethereum, or Ether, is a self-regulating platform (Houben, 2015) that enables payments to occur only when all agreed-upon criteria have been met. The platform is programmed in such a manner that payment is made only when the job is completed in accordance with the criteria of the encrypted coded contract (virtual contract). The transaction is not involving a third party. It allows the development and operation of Smart Contracts and Distributed Applications (D Apps) without the need for downtime, fraud, control, or intervention from a third party.
Ethereum is capable of "codifying, decentralizing, securing, and trading almost anything". One of the most significant Ethereum-related initiatives is Microsoft's collaboration with ConsenSys, which provides "Ethereum Blockchain as a Service (E BaaS) on Microsoft Azure, providing enterprise customers and developers with a single-click cloud-based blockchain development environment".
After a fraudulent attacker stole more than $50 million in assets from the decentralized autonomous organizations (DAO) (Houben, 2015), a collection of smart contracts built from Ethereum's computing platform, Ethereum was split into two separate blockchains in 2016: Ethereum and Ethereum Classic. Ethereum's current version was created as a hard fork from the original software in order to prevent further ransomware attacks. Ethereum is the second-largest virtual currency in the market in terms of market value in September 2019, behind only Bitcoin (Hileman & Rauchs, 2017) Ether money is much simpler to acquire than Bitcoin (roughly 14 or 15 seconds compared to Bitcoin's near-uniform 10 minutes), and there are significantly more ether units in circulation than Bitcoin

ISSN 2564-212X | Journal of Policy & Governance| 01(01) August 2021 | https://doi.org/10.33002/jpg010104
49
Walia & Saggar | Foundation of the Digital Global Economy
6. BLOCKCHAIN
A blockchain is a database that is built over time by a network of users who all use the same software and are bound and controlled by the program's limitations and regulations. A blockchain is made up of data blocks that are eventually "chained" together, as the name suggests. It is more like a spreadsheet that grows as more cells are added. The program builds and maintains a blockchain database while it is in use. As a result, unlike a centralized database controlled by a single entity, it remains "alive" even if individual members stop contributing (or, for example, go bankrupt). It produces an irreversible record that is unaffected by third-party interference.
Furthermore, if the underlying program being executed by participants' modified code changes, the resulting blockchain's design changes, allowing the development of blockchain databases capable of storing a variety of data types, such as property titles, contracts, shares, voting decisions (Noizat, 2015), and even reputation ratings. Through the development of platforms like Ethereum, Counterparty, and Block Stream 25, individuals and small businesses may now utilize blockchain-based solutions. Provenance, for example, is attempting to use the Ethereum architecture to build a very open global corporate supply chain ledger.
Experiments with smart contracts, which are small packets of code — or scripts — that can be stored on a blockchain and retrieved by users to perform simple functions, are in the fore (Wright & De Filippi, 2015). A typical insurance policy, for example, may be designed in this way (Mainelli & Von Gunten, 2014). Consider a blockchain-based script that is triggered when two parties send Bitcoins to a script-managed escrow Bitcoin account, which will subsequently release the Bitcoins to the person who wins a bet on the average amount of rainfall over a certain time in the future. This smart contract is set up to collect meteorological data from weather agencies and then release Bitcoins from escrow after a certain length of time, giving them to a farmer who is suffering from drought. This is a weather derivatives contract built on the blockchain.
Simple building-block contracts may be used to create more complex multi-stage or multi-function entities known as "decentralized autonomous organizations" (DAOs) by some. While complex multi-stage algorithms are kept in the background on a decentralized network of computers rather than being managed by a single management team, such DAOs are difficult to understand and seem to many people to be science fiction.
When it comes to collecting basic data for those with more urgent pragmatic needs, blockchain networks are often the most effective. The potential of blockchain technologies to permanently record property rights has drawn the attention of proponents of free market economics. Land registries are often used as examples. There is an issue of double registration of land, land title fraud, or unclear title to land in countries with poor governance and record-keeping systems, which may be addressed with a blockchain system that permanently records land title in a public manner. In 2015, Honduras formed a partnership with the American firm Factom 27 to create a land registry based on blockchain technology (Chavez-Dreyfuss, 2016).
Brian Singer believes that blockchain technology is the ultimate way to achieving Hernando de Soto's objective of establishing strong property rights in informal economies in an interview with Forbes titled "How Bitcoin Can End Global Poverty" (Forbes, 2015). Inert capital may be enabled if people are given names and property titles. The title to a home may be used to generate leverage, allowing banks to lend to informal entrepreneurs at a lower interest rate.
This paper is founded on the idea that, if property and contracts are properly protected, market and capitalization processes may help people overcome poverty by exposing the hidden potential of informal economies. Rather than relying on a politically controlled State to optimize these market processes, the poverty-eradicating power of property and markets might be enhanced by replacing inefficient state institutions with technology, which would be a kind of political "escape".
However, it is unclear if such blockchain registries can solve core issues. Uncertain land titles are frequent in areas where institutions are weak, which adds to the original ambiguity. In this situation, just providing a technology for recording claims is worthless unless there are strong legal institutions in place to accept the blockchain-registered claims, as well as strong processes in place to determine who gets to submit the claims. There is a sense of perspective here. While blockchain technology has the most promise in circumstances where institutions and parties are vulnerable and cannot simply trust one another. For example, Afghanistan, where governmental capacity is weak and confidence is poor due to war, is in the worst position to deploy such technology. 30 major banks, technology companies, and other

ISSN 2564-212X | Journal of Policy & Governance| 01(01) August 2021 | https://doi.org/10.33002/jpg010104
50
Walia & Saggar | Foundation of the Digital Global Economy
organizations, including J.P. Morgan Chase, Microsoft, and Intel, are collaborating to develop enterprise-ready implementations of Ethereum, a decentralized computing network based on digital currencies, because it paved the way for decentralized financing (Hackett, 2017). 6.1 Benefits of the Decentralized Blockchain Technology 6.1.1 Bitcoin's Technology Safeguards Financial Platforms from Deplatforming
The Reserve Bank of India (RBI) would govern a digital rupee, while Bitcoin and Ethereum are decentralized international cryptocurrencies that are not controlled by any one entity. Administrators of the RBI's digital rupee will be allowed to create wallets, suspend accounts, and reverse transactions. By contrast, Bitcoin is more comparable to digital gold in that it cannot be frozen or stolen by any government. This characteristic contributes significantly to Bitcoin's value in terms of maintaining India's national stability. In times of conflict, India and its diaspora will rely on a network that no government can shut down (Balaji, 2021). 6.1.2 Ethereum's Technology Prevents Social Media Sites from Being Deplatformed
India can emphasize national support for open technologies such as Ethereum in order to create social networks and chat applications that US corporations cannot shut down, for the same reasons that Mexico, Germany, and France expressed outrage over the de-platforming of a sitting US president and his supporters by a group of American tech giants. Global Twitter replacements would be part of the solution, but non-Indians would not be able to use Indian Twitter, and India would also need to interact with the rest of the world via neutral foreign channels. That is what blockchain enables. It is critical to keep in mind that the potential of political deplatforming exists. It is not a big thing to prohibit someone else once a social network prohibits the "world's most powerful man" (referring to Mr. Donald Trump's twitter account being disabled). Each day, another news confirms this tendency. Consider that millions of Indians already use American-developed applications such as Twitter, WhatsApp, Facebook, Gmail, PayPal, and Google Pay. If the Indian Prime Minister or the Indian people get enough negative publicity, American technology firms may ban them from entering the US and accessing most of the internet. Not just through telephone message, but also via payment submission and collection via US-controlled networks such as SWIFT, PayPal, and Google Pay.
America might serve as the impetus for such an occurrence. The New York Times published an erroneous photograph of a Brazilian rainforest on fire, leading an Atlantic writer to advocate for Brazil's invasion. Though the calmer heads prevailed when the photograph was revealed to be a fake, anyone could be the next victim of government misinformation (Chokshi, 2019). There is no way of knowing when digital warfare may erupt. Decentralization is incompatible with deplatforming; hence, blockchain solves the problem.
6.2 Foreign Investment: Crypto brings apital to India
People in the global technology community agree on the significance of Bitcoin. Olaf Carson-Wee of Polychain Capital projected that cryptocurrencies would create 25-50 percent of the world's millionaires if and when Bitcoin hits $200,000 per Bitcoin. Consequently, India's alleged prohibition of Bitcoin criminalizes the belongings of many otherwise innocent Indians. In the first case, it prevents a trillion dollars' worth of cryptocurrency from being transferred to India. The planned crypto ban would increase capital movement. Additionally, neoliberal travel. Let us not overlook the fact that Indian entrepreneurs are very mobile. The value of cryptocurrency exchanges such as Coinbase, Binance, and Kraken, as well as cryptocurrency mining companies and new digital currencies such as Ethereum, has risen to billions of dollars. All Indian counterparts to such institutions will be located outside the country, as Indian pioneers are once again forced to migrate. On the other hand, the right crypto approach would result in capital landing rather than capital flight. Consider the billions of dollars’ worth of cryptocurrencies expected to arrive in India. Frequently, forward-thinking technological capitals and financial centers like Switzerland and Singapore have adopted pro-crypto positions in order to attract the world's largest creators and purchasers to their borders. At the present, the US and China are on a collision path with regard to monetary effect. The US wants all nations to adopt the dollar, while China may use the Belt and Road to promote its digital yuan. India may reinvent itself as a decentralized development that promotes crypto conventions as an alternative to the principles-based global request, beginning with its monetary framework: a computerized rupee backed by advanced gold.
ISSN 2564-212X | Journal of Policy & Governance| 01(01) August 2021 | https://doi.org/10.33002/jpg010104
51
Walia & Saggar | Foundation of the Digital Global Economy
India has successfully recognized that re-establishing uncommitted development would play a stabilizing role in the next US-China Cold War. Additionally, digital currencies provide a scholarly method for financial adjustment across the developments of often varied nations. In contrast to US and China, who will attempt to coerce nations into accepting the dollar or advanced yuan separately, India understands that each country will ultimately need its own public money on a local level and a global one. Bitcoin and crypto conventions provide that neutral stage, a calm environment conducive to global trade and communication, just as gold did in the past and the Law of the Sea does now. In comparison to the dollar or yuan, the advanced rupee is not a candidate to become the world's reserve currency. Thus, although India may have some responsibility for the advancing rupee on a local level, it would be preferable if nobody were in charge, particularly the inevitably unpredictable US or China. 6.3 Financial Fraud Prevention: Crypto refers to mathematically provable accounting
Blockchain, according to Deloitte, is a breakthrough in accounting since it allows for triple-entry accounting. Many people are unaware that the big four accounting companies (PwC, EY, KPMG, and Deloitte) are already using Bitcoin and Ethereum as gold standards of reality. PwC's Halo, for example, "interrogates the network in an unbiased and trustworthy manner to collect verifying information on blockchain transactions and balances", according to the company. The corroborating facts may be trusted because blockchains employ cryptography to establish a visible global record of who charged what money to whom, when and how. Furthermore, if a company's internal history of Bitcoin transactions has mistaken, it may always refer the blockchain record to reconcile a payment. This triple-entry bookkeeping has been dubbed a "game-changer" in accounting by Deloitte and others as a way to "dramatically simplify accounting procedures while staying compliant with regulatory requirements". It is the most significant accounting breakthrough since the introduction of double-entry bookkeeping, which academics say paved the way for the current financial sector.
On-chain accounting makes audits both easy and automated, which is a key feature. Proof-of-reserve technology, for example, allows businesses to confirm that they have the necessary cash on hand on a regular basis. This would prevent situations like those described in the Vijay Mallya4 case, in which allegedly false proof of reserves was submitted to get loans. A blockchain-based lending network (such as MakerDao) will never fall for such a fraud since it requires cryptographically provable on-chain collateral. Regulators may use blockchains to replay transactions for market monitoring, assign some compliance to smart contracts, and even allow for on-chain stock certificate issuance and custody for real-time settlement. In addition, India is considering enabling technology firms to join the banking sector.
Authorities will be able to monitor and mitigate risk with the use of blockchain-based accounting. India may outperform the rest of the world by mandating on-chain accounting, invoicing, and stock issuance for all companies by 2030, thanks to the combination of India Stack and the digital currency. We can avoid manipulation, improve financial sector credibility, and attract more foreign direct investment by encrypting all financial transactions. Overseas investors will have confidence in the accounting. In a nutshell, this is a full 180-degree turn in legislative policy. In the same way that the US government attempted to prohibit encryption in the 1990s before eventually mandating it, intelligent Indian regulators should recognize that blockchains have the potential to deter financial fraud and increase trust in the mechanism through mathematical, cryptographic proofs of enforcement. 6.3.1 Banning crypto is not technically feasible
Banning Bitcoin is theoretically impossible since, even if a government bans cryptocurrencies, it cannot prohibit wallets because they are decentralized access to a wallet and can be reduced to a login ID and password. In case, an individual forgets his/her password, access to the wallet can be regained through a 12-word security key. Thus, cryptocurrency ownership can be reduced to the possession of 12 random words, which can easily be transported across international borders, as something as trivial as a handful of words cannot be regulated. Anyone can deposit Bitcoins (BTC) into your account, but only the individual who owns the wallet with the pass can withdraw them. Therefore, rendering crypto wallets is immune to third party intervention.
4 Businessman Vijay Mallya is an accused in a bank loan default case of over $1.3 billion, which involved his defunct
Kingfisher Airlines. https://blog.ipleaders.in/analysis-vijay-mallya-case/;
https://economictimes.indiatimes.com/topic/Vijay-Mallya-case; https://blog.ipleaders.in/analysis-vijay-mallya-case/;
https://economictimes.indiatimes.com/topic/Vijay-Mallya-case

ISSN 2564-212X | Journal of Policy & Governance| 01(01) August 2021 | https://doi.org/10.33002/jpg010104
52
Walia & Saggar | Foundation of the Digital Global Economy
7. CONCLUSION
Cryptocurrency and the blockchain technology are the next step in facilitating truly trustless exchange of value in modern civilization. The decentralization of blockchain will give rise to operating currencies that cannot be shut down without a complete agreement between nodes. Individual countries placing a ban on the technology or the currency running on it shall not be fruitful due to its decentralized nature. Decentralized open ledgers have proved to be the gold standard of accounting, embracing the technology shall only bring capital investment to the country. The currencies like Ethereum, which use smart contracts, allow users a very powerful platform to develop application on it. The benefits of using Bitcoin technology are that it protects finance platforms from being deplatformed. Whereas Ethereum’s technology helps avoid the deplatforming of social media platforms. It enhances Foreign Investment that is Crypto brings capital to India. Another important benefit is Financial Fraud Prevention which could be understood by the phenomenon that Crypto refers to mathematically provable accounting. Finally, we conclude that banning Crypto is not technically feasible.
ACKNOWLEDGEMENTS We are grateful to Binance exchange for the secondary data. We are grateful to our teachers at the Economics Department of Maharaja Agrasen Institute of Management Studies for guiding us in writing the paper. Our sincere thanks to Dr. Sonali Walia for helping us understand the concept of writing research articles. REFERENCES Balaji, S. S. (2021). Why India Should Buy Bitcoin? Blog: 4 February 2021. Retrieved from
https://balajis.com/why-india-should-buy-bitcoin/ Bryans, D. (2014). Bitcoin and Money Laundering: Mining for and Effective Solution. Indiana Law
Journal, 89 (1), 444. Retrieved from https://www.repository.law.indiana.edu/ilj/vol89/iss1/13 Buterin, V. (2014). Ethereum White paper. https://blockchainlab.com/pdf/Ethereum_white_paper- Chavez-Dreyfuss, G. (2016). Sweden tests blockchain technology for land registry. Reuters, 17 June 2016.
Retrieved from https://www.reuters.com/article/us-sweden-blockchain-idUSKCN0Z22KV Chokshi, N. (2019). As Amazon Fires Spread, So Do the Misleading Photos. New York Times, 23 August
2019. Retrieved from https://www.nytimes.com/2019/08/23/world/americas/amazon-rainforest-fire-photos.html
Forbes, S. (2015). How Bitcoin Will End World Poverty? Forbes, 2 April 2015. Retrieved from https://www.forbes.com/sites/steveforbes/2015/04/02/how-bitcoin-will-end-world-poverty/?sh=1643555e2a5a
Hackett, R. (2017). Big Business Giants from Microsoft to J.P. Morgan are Getting Behind Ethereum. Fortune, 18 Februray 2017. Retrieved from https://fortune.com/2017/02/28/ethereum-jpmorgan-microsoft-alliance/
Hileman, G. & Rauchs, M. (2017). Global Cryptocurrency Benchmarking Study. Cambridge: Centre for Alternative Finance. Retrieved from https://www.jbs.cam.ac.uk/faculty-research/centres/alternative-finance/publications/global-cryptocurrency/#.YPiFpegzZPY
Houben, R. (2015). Bitcoin: there two sides to every coin. ICCLR, 26, 193-208. Mainelli, M. & Von Gunten, C. (2014). Chain of a lifetime: How Blockchain Technology Might
Transform Personal Insurance-Long Finance. Z/Yen Group, Long Finance (December 2014), p.51. Retrieved from https://www.longfinance.net/publications/long-finance-reports/chain-of-a-lifetime-how-blockchain-technology-might-transform-personal-insurance/
Nakamoto, S. (2008). Bitcoin: A peer-to-peer electronic cash system. Retrieved from https://bitcoin.org/bitcoin.pdf
Noizat, P. (2015). Blockchain Electronic Vote. In David Lee Kuo Chuen (Ed.). Handbook of Digital Currency: Bitcoin, Innovation, Financial Instruments, and Big Data, pp. 453–461. Amsterdam, Netherlands: Elsevier. Retrieved from http://www.gbv.de/dms/zbw/830306846.pdf
Wright, A. & De Filippi, P. (2015). Decentralized Blockchain Technology and the Rise of Lex Cryptographia. SSRN Electronic Journal. http://10.2139/ssrn.2580664, or http://dx.doi.org/10.2139/ssrn.2580664

ISSN 2564-212X | Journal of Policy & Governance| 01(01) August 2021 | https://doi.org/10.33002/jpg010104
53
Walia & Saggar | Foundation of the Digital Global Economy
AUTHORS’ DECLARATIONS AND ESSENTIAL ETHICAL COMPLIANCES Authors’ Contributions (in accordance with ICMJE criteria for authorship)
Contribution Author 1 Author 2
Conceived and designed the research or analysis Yes Yes
Collected the data Yes Yes
Contributed to data analysis & interpretation Yes No
Wrote the article/paper Yes No
Critical revision of the article/paper Yes No
Editing of the article/paper Yes No
Supervision Yes No
Project Administration Yes No
Funding Acquisition No No
Overall Contribution Proportion (%) 80 20
Funding No funding was available for the research conducted for and writing of this paper. Research involving human bodies (Helsinki Declaration) Has this research used human subjects for experimentation? No Research involving animals (ARRIVE Checklist) Has this research involved animal subjects for experimentation? No Research involving Plants No plant was used to conduct this research. Research on Indigenous Peoples and/or Traditional Knowledge Has this research involved Indigenous Peoples as participants or respondents? No
(Optional) PRISMA (Preferred Reporting Items for Systematic Reviews and Meta-Analyses) Have authors complied with PRISMA standards? No Competing Interests/Conflict of Interest Authors have no competing financial, professional, or personal interests from other parties or in publishing this manuscript. RIGHTS AND PERMISSIONS Open Access. This article is licensed under a Creative Commons Attribution 4.0 International License, which permits use, sharing, adaptation, distribution and reproduction in any medium or format, as long as you give appropriate credit to the original author(s) and the source, provide a link to the Creative Commons license, and indicate if changes were made. The images or other third-party material in this article are included in the article's Creative Commons license, unless indicated otherwise in a credit line to the material. If material is not included in the article's Creative Commons license and your intended use is not permitted by statutory regulation or exceeds the permitted use, you will need to obtain permission directly from the copyright holder. To view a copy of this license, visit http://creativecommons.org/licenses/by/4.0/.

M – 00231 | Review Article ISSN 2564-212X 01(01) | August 2021
International Legal Regulation and Supranational Interaction in Counteracting the COVID-19 Pandemic: Challenges and Proposals Ievgenii Shulga*1, Zoryana Skaletska2, Olena Kalaianova3, Oleksandra Shynkaruk4 1Department of International Law and Comparative Law, National University of Life and Environmental Sciences of Ukraine, 03041, Kyiv, Ukraine. Email: [email protected] | ORCID: 0000-0002-9343-8647 2Department of European and International Law, National University “Kiyv-Mohyla academy”, Hryhoriya Skovorody St., 2, 04655, Kyiv, Ukraine. Email: [email protected] | ORCID: 0000-0001-9162-4836 3Department of Criminology and Psychology, Odessa State University of Internal Affairs, Uspenska St., 1, 65000, Odesa, Ukraine. Email: [email protected] | ORCID: 0000-0003-3882-2192 4Department of Philosophy and International Communication, National University of Life and Environmental Sciences of Ukraine, 03041, Kyiv, Ukraine. Email: [email protected] | ORCID: 0000-0002-5494-1370 *Corresponding author
ABSTRACT The purpose of the article is to study problems of international legal regulation and supranational cooperation in combating the COVID-19 pandemic. The institutional and international legal mechanism of counteraction to the spread of the pandemic is analyzed. The problem moments of realization of provisions of the main international acts in the area of counteraction to the Coronavirus disease by the national governments are marked out. The methodological basis for the article is general and special methods and techniques of scientific knowledge, in particular: formal-logical, Aristotelian method, method of documentary, system-structured method, formal and legal method, forecasting method, method of generalization. The key problems of international legal counteraction to the pandemic spread are as follows: advisory (not obligatory) character of the majority of international legal acts related to the fight against COVID-19; disinterest of the states in timely informing WHO about the outbreaks of infectious diseases; arbitrary interpretation of the international acts by national governments; human rights restrictions on the movement imposed by the states; lack of a clear funding mechanism to build the necessary global and national infrastructure to ensure commitment in accordance with the International Health Regulations. Keywords: International law; Covid-19; Supranational cooperation; Human rights
Received: 31 July 2021 Reviewed: 05 August 2021 Accepted: 06 August 2021 Published: 10 August 2021
__________________________________________________________________________________________________________________ How to cite this paper: Shulga, I., Skaletska, Z., Kalaianova, O., & Shynkaruk, O. (2021). International Legal Regulation and
Supranational Interaction in Counteracting the COVID-19 Pandemic: Challenges and Proposals. Journal of Policy & Governance, 01(01), 54-62. https://doi.org/10.33002/jpg010105
Copyright © 2021 by author(s). This work is licensed under the Creative Commons Attribution International License (CC BY 4.0). http://creativecommons.org/licenses/by/4.0/

ISSN 2564-212X | Journal of Policy & Governance| 01(01) August 2021 | https://doi.org/10.33002/jpg010105
55
Shulga, Skaletska, Kalaianova, & Shynkaruk | International Legal Regulation and Supranational Interaction in Counteracting the COVID-19 Pandemic: Challenges and Proposals
1. INTRODUCTION
Today, the global society is facing increasing challenges from the spread of infectious diseases. Over the past few decades, the world has faced such strains as Bird Flu (H5N1), Grippus Suum (H1N1), Febris Ebola (EBOV) and others. However, the most widespread so far is the spread of Covid-19 (SARS-CoV-2), the consequences of the spread have a transboundary character and have already manifested themselves in the social sphere and various sectors of the economy of many countries. On March 11, 2020, the World Health Organization (WHO) announced that the COVID-19 virus epidemic had reached pandemic level (World Health Organization, 2020a).
The rapid spread of the COVID-19 pandemic contains a number of threats from ensuring the national security of each individual state, interstate economic and political relations to respecting and protecting human rights. COVID-19 has been spreading around the world for over a year and is taking the lives of millions of people (Worldometers, 2021). The rapid spread of the new strain and the threats it poses to human life and health have brought the issue of pandemic to an international level. Now the international counteraction to the COVID-19 is a key task of international governmental (United Nations, World Health Organization, International Monetary Fund, World Bank, European Central Bank, etc.) and non-governmental (International Red Cross and Red Crescent Movement, Doctors Without Borders, Wild4Life, BRAC, etc.) organizations. Cooperation between international organizations and national governments is carried out mainly on the basis of coordination and recommendations. At the same time, direct implementation of anti-epidemic measures, management in the sphere of counteraction to the spread of the pandemic is the task of national governments implementing administrative restrictive anti-epidemic measures aimed at preventing the spread of COVID-19. Counteracting the spread of the pandemic through the administration of restrictive, anti-epidemic measures and vaccination of the population remain one of the most effective ways to prevent new infections.
The goal of this article is to study problems of international legal regulation and supranational cooperation in combating the COVID-19 pandemic.
2. RESEARCH METHODS
A set of methods were used to compile the article. The peculiarities of the research structure of the
article are determined by a combination of legal and formal-logical methods that allow to achieve its goal. The aristotelian method allowed, based on the study of statistical literature, institutional menhanism to describe in detail and systematically the nature of international legal and supranational cooperation in the field of counteraction to the spread of pandemic COVID-19. Under the influence of the method of documentary analysis, it became possible to analyze the provisions of international legal acts on the essence of their provisions to counter the spread of the pandemic. Use of system-structured method helped to investigate the essence of available international legal countermeasures and their implementation by national governments of the states. The formal and legal method and the forecasting method made it possible to clarify the major problem points in the international legal regulation of combating the spread of infection and to highlight the prospects for their further improvement. Several other general and special methods of scientific knowledge were used in the work that allowed a thorough and comprehensive approach to the implementation of our study. 3. LITERATURE REVIEW
Different issues related to international legal regulation and supranational cooperation in an
attempt to counter the COVID-19 pandemic have been studied by a number of scholars. Habibi et al. (2020) studied violations of the international health regulations during the COVID-19 pandemic. The authors conclude that upholding the rule of international law is needed now more than ever. Countries can start by rolling back illegal travel restrictions that have already been implemented and by supporting WHO and each other in implementing the International Health Regulations, 2005 (IHR).
Pevehouse (2020) examined populist ideology, which sheds light on some of the difficulties in disentangling the various individual-level ideologies and attitudes that hang together around international cooperation. In his work the author has argued that understanding the mechanisms by

ISSN 2564-212X | Journal of Policy & Governance| 01(01) August 2021 | https://doi.org/10.33002/jpg010105
56
Shulga, Skaletska, Kalaianova, & Shynkaruk | International Legal Regulation and Supranational Interaction in Counteracting the COVID-19 Pandemic: Challenges and Proposals
which populism influences international cooperation is an important avenue of research for this topic. The States’ Duties to Prevent and Halt the Coronavirus Outbreak were analized by Dias & Coco
(2020). In the conclusion, scholars noted that with origins dating back to the 19th century, due diligence remains a fundamental principle of international law. To the extent that they can, states must do more to stop this outbreak and prevent it from spreading further and reappearing in recovered areas. In particular, according to the International Health Regulations, 2005, states should continue to closely monitor the development of the disease with efficient testing and to prepare for the worst-case scenario.
Villarreal (2020) resumes that states by deviating from the WHO´s advice fail to fulfill their obligations under the IHR. In his opinion, article 43 of the International Health Regulations, 2005 (IHR)1, which regulate relations between international and national authorities, in general is not ‘hard-and-fast’ in the sense that disregarding the WHO´s recommendations lead to a violation per se. Gostin (2004) in his scientific work focused on specific problems of international infectious disease law. The author claims that the WHO should ensure state compliance with health norms and generous economic and technical assistance to poorer countries. An important issue for the international community is how sovereign countries can join together to make global health work for everyone, the poor and the wealthy alike.
Milanovic (2020) highlighted as a separate problem the viral misinformation and the freedom of expression. At the same time, the researcher believes that the suppression of misinformation, on COVID-19 or some other issue, by state and corporate entities can at best be a mitigating strategy. They are not effective enough for the ultimate goal that they are pursuing, especially when there are serious structural problems in societies that create fertile ground for misinformation. Kurbatov & Rogozha (2020) also made stress on ethical dimensions of COVID-19 pandemic situation and its influence on development of educational and other practices at national and global level.
The new strain of COVID-19 virus is causing an imbalance in the body's immune response by infiltrating body cells, making its own copies of host new cells, which is extremely dangerous to human health (Gallagher, 2020). The first case of infection was recorded in the city of Wuhan, China, in late 2019, but a timely failure to implement administrative restrictions and a lack of global awareness caused the virus to spread to other nations and continents. Today, the WHO, as the main specialized organization in the field of health, officially recognizes the disease as a terrible pandemic and takes measures to coordinate and support states to prevent, detect and organize the fight against it. So, the organization created the Fund for assistance to the pandemic, developed international health regulations, adopted the updated strategy for combating COVID-19 with a number of recommendations and other activities (World Health Organization, 2020b).
The main international act in the sphere of fighting the pandemic is the new edition of the International Health Regulations (IHR) adopted by WHO in 2005 to prevent the global spread of diseases. Their prevention and control, taking a number of measures at public health level, which are adequate to public health risks, limited by them, and do not create unnecessary obstacles to international transport and trade. In accordance with the provisions of the IHR, the mechanism for combating COVID-19 includes two main steps. Step 1 relates to increasing the expressed obligations of state parties: a) the obligation to inform WHO about health risks regardless of the consent of the state; b) taking protective measures in strict accordance with the principle of respect for human rights and dignity; c) building the necessary capacity for timely identification, reporting and taking necessary actions in response to health risks, including establishment of national focal centers. Step 2 is connected with expanding the powers and obligations of the WHO: a) the right of the WHO to issue temporary and permanent recommendations to states where outbreaks of infectious diseases have been registered; b) the right to consider, in addition to information provided by official authorities, also information from non-governmental sources, such as data from non-governmental organizations, media, Internet resources; c) the obligation to check the reliability and confidentiality of the information received (World Health Organization, 2005e).
The other important international act to counter the pandemic is the COVID-19 Strategy Update (hereinafter referred to as the Strategy), which provides for the use of organizational and legal measures by states, such as rapid detection, testing and treatment of patients with severe disease, mobilizing all structures and populations to fight the pandemic, suppressing transmission in the population, reducing mortality by providing appropriate clinical care to COVID-19 patients (World Health Organization, 2020c).
1 International Health Regulations (2005). Retrieved from https://apps.who.int/iris/rest/bitstreams/52146/retrieve
ISSN 2564-212X | Journal of Policy & Governance| 01(01) August 2021 | https://doi.org/10.33002/jpg010105
57
Shulga, Skaletska, Kalaianova, & Shynkaruk | International Legal Regulation and Supranational Interaction in Counteracting the COVID-19 Pandemic: Challenges and Proposals
In addition, it is the responsibility of each country to develop and implement national strategies to combat the COVID-19 pandemic, including such areas as:
a) coordinating the national and regional response; b) the involvement and mobilization of local communities affected by the virus and at risk; c) applying contextually necessary medical and sanitary measures to slow down virus
transmission and control sporadic cases; d) preparing the health system to reduce COVID-19 related deaths, maintaining the priority of
health services and protecting health workers; e) emergency planning to ensure continuity of vital public functions and services (World Health
Organization, 2020d). It can be argued that the strategy acts as a kind of roadmap to combat the spread of the pandemic
for national governments. However, as can be seen from the document these goals are rather abstract, and determine primarily the key areas of the international legal regulation of the spread of the virus creates a wide field for the implementation of the so-called "trial and error" system for national governments in accordance with their qualifications, democratic processes and financial capabilities.
4. RESULTS AND DISCUSSION
Analysis of the provisions of the Strategy shows that the above intergovernmental health
organization entrusts national governments, represented by the ministries of health, with developing the components of the Strategy for combating Coronavirus infection and implementation of the International Health Regulations provisions on their own, giving only general guidelines. As a result, national governments can quite arbitrarily draft the provisions of the document. So, a series of measures, taken by the national governments in response to the pandemic COVID-19, violated the provisions of the IHR, which set the limits of the range of medical and sanitary measures. The states have the right to take, in conditions of public health risks, the measures, based on the scientific principles and data, which are comparable with the existing risks, and take into consideration the human rights. Thus, according to assessment of Habibi et al. (2020), the travel restrictions imposed were not based on scientific evidence or WHO guidance. It violates article 43, paragraph 2 of the IHR. The travel restrictions do not comply with article 43, paragraph 1, paragraph 5, which requires that the measures should be no more restrictive than the available reasonable alternatives. Therefore, some measures are discriminatory, in violation of the principles laid out in article 3 of the IHR. The states often failed to comply with article 43, paragraph 3 and 5, which require WHO to provide information on restrictions imposed (Habibi et al, 2020).
Conversely, some states have not acted with sufficient diligence in preparing and counteracting the spread of the pandemic and have not always taken the necessary measures and followed WHO recommendations (Dias & Coco, 2020). However, the legal consequences of states deviating from WHO recommendations remain open (Villarreal, 2020). The following factors also affect the effectiveness of implementation of the IHR and the Strategy:
1) challenges in implementation at the national level, which depend on the political will of states (manifested in states' disinterest in informing WHO in a timely manner about outbreaks of infectious diseases because of the possible prospect of loss of economic benefits, the possibility of future reservations, and the absence of a legally binding dispute resolution mechanism);
2) traditionally, WHO acts have been of a soft law nature, which may cause a negative attitude towards both the IHR as a whole and the recommendations issued on their basis by WHO, on the part of states;
3) new IHR are not aimed at preventing new infectious diseases and incorporate NOT preventive actions, but actions aimed at combating the consequences;
4) lack of an appropriate funding mechanism, which would allow to create the necessary global and national infrastructure to ensure obligations in accordance with the IHR, including assisting the least developed countries in building their own capacity (Gostin, 2004).
It should also be noted that WHO is not the only international governmental organization that coordinates the regulatory and legislative actions of national governments. Thus, the issue of developing principles and fundamental principles of international cooperation against the pandemic has been repeatedly put on the agenda of the UN General Assembly, resulting in a number of resolutions on combating the spread of COVID-19. Thus, Resolution 74/270 "Global Solidarity to Fight the Coronavirus

ISSN 2564-212X | Journal of Policy & Governance| 01(01) August 2021 | https://doi.org/10.33002/jpg010105
58
Shulga, Skaletska, Kalaianova, & Shynkaruk | International Legal Regulation and Supranational Interaction in Counteracting the COVID-19 Pandemic: Challenges and Proposals
Disease 2019 (COVID-19)"2 as of 02.04.2020 emphasized the central role of the UN in strengthening cooperation to take global measures to prevent and contain the spread of COVID-19. The resolution proclaimed the following:
(1) WHO has a crucial role in the fight against the spread of COVID-19; (2) COVID-19 can be countered through global action based on unity, solidarity and active
multilateral cooperation; the global response to the threat of COVID-19 must fully respect human rights and prevent discrimination, racism and xenophobia;
(3) There is a list of areas for international cooperation to be enhanced, such as sharing information, scientific knowledge and experience, including experiences in the implementation of the WHO recommendations and standards (United Nations, 2020a).
Resolution 74/274 "International cooperation to ensure global access to medicines, vaccines and medical equipment to face COVID-19" of 20.04.2020 co-authored by Ukraine establishes a model of cooperation between WHO and other relevant agencies in the UN common system, including international financial institutions. This embodies recommendations for operational scaling up of production, strengthening of supply chains that promote fair, transparent, equal, effective and timely access to prevention tools, laboratory tests, reagents and supporting materials, essential medical supplies, new diagnostic tools, medicines and future vaccines against COVID-19. The Resolution states that medical products should be available to all who need them, including developing countries (United Nations, 2020b). However, the provisions of this Resolution are quite difficult to implement, given the economic performance of states. Thus, countries with more developed economic potential are able to implement a wide range of measures from restrictions on the movement of citizens and their isolation to the implementation of compensatory policies. Less developed states have to consider the economic and social conditions of their citizens, while facilitating quarantine to provide opportunities to preserve workplaces and support small businesses.
The accumulated global experience of WHO and other international organizations within the UN system on COVID-19 and the development of recommendations, technical guidelines, resource management tools are presented in chronological order in a special "timeline: WHO's response to COVID-19" (World Health Organization, 2020d). However, the implementation of international legal measures to fight the pandemic are presented mainly in the form of restrictions. And in this case, there is a question of the correlation of the introduction of these quarantine restrictions with the observance of human rights. This issue arises in particular in the case of states of emergency or similar regimes, the imposition of which increases the powers of governments (sometimes also the police and the army) and reduces the powers of parliaments and the judiciary, with a serious blurring of the lines separating executive, legislative and judicial powers and may cause imbalances in the system of checks and balances that underlie democracy (European Parliament, 2020).
In general, international human rights standards guarantee everyone the right to the highest attainable standard of health and oblige states to take measures to prevent health threats and to provide health care to those who need it. At the same time, it is considered that the COVID-19 pandemic, which certainly reaches the level of threat to public health, may justify the restriction of certain rights and freedoms (European Union Agency for Fundamental Rights, 2020). However, these restrictions must be imposed on the basis of the rule of law, openness and transparency. They must meet the challenges and must be scientifically sound. Their application cannot be discriminatory and unlimited in time. In addition, restrictions must respect human dignity and human rights (United Nations, 2020c).
The application of measures aimed at countering the COVID-19 pandemic must not result in violations of people's rights to privacy, freedom from discrimination, freedom of information and freedom of expression (United Nations, 2020c). Such rights may be restricted; for example freedom of expression may be restricted in relation to the dissemination of false information, but any restrictions must balance human rights and the public interest. In the context of the COVID-19 pandemic, the state has a negative obligation “not to disseminate false information and a positive obligation to provide truthful, accurate and reliable information, as such information becomes an important part of combating the spread of the virus. At the same time, combating misinformation about the COVID-19 virus should not disproportionately limit freedom of the media” (Council of Europe, 2020).
2 Resolution 74/270 "Global Solidarity to Fight the Coronavirus Disease 2019 (COVID-19)". Retrieved from
https://documents-dds-ny.un.org/doc/UNDOC/GEN/N20/087/28/PDF/N2008728.pdf?OpenElement

ISSN 2564-212X | Journal of Policy & Governance| 01(01) August 2021 | https://doi.org/10.33002/jpg010105
59
Shulga, Skaletska, Kalaianova, & Shynkaruk | International Legal Regulation and Supranational Interaction in Counteracting the COVID-19 Pandemic: Challenges and Proposals
It is interesting, in our opinion, to analyze supranational cooperation within the framework of the EU, an economic and political association of states that was created to promote peace, democratic values and the well-being of citizens. Here we should note the key role of the European Commission in counteracting the spread of coronavirus disease, which, since January 2020, has adopted a series of power and administrative measures (Leyen, 2021a) to protect EU citizens from the threat of coronavirus. Namely, the Commission has activated the EU Civil Protection Mechanism and carried out the repatriation (return) of EU citizens. Interstate measures to protect the population, in particular travelers, industry, agriculture, transport, joint procurement of personal protective equipment and medical equipment, research on the new Coronavirus 2019-nCoV, regulations on measures related to health protection at borders to protect the health of citizens, while ensuring the proper treatment of people who have to travel and ensure the availability of essential goods and services, free movement of essential workers etc., and additional funding of the health care system. Full disclosure of information on cooperation, communications, activities and decisions of a medical and other nature in chronological order are reflected on the website of the Council of Europe (European Commission, 2021). At the same time, each state was left alone in counteracting the spread of the COVID-19, introducing its own list of quarantine measures. Instead of developing a unified plan of action mandatory for all members of the Union and creating international research centers, the EU funded Astra Zeneca with more than 300 billion Euros, which in the end narrowed the production of vaccines in one company, could not meet the needs of vaccination of citizens of the Union. Thus, to date, vaccine shortages and failed vaccination policies have resulted in a situation in which only 46% of the EU population received their first dose of vaccine (Leyen, 2021b). In other words, it is clear that the EU, as a powerful supranational entity, has not created the conditions for the adoption of a clear mechanism for counteracting the spread of the COVID-19 and dealing with its consequences. All this demonstrates the ineffectiveness of the supranational level of the fight against the spread of the COVID-19. The decrease in the level of internationalization of the strengthening role of the state in the Union affects the further predominance of national interests over the interests of communities.
A separate problem of internationalization today is countering disinformation, which is a threat to international and national information security. Thus, information attacks were repeatedly exposed to both the use of individual vaccines (Ministry of Health of Ukraine, 2021) and the vaccination process in general, which ultimately had a negative impact on the perception of vaccination by the population. It should be noted that the first step to counteract the spread of misinformation have already been taken, so recently the European Union adopted the Code of Practice against Disinformation (European Commission, 2021) and the Action Plan against Disinformation (European Commission, 2018). On the basis of these documents, it is necessary to develop international and national acts to counteract direct information threats during the pandemic COVID-19, should contain a system of clear and specific measures to counter disinformation manifestations associated with the pandemic, the organizational and legal status of subjects “objects of the fight against disinformation, the mechanism of liability, etc.” It is also necessary to develop and implement state programs to improve information literacy among the population and economic entities in the media sphere. Disseminate information literacy skills by organizing educational events at schools, universities, and government institutions in the form of lectures, roundtables, online meetings, podcasts on Youtube, and social networks, involving journalism experts, government officials, law enforcement officials, scientists, etc.
5. CONCLUSIONS
The COVID-19 pandemic has become a significant challenge for the global community and has shown unpreparedness for a coordinated and effective counteraction to its spread. Among the major problems of the international legal response to the spread of the pandemic are: the recommendatory (non-binding) nature of most international legal acts related to the fight against COVID-19; the lack of interest of states in informing WHO in time about the outbreak of infectious diseases for fear of losing economic benefits; arbitrary interpretation of the provisions of international acts by national governments, threatening to limit and violate human rights; restrictions on human rights of movement imposed by states were not based on scientific evidence or WHO guidance; lack of a clear funding mechanism that would allow the creation of the necessary global and national infrastructures to ensure obligations in accordance with the IHR, including assistance to the least developed countries in building their own

ISSN 2564-212X | Journal of Policy & Governance| 01(01) August 2021 | https://doi.org/10.33002/jpg010105
60
Shulga, Skaletska, Kalaianova, & Shynkaruk | International Legal Regulation and Supranational Interaction in Counteracting the COVID-19 Pandemic: Challenges and Proposals
capacity; lack of a clear mechanism to counteract disinformation manifestations associated with the COVID-19 and the like.
These problems characterize the current state of international legal regulation and supranational cooperation in counteracting the spread of COVID-19. Their solution in combination with the strengthening of the role of international institutions over national governments will increase the effectiveness of counteraction to the spread of the pandemic and the prevention of the spread of new strains of infectious diseases.
REFERENCES Council of Europe (2020). Press freedom must not be undermined by measures to counter disinformation
about COVID-19. Commissioner for Human Rights. Retrieved from https://www.coe.int/en/web/media-freedom/-/press-freedom-must-not-be-undermined-by-measures-to-counter-disinformation-about-covid-19 [Accessed 05 April 2021]
Dias, T. S. & Coco, A. (2020). Part III: Due Diligence and COVID-19: States’ Duties to Prevent and Halt the Coronavirus Outbreak. Blog of the European Journal of International Law, 25 March 2020. Retrieved from https://www.ejiltalk.org/part-iii-due-diligence-and-covid-19-states-duties-to-prevent-and-halt-the-coronavirus-outbreak [Accessed 03 April 2021]
European Commission (2018). Report on the implementation of the Action Plan Against Disinformation. Retrieved from https://op.europa.eu/en/publication-detail/-/publication/8a94fd8f-8e92-11e9-9369-01aa75ed71a1/language-en [Accessed 20 April 2021]
European Commission (2021). Code of Practice on Disinformation. Retrieved from https://digital-strategy.ec.europa.eu/en/policies/code-practice-disinformation [Accessed 12 July 2021]
European Parliament (2020). The Impact of COVID-19 Measures on Democracy, the Rule of Law and Fundamental Rights in the EU. Monitoring Group on Democracy. Retrieved from https://www.europarl.europa.eu/RegData/etudes/BRIE/2020/651343/IPOL_BRI(2020)651343_EN.pdf [Accessed 20 April 2021]
European Union Agency for Fundamental Rights (2020) Coronavirus pandemic in the EU – Fundamental Rights Implications. Bulletin 1. Retrieved from https://fra.europa.eu/sites/default/files/fra_uploads/fra-2020-coronavirus-pandemic-eu-bulletin-1_en.pdf [Accessed 15 May 2021]
Gallagher, J. (2020). Coronavirus: What it does to the body. BBC News Ukraine. Retrieved from https://www.bbc.com/ukrainian/features-51886721 [Accessed 05 April 2021]
Gostin, L. O. (2004). International infectious disease law: revision of the World Health Organization's International Health Regulations. Jama, 291(21), 2623-2627.
Habibi, R., Burci, G. L., de Campos, T. C., Chirwa, D., Cinà, M., Dagron, S., & Hoffman, S. J. (2020). Do not violate the International Health Regulations during the COVID-19 outbreak. The Lancet, 395(10225), 664-666. https://doi.org/10.1016/S0140-6736(20)30373-1
Kurbatov, S. V., & Rohozha, M. M. (2020). University Mission in Western-European Culture (Ethical and Sociological Aspects) P. ІІ. Filosofiya Osvity. Philosophy of Education, 26(1), 113–130. https://doi.org/10.31874/2309-1606-2020-26-1-7
Leyen, U. (2021a). Nearly half of the population in the EU has received the first dose of COVID vaccine. Word and Action, Analytical Portal. Retrieved from https://www.slovoidilo.ua/2021/05/25/novyna/suspilstvo/yes-pershu-dozu-vakcyny-covid-otrymala-majzhe-polovyna-naselennya [Accessed 20 June 2021]
Leyen, U. (2021b). We must look out for each other; we must pull each other through this. Timeline of EU action. Retrieved from https://ec.europa.eu/info/live-work-travel-eu/coronavirus-response/timeline-eu-action_en [Accessed on 15 May 2021]
Milanovic, M. (2020). Viral Misinformation and the Freedom of Expression: Part III. Ejiltalk. Org, 1-5. Retrieved from https://www.ejiltalk.org/viral-misinformation-and-the-freedom-of-expression-part-iii/ [Accessed 15 May 2021]
Ministry of Health of Ukraine (2021). The most common fakes about vaccination. Retrieved from https://moz.gov.ua/article/health/najposhirenishi-fejki-pro-vakcinaciju-vid-covid-19 [Accessed 14 July 2021]

ISSN 2564-212X | Journal of Policy & Governance| 01(01) August 2021 | https://doi.org/10.33002/jpg010105
61
Shulga, Skaletska, Kalaianova, & Shynkaruk | International Legal Regulation and Supranational Interaction in Counteracting the COVID-19 Pandemic: Challenges and Proposals
Pevehouse, J. C. (2020). The COVID-19 Pandemic, International Cooperation, and Populism. International Organization, 74(S1), E191-E212. https://doi.org/10.1017/S0020818320000399
United Nations (2020a). COVID-19 and Human Rights. The UN High Commissioner for Human Rights. Retrieved from https://news. un.org/ru/story/2020/03/1373871 [Accessed 05 April 2021]
United Nations (2020b). Resolution 74/274 entitled “International cooperation to ensure global access to medicines, vaccines and medical equipment to face COVID-19”. The General Assembly. Retrieved from https://www.un.org/pga/74/2020/04/15/international-cooperation-to-ensure-global-access-to-medicines-vaccines-and-medical-equipment-to-face-covid-19/ [Accessed 15 April 2021]
United Nations (2020c). COVID-19: States should not abuse emergency measures to suppress human rights. UN experts. Retrieved from https://www.ohchr.org/RU/NewsEvents/Pages/DisplayNews.aspx?NewsID=25722&LangID=R. [Accessed 20 April 2021]
Villarreal, P. (2020). Can They Really Do That? States’ Obligations Under the International Health Regulations in Light of COVID-19 (Part I). Opinio Juris. Retrieved from http://opiniojuris.org/2020/03/31/covid-19-symposium-can-they-really-do-that-states-obligations-under-the-international-health-regulations-in-light-of-covid-19-part-i/ [Accessed 10 May 2021]
World Health Organization (2005). International health regulations. Third report of Committee A, 58-th Wealth Assembly, A58/55, 5-60. Retrieved from https://apps.who.int/iris/rest/bitstreams/52146/retrieve [Accessed 15 May 2021]
World Health Organization (2020a). Recommendations for the public on infection with the new coronavirus COVID-19. Retrieved from https://www.who.int/ru/emergencies/diseases/novel-coronavirus-2019/advice-for-public [Accessed 12 May 2021]
World Health Organization (2020b). COVID-19 Strategy Update. Retrieved from https://krphc.org.ua/wp-content/uploads/2020/05/covid19-strategy-update-2020-ru.pdf [Accessed 04 May 2021]
World Health Organization (2020c). Timeline: WHO’s COVID-19 response. Retrieved from https://www.who.int/emergencies/diseases/novel-coronavirus-2019/interactive-timeline [Accessed 22 May 2021]
World Health Organization (2020d). WHO Director-General’s opening remarks at the media briefing on COVID-19. Retrieved from https://www.who.int/director-general/speeches/detail/who-director-general-s-opening-remarks-at-the-media-briefing-on-covid-19---11-march-2020 [Accessed 22 May 2021]
Worldometers (2021). Covid-19 worldwide distribution statistics. Retrieved from https://www.worldometers.info/coronavirus/ [Accessed on 20 April 2021]

ISSN 2564-212X | Journal of Policy & Governance| 01(01) August 2021 | https://doi.org/10.33002/jpg010105
62
Shulga, Skaletska, Kalaianova, & Shynkaruk | International Legal Regulation and Supranational Interaction in Counteracting the COVID-19 Pandemic: Challenges and Proposals
AUTHORS’ DECLARATIONS AND ESSENTIAL ETHICAL COMPLIANCES Authors’ Contributions (in accordance with ICMJE criteria for authorship)
Contribution Author 1 Author 2 Author 3 Author 4
Conceived and designed the research or analysis Yes Yes Yes Yes
Collected the data Yes Yes Yes Yes
Contributed to data analysis & interpretation Yes No No Yes
Wrote the article/paper Yes No Yes No
Critical revision of the article/paper Yes Yes No No
Editing of the article/paper Yes No Yes No
Supervision Yes No No Yes
Project Administration Yes Yes No No
Funding Acquisition No No No No
Overall Contribution Proportion (%) 40 20 20 20
Funding No funding was available for the research conducted for and writing of this paper. Research involving human bodies (Helsinki Declaration) Has this research used human subjects for experimentation? No Research involving animals (ARRIVE Checklist) Has this research involved animal subjects for experimentation? No Research involving Plants No plant was used to conduct this research. Research on Indigenous Peoples and/or Traditional Knowledge Has this research involved Indigenous Peoples as participants or respondents? No
(Optional) PRISMA (Preferred Reporting Items for Systematic Reviews and Meta-Analyses) Have authors complied with PRISMA standards? No Competing Interests/Conflict of Interest Authors have no competing financial, professional, or personal interests from other parties or in publishing this manuscript. RIGHTS AND PERMISSIONS Open Access. This article is licensed under a Creative Commons Attribution 4.0 International License, which permits use, sharing, adaptation, distribution and reproduction in any medium or format, as long as you give appropriate credit to the original author(s) and the source, provide a link to the Creative Commons license, and indicate if changes were made. The images or other third-party material in this article are included in the article's Creative Commons license, unless indicated otherwise in a credit line to the material. If material is not included in the article's Creative Commons license and your intended use is not permitted by statutory regulation or exceeds the permitted use, you will need to obtain permission directly from the copyright holder. To view a copy of this license, visit http://creativecommons.org/licenses/by/4.0/.

M – 00232 | Analytical Article ISSN 2564-212X 01(01) | August 2021
Comparative Analysis of Ukrainian and Canadian Legislation Regulating the Land Management Valeriia Borzenkova Department of Land and Agrarian Law, Yaroslav Mudryi National Law University, Kharkiv, Ukraine. Email: [email protected] | ORCID: 0000-0003-1565-9732
ABSTRACT Land management activities in Ukraine are at the stage of gradual legislative reform, which takes place through deregulation and simplification of land management procedures. The analysis of Canada's practical experience in regulating land management activities allows Ukraine to create a single organization consisting of committees on certain land management issues, which will contribute to the development and effective work in this area. Keywords: Land management activities; Land management documentation; Professional liability insurance; Licensing; Certification
Received: 19 July 2021 Reviewed: 30 July 2021 Accepted: 02 August 2021 Published: 10 August 2021
__________________________________________________________________________________________________________________ How to cite this paper: Borzenkova, V. (2021). Comparative Analysis of Ukrainian and Canadian Legislation Regulating the Land
Management. Journal of Policy & Governance, 01(01), 63-68. https://doi.org/10.33002/jpg010106
Copyright © 2021 by author(s). This work is licensed under the Creative Commons Attribution International License (CC BY 4.0). http://creativecommons.org/licenses/by/4.0/

ISSN 2564-212X | Journal of Policy & Governance| 01(01) August 2021 | https://doi.org/10.33002/jpg010106
64
Borzenkova | Comparative Analysis of Ukrainian and Canadian Legislation Regulating the Land Management
1. INTRODUCTION
Land management documentation is a tool for the realization of land rights and is imagined as an integral part of land management. The development of land management documentation, or land management work, is a complex procedural mechanism of actions of the developer, which requires detailed legal regulation. Canada’s experience and practice in reference to land management will provide an opportunity to consider possible ways to improve Ukrainian legislation in the field of land management regulation.
The aim of this article is to comparatively analyze the legal regulation of land management in Canada and Ukraine, control over the activities of land surveyors, their professional responsibility, ethical principles and development of recommendations taking into account the positive experience of a foreign country for Ukraine.
2. METHODOLOGY
This scientific study used a special comparative and legal method, which presupposes comparison of legal systems of Canada and Ukraine, to distinguish similarities and differences in the means of legal regulation of land management activities. General logical methods and techniques such as methods of structural analysis and synthesis and analogy are used.
3. RESULTS AND DISCUSSION
The main elements of the professional competence of Canadian land surveyors and the effective implementation of land management activities are the strategic vision of the development of this area, unified management and state control. To compare the Ukrainian models with the Canadian models of land management regulation, it is imperative to trace both the common and distinctive features of the two countries’ legislations. 3.1 Models of Regulating Land Management Organization
First of all, it should be noted that the legislation of Canada provides for two types of land surveyors; firstly, it is a land surveyor who has the right to survey land in the province in accordance with the laws of the province and the Surveyor General. This position is directly created under federal system of Canada within the ambit of the Canada Lands Surveys Act, 19851). The Surveyor General monitors the compliance of the land surveyor with accurate and regular records of all his/her surveys. Additionally, on the instructions of the Minister, he/she performs the functions of storing original plans, journals, field notes and other documents related to surveys.
Canada has established a collegial body known as the Association of Canada Lands Surveyors2 , purpose of which is to establish and maintain standards of qualification, behavior, knowledge and skills of Canadian surveyors and land surveyors, cooperation with other institutions and organizations, and the regulation of land management activities. The governing body of the Association is the Council, which includes president and vice-president of the Association, former President of the Association, members of the Association, who are elected in accordance with by-laws, the Surveyor General, two persons who are not members of the Association and are appointed by the Minister.
The Council is authorized to adopt by-laws relating to any issues necessary for land management. Committees are created at the Council, namely: the Executive Committee, which performs the functions and powers as delegated by the Council, except for the creation of norms and by-laws; the Commission of Experts supervising all issues related to the admission and eligibility of candidates and their test; the Complaints Review Committee whose powers include hearing the complaints received by the Association against the conduct or actions of any member of the Association, Canadian landowner or permit owner; the Disciplinary Committee that hears and determines allegations of unlawful professional actions or incompetence as reported by the Council, an issue of retaining a member of the Association, or issuing a license.
As the Ukraine is reforming the land relations and affairs by improving the management system and deregulation, it would be relevant to create a similar organization on geodesy and land management.
1 https://laws-lois.justice.gc.ca/eng/acts/L-6/ 2 https://www.acls-aatc.ca/

ISSN 2564-212X | Journal of Policy & Governance| 01(01) August 2021 | https://doi.org/10.33002/jpg010106
65
Borzenkova | Comparative Analysis of Ukrainian and Canadian Legislation Regulating the Land Management
In Ukraine, similar organizations also exist. Such public organizations are Association of Certified Surveyors of Ukraine, All-Ukrainian Union of Certified Engineers & Land Surveyors, Land Union of Ukraine and many others. However, the creation of a single organization having powers to control and manage the land management activities will contribute to the development of these fields and effective land management. 3.2 Ways of Solving Problematic Issues
In Ukraine, annually more than 800,000 people carry out operations with their land plots as part of their land management process. At the time of registering land plots, up to 57 documents, up to 79 instruments (regulating land relations) and 8 different databases are created by the State to store information about land plots (Pryadka, Tretiak, & Tretiak, 2021, p.16). An important part of such legal actions is the land management documentation, which is aimed at formalizing design decisions, text and graphic materials along with the land management.
For a long time, there is lack of consolidated unified State samples of certain documents on land management and of a detailed approach to the preparation of technical documents. The lack of legal unified prototype leads to the existing incoherence in the land management activities. For example, it is possible to cite a land management project after the allocation of land plots for that. The Law of Ukraine "On Land Management"3 prescribes the composition of documents that the land management project after the allocation of land should include in case of proposed changes in land use. But the question how land management design is carried out in such cases remains unanswered. Thus, absence of such unambiguous regulation causes practical problems for approval of land management projects, since there are no uniform requirements for the preparation of documentation. Therefore, there are no existing uniform standards for the approval of such documentation.
In 1999, the State Committee of Ukraine on Land Resources approved the "Model of the project of land allocation to legal entities and individuals for any needs", which was mostly intended for the allocation of land for development. The use of this "Model" as a standard of such documentation is impossible, because the projects of allocation of land depending on the purpose of such allocation differ in their complexity and, therefore, cannot be compared. It points to the problem of lack of legal support for the development of a land management project on the allocation of land plots and the need to develop standards for individual documents and approaches to their registration.
A similar problem arises when conducting land inventory in accordance with the Resolution4 of the Cabinet of Ministers of Ukraine of June 5, 2019. This resolution has determined that land inventory works would include surveying, topographic-geodetic and design-survey work, and preparation and execution of technical documentation. The State Land Cadastre Center5 provides an example of technical documentation on land management for the inventory of general-purpose land and agricultural land. This is mostly a recommended for such documentation works. The model work is the only sample to create technical documentation on land management for the inventory of land plots. But it cannot be recommended to lands to be used for another purposes.
Creation of a special body that would regulate the work of landowners will allow to unify land management activities. A committee will also be set up for the development of standards to prepare land management documentation. The publication of by-laws and regulations by such a body will detail the requirements of the legislation regarding land management work. 3.3 Licensing and Certification of Land Management Activities
One of the common features of the legislation of Ukraine and Canada is that land management work is licensed. In Canada, this license is issued to the member of the Association of Canada Land Surveyors who has experience and practical training in geodesy for at least 2 years during the past 5 years, and he/she adheres to licensing requirements provided for by regulations and by-laws (Canada Lands Surveyors Act, 1985).
In Ukraine, a person is authorized to carry out land management activities who has higher education and qualifications in the field of land management. Certified land surveyor engineers are the
3 Law of Ukraine "On Land Management" №36, 2003 https://zakon.rada.gov.ua/laws/show/858-15#Text 4 "On approval of the Procedure for conducting land inventory and recognizing those that have lost their validity”,
Resolutions of the Cabinet of Ministers of Ukraine". https://zakon.rada.gov.ua/laws/show/476-2019-%D0%BF#Text 5 http://dzk.gov.ua/en/home/

ISSN 2564-212X | Journal of Policy & Governance| 01(01) August 2021 | https://doi.org/10.33002/jpg010106
66
Borzenkova | Comparative Analysis of Ukrainian and Canadian Legislation Regulating the Land Management
persons who have higher education in such speciality and qualifications in the land management. These surveyors should have relevant work experience for at least 1 year, have passed the qualification exam, have received a certificate, and have registered in the State Register of Certified Land Surveyors (Law of Ukraine “On Land Management”6).
Figure 1: Canadian Land Surveyor
Figure 2: Ukrainian Land Surveyor
6 https://zakon.rada.gov.ua/laws/show/858-15#Text
has
experience
of no less
than 2 years
within last 5
years
adheres to licensing
requirements
has passed
qualification exam
member of
the
Association
Canadian Land Surveyor
has work experience
in the specialty for at least one
year
is registered in the State Register of
Certified Land Surveyors
has passed the qualification exam
has higher education in the field of …
Ukrainian Land Surveyor

ISSN 2564-212X | Journal of Policy & Governance| 01(01) August 2021 | https://doi.org/10.33002/jpg010106
67
Borzenkova | Comparative Analysis of Ukrainian and Canadian Legislation Regulating the Land Management
The licensing and certification of land management activities are done because such an activity requires special knowledge and sufficient technical skills and technological support of equipment. This also follows the principle of distribution of responsibility, according to which the developers of land management documentation dispose of the job. This technical work also requires legal literacy and quality and safety of the tasks in the documentation process, for which the customer is not responsible. 3.4 Land Surveyors’ Professional Liability
The legislation of Canada stipulates a compulsory professional liability assurance by each member of the Association. On 27 May 2021, the Law of Ukraine “On Amendments to Certain Legislative Acts of Ukraine on Improving the Management System and Deregulation in the Field of Land Relations” (Law No. 2194)7 came into force, which is to regulate the issues of land management in Ukraine. It has the provisions to solve the problem of liability of land management executors to the customers and third parties if they commit errors in the preparation of land management documentation or in the implementation of land management work. There was a need for such regulatory fixation having provisions of compulsory insurance for such liability. From now on, in case of a damage to the customer or a third party due to negligence, oversight or professional errors made by technician in performing the topographic, geodetic and cartographic works, compensation should be paid to the customer or third party in the form of insurance indemnity, the amount of which is to be ascertained with the consent of the parties but cannot be less than 1,000 minimum wages.
However, the definition of an insured event as circumstances relating to land management works of national purpose does not correspond to the interests of persons who have applied to the developers in order to create land management documentation regarding the land plot that is in their ownership or use. In practice, errors in land management documentation often cause negative legal consequences. 3.5 Ethics of Land Management Activity
The laws of Canada regulate ethical issues of land management activities. Subject to the approval of the Minister, the Council of the Association of Canada Lands Surveyors8 adopts an ethical code of professional conduct of the land surveyors, and any other person bearing the title “Canadian Land Surveyor”, or a contender for such a title. In case, anyone is found guilty of the offense is fined with a severe penalty of not exceeding $10,000, or imprisonment for a term not exceeding 6 months, or to both types of punishment at the same time.
In Ukraine, there is no such regulation for monitoring ethical behavior of persons engaged in land management activities. The requirements for the ethical conduct of the land surveyors’ activities are basically the requirements of professionalism from the administrative services. No doubt, development and approval of ethical standards of land management will be the key to the translational development and effective implementation of land management in the future. 4. CONCLUSIONS
Considering lot of common things in legal regulation of land management, the Canadian system is considered to be more developed than Ukrainian. Improving the Ukrainian system of land management will be possible with the creation of a special body authorized not only to license such activities, but also to develop by-laws that will form the legislation. As part of such a body, special committees will exercise control over the assurance of land management activities, compliance with the ethical standards, compliance with the norms of registration of land management documentation and procedures, approval process, and so on. REFERENCE
Pryadka V., Tretiak A., & Tretiak, V. (2021). Legislative and management problems of the land management process in the registration of rights to land plots. Land Survey Bulletin (in Ukrainian), № 1.С., 15-20.
7 https://www.rada.gov.ua/en/news/News/207536.html 8 https://www.acls-aatc.ca/
ISSN 2564-212X | Journal of Policy & Governance| 01(01) August 2021 | https://doi.org/10.33002/jpg010106
68
Borzenkova | Comparative Analysis of Ukrainian and Canadian Legislation Regulating the Land Management
AUTHORS’ DECLARATIONS AND ESSENTIAL ETHICAL COMPLIANCES Authors’ Contributions (in accordance with ICMJE criteria for authorship) This article is 100% contributed by the sole author. She conceived and designed the research or analysis, collected the data, contributed to data analysis & interpretation, wrote the article, performed critical revision of the article/paper, edited the article, and supervised and administered the field work. Funding No funding was available for the research conducted for and writing of this paper. Research involving human bodies (Helsinki Declaration) Has this research used human subjects for experimentation? No Research involving animals (ARRIVE Checklist) Has this research involved animal subjects for experimentation? No Research involving Plants No plant was used to conduct this research. Research on Indigenous Peoples and/or Traditional Knowledge Has this research involved Indigenous Peoples as participants or respondents? No
(Optional) PRISMA (Preferred Reporting Items for Systematic Reviews and Meta-Analyses) Have authors complied with PRISMA standards? No Competing Interests/Conflict of Interest Author has no competing financial, professional, or personal interests from other parties or in publishing this manuscript. RIGHTS AND PERMISSIONS Open Access. This article is licensed under a Creative Commons Attribution 4.0 International License, which permits use, sharing, adaptation, distribution and reproduction in any medium or format, as long as you give appropriate credit to the original author(s) and the source, provide a link to the Creative Commons license, and indicate if changes were made. The images or other third-party material in this article are included in the article's Creative Commons license, unless indicated otherwise in a credit line to the material. If material is not included in the article's Creative Commons license and your intended use is not permitted by statutory regulation or exceeds the permitted use, you will need to obtain permission directly from the copyright holder. To view a copy of this license, visit http://creativecommons.org/licenses/by/4.0/.

M – 00233 | Analytical Article ISSN 2564-212X 01(01) | August 2021
West Bengal Assembly Election 2021: An Analysis Onkar Singh Global Corporate Citizenship, Accenture, Bangalore, India.
Email: [email protected] | ORCID: 0000-0002-8050-0501
ABSTRACT West Bengal Assembly election was one of the most keenly watched assembly elections in India in 2021. One of the reasons for this interest was the unexpected rise of the Bhartiya Janata Party in a state mostly known for its contests between the Left parties, the Indian National Congress, and the All-India Trinamool Congress. The Bhartiya Janata Party (BJP) had only 3 seats in the last assembly election of 2016, whereas the ruling All India Trinamool Congress (AITC or TMC) party had 212 seats. The BJP was never a major player in the state except during the last parliamentary election (2019) when BJP bagged 18 out of the 42 parliamentary seats. The analysis presented in this paper analyzes the constituency-wise figures for each of the 294 constituencies spread over 19 districts of the state of West Bengal in India. The TMC emerged victorious with 48% of the total popular votes, while the opposition BJP got 39% of the popular votes. Also, TMC won 213 (73%) of total seats, whereas the BJP came to a distant second with 77 (26%) seats, even though it raised its stock significantly in the West Bengal Assembly from its 2016 tally of a meager 3 seats. After the West Bengal 2021 election results, Mamata Banerjee emerged as one of the main challengers of BJP at the national arena of Indian politics. This paper will benefit and help anyone interested in Indian political analysis and would also provide key insights for the political analysts and the political parties interested in a seat-by-seat deep dive. The analysis was done with the help of Microsoft Excel and R Software. Keywords: Assembly election; Political parties; Election analysis; Vote share; India
Received: 18 July 2021 Reviewed: 30 July 2021 Accepted: 05 August 2021 Published: 20 August 2021
__________________________________________________________________________________________________________________
How to cite this paper: Singh, O. (2021). West Bengal Assembly Election 2021: An Analysis. Journal of Policy & Governance, 01(01), 69-121. https://doi.org/10.33002/jpg010107
Copyright © 2021 by author(s). This work is licensed under the Creative Commons Attribution International License (CC BY 4.0).
http://creativecommons.org/licenses/by/4.0/

ISSN 2564-212X | Journal of Policy & Governance| 01(01) August 2021 | https://doi.org/10.33002/jpg010107
70
Singh | West Bengal Assembly Election 2021: An Analysis
1. INTRODUCTION
West Bengal1 Assembly election was one of the most keenly watched assembly elections in India in 2021. One of the reasons for this interest was the unexpected rise of the Bhartiya Janata Party2 in a state mostly known for its contests between the Left3 parties, the Indian National Congress4 , and the All-India Trinamool Congress5. The Bhartiya Janata Party (BJP) had only 3 seats in the last assembly election of 2016, whereas the ruling All India Trinamool Congress (AITC or TMC) party had 212 seats. The BJP was never a major player in the state except during the last parliamentary election (2019) when BJP bagged 18 out of the 42 parliamentary seats. This raised the optimisms in the BJP camp. The party put all its political might in the West Bengal Legislative Assembly election, which was concluded in May 2021, where it was pitted against the ruling TMC led by its supremo Mamata Banerjee. The stakes were so high that BJP made some of its central ministers resign to contest the assembly elections to bolster the party’s prospects in the state, traditionally considered home to the non-BJP political forces.
This was coupled with the high decibel election campaign led by Prime Minister Narendra Modi along with the Home Minister Amit Shah and BJP President J.P. Nadda. On the other hand, the two-time chief minister of West Bengal, Mamata Banerjee, led the incumbent party from the front and ran a highly successful campaign leading to her party’s victory in the assembly election. This marked the beginning of the third term of the TMC government in the state. The opinion and exit polls were equally divided some predicted edge to the ruling TMC while others giving a slight edge to the BJP. However, the final results, announced on 2nd May 2021, put all speculations to rest with TMC winning 213 seats, whereas BJP managed to win only 77 seats.
The analysis presented in this paper attempts to analyze the constituency-wise figures for each of the 294 constituencies spread over 19 districts of the state of West Bengal in India. This paper will benefit and help anyone interested in Indian political analysis and would also provide key insights for the political analysts and the political parties interested in a seat-by-seat deep dive. The study conducted to prepare this paper aims at synthesizing the political data using visualization for a better understanding of the election results. This would also be helpful for political analysts, political and social scientists, and political parties to further analyze the election results at a granular level. The future scope of this study would entail a demographic extrapolation on
1 West Bengal is eastern state of India. https://wb.gov.in/; https://en.wikipedia.org/wiki/West_Bengal 2 Presently the largest political party, which is also ruling in the centre (Union of India). https://www.bjp.org/ 3 Refers to the Communist Party of India (Marxist) (CPM) which rule the state of West Bengal for more than three
decades https://en.wikipedia.org/wiki/Communist_Party_of_India_(Marxist) 4 The oldest political of India having ruled the country for longest period. https://www.inc.in/ 5 https://aitcofficial.org/; https://en.wikipedia.org/wiki/All_India_Trinamool_Congress
Figure 1: Map of West Bengal Districts

ISSN 2564-212X | Journal of Policy & Governance| 01(01) August 2021 | https://doi.org/10.33002/jpg010107
71
Singh | West Bengal Assembly Election 2021: An Analysis
the election results to understand various social economic and political contexts that determine the election outcomes in India. 2. METHODOLOGY
The data for the analysis conducted under this study was obtained from the Election Commission of India portal6 and Trivedi Center for Political Data7 at the Ashoka University, India. The analysis was done with the help of Microsoft Excel and R Software and its ggplot2 package for Visualization. The various reports and publications were used as a secondary source in the process of this analysis. The analysis covers each of 19 districts of the West Bengal state represented in figure 1 and provides with election results for each of the 294 assembly constituencies in West Bengal.
3. RESULTS AND DISCUSSION
This section and the subsequent sections provide the details of political parties, which participated in the West Bengal election, key election results such as by number and percentage of seats, regional and gender distribution of winning candidates per party, and then follows with a district-wise summary of election outcomes and delves deeper into the election results of all seats in each district of the state of West Bengal. 3.1 Total Number of Political Parties in the Fray
As mentioned in table 1, a large number of independent candidates (611) and a total of 58 political parties took part in the West Bengal assembly election 2021. The main parties include Bhartiya Janata Party (BJP), All India Trinamool Congress (AITC/TMC), Communist Party of India Marxist (CPIM), and Indian National Congress (INC/Congress). The BJP, TMC, CPIM, and Congress contested 291, 288, 138, and 91 seats, respectively (Figure 2). Table 1: Political parties and number of seats contested
S.No. Political Party No. of Contested Seats
1. Independents (IND) 611
2. Bhartiya Janata Party (BJP) 291
3. All India Trinamool Congress (AITC) 288
4. Socialist Unity Centre of India (Communist) [SUCI] 188
5. Bahujan Samaj Party (BSP) 162
6. Communist Party of India (Marxist)(CPM) 138
7. Indian National Congress (INC) 91
8. Bahujan Mukti Party (BMP) 45
9. Amra Bangalee (AB) 40
10. Indian Secular Front (ISF/RSSCMJP) 32
11. All India Forward Bloc (AIFB) 21
12. Janata Dal (United) [JD(U)] 16
13. Kamatapur People’s Party (United) 15
14. Communist Party of India (Marxist–Leninist) Liberation [CPI(ML)(L)]
12
15. Purvanchal Mahapanchayat (PM) 12
16. Communist Party of India (CPI) 10
17. Lok Janshakti Party (LJP) 10
18. Revolutionary Socialist Party (RSP) 10
19. Bhartiya Nyay-Adhikar Raksha Party (BNARP) 8
20. Justice and Development Party (JDP) 7
21. Party for Democratic Socialism (PDS) 7
6 https://eci.gov.in/ 7 https://tcpd.ashoka.edu.in/

ISSN 2564-212X | Journal of Policy & Governance| 01(01) August 2021 | https://doi.org/10.33002/jpg010107
72
Singh | West Bengal Assembly Election 2021: An Analysis
S.No. Political Party No. of Contested Seats
22. All India Majlis-e-Ittehadul Muslimeen (AIMIM) 6
23. United Socialist Party (USP) 6
24. Bahujan Maha Party (BMP) 5
25. Indian Unity Centre (IUC) 5
26. Republican Party of India (A) (RPI-A) 5
27. Ambedkarite Party of India (API) 4
28. Indian Union Muslim League (IUML) 4
29. Jan Sangh Party (JSP) 4
30. National Republic Party of India (NRPI) 4
31. Republican Party of India (Athawale) (RPI-A) 4
32. Social Democratic Party of India (SDPI) 4
33. Socialist Party (India) (SPI) 4
34. Welfare Party of India (WPI) 4
35. Communist Party of India (Marxist-Leninist) Red Star 3
36. Democratic Socialist Party of India (DSPI) 3
37. Hindustani Awam Morcha (HAM) 3
38. Humanity Universal Motion Party (HUMP) 3
39. National People's Party (NPP) 3
40. Akhil Bharat Hindu Mahasabha (ABHM) 2
41. All India Minorities Front (AIMF) 2
42. Bhartiya Momin Front (BMF) 2
43. Bhartiya Tribal Party (BTP) 2
44. Guru Chand Mukti Morcha (GCMM) 2
45. Mulnibasi Party of India (MPI) 2
46. Right to Recall Party (RRP) 2
47. West Bengal Socialist Party (WBSP) 2
48. All Jharkhand Students Union (AJSUP) 1
49. Bharateeya Manavadhikar Party (BMP) 1
50. Jamat-E-Seratul Mustakim (JSM) 1
51. Lok Samya Party (LSP) 1
52. New Democratic Party of India (NDPI) 1
53. Paradise Party (PP) 1
54. Progressive People's Party (PPP) 1
55. Rashtravadi Janata Party (RJP) 1
56. Revolutionary Socialist Party of India (Marxist) (RSPI-M) 1
57. Sajag Samaj Party (SSP) 1
58. Samajwadi Jan Parishad (SJP) 1
59. Vikas India Party (VIP) 1
3.2 Main Political Parties by Number of Seats Contested
Both TMC and BJP contested almost all of the seats, whereas other main parties in the state like CPM and Congress, had an alliance with Indian Secular Front8 (ISF), a newly formed party led by Abbas Siddiqui, as mentioned in table 1.
8 ISF fought the election on the Rashtriya Secular Majlis Party (RSMP) of Bihar which has the 'envelope' symbol.
http://www.millenniumpost.in/kolkata/isf-to-fight-polls-on-borrowed-symbol-434695

ISSN 2564-212X | Journal of Policy & Governance| 01(01) August 2021 | https://doi.org/10.33002/jpg010107
73
Singh | West Bengal Assembly Election 2021: An Analysis
Figure 2: Main Political parties by number of seats contested
3.3 Total Number of Repeat vs. New Candidates
In figure 3, it is depicted that a larger number of repeat candidates were fielded by the TMC, because it had the largest number of members of legislative assembly (MLAs) in the outgoing assembly, and it is not common that parties replace their seating candidates. The BJP fielded the largest number of new candidates. Since all other political parties had fewer MLAs in the assembly, they likely bet on the newer candidates than those who lost the election on their ticket last time.
Figure 3: Total number of repeat vs new candidates
3.4 Total Number of Votes Secured by Each Political Party
As shown in figure 4 below, while the ruling party TMC bagged 28.6 million votes, the BJP got 22.7 million votes. The difference in votes between the two main parties is of 5.9 million votes. CPM bagged 2.8 million votes, whereas the Congress could manage to get over 1.7 million votes.

ISSN 2564-212X | Journal of Policy & Governance| 01(01) August 2021 | https://doi.org/10.33002/jpg010107
74
Singh | West Bengal Assembly Election 2021: An Analysis
Figure 4: Total number of votes secured by each political party
3.5 Total Percentage of Votes and the Total Number of Seats won by Parties
The analysis in figure 5 indicates that TMC emerged victorious with 48% of the total popular votes, while the opposition BJP got 39% of the popular votes. The CPM managed to win 5% of the votes followed by the Congress and Independents with 3% and 2% of the popular votes, respectively. This shows that the contest was highly polarized and bipolar between the incumbent Trinamool Congress (AITC) and
Figure 5 (left): Total percentage of votes secured by each political party Figure 6 (right): Total number of seats secured by each political party

ISSN 2564-212X | Journal of Policy & Governance| 01(01) August 2021 | https://doi.org/10.33002/jpg010107
75
Singh | West Bengal Assembly Election 2021: An Analysis
the opposition Bhartiya Janata Party (BJP). As indicated in figure 6 below, TMC won 213 (73% of total seats), whereas the BJP came to a distant second with 77 (26%) seats, even though it raised its stock significantly in the West Bengal Assembly from its 2016 tally of a meager 3 seats. 3.6 Total Number of Seats Secured by Each Political Party Per Region
As per figure 7 below, TMC won the largest proportions of seats in the Presidency (TMC: 111 vs. BJP: 16) and Burdwan (TMC: 79 vs. BJP: 31) divisions whereas BJP emerged as a dominant force in the Jalpaiguri division (BJP 30 vs. TMC 23).
Figure 7: Total number of seats secured by each political party per region
3.7 Seats by Constituency Type
As per the figure 8 below, TMC won 82% of the General (or non-reserved) (168 out of 206) seats, and it won 53% (36 out of 68) of the SC and 56% of the ST (9 out of 16) reserved seats.9 TMC had done
9 Reservation is a system of affirmative action in India that provides historically disadvantaged groups representation in
education, employment and politics. https://en.wikipedia.org/wiki/Reservation_in_India
Figure 8: Winner by constituency type

ISSN 2564-212X | Journal of Policy & Governance| 01(01) August 2021 | https://doi.org/10.33002/jpg010107
76
Singh | West Bengal Assembly Election 2021: An Analysis
better electorally in General seats compared to SC and ST reserved seats. BJP won 18% of the total General or non-reserved (18 out of 206) seats and 47% of the SC (32 out of 68) and 44% of the ST (7 out of 16) reserved seats. The BJP had done better electorally in SC and ST seats compared to the General seats. 3.8 Seats with a Victory Margin of 5000 or Below
The total number of candidates who won by a margin of 5000 or less was 35 or around 12% of the total assembly seats. Out of the total 35, 63% or 22 were won by BJP and 37% or 13 were won by TMC. This indicates that more candidates from BJP won by a lower margin than TMC.
Figure 9: Winner by a margin of 5000 or less
3.9 Constituencies with Lower Voter Turnout
As depicted in figure 10 below, there were 5 constituencies with a turnout of 60% and below; in all these five constituencies the winning candidates were from the ruling TMC. However, since the seats with lower turnouts were just 5, this could just be a mere coincidence or some underlying factors that need to be further investigated if lower voter turnout favored one party over another in this state election.
Figure 10: Constituencies with lower voter turnout
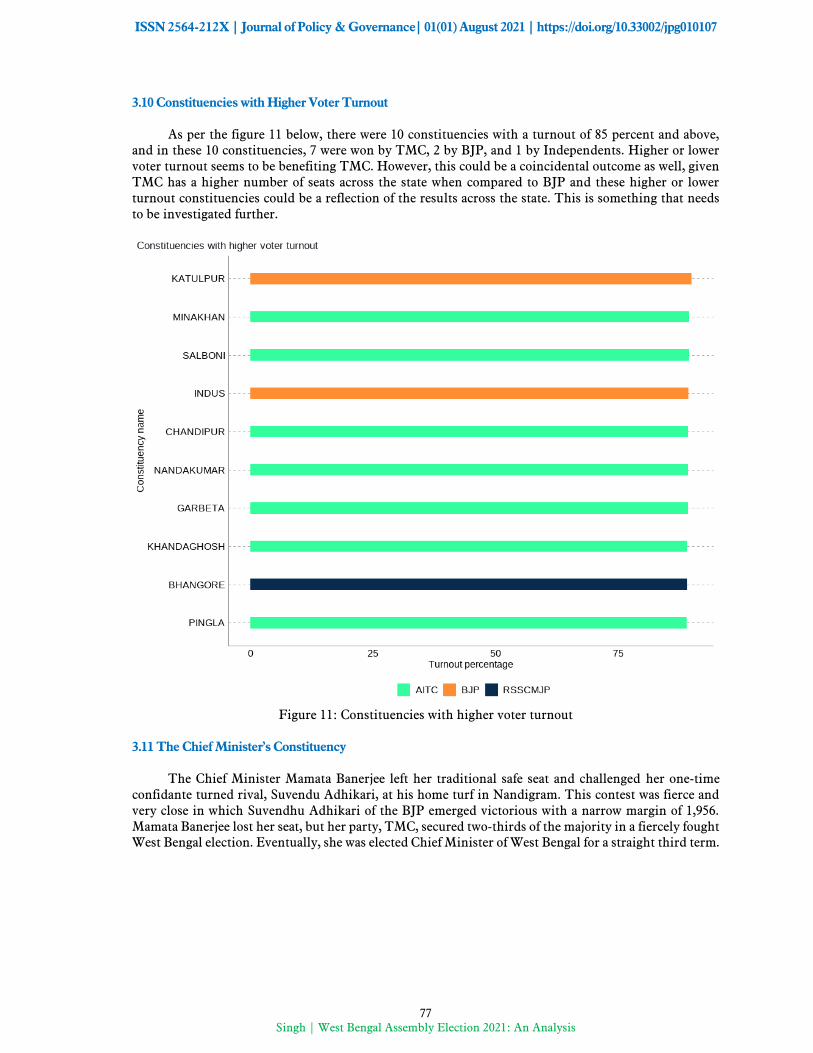
ISSN 2564-212X | Journal of Policy & Governance| 01(01) August 2021 | https://doi.org/10.33002/jpg010107
77
Singh | West Bengal Assembly Election 2021: An Analysis
3.10 Constituencies with Higher Voter Turnout
As per the figure 11 below, there were 10 constituencies with a turnout of 85 percent and above, and in these 10 constituencies, 7 were won by TMC, 2 by BJP, and 1 by Independents. Higher or lower voter turnout seems to be benefiting TMC. However, this could be a coincidental outcome as well, given TMC has a higher number of seats across the state when compared to BJP and these higher or lower turnout constituencies could be a reflection of the results across the state. This is something that needs to be investigated further.
Figure 11: Constituencies with higher voter turnout
3.11 The Chief Minister’s Constituency
The Chief Minister Mamata Banerjee left her traditional safe seat and challenged her one-time confidante turned rival, Suvendu Adhikari, at his home turf in Nandigram. This contest was fierce and very close in which Suvendhu Adhikari of the BJP emerged victorious with a narrow margin of 1,956. Mamata Banerjee lost her seat, but her party, TMC, secured two-thirds of the majority in a fiercely fought West Bengal election. Eventually, she was elected Chief Minister of West Bengal for a straight third term.

ISSN 2564-212X | Journal of Policy & Governance| 01(01) August 2021 | https://doi.org/10.33002/jpg010107
78
Singh | West Bengal Assembly Election 2021: An Analysis
Figure 12: The Chief Minister’s Constituency
3.12 The Gender Split of Winners by Party
Mamata Banerjee is the first woman Chief Minister of West Bengal and today is the most prominent leader of not only Bengal but also in India. Let us look at the gender splits of MLAs in her party versus the opposition BJP. As per the figure 13 below, out of the total seats won by TMC, the seats won by women were 33 or 15.5% of the total seats of 213, whereas for the BJP it was 7 seats or 9% of the total seats of 77. The proportion of women who got elected as members of the legislative assembly (MLAs) on TMC tickets is higher than that of the BJP.
Figure 13: The gender split of winners by party

ISSN 2564-212X | Journal of Policy & Governance| 01(01) August 2021 | https://doi.org/10.33002/jpg010107
79
Singh | West Bengal Assembly Election 2021: An Analysis
4. ANALYSIS OF RESULTS: DISTRICT-WISE 4.1 Results Summary Per District: Total number of seats secured by each political party by district
As illustrated in table 2 and figure 14 below, out of the total 19 districts, TMC bagged more seats than BJP in 12 districts (Bardhaman, Birbhum, Hooghly, Howrah, Kolkata Corporation, Maldah, Murshidabad, North 24 Parganas, Paschim Medinipur, Purba Medinipur, South 24 Parganas, and Uttar Dinajpur), whereas BJP had a bigger share of seats in only 6 districts (Bankura, Cooch Behar, Darjeeling, Jalpaiguri, Nadia, and Purulia). BJP did not win any seat in Howrah (16 seats), Kolkata Corporation (11 seats), and South 24 Parganas (30 seats) districts, whereas TMC did not win any seat in Darjeeling (6 seats). Table 2: Total number of seats secured by each political party by district
S.No. District Name Party Total Number of Seats 1. Bankura BJP 8
2. Bankura AITC 4
3. Bardhaman AITC 22
4. Bardhaman BJP 3
5. Birbhum AITC 10
6. Birbhum BJP 1
7. Cooch Behar BJP 7
8. Cooch Behar AITC 2
9. Dakshin Dinajpur AITC 3
10. Dakshin Dinajpur BJP 3
11. Darjeeling BJP 5
12. Darjeeling IND 1
13. Hooghly AITC 14
14. Hooghly BJP 4
15. Howrah AITC 16
16. Jalpaiguri BJP 9
17. Jalpaiguri AITC 3
18. Kolkata Corporation AITC 11
19. Maldah AITC 8
20. Maldah BJP 4
21. Murshidabad AITC 18
22. Murshidabad BJP 2
23. Nadia BJP 9
24. Nadia AITC 8
25. North 24 Parganas AITC 28
26. North 24 Parganas BJP 5
27. Paschim Medinipur AITC 17
28. Paschim Medinipur BJP 2
29. Purba Medinipur AITC 9
30. Purba Medinipur BJP 7
31. Purulia BJP 6
32. Purulia AITC 3
33. South 24 Parganas AITC 30
34. South 24 Parganas RSSCMJP 1
35. Uttar Dinajpur AITC 7
36. Uttar Dinajpur BJP 2

ISSN 2564-212X | Journal of Policy & Governance| 01(01) August 2021 | https://doi.org/10.33002/jpg010107
80
Singh | West Bengal Assembly Election 2021: An Analysis
Figure 14: Total number of seats secured by each political party by district District-wise analysis of seats earned by each political party has been given below. 4.2 Bankura District
In accordance with the analysis in figure 15 below and Annex 1, the district of Bankura has a total of 12 legislative constituencies. The district has 6 reserved constituencies out of which 4 seats are reserved for the Scheduled Castes10 (SC) community and 2 seats are reserved for the Scheduled Tribes11 (ST) community. Seats reserved for SC include Saltora, Katulpur, Indus and Sonamukhi, and the seats reserved for ST include Ranibundh, and Raipur.
Out of the total 12 seats in the Bankura district, the largest number of seats i.e., 8 were won by the BJP while the AITC won 4 seats. The seats won by BJP were Saltora, Chhatna, Bankura, Onda, Bishnupur, Katulpur, Indus and Sonamukhi, and the seats won by AITC include Ranibundh, Raipur, Taldangra and Barjora.
Out of the total polled votes of 2,470,633, BJP secured a total of 1,119,399 (45%) votes, while the AITC secured 1,092,741 (44%) votes. The CPM with a vote share of 110,909 (4%) was on third place, while the INC was on the fourth position after securing 47,335 (2%) of the total votes in the district.
10 https://en.wikipedia.org/wiki/Scheduled_Castes_and_Scheduled_Tribes 11 https://en.wikipedia.org/wiki/Scheduled_Castes_and_Scheduled_Tribes

ISSN 2564-212X | Journal of Policy & Governance| 01(01) August 2021 | https://doi.org/10.33002/jpg010107
81
Singh | West Bengal Assembly Election 2021: An Analysis
Figure 15: Bankura District: Winners per constituency and top 3 candidates 4.3. Bardhaman District
As the analysis in figure 16 below and Annex 2, district of Bardhaman has a total of 25 legislative constituencies. The district has 7 reserved constituencies, and all 7 seats are reserved for the Scheduled Castes (SC) community. Seats reserved for SC include Khandaghosh, Raina, Jamalpur, Kalna, Bardhaman Uttar, Ausgram and Galsi.
Out of the total 25 seats in the Bardhaman district, the largest number of seats i.e., 22 were won by the AITC, while the BJP won 3 seats. The seats won by AITC were Khandaghosh, Bardhaman Dakshin, Raina, Jamalpur, Monteswar, Kalna, Memari, Bardhaman Uttar, Bhatar, Purbasthali Dakshin, Purbasthali Uttar, Katwa, Ketugram, Mangalkot, Ausgram, Galsi, Pandabeswar, Durgapur Purba, Raniganj, Jamuria, Asansol Uttar and Barbani, and the seats won by BJP were Durgapur Paschim, Asansol Dakshin and Kulti.
Out of total polled votes of 5,044,003, AITC secured a total of 2,382,485 (47%) votes, while the BJP secured 2,062,687 (41%) votes. The CPM with a vote share of 404,042 (8%) was on third place, while the INC was on the fourth position after securing 60,824 (1%) of the total votes in the district.

ISSN 2564-212X | Journal of Policy & Governance| 01(01) August 2021 | https://doi.org/10.33002/jpg010107
82
Singh | West Bengal Assembly Election 2021: An Analysis
Figure 16: Bardhaman District: Winners per constituency and top 3 candidates 4.4. Birbhum District
The figure 17 below and Annex 3 indicate that the district of Birbhum has 11 legislative constituencies. The district has 3 reserved constituencies, and all 3 seats are reserved for the Scheduled Castes (SC) community. Seats reserved for SC include Dubrajpur, Nanoor and Sainthia.
From total 11 seats in the Birbhum district, the largest number of seats i.e., 10 were won by the AITC, while the BJP won only 1 seat. The seats won by AITC were Suri, Bolpur, Nanoor, Labhpur, Sainthia, Mayureswar, Rampurhat, Hansan, Nalhati and Murarai, and the seat won by BJP was Dubrajpur.
Of total polled votes of 2,348,347, AITC secured 1,223,569 (52%) votes, while the BJP secured 931,633 (40%) of the total votes. The INC with a vote share of 65,369 (3%) was on third place, while the CPM was on the fourth position after securing 41,433 (2%) of the total votes in the district.

ISSN 2564-212X | Journal of Policy & Governance| 01(01) August 2021 | https://doi.org/10.33002/jpg010107
83
Singh | West Bengal Assembly Election 2021: An Analysis
Figure 17: Birbhum District: Winners per constituency and top 3 candidates 4.5. Cooch Behar District
The analysis presented in figure 18 below and Annex 4 highlights that the district of Cooch Behar has a total of 9 legislative constituencies. The district consists of 5 reserved constituencies and all 5 seats are reserved for the Scheduled Castes (SC) community. The seats reserved for SC include Mekliganj, Mathabhanga, Cooch Behar Uttar, Sitalkuchi and Sitai.
From total 9 seats in Cooch Behar district, the largest number of seats, i.e. 7, were won by the BJP, while the AITC won 2 seats. The seats won by BJP were Mathabhanga, Cooch Behar Uttar, Cooch Behar Dakshin, Sitalkuchi, Dinhata, Natabari and Tufanganj, and the seats won by AITC were Mekliganj and Sitai.
Out of the total polled votes of 1,991,218, the BJP secured a total of 984,977 (49%) votes, while the AITC secured 891,584 (45%) of the votes. The AIFB with a vote share of 34,643 (2%) was on third place, while the CPM was on the fourth position after securing 26,277 (1%) of the total votes in the district.

ISSN 2564-212X | Journal of Policy & Governance| 01(01) August 2021 | https://doi.org/10.33002/jpg010107
84
Singh | West Bengal Assembly Election 2021: An Analysis
Figure 18: Cooch Bihar District: Winners per constituency and top 3 candidates 4.6. Dakshin Dinajpur District
The analysis depicted in figure 19 below and Annex 5 tells that the district of Dakshin Dinajpur has a total of 6 legislative constituencies. The district comprises 3 reserved constituencies out of which 2 seats are reserved for the Scheduled Castes (SC) community, whereas 1 seat is reserved for the Scheduled Tribes (ST) community. The seats reserved for SC community include Kushmandi and Gangarampur, and the seat reserved for ST includes Tapan.
Viewing the results, out of the total 6 seats in the Dakshin Dinajpur district, 3 seats each were won by the AITC and the BJP, respectively. The seats won by AITC were Kushmandi, Kumarganj and Harirampur, and the seats won by BJP include Balurghat, Tapan and Gangarampur.
Coming to the total polled votes of 1,061,300, AITC secured a total of 501,418 (47%) votes, while the BJP secured 456,473 (43%) of the votes. The RSP with a vote share of 40,812 (4%) was on third place, while the CPM was on the fourth position having secured 24,717 (2%) of the total votes in the district.

ISSN 2564-212X | Journal of Policy & Governance| 01(01) August 2021 | https://doi.org/10.33002/jpg010107
85
Singh | West Bengal Assembly Election 2021: An Analysis
Figure 19: Dakshin Dinajpur District: Winners per constituency and top 3 candidates 4.7. Darjeeling District
Figure 20 below and Annex 6 reflect that the district of Darjeeling bears a total of 6 legislative constituencies. The district has 2 reserved constituencies out of which 1 seat is reserved for the Scheduled Castes (SC) community, whereas 1 seat is reserved for the Scheduled Tribes (ST) community. The seats reserved for SC include Matigara-Naxalbari, and the seat reserved for ST includes Phansidewa.
Figure 20: Darjeeling District: Winners per constituency and top 3 candidates

ISSN 2564-212X | Journal of Policy & Governance| 01(01) August 2021 | https://doi.org/10.33002/jpg010107
86
Singh | West Bengal Assembly Election 2021: An Analysis
In Darjeeling district, the largest number of seats, i.e. 5, out of total 6, were won by the BJP, while the Independent candidate won 1 seat. The seats won by BJP were Darjeeling, Kurseong, Matigara-Naxalbari, Siliguri and Phansidewa, and the seat won by the Independent candidate was Kalimpong.
Looking at the vote distribution, BJP secured a total of 531,524 (48%) votes from total polled votes of 1,110,136, while the Independents secured 290,173 (26%) of the votes. The AITC with a vote share of 200,661 (18%) was on third place, while the INC was on the fourth position with a share of 37,590 (3%). 4.8. Hooghly District
According to the analysis portrayed in figure 21 below and Annex 7, the district of Hooghly comprises a total of 18 legislative constituencies. The district has 4 reserved constituencies, and all 4 seats are reserved for the Scheduled Castes (SC) community. Seats reserved for SC include Balagarh, Dhanekhali, Arambag and Goghat.
From total 18 seats in the Hooghly district, the largest number of seats, i.e. 14, were won by the AITC, while 4 seats were won by the BJP. The seats won by AITC were Uttarpara, Sreerampur, Champdani, Singur, Chandannagore, Chunchura, Balagarh, Pandua, Saptagram, Chanditala, Jangipara, Haripal, Dhanekhali and Tarakeswar, and the seats won by BJP were Pursurah, Arambag, Goghat and Khanakul.
Out of the total polled votes of 3,778,058, AITC secured a total of 1,805,779 (48%) votes while the BJP secured 1,525,889 (40%) of the votes. The CPM with a vote share of 234,397 (6%) was on third place, while the INC was on the fourth position having secured 67,866 (2%) of the total votes in the district.
Figure 21: Hooghly District: Winners per constituency and top 3 candidates

ISSN 2564-212X | Journal of Policy & Governance| 01(01) August 2021 | https://doi.org/10.33002/jpg010107
87
Singh | West Bengal Assembly Election 2021: An Analysis
4.9. Howrah District
With regard to the analysis given in figure 22 below and Annex 8, the district of Howrah possesses a total of 16 legislative constituencies. The district comprises 2 reserved constituencies and both the seats are reserved for the Scheduled Castes (SC) community. Seats reserved for SC are Sankrail and Uluberia Uttar.
Out of the total 16 seats in the Howrah district, all seats, i.e. 16, were won by the AITC. The seats won by AITC were Bally, Howrah Uttar, Howrah Madhya, Shibpur, Howrah Dakshin, Sankrail, Panchla, Uluberia Purba, Uluberia Uttar, Uluberia Dakshin, Shyampur, Bagnan, Amta, Udaynarayanpur, Jagatballavpur and Domjur.
What was the distribution of polled votes of 3,176,015? The AITC secured a total of 1,613,916 (51%) votes, while the BJP secured 1,159,043 (36%) of the votes. The CPM with a vote share of 148,219 (5%) remained on third place, while the RSSCMJP came on to the fourth position with the vote share of 91,396 (3%) in the district.
Figure 22: Howrah District: Winners per constituency and top 3 candidates 4.10. Jalpaiguri District
The analysis in figure 23 below and Annex 9 reveals that the district of Jalpaiguri has a total of 12 legislative constituencies. The district has 10 reserved constituencies out of which 5 seats are reserved for the Scheduled Castes (SC) community and 5 seats reserved for the Scheduled Tribes (ST) community. The seats reserved for SC are Falakata, Dhupguri, Maynaguri, Jalpaiguri and Rajganj, whereas the seats reserved for ST include Kumargram, Kalchini, Madarihat, Mal and Nagrakata.
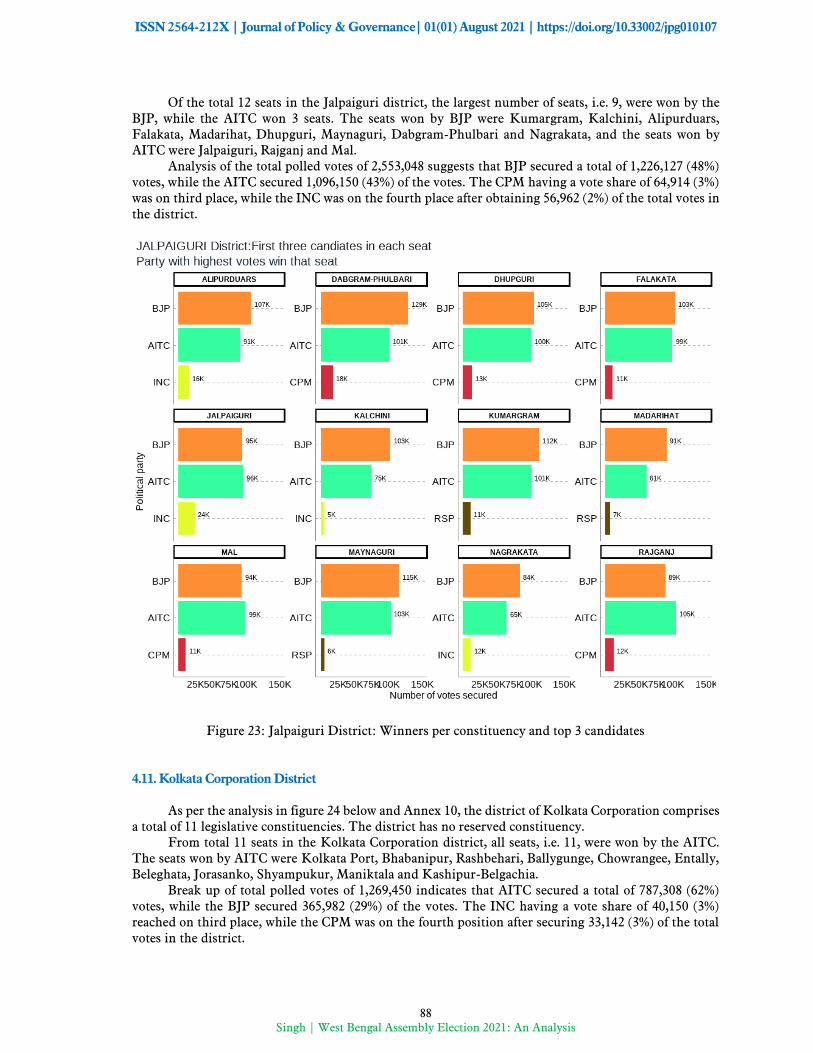
ISSN 2564-212X | Journal of Policy & Governance| 01(01) August 2021 | https://doi.org/10.33002/jpg010107
88
Singh | West Bengal Assembly Election 2021: An Analysis
Of the total 12 seats in the Jalpaiguri district, the largest number of seats, i.e. 9, were won by the BJP, while the AITC won 3 seats. The seats won by BJP were Kumargram, Kalchini, Alipurduars, Falakata, Madarihat, Dhupguri, Maynaguri, Dabgram-Phulbari and Nagrakata, and the seats won by AITC were Jalpaiguri, Rajganj and Mal.
Analysis of the total polled votes of 2,553,048 suggests that BJP secured a total of 1,226,127 (48%) votes, while the AITC secured 1,096,150 (43%) of the votes. The CPM having a vote share of 64,914 (3%) was on third place, while the INC was on the fourth place after obtaining 56,962 (2%) of the total votes in the district.
Figure 23: Jalpaiguri District: Winners per constituency and top 3 candidates 4.11. Kolkata Corporation District
As per the analysis in figure 24 below and Annex 10, the district of Kolkata Corporation comprises a total of 11 legislative constituencies. The district has no reserved constituency.
From total 11 seats in the Kolkata Corporation district, all seats, i.e. 11, were won by the AITC. The seats won by AITC were Kolkata Port, Bhabanipur, Rashbehari, Ballygunge, Chowrangee, Entally, Beleghata, Jorasanko, Shyampukur, Maniktala and Kashipur-Belgachia.
Break up of total polled votes of 1,269,450 indicates that AITC secured a total of 787,308 (62%) votes, while the BJP secured 365,982 (29%) of the votes. The INC having a vote share of 40,150 (3%) reached on third place, while the CPM was on the fourth position after securing 33,142 (3%) of the total votes in the district.

ISSN 2564-212X | Journal of Policy & Governance| 01(01) August 2021 | https://doi.org/10.33002/jpg010107
89
Singh | West Bengal Assembly Election 2021: An Analysis
Figure 24: Kolkata Corporation District: Winners per constituency and top 3 candidates
4.12. Maldah District
The analysis in figure 25 below and Annex 11 shows that the district of Maldah has a total of 12 legislative constituencies. The district has 3 reserved constituencies out of which 2 seats are reserved for the Scheduled Castes (SC) community and 1 seat reserved for the Scheduled Tribes (ST) community. The seats reserved for SC include Gazole and Maldaha and the seat reserved for ST includes Habibpur.
The results of total 12 seats in the Maldah district indicate that the largest number of seats, i.e. 8, were won by the AITC with the BJP having won 4 seats. The seats won by AITC were Chanchal, Harischandrapur, Malatipur, Ratua, Manickchak, Mothabari, Sujapur and Baishnab Nagar, while the seats won by BJP were Habibpur, Gazole, Maldaha and Englishbazar.
Out of the total polled votes of 2,412,438, AITC attained a total of 1,277,474 (53%) votes, while the BJP secured 791,356 (33%) of the votes. The INC with a vote share of 211,488 (9%) came on third place, with the CPM at the fourth place having secured 38,708 (2%) in the total votes in the district.
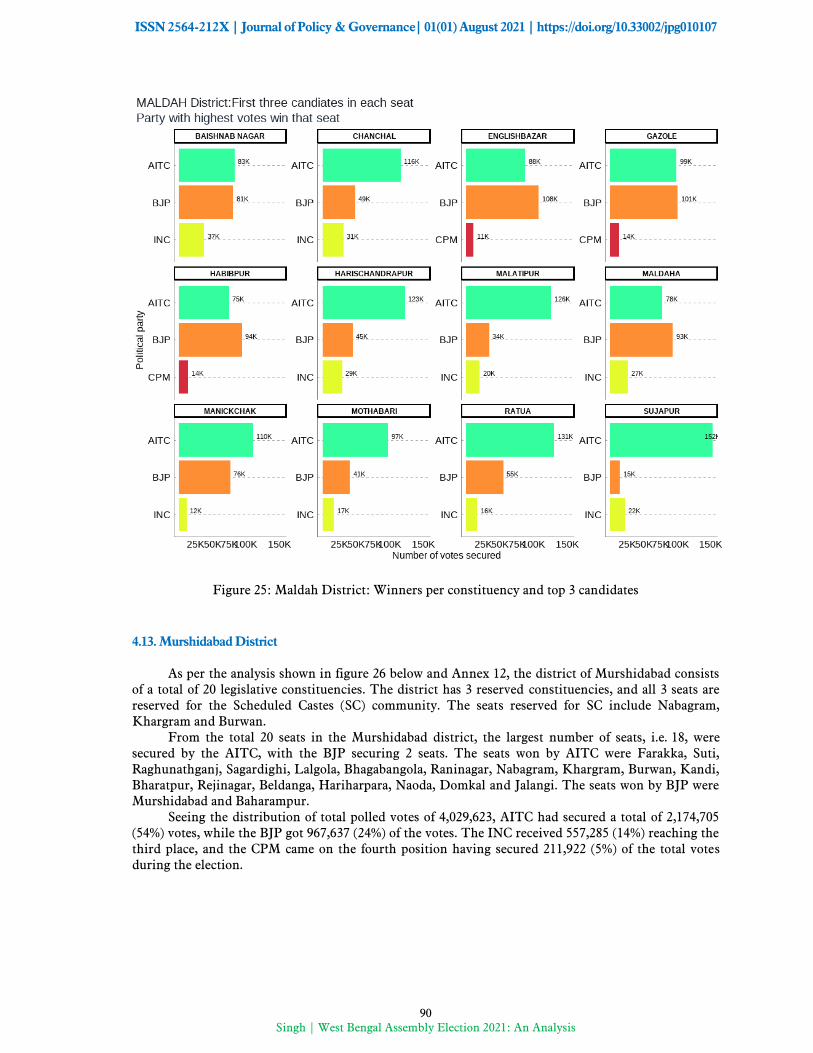
ISSN 2564-212X | Journal of Policy & Governance| 01(01) August 2021 | https://doi.org/10.33002/jpg010107
90
Singh | West Bengal Assembly Election 2021: An Analysis
Figure 25: Maldah District: Winners per constituency and top 3 candidates
4.13. Murshidabad District
As per the analysis shown in figure 26 below and Annex 12, the district of Murshidabad consists of a total of 20 legislative constituencies. The district has 3 reserved constituencies, and all 3 seats are reserved for the Scheduled Castes (SC) community. The seats reserved for SC include Nabagram, Khargram and Burwan.
From the total 20 seats in the Murshidabad district, the largest number of seats, i.e. 18, were secured by the AITC, with the BJP securing 2 seats. The seats won by AITC were Farakka, Suti, Raghunathganj, Sagardighi, Lalgola, Bhagabangola, Raninagar, Nabagram, Khargram, Burwan, Kandi, Bharatpur, Rejinagar, Beldanga, Hariharpara, Naoda, Domkal and Jalangi. The seats won by BJP were Murshidabad and Baharampur.
Seeing the distribution of total polled votes of 4,029,623, AITC had secured a total of 2,174,705 (54%) votes, while the BJP got 967,637 (24%) of the votes. The INC received 557,285 (14%) reaching the third place, and the CPM came on the fourth position having secured 211,922 (5%) of the total votes during the election.

ISSN 2564-212X | Journal of Policy & Governance| 01(01) August 2021 | https://doi.org/10.33002/jpg010107
91
Singh | West Bengal Assembly Election 2021: An Analysis
Figure 26: Murshidabad District: Winners per constituency and top 3 candidates 4.14. Nadia District
Data in figure 27 below and Annex 13 reveals that the district of Nadia has a total of 17 legislative constituencies. The district comprises 5 reserved constituencies and all 5 seats are reserved for the Scheduled Castes (SC) community. Seats reserved for SC include Krishnaganj, Ranaghat Uttar Purba, Ranaghat Dakshin, Kalyani and Haringhata.
The largest number of seats (i.e., 9 out of the total 17 seats) were won by the BJP, while the AITC got 8 seats. The seats won by BJP were Krishnanagar Uttar, Santipur, Ranaghat Uttar Paschim, Krishnaganj, Ranaghat Uttar Purba, Ranaghat Dakshin, Chakdaha, Kalyani and Haringhata. On the other hand, the seats won by AITC were Karimpur, Tehatta, Palashipara, Kaliganj, Nakashipara, Chapra, Nabadwip and Krishnanagar Dakshin.
AITC secured a total of 1,611,050 (44%) votes out of total polled votes of 3,625,258, while the BJP secured 1,590,147 (44%) of the votes. The CPM with a vote share of 208,699 (6%) was on third place, while the Independents were on the fourth position after securing 99,485 (3%) of the total votes.

ISSN 2564-212X | Journal of Policy & Governance| 01(01) August 2021 | https://doi.org/10.33002/jpg010107
92
Singh | West Bengal Assembly Election 2021: An Analysis
Figure 27: Nadia District: Winners per constituency and top 3 candidates 4.15. North 24 Parganas
As per the analysis given in figure 28 below and Annex 14, the district of North 24 Parganas is divided into total of 33 legislative constituencies. The district has 8 reserved constituencies out of which 7 seats are reserved for the Scheduled Castes (SC) community and 1 seat reserved for the Scheduled Tribes (ST) community. The seats reserved for SC include Bagdah, Bongaon Uttar, Bongaon Dakshin, Gaighata, Swarupnagar, Minakhan and Hingalganj, whereas the seat reserved for ST includes Sandeshkhali.
Total 33 seats in the North 24 Parganas district were analyzed. The largest number of seats, i.e. 28, were secured by the AITC, while the BJP got 5 seats. The seats won by AITC were Swarupnagar, Baduria, Habra, Ashoknagar, Amdanga, Bijpur, Naihati, Jagatdal, Noapara, Barrackpur, Khardaha, Dum Dum Uttar, Panihati, Kamarhati, Baranagar, Dum Dum, Rajarhat New Town, Bidhannagar, Rajarhat Gopalpur, Madhyamgram, Barasat, Deganga, Haroa, Minakhan, Sandeshkhali, Basirhat Dakshin, Basirhat Uttar and Hingalganj. On the other side, the seats secured by BJP were Bagdah, Bongaon Uttar, Bongaon Dakshin, Gaighata and Bhatpara.
The total polled votes of 6,380,727 were analyzed. The AITC secured a total of 3,131,141 (49%) votes, whereas the BJP secured 2,217,198 (35%) of the votes. The CPM having 368,123 (6%) votes was on third place, with the RSSCMJP on the fourth position after securing 322,688 (5%) of the total votes.

ISSN 2564-212X | Journal of Policy & Governance| 01(01) August 2021 | https://doi.org/10.33002/jpg010107
93
Singh | West Bengal Assembly Election 2021: An Analysis
Figure 28: North 24 Parganas: Winners per constituency and top 3 candidates 4.16. Paschim Medinipur District
In accordance with the data shown in figure 29 below and Annex 15, the district of Paschim Medinipur has a total of 19 legislative constituencies. The district has 6 reserved constituencies out of which 3 seats are reserved for the Scheduled Castes (SC) community and another 3 seats are reserved for the Scheduled Tribes (ST) community. The seats reserved for SC include Ghatal, Chandrakona and Keshpur, and the seats reserved for ST include Nayagram, Keshiary and Binpur.
Of 19 seats in the Paschim Medinipur district, the largest number of seats (i.e., 17) were occupied by the AITC, with the BJP secured 2 seats. The seats won by AITC were Dantan, Nayagram, Gopiballavpur, Jhargram, Keshiary, Narayangarh, Sabang, Pingla, Kharagpur, Debra, Daspur, Chandrakona, Garbeta, Salboni, Keshpur, Medinipur and Binpur. Likewise, the seats won by BJP were Kharagpur Sadar and Ghatal.
From the total polled votes of 4,028,773, AITC secured a total of 2,023,763 (50%) votes with the BJP having secured 1,695,443 (42%) votes. The CPM having vote share of 168,713 (4%) was on third place, while the INC was on the fourth place with 35,337 (1%) of the total votes in the district.

ISSN 2564-212X | Journal of Policy & Governance| 01(01) August 2021 | https://doi.org/10.33002/jpg010107
94
Singh | West Bengal Assembly Election 2021: An Analysis
Figure 29: Paschim Medinipur: Winners per constituency and top 3 candidates 4.17. Purba Medinipur District
As per the analysis contained in the figure 30 below and Annex 16, the district of Purba Medinipur has a total of 16 legislative constituencies. The district comprises 2 reserved constituencies and both the seats are reserved for the Scheduled Castes (SC) community. Seats reserved for SC include Haldia and Khejuri.
Out of the total 16 seats in the Purba Medinipur district, the largest number of seats (i.e. 9) were won by the AITC while the BJP won 7 seats. The seats secured by AITC were Tamluk, Panskura Purba, Panskura Paschim, Nandakumar, Mahisadal, Chandipur, Patashpur, Ramnagar and Egra. BJP won the seats of Moyna, Haldia, Nandigram, Kanthi Uttar, Bhagabanpur, Khejuri and Kanthi Dakshin.
The distribution of polled votes of 3,519,791 shows that BJP secured a total of 1,660,061 (47%) votes while the AITC secured 1,658,308 (47%) of the votes. On the third position was the CPM having a vote share of 93,358 (3%), while the CPI was at the fourth position after securing 42,487 (1%) in the total votes in the district.

ISSN 2564-212X | Journal of Policy & Governance| 01(01) August 2021 | https://doi.org/10.33002/jpg010107
95
Singh | West Bengal Assembly Election 2021: An Analysis
Figure 30: Purba Medinipur: Winners per constituency and top 3 candidates 4.18. Purulia District
As per the analysis depicted in the figure 31 below and Annex 17 data, the district of Purulia comprises a total of 9 legislative constituencies, from which 4 are reserved constituencies. Out of those 4, 2 seats are reserved for the Scheduled Castes (SC) community, whereas 2 seats are reserved for the Scheduled Tribes (ST) community. The seats reserved for SC include Para and Raghunathpur, and the seats reserved for ST include Bandwan and Manbazar.
Out of the 9 seats in the Purulia district, the largest number of seats (i.e., 6) were received by the BJP, while the AITC got 3 seats. The seats won by BJP were Balarampur, Joypur, Purulia, Kashipur, Para and Raghunathpur, and the seats won by AITC include Bandwan, Baghmundi and Manbazar.
Of the total polled votes of 1,847,059, the AITC obtained a total of 723,576 (39%) votes, with the BJP securing 711,977 (39%) votes. The INC came on third position with a vote share of 147,117 (8%), when the CPM was on the fourth position with 78,399 (4%) votes.

ISSN 2564-212X | Journal of Policy & Governance| 01(01) August 2021 | https://doi.org/10.33002/jpg010107
96
Singh | West Bengal Assembly Election 2021: An Analysis
Figure 31: Purulia District: Winners per constituency and top 3 candidates 4.19. South 24 Parganas District
According to the data in figure 32 below and Annex 18, the district of South 24 Parganas comprises a total of 31 legislative constituencies, from which 9 are reserved constituencies, and all 9 seats are reserved for the Scheduled Castes (SC) community. The seats reserved for SC include Gosaba, Basanti, Kultali, Mandirbazar, Jaqynagar, Baruipur Purba, Canning Paschim, Magrahat Purba and Bishnupur (SC).
Out of the total 31 seats in the South 24 Parganas district, the largest number of seats (i.e. 30) were obtained by the AITC, while the RSSCMJP got only 1 seat. The seats won by AITC were Gosaba, Basanti, Kultali, Patharpratima, Kakdwip, Sagar, Kulpi, Raidighi, Mandirbazar, Jaqynagar, Baruipur Purba, Canning Paschim, Canning Purba, Baruipur Paschim, Magrahat Purba, Magrahat Paschim, Diamond Harbour, Falta, Satgachia, Bishnupur (SC), Sonarpur Dakshin, Kasba, Jadavpur, Sonarpur Uttar, Tollygunj, Behala Purba, Behala Paschim, Maheshtala, Budge Budge and Metiaburuz. The seats secured by RSSCMJP included Bhangore.
From total polled votes of 6,734,075, AITC secured a total of 3,523,407 (52%) votes, while the BJP secured 2,142,477 (32%) of the votes. The CPM with a vote share of 508,632 (8%) was on third place, while the RSSCMJP was on the fourth position with 281,963 (4%) votes in the district.

ISSN 2564-212X | Journal of Policy & Governance| 01(01) August 2021 | https://doi.org/10.33002/jpg010107
97
Singh | West Bengal Assembly Election 2021: An Analysis
Figure 32: South 24 Parganas District: Winners per constituency and top 3 candidates 4.20. Uttar Dinajpur District
Figure 33 below and Annex 19 demonstrate that the district of Uttar Dinajpur has a total of 9 legislative constituencies, with 2 reserved constituencies for the Scheduled Castes (SC) community. These seats reserved for SC include Hemtabad and Kaliaganj.
Who secured what out of the total 9 seats in the Uttar Dinajpur district? The largest number of seats (i.e. 7) went to AITC, while the BJP got 2 seats. The seats won by AITC were Chopra, Islampur, Goalpokhar, Chakulia, Karandighi, Hemtabad and Itahar, while the seats obtained by BJP included Kaliaganj and Raiganj.
Out of the total polled votes of 1,722,482, AITC secured a total of 918,653 (53%) votes while the BJP secured 643,709 (37%) of the votes. The INC having a vote share of 56,820 (3%) remained on third place, whereas the AIFB reached to the fourth position after securing 37,850 (2%) votes in the district.

ISSN 2564-212X | Journal of Policy & Governance| 01(01) August 2021 | https://doi.org/10.33002/jpg010107
98
Singh | West Bengal Assembly Election 2021: An Analysis
Figure 33: Uttar Dinajpur District: Winners per constituency and top 3 candidates 4. CONCLUSIONS
The AITC won the election comprehensively, while the BJP consolidated its position as the main opposition party in West Bengal relegating the Left parties and Congress to an insignificant player in the politics of West Bengal. After the West Bengal 2021 election results, Mamata Banerjee emerged as one of the main challengers of BJP at the national arena of Indian politics. What lessons Bengal election offers to the country remains to be seen yet, but the state and central government’s handling of the second wave of Covid-19 crisis (in which many Indians lost lives) and associated social and economic crisis has kept the political battle open for the forthcoming Uttar Pradish election in 2022 and the India’s general election in 2024. It has also infused fresh energy in opposition parties to challenge the election machinery and public image of Prime Minister Narendra Modi. With the global and national uncertainties looming large due to the Covid-19 crisis and a prediction of the third wave of the virus in the country, governments both at the state and the central level need to do much more than business as usual to win the trust of the people, if they want to acquire significant position in elections

ISSN 2564-212X | Journal of Policy & Governance| 01(01) August 2021 | https://doi.org/10.33002/jpg010107
99
Singh | West Bengal Assembly Election 2021: An Analysis
Annex 1: Bankura District Election Results: Top 3 Candidates by Votes in Each Constituency
Constituency Type Party Candidate Position Votes Margin Bankura GEN BJP Niladri Sekhar Dana 1 95,466 1,468
Bankura GEN AITC Sayantika Banerjee 2 93,998 80,234
Bankura GEN INC Radharani Banerjee 3 13,764 9,257
Barjora GEN AITC Alok Mukherjee 1 93,290 3,269
Barjora GEN BJP Supriti Chatterjee 2 90,021 64,786
Barjora GEN CPM Sujit Chakraborty 3 25,235 20,332
Bishnupur GEN BJP Tanmay Ghosh (Bumba)
1 89,689 11,420
Bishnupur GEN AITC Archita Bid 2 78,269 62,455
Bishnupur GEN INC Debu Chatterjee 3 15,814 12,395
Chhatna GEN BJP Satyanarayan Mukhopadhyay
1 90,233 7,164
Chhatna GEN AITC Subasish Batabyal 2 83,069 73,369
Chhatna GEN RSP Falguni Mukherjee 3 9,700 6,186
Indus SC BJP Nirmal Kumar Dhara 1 104,936 7,220
Indus SC AITC Runu Mete 2 97,716 85,097
Indus SC CPM Nayan Kumar Shill (Bagdi)
3 12,619 9,437
Katulpur SC BJP Harakali Protiher 1 106,022 11,785
Katulpur SC AITC Sangeeta Malik 2 94,237 76,480
Katulpur SC INC Akshay Santra 3 17,757 15,238
Onda GEN BJP Amarnath Shakha 1 104,940 11,551
Onda GEN AITC Arup Kumar Khan 2 93,389 77,776
Onda GEN AIFB Tarapada Chakrabarti 3 15,613 10,734
Raipur ST AITC Mrityunjoy Murmu 1 101,043 19,398
Raipur ST BJP Sudhanshu Hansda 2 81,645 75,052
Raipur ST RSSCMJP Milan Mandi 3 6,593 3,607
Ranibundh ST AITC Jyotsna Mandi 1 90,928 3,939
Ranibundh ST BJP Kshudiram Tudu 2 86,989 66,932
Ranibundh ST CPM Deblina Hembram 3 20,057 15,250
Saltora SC BJP Bauri Chandana 1 91,648 4,145
Saltora SC AITC Sontosh Kumar Mondal
2 87,503 73,419
Saltora SC CPM Nandadulal Bauri 3 14,084 10,530
Sonamukhi SC BJP Dibakar Gharami 1 98,161 10,888
Sonamukhi SC AITC Dr. Shyamal Santra 2 87,273 71,548
Sonamukhi SC CPM Ajit Ray 3 15,725 12,953
Taldangra GEN AITC Arup Chakraborty 1 92,026 12,377
Taldangra GEN BJP Shyamal Kumar Sarkar (Benu)
2 79,649 56,460
Taldangra GEN CPM Manoranjan Patra 3 23,189 19,671

ISSN 2564-212X | Journal of Policy & Governance| 01(01) August 2021 | https://doi.org/10.33002/jpg010107
100
Singh | West Bengal Assembly Election 2021: An Analysis
Annex 2: Bardhaman District Election Results: Top 3 Candidates by Votes in Each Constituency
Constituency Type Party Candidate Position Votes Margin Asansol Dakshin GEN BJP Agnimitra Paul 1 87,881 4,487
Asansol Dakshin GEN AITC Sayani Ghosh 2 83,394 67,422
Asansol Dakshin GEN CPM Prasanta Ghosh 3 15,972 12,506
Asansol Uttar GEN AITC Ghatak Moloy 1 100,931 21,110
Asansol Uttar GEN BJP Krishnendu Mukherjee
2 79,821 75,350
Asansol Uttar GEN RSSCMJP Mohammad Mustaqim
3 4,471 1,123
Ausgram SC AITC Abhedananda Thander
1 100,392 11,815
Ausgram SC BJP Kalita Maji 2 88,577 68,178
Ausgram SC CPM Chanchal Kumar Majhi
3 20,399 16,360
Barbani GEN AITC Bidhan Upadhyay 1 88,430 23,457
Barbani GEN BJP Arijit Roy 2 64,973 56,011
Barbani GEN INC Ranendra Nath Bagchi
3 8,962 5,923
Bardhaman Dakshin GEN AITC Khokan Das 1 91,015 8,105
Bardhaman Dakshin GEN BJP Sandip Nandi 2 82,910 59,564
Bardhaman Dakshin GEN CPM Pritha Tah 3 23,346 19,639
Bardhaman Uttar SC AITC Nisith Kumar Malik 1 111,211 17,268
Bardhaman Uttar SC BJP Radha Kanta Roy 2 93,943 62,915
Bardhaman Uttar SC CPM Chandi Choran Let 3 31,028 27,681
Bhatar GEN AITC Adhikari Mangobinda 1 108,028 31,741
Bhatar GEN BJP Mahendranath Kowar 2 76,287 56,680
Bhatar GEN CPM Nazrul Haque 3 19,607 15,261
Durgapur Paschim GEN BJP Lakshman Chandra Ghorui
1 91,186 14,664
Durgapur Paschim GEN AITC Biswanath Parial 2 76,522 58,492
Durgapur Paschim GEN INC Debesh Chakraborty 3 18,030 15,406
Durgapur Purba GEN AITC Pradip Mazumdar 1 79,303 3,746
Durgapur Purba GEN BJP Colonel Diptansu Chaudhury
2 75,557 46,494
Durgapur Purba GEN CPM Abhas Ray Chaudhuri 3 29,063 26,435
Galsi SC AITC Nepal Ghorui 1 109,504 19,262
Galsi SC BJP Bikash Biswas 2 90,242 73,222
Galsi SC AIFB Nandalal Pondit 3 17,020 13,502
Jamalpur SC AITC Alok Kumar Majhi 1 96,999 17,971
Jamalpur SC BJP Balaram Bapari 2 79,028 55,730
Jamalpur SC CPM Samar Hazra 3 23,298 20,433
Jamuria GEN AITC Hareram Singh 1 71,002 8,051
Jamuria GEN BJP Tapas Kumar Roy 2 62,951 38,133
Jamuria GEN CPM Aishe Ghosh 3 24,818 22,409
Kalna SC AITC Deboprasad Bag (Poltu)
1 96,073 7,478
Kalna SC BJP Biswajit Kundu 2 88,595 69,590
Kalna SC CPM Nirab Khan 3 19,005 16,498
Katwa GEN AITC Rabindranath Chatterjee
1 107,894 9,155
Katwa GEN BJP Shyama Majumdar 2 98,739 85,763

ISSN 2564-212X | Journal of Policy & Governance| 01(01) August 2021 | https://doi.org/10.33002/jpg010107
101
Singh | West Bengal Assembly Election 2021: An Analysis
Constituency Type Party Candidate Position Votes Margin Katwa GEN INC Prabir Ganguli 3 12,976 11,196
Ketugram GEN AITC Sekh Sahonawez 1 100,226 12,683
Ketugram GEN BJP Anadi Ghosh (Mathura)
2 87,543 67,451
Ketugram GEN CPM Mizanul Kabir (Dhiraj)
3 20,092 16,472
Khandaghosh SC AITC Nabin Chandra Bag 1 104,264 20,886
Khandaghosh SC BJP Bijan Mandal 2 83,378 60,455
Khandaghosh SC CPM Asima Roy 3 22,923 19,458
Kulti GEN BJP Ajay Kumar Poddar 1 81,112 679
Kulti GEN AITC Ujjal Chatterjee 2 80,433 74,638
Kulti GEN INC Chandi Das Chatterjee 3 5,795 2,242
Mangalkot GEN AITC Apurba Chowdhury (Achal)
1 107,596 22,337
Mangalkot GEN BJP Rana Protap Goswami 2 85,259 68,476
Mangalkot GEN CPM Choudhury Sahajahan 3 16,783 12,957
Memari GEN AITC Madhusudan Bhattacharya
1 104,851 23,078
Memari GEN BJP Bhismadeb Bhattacharya
2 81,773 56,155
Memari GEN CPM Sanat Banerjee 3 25,618 23,497
Monteswar GEN AITC Chowdhury Siddiqullah
1 105,460 31,805
Monteswar GEN BJP Saikat Panja 2 73,655 48,915
Monteswar GEN CPM Anupam Ghosh 3 24,740 22,863
Pandabeswar GEN AITC Narendranath Chakraborty
1 73,922 3,803
Pandabeswar GEN BJP Kumar Jitendra Tewari
2 70,119 57,923
Pandabeswar GEN CPM Subhas Bauri 3 12,196 9,461
Purbasthali Dakshin GEN AITC Swapan Debnath 1 105,698 17,410
Purbasthali Dakshin GEN BJP Rajib Kumar Bhowmick
2 88,288 73,227
Purbasthali Dakshin GEN INC Abhijit Bhattacharyya 3 15,061 11,956
Purbasthali Uttar GEN AITC Tapan Chatterjee 1 92,421 6,706
Purbasthali Uttar GEN BJP Gobardhan Das 2 85,715 57,581
Purbasthali Uttar GEN CPM Pradip Kumar Saha 3 28,134 26,227
Raina SC AITC Shampa Dhara 1 108,752 18,205
Raina SC BJP Manik Roy 2 90,547 65,215
Raina SC CPM Basudeb Khan 3 25,332 23,461
Raniganj GEN AITC Tapas Banerjee 1 78,164 3,556
Raniganj GEN BJP Dr. Bijan Mukherjee 2 74,608 52,920
Raniganj GEN CPM Hemant Kumar Prabhakar
3 21,688 19,682

ISSN 2564-212X | Journal of Policy & Governance| 01(01) August 2021 | https://doi.org/10.33002/jpg010107
102
Singh | West Bengal Assembly Election 2021: An Analysis
Annex 3: Birbhum District Election Results: Top 3 Candidates by Votes in Each Constituency
Constituency Type Party Candidate Position Votes Margin Bolpur GEN AITC Sinha Chandranath 1 116,443 22,280
Bolpur GEN BJP Anirban Ganguly 2 94,163 84,198
Bolpur GEN RSP Tapan Hore 3 9,965 6,628
Dubrajpur SC BJP Anup Kumar Saha 1 98,083 3,863
Dubrajpur SC AITC Debabrata Saha 2 94,220 88,206
Dubrajpur SC AIFB Bijoy Bagdi 3 6,014 2,857
Hansan GEN AITC Dr. Asok Kumar Chattopadhyay
1 108,289 50,613
Hansan GEN BJP Nikhil Banerjee 2 57,676 17,861
Hansan GEN INC Miltan Rasid 3 39,815 37,395
Labhpur GEN AITC Abhijit Sinha (Rana) 1 108,423 17,975
Labhpur GEN BJP Biswajit Mondal 2 90,448 83,969
Labhpur GEN CPM Syed Mahfuzul Karim 3 6,479 3,422
Mayureswar GEN AITC Abhijit Roy 1 100,425 12,075
Mayureswar GEN BJP Shyamapada Mondal 2 88,350 82,788
Mayureswar GEN RSSCMJP Kashinath Pal 3 5,562 2,759
Murarai GEN AITC Dr Mosarraf Hossain 1 146,496 98,246
Murarai GEN BJP Debasish Roy 2 48,250 30,963
Murarai GEN INC Asif Ekbal 3 17,287 15,430
Nalhati GEN AITC Rajendra Prasad Singh (Raju Singh)
1 117,438 56,905
Nalhati GEN BJP Tapas Kumar Yadav(Ananda Yadav)
2 60,533 39,205
Nalhati GEN AIFB Dipak Chatterjee 3 21,328 19,428
Nanoor SC AITC Bidhan Chandra Majhi 1 112,116 6,670
Nanoor SC BJP Tarakeswar Saha 2 105,446 92,568
Nanoor SC CPM Shyamali Pradhan 3 12,878 10,139
Rampurhat GEN AITC Asish Banerjee 1 103,276 8,472
Rampurhat GEN BJP Subhasis Choudhury (Khokan)
2 94,804 83,097
Rampurhat GEN CPM Sanjib Barman (Gopi) 3 11,707 8,326
Sainthia SC AITC Nilabati Saha 1 110,572 15,243
Sainthia SC BJP Piya Saha 2 95,329 84,960
Sainthia SC CPM Mausumi Konai 3 10,369 8,271
Suri GEN AITC Bikash Roychoudhury 1 105,871 7,320
Suri GEN BJP Chattopadhyay Jagannath
2 98,551 90,284
Suri GEN INC Chanchal Chatterjee 3 8,267 6,183
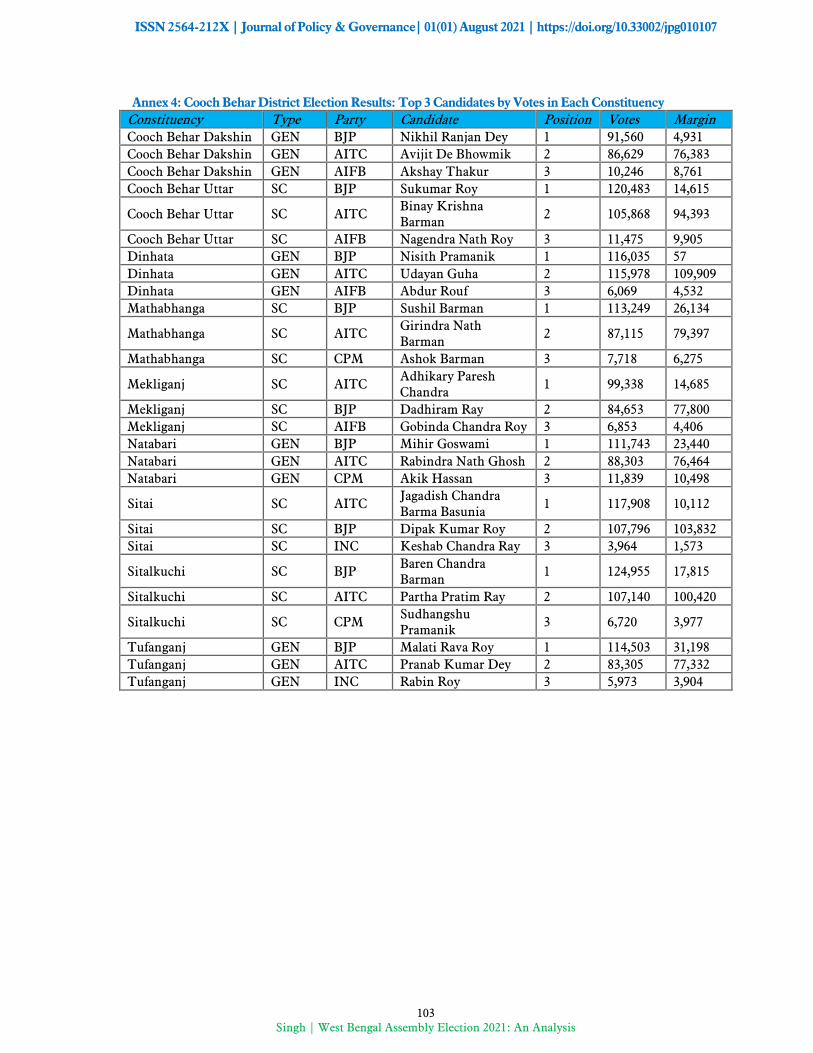
ISSN 2564-212X | Journal of Policy & Governance| 01(01) August 2021 | https://doi.org/10.33002/jpg010107
103
Singh | West Bengal Assembly Election 2021: An Analysis
Annex 4: Cooch Behar District Election Results: Top 3 Candidates by Votes in Each Constituency
Constituency Type Party Candidate Position Votes Margin Cooch Behar Dakshin GEN BJP Nikhil Ranjan Dey 1 91,560 4,931
Cooch Behar Dakshin GEN AITC Avijit De Bhowmik 2 86,629 76,383
Cooch Behar Dakshin GEN AIFB Akshay Thakur 3 10,246 8,761
Cooch Behar Uttar SC BJP Sukumar Roy 1 120,483 14,615
Cooch Behar Uttar SC AITC Binay Krishna Barman
2 105,868 94,393
Cooch Behar Uttar SC AIFB Nagendra Nath Roy 3 11,475 9,905
Dinhata GEN BJP Nisith Pramanik 1 116,035 57
Dinhata GEN AITC Udayan Guha 2 115,978 109,909
Dinhata GEN AIFB Abdur Rouf 3 6,069 4,532
Mathabhanga SC BJP Sushil Barman 1 113,249 26,134
Mathabhanga SC AITC Girindra Nath Barman
2 87,115 79,397
Mathabhanga SC CPM Ashok Barman 3 7,718 6,275
Mekliganj SC AITC Adhikary Paresh Chandra
1 99,338 14,685
Mekliganj SC BJP Dadhiram Ray 2 84,653 77,800
Mekliganj SC AIFB Gobinda Chandra Roy 3 6,853 4,406
Natabari GEN BJP Mihir Goswami 1 111,743 23,440
Natabari GEN AITC Rabindra Nath Ghosh 2 88,303 76,464
Natabari GEN CPM Akik Hassan 3 11,839 10,498
Sitai SC AITC Jagadish Chandra Barma Basunia
1 117,908 10,112
Sitai SC BJP Dipak Kumar Roy 2 107,796 103,832
Sitai SC INC Keshab Chandra Ray 3 3,964 1,573
Sitalkuchi SC BJP Baren Chandra Barman
1 124,955 17,815
Sitalkuchi SC AITC Partha Pratim Ray 2 107,140 100,420
Sitalkuchi SC CPM Sudhangshu Pramanik
3 6,720 3,977
Tufanganj GEN BJP Malati Rava Roy 1 114,503 31,198
Tufanganj GEN AITC Pranab Kumar Dey 2 83,305 77,332
Tufanganj GEN INC Rabin Roy 3 5,973 3,904

ISSN 2564-212X | Journal of Policy & Governance| 01(01) August 2021 | https://doi.org/10.33002/jpg010107
104
Singh | West Bengal Assembly Election 2021: An Analysis
Annex 5: Dakshin Dinajpur District Election Results: Top 3 Candidates by Votes in Each Constituency
Constituency Type Party Candidate Position Votes Margin Balurghat GEN BJP Ashok Kumar Lahiri 1 72,129 13,436
Balurghat GEN AITC Sekhar Dasgupta 2 58,693 42,540
Balurghat GEN RSP Sucheta Biswas 3 16,153 14,323
Gangarampur SC BJP Satyendra Nath Ray 1 88,724 4,592
Gangarampur SC AITC Goutam Das 2 84,132 71,859
Gangarampur SC CPM Nanda Lal Hazra 3 12,273 11,104
Harirampur GEN AITC Biplab Mitra 1 96,131 22,672
Harirampur GEN BJP Nilanjan Roy 2 73,459 61,015
Harirampur GEN CPM Rafikul Islam 3 12,444 10,613
Kumarganj GEN AITC Toraf Hossain Mandal 1 89,763 29,367
Kumarganj GEN BJP Manas Sarkar 2 60,396 42,918
Kumarganj GEN INC Chaudhuri Nargis Banu 3 17,478 16,263
Kushmandi SC AITC Rekha Roy 1 89,968 12,584
Kushmandi SC BJP Ranjit Kumar Roy 2 77,384 64,813
Kushmandi SC RSP Narmada Chandra Roy 3 12,571 10,973
Tapan ST BJP Budhrai Tudu 1 84,381 1,650
Tapan ST AITC Kalpana Kisku 2 82,731 70,643
Tapan ST RSP Raghu Urow 3 12,088 9,942
Annex 6: Darjeeling District Election Results: Top 3 Candidates by Votes in Each Constituency
Constituency Type Party Candidate Position Votes Margin Darjeeling GEN BJP Neeraj Tamang Zimba 1 68,907 21,276
Darjeeling GEN IND Keshav Raj Sharma 2 47,631 9,391
Darjeeling GEN IND Pemba Tshering 3 38,240 35,385
Kalimpong GEN IND Ruden Sada Lepcha 1 58,206 3,870
Kalimpong GEN BJP Suva Pradhan 2 54,336 22,480
Kalimpong GEN IND Dr. R.b. Bhujel 3 31,856 29,696
Kurseong GEN BJP Bishnu Prasad Sharma (Alias B.p. Bajgain)
1 73,475 15,515
Kurseong GEN IND Tshering Lama 2 57,960 24,866
Kurseong GEN IND Narbu Lama 3 33,094 30,549
Matigara-Naxalbari SC BJP Anandamay Barman 1 139,785 70,848
Matigara-Naxalbari SC AITC Rajen Sundas 2 68,937 45,877
Matigara-Naxalbari SC INC Sankar Malakar 3 23,060 19,148
Phansidewa ST BJP Durga Murmu 1 105,651 27,711
Phansidewa ST AITC Chhotan Kisku 2 77,940 65,125
Phansidewa ST INC Sunil Chandra Tirkey 3 12,815 10,028
Siliguri GEN BJP Sankar Ghosh 1 89,370 35,586
Siliguri GEN AITC Dr. Omprakash Mishra
2 53,784 24,949
Siliguri GEN CPM Asok Bhattacharya 3 28,835 26,761

ISSN 2564-212X | Journal of Policy & Governance| 01(01) August 2021 | https://doi.org/10.33002/jpg010107
105
Singh | West Bengal Assembly Election 2021: An Analysis
Annex 7: Hooghly District Election Results: Top 3 Candidates by Votes in Each Constituency
Constituency Type Party Candidate Position Votes Margin Arambag SC BJP Madhusudan Bag 1 103,108 7,172
Arambag SC AITC Sujata Mondal 2 95,936 80,971
Arambag SC CPM Sakti Mohon Malik 3 14,965 11,794
Balagarh SC AITC Manoranjan Bapari 1 100,364 5,784
Balagarh SC BJP Subhas Chandra Haldar 2 94,580 74,814
Balagarh SC CPM Mahamaya Mondal 3 19,766 16,661
Champdani GEN AITC Arindam Guin (Bubai) 1 100,972 30,078
Champdani GEN BJP Dilip Singh 2 70,894 47,622
Champdani GEN INC Abdul Mannan 3 23,272 19,925
Chandannagore GEN AITC Indranil Sen 1 86,778 31,029
Chandannagore GEN BJP Deepanjan Kumar Guha
2 55,749 22,047
Chandannagore GEN CPM Gautam Sarkar 3 33,702 30,679
Chanditala GEN AITC Swati Khandoker 1 103,118 41,347
Chanditala GEN BJP Debashish Dasgupta(Yash D Guptaa)
2 61,771 24,610
Chanditala GEN CPM Md. Salim 3 37,161 35,005
Chunchura GEN AITC Asit Mazumder (Tapan)
1 117,104 18,417
Chunchura GEN BJP Locket Chatterjee 2 98,687 69,910
Chunchura GEN AIFB Pranab Kumar Ghosh 3 28,777 24,439
Dhanekhali SC AITC Asima Patra 1 124,776 30,159
Dhanekhali SC BJP Tusar Kumar Majumdar
2 94,617 85,584
Dhanekhali SC INC Anirban Saha 3 9,033 5,803
Goghat SC BJP Biswanath Karak 1 102,227 4,147
Goghat SC AITC Manas Majumdar 2 98,080 83,702
Goghat SC AIFB Shiba Prasad Malick 3 14,378 11,896
Haripal GEN AITC Dr. Karabi Manna 1 110,215 23,072
Haripal GEN BJP Samiran Mitra 2 87,143 71,348
Haripal GEN RSSCMJP
Simal Saren 3 15,795 12,428
Jangipara GEN AITC Snehasis Chakraborty 1 101,885 17,926
Jangipara GEN BJP Debjit Sarkar 2 83,959 66,203
Jangipara GEN RSSCMJP
Sk. Mainuddin 3 17,756 14,716
Khanakul GEN BJP Susanta Ghosh 1 107,403 12,884
Khanakul GEN AITC Munsi Nazbul Karim 2 94,519 85,787
Khanakul GEN RSSCMJP
Faisal Khan 3 8,732 5,454
Pandua GEN AITC Dr. Ratna De Nag 1 102,874 31,858
Pandua GEN BJP Partha Sharma 2 71,016 29,542
Pandua GEN CPM Amjad Hossain Sk. 3 41,474 39,310
Pursurah GEN BJP Biman Ghosh 1 119,334 28,178
Pursurah GEN AITC Dilip Yadav 2 91,156 83,328
Pursurah GEN INC Monika Malik Ghosh 3 7,828 5,040
Saptagram GEN AITC Tapan Dasgupta 1 93,328 9,772
Saptagram GEN BJP Debabrata Biswas 2 83,556 75,224
Saptagram GEN INC Pabitra Deb 3 8,332 5,295

ISSN 2564-212X | Journal of Policy & Governance| 01(01) August 2021 | https://doi.org/10.33002/jpg010107
106
Singh | West Bengal Assembly Election 2021: An Analysis
Constituency Type Party Candidate Position Votes Margin Singur GEN AITC Becharam Manna 1 101,077 25,923
Singur GEN BJP Rabindranath Bhattacharya
2 75,154 45,138
Singur GEN CPM Srijan Bhattacharyya 3 30,016 27,671
Sreerampur GEN AITC Dr. Sudipto Roy 1 93,021 23,433
Sreerampur GEN BJP Kabir Shankar Bose 2 69,588 50,187
Sreerampur GEN INC Alok Ranjan Banerjee 3 19,401 17,001
Tarakeswar GEN AITC Ramendu Sinharay 1 96,698 7,484
Tarakeswar GEN BJP Dr. Swapan Dasgupta 2 89,214 74,619
Tarakeswar GEN CPM Surajit Ghosh 3 14,595 11,843
Uttarpara GEN AITC Kanchan Mullick 1 93,878 35,989
Uttarpara GEN BJP Prabir Kumar Ghosal 2 57,889 15,171
Uttarpara GEN CPM Rajat Banerjee (Bappa) 3 42,718 39,365
Annex 8: Howrah District Election Results: Top 3 Candidates by Votes in Each Constituency
Constituency Type Party Candidate Position Votes Margin Amta GEN AITC Sukanta Kumar Paul 1 102,445 26,205
Amta GEN BJP Debtanu Bhattacharya 2 76,240 51,131
Amta GEN INC Asit Mitra 3 25,109 23,807
Bagnan GEN AITC Arunava Sen (Raja) 1 106,042 30,120
Bagnan GEN BJP Anupam Mallik 2 75,922 61,367
Bagnan GEN CPM Sk Bosir Ahmed 3 14,555 13,007
Bally GEN AITC Rana Chatterjee 1 53,347 6,237
Bally GEN BJP Baishali Dalmiya 2 47,110 25,070
Bally GEN CPM Dipsita Dhar 3 22,040 20,835
Domjur GEN AITC Kalyan Ghosh 1 130,499 42,620
Domjur GEN BJP Rajib Banerjee S/O- Late Dhananjoy Banerjee
2 87,879 65,111
Domjur GEN CPM Uttam Bera 3 22,768 19,913
Howrah Dakshin GEN AITC Nandita Chowdhury 1 116,839 50,569
Howrah Dakshin GEN BJP Rantidev Sengupta 2 66,270 38,983
Howrah Dakshin GEN CPM Sumitro Adhikary 3 27,287 24,339
Howrah Madhya GEN AITC Arup Roy, S/O Late Prabhat Roy
1 111,554 46,547
Howrah Madhya GEN BJP Sanjay Singh 2 65,007 52,065
Howrah Madhya GEN INC Palash Bhandari 3 12,942 10,207
Howrah Uttar GEN AITC Gautam Chowdhuri 1 71,575 5,522
Howrah Uttar GEN BJP Umesh Rai 2 66,053 57,920
Howrah Uttar GEN CPM Pawan Kumar Singh 3 8,133 6,463
Jagatballavpur GEN AITC Sitanath Ghosh 1 116,562 29,196
Jagatballavpur GEN BJP Anupam Ghosh 2 87,366 62,004
Jagatballavpur GEN RSSCMJP
Sk Sabbir Ahmed 3 25,362 22,593
Panchla GEN AITC Gulsan Mullick 1 104,572 32,751
Panchla GEN BJP Mohit Lal Ghanti 2 71,821 36,245
Panchla GEN RSSCMJP
Abdul Jalil Sk 3 35,576 33,165
Sankrail SC AITC Priya Paul 1 111,888 40,427
Sankrail SC BJP Probhakar Pandit 2 71,461 37,317

ISSN 2564-212X | Journal of Policy & Governance| 01(01) August 2021 | https://doi.org/10.33002/jpg010107
107
Singh | West Bengal Assembly Election 2021: An Analysis
Constituency Type Party Candidate Position Votes Margin Sankrail SC CPM Samir Malick 3 34,144 32,294
Shibpur GEN AITC Manoj Tiwary 1 92,372 32,603
Shibpur GEN BJP Rathin Chakrabarty 2 59,769 34,799
Shibpur GEN AIFB Jagannath Bhattacharyya
3 24,970 23,058
Shyampur GEN AITC Kalipada Mandal 1 114,804 31,511
Shyampur GEN BJP Tnusree Chakraborty 2 83,293 62,885
Shyampur GEN INC Amitabha Chakraborti 3 20,408 19,266
Udaynarayanpur GEN AITC Samir Kumar Panja 1 101,510 13,998
Udaynarayanpur GEN BJP Sumit Ranjan Karar 2 87,512 82,334
Udaynarayanpur GEN INC Aloke Koley 3 5,178 3,460
Uluberia Dakshin GEN AITC Pulak Roy 1 101,880 28,438
Uluberia Dakshin GEN BJP Papia Dey (Adhikary) 2 73,442 52,332
Uluberia Dakshin GEN AIFB Sk Kutub Uddin Ahmed
3 21,110 19,636
Uluberia Purba GEN AITC Bidesh Ranjan Bose 1 86,526 17,126
Uluberia Purba GEN BJP Pratyush Mandal 2 69,400 38,942
Uluberia Purba GEN RSSCMJP
Abbas Uddin Khan 3 30,458 28,347
Uluberia Uttar SC AITC Dr. Nirmal Maji 1 91,501 21,003
Uluberia Uttar SC BJP Chiran Bera 2 70,498 51,206
Uluberia Uttar SC CPM Ashok Dalui 3 19,292 18,044
Annex 9: Jalpaiguri District Election Results: Top 3 Candidates by Votes in Each Constituency
Constituency Type Party Candidate Position Votes Margin Alipurduars GEN BJP Suman Kanjilal 1 107,333 16,007
Alipurduars GEN AITC Sourav Chakraborty (Ghutis)
2 91,326 75,675
Alipurduars GEN INC Deba Prasad Roy 3 15,651 13,300
Dabgram-Phulbari GEN BJP Sikha Chatterjee 1 129,088 27,593
Dabgram-Phulbari GEN AITC Goutam Deb 2 101,495 83,497
Dabgram-Phulbari GEN CPM Dilip Singh 3 17,998 14,619
Dhupguri SC BJP Bishnu Pada Ray 1 104,688 4,355
Dhupguri SC AITC Mitali Roy 2 100,333 87,226
Dhupguri SC CPM Pradip Kumar Roy 3 13,107 10,929
Falakata SC BJP Dipak Barman 1 102,993 3,990
Falakata SC AITC Subhash Chandra Roy 2 99,003 88,231
Falakata SC CPM Kshitish Chandra Ray 3 10,772 8,802
Jalpaiguri SC AITC Dr. Pradip Kumar Barma
1 95,668 941
Jalpaiguri SC BJP Soujit Singha (Piku) 2 94,727 70,499
Jalpaiguri SC INC Sukhbilas Barma 3 24,228 20,847
Kalchini ST BJP Bishal Lama 1 103,104 28,576
Kalchini ST AITC Passang Lama 2 74,528 69,046
Kalchini ST INC Avijit Narjinary 3 5,482 3,057
Kumargram ST BJP Manoj Kumar Oraon 1 111,974 11,001
Kumargram ST AITC Leos Kujur (Urao) 2 100,973 89,720
Kumargram ST RSP Kishor Minj 3 11,253 8,535
Madarihat ST BJP Manoj Tigga 1 90,718 29,685
Madarihat ST AITC Rajesh Lakra 2 61,033 53,961

ISSN 2564-212X | Journal of Policy & Governance| 01(01) August 2021 | https://doi.org/10.33002/jpg010107
108
Singh | West Bengal Assembly Election 2021: An Analysis
Constituency Type Party Candidate Position Votes Margin Madarihat ST RSP Subhash Lohar 3 7,072 4,450
Mal ST AITC Bulu Chik Baraik 1 99,086 5,465
Mal ST BJP Mahesh Bagey 2 93,621 82,692
Mal ST CPM Manu Oraon 3 10,929 6,230
Maynaguri SC BJP Kaushik Roy 1 115,306 11,911
Maynaguri SC AITC Manoj Roy 2 103,395 97,635
Maynaguri SC RSP Naresh Chandra Roy 3 5,760 2,665
Nagrakata ST BJP Puna Bhengra 1 83,707 19,038
Nagrakata ST AITC Joseph Munda 2 64,669 53,068
Nagrakata ST INC Sukbir Subba 3 11,601 6,675
Rajganj SC AITC Khageswar Roy 1 104,641 15,773
Rajganj SC BJP Supen Roy 2 88,868 76,760
Rajganj SC CPM Ratan Kumar Roy 3 12,108 8,933
Annex 10: Kolkata Corporation District Election Results: Top 3 Candidates by Votes in Each Constituency
Constituency Type Party Candidate Position Votes Margin Ballygunge GEN AITC Subrata Mukherjee 1 106,585 75,359
Ballygunge GEN BJP Lokenath Chatterjee 2 31,226 22,752
Ballygunge GEN CPM Dr. Fuad Halim 3 8,474 7,157
Beleghata GEN AITC Paresh Paul 1 103,182 67,140
Beleghata GEN BJP Kashinath Biswas 2 36,042 21,997
Beleghata GEN CPM Rajib Biswas 3 14,045 12,481
Bhabanipur GEN AITC Sobhandeb Chattopadhyay
1 73,505 28,719
Bhabanipur GEN BJP Rudranil Ghosh 2 44,786 39,575
Bhabanipur GEN INC Md. Shadab Khan 3 5,211 3,641
Chowrangee GEN AITC Bandyopadhyay Nayna 1 70,101 45,344
Chowrangee GEN BJP Devdutta Maji 2 24,757 10,491
Chowrangee GEN INC Santosh Kumar Pathak 3 14,266 13,054
Entally GEN AITC Swarna Kamal Saha 1 101,709 58,257
Entally GEN BJP Priyanka Tibrewal 2 43,452 39,098
Entally GEN RSSCMJP Md. Iqbal Alam 3 4,354 2,420
Jorasanko GEN AITC Vivek Gupta 1 52,123 12,743
Jorasanko GEN BJP Meena Devi Purohit 2 39,380 34,611
Jorasanko GEN INC Ajmal Khan 3 4,769 3,741
Kashipur-Belgachia
GEN AITC Atin Ghosh 1 27,482 12,786
Kashipur-Belgachia
GEN BJP Sibaji Sinha Roy 2 14,696 8,495
Kashipur-Belgachia
GEN CPM Pratip Dasgupta 3 6,201 5,649
Kolkata Port GEN AITC Firhad Hakim 1 105,543 68,554
Kolkata Port GEN BJP Awadh Kishore Gupta 2 36,989 31,399
Kolkata Port GEN INC Md Mukhtar 3 5,590 4,230
Maniktala GEN AITC Sadhan Pande 1 25,589 8,490
Maniktala GEN BJP Kalyan Chaubey 2 17,099 12,677
Maniktala GEN CPM Rupa Bagchi 3 4,422 3,874
Rashbehari GEN AITC Debasish Kumar 1 65,704 21,414
Rashbehari GEN BJP Lt. Gen. (Dr.) Subrata Saha
2 44,290 33,976

ISSN 2564-212X | Journal of Policy & Governance| 01(01) August 2021 | https://doi.org/10.33002/jpg010107
109
Singh | West Bengal Assembly Election 2021: An Analysis
Constituency Type Party Candidate Position Votes Margin Rashbehari GEN INC Ashutosh Chatterjee 3 10,314 8,652
Shyampukur GEN AITC Dr. Shashi Panja 1 55,785 22,520
Shyampukur GEN BJP Sandipan Biswas 2 33,265 22,437
Shyampukur GEN AIFB Jiban Prakash Saha 3 10,828 9,765
Annex 11: Maldah District Election Results: Top 3 Candidates by Votes in Each Constituency
Constituency Type Party Candidate Position Votes Margin Baishnab Nagar GEN AITC Chandana Sarkar 1 83,061 2,471
Baishnab Nagar GEN BJP Swadhin Kumar Sarkar 2 80,590 43,147
Baishnab Nagar GEN INC Azizul Hoque 3 37,443 35,161
Chanchal GEN AITC Nihar Ranjan Ghosh 1 115,966 67,338
Chanchal GEN BJP Dipankar Ram (Bankat) 2 48,628 17,282
Chanchal GEN INC Asif Mehbub 3 31,346 30,132
Englishbazar GEN BJP Sreerupa Mitra Chaudhury(Nirbhoy Didi)
1 107,755 20,099
Englishbazar GEN AITC Krishnendu Narayan Choudhury
2 87,656 76,703
Englishbazar GEN CPM Koushik Misra(Saheb) 3 10,953 7,757
Gazole SC BJP Chinmoy Deb Barman 1 100,655 1,798
Gazole SC AITC Basanti Barman 2 98,857 84,907
Gazole SC CPM Arun Kumar Biswas 3 13,950 12,007
Habibpur ST BJP Joyel Murmu 1 94,075 19,517
Habibpur ST AITC Prodip Baskey 2 74,558 60,753
Habibpur ST CPM Thakur Tudu 3 13,805 7,909
Harischandrapur GEN AITC Tajmul Hossain 1 122,527 77,473
Harischandrapur GEN BJP Md. Matibur Rahaman 2 45,054 15,658
Harischandrapur GEN INC Alam Mostaque 3 29,396 27,923
Malatipur GEN AITC Abdur Rahim Boxi 1 126,157 91,949
Malatipur GEN BJP Mousumi Das 2 34,208 14,381
Malatipur GEN INC Alberuni Zulkarnain 3 19,827 17,793
Maldaha SC BJP Gopal Chandra Saha 1 93,398 15,456
Maldaha SC AITC Ujjwal Kumar Chowdhury
2 77,942 51,379
Maldaha SC INC Bhupendra Nath Halder (Arjun)
3 26,563 23,745
Manickchak GEN AITC Sabitri Mitra 1 110,234 33,878
Manickchak GEN BJP Gour Chandra Mandal 2 76,356 64,801
Manickchak GEN INC Alam Mottakin 3 11,555 8,812
Mothabari GEN AITC Yeasmin Sabina 1 97,397 56,573
Mothabari GEN BJP Shyamchand Ghosh 2 40,824 23,921
Mothabari GEN INC Dulal Sk 3 16,903 13,318
Ratua GEN AITC Samar Mukherjee 1 130,674 75,650
Ratua GEN BJP Abishek Singhania 2 55,024 38,851
Ratua GEN INC Khatun Najema 3 16,173 7,545
Sujapur GEN AITC Md Abdul Ghani 1 152,445 130,163
Sujapur GEN INC Isha Khan Choudhury 2 22,282 7,493
Sujapur GEN BJP Sk Ziauddin 3 14,789 3,616

ISSN 2564-212X | Journal of Policy & Governance| 01(01) August 2021 | https://doi.org/10.33002/jpg010107
110
Singh | West Bengal Assembly Election 2021: An Analysis
Annex 12: Murshidabad District Election Results: Top 3 Candidates by Votes in Each Constituency
Constituency Type Party Candidate Position Votes Margin Baharampur GEN BJP Subrata Maitra (Kanchan) 1 89,340 26,852
Baharampur GEN AITC Naru Gopal Mukherjee 2 62,488 22,321
Baharampur GEN INC Manoj Chakraborty 3 40,167 37,642
Beldanga GEN AITC Hasanuzzaman Sk 1 112,862 53,832
Beldanga GEN BJP Sumit Ghosh 2 59,030 32,081
Beldanga GEN INC Safiujjaman Seikh 3 26,949 24,981
Bhagabangola GEN AITC Idris Ali 1 153,795 106,008
Bhagabangola GEN CPM Md. Kamal Hossain 2 47,787 31,080
Bhagabangola GEN BJP Mehebub Alam 3 16,707 13,311
Bharatpur GEN AITC Humayun Kabir 1 96,226 43,083
Bharatpur GEN BJP Iman Kalyan Mukherjee 2 53,143 23,027
Bharatpur GEN INC Kamalesh Chatterjee (Gopal)
3 30,116 27,535
Burwan SC AITC Jiban Krishna Saha 1 81,890 2,749
Burwan SC BJP Amiya Kumar Das 2 79,141 66,881
Burwan SC INC Shiladitya Haldar 3 12,260 10,252
Domkal GEN AITC Jafikul Islam 1 127,671 47,229
Domkal GEN CPM Md. Mostafijur Rahaman (Rana)
2 80,442 68,094
Domkal GEN BJP Biyamma Mondal (Rubia) 3 12,348 9,929
Farakka GEN AITC Manirul Islam 1 102,319 59,945
Farakka GEN BJP Ghosh Hemanta 2 42,374 6,169
Farakka GEN INC Mainul Haque 3 36,205 34,558
Hariharpara GEN AITC Niamot Sheikh 1 102,660 14,066
Hariharpara GEN INC Mir Alamgir (Palash) 2 88,594 70,216
Hariharpara GEN BJP Tanmoy Biswas 3 18,378 16,653
Jalangi GEN AITC Abdur Razzak 1 123,840 79,276
Jalangi GEN CPM Saiful Islam Molla 2 44,564 791
Jalangi GEN BJP Chandan Mandal 3 43,773 39,584
Kandi GEN AITC Apurba Sarkar (David) 1 95,399 38,080
Kandi GEN BJP Goutam Roy 2 57,319 29,764
Kandi GEN INC Shafiul Alam Khan (Bonu) 3 27,555 24,424
Khargram SC AITC Ashis Marjit 1 93,255 32,573
Khargram SC BJP Aditya Moulik 2 60,682 33,259
Khargram SC INC Bipad Taran Bagdi 3 27,423 25,738
Lalgola GEN AITC Ali Mohammad 1 107,860 60,707
Lalgola GEN INC Abu Hena 2 47,153 17,689
Lalgola GEN BJP Kalpana Ghosh 3 29,464 27,773
Murshidabad GEN BJP Gouri Sankar Ghosh 1 95,967 2,491
Murshidabad GEN AITC Shaoni Singha Roy 2 93,476 64,641
Murshidabad GEN INC Neajuddin Sk 3 28,835 25,931
Nabagram SC AITC Kanai Chandra Mondal 1 100,455 35,533
Nabagram SC BJP Mohan Halder 2 64,922 25,793
Nabagram SC CPM Kripalini Ghosh 3 39,129 36,500
Naoda GEN AITC Sahina Momtaz Khan 1 117,684 74,153
Naoda GEN BJP Anupam Mandal 2 43,531 11,943
Naoda GEN INC Mosaraf Hossain Mondal (Madhu)
3 31,588 27,195
Raghunathganj GEN AITC Akhruzzaman 1 126,834 98,313

ISSN 2564-212X | Journal of Policy & Governance| 01(01) August 2021 | https://doi.org/10.33002/jpg010107
111
Singh | West Bengal Assembly Election 2021: An Analysis
Constituency Type Party Candidate Position Votes Margin Raghunathganj GEN BJP Golam Modaswer 2 28,521 12,277
Raghunathganj GEN IND Nasir Saikh 3 16,244 3,445
Raninagar GEN AITC Abdul Soumik Hossain 1 134,957 79,702
Raninagar GEN INC Firoza Begam 2 55,255 34,117
Raninagar GEN BJP Mst Masuara Khatun 3 21,138 18,364
Rejinagar GEN AITC Rabiul Alam Chowdhury 1 118,494 68,268
Rejinagar GEN BJP Arabinda Biswas 2 50,226 12,944
Rejinagar GEN INC Kafiruddin Sk 3 37,282 35,722
Sagardighi GEN AITC Subrata Saha 1 95,189 50,206
Sagardighi GEN BJP Khatun Mafuja 2 44,983 8,639
Sagardighi GEN INC Sk M Hasanuzzaman (Bappa)
3 36,344 32,894
Suti GEN AITC Emani Biswas 1 127,351 70,701
Suti GEN BJP Koushik Das 2 56,650 37,890
Suti GEN INC Humayun Reza 3 18,760 10,754
Annex 13: Nadia District Election Results: Top 3 Candidates by Votes in Each Constituency
Constituency Type Party Candidate Position Votes Margin Chakdaha GEN BJP Bankim Chandra Ghosh 1 99,368 11,680
Chakdaha GEN AITC Subhankar Singha (Jishu) 2 87,688 69,876
Chakdaha GEN CPM Narayan Das Gupta 3 17,812 16,129
Chapra GEN AITC Rukbanur Rahman 1 73,866 12,118
Chapra GEN IND Jeber Sekh 2 61,748 3,580
Chapra GEN BJP Kalyan Kumar Nandi 3 58,168 46,446
Haringhata SC BJP Asim Kumar Sarkar 1 97,666 15,200
Haringhata SC AITC Nilima Nag (Mallick) 2 82,466 57,666
Haringhata SC CPM Alakesh Das 3 24,800 23,373
Kaliganj GEN AITC Nasiruddin Ahamed (Lal) 1 111,696 46,987
Kaliganj GEN BJP Abhijit Ghosh 2 64,709 39,633
Kaliganj GEN INC Abul Kashem 3 25,076 23,025
Kalyani SC BJP Ambika Roy 1 97,026 2,206
Kalyani SC AITC Aniruddha Biswas 2 94,820 72,655
Kalyani SC CPM Sabuj Das 3 22,165 19,588
Karimpur GEN AITC Bimalendu Sinha Roy 1 110,911 23,575
Karimpur GEN BJP Samarendranath Ghosh 2 87,336 70,151
Karimpur GEN CPM Prabhas Majumdar 3 17,185 15,716
Krishnaganj SC BJP Ashis Kumar Biswas 1 117,668 21,277
Krishnaganj SC AITC Dr. Tapas Mandal 2 96,391 85,478
Krishnaganj SC CPM Jhunu Baidya 3 10,913 8,814
Krishnanagar Dakshin GEN AITC Ujjal Biswas 1 91,738 9,305
Krishnanagar Dakshin GEN BJP Mahadev Sarkar 2 82,433 66,827
Krishnanagar Dakshin GEN CPM Biswas Sumit 3 15,606 13,441
Krishnanagar Uttar GEN BJP Mukul Roy 1 109,357 35,089
Krishnanagar Uttar GEN AITC Koushani Mukherjee 2 74,268 62,861
Krishnanagar Uttar GEN INC Silvi Saha 3 11,407 9,556
Nabadwip GEN AITC Pundarikakshya Saha 1 102,170 18,571
Nabadwip GEN BJP Sidhartha Shankar Naskar
2 83,599 65,059
Nabadwip GEN CPM Swarnendu Sinha 3 18,540 16,196

ISSN 2564-212X | Journal of Policy & Governance| 01(01) August 2021 | https://doi.org/10.33002/jpg010107
112
Singh | West Bengal Assembly Election 2021: An Analysis
Constituency Type Party Candidate Position Votes Margin Nakashipara GEN AITC Kallol Khan 1 104,812 21,271
Nakashipara GEN BJP Santanu Dey 2 83,541 72,264
Nakashipara GEN IND Tanmay Ganguli 3 11,277 5,912
Palashipara GEN AITC Dr. Manik Bhattacharya 1 110,274 51,336
Palashipara GEN BJP Bibhash Chandra Mandal 2 58,938 32,710
Palashipara GEN CPM S.m. Sadi 3 26,228 24,532
Ranaghat Dakshin SC BJP Mukut Mani Adhikari 1 119,260 16,515
Ranaghat Dakshin SC AITC Barnali Dey Roy 2 102,745 87,621
Ranaghat Dakshin SC CPM Rama Biswas 3 15,124 13,458
Ranaghat Uttar Paschim
GEN BJP Parthasarathi Chatterjee 1 113,637 23,128
Ranaghat Uttar Paschim
GEN AITC Sankar Singha 2 90,509 80,164
Ranaghat Uttar Paschim
GEN INC Bijayendu Biswas (Habu) 3 10,345 8,087
Ranaghat Uttar Purba SC BJP Ashim Biswas 1 116,786 31,782
Ranaghat Uttar Purba SC AITC Samir Kumar Poddar 2 85,004 79,800
Ranaghat Uttar Purba SC RSSCMJP
Dinesh Chandra Biswas 3 5,204 2,845
Santipur GEN BJP Jagannath Sarkar 1 109,722 15,878
Santipur GEN AITC Ajoy Dey 2 93,844 83,996
Santipur GEN INC Ritzu Ghosal 3 9,848 7,463
Tehatta GEN AITC Tapas Kumar Saha 1 97,848 6,915
Tehatta GEN BJP Ashutosh Paul 2 90,933 67,694
Tehatta GEN CPM Subodh Chandra Biswas 3 23,239 21,363
Annex 14: North 24 Parganas District Election Results: Top 3 Candidates by Votes in Each Constituency
Constituency Type Party Candidate Position Votes Margin Amdanga GEN AITC Rafiqur Rahaman 1 88,935 25,480
Amdanga GEN BJP Joydev Manna 2 63,455 12,550
Amdanga GEN RSSCMJP Jamal Uddin 3 50,905 48,581
Ashoknagar GEN AITC Narayan Goswami 1 93,587 23,532
Ashoknagar GEN BJP Tanuja Chakraborty 2 70,055 24,260
Ashoknagar GEN RSSCMJP Tapas Banerjee 3 45,795 44,184
Baduria GEN AITC Abdur Rahim Quazi 1 109,701 56,444
Baduria GEN BJP Sukalyan Baidya 2 53,257 8,026
Baduria GEN INC Abdus Sattar 3 45,231 43,278
Bagdah SC BJP Biswajit Das 1 108,111 9,792
Bagdah SC AITC Paritosh Kumar Saha 2 98,319 90,069
Bagdah SC INC Kirttaniya Prabir (Bapi) 3 8,250 6,010
Baranagar GEN AITC Tapas Roy 1 85,615 35,147
Baranagar GEN BJP Parno Mittra 2 50,468 30,333
Baranagar GEN INC Amal Kumar Mukhopadhyay
3 20,135 17,757
Barasat GEN AITC Chiranjeet Chakrabarti 1 104,431 23,783
Barasat GEN BJP Sankar Chatterjee 2 80,648 46,477
Barasat GEN AIFB Sanjib Chattopadhyay 3 34,171 31,483
Barrackpur GEN AITC Raju Chakraborty (Raj) 1 68,887 9,222
Barrackpur GEN BJP Chandramani Shukla 2 59,665 43,520
Barrackpur GEN CPM Debasish Bhowmick 3 16,145 14,215

ISSN 2564-212X | Journal of Policy & Governance| 01(01) August 2021 | https://doi.org/10.33002/jpg010107
113
Singh | West Bengal Assembly Election 2021: An Analysis
Constituency Type Party Candidate Position Votes Margin Basirhat Dakshin GEN AITC Dr. Saptarshi Banerjee 1 115,873 24,468
Basirhat Dakshin GEN BJP Tarak Nath Ghosh 2 91,405 68,316
Basirhat Dakshin GEN INC Amit Majumdar 3 23,089 21,400
Basirhat Uttar GEN AITC Rafikul Islam Mondal 1 137,216 89,351
Basirhat Uttar GEN RSSCMJP Md Baijid Amin 2 47,865 360
Basirhat Uttar GEN BJP Narayan Chandra Mondal
3 47,505 45,491
Bhatpara GEN BJP Pawan Kumar Singh 1 57,244 13,687
Bhatpara GEN AITC Jitendra Shaw (Jitu) 2 43,557 41,388
Bhatpara GEN INC Dharmendra Shaw 3 2,169 1,009
Bidhannagar GEN AITC Sujit Bose 1 75,912 7,997
Bidhannagar GEN BJP Sabya Sachi Dutta 2 67,915 55,094
Bidhannagar GEN INC Abhisek Banerjee 3 12,821 10,608
Bijpur GEN AITC Subodh Adhikary 1 66,625 13,347
Bijpur GEN BJP Subhranshu Roy 2 53,278 38,788
Bijpur GEN CPM Sukanta Rakshit (Babin) 3 14,490 12,948
Bongaon Dakshin SC BJP Swapan Majumder 1 97,828 2,004
Bongaon Dakshin SC AITC Alo Rani Sarkar 2 95,824 85,755
Bongaon Dakshin SC CPM Tapas Kumar Biswas 3 10,069 8,527
Bongaon Uttar SC BJP Ashok Kirtania 1 97,761 10,488
Bongaon Uttar SC AITC Shyamal Roy 2 87,273 73,222
Bongaon Uttar SC CPM Pijush Kanti Saha 3 14,051 12,218
Deganga GEN AITC Rahima Mondal 1 100,105 32,537
Deganga GEN RSSCMJP Karim Ali 2 67,568 29,122
Deganga GEN BJP Dipika Chattarjee 3 38,446 35,504
Dum Dum GEN AITC Brtya Basu 1 87,999 26,731
Dum Dum GEN BJP Bimalshankar Nanda 2 61,268 30,615
Dum Dum GEN CPM Palash Das 3 30,653 28,614
Dum Dum Uttar GEN AITC Chandrima Bhattacharya
1 95,465 28,499
Dum Dum Uttar GEN BJP Dr. Archana Majumdar 2 66,966 21,238
Dum Dum Uttar GEN CPM Tanmoy Bhattacharya 3 45,728 43,617
Gaighata SC BJP Subrata Thakur 1 100,808 9,578
Gaighata SC AITC Narottam Biswas 2 91,230 76,392
Gaighata SC CPI Kapil Krishna Thakur 3 14,838 13,312
Habra GEN AITC Jyoti Priya Mallick 1 90,533 3,841
Habra GEN BJP Biswajit Sinha 2 86,692 64,698
Habra GEN CPM Rijinandan Biswas 3 21,994 20,704
Haroa GEN AITC Islam Sk Nurul (Haji) 1 130,398 80,978
Haroa GEN RSSCMJP Kutubuddin Fathe 2 49,420 10,914
Haroa GEN BJP Rajendra Saha (Somu) 3 38,506 35,576
Hingalganj SC AITC Debes Mandal 1 104,706 24,916
Hingalganj SC BJP Nemai Das 2 79,790 73,782
Hingalganj SC CPI Ranjan Kumar Mondal 3 6,008 4,272
Jagatdal GEN AITC Somenath Shyam Ichini 1 87,030 18,364
Jagatdal GEN BJP Arindam Bhattacharya 2 68,666 51,918
Jagatdal GEN AIFB Nemai Saha 3 16,748 14,180
Kamarhati GEN AITC Madan Mitra 1 73,845 35,408
Kamarhati GEN BJP Anindya Banerjee 2 38,437 10,127
Kamarhati GEN CPM Sayandeep Mitra 3 28,310 26,757

ISSN 2564-212X | Journal of Policy & Governance| 01(01) August 2021 | https://doi.org/10.33002/jpg010107
114
Singh | West Bengal Assembly Election 2021: An Analysis
Constituency Type Party Candidate Position Votes Margin Khardaha GEN AITC Kajal Sinha 1 89,807 28,140
Khardaha GEN BJP Silbhadra Datta 2 61,667 34,751
Khardaha GEN CPM Debajyoti Das (Subho) 3 26,916 24,501
Madhyamgram GEN AITC Rathin Ghosh 1 112,741 48,126
Madhyamgram GEN BJP Rajasree Rajbanshi 2 64,615 17,867
Madhyamgram GEN RSSCMJP Biswajit Maity 3 46,748 43,596
Minakhan SC AITC Usha Rani Mondal 1 109,818 55,830
Minakhan SC BJP Jayanta Mondal 2 53,988 9,382
Minakhan SC CPM Pradyut Roy 3 44,606 40,666
Naihati GEN AITC Partha Bhowmick 1 77,753 18,855
Naihati GEN BJP Phalguni Patra 2 58,898 43,073
Naihati GEN CPM Indrani Kundu Mukherjee
3 15,825 14,124
Noapara GEN AITC Manju Basu 1 94,203 26,710
Noapara GEN BJP Sunil Singh 2 67,493 43,991
Noapara GEN INC Subhankar Sarkar 3 23,502 20,616
Panihati GEN AITC Nirmal Ghosh 1 86,495 25,177
Panihati GEN BJP Sanmoy Bandyopadhyay 2 61,318 40,149
Panihati GEN INC Tapas Majumder 3 21,169 18,835
Rajarhat Gopalpur GEN AITC Aditi Munshi 1 87,650 25,296
Rajarhat Gopalpur GEN BJP Samik Bhattacharya 2 62,354 37,843
Rajarhat Gopalpur GEN CPM Subhajit Dasgupta 3 24,511 22,253
Rajarhat New Town GEN AITC Tapash Chatterjee 1 127,374 56,432
Rajarhat New Town GEN BJP Bhaskar Roy 2 70,942 39,399
Rajarhat New Town GEN CPM Saptarshi Deb 3 31,543 29,511
Sandeshkhali ST AITC Sukumar Mahata 1 112,450 39,685
Sandeshkhali ST BJP Dr. Bhaskar Sardar 2 72,765 58,378
Sandeshkhali ST RSSCMJP Barun Mahato 3 14,387 11,931
Swarupnagar SC AITC Bina Mondal 1 99,784 34,800
Swarupnagar SC BJP Brindaban Sarkar 2 64,984 21,702
Swarupnagar SC CPM Biswajit Mandal 3 43,282 42,026
Annex 15: Paschim Medinipur District Election Results: Top 3 Candidates by Votes in Each Constituency
Constituency Type Party Candidate Position Votes Margin Binpur ST AITC Debnath Hansda 1 100,277 39,494
Binpur ST BJP Palan Saren 2 60,783 52,430
Binpur ST CPM Dibakar Hansda 3 8,353 2,035
Chandrakona SC AITC Arup Dhara 1 121,846 11,281
Chandrakona SC BJP Sibaram Das 2 110,565 99,764
Chandrakona SC RSSCMJP Gouranga Das 3 10,801 7,895
Dantan GEN AITC Bikram Chandra Pradhan 1 95,209 623
Dantan GEN BJP Saktipada Nayak 2 94,586 88,934
Dantan GEN CPI Sisir Kumar Patra 3 5,652 4,402
Daspur GEN AITC Mamata Bhunia 1 114,753 26,842
Daspur GEN BJP Prasanta Bera 2 87,911 70,866
Daspur GEN CPM Dhruba Sekhar Mandal 3 17,045 15,658
Debra GEN AITC Humayun Kabir 1 95,850 11,226
Debra GEN BJP Bharati Ghosh 2 84,624 63,901
Debra GEN CPM Prankrishna Mondal 3 20,723 19,214

ISSN 2564-212X | Journal of Policy & Governance| 01(01) August 2021 | https://doi.org/10.33002/jpg010107
115
Singh | West Bengal Assembly Election 2021: An Analysis
Constituency Type Party Candidate Position Votes Margin Garbeta GEN AITC Uttara Singha (Hazra) 1 94,928 10,572
Garbeta GEN BJP Madan Ruidas 2 84,356 61,314
Garbeta GEN CPM Ghosh Kumar Tapan 3 23,042 20,323
Ghatal SC BJP Sital Kapat 1 105,812 966
Ghatal SC AITC Shankar Dolai 2 104,846 94,681
Ghatal SC CPM Kamal Chandra Dolui 3 10,165 8,157
Gopiballavpur GEN AITC Dr. Khagendra Nath Mahata
1 104,115 23,768
Gopiballavpur GEN BJP Sanjit Mahata 2 80,347 74,528
Gopiballavpur GEN CPM Prasanta Kumar Das 3 5,819 3,028
Jhargram GEN AITC Birbaha Hansda 1 109,493 38,240
Jhargram GEN BJP Sukhamay Satpathy (Jahar)
2 71,253 60,823
Jhargram GEN CPM Madhuja Sen Roy 3 10,430 6,794
Keshiary ST AITC Paresh Murmu 1 106,366 15,330
Keshiary ST BJP Sonali Murmu Soren 2 91,036 81,766
Keshiary ST CPM Dr. Pulin Bihari Baske 3 9,270 6,700
Keshpur SC AITC Seuli Saha 1 116,992 20,720
Keshpur SC BJP Pritish Ranjan Kuar 2 96,272 82,602
Keshpur SC CPM Rameswar Doloi 3 13,670 10,372
Kharagpur GEN AITC Dinen Roy 1 109,727 36,230
Kharagpur GEN BJP Tapan Bhuya 2 73,497 62,252
Kharagpur GEN CPM Syed Saddam Ali 3 11,245 8,931
Kharagpur Sadar GEN BJP Hiranmoy Chattopadhyaya
1 79,607 3,771
Kharagpur Sadar GEN AITC Pradip Sarkar 2 75,836 65,045
Kharagpur Sadar GEN INC Reeta Sharma 3 10,791 8,148
Medinipur GEN AITC June Maliah 1 121,175 24,397
Medinipur GEN BJP Samit Kumar Dash 2 96,778 83,794
Medinipur GEN CPI Tarun Kumar Ghosh 3 12,984 9,056
Narayangarh GEN AITC Atta Surja Kanta 1 100,894 2,416
Narayangarh GEN BJP Rama Prasad Giri 2 98,478 85,249
Narayangarh GEN CPM Tapas Sinha 3 13,229 10,396
Nayagram ST AITC Dulal Murmu 1 100,903 22,754
Nayagram ST BJP Bakul Murmu 2 78,149 72,286
Nayagram ST CPM Haripada Saren 3 5,863 2,777
Pingla GEN AITC Ajit Maity 1 112,435 6,656
Pingla GEN BJP Antara Bhattacharyya 2 105,779 98,676
Pingla GEN INC Samir Roy 3 7,103 5,030
Sabang GEN AITC Manas Ranjan Bhunia 1 112,098 9,864
Sabang GEN BJP Amulya Maity 2 102,234 84,791
Sabang GEN INC Chiranjib Bhowmik 3 17,443 15,909
Salboni GEN AITC Srikanta Mahata 1 126,020 32,644
Salboni GEN BJP Rajib Kundu 2 93,376 73,517
Salboni GEN CPM Ghosh Susanta 3 19,859 17,216

ISSN 2564-212X | Journal of Policy & Governance| 01(01) August 2021 | https://doi.org/10.33002/jpg010107
116
Singh | West Bengal Assembly Election 2021: An Analysis
Annex 16: Purba Medinipur District Election Results: Top 3 Candidates by Votes in Each Constituency
Constituency Type Party Candidate Position Votes Margin Bhagabanpur GEN BJP Rabindranath Maity 1 121,480 27,549
Bhagabanpur GEN AITC Ardhendu Maity 2 93,931 88,657
Bhagabanpur GEN INC Shiu Maiti 3 5,274 4,255
Chandipur GEN AITC Soham Chakraborty 1 109,770 13,472
Chandipur GEN BJP Pulak Kanti Guria 2 96,298 86,461
Chandipur GEN CPM Ashis Kumar Guchhait 3 9,837 8,472
Egra GEN AITC Tarun Kumar Maity 1 125,763 18,491
Egra GEN BJP Arup Dash 2 107,272 102,186
Egra GEN INC Manas K. Karmahapatra 3 5,086 3,693
Haldia SC BJP Tapasi Mondal 1 104,126 15,008
Haldia SC AITC Swapan Naskar 2 89,118 66,430
Haldia SC CPM Kar Paik Manika 3 22,688 20,766
Kanthi Dakshin GEN BJP Arup Kumar Das 1 98,477 10,293
Kanthi Dakshin GEN AITC Jyotirmoy Kar 2 88,184 82,170
Kanthi Dakshin GEN CPI Anurup Panda 3 6,014 4,878
Kanthi Uttar GEN BJP Sumita Sinha 1 113,524 9,330
Kanthi Uttar GEN AITC Tarun Kumar Jana 2 104,194 97,690
Kanthi Uttar GEN CPM Sutanu Maity 3 6,504 5,012
Khejuri SC BJP Santanu Pramanik 1 110,407 17,965
Khejuri SC AITC Partha Pratim Das 2 92,442 84,630
Khejuri SC CPM Himangshu Das 3 7,812 6,676
Mahisadal GEN AITC Tilak Kumar Chakraborty
1 101,986 2,386
Mahisadal GEN BJP Biswanath Banerjee 2 99,600 85,804
Mahisadal GEN RSSCMJP Bikram Chatterjee 3 13,796 12,031
Moyna GEN BJP Ashoke Dinda 1 108,109 1,260
Moyna GEN AITC Sangram Kumar Dolai 2 106,849 101,741
Moyna GEN INC Manik Bhaumik 3 5,108 3,434
Nandakumar GEN AITC Sukumar De 1 108,181 5,406
Nandakumar GEN BJP Adhikary Nilanjan 2 102,775 89,993
Nandakumar GEN CPM Karuna Sankar Bhowmik 3 12,782 11,309
Nandigram GEN BJP Adhikari Suvendu 1 110,764 1,956
Nandigram GEN AITC Mamata Banerjee 2 108,808 102,541
Nandigram GEN CPM Minakshi Mukherjee 3 6,267 5,177
Panskura Paschim GEN AITC Phiroja Bibi 1 111,705 8,889
Panskura Paschim GEN BJP Sintu Senapati 2 102,816 87,692
Panskura Paschim GEN CPI Chittaranjan Dasthakur 3 15,124 13,787
Panskura Purba GEN AITC Biplab Roy Chowdhury 1 91,213 9,660
Panskura Purba GEN BJP Debabrata Pattanayek 2 81,553 60,836
Panskura Purba GEN CPM Ibrahim Ali Sk 3 20,717 19,259
Patashpur GEN AITC Uttam Barik 1 105,299 9,994
Patashpur GEN BJP Ambujaksha Mahanti 2 95,305 88,674
Patashpur GEN CPI Saikat Giri 3 6,631 5,770
Ramnagar GEN AITC Akhil Giri 1 112,622 12,517
Ramnagar GEN BJP Swadesh Ranjan Nayak 2 100,105 93,354
Ramnagar GEN CPM Sabyasachi Jana 3 6,751 5,518
Tamluk GEN AITC Saumen K. Mahapatra 1 108,243 793
Tamluk GEN BJP Hare Krishna Bera 2 107,450 92,732
Tamluk GEN CPI Goutam Panda 3 14,718 11,962

ISSN 2564-212X | Journal of Policy & Governance| 01(01) August 2021 | https://doi.org/10.33002/jpg010107
117
Singh | West Bengal Assembly Election 2021: An Analysis
Annex 17: Purulia District Election Results: Top 3 Candidates by Votes in Each Constituency
Constituency Type Party Candidate Position Votes Margin Baghmundi GEN AITC Sushanta Mahato 1 75,905 13,969
Baghmundi GEN AJSUP Ashutosh Mahato 2 61,936 10,890
Baghmundi GEN INC Nepal Chandra Mahato 3 51,046 39,204
Balarampur GEN BJP Baneswar Mahato 1 89,521 423
Balarampur GEN AITC Shantiram Mahato 2 89,098 80,203
Balarampur GEN INC Uttam Kumar Bandyopadhyay
3 8,895 6,454
Bandwan ST AITC Rajib Lochan Saren 1 113,337 18,831
Bandwan ST BJP Parcy Murmu 2 94,506 72,302
Bandwan ST CPM Besra Susanta Kumar 3 22,204 17,137
Joypur GEN BJP Nara Hari Mahato 1 74,380 12,200
Joypur GEN INC Phanibhushan Kumar 2 62,180 26,751
Joypur GEN IND Dibyajoti Singh Deo 3 35,429 16,016
Kashipur GEN BJP Kamalakanta Hansda 1 92,938 7,387
Kashipur GEN AITC Swapan Kumar Beltharia
2 85,551 74,624
Kashipur GEN CPM Mallika Mahata 3 10,927 8,526
Manbazar ST AITC Sandhyarani Tudu 1 103,298 15,516
Manbazar ST BJP Gouri Singh Sardar 2 87,782 70,933
Manbazar ST CPM Yaminikanta Mandi 3 16,849 14,558
Para SC BJP Nadiar Chand Bouri 1 87,347 4,007
Para SC AITC Umapada Bauri 2 83,340 69,659
Para SC CPM Swapan Kumar Bauri 3 13,681 10,024
Purulia GEN BJP Sudip Kumar Mukherjee
1 89,733 7,018
Purulia GEN AITC Sujoy Banerjee 2 82,715 57,719
Purulia GEN INC Partha Pratim Banerjee 3 24,996 22,408
Raghunathpur SC BJP Vivekananda Bauri 1 95,770 5,438
Raghunathpur SC AITC Bouri Hazari 2 90,332 75,594
Raghunathpur SC CPM Ganesh Bouri 3 14,738 10,909
Annex 18: South 24 Parganas District Election Results: Top 3 Candidates by Votes in Each Constituency
Constituency Type Party Candidate Position Votes Margin Baruipur Paschim GEN AITC Biman Banerjee 1 121,006 61,910
Baruipur Paschim GEN BJP Debopam Chattopadhyaya (Babu)
2 59,096 33,457
Baruipur Paschim GEN CPM Md Lahek Ali 3 25,639 23,870
Baruipur Purba SC AITC Bivas Sardar (Vobo) 1 123,243 49,641
Baruipur Purba SC BJP Chandan Mondal 2 73,602 52,135
Baruipur Purba SC CPM Swapan Naskar 3 21,467 19,612
Basanti SC AITC Shyamal Mondal 1 111,453 50,642
Basanti SC BJP Ramesh Majhi 2 60,811 24,123
Basanti SC RSP Subhas Naskar 3 36,688 34,781
Behala Paschim GEN AITC Partha Chatterjee 1 114,778 50,884
Behala Paschim GEN BJP Srabanti Chatterjee 2 63,894 16,385
Behala Paschim GEN CPM Nihar Bhakta 3 47,509 45,076
Behala Purba GEN AITC Ratna Chatterjee 1 110,968 37,428
Behala Purba GEN BJP Payel Sarkar 2 73,540 43,368

ISSN 2564-212X | Journal of Policy & Governance| 01(01) August 2021 | https://doi.org/10.33002/jpg010107
118
Singh | West Bengal Assembly Election 2021: An Analysis
Constituency Type Party Candidate Position Votes Margin
Behala Purba GEN CPM Samita Har Chowdhury
3 30,172 27,337
Bhangore GEN RSSCMJP Md. Nawsad Siddique 1 109,237 26,151
Bhangore GEN AITC Karim Rezaul 2 83,086 44,360
Bhangore GEN BJP Soumi Hati 3 38,726 33,796
Bishnupur(Sc) SC AITC Dilip Mondal 1 136,509 58,832
Bishnupur(Sc) SC BJP Agniswar Naskar 2 77,677 59,682
Bishnupur(Sc) SC CPM Jhuma Kayal 3 17,995 15,286
Budge Budge GEN AITC Ashok Kumar Deb 1 122,357 44,714
Budge Budge GEN BJP Dr. Tarun Kumar Adak
2 77,643 66,834
Budge Budge GEN INC Sk Mujibar Rahaman 3 10,809 8,074
Canning Paschim SC AITC Paresh Ram Das 1 111,059 35,243
Canning Paschim SC BJP Arnab Roy 2 75,816 62,426
Canning Paschim SC IND Meghnath Halder 3 13,390 1,482
Canning Purba GEN AITC Saokat Molla 1 122,301 53,007
Canning Purba GEN RSSCMJP Gazi Shahabuddin Siraji
2 69,294 34,791
Canning Purba GEN BJP Kalipada Naskar 3 34,503 31,817
Diamond Harbour GEN AITC Pannalal Halder 1 98,478 16,996
Diamond Harbour GEN BJP Dipak Kumar Halder 2 81,482 42,763
Diamond Harbour GEN CPM Pratik Ur Rahaman 3 38,719 37,134
Falta GEN AITC Sankar Kumar Naskar 1 116,713 39,928
Falta GEN BJP Bidhan Parui 2 76,785 69,316
Falta GEN INC Abdur Razzak Molla 3 7,469 5,793
Gosaba SC AITC Jayanta Naskar 1 105,723 23,709
Gosaba SC BJP Barun Pramanik (Chitta)
2 82,014 77,143
Gosaba SC RSP Anil Chandra Mondal 3 4,871 3,600
Jadavpur GEN AITC Debabrata Majumdar (Malay)
1 98,100 38,869
Jadavpur GEN CPM Dr. Sujan Chakraborty
2 59,231 6,092
Jadavpur GEN BJP Rinku Naskar 3 53,139 50,409
Jaqynagar SC AITC Biswanath Das 1 104,952 38,683
Jaqynagar SC BJP Rabin Sardar 2 66,269 48,901
Jaqynagar SC CPM Apurba Pramanik (Apu)
3 17,368 7,945
Kakdwip GEN AITC Manturam Pakhira 1 114,493 25,302
Kakdwip GEN BJP Dipankar Jana 2 89,191 76,957
Kakdwip GEN INC Indranil Rout 3 12,234 10,604
Kasba GEN AITC Ahmed Javed Khan 1 121,372 63,622
Kasba GEN BJP Dr. Indranil Khan 2 57,750 18,570
Kasba GEN CPM Shatarup Ghosh 3 39,180 36,704
Kulpi GEN AITC Jogaranjan Halder 1 96,577 33,818
Kulpi GEN BJP Pranab Kumar Mallik 2 62,759 32,798
Kulpi GEN RSSCMJP Siraj Uddin Gazi 3 29,961 28,276
Kultali SC AITC Ganesh Chandra Mondal
1 117,238 47,177
Kultali SC BJP Mintu Halder 2 70,061 50,051
Kultali SC CPM Ram Sankar Halder 3 20,010 4,704

ISSN 2564-212X | Journal of Policy & Governance| 01(01) August 2021 | https://doi.org/10.33002/jpg010107
119
Singh | West Bengal Assembly Election 2021: An Analysis
Constituency Type Party Candidate Position Votes Margin Magrahat Paschim GEN AITC Gias Uddin Molla 1 97,006 46,941
Magrahat Paschim GEN BJP Dhurjati Saha (Manas) 2 50,065 9,380
Magrahat Paschim GEN RSSCMJP Maidul Islam Molla 3 40,685 38,399
Magrahat Purba SC AITC Namita Saha 1 110,945 54,079
Magrahat Purba SC BJP Chandan Kumar Naskar
2 56,866 23,044
Magrahat Purba SC CPM Chandan Saha 3 33,822 32,342
Maheshtala GEN AITC Dulal Chandra Das 1 124,008 57,949
Maheshtala GEN BJP Umesh Das 2 66,059 40,783
Maheshtala GEN CPM Pravat Chowdhury 3 25,276 23,227
Mandirbazar SC AITC Joydeb Halder 1 95,834 23,492
Mandirbazar SC BJP Dilip Kumar Jatua 2 72,342 46,945
Mandirbazar SC RSSCMJP Sanchay Kumar Sarkar 3 25,397 23,575
Metiaburuz GEN AITC Abdul Khaleque Molla 1 151,066 119,604
Metiaburuz GEN BJP Ramjit Prasad 2 31,462 24,073
Metiaburuz GEN RSSCMJP Nuruzaman Molla 3 7,389 4,381
Patharpratima GEN AITC Samir Kumar Jana 1 120,181 22,134
Patharpratima GEN BJP Asit Kumar Haldar 2 98,047 87,865
Patharpratima GEN INC Shukdeb Bera 3 10,182 8,518
Raidighi GEN AITC Aloke Jaldata 1 115,707 35,568
Raidighi GEN BJP Santanu Bapuli 2 80,139 43,208
Raidighi GEN CPM Kanti Ganguly 3 36,931 34,069
Sagar GEN AITC Bankim Chandra Hazra 1 129,000 29,846
Sagar GEN BJP Kamila Bikash 2 99,154 90,058
Sagar GEN CPM Sk Muklesur Rahaman 3 9,096 8,071
Satgachia GEN AITC Mohan Chandra Naskar
1 118,635 23,318
Satgachia GEN BJP Chandan Pal 2 95,317 79,097
Satgachia GEN CPM Goutam Pal 3 16,220 14,595
Sonarpur Dakshin GEN AITC Arundhuti Maitra (Lovely)
1 109,222 26,181
Sonarpur Dakshin GEN BJP Anjana Basu 2 83,041 51,263
Sonarpur Dakshin GEN CPI Shuvam Banerjee 3 31,778 29,228
Sonarpur Uttar GEN AITC Firdousi Begum 1 119,957 36,090
Sonarpur Uttar GEN BJP Ranjan Baidya 2 83,867 54,467
Sonarpur Uttar GEN CPM Monalisa Sinha 3 29,400 27,286
Tollygunj GEN AITC Aroop Biswas 1 101,440 50,080
Tollygunj GEN BJP Babul Supriyo 2 51,360 10,763
Tollygunj GEN CPM Debdut Ghosh 3 40,597 38,287

ISSN 2564-212X | Journal of Policy & Governance| 01(01) August 2021 | https://doi.org/10.33002/jpg010107
120
Singh | West Bengal Assembly Election 2021: An Analysis
Annex 19: Uttar Dinajpur District Election Results: Top 3 Candidates by Votes in Each Constituency
Constituency Type Party Candidate Position Votes Margin Chakulia GEN AITC Azad Minhajul Arfin 1 86,311 33,837
Chakulia GEN BJP Sachin Prasad 2 52,474 23,770
Chakulia GEN AIFB Ali Imran Ramz 3 28,704 25,979
Chopra GEN AITC Hamidul Rahaman 1 124,923 64,905
Chopra GEN BJP Md. Shahin Akhter 2 60,018 47,739
Chopra GEN CPM Anwarul Haque 3 12,279 9,113
Goalpokhar GEN AITC Md. Ghulam Rabbani 1 105,649 73,514
Goalpokhar GEN BJP Md. Ghulam Sarwar 2 32,135 12,744
Goalpokhar GEN INC Masood Md. Naseem Ahsen
3 19,391 17,375
Hemtabad SC AITC Satyajit Barman 1 116,425 27,215
Hemtabad SC BJP Chandima Roy 2 89,210 79,757
Hemtabad SC CPM Bhupen Barman 3 9,453 7,293
Islampur GEN AITC Abdul Karim Chowdhary
1 100,131 37,440
Islampur GEN BJP Saumyaroop Mandal 2 62,691 59,230
Islampur GEN INC Sadiqul Islam 3 3,461 1,485
Itahar GEN AITC Mosaraf Hussen 1 114,645 43,975
Itahar GEN BJP Amit Kumar Kundu 2 70,670 65,762
Itahar GEN CPI Srikumar Mukherjee 3 4,908 3,668
Kaliaganj SC BJP Soumen Roy 1 116,768 21,820
Kaliaganj SC AITC Tapan Deb Singha 2 94,948 78,178
Kaliaganj SC INC Pravash Sarkar 3 16,770 12,766
Karandighi GEN AITC Goutam Paul 1 116,594 36,626
Karandighi GEN BJP Subhas Chandra Sinha S/O: Haranarayan Sinha
2 79,968 70,822
Karandighi GEN AIFB Md. Hafizul Iqbal 3 9,146 6,697
Raiganj GEN BJP Krishna Kalyani 1 79,775 20,748
Raiganj GEN AITC Agarwal Kanaia Lal 2 59,027 41,829
Raiganj GEN INC Mohit Sengupta 3 17,198 14,730
ISSN 2564-212X | Journal of Policy & Governance| 01(01) August 2021 | https://doi.org/10.33002/jpg010107
121
Singh | West Bengal Assembly Election 2021: An Analysis
AUTHOR’ DECLARATIONS AND ESSENTIAL ETHICAL COMPLIANCES Author’ Contributions (in accordance with ICMJE criteria for authorship) This article is 100% contributed by the sole author. She conceived and designed the research or analysis, collected the data, contributed to data analysis & interpretation, wrote the article, performed critical revision of the article/paper, edited the article, and supervised and administered the field work. Funding No funding was available for the research conducted for and writing of this paper. Research involving human bodies (Helsinki Declaration) Has this research used human subjects for experimentation? No Research involving animals (ARRIVE Checklist) Has this research involved animal subjects for experimentation? No Research involving Plants No plant was used to conduct this research. Research on Indigenous Peoples and/or Traditional Knowledge Has this research involved Indigenous Peoples as participants or respondents? No
(Optional) PRISMA (Preferred Reporting Items for Systematic Reviews and Meta-Analyses) Have authors complied with PRISMA standards? No Competing Interests/Conflict of Interest Author has no competing financial, professional, or personal interests from other parties or in publishing this manuscript. RIGHTS AND PERMISSIONS Open Access. This article is licensed under a Creative Commons Attribution 4.0 International License, which permits use, sharing, adaptation, distribution and reproduction in any medium or format, as long as you give appropriate credit to the original author(s) and the source, provide a link to the Creative Commons license, and indicate if changes were made. The images or other third-party material in this article are included in the article's Creative Commons license, unless indicated otherwise in a credit line to the material. If material is not included in the article's Creative Commons license and your intended use is not permitted by statutory regulation or exceeds the permitted use, you will need to obtain permission directly from the copyright holder. To view a copy of this license, visit http://creativecommons.org/licenses/by/4.0/.