soft_v12_n12_2019_paged.pdf - IARIA Journals
202
-
Upload
khangminh22 -
Category
Documents
-
view
0 -
download
0
Transcript of soft_v12_n12_2019_paged.pdf - IARIA Journals


The International Journal on Advances in Software is published by IARIA.
ISSN: 1942-2628
journals site: http://www.iariajournals.org
contact: [email protected]
Responsibility for the contents rests upon the authors and not upon IARIA, nor on IARIA volunteers,
staff, or contractors.
IARIA is the owner of the publication and of editorial aspects. IARIA reserves the right to update the
content for quality improvements.
Abstracting is permitted with credit to the source. Libraries are permitted to photocopy or print,
providing the reference is mentioned and that the resulting material is made available at no cost.
Reference should mention:
International Journal on Advances in Software, issn 1942-2628
vol. 12, no. 1 & 2, year 2019, http://www.iariajournals.org/software/
The copyright for each included paper belongs to the authors. Republishing of same material, by authors
or persons or organizations, is not allowed. Reprint rights can be granted by IARIA or by the authors, and
must include proper reference.
Reference to an article in the journal is as follows:
<Author list>, “<Article title>”
International Journal on Advances in Software, issn 1942-2628
vol. 12, no. 1 & 2, year 2019,<start page>:<end page> , http://www.iariajournals.org/software/
IARIA journals are made available for free, proving the appropriate references are made when their
content is used.
Sponsored by IARIA
www.iaria.org
Copyright © 2019 IARIA

International Journal on Advances in Software
Volume 12, Number 1 & 2, 2019
Editor-in-Chief
Petre Dini, IARIA, USA
Editorial Advisory Board
Hermann Kaindl, TU-Wien, Austria
Herwig Mannaert, University of Antwerp, Belgium
Subject-Expert Associated Editors
Sanjay Bhulai, Vrije Universiteit Amsterdam, the Netherlands (DATA ANALYTICS)
Stephen Clyde, Utah State University, USA (SOFTENG + ICSEA)
Emanuele Covino, Università degli Studi di Bari Aldo Moro, Italy (COMPUTATION TOOLS)
Robert (Bob) Duncan, University of Aberdeen, UK (ICCGI & CLOUD COMPUTING)
Venkat Naidu Gudivada, East Carolina University, USA (ALLDATA)
Andreas Hausotter, Hochschule Hannover - University of Applied Sciences and Arts, Germany (SERVICE
COMPUTATION)
Sergio Ilarri, University of Zaragoza, Spain (DBKDA + FUTURE COMPUTING)
Christopher Ireland, The Open University, UK (FASSI + VALID + SIMUL)
Alex Mirnig, University of Salzburg, Austria (CONTENT + PATTERNS)
Jaehyun Park, Incheon National University (INU), South Korea (ACHI)
Claus-Peter Rückemann, Leibniz Universität Hannover / Westfälische Wilhelms-Universität Münster / North-
German Supercomputing Alliance (HLRN), Germany (GEOProcessing + ADVCOMP + INFOCOMP)
Markus Ullmann, Federal Office for Information Security / University of Applied Sciences Bonn-Rhine-Sieg,
Germany (VEHICULAR + MOBILITY)
Editorial Board
Witold Abramowicz, The Poznan University of Economics, Poland
Abdelkader Adla, University of Oran, Algeria
Syed Nadeem Ahsan, Technical University Graz, Austria / Iqra University, Pakistan
Marc Aiguier, École Centrale Paris, France
Rajendra Akerkar, Western Norway Research Institute, Norway
Zaher Al Aghbari, University of Sharjah, UAE
Riccardo Albertoni, Istituto per la Matematica Applicata e Tecnologie Informatiche “Enrico Magenes” Consiglio
Nazionale delle Ricerche, (IMATI-CNR), Italy / Universidad Politécnica de Madrid, Spain
Ahmed Al-Moayed, Hochschule Furtwangen University, Germany
Giner Alor Hernández, Instituto Tecnológico de Orizaba, México
Zakarya Alzamil, King Saud University, Saudi Arabia
Frederic Amblard, IRIT - Université Toulouse 1, France
Vincenzo Ambriola , Università di Pisa, Italy

Andreas S. Andreou, Cyprus University of Technology - Limassol, Cyprus
Annalisa Appice, Università degli Studi di Bari Aldo Moro, Italy
Philip Azariadis, University of the Aegean, Greece
Thierry Badard, Université Laval, Canada
Muneera Bano, International Islamic University - Islamabad, Pakistan
Fabian Barbato, Technology University ORT, Montevideo, Uruguay
Peter Baumann, Jacobs University Bremen / Rasdaman GmbH Bremen, Germany
Gabriele Bavota, University of Salerno, Italy
Grigorios N. Beligiannis, University of Western Greece, Greece
Noureddine Belkhatir, University of Grenoble, France
Jorge Bernardino, ISEC - Institute Polytechnic of Coimbra, Portugal
Rudolf Berrendorf, Bonn-Rhein-Sieg University of Applied Sciences - Sankt Augustin, Germany
Ateet Bhalla, Independent Consultant, India
Fernando Boronat Seguí, Universidad Politecnica de Valencia, Spain
Pierre Borne, Ecole Centrale de Lille, France
Farid Bourennani, University of Ontario Institute of Technology (UOIT), Canada
Narhimene Boustia, Saad Dahlab University - Blida, Algeria
Hongyu Pei Breivold, ABB Corporate Research, Sweden
Carsten Brockmann, Universität Potsdam, Germany
Antonio Bucchiarone, Fondazione Bruno Kessler, Italy
Georg Buchgeher, Software Competence Center Hagenberg GmbH, Austria
Dumitru Burdescu, University of Craiova, Romania
Martine Cadot, University of Nancy / LORIA, France
Isabel Candal-Vicente, Universidad del Este, Puerto Rico
Juan-Vicente Capella-Hernández, Universitat Politècnica de València, Spain
Jose Carlos Metrolho, Polytechnic Institute of Castelo Branco, Portugal
Alain Casali, Aix-Marseille University, France
Yaser Chaaban, Leibniz University of Hanover, Germany
Savvas A. Chatzichristofis, Democritus University of Thrace, Greece
Antonin Chazalet, Orange, France
Jiann-Liang Chen, National Dong Hwa University, China
Shiping Chen, CSIRO ICT Centre, Australia
Wen-Shiung Chen, National Chi Nan University, Taiwan
Zhe Chen, College of Computer Science and Technology, Nanjing University of Aeronautics and Astronautics, China
PR
Po-Hsun Cheng, National Kaohsiung Normal University, Taiwan
Yoonsik Cheon, The University of Texas at El Paso, USA
Lau Cheuk Lung, INE/UFSC, Brazil
Robert Chew, Lien Centre for Social Innovation, Singapore
Andrew Connor, Auckland University of Technology, New Zealand
Rebeca Cortázar, University of Deusto, Spain
Noël Crespi, Institut Telecom, Telecom SudParis, France
Carlos E. Cuesta, Rey Juan Carlos University, Spain
Duilio Curcio, University of Calabria, Italy
Mirela Danubianu, "Stefan cel Mare" University of Suceava, Romania
Paulo Asterio de Castro Guerra, Tapijara Programação de Sistemas Ltda. - Lambari, Brazil

Cláudio de Souza Baptista, University of Campina Grande, Brazil
Maria del Pilar Angeles, Universidad Nacional Autonónoma de México, México
Rafael del Vado Vírseda, Universidad Complutense de Madrid, Spain
Giovanni Denaro, University of Milano-Bicocca, Italy
Nirmit Desai, IBM Research, India
Vincenzo Deufemia, Università di Salerno, Italy
Leandro Dias da Silva, Universidade Federal de Alagoas, Brazil
Javier Diaz, Rutgers University, USA
Nicholas John Dingle, University of Manchester, UK
Roland Dodd, CQUniversity, Australia
Aijuan Dong, Hood College, USA
Suzana Dragicevic, Simon Fraser University- Burnaby, Canada
Cédric du Mouza, CNAM, France
Ann Dunkin, Palo Alto Unified School District, USA
Jana Dvorakova, Comenius University, Slovakia
Hans-Dieter Ehrich, Technische Universität Braunschweig, Germany
Jorge Ejarque, Barcelona Supercomputing Center, Spain
Atilla Elçi, Aksaray University, Turkey
Khaled El-Fakih, American University of Sharjah, UAE
Gledson Elias, Federal University of Paraíba, Brazil
Sameh Elnikety, Microsoft Research, USA
Fausto Fasano, University of Molise, Italy
Michael Felderer, University of Innsbruck, Austria
João M. Fernandes, Universidade de Minho, Portugal
Luis Fernandez-Sanz, University of de Alcala, Spain
Felipe Ferraz, C.E.S.A.R, Brazil
Adina Magda Florea, University "Politehnica" of Bucharest, Romania
Wolfgang Fohl, Hamburg Universiy, Germany
Simon Fong, University of Macau, Macau SAR
Gianluca Franchino, Scuola Superiore Sant'Anna, Pisa, Italy
Naoki Fukuta, Shizuoka University, Japan
Martin Gaedke, Chemnitz University of Technology, Germany
Félix J. García Clemente, University of Murcia, Spain
José García-Fanjul, University of Oviedo, Spain
Felipe Garcia-Sanchez, Universidad Politecnica de Cartagena (UPCT), Spain
Michael Gebhart, Gebhart Quality Analysis (QA) 82, Germany
Tejas R. Gandhi, Virtua Health-Marlton, USA
Andrea Giachetti, Università degli Studi di Verona, Italy
Afzal Godil, National Institute of Standards and Technology, USA
Luis Gomes, Universidade Nova Lisboa, Portugal
Diego Gonzalez Aguilera, University of Salamanca - Avila, Spain
Pascual Gonzalez, University of Castilla-La Mancha, Spain
Björn Gottfried, University of Bremen, Germany
Victor Govindaswamy, Texas A&M University, USA
Gregor Grambow, AristaFlow GmbH, Germany
Carlos Granell, European Commission / Joint Research Centre, Italy

Christoph Grimm, University of Kaiserslautern, Austria
Michael Grottke, University of Erlangen-Nuernberg, Germany
Vic Grout, Glyndwr University, UK
Ensar Gul, Marmara University, Turkey
Richard Gunstone, Bournemouth University, UK
Zhensheng Guo, Siemens AG, Germany
Ismail Hababeh, German Jordanian University, Jordan
Shahliza Abd Halim, Lecturer in Universiti Teknologi Malaysia, Malaysia
Herman Hartmann, University of Groningen, The Netherlands
Jameleddine Hassine, King Fahd University of Petroleum & Mineral (KFUPM), Saudi Arabia
Tzung-Pei Hong, National University of Kaohsiung, Taiwan
Peizhao Hu, NICTA, Australia
Chih-Cheng Hung, Southern Polytechnic State University, USA
Edward Hung, Hong Kong Polytechnic University, Hong Kong
Noraini Ibrahim, Universiti Teknologi Malaysia, Malaysia
Anca Daniela Ionita, University "POLITEHNICA" of Bucharest, Romania
Chris Ireland, Open University, UK
Kyoko Iwasawa, Takushoku University - Tokyo, Japan
Mehrshid Javanbakht, Azad University - Tehran, Iran
Wassim Jaziri, ISIM Sfax, Tunisia
Dayang Norhayati Abang Jawawi, Universiti Teknologi Malaysia (UTM), Malaysia
Jinyuan Jia, Tongji University. Shanghai, China
Maria Joao Ferreira, Universidade Portucalense, Portugal
Ahmed Kamel, Concordia College, Moorhead, Minnesota, USA
Teemu Kanstrén, VTT Technical Research Centre of Finland, Finland
Nittaya Kerdprasop, Suranaree University of Technology, Thailand
Ayad ali Keshlaf, Newcastle University, UK
Nhien An Le Khac, University College Dublin, Ireland
Sadegh Kharazmi, RMIT University - Melbourne, Australia
Kyoung-Sook Kim, National Institute of Information and Communications Technology, Japan
Youngjae Kim, Oak Ridge National Laboratory, USA
Cornel Klein, Siemens AG, Germany
Alexander Knapp, University of Augsburg, Germany
Radek Koci, Brno University of Technology, Czech Republic
Christian Kop, University of Klagenfurt, Austria
Michal Krátký, VŠB - Technical University of Ostrava, Czech Republic
Narayanan Kulathuramaiyer, Universiti Malaysia Sarawak, Malaysia
Satoshi Kurihara, Osaka University, Japan
Eugenijus Kurilovas, Vilnius University, Lithuania
Alla Lake, Linfo Systems, LLC, USA
Fritz Laux, Reutlingen University, Germany
Luigi Lavazza, Università dell'Insubria, Italy
Fábio Luiz Leite Júnior, Universidade Estadual da Paraiba,Brazil
Alain Lelu, University of Franche-Comté / LORIA, France
Cynthia Y. Lester, Georgia Perimeter College, USA
Clement Leung, Hong Kong Baptist University, Hong Kong

Weidong Li, University of Connecticut, USA
Corrado Loglisci, University of Bari, Italy
Francesco Longo, University of Calabria, Italy
Sérgio F. Lopes, University of Minho, Portugal
Pericles Loucopoulos, Loughborough University, UK
Alen Lovrencic, University of Zagreb, Croatia
Qifeng Lu, MacroSys, LLC, USA
Xun Luo, Qualcomm Inc., USA
Stephane Maag, Telecom SudParis, France
Ricardo J. Machado, University of Minho, Portugal
Maryam Tayefeh Mahmoudi, Research Institute for ICT, Iran
Nicos Malevris, Athens University of Economics and Business, Greece
Herwig Mannaert, University of Antwerp, Belgium
José Manuel Molina López, Universidad Carlos III de Madrid, Spain
Francesco Marcelloni, University of Pisa, Italy
Eda Marchetti, Consiglio Nazionale delle Ricerche (CNR), Italy
Gerasimos Marketos, University of Piraeus, Greece
Abel Marrero, Bombardier Transportation, Germany
Adriana Martin, Universidad Nacional de la Patagonia Austral / Universidad Nacional del Comahue, Argentina
Goran Martinovic, J.J. Strossmayer University of Osijek, Croatia
Paulo Martins, University of Trás-os-Montes e Alto Douro (UTAD), Portugal
Stephan Mäs, Technical University of Dresden, Germany
Constandinos Mavromoustakis, University of Nicosia, Cyprus
Jose Merseguer, Universidad de Zaragoza, Spain
Seyedeh Leili Mirtaheri, Iran University of Science & Technology, Iran
Lars Moench, University of Hagen, Germany
Yasuhiko Morimoto, Hiroshima University, Japan
Antonio Navarro Martín, Universidad Complutense de Madrid, Spain
Filippo Neri, University of Naples, Italy
Muaz A. Niazi, Bahria University, Islamabad, Pakistan
Natalja Nikitina, KTH Royal Institute of Technology, Sweden
Roy Oberhauser, Aalen University, Germany
Pablo Oliveira Antonino, Fraunhofer IESE, Germany
Rocco Oliveto, University of Molise, Italy
Sascha Opletal, Universität Stuttgart, Germany
Flavio Oquendo, European University of Brittany/IRISA-UBS, France
Claus Pahl, Dublin City University, Ireland
Marcos Palacios, University of Oviedo, Spain
Constantin Paleologu, University Politehnica of Bucharest, Romania
Kai Pan, UNC Charlotte, USA
Yiannis Papadopoulos, University of Hull, UK
Andreas Papasalouros, University of the Aegean, Greece
Rodrigo Paredes, Universidad de Talca, Chile
Päivi Parviainen, VTT Technical Research Centre, Finland
João Pascoal Faria, Faculty of Engineering of University of Porto / INESC TEC, Portugal
Fabrizio Pastore, University of Milano - Bicocca, Italy

Kunal Patel, Ingenuity Systems, USA
Óscar Pereira, Instituto de Telecomunicacoes - University of Aveiro, Portugal
Willy Picard, Poznań University of Economics, Poland
Jose R. Pires Manso, University of Beira Interior, Portugal
Sören Pirk, Universität Konstanz, Germany
Meikel Poess, Oracle Corporation, USA
Thomas E. Potok, Oak Ridge National Laboratory, USA
Christian Prehofer, Fraunhofer-Einrichtung für Systeme der Kommunikationstechnik ESK, Germany
Ela Pustułka-Hunt, Bundesamt für Statistik, Neuchâtel, Switzerland
Mengyu Qiao, South Dakota School of Mines and Technology, USA
Kornelije Rabuzin, University of Zagreb, Croatia
J. Javier Rainer Granados, Universidad Politécnica de Madrid, Spain
Muthu Ramachandran, Leeds Metropolitan University, UK
Thurasamy Ramayah, Universiti Sains Malaysia, Malaysia
Prakash Ranganathan, University of North Dakota, USA
José Raúl Romero, University of Córdoba, Spain
Henrique Rebêlo, Federal University of Pernambuco, Brazil
Hassan Reza, UND Aerospace, USA
Elvinia Riccobene, Università degli Studi di Milano, Italy
Daniel Riesco, Universidad Nacional de San Luis, Argentina
Mathieu Roche, LIRMM / CNRS / Univ. Montpellier 2, France
José Rouillard, University of Lille, France
Siegfried Rouvrais, TELECOM Bretagne, France
Claus-Peter Rückemann, Leibniz Universität Hannover / Westfälische Wilhelms-Universität Münster / North-
German Supercomputing Alliance, Germany
Djamel Sadok, Universidade Federal de Pernambuco, Brazil
Ismael Sanz, Universitat Jaume I, Spain
M. Saravanan, Ericsson India Pvt. Ltd -Tamil Nadu, India
Idrissa Sarr, University of Cheikh Anta Diop, Dakar, Senegal / University of Quebec, Canada
Patrizia Scandurra, University of Bergamo, Italy
Daniel Schall, Vienna University of Technology, Austria
Rainer Schmidt, Munich University of Applied Sciences, Germany
Sebastian Senge, TU Dortmund, Germany
Isabel Seruca, Universidade Portucalense - Porto, Portugal
Kewei Sha, Oklahoma City University, USA
Simeon Simoff, University of Western Sydney, Australia
Jacques Simonin, Institut Telecom / Telecom Bretagne, France
Cosmin Stoica Spahiu, University of Craiova, Romania
George Spanoudakis, City University London, UK
Cristian Stanciu, University Politehnica of Bucharest, Romania
Lena Strömbäck, SMHI, Sweden
Osamu Takaki, Japan Advanced Institute of Science and Technology, Japan
Antonio J. Tallón-Ballesteros, University of Seville, Spain
Wasif Tanveer, University of Engineering & Technology - Lahore, Pakistan
Ergin Tari, Istanbul Technical University, Turkey
Steffen Thiel, Furtwangen University of Applied Sciences, Germany

Jean-Claude Thill, Univ. of North Carolina at Charlotte, USA
Pierre Tiako, Langston University, USA
Božo Tomas, HT Mostar, Bosnia and Herzegovina
Davide Tosi, Università degli Studi dell'Insubria, Italy
Guglielmo Trentin, National Research Council, Italy
Dragos Truscan, Åbo Akademi University, Finland
Chrisa Tsinaraki, Technical University of Crete, Greece
Roland Ukor, FirstLinq Limited, UK
Torsten Ullrich, Fraunhofer Austria Research GmbH, Austria
José Valente de Oliveira, Universidade do Algarve, Portugal
Dieter Van Nuffel, University of Antwerp, Belgium
Shirshu Varma, Indian Institute of Information Technology, Allahabad, India
Konstantina Vassilopoulou, Harokopio University of Athens, Greece
Miroslav Velev, Aries Design Automation, USA
Tanja E. J. Vos, Universidad Politécnica de Valencia, Spain
Krzysztof Walczak, Poznan University of Economics, Poland
Yandong Wang, Wuhan University, China
Rainer Weinreich, Johannes Kepler University Linz, Austria
Stefan Wesarg, Fraunhofer IGD, Germany
Wojciech Wiza, Poznan University of Economics, Poland
Martin Wojtczyk, Technische Universität München, Germany
Hao Wu, School of Information Science and Engineering, Yunnan University, China
Mudasser F. Wyne, National University, USA
Zhengchuan Xu, Fudan University, P.R.China
Yiping Yao, National University of Defense Technology, Changsha, Hunan, China
Stoyan Yordanov Garbatov, Instituto de Engenharia de Sistemas e Computadores - Investigação e
Desenvolvimento, INESC-ID, Portugal
Weihai Yu, University of Tromsø, Norway
Wenbing Zhao, Cleveland State University, USA
Hong Zhu, Oxford Brookes University, UK
Qiang Zhu, The University of Michigan - Dearborn, USA

International Journal on Advances in Software
Volume 12, Numbers 1 & 2, 2019
CONTENTS
pages: 1 - 10Components and Computational Modules for Knowledge Mapping: A Case of Spatial KnowledgeClaus-Peter Rückemann, Westfälische Wilhelms-Universität Münster (WWU); Knowledge in Motion, DIMF; LeibnizUniversität Hannover, Germany
pages: 11 - 29Fuzzy Outlier Detection by Applying the ECF-Means Algorithm. A clustering ensemble approach for mining largedatasetsGaetano Zazzaro, CIRA (Italian Aerospace Research Centre), ItalyAngelo Martone, CIRA (Italian Aerospace Research Centre), Italy
pages: 30 - 45Current Progress in Cross-Platform Application Development - Evaluation of Frameworks for Mobile ApplicationDevelopmentJan Christoph, Hochschule Pforzheim, GermanyRaniel Rösch, Hochschule Pforzheim, GermanyThomas Schuster, Hochschule Pforzheim, GermanyLukas Waidelich, Hochschule Pforzheim, Germany
pages: 46 - 55Holistic Analysis of the Effectiveness of a Software Engineering Teaching ApproachJose Carlos Meireles Metrolho, R&D Unit in Digital Services, Applications and Content - Polytechnic Institute ofCastelo Branco, PortugalFernando Reinaldo Ribeiro, R&D Unit in Digital Services, Applications and Content - Polytechnic Institute of CasteloBranco, Portugal
pages: 56 - 67Managing Technical Debt in Timed-boxed Software Processes: Quantitative EvaluationsLuigi Lavazza, Università degli Studi dell’Insubria, ItalySandro Morasca, Università degli Studi dell’Insubria, ItalyDavide Tosi, Università degli Studi dell’Insubria, Italy
pages: 68 - 90An Explorative Study on Motion as Feedback: Using Semi-Autonomous Robots in Domestic SettingsDiana Saplacan, Department of Informatics, University of Oslo, NorwayJo Herstad, Department of Informatics, University of Oslo, Norway
pages: 91 - 102Automatic Schema Matching as a Complex Adaptive System: a new Approach based on Agent-based Modelingand SimulationHicham Assoudi, UQAM, CanadaHakim Lounis, UQAM, Canada
pages: 103 - 124Trend Discovery and Social Recommendation in Support of Documentary Production

Giorgos Mitsis, Institute of Communications and Computer Systems, GreeceNikos Kalatzis, Institute of Communications and Computer Systems, GreeceIoanna Roussaki, Institute of Communications and Computer Systems, GreeceSymeon Papavassiliou, Institute of Communications and Computer Systems, Greece
pages: 125 - 151Rethinking Enterprise Architecture Frameworks for the Digital Age: The Digital Diamond Framework and EA ToolRoy Oberhauser, Aalen University, Germany
pages: 152 - 165Model-centric and Phase-spanning Software Architecture for Surveys - Report on the Tool Coast and LessonsLearnedThomas M. Prinz, Course Evaluation Service, Friedrich Schiller University Jena, GermanySebastian Apel, Chair of Software Technology, Friedrich Schiller University Jena, GermanyRaphael Bernhardt, Course Evaluation Service, Friedrich Schiller University Jena, GermanyJan Plötner, Course Evaluation Service, Friedrich Schiller University Jena, GermanyAnja Vetterlein, Course Evaluation Service, Friedrich Schiller University Jena, Germany
pages: 166 - 178Facilitating a Statewide GIS Metadata Standard through Training, Outreach and Programmatic MetadataEvaluationTimothy Mulrooney, North Carolina Central University, United States
pages: 179 - 190A Constructivist Grounded Theory of Trust in Agile Scrum TeamsTrish O'Connell, Galway-Mayo Institute of Technology, IrelandOwen Molloy, National University of Ireland, Galway, Ireland

1
International Journal on Advances in Software, vol 12 no 1 & 2, year 2019, http://www.iariajournals.org/software/
2019, © Copyright by authors, Published under agreement with IARIA - www.iaria.org
Components and Computational Modules for Knowledge Mapping:
A Case of Spatial Knowledge
Claus-Peter RuckemannWestfalische Wilhelms-Universitat Munster (WWU);
Knowledge in Motion, DIMF, Germany;Leibniz Universitat Hannover
Email: [email protected]
Abstract—This paper presents the research results from anextended case study and implementation for the identificationand spatial mapping of arbitrary non-georeferenced input dataentities. The implemented components and methods are basedon the methodology of knowledge mapping. The methodologyenables to implement and realise methods for the creation ofnew context for objects and entities, e.g., creating support for thetasks of knowledge mining and decision making. The focus ofthe methodology is the mapping of knowledge and its facilities ofcreating substantially different practical method implementationsfor identical input objects while aiming on comparable tasks.The main goal of these case studies and implementations is todemonstrate how to create two different automatable methodsfor knowledge mapping to be applied on each input object,based on a functional architecture of sustainable long-term multi-disciplinary knowledge resources and components, which providesupport for a wide range of flexibility for knowledge mapping anddifferent computational solutions. The implementation cases arebased on automated computational cases of spatial visualisation.In addition, the results from any of these realisations are usedto further valorise new knowledge and continuously improve thecontributing long-term knowledge resources.
Keywords–Knowledge Mapping; Spatial Knowledge; ContextCreation Algorithms; Universal Decimal Classification; AdvancedData-centric Computing.
I. INTRODUCTION
Knowledge Mining and decision making are facilities, whichare required for a large number of application scenarios butwhich are, nevertheless, in practice widely based on plainmethods of data mining only.
This extended research is based on the results from thecollaborations on computation and Knowledge Mapping fordata entities, which was presented at the INFOCOMP 2018conference in Barcelona, Spain [1]. The methodology goesbeyond creation of plain methods and the practically verylimited view of ‘data’, which is commonly used. The pa-per illuminates the view of the Principles of SuperordinateKnowledge [2], which is not restricted to a plain data viewbut focusses on advanced knowledge based context creationfor arbitrary knowledge. The principles are general, comparedto simpler approaches. Therefore, the principles should not beintermixed with ‘data’ based mining approaches.
There are no other, comparable realisations known sofar, which use standardised, universal conceptual knowledgeframeworks for creating context, e.g., spatial context.
This paper presents context-methods for multi-dimensionalcontext creation based on the new methodology of Knowl-edge Mapping. The methodology allows to create knowl-edge mapping and new context for arbitrary objects, basedon knowledge, e.g., conceptual knowledge. The results aremethods based on an architecture allowing advanced knowl-edge mapping, including flexible deployment of computationalsequences and an implementation of resources and applicationcomponents.
This paper is organised as follows. Section II introducesto the motivation, state-of-the-art, and the base of the new ap-proach. Section III presents the architecture, frame of universalknowledge, target input and associated universal knowledge.Section IV presents an exemplary approach, with the details oftwo well comparable but different case study implementationsand all essential components. Section V discusses the resultsof the case studies, evaluates them based on the conceptualknowledge, computational sequences, and architectures anddelivers a computational footprint in context with referredknowledge. Section VI summarises the results and lessonslearned, conclusions, and future work.
II. MOTIVATION AND APPROACH
Resources of knowledge are steadily increasing in numberand size and so is the complexity and heterogeneity of theassociated knowledge. In most cases, it is not possible tofind satisfying results even though the basis of data is rapidlygrowing. New approaches are needed in order to find answersto challenging knowledge mining requests.
Concepts used in the past mostly provided non consistentand insufficient approaches when dealing with the complex-ity of knowledge. In most cases, those concepts basicallyconsider dealing with ‘data’ and claim to result in ‘knowl-edge’ or even ‘wisdom’ of some kind [3]. For example,the Data-Information-Knowledge-Wisdom (DIKW) approachwidely used in Data Mining (DM) lacks an understanding ofdata being only one aspect of knowledge [4].
Implementations are mostly neglecting the knowledge asso-ciated with originary resources and referred knowledge andtherefore deal with the applications and isolated technicalfeatures, which are neither able to be integrated for improvingresults and resources nor can they provide reasonable freedomof solutions.

2
International Journal on Advances in Software, vol 12 no 1 & 2, year 2019, http://www.iariajournals.org/software/
2019, © Copyright by authors, Published under agreement with IARIA - www.iaria.org
Concepts like DIKW are lacking a profound relation of dataand information [5]. Terms like “knowledge hierarchy” and“information hierarchy” are more misleading than constructive,especially when we have to deal with complex and long-termresources. Approaches used with data warehousing [6] on thatbasis, e.g., Extract, Transform, Load (ETL) and Extract, Load,Transform (ELT) for integrating data newly also resulted inrequiring hybrid approaches but have not been based on aprofound understanding of knowledge.
It should be explicitly stated, as commonly not sufficientlyunderstood: The knowledge based concept is superior to aplain, data based concept. Mining and management based onthe data concept is by far insufficient due to its most limitedanalysis approaches where accuracy is restricted to attributeddata, e.g., simple data mining procedures and character stringcomparisons.
The described deficits are a major motivation for the long-term research presented in this paper. The fundaments ofterminology and of understanding knowledge are layed outby Aristotle [7][8], being an essential part of ‘Ethics’ [9].Information sciences can very much benefit from Aristotle’sfundaments and a knowledge-centric approach [10] but forbuilding holistic and sustainable solutions they need to gobeyond the available technology-based approaches and hypoth-esis [11] as analysed in Platons’ Phaidon.
Making a distinction and creating interfaces between meth-ods and applications [12], the principles are based on themethodology of knowledge mapping [13], which fundamentsare not outlined here again. The implementation can make useof objects and conceptual knowledge [14] and shows beingable to build a base for applications scenarios like associativeprocessing [15] and advanced knowledge discovery [16].
Considering this state-of-the-art, the methodology deployedin this research and the accompanying implementation ofmethods consequently focusses on the complex knowledgebasis, which allows to integrate the different aspects of knowl-edge and the complexity of knowledge context. In result,the methodology allows to create methods focussing on al-ternative contexts based on a wide range of criteria andsolutions provided by knowledge context. Implementations areconsidered knowledge-centric, with data being one comple-mentary facet of knowledge. Therefore, the methodology and,in consequence, the method implementations based on thismethodology, are vastly scalable. Scalability support rangesfrom fixed associations to arbitrarily fuzzy understanding.
III. ARCHITECTURE AND UNIVERSAL KNOWLEDGE
An understanding of the essence and complexity of uni-versal, multi-disciplinary knowledge can be achieved by tak-ing a closer look on classification. The state-of-the-art ofclassifying ‘universal knowledge’ is the Universal DecimalClassification (UDC) and its solid background and long history.The LX knowledge resources’ structure and the classificationreferences [17] based on UDC [18] are essential means forthe processing workflows and evaluation of the knowledgeobjects and containers. Both components provide strong multi-disciplinary and multi-lingual support.
For this part of the research, all small unsorted excerpts ofthe knowledge resources objects only refer to main UDC-basedclasses, which for this publication are taken from the Multilin-gual Universal Decimal Classification Summary (UDCC Pub-lication No. 088) [19] released by the UDC Consortium underthe Creative Commons Attribution Share Alike 3.0 license [20](first release 2009, subsequent update 2012). Nevertheless, theresearch conducted here in deploying knowledge provides anew solution not precedented by comparable approaches, fromthe view of methodology and implemented methods.
A. ArchitectureThe implementation architecture is shown in Figure 1.
OriginaryApplications
and
Referenced Resources
Integrated Resources
Containers
Resources Resources
Sources,
and
Components
Comparative Mapping
Spatial Mapping
Spatial Visualisation
Object
Collections
Knowledge Resources
Spatial Visualisation Media Generator
Conceptual Mapping
is_in_country
country_codes
affiliation_desc
is_affiliation
affiliation_georef
spatial_vis_poi
spatial_vis_poly_cc
country_codes_desc
Sources
Data
Data Object
(unstructured or structured)
Check ModuleConfiguration
Get Object EntityData Object Entity
(unstructured or structured)Configuration
Get Module
Object Data Resources
(c) Rückemann 2017
Data Join ModuleConfiguration
pre−filters
post−filters
Resolver ModuleConfiguration
Conceptual ModuleConfiguration
Spatial ModuleConfiguration
Vis. ModuleConfiguration
Object
Object Entity Context Creation
Object Entity Mapping
Object Entity Analysis
New Object Context Environment
Figure 1. Architecture for mapping arbitrary objects / entities to new contextenvironments, allowing different methods (yellow/red) for implementations.
The illustration of the architecture for knowledge mappingof arbitrary objects and entities to new object context environ-ments also takes into account that the context of objects andtheir entities can contain many different facets and referencesfrom different origin.
The target for the case studies is a knowledge mappingproviding two different mapping views. The spatial visualisa-tion is an illustrative step, providing insights on new context.

3
International Journal on Advances in Software, vol 12 no 1 & 2, year 2019, http://www.iariajournals.org/software/
2019, © Copyright by authors, Published under agreement with IARIA - www.iaria.org
Data and modules are provided by Knowledge Resources,originary resources, and application resources and components.The architecture is also aware of allowing different methods(e.g., highlighted in yellow/red) for implementations regardingthe same resources and target.
The core of the knowledge mapping in this case consistsof comparative mapping, conceptual mapping, and spatialmapping. All the examples in the case studies are based onthe methodology of knowledge mapping [13]. The integrationof originary sources provides a generic view for terms like‘knowledge integration’ and ‘knowledge representation’ assuch might be used in less generic approaches.
Here, in the mapping and the consecutive steps (here, avisualisation for illustration purposes), we do have the majordifferences of different methods for implementing alternativeways for the same resources and target.
The following case studies, all from real productive imple-mentations, demonstrate the different characteristics of imple-mentations based on the same universal knowledge. From amultitude of application scenarios, a term to location associa-tion providing ways of knowledge mapping of textual contextto space and place were choosen for case studies.
B. Target Data and Universal KnowledgeThe next passages show some major steps for creating
spatially linked context from plain text, which were used inthe workflows required for the cases.
For demonstration, a publicly available central target objectwas used for input to both implemented methods realised inthis paper and for data entity analysis.
1) Target data: Natural language target: The singledata object in this case study implementation (Figure 2)contains mostly unstructured text [21] markup, and formattinginstructions.
1 <!DOCTYPE html PUBLIC "-//W3C//DTD XHTML 1.0 Transitional//EN" ... <title>GEOProcessing 2018 ...</title>
2 ..., Leibniz Universität Hannover / WestfälischeWilhelms-Universität Münster / North-German Supercomputing Alliance
(HLRN), Germany ...3 ..., Technion - Israel Institute of Technology, Haifa, Israel<br />4 ..., Consiglio Nazionale delle Ricerche - Genova, Italy <br />5 ..., Centre for Research in Geomatics - Laval University, Quebec, Canada <
br />6 ..., Curtin University, Australia <br />7 ..., Lomonosov Moscow State University, Russia <br />8 ..., FH Aachen, Germany</p>9 ...
10 ..., Erciyes University, Turkey <br />11 ..., Synodon Inc., Canada<br />12 ..., Royal Observatory of Belgium (ROB), Belgium<br />13 ..., Oracle America Inc., USA <br />14 ..., Environmental Systems Research Institute (ESRI), USA<br />15 ..., OSCARS, France<br />16 ..., Geospatial technologies/Oracle Server Technologies - Sophia Antipolis,
France<br />17 ..., University of Coimbra/INESC Coimbra, Portugal</p>18 ...19 <p>..., Universiti Tun Hussein Onm Malaysia, Malaysia<br />20 ..., Cardiff University, Wales, UK<br />21 ..., Universidade Federal do Rio Grande, Brazil<br />22 ..., GIS unit Kuwait Oil Company, Kuwait<br />23 ..., Middle East Technical University, Turkey<br />24 ..., University of Sharjah, UAE<br />25 ..., Georgia State University, USA<br />26 ..., Centre for Research in Geomatics - Laval University, Quebec,
Canada<br />27 ..., Environmental Systems Research Institute (ESRI), USA<br />28 ..., ORT University - Montevideo, Uruguay<br /> ...
Figure 2. Mapping target: Single object, unstructured text containingvarious natural language references to locations (excerpt).
The sample object is the publicly available committees’ page ofthe Tenth International Conference on Advanced GeographicInformation Systems, Applications, and Services (GEOPro-cessing 2018), in Rome [21].
Large passages of text not relevant for demonstration of theprinciples were reduced to ellipses. The spatial visualisationcan result from identifying and mapping entities in the text ofan object to various knowledge context. The identification ofentities is resulting from automated analysis.
2) Knowledge Resources: Location, integrated: Figure 3shows the object content after automatically integrated withthe Knowledge Resources via a join module.
1 GEOProcessing 2018 [...]: ...2 ..., Leibniz Universitat Hannover / Westfalische Wilhelms-Universitat Munster
/ North-German Supercomputing Alliance (HLRN), Germany ...3 ..., Technion - Israel Institute of Technology, Haifa, Israel4 ..., Consiglio Nazionale delle Ricerche - Genova, Italy5 ..., Centre for Research in Geomatics - Laval University, Quebec, Canada6 ..., Curtin University, Australia7 ..., Lomonosov Moscow State University, Russia8 ..., FH Aachen, Germany9 ...
10 ..., Erciyes University, Turkey11 ..., Synodon Inc., Canada12 ..., Royal Observatory of Belgium (ROB), Belgium13 ..., Oracle America Inc., USA14 ..., Environmental Systems Research Institute (ESRI), USA15 ..., OSCARS, France16 ..., Geospatial technologies/Oracle Server Technologies, Sophia Antipolis,
France17 ..., University of Coimbra/INESC Coimbra, Portugal18 ...19 ..., Universiti Tun Hussein Onm Malaysia, Malaysia20 ..., Cardiff University, Wales, UK21 ..., Universidade Federal do Rio Grande, Brazil22 ..., GIS unit Kuwait Oil Company, Kuwait23 ..., Middle East Technical University, Turkey24 ..., University of Sharjah, UAE25 ..., Georgia State University, USA26 ..., Centre for Research in Geomatics - Laval University, Quebec, Canada27 ..., Environmental Systems Research Institute (ESRI), USA28 ..., ORT University - Montevideo, Uruguay ...
Figure 3. Object instance representation after integration into knowledgeresources, containing source references and locations (excerpt).
The Object Entity Mapping facilitates to associate relevant ob-jects, e.g., via conceptual knowledge and comparative methods.
The objects and their entities can contain any knowledge,e.g., factual and conceptual knowledge. In this case, dealingwith space and place data, the references, e.g., referred con-ceptual knowledge, carried in objects are most relevant.
The complement knowledge used with the mapping con-tains multi-disciplinary and multi-lingual knowledge, it cancontain names, places, and synonyms in different languagesas well as extensive context references, dynamically usablegeo-coordinates, geo-classification, and so on. The comple-ment knowledge is continuously improved and extended bymanual means, integration of resources as well as by trainingprocedures.
3) UDC: Place and Space: Tables I, II, and III showexample excerpts of relevant main classification codes anddetails of the UDC references used for conceptual mapping.For conceptual knowledge of place and spatial context theimplementations requires to provide references to classificationcodes. The UDC provides references based on the commonauxiliaries of place of the UDC [22] as excerpted here forfacets of place and space, physiographic designation, andplaces from ancient to modern world.
4
International Journal on Advances in Software, vol 12 no 1 & 2, year 2019, http://www.iariajournals.org/software/
2019, © Copyright by authors, Published under agreement with IARIA - www.iaria.org
TABLE I. CONCEPTUAL MAPPING REFERENCES WITH UDC CODES OFSPATIAL FEATURES / PLACE: AUXILIARIES OF PLACE (EXCERPT).
UDC Code Description
UDC:(1/9) Common auxiliaries of place.UDC:(1) Place and space in general. Localization. OrientationUDC:(100) Universal as to place. International. All countries in generalUDC:(1-0/-9) Special auxiliary subdivision for boundaries and
spatial forms of various kindsUDC:(1-0) ZonesUDC:(1-1) Orientation. Points of the compass. Relative positionUDC:(1-2) Lowest administrative units. LocalitiesUDC:(1-5) Dependent or semi-dependent territoriesUDC:(1-6) States or groupings of states from various points of viewUDC:(1-7) Places and areas according to privacy, publicness and
other special featuresUDC:(1-8) Location. Source. Transit. DestinationUDC:(1-9) Regionalization according to specialized points of view
TABLE II. CONCEPTUAL MAPPING REFERENCES WITH UDC CODES OFSPATIAL FEATURES / PLACE: PHYSIOGRAPHIC DESIGNATION (EXCERPT).
UDC Code Description
UDC:(2) Physiographic designationUDC:(20) EcosphereUDC:(21) Surface of the Earth in general.
Land areas in particular.Natural zones and regions
UDC:(23) Above sea level. Surface relief. Above groundgenerally. Mountains
UDC:(24) Below sea level. Underground. SubterraneanUDC:(25) Natural flat ground (at, above or below sea level). The
ground in its natural condition, cultivated or inhabitedUDC:(26) Oceans, seas and interconnectionsUDC:(28) Inland watersUDC:(29) The world according to physiographic featuresUDC:(3/9) Individual places of the ancient and modern world
TABLE III. CONCEPTUAL MAPPING REFERENCES WITH UDC CODES OFSPATIAL FEATURES / PLACE: PLACES (EXCERPT).
UDC Code Description
UDC:(3) Places of the ancient and mediaeval worldUDC:(4/9) Countries and places of the modern world
The references, e.g., classification, facets, concordances, andtextual description, are usable in all the procedures and stepsand allow to consider and implement arbitrary flexibility offuzziness. Entry points to relevant and associated knowledgemay be in any disciplinary context due to the consistentframework of the UDC and the multi-disciplinary and multi-lingual Knowledge Resources. During the research, two com-putational sequences were implemented for illustration of suchprocedures. These sequences show different characteristics incontent and context, as well as different characteristics inarchitecture and computational requirements.
IV. IMPLEMENTATION: MULTIPLE WAYS TO SPACE
The following case studies present two different methods forimplementing object/entity knowledge mapping to space andplace targets and discuss major insights. Computational knowl-edge mapping procedures are presented for both methods, as
well as the visualisation of the results. The computationalapplication components are part of the available resources.
The Generic Mapping Tools (GMT) [23] suite applicationcomponents were used for handling the spatial data, applyingrelated criteria, and for the visualisation. All provided spatialpresentations in the following examples are using the sameMercator projection (region: -180/180/-60/84) in order toprovide a common base for the comparison.
A. Space and place: Affiliation based knowledge mappingThis method implements the knowledge mapping based
on affiliations. The implementation is done according to theimplementation architecture (Figure 1).
1) Computational sequence: Table IV gives the computa-tional sequence of the core computational procedures.
TABLE IV. AFFILIATION BASED MAPPING: COMPUTATIONAL SEQUENCEOF CORE COMPUTATIONAL PROCEDURES AND REFERRED MODULES.
Procedure Module
Comparative Mapping is_affiliationConfiguration
Conceptual Mapping affiliation_descConfiguration
Spatial Mapping affiliation_georefConfiguration
The means, regarding space and place: Affiliation mapping,affiliation association via conceptual knowledge and textualdescription, and affiliation georeferencing.
The module is_affiliation is responsible for thecomparative mapping. The module affiliation_descis responsible for the conceptual mapping. The moduleaffiliation_georef is responsible for the spatial mapping.
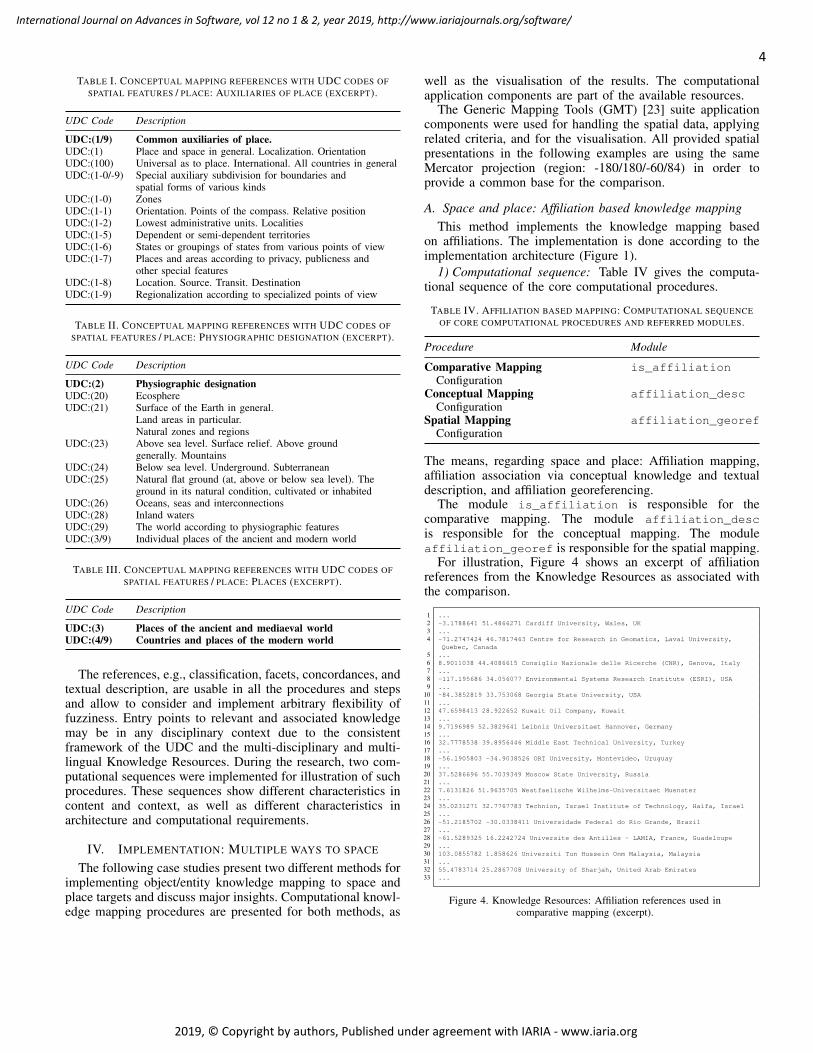
For illustration, Figure 4 shows an excerpt of affiliationreferences from the Knowledge Resources as associated withthe comparison.
1 ...2 -3.1788641 51.4866271 Cardiff University, Wales, UK3 ...4 -71.2747424 46.7817463 Centre for Research in Geomatics, Laval University,
Quebec, Canada5 ...6 8.9011038 44.4086615 Consiglio Nazionale delle Ricerche (CNR), Genova, Italy7 ...8 -117.195686 34.056077 Environmental Systems Research Institute (ESRI), USA9 ...
10 -84.3852819 33.753068 Georgia State University, USA11 ...12 47.6598413 28.922652 Kuwait Oil Company, Kuwait13 ...14 9.7196989 52.3829641 Leibniz Universitaet Hannover, Germany15 ...16 32.7778538 39.8956446 Middle East Technical University, Turkey17 ...18 -56.1905803 -34.9038526 ORT University, Montevideo, Uruguay19 ...20 37.5286696 55.7039349 Moscow State University, Russia21 ...22 7.6131826 51.9635705 Westfaelische Wilhelms-Universitaet Muenster23 ...24 35.0231271 32.7767783 Technion, Israel Institute of Technology, Haifa, Israel25 ...26 -51.2185702 -30.0338411 Universidade Federal do Rio Grande, Brazil27 ...28 -61.5289325 16.2242724 Universite des Antilles - LAMIA, France, Guadeloupe29 ...30 103.0855782 1.858626 Universiti Tun Hussein Onm Malaysia, Malaysia31 ...32 55.4783714 25.2867708 University of Sharjah, United Arab Emirates33 ...
Figure 4. Knowledge Resources: Affiliation references used incomparative mapping (excerpt).

5
International Journal on Advances in Software, vol 12 no 1 & 2, year 2019, http://www.iariajournals.org/software/
2019, © Copyright by authors, Published under agreement with IARIA - www.iaria.org
In practice, the number of such place references can be verylarge. In case of this study, the numbers are in the range ofmillions of places. Therefore, it is important to understandwhat the tasks of the modules are.
2) Module tasks:
• The first module creates possible entities, including arecoder for alternative re-coding of codepages, a correc-tor generating attempts for corrections of writing, anda comparator computing comparisons with known andavailable affiliation space and place in the resources andreferences, here on base of affiliations and distinctivelocations.
• The second module identifies the resulting entities basedon the fit, according to the conceptual knowledge rel-evant for the targeted knowledge mapping, here geo-spatial association and referencing.
• The third module creates the spatial mapping and visu-alisation, depending on the choosen base.
With all modules, functional code is generated for the respec-tive steps. The generation ensures that appropriate implemen-tations can be achieved depending on the computing resourcesand infrastructures, which are used for the computational tasks.This is important, especially for large numbers of target datasets because many millions of comparisons may be requiredfor each step and, e.g., the computation be parallelised appro-priately.
3) Output representation: The visualisation of the results(red bullets) from the affiliation based procedures was doneon a spatial map (Figure 5).
Figure 5. Visualisation of the result of affiliation based knowledge mapping:Geo-referenced place association (Mercator projection).
The computing task can be parallelised for objects andentities. For demanding application scenarios, e.g., dynami-cal implementations, this implementation benefits to a smallextend from parallelisation.
B. Space and place: Country code based knowledge mappingThis method implements the knowledge mapping based on
country codes. The implementation is done according to theimplementation architecture (Figure 1).
1) Computational sequence: Table V gives the computa-tional sequence of the core computational procedures.
That means, regarding space and place: Country mapping,association of country codes via codes description, and evalu-ation of country codes and visualisation.
TABLE V. COUNTRY CODE BASED MAPPING: COMPUTATIONAL SEQUENCEOF CORE COMPUTATIONAL PROCEDURES AND REF. MODULES.
Procedure Module
Comparative Mapping is_in_countryConfiguration
Conceptual Mapping country_codes_descConfiguration
Spatial Mapping country_codesConfiguration
The module is_in_country is responsible for the compara-tive mapping. The module country_codes_desc is responsi-ble for the conceptual mapping. The module country_codesis responsible for the spatial mapping.
2) Module tasks:• The first module creates possible entities, including a
recoder for alternative re-coding of codepages, a correc-tor generating attempts for corrections of writing, anda comparator computing comparisons with known andavailable country and country code space and place inthe resources and references, here on base of countriesand larger areas.
• The second module identifies the resulting entities basedon the fit, according to the conceptual knowledge rel-evant for the targeted knowledge mapping, here geo-spatial association and referencing.
• The third module creates the spatial mapping and visu-alisation, depending on the choosen base.
Here, too, with all modules, functional code is generated forthe respective steps. The generation ensures that appropriateimplementations can be achieved depending on the computingresources and infrastructures, which are used for the computa-tional tasks. This is important, especially for large numbers oftarget data sets because many millions of comparisons may berequired for each step and, e.g., the computation be parallelisedappropriately.
Figure 6 shows an excerpt of country code references from theKnowledge Resources as associated with the comparison.
In practice, the number of such country code referenceshave several hundred pattern-code entities for a certain year

6
International Journal on Advances in Software, vol 12 no 1 & 2, year 2019, http://www.iariajournals.org/software/
2019, © Copyright by authors, Published under agreement with IARIA - www.iaria.org
or era. In case of this study, the numbers are in the rangeof about 300 pattern rules per language. Resolving can bedone automatically via geo-referencing and visualisationapplication components.
1 ...2 "Australia" lxcoco-AU3 "Brazil|, Brasil" lxcoco-BR4 "Canada" lxcoco-CA5 ...6 "Germany|Deutschland" lxcoco-DE7 "Ghana" lxcoco-GH8 "Gibraltar" lxcoco-GI9 ...
10 "Great Britain" lxcoco-GB311 ...12 "Greece" lxcoco-GR13 "Greenland|Grønland" lxcoco-GL14 "Grenada" lxcoco-GD15 "Guadeloupe" lxcoco-GP16 ...17 "Israel" lxcoco-IL18 "Italy" lxcoco-IT19 "Kuwait" lxcoco-KW20 "Malaysia" lxcoco-MY21 "Russian Federation" lxcoco-RU122 "Russia" lxcoco-RU223 "Turkey" lxcoco-TR24 "United Arab Emirates" lxcoco-AE125 "UAE|U\.A\.E\." lxcoco-AE226 "United Kingdom" lxcoco-GB127 ", UK" lxcoco-GB228 "United States of America|USA|U\.S\.A\.|U\.S\." lxcoco-US29 "Uruguay" lxcoco-UY30 ...
Figure 6. Knowledge Resources: Country Codes used for comparativemapping (excerpt).
Due to the nature of arbitrary and heterogeneous input objectsthe corrector algorithms benefit from continuous training. Anexcerpt of the corrector algorithm is shown in a correctingcode listing (Figure 7).
1 ...2 s+George Mason University.*?Romanian Academy, USA.*?Romania+George Mason
University, USA\nRomanian Academy, Romania+g3 s+UAP and SEU, Bangladesh.*Islamic University in Madinah, KSA+UAP and SEU,
Bangladesh\nIslamic University in Madinah, KSA+g4 s+Swiss National Science Foundation.*Oregon Health.*Science University, USA+
Swiss National Science Foundation, Switzerland\nOregon Health \& ScienceUniversity, USA+g
5 s+World Precision Instruments, Inc. USA; University of South Florida, USA+WorldPrecision Instruments, Inc. USA\nUniversity of South Florida, USA+g
6 s+Bowie State University; University of Maryland, College Park, USA+Bowie StateUniversity, USA\nUniversity of Maryland, College Park, USA+g
7 s+Cardiff University School of Medicine,.*\|.*Welsh e-Science Centre+CardiffUniversity School of Medicine\nWelsh e-Science Centre+g
8 s+California NanoSystems Institute (CNSI), Brain Research Institute (BRI).*\|.*University of California at Los Angeles (UCLA), USA+California NanoSystemsInstitute (CNSI), Brain Research Institute (BRI)\nUniversity of California atLos Angeles (UCLA), USA+g
9 s+CEA-Leti\/DACLE\/LIALP Lab, Verimag Lab.*?Grenoble University, France+CEA-Leti\/DACLE\/LIALP Lab, Verimag Lab, France\nGrenoble University, France+g
10 s+CISTER, INESC/TEC.*\|.*Polytechnic Institute of Porto, Portugal+CISTER, INESC/TEC, Portugal\nPolytechnic Institute of Porto, Portugal+g
11 s+Instituto de Telecomunica<UTFSeq>es, Aveiro, Portugal.*University of Bradford,UK+Instituto de Telecomunica<UTFSeq>es, Aveiro, Portugal\nUniversity ofBradford, UK+g
12 s+Instituto de Telecomunica<UTFSeq>es, Aveiro, Portugal.*American University ofNigeria, Nigeria+Instituto de Telecomunica<UTFSeq>es, Aveiro, Portugal\nAmerican University of Nigeria, Nigeria+g
13 s+University of Pisa, Italy.*Leiden University, The Netherlands+University ofPisa, Italy\nLeiden University, The Netherlands+g
14 s+(University of Hamburg)/.*?(Regional Computer Center), Germany+<DSym>{1},Germany\n<DSym>{2}, Hamburg, Germany+g
15 s+Defence R.*?D Canada, Valcartier.*?Univ. Laval.*?Univ. de Montr.*?al, Canada+Defence R\&D Canada, Valcartier, Canada\nUniv. Laval, Canada\nUniv. de Montreal, Canada+g
16 s+Defence R\&D, Canada+Defence R\&D Canada, Canada+g17 s+Sensemaking-PACOM Fellowship \& AIRS, Swansea University/Hawaii Pacific
University, UK/USA+Sensemaking-PACOM Fellowship \& AIRS, Swansea University\nHawaii Pacific University, UK/USA+g
18 s+Department of Computing Science and HPC2N.*+Department of Computing Science,Ume<UTFSeq> University, Sweden\nHigh Performance Computing Center North (HPC2N), Ume<UTFSeq> University, Sweden+
19 s+High Performance Computing Center North (HPC2N), Sweden+High PerformanceComputing Center North (HPC2N), Ume<UTFSeq> University, Sweden+g
20 s+California NanoSystems Institute (CNSI), Brain Research Institute (BRI) |University of California at Los Angeles (UCLA), USA+California NanoSystemsInstitute (CNSI), USA\nBrain Research Institute (BRI), USA\nUniversity ofCalifornia at Los Angeles (UCLA), USA+g
21 s+Westf.*lische Wilhelms-Universit.*t M.*nster.*Leibniz Universit.*t Hannover.*North-German Supercomputing Alliance, Germany+Westfalische Wilhelms-UniversitatMunster, Munster, Germany\nLeibniz Universitat Hannover, Hannover, Germany\nNorth-German Supercomputing Alliance, Germany+g
22 s+University Politehnica Bucharest, Romania.*?Texas A\&M University, USA+University Politehnica Bucharest, Romania\nTexas A\&M University, USA+g
23 s+Brown University, USA.*University of Saskatchewan, Canada+Brown University,USA\nUniversity of Saskatchewan, Canada+g
24 s+ICT-KTH, Sweden.*?IDI-NTNU, Norway+ICT-KTH, Sweden\nIDI-NTNU, Norway+g25 s+Center for Service Research \(CfSR\)\/National Institute of Advanced
Industrial Science and Technology \(AIST\), Japan+Center for Service Research (CfSR), Japan\nNational Institute of Advanced Industrial Science and Technology(AIST), Japan+g
26 s+Wirtschafts- und Sozialwissenschaftliches Institut, D.*?sseldorf, KarlsruheInstitute of Technology, Germany+Wirtschafts- und SozialwissenschaftlichesInstitut, Dusseldorf, Germany\nKarlsruhe Institute of Technology, Germany+g
27 s+Colorado State University, USA.*Lancaster University, UK+Colorado StateUniversity, USA\nLancaster University, UK+g
28 s+University of Carthage, Tunis.*El Manar University, Tunisia+University ofCarthage, Tunis, Tunisia\nEl Manar University, Tunisia+g
29 s+University of Carthage, Tunis<DSym>+University of Carthage, Tunis, Tunisia+g30 s+The University of Melbourne, Australia+University of Melbourne, Australia+g31 s+Ural Federal University.*Ekaterinburg, Russian Federation.*University of
Peloponnese.*Tripolis, Greece+Ural Federal University, Ekaterinburg, RussianFederation\nUniversity of Peloponnese, Tripolis, Greece+g
32 s+University of Twente and University of Groningen.*,The Netherlands+Universityof Twente, The Netherlands\nUniversity of Groningen, The Netherlands+g
33 s+French National Institute of Geographic and Forest Information.*, France+IGNInstitut National de l Information GA c©ographique et ForestiA¨re, France+g
34 s+ForestiA¨re+Forestiere+g35 ...
Figure 7. Correcting code for the corrector algorithm (excerpt).
The examples from the Knowledge Resources are a smallsubset from hundreds of thousands of comparable entries.The entries are presented here in Perl Compatible RegularExpressions (PCRE) style [24] based on widely commonPerl [25] conventions. For display, dollar symbols are sub-stituted as <DSym>, various UTF sequences are substituted as<UTFSeq>.
After conceptual mapping, correcting algorithms, sorting,and removing duplicates a list of country codes can begenerated using a country code container from the knowledgeresources. Figure 8 shows the list of resulting country codesautomatically generated for the target data.
1 AE,AT,AU,BE,BR,CA,CN,CY,DE,EC,ES,FI,FR,GB,GP,GR,HK,HR,IE,IL,IN,IR,IT,JP,KW,MY,NL,PK,PL,PT,RO,RU,SE,SG,TR,UA,US,UY
Figure 8. Knowledge Resources: Country Codes automatically generatedfor the target data (excerpt).
3) Output representation: The visualisation of the results(yellow country colourisation) from the country code basedprocedures was done on a spatial map (Figure 9). The countrycodes are based on the standard of the International StandardsOrganisation (ISO).
Figure 9. Visualisation of the result of country code based knowledge mapping:ISO referenced state association (Mercator projection).

7
International Journal on Advances in Software, vol 12 no 1 & 2, year 2019, http://www.iariajournals.org/software/
2019, © Copyright by authors, Published under agreement with IARIA - www.iaria.org
The computing task can be parallelised for objects andentities. For demanding application scenarios, e.g., dynamicalimplementations, this implementation widely benefits fromparallelisation. The parallelisation will be an individual taskof implementing a parallelisation concept optimal for theresources, on precondition that the computational resourcesand architectures are known in detail and available.
C. VisualisationThe spatial visualisation for the presented implementations
is done according to the implementation architecture (Fig-ure 1).
Table VI lists the alternative modules implemented forvisualisation of both methods implemented for affiliation basedknowledge mapping and country code based knowledge map-ping.
TABLE VI. SPATIAL VISUALISATION: ALTERNATIVE PROCEDURES FORAFFILIATIONS AND COUNTRY CODES.
Alternative Procedures Module
Spatial Visualisation Affiliation spatial_vis_polConfiguration
Spatial Visualisation CC spatial_vis_poly_ccConfiguration
The module spatial_vis_pol is responsible for visualisa-tion of affiliation based computational sequences. The modulespatial_vis_poly_cc is responsible for visualisation ofcountry code based computational computational sequences.
The functional code for the modules is generated for therespective type of visualisation. In this case, there is noprinciple impediment for a combined application of both codesif required.
The essential attribute characteristics for affiliation basedknowledge mapping spatial visualisation are illustrated by thelisting in Figure 10.
1 ...2 gmt pscoast -JM4.5i -R-180/180/-60/84 -F<CountryCodes>+glightgray -Glightgray
-Baf -BWSne -P -K > <PSFile>3 ...4 gmt psxy <DataFile> -J -O -R -Sc0.15c -G255/0/0 -W0.05p,black >> <PSFile>5 ...
Figure 10. Spatial affiliation based knowledge mapping visualisationcharacteristics for GMT (excerpt).
The essential attribute characteristics for country codeknowledge mapping based spatial visualisation are illustratedby the listing in Figure 11.
1 ...2 gmt pscoast -JM4.5i -R-180/180/-60/84 -F<CountryCodes>+glightgray -Glightgray
-Baf -BWSne -P -K > <PSFile>3 ...4 gmt pscoast -J -R -N1/0.15p,black -F<CountryCodes>+gorange -O >> <PSFile>5 ...
Figure 11. Country code based knowledge mapping spatial visualisationcharacteristics for GMT (excerpt).
Individual attributes can be a matter of module configurationor visualisation attributes in a certain context can be a matterof training procedures.
V. DISCUSSION
Implementations can range from generic to specialised, asgranted by the methodology, all the components and the illus-trated architecture. A reason for illustrating the methodologywith a well defined implementation is that from many expe-riences made from working with methodologies, specialisedimplementations tend to be better comprehensible by themajority of researchers in various disciplines.
The methodology of knowledge mapping, as illustratedvia implementation of two methods discussed here, allowsa versatile number of methods to be created for a purpose,based the same knowledge and data.A. Comparison and discussion of results
The two sequences show different characteristics• in content and context, as well as• in architecture and computational requirements.
Country code based and affiliation based solutions resultin visualisation of different distribution patterns. While anaffiliation based solution can have a higher granularity it canbe more precise in detail. In that context, a country code basedsolution is associated with more dependencies in the results –border lines, different country context, especially for handlingand visualising long-term intervals. For example, consideringthe same data, on the one hand geo-references of a place donot really change much over time, on the other hand borderlines of states change much faster on a global scale.
For a visual comparison, the results from both the affiliationbased and country code based sequences were placed on thesame spatial map (Figure 12).
Figure 12. Comparison of both affiliation and country code based knowledgemapping: Geo-referenced place and ISO referenced state results.
There are more differences in detail, which can influencedecisions on applicability and implementation. In general,there are arbitrary ways of implementing a knowledge mappingtarget based on the same Knowledge Resources. An imple-mentation will in most cases be triggered by a combinationof items, e.g., purpose, implementation efficiency, and com-putational performance. The characteristics and resolvabilityachieved via different knowledge mapping may be different.

8
International Journal on Advances in Software, vol 12 no 1 & 2, year 2019, http://www.iariajournals.org/software/
2019, © Copyright by authors, Published under agreement with IARIA - www.iaria.org
The number of countries is much more limited and the identifi-cation can be much more standardised than for geo-referencedplaces. The distribution of affiliation associated places cancreate a different impression than a visualisation based oncountry data. The sizes of mapped country areas can createa different impression than a visualisation based on countrydata. Associations based on both results can be significantlydifferent, leading to further different knowledge context.
A further significant difference of the two case studyimplementations is the fact that the computationalrequirements are much more complex for affiliation mappingthan for country code mapping. Depending on the objects andentities and the selected knowledge resources the factor ofcomplexity can go up by millions. This is foremost relevantfor the computation of comparative modules and analysis andvisualisation of results.
B. Knowledge and its computational footprintBased on the case studies, the characteristics of both solu-
tions result in different computational requirements. Table VIIcompares the solutions regarding the numbers of computa-tional checks required, done for the same object and entities.
TABLE VII. CORE PROCEDURES AND OBJECTS: COMPARISON OFCOUNTRY CODE AND AFFILIATION BASED MAPPING.
Procedure Country Code Affiliation
Comparative Mappingpre-filter Checks 5,500 72,000Knowledge Mapping Checks 40,000 570,000post-filter Checks 7,000 75,000
Conceptual MappingChecks UDC 300 5,000,000Checks, other references 300 500,000
Spatial MappingResults > 50 Polygons >50 PointsContext, object level > 120 Polygons 0 PolygonsContext, basic 1 Basemap 1 Basemap
Different implementations involve different knowledge. Ascan be reasoned from the comparison, the case of affiliationbased knowledge mapping might be a challenge for certainarchitectures, e.g., a distributed service implementation.
On the opposite, country code mapping can mean higherrequirements for supportive data and higher load on spatialmapping application components, e.g., polygons provided byadditional data, requests, application bound features, and vi-sualisation. The supportive data can easily get into the rangeof millions of entities and Giga Bytes of data size per singlerequest. If considering that country shapes will differ for acertain year or era, then multiple supportive data sets mightbe needed. Therefore, load distribution is very much differentfor the implementations due to the nature of the differentmethodologies. The core sequences required for the knowledgemapping result in significant computational loads, especially attwo steps: Comparisons and visualisation. These result in bothcomparative mapping load and supportive application load.Configuration of resources and modules can help to scale the
computational load, nevertheless, any different configurationswill have additional impact on the associated knowledgeinvolved, which can be a significant reason for decision:For most component implementations and investments it doesmake a difference if a computational step takes two seconds ortwo days and if the required knowledge and data are involvedor not. In addition to different knowledge being associatedduring the sequences, there is another difference: Most ofthe procedures are not bidirectional. If the affiliation basedknowledge mapping is used in order to compute a consecutivecountry code based knowledge mapping and even if the resultwould be identical to the plain country code mapping this doesnot indicate that the country code mapping could also providea consecutive affiliation mapping in the same manner.
C. Re-use, continuous creation, and improvementAccess and interface modules, especially for accessing struc-
tures, dealing with formatting, and handling of sorting andfiltering can easily be reused or cloned with modifications.Visualisation modules can also be easily reused and adoptedfor different methods of knowledge mapping.
The modules characteristic for a respective knowledge map-ping method make up the core for a case. Different algorithmsshould be implemented in modular ways, e.g., allowing stan-dalone of algorithms as well as an integrated use of algorithms.Nevertheless, on premise of sufficient complexity of the knowl-edge resources, even all the knowledge required with differentknowledge mapping methods can overall be delivered by theknowledge resources. The delivered knowledge can comprisethe knowledge complements, e.g., including supportive knowl-edge for methods, references, algorithms, implementations ofalgorithms, and visualisation components.
With natural language target data or comparable sources alot of processing may have to be done before getting into theknowledge mapping itself. For example, codepages have to beresolved and codepages have to be recoded, languages mayhave to be recognised by document, sentence, and even wordand different ways of writing the same object may have tobe resolved. Incomplete object references may be associatedwith full entries and so on. Creation and improvement ofresources and knowledge content are continuous processes.The optimisation, e.g., regarding the resources and modulesfor improving resulting outputs is intrinsically supported bythe application of the modules itself. This is based on the factthat intermediate results from any application or run can beused for training of procedures and Knowledge Resources.
VI. CONCLUSION
This paper presented the research results from an extendedcase study and implementation for the identification and spatialmapping of arbitrary non-georeferenced input data entities.
The methodology of knowledge mapping was used for creat-ing methods and implementing components for different tasks,e.g., for advanced knowledge as successfully demonstratedwith the case studies. The methodology allowed an efficientimplementation and realisation of methods for the creation ofnew context for objects and entities.

9
International Journal on Advances in Software, vol 12 no 1 & 2, year 2019, http://www.iariajournals.org/software/
2019, © Copyright by authors, Published under agreement with IARIA - www.iaria.org
It was successfully demonstrated that the goal of the studiesand implementations to create different automatable methodsfor knowledge mapping in a spatial context can be efficientlyachieved in very flexible, modular, and reusable ways.
The more, due to the high quality of the knowledge re-sources in addition with the long-term training, the com-pleteness of the resulting mapping in this case proved to beultimatively complete and sufficiently precise for the targetobjects without additional intervention, for both methods.
The multi-disciplinary and multi-lingual Knowledge Re-sources and the Knowledge Mapping based implementationscan benefit from being continuously assisted by training proce-dures, which can contribute to the complementary knowledgecontent. In addition, the results from any of these realisationscan be used to further valorise new knowledge and continu-ously improve the long-term knowledge resources, which againextends the quality and quantity of available resources.
With this research the implementations targeted on knowl-edge based, automatable computational cases of spatial visu-alisation. This goal was achieved while preserving facilitiesfor any form of non automated or semi-automated use withoutprinciple constraints.
In addition, the Knowledge Resources could be extendedand improved in quality and quantity by applying the imple-mentations to various target objects, due to the successfullymined results achieved from the implemented cases, whichbecome part of the knowledge resources themselves.
In consequence, the result of this research is a functional ar-chitecture, which proved to provide most flexible facilities forcreating knowledge mapping and different and very scalablecomputational solutions. In consequence, the further develop-ment of resources and methods allows to consider differentconstraints when implementing solutions for a certain task.It was shown that the architecture allows to efficiently createimplementations with significantly different characteristics.
The knowledge resources and the knowledge based solutionsprovide comprise universal knowledge and are not limited toa certain discipline or task. Nevertheless, examples limitedto a defined task had to be taken for demonstration. Thepresented case studies illustrated how the knowledge mappingis applied for different solutions, namely country code basedknowledge mapping and affiliation based knowledge mapping.The knowledge objects involved for these solutions howeverwere not limited to a single discipline and task and are trulymulti-disciplinary and multi-lingual as are all the componentsand referenced knowledge involved in the scenarios. Bothsolutions are very much visualisations of object entities. Re-gardless of that fact, both workflows are significantly differentin steps, methods, algorithms, details of involved knowledge,and computational characteristics.
The facts, which become visible when the case studyexamples are discussed as an example of general abstraction,while still accessing the same resources: The large range offlexibility from knowledge, algorithmic, and computationalperspectives. The complements of possibly required solutionsshare the complementary knowledge. Here, results comparableto the country code solution can be created with geo-referencedplace data. In contrast, from the data involved with the country
code solution it is not possible to create a geo-referenced viewbased on the associated data.
From the educational view on insight it may be interestingbeing able to generate different views of knowledge and infor-mation in different ways and with different media based on thismethodological approach. The achieved results can becomepart of what is known in addition of what is remembered [26]and can preserve contextual details not learned otherwise.
Therefore, besides the individual context and results deliv-ered by different implementations, it holds “The journey is thereward”. The methodology of knowledge mapping as describedcan be used for any knowledge and context. The conductedcase study is using terms in arbitrary text on the one hand,which can be associated with geo-referencing on the otherhand. A different application scenario can be regional florasand faunas being mapped to an biological context, in whichcase even no geo-referencing or cartographic visualisationneeds to be involved. Instead, the results can show the levelof complexity for certain cases.
In conclusion, one can choose solutions under differentconstraints of application scenarios, e.g., knowledge involved,flexibility of sequences, and computational requirements. Thatway, it is possible to create scalable solutions considering theimplementation of required procedures and methodologies, aswell as the implementation of required infrastructures. Furtherfuture research will be spent on extending the dimensionalextent of knowledge resources and on the creation of advancedmethodologies for creating method for advanced knowledgemining, further increasing quality and quantity of multi-disciplinary and multi-lingual content, knowledge mapping,and integration.
ACKNOWLEDGEMENTS
We are grateful to the “Knowledge in Motion” (KiM)long-term project, Unabhangiges Deutsches Institut fur Multi-disziplinare Forschung (DIMF), for partially funding thisimplementation, case study, and publication under grantsD2016F1P04683, D2017F1P04708, D2017F1P04812 and toits senior scientific members and members of the permanentcommission of the science council and the board of trustees,especially to Dr. Friedrich Hulsmann, Gottfried WilhelmLeibniz Bibliothek (GWLB) Hannover, to Dipl.-Biol. BirgitGersbeck-Schierholz, Leibniz Universitat Hannover, to Dipl.-Ing. Martin Hofmeister, Hannover, and to Olaf Lau, Hannover,Germany, for collaboration, practical multi-disciplinary casestudies, and the analysis of advanced concepts. We are gratefulto Dipl.-Ing. Hans-Gunther Muller, Cray, Germany, for his ex-cellent contributions and assistance providing practical privatecloud and storage solutions. We are grateful to all national andinternational partners in the Geo Exploration and Informationcooperations for their constructive and trans-disciplinary sup-port. We are grateful to the Science and High PerformanceSupercomputing Centre (SHPSC) for long-term support ofcollaborative research since 1997, including the GEXI devel-opments and case studies and The International ARS Scienceand History Network for providing multi-disciplinary referencedata. / DIMF-PIID-DF98 007.

10
International Journal on Advances in Software, vol 12 no 1 & 2, year 2019, http://www.iariajournals.org/software/
2019, © Copyright by authors, Published under agreement with IARIA - www.iaria.org
REFERENCES
[1] C.-P. Ruckemann, “Computation and Knowledge Mapping forData Entities,” in Proceedings of The Eighth International Con-ference on Advanced Communications and Computation (INFO-COMP 2018), July 22–26, 2018, Barcelona, Spain. XPS Press,Wilmington, Delaware, USA, 2018, pp. 7–12, ISSN: 2308-3484,ISBN: 978-1-61208-655-2, ISBN: 978-1-61208-084-0 (ElectronicProceedings), URL: http://www.thinkmind.org/download.php?articleid=infocomp 2018 1 20 60031 [accessed: 2019-02-03].
[2] C.-P. Ruckemann, “Principles of Superordinate Knowledge: Separationof Methodology, Implementation, and Realisation,” in The EighthSymposium on Advanced Computation and Information in Natural andApplied Sciences, Proceedings of The 16th International Conference ofNumerical Analysis and Applied Mathematics (ICNAAM), September13–18, 2018, Rhodes, Greece, Proceedings of the American Instituteof Physics (AIP). AIP Press, American Institute of Physics, Melville,New York, USA, 2019, ISSN: 0094-243X, (to appear).
[3] R. L. Ackoff, “From data to wisdom,” Journal of Applied SystemsAnalysis, vol. 16, 1989, pp. 3–9, ISSN: 0308-9541.
[4] M. Fricke, “The knowledge pyramid: a critique of the DIKW hierarchy,”Journal of Information Science, vol. 35, no. 2, 2009, pp. 131–142,SAGE, DOI: 10.1177/0165551508094050.
[5] J. Rowley, “The wisdom hierarchy: representations of the DIKWhierarchy,” Journal of Information Science, vol. 33, no. 2, 2007, pp.163–180, SAGE, DOI: 10.1177/0165551506070706.
[6] A. Bauer and H. Gunzel, Eds., Data-Warehouse-Systeme - Architektur,Entwicklung, Anwendung. dpunkt-Verlag, 2013, ISBN: 3-89864-785-4.
[7] Aristotle, Nicomachean Ethics, 2008, (Written 350 B.C.E.), Translatedby W. D. Ross, Provided by The Internet Classics Archive, URL: http://classics.mit.edu/Aristotle/nicomachaen.html [accessed: 2019-02-03].
[8] Aristotle, Nicomachean Ethics, Volume 1, 2009, Project Gutenberg,eBook, EBook-No.: 28626, Release Date: April 27, 2009, DigitisedVersion of the Original Publication, Produced by Sophia Canoni, Bookprovided by Iason Konstantinidis, Translator: Kyriakos Zambas, URL:http://www.gutenberg.org/ebooks/12699 [accessed: 2018-05-12].
[9] Aristotle, The Ethics of Aristotle, 2005, Project Gutenberg, eBook,EBook-No.: 8438, Release Date: July, 2005, Digitised Version of theOriginal Publication, Produced by Ted Garvin, David Widger, andthe DP Team, Edition 10, URL: http://www.gutenberg.org/ebooks/8438[accessed: 2019-02-03].
[10] L. W. Anderson and D. R. Krathwohl, Eds., A Taxonomy for Learning,Teaching, and Assessing: A Revision of Bloom’s Taxonomy of Educa-tional Objectives. Allyn & Bacon, Boston, MA (Pearson EducationGroup), USA, 2001, ISBN-13: 978-0801319037.
[11] Plato, Phaedo, 2008, (Written 360 B.C.E.), Translated by BenjaminJowett, Provided by The Internet Classics Archive, URL: http://classics.mit.edu/Plato/phaedo.html [accessed: 2019-02-03].
[12] C.-P. Ruckemann and F. Hulsmann, “Significant Differences: Method-ologies and Applications,” KiMrise, Knowledge in Motion Meeting,November 27, 2017, Knowledge in Motion, Hannover, Germany, 2017.
[13] C.-P. Ruckemann, “Methodology of Knowledge Mapping for ArbitraryObjects and Entities: Knowledge Mining and Spatial Representations– Objects in Multi-dimensional Context,” in Proceedings of TheTenth International Conference on Advanced Geographic InformationSystems, Applications, and Services (GEOProcessing 2018), March25 – 29, 2018, Rome, Italy. XPS Press, Wilmington, Delaware,USA, 2018, pp. 40–45, ISSN: 2308-393X, ISBN-13: 978-1-61208-617-0, URL: http://www.thinkmind.org/index.php?view=article&articleid=geoprocessing 2018 3 20 30078 [accessed: 2019-02-03].
[14] C.-P. Ruckemann, “Creation of Objects and Concordances for Knowl-edge Processing and Advanced Computing,” in Proceedings of TheFifth International Conference on Advanced Communications and Com-putation (INFOCOMP 2015), June 21–26, 2015, Brussels, Belgium.
XPS Press, 2015, ISSN: 2308-3484, ISBN-13: 978-1-61208-416-9, URL: http://www.thinkmind.org/index.php?view=article&articleid=infocomp 2015 4 30 60038 [accessed: 2019-02-03].
[15] C.-P. Ruckemann, “Advanced Association Processing and ComputationFacilities for Geoscientific and Archaeological Knowledge ResourcesComponents,” in Proceedings of The Eighth International Conference onAdvanced Geographic Information Systems, Applications, and Services(GEOProcessing 2016), April 24 – 28, 2016, Venice, Italy. XPS Press,2016, pages 69–75, ISSN: 2308-393X, ISBN-13: 978-1-61208-469-5.
[16] C.-P. Ruckemann, “Advanced Knowledge Discovery and Computingbased on Knowledge Resources, Concordances, and Classification,”International Journal On Advances in Intelligent Systems, vol. 9, no.1&2, 2016, pp. 27–40, ISSN: 1942-2679.
[17] C.-P. Ruckemann, “Enabling Dynamical Use of Integrated Systems andScientific Supercomputing Resources for Archaeological InformationSystems,” in Proc. INFOCOMP 2012, Oct. 21–26, 2012, Venice, Italy,2012, pp. 36–41, ISBN: 978-1-61208-226-4.
[18] “UDC Online,” 2018, URL: http://www.udc-hub.com/ [accessed: 2019-02-03].
[19] “Multilingual Universal Decimal Classification Summary,” 2012, UDCConsortium, 2012, Web resource, v. 1.1. The Hague: UDC Consortium(UDCC Publication No. 088), URL: http://www.udcc.org/udcsummary/php/index.php [accessed: 2019-02-03].
[20] “Creative Commons Attribution Share Alike 3.0 license,” 2012, URL:http://creativecommons.org/licenses/by-sa/3.0/ [accessed: 2019-02-03].
[21] “GEOProcessing 2018: Committees,” 2018, the Tenth InternationalConference on Advanced Geographic Information Systems, Appli-cations, and Services (GEOProcessing 2018) March 25–29, 2018 –Rome, Italy, (document state at 2018-03-04), URL: https://www.iaria.org/conferences2018/ComGEOProcessing18.html [accessed: 2019-02-03].
[22] “UDC (1/9): Common auxiliaries of place,” 2019, URL: http://udcdata.info/001951 [accessed: 2019-02-03].
[23] “GMT - Generic Mapping Tools,” 2019, URL: http://imina.soest.hawaii.edu/gmt [accessed: 2019-02-03].
[24] “Perl Compatible Regular Expressions (PCRE),” 2019, URL: https://www.pcre.org/ [accessed: 2019-02-03].
[25] “The Perl Programming Language,” 2019, URL: https://www.perl.org/[accessed: 2019-02-03].
[26] F. Jabr, “The Reading Brain in the Digital Age: The Science ofPaper versus Screens,” Scientific American, Apr. 11, 2013, URL: https://www.scientificamerican.com/article/reading-paper-screens/ [accessed:2019-02-03].

11
International Journal on Advances in Software, vol 12 no 1 & 2, year 2019, http://www.iariajournals.org/software/
2019, © Copyright by authors, Published under agreement with IARIA - www.iaria.org
Fuzzy Outlier Detection by Applying the ECF-Means Algorithm
A clustering ensemble approach for mining large datasets
Gaetano Zazzaro, Angelo Martone
CIRA
Italian Aerospace Research Centre
Capua (CE), Italy
e-mail: {g.zazzaro, a.martone}@cira.it
Abstract—This paper focuses on how to mine large datasets by
applying the ECF-means algorithm, in order to detect potential
outliers. ECF-means is a clustering algorithm, which combines
different clustering results in ensemble, achieved by different
runs of a chosen algorithm, into a single final clustering
configuration. Furthermore, ECF is also a manner to “fuzzify”
a clustering algorithm, assigning a membership degree to each
point for each obtained cluster. A new kind of outlier, called 𝒐-
rank fuzzy outlier, is also introduced; this element does not
strongly belong to any cluster, which needs to be observed more
closely; moreover, a novel validation index, called 𝒐. 𝑭𝑶𝑼𝑰, is
defined too, based on this new kind of fuzzy outliers. The
proposed method for fuzzification is applied to the 𝒌-means
clustering algorithm by using its Weka implementation and an
ad-hoc developed software application. Through the three
exposed case studies, the experimental outcomes on real world
datasets, and the comparison with the results of other outlier
detection methods, the proposed algorithm seems to provide
other types of deeper detections; the first case study concerns
the famous Wine dataset from the UCI Machine Learning
Repository; the second one involves the analysis and exploration
of data in meteorological domain, where various results are
explained; finally, the third case study explores the well-known
Iris dataset which, traditionally, has no outliers, while new
information is discovered by the ECF-means algorithm and
exposed here with many results.
Keywords-ECF-means; Fuzzy Outlier Detection; Data
Mining; Ensemble Clustering; k-means; Weka.
I. INTRODUCTION
The Ensemble Clustering Fuzzification (ECF) means [1] is an algorithm aimed at combining multiple clustering models to produce a better result than that of the individual clustering components. The proposed ensemble approach is carried on using the well-known 𝑘-means algorithm, its Weka implementation, and an ad-hoc developed software application. Compared to the version described in [1], we made some updates obtaining a new version of the algorithm. First of all, the most important variation to the algorithm consists in removing any equal partitions determined by two different runs of 𝑘 -means algorithm. Therefore, all the ensemble results and the evaluation indexes are calculated on the number of different obtained partitions and not on the total number of performed iterations. Moreover, we also define a
new validation index, called 𝑜 -rank fuzzy outlier index (𝑜. 𝐹𝑂𝑈𝐼) by calculating the percentage of 𝑜 -rank fuzzy outliers discovered by ECF.
The clusters achieved by the algorithm can be read in a “soft” way, in order to better explore and understand the results, and discover potential outliers in the dataset.
An outlier, or an anomaly, is an observation that is numerically distant from the rest of the data. What “distant” means depends on the context and on the domain, on the type of data and on the objective of analysis that must be achieved. Additionally, outlier detection is the process, or a technique, to find patterns in data that do not conform to estimated behavior. It plays a primary role in both statistical and data mining tasks, so much that identifying, understanding, and predicting anomalies from data is one of the key pillars of modern and advanced data analysis.
Nowadays methods and algorithms for data analysis increasingly involve huge amounts of data which are certainly rich in valuable information and useful knowledge, but also full of noise and impurities. The main challenges of outlier detection with this increasing complexity, variety, and volume of datasets, are how to discover similar outliers in one fell swoop, as a group [2]. Thus, an advantageous activity of data analysis must strictly have a data preparation step that includes data cleaning and anomalies removal activities.
Several outlier detection techniques have been proposed in literature [3]. Roughly, the approaches to outlier detection can be divided into two main categories: statistical and non-statistical methods. Within the non-statistical methods, the Machine Learning techniques for Data Mining are very popular, studied, and even among the most applied. Statistical methods are typically model-driven while Data Mining methods are typically data-driven. Mainly the Data Mining approaches for anomaly detection are divided into Proximity-based, Density-based, and Clustering-based techniques. This paper focuses on clustering-based outlier detection algorithms that look for outliers by applying one of the clustering algorithms and retrieve the anomalies subset. Moreover, this paper presents our idea on how apply the ECF-means algorithm for outlier detection task, and therefore, we explore datasets by applying this clustering-based technique.
Whilst usually it is hard to attach an outlier score to objects by using most of the clustering algorithms [4], the ECF-means algorithm defines a new class of outliers, consisting of elements that in [1] are named 𝑜 -rank fuzzy outliers.

12
International Journal on Advances in Software, vol 12 no 1 & 2, year 2019, http://www.iariajournals.org/software/
2019, © Copyright by authors, Published under agreement with IARIA - www.iaria.org
Therefore, ECF-means is able to assign a score to each element of the dataset depending on the vector constituted by its memberships to every obtained clusters. An element whose score is lower than a fixed threshold level is an outlier, because it belongs to two or more different clusters, without a clear and unambiguous membership. In this way, it is possible to have different kinds of outliers by fixing different thresholds: an element with level 1 is not a true outlier, whilst an element of level 0 is a full anomaly. These elements can be analyzed separately in order to understand if they are records that have undergone measurement errors and need to be deleted, or elements that are, from some point of view, special elements, confirming the idea that outliers are sometimes more interesting than the majority of the data.
Finally, the detected outliers are something new compared to those discovered by the crisp or traditional techniques for outlier analysis, and the two ways rarely discover the same anomalies.
In this paper, we present some applications of ECF-means algorithm, including datasets explorations, clustering results, outliers detection and classification. For the sake of clarity, this algorithm has many purposes and this paper focuses on an its application aimed at detecting outliers in various real-world benchmark datasets, testing its results and comparing the discovered anomalies with those detected by classical statistical methods. Our examples will demonstrate the efficiency of the ECF-means approach, comparing our results with those retrieved by other methods.
A. Structure of the paper
In Section II, we present some outlier detection generalities, including different approaches to discover anomalies in large datasets, and application fields. Particular attention is given to the clustering-based algorithms for anomaly detection and to properties of the algorithms for outliers detection.
In Section III, we provide cluster analysis general outlines, including main definitions, its scope and its role in Data Mining. Furthermore, some concepts regarding Ensemble Clustering, soft and hard clustering are mentioned.
In Section IV, the original 𝑘 -means algorithm is synthesized, exposing its pros and cons.
In Section V, the ECF-means is presented, including some main definitions; in particular, we introduce the 𝑜-rank fuzzy outlier definition.
In Section VI, we present some validation measures for cluster analysis and for fuzzy clustering, including Silhouette, Partition Entropy Coefficient, the Threshold Index, and a novel index called 𝑜 -rank fuzzy outlier index.
In Section VII, the ECF-means SW application is explained, underlining the updates of the new version.
In Sections VIII, IX, and X we show how the new version of the implemented software tool has been used in three different applications, underlining how it helped us to explore datasets, to discover new knowledge, to detect potential outliers, and to group objects in order to train custom models.
Finally, in Section XI, we show our general considerations in order to motivate future works and researches.
II. OUTLIER DETECTION
In outlier detection, the main goal is to discover objects that are different than the most other objects in the dataset. In many applications outliers contain important information and their correct identification is crucial.
A. Different Approaches and Application Fields
Outlier detection, or interchangeably anomaly detection, is the process of finding data objects with behaviors that are very different from expectation. Precisely, such objects are called outliers, anomalies, abnormalities, discordants or deviants. Outlier detection is generally considered a problem of machine learning or data mining, in the same way as classification and clustering.
A very common definition of an outlier is provided in [5] and it states:
“An Outlier is an observation which deviates so much from the other observations as to arouse suspicions that it was generated by a different mechanism.”
In Data Mining and Statistics, outliers are particularly important aspects of the data. It may be difficult to evaluate the amount of noise in the data set or the number of outliers. More than that, what is noise or an outlier to one person may be interesting to another person. So, a unique mechanism that can identify outliers in datasets is impossible to define. Furthermore, the resolution of potential conflicts in detection is often possible thanks only to domain knowledge, which cannot always come to the aid of data analysts, especially when they are dealing with big data.
Table I shows several examples with categories of anomalies and it confirms why an uniform definition of anomaly is very hard to achieve. It is also evident that there is no clear separation between these types of outliers.
TABLE I. EXAMPLES OF OUTLIERS
Example Category
1 Outlier with respect to rest of the data points
Point Outlier, Contextual Outliers
2 Outlier with respect to
local neighborhood Point Outlier, Contextual
Outliers
3 Outlier with respect to the
data distribution Point Outlier, Contextual
Outliers
4 Outlier with respect to
local dense regions Point Outlier, Collective
Outliers
5 Outlier tight cluster in a
sparse region Point Outlier, Collective
Outliers
6 Outlier sparse cluster in a
dense region Collective Outliers
Outliers can be classified into three main categories that intersect with the examples in Table I:
1. point outliers, where a single instance of data is anomalous if it is too far off from the rest;
2. contextual outliers, if its value significantly deviates from the rest the data points in the same context; note that this means same value may not be considered an outlier if it occurred in a different context; these outliers are common in time-series data;
3. collective outliers, where a set of data instances collectively helps in detecting anomalies.

13
International Journal on Advances in Software, vol 12 no 1 & 2, year 2019, http://www.iariajournals.org/software/
2019, © Copyright by authors, Published under agreement with IARIA - www.iaria.org
The technique chosen for anomaly detection can be based on the type of data you are dealing with. Many of these approaches have been exactly developed for certain application domains, while others are more generic and reusable. One of the main criteria used to select the outlier detection technique is based on the nature of the outlier to discover.
Approaches for outlier detection are reported in Table II [6] [7] [8].
TABLE II. METHODS FOR OUTLIER DETECTION
Method Description
Nearest neighbor-based
lazily analyze the nearest neighborhood of a test point to assign it an outlier score relative to their neighborhood; in particular, these methods are based on the idea that normal instances lie in dense neighborhoods whilst anomalous points lie in sparse neighborhoods
Clustering-based
the anomaly score assigned to a test point is based on its relationship with its nearest cluster; by using these algorithms, outliers do not belong to a cluster or are far away from the nearest cluster representative
Classification-based
operate under the hypothesis that a classifier can be trained from a given feature space that can discriminate between normal and outlier classes
Statistical are based on building a probability distribution model and considering how likely objects are under that model; outliers appear in the low probability regions of the distribution and have high anomaly score
Spectral decomposition- based
are unsupervised learning techniques that find an approximation of the data using a combination of attributes that reveal low dimensional structure in dimensional data; points that are different from others in the lower approximation are detected as outliers
Information theoretic
by which an anomalous point is an instance that has irregularities in the information content by using different information theoretic measures such as entropy or complexity
Other authors report [4] that the Machine Learning methods for outlier detection can be classified as proximity-based techniques, mainly founded on Nearest Neighbor concept, density-based techniques, where outliers are objects that are in regions of low density, and clustering-based techniques, where outliers can form small groupings or where an outlier is an object does not strongly belong to any cluster.
TABLE III. APPLICATIONS FIELDS OF OUTLIER DETECTION
Field Goal
1 Medical Informatics Healthcare analysis, diagnostics, in a
wide variety of medical specializations
2 Intrusion Detection Break-ins, penetrations, and other form
of computer abuse detection
3 Fraud Detection Credit card, mobile phone
4 Fault / Damage
Detection Industry damage, multi-failures in
Avionics systems, and others
5 Crime Investigation /
Counter Terror Op. Planning
Fake news, misinformation, security, surveillance, social network monitoring
6 Other Domains
Speech Recognition, Traffic Monitoring, Detecting Faults in Web Applications, Detectiong Outliers in Astronomical
Data, in CRM, in Census Data, in Biological Data, Novelty Detection in
Robot Behaviour, Click Through Protection, and others
The well-known DBSCAN clustering algorithm [9] can be considered, for example, both in the density-based category and in the clustering-based one, because DBSCAN assumes that regions or points with density lower than a global threshold are noise or outliers.
It is very important to underline that outlier detection can represent both the objective of the analysis and a data cleaning method in the Data Preparation step of the CRISP-DM [10].
Outlier detection is central for a wide variety of applications and activities [11] [12] such as reported in Table III.
B. Clustering-based Outlier Detection
Outlier detection finds objects that are not strongly related to other objects, while on the contrary cluster analysis finds groups of strongly related objects in the dataset. One implication is that clustering can be successfully used for outlier analysis.
This approach is based on the idea that anomalous points do not belong to a cluster or to a single cluster without ambiguity. Another possibility occurs when the anomalous point is far away from the nearest normal cluster representative (such as the centroid, the medoide, etc.). The use of an unsupervised outlier detection approach based on a clustering algorithm also has the advantage of avoiding the bias introduced by training an algorithm with anomalous instances, labeled wrongly as normal data, producing many and unmanageable misclassifications.
Applying a clustering method to detect anomalies can discover, such as all the kinds of outlier detection approaches, single, spare, and rare elements, or also clusters of outliers, forming a collection, which is why in this case anomalies are called “collective outliers”. For the sake of clarity, many times the collective outliers aggregate far from the rest of the elements of the dataset, and then they could be modeled by a rule, forming a real new cluster and not an actual set of anomalies. So, an almost always applicable rule by which we can understand if a potential anomaly is a real anomaly, is to recognize if the anomaly belongs to a pattern. As already mentioned, the subset of the detected anomalous points may also not form a cluster, for example, because they are not cohesive with each other or they are not well separated from the rest of the clusters.
The main idea to detect anomalies by using a clustering approach is based on the property that “normal” data belong to large and dense clusters, whereas outliers belong to small or sparse clusters, or they are singletons, not belonging to any cluster. Consequently, all clusters smaller than a minimum size can be discarded, reassessed, or reported.
The clustering approach to anomaly detection can be used with any clustering algorithm, but requires thresholds for the minimum cluster size and the distance between a small cluster and other clusters. The idea of a clustering-based algorithm for outlier detection is captured by the definition [4]:
“An object is a cluster-based outlier if the object does not strongly belong to any cluster.”
In this context, “strongly” also means “clearly” and “without ambiguity”, and in the next sections the meaning of these words will be more explicit.

14
International Journal on Advances in Software, vol 12 no 1 & 2, year 2019, http://www.iariajournals.org/software/
2019, © Copyright by authors, Published under agreement with IARIA - www.iaria.org
The binding of a point to its cluster can be measured by a score. A simple way of defining this score is to first cluster the whole dataset and then use the distance of the point to its closest cluster centroid. The points that have the highest scores are potential outliers.
After objects of a set are clustered and outliers are discovered and removed, the set with the rest of objects can be clustered again, analyzing if outliers affect the clustering. This is a very thorny problem, especially if 𝑘-means is chosen as the clustering algorithm, the results of which depend on the choice of the initial centroids and on the number 𝑘 of clusters to be determined.
Another problem to be highlighted concerns the size of the clusters. If a cluster has very few points, these are potential outliers only if the other clusters have much larger sizes, otherwise nothing can be said. In a nutshell, outlier detection is strongly conditioned by the selected threshold.
Furthermore, many clustering techniques, such as 𝑘 -means, do not automatically determine the number of clusters. This is a problem when using clustering in outlier detection, since whether an object is considered an outlier or not may depend on the number of obtained clusters.
All these aspects make us understand how the problem of outlier detection is strictly dependent on the set of data, the chosen method, the parameters of the algorithm, and the analysis goals. As consequence we have that we are not always sure that a discovered point is really anomalous.
The cluster-based outlier definition inherently contains a fuzzy reinterpretation of cluster analysis and outlier detection. For this reason, the ECF-means algorithm is a good candidate to detect potential outliers and to explore the dataset and clustering results.
C. Fuzzy Clustering-based Approach to Outlier Detection
In order to detect anomalies, fuzzy clustering is an alternative approach to classical clustering-based methods that are centered on the concept of crisp membership. Recently fuzzy clustering-based methods are applied in many fields, analyzing various types of data, and also getting very good results [13] [14] [15] [16]. In most of these works, however, authors use the fuzzy c-means clustering (FCM) algorithm, or a variant of it, for detecting outliers. Moreover, many crisp clustering techniques have difficulties in handling extreme outliers but fuzzy clustering algorithms tend to give them very small membership degree in surrounding clusters.
A systematic approach is to first cluster all objects and then assess the degree to which an object belongs to any cluster. Generally, the rules of assignment of the degree of membership characterizes the fuzzy clustering results. For example, the distance of an object to its cluster center can be used to measure the degree to which the object belongs to a specific cluster. If the elimination of an object results in a substantial improvement in the objective, then we would classify the object as an outlier. In a nutshell, clustering creates a model of the data and anomalies distort that model.
Another way to state if an object is an anomalous point is to calculate a level of “undecidability” of the point; for example, if the point belongs to two clusters with the same degree, then it has a high possibility of being an outlier.
D. Ensemble Outlier Detection
Mainly, an ensemble classical approach to outlier detection combines the outputs of individual outlier detection components by a weighted majority voting rule in a complete unsupervised context. The construction of ensembles is proposed as a solution to increase the individual capacity of each algorithm component and to improve the “anomalousness” of a potential outlier. However, no gain will be obtained by using components whose results are equal. So the discovered outliers sets must have some different anomalous points.
Whilst unsupervised outlier detection algorithms often suffer from high false positive detection rates, an ensemble approaches can be used to reduce these rates and many applications have shown good results to achieve more accurate and reliable anomalies [17].
The ensemble components can be built by applying each approach in Table II. However, the classification-based methods are more common than clustering-based ones [18].
The approach presented here is not a classical clustering-based method, it is a rather unique approach between ensemble methods for anomaly detection, due to its hybrid nature. In fact, on the one hand, it is the consequence of an aggregation clustering method, on the other hand, it exploits its fuzzy implication to assign scores to all points of the dataset, and on the basis of these scores it attributes a level of “outlierness” to the points.
E. Properties of the Algorithms for Outlier Detection
An anomaly detection method can enjoy some properties. The idea presented here is to apply an algorithm for
anomaly detection to a dataset, to remove the discovered anomalous points, and then to apply to the remaining data the same algorithm again.
Let 𝑆 be a set of points, 𝐹 an outlier detection method, and 𝐴 the set of outliers of 𝑆 discovered by 𝐹. In this case we can write 𝐹(𝑆) = 𝐴 . If 𝐹(𝑆 − 𝐴) = ∅ , then 𝐹 is an invariant algorithm for 𝑆 (or 𝑆 is invariant respect to 𝐹). In this case, 𝐹 finds all the outliers of 𝑆 in one fell swoop. If 𝐹 is invariant for each set, simply 𝐹 is invariant.
The mentioned DBSCAN algorithm [4] [9] can be considered as a clustering-based outlier detection method; in a nutshell, the clustering results depend on the radius 𝜀 of the epsilon-range-queries (which are hyperspheres) and on 𝑚 parameter that is the minimum number of data objects required in an epsilon-range-query. For DBSCAN the outliers are noise, i.e., those points belonging to those clusters that have less than 𝑚 elements, and therefore, they are not reached by any epsilon-range-query. Fixing 𝜀 and 𝑚 , DBSCAN is invariant for each set.
The ECF-means algorithm is invariant for some datasets and not for others, as will be shown in the case studies in the next sections.
For the sake of clarity, the invariance property is not a property of the anomaly detection method, but of the set analyzed by the method.
If 𝐹 enjoys the invariance property for each set, then on one hand, 𝐹 is a very “robust” method for outliers detection,

15
International Journal on Advances in Software, vol 12 no 1 & 2, year 2019, http://www.iariajournals.org/software/
2019, © Copyright by authors, Published under agreement with IARIA - www.iaria.org
but on the other hand, the method is a very strong property, or it can be very hard to prove it. It can be relaxed by a more general property explained in Figure 1.
Invariance Property of Order 𝒏
𝑆 = 𝐴0 set of points 𝐹 outlier detection method 𝐴1 the set of outliers of 𝑆 discovered by 𝐹: 𝐴1 = 𝐹(𝑆) = 𝐹(𝐴0) 𝐴2 the set of outliers of 𝐴0 − 𝐴1:
𝐴2 = 𝐹(𝑆 − 𝐹(𝑆)) = 𝐹(𝐴0 − 𝐴1) 𝐴3 the set of outliers of 𝐴0 − (𝐴1 ∪ 𝐴2):
𝐴3 = 𝐹 (𝑆 − (𝐹(𝑆) ∪ 𝐹(𝑆 − 𝐹(𝑆)))) = 𝐹(𝐴0 − (𝐴1 ∪ 𝐴2))
…… 𝐴𝑛 = 𝐹(𝐴0 − (𝐴1 ∪ 𝐴2 ∪ …∪ 𝐴𝑛−1)) 𝐴𝑛+1 = 𝐹(𝐴0 − (𝐴1 ∪ 𝐴2 ∪…∪ 𝐴𝑛))
𝐹 is 𝑛-invariant for 𝑆 if and only if 𝐴𝑛+1 = ∅ and 𝐴𝑛 ≠ ∅
Figure 1. Generic Invariance Property of 𝐹.
In the generic invariance property of 𝐹, 𝐴𝑛+1 ∩ 𝐴𝑛 = ∅ (𝑛 > 0).
III. CLUSTER ANALYSIS
In order to detect potential outliers and to explore the dataset, cluster analysis is widely used in data mining. In this section, some general clustering considerations are shown.
A. Introduction
Clustering, or cluster analysis, belongs to intersection of Statistics, Machine Learning, and Pattern Recognition. It is a very useful unsupervised method for discovery pattern in large amount of data. It is a technique to group a set of objects into subsets or clusters. It is widely used [19] for Data Mining tasks, because it can be easily applied to understand, explore, prepare, and model data. It plays an outstanding role in many applications, such as scientific data exploration, information retrieval and text mining, web analysis, bioinformatics, and many others.
It can be applied at various steps of the Knowledge Discovery in Database (KDD) process. KDD can be carried out according to the Cross Industry Standard Process for Data Mining (CRISP-DM) [10]. Table IV shows the six steps of CRISP and where the cluster analysis can be applied. Some cluster analysis tasks are also reported.
TABLE IV. CRISP-DM STEPS AND CLUSTER ANALYSIS
CRISP-DM Step Name Cluster Analysis Tasks
I Business Understanding --------
II Data Understanding Data Exploration and Description
III Data Preparation Data Selection, Cleaning and Reduction, Features Selection, Gain and Raising
IV Modeling
Generate Test Design, Data Modeling (Segmentation, Associative Rules, …), Model Customization
V Evaluation --------
VI Deployment --------
In the literature, there are many categories of algorithms for clustering: Heuristic-based, Model-based, and Density-based [20]. Their common goal is to create clusters so that objects in the same cluster should be as similar as possible, whereas objects in one cluster should be as dissimilar as possible from objects in the other clusters. Usually, it is not easy to choose the most useful algorithmic approach, the most satisfying result, and therefore, the most usable configuration. In fact, the different models for clustering may produce configurations that are very different from one another. Anyone applying a clustering algorithm immediately realizes how difficult it is to choose the final cluster configuration. We may have different results because we choose different algorithms, or different parameters of the fixed algorithm. Furthermore, the numerous available evaluation metrics often do not facilitate this choice because they lead to very discordant results.
In spite of the availability of a large number of validation criteria, the ability to truly test the quality of a final configuration remains vague and hard to achieve. Specific domain knowledge is not an aid because it is often hard to translate it into operating rules, neither the domain expert has a real target class for evaluating and comparing the results. So, why do not consider all the obtained configurations? That is, why do not find a method that summarizes all the results of clusterings? Meta-learning ensemble methods may be an answer. The idea is that no single model or criterion truly captures the optimal clustering, but a cooperation of models could provide a more robust solution. Cluster Ensemble, or Aggregation Clustering, or Multiview Clustering, aims to find a single clustering from multi-source basic clusterings on the same group of data objects [21]. However, these ensemble methods, such as voting-based clustering [22], consensus clustering [23], or clustering aggregation [24] do not assign a level of membership to every point in clusters.
In order to overcome the limits mentioned above, the ECF-means algorithm can be included within ensemble procedures. It is also an a posteriori criterion for optimization of the obtained groupings. This procedure takes in input any partitioning clustering algorithm for which it is possible to initially choose the 𝑘 number of clusters to be determined and a seed for the random choice of the initial 𝑘 centroids.
The 𝑘-means algorithm is one of the clustering algorithms that checks all the conditions listed. So, it is considered as the reference clustering algorithm. In Weka implementation of 𝑘-means [25] [26], the name of the algorithm is SimpleKMeans; in this version the seed parameter is 𝑠 , which is the initialization value for the random number generator. Using the same seed value will always result in the same initial centroids then. Exploiting this seed parameter, many different configurations are evaluated and compared, and also used in our meta-algorithm for ensemble final configuration.
ECF-means can lead also to a “soft” interpretation of the clusters, in order to better explore and understand the results, and to find possible outliers in the dataset.
B. Definitions and Scope
A Clustering algorithm produces a partition on an unlabeled data set, such that no cluster is empty, no two

16
International Journal on Advances in Software, vol 12 no 1 & 2, year 2019, http://www.iariajournals.org/software/
2019, © Copyright by authors, Published under agreement with IARIA - www.iaria.org
clusters intersect, and the union of all clusters is the data set itself.
The goal is to create clusters that are coherent internally, but substantially different from each other. In a nutshell, objects in the same cluster should be as similar as possible, whereas objects in one cluster should be as dissimilar as possible from objects in the other clusters.
Similarity between objects that belong to a cluster is usually measured by a metrics 𝑑 . Two objects 𝑥 and 𝑦 are similar if the value of 𝑑(𝑥, 𝑦) is small; what “small” means depends on the context of the problem. 𝑑 is defined by some distance measure. Typically, the Euclidean Distance (or simply the squared Euclidean Distance) is widely used in many applications (it is also used in the ECF-means) for the computation of similarities:
𝐸𝐷2(𝑥, 𝑦) =∑(
𝑛
𝑖=1
𝑥𝑖 − 𝑦𝑖)2
It is important to underline that, also depending on the type of data, other many metrics are possible.
Numerous clustering algorithms are available in the literature and there are several points of view for examining clustering techniques; a very good landscape of Clustering algorithms can be retrieved in [20], and an in-depth and complete study of clustering techniques, algorithms and applications can be retrieved in [27].
C. Ensemble Clustering
Different clustering approaches or different views of the data can lead to different solutions to the clustering problem. Indeed, also initial settings of a fixed algorithm may produce clusters that are very different from one another. This evidence is closely related to the theory of Ensemble Clustering (or Multiview Clustering), which studies this issue from a broader perspective [21] [28].
Therefore, instead of running the risk of picking an unsuitable clustering algorithm, a cluster ensemble can be used in order to get a “better” clustering configuration. The idea is that no single model or criterion truly captures the optimal clustering, but a collective of models will provide a more robust final solution.
Most ensemble models use the following three steps to discover the final clusters configuration:
1. Generate 𝑁 different clusterings, by using different approaches, or different data selection, different settings of the same algorithm, or different clusterings provided by different runs of the same algorithm. These represent the ensemble components.
2. Combine the results into a single and more robust clustering, by using a meta-rule or a set of rules.
3. Evaluate the ensemble clustering result and compare it with the results of the 𝑁 components.
As already mentioned, the ensemble components can be selected in a wide variety of ways.
Some strategies for building clustering ensemble components follow:
1. By using different subsets of features. Each clustering configuration is found by means of overlapping or disjoint subsets of the original features set.
2. By selecting different subsets of the data, via random sampling.
3. The different components can be selected combining a variety of models and algorithms such as partitioning, hierarchical or density-based methods, random or deterministic algorithms, and so on.
4. The different components can correspond to different settings of the same algorithm.
5. The different components could be obtained from a single algorithm, randomizing the initial choice of the clusters centroids. Of course, an example is 𝑘-means; thus, the ensemble can be formed as the result of 𝑁 different runs of the algorithm.
After the individual components have been obtained, it is often a challenge to find a meta-rule able to combine the results from these different solutions in order to create a unified ensemble clustering.
D. Hard and Soft Clustering
Clustering algorithms can also be classified into hard and soft algorithms. A hard clustering algorithm leads to a partition of crisp sets. In a crisp set, an element is either a member of the set or not. On the other hand, a soft clustering algorithm leads to fuzzy clusters. Fuzzy sets allow elements to be partially in a set. Each element is given a degree of membership in a set.
One of the most famous fuzzy clustering algorithms is fuzzy 𝑐-means [29] (FC-means), which allows an object to belong to two or more clusters with a membership degree between zero (not an element of the set) and one (a member of the set). It has been widely used in many real-world application domains where well-separated clusters are typically not available.
The ECF-means algorithm leads to a fuzzy partitioning of the dataset, by repeatedly applying the results of the 𝑘-means algorithm, as reported in next sections.
IV. THE 𝑘-MEANS ALGORITHM
𝑘-means is a simple clustering algorithm whose main goal is to find 𝑘 non-overlapping clusters. Each final cluster is represented by its centroid that is typically the mean of the points in that cluster.
A. Introduction, scope and procedure
𝑘 -means is one of the oldest and still widely used algorithms for cluster analysis. Without any doubt, it represents the archetype of the clustering partitioning algorithms. Because of its mathematical simplicity, it is also the most studied unsupervised learning technique [30], and over the years, many of its variations and extensions have been implemented (for High-Dimensional Data, for Data Streams, Time Series, for Data with noise, and so on). 𝑘 -means is also a simple prototype-based clustering
algorithm that uses the centroid of the objects in a cluster as the prototype of the cluster.
Its basic algorithmic structure is shown in Figure 2.

17
International Journal on Advances in Software, vol 12 no 1 & 2, year 2019, http://www.iariajournals.org/software/
2019, © Copyright by authors, Published under agreement with IARIA - www.iaria.org
𝒌-means Clustering Algorithm
Input: S set of instances; 𝑘 number of clusters Output: set of 𝑘 clusters with 𝑘 centroids
1. Randomly initialize 𝑘 cluster centers (centroids) 2. While termination condition is not satisfied { 3. Assign instances to the closest cluster center 4. Update cluster centers using the instances assignment 5. }
Figure 2. 𝑘-means Algorithm.
The condition of termination of the process is satisfied when no point changes clusters.
B. Pros and Cons
The algorithm has been very successful thanks to its simplicity and also for its linear time complexity 𝑂(𝑘𝑛𝑙) , where 𝑛 is the number of objects to be clustered and 𝑙 is the number of iterations that the algorithm is performing.
Like most partitioning clustering algorithms, 𝑘-means has some disadvantages:
1. It is very sensitive to outliers and noise. 2. The number of clusters need to be specified by the
user and often it is not simple to choose it. 3. It is not able to discover concave-shaped clusters. 4. Since the initial choice of 𝑘 centroids is random,
different selections can also lead to very different final partitions, especially for large datasets with many features.
The 𝑘-means algorithm always terminates, but it does not necessarily find the “best” set of clusters.
C. Fuzzy 𝑐-means
The fuzzy 𝑐 -means (FCM) algorithm has got many versions. The code of Figure 3 does not use incremental updates of cluster centroids.
Basic Fuzzy 𝒄-means Algorithm
1. Select an initial fuzzy pseudo-partition, i.e. assign values to all the 𝑤𝑖𝑗
2. repeat 3. Compute the centroid of each cluster using the fuzzy pseudo-
partition 4. Recompute the fuzzy pseudo-partition. i.e., the 𝑤𝑖𝑗 5. until The centroids do not change. (Alternative stopping conditions are “if the change in the error is
below a specified threshold” or “if the absolute change in any 𝑤𝑖𝑗 is below a given threshold.”
Figure 3. Basic Fuzzy c-means Algorithm.
𝑘-means can be regarded as a special case of fuzzy 𝑐-means [4] and the behavior of the two algorithms is quite similar.
V. ENSEMBLE CLUSTERING FUZZIFICATION MEANS
The initial selection of centroids can significantly affect the result of the 𝑘-means algorithm. To overcome this, the algorithm can be run several times for a fixed value of 𝑘, each time with a different choice of the initial 𝑘 centroids.
In many software implementations of 𝑘 -means, for example, in its Weka version, it is possible to choose a seed parameter (𝑠), useful for the random selection of the first initial centroids (𝑠 is the random number seed to be used). Using this parameter, it is possible to realize, as will be described in the following sections, a procedure able to optimize and reinforce the obtained partition.
A. Introduction and Definitions
Let 𝑆 ⊆ ℝ𝑚 be a set of points. Let 𝑘 be the desired number of clusters to be determined. Changing the seed (𝑠) from 0 to 𝑁 − 1 , 𝑁 partitions of 𝑆 can be generated by applying the 𝑘-means algorithm. Some of these partitions are exactly the same, considering or not the order of groupings. Others, however, differ for very few records, and others for many.
In the following 𝑁 × 𝑘 matrix, called Clustering Matrix 𝐶 of 𝑆, each row is a partition of 𝑘 clusters of 𝑆.
𝐶 =
(
𝐶1,1 𝐶1,2 … 𝐶1,𝑘𝐶2,1 𝐶2,2 … 𝐶2,𝑘… … 𝐶𝑖,𝑗 …
𝐶𝑁,1 𝐶𝑁,2 … 𝐶𝑁,𝑘)
𝐶𝑖,𝑗 is the 𝑗-th cluster obtained at the 𝑖-th iteration of the
clustering algorithm, with 𝑖 = 1, … , 𝑁 and 𝑗 = 1,… , 𝑘. It is possible to associate a new 𝑁 × 𝑘 matrix to 𝐶, called
𝑀𝑈 matrix, which is the matrix of the centroids of the clusters:
𝐶 →
(
𝜇(𝐶1,1) 𝜇(𝐶1,2) … 𝜇(𝐶1,𝑘)
𝜇(𝐶2,1) 𝜇(𝐶2,2) … 𝜇(𝐶2,𝑘)
… … 𝜇(𝐶𝑖,𝑗) …
𝜇(𝐶𝑁,1) 𝜇(𝐶𝑁,2) … 𝜇(𝐶𝑁,𝑘))
= 𝑀𝑈
𝜇(𝐶𝑖,𝑗) is the arithmetic mean of the 𝑗-th cluster of the 𝑖-th
iteration of the algorithm, with 𝑖 = 1, … ,𝑁 and 𝑗 = 1,… , 𝑘.
B. Clusters Sort Algorithm
The algorithm in Figure 4 is useful for sorting the clusters partitions of 𝐶 matrix. This step is essential because 𝑘-means can produce different orders of clusters in different runs, even if the partitioning results can be the same.
Please note it is possible that the average of some elements of the second row 𝐶2 in Algorithm 1 has a minimum distance from two or more averages of elements of the first row 𝐶1. In this case, the minimum value of the minimum values is chosen.
C. The ECF-means Algorithm
Let 𝐶 be a Clustering Matrix of 𝑆 , sorted by using the Algorithm 1.
We define 𝑪𝒋 as floor of 𝑪𝒋 : 𝐶𝑗 = ⋂ 𝐶𝑖,𝑗𝑁𝑖=1 , with 𝑗 =
1,… , 𝑘 . It is possible that 𝐶𝑗 = ∅ (𝑗 = 1,… , 𝑘 ). Moreover,
𝑺 = ⋃ 𝐶𝑗𝑘𝑗=1 is defined as the floor of 𝑺.

18
International Journal on Advances in Software, vol 12 no 1 & 2, year 2019, http://www.iariajournals.org/software/
2019, © Copyright by authors, Published under agreement with IARIA - www.iaria.org
Algorithm 1: Clusters Sort Algorithm
Input: two different rows of 𝐶:
𝐶1 = (𝐶1,1, 𝐶1,2, … , 𝐶1,𝑘) and 𝐶2 = (𝐶2,1, 𝐶2,2, … , 𝐶2,𝑘) Output: a new order of the second row: (𝐶′2,1, 𝐶′2,2, … , 𝐶′2,𝑘) = 𝐶′2
𝐶1 represents the reference row of the current sorting procedure (e.g., obtained by fixing 𝑠 = 0 in the Weka 𝑘-means algorithm).
1. Calculate the 2 × 𝑘 matrix of clusters centroids:
𝑀𝑈 = (𝜇(𝐶1,1), 𝜇(𝐶1,2),… , 𝜇(𝐶1,𝑘)
𝜇(𝐶2,1), 𝜇(𝐶2,2),… , 𝜇(𝐶2,𝑘))
2. Compute the Euclidean Distances (𝐸𝐷) in 𝑀𝑈. The following 𝑘 ×𝑘 matrix is the ∆ matrix of the 𝐸𝐷s:
∆= (
𝑑1,1 𝑑1,2 … 𝑑1,𝑘𝑑2,1 𝑑2,2 … 𝑑2,𝑘… … … …𝑑𝑘,1 𝑑𝑘,2 … 𝑑𝑘,𝑘
)
Where:
𝑑𝑖,𝑗 = 𝐸𝐷 (𝜇(𝐶1,𝑖), 𝜇(𝐶2,𝑗)), with 𝑖, 𝑗 = 1,… , 𝑘.
3. Calculate the minimum value of each row of ∆. min{𝑑1,1, 𝑑1,2,… , 𝑑1,𝑘} = 𝑑1,𝑗1 = 𝑚𝑖𝑛1
min{𝑑2,1, 𝑑2,2, … , 𝑑2,𝑘} = 𝑑2,𝑗2 = 𝑚𝑖𝑛2 ……………… min{𝑑𝑘,1, 𝑑𝑘,2, … , 𝑑𝑘,𝑘} = 𝑑𝑘,𝑗𝑘 = 𝑚𝑖𝑛𝑘
4. The second row 𝐶′2 is:
(𝐶′2,1, 𝐶′2,2, … , 𝐶′2,𝑘) = (𝐶2,𝑗1 , 𝐶2,𝑗2, … , 𝐶2,𝑗𝑘 )
Where: 𝐶′2,1 = 𝐶2,𝑗1 is the cluster (in 𝐶2) that has the centroid with the minimum distance from the centroid of the first element of 𝐶1. ……… 𝐶′2,𝑘 = 𝐶2,𝑗𝑘 is the cluster (in 𝐶2) that has the centroid with the
minimum distance from the centroid of the 𝑘-th element of 𝐶1.
Figure 4. Clusters Sort Algorithm.
Let 𝑥 be an element of 𝑆; we can count the number of clusters of the first column of 𝐶 where 𝑥 is, the number of clusters of the second column of 𝐶 where 𝑥 is, and so on. In this way, we can associate a new numerical vector to 𝑥, called attitude of 𝒙 (𝑎𝑡𝑡(𝑥)):
𝑎𝑡𝑡(𝑥) = (𝑎𝑡𝑡1(𝑥), 𝑎𝑡𝑡2(𝑥), … , 𝑎𝑡𝑡𝑘(𝑥)),
where 𝑎𝑡𝑡𝑗(𝑥) is the number of clusters in the 𝑗-th column of
𝐶 where 𝑥 is located. 𝑎𝑡𝑡𝑗(𝑥) = 𝑁 ⇔ 𝑥 ∈ 𝐶𝑗 and
∑ 𝑎𝑡𝑡𝑗(𝑥)𝑘𝑗=1 = 𝑁. In this manner, we are defining a function
𝑎𝑡𝑡𝑗 (𝑗 = 1,… , 𝑘 and 𝐼 = {1,2, … , 𝑁}):
𝑎𝑡𝑡𝑗: 𝑥 ∈⋃𝐶𝑖,𝑗𝐼
→ 𝑎𝑡𝑡𝑗(𝑥) = |{𝑖 ∈ 𝐼: 𝑥 ∈ 𝐶𝑖,𝑗}|
where, as usual, |𝐴| is the number of the elements of the set 𝐴. Finally, we can define the probability vector of 𝒙, as:
𝑝(𝑥) = (𝑎𝑡𝑡1(𝑥)
𝑁,𝑎𝑡𝑡2(𝑥)
𝑁,… ,
𝑎𝑡𝑡𝑘(𝑥)
𝑁)
Thanks to the simple mathematical notions of the current section, we are able to “soften” the “hard” 𝑘-means algorithm and we can have a new Fuzzy Clustering Algorithm. According to this approach, each element of the dataset belongs to each cluster with a different degree of membership, and the sum of these probabilities is equal to one.
Furthermore, the method can also be interpreted in a different way. Indeed, this “fuzzification” procedure can be used not only with 𝑘-means algorithm, but also for others partitional clustering algorithms for which it is possible to choose the number of clusters to be determined. In this way, the algorithm is part of the Ensemble algorithms. For these reasons, ECF-means is also a meta-algorithm because we reach a fuzzy partition of the dataset by using a multiple clustering algorithm schema.
The Algorithm 2 of Figure 5 is able to assign a probability membership to each point of the dataset and to “slice” the data in clusters.
Algorithm 2: ECF-means (Fuzzification of 𝒌-means)
Input: 𝑆 ⊆ ℝ𝑚 ; number 𝑘 of clusters to be determined; membership threshold 𝑡 (0≤ 𝑡 ≤ 1); number 𝑁 of 𝑘 -means iterations Output: set of 𝑘 clusters of level 𝑡; probability vector of each element 𝑥 of 𝑆
1. Apply the 𝑘-means algorithm to 𝑆, fixing the random seed 𝑠 = 0, obtaining the clusters 𝐶0,1, … , 𝐶0,𝑘 (𝐶(0)-configuration)
2. foreach 𝑠 = 1,… , 𝑁 − 1 3. Apply the 𝑘-means algorithm to 𝑆, obtaining the clusters
𝐶′𝑠,1, … , 𝐶′𝑠,𝑘 (𝐶′(𝑠)-configuration) 4. Apply the Clusters Sort Algorithm to 𝐶′(𝑠), considering
𝐶(0) as reference, obtaining the clusters 𝐶𝑠,1, … , 𝐶𝑠,𝑘 (𝐶(𝑠)-configuration)
5. end 6. foreach 𝑗 = 1,… , 𝑘 7. foreach 𝑥 ∈ 𝑆 8. Calculate 𝑝𝑗(𝑥) = 𝑎𝑡𝑡𝑗(𝑥)/𝑁 9. Fix the cluster 𝐶𝑗
𝑡 = {𝑥 ∈ 𝑆| 𝑝𝑗(𝑥) ≥ 𝑡}
10. end 11. end
Figure 5. ECF-means Algorithm.
The membership threshold 𝑡 in the Algorithm 2 is fixed by the user and it is very useful to change the “level” to clusters
final configuration. If 𝑡 = 1, then 𝐶𝑗1 = {𝑥 ∈ 𝑆|𝑝𝑗(𝑥) = 1} =
𝐶𝑗 . Additionally, 𝑆 = ⋃ 𝐶𝑗1𝑘
𝑗=1 . If 𝑡 = 0 , then 𝐶𝑗0 = {𝑥 ∈
𝑆|𝑝𝑗(𝑥) ≥ 0} and ⋃ 𝐶𝑗0𝑘
𝑗=1 = 𝐶𝑗0 = 𝑆.
Let 𝑝(𝑥) be the probability vector of 𝑥 and let 𝑀 =max 𝑎𝑡𝑡(𝑥) = max{𝑎𝑡𝑡1(𝑥), 𝑎𝑡𝑡2(𝑥), … , 𝑎𝑡𝑡𝑘(𝑥)} be the maximum of 𝑎𝑡𝑡(𝑥), if this exists. We can define the position of 𝑀 in 𝑎𝑡𝑡(𝑥) as 𝑃𝑀𝐴(𝑥), if this exists.
D. 𝑜-rank Fuzzy Outlier
As has been defined, to each point of the dataset it is possible to associate a probability vector, which is as matter of fact a vector of degrees of memberships. What happens if we cannot unambiguously identify the cluster to which the point belongs? What happens if the two highest components

19
International Journal on Advances in Software, vol 12 no 1 & 2, year 2019, http://www.iariajournals.org/software/
2019, © Copyright by authors, Published under agreement with IARIA - www.iaria.org
of the vector are equal (or almost equal)? In this case, two interpretations are possible; the “ambiguity”:
1. depends on the clustering procedure, for example, on
the choice of 𝑘 or on the selection of the number 𝑁 of iterations,
2. is intrinsic to the point because the point is an anomaly.
The first interpretation leads to the definition of a novelty validation measure called Threshold Index 𝑇𝐼 , which is reported in the next section. Thanks to the second interpretation it is possible to define a new particular type of outlier, called 𝑜-rank fuzzy outlier.
An element 𝑥 ∈ 𝑆 is an 𝒐 -rank fuzzy outlier of 𝑺 if 𝑝𝑗(𝑥) − 𝑝𝑙(𝑥) ≤ 𝑜 (0 ≤ 𝑜 ≤ 1), where 𝑝𝑗(𝑥) and 𝑝𝑙(𝑥) are
the first two highest value components of 𝑝(𝑥) . The 𝑜 parameter is also named “outlier threshold”.
The definition of 𝑜-rank fuzzy outlier helps us to treat these points as special points, which need to be observed more closely, because they belong at least to two different clusters, with a degree of “ambiguity”.
The 𝑜 parameter allows to create a hierarchy of outliers; that is, 𝑜 represents a score to be assigned to each point of the dataset. For example, if 𝑘 = 3 and 𝑝(𝑥1) = (1, 0, 0), 𝑝(𝑥2) = (0.1, 0.45, 0.45), 𝑝(𝑥3) = (0.75, 0.05, 0.2), and 𝑝(𝑥4) = (0.5, 0.4, 0.1), then:
𝑥1, 𝑥2, 𝑥3, 𝑥4 are 1-rank outliers
𝑥2, 𝑥3, 𝑥4 are 0.55-rank outliers
𝑥2, 𝑥4 are 0.1-rank outliers
𝑥2 is a 0-rank outlier
The set of 1-rank fuzzy outliers of 𝑆 is 𝑆; the set of 1-rank fuzzy outliers of 𝑆 that aren’t 𝑜-rank fuzzy outlier, with 𝑜 <1 , is the floor of 𝑆. From the “ 𝑜 -rank fuzzy outlier” perspective, each point in the dataset is an outlier.
The 𝑜-rank fuzzy outliers, where 𝑜 is close to 0, are the most interesting points of the dataset, which need to be analyzed separately from the rest of the other points. Their fuzzy nature pushes us to a deepening, also to understand if they are “polluting” elements of the dataset, or they are wrongly selected by the algorithm and, therefore, they are ambiguous points for the algorithm but not anomalous in the dataset, or they constitute the main objective of detection.
If ECF is considered a method for outliers detection, and if 𝑜.FOU is the set of 𝑜-rank fuzzy outliers of 𝑆, it could be very interesting to find the highest 𝑜 for which ECF-means is invariant for 𝑆, naturally if a such 𝑜 exists:
max {𝑜: 𝐸𝐶𝐹(𝑆 − 𝑜. 𝐹𝑂𝑈) = ∅}
For this selected 𝑜, the set of 𝑜-rank fuzzy outliers of 𝑆 that make ECF-means an invariant method for outliers detection is a special subset that has to be detailed.
E. Updates to the New Version of the Algorithm
As pointed in the previous sections, changing the seed (𝑠) from 0 to 𝑁 − 1 , 𝑁 partitions of 𝑆 can be generated by applying the 𝑘-means algorithm. Some of these partitions are exactly the same, considering or not the order of groupings. In
this new version of the algorithm, after applying the clusters sorting algorithm, all the identical configurations are deleted, leaving only all the different partitions. Obviously, two partitions are different if they have at least one element that belongs to two different clusters of the two partitions.
This change effects on the whole designed method. As consequence of this choice, all the ensemble results and the evaluation indexes are calculated on the number of different obtained partitions and not on the total number of performed iterations.
Two different seeds could lead to the same partition because through them the same initial centroids are selected, or because of some topological reason, which is for the geometric distributions of the elements in the dataset. It might be interesting to find out some rules by which different selections of the initial centroids lead to the same final configuration and to discover if a pattern exists for these elements. This change was made above all to avoid that the Weka algorithm based on the seed (𝑠) too often chooses the same initial centroids and, therefore, that the corresponding partitions are too privileged and impact on the final result.
Even the case studies presented have clearer results thanks to the changes that have been made, and the new validation index facilitates the interpretation of the achieved results.
Note that, especially for small datasets, the possible different final configurations can be very few; in this case, an ensemble approach can be superfluous or even useless.
VI. CLUSTER VALIDITY ASSESSMENT
Clustering validation has long been recognized as one of the critical issues essential to success of clustering applications [27].
A. Introduction
One of the most important issues in clusters analysis is the evaluation of the clustering results. In order to compare the outputs of different clustering algorithms, or the different partitions retrieved by the same clustering algorithm by using different parameters, it is necessary to develop some validity criteria. Moreover, if the number of clusters is not given by the clustering algorithm, many cluster validity methods have been developed in the literature; indeed, to find the optimal number of clusters in the data set is a very central task in data analysis. These methods lead to many different indices, specialized for the various categories and approaches of clustering algorithms; moreover, the methods are usually divided in supervized and un-supervized methods, or in internal and external validation criteria [27].
Most validation indices take into account the concepts of cohesion and separation [31]; therefore, the index is a measure that “optimizes”:
Cohesion, also called compactness or tightness: patterns in one cluster should be as similar to each other as possible. The fitness variance of the patterns in a cluster is an indication of the cluster’s cohesion.
Separation: clusters should be well separated. Distance among the representatives of the clusters provides an indication of cluster separation.

20
International Journal on Advances in Software, vol 12 no 1 & 2, year 2019, http://www.iariajournals.org/software/
2019, © Copyright by authors, Published under agreement with IARIA - www.iaria.org
B. Silhouette Index
One of the most widespread and useful indices is the Silhouette [32] [33]. The Silhouette method is an unsupervized method (it does not need a class attribute to calculate it) for evaluation of clusterings. It is a measure of how similar an object is to its own cluster (cohesion) compared to other clusters (separation).
The Silhouette index is calculated strarting from the definition of the silhouette of each point of the dataset. The silhouette 𝑠(𝑖) of a point 𝑖 is calculated by the following formula:
𝑠(𝑖) =𝑏(𝑖) − 𝑎(𝑖)
max {𝑎(𝑖), 𝑏(𝑖)}
Where:
𝑠(𝑖) is the silhouette of 𝑖 𝑖 is a generic point in the dataset;
𝑎(𝑖) is the average distance between 𝑖 and all other data within the same cluster.
𝑏(𝑖) is the smallest average distance of 𝑖 to all points in any other cluster, of which 𝑖 is not a member.
From the above definition it is clear that −1 ≤ 𝑠(𝑖) ≤ 1. The Silhouette index is the aritmetic mean of the
silhouettes of each point in the dataset. A value of the Silhouette index far from zero expresses a
good result of the clustering algorithm.
C. Validation Measures for Fuzzy Clustering
Let 𝑈 = (𝑢𝑙𝑖) (1 ≤ 𝑙 ≤ 𝑘, 1 ≤ 𝑖 ≤ 𝑛) be the membership’s matrix of a fuzzy partition of a dataset 𝑆 with 𝑛 records, and 𝑘 is the number of clusters.
The first validity index for fuzzy clustering is the Partition Coefficient Index (𝑃𝐶) [34]. 𝑃𝐶 is based on 𝑈 and it is defined as:
𝑃𝐶 =1
𝑛∑∑𝑢𝑙𝑖
2
𝑛
𝑖=1
𝑘
𝑙=1
𝑃𝐶 ∈ [1 𝑘⁄ , 1] . Furthermore, a 𝑃𝐶 value close to 1 𝑘⁄ indicates that clustering is “very fuzzy”; the value 1 𝑘⁄ is obtained when 𝑢𝑙𝑖 = 1 𝑘⁄ , for each 𝑙, 𝑖.
Another index is the Partition Entropy Coefficient (𝑃𝐸):
𝑃𝐸 = −1
𝑛∑∑𝑢𝑙𝑖𝑙𝑜𝑔𝑎(𝑢𝑙𝑖)
𝑛
𝑖=1
𝑘
𝑙=1
𝑃𝐸 ∈ [0, 𝑙𝑜𝑔𝑎𝑘]. Furthermore, a low 𝑃𝐸 value indicates that clustering is “not very fuzzy”. 𝑃𝐸 values close to the upper limit indicate an absence of any clustering structure within the dataset or the inability of the algorithm to extract it.
The main disadvantage of 𝑃𝐶 and 𝑃𝐸 is their monotonic evolution tendency with respect to 𝑘 . To avoid this, a modification of the 𝑃𝐶 index can reduce the monotonic tendency and was defined by:
𝑀𝑃𝐶 = 1 − 𝑘
𝑘 − 1 (1 – 𝑃𝐶)
where 0 ≤ 𝑀𝑃𝐶 ≤ 1. Finally, let we define a novel validity index, which we call
the Threshold Index 𝑻𝑰, by the following formula:
𝑇𝐼 =|𝑆|
|𝑆|
𝑇𝐼 provides a measure of the quantity of elements in the dataset that are fixed in every partition (they belong to the floor set) with respect to the size of the whole dataset.
Finally, if 𝑜.FOU is the set of 𝑜-rank fuzzy outliers, then let we define the 𝒐-rank fuzzy outlier index (𝒐. 𝑭𝑶𝑼𝑰), by the following formula:
𝑜. 𝐹𝑂𝑈𝐼 =|𝑜. 𝐹𝑂𝑈|
|𝑆|
𝑜. 𝐹𝑂𝑈𝐼 tells how many elements in the dataset are 𝑜-rank fuzzy outliers with respect to the size of the whole dataset.
Thanks to these validation measures, it is possible to have a rough idea of the fuzzy nature of the whole dataset and, thanks to 𝑜. 𝐹𝑂𝑈𝐼, if too many points are outliers, then it is necessary to modify the parameters of the algorithm, such as 𝑘 or 𝑁. For this reason, they are useful to better select these parameters.
VII. ECF-MEANS TOOL V2.0
With the purpose of testing the ECF-means algorithm, a software application has been designed and developed. It has been carried on using a Client/Server architectural pattern, where the Server part consists of the algorithm and other support utilities, while the Client part is made by a browser-based application, responsible of the ECF-means result visualization.
The algorithm had an important update and it leads to a new version of the software tool, and that is why we have renamed the tool updating it to the version 2.0. However, the tool presents an option to choose whether to keep the old version of the algorithm, leaving even the same configurations, or go to version 2.0, deleting the same partitions.
A. Software Implementation
The ECF-means web application is built up of two main modules: the first one wraps the ECF-means Algorithm that has been implemented in Java programming language, and it makes use of the Weka 𝑘-means algorithm (SimpleKMeans) [25] [35] as clustering algorithm implementation.
The second module consists of the web application client part, which has been implemented by using JavaScript libraries, such as D3.js, as visualization library, and jQuery for Ajax asynchronous data communication and Document Object Model (DOM) manipulation tasks.
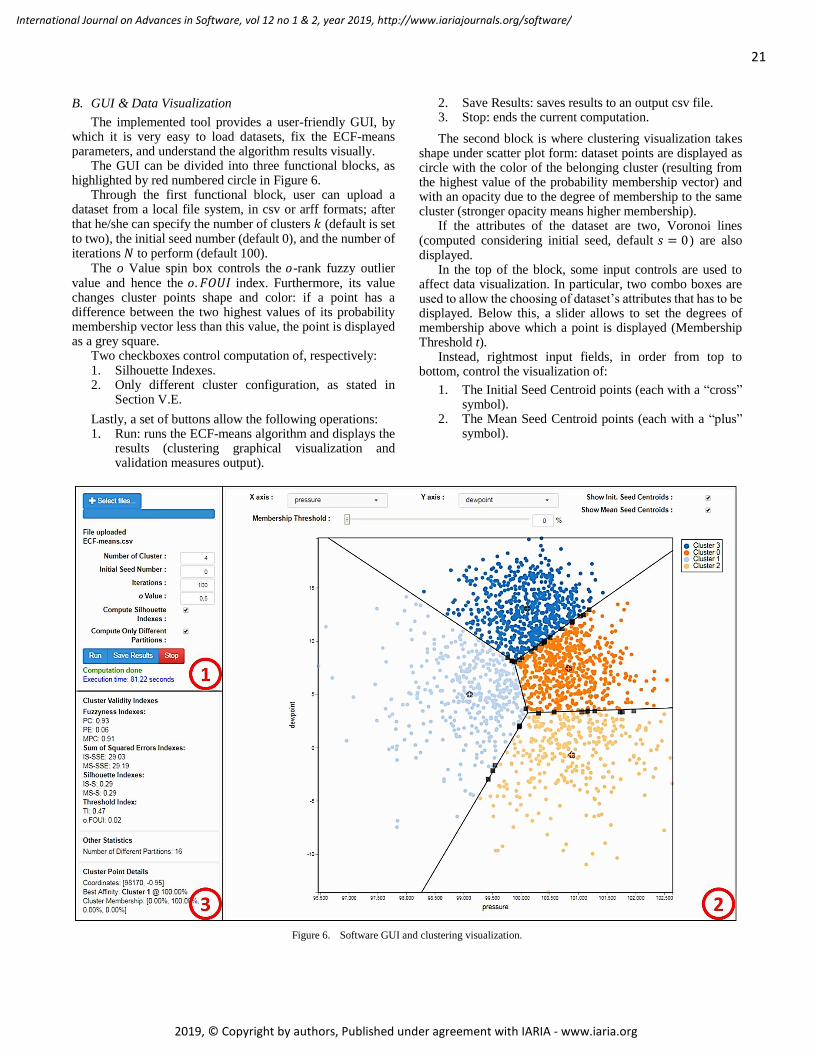
21
International Journal on Advances in Software, vol 12 no 1 & 2, year 2019, http://www.iariajournals.org/software/
2019, © Copyright by authors, Published under agreement with IARIA - www.iaria.org
B. GUI & Data Visualization
The implemented tool provides a user-friendly GUI, by which it is very easy to load datasets, fix the ECF-means parameters, and understand the algorithm results visually.
The GUI can be divided into three functional blocks, as highlighted by red numbered circle in Figure 6.
Through the first functional block, user can upload a dataset from a local file system, in csv or arff formats; after that he/she can specify the number of clusters 𝑘 (default is set to two), the initial seed number (default 0), and the number of iterations 𝑁 to perform (default 100).
The o Value spin box controls the 𝑜-rank fuzzy outlier value and hence the 𝑜. 𝐹𝑂𝑈𝐼 index. Furthermore, its value changes cluster points shape and color: if a point has a difference between the two highest values of its probability membership vector less than this value, the point is displayed as a grey square.
Two checkboxes control computation of, respectively: 1. Silhouette Indexes. 2. Only different cluster configuration, as stated in
Section V.E.
Lastly, a set of buttons allow the following operations: 1. Run: runs the ECF-means algorithm and displays the
results (clustering graphical visualization and validation measures output).
2. Save Results: saves results to an output csv file. 3. Stop: ends the current computation.
The second block is where clustering visualization takes shape under scatter plot form: dataset points are displayed as circle with the color of the belonging cluster (resulting from the highest value of the probability membership vector) and with an opacity due to the degree of membership to the same cluster (stronger opacity means higher membership).
If the attributes of the dataset are two, Voronoi lines (computed considering initial seed, default 𝑠 = 0) are also displayed.
In the top of the block, some input controls are used to affect data visualization. In particular, two combo boxes are used to allow the choosing of dataset’s attributes that has to be displayed. Below this, a slider allows to set the degrees of membership above which a point is displayed (Membership Threshold t).
Instead, rightmost input fields, in order from top to bottom, control the visualization of:
1. The Initial Seed Centroid points (each with a “cross” symbol).
2. The Mean Seed Centroid points (each with a “plus” symbol).
Figure 6. Software GUI and clustering visualization.

22
International Journal on Advances in Software, vol 12 no 1 & 2, year 2019, http://www.iariajournals.org/software/
2019, © Copyright by authors, Published under agreement with IARIA - www.iaria.org
The last third block is divided into three box panels: in the first one the validation measures are displayed, as described in Section VI.C, such as 𝑃𝐶, 𝑃𝐸, 𝑀𝑃𝐶, 𝑇𝐼, and 𝑜. 𝐹𝑂𝑈𝐼. In addition, Sum of Squared Errors (SSE) and Silhouette (S) measures have also been included; they are calculated considering Initial Seed (IS) and Mean Seed (MS), where MS is the mean value of the measure over all the 𝑁 iterations, which lead to the definition of IS-SSE, MS-SSE, IS-S, and MS-S. Below this box, a second box displays the number of different retrieved partitions.
Lastly, in the bottom part of the block, a popup panel is displayed when a user clicks on a cluster point, where information about this clicked point are reported, such as point features, cluster memberships vector, best cluster assignment, etc.
C. Output Results
The ECF application exports results in csv format, where each row of the output file represents a point 𝑥 of the dataset. The application appends ECF-means algorithm results as additional columns to the attributes columns of the point 𝑥.
TABLE V. COLUMN NAMES MEANING
Column Names Description
ISCDistance𝑖, with 𝑖 = 1,… , 𝑘
Vector of Euclidean Distances between point 𝑥 and Initial Seed Centroids
ISCMembership Cluster membership derived from the position of the smallest value in ISCDistance vector
MSCDistance𝑖 , with 𝑖 = 1,… , 𝑘
Vector of Euclidean Distances between point 𝑥 and Mean Seed Centroids
MSCMembership
Cluster membership derived from the position of the smallest value in MSCDistance vector
Membership𝑖, with 𝑖 = 1,… , 𝑘
Probability vector of point 𝑥, 𝑝(𝑥)
ECFMembership Cluster membership derived from the 𝑃𝑀𝐴(𝑥)
o-rank fuzzy outlier
Y, if the point 𝑥 is an o-rank fuzzy outlier, where o is fixed through the o Value input box by the user N, otherwise
Table V shows these additional column names meaning, where Mean Seed Centroid (MSC) is the arithmetic mean value of all computed centroids in 𝑁 iterations.
VIII. CASE STUDY 1: THE WINE DATASET
The Wine dataset from the UCI Machine Learning Repository [36] is widely mined both by applying classification algorithms and clustering techniques. Chemical indicators are used in order to analyze the wine dataset. This case study is useful to underline the differences between classical methods for outlier detection and ECF-means.
A. Dataset Exploration
The Wine dataset has got 178 instances described by 13 attributes, with no missing values, and divided into three classes {0, 1, 2}, with the distribution [59, 71, 48]. These data are the results of a chemical analysis of wines grown in the same region in Italy but derived from three different cultivars.
The analysis determined the quantities of 13 constituents found in each of the three types of wines.
TABLE VI. LIST OF WINE DATASET VARIABLES (FEATURES)
# Name # Name
1 Alcohol 8 Nonflavanoid phenols
2 Malic acid 9 Proanthocyanins
3 Ash 10 Color intensity
4 Alcalinity of ash 11 Hue
5 Magnesium 12 OD280/OD315 of diluted wines
6 Total phenols 13 Proline
7 Flavanoids
The attributes (variables) are listed in Table VI.
B. Outliers Detection with RapidMiner Tool
The RapidMiner tool [37] provides a series of case studies for data analysis by using machine learning techniques, and one of these concerns outlier detection in Wine dataset. The goal of these case study is to select anomalies in data resulting from a chemical analysis of wines by finding the data clusters and, then, identifying the anomalies based on local outlier factors. The clusters are achieved by applying the 𝑋-means algorithm [38] which determines the correct number of centroids based on a heuristic. Briefly, 𝑋 -means is an extended version of 𝑘-means. It begins with a minimum set of centroids and then iteratively exploits if using more centroids makes sense according to the data. If a cluster is split into two sub-clusters is determined by the Bayesian Information Criteria (BIC), balancing the trade-off between precision and model complexity.
TABLE VII. 𝑋-MEANS RESULTS
Cluster Number of
Items cluster_0 51
cluster_1 62
cluster_2 29
cluster_3 36
Tot 178
TABLE VIII. LIST OF OUTLIERS
# Id Cluster Thershold
1 26 cluster_1 1.605
2 60 cluster_0 1.744
3 70 cluster_0 1.867
4 72 cluster_0 1.538
5 74 cluster_1 1.963
6 79 cluster_0 1.611
7 96 cluster_1 1.880
8 97 cluster_0 1.534
9 111 cluster_0 1.655
10 122 cluster_1 1.943
11 159 cluster_3 1.684
The outliers are detected by find the “outlier scoring” using the LOF (local outlier factor) mechanism [39]. The examples are filtered to get one data set with the outliers and another with the rest (non-anomalous points), using “outlier=1.5” as a threshold. Then, the outputs of the

23
International Journal on Advances in Software, vol 12 no 1 & 2, year 2019, http://www.iariajournals.org/software/
2019, © Copyright by authors, Published under agreement with IARIA - www.iaria.org
RapidMiner analysis flow are the clustered data and two example sets with the outliers/non-outliers records.
The 𝑋-means algorithm provides 4 clusters, as reported in Table VII.
The outliers set, which we call 𝑂𝑈𝑇 , provided by the RapidMiner flow, consists of 11 anomalies reported in Table VIII.
The set 𝑂𝑈𝑇 of anomalies will be compared with the set of outliers obtained by the ECF-means algorithm, in order to discover if there is an 𝑜-rank threshold such that the two sets have some elements in common (𝑂𝑈𝑇 ∩ 𝑜. 𝐹𝑂𝑈 ≠ ∅).
C. DBSCAN Algorithm Application
The mentioned DBSCAN algorithm can be applied in order to detect noise in the Wine dataset. Fixing 𝜀 = 0.6 and 𝑚 = 5 in the Weka algorithm version, DBSCAN retrieves one cluster and provides 11 unclustered instances (noises), which are listed in Table IX, and they form the set 𝑁𝑂𝐼.
TABLE IX. LIST OF NOISES
# Id 𝑶𝑺
1 60 YES 2 70 YES
3 74 YES
4 79 YES
5 96 YES
6 97 YES
7 111 YES
8 116 NO
9 122 YES
10 125 NO
11 159 YES
In the third column of Table IX, the “YES” value says if the unclustered instance is also in 𝑂𝑈𝑇 set.
D. ECF-means Application
The ECF-means tool provides some different results. First of all, by changing 𝑘 from 2 to 5, the best clustering outcomes are obtained by selecting 𝑘 = 3. In Table X the validation measures are listed and they are calculated by fixing I = 500, which is the total number of performed iterations. #DP indicates the number of different partitions obtained during the 500 performed iterations.
TABLE X. VALIDATION MEASURES (I=500)
𝒌 MPC MS-S TI #DP
2 0.21 0.4 0.01 8
3 0.89 0.48 0.62 21
4 0.65 0.42 0.27 246
5 0.57 0.41 0 466
In spite of the fuzzy nature of the analyzed dataset (MPC=0.89), setting 𝑘 = 3 the values of the Silhouette (MS-S = 0.48) and of the Threshold Index (TI = 0.62) are the highest of the list.
The floor 𝑆 of Wine dataset has got 110 instances; these
elements do not have a fuzzy nature (or a degree of “ambiguity”), and the first cluster has got only one element, the second one has got 58 elements, and the third one has got
51 elements. Set 𝑆 − 𝑆 contains potential outliers, and by
changing the 𝑜 parameter, different levels of 𝑜 -rank fuzzy outliers are obtained, as Table XI shows.
TABLE XI. LIST OF 𝑜-RANK FUZZY OUTLIERS
𝒐 𝒐-𝑭𝑶𝑼𝑰 Id of 𝒐-rank
fuzzy outliers 0.05 0.01 69
0.1 0.01 69
0.15 0.01 69, 74
0.25 0.02 69, 72, 74
0.35 0.03 61, 69, 71, 72, 74, 75
𝑝(69) = (0.5238, 0, 0.4762) is the probability vector of the element with Id = 69, whilst the probability vector of 74 is 𝑝(74) = (0.4286, 0.5714, 0) . The element 72, which is a 0.25-rank fuzzy outlier is not a real outlier because it is not an ambiguous element, considering its probability vector 𝑝(72) = (0.619, 0.381, 0).
The detected 0.15-rank fuzzy outliers, discovered by the ECF-means algorithm, listed in Table XI, form the 0.15 -𝐹𝑂𝑈 = {69, 74} set.
The intersection set 𝑂𝑈𝑇 ∩ 𝑁𝑂𝐼 ∩ 0.15.𝐹𝑂𝑈 is {74} and this point does not represent anything new.
However, the new detected point, marked with id = 69, is really halfway between the first cluster and the third one and its discovery makes us understand how the proposed ECF-means method is able to enrich our knowledge on the analyzed dataset. Moreover, this point is found also by the RapidMiner outlier detection process, using “outlier=1.3” as threshold of the selecting filter, instead of 1.5.
IX. CASE STUDY 2 IN METEOROLOGICAL DOMAIN
The application of the ECF-means algorithm to the meteorological dataset [40] has been extensively presented in [1], where numerous results have been described. To deepen the nature of the dataset and to have an example of data analysis, you can consult [41].
This case study is useful for explaining how the algorithm is able to explore even datasets with numerous records, how the number of discovered outliers increases with the increase of the 𝑜 parameter, and how the “ambiguous” points also belong to overlapping geographical areas.
A. Summary of the Previous Results
Briefly, in this section a summary of the results of the ECF-means application is presented.
An historical dataset made up of 9200 meteorological observations has been collected. Data have been retrieved from ECMWF MARS Archive containing the surface Synoptic observations (SYNOP) provided by 4 geographical sites: Charles De Gaulle (CDG) airport in Paris and Grazzanise, Milan, and Pantelleria airports in Italy.
SYNOP observations are recorded every hour and the list of the meteorological variables [41] used for applying the ECF-means algorithm is reported in Table XII. Each airport site has got 2300 records and the SITE attribute has 4 values.
Considering the Silhouette measure, the best clustering partition is obtained by selecting 𝑘 = 3 for 𝑘 -means

24
International Journal on Advances in Software, vol 12 no 1 & 2, year 2019, http://www.iariajournals.org/software/
2019, © Copyright by authors, Published under agreement with IARIA - www.iaria.org
algorithm (Silhouette=0.49). Fixing 𝑘 = 3 and considering SITE attribute as Class attribute, CDG and Milan are inserted into the same cluster (Cluster 0) by the algorithm (4 sites in 3 clusters): it seems that the two sites have a lot in common! Thus, we try to merge these two sets, obtaining a new set called CDG+MIL.
TABLE XII. LIST OF METEOROLOGICAL VARIABLES (FEATURES)
# Name # Name
1 Pressure 6 cloud cover
2 three-hour pressure change 7 height of base of cloud
3 wind direction 8 Dewpoint Temperature
4 wind speed 9 Drybulb Temperature
5 Visibility 10 SITE
The incorrectly clustered instances are 3710 and represent 40.32% of the original dataset. 𝑘 -means does not provide homogeneous clusters with respect to SITE attribute. From an intuitive point of view, the 3 sites (Grazzanise, Pantelleria and CDG+MIL) have an ambiguous meteorological nature and the 3710 unclustered instances are on the border between two or more sites. In other words, the datasets have overlapping areas, with “similar” meteorological conditions, and perhaps the sites are not so different, and they are not well-separated from each other.
The ECF-means algorithm tries to overcome the problem in which the 𝑘-means algorithm falls in this meteorological case study, and in part it succeeds, if only because it provides much more information on datasets, clusters, and on clustering results, thanks to which the data analyst can make more informed and useful choices.
By fixing 𝑘 = 3, thanks to the ECF-means application, we are able to select the floor 𝑆 of whole dataset. It has got 5363
records. The incorrectly clustered instances are 704 and represent 13.12% of 𝑆.
The elements belonging to 𝑆 never fluctuate from one
cluster to another (considering the 350 iterations) and constitute approximately 58.3% of the initial dataset.
The obtained results lead to a clear improvement of the clustering: the clusters seem much more separate, if the contingency matrices are calculated starting from the floor set. ECF-means manages to break down the percentage of instances that are incorrectly clustered from 40.32% to 13.12%.
B. Outlier Detection by Applyng the InterquartileRange
The Weka tool provides a filter for detecting outliers and extreme values based on interquartile ranges. It can be found among the filters in the preprocess tab. The filter complies with the following schema:
A point 𝑥 is an outlier ⇔
{𝑄3 + 𝑂𝐹 ∗ 𝐼𝑄𝑅 < 𝑥 < 𝑄3 + 𝐸𝑉𝐹 ∗ 𝐼𝑄𝑅
𝑜𝑟𝑄1 − 𝐸𝑉𝐹 ∗ 𝐼𝑄𝑅 ≤ 𝑥 < 𝑄1 − 𝑂𝐹 ∗ 𝐼𝑄𝑅
A point 𝑥 is an extreme value ⇔
{𝑥 > 𝑄3 + 𝐸𝑉𝐹 ∗ 𝐼𝑄𝑅
𝑜𝑟𝑥 < 𝑄1 − 𝐸𝑉𝐹 ∗ 𝐼𝑄𝑅
Where:
𝑄1 = 25% quartile,
𝑄3 = 75% quartile,
𝐼𝑄𝑅 = Interquartile Range, difference between 𝑄1 and 𝑄3,
𝑂𝐹 = Outlier Factor,
𝐸𝑉𝐹 = Extreme Value Factor.
The filter adds two new columns to the dataset: Outlier and ExtremeValue, which assume the values “yes” or “no”, depending on the previous filter schema.
The dataset is divided by the three sites: Grazzanise, Pantelleria and CDG+MIL, and then, fixing 𝑂𝐹 = 3.0 and 𝐸𝑉𝐹 = 6.0, the filter is applied to the three geographical sites separately.
Table XIII shows the number and the percentages of the outliers and of the extreme values discovered by the Weka filter.
TABLE XIII. SYNOP OUTLIERS AND EXTREME VALUES
Grazzanise Pantelleria CDG+MIL
Outlier 144 (6.3%) 267 (11.6%) 319 (6.9%)
Extreme Values 65 (2.8%) 141 (6.1%) 157 (3.4%)
These values are statistical outliers and they depend on the distributions of all the meteorological variables.
By removing these points, putting together the three subsets, the residual dataset has got 8365 instances (some elements are both outliers and extreme values), and the three sites have the distribution [2145, 2012, 4208].
C. Outlier Detection by Applyng ECF-means
It is very useful to make a classification of the 𝑜-rank fuzzy outliers of the SYNOP dataset. As we already said, from the “𝑜 -rank fuzzy outlier” perspective, each point in the dataset is an outlier. The elements that belong to the 𝑆, for
example, are 1-rank fuzzy outliers but aren’t 𝑜-rank fuzzy outlier, with 𝑜 < 1.
First of all, the intersection between the set 𝑂𝑈𝑇 of 835 detected outliers by applying the InterquartileRange filter and the set of instances that are in 𝑆 and not in 𝑆 has got 748
elements:
|𝑂𝑈𝑇 ∩ (𝑆 − 𝑆)| = 748
This makes us realize how the anomalies discovered by the ECF method have much in common with the statistical outliers that are in the 𝑂𝑈𝑇 set.
The elements belong to 𝑜.𝐹𝑂𝑈 are 𝑜-rank fuzzy outliers and they have a fuzzy nature. However, 𝑜-rank fuzzy outliers with small 𝑜 (𝑜 < 1.5) are the most interesting ones, and we will compare them with the 𝑂𝑈𝑇 elements in more detail. So, also in this case study we will determine the set 𝑂𝑈𝑇 ∩𝑜. 𝐹𝑂𝑈 (|𝑂𝑈𝑇 ∩ 𝑜.𝐹𝑂𝑈| ≤ 748, for small values of 𝑜).

25
International Journal on Advances in Software, vol 12 no 1 & 2, year 2019, http://www.iariajournals.org/software/
2019, © Copyright by authors, Published under agreement with IARIA - www.iaria.org
By changing the 𝑜 parameter (and fixing 𝑘 = 3), we have the results of Table XIV, where the fuzzy outliers are divided with respect to the SITE attribute.
TABLE XIV. SYNOP 𝑜-RANK FUZZY OUTLIERS
𝒐 Grazzanise Pantelleria CDG+MIL Tot 0.05 7 22 25 54 (0.6%)
0.1 41 27 63 131 (1.4%)
0.15 145 204 248 597 (6.5%)
0.2 328 454 587 1369 (14.9%)
We found that 597 points (about 6.5% of the initial
dataset) have an Outlier Threshold (difference between the two highest values of the probability membership vector), less than 0.15. These ambiguous instances belong also to 𝑂𝑈𝑇 set:
|𝑂𝑈𝑇 ∩ 0.15. 𝐹𝑂𝑈| = 597
The remaining 748 − 597 = 151 points, which are in 𝑂𝑈𝑇 but do not belong to 0.15 .𝐹𝑂𝑈 set, are all 0.2-rank fuzzy outliers.
D. Invariance Property
Is the ECF-means method for outlier detection invariant for the SYNOP dataset? Or better, is there an 𝑜 value for which the set of 𝑜 -rank fuzzy outliers of (𝑆𝑌𝑁𝑂𝑃 −𝑜.𝐹𝑂𝑈) = ∅?
The tests we performed, by changing the 𝑜 parameter, showed us that ECF-means is not an invariant algorithm for SYNOP set. But fixing 𝑜 = 0.15, the set of the 0.15-rank fuzzy outliers of (𝑆𝑌𝑁𝑂𝑃 − 0.15. 𝐹𝑂𝑈) is very small. Indeed, this set has got only 59 instances, which are new points but, deepening this set, we have discovered that these elements belong to the 0.2.𝐹𝑂𝑈 set.
For the sake of study, we repeated the procedure by setting 𝑜 = 0.2, and then discovering the 0.2-rank fuzzy outliers of (𝑆𝑌𝑁𝑂𝑃 − 0.2. 𝐹𝑂𝑈). Also, in this case, the resulting set is very small and it has got 40 instances.
On the other hand, if we calculate the 𝑜-rank fuzzy outliers of the floor 𝑆 of the SYNOP set (we are applying the ECF-
means algorithm to 𝑆 that has got 5363 records) we find out
that 0.15. 𝐹𝑂𝑈 is empty and 0.1. 𝐹𝑂𝑈 has got only 11 elements, whilst 0.05. 𝐹𝑂𝑈 has got 27 records (0.5% of 𝑆),
and this result is really amazing.
E. Experimental Results
The results obtained in this case study encourage us to reflect a lot. Unlike the previous case study, here we do not find any new points compared to those discovered by the traditional method based on statistics. But surely the most interesting result is the ability that the proposed method has to assign a score to each set of outliers.
Moreover, this case study gave us the opportunity to investigate the invariance property of the ECF-means method and to research the connection between the floor set of SYNOP and the 𝑜-rank fuzzy outliers. Although we did not find a precise analytical relationship between floor of SYNOP and 𝑜 (and we do not believe it exists because of the many algorithm parameters involved), we discovered a method to
reduce the number of 𝑜-rank fuzzy outliers and to determine a “stable” subset of the original dataset.
SYNOP is a very difficult set to analyze, not only because it has many statistical outliers (about 9.1% of the original dataset), but also because, as repeatedly pointed out by the meteorologist and as also discovered in [1] and in [41], there are no net separations between airport areas, from a weather point of view. For example, the elements in 0.15.𝐹𝑂𝑈 are very fuzzy points and they belong to more than one cluster, and probably to more than one airport site (to overlapping areas).
In [41] the dataset is mined in order to find short-range temporal models for fog prediction; a next step would be to find out if prediction errors belong to 𝑜. 𝐹𝑂𝑈, for some 𝑜; or, if the generic forecast error decreases by removing the detected outliers from the dataset, or analyzing only the floor 𝑆 of SYNOP dataset.
X. CASE STUDY 3: THE IRIS DATASET
The famous Iris dataset is a multivariate dataset that contains 3 classes of 50 instances each, where each class refers to a species of iris plant (Iris-setosa, Iris-virginica, and Iris-versicolor). Four features were measured from each sample: the length and the width of the sepals and petals, in centimeters.
The use of this dataset is very common in classification and clustering tasks, where numerous results have been obtained. Moreover, historically this dataset has been one the driving force of many theoretical studies, above all to discover and to deepen many non-linear classification methods.
From a statistical point of view, the Iris dataset has neither outliers nor extreme values; this makes the dataset a good example for exploration by the ECF-means algorithm, in order to discover new kind of outliers.
A. Summary of 𝑘-means Results
The data set only contains two clusters with rather obvious separation: one of the clusters contains Iris-setosa, while the other cluster contains both Iris-virginica and Iris-versicolor.
Fixing 𝑘 = 3, the incorrectly clustered instances are 18, as reported in the contingency matrix of Table XV, and represent 12% of the original Iris dataset, by applying the simple 𝑘-means algorithm (or by applying the ECF-means algorithm, fixing 𝑠 = 0 and 𝐼 = 1).
TABLE XV. CLASSES TO CLUSTERS (𝑠 = 0 AND 𝐼 = 1)
0 1 2 Assigned to cluster
0 0 50 Iris-setosa Cluster 2
40 10 0 Iris-versicolor Cluster 0
8 42 0 Iris-virginica Cluster 1
32% 35% 33%
All the records of the Iris dataset belonging to the Iris setosa class come together in a single and homogeneous cluster. No point in this cluster shows an ambiguous or fuzzy nature, so none of these points is an outlier. The fuzzy outliers of the dataset are, therefore, to be searched among the records labeled by versicolor tag or virginica one.
26
International Journal on Advances in Software, vol 12 no 1 & 2, year 2019, http://www.iariajournals.org/software/
2019, © Copyright by authors, Published under agreement with IARIA - www.iaria.org
B. ECF-means Algorithm Application
Fixing 𝑘 = 3 and choosing the number of iterations 𝐼 =7500, the performed iterations generate the validity indexes and the statistics of Table XVI, where the 𝑜 parameter is set to 0.1.
TABLE XVI. VALIDITY INDEXES (7500 ITERATIONS)
Index Value Descriptive note
MPC 0.73 If the Normalized Partition Coefficient
Index is 1, then the clustering is not fuzzy
Silhouette Index
0.57 An everage Silhouette greater than 0.5
indicates reasonable partitioning of data
TI 0.5 50% of the instances belong to the floor of the Iris dataset; then, the other 50% of the
instances have a fuzzy nature
No. of 𝟎. 𝟏. 𝑭𝑶𝑼
13 13 elements have 𝑜 ≤ 0.1 and they are 0.1-rank fuzzy outliers. From the results of the
next tables 𝑜 ≤ 0.057
𝟎. 𝟏. 𝑭𝑶𝑼𝑰 0.0867 13/150=0.0867
No. of different partitions
6
The 7500 performed Iterations generate 6 different partitions. The first seeds (𝑠)
generating these partitions are:
0, 1, 31, 98, 1794, 5894
EFC-means provides the results in the contingency matrix of Table XVII, where the incorrectly clustered instances are 17 and represent 11.33% of the original Iris dataset.
TABLE XVII. CLASSES TO CLUSTERS (𝑘 = 3, 𝐼 = 7500)
0 1 2 Assigned to cluster
0 0 50 Iris-setosa Cluster 2
47 3 0 Iris-versicolor Cluster 0
14 36 0 Iris-virginica Cluster 1
41% 26% 33%
Thanks to the ECF-means application, we are able to select the floor 𝑆 of whole Iris dataset 𝑆. 𝑆 has got 75 elements
(TI = 0.5) that have the distributions in Table XVIII.
TABLE XVIII. CLASSES TO CLUSTERS (𝑆)
0 1 2 Assigned to cluster
0 0 32 Iris-setosa Cluster 2
4 3 0 Iris-versicolor Cluster 0
0 36 0 Iris-virginica Cluster 1
5.33% 52% 42.67%
𝑆 has got 3 incorrected clustered instances that represent
4% of 𝑆.
In conclusion, if 𝑡 = 1 , then |𝐶01| = 4 , |𝐶1
1| = 39 , and |𝐶21| = 32.
C. Outlier Detection by Applyng ECF-means
The 50 elements in Table XVII tagged by Iris-setosa class are divided in 4 subsets, depending on their probability vectors, which are in Table XIX. The last column of the table contains the difference between the two highest probabilities of the vector (the 𝑜 parameter).
The 32 elements in the A1 subset belong to the floor of Cluster_2 (Table XVIII) and, therefore, to the 𝑆 set. Although
the elements in B1, C1, and D1 do not belong to 𝑆 , their
probability of belonging to the Cluster_2 is very high (around 79.6%).
TABLE XIX. IRIS-SETOSA PROBABILITY VECTORS (7500 ITERATIONS)
N. of
elements Clus_0 Clus_1 Clus_2 𝒐
A1 32 0 0 1 1
B1 13 0.204 0 0.796 0.592
C1 4 0.2035 0 0.7965 0.593
D1 1 0.2037 0 0.7963 0.5926
In conclusion, the elements tagged by Iris-setosa class label form the Cluster_2. This result, as we know, does not surprise us, and confirms the goodness of the ECF-means algorithm.
The results obtained by analyzing the other floral classes seem to be much more interesting.
The 50 Iris-versicolor elements have the probability vectors of Table XX. These elements fluctuate between the Cluster_0 and the Cluster_1, and no element is in Cluster_2.
TABLE XX. IRIS-VERSICOLOR PROBABILITY VECTORS (7500
ITERATIONS)
N. of
elements Clus_0 Clus_1 Clus_2 𝒐
A2 34 0.796 0.204 0 0.592
B2 6 0.5231 0.4769 0 0.0462
C2 4 1 0 0 1
D2 3 0 1 0 1
E2 2 0.7965 0.2035 0 0.593
F2 1 0.5285 0.4715 0 0.057
The elements of A2, C2, and E2 belongs to Cluster_0, without any doubt. In particular, the 4 elements of C2 are in the floor of Cluster_0.
Surely, by analyzing the table, the instances marked by the Iris-versicolor class label are mainly found in Cluster_0, and the floor of this cluster has got only 4 elements, and then they belong to the 𝑆 set.
The 3 elements in D2 are put in the floor of the Cluster_1, but they have the Iris-versicolor label class, and then they are unclustered instances.
The 7 elements belonging to B2∪F2 are 0.057-rank fuzzy outliers, even if their probabilities of belonging to Cluster_0 are greater than the probabilities of belonging to Cluster_1.
The 50 Iris-virginica elements have the probability vectors of Table XXI. Also, these elements fluctuate between the Cluster_0 and the Cluster_1.
In this case, the floor of the Cluster_1 has got 36 instances (to which are added the 3 instances tagged by Iris-versicolor label, retrieved in the Iris-versicolor case, Table XX).
TABLE XXI. IRIS-VIRGINICA PROBABILITY VECTORS (7500
ITERATIONS)
N. of
elements Clus_0 Clus_1 Clus_2 𝒐
A3 36 0 1 0 1
B3 8 0.796 0.204 0 0.592
C3 6 0.5231 0.4769 0 0.0462

27
International Journal on Advances in Software, vol 12 no 1 & 2, year 2019, http://www.iariajournals.org/software/
2019, © Copyright by authors, Published under agreement with IARIA - www.iaria.org
The 8 points of B3 seem to belong to Cluster_0 and then they are unclustered instances.
The 6 elements in C3 are, without any doubt, 0.0462-rank fuzzy outliers.
TABLE XXII. 0.057-RANK FUZZY OUTLIERS OF IRIS DATASET
El.
Num. Sepal length
Sepal width
Petal length
Petal width
1 52 6.4 3.2 4.5 1.5
2 57 6.3 3.3 4.7 1.6
3 66 6.7 3.1 4.4 1.4
4 71 5.9 3.2 4.8 1.8
5 77 6.8 2.8 4.8 1.4
6 86 6 3.4 4.5 1.6
7 87 6.7 3.1 4.7 1.5
8 124 6.3 2.7 4.9 1.8
9 127 6.2 2.8 4.8 1.8
10 128 6.1 3 4.9 1.8
11 139 6 3 4.8 1.8
12 147 6.3 2.5 5 1.9
13 150 5.9 3 5.1 1.8
Choosing the maximum 𝑜 in the previous Table IX, Table X, and Table XI, for which the elements are fuzzy outliers, the Iris dataset has got 13 elements that are 0.057-rank fuzzy outliers (B2∪F2∪C3), and they are presented in Table XXII.
D. Invariance Property
Also for Iris dataset we study the property of invariance. First of all, in summary, from the previous application of ECF-means algorithm, we have:
|0.057. 𝐹𝑂𝑈| = 13,
|𝐼𝑟𝑖𝑠 − 0.057. 𝐹𝑂𝑈| = 137,
|𝐼𝑟𝑖𝑠| = 75.
The ECF-means method is invariant for the Iris dataset. That is to say, the set of 0.057-rank fuzzy outliers of (𝐼𝑟𝑖𝑠 −
0.057 .𝐹𝑂𝑈) = ∅ . Not only that, the smallest 𝑜 value for which we have 𝑜-rank fuzzy outliers is 𝑜 = 0.552.
Furthermore, if we consider 𝐼𝑟𝑖𝑠, the set of 𝑜-rank fuzzy
outliers of 𝐼𝑟𝑖𝑠 is empty for any value of 𝑜 such that 𝑜 ≤0.246. Then, for this case study, 𝐼𝑟𝑖𝑠 ≠ 𝐼𝑟𝑖𝑠, but
|𝐶𝑙𝑢𝑠𝑡𝑒𝑟_0| = 2, 𝐶𝑙𝑢𝑠𝑡𝑒𝑟_1 = ∅, and 𝐶𝑙𝑢𝑠𝑡𝑒𝑟_2 =
𝐶𝑙𝑢𝑠𝑡𝑒𝑟_2, which confirms the elements labeled by the Iris-
setosa class are still preserved by the algorithm.
E. Experimental Results
The 13 0.057-rank fuzzy outliers are labeled by the Iris-versicolor class or by the Iris-virginica one, and not by Iris-setosa class, as reported in the scatter plot chart of sepalwidth, petalwidth space in Figure 7 (left part), where they are marked by boxes in grey color. In particular, 7 fuzzy outliers have the Iris-versicolor class and 6 the Iris-virginica class. They belong to 𝑆 − 𝑆 and can be analyzed separately in order to understand
their fuzzy nature. Moreover, there are 11 unclustered instances (D2∪C3),
but the elements in D2 belong to the floor of the Cluster_1. Finally, the floor of Iris dataset has got 75 points (A1∪C2∪D2∪A3), as reported in Figure 7 (right part); the floor of a set can be easily achieved by scrolling the “Membership Threshold” slider up to 100% in the graphical user interface of the tool, because the floor has got only the elements with the probability vectors equal to (1, 0, 0), or to (0, 1, 0), or to (0, 0, 1).
The charts also show the centroids of the three clusters. The “cross” symbol indicates the Initial Seed Centroid points, whilst the “plus” symbol are the Mean Seed Centroid points. In each cluster, the farther away are the “cross” and the “plus” symbols, the more points are fuzzy (and, therefore, fewer points belong to the floor of the considered cluster).
Figure 7. Scatter plot chart of 𝑆 with 0.057-rank fuzzy outliers in grey (on the left) and S scatter plot chart (on the right).

28
International Journal on Advances in Software, vol 12 no 1 & 2, year 2019, http://www.iariajournals.org/software/
2019, © Copyright by authors, Published under agreement with IARIA - www.iaria.org
Thanks to the obtained results, we can easily understand how the algorithm is able to optimize the partitioning of the data space with respect to the class that expresses the floral typology. The algorithm is able to find this partitioning in one fell swoop. By applying the simple 𝑘-means we may not be able to get the same partition. However, the most interesting result is that the algorithm is able to preserve the cluster with Iris-setosa label and to find the floating elements that are at the limits of the floral types.
These “disturbing” elements can be analyzed separately in order to understand if they are, from some point of view, outliers or records that have undergone measurement errors.
The arithmetic mean of the 13 discovered fuzzy outliers is, for example, 𝜇13 = (6.277, 3.008, 4.761, 1.67) and the arithmetic mean of the distances of the 13 points from 𝜇13 is 0.441. Moreover, if you subdivide the 13 points into two subsets, taking into account the two values of the target class, the 7 records with Iris-versicolor value have 𝜇7 =(6.4, 3.157, 4.628, 1.543) and the arithmetic mean of the distances of the 7 points from 𝜇7 is 0.389; the 6 records with Iris-virginica value have 𝜇6 = (6.133, 2.833, 4.917, 1.817) and the arithmetic mean of the distances of these 6 points from 𝜇6 is 0.25.
These measures give us an idea of how the outliers are close to each other, and how they have a low dispersion around the average.
XI. CONCLUSION AND FUTURE WORKS
In this work we have presented a procedure for detecting outliers or anomalies in large datasets, using the ECF-means algorithm, which is an ensemble method useful for optimizing and “fuzzifing” cluster analysis results. After describing the various types of outliers and the main approaches of data mining for their discovery, in this paper we defined a new category of outliers, called 𝑜-rank fuzzy outliers, based on the different degrees of membership of the point to the various obtained clusters.
By using an ad hoc implemented software application and the Weka version of the well-known 𝑘-means algorithm, three case studies have been proposed, aimed at showing the strengths of the ECF-means ensemble approach.
In particular, with the tool it is possible:
1. optimize the choice of algorithm parameters, such as
the number 𝑘 of the clusters to be determined, by calculating validation metrics such as the Silhouette, the partition entropy coefficient, and two new metrics
that are the threshold index (TI) and the 𝑜-rank fuzzy
outlier index (𝑜.FOUI), which have been defined for the first time in this work. These new indexes give us a rough estimate of the amount of outliers of the dataset;
2. calculate a degree of membership of each point to each cluster;
3. select the 𝑜-rank fuzzy outliers of the dataset as those points that have a fixed level of ambiguity, and also choose the level;
4. view the obtained results using a simple and interactive graphical interface.
The presented case studies showed that the ECF-means algorithm is able to detect more and different anomalies than those discovered by the usual outlier detection methods: these new points are elements that have a high level of ambiguity and which must be subjected to a more in-depth analysis. Being able to assign a level or score of ambiguity to each point is certainly one of the strengths of the proposed method, which is a method for exploring data.
However, we had that all the most exciting results can be obtained by the active interaction with the software tool interface, thanks to which, by scrolling the sliders, changing parameters, and visualizing groupings, numerous properties of the dataset can be discovered.
In future works, we are going to evaluate our method on other several datasets, for example, on others from UCI ML Repository.
Future investigations about the algorithm: 1. to find the relationship between the clusters centroids
calculated considering the initial seed (𝑠 = 0) (the “cross” symbols in the GUI) and those obtained considering the means of the centroids computed over all the 𝑁 iterations (the “plus” symbols in the GUI), as it was stated in the case study of the Iris dataset;
2. to understand the relationship between the distance among the cross and the plus centroids and the floor of each cluster;
3. to discover a criterion for the 𝑜 parameter optimization in relation to the other parameters, such as 𝑘 and 𝑁.
Additionally, in order to understand the final configuration, the floor of the analyzed dataset, and the discovered fuzzy outliers, why not train a model by using a machine learning technique, able to predict the probability vector of a point in a test set? The model could be a multivariate and regressive classifier with 𝑘 − 1 output variables, useful to know the level of “ambiguity” of a new and not yet clustered observation.
For the current study, we have chosen the simple 𝑘-means as the reference clustering algorithm. Furthermore, we can consider other algorithms in substitution or in addition to it, and this will surely be one of the next improvement of the tool.
Another information that can be very useful to the data analyst is the frequencies of the partitions that are obtained by varying the seed 𝑠. This feature, and other statistical computations, will also be added to the next tool update.
ACKNOWLEDGMENT
The authors would mention the TECVOL II and the Big Data Facility projects, both funded by the Italian PRORA, in which the meteorological database has been realized and the tool has been designed and developed.
REFERENCES
[1] G. Zazzaro and A. Martone, “ECF-means – Ensemble Clustering Fuzzification Means,” Proc. of the Eighth International Conference on Advances in Information Mining and Management (IMMM), pp. 20-27, 2018.

29
International Journal on Advances in Software, vol 12 no 1 & 2, year 2019, http://www.iariajournals.org/software/
2019, © Copyright by authors, Published under agreement with IARIA - www.iaria.org
[2] S. Vijendra and P. Shivani, “Robust Outlier Detection Technique in Data Mining: A Univariate Approach,” arXiv Preprint arXiv:1406.5074, [Online] available from: http://arxiv.org/abs/1406.5074, 2019.01.25.
[3] A. Zimeck and P. Filzmoser, “There and back again: Outlier detection between statistical reasoning and data mining algorithms,” WIREs Data Mining Knowl Discov. 8:e1280, Wiley Periodicals, Inc., 2018.
[4] P. Tan, M. Steinbach, and V. Kumar, “Introduction to Data Mining”, Pearson Addison Wesley, 2005.
[5] D. Hawkins, “Identification of Outliers,” Chap. and Hall, 1980.
[6] V. Chandola, A. Banerjee, and V. Kumar, “Anomaly Detection,” in Encyclopedia of Machine Learning and Data Mining. Second Edition, Springer, 2017.
[7] S. Agrawal and J. Agrawal, “Survey on Anomaly Detection using Data Mining Techniques,” Proc. of 19th International Conference on Knowledge Based and Intelligent Information and Engineering Systems, Elsevier, 2015.
[8] C. C. Aggarwal, “Outlier Analysis. 2nd Ed.,” Springer, 2017.
[9] M. Ester, H. P. Kriegel, J. Sander, and X. Xu, “A Density-Based Algorithm for Dicovering Clusters in Large Spatial Databases with Noise,” Proc. Of the 2nd Intl. Conf. on Knowledge Discovery and Data Mining, AAAI Press, pp. 226-231, August 1996.
[10] P. Chapman et al., “CRISP-DM 1.0. Data Mining guide,” 2000.
[11] K. Singh and S. Upadhyaya, “Outlier Detection: Applications And Techniques,” IJCSI International Journal of Computer Science Issues, vol. 9, Issue 1, no. 3, pp. 307-323, January 2012.
[12] Z. Niu, S. Shi, J. Sun, and X. He, “A Survey of Outlier Detection Methodologies and Their Applications,” AICI 2011, Part I, LNAI 7002, pp. 380-387, 2011.
[13] H. Izakian and W. Pedrycz, “Anomaly Detection in Time Series Data using a Fuzzy C-Means Clustering,” in IFSA World Congress and NAFIPS Annual Meeting (IFSA/NAFIPS), 2013 Joint.
[14] B. S. Harish and S. V. Aruna Kumar, “Anomaly based Intrusion Detection using Modified Fuzzy Clustering,” International Journal of Interactive Multimedia amd Artificial Intelligence, vol. 4, no. 6, 2017.
[15] L. Xie, Y. Wang, L. Chen, and G. Yue, “An Anomaly Detection Method Based on Fuzzy C-means Clustering Algorithm,” Proceedings of the Second International Symposion on Networking and Network Security (ISNNS’10), 2010.
[16] R. Sampat and S. Sonowani, “A Survey of Fuzzy Clustering Techniques for Intrusion Detection System,” International Journal of Engineering Research & Technology (IJERT), vol. 3 Issue 1, 2014.
[17] Z. Zhao, C. K. Mohan, and K. G. Mehrotra, “Adaptive Sampling and Learning for Unsupervised Outlier Detection,” Proceedings of the Twenty-Ninth International Florida Artificial Intelligence Research Society Conference, 2016.
[18] B. Micenková, B. McWilliams, and I. Assent, “Learning Outlier Ensembles: The Best of Both Worlds – Supervised and Unsupervised,” Proc. of the ODD^2 workshop organized together with KDD'14, 2014.
[19] P. Berkhin, “Survey of clustering data mining techniques,” Technical report, Accrue Software, San Jose, CA, 2002.
[20] A. K. Jain, A. Topchy, M. H. C. Law, and J. M. Buhmann, “Landscape of Clustering Algorithms,” IAPR International Conference on Pattern Recognition, vol. 1, pp. 260-263, Cambridge, UK, 2004.
[21] L. I. Kuncheva, “Combining Pattern Classifiers. Methods and Algorithms,” Wiley-Interscience, A John Wiley & Sons, Inc., Publication, 2004.
[22] A. Strehl and J. Ghosh, “Cluster Ensembles – A Knowledge Reuse Framework for Combining Multiple Partitions,” Journal of Machine Learning Research 3 (2002), pp. 583-617.
[23] S. Monti, P. Tamayo, J. Meisirov, and T. Golub, “Consensus Clustering: A Resampling-Based Method for Class Discovery and Visualization of Gene Expression Microarray Data,” Machine Learning, 52, pp. 91–118, 2003, Kluwer Academic Publishers.
[24] A. Gionis, H. Mannila, and P. Tsaparas, “Clustering Aggregation,” on 21st International Conference on Data Engineering (ICDE), pp. 341-352, 2005.
[25] R. R. Bouckaert et al., “WEKA Manual for Version 3-9-2,” the University of Waikato, Hamilton, New Zealand, December, 2017.
[26] E. Frank, M. A. Hall, and I. H. Witten, “Data Mining: Practical Machine Learning Tools and Techniques,” Morgan Kaufmann, 2016.
[27] G. Gan, C. Ma, and J. Wu, “Data Clustering. Theory, Algorithms, and Applications,” ASA-SIAM Series on Statistics and Applied Probability, SIAM, Philadelphia, ASA, Alexandria, VA, 2007.
[28] C. C. Aggarwal, “Data Mining. The Textbook,” Springer International Publishing, 2015.
[29] J. C. Bezdek, R. Ehrlich, and W. Full, “FCM: The Fuzzy c-Means Clustering Algorithm,” Computers & Geosciences Vol. 10, no. 2-3, pp. 191-203, 1984.
[30] J. Wu, “Advances in k-means Clustering. A Data Mining Thinking,” Springer, 2012.
[31] S. Das, A. Abraham, and A. Konar, “Metaheuristic Clustering,” Studies in Computational Intelligence, vol. 178, Springer, 2009.
[32] P. J. Rousseeuw, “Silhouettes: a graphical aid to the interpretation and validation of cluster analysis,” Journal of Computational and Applied Mathematics 20, 53-65, 1987.
[33] C. Subbalakshmi, G. R. Krishna, S. K. M. Rao, and P. V. Rao, “A Method to Find Optimum Number of Clusters Based on Fuzzy Silhouette on Dynamic Data Set,” International Conference on Information and Communication Technologies (ICICT 2014), Procedia Computer Science 46, 346-353, Elsevier, 2015.
[34] R. N. Dave, “Validating fuzzy partition obtained through c-shells clustering,” Pattern Recog. Lett. 17, pp. 613–623, 1996.
[35] M. Hall et al., “The WEKA Data Mining Software: An Update,” SIGKDD Explorations, vol. 11, Issue 1, 2009.
[36] D. Dua and E. K. Taniskidou, UCI Machine Learning Repository, Irvine, CA: University of California, School of Information and Computer Science, 2017.
[37] M. Hofmann and R. Klinkenberg, “RapidMiner: Data Mining Use Cases and Business Analytics Applications,” Chapman & Hall/CRC Data Mining and Knowledge Discovery Series, CRC Press, October 25, 2013.
[38] D. Pelleg and A. W. Moore, “X-means: Extending K-means with Efficient Estimation of the Number of Clusters,” in Seventeenth International Conference on Machine Learning, 727-734, 2000.
[39] M. M. Breuning, H-P Kriegel, R. T. Ng, and J. Sander, “LOF: Identifying Density-Based Local Outliers,” in Proc. Of the 2000 ACM SIGMOD, pp. 93-104, ACM, USA, 2000.
[40] ECMWF, Mars User Guide. User Support. Operations Dep. 2013.
[41] G. Zazzaro, G. Romano, and P. Mercogliano, “Data Mining to Forecasting Fog Events and Comparing Geographical Sites. Designing a novel method for predictive models portability,” Int. Journal on Advances in Nets and Services, vol. 10, no. 3 & 4, pp. 160-171, 2017.

30
International Journal on Advances in Software, vol 12 no 1 & 2, year 2019, http://www.iariajournals.org/software/
2019, © Copyright by authors, Published under agreement with IARIA - www.iaria.org
Current Progress in Cross-Platform Application Development
Evaluation of Frameworks for Mobile Application Development
Jan Christoph, Daniel Rösch, Thomas Schuster, Lukas Waidelich
Pforzheim University
Tiefenbronner Straße 65, Germany
{jan.christoph | daniel.roesch | thomas.schuster | lukas.waidelich}@hs-pforzheim.de
Abstract — Cross-platform development is increasingly driven
by web frameworks. Modern frameworks typically support ap-
plication deployment for different platforms as well as the crea-
tion of progressive web apps. This approach is also driven by the
increasing number of different device types and platforms. De-
velopment efforts can be significantly reduced by utilization of
modern frameworks. Hence, several modern frameworks that
have proven to be suitable for cross-platform development will
be compared in this article. This article will extend our previous
research on cross-platform development by several dimensions:
at first, research on literature and technology developments re-
garding cross-platform development is extended. Secondly, we
added further frameworks into our analysis. Thirdly, the evalu-
ation approach is systematically extended to discuss each frame-
work on an individual basis. This is driven by a reference archi-
tecture and implementation. To create a sound and objective
framework comparison, the reference architecture is utilized to
implement applications by means of each framework. Subse-
quently tests for different mobile devices and platforms are de-
fined. All frameworks are compared according several key met-
rics. Finally, we describe current strengths and weaknesses of
all approaches before giving an outlook on future steps of re-
search.
Keywords — cross-platform development; web component;
web application framework; progressive web app.
I. INTRODUCTION
This article is an extended version of a former conference publication, see [1] for further details. Mobile devices have become an important platform for today’s software applica-tions. Especially, the utilization of smartphones increased rap-idly within the last couple of years [2][3]. Since smartphones are often utilized to consume or orchestrate services, this pro-cess includes a vast range of applications. Smartphones also connect to other domains such as the Internet of Things (IoT) and often utilize smart cloud-based services [4].
The introduction of smartphones rapidly increased the need and development of mobile software. The development of mobile software applications is a special case of software engineering. Mobile applications are often also referred to as apps, which implies that the application is intended to be used on a smartphone or wearable device [5]. Thus, development must cope with specific aspects such as: short application lifecycles, limited device capabilities, mobility of users and
devices, availability of network infrastructure as well as secu-rity and privacy issues [6]. The difference in devices also gen-erates a variety of different resolutions and display sizes.
While developers are enacted to create and distribute ap-plications in a large scale, they also have to deal with these inherent differences and limitations of mobile devices (i.e., battery life or small displays). Furthermore, it is necessary to address different operating systems (especially for smartphones, and, to a limited extent, for feature phones as well). Since the market for smartphones has consolidated re-cently, some operating systems (i.e., Windows Phone, Black-berryOS and other OS hold a market share of 3.2%) vanished again. Still, to address the smartphone market, applications for both, Android (market share: 72.4%) and iOS (market share: 24.4%) need to be provided [7]. In addition, Android is split into different versions, manufacturers and various system cus-tomizations. Despite vendor customization and just consider-ing the Android version, current most widely used is Oreo (8.0 and 8.1 with 28.3%), followed by Nougat (7.0 and 7.1 with 19.2%) and finally, the latest version Pie (9; with 10.4%) [8].
In order to reach as many users as possible, applications need to support all major device platforms and versions of op-erating systems [6][9]. This introduces the need to either de-velop platform specific or platform agnostic applications. Platform specific implementations (native apps) literally re-quire almost as many application implementations as plat-forms that are intended to be addressed. Therefore, this ap-proach generates correspondingly high development expend-itures. On the other hand, with a more generic approach, a sin-gle application or some core components could serve as the basis for multiple platforms. Besides reduced developments efforts, a generic approach also strengthens reuse of code and components.
Currently, generic approaches can be further subdivided into Web and hybrid applications (see Figure 1). Web appli-cations can be used virtually under any platform, as a Web browser is preinstalled on almost all devices. The most salient advantage is application portability, which basically comes at no cost. Web apps are typically optimized by means of Hyper Text Markup Language (HTML5), Cascading Style Sheet (CSS) and JavaScript [10]. Numerous frameworks (such as Angular, Bootstrap, React or Vue) provide additional func-tionality on top of Web standard technologies and help to speed up development of Web apps.

31
International Journal on Advances in Software, vol 12 no 1 & 2, year 2019, http://www.iariajournals.org/software/
2019, © Copyright by authors, Published under agreement with IARIA - www.iaria.org
Figure 1: Mobile App Technology Stack.
Major disadvantages of Web applications are that they do not possess platform specific look and feel and often are re-stricted in functionality – especially access to system func-tions and device sensors. Furthermore, they must be inter-preted and suffer performance losses compared to native ap-plications [11].
Hybrid applications are built on frameworks such as Apache Cordova or Adobe PhoneGap. Often they rely on Web technologies also, and enact access to native device functions and sensors [6]. Hybrid apps utilize a specialized browser to present the user interface (UI). This results in a presentation layer, which is identical or very near to widgets used in native apps. Today's hybrid framework technologies are mainly ex-tensions of Cordova and PhoneGap, as they extend and sim-plify the development of cross-platform applications. There-fore, the frameworks Cordova and PhoneGap are not included in the evaluation. While hybrid apps overcome some issues of Web apps (such as access to system functions and sensors), they still experience a loss of performance compared to native applications. However, it is notable that performance of hy-brid apps has improved a lot with latest developments [6][10]. Comparing the short development lifecycles of devices and operating systems on the one hand to that of hybrid app frame-works on the other, it is noticeable that the latest developments are implemented with delays by the frameworks. As a result, access to new functionalities can be gained earlier when de-velopment is based on native apps.
Issues of supported functionality, performance and the ge-neric question of maintenance of cross-platform applications lead us to the evaluation of multiple cross-platform frame-works. With this paper we want to record the current state of the art in the development of cross-platform apps. In addition,
we want to uncover innovations and differences that arise with the deployment of new frameworks and versions. We achieve this with our reference app. The remaining parts of this article are structured as follows: First, Section II introduces the liter-ature research method. This work can be seen as a starting point for further work on the article. Section III provides an overview of current mobile app development. In Section IV, a reference architecture is presented and five framework-based implementations of this architecture are discussed. The reference implementations are being evaluated in Section V. Finally, Section VI outlines the conclusion and outlook for further research.
II. LITERATURE RESEARCH
A comprehensive literature research was initiated to iden-
tify significant literature on the topic of cross-platform devel-
opment and cross-platform frameworks. In addition, im-
portant scientific articles from the same field of research
should be identified, which will form the basis for the later
main part of the article. For this purpose, the proven literature
research of Brocke et al. [12] was used. A five-phase model is
defined by Brocke et al., which enables a systematic literature
search. In the process, they combine approaches from Cooper
[13] and Webster & Watson [14] . The method, the five-phase
process is shown in Figure 2.
A. Definition of review scope
Phase I defines the different characteristic values of liter-
ature research. We apply the taxonomy of Cooper [13] in this
phase as a basis. The applied taxonomy according to Cooper
is explained below and also shown in TABLE I. The focus of

32
International Journal on Advances in Software, vol 12 no 1 & 2, year 2019, http://www.iariajournals.org/software/
2019, © Copyright by authors, Published under agreement with IARIA - www.iaria.org
this article is on research outcomes in the area of cross plat-
form technologies. In addition, the practical application of
these technologies plays an important part in our research. If
the technologies in focus are not applied in a broad common
sense, they might lack in one or more aspects (e.g., they are
just not well-known, they are error prone, they do not offer
simplified multi-platform deployment, they do not support
well supported programming languages or constructs or they
are simply not applicable to specific project requirements).
Figure 2: Literature review framework used for literature research
according to Brocke et al. [12].
The goal of our work is to answer central questions on
cross-platform development. We intend to do so by analysing
different cross-platform frameworks and comparing them
with each other. In a broader sense, the organisation of the
work is to be characterised as conceptual. The different
frameworks are described individually and compared step by
step. The perspective of the authors is classified as neutral.
The authors intend to provide the reader with a no-obligation
perspective and to perform the subsequent tests from a neu-
tral perspective. The article is aimed at general scholars who
are interested in the cross-platform concept and also want to
acquire knowledge about the existing frameworks and their
distinctions. In addition, practitioners dealing with cross-plat-
form development will be addressed. The underlying litera-
ture research does not claim to be exhaustive, because of its
topicality in this thematic area. Therefore, a short overview
of the current state of research is given, with the aim of a cen-
tral literature search, which focuses on the above defined top-
ics.
TABLE I: APPLIED TAXONOMY OF COOPER [13].
Characteristic Categories
(1) Focus
Research outcomes
Research methods
Theories Applica-
tions
(2) Goal Integration Criticism Central
issues
(3) Organisation Historical Conceptual Methodo-
logical
(4) Perspective Neutral representation Espousal of position
(5) Audience Specialised
scholars General scholars
Practition-
ers / politi-
cians
General public
(6) Coverage Exhaustive Exhaus-tive and
selective
Representa-
tive
Central/
pivotal
B. Conceptualisation of the topic
In Phase II, the conceptualization of the cross-platform
development topic field is carried out. In the current work,
this is done on the one hand by brainstorming and on the other
hand by systematic mapping of topics on a canvas, which
supported the research team in developing a common stand-
point on the topic analysed. In addition, initial concepts were
identified, which will then be searched for within the scope
of the third phase.
C. Literature search
Phase III describes the procedure for literature search. In
this section, the reader has the opportunity to gain insights
into the authors' systematic approach.
The framework conditions are set at the beginning. There-
fore, the key terms are defined as follows. The literary search
uses two keyword strings. The first keyword string is "cross-
platform development", the second search string equals
"cross-platform frameworks". The string was searched in
English language.
Furthermore, the media types are defined on the basis of
Brocke et al. [12]. The sources of the current research consist
of the latest journal and conference articles as well as web
documents. The aim of this selection is to identify the main
findings on the state of scientific research. Different data-
bases are selected for the two source types. Peer-review arti-
cles in journals or conferences are found in current databases
such as ScienceDirect, Emerald Insight and especially
through the Google Scholar search engine. Web documents
have been investigated by the search engine Google.
The next step is to perform the electrical search. In addi-
tion to the keyword-string entered, the search settings in the
database for articles are set to journals and conferences and
the web search is focused on documents. In addition, the last
three years are taken into account. The first 20 hits of all types
of researched publications are considered, which are sorted
in advance according to relevance.
According to later findings, the search was extended to
the five specific frameworks Ionic, Xamarin, React Native,
Oracle Jet and Flutter. The same search process was used for
these five concepts.

33
International Journal on Advances in Software, vol 12 no 1 & 2, year 2019, http://www.iariajournals.org/software/
2019, © Copyright by authors, Published under agreement with IARIA - www.iaria.org
D. Literature analysis and synthesis
Phase IV comprises the literature analysis and synthesis
of the collected works. This is done through a multi-level fil-
tering approach to obtain the final list of documents relevant
to the following activities. These steps apply to the two media
types from the previous section.
The first type of filter refers to the title that has been pub-
lished. The presence document must refer to the keyword
string. If this requirement is fulfilled, the literature will con-
tinue to be considered. Secondly, abstraction is examined.
There, the existing literature must contain elements of the
keyword string. If this requirement is also met, the literature
will be considered further. The full text is then filtered. If the
document contains or refers to the contents of the keyword
string, it is included in the final selection. The final step is the
redundancy analysis, which eliminates redundant entries
from journals and Internet documents.
Afterwards, the relevant literature is then transferred to a
spreadsheet in, which the results are first classified according
to the following criteria: author, title, publication type, year
of publication, language, publisher/journal and found data-
base/search engine. In the next step, the works were exam-
ined for their relevance in terms of content. The spreadsheet
is converted into a so-called concept matrix according to
Webster & Watson [14]. The identified focal points and con-
cepts for cross-platform development and cross-platform
frameworks are added to the spreadsheet. The concepts are
assigned to the individual documents in the form of crosses.
As a result of this step, the concept matrix can be used.
E. Research Agenda
Finally, Phase V aims to identify topics within the so-
called Research Agenda. These topics are under-represented
in the identified literature. This allows a recommendation;
which concepts should be part of future research. Further
fields of research are addressed in section VI Conclusion and
Outlook. Based on the identified documents, the main focus
will mainly be on the cross-platform frameworks. In other
words, which of the identified frameworks are particularly
useful for the suitability of mobile applications? As a result
of Section II, the identified works will be presented in an ad-
ditional step. This will be addressed as status quo of cross-
platform development hereafter in Section III Related Work.
III. RELATED WORK
This section covers different solutions and technologies
which enable fast and efficient cross-platform-development
of applications.
A. Cross-Platform Development
As stated above, there are several approaches for cross-platform development. This type of development is subject to typical challenges of ubiquitous computing. In addition, fur-ther challenges are typical to cross-platform development [6], [15], the most important issue being associated with:
1. User Interface (UI) 2. Limited Resources 3. Device Management 4. Application Maintenance
The design of UI is associated with questions of simplicity and intuitiveness. For mobile cross-platform development, this is extended by design guidelines defined by the different operating systems. It is further restricted because of different device capabilities (e.g., screen sizes and resolution) [16]. Limited resources is a typical issue in mobile software engi-neering; for cross-platform development the application size and resource consumption (especially power and memory management) is a typical issue [6][17]. Since cross-platform development addresses a vast variety of devices, their man-agement in terms of appropriate usage of hardware and sen-sors (i.e., CPU, memory, Bluetooth, or camera) becomes an-other typical challenge. Furthermore, different operating sys-tems must be handled as well. Finally the application has to be maintained by following short lifecycles of devices, oper-ating systems and frameworks [6][16].
A lot of different methods that address cross-platform de-velopment can be observed in science and industry. Some are based on model-driven software engineering [18]. The ad-vantage of model-driven methods is that developers and users, which are less familiar with specific programming paradigms are enabled to efficiently implement applications. As Object Management Group (OMG) standard, the Interaction Flow Modeling Language (IFML) offers model-based and plat-form-independent development of applications for different types of devices. Following the Model-Driven Architecture (MDA) it is based on a meta-model and it is built upon Web Modeling Language (WebML). A Web-based and an eclipse-based modelling environment is provided for IFML. Further-more, extensions for Apache Cordova and PhoneGap are pro-vided [18][19]. An open challenge is to keep the extensions up-to-date. Other solutions, such as WebView, utilize native code and combine it with Web technologies. Native compo-nents are used as containers to render Web pages that contain application logic and presentation layer definitions. Native components serve to access device-specific functions (i.e., push notifications or sensor data). Although WebView is a na-tive application, it can internally use Web technologies with-out switching to a standard browser. WebView also supports CSS and JavaScript for custom interface development [11]. However, WebView does have two main drawbacks: 1) cus-tom styling is necessary to gain a native look and 2) its perfor-mance is below average [20]. In summary, we observe three general approaches to cross-platform development:
1. Native application 2. Transformation- or generator-based application 3. Interpreted application (parser-based)
With native development, an application is developed for each specific device (and operating system). Benefits include the native look and feel, the ability to use all platform-specific features and a comparatively high performance of the app. The most prevalent disadvantage is high efforts for development and maintenance.

34
International Journal on Advances in Software, vol 12 no 1 & 2, year 2019, http://www.iariajournals.org/software/
2019, © Copyright by authors, Published under agreement with IARIA - www.iaria.org
TABLE II: COMPARISON OF FRAMEWORK POPULARITY [21].
Source Unit Ionic Xamarin React Native Oracle Jet Flutter
StackShare
Stacks 2.360 461 3.880 N/A 105
Fans 2.310 549 3.740 N/A 156
Jobs 98 47 726 N/A 5
Votes 1.660 646 821 N/A 49
Hacker News Posts 669 995 917 8 N/A
Reddit Posts 989 1.080 N/A 55 1.080
Stack Overflow
Stats
Posts 4.430 35.000 45.100 280 9.890
GitHub Stats Stars 36.700 N/A 73.200 295 51.400
Forks 12.800 N/A 16.200 81 5.360
The latter is a result of redundancy in code and support because each platform has to be served by a separate applica-tion [11][15].
The use of generators employs a meta-implementation, which is then transformed to specific platforms (e.g., as used in Cordova or Ionic). Similarly, model-driven development approaches (such as IFML) may use transformations to pro-duce platform specific code. An advantage is that the applica-tion logic is platform agnostic [18]. Applications, which are interpreted rely on some kind of parser. The parser interprets application code during runtime in order to create platform specific instructions. Fabrik19 utilizes an interpreted approach in its Mobility Suite (MOS) framework.
B. Cross-Platform Frameworks
As discussed above, there are a lot of cross-platform frameworks like IFML, Cordova, Corona Software Develop-ment Kit (SDK), Appcelerator Titanium, TheAppBuilder, PhoneGap, Native Script, SenchaTouch, Framework7, Apache Weex, Flutter, Oracle Jet, Jasonette or Manifold – also see [9]. All of them utilize one or a combination of the three methods to create platform specific applications. In our eval-uation we also regard the popularity of the different frame-works. We consider communities like StackShare, Hacker News, Reddit, Stack Overflow Stats as well as GitHub Stats. In our comparison, we strive to evaluate the most frequently used and most progressively developed frameworks as illus-trated in TABLE II.
Ionic offers a generator-based approach [22]. The frame-work is free to use and available as open source. Additionally, several services are available via pay on demand. The gener-ator utilizes a Web application as input. Thus, development of cross-platform applications is based on Web technologies (Ja-vaScript/TypeScript, HTML5 and CSS; see Figure 3). Ionic also relies on Angular [22] in order to foster component based development and reuse of templates. Ionic officially supports Android, iOS and Universal Windows Platform (UWP) [23]. Since Ionic is based on Web applications that are generated
into platform specific applications through Apache Cordova, these source applications may also be executed in any Web browser. Native operating system functions and access to sen-sors is only available after generation of platform specific code. The utilization device specific functionalities often also rely on plugins that have to be declared as dependency [19].
Figure 3: Ionic Architecture [23].
Xamarin is another framework to develop cross-platform apps for Android, iOS and UWB [24]. Other platforms such as Linux are not supported and macOS support was recently added with the launch of Xamarin.Mac.
Xamarin is based on .Net and utilizes C# as programming language. Xamarin is divided into two major parts: 1) Xama-rin platform and 2) Xamarin.Forms. The Xamarin platform (Xamarin.Android, Xamarin.iOS) provides APIs to share code for application logic between all platforms. The UI is written individually for each platform. Xamarin.Forms allows to create additional platform-independent UI, which are mapped into native UI in a second step (see Figure. 4). The
35
International Journal on Advances in Software, vol 12 no 1 & 2, year 2019, http://www.iariajournals.org/software/
2019, © Copyright by authors, Published under agreement with IARIA - www.iaria.org
development environment is based on Visual Studio (or Xamarin Studio for macOS) [24].
Figure 4: Xamarin Architecture [24], [25].
React Native is a parser based open-source framework for building cross-platform applications [26]. It is based on React. Both frameworks are being developed by Facebook. React Native currently supports Android and iOS and uses a Na-tiveScript Runtime environment to execute the application code (see Figure 5). However, with a little more effort, it is also possible to deploy to UWP. Since React is built on JavaS-cript, this holds true for React Native as well. React Native invokes Objective-C APIs to render to iOS components and Java Application Programming Interface (APIs) to render to Android components. This means that no code generation is utilized in React Native. Facebook promises that the perfor-mance of apps would be almost as good as that of native ap-plications. Components for React Native may either be built as functional components or class components [26].
Figure 5: React Native Architecture.
Oracle Jet follows a similar philosophy as Ionic and was developed in the software house Oracle. The framework and its tools are freely available as open source. Oracle Jet also uses the generator-based approach. Web technologies (JavaS-cript, Knockout, jQuery, HTML5 and CSS, etc. see Figure 6) are used for the development. Platform-specific versions can be derived from the web application. Apps for Android, iOS and UWP can be officially released. Also, an execution in the browser is possible without further ado, particularly since the application is converted by means of Web technologies. For the use of platform-specific sensors, Cordova plug-ins must be used [27][28].
Figure 6: Oracle Jet Component Architecture [29].

36
International Journal on Advances in Software, vol 12 no 1 & 2, year 2019, http://www.iariajournals.org/software/
2019, © Copyright by authors, Published under agreement with IARIA - www.iaria.org
Figure 7: Flutter Architecture.
Flutter is a parser based, open source SDK, which offers an easy way to develop high-fidelity and high-performance mobile apps for android and iOS. Flutter uses a rich set of Cu-pertino (iOS) and Material Design behaviours and widgets. Furthermore, Flutter implements platform-specific code like navigational patterns, fonts and more. Flutter apps are written in Dart. Its syntax looks a lot like Java, JavaScript, C# or swift. Dart uses the standard Android and iOS toolchains to compile your code [30]. Flutter does not separate views, controllers, layouts and other properties like other frameworks. It uses one consistent, unified object model, so called widgets. Widgets can define structural elements (like buttons or menus), stylis-tic elements (like fonts or colour schemes, aspects of layouts (like margins) and so on [31]. Messages between the client (UI) and the host (platform) are passed using platform chan-nels as illustrated in Figure 7. These messages and their re-sponses are passed asynchronously. This way the user inter-face will remain responsive.
IV. REFERENCE ARCHITECTURE AND IMPLEMENTATION
This article follows the constructivist paradigm of design science [32]. Thus, insights will be retrieved by creating and evaluating artefacts in the form of models, reference architec-tures and, in our case, specific implementation variants and efforts spent on their creation. Contrary to empirical research, the goal is not necessarily to evaluate the validity of research results with respect to their truth, but to the usefulness and fea-sibility of the different approaches in order to solve a common
problem – here, to deploy with ease to different mobile plat-forms. Following this line of thought, requirements will be im-posed by the definition of a reference application architecture. The reference architecture is derived using common hypothe-ses, practitioner interviews and literature review. The refer-ence architecture serves as requirements model for the imple-mentation of different alternatives and tests in a real environ-ment.
Thus, the reference application architecture is defined to compare most utilized frameworks against each other and to identify strengths and weaknesses. To enact a comprehensive comparison [9][33], the application should access native sys-tem functionalities and provide a platform specific UI. In short, the frameworks should generate applications, which are close to native applications. Thus, we also evaluated against platform specific UI guidelines for Android and iOS [34]. We defined the following functional reference criteria:
1. Layout: Grid 2. Layout: Tab 3. Operating System Function: Access current time 4. Sensor Function: Access current position (GPS) 5. Sensor Function: Access the phone camera
In addition to functional criteria, it is also important to measure quality aspects, such as development efforts and ap-plication performance. Therefore, we analysed two different types of layouts mentioned in the list above, which are often used in today’s apps – Mock-ups are depicted in Figure 8,

37
International Journal on Advances in Software, vol 12 no 1 & 2, year 2019, http://www.iariajournals.org/software/
2019, © Copyright by authors, Published under agreement with IARIA - www.iaria.org
which serve as system templates for the reference app. Three tabs can be used to test the system time, GPS and camera func-tions.
Figure 8: Wireframes.
A. Ionic
Layout – Grid: Ionic provides a typical Grid-View with the <ion-grid> component [23]. Furthermore, styling of the GridView can be set individually. Layout – Tab: Using Tabs in Ionic is easy as wall, it may be just derived by use of the starter template (which provides this from scratch). Precise in-structions may also be found in the documentation [23].
Access system time: This is derived by simple and built-in JavaScript function calls (e.g., date().getHours() is used to get the current hour). Access current position (GPS): To de-termine the position, the Cordova plug-in Geolocation has to be installed via npm. Then, it can be integrated in the project [23]. As shown in Listing 1 the position can be retrieved, if the necessary sensors are available and permissions are given. Access to the camera: To use the camera, the Cordova plugin Camera is required and has to be integrated into the project [23].
Listing 1
getThePosition(){ this.geolocation.getCurrentPosition(). then((resp) =>{ this.longitude = resp.coords.longitude; this.latitude = resp.coords. latitude; this.altitude = resp.coords. altitude; this.speed = resp.coords. speed; }).catch((error) => { console.log("Error getting location", error); }); }
Debugging & testing: Ionic offers several methods to de-bug and test apps. If the application is not utilizing sensor in-formation, a clean Web test can be driven (by ionic serve). Web tests may be carried out as known for Web applications in general – such as debugging by means of the browser’s de-veloper console (F12 shortcut) or employing Web driver test scripts. If sensor information is utilized the application has to be deployed to a platform specific device or an emulator. With
Ionic this can be done by calling ionic cordova build an-droid|ios to build the app and ionic cordova emulate android|ios to execute the app on an emulator. If a test de-vice is being utilized instead of emulation (by calling ionic cordova run android|ios) the application may again be tested in a browser, e.g., using Google Chrome (chrome://inspect/#devices has to be called and the spe-cific device has to be selected). In order to automate unit test-ing typical tooling as known for other JavaScript-based frame-works can be used. To test the reference implementation, we could simply employ the well-known frameworks Karma and Jasmin. The application source code is publically available via GitHub, the repository URL is:
https://github.com/futureLABHsPforzheim/ionic_blog_proto-type.git
B. Xamarin
Layout – Grid: In Xamarin the layout differs, depending on the chosen platform. For Android GridView and for iOS uicollectionview has to be used [24]. Layout – Tab: In Xamarin tabs have to be set up manually. There is no standard template available to support this layout. Typically, a tabbed page will be used to reference other content integrated as tabs.
Access system time: To retrieve the system time, a View-Model is created, and a DateTime attribute tracks the current time. For updates a PropertyChanged event is fired. The ref-erence is made possible by the data binding. Access current position (GPS): The current position is determined by the plugin Xam.Plugin.Geolocator [24] (installed via NuGet). Adjustments are needed to support Android. In addition, nec-essary privileges for querying the position must be granted. After configuration, the logic can be implemented. Attributes for longitude and latitude have to be mapped to determine the location (see Listing 2). Access to the camera: Camera access is realized with the plugin Xam.Plugin.Media [24]. It has to be configured by means of xml. In important step is the defi-nition of a resources folder to determine where to store cap-tured pictures and videos. The camera itself can be called asynchronously (getTakePhotoAsyncCommand).
Listing 2
public async System.Threading.Tasks.Task getLocationAsync() { var locator = CrossGeolocator.Current; locator.DesiredAccuracy = 50;
if (locator.IsGeolocationAvailable && locator.IsGeolocationEnabled) {
var position = await locator.GetPositionAsync(); this.Longitude="Longitude" +
position.Longitude.ToString(); this.Latitude="Latitude" +
position.Latitude.ToString(); } }

38
International Journal on Advances in Software, vol 12 no 1 & 2, year 2019, http://www.iariajournals.org/software/
2019, © Copyright by authors, Published under agreement with IARIA - www.iaria.org
Debugging & testing: Xamarin enables unit testing and debugging with Visual Studio. For Xamarin, Visual Studio basically offers the same mechanisms as known for any other component, which is developed within Visual Studio (such as break points and live debugging). Visual also offers support for asynchronous testing and mock object creation, e.g., if the Model View Viewmodel (MVVM) pattern is applied and view models invoke service operations asynchronously.
Visual Studio also provides a well sophisticated profiler,
which provides monitoring of memory utilization and object
allocation. Finally, Xamarin also offers also a test cloud for
UI-Tests – where automated testing for native and hybrid ap-
plications is done by employing the App-Center. The source
code of the Xamarin-Reference-App is publically available
via GitHub, the repository URL is:
https://github.com/futureLABHsPforzheim/xama-
rin_blog_prototype.git
C. React Native
Layout – Grid: React Native does not provide a grid lay-out immediately. To resemble a grid-layout within the refer-ence implementation, a ScrollView component was used and individual views had been adapted by means of CSS. Alterna-tively, third-party grid components could be utilized as well to resemble a grid layout. React Native Easy Grid and React Native Layout Grid are just two examples of these compo-nents, which may be installed via npm. Layout – Tab: React-Native Expo IDE can create a starter app, which directly op-erates with tabs. Manual creation is not as easy as in Ionic but efforts are still considerably low.
Access system time: Is achieved by simple JavaScript calls. this.state [26] is needed for the databinding and new Date().getHours() retrieves the current hour. Access cur-rent position (GPS): The determination of the current posi-tion is already integrated in the React Native API [26]. The position is retrieved by calling navigator.geoloca-tion.getCurrentPosition, further details can be seen in Listing 3. Access to the camera: Camera and access rights have to be configured and hasCameraPermission has to be set to zero. The componentWillMount method the permis-sions are checked and we the status is updated. The asynchro-nous method takePicture is utilized tJano check if the cam-era is available and if it was possible to take a picture.
Listing 3
Navigator.geolocation.getCurrentPosition( (position) => { this.setState({ latitude: position.coords.latitude, longitude: position.coords.longitude, error: null, }); }, (error) => this.setState({ error: error.message }), { enableHighAccuracy: true, timeout: 20000, maximumAge: 1000}, );
Debugging & testing: React Native similarly offers mul-tiple ways to debug and test apps. Debugging mode can be
activated from a developer menu. This can be called by key-board shortcuts or, if running on a test device, by shaking the smartphone. To debug the JavaScript code in Chrome, a re-mote debugging session can by created when select Debug JS Remotely is selected from the developer menu. This will open http://localhost:8081/debugger-ui in a new browser tab. Other debugger implementations may be used as well and a recommendation then would be to use the standalone version of React developer tools. These can be installed via npm in-stall -g react-devtools and may be called via react-devtools. To set up unit testing for React Native it is recom-mended to utilize Jest and execute tests via node. For integra-tion testing, several different options exist. Integration testing always relies on platform specific environments; thus, those have to be set up first. The application source code is publicly available, the repository URL is:
https://github.com/futureLABHsPforzheim/react_blog_pro-
totype
D. Oracle Jet
Layout – Grid: Oracle Jet offers several components for
displaying data. With the tag <oj-data-grid> data can also be
displayed in a GridView. Layout – Tab: Oracle Jet offers
ready-made templates for tabs that can be reused. An inde-
pendent implementation can be done by using the tag <oj-
tab-bar> in combination with a <ul> [27].
Access system time: Oracle Jet also uses JavaScript tech-
nologies, so the time query is similar to Ionic
(date().getHours(). Access current position (GPS): Ora-
cle supports the use of Cordova plug-ins. After installing the
Cordova plugin Geolocation, it can be integrated into the pro-
ject. As can be seen in Listing 4, the values are stored in var-
iables latitude and longitude after a successful determination
of the location. Access to the camera: In Oracle Jet, the Cor-
dova Camera Plugin can be used to provide camera function-
ality. In order to use the camera in Oracle Jet, an appropriate
authorization must be granted.
Listing 4
self.getMapLocation = function (info) { navigator.geolocation.getCurrentPosition (onMapSuccess, onMapError, { enableHighAccuracy: true }); }; var onMapSuccess = function (position) { self.latitude(position.coords.latitude); self.longitude(position.coords.longitude); };
Debugging & testing: Oracle Jet applications can be ex-amined with any browser. In our development environment we used Chrome for debugging. As soon as the application was started with ojet serve ios|android|windows -browser, debugging in the local browser is possible. Debug-ging on an emulator or a physical device is also possible. The commands ojet serve ios|android|windows -emulator and ojet serve ios|android|windows -device are used

39
International Journal on Advances in Software, vol 12 no 1 & 2, year 2019, http://www.iariajournals.org/software/
2019, © Copyright by authors, Published under agreement with IARIA - www.iaria.org
for this purpose. As soon as the app is started, it can be exam-ined in the browser. Chrome offers a selection of available de-vices via chrome://inspect/#devices. Thus, console out-puts, network communication, memory utilization etc. can be examined. To test the application and its functionality, differ-ent frameworks can be used that are JavaScript compatible. Oracle itself uses QUnit [27]. The source code is publically available via GitHub, the repository URL is:
https://github.com/K1ngdan1/JetRefApp.git
E. Flutter
Layout – Grid: To use the GridView in Flutter with Dart
you define a new GridView.count(). CrossAxisCount defines
the amount of children in a Row and childApsectRatio their
size, both spacing options define how much space is between
the grid items, which are defined by children. Here children
attribute is filled with a list of widgets (see Listing 5).
Listing 5
return new Container( margin: const EdgeInsets.only(top: 200.0), color: Colors.white30, child: new GridView.count( crossAxisCount: 2, childAspectRatio: 1.0, padding: const EdgeInsets.all(4.0), mainAxisSpacing: 4.0, crossAxisSpacing: 4.0, children: widgets), );
Listing 6
return Scaffold( appBar: AppBar( title: Text('Colla Test App'), elevation: 0.7, bottom: new TabBar( controller: _tabController, indicatorColor: Colors.white, tabs: <Widget>[ new Tab(icon: new Icon(Icons.timer)), new Tab(icon: new Icon(Icons.location_searching)), new Tab(icon: new Icon(Icons.camera_alt)), ], ), ), body: new TabBarView( controller: _tabController, children: <Widget>[ new Time(), new Gps(), new Camera(widget.cameras), ], ) );
Layout – Tab: Dart defines Tabs with a widget named
TabBar, which creates the look of the Tab Bar. To use the
TabBar a TabController is needed to pass different options
e.g., the amount of tabs to the TabBar. The TabBarView cre-
ates the functionality for the GridView (see Listing 6) [35].
Access system time: To access the system time new
DateTime.now() is called. Access current position (GPS):
To access your location you first need to import the package
location. Then define a new variable and initiate it (see List-
ing 7).
Listing 7
Location _location = new Location(); StreamSubscription<Map<String,double>> _locationSubscription;
As illustrated in Listing 8 it can then be listened to the On-
LocationChanged method, which returns the current location
[36].
Listing 8
_locationSubscription= _location.onLocationChanged().listen((Map<String, double> result) { setState(() { lng = result["longitude"]; lat = result['latitude']; alt = result['altitude']; speed = result['speed']; }); });
Access the camera: First the camera package needs to be
imported and I must be verified if a camera is available (see
Listing 9).
Listing 9
List<CameraDescription> cameras; cameras = await availableCameras();
Afterwards it is mandatory to pass the found camera and
the desired resolution to the controller (see Listing 10).
Listing 10
controller = new CameraController(widget.cameras[0], ResolutionPreset.medium);
The asynchronous method takePicture then lets the user
take a picture and return its file path (see Listing 11) [36].
Listing 11
await controller.takePicture(filePath); return filePath;
The source code of the Flutter-Reference-App is publicly
available via GitHub, the repository URL is:
https://github.com/futureLABHsPforzheim/flutter_blog_pro-
totype.git

40
International Journal on Advances in Software, vol 12 no 1 & 2, year 2019, http://www.iariajournals.org/software/
2019, © Copyright by authors, Published under agreement with IARIA - www.iaria.org
V. FRAMEWORK EVALUTION
The evaluation and comparison of all frameworks is based on the reference architecture and the implementation of the corresponding test app. We selected several evaluation criteria based on the evaluation framework developed by Heitkötter et al. [37]. The aforementioned covers different evaluation crite-ria, especially for infrastructure (including the lifecycle as well as the functionality and usability of the app) and app de-velopment (including testing, debugging and developing the app). We also extended and removed some criteria (e.g., scala-bility). Hence, we base the evaluation on the following appli-cation properties:
1. Supported platforms 2. Supported development environment 3. Access to platform-specific functions 4. Application look and feel 5. Application portability 6. Simplicity of development 7. Application performance
At first, it is important, which platforms (Android, iOS, UWP, etc.) and to which extent these are supported by each framework. The next criterion discusses all possible develop-ment platforms and environments (Windows, MacOS and Linux). With the help of our test app we intend to analyze if platform-specific functions are available. Also, an evaluation of the UI is conducted to measure platform specific look and feel. Moreover, we want to unveil if the source code is reusa-ble and if it can be integrated into other frameworks (portabil-ity). Also, the development efforts play a major role and will be evaluated within criterion 6. In order to assess and evaluate efforts and feasibility of the frameworks, we asked five expe-rienced developers to implement our test application accord-ing the reference architecture. The following evaluation is also based on their feedback. Finally, we conducted an assessment of the application's performance. Therefore, the test app is used to measure: start time, used memory and execution speed of internal functionalities such as GPS polling. For this pur-pose, three test devices (Honor 9, Sony XZ1, Samsung Galaxy S7, IPhone 8) were used. The specifications of the test devices are listed in TABLE III. In order to stabilize test results, 100 test runs were conducted for each device. The following sub-sections will outline our observations for each framework in-dividually. Finally, this section is concluded by a comparison of all frameworks.
A. Ionic
Configuring a system for Ionic and creating a first app only takes a few minutes. Regarding ramp up, the majority of our developers found that Ionic is the easiest framework to start with. It has to be mentioned that it is necessary to ensure that all dependencies (to plug-ins) are installed according their de-clared version. This can be error prone, especially when Ionic is updated. In case of multiple app development projects, con-
flicts may also arise between dependencies of different pro-jects. Hence, previously deployed Ionic projects should be re-moved from the test device to prevent side effects during test-ing. As a prerequisite to start and develop Ionic applications only knowledge in the typical Web development stack (HTML, JavaScript and CSS) is required. TypeScript as an extension of JavaScript and thus is easy to learn if JavaScript is already known. TypeScript provides additional benefits compared to JavaScript (especially type safety) – some exten-sion have been adopted into ECMAScript-6 (such as classes, inheritance or generics) [38].
In addition, Ionic reuses Angular, which makes it easier to keep the code clean, separate concerns and speed up develop-ment of the application itself. The project structure in Ionic is logically well structured according to Web component archi-tecture. Since Ionic relies on Web technologies, the user is free to choose the development environment [23]. The use of Cor-dova is another advantage, especially because it enables ac-cess to system specific functionality and device sensors. Fur-thermore, Cordova improves re-use of application compo-nents, since a single code base can be utilized for all platforms. However, since Ionic is based on Web-technologies and pack-aged into native wrapper applications, the performance is be-hind native applications. Former evaluations also indicated that the performance is behind Xamarin and React Native, es-pecially for larger applications [20].
B. Xamarin
Xamarin projects can be set up in Visual Studio. With the use of C#, Xamarin is the best choice for developers, who also work conventionally with C#. Another advantage is the native UI [24]. Users will not recognize any difference to native ap-plications. Xamarin offers to share a single code base between platforms, to develop application logic. Platform specific ex-tensions may be integrated with a subproject feature of Xama-rin. As for all cross-platform frameworks, problems may arise with third-party plugins (installed via NuGet). We recognized several issues with outdated plug-ins. In general, our experi-ence has shown that new device and operating features of mo-bile devices had been adopted very fast by Xamarin. Hence, in most cases its framework-based services can be used in-stead of third-party plugins. Regarding testing and debugging applications, the developers stated that Xamarin would be the most convenient framework to use. This may be the case be-cause of extended possibilities instantly provided by Visual Studio.
C. React Native
React Native is easy to set up as well. React Native is built upon React and is also based on JavaScript. Applications de-veloped in React Native interpreted directly and the design ap-pears near to native. Interesting features include a well-de-signed live debugging. With Expo, React Native offers an open source toolchain to simplify deployment on test de-vices.

41
International Journal on Advances in Software, vol 12 no 1 & 2, year 2019, http://www.iariajournals.org/software/
2019, © Copyright by authors, Published under agreement with IARIA - www.iaria.org
TABLE III: TEST DEVICES
Honor 9 Sony XZ1 Samsung Galaxy S7 IPhone 8
Processor
type
HiSilicon Kirin 960 octa-core
processor (four 2.4 GHz cores and four 1.8 GHz cores)
Qualcomm Snapdragon 835 MSM8998
Octa-core (quad 2.35 GHz + quad 1.9 GHz) 64-bit Kryo processor
Exynos: Octa-core (4x2.3
GHz Mongoose & 4x1.6 GHz Cortex-A53)
Apple, Hexa-Core (64 Bit)
1. CPU: A11 Bionic, 4 x 2,24 GHz
2. CPU: A11 Bionic
Memory 4 GB RAM 4 GB 4 GB 2 GB
Graphic
chip
Mali-G71 MP8 GPU Adreno 540 Adreno 530 A11 Bionic
Display
size
5,15 inches
(1080x1920)
5,2 inches
(1080x1920)
5,5 inches
(1440x2560)
4,7 inches
(750x1334)
OS Version
Android 7.0 Nougat 8.0 Oreo Android 6.0.1 Marshmallow iOS 12.1.2
Although this may result in some benefits, we observed that the apps that are generated by the Expo are structured dif-ferently than those set up by the console. Additionally, these apps have different access to native functions. Another disad-vantage compared to the other frameworks is interface devel-opment. React utilizes a lot of specific HTML-Tags, which we recognized as somewhat difficult to use and configure. This makes it more difficult to get started than with other frame-works, even if experience in Web technologies is pre-existent.
Oracle Jet
Oracle Jet also offers its own CLI commands for the cre-
ation of cross-platform projects. Web technologies such as
JavaScript, HTML and CSS are used to build individual
pages of the app. To simplify the retrieval and processing of
information within the application, the jQuery library is used.
In addition, Oracle Jet offers a variety of UI elements to pro-
vide arbitrary display options. Oracle indicates, which
plugins have already been tested and verified. Other plugins
can also be used in Oracle Jet projects, but incompatibilities
may occur, and their functionality is not guaranteed. Oracle
Jet does not offer in-house debugging features, but existing
test and debug tools can be integrated into the system. In ad-
dition, Oracle Jet offers its own packaging functions for An-
droid, iOS and Web.
D. Flutter
Flutter is easy to setup. You literally need to download a
zip folder, unzip it in a directory with no security restriction
(e.g., on Windows C:\). Flutter comes with its own command
line tool, but you can integrate it into your system by adding
it to your environmental variables. Flutter also offers hot re-
load and fast native like performance, which enhances the
speed of development and the feeling of a native app. Flutter
uses its own programming language called Dart. It is oriented
on concepts known by Java and JavaScript but offers a lot of
specific extensions like the handling of asynchronous calls
with their new Future class. It also has its own virtual ma-
chine and comes with 2D-Rendering. In the beginning you
need to get used to Dart because there are some differences
in creating the UI but since their documentation is really good
you will be able to adjust yourself pretty quick.
E. Comparative Evaluation
To evaluate all frameworks comparatively and in an ob-jective manner, we implemented a test application according the reference architecture (as defined in Section IV). In a sec-ond step, we measured the criteria defined at the beginning of Section V, to reason about benefits and limitations of all frameworks. Based on upon the evaluation criteria presented and measured below, the overall results are summarized in TABLE IV. For each evaluation criterion, we applied a nom-inal scale that rates the observed framework behaviour in comparison to our general expectations and in relation to the other frameworks. The nominal scale contains the following ratings: “++”=very good, “+”=good, “0”=neutral, “-“=poor, and “--"=very poor.
Supported platforms: Ionic officially supports Android, iOS and since 2016 also UWP development, although the doc-umentation is still very limited here. Xamarin offers full sup-port for Android, iOS and UWP. Limited support is provided for MacOS. React Native supports iOS, Android and with a little extra effort also UWP applications. Oracle Jet also sup-ports iOS UWP and Android platforms. Flutter supports An-droid and iOS and with the help of Hummingbird it is possible to deploy your app in a specialized browser, which means you can use it on your desktop computer as well. The UWP is not yet supported and probably never will be because the market share is just too small to benefit from it. In a developers per-spective Xamarin is rated best, because its platform support is broader than all other frameworks.
Supported development environment: Ionic applica-tions can be developed on Windows, macOS and Linux. The development platform for Xamarin is Visual Studio for Win-dows and Xamarin Studio for macOS. React Native supports Windows, macOS and Linux. Oracle Jet projects, on the other hand, can be developed on Windows, macOS and Linux. Flut-ter can be used on any kind of operating system. Literally, since the web-based frameworks depend on technologies available on all common development environments, they all share a best in class rating. The latter does not hold true for Xamarin, since it is based on .net technologies and hence re-stricts use of development platforms. Thus, for this criterion Xamarin is rated less than all other frameworks.
Access to platform-specific functions: Ionic provides ac-cess to iOS, Android, Microsoft and browser-based features. Platform-specific functions can be used via various Cordova

42
International Journal on Advances in Software, vol 12 no 1 & 2, year 2019, http://www.iariajournals.org/software/
2019, © Copyright by authors, Published under agreement with IARIA - www.iaria.org
plugins. With Xamarin, all platform-specific functions can be used in a similar fashion. However, Xamarin offers different possibilities to access platform specific functions. The fastest possibility is to install corresponding NuGet packages. A sec-ond option would be the definition of interfaces with platform or device specific implementations and expose this shared code via the dependency service. Then there is also the possi-bility to use native libraries, for example written in pure Java for Android, via binding. While React-Native is JavaScript-based, and many native functions are not supported, it is pos-sible to include native SDKs and libraries. However, this re-quires specific code for Android (in Java) and for iOS (in Swift) which results in higher development efforts. In addi-tion, these features are currently often not mature enough. Or-acle Jet projects use Cordova like Ionic to address platform-specific functions. A common code base is therefore sufficient to address all different platforms and use their device-specific functions. Flutter uses Dart to directly interact with the native API of the client as illustrated already in Figure 8. Overall, the most comprehensive support for use of platform specific func-tions is given with Xamarin which it is rated best in this cate-gory.
Application look and feel: Ionic offers its own widgets for the UI. Navigation elements (e.g., back button) are pro-vided in platform-specific style, so the differences to native apps are small. As already described in Section V, the use of a GridView in Ionic is very simple. Xamarin creates com-pletely native UI, thus the interface is familiar to the user. Xamarin also supports styling with themes and the interface is not different to native apps. Xamarin Android also supports material design. React Native uses specialized widgets. Set-ting up a GridView it is not as easy as in Ionic or Xamarin, CSS has to be used to achieve this layout. In general, Ionic and React Native ignore style guidelines of platforms partially and some widgets break them explicitly. For example, tabs in Android are at the top of the screen in native apps, while this is not the case in apps developed with Ionic or React Native. Xamarin, in contrast, uses tabs as expected. Oracle Jet offers native themes to display the applications adapted to the plat-form used. In addition, different templates can be used to adapt the styling to your own needs. Since Flutter uses its own widgets, which are accessing the native API and Widgets via Dart. That brings the look and feel of a native written app. The most native appearance of apps is given when Flutter and Xamarin are utilized. While the other frameworks also get close to a native user experience, they still fall behind.
Application portability: Since Ionic represents a hybrid approach, portability of the source code is given and further supported through Cordova. Since Ionic modules are well-structured and based on Web technologies, they can be trans-ferred to other Web frameworks. However, as many other frameworks, Ionic uses specific HTML tags that may not be supported in other frameworks, thus there is limited transfer-ability of this module part. Since Xamarin separates applica-tion logic and UI related code, it offers the best portability and reuse of the logic. Furthermore, Visual Studio offers tolling (portability analyser) to transfer the UI related parts as well. Of course, it has to be said that this is restricted to .Net and
mono frameworks. The UI (defined by eXtended Application Markup Language, XAML), could in principle be transformed into HTML or similar languages, which, however, requires further manual efforts in a second step. Similarly, React Na-tive offers portability to different platforms. React-Native code is relatively easy to transfer to other frameworks that use JavaScript, HTML, and CSS. Comparable to Ionic, special-ized HTML tags have to be XAML handled manually. How-ever, since as React Native Logic, UI and CSS are typically implemented in a single file, this tends to be tedious. Like Ionic, Oracle Jet uses a hybrid approach. JavaScript is used for the application logic, HTML for the page structure and CSS for the styling. This allows this code to be transferred to other hybrid approaches that use web technologies. However, the Oracle Jet specific HTML tags represent limitations. These cannot be transferred to other frameworks and must be re-placed. Even though Flutter uses Dart is possible to use the code elsewhere, since there are possibilities to compile or re-use the code in web apps like Hummingbird, DartPad and dart2js [36][39][40]. Overall, we expected frameworks to be much more advanced already, nevertheless neither of them could really fulfil our expectations.
Simplicity of development: Through a lot of documenta-tion (tutorials, community discussion, API documentation, quick start and programming templates) a quick and efficient start in development of Ionic Apps is possible. Because of the short development lifecycle, confusion may occur through different version documents and some outdated plugins. Oc-casionally, the framework reveals unexpected behavior (some builds end up with broken apps, while a rebuild without code change is successful). We intend to examine this further. Cur-rently we believe that this is related to generator issues. In principle, the development with Xamarin is fast as well, since the framework also possesses a very good documentation (tu-torials, sample projects and a very precise API documenta-tion). The programming language underneath (C#) also is very sophisticated and in our opinion much better then JavaScript. In terms of simplicity, Visual Studio or NuGet may pose a certain barrier for developers not used to it in the beginning. The entry into the development with React Native is compa-rable to Ionic. The use of the framework-specific UI elements is different from the other frameworks but does not impose an obstacle. The ability to see and debug all changes in real-time eases troubleshooting. A larger issue is related to external li-braries and modules. Since many of these modules and librar-ies are not officially supported, regular maintenance and sup-port is not guaranteed. In addition, we observed that the instal-lation of node modules consumes much more time compared to Ionic. For Oracle Jet, the vendor provides extensive docu-mentation from application setup to testing and debugging Or-acle Jet applications. A cookbook is available for existing el-ements (collections, controls, forms, framework, layout and patterns). Additionally, sample projects and starter templates are offered to speed up the start of development. Thus, de-tailed documentations are available, which simplify the devel-opment with Oracle Jet. A detailed debugging using the browser tools promotes the development and simplifies the finding and elimination of errors.

43
International Journal on Advances in Software, vol 12 no 1 & 2, year 2019, http://www.iariajournals.org/software/
2019, © Copyright by authors, Published under agreement with IARIA - www.iaria.org
TABLE IV: EVALUATION OF CROSS-PLATFORM FRAMEWORKS
Evaluation Criteria Ionic Xamarin React Native Oracle
Jet
Flutter
Supported platforms + ++ + + +
Supported development platforms ++ 0 ++ ++ ++
Access to platform-specific func-
tions + ++ 0 + +
Application Look & Feel + ++ + + ++
Application Portability 0 0 0 0 0
Simplicity of development ++ + 0 + +
Application performance + + 0 + ++
Flutter comes with a very good documentation that offers a cookbook for different widgets and use cases. It also has a large number of code labs/tutorials to help you getting into Flutter and Dart. In terms of debugging and testing Dart has some tools like the Dart Analyzer to check our code for errors or the Dart Observatory, which lets you define your own breakpoints in the code without using an IDE to do so. Like in every mentioned framework you can print out logs as well. Furthermore, Flutter has integrated the possibility of writing unit tests, widget tests and integration tests, which is well doc-umented on their official page. We faced very little errors and bug while developing though the framework is still young. In this category we rated how quick and flawless a developer can initiate and develop an application. Overall, all frameworks provide developer support but Ionic currently provides the most comprehensive developer guidelines.
Application performance: In order to stabilize test re-
sults, we deployed all test applications and measured results
of 100 test runs with four test devices. Hence, we could ob-
serve the following numbers: The required start time of the
Ionic test app is between 2s and 2.44s, while Xamarin re-
quires 3 to 3.3s, React Native 4 to 4.5s and Oracle Jet 1,2s.
Flutter just needed 0.5s to start the app The size of the Ionic
app is 10 MB, while Xamarin requires 24 MB, React Native
requires 11 MB, Oracle Jet requires 19.13 MB and the Flutter
app requires 34.12 MB. The time the Ionic app takes to re-
trieve the current location (with high signal strength of GPS)
is approximately 0.1s, while Xamarin needs 3.0s, React Na-
tive 0.4s, Oracle Jet 1.2s and Flutter 0,3s.
VI. CONCLUSION AND OUTLOOK
In this article, we reviewed a couple of cross-platform
frameworks and discovered that they can significantly reduce
development efforts, especially if code shall be shared be-
tween different platforms. This of course, is not the case with
native app development. Hence, in our point of view cross-
platform development is superior to native app development.
This especially holds true, if a cost-benefit relation is applied.
In addition, there are almost no limitations in the use of native
functionalities when cross platform libraries are employed.
In this article, we focused the evaluation on five different
frameworks and evaluated, which of them provides the best
development support for multiplatform deployment. In order
to decide, which frameworks and approaches to choose for
evaluation, we conducted a literature review and did some re-
search about popularity of frameworks. Hence, we evaluated
developer-oriented web portals and usage statistics of cross-
platform development frameworks. While we had been able
to discover several scientific approaches to multiplatform de-
velopment, we recognized that current development is mainly
driven by standardized web technologies. These are typically
extended by generator-based technologies, which are utilized
in order to transform and package applications for platform
specific rollout (deployment). Further approaches where de-
fined in literature, such as transformation-based or inter-
preted application (parser-based) development.
We analysed and evaluated all frameworks on the basis of
the following categories: a) supported platforms, b) sup-
ported development environment, c) access to platform-spe-
cific functions, d) application look and feel, e) application
portability, f) simplicity of development, and g) application
performance. The results of our evaluation conclude that
Flutter is the best suited framework for cross-platform devel-
opment. In our case study, we examined Ionic, Xamarin, Re-
act-Native, Oracle Jet and Flutter in detail. Our results re-
vealed several differences to other comparable articles. First,
numerous articles have reported that Ionics’s performance is
rather poor compared to the other frameworks. However,
Ionic scored surprisingly well in our tests. Together with the
Flutter framework, Ionic had the best performance score.
Compared to other studies [6], performance enhancements of
all evaluated cross-platform frameworks could be observed
in general. This applies to response and processing times as
well as sensor access. The latter can be a result of framework
improvements within the latest versions as well as mobile de-
vice platform improvements. From a user's point of view,
there are almost no observable performance issues when
compared to native applications. All evaluated frameworks
offer full access to system functionalities and sensors. Alt-
hough new versions of operating systems can lead to different
functionalities and sometimes completely different APIs, the
rate and speed of their adoption in cross-platform frameworks
is quite high [41]. All cross-platform frameworks allow ge-
neric development for different operating systems, although
there are still limitations. As we mentioned before, apps are
sometimes not fully portable and may require platform-spe-
cific customizations. This holds true for all approaches. Fur-
thermore, the statement that the reuse of components between

44
International Journal on Advances in Software, vol 12 no 1 & 2, year 2019, http://www.iariajournals.org/software/
2019, © Copyright by authors, Published under agreement with IARIA - www.iaria.org
different mobile applications is not yet fully supported is not
valid. Ionic has released betas, which support the use of other
components written in React, Vue and Angular [23]. Never-
theless, we could not observe that components developed in
one framework could be integrated in other frameworks with
ease. Since the web-component standard is promising in this
context, we plan to do research of cross-component integra-
tion between different frameworks in a next step. As another important feature of a framework, long-term
support is essential to reach a wide range of users and ensure support for current applications. In newer versions of the frameworks examined, it was observed that downward com-patibility with APIs of earlier releases was not given. This is common in web development and is known at least since An-gular 2 completely broke with the API of its predecessor An-gularJS. This can be observed repeatedly for new releases, and its likelihood that this is repeated for future framework re-leases is high. Thus, it is important for mobile software engi-neering, whether standardized component development (e.g., the web component architecture) will be adopted in all frame-works. Supplementary important aspects are, if framework consolidation is promoted or whether the spread of new pro-gramming languages and techniques will further divide the market. Similar arguments apply to the downward compatibil-ity of the API. This will give rise to further research questions on API issues.
As mentioned above, an important question will be whether it is possible to transfer code from current framework applications into new releases and preserve their functionality (even if the API changes). Therefore, we intend to define a model-driven approach to address this problem in a next step. In this context, we plan to compare parser-based methods with transformation-based cross-platform approaches and to derive API mappings. As a broader outlook, a more detailed study in the area of web components will be performed. In this context, we are planning to assess reusability of web components. Our goal is to evaluate web component programmed utilization across multiple different frameworks.
ACKNOWLEDGEMENT
This article is result of our work conducted in the project
“EDV – Einfaches Digitales Vergessen”. The research pro-
ject was supported by the German Federal Ministry of Eco-
nomics and Energy (BMWi) as part of the smart data funding
line.
REFERENCES
[1] J. Christoph, D. Rösch, and T. Schuster, “Cross-Platform De-
velopment. Suitability of Current Mobile Application Frame-
works,” in The Eighth International Conference on Ad-
vanced Collaborative Networks, Systems and Applications,
Venice, Italy, 2018, pp. 13–20.
[2] Statista, “Internet of Things, Forecast, Number of networked
devices worldwide by 2020,” Statista. [Online]. Available:
https://de.statista.com/statistik/daten/studie/537093/um-
frage/anzahl-der-vernetzten-geraete-im-internet-der-dinge-
iot-weltweit/. [Accessed: 07-Mar-2018].
[3] Statista, “Number of smartphone users worldwide 2014-
2020.” [Online]. Available: https://www.statista.com/statis-
tics/330695/number-of-smartphone-users-worldwide/. [Ac-
cessed: 15-May-2018].
[4] L. Knoll, “Developing The Connected World Of 2018 And
Beyond,” Forbes. [Online]. Available:
https://www.forbes.com/sites/forbestechcoun-
cil/2018/03/16/developing-the-connected-world-of-2018-
and-beyond/. [Accessed: 30-Jan-2019].
[5] L. Corral, A. Janes, and T. Remencius, “Potential advantages
and disadvantages of multiplatform development frame-
works–a vision on mobile environments,” Procedia Com-
puter Science, vol. 10, pp. 1202–1207, 2012.
[6] W. S. El-Kassas, B. A. Abdullah, A. H. Yousef, and A. M.
Wahba, “Taxonomy of Cross-Platform Mobile Applications
Development Approaches,” Ain Shams Engineering Journal,
vol. 8, no. 2, pp. 163–190, Jun. 2017.
[7] Statista 2019, “Marktanteile der führenden mobilen Betriebs-
systeme an der Internetnutzung mit Mobiltelefonen weltweit
von September 2009 bis November 2018,” 01-Nov-2018.
[Online]. Available: https://de.statista.com/statis-
tik/daten/studie/184335/umfrage/marktanteil-der-mobilen-
betriebssysteme-weltweit-seit-2009/. [Accessed: 31-Jan-
2019].
[8] Android Developers, “Android distribution dashboard.”
[Online]. Available: https://developer.an-
droid.com/about/dashboards. [Accessed: 01-Jun-2019].
[9] I. Dalmasso, S. K. Datta, C. Bonnet, and N. Nikaein, “Sur-
vey, comparison and evaluation of cross platform mobile ap-
plication development tools,” in Wireless Communications
and Mobile Computing Conference (IWCMC), 2013 9th In-
ternational, 2013, pp. 323–328.
[10] M. Lachgar and A. Abdali, “Decision Framework for Mobile
Development Methods,” International Journal of Advanced
Computer Science and Applications (IJACSA), vol. 8, no. 2,
2017.
[11] V. Ahti, S. Hyrynsalmi, and O. Nevalainen, “An Evaluation
Framework for Cross-Platform Mobile App Development
Tools: A case analysis of Adobe PhoneGap framework,”
2016.
[12] J. vom Brocke, A. Simons, B. Niehaves, and K. Reimer, “Re-
constructing the Giant on the importance of Rigour in docu-
menting the Literature search Process,” ECIS 2009 Proceed-
ings, vol. Paper 161, pp. 1–14, 2009.
[13] H. M. Cooper, “Organizing knowledge syntheses: A taxon-
omy of literature reviews,” Knowledge in Society, vol. 1, no.
1, pp. 104–126, Mar. 1988.
[14] J. Webster and R. T. Watson, “Analyzing the Past to Prepare
for the Future: Writing a literature Review,” MIS Quarterly,
vol. 2, no. 26, pp. xiii–xxiii, 2002.
[15] P. Smutný, “Mobile development tools and cross-platform
solutions,” in Proceedings of the 2012 13th International
Carpathian Control Conference, 2012.
[16] J. Perchat, M. Desertot, and S. Lecomte, “Component based
framework to create mobile cross-platform applications,”
Procedia Computer Science, vol. 19, pp. 1004–1011, 2013.
[17] M. E. Joorabchi, M. Ali, and A. Mesbah, “Detecting incon-
sistencies in multi-platform mobile apps,” in Software Relia-
bility Engineering (ISSRE), 2015 IEEE 26th International
Symposium on, 2015, pp. 450–460.

45
International Journal on Advances in Software, vol 12 no 1 & 2, year 2019, http://www.iariajournals.org/software/
2019, © Copyright by authors, Published under agreement with IARIA - www.iaria.org
[18] R. Acerbis, A. Bongio, M. Brambilla, and S. Butti, “Model-
Driven Development Based on OMG’s IFML with WebRa-
tio Web and Mobile Platform,” in Engineering the Web in the
Big Data Era, 2015, pp. 605–608.
[19] Apache Cordova, “Architectural overview of Cordova plat-
form.” [Online]. Available: https://cor-
dova.apache.org/docs/en/7.x/guide/overview/index.html.
[Accessed: 09-Mar-2018].
[20] A. Holzinger, P. Treitler, and W. Slany, “Making Apps Use-
able on Multiple Different Mobile Platforms: On Interopera-
bility for Business Application Development on
Smartphones,” in Multidisciplinary Research and Practice
for Information Systems, 2012, pp. 176–189.
[21] “Ionic vs React Native vs Xamarin 2018 Comparison | Stack-
Share.” [Online]. Available: https://stackshare.io/stack-
ups/ionic-vs-react-native-vs-xamarin. [Accessed: 07-Mar-
2018].
[22] M. Ramos, M. T. Valente, R. Terra, and G. Santos, “Angu-
larJS in the wild: A survey with 460 developers,” in Proceed-
ings of the 7th International Workshop on Evaluation and
Usability of Programming Languages and Tools, 2016, pp.
9–16.
[23] Ionic, “Build Amazing Native Apps and Progressive Web
Apps with Ionic Framework and Angular,” Ionic Frame-
work. [Online]. Available: https://ionicframework.com/.
[Accessed: 20-May-2019].
[24] “Developer Center - Xamarin.” [Online]. Available:
https://developer.xamarin.com/. [Accessed: 07-Mar-2018].
[25] A. Sandu, “Build Cross-Platform Android and iOS UIs with
Xamarin Forms,” 26-Feb-2016. [Online]. Available:
https://www.sitepoint.com/build-cross-platform-android-
ios-uis-xamarin-forms/. [Accessed: 31-Jan-2019].
[26] Facebook, “React Native · A framework for building native
apps using React.” [Online]. Available: https://face-
book.github.io/react-native/index.html. [Accessed: 09-Mar-
2018].
[27] Oracle, “Oracle Jet Developer’s Guide.” [Online]. Available:
https://docs.oracle.com/en/middleware/jet/6.1/develop/in-
dex.html. [Accessed: 18-Jan-2019].
[28] Oracle, “Welcome to Oracle JET.” [Online]. Available:
https://www.oracle.com/webfolder/technetwork/jet/in-
dex.html. [Accessed: 18-Jan-2019].
[29] Oracle, “The Oracle JET Architecture,” JavaScript Exten-
sion Toolkit (JET) Developing Applications with Oracle JET.
[Online]. Available: https://docs.oracle.com/middle-
ware/jet410/jet/developer/GUID-293CB342-196F-4FC3-
AE69-D1226A025FBB.htm#JETDG113. [Accessed: 31-
Jan-2019].
[30] “Building Beautiful UIs with Flutter.” [Online]. Available:
https://codelabs.developers.google.com/codelabs/flutter/#0.
[Accessed: 25-Jan-2019].
[31] “Flutter - Beautiful native apps in record time.” [Online].
Available: https://flutter.io/. [Accessed: 25-Jan-2019].
[32] A. R. Hevner, S. T. March, J. Park, and S. Ram, “Design Sci-
ence in Information Systems Research,” MIS Quarterly, vol.
28, no. 1, pp. 75–105, Mar. 2004.
[33] M. E. Joorabchi, A. Mesbah, and P. Kruchten, “Real chal-
lenges in mobile app development,” in Empirical Software
Engineering and Measurement, 2013 ACM/IEEE Interna-
tional Symposium on, 2013, pp. 15–24.
[34] M. Willocx, J. Vossaert, and V. Naessens, “A Quantitative
Assessment of Performance in Mobile App Development
Tools,” in 2015 IEEE International Conference on Mobile
Services, 2015, pp. 454–461.
[35] Flutter, “Dart API docs,” 07-May-2019. [Online]. Available:
https://docs.flutter.io/. [Accessed: 25-Jan-2019].
[36] “Dart Packages,” Dart Packages. [Online]. Available:
https://pub.dartlang.org/. [Accessed: 25-Jan-2019].
[37] C. Rieger and T. A. Majchrzak, “Weighted Evaluation
Framework for Cross-Platform App Development Ap-
proaches,” in Information Systems: Development, Research,
Applications, Education, 2016, pp. 18–39.
[38] Microsoft, “TypeScript is a superset of JavaScript that com-
piles to clean JavaScript output,” 07-Jun-2018. [Online].
Available: https://github.com/Microsoft/TypeScript. [Ac-
cessed: 07-Mar-2018].
[39] Dart, “dart2js: The Dart-to-JavaScript Compiler,” 17-Apr-
2019. [Online]. Available: https://web-
dev.dartlang.org/tools/dart2js. [Accessed: 28-Jan-2019].
[40] Y. Jbanov, “Hummingbird: Building Flutter for the Web,”
Flutter, 04-Dec-2018. [Online]. Available: https://me-
dium.com/flutter-io/hummingbird-building-flutter-for-the-
web-e687c2a023a8. [Accessed: 28-Jan-2019].
[41] M. Martinez and S. Lecomte, “Towards the Quality Improve-
ment of Cross-Platform Mobile Applications,” in 2017
IEEE/ACM 4th International Conference on Mobile Soft-
ware Engineering and Systems (MOBILESoft), Buenos
Aires, Argentina, 2017, pp. 184–188.

46
International Journal on Advances in Software, vol 12 no 1 & 2, year 2019, http://www.iariajournals.org/software/
2019, © Copyright by authors, Published under agreement with IARIA - www.iaria.org
Holistic Analysis of the Effectiveness of a Software Engineering Teaching Approach
José Carlos Metrôlho, Fernando Reinaldo Ribeiro
R&D Unit in Digital Services, Applications and Content
Polytechnic Institute of Castelo Branco
Castelo Branco, Portugal
[email protected], [email protected]
Abstract—To provide the best training in software engineering,
several approaches and strategies are carried out. Some of
them are more theoretical, learned through books and
manuals, while others have a practical focus and often done in
collaboration with companies. In this paper, we share an
approach based on a balanced mix to foster the assimilation of
knowledge, the approximation with what is done in software
companies and student motivation. Two questionnaires were
also carried out, one involving students, who had successfully
completed the subject in past academic years (some had
already graduated, and others are still students), and other
questionnaire involving companies, in the field of software
development, which employ students from our school. The
analysis of the perspectives of the different stakeholders allows
an overall and holistic) view, and a general understanding, of
the effectiveness of the software engineering teaching
approach. We analyse the results of the questionnaires and
share some of the experiences and lessons learned.
Keywords- agile methodologies; education; software
engineering; teaching; teamwork.
I. INTRODUCTION
One of the biggest challenges in teaching software engineering is empowering students with the knowledge and skills they need to be well prepared to face the labour market. This includes providing students with technical skills but also providing them with the non-technical skills associated to the software engineering process. It is also known that the teaching of software engineering cannot be limited to the presentation of concepts and methodologies as a set of abstract concepts. In our previous paper, presented in ICSEA [1], we analysed how the main concepts of the software engineering subject are assimilated by the students and if they are applied in the labour market. We also learn that it is important for students to develop practical projects to complement their education. This is corroborated by other authors who point out that wherever possible, software engineering teaching should be adequately complemented with the practice of software engineering projects so that the students can assimilate and understand them successfully [2]–[4]. Additionally, it is important to consider the growing importance of human factors in the software development process [5] and consequently the role that some of them play
in the software engineering process, namely: communication, coordination, collaboration, trust, expert recommendation, program comprehension, knowledge management and culture.
Several approaches and strategies have been proposed and used to improve the teaching and learning of software engineering. They all ensure the importance of giving students hands-on experience. However, the way they propose to do so differs greatly.
This paper describes an experience in teaching Software Engineering, of a Computer Engineering program, using a project-based approach. This approach is enriched with the collaboration of software houses giving the students a real-world experience of software engineering project development. In our paper [1] we tried to understand how the main concepts of the subject are assimilated by the students and if they are applied in the professional life of our past students. In this paper we extend our approach to include the point of view of the companies that employ our students. The opinion of these companies, which employ and develop activities in this area (Software development), is very valuable. It may represent significant contributions for the improvement of the teaching-learning process and for better integration of the students in the labour market. To reach this goal, we conducted a questionnaire with a group of employers. We chose 5 companies that have recruited our graduates in Portugal. This set of companies is obviously reduced compared to the universe of thousands of software development companies worldwide. However, the collected data is a starting point for analysing what is considered relevant to these partners. Although we graduate students for a larger universe of companies, the collected data are useful as indicators of aspects that we must take into account, while obviously not neglecting other methodologies and topics related to Software Engineering.
The results of this questionnaire allow us to improve the definition of the topics on which the lecture should focus and to keep the syllabus updated. Additionally, it helps us to understand the strengths and weaknesses of the employees who graduated from our school (soft skills and technical skills). This analysis of the perspectives of the different stakeholders allows an overall and holistic view and a

47
International Journal on Advances in Software, vol 12 no 1 & 2, year 2019, http://www.iariajournals.org/software/
2019, © Copyright by authors, Published under agreement with IARIA - www.iaria.org
general understanding of the effectiveness of the software engineering teaching approach.
The remainder of this paper will be as follows: Section II presents a brief review of related work; in Section III we present an overview of our project-based approach for software engineering; Section IV provides a brief description of the questionnaires that were conducted to achieve feedback from former students and employers; in Section V we present the results and analysis of the questionnaire; Section VI presents some lessons learned and challenges faced and finally, in Section VII we present some conclusions and we outline some of the future work.
II. RELATED WORK
To provide the best training in software engineering, several approaches and strategies have been proposed. Some of them are more theoretical, more focused on the study of theory through books and manuals, while others have a more practical focus and often done in collaboration with companies. Nowadays, it seems to be a well-accepted fact that the software engineering training should not be strictly focused on the theoretical study of concepts and methodologies. It is important to provide students with hands-on experience in a software engineering project and provide them with the non-technical skills in a software project. It is important to promote hands-on ability training and the rapprochement between teaching and practice. Additionally, the recent diffusion of agile methodologies in software development brings many difficulties and challenges to software engineering teaching. In this context, several authors refer that current approaches to teaching software engineering are outdated and lack authenticity [6], [7]. However, as referred in [6], it is not clear which should be the best approach and there are different perspectives with different proposed approaches. Some authors (e.g., Clear and Damian [6][8]) suggest that the best approach is to emulate the workplace through distributed software development projects, through cross-university or cross-course courses, others (e.g., [9]–[11]) suggest involving students in a project where they have the possibility to experience team work and understanding in the practice of the theoretical concepts dealt with in the course and others (e.g., [12]–[14]) argue for the use of simulations and games to provide students with a variety of experiences that would not be possible within the constraints of an academic environment. Next, a brief analysis of some works that have been proposed for each one of the perspectives identified before is presented.
The emulation of the workplace through distributed projects or cross-university courses was approached and experienced by some authors. The DOSE [8], a Distributed and Outsourced Software Engineering course, followed an approach to teaching distributed software engineering centred in a distributed software development project. They experienced teaching software engineering using a geographically distributed software project involving various countries with different cultures, native languages and time zones. This approach gives the students the opportunity of facing the challenges of distributed software development and helps them understand typical software engineering
issues, such as the importance of software requirements for specifications, or the relevance of adequate system design. However, they also identify some time scheduling inconveniences, and difficulties in keeping teams committed to their peers. The Undergraduate Capstone Open Source Projects (UCOSP) program [15] ran for ten terms over six years providing for over 400 Canadian students from more than 30 schools. After this period, the authors identified some lessons they had learned: Students work on real distributed open-source projects as full members of software development teams; they use the same software development processes as regular team members and are provided with explicit mentorship from volunteer mentors from each project; students integrate and apply the skills they have learned in their courses in a real development setting; students develop and improve their technical communication skills in a real development setting.
A project-oriented approach is followed in several software engineering training programmes. Its purpose is to teach students the theoretical and the practical aspects of developing software systems in a team environment giving students a chance to experience a work scenario that is closer to a real-world experience. A Project-Based learning in software engineering Lab, teaching through an e-Portfolio approach is described in [10]. In this approach, the e-Portfolio allows students to carry out a software project, addressing each phase collaboratively with other students and obtaining appropriate feedback from instructors. The e-Portfolio includes a single problem statement for the development of a complete software project comprising of a set of deliverables. To support the implementation, they chose the Moodle Platform. To assess the students’ e-portfolios, various rubrics were implemented by scoring and weighting the sections and categories for every deliverable to be evaluated. Another project-based learning approach for teaching software engineering concepts is described in [11]. Their goal is to teach software engineering concepts using the Scrum framework in real life projects. Projects usually have a capacity of about 1000 workhours. To make the projects more relevant real customers were incorporated. They bring in requirements from industry and present their topics during a kick-off meeting. During the project, students work together as self- organized teams (5-7 elements). They chose an appropriate project management and team coordination process and they are only asked to use some core tools that are needed to monitor the projects.
A game-based learning methodology of teaching software engineering is presented in [13]. They suggest a methodology of two-fold use of learning games for teaching software engineers. Students, experienced in programming, develop learning games, and then they use the games that are developed for teaching the next generation of students. Students developing games learn the software development life cycle phases including testing, deployment and maintenance, they contact with customers (teachers of corresponding subjects act as customers) and users (students, learning these subjects). In their approach, they find both advantages and disadvantages. As advantages, they identify the increasing students’ motivation and revealing their

48
International Journal on Advances in Software, vol 12 no 1 & 2, year 2019, http://www.iariajournals.org/software/
2019, © Copyright by authors, Published under agreement with IARIA - www.iaria.org
creativity. The main problems observed include difficulty in organizing team work especially for students of early years and lack of time for coordinating them. Schäfer [14] describes some lessons learned after two teaching periods in using Scrum with gamification to learn and train the agile principles. They found that their approach has both advantages and disadvantages. Gamification is motivating and helps to bring participants with different backgrounds together in project teams. As drawbacks, they refer to the importance of having a real external stakeholder or customer defining a project goal externally in a Scrum learning project.
There are different approaches and strategies that may be followed to provide students with the best training in software engineering. All of them agree that the theoretical study of concepts and methodologies should be complemented with hands-on experience in a software engineering project. This would allow students to be provided with a better understanding of the theoretical concepts and to equip them with the non-technical skills in software projects. However, the way different approaches propose to provide the students with the practical experience is very different. Some of them suggest emulating the workplace through distributed projects, which may involve several entities and thus provide interesting experiences in software engineering. Others suggest a project-oriented course where students can practice requirements analysis, project management, development methodologies and teamwork. Another recommendation is using simulations and games to simulate distinct scenarios in software engineering teaching and training.
However, regardless of the approach or strategy, it is necessary to understand whether students have acquired the knowledge and skills they need for the performance of their duties, and whether they apply them in their professional activity in software engineering. To understand this, it is a holistic analysis (i.e., analysis of the big picture involving several stakeholders, namely students, alumni and employers, about the teaching methodology implemented in this subject in recent years) that is important since it allows for an understanding of the vision of the different stakeholders that may be involved in the software engineering teaching process: teachers, students, graduates and employers.
III. OVERVIEW OF OUR APPROACH FOR SOFTWARE
ENGINEERING
In this case a project-based approach was adopted for
teaching Software Engineering. This subject is part of the
second year of a computer science course (undergraduate
course). It is a subject that has 5 ECTS and where the
semester load is 30 hours for theoretical classes and 45
hours for laboratory classes. The focus of the adopted
approach was to combine theory and practice.
One teacher is responsible for the subject management
and theoretical lectures. In these classes, the teacher
presents the concepts and methodologies and promotes
discussion about them. Students are also provided with an
introduction to some software development methodologies
namely Waterfall, Extreme Programming, Scrum, Spiral,
etc. Other topics analysed include quality and metrics in
software engineering, software design, implementation,
testing, configuration management, among others. In the
assessment, this theoretical part has a weight of 40% for the
final grade; the remaining 60% is from the practical
component.
Another teacher is responsible for the practical classes. In
these classes, students acquire some practice of software
engineering through the specification, design,
implementation and validation of a software application, as
a project for teams of 4-6 students. Scrum is the adopted
agile software development methodology. The teacher acts
as a product owner. Each team member has a specific
function (e.g., Scrum Master, Designer, etc.). Each team
develops a different project. However, all the projects are
focused on the development of a game from a software
engineering perspective. This is important to maintain the
students motivated and engaged with the project. The first
deliverable is revised to accommodate feedback from the
product owner. Trello is used for project management and to
track progress on tasks.
A. Additional Realism
One class of the subject has been taught by professionals
from software house companies. In this class, software
development processes like Feature Driven Development
(FDD) and Behaviour Driven Development (BDD) were
approached and some of their practical aspects are
discussed.
Another important initiative to enable students to get in
touch with practice in software engineering is a one-day
visit to the premises of another software house company.
This company (Outsystems) is well-known for the software
development platform they hold and that is used by many
software companies worldwide. Their platform is a low-
code platform for rapid application development. It is
especially designed for developing applications in the
context of agile projects. During this journey, students were
able to have closer contact with some Scrum activities
(namely Daily Scrum, Sprint, Sprint Execution) and contact
with some Scrum Roles (Scrum Master, Development
Team). Professionals explain to the students what they are
doing, and which technologies and tools are used to support
their activities. Students also had a brief session about
software cost estimation.
These events are very important since they provide
students with the contact and interaction with real software
engineering projects with real stakeholders. They help to
improve the understanding and the assimilation of the
concepts learned in the classes of the subject.
B. Student evaluation
The student evaluation comprises both theoretical and
practical evaluation. The theoretical evaluation is a written

49
International Journal on Advances in Software, vol 12 no 1 & 2, year 2019, http://www.iariajournals.org/software/
2019, © Copyright by authors, Published under agreement with IARIA - www.iaria.org
exam over the course material. The exam consists of 10
questions chosen from the list of 30 questions that were
made available to the students at the beginning of the
semester. Most questions are reflexive questions about
software engineering subjects. With this approach, the intent
is to avoid students wanting to memorise the matters learned
along the semester (15 weeks). Also, it is desirable that
students learn and acquire knowledge for a long-life period,
mainly to be used after graduation on their job integration
experience. In section V, some gathering data that wants to
evaluate results about the achievement to this goal of our
approach will be presented.
For the practical evaluation, throughout the semester,
during the 15 working weeks, students´ working teams
develop the product on 6 sprints (sprints here are defined as
having 2 weeks each). The teacher (i.e., product owner)
meets with each team at the end of the sprint to evaluate the
work in progress, the achievements and the goals for the
next sprint. The team works in class (3h/week) and out of
class. Halfway through the semester, after sprint 4, and at
the end of the semester, after sprint 7, each team has an
assessment session where both teachers are present to
evaluate different parameters. Some of the parameters are:
clear goals, state of the art, requirements (functional and
non-functional), software development process (roles,
artefacts, timings, hits and misses), team member´s
description (roles, skills) task scheduling (monitoring using
Trello tool), modelling (user stories), implementation
(code), budget (estimated based on the lesson learned during
the visit to the company referred to on the previous section
of this paper), conclusions (pros and cons) and future work,
literature used and citation on the final report, and final
presentation and discussion.
One of the achievements that students sometimes realize
is learning from mistakes. For instance, if they do not
communicate within the team the achieved results are poor,
when compared with other more cohesive teams. On the
other hand, in collaboration with the “Scrum Master” of the
team, a deeper evaluation can be done to eventually assign
different grades to the members of the team.
IV. UNDERSTANDING STAKEHOLDERS' PERSPECTIVE
In order to gauge the post-retention cognitive load, a
questionnaire of former students was conducted in order to
obtain feedback on the importance of the subject to their
current professional activity (of those who finished the
course and work in the area), and also to know if the
knowledge transmitted in the theoretical classes remains.
For this last component, the questionnaire included
questions that had already been used in the theoretical
evaluation of the subject. The answers were evaluated with
the same evaluation criteria, graded in a scale of 0-20. The
questions were selected from the same set of 30 questions
referred to in Section III-B. Respondents were informed that
the results were for a study. They were also informed that
the goal of the study was to understand if the concepts and
knowledge acquired in the Software Engineering subject
remained present. The questionnaire was also used to gather
insights about the usefulness of the subject for each
graduate’s the practical life. Thus, questions about aspects
that may be used in the day to day of their professional
activities in the companies where they currently work, were
included in the questionnaire.
Also, in order to get feedback from employers about
issues that are important to graduate students starting their
professional activity, a questionnaire for employers was
conducted. The questionnaire included questions about the
development processes used in the company (traditional,
agile, etc.); the importance of software engineering contents
to the company’s activity; soft skills and technical
knowledge that have more importance to the company; and
a question about topics or issues that, in their opinion,
should be considered in software engineering subjects. The
answers were analysed and will be presented in further
sections. Respondents were informed that the results were
for a study. The questionnaire was also used to gather
insights about issues that must be included in future editions
of this subject. Thus, questions about aspects that may be
important in the day-to-day activities in the companies were
included in the questionnaire.
A. Questionnaire of Former Students’ Description
This questionnaire was designed to be directed towards
our objectives and be filled in quickly and simply. Some
questions were answered in free text (case of questions of
theoretical knowledge) and others are multiple choice
questions (e.g., used software methodologies). The
questionnaire was organized in three parts: Questions about
the current professional activity of the respondents;
theoretical questions about software engineering; and space
for feedback on the importance of topics in their current
professional life (for those who had already finished the
course).
As examples of questions, we asked if the graduated
students were working. If yes, we asked about the actual
tasks in their companies (Planning, Requirements analysis,
Design, Code, Quality control, Tester, Project management,
other), the used methodologies (Waterfall, Scrum, XP,
Prototyping, Spiral, FDD, Lean, RUP, other, none). About
the theoretical questions we asked about the fundamentals
of Software Engineering, Software Quality, Verifications vs
Validation, traditional vs Agile, team dimensions and roles,
among other questions and feedback.
B. Questionnaire of Employers’ Description
This questionnaire was also designed to be directed
towards our objectives and be filled in quickly and simply.
Some questions were answered in free text and others are
multiple choice questions (e.g., used software
methodologies). The questionnaire was organized in distinct
parts: Questions to characterize the company activity;
questions to characterize topics of importance to the

50
International Journal on Advances in Software, vol 12 no 1 & 2, year 2019, http://www.iariajournals.org/software/
2019, © Copyright by authors, Published under agreement with IARIA - www.iaria.org
companies’ activity and feedback with contributions for
future improvements of the syllabus.
As examples of questions, we asked about the
respondent’s experience, position in the company, number
of students graduated from our school that work/worked in
the company, activity of the company (planning,
requirements analysis, design, code, quality control, tests,
project management, quality assurance, others), used
software processes in the company (Waterfall, Scrum, XP,
Prototyping, etc.), from the different company’s activities
what are the most important. We also asked about the soft
skills and technical knowledge that are most important to
the company activities. And lastly, but not least important,
we requested feedback to improve and keep the syllabus
updated.
V. QUESTIONNAIRE RESULTS AND ANALYSIS
This section presents the results of the questionnaires answered by the students, graduates and also the results of the questionnaire answered by the employers.
A. Data Collection/Methodology: students and graduated
students
As a universe of respondents, questionnaires were sent
to 97 students. Of these, 56 were undergraduate students
(although they had passed in this subject) and 41 graduated.
The questionnaire was done online, using the
LimeSurvey Webtool.
The response rate was of 24.4% of the graduated
students and of 21.4% of the undergraduate students.
It is important to note also that some respondents did not
answer all questions.
B. Results and Analysis: students and graduated students
Figure 1 shows the activities the respondents (Graduated students) are involved in, in their work. 84% of the respondents are involved in more than one activity. 50% of them are involved in planning, analysis and testing but they are not involved in implementation.
Figure 1. Activities carried out (Graduated students).
Graduated students were also asked to identify the software development methodologies they use in their activities. They were able to identify the methodologies they use considering a list of given methodologies. Results are presented in Figure 2.
More than 70% of the respondents refer that they use the Scrum methodology. This appears to be in line with the results presented in the “12th annual State of Agile report” [16] that refers that 52% of respondents stated that more than half of the teams in their organizations are using agile practices. And it is also in accordance with the results presented in another questionnaire of more than 2,000 active Scrum and Agile practitioners [17]. This study refers that 94% of agile users use the Scrum approach in their agile practice (78% use Scrum with other approaches).
Figure 2. Software development methodologies (Graduated students).
With respect to the importance of the subjects learned, 87.5 percent, of the 8 graduated students that respond to this question, said that the content learned in the course has been considerably useful for their actual professional activity (see Figure 3).
Figure 3. Course content vs professional activity (Graduated students).

51
International Journal on Advances in Software, vol 12 no 1 & 2, year 2019, http://www.iariajournals.org/software/
2019, © Copyright by authors, Published under agreement with IARIA - www.iaria.org
The second part of the questionnaire was related to theoretical questions about software engineering. This part was evaluated in a 0-20 scale and we compare these results with the results achieved by the same individual during the course. We consider the individual “maintained” if (grade
achieved in the subject -1.5 grade achieved in the
questionnaire (grade achieved in the subject +1.5). After evaluating the answers of the non-graduated
students to the questions, we conclude that there is a majority (58%) that has maintained or increased the result (41% maintained, 17% increased) (see Figure 4).
Figure 4. Grades evolution (Students).
In the case of students already graduated, the results, presented in Figure 5, are better (less cases (37.5%) of lowering grades). Despite the long period of time after they attend the course, this is probably a consequence of the practical experience they get in the field of software development.
Figure 5. Grades evolution (Graduated students).
In addition, at the end of each semester, a questionnaire
is usually conducted in order to obtain knowledge about the
students' perception of the importance of the subject for
their academic education. This questionnaire addressed four
issues: acquisition of knowledge; development of skills,
improvement of critical thinking; relevance for academic
background. Figure 6 shows the results of the questionnaires
(average values) performed in the last 2 years. Each topic
was evaluated on a 6-level scale (1 nothing important – 6
very important).
In general, all issues were evaluated very positively,
which shows that there is a recognition of the importance of
the subject for their education.
Figure 6. Students' perception of the importance of the subject for their
academic education.
C. Data Collection/Methodology: employers
We selected 5 companies that have employed graduates
of the school in recent years. The selected companies are
multinationals, working in the ICT area, and each of them
has at least graduates from the school as collaborators. For
each company we asked a member, with an intermediate or
high responsible position, to fill in a questionnaire about
their activities and about the school graduates they currently
employ. The questionnaires were completed by
representatives of the company that hold leadership
positions (Senior Manager, Executive Director, Team
Manager, Business & Project Manager, Ecosystem Talent
Director). The professional experience, in the ICT area, of
these representatives of companies, goes from 13 years to
21 years.
The questionnaire was composed of 4 parts. The first
part with general questions about the company and the
respondent. The second part with 3 questions about the
activity of the company. Two questions on which the
respondent had to select from among the various options
available, and one question where the respondent had to
evaluate various options on a 1-6 scale (1 nothing important
– 6 very important) on the importance of software
engineering to the company's activity. The third part of the
questionnaire consisted of 2 questions about the technical
and soft skills of the employees who were graduated by the
school. In these questions, the respondent had to evaluate
several options on a 1-6 scale (1 very poor – 6 very good).
Part 4 includes only one question where respondents were
asked to provide feedback or additional input.
The five representatives of the companies replied to the
questionnaire.

52
International Journal on Advances in Software, vol 12 no 1 & 2, year 2019, http://www.iariajournals.org/software/
2019, © Copyright by authors, Published under agreement with IARIA - www.iaria.org
D. Results and Analysis: employers
Respondents answered that they had already worked, or
are currently working, with 7, 15, 20, 30 and 38 employees
who graduated from the school (each value correspond to a
different company). This number of employees, graduated
from the school, is higher than the number of graduates who
were questioned (Sections V.A and V.B) because they
represent graduates of several years. Although they do not
represent the same universe, some of the graduates
questioned in Sections V.A and V.B are employees in these
companies. Therefore, they may be included in the group
referred to herein.
Respondents were asked to fit their area of intervention
by considering a list of 8 activities related to software
engineering (see Figure 7). Each respondent could select
several activities from a list or indicate other activities. Most
companies focus on several areas of software engineering.
Only areas related to quality assurance and software quality
control are not ensured in all questioned companies.
Figure 7. Company's activities.
Another important aspect, regarding the activity of
companies, is related to the software development
methodologies they use most in their activity. In our classes
we teach some software development methodologies
namely Waterfall, Extreme Programming, Scrum, Spiral,
etc. However, in the practical project, Scrum is the adopted
software development methodology. The goal is to provide
students with knowledge and practice about the
methodologies most companies follow. And it seems to be a
wise decision. According to the questionnaire’s responses,
the Scrum methodology is the one most used by these
companies. The waterfall software development
methodology is also one of the most used. Figure 8 shows
the software development methodologies used by the
respondent companies. In this question each respondent
could select, from a list, all the methodologies that they used
in their projects. They could also add other methodologies.
Figure 8. Software development methodologies used in the company.
Respondents were also asked to evaluate the importance of technical knowledge and skills, in 9 areas (from a predefined list) associated with software engineering. The graph, shown in Figure 9, presents the number of respondents that evaluated each area of knowledge and the average value of the importance that these respondents gave to this area of knowledge. It is important to note that some of them did not evaluate all available areas. The knowledge areas that were evaluated as most important were (in descending order of importance): coding, requirements analysis, development methodologies. Some respondents also mentioned user experience, debug and problem solving.
Figure 9. Importance of knowledge learned about Software Engineering
for what the activity of the company is.
The next two figures represent the opinion of the representatives of the companies on graduates at school. Similarly, to the previous figure, in these issues some companies did not evaluate all the issues that are available in

53
International Journal on Advances in Software, vol 12 no 1 & 2, year 2019, http://www.iariajournals.org/software/
2019, © Copyright by authors, Published under agreement with IARIA - www.iaria.org
the list. Graphs, shown in Figure 10 and Figure 11, show the number of companies that evaluate each skill and the average value of the evaluation that these companies gave to that skill. It is also important to note that companies were asked to make an overall assessment of employees for each competency. However, this does not have an easy answer. Employees have different competencies, work on different projects, and often relate to the respondent in different domains. This was corroborated by the respondents and, in particular, one which stated that "…it is very difficult to assign a general classification to all the employees who were recruited from school courses. Besides being many, they were also in different periods, different courses and as you know, not all are the same."
Figure 10. Strengths and weaknesses of the employees who graduated from
our school (Soft skills).
Figure 11. Strengths and weaknesses of the employees who graduated from
our school (knowledge and technical skills).
Figure 10 corresponds to the feedback given by the respondents about the soft skills of their employees who graduated from school. The two skills that got higher ratings were related to teamwork and adaptability/flexibility. Both obtained very positive ratings from all respondents. With less positive evaluations arise the creativity and critical thinking.
The graph (from Figure 11) presents the feedback given by the respondents about the technical skills of their employees who graduated from school. Coding stands out for the positive. Software testing and the quality assurance had lower ratings.
The last part of the questionnaire was one open question where respondents were free to provide feedback or additional input. The answers obtained are different because they represent different perspectives and are usually conditioned by the nature of the company and the activities in which it focuses. However, these are valuable inputs as they represent the perspectives and real needs of companies. Below, some comments received:
“... any educational institution should be increasingly adapted to the major market trends, including them in the course programme ... so that the transition to the labour market is simple and contributes to meet the current needs ...”.
“… strengthen the most used subjects: Methodologies/Development processes, Implementation/Coding, Maintenance and Software Testing...”.
“…strengthen the areas of Software Quality (automatic software testing, AI (artificial intelligence), ... as well as Computer Security…”.
However, these comments also show the different perspectives and focus of each of the companies.
VI. LESSONS LEARNED AND CHALLENGES FACED
The contributions of this paper are in the form of the lessons learnt, which may be seen as guidance for others looking to approximate the know-how of students to the methods and techniques used by software companies. In summary, these are:
• Students should learn by doing and, wherever possible, software engineering principles should be assessed in the context of practical work, rather than by regurgitating material taught or extracted from textbooks.
• Students must have well defined and known goals. The assessment of the theoretical subjects does not need to be a surprise in the exam.
• Opening classes to external stakeholders (by promoting talks or visiting companies) during the last part of the semester helps students to reinforce knowledge and motivate them to the subjects.
• It is very important to get feedback from past students and evaluate if the transmitted concepts and knowledge are still there, and if it was improved by the work experience in the labour market.
• It is important to choose projects that are of interest to the students and that can motivate them and involve them in their development.

54
International Journal on Advances in Software, vol 12 no 1 & 2, year 2019, http://www.iariajournals.org/software/
2019, © Copyright by authors, Published under agreement with IARIA - www.iaria.org
• It is very important to get feedback from companies that employ past students. It may contribute to a better adjustment of the syllabus with the real needs of the labour market. It also provides very important feedback on the technical and behavioural skills of former students.
• It is important to analyse the different perspectives of the various stakeholders: teachers, students, graduates and employers. This allows a holistic analysis and may help to improve the teaching methodologies.
However, during our experience, we faced challenges like:
• Difficulty in maintaining all team members equally motivated and engaged in the same way throughout the entire project development period;
• Keeping all students involved in the project. Some students may drop out, leaving the team during the semester, and affecting the workflow and scheduling of the remaining members of the team;
• Allowing students to experience various roles within the team. It is necessary to find a way to rotate the roles of each one within the team, to avoid any student being too focused on just one role. It is important that everyone experiences a diversity, as broad as possible, of different roles;
• Allowing students to experience different methodologies in real environments. More field trips and contact with companies that use different methodologies, must be promoted to foster more diversity of experiences.
• The representative of the companies that collaborated with us were very cooperative. However, some difficulties in responding to questionnaire questions were identified. This was mainly due to the fact that companies employ several graduates and therefore they try to make an average assessment.
VII. CONCLUSION AND FUTURE WORK
Our questionnaire of former students was the starting point of a reflexion about the impact of the approach followed in previous years in the subject of Software Engineering. Based on the results, we think that allowing students to know the pool of questions in advance, fosters the students on important knowledge in the field and to understand these items, that we want students to maintain over a long period of time. The second questionnaire, of employers, give us important feedback to know the most important aspects of software engineering to companies, in the field of software production, where several of our former students are working. The feedback allows us to understand the employer’s opinion about our graduated student’s training and get contributions to focus our teaching goals in topics that are considered relevant to the future of our students. Using the feedback achieved from the questionnaire given to the employees of our graduated students, we want to improve and maintain updated the
contents of this subject. This holistic analysis that includes different perspectives from different stakeholders: teachers, students, graduates and employers, gave us important guidelines to improve the teaching methodologies and syllabus.
Regarding the assessment of students, in future editions of the subject the pool of questions will be increased to improve the effect of randomisation for the next exams. Also, a mix of questions from the pool (~66%) and other questions (~33%), will be used to build the exams and explore the advantages of both approaches. As for the practical component, based on the results, Scrum is still used as a case study since it is one of the most used processes by companies where our graduated students work.
One final remark to reiterate that the study presented here is based on data collected from our students and alumni of the Software Engineering subject and from a group of 5 experienced representatives of multinational companies with whom we interact. This set of companies is obviously reduced compared to the universe of thousands of software development companies worldwide and the opinion of other employers may differ significantly according to their own reality and activity. In any case, the collected data is useful as indicators of aspects that we must take into account, obviously without neglecting other methodologies and topics related to Software Engineering.
We will continue to make all efforts to listen to these types of stakeholders (students, alumni and representatives of companies) and to broaden the universe of respondents, with the aim of keeping the themes and methodologies taught updated.
REFERENCES
[1] J. Metrôlho and F. Ribeiro, ‘Software Engineering
Education: Sharing an approach, experiences, survey and
lessons learned’, in The Thirteenth International
Conference on Software Engineering Advances (ICSEA),
2018.
[2] R. Chatley and T. Field, ‘Lean Learning: Applying Lean
Techniques to Improve Software Engineering Education’,
in Proceedings of the 39th International Conference on
Software Engineering: Software Engineering and
Education Track, 2017, pp. 117–126.
[3] S. D. Zorzo, L. de Ponte, and D. Lucrédio, ‘Using scrum
to teach software engineering: A case study’, in 2013
IEEE Frontiers in Education Conference (FIE), 2013, pp.
455–461.
[4] M. Kuhrmann and J. Münch, ‘Enhancing Software
Engineering Education Through Experimentation: An
Experience Report’. 2018.
[5] C. Amrit, M. Daneva, and D. Damian, ‘Human factors in
software development: On its underlying theories and the
value of learning from related disciplines; A Guest
Editorial Introduction to the Special Issue’, Inf. Softw.
Technol., vol. 56, no. 12, pp. 1537–1542, 2014.

55
International Journal on Advances in Software, vol 12 no 1 & 2, year 2019, http://www.iariajournals.org/software/
2019, © Copyright by authors, Published under agreement with IARIA - www.iaria.org
[6] S. Beecham, T. Clear, D. Damian, J. Barr, J. Noll, and W.
Scacchi, ‘How Best to Teach Global Software
Engineering? Educators Are Divided’, IEEE Softw., vol.
34, no. 1, pp. 16–19, 2017.
[7] F. Matthes et al., ‘Teaching Global Software Engineering
and International Project Management - Experiences and
Lessons Learned from Four Academic Projects’, 3rd Int.
Conf. Comput. Support. Educ. CSEDU 2011, p. 12, 2011.
[8] M. Nordio et al., ‘Teaching Software Engineering Using
Globally Distributed Projects: The DOSE Course’, in
Proceedings of the 2011 Community Building Workshop
on Collaborative Teaching of Globally Distributed
Software Development, 2011, pp. 36–40.
[9] D. Dahiya, ‘Teaching Software Engineering: A Practical
Approach’, SIGSOFT Softw. Eng. Notes, vol. 35, no. 2,
pp. 1–5, 2010.
[10] J. A. Macias, ‘Enhancing Project-Based Learning in
Software Engineering Lab Teaching Through an E-
Portfolio Approach’, IEEE Trans. Educ., vol. 55, no. 4,
pp. 502–507, 2012.
[11] A. Heberle, R. Neumann, I. Stengel, and S. Regier,
‘Teaching agile principles and software engineering
concepts through real-life projects’, in 2018 IEEE Global
Engineering Education Conference (EDUCON), 2018, pp.
1723–1728.
[12] M. Yampolsky and W. Scacchi, ‘Learning Game Design
and Software Engineering Through a Game Prototyping
Experience: A Case Study’, in Proceedings of the 5th
International Workshop on Games and Software
Engineering, 2016, pp. 15–21.
[13] O. Shabalina, N. Sadovnikova, and A. Kravets,
‘Methodology of teaching software engineering: Game-
based learning cycle’, Proc. - 2013 IEEE 3rd East. Eur.
Reg. Conf. Eng. Comput. Based Syst. ECBS-EERC 2013,
pp. 113–119, 2013.
[14] U. Schäfer, ‘Training scrum with gamification: Lessons
learned after two teaching periods’, in 2017 IEEE Global
Engineering Education Conference (EDUCON), 2017, pp.
754–761.
[15] R. Holmes, M. Craig, K. Reid, and E. Stroulia, ‘Lessons
Learned Managing Distributed Software Engineering
Courses’, in Companion Proceedings of the 36th
International Conference on Software Engineering, 2014,
pp. 321–324.
[16] VersionOne Inc, ‘12th annual State of Agile report’, 2018.
[17] Scrum Alliance, ‘STATE OF SCRUM 2017-2018.
Scaling and agile transformation.’, 2017.
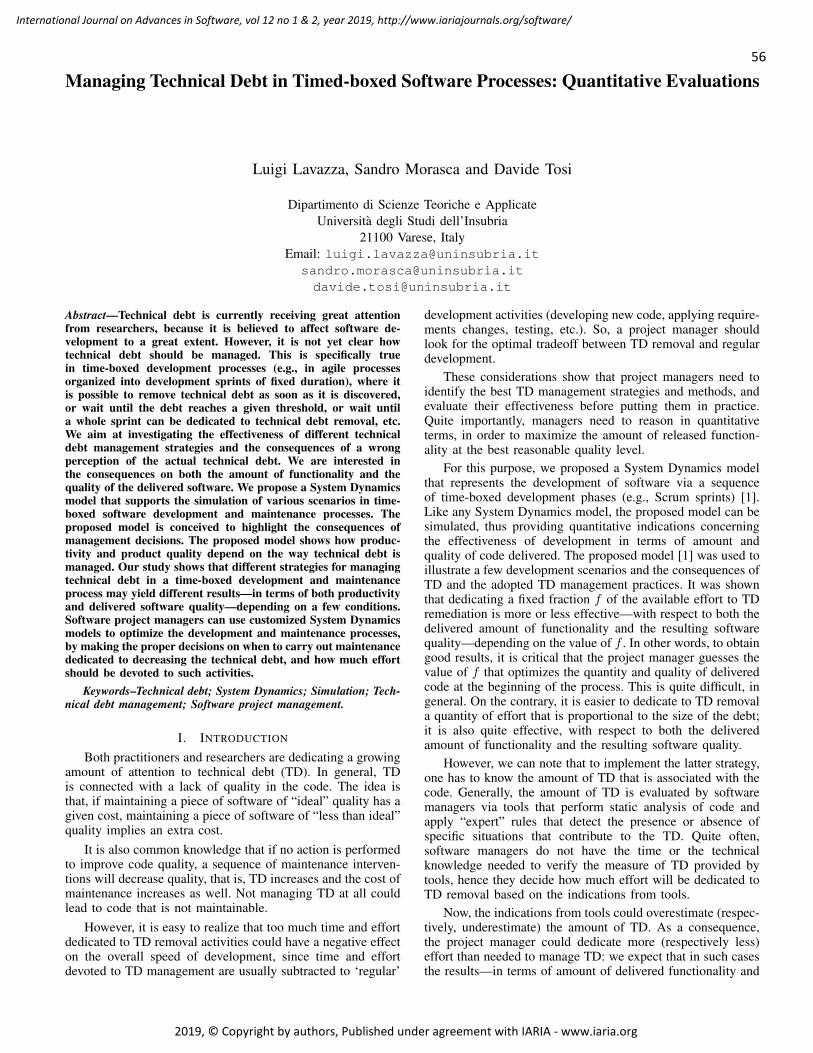
56
International Journal on Advances in Software, vol 12 no 1 & 2, year 2019, http://www.iariajournals.org/software/
2019, © Copyright by authors, Published under agreement with IARIA - www.iaria.org
Managing Technical Debt in Timed-boxed Software Processes: Quantitative Evaluations
Luigi Lavazza, Sandro Morasca and Davide Tosi
Dipartimento di Scienze Teoriche e ApplicateUniversita degli Studi dell’Insubria
21100 Varese, ItalyEmail: [email protected]
[email protected]@uninsubria.it
Abstract—Technical debt is currently receiving great attentionfrom researchers, because it is believed to affect software de-velopment to a great extent. However, it is not yet clear howtechnical debt should be managed. This is specifically truein time-boxed development processes (e.g., in agile processesorganized into development sprints of fixed duration), where itis possible to remove technical debt as soon as it is discovered,or wait until the debt reaches a given threshold, or wait untila whole sprint can be dedicated to technical debt removal, etc.We aim at investigating the effectiveness of different technicaldebt management strategies and the consequences of a wrongperception of the actual technical debt. We are interested inthe consequences on both the amount of functionality and thequality of the delivered software. We propose a System Dynamicsmodel that supports the simulation of various scenarios in time-boxed software development and maintenance processes. Theproposed model is conceived to highlight the consequences ofmanagement decisions. The proposed model shows how produc-tivity and product quality depend on the way technical debt ismanaged. Our study shows that different strategies for managingtechnical debt in a time-boxed development and maintenanceprocess may yield different results—in terms of both productivityand delivered software quality—depending on a few conditions.Software project managers can use customized System Dynamicsmodels to optimize the development and maintenance processes,by making the proper decisions on when to carry out maintenancededicated to decreasing the technical debt, and how much effortshould be devoted to such activities.
Keywords–Technical debt; System Dynamics; Simulation; Tech-nical debt management; Software project management.
I. INTRODUCTION
Both practitioners and researchers are dedicating a growingamount of attention to technical debt (TD). In general, TDis connected with a lack of quality in the code. The idea isthat, if maintaining a piece of software of “ideal” quality has agiven cost, maintaining a piece of software of “less than ideal”quality implies an extra cost.
It is also common knowledge that if no action is performedto improve code quality, a sequence of maintenance interven-tions will decrease quality, that is, TD increases and the cost ofmaintenance increases as well. Not managing TD at all couldlead to code that is not maintainable.
However, it is easy to realize that too much time and effortdedicated to TD removal activities could have a negative effecton the overall speed of development, since time and effortdevoted to TD management are usually subtracted to ‘regular’
development activities (developing new code, applying require-ments changes, testing, etc.). So, a project manager shouldlook for the optimal tradeoff between TD removal and regulardevelopment.
These considerations show that project managers need toidentify the best TD management strategies and methods, andevaluate their effectiveness before putting them in practice.Quite importantly, managers need to reason in quantitativeterms, in order to maximize the amount of released function-ality at the best reasonable quality level.
For this purpose, we proposed a System Dynamics modelthat represents the development of software via a sequenceof time-boxed development phases (e.g., Scrum sprints) [1].Like any System Dynamics model, the proposed model can besimulated, thus providing quantitative indications concerningthe effectiveness of development in terms of amount andquality of code delivered. The proposed model [1] was used toillustrate a few development scenarios and the consequences ofTD and the adopted TD management practices. It was shownthat dedicating a fixed fraction f of the available effort to TDremediation is more or less effective—with respect to both thedelivered amount of functionality and the resulting softwarequality—depending on the value of f . In other words, to obtaingood results, it is critical that the project manager guesses thevalue of f that optimizes the quantity and quality of deliveredcode at the beginning of the process. This is quite difficult, ingeneral. On the contrary, it is easier to dedicate to TD removala quantity of effort that is proportional to the size of the debt;it is also quite effective, with respect to both the deliveredamount of functionality and the resulting software quality.
However, we can note that to implement the latter strategy,one has to know the amount of TD that is associated with thecode. Generally, the amount of TD is evaluated by softwaremanagers via tools that perform static analysis of code andapply “expert” rules that detect the presence or absence ofspecific situations that contribute to the TD. Quite often,software managers do not have the time or the technicalknowledge needed to verify the measure of TD provided bytools, hence they decide how much effort will be dedicated toTD removal based on the indications from tools.
Now, the indications from tools could overestimate (respec-tively, underestimate) the amount of TD. As a consequence,the project manager could dedicate more (respectively less)effort than needed to manage TD: we expect that in such casesthe results—in terms of amount of delivered functionality and

57
International Journal on Advances in Software, vol 12 no 1 & 2, year 2019, http://www.iariajournals.org/software/
2019, © Copyright by authors, Published under agreement with IARIA - www.iaria.org
quality—will worsen, with respect to the situation when theproper amount of effort is dedicated to TD management.
Accordingly, in this paper we enhance the results presentedin [1] by exploring the effects of basing decisions concerningTD management on an inaccurate perception of the amount ofTD in the code.
The paper is organized as follows. In Section II, we providebackground concerning TD and System Dynamics. In Sec-tion III, we introduce our model of software development andmaintenance, characterized by time-boxed incremental phases.In Section IV, the model is used to simulate the behavior ofthe process when different strategies for allocating effort to payoff the TD are used. In Section V, we discuss the outcomesof simulations, especially as far as productivity and deliveredquality are concerned. In Section VI the model is enhanced totake into account errors in the perception of TD, and the resultsof simulations are reported. Section VII accounts for relatedwork. Finally, in Section VIII, we draw some conclusions andoutline future work.
II. BACKGROUND
We here concisely recall the TD concepts proposed in theliterature that we later model and illustrate via simulations(Section II-A) and the principles of System Dynamics model-ing (Section II-C).
A. Technical DebtIn the last few years, TD has received great attention from
researchers. For example, a recent Systematic Mapping Studyon TD and TD management (TDM) covering publicationsfrom 1992 and 2013 detected 94 primary studies to obtaina comprehensive understanding on the TD concepts and anoverview on the current state of research on TDM [2].
An updated Systematic Mapping Study identified elementsthat are considered by researchers to have an impact on TDin the industrial environment [3]. The authors classified thesetwelve elements in three main categories: (1) Basic deci-sion making factors, (2) Cost estimation techniques, and (3)Practices and techniques for decision-making. They mappedthese elements to the stakeholders’ point of view, specifically,for business organizational management, engineering manage-ment, and software engineering areas.
Several authors proposed definitions for TD and its inter-ests. Nugroho et al. [4] define TD as “the cost of repairingquality issues in software systems to achieve an ideal qualitylevel” and the interests of the debt as “the extra maintenancecost spent for not achieving the ideal quality level.” Otherworks try to empirically correlate TD with software size,software quality, customer satisfaction, and other softwareproperties, in the context of enterprise software systems [5].
In a recent Dagstuhl Seminar [6], the following definitionof TD was proposed: “In software-intensive systems, technicaldebt is a collection of design or implementation constructsthat are expedient in the short term, but set up a technicalcontext that can make future changes more costly or impossi-ble. Technical debt presents an actual or contingent liabilitywhose impact is limited to internal system qualities, primarilymaintainability and evolvability.”
The Software Quality Assessment based on Lifecycle Ex-pectations (SQALE) method [7] addresses a set of external
qualities (like Reliability, Efficiency, Maintainability, etc.).Each of these qualities is associated with a set of requirementsconcerning internal qualities, each provided with a “remedia-tion function,” which represents the cost of changing the codeso that the requirement is satisfied. Based on these functions,the cost of TD is computed for each external quality and forall qualities.
The Object Management Group has published a beta ver-sion of the specification of a measure of TD principal, definedas “The cost of remediating must-fix problems in productioncode” [8]. The measure can be computed automatically as aweighted sum of the “violations of good architectural andcoding practices,” detected according to the occurrence ofspecific code patterns. The weight is computed according to theexpected remediation effort required for each violation type.
B. Tools Detecting Technical DebtSeveral tools are now available to detect TD automatically.
Examples of tools are (alphabetically ordered): CAST [9], [10],SonarCloud [11], Squore [12], [13], TeamScale [14], [15], andmany more.
The CAST Research Labs (CRL) is part of the enterpriseCAST Application Intelligence Platform and is focused on thecalculation of the TD for software applications by collectingmetrics and structural characteristics of software. CRL also re-turns insights that can help developers improve the applicationstructural quality.
SonarCloud (aka SonarQube) is an open source cloudplatform where software developers can upload their softwareand collect a set of quality metrics, bugs, vulnerabilities, codesmells, code coverage, and code duplications. Starting from allthese data, SonarCloud estimates the TD of the software underanalysis. Developers may study also the evolution of the TDover time by navigating interactive charts.
Squore is a commercial solution similar to SonarCloud. Aset of dashboards visually report quality metrics and 4 keyinsights (i.e., the overall rating of the software under analysis,trend analysis, forecasts, and project portfolio comparison).Moreover, a specific section is related to TD where four in-dicators (efficiency, portability, maintainability, and reliability)are used to calculate the TD density and ranking (similar to thesix grades used by SonarCloud). The remediation cost showshow many man-days are supposed to be needed to eliminateall TD highlighted.
TeamScale is a commercial tool based on a set of dash-boards where managers can monitor the evolution of thequality of their applications. TeamScale is able to analyze thearchitecture conformance, code clones, missing tests, codingconventions, documentation, external and internal softwaremetrics, and TD. Developers and managers can track theevolution of their software applications by comparing differentreleases and visualizing the history trend of quality metrics.
All of the mentioned tools can be used to get an overallevaluation of code quality, expressed in terms of TD.
C. System DynamicsSystem Dynamics was developed by Jay Forrester [16] as
a modeling methodology that uses feedback control systemsprinciples to represent the dynamic behavior of systems. Theelements of System Dynamics models are levels, constants,

58
International Journal on Advances in Software, vol 12 no 1 & 2, year 2019, http://www.iariajournals.org/software/
2019, © Copyright by authors, Published under agreement with IARIA - www.iaria.org
auxiliary variables and rates. The dynamics of systems isdetermined by how levels work: given a level L, its valuein time is always determined by an equation L(t + ∆t) =L(t) + (in(t) − out(t))∆t, where in(t) and out(t) are rates.Levels and rates can concern anything (e.g., people, rabbits,bricks, lines of code, etc.), depending on the application scopeand goal of the model. The value of a rate at time t is definedbased on the values of auxiliary variables, other rates andlevels at time t. Likewise for auxiliary variables, which arenot necessary, but are useful to write readable models.
The elements of a System Dynamics model are intercon-nected just like in the real world, to form a network, wherecauses and effects are properly represented. Models can beexecuted, so that the behavior of the modeled system can besimulated. Via System Dynamics models, it is quite easy toperform what-if analyses: you obtain different behaviors bychanging the initial state of the system (given by the values oflevels), how rates and variable are computed, how they dependon each other, etc.
III. THE PROPOSED MODEL
As already mentioned, the proposed model describes inan operational way the time-boxed development process, es-pecially in terms of maintenance activities concerning thereduction of TD. The proposed model aims at evaluatingthe productivity of development and maintenance activities,and the quality of the released product. Productivity is heredefined as the ratio of the amount of product—measured inFunction Points (FP) [17][18]—developed in a time period tothe amount of effort/resources used.
To focus on the main objectives, we abstract from all thoseaspects of the model that deal with activities and softwareproducts that are not directly connected with TD management.For instance, in a real process, the productivity of individualstends to increase because of learning effects, the number ofdevelopers allocated may change during a project, etc.: weexclude all of these variables because they would introducenoise in our investigation, which focuses on the effects of TDmanagement decisions alone.
A. AssumptionsThe main reason why practitioners and researchers are
interested in TD is that maintaining code burdened with a bigTD (i.e., low-quality code) costs much more than maintainingcode with little TD (i.e., high-quality code). This is becausemore work is needed to carry out any code-related activitywhen code is of low quality (e.g., difficult to understand, poorlystructured, full of hidden dependencies, etc.).
To account for the relation that links TD to maintenancecost, we need a measure of TD. To this end, we measureTD via a “TD index,” an indicator that takes into account theinternal qualities of code that concur to determine the amountof TD embedded in the code. Here, we are not interested indefining precisely the TD index, based on the measures ofindividual internal qualities, because this is not relevant forour purposes. Clearly, accurately modeling individual internalqualities of code would make the model more apt at reproduc-ing the behavior of real development environments. But thisis not our purpose: we aim at building a model that shows—at a fairly high level—the effects of decisions concerning TDmanagement in a generic realistic development environment.
We assume that the TD index ranges between 0 (highestquality) and 1 (worst quality). The extreme values representlimiting cases, which may not occur in practice. When the TDindex is 1, maintenance is so difficult that one is better off bysimply throwing away the code and building a new versionfrom scratch, and productivity is null, i.e., prod = 0. Whenthe TD index is 0, maintenance activities attain their optimalproductivity prodopt. When 1>TD index>0, prod steadilyincreases from 0 to prodopt when the TD index decreases.
Figure 1. Effect of technical debt on productivity.
The value of productivity for a given value of the TDindex prod(TDindex) can be expressed as prodMult(TDindex)×prodopt. Figure 1 shows a possible behavior of prod-Mult(TDindex). Namely, Figure 1 implies that there is a linearrelationship between TD and productivity: when the TD indexis zero (i.e., quality is optimal) productivity is maximum,when the TD index is one (i.e., quality is as bad as possible)productivity is null.
We use the function illustrated in Figure 1 to build modelsto exemplify our proposal. Other monotonically decreasingfunctions (e.g., concave or convex function) that go throughpoints (0, 1) and (1, 0) could be used as well. Here we use thelinear model because we have no reason to do otherwise, es-pecially considering that the TD index itself is not thoroughlydefined.
Here, we assume that development is carried out in atime-boxed way. This is coherent with the organization ofdevelopment in most agile processes. We assume that thedevelopment is composed of a sequence of “sprints,” each ofwhich has a fixed duration and involves a constant numberof developers, hence a sprint “consumes” a fixed number ofPerson Days (PD). For instance, if sprints last 20 work daysand involve 5 developers, then each sprint “costs” 100 PD. Ifat the end of 5 sprints 416 FP are released, we have achieved aproductivity of 416/(5·100)=0.832 FP/PD; if at the end of thesesprints 378 FP are released, we have achieved a productivityof 378/500=0.756 FP/PD. Quite clearly, in the former case themanagement of TD was more effective, a higher productivitywas achieved, more functionality was released, and biggerreturns can be expected.
A consequence of our assumptions is that the amount ofeffort spent is strictly proportional to development duration,which can be expressed in number of sprints. Given this

59
International Journal on Advances in Software, vol 12 no 1 & 2, year 2019, http://www.iariajournals.org/software/
2019, © Copyright by authors, Published under agreement with IARIA - www.iaria.org
proportionality between effort and the number of sprints, wecan express productivity as the amount of code released afterN sprints. Thus, we measure the productivity values above as416/5=83.2 FP/Sprint (instead of 416/500=0.832 FP/PD) and378/5=75.6 FP/Sprint (instead of 378/500=0.756 FP/PD).
During each sprint, the developers can carry out two typesof activities: 1) increase the functionality of the system, byadding new code, and 2) decrease TD, by refactoring codestructure, removing defects and improving the qualities thatmake development and maintenance easier. Since in eachsprint the amount of work is fixed, managers have to decidewhat fraction of work has to be dedicated to new codedevelopment—the remaining fraction being dedicated to TDmanagement. Several different criteria can be used in settingsuch fraction, as illustrated in Section IV.
We assume that during each sprint a constant fraction ofthe new code affected by quality problems (hence, increasingthe TD) is released. This fraction depends on several factors,like the experience and ability of developers, the availabilityof sophisticated tools, problem complexity, etc. We assumethat these factors are constant throughout all the sprints: inthis way, we do not generate noise and we can highlight theeffects of TDM decisions.
B. The ModelThe proposed System Dynamics model involves two level
variables: CodeSize (measured in FP) and TDIndex.The constants in the model are:
nominal_maintenance_productivity, the productivity inFP/Sprint in ideal conditions, i.e., when the TD index is zero.We assume that the nominal productivity is 80 FP/Sprint, cor-responding to 0.1 FP/PersonHour, a fairly typical value [19].nominal_TDimprovement_productivity, the amount ofcode that can be optimized—i.e., whose TD is completelyrepaid—in a sprint, when the effort is completely devoted toTD improvement. We assume that this value is 40 FP/Sprint.In real developments, this amount is not necessarily constant:a sprint could be sufficient to “clean” 40 FP or relatively goodcode, but not to “clean” 40 FP of very bad quality code.bad_fraction_of_new_code, the fraction of the new code(released at the end of each sprint) that contributes to increas-ing TD. We here assume that the value of this constant is 0.2.available_effort: the effort available at each sprint. Asalready mentioned, we assume it to be a constant. The actualvalue is not relevant, however, we can take 100 PD as areference value.
The rate and auxiliary variables of the model are:fraction_of_effort_for_quality_maintenance:the fraction of available_effort dedicated torepaying TD. This variable is computed via functionfracEffortForQuality, which has the TD index as anargument.quality_maintenance_effort: the effort available forimproving the quality of code in a sprint.maintenance_effort: the effort available for developingnew code in a sprint.maintenance_productivity: the productivityof developing new code in a sprint. It dependson the nominal_maintenance_productivity,the maintenance_effort and the decrease ofproductivity due to the TD (computed via function
productivity_considering_TD).TD_dec_rate: the TD decrease rate.TD_inc_rate: the TD increase rate.
The values of the aforementioned variables are determinedby the following equations:
available_effort=1fraction_of_effort_for_quality_maintenance=fracEffortForQuality(TDindex)quality_maintenance_effort=available_effort*fraction_of_effort_for_quality_maintenancemaintenance_effort=available_effort-quality_maintenance_effortmaintenance_productivity=nominal_maintenance_productivity*maintenance_productivity_considering_TD(TDindex)TDimprovement_productivity=nominal_TDimprovement_productivity*
quality_maintenance_effortTD_inc_rate=bad_fraction_of_new_code*maintenance_productivity/CodeSizeTD_dec_rate=TDimprovement_productivity/CodeSize
where the following functions are used:maintenance_productivity_considering_TD(TDindex):the loss of productivity due to TD, as described in Figure 1.fracEffortForQuality(TDindex): this function describesthe strategy used for tackling TD. In Section IV, we use a fewdifferent strategies, hence, a few different function definitions.
The levels are computed as follows (where all auxiliaryand rate variables are computed at time t):CodeSize(t+∆t)=CodeSize(t)+
∆t*maintenance_productivityTDindex(t+∆t)=TDindex(t)+
∆t*(TD_inc_rate-TD_dec_rate))
IV. SIMULATING THE MODEL
We simulate the model with a few different TD man-agement strategies. The considered case is characterized asfollows. Initially, the software system to be maintained hassize 80 FP and its TD index is 0.2 (representing the qualitygap between the “ideal” quality and the actual initial qualityaccepted to speed up development and release the productearly). The nominal productivity (i.e., new code developmentproductivity in ideal conditions, when no extra effort is duebecause of TD) is 80 FP/Sprint. The nominal TD repaymentproductivity (i.e., the amount of functionality for which theTD is completely repaid in a sprint) is 40 FP/Sprint. At theend of every sprint, 20% of the added code is “bad” code.
Our software organization goes through a sequence of 30maintenance sprints. We assume that there are always enoughnew requirements to implement to use up the developmentcapacity of sprints. This is a situation that occurs quite oftenin practice. We also assume that the same amount of effortis allocated to all sprints. In actual developments, this doesnot always happen. Anyway, simulations that do not dependon variations in the available effort provide better indicationsof the effects of TD management strategies, since they do notdepend on accidental phenomena, like the amount of availableworkforce.

60
International Journal on Advances in Software, vol 12 no 1 & 2, year 2019, http://www.iariajournals.org/software/
2019, © Copyright by authors, Published under agreement with IARIA - www.iaria.org
A. Constant Effort for TD ManagementIn the first simulation, we assume that the considered
software development organization allocates a constant fractionof the effort available in each sprint, to tackle the TD. Itis reasonable to expect that the achieved results depend onhow big the fraction of effort dedicated to TD managementis. Hence, we run the simulation a few times, with differentfractions of the available effort dedicated to TD management,ranging from zero (i.e., nothing is done to decrease the TD)to 40%. The main results of the simulation are given inFigure 2, which shows, from left to right: the functional sizeof the software product version released after each sprint;the functional size increment due to each sprint (i.e., theenhancement productivity of each sprint); the evolution of theTD through sprints (i.e., the quality of the software productversions released after each sprint).
The amount of functionality delivered at the end of thesprints, and the corresponding TD index are also given inTable I.
TABLE I. RESULTS WITH DIFFERENT FRACTIONS OF EFFORTDEDICATED TO TD MANAGEMENT
Fraction of effort Delivered Finalfor TD management functionality [FP] TD index
0 960 0.770.1 1244 0.540.2 1461 0.30.3 1616 0.050.4 1480 0.01
We can examine the achieved results starting with the solidblack lines, which represent the case in which no effort at all isdedicated to repaying the TD. It is easy to see that the resultsobtained by this TD management strategy (a no-managementstrategy, actually) are quite bad. In fact, after 30 sprints weget only 960 FP: about 500 FP less than the most efficientTD management strategy. Not only: the final product has TDindex = 0.77, that is, a very low quality, probably hardlyacceptable in practice. The effects of TD on maintenanceproductivity are apparent: the continuously growing TD makesmaintenance less efficient over sprints and after the first 15sprints, productivity has dropped from 80 FP/Sprint to lessthan 30 FP/Sprint, due to TD. So, just ignoring the TD is nota good practice. Definitely, we have to allocate some effort todecrease the TD, but how much effort should we dedicate torepaying TD?
By looking at Figure 2 and Table I, it is easy to see thatdedicating 10% of the available effort to repaying TD improvesthe situation with respect to not managing the TD at all: thefinal size (1244 FP) is bigger, and the final TD index (0.54) isbetter, though not really good. When we dedicate 20% of theavailable effort to repaying TD the results improve further: thefinal size (1461 FP) is bigger, and the final TD index (0.3) isbetter, though still not very good.
In summary, by increasing the fraction of effort dedicatedto repaying TD from 0 to 20% we improve both the amount offunctionality that we are able to release, and the quality of thesoftware product. Hence, it would be natural to hypothesizethat, by further increasing the fraction of effort dedicated torepaying TD, we obtain improvements in both the amount andquality of delivered software. Actually, this is not the case:when 30% of the available effort is dedicated to repaying
TD, we further improve both the released functionality (1616FP) and the quality (TD index = 0.05), but if an even biggerfraction (40%) of effort is dedicated to repaying TD, weachieve practically ideal quality (the final TD index is 0.01),but substantially less functionality (the final size being 1480FP).
The explanation of these results is that this is a case ofPareto-optimality: beyond a given point it is not possible to fur-ther improve quality without decreasing the amount of releasedfunctionality, and vice-versa. Increasing the fraction of effortdedicated to TD improvement clearly improves maintenanceproductivity by decreasing TD, but at the same time subtractseffort from enhancement maintenance activities. Hence, oneshould look for a trade-off, to achieve both a reasonablyhigh productivity level and an acceptable quality level (i.e.,a sufficiently small TD).
Via a series of simulations, it is possible to find thefraction of effort dedicated to repaying TD that maximizesthe released functionality, hence maintenance productivity. Inthe considered case, allocating 32% of the available effort toTD improvement eventually results in yielding 1638 FP, thefinal TD index being 0.007.
Finally, it should be noticed that in the short term—i.e., inthe first eight sprints or less—not managing TD does not seemto cause relevant negative consequences. For instance, in theconsidered case, if the goal is to achieve a 400 FP softwareproduct, not managing the TD may be a viable choice: youget the product faster than by managing TD. Of course, oneshould be sure that no further maintenance will be needed,otherwise maintenance cost would be quite high, that is, onehas just postponed paying the debt, also adding some interest.
B. Variable Effort for TD ManagementIn the previous section, the fraction of effort dedicated to
quality improvement was fixed, i.e., it was constant over thesprints. This can be used as a first assumption, but it maynot be a good managerial choice, for at least the followingtwo reasons. First, the initial TD could be greater than in thecase described in Section IV-A. Hence, it would be a goodpractice to devote a substantial amount of effort to improvequality at the beginning of development, with the objectiveof decreasing the TD, and then proceed with easier and moreproductive maintenance. This corresponds to repaying (all ora substantial part of) the TD in the first sprints: the followingsprints will have to pay low or null interests.
Second, the effort dedicated to TD management could beexcessive. Consider the evolution of the TD index throughsprints illustrated in Figure 2: when the fraction of effortdedicated to quality improvement is 40%, the TD is practicallynil after 10 sprints. In the following sprints, the fraction ofeffort for TD management is partly used to balance the increaseof debt caused by new code, and part is wasted. This effect iseasy to see when you compare the effects of dedicating 30%and 40% of the available effort to TD management. After afew sprints, in both cases the TD index is practically constant(about 0.07 in the former case, about 0.01 in the latter case).Maintenance productivity is also constant in the two cases,but higher in the former case, as shown in the central graphof Figure 2. How is it possible that, when 30% of effort isdedicated to TD management, we are using some effort tomanage a higher TD, and still we get a higher productivity?

61
International Journal on Advances in Software, vol 12 no 1 & 2, year 2019, http://www.iariajournals.org/software/
2019, © Copyright by authors, Published under agreement with IARIA - www.iaria.org
Figure 2. Size of delivered code, Sprint productivity and TD index, depending on a constant fraction of effort allocated to improving the TD.
Because the effort needed to keep TD close to zero is muchless than the allocated 40%: the exceeding part is wasted.
A better strategy for TD management would be to allocateto TD improvement a fraction of effort that is larger when theTD is large and smaller when the TD is little. Of course, thereare various ways to decide the fraction of effort to be dedicatedto decrease TD. We adopt the function shown in Figure 3,which defines the fraction of effort for TD improvement as1 − (1 − TDindex)k. By changing the value of k we decidehow aggressive the approach to debt repayment is: with k =1 the fraction of the effort dedicated to debt repayment isproportional to the debt; with k > 1 as soon as TD index raisesabove zero, a substantial fraction of the effort (the greater kthe bigger the fraction) is dedicated to decrease TD.
Figure 3. Percentage of effort dedicated to TD improvement, as a function1-(1-TDindex)k of TD.
In this section, the fraction of effort dedicated to TDmanagement is decided at every sprint, as 1−(1−TDindex)3:a moderately aggressive policy. When debt increases, we tryto decrease it fairly soon, to avoid paying large interests.Figure 4 shows the results of the simulation. The adoptedpolicy provides good results: at the end of the sprints we get
1653 FP, more than in any of the simulations performed inSection IV-A. The final TD index is < 0.1, that is, a verygood quality.
It is interesting to note that after a few sprints, the TD indexremains constant, and, as a consequence, productivity remainsconstant as well. The reason is that, at the beginning of eachsprint, the effort dedicated to TD management is adequate forrepaying the existing TD, but, during the sprint, new TD willbe created. This situation is perpetuated over the sprints. Tocompletely repay TD, a policy should allocate enough effortto both repay the existing TD, and to anticipate the new TD,by performing maintenance in a way that preserves optimalcode structure and quality.
However, the strategy simulated in this section dedicates alarge fraction of effort to decrease the TD in the first sprints,which guarantees very good results, in terms of both theamount of functionality delivered and the delivered quality.
C. Dedicating Sprints to Technical Debt RemovalIn time-boxed development, it is often the case that a
sprint is either completely dedicated to enhancement or todecreasing TD (especially via refactoring). So, the policy forallocating effort to TD management is simple: if the TDindex is sufficiently high (i.e., above a given threshold), thenext sprint will be completely dedicated to TD repayment;otherwise, the next sprint will be dedicated completely tomaintenance. In our case, if a sprint is dedicated completelyto TD management, developers will be able to optimize aportion of code 40 FP large. Hence, we can allocate a sprintto TD management when a portion of code of at least 40 FPis affected by TD: this is the threshold for deciding to stopdeveloping and have a refactoring sprint.
We simulated development with this criterion for allocatingeffort to TD management and we obtained the results illus-trated in Figure 5. It is easy to see that this strategy results, onaverage, in two consecutive development sprints followed by arefactoring sprint. TD progressively decreases until it becomespractically nil (oscillating between 0.01 and 0.03). At the endof sprints, 1623 FP are released, that is, a bit less than withthe policy described in Section IV-B. However, at the end ofrefactoring sprints the achieved TD index is better, comparedto the TD index achieved in Section IV-B.

62
International Journal on Advances in Software, vol 12 no 1 & 2, year 2019, http://www.iariajournals.org/software/
2019, © Copyright by authors, Published under agreement with IARIA - www.iaria.org
Figure 4. Size of delivered code, Sprint productivity and TD index through sprints, when the fraction of effort for TD improvement is 1-(1-TDindex)3.
Figure 5. Size of delivered code, Sprint productivity and TD index through sprints, when sprints are dedicated to either TD management or maintenance.
As a final observation, we should consider that applyingthis strategy is relatively easy, while applying the ‘variablefraction’ strategy described in Section IV-B is more difficult:with that strategy, both enhancements and refactoring areperformed in each sprint: event though this is a fairly naturalway of working for developers, it is difficult to assure thatexactly the planned amount of effort is dedicated to refactoring.
V. DISCUSSION
The results obtained with the different criteria for allocatingeffort to TD improvement are summarized in Table II. In Ta-ble II, we have added the results—not given in Section IV-B—obtained when the fraction of effort dedicated to TD improve-ment is 1-(1-TDindex)1/3. In such case, the fraction of effortdedicated to TD improvement decided at the beginning of eachsprint is based on the current TD index, but the approach isnot aggressive. On the contrary, a substantial fraction of effortis dedicated to TD improvement only when the TD index isrelatively large.
The results given in Table II, along with the more detailedresults reported in Section IV, suggest a few observations.
First, allocating a constant amount of effort to TD improve-ment does not seem to be a good idea. In fact, if the chosenfraction of effort allocated to TD improvement is too high ortoo low, the productivity of enhancement maintenance will belower than possible. Also, the final quality of the product (asindicated by the TD index) could be quite low. In practice,
TABLE II. RESULTS WITH VARIOUS CRITERIA
Criterion Delivered Finalfunctionality [FP] TD index
Constant (0%) 960 0.77Constant (10%) 1244 0.54Constant (20%) 1461 0.30Constant (30%) 1616 0.05Constant (40%) 1480 0.011-(1-TDindex)3 1653 0.101-(1-TDindex)1/3 1282 0.44Threshold 1623 0.02
allocating a constant amount of effort to TD improvementworks well only if the right fraction of effort is allocated, butchoosing such fraction may not be easy.
On the contrary, computing the amount of effort for TDimprovement at the beginning of each sprint, based on thecurrent TD index seems very effective, especially as far asoptimizing the productivity of enhancement maintenance isconcerned.
One could observe that in some situations it may be hard toseparate clearly the effort devoted to enhancements from theeffort devoted to TD improvement. This is particularly truewhen developers perform refactoring activities while they areenhancing the existing code. For this reason, an organizationmay want to have sprints entirely dedicated to refactoringand other TD improving activities, and sprints entirely ded-icated to enhancements. In this case, the evaluations given

63
International Journal on Advances in Software, vol 12 no 1 & 2, year 2019, http://www.iariajournals.org/software/
2019, © Copyright by authors, Published under agreement with IARIA - www.iaria.org
in Section IV-C show that allocating an entire sprint to TDimprovement whenever there is enough TD to absorb onespring effort provides quite good results, in terms of bothproductivity and quality.
In any case, we have to stress that all the presentedstrategies for TD management are based on the quantitativeevaluation of TD, which results in the TD index. So, devisinga way to measure TD appears fundamental to managing TDeffectively and efficiently.
VI. CONSEQUENCES OF A WRONG EVALUATION OFTECHNICAL DEBT
Based on the considerations given in Section V above, anorganization may decide to adopt the strategy that allocatesentire sprints to decrease TD, whenever the TD index becomesbig enough, i.e., when the effort spent in a sprint can beabsorbed entirely by refactoring and other TD decreasingactivities.
Now, the value of the TD index is computed based on theanalysis of the code quality performed by tools. Let us supposethat the evaluation reported by tools is not accurate, or thatthe computation of the TD index based on such evaluationis biased. This will likely result in dedicating too much ortoo less effort to TD management. In this section, we studythe dependence of the effectiveness of managerial decisionsconcerning TD management on the accuracy of the TD indexused to take those decisions.
A. Revised System Dynamics ModelIn the model given in Section III-B we have
fraction_of_effort_for_quality_maintenance=fracEffortForQuality(TDindex)
quality_maintenance_effort=available_effort*fraction_of_effort_for_quality_maintenance
where the function fracEffortForQuality(TDindex)specifies the strategy used for tackling TD, based in the TDindex. In this model, variable TDindex is assumed to representthe real amount of TD currently associated with the code.
We modified the model as follows:
reportedTD=perceivedTD(TDindex)fraction_of_effort_for_quality_maintenance=fracEffortForQuality(reportedTD)
quality_maintenance_effort=available_effort*fraction_of_effort_for_quality_maintenance
where function perceivedTD(TDindex) provides theamount of TD that is perceived by the project manager. Suchvalue depends on the actual TDindex and possibly on manyother factors. As already mentioned, here we are not interestedin defining a detailed model that accounts for all the relevantfactors that may affect development, but only to highlight theeffect of a few factors specifically related to TD management.Therefore, we define function perceivedTD(TDindex)simply as returning TDindex×TDperceptionFactor,where TDperceptionFactor is a constant. Clearly, whenTDperceptionFactor is one, the perceived value ofthe TD index is the real value of the TD index, whileTDperceptionFactor< 1 (respectively, > 1) indicates anunderestimation (respectively, overestimation) of the TD index.
The value given by function perceivedTD(TDindex) isassigned to variable reportedTD, which is then used as theargument of function fracEffortForQuality to decide howmuch effort should be dedicated to TD maintenance. With theadopted strategy, if this effort is greater or equal than the effortavailable in a sprint, the next sprint is dedicated completely todecreasing the TD.
B. Simulating the Effects of Wrong Evaluations of TechnicalDebt
We simulated the system with different values ofTDperceptionFactor.
The first outcome we obtained is that when the TDindex is moderately overestimated, the results tend to im-prove, even though only marginally. For instance, whenTDperceptionFactor=1.2, i.e., when a TD index equalto 0.2 is perceived as 0.24, we get the results described inFigure 6. After 30 sprints, we get 1629 FP and a (real) finalTD index slightly above = 0.02. That is, we slightly increasedthe amount of released functionality at the expenses of verylittle (practically negligible) decrease of quality.
Underestimating the TD might appear to be more danger-ous: when the TD index is underestimated by 10%, we get theresults in Figure 7.
After 30 sprints, we get 1588 FP and a (real) final TDindex slightly above = 0.03. Although the loss of quality ismarginal, we get 46 FP less than when perceiving the amountof TD exactly.
By increasing the underestimation, the results do notchange dramatically. When the perceived TD is 75% of theactual TD, we achieve 1546 FP with a still quite good quality(TD index is 0.04).
Probably, we should be more worried about overestimation.In fact, tools performing static code analysis tend to revealmany “violations” of code correctness rules, that may induceproject managers—with special reference to those not havinga deep understanding of how tools work—to think that theircode carries a much larger TD than it actually does.
With our simulated system, a breakpoint occurs when theTD index is overestimated by 135% or more. In such cases, weget the situation depicted in Figure 8. Figure 8 shows that theoverestimation of TD induces the project manager to dedicateevery second sprint to TD removal. This greatly decreasesthe amount of effort dedicated to enhancement. The releasedfunctionality at the end of the sprints is thus just 1280 FP.
C. Considerations on the Required Accuracy of Technical DebtEvaluation
The simulations described in Section VI-B above show thatthe correct evaluation if the quantity of TD is important toachieve optimal results. The effects of errors in evaluating theTD index are summarized in Table III.
It can also be observed that the adopted strategy, namelythe allocation of entire sprints to TD removal when there isenough TD to justify such allocation, is fairly robust withrespect to errors in evaluating the amount of TD. In fact,when the TD evaluation error is relatively small, the ‘pattern’of enhancement and TD removal sprints remains unchanged.This is evident by looking at the central graphs of Figures 5, 6and 7: in all these cases, after the initial sprints we have a TD

64
International Journal on Advances in Software, vol 12 no 1 & 2, year 2019, http://www.iariajournals.org/software/
2019, © Copyright by authors, Published under agreement with IARIA - www.iaria.org
Figure 6. Size of delivered code, Sprint productivity and TD index through sprints, when sprints are dedicated to either TD management or maintenance andTD index is overestimated by 20%.
Figure 7. Size of delivered code, Sprint productivity and TD index through sprints, when sprints are dedicated to either TD management or maintenance andTD index is underestimated by 10%.
TABLE III. EFFECTS OF ERRORS IN EVALUATING TD
Error Delivered Finalfunctionality [FP] TD index
-25% 1546 0.03–0.04-10% 1588 0.02–0.03
0% 1623 0.01–0.02+10% 1626 0.01–0.02+25% 1629 0.01–0.02+50% 1556 0.00–0.02
+100% 1565 0.00–0.01+135% 1257 0.00–0.01
removal sprint every three sprints, with just an exception (inFigures 5 a sequence of three enhancement sprints is present).So, the variations in the amount of delivered functionality aredue only to the fact that productivity depends on the amountof TD in the code.
On the contrary, when the overestimation of TD is large, wehave that every second sprint is dedicated to TD removal (seethe central graph of Figure 6): half of the project developmenteffort is dedicated to removing non-existent TD.
In conclusion, it appears useful to evaluate the TD ascorrectly as possible, and it is absolutely necessary to avoidlarge overestimations of TD.
VII. RELATED WORK
The term “technical debt” (TD) was forged by Cunning-ham [20]. Cunningham observes that sometimes code whoseinternal quality is not really optimal is released to achieve someimmediate advantage, e.g., to ship a product in the shortestpossible time, and that “Shipping first time code is like goinginto debt. A little debt speeds development so long as it is paidback promptly with a rewrite. [...] The danger occurs when thedebt is not repaid” because “excess quantities [of immaturecode] will make a program unmasterable.”
TD has received a good deal of attention from researchers.For example, a recent Systematic Mapping Study on TDand TD management covering publications from 1992 and2013 detected the existence of 94 primary studies that wereused to obtain a comprehensive understanding on the TDconcepts and an overview on the current state of researchon TD management [2]. As for TD management, the studyreported that some activities—such as TD identification andmeasurement—received a good deal of attention, while otheractivities—such as TD representation and documentation—didnot receive any attention at all. Finally, a clear lack of toolsfor managing TD was highlighted: only four tools are availableand dedicated to managing TD.
In another Systematic Mapping Study [21], among others,
65
International Journal on Advances in Software, vol 12 no 1 & 2, year 2019, http://www.iariajournals.org/software/
2019, © Copyright by authors, Published under agreement with IARIA - www.iaria.org
Figure 8. Size of delivered code, Sprint productivity and TD index through sprints, when sprints are dedicated to either TD management or maintenance andTD index is overestimated by 135%.
the following research question was addressed: What strategieshave been proposed for the management of TD, which em-pirical evaluations have been performed, and which softwarevisualization techniques have been proposed to manage TD?The findings of the study show that most studies deal withTD at the source code level (i.e. design, defect, code andarchitecture debt) and researchers detected the existence ofTD throughout the entire lifecycle of the project. This impliesthat ensuring the quality of the project’s source code is not theonly way to enhance project quality. However, researchers limitthe study to the existing problems in the source code. Severalstudies focus on strategies to manage TD. However, only fivestrategies (Portfolio Approach, Cost-Benefit Analysis, AnalyticHierarchy Process, Calculation of TD Principal, and Markingof dependencies and Code Issues) were cited and evaluatedin more than two papers. Few studies addressed the evolutionof TD during the development and maintenance phases of aproject.
System Dynamics was first applied in Software Engineer-ing by Abdel-Hamid and Madnick [22], who proposed a modelthat accounted for human resource management, softwaredevelopment, and planning and control.
The model by Abdel-Hamid and Madnick was used tostudy software effort and schedule estimation [23], projectstaffing [24], project control with unreliable information [25],as well as several other aspects of software project manage-ment and development.
A software tool for writing and simulating System Dy-namics models dealing with software development was alsodeveloped [26].
System Dynamics models were also used for simulating,understanding and optimizing the software development pro-cess [27] and various activities involved in software develop-ment, like requirements engineering [28], reliably control [29],knowledge management [30], outsourcing [31], [32], secu-rity [33], and system acquisition [34].
System Dynamics was then extensively used to modelsoftware development and its management. A survey of SystemDynamics applied to project management was published byLyneis and Ford [35], while in [36] De Franca and Travassospropose a set of reporting guidelines for simulation-based
studies with dynamic models in the context of SE to highlightthe information a study of this type should report.
Cao et al. [37] proposed a System Dynamics simulationmodel that considers the complex interdependencies among thevariety of practices used in Agile development. The model canbe used to evaluate—among others—the effect of refactoringon the cost of implementing changes. The model proposedby Cao et al. is quite comprehensive: it includes sub-modelsof human resource management, Agile planning and controland Customer involvement, which are not present in ourmodel. Besides, the models of Software production, Changemanagement, and Refactoring and quality of design are moredetailed than in our model. In fact, the model by Cao et al.aims at providing a complete and realistic simulation of realAgile processes, so it needs to be complete and detailed, whilewe just aim at showing the occurrence of phenomena that aredescribed by the literature on TD.
Glaiel et al. [38] used System Dynamics to build the AgileProject Dynamics model, which captures each of the Agilemain characteristics as a separate component of the modeland allows experimentation with combinations of practices andmanagement policies. Like our model, the APD model ad-dresses developments that proceed through sprints and includesthe representation of TD; nonetheless, the APD model is quitedifferent from ours. In fact, the APD model is quite complex,as it aims at capturing several (if not all) of the characteristicsof agile development, while our model is a proof of concept,aiming at showing how the TD works. As a result, the effectsof basic managerial decision (like the proportion of effort tobe devoted to quality improvement) on TD are more evidentin our model.
We remind the reader that our model is by no meanssuitable for realistic simulations, being oversimplified. TheADP model is for sure more suitable for simulating the likelybehavior of a real agile development project.
Finally, it should be noted that both Glaiel et al. [38]and Cao et al. [37] model agile software development pro-cesses, while we propose a model of a software developmentprocess that—although incremental and time-boxed—is notconstrained by several features of typical agile developmentprocesses.
A consequence of this difference is that the models by

66
International Journal on Advances in Software, vol 12 no 1 & 2, year 2019, http://www.iariajournals.org/software/
2019, © Copyright by authors, Published under agreement with IARIA - www.iaria.org
Cao et al. and by Glaiel et al. consider quality improvementsexclusively connected with refactoring, while in our modelquality improvement is a specific goal, which is supportedby ad-hoc budget (the fraction of effort dedicated to qualityimprovement) and can be performed continuously and inconjunction with development activities.
Cao et al. develop a system dynamics simulation model that–although comprehensive– does not focus on technical debtand how to optimize its management, as we propose to do.Glaiel et al. model technical debt and its management as partpart of the refactoring section of a larger model. As such, theeffect and the management options for dealing with technicaldebt are somewhat hidden in the model. On the contrary, ourmodel lets us focus on the technical debt, its effects and theconsequences of specific management strategies.
In conclusion, to the best of our knowledge, no other paperaddresses the TD management problem as we did. Althoughless comprehensive than the mentioned System Dynamicsmodels, our proposal helps better understand the consequencesof TD and the effectiveness of its management strategies.
VIII. CONCLUSIONS
The term “technical debt” indicates several concepts andissues related to software development and maintenance. Thelatter are complex and multifaceted activities: accordingly, itis not surprising that managing TD is quite difficult [6].
In this paper, we have provided a formal, executable modelof time-boxed software development, where the effects of TDare explicitly and quantitatively represented and accounted for.The model is usable to show—via simulation—the effects thatTD have on relevant issues such as productivity and quality,depending on how TD is managed, with special reference onhow much effort is dedicated to TD repayment and when—ina sequence of sprints—such effort is allocated.
The model also accounts for errors in the evaluation ofthe amount of TD affecting the code. Measuring the TD isnecessary, because the decisions of how much effort should beconveniently subtracted from code enhancement and dedicatedto debt reduction is often based on the knowledge of howmuch debt has been accumulated. In fact, the assumption thatmore TD decreases productivity leads to increasing the effortfor debt reduction, in order to restore high productivity levels.The proposed mode shows how to evaluate –via simulation–the effects of errors in the measure of TD.
The proposed model can be used to prove or disproveconcepts and hypotheses, to perform what-if analyses, etc.However, our model is not intended to be used in practicalsoftware project management as-is, because, the model illus-trated above is too abstract and contains hypotheses that couldnot match the target development environment. Whoever wantsto use the presented model for practical project managementshould first enhance it; examples of models representing allthe main aspects of software development can be found in thepapers by Cao et al. [37] and Glaiel et al. [38].
We plan to extend the presented model in several direc-tions: to account for different effects of TD on productivity(i.e., with functions different from the one in Figure 1), toexplicitly model defects, to test different debt managementpolicies, etc.
ACKNOWLEDGMENT
This work was partly supported by the “Fondo di ricercad’Ateneo” funded by the Universita degli Studi dell’Insubria.
REFERENCES[1] L. Lavazza, S. Morasca, and D. Tosi, “A method to optimize technical
debt management in timed-boxed processes,” in ICSEA 2018 - The 13thInternational Conference on Software Engineering Advances, 2018, pp.45–51.
[2] Z. Li, P. Avgeriou, and P. Liang, “A systematic mapping study ontechnical debt and its management,” Journal of Systems and Software,vol. 101, 2015, pp. 193–220.
[3] C. Fernandez-Sanchez, J. Garbajosa, A. Yague, and J. Perez, “Iden-tification and analysis of the elements required to manage technicaldebt by means of a systematic mapping study,” Journal of Systems andSoftware, vol. 124, 2017, pp. 22 – 38.
[4] A. Nugroho, J. Visser, and T. Kuipers, “An empirical model of technicaldebt and interest,” in Proceedings of the 2nd Workshop on ManagingTechnical Debt. ACM, 2011, pp. 1–8.
[5] N. Ramasubbu and C. F. Kemerer, “Managing technical debt in enter-prise software packages,” IEEE Transactions on Software Engineering,vol. 40, no. 8, Aug. 2014, pp. 758–772.
[6] P. Avgeriou, P. Kruchten, I. Ozkaya, and C. Seaman, “Managingtechnical debt in software engineering (dagstuhl seminar 16162),” inDagstuhl Reports, vol. 6, no. 4. Schloss Dagstuhl-Leibniz-Zentrumfuer Informatik, 2016, pp. 110–138.
[7] J. Letouzey, “The SQALE method for evaluating technical debt,” in Pro-ceedings of the Third International Workshop on Managing TechnicalDebt, MTD 2012, Zurich, June 5, 2012, 2012, pp. 31–36.
[8] “Automated technical debt measure – beta,” Object Management Group,specification ptc/2017-09-08, September 2017.
[9] “CAST Application Intelligence Platform,”https://www.castsoftware.com/products/application-intelligence-platform, accessed: 2019-02-05.
[10] B. Curtis, J. Sappidi, and A. Szynkarski, “Estimating the size, cost,and types of technical debt,” in Proceedings of the Third InternationalWorkshop on Managing Technical Debt. IEEE Press, 2012, pp. 49–53.
[11] “sonarcloud,” https://sonarcloud.io/about, accessed: 2019-02-05.[12] “squoring,” https://www.squoring.com/en/, accessed: 2019-02-05.[13] B. Baldassari, “Squore: a new approach to software project assessment.”
in International Conference on Software & Systems Engineering andtheir Applications, 2013.
[14] “https://www.cqse.eu/en/,” https://www.cqse.eu/en/, accessed: 2019-02-05.
[15] V. Bauer, L. Heinemann, B. Hummel, E. Juergens, and M. Conradt,“A framework for incremental quality analysis of large software sys-tems,” in Software Maintenance (ICSM), 2012 28th IEEE InternationalConference on. IEEE, 2012, pp. 537–546.
[16] J. Forrester, Industrial Dynamics. Cambridge: MIT Press, 1961.[17] A. J. Albrecht, “Function points as a measure of productivity,” in Act
as do 53 rd meeting of GUIDE International Corp., Guidance for usersof integrated data processing equipment conference, Dallas, 1981.
[18] IFPUG, “Function point counting practices manual, release 4.2,” IF-PUG, Tech. Rep., 2004.
[19] L. Lavazza, S. Morasca, and D. Tosi, “An empirical study on the factorsaffecting software development productivity,” e-Informatica SoftwareEngineering Journal, vol. 12, no. 1, 2018, pp. 27–49.
[20] W. Cunningham, “The wycash portfolio management system,” ACMSIGPLAN OOPS Messenger, vol. 4, no. 2, 1993, pp. 29–30.
[21] N. S. Alves, T. S. Mendes, M. G. de Mendonca, R. O. Spınola, F. Shull,and C. Seaman, “Identification and management of technical debt:A systematic mapping study,” Information and Software Technology,vol. 70, 2016, pp. 100–121.
[22] T. Abdel-Hamid and S. E. Madnick, Software project dynamics: anintegrated approach. Prentice-Hall, Inc., 1991.
[23] T. K. Abdel-Hamid, “Adapting, correcting, and perfecting softwareestimates: a maintenance metaphor,” Computer, vol. 26, no. 3, 1993,pp. 20–29.

67
International Journal on Advances in Software, vol 12 no 1 & 2, year 2019, http://www.iariajournals.org/software/
2019, © Copyright by authors, Published under agreement with IARIA - www.iaria.org
[24] T. K. Abdel-Hamid, K. Sengupta, and M. Hardebeck, “The effectof reward structures on allocating shared staff resources among in-terdependent software projects: An experimental investigation,” IEEETransactions on Engineering Management, vol. 41, no. 2, 1994, pp.115–125.
[25] K. Sengupta and T. K. Abdel-Hamid, “The impact of unreliable in-formation on the management of software projects: a dynamic decisionperspective,” IEEE Transactions on Systems, Man, and Cybernetics-PartA: Systems and Humans, vol. 26, no. 2, 1996, pp. 177–189.
[26] A. Barbieri, A. Fuggetta, L. Lavazza, and M. Tagliavini, “Dynaman:a tool to improve software process management through dynamicsimulation,” in Computer-Aided Software Engineering. Proceedings.,Fifth International Workshop on. IEEE, 1992, pp. 166–175.
[27] R. J. Madachy, Software process dynamics. John Wiley & Sons, 2007.[28] F. Stallinger and P. Grunbacher, “System dynamics modelling and sim-
ulation of collaborative requirements engineering,” Journal of Systemsand Software, vol. 59, no. 3, 2001, pp. 311–321.
[29] I. Rus, J. Collofello, and P. Lakey, “Software process simulation forreliability management,” Journal of Systems and Software, vol. 46,no. 2, 1999, pp. 173–182.
[30] P. Peters and M. Jarke, “Simulating the impact of information flows innetworked organizations,” ICIS 1996 Proceedings, 1996, p. 30.
[31] S. T. Roehling, J. S. Collofello, B. G. Hermann, and D. E. Smith-Daniels, “System dynamics modeling applied to software outsourcingdecision support,” Software process: improvement and practice, vol. 5,no. 2-3, 2000, pp. 169–182.
[32] A. Dutta and R. Roy, “Offshore outsourcing: A dynamic causal modelof counteracting forces,” Journal of Management Information Systems,vol. 22, no. 2, 2005, pp. 15–35.
[33] ——, “Dynamics of organizational information security,” System Dy-namics Review, vol. 24, no. 3, 2008, pp. 349–375.
[34] S. J. Choi and W. Scacchi, “Modeling and simulating software acqui-sition process architectures,” Journal of Systems and Software, vol. 59,no. 3, 2001, pp. 343–354.
[35] J. M. Lyneis and D. N. Ford, “System dynamics applied to projectmanagement: a survey, assessment, and directions for future research,”System Dynamics Review, vol. 23, no. 2-3, 2007, pp. 157–189.
[36] B. B. Franca and G. H. Travassos, “Experimentation with dynamicsimulation models in software engineering: Planning and reportingguidelines,” Empirical Software Engineering, vol. 21, no. 3, June 2016,pp. 1302–1345.
[37] L. Cao, B. Ramesh, and T. Abdel-Hamid, “Modeling dynamics in agilesoftware development,” ACM Transactions on Management InformationSystems (TMIS), vol. 1, no. 1, 2010, pp. 5:1–5:27.
[38] F. S. Glaiel, A. Moulton, and S. E. Madnick, “Agile project dynamics: Asystem dynamics investigation of agile software development methods,”2014.

68
International Journal on Advances in Software, vol 12 no 1 & 2, year 2019, http://www.iariajournals.org/software/
2019, © Copyright by authors, Published under agreement with IARIA - www.iaria.org
An Explorative Study on Motion as Feedback:
Using Semi-Autonomous Robots in Domestic Settings
Diana Saplacan, Jo Herstad
Department of Informatics
University of Oslo, UiO,
Oslo, Norway
email: {diana.saplacan; jo.herstad}@ifi.uio.no
Abstract—This paper presents motion as feedback. The study is
based on empirical data from an explorative study of semi-
autonomous robots used in domestic settings. We explore
feedback received from stationary technology, e.g., a
smartphone, and technology that is self-propelled, e.g., a semi-
autonomous robot. The paper has its theoretical foundation in
the familiarity concept used as a contextual and analytical tool
for unpacking feedback. The data analysis is done through
thematic analysis. The findings are structured in: feedback
received from a smartphone app technology, feedback received
from the robot-mediated via an app; and motion as feedback
received from the robot. Motion as feedback is discussed in
terms of: (a) what type of emotions feedback triggers in the
users, and (b) making sense of the motion as positive, negative,
homeostatic, archival and transition feedback. We argue that
having familiarity in mind when designing new technologies,
can make it easier for the user to know-how to engage with the
technology. Our conclusion is that: a semi-autonomous robot
technology can become more familiar to the user if it triggers
positive feelings, if its motion is coherent, if its navigation is
appropriate to the situation, and if its motion is not disturbing
or interrupting the user; and lastly, familiarity needs to be
considered when designing for a robot for the elderly.
Keywords – feedback; motion as feedback; semi-autonomous
robot; familiarity; emotions.
I. INTRODUCTION
This paper builds further on our reported work on how
feedback from digital technologies may trigger the feeling of
fear for technology when using those [1]. We have in our
previous work used fear as an umbrella term for emotions,
such as angst, anxiety, concern, doubt, dread, unease,
uneasiness, worry, aversion, fright, phobia, and presentiment
[2]. In this paper, we extend this work by looking at the
motion of robots as a type of feedback. We do this by
running a study where researchers test out a robot, and by
introducing a robot in the homes of the elderly.
The questions that we address are: 1) What kind of
emotions are triggered in the user by improper or lack of
feedback when engaging with digital technology: a
smartphone app or a semi-autonomous robot? 2) How is a
motion made sense of by the users when engaging with a
semi-autonomous robot, in their homes? Moreover, if motion
is illustrated as a type of feedback – what do we learn from
their experiences?
The rest of this paper is organized as follows. We
continue by introducing some terminology used in this paper
and a short background for the study. Section II gives an
overview of the current state of the art on different types of
robots used in home and outside the home. Section III
elaborates on feedback as understood within Human-
Computer Interaction (HCI). We introduce feedback as
visual and textual feedback. Based on the literature, we
describe polarity-, homeostatic, and archival feedback,
which we later use in our mapping of motion as feedback.
We continue then by introducing the reader briefly to motion
as feedback and the robot’s navigation. Section IV continues
with positing this paper on a theoretical level, elaborating on
the familiarity concept grounded in literature. Section V
gives a detailed account of the methodology and methods for
this study. Section VI presents in details the findings based
on empirical data. Section VII discusses the findings through
the lens of familiarity while elaborating on the motion as
feedback. Finally, Section VIII concludes the paper and gives
directions for further work.
A. Terminology
A domestic setting provides the opportunity for those who
live there, or are around, to use technologies that are still,
such as a smartphone, or technologies that move, such as a
semi-autonomous robot.
A smartphone is still technology. We define still
technology as a technology that does not move by itself; it is
not self-propelled, i.e., it does not change its location without
the continuous intervention of a human or another object.
Examples of analog and digital still technologies are a table,
a sofa, a notebook, a speaker, a lamp, a mobile phone, or a
smartphone. One could argue that a smartphone is indeed a
mobile technology. We agree with this if we talk about the
way it is used. However, when it comes to its form of motion
or locomotion, a smartphone or mobile phone does not move
around by itself and change its location, unless they are
moved by someone or something that can move. However, a
smartphone or a mobile phone can vibrate, and one could
argue that vibration is a type of movement. However, this

69
International Journal on Advances in Software, vol 12 no 1 & 2, year 2019, http://www.iariajournals.org/software/
2019, © Copyright by authors, Published under agreement with IARIA - www.iaria.org
type of movement is not an intended movement of changing
its location, or of navigating an environment.
We define a semi-autonomous robot as an in-motion
technology that can move by itself; it can be self-propelled,
that follows a locomotion process, i.e., it can change its
location without a necessary and continuous intervention of
a human or another object. Examples of in-motion analog
and digital technologies are mechanical robots and semi-
autonomous robots, which can navigate a place by
themselves, such as semi-autonomous vacuum cleaner
robots, or lawn mowers.
In this paper, we use this terminology interchangeably:
smartphone app technology, in order to refer to still
technology; and semi-autonomous robot technology for
referring to in-motion technologies, here a semi-autonomous
vacuum cleaner robot.
B. Background
According to the literature, robots are defined as:
“physically embodied systems capable of enacting physical
change in the world.” [3]. Following [4], industrial robots
refer to robots that move around or transport things, and
usually operate on conveyor belts, in packaging, and
assembling [4]. Industrial robots usually perform repetitive
routine tasks, often having a predefined navigation path.
Professional service robots are similar to industrial robots,
but they are used outside the industrial setting: they can
transport things, by navigating around the environment [4].
To these, robots used in healthcare also add up [3]. They
refer to the micro-robotics that are used inside the body,
protheses robotics that are used on the body, and robotics
that are used outside the body. Other robots are used to
support mental or behavioral therapy, such as those used for
people with diagnoses on the autism spectrum disorder,
those with cognitive impairments, or as companions [3].
However, they usually perform tasks to assists people:
cleaning nuclear waste [4], supporting surgeries in hospital
settings, or carrying around medicines or instruments, see
for example the work from [5] or [6]. The robots that are
outside the body and can move semi-autonomously usually
have pre-defined paths and navigate in uncluttered
environments.
Further, the third wave in HCI discusses digital
technology in our homes [7]. However, we still seem to
have less knowledge on the use of moving objects in the
home than about the use of stationary technology – although
several existent projects are studying the use of robots in the
home. These are usually included under the category of
personal service robots, following [4]. Amongst personal
service robots are: robotic vacuum cleaners, lawn mowers,
and assistive robots for the elderly or the un-abled [4].
This study is part of the Multimodal Elderly Care Systems
(MECS) [8]. The project focuses on the design of a robot for
the independently living elderly. We define elderly as old
adults (≥ 65 years), according to definitions used in
gerontology [9][10]. However, within the frame of the
MECS project, this study consists of a qualitative
interpretative phenomenological evaluation of the interactive
systems as experienced by participants in their daily lives,
and the phenomena surrounding them. We followed the HCI
definition - a “discipline concerned with the design,
evaluation, and implementation of interactive computing
systems for human use and with the study of major
phenomena surrounding them.” [11, 15, emphasis added].
The setting for this study was the homes of our participants.
II. STATE OF THE ART
According to state of the art in robotics, published in
2016 U.S. Robotics Roadmap, the focus area of the field is
currently on: aging well and quality of life, robotics used in
the medical field in surgeries and interventions, and the
robots used as “clinical workforce support” [3, 73]. The
study also says that a one-size fits all approach is hard to be
achieved in robotics [3].
A thorough overview of the robots used in studies for
supporting independent living is given in [12]. There are
several projects studying the use of robots in the home. A
project concerning the care of the elderly is Acceptable
robotiCs COMPanions for AgeiNG Years (ACCOMPANY)
[13][14]. ACCOMPANY developed Care-O-Bot robot.
Care-O-Bot is amongst one of the robot assistants used for
housekeeping and home care [13][14][15][16]. Care-O-Bot
is a state-of-the-art robot designed to be used in the home
[17]. A couple of other projects studying these type of
robots are named in the work of [17], such as Handy 1,
Movaid, and Nursebot built for the elderly or the disabled;
GuideCane, Hitomi, PAM-AID, PAMM, Smart-Cane
PAMM, and Smart-Walker PAMM. These robotic
prototypes were built to be walking aid for the blind,
elderly, or the disabled [17].
At EU-level, several projects studied the use of robots in
the home. Amongst the European Union projects are:
Robot-Era Project [3], MARIO Project on Managing active
and healthy aging with use of caring service robots,
EURON RoboEthics Roadman, EP6, ETHICBOTS,
BREATHE, and ICT & Ageing Project [18]. Another
project was the Multi-Role Shadow Robotic System for
Independent Living (SRS) [19]. The project focused on
studying the frail elderly people: the elderly whose
Activities of Daily Living (ADL) are limited by their health
problems [19]. Many of the frail elderlies use walking
chairs, sticks, or wheelchairs [19]. The study shows that
teleoperated robots may be accepted in some situations,
whereas direct physical interaction with a service robot can
be, at times, difficult [19]. It seems that “housing-related
needs” are central for learning and adopting the technology
if these technologies function well [19, 303]. For instance,
the study also indicates that men have more difficulties than
women with housekeeping tasks, while women have
difficulties in reaching things [19]. A similar study to ours
talks about introducing personal service robots, a Roomba
Discovery vacuum cleaner, in homes [20]. The home is

70
International Journal on Advances in Software, vol 12 no 1 & 2, year 2019, http://www.iariajournals.org/software/
2019, © Copyright by authors, Published under agreement with IARIA - www.iaria.org
viewed as an ecology of products, people, activities, a social
and cultural context of use, and a place – a bounded
environment [20]. It seems that the expectations one has of
technology are highly related to shaping the initial
expectations of technology. The use of the robot also
influenced the practice of housekeeping: in some
households, the male participants set-up the robot; in others,
only the women use it [20].
Companion robots are also used in studies with the
elderly. An example of a companion robot is PARO, the
seal robot [21][22][23]. The seal robot PARO was used in
facilities for the elderly in the Nursing-care Robot
Promotion Project, in Japan [22]. An initial study showed
that the elderly participants suffering from various mental or
behavioral issues, but who interacted with PARO over time
improved their communication, reduced their aggression
and wandering, as well as improved the sociability of the
participants, over time [22]. PARO also seems to be widely
accepted across cultures [24]. Other examples of companion
robots are Pepper and NAO used in exploratory studies, as
shown in [25]. AIBO, Furby, and NeCoRo are a few other
robots representing animals that were used in therapy with
children, or in nursing homes with the elderly [21][22].
Another project from the EU project within the Ambient
Assisted Living (AAL) is Enabling Social Interaction
Through Ambient (EXCITE) [26]. The project introduced
the Giraff robot in several homes with the purpose of
studying “social interaction through robotic telepresence”
[26, 827], an idea that stemmed from the RoboCare project
[27].
Finally, it seems that “20% of the world’s population
experience difficulties with physical, cognitive, or sensory
functioning, mental health or behavioral health” [3]. In
numbers, there are around 190 million people experiencing
difficulties with ADL, including physical tasks and
cognitive tasks [3]. Further, it seems that the aging of the
workforce has consequences within the healthcare field
[28][29]. A study from [30] shows that, for instance, in
Sweden, the cost for the home care for the elderly would
increase between 20 and 35% between 2013 to 2020,
whereas this could instead be reduced by 50% as of 2020,
with the digitalization of the home care services [30]. In
Norway, the elderly population will increase by 21% by
2050 [31]. Furthermore, the active working force will not be
able to tackle the healthcare needs imposed by this increase
[31] and yet among the action plans taken at the European
Union’s level, regarding this societal challenge, is the
digitalization of health through the use of Information
Communication Technologies (ICT’s) [32]. Moreover,
several studies address directly or indirectly the issue of the
digital divide between users with ICT literacy and those,
with reduced ICT literacy. Elderly are often included in the
group of users with reduced ICT literacy as shown in
[33][34][35][36]. Yet, all the above yield at how important
it is to make sense of the design of today’s technologies,
including those that move: semi-autonomous robots for the
use in the homes of the elderly. Nevertheless, one of the
designing principles for designing good smartphone
technologies and semi-autonomous robots is to give
informative feedback when an error occurs [37][38].
Understanding feedback is, therefore, highly relevant in this
context. Next section gives an introduction to the main topic
discussed in this paper: feedback.
III. FEEDBACK
In this section, we describe how feedback is currently
discussed in the HCI literature.
Feedback is an abstract concept that was used in a number
of disciplines. Diverse elaborations and explorations of
feedback definitions are encountered from control theory and
cybernetics to the definitions used in HCI [1][39]. Before
going further, we wish to turn to the definition of feedback,
within HCI, as explained by Norman (2013): informing the
user, in some way, that the system is working, as a response
to the user’s action [40].
Feedback in the interaction with a desktop computer
interface was well established a long time ago and often
already understood by the user [41]. Here are a few examples
based on Apple’s User Interface Guidelines dating back to
1992: feedback to the user when typing in passwords by
displaying a bullet character for each typed character by the
user; feedback of a cursor showing a delay after user has
moved a big document to the trash bin; a dialogue box
feedback informing the user about his or her actions’ result;
when the user deletes everything from the trash bin, an empty
trash text should be displayed; when selecting an option in a
radio button, the user should see a bullet in the selected
option; when an option from a menu is chosen by the user,
the option is hoovered or the background color is changed;
when an item is selected from a palette of patterns or colors,
that option is highlighted or outlined; moving around
windows on the desktop is illustrated immediately to the user
through the windows new position; an active window is
highlighted or outlined; when a user shall be informed about
potential dangers, such as an unsafe document to be opened,
or a non-reversible action, the user should be informed
through a caution alert box, where the user has the possibility
to cancel the action or to proceed further; or a button that is
clicked or hoovered over shall be highlighted [41].
According to [42], feedback is an important concept that
is studied, especially within education. However, within the
HCI field, it seems still to remain ambiguous and primitive,
and “is oversimplified” [42, 253]. While some of the
literature identifies feedback as a response to the user’s
action [9], others talk about feedback as a way “to
communicate the state of the system independently of the
user’s action” [43, 316]. Feedback can be visual, auditory,
haptic, and some talk about it as bio-feedback in HCI studies
that measure or self-track the human [1]. Others talk about
eco-feedback in sustainability and environmental HCI
studies, or affective feedback [1].

71
International Journal on Advances in Software, vol 12 no 1 & 2, year 2019, http://www.iariajournals.org/software/
2019, © Copyright by authors, Published under agreement with IARIA - www.iaria.org
Further, language seems to play a central role in HCI, in
auditory and textual feedback. However, we have also seen
that language per se used in the interaction with computers
or machines does not always work: see for instance the
example of the natural language processing ELIZA used in
early days of Artificial Intelligence (AI), mentioned in [44];
or the example of textual feedback using technical language
of “it cannot connect to the cloud services” [1, 176]. [44]
talked about how the HCI field evolved based mainly on
conversational and linguistic development, a common
language [44]. This was mainly a question of mutual
intelligibility through language.
But the HCI field has evolved, and while visual, auditory
and textual feedback still remain essential, it also seems to
become more common to interact with things that move. As
[45] has earlier put it: the conditions for the possibility that
the world as an adjacent to everyday interaction becomes an
interface for computation, we could, in his words, through
this type of interaction “capitalize our familiarity, skill and
experience in dealing with the everyday world around us”
[44, 1]. In addition to the development of a common
language, we also need to develop a shared understanding,
mutual intelligibility of the motion of the robot: “A robot in
the real world, however, must consider the execution of the
plan as a major part of every task. Unexpected occurrences
are not unusual, so that the use of sensory feedback and
corrective action are crucial” (Raphael, cited in McCorduck,
1979, p. 224), in [44, 23]. How can then the movement itself
of things be applied in order to facilitate human interaction
with things? What experience of the robot’s movements
should be designed for? And what do these movements
communicate to the user? How are these movements
interpreted by the user as feedback? How do we describe
patterns of movements, styles of movement, or ways of
moving? How can these movement styles be mapped as
feedback to the user?
Before going further, we would like to explain polarity
feedback, homeostatic feedback, and archival feedback –
types of feedback that we found in the existent literature.
This is later our departure point for discussing motion as
feedback.
A. Polarity Feedback: Positive and Negative
Polarity feedback can be regarded as positive or negative
[42], depending on how the feedback is interpreted by the
user, compared to the user’s expectations. According to [42],
feedback as information retrieval, in the broader sense of it,
is formed by a message, a cognitive interpretation, and its
context. For instance, a user sets the temperature on a
thermostat in a room to be 25°C degrees. In this situation, the
visual feedback can be translated as positive, if it shows the
temperature set by the user, or at least close to what the user
has set (23°C degrees, or perhaps 26°C degrees) could still
be accepted. However, if the temperature of the room does
not seem to be close to what the user has set, say 15°C
degrees or 35°C degrees, the feedback is translated as
negative feedback. In other words, positive feedback is when
the system responds accordingly or at least close enough to
the input of the user, meeting the user’s expectations. On the
other hand, negative feedback is when the system does not
respond exactly or close enough to the user’s input, resulting
in a high difference between the system response and the
user’s expectations. Negative feedback does not necessarily
need to have a negative value, (+)15 °C can still be
considered a negative value.
B. Homeostatic Feedback
Feedback has a polarity, positive, and negative, but it can
also be homeostatic [46]. Homeostatic feedback is a type of
feedback that is constant, regardless if the feedback is
positive or negative; the state of the feedback is the same
over a longer time period. Polarity feedback and homeostatic
feedback are not mutually exclusive: positive or negative
feedback can also be at the same time homeostatic [42].
Taking the same example of receiving feedback from a
thermostat on a room’s temperature homeostatic feedback is
when the thermostat shows over a longer period of time
exactly 25°C degrees, according to the user’s input. But
homeostatic feedback can also be negative feedback of 15°C,
or 30°C degrees, over a longer period of time. If the
thermostat does not start, although the user has pressed a
start button, it can also be translated into a homeostatic
negative feedback.
C. Archival Feedback
The literature discusses archival feedback [46]. This type
of feedback is distinguished from immediate feedback [46].
Such a type of feedback logs and remembers the system’s
previous actions, in such a way that it can return to a
previous state. A concrete example is when the user uses the
UNDO button: if the actions of the user were logged over
time, then the UNDO button performs a positive action, e.g.,
the system goes back to a previous state. This type of
feedback that logs and remembers previous states of the
system is called archival feedback. If the UNDO button
cannot perform this operation, pressing the UNDO button
gives a negative feedback, e.g., nothing changes – the system
stays the same. However, the system should inform the user
anyway, that nothing was changed. This is then not an
archival feedback, but rather the user receives a negative
feedback on its input regarding the archival feedback.
D. On Motion - As Feedback
Following Mitcham’s (1978) in [47] it seems that a tool
is activated by the human agency, while a machine can, to a
certain degree, operate independently [47]. Following this
definition, we could say that a semi-autonomous robot used
at home is in a way a machine – something that acts
independently, but also a tool, since it is controlled at some
degree by the user: through a button, or by using an app as a
remote controller, or through a remote controller.

72
International Journal on Advances in Software, vol 12 no 1 & 2, year 2019, http://www.iariajournals.org/software/
2019, © Copyright by authors, Published under agreement with IARIA - www.iaria.org
In general, humans know where they are, or how to navigate their way where they want to get [47]. One can navigate his or her way based on own knowledge or familiarity with the place, or by using a map. This is done through their own body’s locomotion [47]. Wayfinding is different from navigation, by moving from a location to another region (compared to navigation, which is moving from one location to another location) [47, 219-242]. A semi-autonomous robot is moving within a home through both types of motion: first, through wayfinding, by creating a map of the place; and second, through navigation, moving around on the already mapped space. These types of movement can be classified as locomotion, or a global movement, according to [48]. Besides these movements, a robot also has its own motions, such as moving the head of a robot, moving an arm, without changing the robot’s location. The authors classify this type of movement as a local movement, or to use the term from robotics, configuration movement [48]. In this paper, the local movement is considered as still type of motion. The paper is mainly concerned with the locomotion type of movement. Rather than going into the depths of motion and animation techniques here, we would like instead to focus on exploring further domestic robot’s motion as feedback: What kind of feedback does the user receive and in, which situations? What are the implications of the motion for the feedback? How is the robot motion perceived by the users in terms of feedback?
We have earlier conceptualized feedback [39] based on
Hall et al. (1968) proxemics [49]. We have identified that a
semi-autonomous robot includes the same types of feedback
as a smartphone app technology, but in addition, it has the
motion element [39]. We observed that the motion of
the robot could be considered as a type of feedback that it is
manifested through distributed feedback, via extended
proxemics, when the feedback from a robot is given via an
app [39]. We noticed that this type of feedback was
distributed when using an app. To simplify the discussions
later, we illustrate (a) getting feedback from a smartphone
app technology vs. (b) getting feedback from a robot (Fig. 1).
We also noticed that while feedback from a smartphone is
direct, feedback from a robot can be both direct, from the
robot, or distributed, via an appWe build in this paper further
on the earlier reported work, the motion as a form of
feedback, by investigating the motion of the robot, and by
looking at how it is made sense by the users. We do this by
bringing up examples from our empirical data (Section VI).
We make sense of motion as feedback based on our
empirical data, by distinguishing between feedback from a
smartphone and a semi-autonomous technology, reshaping
and molding the notion, understanding and making sense of
the motion as feedback. In this way, can these various types
of motions be perceived as feedback by the participants?
How can we classify then these motions as feedback?
Introducing a common vocabulary may help us to talk about
motions of semi-autonomous things in homes in a better
way, similarly to perspectives from other fields, such as
mathematics, physics, medicine, or biology:
anthropomorphizing – moving like a human; zoomorphic –
animal movement, robot morphing – moving like a machine.
We continue in the next section by laying our theoretical
foundation: the familiarity concept. The concept will later in
the paper help us to unpack and understand the feedback
notion.
Figure 1. The user receives feedback

73
International Journal on Advances in Software, vol 12 no 1 & 2, year 2019, http://www.iariajournals.org/software/
2019, © Copyright by authors, Published under agreement with IARIA - www.iaria.org
IV. THEORETICAL FOUNDATIONS: ON FAMILIARITY
According to [50], theory helps us “to structure
knowledge, to evaluate and assess it, to construct it and share
it” [50, 126]. Amongst their six models of using theory, there
are also: theory as a contextual tool, where the researchers
start with a research question and take a position, often
referring to theory as concepts, ideas, or perspectives; and
theory as an analytical tool, where the researchers use the
theory to analyze and interpret the findings in the light of the
theory [50]. In this paper, we have used both these types of
using theory: for both the former and the latter one, we posit
the paper within the frame of the familiarity concept used in
HCI.
The concept of familiarity is illustrated in Heidegger’s
Being and Time as “[knowing] its way about” [51].
Familiarity can be described as an intimate, close, and
friendly state, or interaction [52]. In Dreyfus’ view,
familiarity gives one the tools to respond correspondingly to
different situations [53]. In HCI, familiarity has been used as
a base for the design. For instance, this concept can be used
in the skeuomorphic design. Skeuomorphic design refers to
when the digital interface adopts some of the physical
artifact’s properties in order to accommodate better the user
by making the digital artifact looking more familiar [54].
Such an example is, for instance, when a digital interface
imitates the paper look of an old book. Others have used it
within the design of tangible systems [55]. However, it
seems the concept is still underexplored within HCI, while it
seems to be important in the sense-making of using
technology. For instance, [56] found that familiarity plays a
central role in individuals’ relationships with technology
[56]. Later, [57] pointed out that familiarity concept did not
get too much attention in the field of HCI, besides his
previous work together with Van de Walle [57].
Inspired by the work of Heidegger, Mereleu-Ponty, and
Dreyfus, [58] tried to make sense of everyday’s examples of
interacting with technology, the readiness of coping with it in
everyday life situations. Further, familiarity is based on
several key points [55]. Among these are: familiarity with
digital technology depicts a “know-how” relationship [58]
based on a tacit knowledge; familiarity is based on everyday
use, on reading about it, and being taught how to use it;
familiarity with digital technology means knowing how to
use it, or using Turner’s words, “to be ready to cope with it”
[55, 25, emphasis added]. Familiarity is also a form of
engagement, of what Heidegger calls involvement [59].
However, familiarity with technology is more difficult
because involvement with technology can become complex
[59]. Involvement represents a form of care, enfoldment,
entanglement, according to [55]. Familiarity also has an
affective part that builds upon feelings of closeness, of being
at home, feelings of comfort, ownership, and warmness [55].
Inspired perhaps by Heidegger’s “being-in-the-world,” he
calls this relationship of co-existence with technology as
being-with [55]. According to the author, an appropriate way
of becoming familiar with technology is to integrate it within
the participants’ everyday life [59]. He sees this type of
relationship as a co-existence relationship with technology
[59]. Turner (2008) also says that familiarity can be
illustrated as one’s perception change rather than knowledge
creation [57] .
Finally, [60] also argued for familiarity as a basis for
universal design. They mean that HCI is based on the
distinction between man and machine [60]. Furthermore,
[61] described it as an intimate or close relationship, where
humans engage with- and try to understand the technology
[61]. The authors propose a salutogenic approach, as a way
of focusing on the factors that contribute to well-being and
health, rather than treating or fixing a disability, incapability
or weakness [61]. In this paper, we try to understand the
participants’ engagement with the technology, by making
sense of the feedback received from the technology, being it
a smartphone app or a semi-autonomous robot.
In the next section, we continue by introducing our
methodology and methods used in this study.
V. METHODOLOGY AND METHODS
According to [62], interpretive research is afforded
through “language, consciousness, and shared meanings”
[62, 2]. Boland (1985) in [62, 2], says that “the philosophical
base of interpretive research is hermeneutics and
phenomenology.” Further, we followed one of Ricoeur’s
thesis that hermeneutics builds upon phenomenology [63].
In addition to the earlier reported work [1], we have now
included both researchers and several elderly people in the
study. We describe next our study context, study design, the
robots used in this study, selection of robots, participants,
data collection, and data analysis, as well as ethical
considerations.
A. Study Context
The study was performed in the old district area of Oslo,
Norway. The area has approximately 3000 senior citizens,
over 67 years old. Some of these elderlies choose to live in
accommodation facilities for the elderly. The elderly usually
live there independently, or together with their partners.
However, the accommodation is provisioned with a 24/7
reception staffed with at least two personnel, available for
the elderly, a gym, a restaurant for taking breakfast or lunch,
which is also open to the public, a library where meetings or
various courses are held, and an open area for coffee breaks
and other events. Several studies have been performed in
such facilities [64][65][66][67][68], but none of these report
data on the use of robots or semi-autonomous robots in the
homes of the independent living elderly.
B. Study Design
This study was divided into three stages. The first stage
was a pilot phase, with the purpose of learning, and getting a
pre-understanding of the context (stage 1). Next, several of
the researchers involved in the project tried out the semi-
autonomous robots in their homes (stage 2). After some of

74
International Journal on Advances in Software, vol 12 no 1 & 2, year 2019, http://www.iariajournals.org/software/
2019, © Copyright by authors, Published under agreement with IARIA - www.iaria.org
the researchers have tried out the semi-autonomous robots,
we started introducing the first available robot in the homes
of the elderly (stage 3). In some cases, the robots were run in
parallel in both homes of the elderly, and homes of the
researchers.
C. Robots in this Study
In this study, we have used semi-autonomous vacuum-
cleaner robots in the homes of our participants. Selecting
such a robot was a bi-informed choice. On the one hand, our
elderly participants reported earlier familiarity with semi-
autonomous robots, such as vacuum-cleaners and lawn-
mowers that they have seen on TV and were keen to test out.
These types of robots are sometimes referred to as domestic
robots or domotics. On the other hand, the study is part of the
MECS project, that aims to develop a robot for independent
living elderly. This study was made at an incipient phase of
the project. The project did not have yet any fully developed
robot for the independent living elderly, such as a safety
alarm robot, in place at the time. Therefore, we chose to
build on our senior participants’ familiarity with the robots,
e.g., by selecting semi-autonomous vacuum cleaners to be
used in their homes.
We have initially investigated several potential robots to
acquire for our study. We finally selected three of them for
the purpose of our study: iRobot Roomba 980 [69], Neato
BotVac, and Samsung PowerBot VR20H. Table I below
gives a summary of the technical specifications of the robots.
TABLE I. SUMMARY: TECHNICAL SPECIFICATIONS OF THE SELECTED
ROBOTS
D. Selection of the Robots to be Used in the Elderly’s
Homes
When the robots were introduced in the homes of the
researchers in the first stage of the project, we noticed soon
that iRobot Roomba 980 and Neato were the most
appropriate for the elderly, due to their reduced sizes,
compared to BotVac robot. This led us to make the choice of
only using iRobot Roomba 980 and Neato in the elderly’s
homes.
E. Participants
13 participants took part in this study: seven (7) of the
participants were researchers that tested the robots as part of
the pilot study, including the authors (SD, HJ), during the
period of times ranging from about one week to about one
month. At this stage, 2 females and 5 males participated. Six
(6) elderly persons used the semi-autonomous vacuum
cleaner for about one month: 5 females, and 1 male. Three of
the elderly participants were included in the previously
reported work [1]. The participants had different
backgrounds and presented different levels of interest in
modern technologies.
The researchers are represented in this study by both
junior and senior researchers. The elderly participants (≥65
years), part of the MECS project, were recruited through
MECS’ partner organization. Due to the high commitment
that the study required, including weekly visits, the use of the
robot, photos, participant diary notes as domestic probes,
observations, and interviews, only six elderly participants
were willing to participate within the timeframe of study data
collection. The participants were self-selected and took part
in the study based on their free will. Some of the participants
took part in the study through the snowball effect by finding
out about the study from others.
F. Data Collection
The data was collected from researchers and the elderly.
The data collected from researchers was retrieved through
diary notes and photos (Table II). The data collected from
the elderly participants were retrieved through interviews,
elderly’s diary notes used as domestic probes, photos,
researcher’s notes, and headnotes (Table III on the next
page). Headnotes are “experiences, impressions, encounters,
and evaluations that are continuously present in [the]
memory,” according to [70] following [71]. Each senior
participant received a notebook to be used for their diary
notes. We kindly asked the elderly participants to note down
in their diaries the situations they encounter. These notes, or
posts, as we named them, were written by the elderly,
especially when something unusual or unfamiliar occurred.
TABLE II. OVERVIEW OF THE DATA COLLECTED FROM RESEARCHERS
Robot
Specifications
iRobot
Roomba
980
Neato
BotVac
Samsung
POWERbot
Dimensions (Depth x
Width x Height)
35 x 14 x
9.2 (cm)
33.5 x 32.1
x 10 (cm)
37.8 x 13.5 x
36.2 (cm)
Weight 4 kg Ca 4.1kg Cca 4.8 kg
App as a remote
controller
YES.
iRobot Home App
Yes. Neato
Robotics
Yes.
Powerbot, smart home
app.
Charging Battery
and electricity
Battery and
electricity
Battery and
electricity
Data collection methods - Researchers
# Timeframe Documentation Robot used
1 One week Yes. Diary notes, seven posts (one
per day), ca 4 and a half A4 pages,
analog format, 28 photos
Neato
2 Ca two week Yes. 3 pages of A4 notes, digital
format, 4 photos enclosed
Neato
3 Ca one week Yes. Short notes on strengths and
weaknesses of using such a robot, digital format
iRobot
4 One week Yes. 1 page of notes, digital
format
Samsung
PowerBot
5 Ca one week Yes. Half page was written notes
on strengths and weaknesses,
digital format
Neato
6 Ca one month Yes. Four pages of written notes, 22 posts, digital format
Neato
7 Ca one month Yes. Ca 19 A4 pages of written
notes, analog format
Neato

75
International Journal on Advances in Software, vol 12 no 1 & 2, year 2019, http://www.iariajournals.org/software/
2019, © Copyright by authors, Published under agreement with IARIA - www.iaria.org
G. Data Analysis
The process of analysis started already while being in the
field, as a form of doing some preliminary work [72]. This
has been followed by a multiple stage analysis process,
where the data went through some analytical filters.
Specifically, we have followed thematic analysis from V.
Braun & V. Clarke to analyze the data collected in stage 2)
and 3) [73]. This was done in 5 steps. We have first started
by trying to familiarize ourselves with the data (step 1). We
did this by creating a map of data and resources, which later
resulted in Table II, respectively Table III. At this stage, we
had put aside the initial research question, to be open for
novelty, for what may come up and we did not think of,
trying to focus on what the participants found interesting.
Thereafter, our analysis was done in a bottom up fashion
starting from coding each of the resources (step 2). We have
then grouped the resources in three categories based on the
data sources: researcher’s diary, researcher’s observation
notes during elderly’s observation and elderly’s own diary
notes, and interviews. At this point, the raw data became
textual data, in the form of transcribed interviews, notes, or
interview summaries. All the interviews with the elderly
were transcribed verbatim by author SD. The transcribed
interviews alone resulted in around 26000 words exclusive
the pilot interview (circa 33500 words together with the pilot
TABLE III. OVERVIEW OF THE DATA COLLECTED FROM THE ELDERLY
interview). At the same time, the author (SD) went through
the photos taken (n=147). The coding was done by reading
the material “line-by-line to identify and formulate all ideas,
themes, or issues they suggest, no matter how varied and
disparate" [74, 143]. This resulted in a variety of scattered
codes.
Next step was collating the codes further into sub-
categories for each of the data sources (step 3). This was
done through color coded post-it notes by the author (SD).
We cannot claim a full inter-reliability of the study, as the
coding was done by one author (SD) [75]. However,
following [75], validity, in this case, is not of "a particular
concern", as the study focuses on exploring the potential
challenges one may encounter when a robot is introduced in
the home [75, 212]. Moreover, the findings were discussed
at different points during data collection amongst the
researchers in the project. In addition, the collated codes
were discussed by the authors (SD, HJ) during the data
analysis.
As a result, the data collected through researcher’s diary,
researcher’s observation notes and elderly’s diary notes, and
interviews resulted in [n=51], [n=47], respectively [n=124]
collated codes: a total of [n=222] codes. At this stage, we
were searching for themes. We observed that some of the
collated codes were present across several of the resources:
written utterances during our drop-in visits (usually once per
week, or on request), and utterances from the interviews. We
#
Data collection methods - elderly
Gender
(Female
F, Male
M) Interview Elderly’s Diary
notes
Researcher’s
notes
Photoswe
re taken
by the
researche
rs
Eventual details about the robot used, if any
assistive technologies were used, and level of
information technology literacy
1
F Circa 1 hour, audio-recorded
pilot interview, transcribed
verbatim (SD) AND
Circa 1 hour and 45 minutes
of untranscribed audio-recording from the
installation of the robot
Yes. Circa 5 A4
pages, analogue format.
Yes. Circa 2
A4 pages.
Yes. 36
photos
iRoomba, 87 years old, walking chair, did not
use the app
2
F Circa 40 minutes, audio-
recorded, transcribed verbatim (SD)
Yes. Circa 3 A4
pages notes,
analogue format
Yes. Circa 2 A4 pages.
Yes. 4 photos.
iRoomba, walking chair, necklace alarm that she
does not wear it, high interest in technology, used
the app, has a smartphone,
3
M Circa 25 minutes, audio-recorded, transcribed
verbatim (SD)
Yes. One letter-size page, analog
format, short
notes.
Yes. Circa 4
letter-sized pages.
Yes. 10
photos.
Neato, wheelchair, not interested in technology,
did not used the app, easy to use, has a wearable safety alarm
4
F Circa 33 minutes audio-
recorded, transcribed
verbatim (SD)
Yes. One A4 page, analog
format
Yes. Circa 2
A4 pages.
Yes. 36
photos
iRomba, wheelchair, interested in technology, did not use the app, easy to use, does not have a
smartphone, wearable safety alarm
5
F Circa 45 minutes audio-
recorded, transcribed verbatim (SD)
Yes. One letter
size page, analog
format.
Not available Yes. 13 photos
Walker, did not use the app, not interested in
technology, does not have a smartphone,
wearable safety alarm
6
F Circa 43 minutes, audio-
recorded, (transcribed verbatim) (SD)
Yes. 4 letter-size pages, analog
format.
Yes. Circa 1
letter-sized page.
Yes. 16
photos
Interested in technology, no walker, wanted to
use the app, but gave up, does not have any wearable alarm

76
International Journal on Advances in Software, vol 12 no 1 & 2, year 2019, http://www.iariajournals.org/software/
2019, © Copyright by authors, Published under agreement with IARIA - www.iaria.org
looked for performative utterances [76]. This was carefully
paid attention to due to two main reasons: in order to observe
whether or not the researchers and elderly encounter the
same type of challenges with the robot, and how information
technology literacy influenced the attitudes towards the
robot.
Finally, the collated codes and findings were discussed
between the authors (SD, HJ) at multiple times. At this stage,
we reviewed the themes resulted (step 4). The final analysis
resulted in three main themes: robot, home space, and human
emotions and perspectives on perceived autonomy (step 5).
H. Ethical Considerations
The project is in line with the ethical guidelines from the
Norwegian Center for Research Data (NSD) (ref. nr: 50689).
The data collected during this study were stored on the
Services for Sensitive Data (TSD) facilities, owned by the
University of Oslo, Norway, operated and developed by the
TSD service group at the University of Oslo, IT-Department
(USIT). All the data was anonymized. Prior to starting the
study, the participants were given detailed information about
the study. The participants could withdraw at any time
without giving any explanation and without any
consequences for them. The participants willing to
participate signed informed consent before taking part in the
study.
During the study, we had constant contact with our
participants, through regular visits, often each Wednesday,
on pre-agreed times, but also on demand, if they needed any
support or had questions. Sometimes, we called them on the
phone just to check if there was anything they wondered
regarding the robot. They also received our contact details
and could contact us at any time.
VI. FINDINGS
This section presents the findings from this study. The
findings are structured in three categories: the user receives
feedback from a smartphone technology (Sub-section A),
the user receives distributed feedback via an app (Sub-
section B), and robot motion as feedback and its implication
for the user (Sub-section C). The findings are supported by
empirical examples. A detailed account is given below for
each of these.
A. Findings: The User Receives Feedback From A
Smartphone Technology
In this section, we present a situation where the user
receives feedback from a smartphone app technology. This is
illustrated through textual feedback that is either improper or
lacking. Fig. 2 illustrates the situation presented here.
Figure 2. Feedback between smartphone technology and a (human) as user
1) Providing Improper Feedback
The user is provided with improper textual feedback [1]:
a) “SMS shows full. Do I need to buy a new phone?”:
One of the participants told us about her experience with the
mobile phone and the feedback of SMS - full blinking icon.
Her concern was that she could not store any longer the
photos she received from her family. The participant was
concerned that she had to buy a new phone, and that this
would lead to losing the existent photos.
b) “Where is the ‘No’ option when updating
software?”: Another situation described by one of the
participants was related to getting constant updates, where
she gets either the option ‘Now’ or ‘Later,’ but not a ‘No’
option. She contacted the company providing the operating
system via a handwritten letter and asked about this option.
To her surprise, she got called up by the customer service,
and got offered help on how to deal with the two options
available, ‘Now’ and ‘Later,’ but the company had no plan
to introduce a No-option. The participant explained that she
knew how to deal with the updates, but what she wanted
was that the feedback should embed a ‘No’-option
alternative. Regarding this design issue, this has to do with
the continuous update of software and the point of view of
the elderly on these always encountering updates. This
example illustrates a situation where feedback messages do
not provide enough options.
2) Lack of feedback
“You were terribly afraid of doing something wrong”: In
one of our interview sessions, one participant describes that
when she learns using new technologies, she is so afraid of
doing something wrong. A concrete example is that the
technology, being it smartphone or tablet, does not provide
any feedback on how to get back to basics: “so you were
very afraid that... I did not feel I could come back to the
base. But I was afraid to do something wrong.”
By this, the participant means that the applications are
built in such a way, that one is expected to have that intuitive
knowledge, but for new users, it can be difficult to
understand how to navigate within an app, and one can easily
get stuck.

77
International Journal on Advances in Software, vol 12 no 1 & 2, year 2019, http://www.iariajournals.org/software/
2019, © Copyright by authors, Published under agreement with IARIA - www.iaria.org
B. Findings: The User Receives Distributed Feedback
From A Robot via an App
This sub-section illustrates the situation when a user
receives feedback from a semi-autonomous robot technology
via a smartphone, through an app. We illustrate first some of
the implications that the use of such an app has for the user
at the installation time. Thereafter, we illustrate some
situations where the users received either improper feedback,
or the feedback was lacking. An illustration of the situation
is presented in Fig. 3 below.
Some of the participants have chosen to install the app in
order to control the robot remotely. Several steps had to be
followed in order to install the app. As the diary notes show,
for Neato robotics app, for instance, one should create an
online account. This, required an email address. This
required a Wi-fi connection to the network. One of the issues
that occurred during this step at the installation of the robot
in one of the participants’ homes was that the robot required
a 5 GHz Wi-fi, while the participant’s router had only 2.4
GHz.
The next step was to choose the right robot amongst
several robots listed in the app. The final step was to connect
to the robot. Once the app was installed, a map of the local
space was created within the app after the robot has moved
around. The map provided the approximate area, including
obstacles, edges of space, and door limits (Fig. 4).
One of the participants gives a rich description of his
experience on installing the app: “Today, it's time to get this
thing going. First, I need to connect to the vacuum. This
involves enabling Wi-fi on the vacuum, then connect your
phone to the vacuum's Wi-fi access point (yes, the vacuum
has its own Wi-fi access point). Then you can use
Figure 4. Example on the map is shown in a robot app that was generated
by the robot
the Neato app to choose the actual Wi-fi point to connect to.
On the one hand, this makes it easier to configure the robot
since you connect only to it and you get the richness of a
mobile app to input information (including passwords to
access point), but it's not without some flaws. First, I
assumed it would show the access points right away; it
didn't. So, I typed in the access point and the password. I
should also point out that I connected it to the "guest" Wi-fi,
not our main Wi-fi. It's suddenly at this point that I realize
how little I trust this thing belonging to the main network,
and I start to think about other ways to partition the
network. […] Regardless, the phone tells me that the
process may take up to 3 minutes and that I should watch
Figure 3. Feedback from a semi-autonomous robot technology to a (human) user mediated via an app
Figure 1.

78
International Journal on Advances in Software, vol 12 no 1 & 2, year 2019, http://www.iariajournals.org/software/
2019, © Copyright by authors, Published under agreement with IARIA - www.iaria.org
the robot's display screen during this time. I do, but it only
shows the current setting of Wi-fi on. When I try to move
back, I accidentally turn off Wi-fi, and I put the system in an
uncertain state. I try to re-enable the wi-fi, but now the
phone and the robot are confused. The phone, after 3
minutes, reports that the wi-fi information was "incorrect"
and urges me to try again. But the robot refuses to
rebroadcast its Neato access point. […] I switch the vacuum
off using its hardware switch and then turn it back on. I go
through the process again (with a lighter touch on my
fingers). […] Then, I can choose the network and enter the
password. This time it connects shortly thereafter. At this
point, the robot asks for a name, I just give it Neato, and I
set it out for its first vacuum tour” (Diary notes,
Researcher).
Further, we found out that many of the in-app
instructions and paper instructions that came along with the
robot were available only in English. Many of the elderly
participants pointed out that they do not feel comfortable
about using technologies in English, and it would have been
better to have it in their mother tongue, Norwegian. Here is
an example of what one of the participants say:
(Participant): “Yes. So it was another time when it got stuck
in the charger, and it blinked. It was something about the
light, but I did not understand what it was. I have missed a
Norwegian instruction manual. It would have been very nice
to have one.” (Interviewer): “You are not the first person
saying this. […]” (Participant): “Because even if I
understand pretty well English, these technical things are a
lot worse, because you do not understand them so well:
technical language is more difficult!” (Interview, Elder
person).
1) Providing Improper Feedback:
Another issue that seems relevant to the use of the app
was when a power outage occurred, and the app stopped
working, as it required an Internet connection. During a
power outage, the app controlling the domestic robot
stopped working, according to one of the elderly
participants. The participant got a message that the app
“cannot connect to the cloud services”. The use of technical
terms, such as “cloud service” when giving feedback to the
user, seems to be inappropriate. She said: “It was just
standing still there, or when I pressed on it where it says
something about cloud-service. It didn’t do anything, but I
thought you would come tomorrow” [1]. The technical term
“cloud service” confused the elderly user. The user, in this
case, relied on the researchers help to come along the next
days.
Another participant wrote in his diary notes that the robot
urged for attention through a feedback message: “Please
clear my path (2000) and a red cross” (Diary notes,
Researcher), without understanding the meaning of the error
2000. Another participant referred to the message he
received from the app as a “cryptic message.” One of the
participants explained that the app does not give proper
feedback regarding the area of the room: “The area cleaned
shown on the map is 4 mp2. But the hall and room 3 are
more than 4 mp2.” (Diary notes, Researcher).
2) Lack of Feedback:
It seems that one of the participants has used the app to
schedule the robot. However, the participant did not get any
notification (e.g., lack of feedback) when the robot once
started to run: “Went out to meet some friends, when I got
home, I found the robot running. Apparently, I had turned
on a schedule when I had last used the app. I'm not sure
*how* I did this, but I did it. The Wife was home, so she
picked up the rug in the entryway.” (Diary notes,
Researcher) Another similar situation is illustrated in one of
the participant’s diary notes: “We went out for a walk, and
when we came home the robot was vacuuming, it had sort
of cleaned the rug in the entryway, but not really. […] A bit
annoyed, I looked at its schedule. It seems it will be going at
9:30 tomorrow evening. We'll be ready for it this time. I
enjoy that it has created a staggering vacuuming schedule,
but a bit annoyed that it just launches itself out there.”
(Researcher, Diary notes).
C. Findings: Robot Motion as Feedback and its
Implications for the User
In this section, we present situations where the users
interact or engage with semi-autonomous robot technology.
We make sense of the movements illustrated as feedback, as
they happened. The situations illustrated that: the
incoherence semi-autonomous robot’s motion triggered
various feelings, including stress, anger or other feelings
related to robot personification; the users received indirect
feedback to do facilitation work, such as moving things
around in home, lift the robot and move it manually to
another place; and that the robot’s motion creates noise. An
illustration of the situations described here is given in Fig. 5.
1) Movement Triggers Feelings
a) Feelings of Incoherence in Robot’s Motion: Some
participants pointed out incoherence in the robot’s
movement. The feeling of incoherence was triggered by the
non-regular pattern of the movement, the user not being able
to predict it. Indirectly, the robot motion gave a feeling of
incoherence. Here are some examples: “I think it starts in
one room, and then it goes to another, and then it goes again
to the first room. I think it is a bit strange that it does not
finish in the first room, and it goes perhaps to the kitchen,
and then it comes back, and it continues likes this, and then
goes out again. I think it was very strange (break), really,
very strange.” (Interview, Elder participant); “[…] And
suddenly it started going by itself one morning. I thought it
was very strange.” (Interview, Elder participant); “One time
when I pressed on HOME, it started going around by itself,
so I had to carry it back” [the participant means here that she
pressed on the HOME button, but she had to carry manually
the robot back to its charging station].
b) Feelings of Anger, Stress, or Annoyance: Some of
the participants found it stressful to follow the robots’

79
International Journal on Advances in Software, vol 12 no 1 & 2, year 2019, http://www.iariajournals.org/software/
2019, © Copyright by authors, Published under agreement with IARIA - www.iaria.org
movement: “There? [it reads out loud from own diary notes]:
Puhhh… It was a bit stressful to keep an eye on it. […] Yes,
I think it was a bit stressful because it went so many times
over the same place. And I think it is a waste, such a waste.
It went back and forward, and I wanted then to... I just put
my foot in his way, so it couldn’t go another way. You
decide very little over it.” (Interview, Elder participant); In
another elderly’s participant diary notes was written: “[…] Is
this helping, or it will be Stressful [note that the participant
writes the word Stressful starting with capital S]” (Diary
notes, Elder participant). Another participant points out
feelings of anger triggered by the robot motion: “So it was a
bit stressful there! I was angry at it.” (Interview, Elder
participant). Another participant said: “At the beginning, it
was a little odd to have a device moving on its own while we
are sitting in the living room or having dinner. Since this was
our first experience with this kind of technology, it makes
sense to be annoyed or even scared by this robot at the
beginning. However, having a remote control to terminate
the robot manually or to change the current function
overcomes the fear!” (Diary notes, Researcher).
c) Feelings of Personification – Robot as a
Companion: However, besides feelings of incoherence in
movement, stress, and anger, the robot also awaked feelings
of personification – they viewed the robot like a pet, or
someone in the home, that they talked to (Interview, Elder
participant). Some of the participants personified the robots
by giving them names such as King Robot, Frida, or Snilla.
2) Robot Enacts the User to do Facilitation Work
a) The Robot gets Stuck in Obstacles: There were
several situations when the robot got stuck, in curtains, under
the bed or sofa, in cables, or things around the home. Here
are some exemplifications from both elderlies and
researchers: “I got my brother fixing the cables under the
bed, so they are not in its way. […] If it had gotten stuck
there, I wouldn’t have been able to come down there. I was
very afraid of this. So no cables were supposed to be there! I
felt so much better then!” (Interview, Elder participant);
(Interviewer): “Okay… But you also wrote in your diary
notes that you had to clean a bit before you could run the
robot.”; (Participant): “[…] I have lots of chairs here. I have
put those two on top of each other because otherwise, it stops
all the time. So I have removed them. And the cables […]
Yes, I have cleaned a bit.”; (Interviewer):” Did they get stuck
in the cables on the floor?” (Participant): “I have tried to
remove those. Yes, because it stopped a bit... or it brought
those with it. So I had to clean.” (Interview, Elder
participant). Some situations are illustrated below (Fig. 6).
Figure 6. Situations where the robot got stuck and needed facilitation work
Figure 5. Feedback from a semi-autonomous robot technology directly to the (human) user

80
International Journal on Advances in Software, vol 12 no 1 & 2, year 2019, http://www.iariajournals.org/software/
2019, © Copyright by authors, Published under agreement with IARIA - www.iaria.org
A few other examples are: “[…] A chair had to be taken
outside of the room, two pillows and a basket were set on a
table, two cables had to be taken up. Two doors had to be
closed. […]” (Diary notes, Elder participant); “The robot
got stuck in the carpet’s tassels and stayed still. It took some
time to free R from the tassels, so I took away the carpet.
[…]” (Diary notes, Elder participant); “R got stuck under a
little table, I have freed R and lifted the machine to the
charging station.” (Diary notes, Elder participant);
(Interviewer): “Do you see this as a problem?” (Participant):
“Well… As I am quite strong, it works. But not everyone
can lift and carry it.” (Interview, Elder participant); “On a
shelf, it was a lamp, but its cable was down on the floor.
The robot got stuck, and it dragged the lamp down. As a
result, the lamp got disassembled in 2 pieces. Luckily it was
a plastic lamp & it didn’t break. I could put it together.”
(Diary notes, Researcher). One of the commented on how a
robot generates other types of work – additional and
facilitation work is needed to be done. “[…] The goal I had
was to make the floor clean; but to get to this – I needed to
install something on the floor… A paradox.” (Diary notes,
Researcher).
Several participants suggested that one needs to do
some facilitation work regarding the surface where the robot
should navigate: “It started working, but it got stuck on the
TV stand. I got a message about 10 minutes out. I then came
back and freed it. It went for a while but got lost under the
table. I pulled out the chair, and it seemed to go OK.
Afterward, it did OK, though it tried to climb the entrance to
the laundry room.” (Diary notes, researcher); “I pressed
“HOME” button, it started. After a while, it got stuck. I
remembered the previous installation at home when the app
gave notifications about this – when I was out-of-the-house.
This information was disturbing at that time since I did not
want to do anything with it. It interrupted a nice train
journey I remember now and started off a train of thoughts
of where it was stuck, and why (since I had done my best to
make a “clean floor” there as well.” (Diary notes,
Researcher). Another participant pointed out: “Managed to
move small, light things like a tiny rug, map tube” (Diary
notes, researcher). A few others said: “After getting tired of
the robot getting stuck, I put the stripe on the area it always
got stuck, and it worked fine. Yay!” (Diary notes,
researcher); “I had to move the chairs that were under the
table because it was too small. I’ve noticed that it didn’t
reach.” (Interview, Elder participant); “Yes, it pulled the
cables a few times. Especially those behind the sofa, it is a
long cable, and it pulled it out. Now I have fastened it, so it
doesn’t go on it any longer.” (Interview, Elder participant);
“Isn’t it supposed that robots do their job on their own,
without needing one’s assistance?” (Diary notes, Elder
participant); “A few times I had to move because it got
stuck a lot. So next time I had to move those things out
[talks about furniture] But I think it is a bit confused
because it seems to have memory. When I moved the
furniture, I think it was a bit confused, I think. But yes, I
had to move the furniture.” (Paraphrasing from an interview
with an elder participant).
b) The Robot Escapes and Indirectly Asks for
Facilitation Work: Two of the elderly participants
encountered situations when the robot would escape from
their apartment. Here are some examples from our data:
(Participant): “[reads out loud from his diary notes] Her
name is Frida. It behaved well. It got away one of these
days. I forgot to lock the entrance door, and it disappeared
in the hall.”; (Interviewer 1): “[surprised] Okay. So it
disappeared??”; (Participant): “Yes, yes. That one is wild. It
went fast over the doorstep.“; (Interviewer 1): “So you had
to go and bring it back.”; (Participant): “Yes, yes, yes. Yes,
but maybe after it finished, it would have come back by
itself. I don’t know.”; “I also had that door open, and it was
out in the hall. But after, I closed the door, and it had to stop
there.”. Some examples when the robot tries to go over the
doorsteps are exemplified in the images below (Fig. 7).
Figure 7. Robot escapes
c) Motion Creates Noise
Several participants, both researchers and elderly,
reported that the motion of the robot created noise. Noise, in
this case, can be accounted as a form of feedback for the
motion, with the meaning of: “the robot is ON, and
navigating around.” Here are a few excerpts from our data
exemplifying this: “R has started just now. The Radio
attenuates the sound from R.” (Diary notes, Elder
participant); “[…] I have pressed on clean, but it was just
standing there and making noise. I had to lift it to the
charging station, press clean and R continued its tour.”
(Diary notes, older participant); “Back to the engine sound.
I guess this is to be worked with; to make it quieter.
Perhaps it could be possible to make user settings; how
much power should be used, and this will again regulate the
sound/noise. It is hard to think of the sound as nothing but
noise… The sound from the movement is very low in
comparison to the sound from the vacuum engine. It is also
more pleasant to the ear.” (Diary notes, researcher
participant); “Checked the schedule, and thought nothing
was on. So, I went out, but it turned out that it was actually

81
International Journal on Advances in Software, vol 12 no 1 & 2, year 2019, http://www.iariajournals.org/software/
2019, © Copyright by authors, Published under agreement with IARIA - www.iaria.org
going at 9:30. I wasn't there, but the wife was trying to sleep
and complained about all the noise it made. But it got stuck
somewhere, constantly asking for attention. When I finally
got home, it was waiting at the front door, stuck in the
carpet. It complained that it wanted the roller cleaned. I just
put it away for tomorrow.” (Diary notes, researcher
participant); “Noise, can't use together with TV watching”
(Diary notes, researcher participant); “Any way to pause
cleaning once it starts, e.g., to take a phone call? Via app?”
(Diary notes, researcher participant).
Finally, in this section, we have illustrated situations on
the motion as feedback and its implications for the user,
based on empirical data. In the next Section, we continue
with discussing and unpacking further motion as feedback
through the lens of familiarity based on the situations
presented here, and also coming back to our initial stated
research questions.
VII. DISCUSSION
“The designer of any artifact that is a tool must
communicate the artifact's intended use and, in some cases,
the rationale for its behavior, to the user. There is a strong
sense, therefore in, which the problem with such a premise,
however (as archaeologists well know), is that while the
attribution of some design intent is a requirement for an
artifact's intelligibility, the artifact's design per se does not
unequivocally convey either its actual, or its intended use.
While this problem in the interpretation of artifacts can be
alleviated, it can never fully be resolved, and it defines the
essential problem that the novice user of the artifact
confronts. Insofar as the goal of design is that the artifact
should be self-evident; therefore, the problem of deciphering
an artifact defines the problem of the designer as well.” [44,
14-15, emphasis added].
What kind of emotions are triggered by improper or lack
of feedback when engaging with a smartphone app or semi-
autonomous robot technology? How is a motion made sense
of and understood by the users when engaging with a semi-
autonomous robot, in their homes? If the motion is
illustrated as a type of feedback – what do we learn from
their experiences?
It seems that emotion and motion are, at least
etymologically, interconnected. Etymologically, emotion
dates back to the 12th century from the old Franch emovoir,
which means to stir up, and from the Latin emovere, which
means to move out, remove, agitate [77]. In the late 17th and
18th century, the term illustrated “a sense of strong feeling,”
and later was extended to any feeling, according to the
Online Etymological Dictionary [77]. The term motion dates
back to 13th -14th centuries and it means “the process of
moving,” movement, change, coming from the Old French
mocion, and from the Latin motionem, with the meaning of
“a moving, a motion, an emotion” [78]. The term
locomotion dates back to the 17th century and is formed
from the Latin locus, which stands for a place, and the term
motion [79]. Further, findings from our data present issues
related to the robot, to the home space, and to human’s
emotions and perspectives on perceived autonomy. We
choose to limit our discussions related to the issues
encountered that are related to the robot’s movement. The
research questions are analyzed and reflected upon, based
on the findings presented in Section VI, the Sub-sections A-
C. We do this through the lens of the familiarity concept by
reflecting on the motion as feedback.
A. The Role of Familiarity for the Emotions Triggered by
the Engagement with Technology
The first question that we address is: What kind of
emotions are triggered in the user by improper or lack of
feedback when interacting or engaging with a smartphone
app or a semi-autonomous robot technology?
An intuitive interface is an interface that the user
naturally knows how to use it, whereas a familiar interface
is an interface that the user has been exposed to over time
and learned how to use it [80]. Raskin (1994) suggested that
we should use the word familiar instead of intuitive
[57][80]. We have earlier noticed that elderly participants
feared interaction with unfamiliar digital technology
because they did not master it, they did not feel able to learn
it, and it was not in their zone of proximal development. At
the same time, we also noticed that the language used for
giving feedback to the users, in a breakdown situation, was
often inappropriate: either by providing improper feedback
or through lack of feedback. We talked about improper
feedback as textual feedback using technical terms for
transmitting a message. This triggered in the elderly feelings
of fear, including its derivatives: angst, anxiety, concern,
doubt, dread, unease, uneasiness, worry, aversion, fright,
phobia, and presentiment [81].
Many of the studies on feedback within HCI are inspired
by human-to-human conversational interactions [43][46].
However, specifically, [44] noticed earlier that human-
machine communication was using English as the “natural
language” for communicating between humans and
machines [44, p. 28]. This choice was anchored in Austin’s
(1962) “How to do things with words,” that language
through its utterances can be a form of action, but this
requires an appropriate interpretation of its interlocutor [76].
We noticed in our study that the interlocutor could not
always interpret the use of technical terms. This is an issue
of mutual intelligibility, as [44] would call it. Therefore,
designers should consider avoiding the use of those in
textual feedback. Similar findings to ours were presented in
the study of eco-feedback from [82], that pointed out that
householders participants did not understand the language
used in the textual feedback. In addition, the Macintosh
User Interface Guidelines, dating back to 1992, pointed out
that feedback should be proper, and inform the user as much
as possible, instead of providing the user with a technical
language such as: “The computer unexpectedly crashed. ID
= 13” [41, 9]. We encountered a similar situation in our

82
International Journal on Advances in Software, vol 12 no 1 & 2, year 2019, http://www.iariajournals.org/software/
2019, © Copyright by authors, Published under agreement with IARIA - www.iaria.org
findings when one of the participants received the error
message: “Please clear my path (2000) and a red cross”.
This type of error message is improper because it did not
make sense for the participant. Feedback should be
appropriate and timely [41]. In addition, another study
showed that seniors that are not familiar with particular
technical terminology do not use these words [60]. In our
findings, a similar situation occurred when one of the
participants pointed out the use of technical language in the
feedback they received via an app: “it cannot connect to the
cloud services.” [1, 176]. These are, however, examples
from the everyday’ participants’ interaction with the robot
but are nevertheless important to be accounted to make
sense of them. [58] explained that making sense of everyday
examples of interacting with technology, of coping with it in
everyday life situations is an indication of our familiarity
with the technology. This relies upon the know-how,
following Dreyfus in [59].
Feedback, however, has cognitive attributes that can be
interpreted by the users. For instance, [42] talks about the
mind and the text, and how the information transmitted can
change the state of someone’s mind and/or affect, depending
on the conceptualization and interpretation of the
information. We have seen concrete examples in this study
of how someone’s interpretation of robot motion changed
his/her state of mind to stress, anger, or feelings of
personification. However, apart from the emotions triggered
by smartphone app technologies, moving further to the
emotions triggered by the semi-autonomous robot, we
noticed the following: the incoherence in motion triggered
various feelings, including stress, anger or other feelings
related to robot personification. When a technology triggers
emotions within a user, being positive or negative, it means
that the user engages with it, rather than interacts with it
[83]. Interaction is a form of “’dialogue’ with the
technology” [83, 62]. Engaging with the technology also
has an affective part, in comparison to interaction [83]. We
have also observed that amongst different mechanisms to
engage with technology, to be able to maintain a dialogue
with it, to cope, to co-exist with it, one is feedback. If, for
instance, motion feedback supports this engagement with the
technology in itself, rather than just the interaction with it,
we become more familiar with it. The repertoire of emotions
awaken by the participants’ experience of the robot is the
result of their interaction, engagement, or even familiarity
with it. The emotions triggered in both elderly and
researcher participants were often of stress, anger,
annoyance. However, we observed that, in general, elderly
often felt as non-experts when using the robot and did not
have the same deep tacit knowledge as the researchers in
this study, that seemed to be more familiar with using the
same technologies, or similar ones. We also observed that
both the independent living elderly and the researchers in
this study were challenged in many ways by interacting with
a semi-autonomous robot technology: perhaps more than
with a smartphone app technology. Many of these
challenges arose due to additional interaction elements: the
(sometimes incoherent) motion of the robot and the use of
the app. The participants often had to learn the know-how, to
co-exist with the robot, and to accommodate it: not the
opposite – the robot did not necessary accommodated them,
although it was its purpose. On the other hand, [84] talk
about unfamiliarity of the users with a new technological
machine makes it more difficult to cope with it – this does
not mean that the machine lacks technological advancement,
but perhaps it is not designed in a familiar way for the
users.
Finally, we have noticed that the robot, through its
motion, did not only trigger negative feelings but also
feelings of personification: the participants associated the
motion feedback of the robot with aliveness. The movement
of the robot put the robot somewhere in between a static
object, and a fully autonomous object: it was something that
could move by itself, be self-propelled, i.e., it could change
its location without a necessary and continuous intervention
of a human or another object. Nevertheless, this idea of
aliveness as a familiar characteristic has been earlier
noticed, based on “autonomous motion, or reactivity” [44].
These feelings of personification can be translated as
awaking positive emotions in the elderly. However, making
sense of the motion itself as feedback, and how it can be
understood through the lens of familiarity remains to be
discussed. We explore this next.
B. Making Sense of the Motion as Feedback
The second set of questions addressed in this paper is:
How is a motion made sense of and understood by the users
when interacting or engaging with a semi-autonomous
robot, in their homes? If the motion is illustrated as a type
of feedback – what did we learn from their experiences?
Humans are usually familiar with their own movement,
with seeing things that move around outdoors: bicycles,
cars, trains, ships, airplanes. However, one is not yet
familiar with semi-autonomous things that move within a
home. This phenomenon has been discussed within
Robotics and Human-Robot Interaction (HRI), but it still
remains to be explored within HCI. A home is not a static
linear environment, but rather things happen in a dynamic
and non-linear fashion: people in the home move objects
around: a chair is moved to another place, a bag is placed on
the floor, a sock is forgotten on the floor and so on. A robot,
whose main surface of navigation is the floor, may
encounter these objects and treat them as obstacles: both in
its wayfinding and in its navigation. Familiarity is also a
form of engagement, or what Heidegger calls involvement
[83]. One becomes familiar with the technology through
repeated, everyday exposure to it [59][60]. But a semi-
autonomous robot that moves within the home seems to be
still unfamiliar so far: perhaps because we are not yet
exposed in our daily lives to robots that move semi-
autonomously in our homes. Turner (2011) talks about the
inclusiveness of technology, that it must fit users’ everyday

83
International Journal on Advances in Software, vol 12 no 1 & 2, year 2019, http://www.iariajournals.org/software/
2019, © Copyright by authors, Published under agreement with IARIA - www.iaria.org
lives [58]. Did the robot fit the participants’ everyday lives?
The elderly in this study were willing to adopt a robot in
their homes, out of curiosity, willing to learn more about
such semi-autonomous robot technologies, to become
familiar with it, but also perhaps they sought out some sort
of practical coping, that ameliorate some of the direct
consequences of aging, such as bending while doing
cleaning work. Housekeeping, for instance, seems to be
considered not only a physical task, but also a goal-oriented
task that requires some degree of cognitive functioning [3].
However, the authors refer to information retrieval only
as a text regarding these types of feedback, not as a motion
[42][46]. The human is considered here as an interpreter of
the motion as feedback. Motion feedback, similarly to visual
feedback, can also be translated into positive, negative,
homeostatic feedback, or archival feedback. Based on our
study, we have observed that the motion as feedback can be
mapped out to four situations: (1) when the robot is still, (2)
when the robot goes from a still state to motion, (3) when
the robot goes from a motion state to a still state, and
finally, (4) when the robot is in motion. We ground our
mapping on empirical examples from our data to illustrate
motion as feedback, but we do not argue that other ways of
are not possible. Besides polarity feedback, homeostatic
feedback, and archival feedback, we introduce the notion of
transition feedback. Transition feedback emerged during
our mapping of motion as feedback. Transition feedback
refers to motion as feedback when the robot changes its state
from still to motion (2), or from motion to a still state (3).
Next, we map polarity feedback, homeostatic feedback, and
archival feedback to motion as feedback.
1) When the Robot is Still
When the robot stands still, the motion as feedback can be
translated into homeostatic feedback: the robot does not
perform any change in its motion state. The homeostatic
feedback can be either positive or negative, depending on if
the user has previously pressed the button to start it, or not.
For instance, if the user presses the CLEAN button, which
means that the change of the robot should be changed from
still to motion, but the robot remains still, the feedback is
negative.
2) When the Robot Goes from a Still to a Motion State
The transition between the still state to a motion state of a
robot can be translated as positive or negative feedback,
depending on the correspondence between the user’s input
and expectations. Positive feedback is given when the user
presses the CLEAN button, and the robot moves around
cleaning. This is also transitioning state feedback, as the
robot changes its state. An example of negative feedback for
this situation is when the robot starts moving around by
itself, without being enacted by the user.
3) When the Robot Goes from a Motion State to a Still
State
The robot turns back to its charging station when the user
presses the HOME button can be translated into positive
feedback, as the robot responds to the user’s input. At the
same time, this can also be translated into transitioning
feedback since the robot changes its state, from motion to a
still state. A second situation is when the robot turns back to
its charging station when it is almost out of battery. This
motion feedback can be translated as positive archival
feedback since the robot acts accordingly to its resources,
e.g., needs to be charged. However, from the point of view
of the user, this can be translated as negative feedback, since
the robot does not meet the expectation of the user: to be in
motion once that the user has pressed CLEAN. It can also
be translated into transition motion feedback since it is
changing its state. A third situation is when the robot
remembers the path and turns back to its charging station
after finishing cleaning. This can be translated as positive
archival feedback because it remembers its way back, based
on a logged history or a previously created map. A fourth
situation is when the robot gets stuck and enacts the users
through indirect or invisible feedback to do facilitation
work. In other words, the robot gives a negative transition
motion feedback to the user by changing its state, from
motion to a still state.
4) When the Robot is in Motion
We could see in our findings that when the user presses
the HOME button, but the robot does not go back to its
home station, and yet here the archival feedback was
missing. This can be translated as negative homeostatic
motion feedback. We can say that when the user presses the
HOME button and the robot returns to the home station, the
user understands the robots’ navigation to the base station as
immediate positive feedback: it responded to the user’s
action. Another situation is illustrated when the motion of
the robot is incoherent: it only cleans a small surface,
without navigating the whole area. This can be translated as
negative homeostatic motion feedback. When the robot is in
motion, and the motion feedback is manifested through the
noise, it can be translated into positive homeostatic
feedback. However, in the view of the user, this is translated
as negative feedback since the noise itself creates feelings of
annoyance, disturbing the user.
When the robot remembers the map of the rooms when is
not running for the first time in the area (coherent
navigation), the motion of the robot can be translated into
positive archival homeostatic motion feedback, since the
robot remembers the map of the room and can navigate
accordingly. Opposite to this situation is when the robot
escapes a room previously navigated, i.e., the navigation
path of the robot does not respect the boundaries. This can
be translated as negative motion feedback.
We illustrate some examples of positive, negative,
homeostatic and archival motion feedback in Table IV.
C. Familiarity with the Motion as Feedback
Based on this study, we have observed that the
familiarity, or for that matter unfamiliarity, of the motion as
feedback can be based on already established notions of the
polarity of feedback, homeostatic feedback, and archival

84
International Journal on Advances in Software, vol 12 no 1 & 2, year 2019, http://www.iariajournals.org/software/
2019, © Copyright by authors, Published under agreement with IARIA - www.iaria.org
feedback. However, these notions were used so far in
relation to textual or visual feedback [55][60]. We have
classified motion as feedback, based on the motion state of
the robot and empirical examples from our data: 1) motion
as feedback when the robot is still, 2) motion as feedback
when the robot is transitioning from a still state to a motion
state, 3) motion as feedback when the robot is transitioning
from a motion state to a still state, and 4) motion as
feedback when the robot is in motion. To the already
existent types of feedback, we have observed that for semi-
autonomous robots, transitioning feedback for situation 2)
and 3) is a new type of feedback. We have mapped and
illustrated the four situations based on the robot’s states and
their corresponding feedback (Fig. 8 on the next page).
Further, [85] compared and synthesized the design
principles from Schneider (1999) [37][38], from
Constantine & Lockwood (1999) [86], and from Nielsen
(2005) [87]. The author found out that the principles related
to error handling and error recovery, based on the three
named guidelines are necessary for any type of interactive
system [85, 45]. Specifically, the author means that errors
should be avoided [85, 45]. If we translate this to the
familiarity of motion as feedback, it implies that any
feedback that can be translated as a form of negative
TABLE IV. MAKING SENSE OF MOTION AS FEEDBACK
feedback illustrates some sort of unfamiliarity: either of the
robot as a response to a user action, or of the emotions
triggered in the user. The authors say: “in other words, the
environment would behave in a manner familiar to the user
as if they were not actually using a computer system.” [85,
45]. We can observe that negative feedback occurred in all
types of situations. This means that the semi-autonomous
robot did not respond or act in a familiar way. Further,
according to the authors the concept of UNDO, of archival
feedback, which we translated as a way for the robot for
going to a previous state, is “unnatural” and conflicts “with
the principle of familiarity” [85, 45]. We observed this type
of archival feedback in situation 3) when the robot
transitioned from a motion state to a still state, and in 4)
when the robot maintained its motion state. For motion as
feedback, this idea that the archival feedback is unnatural
and conflicts with the familiarity concepts seems to do not
always hold. We argue rather that there are situations when
the robot acts in a familiar way for the user. Here are our
arguments: the robot turns back to its charging station when
the user presses HOME button – this is in line with the
user’s expectations; the robot turns back to its charging
station when it is almost out of battery – the robot is at least
in line with the needs of its system for more resources; the
robot remembers the path and turns back to its charging
Robot state Example of situation Motion as
negative
feedback
Motion as
positive
feedback
Motion as
homeostatic
feedback
Motion as
archival
feedback
1) The robot is
still
The robot stands still. X
The user presses the button, but nothing happens. X X
2) The robot is
transitioning
from a still state to a
motion state
(transition feedback)
The user presses the CLEAN button and the robot moves around cleaning.
X X
The robot starts moving around by itself without being enacted by the user.
X X
3) The robot is
going from a motion state
to a still state
(transition feedback)
The robot turns back to its charging station when the user presses HOME button.
X X
The robot turns back to its charging station when it is almost out of battery.
X X X
The robot remembers the path and turns back to its charging
station after finishing cleaning.
X X
The robot gets stuck and enacts the users through indirect or
invisible feedback to do facilitation work.
X X
4) The robot is
in motion
Motion feedback manifested through noise.
X X X
The robot remembers the map of the rooms when is not running
for the first time in the area (coherent navigation).
X X X
The motion of the robot is incoherent (it only cleans a small
surface, without navigating the whole area).
X X
The robot escapes (e.g., the navigation path of the robot does
not respect the boundaries).
X X

85
International Journal on Advances in Software, vol 12 no 1 & 2, year 2019, http://www.iariajournals.org/software/
2019, © Copyright by authors, Published under agreement with IARIA - www.iaria.org
station after finishing cleaning – the robot is acting in a
familiar way to user’s expectations, it acts accordingly after
finishing its job.
Further, in this section, we have followed Turner (2011),
of making sense everyday examples of interacting with
technology, the readiness of coping with it in everyday life
situations [58]. This sense-making lead us to a mapping
between polarity feedback (positive or negative),
homeostatic feedback, and archival feedback to motion as
feedback. In addition, we observed that doing this mapping
by using the states of a robot, still and in motion, and their
corresponding transitions, we could define the transition
feedback type. We have also observed that different
feedback for different states can trigger emotions (positive
or negative) in the user. If we follow the idea that the
interaction is a form of dialogue’ with the technology, we
are still concerned that current design remains unfamiliar to
the user in specific situations, regardless if the user is
experienced or not. To come back to Suchman’s (1986) idea
that a “tool must communicate”, and that “the artifact
should be self-evident” [44, 14-15], it seems that our artifact,
tool, and machine, the robot, was not able to communicate in
a number of situations that we illustrated based on our
empirical data. This problem of unfamiliarity, as opposed to
familiarity, reveals a deeper underlying problem: “the
problem of deciphering an artifact defines the problem of the
designer as well.” [44, 14-15].
If the robot does not follow a familiar way of navigating a
space, responding to the user’s expectations, this may lead,
in the case of the elderly and their use of a safety alarm
robot, to additional falls for them. A concrete example is
when the robot transitions from a still state to a motion state,
without giving any feedback to the user, besides the
feedback in the form of transition motion feedback, and
noise as homeostatic feedback. Falls amongst elderly is a
well-known problem [88]. The situation presented above
may lead the user to additional falls if the user is not aware
of the transition and homeostatic feedback. Introducing a
robot that does not respond accordingly, by giving negative
feedback, being it homeostatic or archival, may have
negative consequences on the user. Further, the report about
falls amongst the elderly shows that fall may lead to fear of
falling, and other negative physical and mental health
consequences [88]. The literature also shows that falls
amongst elderly people (≥65 years old) are very common,
and hospitalized due to fall injuries seem to occur five times
more than due to other causes [89]. Another problem with
the motion as feedback is when the robot escapes. In the
situation of the use of a robot in the home, e.g. a safety alarm
robot for the elderly, such a type of negative and homeostatic
feedback may lead to a non-detected fall. The situation of the
robot getting stuck, as negative and homeostatic motion
feedback, may also lead in a real situation to a non-detected
fall, and in other implications for the user: bending over to
move the robot.
Lastly, we can say that looking at the motion as feedback
with the help of familiarity concept contributed to understand
the potential challenges and implications when introducing a
robot in the homes of the independent living elderly.
Moreover, it also contributed to map and discusses motion as
a positive, negative, homeostatic, archival, and transition
motion feedback.
VIII. CONCLUSION AND FUTURE WORK
In this paper, we have presented motion as feedback
through empirical data from an explorative study of semi-
autonomous robots used in domestic settings. We started the
Figure 8. Motion as feedback based on the semi-autonomous robot’s states
Figure 8. Motion as feedback based on the semi-autonomous robot’s states

86
International Journal on Advances in Software, vol 12 no 1 & 2, year 2019, http://www.iariajournals.org/software/
2019, © Copyright by authors, Published under agreement with IARIA - www.iaria.org
paper by stating our research questions, introducing some
terminology and the background for this study. In Section
II, we gave an account on the state-of-the-art. Section III
introduced the reader to the concept of feedback within
HCI, where it often is understood and designed as visual,
auditory, haptic, or textual. We drew attention upon the
significance of the use of natural language when interacting
with computers, or designing feedback, dating back to the
work of Suchman (1985) [41][44]. We elaborated on
polarity-, homeostatic, and archival feedback based on the
existent literature. We briefly described motion as feedback
based on robot navigation. We have framed feedback from a
smartphone app and semi-autonomous robot technology, to
be able to discuss robot’s motion as feedback, and
differentiate it from feedback received from stationary
technology, we have framed feedback from smartphone app
and semi-autonomous robot technology.
Further, in Section IV, we have elaborated on our
theoretical foundations, explaining the familiarity concept.
Section V illustrated in detail the methodology and methods
for this study, including the ethical aspects. In Section VI,
we have presented our findings structured in: the user
receives feedback from a smartphone technology; the user
receives distributed feedback from a robot - mediated via an
app; and motion as feedback and its implications for the user.
Finally, in Section VII, we discussed the motion as feedback:
the role of familiarity for the emotions triggered by the
engagement with the technology, discussing how feedback
can support familiarity with technology; and making sense of
the motion as feedback, based on polarity-, homeostatic-, and
archival feedback. The transitioning feedback emerged here.
We continued by discussing familiarity with the motion as
feedback. We argue that having familiarity in mind when
designing new technologies, can make it easier for the user
to know-how to use the technology.
Our conclusion is that a semi-autonomous robot
technology can become more familiar to the user if it
triggers (more often) positive feelings in the user (than
negative feelings). Finally, from a System Engineering
perspective, following HCI requirements derive from the
findings: if its motion is coherent, if its navigation is
appropriate to the situation (e.g., going back to the charging
station when it is out of battery, not getting stuck,
remembering the map of the rooms to be navigated, without
“escaping”), and if its motion is not disturbing or
interrupting the user (e.g., when taking a phone call, or
when eating). Taking a being-with approach to familiarity
for semi-autonomous robot technology to make sense of the
robot’s motion helped us in being able to distinguish
amongst motion as positive, negative, homeostatic, archival,
and transitioning feedback. This approach changed how we
view that the participants engaged with the technology: it
changed their routines at home through the enactment of
facilitation work, their schedule, their relationship with the
technology itself and with others that live or visit the same
home – once part of the home or one’s daily’s live, it
became a subject for discussion suddenly. It was part of
their everyday lives. However, we can conclude that
through making sense of motion as the feedback, we may
observe that the semi-autonomous robot was part of, but not
yet integrated within their homes and their daily lives. The
robot did not accommodate the participants, but rather, the
participants had to accommodate the robot. Familiarity was
defined as an intimate, close, and friendly state, or
interaction [81]. However, we showed through this study
that while using familiarity as a lens to analyze the
participants’ experiences with the semi-autonomous robot
technology, the relationship between the participants and the
robot remains unfamiliar in many situations. The robot still
remains in many situations un-familiar to the participants,
the know-how relationship is not fully developed, and the
participants do not always have tacit knowledge on how to
interact with it. Finally, the co-existence with such robots in
domestic settings is not fully developed yet. We can
conclude that familiarity per se plays a central role in
individuals’ relationships with technology [56].
Coming back to the State of the Art described in Section
II, this study supports the findings from the ACCOMPANY
project and Care-O-Bot robot [13][14][15][16]: many of the
elderly need support with the ADL. Specifically, the need
for support with the housekeeping related needs was
nevertheless present also in this study, along with the
findings from [19]. However, some of the studies made with
the robots used in Robot-Era Project [3], ACCOMPANY
[13][14], MARIO, EURON RoboEthics Roadman, EP6,
ETHICBOTS, BREATHE, or ICT & Ageing Project [18]
were centering their focus around the functionalities of the
robot, and the user acceptance of the robots. These robots
were also specifically designed for home care of the elderly.
The studies made on the companion robots: PARO
[21][22][23], AIBO, Furby, NeCoRo [21][22], Pepper and
NAO [25], or Giraff [26] focused nevertheless on how a
robot may impact the elderly’s behavior across time. Many
of the studies used quantitative statistical data for the
evaluation of the robots. While this is nevertheless
important, our study provides an example on how existent
robots on the market can be used instrumentally in
explorative interpretative qualitative studies for
understanding more about the participants’ everyday
experiences, and how their daily activities may change when
introducing such robot in their homes. The study is
primarily about the lived experiences of the participants.
These experiences are instrumentally used as a foundation
for understanding more about design, design of robots for
their use at home, design implications of feedback, and
motion as feedback distributed or not via an app.
We suggest as future work to elaborate further on the
relationship between motion, transitioning motion feedback,
and the role of familiar feedback in engaging with
technology, rather than interacting with it. Further, one
could explore more the affordances of motion as feedback,
following the definition of affordances as given by [90], or

87
International Journal on Advances in Software, vol 12 no 1 & 2, year 2019, http://www.iariajournals.org/software/
2019, © Copyright by authors, Published under agreement with IARIA - www.iaria.org
as seen in HCI. Introducing moving technologies in the
home lays the foundation for further explorations. One way
to build further on this study is by conducting a quantitative
statistical study on the acceptance of the robots in the home,
on the movement types of robot, or by using the concept of
animacy as shown in [48]. Exploring the abstract concept of
feedback as a coordination mechanism and/or as a boundary
object is also of high interest and relevance for those
interested in theoretical anchored explorations. Another way
for continuing this study is by conducting a qualitative
interpretative study by analyzing the division of work tasks
and types of work performed by the human and the robot.
Here we encourage the analysis of work tasks and types of
works to be done by borrowing established concepts used
outside of HCI field, such as Computer Supported
Cooperative Work. Nevertheless, studying the boundaries
between when the interaction between the human and a
robot becomes a cooperation between the human and the
robot is of high relevance, especially now with faceless
interaction devices: conversational based devices on face- or
faceless interactions based mainly on speech, such as, e.g.,
Sophia the Robot, or with Google Home Mini.
Finally, this study was conducted to understand the
potential challenges (e.g., robot motion as feedback is not
understood by the participants, the robot motion enacts the
participants to do facilitation work, the robot escapes, etc.)
that may occur when introducing a robot in the homes of the
independent living elderly. Introducing modern technologies
in the homes of the elderly, such domestic robots requires
scrutiny of the design of current and eventual future
technologies that will be used by them. Understanding which
challenges the elderly encounter when they interact with a
semi-autonomous robot, in their everyday lives in domestic
settings, contributes to our understanding on potential
challenges on the future home care robots for the
independent living elderly.
ACKNOWLEDGMENTS
This work was part of the MECS project funded by the
Norwegian Research Council IKTPluss Program (Grant
agreement no: 247697). We would like to thank our project
funders, partners, especially to Kampen Omsorg Pluss, and
the project manager, Jim Tørresen. Special thanks to
colleagues Trenton Schulz, Fahd Newaz, and Rebekka Soma
for our time at KO++. Nevertheless, we would like to
warmly thank the reviewers for their time, effort, and
valuable input on making this work better.
REFERENCES
[1] D. Saplacan and J. Herstad, “Fear, Feedback, Familiarity...
How are These Connected? - Can familiarity as a design
concept applied to digital feedback reduce fear?,”
Proceedings of The Eleventh International Conference on
Advances in Computer-Human Interactions (ACHI). Mar-
2018.
[2] Dictionary.com, “Thesaurus.com | Meanings and
Definitions of Words at Thesaurus.com,” Thesaurus.com,
2016. [Online]. Available: http://www.thesaurus.com/,
http://www.thesaurus.com/. [Accessed: 26-Jul-2017].
[3] L. D. Riek, “Healthcare Robotics,” ACM Communications,
vol. 60. pp. 68–78, Nov-2017.
[4] S. Thrun, “Toward a Framework for Human-robot
Interaction,” Hum-Comput Interact, vol. 19, no. 1, pp. 9–24,
Jun. 2004.
[5] R. Soma, V. Dønnem Søyseth, M. Søyland, and T. Schulz,
“Facilitating Robots at Home: A Framework for
Understanding Robot Facilitation,” presented at the ACHI
2018, The Eleventh International Conference on Advances
in Computer-Human Interactions, 2018, pp. 1–6.
[6] J. S. Oskarsen, “Human-supported robot work,” Master
Thesis, University of Oslo, Department of Informatics,
Faculty of mathematics and natural sciences, Oslo, Norway,
2018.
[7] S. Bødker, “Third-Wave HCI, 10 Years Later—
Participation and Sharing,” interactions, vol. 22. ACM New
York, NY, USA, pp. 24–31, 2015.
[8] “MECS,” Multimodal Elderly Care Systems (MECS), About
the project, 17-Oct-2016. [Online]. Available:
http://www.mn.uio.no/ifi/english/research/groups/robin/rese
arch-projects/mecs/. [Accessed: 17-Oct-2016].
[9] P. B. Baltes and J. Smith, “New frontiers in the future of
aging: from successful aging of the young old to the
dilemmas of the fourth age,” Gerontology, vol. 49, no. 2,
pp. 123–135, Apr. 2003.
[10] D. Field and M. Minkler, “Continuity and change in social
support between young-old and old-old or very-old age,” J.
Gerontol., vol. 43, no. 4, pp. P100-106, Jul. 1988.
[11] T. T. Hewett et al., “ACM SIGCHI Curricula for Human-
Computer Interaction : 2. Definition and Overview of
Human-Computer Interaction.” ACM SIGCHI, 1996-1992.
[12] S. Bedaf, G. J. Gelderblom, and L. De Witte, “Overview
and Categorization of Robots Supporting Independent
Living of Elderly People: What Activities Do They Support
and How Far Have They Developed,” Assist. Technol. Off.
J. RESNA, vol. 27, no. 2, pp. 88–100, 2015.
[13] S. Bedaf, H. Draper, G.-J. Gelderblom, T. Sorell, and L. de
Witte, “Can a Service Robot Which Supports Independent
Living of Older People Disobey a Command? The Views of
Older People, Informal Carers and Professional Caregivers
on the Acceptability of Robots,” Int. J. Soc. Robot., vol. 8,
no. 3, pp. 409–420, Jun. 2016.
[14] F. Amirabdollahian et al., “Accompany: Acceptable
robotiCs COMPanions for AgeiNG Years —
Multidimensional aspects of human-system interactions,” in
2013 6th International Conference on Human System
Interactions (HSI), 2013, pp. 570–577.
[15] B. Graf, M. Hans, and R. D. Schraft, “Care-O-bot II—
Development of a Next Generation Robotic Home
Assistant,” Auton. Robots, vol. 16, no. 2, pp. 193–205, Mar.
2004.
[16] M. Hans and W. Baum, “Concept of a hybrid architecture
for Care-O-bot,” in Proceedings 10th IEEE International
Workshop on Robot and Human Interactive
Communication. ROMAN 2001 (Cat. No.01TH8591), 2001,
pp. 407–411.
[17] B. Graf, “Reactive navigation of an intelligent robotic
walking aid,” in Proceedings 10th IEEE International
Workshop on Robot and Human Interactive

88
International Journal on Advances in Software, vol 12 no 1 & 2, year 2019, http://www.iariajournals.org/software/
2019, © Copyright by authors, Published under agreement with IARIA - www.iaria.org
Communication. ROMAN 2001 (Cat. No.01TH8591), 2001,
pp. 353–358.
[18] H. Felzmann, K. Murphy, D. Casey, and O. Beyan, “Robot-
assisted care for elderly with dementia: is there a potential
for genuine end-user empowerment?,” in The Emerging
Policy and Ethics of Human Robot Interaction, Portland,
Oregon, USA, 2015.
[19] L. Pigini, D. Facal, L. Blasi, and R. Andrich, “Service
robots in elderly care at home: Users’ needs and perceptions
as a basis for concept development,” Technol. Disabil., vol.
24, no. 4, pp. 303–311, 2012.
[20] J. Forlizzi and C. DiSalvo, “Service Robots in the Domestic
Environment: A Study of the Roomba Vacuum in the
Home,” in Proceedings of the 1st ACM SIGCHI/SIGART
Conference on Human-robot Interaction, New York, NY,
USA, 2006, pp. 258–265.
[21] S. A. McGlynn, S. Kemple, T. L. Mitzner, C.-H. A. King,
and W. A. Rogers, “Understanding the potential of PARO
for healthy older adults,” Int. J. Hum.-Comput. Stud., vol.
100, pp. 33–47, Apr. 2017.
[22] K. Wada, Y. Takasawa, and T. Shibata, “Robot therapy at
facilities for the elderly in Kanagawa prefecture - a report
on the experimental result of the first month,” in The 23rd
IEEE International Symposium on Robot and Human
Interactive Communication, 2014, pp. 193–198.
[23] L. Giusti and P. Marti, “Interpretative Dynamics in Human
Robot Interaction,” in ROMAN 2006 - The 15th IEEE
International Symposium on Robot and Human Interactive
Communication, 2006, pp. 111–116.
[24] K. Wada and T. Shibata, “Robot Therapy in a Care House -
Change of Relationship among the Residents and Seal
Robot during a 2-month Long Study,” in RO-MAN 2007 -
The 16th IEEE International Symposium on Robot and
Human Interactive Communication, 2007, pp. 107–112.
[25] J. Hoefinghoff, A. R. der Pütten, J. Pauli, and N. Krämer,
“‘Yes Dear, that Belongs into the Shelf!’ - Exploratory
Studies with Elderly People Who Learn to Train an
Adaptive Robot Companion,” in Social Robotics, 2015, pp.
235–244.
[26] J. González-Jiménez, C. Galindo, and J. R. Ruiz-Sarmiento,
“Technical improvements of the Giraff telepresence robot
based on users’ evaluation,” in 2012 IEEE RO-MAN: The
21st IEEE International Symposium on Robot and Human
Interactive Communication, 2012, pp. 827–832.
[27] A. Cesta, G. Cortellessa, A. Orlandini, and L. Tiberio,
“Long-Term Evaluation of a Telepresence Robot for the
Elderly: Methodology and Ecological Case Study,” Int. J.
Soc. Robot., vol. 8, no. 3, pp. 421–441, Jan. 2016.
[28] eurostat, “Population structure and ageing - Statistics
Explained,” Population structure and ageing, 20-Jul-2017.
[Online]. Available: http://ec.europa.eu/eurostat/statistics-
explained/index.php/Population_structure_and_ageing.
[Accessed: 20-Jul-2017].
[29] ssb, “Next million reached set to be the fastest,” ssb.no,
2017. [Online]. Available:
http://www.ssb.no/en/befolkning/statistikker/folkfram/aar/2
016-06-21. [Accessed: 20-Jul-2017].
[30] M. Forzati and C. Mattson, “Effekter av digitala tjänster för
äldrevård - ekonomisk studie,” ssnf.org, acr057005, Jan.
2014.
[31] J. Ramm, “Health and care. Use of services among the
elderly,” ssb.no, 2013. [Online]. Available:
http://www.ssb.no/en/helse/artikler-og-publikasjoner/eldres-
bruk-av-helse-og-omsorgstjenester. [Accessed: 20-Jul-
2017].
[32] European Commision, “eHealth Action Plan 2012-2020:
Innovative healthcare for the 21st century,” Digital Single
Market, 07-Dec-2012. [Online]. Available:
https://ec.europa.eu/digital-single-market/en/news/ehealth-
action-plan-2012-2020-innovative-healthcare-21st-century.
[Accessed: 20-Jul-2017].
[33] J. A. Delello and R. R. McWhorter, “Reducing the Digital
Divide: Connecting Older Adults to iPad Technology,” J.
Appl. Gerontol., vol. 36, no. 1, pp. 3–28, Jan. 2017.
[34] Y.-H. Wu, S. Damnée, H. Kerhervé, C. Ware, and A.-S.
Rigaud, “Bridging the digital divide in older adults: a study
from an initiative to inform older adults about new
technologies,” Clin. Interv. Aging, vol. 10, pp. 193–201,
Jan. 2015.
[35] T. Halbach and T. Schulz, “MobileSage - A Prototype
Based Case Study for Delivering Context-Aware,
Personalized, On-Demand Help Content,” presented at the
CENTRIC 2013, The Sixth International Conference on
Advances in Human oriented and Personalized
Mechanisms, Technologies, and Services, 2014, vol.
International Journal on Advances in Intelligent Systems, 7,
nos. 1–2, pp. 267–278.
[36] M. Anerson and A. Perrin, “1. Technology use among
seniors,” Pew Research Center: Internet, Science & Tech,
17-May-2017. .
[37] B. Shneiderman, Designing the User Interface: Strategies
for Effective Human-computer Interaction. Boston, MA,
USA: Addison-Wesley Longman Publishing Co., Inc.,
1986.
[38] E. Wong, “Shneiderman’s Eight Golden Rules Will Help
You Design Better Interfaces,” The Interaction Design
Foundation, 2019. [Online]. Available:
https://www.interaction-
design.org/literature/article/shneiderman-s-eight-golden-
rules-will-help-you-design-better-interfaces. [Accessed: 07-
Feb-2019].
[39] D. Saplacan and J. Herstad, “A Quadratic Anthropocentric
Perspective on Feedback - Using Proxemics as a
Framework,” Conference Proceedings of BritishHCI 2017.
Sunderland, U.K., 03-Jul-2017.
[40] D. A. Norman, The design of everyday things, Revised and
expanded edition. New York, New York: Basic Books,
2013.
[41] I. Apple Computer, Macintosh Human Interface Guidelines.
USA: Addison-Wesley Publishing Company, 1992.
[42] A. Spink and T. Saracevic, “Human-computer interaction in
information retrieval: nature and manifestations of
feedback,” Interact. Comput., vol. 10, no. 3, pp. 249–267,
Jun. 1998.
[43] M. A. Pérez-Quiñones and J. L. Sibert, “A Collaborative
Model of Feedback in Human-computer Interaction,” in
Proceedings of the SIGCHI Conference on Human Factors
in Computing Systems, New York, NY, USA, 1996, pp.
316–323.
[44] L. Suchman, Plans and situated actions: The problem of
human-machine communication. Palo Alto, California
94304: Xerox Corporation Palo Alto Research Centers,
1985.

89
International Journal on Advances in Software, vol 12 no 1 & 2, year 2019, http://www.iariajournals.org/software/
2019, © Copyright by authors, Published under agreement with IARIA - www.iaria.org
[45] P. Dourish, “What we talk about when we talk about
context,” Pers. Ubiquitous Comput., vol. 8, no. 1, pp. 19–
30, Feb. 2004.
[46] K. Renaud and R. Cooper, “Feedback in human-computer
interaction - characteristics and recommendations,” South
Afr. Comput. J., vol. 2000, no. 26, pp. 105–114, Nov. 2000.
[47] T. Ingold, The perception of the environment: essays on
livelihood, dwelling and skill. London ; New York:
Routledge, Taylor & Francis Group, 2011.
[48] T. Schulz, J. Torresen, and J. Herstad, “Animation
Techniques in Human-Robot Interaction User Studies: a
Systematic Literature Review,” ArXiv181206784 Cs, Dec.
2018.
[49] E. T. Hall, The hidden dimension. New York: Anchor
Books, 1990.
[50] J. Beck and E. Stolterman, “Examining Practical, Everyday
Theory Use in Design Research,” She Ji J. Des. Econ.
Innov., vol. 2, no. 2, pp. 125–140, Jun. 2016.
[51] M. Heidegger, Being and time. Oxford, U.K.: Blackwell
Publishers Ltd, 1967.
[52] “familiarity, n.,” OED Online. Oxford University Press.
[53] H. Dreyfus, Being-in-the-world: A Commentary on
Heidegger’s Being and Time, Division I. Massachusetts
Institute of Technology, 1991.
[54] N. Backhaus, A. K. Trapp, and M. Thüring, “Skeuomorph
Versus Flat Design: User Experience and Age-Related
Preferences,” in Design, User Experience, and Usability:
Designing Interactions, 2018, pp. 527–542.
[55] P. Turner, How We Cope with Digital Technology. San
Rafael: Morgan & Claypool Publishers, 2013.
[56] G. Van de Walle, P. Turner, and E. Davenport, “A study of
familiarity,” in Human-Computer Interaction-INTERACT,
2003, vol. 3, pp. 463–70.
[57] P. Turner, “Towards an account of intuitiveness,” Behav.
Inf. Technol., vol. 27, no. 6, pp. 475–482, Nov. 2008.
[58] P. Turner, “Everyday Coping: The Appropriation of
Technology,” in Proceedings of the 29th Annual European
Conference on Cognitive Ergonomics, New York, NY,
USA, 2011, pp. 127–133.
[59] P. Turner, “Being-with: A study of familiarity,” Interact.
Comput., vol. 20, no. 4, pp. 447–454, Sep. 2008.
[60] P. Turner and G. van de Walle, “Familiarity as a basis for
universal design,” Gerontechnology, vol. 5, no. 3, pp. 150–
159, Jan. 2006.
[61] J. Herstad and H. Holone, “Making Sense of Co-creative
Tangibles Through the Concept of Familiarity,” in
NORDICHI’12, Proceedings of the 7th Nordic Conference
on Human-Computer Interaction: Making Sense Through
Design, New York, NY, USA, 2012, pp. 89–98.
[62] M. Myers D., “Qualitative Research in Information
Systems,” MISQ Discovery, 1997.
[63] P. Ricoeur, “Phenomenology and Hermeneutics,” Noûs, vol.
9, no. 1, pp. 85–102, 1975.
[64] S. G. Joshi, “Designing for Experienced Simplicity. Why
Analytic and Imagined Simplicity Fail in Design of
Assistive Technology,” Int. J. Adv. Intell. Syst., vol. 8, no. 3
and 4, pp. 324–338, Dec. 2015.
[65] S. G. Joshi, “Designing for Capabilities: A
Phenomenological Approach to the Design of Enabling
Technologies for Older Adults,” 2017.
[66] R. B. Rosseland, “Exploring Movement-Based Rhythmic
Interaction with Senior Citizens,” University of Oslo,
Department of Informatics, Faculty of mathematics and
natural sciences, Oslo, Norway, 2018.
[67] A. Woll, “use of Welfare Technology in Elderly Care,”
University of Oslo, Oslo, Norway, 2017.
[68] S. G. Joshi and T. Bratteteig, “Assembling Fragments into
Continuous Design: On Participatory Design with Old
People,” in Nordic Contributions in IS Research, 2015, pp.
13–29.
[69] iRobot Corporation, “Roomba Robot Vacuum | iRobot.”
[Online]. Available: http://www.irobot.com/For-the-
Home/Vacuuming/Roomba.aspx. [Accessed: 22-Mar-2017].
[70] G. Verne, “‘The winners are those who have used the old
paper form’. On citizens and automated public services,”
University of Oslo, Oslo, Norway, 2015.
[71] S. Ottenberg, “Thirty Years of Fieldnotes: Changing
Relationships to the text,” in The Making of Anthropology,
R. Sanjek, Cornell University Press, 1990, pp. 139–160.
[72] M. Crang and I. Cook, Doing Ethnographies. SAGE
Publications, Inc., 2007.
[73] V. Braun and V. Clarke, “Using thematic analysis in
psychology,” Qual. Res. Psychol., vol. 3, no. 2, pp. 77–101,
Jan. 2006.
[74] R. M. Emerson, R. I. Fretz, and L. L. Shaw, “Processing
Fieldnotes: Coding and Memoing (Chapter 6),” in Writing
Etnographic Fieldnotes, Chigago and London: University
of Chicago Press, 1995, pp. 142–168.
[75] J. Lazar, J. H. Feng, and H. Hochheiser, Research Methods
In Human-Computer Interaction. West Sussex, United
Kingdom: Jon Wiley & Sons Ltd, 2010.
[76] W. J. Austin, How to do things with words. Great Britain,
Guernesey, Channel Islands: Oxford University Press, 1962.
[77] Online Etymology Dictionary, “emotion,” 15-Feb-2019.
[Online]. Available:
https://www.etymonline.com/word/emotion. [Accessed: 15-
Feb-2019].
[78] Online Etymology Dictionary, “motion | Search Online
Etymology Dictionary,” 15-Feb-2019. [Online]. Available:
https://www.etymonline.com/search?q=motion. [Accessed:
15-Feb-2019].
[79] Online Etymology Dictionary, “locomotion,” 15-Feb-2019.
[Online]. Available:
https://www.etymonline.com/word/locomotion. [Accessed:
15-Feb-2019].
[80] J. Raskin, “Viewpoint: Intuitive Equals Familiar,” Commun
ACM, vol. 37, no. 9, pp. 17–18, Sep. 1994.
[81] OED, “fear, n.1,” Oxford Engglish Dictionary Online.
Oxford University Press, 2017.
[82] Y. A. A. Strengers, “Designing Eco-feedback Systems for
Everyday Life,” in Proceedings of the SIGCHI Conference
on Human Factors in Computing Systems, New York, NY,
USA, 2011, pp. 2135–2144.
[83] P. Turner, “The Anatomy of Engagement,” in Proceedings
of the 28th Annual European Conference on Cognitive
Ergonomics, New York, NY, USA, 2010, pp. 59–66.
[84] L. Suchman, J. Blomberg, J. E. Orr, and R. Trigg,
“Reconstructing Technologies as Social Practice,” Am.
Behav. Sci., vol. 43, no. 3, pp. 392–408, Nov. 1999.
[85] R. Picking, V. Grout, J. McGinn, J. Crisp, and H. Grout,
“Simplicity, Consistency, Universality, Flexibility and
Familiarity: The SCUFF Principles for Developing User
Interfaces for Ambient Computer Systems,” Int. J. Ambient
Comput. Intell. IJACI, vol. 2, no. 3, pp. 40–49, 2010.

90
International Journal on Advances in Software, vol 12 no 1 & 2, year 2019, http://www.iariajournals.org/software/
2019, © Copyright by authors, Published under agreement with IARIA - www.iaria.org
[86] L. L. Constantine and L. A. D. Lockwood, Software for
Use: A Practical Guide to the Models and Methods of
Usage-Centered Design, 1 edition. Boston, Mass.: Addison-
Wesley Professional, 1999.
[87] J. Nielsen, “10 Usability heuristics.” Nielsen, Jakob, 2005.
[88] “Seniors’ falls in Canada - protecting Canadians from
Illness,” Ministery of Health, Canada, Second Edition,
2014.
[89] A. Danielsen, H. Olofsen, and B. A. Bremdal, “Increasing
fall risk awareness using wearables: A fall risk awareness
protocol,” J. Biomed. Inform., vol. 63, pp. 184–194, Oct.
2016.
[90] J. J. Gibson, The ecological approach to visual perception.
New York, London: Psychology Press, 2015.
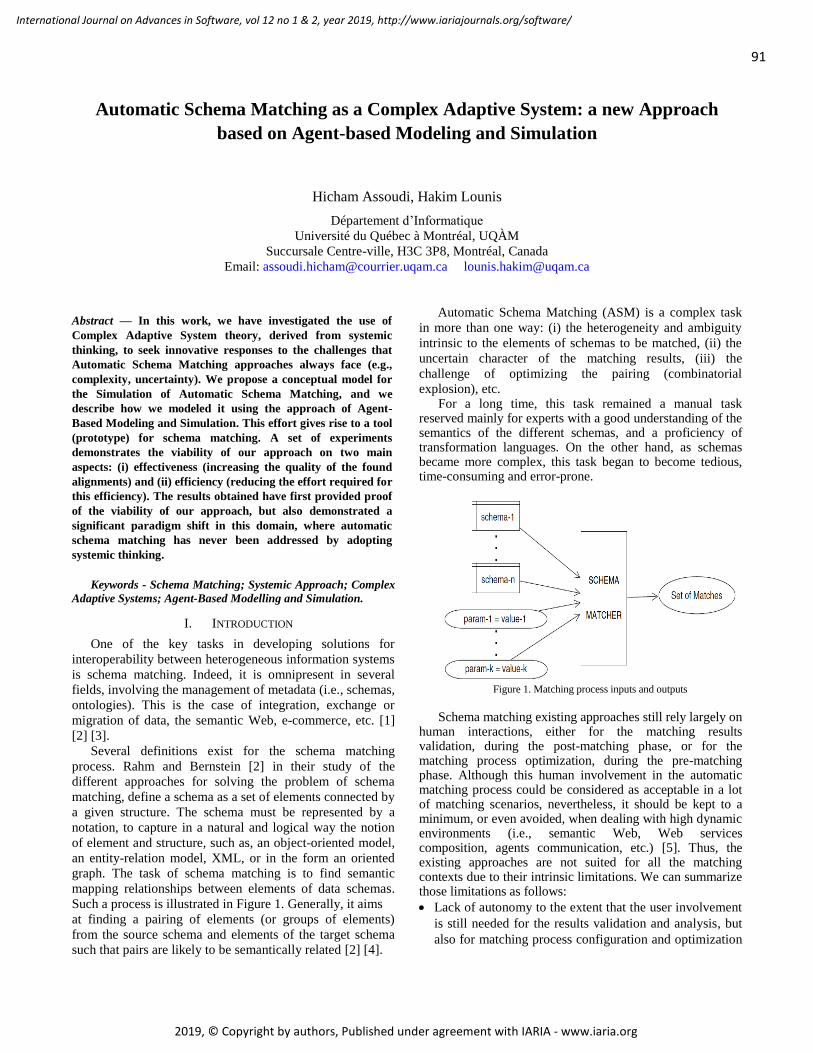
91
International Journal on Advances in Software, vol 12 no 1 & 2, year 2019, http://www.iariajournals.org/software/
2019, © Copyright by authors, Published under agreement with IARIA - www.iaria.org
Automatic Schema Matching as a Complex Adaptive System: a new Approach
based on Agent-based Modeling and Simulation
Hicham Assoudi, Hakim Lounis
Département d’Informatique
Université du Québec à Montréal, UQÀM
Succursale Centre-ville, H3C 3P8, Montréal, Canada
Email: [email protected] [email protected]
Abstract — In this work, we have investigated the use of
Complex Adaptive System theory, derived from systemic
thinking, to seek innovative responses to the challenges that
Automatic Schema Matching approaches always face (e.g.,
complexity, uncertainty). We propose a conceptual model for
the Simulation of Automatic Schema Matching, and we
describe how we modeled it using the approach of Agent-
Based Modeling and Simulation. This effort gives rise to a tool
(prototype) for schema matching. A set of experiments
demonstrates the viability of our approach on two main
aspects: (i) effectiveness (increasing the quality of the found
alignments) and (ii) efficiency (reducing the effort required for
this efficiency). The results obtained have first provided proof
of the viability of our approach, but also demonstrated a
significant paradigm shift in this domain, where automatic
schema matching has never been addressed by adopting
systemic thinking.
Keywords - Schema Matching; Systemic Approach; Complex
Adaptive Systems; Agent-Based Modelling and Simulation.
I. INTRODUCTION
One of the key tasks in developing solutions for
interoperability between heterogeneous information systems
is schema matching. Indeed, it is omnipresent in several
fields, involving the management of metadata (i.e., schemas,
ontologies). This is the case of integration, exchange or
migration of data, the semantic Web, e-commerce, etc. [1]
[2] [3].
Several definitions exist for the schema matching
process. Rahm and Bernstein [2] in their study of the
different approaches for solving the problem of schema
matching, define a schema as a set of elements connected by
a given structure. The schema must be represented by a
notation, to capture in a natural and logical way the notion
of element and structure, such as, an object-oriented model,
an entity-relation model, XML, or in the form an oriented
graph. The task of schema matching is to find semantic
mapping relationships between elements of data schemas.
Such a process is illustrated in Figure 1. Generally, it aims
at finding a pairing of elements (or groups of elements)
from the source schema and elements of the target schema
such that pairs are likely to be semantically related [2] [4].
Automatic Schema Matching (ASM) is a complex task
in more than one way: (i) the heterogeneity and ambiguity
intrinsic to the elements of schemas to be matched, (ii) the
uncertain character of the matching results, (iii) the
challenge of optimizing the pairing (combinatorial
explosion), etc. For a long time, this task remained a manual task
reserved mainly for experts with a good understanding of the semantics of the different schemas, and a proficiency of transformation languages. On the other hand, as schemas became more complex, this task began to become tedious, time-consuming and error-prone.
Figure 1. Matching process inputs and outputs
Schema matching existing approaches still rely largely on
human interactions, either for the matching results validation, during the post-matching phase, or for the matching process optimization, during the pre-matching phase. Although this human involvement in the automatic matching process could be considered as acceptable in a lot of matching scenarios, nevertheless, it should be kept to a minimum, or even avoided, when dealing with high dynamic environments (i.e., semantic Web, Web services composition, agents communication, etc.) [5]. Thus, the existing approaches are not suited for all the matching contexts due to their intrinsic limitations. We can summarize those limitations as follows:
Lack of autonomy to the extent that the user involvement
is still needed for the results validation and analysis, but
also for matching process configuration and optimization

92
International Journal on Advances in Software, vol 12 no 1 & 2, year 2019, http://www.iariajournals.org/software/
2019, © Copyright by authors, Published under agreement with IARIA - www.iaria.org
(tuning) to improve the matching result quality and then
reduce uncertainty.
Lack of adaptation in sense that the optimization task of
the matching tool must be repeated and adapted
manually, for every new matching scenario.
Thus, we were motivated to investigate other paradigms
to approach the issue of ASM, as a complex subject
appropriate for an approach, which would allow to see this
problematic as a whole, that is, as a system whose
execution, configuration, and optimization depend not only
on the different components of the system, but also on
taking into account the relationships and interactions
between these components. We try to answer the following
general question: “How can we, with the help of a generic
approach, better manage complexity and uncertainty
inherent to the automatic matching process in general, and
in the context of dynamic environments (minimal
involvement of the human expert)?”
More specifically, we asked the following questions:
(i) How can we model the complexity of the matching
process to help reduce uncertainty?
(ii) How can we provide the matching process of
autonomy and adaptation properties with the aim to make
the matching process able to adapt to each matching
scenario (self-optimize)?
(iii) What would be the theoretical orientation that may
be adequate to respond to the above questions?
In our work, we have investigated the use of the theory
of Complex Adaptive System (CAS) emanating from
systemic thinking, to seek, far from the beaten path,
innovative responses to the challenges faced by classical
approaches for automatic schema matching, (e.g.,
complexity, uncertainty). The central idea of our work is to
consider the process of matching as a CAS and to model it
using the approach of Agent-Based Modeling and
Simulation (ABMS). The aim being the exploitation of the
intrinsic properties of the agent-based models, such as
emergence, stochasticity, and self-organization, to help
provide answers to better manage complexity and
uncertainty of Schema Matching.
Thus, we propose a conceptual model for a multi-agent
simulation for schema matching called Schema Matching as
Multi-Agents Simulation (SMAS). The implementation of
this conceptual model has given birth to a prototype for
schema matching (Reflex-SMAS).
Our prototype Reflex-SMAS was submitted to a set of
experiments, to demonstrate the viability of our approach
with respect to two main aspects: (i) effectiveness
(increasing the quality of the found matchings), and (ii)
efficiency (reducing the effort required for this efficiency).
The results came to demonstrate the viability of our
approach, both in terms of effectiveness or that of
efficiency.
The empirical evaluation results, as we are going to
show in Section IV of this paper, were very satisfactory for
both effectiveness (correct matching results found) and
efficiency (no optimization needed to get good result from
our tool).
The current paper is organized as follows: Section II
discusses schema matching through a state of the art that
identifies the important factors affecting the schema
matching process. Section III presents the chosen paradigm
to address the problem. Section IV shows the results
obtained by our approach, and how we can compare them to
those obtained in other works. Finally, the last section
concludes and summarizes this work.
II. CURRENT APPROACHES OF SCHEMA MATCHING
The schema matching process is often used as a
prerequisite for solving other issues, such as data integration
or exchange. Indeed, as part of a process of integration or
exchange of data, the matching process becomes the task
that is responsible for finding an alignment that is
semantically equivalent between a source schema and a
destination schema. This alignment, in the case of data
integration for example, will participate in finding "answers
to requests" made to several disparate data sources by
consolidating the schemas of these disparate sources into a
common schema (i.e., a global scheme). In the case of data
exchange, finding an alignment between a source schema
and a target one serves for the exchange of data between
heterogeneous enterprise systems or applications (such as
Enterprise Resource Planning systems, databases, or legacy
systems) by helping transform data from the source system
format to the target system format.
Generally, Schema Matching is a manual task reserved
for human experts with a good understanding of the
semantics of different schemas. However, this task can be a
tedious, time-consuming and error-prone task.
For many years, several researches have investigated the
problematic of automating the task of Schema Matching
(including matching ontologies). The main goal is the
development of techniques (algorithms, tools, etc.) allowing
the automatic or semi-automatic discovery of the
correspondences between the elements.
Many algorithms and approaches were proposed to deal
with the problem of schema matching and mapping [2][6]-
[16]. Although the existing schema matching tools comprise
a significant step towards fulfilling the vision of automated
schema matching, it has become obvious that the user must
accept a degree of imperfection in this process. A prime
reason for this is the enormous ambiguity and heterogeneity
of schema element names (descriptions). Thus, it could be
unrealistic to expect a matching process to identify the
correct matchings for any possible element in a schema [17]
[18].

93
International Journal on Advances in Software, vol 12 no 1 & 2, year 2019, http://www.iariajournals.org/software/
2019, © Copyright by authors, Published under agreement with IARIA - www.iaria.org
Despite the profusion of approaches, human
involvement is always required, for the automatic matching
process itself, or for the optimization of the performances.
They also rely largely on immediate human interaction for
the validation of the result of the process, or for
configuration/optimization of the process during the pre-
matching phase. This human interaction is generally
conceivable for many contexts; on the other hand, in other
contexts where environments are highly dynamic (e.g.,
semantic Web, composition of Web services,
communication between agents), expert involvement must
be reduced to a minimum.
The vision of a complete automation of the matching
process of schemes is compromised by a human
involvement.
A comprehensive literature review, of the existing
matching tools and approaches, allowed us to identify the
most important factors affecting, in our opinion, the schema
matching process. Moreover, some causal relationships,
between those different factors, participating to the schema
matching difficulties and challenges, were identified.
Figure 2. Schema Matching impacting factors causality diagram
As shown in Figure 2, the factors influencing the
Schema Matching are:
Heterogeneity: in general, the task of matching involves
semantics (understanding the context) to have complete
certainty about the quality of the result. The main
challenge in all cases of automatic matching is to decide
the right match. This is a very difficult task mainly
because of the heterogeneity of the data.
Uncertainty: the cause for this uncertainty lies mainly in
the ambiguity and heterogeneity, both syntactic, and
semantic, which often characterize the Schema Elements
to match.
Optimization: the uncertainty about the matching results
implies the optimization of the process to improve the
matching quality, and the testing of different
combinations (e.g., different Similarity Measures,
Aggregate Functions, and Matching Selection Strategies).
Each step of the matching process involves choosing
between multiple strategies, which leads to a
combinatorial explosion (complexity).
Complexity: the matching process optimization generates
complexity because of the search space (combinatorial
explosion). In addition, changing matching scenarios
exacerbates this complexity to the extent that the result of
the optimization often becomes obsolete with changing
scenarios.
One of the commonalities between all existing
approaches is the thinking behind these approaches, namely,
reductionism (as opposed to holism). The reductionist
thinking is a very common and efficient thinking approach.
It is at the basis of the almost totality of previous schema
matching approaches, and then, on their characteristics that
are, in our view, the root causes preventing the automatic
matching schemes to cope fully with the challenges and
difficulties.
Reductionism, as opposed to systemic (holism), is a
philosophical concept that refers both to the way of thinking
solutions as well as to their modeling methodology (Figure
3). Reductionism advocates reducing system complexity or
phenomenon to their basic elements, which would then be
easier to understand and study [19]. This reductionist
approach, despite its high efficacy in several areas, shows,
however, its limits within certain contexts. In fact, for
explaining certain phenomena or solving certain problems,
the approach consisting of reducing or abstracting the reality
to a linearization of simple relationships of causes and
effects between a complex system underlying fundamental
components, appears as a highly limiting and simplifying
approach.
Figure 3. Reductionism vs. Holism
With regard to schema matching, it seems clear, as
Figure illustrates it, that all current approaches follow the
reductionist thinking. They abstract the matching process to
a linear function with a set of inputs and outputs. This
function is decomposed into a series of modules, each of

94
International Journal on Advances in Software, vol 12 no 1 & 2, year 2019, http://www.iariajournals.org/software/
2019, © Copyright by authors, Published under agreement with IARIA - www.iaria.org
which is responsible for the running of a stage of the process
(e.g., selection and matching execution). In fact, the matching process can be summarized to three
important steps: (i) the stage of selection and execution of the matchers (calculation of similarities), (ii) the stage of the combination of the results (the best similarity scores) based on aggregation functions, and finally (iii), the step of the selection of the alignment (selection of the most promising matches) based on thresholds or maximums.
So, in order to solve the automatic Schema Matching problem, the existing solutions are adopting a linear and analytical approach. At each stage of the matching process, problems are analyzed and broken down into sub problems and then for each specific sub-problem, dedicated and specific solution are proposed.
Some fundamental and intrinsic characteristics, common
to all current Schema Matching systems, may partially
explain their inability to overcome the limitation of the
complexity and other challenges, such as uncertainty. Those
characteristics are declined as following: these systems are
(i) complicated and not complex, (ii) linear (analytical,
deterministic and predictable) and not non-linear, (iii)
centralized rather than decentralized (parallelism and
emerging solutions), (iv) and finally, configurable and not
adaptable (self-configuration, self-optimization).
Figure 4. Generic Schema Matching process (linear process with an
analytical-based resolution)
We can, thus, postulate that the Reductionist school of thought, leading to complicated and not complex systems, could be the root cause that prevents existing approaches
from coping with the challenges of uncertainty and complexity.
The need to explore new approaches to make systemic and holistic responses to the problems of matching leads us to raise the question: how can we have a matching solution that could give us high-quality matching results, for different matching scenarios and this with a minimal optimization effort from the end-user?
Our premise is that a good part of the answer may come
from the theory of CAS where modeling the complexity of
adaptation and evolution of the systems is at the heart of this
theory. Having a schema matching approach that can face
and overcome the challenges facing the existing schema
matching tools requires, in our view, a paradigm shift,
placing the notions of adaptation, evolution, and self-
organization at its center. We strongly believe that the theory
of CAS, which is exploited to explain some biological,
social, and economic phenomena, can be the basis of a
programming paradigm for ASM tools.
Our hypothesis is that, to realize the vision of complete
automation, it would be necessary to operate paradigm-shift
and move from reductionist and complicated solutions to a
holistic (systemic) solution based on the paradigm of
Complex Adaptive Systems (CAS) with the Multi-agents
Simulation as the cornerstone at the heart of our proposed
approach.
Our goal is to find an innovative solution, for the
challenges of automatic matching, by exploiting multi-agent
simulations, taking place in an artificial world, and taking
advantage of the computing power of current computers.
« Simulation models provide virtually unlimited power;
or rather, they provide unlimited virtual power. If you can
think of something, you can simulate it. Experimenting in a
simulated world, you can change anything, in any way, at
any time - even change time itself. » [20].
Figure 5 below represents the different CAS
fundamental characteristics that could allow the matching
system to move from a chaos state (i.e., initial state) to a
state of equilibrium (i.e., final state of the system).
Figure 5. From chaos to equilibrium
The initial state of the system is a state of chaos where
the agents are unstable because of their matching status
(indeterminate matching). After the start of the simulation,
the adaptation stage begins where the agents interact
Chaos
Input Schemas
Adaptation
Interactions
Emergence
Self-organization
Equilibrium
Alignement

95
International Journal on Advances in Software, vol 12 no 1 & 2, year 2019, http://www.iariajournals.org/software/
2019, © Copyright by authors, Published under agreement with IARIA - www.iaria.org
searching for the best match. Over the cycles of the
simulation, consensual matchings (self-organization) begin
to form (i.e., local solution representing a local equilibrium
to the pair of agents), and thus make emerge the final
solution of the alignment (global solution).
The final state of the system is reached once a balance
for the system in its entirety is found, thereby signaling the
end of the simulation.
III. SCHEMA MATCHING AS A SYSTEMIC APPROACH
As part of our research we investigated the use of the
theory of CAS (systemic thinking), to try to find an
innovative response to challenges (i.e., complexity,
uncertainty) that the conventional approaches for schema
matching are still facing.
We think that the CAS could bring us the adaptation
capability to the realm of schema matching tools (self-
configuration and self-optimization), which should relieve
the user from the complexity and effort resulting from
configuring and optimizing the automatic schema matching
systems.
Before going any further, let us first try to explain our
vision of the problematic of ASM under the prism of the
theory of CAS. First and foremost, we wonder about the
nature of ASM solutions, whether they can be considered as
systems. The answer is unequivocally positive. Even if one
strictly stands for the definition of the term system, which
means "a coherent set of closely related parts", it is clear
that the automatic matching of schemas is a system, because
of ASM is a coherent set consisting of several components,
related to each other, in this case schemas, matchers, etc.
Now, if we come to the systemic meaning of the term, the
automatic matching of schemas is a system whose different
components, for example elements of schemas (which can
be represented by agents seeking to find the best match),
must interact within this system with the objective of
producing a final result called alignment.
Next, consider why a system of ASM can be described
as complex. To this end, let us recall the distinction between
a "complex" system and a "complicated" system [21]. First,
in complex systems, relationships between agents (i.e.,
system elements) are more important than the agents
themselves, unlike complicated systems where elements and
their relationships are of equal importance. Second, in
complex systems, simple rules can produce surprising and
complex responses, while in complicated systems, the
results of simple algorithms are simple and predictable. And
finally, in complex systems the agents have the latitude to
respond according to the limits of their rules, as opposed to
the complicated systems, where the response of the
components is completely determined.
On the basis of this distinction, we consider that the
ASM process must be thought and modeled as a complex
system (our approach) and not as a complicated system
(current approaches). So, our conceptual model for schema
matching, based on the theory of complexity, sees the
schema matching process as a complex adaptive system.
As illustrated in Figure 6, in this model, each schema
element of the schemas to match (source or target schema)
is modeled as an autonomous agent, belonging to a
population (source or target schema population). Each agent
behaviors and interaction, at the micro level, with the other
agents in the opposite population and with its environment,
brings out at the macro level, a self-organized system that
represents the global solution to matching problem (i.e.,
relationships between schemas elements). In other words,
the resolution of the matching problem goes through
individual effort deployed by each agent, locally, throughout
the simulation to find the best match in the opposite
population.
Figure 6. Schema Matching as Multi-Agents Simulation (non-linear
process with emergence-based resolution)
We think that many intrinsic properties of our model,
derived from the ABMS modeling approach, can contribute
efficiently to the increase of the matching quality and thus
the decrease of the matching uncertainty. These properties
are:
Emergence: the emergence of the macro solution
(schema matching) comes from local behaviors, rules and
interactions between agents (micro solutions).
Self-organization: the cooperation of source and target
schema elements (represented as agents) helps to reach a
consensus about their best matching.
Stochasticity (randomness): the randomness within the
model, gives the ability to perform statistical analysis on

96
International Journal on Advances in Software, vol 12 no 1 & 2, year 2019, http://www.iariajournals.org/software/
2019, © Copyright by authors, Published under agreement with IARIA - www.iaria.org
the outcome of multiple simulations (meta-simulation)
for the same matching scenario.
Briefly, our idea is to model the Schema Matching
process as interactions, within a self-organized environment,
between agents called “Schema Attribute Agent”. In the rest
of the paper, we are going to refer to the “Schema Element
Agent” simply as agent. Each schema element is modeled as
an agent belonging to one of two populations: source or
target schema group. Furthermore, the schema matching
process is modeled as the interaction between the two
populations of agents.
In our model, the internal architecture of the agents is
Rule-based (reflexive agent). The agents have as a main
goal to find the best matching agent within the other group
of agents.
The foundation of the rules governing the agent’s
behaviors is stochasticity (randomness). In fact, a certain
degree of randomness is present in each step executed by
each agent during the simulation.
The main random elements influencing the simulation
are as follows:
Similarity Calculation based on similarity measures
selected randomly from a similarity measures list.
Similarity Scores aggregation based on aggregation
functions selected randomly from an aggregation
function list (MAX, AVERAGE, WEIGHTED).
Similarity score validation based on generated random
threshold value (within interval)
As opposed to deterministic solutions for schema
matching (all the existing matching solutions), the
nondeterministic and stochastic nature of our agent-based
simulation increase the confidence in the quality of the
matching results. Even though the agent's behaviors are
based on randomness, our model can often produce the right
matchings at the end of each simulation run.
In the context of our operational model, the agent during
the perception phase, perceives its environment by
interrogating it, by performing similarity calculations
(which can be considered as an act of recognition) or by
capturing certain events. The result of this phase will be a
set of percepts, allowing the agent to identify the agents of
the other group, available for matching. The capture of
events, coming from the environment, is another action of
perception: for instance, the event that is triggered when the
agent is chosen by another one as a matching candidate.
During the decision phase, the agent from the results of the
perception phase, reasons, deliberates and decides on the
action to be selected. The decisions, involving the choice of
actions, are the following: (i) the decision concerning the
convergence of similarities and the selection of a candidate
matching, (ii) the decision concerning the reset of the beliefs
concerning the candidate matching, and (iii) the decision on
consensual matching. During the action phase, the agent
executes the actions selected during the previous phase. The
current iteration of the simulation ends with this phase.
Figure 7 illustrates the internal states of each agent. It
allows representing the transitions between the internal
states, during the perception-decision-action cycle of the
agent.
Figure 7. Agent behavior
The behavior of the agent is driven by the goal of
finding a consensual match. The consensus-selection
approach is a naive approach, consisting of waiting for a
consensus that must coincide for both agents (which may
imply a longer duration for the simulation).
The main key-features of our conceptual model are
summarized as follows:

97
International Journal on Advances in Software, vol 12 no 1 & 2, year 2019, http://www.iariajournals.org/software/
2019, © Copyright by authors, Published under agreement with IARIA - www.iaria.org
Stochastic Linguistic Matching: similarity calculation based on similarity measures selected randomly from a similarity measures list. Similarity Scores aggregation based on aggregation functions selected randomly from an aggregation function list (MAX, AVERAGE, WEIGHTED). Similarity score validation based on generated random threshold value (within interval). Figure 8 illustrates this process.
Figure 8. Stochastic Matching
Consensual Matching Selection: to form a valid
pairing/correspondence, the two agents (form opposite
populations: source and target schemas) should refer to
each other as candidate match (in the same time). Figure
9 is an illustration of such a process.
Figure 9. Consensual Matching
Meta-Simulations and Statistical Analysis: performing statistical analysis on multiple simulation runs data is a good way to improve the confidence in the matching result obtained from our model. It is illustrated by Figure 10.
Figure 10. Meta-simulation and statistical analysis

98
International Journal on Advances in Software, vol 12 no 1 & 2, year 2019, http://www.iariajournals.org/software/
2019, © Copyright by authors, Published under agreement with IARIA - www.iaria.org
We believe that the conceptualization and the modeling
of schema matching as multi-agent simulation will allow the
design of a system exhibiting suitable characteristics:
(i) An easy to understand system, composed of simple
reflexive "agents" interacting according to simple rules.
(ii) An effective and efficient system, autonomously
changing over time, adapting, and self-organizing; a system
allowing the emergence of a solution for any given
matching scenario.
As depicted in Figure 1, our Reflex-SMAS prototype
core was implemented in Java using the open source ABMS
framework Repast Simphony (2.1) [22], [23], and the open
source framework for Text Similarity DKPro Similarity
(2.1.0) [24]. The open source R language (R 3.1.0) [25] was
used for statistical data analysis.
Figure 11. High-level Architecture for Reflex-SMAS
In the next section, we are going to describe the empirical evaluation of the prototype Reflex-SMAS.
IV. EMPIRICAL EVALUATION
The validation of agent-based simulation models is a
topic that is becoming increasingly important in the
literature on the field of ABMS. Three types of validation
could be identified [26]: (i) Empirical Validation, (ii)
Predictive Validation, and (iii) Structural Validation.
As we will see in detail, the empirical validation is the
type of validation that we have adopted for the evaluation of
our Agent-based Simulation Model for Schema Matching
(i.e., prototype Reflex-SMAS).
First, we will start with the description of the
methodology used as our validation approach, and then we
continue by providing a summarized view of our validation
results.
A. Evaluation Objectives and Strategy
We are seeking, through this empirical evaluation, to
validate the following aspects of our prototype Reflex-
SMAS:
That our solution is, indeed, an effective and efficient
automatic schema matching system, capable of
autonomously changing behaviors and evolving over
time, to adapt, and to self-organize and thus make the
solution for any matching scenario to emerge. The
effectiveness must be translated mainly by an increase in
the quality of the found alignment and a reduction of the
uncertainty. Efficiency, on the other hand, must be
materialized by reducing the effort required for this
efficiency, in particular reducing the user effort required
to configure or optimize the matching system, without
significantly impairing the response time, which should
remain within the limits of the viable and the acceptable
(especially for the use of matching in highly dynamic
environments).
That our solution is easy to understand, and therefore,
could display a high degree of maintainability (e.g.,
adding new matchers).
The proof strategy consists on conducting experiments
and then collecting and analyzing data from these
experiments. Thus, the validation approach that we have
adopted is considered as a hybrid validation approach
combining two validation approaches coming from two
different fields, namely Schema Matching and ABMS. On
one hand, from the field of Schema Matching, we are
leveraging a popular evaluation method consisting of the
comparison of results with those expected by the user [27].
On the other hand, from the field of ABMS, we are using
the Empirical Validation, which is mainly based on the
comparison among the results obtained from the model and
what we can observe in the real system.
Thus, the strategy adopted for the validation of our
prototype (implementing our multi-agent simulation model
for schema matching) consists of:
Defining different synthetic matching scenarios (three
matching scenarios namely "Person", "Order" and
"Travel") with different sizes and different level of
lexical heterogeneity, so we can evaluate the prototype
matching performance in different situations (adaptation).
Conducting experiments, compiling results and
evaluating the matching performance by comparing, for
those three matching scenarios, the matching results
(matchings) obtained from our prototype Reflex-SMAS
with the results expected by the user.
In the first matching scenario "Person", we need to
match two schemas with small size (i.e., six elements)
showing a medium lexical heterogeneity level. The second

99
International Journal on Advances in Software, vol 12 no 1 & 2, year 2019, http://www.iariajournals.org/software/
2019, © Copyright by authors, Published under agreement with IARIA - www.iaria.org
matching scenario "Order" is composed of schemas with
medium size with a high lexical heterogeneity level. The
schemas in the last matching scenario "Travel" have a
relatively big size with a low lexical heterogeneity level.
Figure 12. Matching Scenario "Person"
Figure 13. Matching Scenario "Order"
Figure 14. Matching Scenario "Travel"
In order to assess the relevance and level of difficulty
that can represent those synthetic matching scenarios (i.e.,
"Person", "Order" and "Travel"), we decided to evaluate
them, first, using the well-known matching tool COMA
[28]–[30]. Since, the COMA tool was not able to resolve all
the all expected matches for those scenarios, we can say that
the proposed synthetic matching scenarios, should be
enough challenging scenarios for our validation (from their
level of heterogeneity perspective).
Regarding the experiments execution and results
compilation, we have decided to run series of three meta-
simulations for each scenario (each meta-simulation
includes 10 simulations). The final matching result is based on a statistical analysis
of each meta-simulation outcome. In other word, the matching result relies on the calculation of the frequency of occurrence of a found match on the ten simulations composing the meta-simulation. Furthermore, executing for each scenario the meta-simulations three times is a choice that we made to help with the assessment of the experiment repeatability.
B. Experiment Results
This section summarizes the results obtained from the
experiments conducted to evaluate the Reflex-SMAS tool.
After executing the set of three meta-simulations for each
matching scenario, we have compiled the results for the
performance for each meta-simulation for all scenarios. As
indicated in Table I, our tool was able to correctly find all
the expected correspondence by the user (a 100% success
rate) after each meta-simulation, and for each scenario.
TABLE I. REFLEX-SMAS EXPERIMENT COMBINED RESULTS
Scenario M.S. M. to F. C.M.F. % C.M.F.
Person 1 6 6 100%
Person 2 6 6 100%
Person 3 6 6 100%
Order 1 8 8 100%
Order 2 8 8 100%
Order 3 8 8 100%
Travel 1 15 15 100%
Travel 2 15 15 100%
Travel 3 15 15 100%
M.S: Meta Simulation
M. to F: Matchings to Find
C.M.F: Correct Matchings Found
% C.M.F: % Correct Matchings Found
Regarding the response time, it corresponds to the
execution, in parallel, of 10 individual simulations. At the
level of the individual simulations, we are interested in the

100
International Journal on Advances in Software, vol 12 no 1 & 2, year 2019, http://www.iariajournals.org/software/
2019, © Copyright by authors, Published under agreement with IARIA - www.iaria.org
discrete time analysis (i.e., iterations), which represents in
some ways the measure of the effort expended by the agents
to form consensual matching. The figure below shows the
response time with respect to each meta-simulation and each
scenario. By examining the graph, we can deduce the
correlation between the response time and the nature of the
different scenarios. We can for example see that the size of
the schemas (i.e., "Travel" scenario) or the high lexical
heterogeneity (i.e., "Order" scenario) correlates negatively
with the number of iterations necessary to find the solution
for each meta-simulation. On the other hand, we can notice
in Figure 15, that the execution time (in minutes) of the
different meta-simulations for the different scenarios
oscillates, approximately, between 2 and 3 minutes.
Figure 15. Number of iterations for all scenarios
Now, if we compare the results of our Reflex-SMAS
prototype with COMA tool results, we can clearly notice
that our tool outperformed the COMA tool in all the
syntactic matching scenarios. Table II shows the compared
result for Reflex-SMAS vs. COMA.
TABLE II. REFLEX-SMAS VS. COMA EXPERIMENT COMBINED
RESULTS
Reflex-SMAS COMA
Scenario
M
.
to
F.
C.M.F.
%
C.M.
F.
C.M.F. %
C.M.F.
Person 6 6 100% 5 83%
Order 8 8 100% 6 75%
Travel 15 15 100% 13 87%
Figure 16 shows a comparison of the performance
obtained for scenarios "Person", "Order" and "Travel" with
our prototype compared to those obtained with the COMA
tool.
Figure 16. Comparative result between Reflex-SMAS and COMA
To challenge the “perfect” results obtained with our tool
Reflex-SMAS for the synthetic matching scenarios, we were
curious to know to what extent the performance obtained at
the meta-simulations, may be impacted by a reduction in the
number of individual simulations composing a meta-
simulation. Therefore, we decided to conduct further
experimentation, reducing, this time, the number of
individual simulations of a meta-simulation from ten
simulations to only three simulations.
The performance obtained in the experiment with the
meta-simulations composed of three individual simulations
instead of ten, has dropped for the scenarios "Order" and
"Travel". It means that our matching tool Reflex-SMAS was
not able to find all the expected matchings during some of
the meta-simulations for those two scenarios (due to the
high level of heterogeneity of the scenario “Order” and the
big size of the scenario “Travel”). Unquestionably, we can
conclude that the number of individual simulations,
composing the meta-simulation is an important factor to
ensure good matching performance (better quantification of
the uncertainty regarding the outcome of the matching
process) especially when it comes to scenarios involving
large schemas and/or having a high level of heterogeneity.

101
International Journal on Advances in Software, vol 12 no 1 & 2, year 2019, http://www.iariajournals.org/software/
2019, © Copyright by authors, Published under agreement with IARIA - www.iaria.org
V. CONCLUSION AND FUTURE WORK
As part of our research, we have proposed an approach
arising from systemic thinking, situating it more precisely,
in the field of CAS. This approach has resulted in a multi-
agent simulation approach based on a non-deterministic,
stochastic (random), unpredictable and non-centralized
model, where each simulation can give rise, even with the
same inputs, to different outputs. The multiplication of the
simulations allows the expansion of the space of
possibilities and consequently the increase of the
potentialities of a better quality of the pairing (i.e., reduction
of the uncertainty on the matching obtained).
Our Reflex-SMAS prototype was subjected to a series of
experiments whose objective was to demonstrate the
viability of our approach in two main aspects: effectiveness
and efficiency. This empirical evaluation step showed us
clearly its capability of providing a high-quality result for
different schema matching scenarios without any
optimization or tuning from the end-user. The experiments
results are very satisfactory. Thus, we can conclude that
approaching the schema matching as a CAS and modeling it
as ABMS is a viable and very promising approach that
could greatly help to overcome the problems of uncertainty
and complexity in the field of schema matching.
Our approach, which is part of the current of systemic
thinking and which lies in the lineage of solutions coming
from the field of CAS, brings a new perspective to the field
of ASM, and represents, in this sense, a significant
paradigm shift in this area.
As future work, we are planning to enhance the
conceptual model of our prototype to tackle challenges, such
as complex schema (𝑛:𝑚 cardinalities) by exploiting other
Similarity Measures, such as Structural Similarities
(schemas structures).
On the other hand, in order to open up new perspectives
and to overcome the limits of purely reactive behavior, we
are thinking on a "conceptual" evolution of the internal
architecture of our agent, evolving it from a reactive agent
to an agent of rational type. This evolution, as illustrated by
Figure 17, consists in the implementation of a decision-
making model under uncertainty, at the level of the
decision-making phase of the agent, giving it the ability to
reason and to choose between conflicting actions. The
rational agent we are aiming for, should have a memory, a
partial representation of its environment and other agents
(its perception), and a capacity for reasoning, allowing it to
make a rational choice (to choose the action with the
greatest utility) that can guarantee it to maximize its
satisfaction (measure of performance). We also speak of
cognitive agent because it possesses explicit representations
of it goals on which it is able to reason in order to produce
action plans.
The result of this conceptual evolution could give rise to
a new version of our prototype, and of course, it must be
verified that the change from a reactive behavior to a
rational one does not penalize the performance of the
simulations.
Figure 17. Towards a rational SMAS
REFERENCES
[1] H. Assoudi and H. Lounis, "Implementing Systemic
Thinking for Automatic Schema Matching: An Agent-
Based Modeling Approach", in Proceedings of the 10th
International Conference on Advanced Cognitive
Technologies and Applications COGNITIVE 2018, pp. 43-
50, 2018.
[2] E. Rahm and P. A. Bernstein, "A survey of approaches to
automatic schema matching ", the VLDB Journal, vol. 10,
no 4, pp. 334–350, 2001.
[3] H. N. Q. Viet, H. X. Luong, Z. Miklos, K. Aberer, and T.
T. Quan, "A MAS Negotiation Support Tool for Schema
Matching", in Proceedings of the Twelfth International
Conference on Autonomous Agents and Multiagent
Systems, 2013.
[4] P. Bohannon, E. Elnahrawy, W. Fan, and M. Flaster,
"Putting context into schema matching", in Proceedings of
the 32nd international conference on Very large data bases,
pp. 307–318, 2006.
[5] V. Cross, "Uncertainty in the automation of ontology
matching", in Uncertainty Modeling and Analysis, 2003.
ISUMA 2003. Fourth International Symposium on, pp.
135–140, 2003.
[6] J. Madhavan, P. A. Bernstein, and E. Rahm, "Generic
schema matching with cupid ", in VLDB, vol. 1, pp. 49–
58, 2001.
[7] B. Villanyi, P. Martinek, and A. Szamos, "Voting based
fuzzy linguistic matching ", in 2014 IEEE 15th
International Symposium on Computational Intelligence
and Informatics (CINTI), 2014, pp. 27-32, 2014.
[8] F. Duchateau and Z. Bellahsene, "Designing a benchmark
for the assessment of schema matching tools", Open
Journal of Databases (OJDB), vol. 1, no 1, pp. 3–25, 2014.
[9] C. J. Zhang, L. Chen, H. V. Jagadish, and C. C. Cao,
"Reducing uncertainty of schema matching via
crowdsourcing", in Proceedings of the VLDB Endowment,
vol. 6, no 9, pp. 757–768, 2013.
[10] P. Shvaiko and J. Euzenat, "Ontology matching: state of
the art and future challenges", Knowledge and Data
Rational-SMAS Predictive Matching
• Bayes Matcher (ML Classifier)
Bayesian Decision Network
Reflex-SMAS
Stochastic Languistic Matching
• Lexical Matching
• Semantic Matching
Consensual Matching Selection
Multi-run Simulations Statistical Analysis

102
International Journal on Advances in Software, vol 12 no 1 & 2, year 2019, http://www.iariajournals.org/software/
2019, © Copyright by authors, Published under agreement with IARIA - www.iaria.org
Engineering, IEEE Transactions on, vol. 25, no 1, pp. 158–
176, 2013.
[11] E. Peukert, "Process-based Schema Matching: From
Manual Design to Adaptive Process Construction", 2013.
[12] E. Peukert, J. Eberius, and E. Rahm, "A self-configuring
schema matching system", in Proceedings of the 2012
IEEE 28th International Conference on Data Engineering
(ICDE), pp. 306–317, 2012.
[13] W. Nian-Feng and D. Xing-Chun, "Uncertain Schema
Matching Based on Interval Fuzzy Similarities",
International Journal of Advancements in Computing
Technology, vol. 4, no 1, 2012.
[14] D. Ngo and Z. Bellahsene, "YAM++: a multi-strategy
based approach for ontology matching task ", in
Knowledge Engineering and Knowledge Management,
Springer, pp. 421–425, 2012.
[15] J. Gong, R. Cheng, and D. W. Cheung, "Efficient
management of uncertainty in XML schema matching",
The VLDB Journal—The International Journal on Very
Large Data Bases, vol. 21, no 3, pp. 385–409, 2012.
[16] A. D. Sarma, X. L. Dong, and A. Y. Halevy, "Uncertainty
in data integration and dataspace support platforms", in
Schema Matching and Mapping, Springer, pp. 75–108,
2011.
[17] A. Gal, "Managing uncertainty in schema matching with
top-k schema mappings", in Journal on Data Semantics VI,
Springer, pp. 90–114, 2006.
[18] A. Gal, "Uncertain schema matching", Synthesis Lectures
on Data Management, vol. 3, no 1, pp. 1–97, 2011.
[19] R. Fortin, "Comprendre la complexité: introduction à La
Méthode d’Edgar Morin". Presses Université Laval, 2005.
[20] L. W. Schruben, "Don’t Try These in the Real World".
2015.
[21] W. Jones, "Complex Adaptive Systems." Beyond
Intractability, Eds. Guy Burgess and Heidi Burgess,
Conflict Information Consortium, University of Colorado,
Boulder, Posted: October 2003.
[22] M. J. North, E. Tatara, N. T. Collier, and J. Ozik, "Visual
agent-based model development with Repast Simphony",
Technical report, Argonne National Laboratory, 2007.
[23] M. J. North, "R and Repast Simphony", 2010.
[24] D. Bär, T. Zesch, and I. Gurevych, "DKPro Similarity: An
Open Source Framework for Text Similarity", in
Proceedings of the 51st Annual Meeting of the Association
for Computational Linguistics: System Demonstrations,
pp. 121–126, 2013.
[25] R. C. Team, "R: A language and environment for statistical
computing. Vienna, Austria: R Foundation for Statistical
Computing; 2012", Open access available at: http://cran. r-
project. org, 2011.
[26] M. Remondino and G. Correndo, "Mabs validation through
repeated execution and data mining analisys", International
Journal of Simulation: Systems, Science & Technology,
vol. 7, no 6, 2006.
[27] Z. Bellahsene, A. Bonifati, F. Duchateau, and Y.
Velegrakis, "On evaluating schema matching and
mapping", in Schema matching and mapping, Springer, pp.
253–291, 2011.
[28] H.-H. Do and E. Rahm, "COMA: a system for flexible
combination of schema matching approaches", in
Proceedings of the 28th international conference on Very
Large Data Bases, pp. 610–621, 2002.
[29] D. Aumueller, H.-H. Do, S. Massmann, and E. Rahm,
"Schema and ontology matching with COMA++", in
Proceedings of the 2005 ACM SIGMOD international
conference on Management of data, pp. 906–908, 2005.
[30] S. Massmann, S. Raunich, D. Aumüller, P. Arnold, and E.
Rahm, "Evolution of the coma match system", Ontology
Matching, pp. 49, 2011.

103
International Journal on Advances in Software, vol 12 no 1 & 2, year 2019, http://www.iariajournals.org/software/
2019, © Copyright by authors, Published under agreement with IARIA - www.iaria.org
Trend Discovery and Social Recommendation in Support of Documentary Production
Giorgos Mitsis, Nikos Kalatzis, Ioanna Roussaki, Symeon Papavassiliou
Institute of Communications and Computer Systems Athens, Greece
e-mails: {gmitsis@netmode, nikosk@cn, ioanna.roussaki@cn, papavass@mail}.ntua.gr
Abstract—Recent market research has revealed a globally
growing interest on documentaries that have now become one
of the biggest content-wise genre in the movie titles catalog,
surpassing traditionally popular genres such as comedy or
adventure films. At the same time, modern audiences appear
willing to immerse into more interactive and personalized
viewing experiences. Documentaries, even in their linear
version, involve high costs in all phases (pre-production,
production, post-production) due to various inefficiencies,
partly attributed to the lack of scientifically-proven cost-
effective Information and Communications Technology tools.
To fill this gap, a set of innovative tools is delivered that focus
on supporting all stages of the documentary creation process,
ranging from the documentary topic selection to its final
delivery to the viewers. This paper elaborates on two specific
tools that primarily focus on the interests and satisfaction of
the targeted audience: the Integrated Trends Discovery tool
and the Social Recommendation & Personalization tool. It
presents their design, functionality and performance, discusses
the extended evaluation and validation that has been carried
out and concludes with exploring the future plans and
potential regarding these tools.
Keywords-documentary production; social-media analytics;
Integrated Trends Discovery tool; Social Recommendation &
Personalization tool; evaluation; validation; benchmarking.
I. INTRODUCTION
From the earliest days of cinema, documentaries have provided a powerful way of engaging audiences with the world. They always had social and market impact, as they adapted to the available means of production and distribution. More than any other type of films, documentarians were avid adapters of new technologies, which periodically revitalized the classical documentary form. The documentary is a genre that lends itself straightforwardly to interaction. People have different knowledge backgrounds, different interests and points of view, different aesthetic tastes and different constraints while viewing a programme. Therefore, it becomes evident that some form of personalized interactive documentary creation will enhance the quality of experience for the viewers, facilitating them to choose different paths primarily with respect to the documentary format and playout system. The convergence between the documentary production field and of digital media enables the realization of this vision.
As the range of Information and Communications Technology (ICT) platforms broadens, documentary makers need to understand and adopt emerging technologies in order
to ensure audience engagement and creative satisfaction, via the use of personalization and interactive media. One of the major challenges for stakeholders in the arena of documentary creation is the development of processes and business models to exploit the advantages of those technical achievements, in order to reduce the overall cost of documentary end-to-end production, to save time and to deliver enhanced personalized interactive and thus more attractive documentaries to the viewers.
This paper is based on [1] that has been prepared within PRODUCER [2], an H2020 EU project that aims to pave the path towards supporting the transformation of the well-established and successful traditional models of linear documentaries to interactive documentaries, by responding to the recent challenges of the convergence of interactive media and documentaries. This is achieved via the creation of a set of enhanced ICT tools that focus on supporting all documentary creation phases, ranging from the user engagement and audience building, to the final documentary delivery. In addition to directly reducing the overall production cost and time, PRODUCER aims to enhance viewers’ experience and satisfaction by generating multi-layered documentaries and delivering more personalized services, e.g., regarding the documentary format and playout.
In order to provide the aforementioned functionality, the PRODUCER platform implemented 9 tools, each focusing on a specific documentary production phase. These tools are: Integrated trends discovery tool, Audience building tool and Open content discovery tool (that support the documentary pre-production phase), Multimedia content storage, search & retrieval tool and Automatic annotation tool (that support the core production phase), Interactive-enriched video creation tool, 360° video playout tool, Second screen interaction tool and Social recommendation & personalization tool (all four focusing on the documentary post-production phase). The architecture of the PRODUCER platform is presented in more detail in [3].
As already mentioned, this paper is based on [1], where an initial prototype implementation was described for two of the PRODUCER tools: the Integrated Trends Discovery tool and the Social Recommendation & Personalization tool. In the current paper, the final version of the prototypes is presented along with a thorough evaluation.
In the rest of the paper, Section II elaborates on the design & functionality of the Integrated Trends Discovery tool while Section III focuses on the description of the Social Recommendation & Personalization tool. In Section IV, the results of the evaluation of the tools are presented. Finally, in

104
International Journal on Advances in Software, vol 12 no 1 & 2, year 2019, http://www.iariajournals.org/software/
2019, © Copyright by authors, Published under agreement with IARIA - www.iaria.org
Section V, conclusions are drawn and future plans are presented.
II. INTEGRATED TRENDS DISCOVERY TOOL
This section elaborates on the ITD tool, i.e., its innovations, architecture, user demographics inference mechanism and respective evaluation.
A. Rationale and Innovations
In recent years, there is an increasing trend on utilizing social media analytics and Internet search engines analytics for studying and predicting behavior of people with regards to various societal activities. The proper analysis of Web 2.0 services utilization goes beyond the standard surveys or focus groups. It is a valuable source of information leveraging internet users as the largest panel of users in the world. Analysts from a wide area of research fields have the ability to reveal current and historic interests of individuals and to extract additional information about their demographics, behavior, preferences, etc. One of the valuable aspects of this approach is that the trial user base consists of people that have not participated in the user requirement extraction phase.
Some of the research fields that demonstrate significant results through the utilization of such analytics include epidemiology (e.g., detect influenza [4][5] and malaria [6]) epidemics), economy (e.g., stock market analysis [7], private consumption prediction [8], financial market analysis and prediction [9], unemployment rate estimation [10]) politics (e.g., predicting elections outcomes [11]).
On the other hand, there are limitations on relying only on these information sources as certain groups of users might be over- or under-represented among internet search data. There is a significant variability of online access and internet search usage across different demographic, socioeconomic, and geographic subpopulations.
With regards to content creation and marketing, the existing methodologies are under a major and rapid transformation given the proliferation of Social Media and search engines. The utilization of such services generates voluminous data that allows the extraction of new insights with regards to the audiences’ behavioral dynamics. In [12], authors propose a mechanism for predicting the popularity of online content by analyzing activity of self-organized groups of users in social networks. Authors in [13] attempt to predict IMDB (http://www.imdb.com/) movie ratings using Google search frequencies for movie related information. In a similar manner, authors in [14] are inferring, based on social media analytics, the potential box office revenues with regards to Internet content generated about Bollywood movies.
The existing research approaches mainly focus on the post-production phase of released content. Identifying the topics that are most likely to engage the audience is critical for content creation in the pre-production phase. The ultimate goal of content production houses is to deliver content that matches exactly what people are looking for. Deciding wisely on the main documentary topic, as well as the additional elements that will be elaborated upon, prior to
engaging any resources in the documentary production process, has the potential to reduce the overall cost and duration of the production lifecycle, as well as to increase the population of the audiences interested, thus boosting the respective revenues. In addition, the existence of hard evidence with regards to potential audience’s volume and characteristics (e.g., geographical regions, gender, age) is an important parameter in order to decide the amount of effort and budget to be invested during production.
There are various social media analytics tools that are focusing on generic marketing analysis, e.g., monitoring for a long time specific keyword(s) and websites for promoting a specific brand and engaging potential customers. These web marketing tools rely on user tracking, consideration of user journeys, detection of conversion blockers, user segmentation, etc. This kind of analysis requires access to specific websites analytics and connections with social media accounts (e.g., friends, followers) that is not the case when the aim is to extract the generic population trends. In addition, these services are available under subscription fee that typically ranges from 100 Euros/month to several thousand Euros/month, a cost that might be difficult to be handled by small documentary houses.
The ITD Tool aims to support the formulation, validation and (re)orientation of documentary production ideas and estimate how appealing these ideas will be to potential audiences based on data coming from global communication media with massive user numbers. The ITD tool integrates existing popular publicly available services for: monitoring search trends (e.g., Google Trends), researching keywords (e.g., Google AdWords Keyword Planner), analyzing social media trends (e.g., Twitter trending hashtags). In more details, the ITD tool innovations include the following:
Identification and evaluation of audience’s generic interest for specific topics and analysis/inference of audience’s characteristics (e.g., demographics, location)
Extraction of additional aspects of a topic through keyword analysis, quantitative correlation of keywords, and association with high level knowledge (e.g., audience sentiment analysis)
Discovery and identification of specific real life events related to the investigated topic (e.g., various breakthroughs of google/twitter trending terms are associated with specific incidents)
Utilization of data sources that are mainly openly accessible through public APIs, which minimizes the cost and increases the user base.
B. Architecture & Implementation Specifications
A functional view of ITD tool’s architecture is provided in Fig. 1. Its core modules are described hereafter.
RestAPI: This component exposes the backend’s functionality through a REST endpoint. The API specifies a set of trend discovery queries where the service consumer provides as input various criteria such as keywords, topics, geographical regions, time periods, etc.
Trends Query Management: This component orchestrates the overall execution of the queries and the processing of the replies. It produces several well formulated queries that are

105
International Journal on Advances in Software, vol 12 no 1 & 2, year 2019, http://www.iariajournals.org/software/
2019, © Copyright by authors, Published under agreement with IARIA - www.iaria.org
forwarded to the respective connectors/wrappers to dispatch the requests to several existing TD tools/services available online. Given that each external service will reply in different time frames (e.g., a call to Google Trends discovery replies within a few seconds while Twitter stream analysis might take longer) the overall process is performed in an asynchronous manner, coordinated by the Message Broker. The Query Management enforces querying policies tailored to each service in order to optimize the utilization of the services and avoid potential bans. To this end, results from calls are also stored in ITD tool’s local database in order to avoid unnecessary calls to the external APIs.
Figure 1. Architecture of the Integrated Trends Discovery Tool.
Trends Message Broker: This component realizes the asynchronous handling of requests. It is essentially a messaging server that forwards requests to the appropriate recipients via a job queue based on a distributed message passing system.
Social Media Connectors: A set of software modules that support the connection and the execution of queries to external services through the provided APIs. Connectors are embedding all the necessary security related credentials to the calls and automate the initiation of a session with the external services. Thus, the connectors automate and ease the actual formulation and execution of the queries issued by the Query Management component. Some example APIs that are utilized by the connectors are: Google AdWords API, Twitter API, YouTube Data API v3.
Trends Data Integration Engine: This module collects the intermediate and final results from all modules, homogenize their different formats, and extracts the final report with regards to the trends discovery process. The results are also modelled and stored in the local data base in order to be available for future utilization.
Trends Database Management & Data model: The ITD tool maintains a local database where the results of various calls to external services are stored. The Database Management module supports the creation, retrieval, update and deletion of data objects. This functionality is supported for both contemporary data but also for historic results
(Trends History Management). Hence, it is feasible for the user to compare trend discovery reports performed in the past with more recent ones and have an intuitive view of the evolution of trend reports in time.
Trends Inference Engine: In some cases, the external services are not directly providing all information aspects of the required discovery process and the combination and analysis of heterogeneous inputs is required. To this end, the application of appropriate inference mechanisms on the available data allows the extraction of additional information escorted by a confidence level that expresses the accuracy of the estimation. Details on the rationale and mechanisms of this module are presented in the following section.
The technologies used for the implementation of the ITD tool can be found in Table I.
TABLE I. ITD SOFTWARE SPECIFICATIONS
Licensing Open source
Core Implementation
Technologies
Python 2.7
Additional technologies
utilised
Nginx server
Django 1.10 (Python framework)
djangorestframework 3.5.1 Celery
RabbitMQ
Redis
Database details MySQL 5.x
Exposed APIs REST
Exchanged data format JSON
GUI description HTML5, Javascript, CSS3, Angular JS 1.6,
Angular-material 1.1.3
The tool is developed as an open source project and the
source code can be found at [15].
C. Knowledge Extraction Approaches
As discussed in the previous section, during the preproduction phase of a documentary, producers are highly interested in estimating audiences’ interests in correlation with high level information like the gender, the age and the sentiment of potential audiences. In a similar manner, after a show has been aired, useful results can be inferred through the analysis of the Internet buzz that the show has created. In other cases, merging information from different, previously unrelated, sources may provide a higher confidence on the final outcome. To this end, various data processing and inference mechanisms are deemed necessary. The ITD tool follows a modular approach with regards to this aspect. The ITD tool provides the necessary means for collecting all relevant data at one place and then different data analytics algorithms can be applied allowing the extraction of additional knowledge according to the scope of the user. As a proof of concept and for supporting the needs of the production teams within the scope of the PRODUCER project, inference algorithms were developed for: i) extracting audience’s characteristics through Twitter data and ii) analyze popularity of targeted TV shows by be complementary use of Google Trends service with Twitter. The design principles and the actual evaluation results of both approaches are presented in Section IV.

106
International Journal on Advances in Software, vol 12 no 1 & 2, year 2019, http://www.iariajournals.org/software/
2019, © Copyright by authors, Published under agreement with IARIA - www.iaria.org
D. Graphical User Interfaces
The Front-End allows the user to create a new query and visualizes the respective results. The overall process consists of two steps supported by two pages (Fig. 2).
Figure 2. The “Home” page of the ITD tool.
First the query’s parameters within the “Queries” (Fig. 3) page are specified and based on these parameters a discovery process is initiated.
Figure 3. The “Queries” page of the ITD tool.
After a successful completion of the query the results are presented on the “Results” page (Fig. 4 and Fig. 5), which provides the following output: (i) a graph of terms (each term is escorted by a user’s popularity metric and is correlated with other terms, where a metric defines the correlation level), (ii) interest per location (country/city), (iii) interest per date(s) allowing the identification if significant dates and seasonal habits, (iv) sentiment and gender analysis related with the researched topic and (vi) questions related to the topic.
Figure 4. A snapshot of “Results” page focusing on “Interest by Time”
and “Keyword Volume”.
Figure 5. A snapshot of “Results” page focusing on “Sentiment and
Gender Estimation”.
Finally, the front-end allows the reviewing of results from past queries and the conversion and download of the query results in CSV format.
III. SOCIAL RECOMMENDATION & PERSONALIZATION TOOL
This section elaborates on the SRP tool, i.e., its functionality, architecture, recommendation extraction algorithm.
A. Rationale & Goal
Personalization & Social Recommendation are dominant mechanisms in today’s social networks, online retails and multimedia content applications due to the increase in profit of the platforms as well as the improvement of the Quality of Experience (QoE) for its users and almost every online company has invested in creating personalized recommendation systems. Major examples include YouTube that recommends relevant videos and advertisements, Amazon that recommends products, Facebook that recommends advertisements and stories, Google Scholar that recommends scientific papers, while other online services provide APIs such as Facebook Open Graph API and Google’s Social Graph API for companies to consume and provide their own recommendations [16].
The Social Recommendation & Personalization (SRP) tool of PRODUCER holistically addresses personalization, relevance feedback and recommendation, offering enriched multimedia content tailored to users’ preferences. The tool’s functionalities can be used in any type of content that can be represented in a meaningful way, as explained later. The application is thus not restricted to documentaries.
The recommendation system we built is not restricted to the video itself, but applies to the set of enrichments accompanying the video as well. Interaction with both video and enrichments is taken into consideration into updating the user’s profile, thus holistically quantifying the user’s behaviour. Its goal is to facilitate the creation of the documentary and allow the reach of the documentary to a wider audience. To do so, the SRP tool is responsible for proposing content to the user or to the producer of the film relevant to specific target groups, via a personalization mechanism.
B. Architecture & Implementation Specifications
SRP tool’s architecture is presented in Fig. 6 and it consists of the following components:
RestAPI: This component is responsible for the exchange

107
International Journal on Advances in Software, vol 12 no 1 & 2, year 2019, http://www.iariajournals.org/software/
2019, © Copyright by authors, Published under agreement with IARIA - www.iaria.org
of information between the frontend of the SRP tool or any application willing to use the SRP tool’s functionality, and its backend.
Frontend: This component is responsible for the Graphical User Interface via which the user interacts with the tool. More information on this component will be presented in subsection D.
User Interaction Monitoring: As the user interacts with the content and the frontend of the tool, interactions and data are being sent to the backend in order to be processed by the tool and perform the corresponding actions.
Figure 6. Architecture of the Architecture of the Social Recommendation
& Personalization Tool.
Data Models: The database where all the data that the tool needs in order to operate seamlessly are stored.
Content Management: The module that processes the ingested content in order to provide a meaningful representation to the underlying algorithms.
User Profile Management: The module that keeps user profiles updated as far as their demographics and actual preferences are concerned, based on their interaction with the content and the platform.
Recommendation Engine: The core part of the tool where the recommendation process takes place and provides the users with the appropriate content.
Various state-of-the-art technologies were utilized in order to achieve the performance and security necessary for the optimal operation of the system. The software specifications for the SRP tool can be found in Table II.
TABLE II. SRP TOOL SOFTWARE SPECIFICATIONS
Licensing Open source
Core Implementation
Technologies
Python 3.5.2
Additional technologies utilised
Nginx server uwsgi
Django 1.10 (Python framework)
djangorestframework 3.5.1
gensim 0.13.4.1
Postgresql 9.5.7 Docker
Docker-compose
Database details PostgreSQL
Exposed APIs REST
Exchanged data format JSON
GUI description GUI application communicating with the backend
of the tool. Users have to signup/login to use the
tool’s backend functionalities.
The tool is developed as an open source project as well
and the source code can be found in [17].
C. Functionality & Design
This section elaborates on the details regarding the features and mechanisms supported by the SRP tool. In order for the recommendation engine to work, the content must be properly indexed and the system should have information about the user’s preferences. The Content Management module ingests the content’s data and maps each content item to a vector as described later in this section. The interaction of the user with the content allows the creation of a similar vector for the user which later can be used to provide recommendations either on a personal level or for a specified target group. The rest of the section further elaborates on each of the functions performed by the SRP tool.
As already stated, the first process the SRP tool has to perform is to index the content in a meaningful way, an important step as also indicated in [18][19]. Each video/enrichment is mapped to a vector, the elements of which are the scores appointed to the video/enrichment expressing the relevance it has to each category of the defined categories. The categories used come from the upper layer of DMOZ (http://dmoztools.net/), an attempt to create a hierarchical ontology scheme for organizing sites, Since the videos in the PRODUCER project are of generic nature, a common ontology scheme seems fit. The feature terms used are presented on Table III.
TABLE III. FEATURE TERMS
Art Business Computer Education Game Health Home
News Recreation Science Shopping Society Sport Child
Each multimedia content item is therefore described as
follows:
, where are the specified
categories and is the relevance the content has to the
specific category. Each element of the vector needs to be generated in an automatic way from the metadata accompanying the video since such a representation is not already available nor is manually provided by the content creators. To achieve this, a previous version of the tool used a naïve tf-idf algorithm while in the current version of the SRP tool, a more sophisticated approach is considered. More specifically, the are appointed using the Word2Vec model [20] a model of a shallow two-layer neural network that is trained to find linguistic context of words. It takes as input a word and returns a unique representation in a multidimensional vector space. The position of the word in

108
International Journal on Advances in Software, vol 12 no 1 & 2, year 2019, http://www.iariajournals.org/software/
2019, © Copyright by authors, Published under agreement with IARIA - www.iaria.org
this vector space is such that words that share common contexts are located in close proximity with each other.
Since the multidimensional vector representation is not useful to us in the way it is, we apply the same procedure on the feature terms used in our vector representations. By doing so, each feature term also has a multidimensional vector representation on the same space as the words and the similarity between the word and each category can be computed. To calculate the overall similarity score, we use a linear combination between the maximum score from all words on the document and the average score of the words. The average score is used in order to reduce the chance that a word that appears few times in the text, but is very relevant to the category in question, skews the result too much in its favor.
In our algorithm we use a pre-trained model from the Wikipedia dataset which consists of millions of documents on a large variety of themes and as a result is a pretty generic dataset covering all the topics that are of interest.
In order to be able to identify content relevant to target audiences, the tool needs to collect information and preferences of viewers since user profiles constitute another integral part of a recommendation system. The representation of each user on the system follows the same principals as the content vector representation, where the vector’s elements signify the importance each term has to the user. As a results each user is represented by a vector
[
]
, where is the value
each user gives to each feature term. Within the platform the SRP tool operates, the viewer
registers and provides some important demographics (i.e., gender, age, country, occupation and education). This information is used in order to create an initial user vector for the user, based on the preferences of users similar to his demographics group. Alternatively, instead of providing this information explicitly, the viewer can choose to login with his/her social network account (e.g., Facebook, Twitter) and the information could be automatically extracted.
The user profile created via this process is static and is not effective for accurate recommendation of content since: a) not every user in the same demographic group has the same preferences and b) his/her interests change dynamically. Thus, in addition to the above process the SRP tool implicitly collects information for the user’s behavior and content choices. Using information about the video he/she watched or the enrichments that caught his/her attention, the SRP tool updates the viewer’s profile to reflect more accurately his/her current preferences.
The created user profile, allows the tool to suggest content to the viewer to consume, as well as a personalized experience when viewing the content by showing only the most relevant enrichments for his/her taste. Through a content-based approach, the user’s profile is matched with the content’s vector by applying the Euclidean similarity measure as:
( )
√∑ (
)
(1)
where is the user’s profile vector and is the content’s
vector. Other similarity metrics were also tested and will be presented in Section IV.
The collaborative approach is complementary with the content-based recommendation using information from other viewers with similar taste, to increase diversity. The idea is to use already obtained knowledge from other users in order make meaningful predictions for the user in question. To do so, the similarity between users is computed as follows:
( )
√∑ (
)
(2)
where the H more similar users from the user’s friends list are denoted as close neighbors. We then compute the similarity of the neighbors to the item:
( ) ∑
( )
( ) (3)
The final similarity between the user and the item is calculated via a hybrid scheme by using the convex combination of the above similarities:
( ) ( )
( ) ( ) (4)
where is a tunable parameter denoting the importance of the content-based and the collaborative approach on the hybrid scheme. A value of has been shown to produce better results than both approaches used individually [21].
Based on the collected data above and the constructed viewers’ profiles, the producer of the documentary can filter the available content based on the preferences of the targeted audience. For this purpose, the k-means algorithm [22] is used to create social clusters of users. Based on the generated clusters, a representative user profile is extracted and is used to perform the similarity matching of the group with the content in question. The SRP tool assigns a score to each item and ranks the items based on that score.
After the creation of the documentary, the SRP tool can be used as an extra step in order to provide a filtering on the enrichments that are paired with the video, so that they do not overwhelm the viewer, filtering out less interesting ones. After specifying the target audience, the SRP tool can provide the list of suggested enrichments that the producer can either accept automatically or select manually based on his/her preferences, enabling the delivery of personalized documentary versions, tailored to audience interests.
D. Graphical User Interfaces
The Social Recommendation & Personalization tool
provides a Graphical User Interface (GUI) in order to make
it accessible to users willing to use the standalone version of
the tool. In the integrated platform, the GUI is part of the
platform in order to better exploit its potential by combining
its services with that of the rest of the tools.
Since the tool needs some information about the users in
order to efficiently provide its recommendations, a page
where he/she can enter or alter his/her personal information
is provided (Fig. 7). This information is used to initialize the
user profile but will also be valuable when willing to gather

109
International Journal on Advances in Software, vol 12 no 1 & 2, year 2019, http://www.iariajournals.org/software/
2019, © Copyright by authors, Published under agreement with IARIA - www.iaria.org
information for a specific target group. When the user enters
his/her information, the data is stored in the SRP tool
database.
Figure 7. SRP tool login screen.
Figure 8. Recommended videos page of SRP tool.
By clicking on “Videos” from the navigation bar, a search bar for searching specific videos as well as a list of videos are presented to the user (Fig. 8). The list of the videos contains the top ten videos from the video database, ranked based on the profile of the user that requested the list by making use of the hybrid recommendation mechanism. It is thus subject to change every time the user interacts with the system, so that the top videos correspond to what the system believes are the most interesting videos for the user at any time.
The “Play Video” page contains more information about the video, as well as the video content itself (Fig. 9). From this page, the user can view the video, interact with it by sharing it to social media, like it or dislike it and watch the enrichments associated with the video. All information concerning the interactions of the user with the content is sent back to the SRP tool backend to update the profile of the user in order to be able to make more precise recommendations in the future.
Figure 9. Play video page of SRP tool.
The last page provided by the GUI is to be used by the
content providers or producers willing to use the services
provided by the SRP tool (Fig. 10). The page is split in three
columns. The leftmost contains a form where the user can
select the audience group he/she wants to target in his/her
documentary, so that the tool knows what recommendation
to make. After choosing the appropriate values in the form,
the user clicks on search and in the middle column, a list of
the 10 most recommended videos for the target group
appears. The list is ranked from most to least relevant. After
selecting the appropriate video, the enrichments of the video
appear on the right column. The tool gives the user the
ability to select which ones of the suggested enrichments
he/she finds appropriate for his/her documentary by toggling

110
International Journal on Advances in Software, vol 12 no 1 & 2, year 2019, http://www.iariajournals.org/software/
2019, © Copyright by authors, Published under agreement with IARIA - www.iaria.org
the slider at the top right of the enrichment. After making
his/her selection, the user can export his/her choices for
further use in the documentary creation process. In the
integrated platform, the exported data could be used by the
rest of the tools of the PRODUCER platform
Figure 10. SRP tool page for Business users.
IV. EVALUATION & BENCHMARKING
In this section, an extensive evaluation of the two tools is presented in order to measure their performance and effectiveness on their corresponding tasks. In order to successfully evaluate the tools, both an objective benchmarking process via simulations on the underlying algorithms and a subjective benchmarking process by actual usage of the tools from real users were performed.
The reason for performing both offline and online evaluation techniques is that recommendation systems are relatively complex mechanisms and their performance cannot be holistically captured through their mathematical model representation. Offline benchmarking was used to configure the underlying algorithm and tweak the available parameters via measuring the effectiveness based on the state of the art metrics, while online experiments came as a confirmation to the above selections and captured the overall Quality of Service perceived by the users (e.g., cold start recommendations, over-specialization etc.)
A. Objective benchmarking
1) Integrated Trends Discovery Tool
The first set of evaluation actions for the ITD tool refers to the inference processes through data analytics approaches. In more details the inference algorithms were developed for: i) extracting audience’s characteristics (gender) through Twitter data and ii) analyse popularity of targeted TV shows by the complementary use of Google Trends service with Twitter.
Extracting audience’s characteristics
The rationale for identifying potential audiences’ gender and age characteristics is that this kind of information is not
freely available from social media services due to user privacy protection data policies. There are various state of the art attempts that focus on inferring user demographics though probabilistic approaches based on user related data freely available on social media (e.g., tweets content, linguistic features, followers’ profile) [23][24][25][26]. With regards to the documentary preproduction phase, Twitter service proved to be the most appropriate one for extracting user profile information, as Twitter account data and content are openly available. The Facebook social media service recently updated the related data access policy and doesn’t allow the access to user content if there is no direct relation with the user (e.g. friends). In a similar manner Google adwords service only provides access to user profile data strictly for mediating Google advertisements and doesn’t allow the utilization of such data for other reasons to third parties.
The task of age and gender estimation is tackled by the ITD tool via the utilization of classification algorithms trained with ground-truth data sets of a number of tweeter users containing records of real Twitter profile information and the respective gender/ age. The core idea for the classification algorithm is that stylistic factors are often associated with user gender, so the Twitter profile colour that has been utilized in combination with the profile picture and the display name. The applied approach, which is presented in detail in [27], constitutes a scalable and fast gender inference mechanism, as a very limited number of features is being utilized for each user thus resulting to a low-dimensional space, in which the machine learning algorithms for gender detection operate. The core benefit of the proposed approach is that it is able to scale and process a very large dataset of Twitter users while is conclusive even in the case where only one of the three aforementioned profile fields used is specified.
The trained network is then utilized in order to generalize the training process and estimate missing information from wider networks of twitter users. The inference process is coordinated by the Trends Inference Engine. The engine uses the TwitterAPI to retrieve tweets where the keywords connected with certain topics are mentioned. Based on the respective Twitter Account ids, profile information is collected for each account. Based on profile attributes (e.g., “name”, “screen_name”, “profile photo”, “short description”, “profile_color”) each user is classified to age & gender category and each classification is escorted by a confidence level.
To infer the gender of users based on their profile pictures, the Face++ Face Detection API (https://www.faceplusplus.com) is utilized. This service detects human faces within images and estimates the respective gender associated with a confidence level. To exploit the display name for determining the user’s gender, a data matching technique is used comparing the names of Twitter users with the names stored in the datasets of Genderize (https://genderize.io/).
In order to exploit the theme color to infer the user gender, a hex color code has been obtained for each user via the Twitter API corresponding to the user’s chosen color.
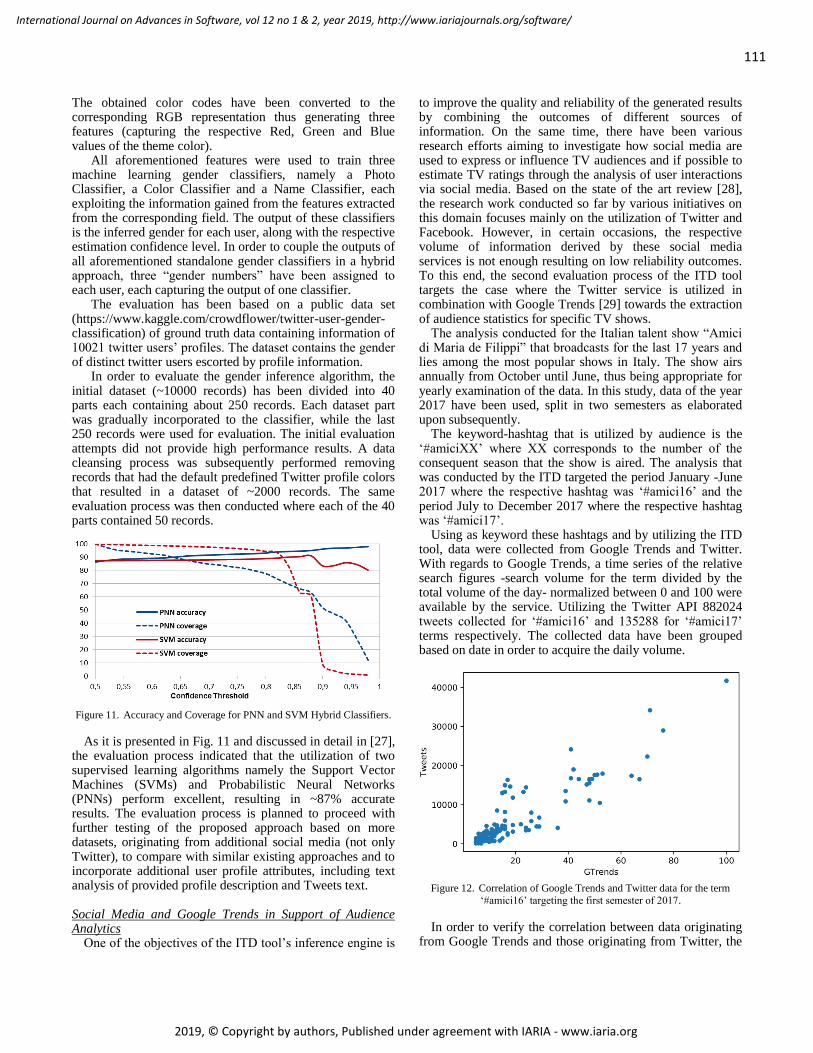
111
International Journal on Advances in Software, vol 12 no 1 & 2, year 2019, http://www.iariajournals.org/software/
2019, © Copyright by authors, Published under agreement with IARIA - www.iaria.org
The obtained color codes have been converted to the corresponding RGB representation thus generating three features (capturing the respective Red, Green and Blue values of the theme color).
All aforementioned features were used to train three machine learning gender classifiers, namely a Photo Classifier, a Color Classifier and a Name Classifier, each exploiting the information gained from the features extracted from the corresponding field. The output of these classifiers is the inferred gender for each user, along with the respective estimation confidence level. In order to couple the outputs of all aforementioned standalone gender classifiers in a hybrid approach, three “gender numbers” have been assigned to each user, each capturing the output of one classifier.
The evaluation has been based on a public data set (https://www.kaggle.com/crowdflower/twitter-user-gender-classification) of ground truth data containing information of 10021 twitter users’ profiles. The dataset contains the gender of distinct twitter users escorted by profile information.
In order to evaluate the gender inference algorithm, the initial dataset (~10000 records) has been divided into 40 parts each containing about 250 records. Each dataset part was gradually incorporated to the classifier, while the last 250 records were used for evaluation. The initial evaluation attempts did not provide high performance results. A data cleansing process was subsequently performed removing records that had the default predefined Twitter profile colors that resulted in a dataset of ~2000 records. The same evaluation process was then conducted where each of the 40 parts contained 50 records.
Figure 11. Accuracy and Coverage for PNN and SVM Hybrid Classifiers.
As it is presented in Fig. 11 and discussed in detail in [27], the evaluation process indicated that the utilization of two supervised learning algorithms namely the Support Vector Machines (SVMs) and Probabilistic Neural Networks (PNNs) perform excellent, resulting in ~87% accurate results. The evaluation process is planned to proceed with further testing of the proposed approach based on more datasets, originating from additional social media (not only Twitter), to compare with similar existing approaches and to incorporate additional user profile attributes, including text analysis of provided profile description and Tweets text.
Social Media and Google Trends in Support of Audience Analytics
One of the objectives of the ITD tool’s inference engine is
to improve the quality and reliability of the generated results by combining the outcomes of different sources of information. On the same time, there have been various research efforts aiming to investigate how social media are used to express or influence TV audiences and if possible to estimate TV ratings through the analysis of user interactions via social media. Based on the state of the art review [28], the research work conducted so far by various initiatives on this domain focuses mainly on the utilization of Twitter and Facebook. However, in certain occasions, the respective volume of information derived by these social media services is not enough resulting on low reliability outcomes. To this end, the second evaluation process of the ITD tool targets the case where the Twitter service is utilized in combination with Google Trends [29] towards the extraction of audience statistics for specific TV shows.
The analysis conducted for the Italian talent show “Amici di Maria de Filippi” that broadcasts for the last 17 years and lies among the most popular shows in Italy. The show airs annually from October until June, thus being appropriate for yearly examination of the data. In this study, data of the year 2017 have been used, split in two semesters as elaborated upon subsequently.
The keyword-hashtag that is utilized by audience is the ‘#amiciXX’ where XX corresponds to the number of the consequent season that the show is aired. The analysis that was conducted by the ITD targeted the period January -June 2017 where the respective hashtag was ‘#amici16’ and the period July to December 2017 where the respective hashtag was ‘#amici17’.
Using as keyword these hashtags and by utilizing the ITD tool, data were collected from Google Trends and Twitter. With regards to Google Trends, a time series of the relative search figures -search volume for the term divided by the total volume of the day- normalized between 0 and 100 were available by the service. Utilizing the Twitter API 882024 tweets collected for ‘#amici16’ and 135288 for ‘#amici17’ terms respectively. The collected data have been grouped based on date in order to acquire the daily volume.
Figure 12. Correlation of Google Trends and Twitter data for the term
‘#amici16’ targeting the first semester of 2017.
In order to verify the correlation between data originating from Google Trends and those originating from Twitter, the

112
International Journal on Advances in Software, vol 12 no 1 & 2, year 2019, http://www.iariajournals.org/software/
2019, © Copyright by authors, Published under agreement with IARIA - www.iaria.org
Pearson correlation coefficient was utilized. The obtained results for the first semester of 2017 are illustrated in Fig. 12 and lead to coefficient of 0.893 and to significance of approximately 10-32. This indicates that the two datasets are strongly correlated, since we secured that the figures of each set are matched 1-1 and the low significance ensures that this result cannot be produced randomly. The respective outcomes for the second semester of 2017 are presented in Fig. 13 and lead to correlation coefficient of 0.816 and to significance of about 10-30. The slightly lower correlation demonstrated can be fully justified by the fact that the show does not broadcast during the summer and thus there is lower activity both on Twitter, as well as on Google, resulting in lower correlation results. Nevertheless, the findings indicate a strong relation between Twitter and Google Trends data. The aforementioned results confirm what the authors originally expected: Data obtained from Google Trends and Twitter at the same period are strongly (linearly) correlated and this of course can be further exploited in a variety of research purposes.
Figure 13. Correlation of Google Trends and Twitter data for the term
‘#amici17’ targeting the second semester of 2017.
The described data homogenization and correlation evaluation mechanism has been integrated within the Inference Engine of the ITD tool allowing the dynamic deduction of whether the data from the two different information sources are converging or not for the utilized keywords that refer to the respective shows. The correlation level is then utilized as an additional value that is escorting the keyword presence volumes and presented to the end-user as an additional indication of the metrics’ confidence.
The evaluation experiments conducted with regards to the overall utilization of the tool are encouraging and have allowed for the discovery of potential shortcomings early in the development phase. Such an issue is related to the volume of calls to external services. For example, Twitter API limits the allowed calls to 15 every 15 minutes per service consumer. As this issue was expected, a caching mechanism is utilized where results from each call to the Twitter API are also stored in the local database. Hence the ITD builds its own information store in order to avoid unnecessary calls. To this end, as the tool is utilized from
various users, the local information store is getting richer.
2) Social Recommendation and Personalization tool
Concerning the evaluation of the Social Recommendation and Personalization tool, part of the benchmarking procedure was performed for the evaluation of the effectiveness of the algorithms used for the generation of the feature vectors of the content, that corresponds to the first process performed by our tool described in Section III, the indexing of the content in a meaningful way. In our tool, we represent the content as a vector, where each element is one of the 14 categories we have specified, and the value is the percentage to which the content is relevant to this category.
The models used in the evaluation process are four pre-trained models [30] on Wikipedia 2014 in glove representation [31] after we passed them from a transformation process to fit the Word2Vec representation, which contain a vocabulary of 400k words and 50 dimensions, a 100 dimensions, a 200 dimensions and a 300 dimensions vector representation respectively, as well as a pre-trained model on Google News with a vocabulary of 3 million words with a vector representation of 300 dimensions.
In order to test the efficiency of those models, in Section A.2.1, the default accuracy test of word2vec models questions-words [32] was performed while in A.2.2, the model was tested on the ability to effectively categorize content items on the 14 categories and a representative example from our dataset is presented. More examples can be found in [33].
Since the representation of the content is only part of the overall mechanism, an evaluation on the effectiveness of the recommendation algorithm as described in the rest of Section III was also performed. In Section A.2.3 the design of the evaluation process is described and in Section A.2.4 the state of the art metrics used for the evaluation are presented. Finally, in Section A.2.5 the results of the simulations are presented and discussed.
A.2.1. Question-words test This test consists of 19544 sets of 4 words, and is used to
test how well a generated vector model does with analogies of different kinds: For example, capital (Athens Greece Baghdad Iraq), currency (Algeria dinar Angola kwanza) etc. The idea is to predict the 4
th word based on the three
previous ones. Once vectors from a corpus with sentences containing
these terms is generated, the question-words file can be used to test how well the vectors do for analogy tests (assuming the corpus contains these terms). So, given an example from question-words.txt (Athens Greece Baghdad Iraq), the analogy test is to look at nearest neighbours for the vector
Vector(Greece) - Vector(Athens) + Vector(Baghdad)
If the nearest neighbour is the vector Iraq then that analogy test passes.
After running the question-words test for all five models, the successful and unsuccessful attempts of the algorithm
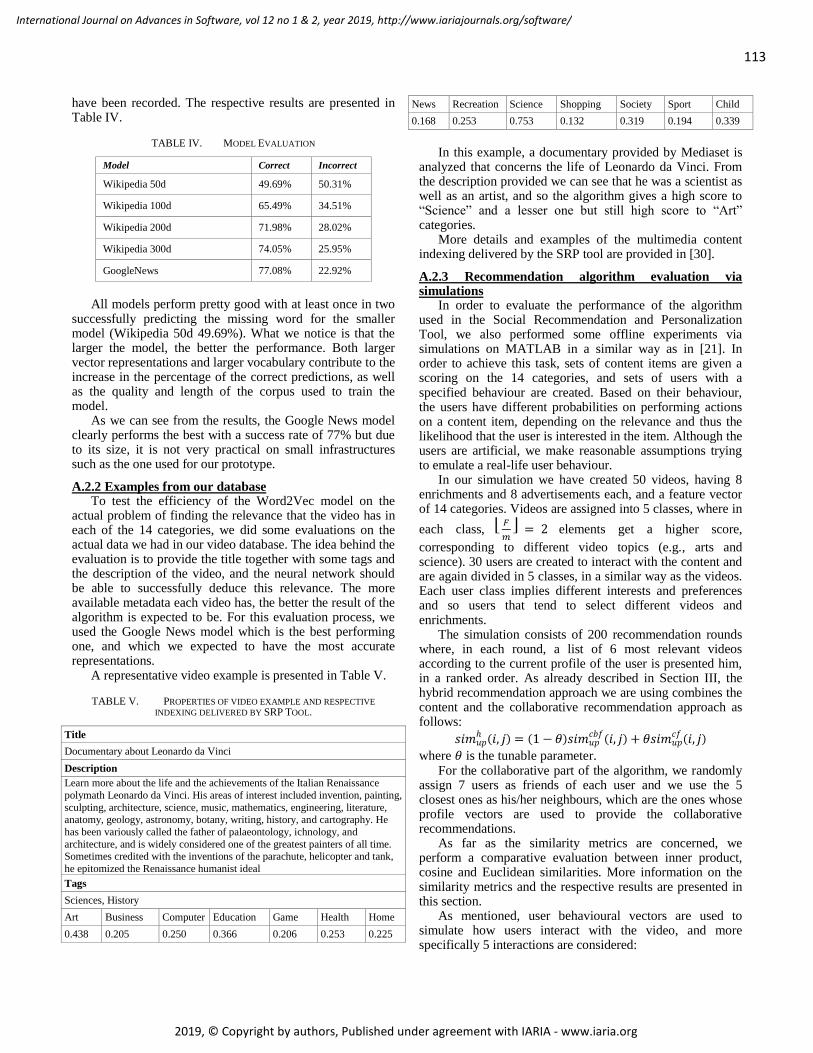
113
International Journal on Advances in Software, vol 12 no 1 & 2, year 2019, http://www.iariajournals.org/software/
2019, © Copyright by authors, Published under agreement with IARIA - www.iaria.org
have been recorded. The respective results are presented in Table IV.
TABLE IV. MODEL EVALUATION
Model Correct Incorrect
Wikipedia 50d 49.69% 50.31%
Wikipedia 100d 65.49% 34.51%
Wikipedia 200d 71.98% 28.02%
Wikipedia 300d 74.05% 25.95%
GoogleNews 77.08% 22.92%
All models perform pretty good with at least once in two
successfully predicting the missing word for the smaller model (Wikipedia 50d 49.69%). What we notice is that the larger the model, the better the performance. Both larger vector representations and larger vocabulary contribute to the increase in the percentage of the correct predictions, as well as the quality and length of the corpus used to train the model.
As we can see from the results, the Google News model clearly performs the best with a success rate of 77% but due to its size, it is not very practical on small infrastructures such as the one used for our prototype.
A.2.2 Examples from our database To test the efficiency of the Word2Vec model on the
actual problem of finding the relevance that the video has in each of the 14 categories, we did some evaluations on the actual data we had in our video database. The idea behind the evaluation is to provide the title together with some tags and the description of the video, and the neural network should be able to successfully deduce this relevance. The more available metadata each video has, the better the result of the algorithm is expected to be. For this evaluation process, we used the Google News model which is the best performing one, and which we expected to have the most accurate representations.
A representative video example is presented in Table V.
TABLE V. PROPERTIES OF VIDEO EXAMPLE AND RESPECTIVE
INDEXING DELIVERED BY SRP TOOL.
Title
Documentary about Leonardo da Vinci
Description
Learn more about the life and the achievements of the Italian Renaissance
polymath Leonardo da Vinci. His areas of interest included invention, painting,
sculpting, architecture, science, music, mathematics, engineering, literature, anatomy, geology, astronomy, botany, writing, history, and cartography. He
has been variously called the father of palaeontology, ichnology, and
architecture, and is widely considered one of the greatest painters of all time. Sometimes credited with the inventions of the parachute, helicopter and tank,
he epitomized the Renaissance humanist ideal
Tags
Sciences, History
Art Business Computer Education Game Health Home
0.438 0.205 0.250 0.366 0.206 0.253 0.225
News Recreation Science Shopping Society Sport Child
0.168 0.253 0.753 0.132 0.319 0.194 0.339
In this example, a documentary provided by Mediaset is
analyzed that concerns the life of Leonardo da Vinci. From the description provided we can see that he was a scientist as well as an artist, and so the algorithm gives a high score to “Science” and a lesser one but still high score to “Art” categories.
More details and examples of the multimedia content indexing delivered by the SRP tool are provided in [30].
A.2.3 Recommendation algorithm evaluation via simulations
In order to evaluate the performance of the algorithm used in the Social Recommendation and Personalization Tool, we also performed some offline experiments via simulations on MATLAB in a similar way as in [21]. In order to achieve this task, sets of content items are given a scoring on the 14 categories, and sets of users with a specified behaviour are created. Based on their behaviour, the users have different probabilities on performing actions on a content item, depending on the relevance and thus the likelihood that the user is interested in the item. Although the users are artificial, we make reasonable assumptions trying to emulate a real-life user behaviour.
In our simulation we have created 50 videos, having 8 enrichments and 8 advertisements each, and a feature vector of 14 categories. Videos are assigned into 5 classes, where in
each class,
elements get a higher score,
corresponding to different video topics (e.g., arts and science). 30 users are created to interact with the content and are again divided in 5 classes, in a similar way as the videos. Each user class implies different interests and preferences and so users that tend to select different videos and enrichments.
The simulation consists of 200 recommendation rounds where, in each round, a list of 6 most relevant videos according to the current profile of the user is presented him, in a ranked order. As already described in Section III, the hybrid recommendation approach we are using combines the content and the collaborative recommendation approach as follows:
( ) ( )
( ) ( )
where is the tunable parameter. For the collaborative part of the algorithm, we randomly
assign 7 users as friends of each user and we use the 5 closest ones as his/her neighbours, which are the ones whose profile vectors are used to provide the collaborative recommendations.
As far as the similarity metrics are concerned, we perform a comparative evaluation between inner product, cosine and Euclidean similarities. More information on the similarity metrics and the respective results are presented in this section.
As mentioned, user behavioural vectors are used to simulate how users interact with the video, and more specifically 5 interactions are considered:

114
International Journal on Advances in Software, vol 12 no 1 & 2, year 2019, http://www.iariajournals.org/software/
2019, © Copyright by authors, Published under agreement with IARIA - www.iaria.org
● Percentage of video watched ● Number of clicks on enrichments ● Number of share of enrichments ● Number of click on ads ● Explicit relevance feedback
These interactions are the same as the ones used in the
actual tool. Videos are watched by the user based on the video
ranking the algorithm provides, and with a probability relevant to the video’s rank and the user’s behavioural vector, the user performs or not the above actions. The probabilistic nature of the process is used so that not all users perform all actions, as well as to capture the realistic tendency of users following particular behaviour based on their actual interest.
After the user has finished his actions, an update procedure follows, similar to the one described in [21]. It should be noted that most of the parameters have been chosen to provide the best results based on the work presented in [21], parameters that were also used on the implementation of the Social Recommendation and Personalization tool.
In order to reduce the randomness from our results, we run the experiment 10 times and calculated the average values on our figures.
A.2.4 Evaluation Metrics The system is evaluated based on three metrics, in order
to measure its effectiveness. The metrics used are the Profile Distance, the Discounted Cumulative Gain and the R-score [34] and are defined as in [21].
● Profile Distance The Profile Distance metric, measures the difference
between the generated profile score of the users from the tool and the actual predefined profile score that corresponds to the actual interests and preferences of the user. In the simulations, this corresponds to the Euclidean distance of the user profile and the user behaviour vector. From the calculation of the metric we can see if the user vector converges to the actual interests through the constant update process based on the interactions of the user with the content and from its change over time, measure how fast, given a new user with no profile, this convergence takes place.
● Discounted Cumulative Gain Another method of evaluating the system is by measuring
how “correct” is the ordering of the recommendations the tool provides to the specific user. Since actually knowing the correct ordering is impossible, we approximate it by assigning a utility score to the recommendations list, which is the sum of the utility score each individual recommendation has. The utility of each recommendation is the utility of the recommended item, as a function of the explicit feedback provided by the user, discounted by a factor based on the position of the recommendation on the list. This metric assumes that the recommendations on top of the list, are more likely to be selected by the user, and thus discount more heavily towards the end of the list.
In the Discounted Cumulative Gain, the discount, as we go down the list, follows a logarithmic function and more specifically,
∑
( )
where is the item position in the list and is the user’s rating on the item . The base of the logarithm typically takes a value between 2 and 10, but base of 2 is the most commonly used [35].
● R-score The R-score follows the same idea of evaluating the
“correct” ordering of the recommendations but instead of a logarithmic discount, it uses an exponential one. Since the items towards the bottom of the list are mostly ignored from the scoring, the R-score measure is more appropriate when the user is expected to select only a few videos from the top of the list.
The equation that is used for the calculation of the R-score is the following one,
∑ ( )
where is the item position in the list, is the user’s rating
on the item , is the neutral rating denoting the
indifference of the user for the item ( in our tool), and
is a tunable parameter that controls the exponential
decline [34].
A.2.5 Simulation Results In the first part of the evaluation, we chose as similarity
metric the Euclidean similarity and tuned the parameter for the hybrid recommendation scheme. The values used on this part of the experiment are:
● for collaborative recommendation only,
● for content-based recommendation only,
● for the hybrid approach where both
content and collaborative recommendations are
equally taken into account. Even though a similar evaluation was already performed
in [21], in our evaluation, the collaborative recommendation part of the approach makes use of the “friends” concept where only a subset of the users is taken into consideration on the neighbour selection process.
In Fig. 14, one can see how the Profile Distance between the generated user profile and the expected one is affected with respect to theta. The smaller the distance, the more accurate the final representation of the user is, concerning his interests and preferences. As expected, the content-based only approach is the best performing one on this metric, while the hybrid approach’s performance is close, since using only his own profile, the algorithm can easier tune it towards convergence. The least successful one is the collaborative approach only with significant distance from the other two, which is expected since the algorithm tries indirectly to deduce the user’s profile through the profile of his friends. Even though the hybrid approach uses both content based and collaborative methods, its performance on the metric is more than satisfactory, while making use of the
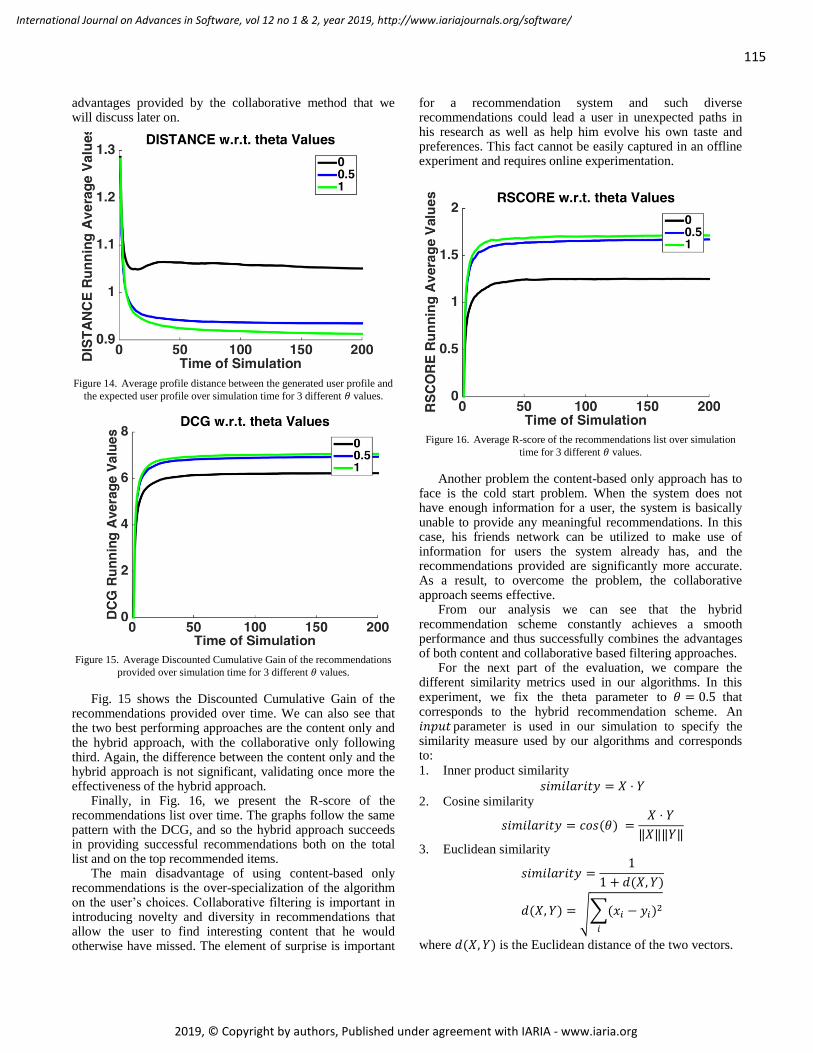
115
International Journal on Advances in Software, vol 12 no 1 & 2, year 2019, http://www.iariajournals.org/software/
2019, © Copyright by authors, Published under agreement with IARIA - www.iaria.org
advantages provided by the collaborative method that we will discuss later on.
Figure 14. Average profile distance between the generated user profile and
the expected user profile over simulation time for 3 different values.
Figure 15. Average Discounted Cumulative Gain of the recommendations
provided over simulation time for 3 different values.
Fig. 15 shows the Discounted Cumulative Gain of the recommendations provided over time. We can also see that the two best performing approaches are the content only and the hybrid approach, with the collaborative only following third. Again, the difference between the content only and the hybrid approach is not significant, validating once more the effectiveness of the hybrid approach.
Finally, in Fig. 16, we present the R-score of the recommendations list over time. The graphs follow the same pattern with the DCG, and so the hybrid approach succeeds in providing successful recommendations both on the total list and on the top recommended items.
The main disadvantage of using content-based only recommendations is the over-specialization of the algorithm on the user’s choices. Collaborative filtering is important in introducing novelty and diversity in recommendations that allow the user to find interesting content that he would otherwise have missed. The element of surprise is important
for a recommendation system and such diverse recommendations could lead a user in unexpected paths in his research as well as help him evolve his own taste and preferences. This fact cannot be easily captured in an offline experiment and requires online experimentation.
Figure 16. Average R-score of the recommendations list over simulation
time for 3 different values.
Another problem the content-based only approach has to face is the cold start problem. When the system does not have enough information for a user, the system is basically unable to provide any meaningful recommendations. In this case, his friends network can be utilized to make use of information for users the system already has, and the recommendations provided are significantly more accurate. As a result, to overcome the problem, the collaborative approach seems effective.
From our analysis we can see that the hybrid recommendation scheme constantly achieves a smooth performance and thus successfully combines the advantages of both content and collaborative based filtering approaches.
For the next part of the evaluation, we compare the different similarity metrics used in our algorithms. In this experiment, we fix the theta parameter to that corresponds to the hybrid recommendation scheme. An parameter is used in our simulation to specify the similarity measure used by our algorithms and corresponds to: 1. Inner product similarity
2. Cosine similarity
( )
3. Euclidean similarity
( )
( ) √∑( )
where ( ) is the Euclidean distance of the two vectors.

116
International Journal on Advances in Software, vol 12 no 1 & 2, year 2019, http://www.iariajournals.org/software/
2019, © Copyright by authors, Published under agreement with IARIA - www.iaria.org
In Fig. 17, we can see that the Euclidean similarity is the best performing similarity measure, achieving a slightly better score than the cosine similarity, while the inner product similarity is the worst performing. What’s more, the Euclidean similarity seems conceptually more appropriate in our use case, since each user and each item can be modeled as a point in the 14-dimensional metric space and the closer they are on the space, the more similar they are.
Figure 17. Average profile distance between the generated user profile and
the expected user profile over simulation time for 3 different similarity
metrics: 1) inner product similarity, 2) cosine similarity, 3) Euclidean
similarity.
The Discounted Cumulative Gain is depicted in Fig. 18 and follows the same trend, showing that the Euclidean similarity outperforms the other two similarity measures by providing better overall recommendation lists to the user. The inner product, which is the simplest one, still performs worse than the rest.
Figure 18. Average Discounted Cumulative Gain of the recommendations
provided over simulation time for 3 different similarity metrics: 1) inner
product similarity, 2) cosine similarity, 3) Euclidean similarity.
Finally, concerning the R-score (Fig. 19), the Euclidean and the cosine similarity achieve the highest score with minor differences, while the inner product achieves
significantly lower score. The fact that the two first measures perform almost the same while in the DCG metric the Euclidean performs better, shows that the Euclidean similarity can better fine tune the lower scoring recommendations since even the lower scoring items, that the R-score ignores, are more likely to be more relevant to the user’s preferences.
Figure 19. Average R-score of the recommendations list over simulation
time for 3 different similarity metrics: 1) inner product similarity, 2) cosine similarity, 3) Euclidean similarity.
More simulations concerning the parameters used can be found in the work presented in [21].
B. Subjective benchmarking
1) Integrated Trends Discovery Tool
The Integrated Trends Discovery Tool was evaluated by numerous individuals that were mainly students from the National Technical University of Athens, which ICCS is affiliated with. The students were mainly coming from the Techno Economics Masters program
1, jointly offered by the
Department of Industrial Management and Technology at the University of Piraeus and the National Technical University of Athens, which is a highly interdisciplinary graduate programme targeted at professionals with existing market/business/working experience. The evaluation process included the following steps:
a) A document describing the core concepts of the
PRODUCER project and the core innovations of
the ITD tool was initially shared with the testers.
b) After reading the document the testers watched a
10-minute video demonstrating the utilisation of
the ITD tool. The video contained textual
information about the internal mechanisms that
contribute in generating the visualised outcome at
the front end of the tool.
1
http://mycourses.ntua.gr/course_description/index.php?cidReq=PSTGR1083

117
International Journal on Advances in Software, vol 12 no 1 & 2, year 2019, http://www.iariajournals.org/software/
2019, © Copyright by authors, Published under agreement with IARIA - www.iaria.org
c) Finally, the testers answered an online Google
Forms based questionnaire. The questionnaire is
available under [36]. This process was completed by 157 individuals. In
addition, another group of 20 individuals, after following steps a) and b), were requested to access a live version of the tool and to freely try the various functionalities. Then they proceeded on step c) and answered the same questionnaire as well. The results from the superset containing both user groups (177 individuals) are presented in the following figures. As depicted in Fig. 20, the ITD tool testers were mainly young persons (18-34 years old), and are in principle students and/or full-time employees. Their current occupations are mainly related to engineering, IT, and business/financial as presented in Fig. 21.
Figure 20. Ages of the user group that tested the Integrated Trends
Discovery Tool.
Figure 21. Occupation of the user group that tested the Integrated Trends
Discovery Tool.
All testers are familiar with the concept of social media services as they utilize them for long time period (more than five years) and for 1 to 4 hours per day (Fig. 22, 23). In addition, most testers are highly interconnected with other users, having more than 100 connections (Fig. 24), and seem to prefer Facebook, LinkedIn, Google, Instagram and Twitter (Fig. 25).
Figure 22. Time period of using Social Media Services.
Figure 23. Time of usage per day of Social Media Services.
Figure 24. Number of connections each user has on his Social Media
profiles.
Figure 25. Social Networking Sites used by the user group.
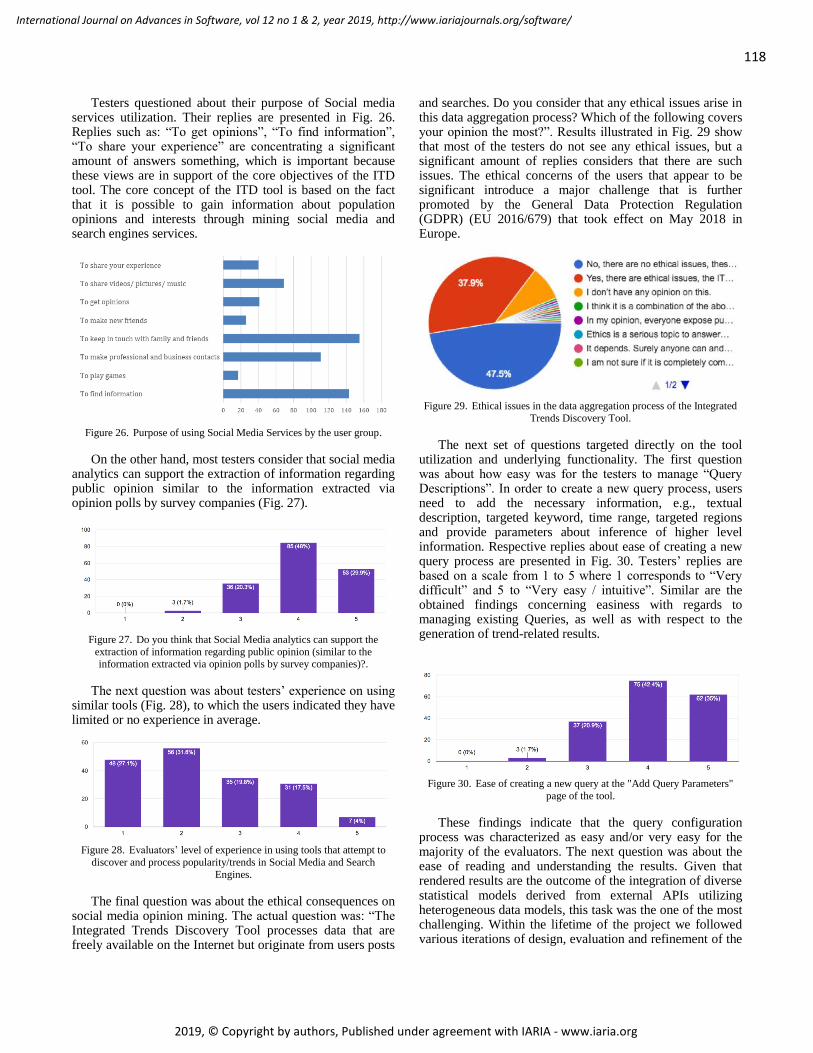
118
International Journal on Advances in Software, vol 12 no 1 & 2, year 2019, http://www.iariajournals.org/software/
2019, © Copyright by authors, Published under agreement with IARIA - www.iaria.org
Testers questioned about their purpose of Social media services utilization. Their replies are presented in Fig. 26. Replies such as: “To get opinions”, “To find information”, “To share your experience” are concentrating a significant amount of answers something, which is important because these views are in support of the core objectives of the ITD tool. The core concept of the ITD tool is based on the fact that it is possible to gain information about population opinions and interests through mining social media and search engines services.
Figure 26. Purpose of using Social Media Services by the user group.
On the other hand, most testers consider that social media analytics can support the extraction of information regarding public opinion similar to the information extracted via opinion polls by survey companies (Fig. 27).
Figure 27. Do you think that Social Media analytics can support the
extraction of information regarding public opinion (similar to the information extracted via opinion polls by survey companies)?.
The next question was about testers’ experience on using similar tools (Fig. 28), to which the users indicated they have limited or no experience in average.
Figure 28. Evaluators’ level of experience in using tools that attempt to
discover and process popularity/trends in Social Media and Search
Engines.
The final question was about the ethical consequences on social media opinion mining. The actual question was: “The Integrated Trends Discovery Tool processes data that are freely available on the Internet but originate from users posts
and searches. Do you consider that any ethical issues arise in this data aggregation process? Which of the following covers your opinion the most?”. Results illustrated in Fig. 29 show that most of the testers do not see any ethical issues, but a significant amount of replies considers that there are such issues. The ethical concerns of the users that appear to be significant introduce a major challenge that is further promoted by the General Data Protection Regulation (GDPR) (EU 2016/679) that took effect on May 2018 in Europe.
Figure 29. Ethical issues in the data aggregation process of the Integrated
Trends Discovery Tool.
The next set of questions targeted directly on the tool utilization and underlying functionality. The first question was about how easy was for the testers to manage “Query Descriptions”. In order to create a new query process, users need to add the necessary information, e.g., textual description, targeted keyword, time range, targeted regions and provide parameters about inference of higher level information. Respective replies about ease of creating a new query process are presented in Fig. 30. Testers’ replies are based on a scale from 1 to 5 where 1 corresponds to “Very difficult” and 5 to “Very easy / intuitive”. Similar are the obtained findings concerning easiness with regards to managing existing Queries, as well as with respect to the generation of trend-related results.
Figure 30. Ease of creating a new query at the "Add Query Parameters"
page of the tool.
These findings indicate that the query configuration process was characterized as easy and/or very easy for the majority of the evaluators. The next question was about the ease of reading and understanding the results. Given that rendered results are the outcome of the integration of diverse statistical models derived from external APIs utilizing heterogeneous data models, this task was the one of the most challenging. Within the lifetime of the project we followed various iterations of design, evaluation and refinement of the

119
International Journal on Advances in Software, vol 12 no 1 & 2, year 2019, http://www.iariajournals.org/software/
2019, © Copyright by authors, Published under agreement with IARIA - www.iaria.org
way that the trend discovery results are presented to the end user. For this reason, various intuitive graphs (times series graphs, bar charts, pie chart, node graphs) are utilized in order to make the results comprehensible to users that are not demonstrating a background in statistics or in data engineering. The outcome of this evaluation is presented in Fig. 31 and most of the tool evaluators find the results reading process relatively easy.
Figure 31. Ease of reading the results.
The last question related to the user interaction was “How user-friendly is the Integrated Trends Discovery Tool?” in general. The respective results are presented in Fig. 32.
Figure 32. Overall user-friendliness of the Integrated Trends Discovery
Tool.
As already described, evaluators at the first steps of the overall process had to read a textual description of the ITD tool objectives, which were also presented in the first minutes of the video describing the tool’s utilization. Based on the presented list of innovations and after the demonstration and actual utilization of the tool, evaluators replied two different questions having the same target. The questions were: “How successful is the Integrated Trends Discovery Tool in performing its intended tasks?” and “Meets expectations as these are defined in the innovations list presented upon video start”. Results are presented in Fig. 33 and Fig. 34.
Figure 33. How successful is the Integrated Trends Discovery Tool in
performing its intended tasks.
Figure 34. Meets expectations as these are defined in the innovations list
presented upon video start.
The last question with regards to the actual evaluation of the tool was related to the overall software quality as this is disclosed through the execution of various tasks. Since this is a difficult question for evaluators with non-technical background, it was considered as optional and hence it was not replied by the whole set of testers. The respective results are illustrated in Fig. 35.
Figure 35. 65: Evaluate overall software quality.
ITD tool developers aim to continue the refinement of the service and to extend the provided functionalities. To this end, evaluators were questioned on which of the provided reports are the more useful. The responses are illustrated in Fig. 36.
Figure 36. The Integrated Trends Discovery Tool provides various reports.
Which are the more useful for you?.
Figure 37. Estimation of cost in order to utilize ITD tool in business
environment.

120
International Journal on Advances in Software, vol 12 no 1 & 2, year 2019, http://www.iariajournals.org/software/
2019, © Copyright by authors, Published under agreement with IARIA - www.iaria.org
Finally, evaluators were questioned: “The Integrated Trends Discovery Tool currently utilizes mainly the free versions of public APIs (e.g., Google API, Twitter API, ...). Hence there are often delays and matters related to limited access to data. Do you believe that a company interested in the tool's results would be willing to purchase more advanced services (e.g., more detailed user demographics, data from larger user populations, data that span longer to the
past) for an additional fee?If so, which of the following
amounts do you consider as appropriate for the needs of a small company?”. The outcome of 177 responses is illustrated in Fig. 37.
2) Social Recommendation and Personalization Tool
For the evaluation of the SRP tool, 143 students from the same set of users used for the evaluation of the Integrated Trends Discovery Tool used the tool and answered the corresponding questionnaires [37]. The demographics of the aforementioned user base can be seen in Figs. 38, 39, 40.
Figure 38. Ages of the user group that tested the Social Recommendation
and Personalization Tool.
Education level of the user group that tested the Social
Recommendation and Personalization Tool.A short video showing the functionalities of the tool and the expected interaction from the users was shown to the users and they were expected to use the tool on their own via its standalone GUI. After exposing themselves to the tool and using it until they were satisfied that they had formed an opinion on its
capabilities, they were asked to respond to the corresponding questionnaire.
The experience of the users that participated in the process on recommender systems is shown in Fig. 41, confirming that a reasonable user diversity was well achieved.
Figure 39. Occupation of the user group that tested the Social
Recommendation and Personalization Tool
Figure 40. Level of experience with Social Recommendation and
Personalization Tools (1: no experience, 5: much experience).
Users were asked to create an account on the tool inserting their information in order to create the basic profile. The information required are certain demographics (age, country etc.) and some personal information (name, email etc.) as well as a username and a password. The information required to be manually inserted by the users were limited, as can be confirmed by the responses of the users (Figs. 42, 43).
After creating his/her account, he/she continued to explore the actual functionalities of the tool. By clicking on the “Videos” tab, two options were available. On the one hand, the user could see the recommended videos that the tool suggests based on the profile the tool has created until now. In the beginning, the profile was created based on the demographics chosen by the user, so that content relevant to similar users was presented. On the other hand, a search functionality was available, where the user could search the database of the SRP tool of more than 2600 videos by providing text relevant to what he/she was searching for. The concept was to use the search functionality together with the

121
International Journal on Advances in Software, vol 12 no 1 & 2, year 2019, http://www.iariajournals.org/software/
2019, © Copyright by authors, Published under agreement with IARIA - www.iaria.org
recommended videos and based on the interaction the user had on the videos, the tool should be able to deduce the user’s profile and suggest relevant videos to his/her interests.
Figure 41. Difficulty of adding data to the system (1: very difficult, 5: very
easy).
Figure 42. Were the data needed by the system too much?.
After some iterations of using the tool, the users had to rate the relevance of the recommended content and the user’s interest in each of the 14 categories presented. The results of the procedure can be seen in Fig. 44 and Fig. 45.
Matching of the generated with the expected user's
profile (1: unacceptable, 5: excellent).In both Fig. 44 and Fig. 45, we see that the majority of the users rate the tools performance as more than satisfactory. In Fig. 44, 39% of the users rated the profile matching generated by the tool and the one they had in mind while using the tool with 3 starts while
38% rated it with 4 stars. On the other hand, in Fig. 45, the matching of the recommended videos to the user’s expectations shows again that the majority was satisfied, with a rating of 3 stars for the 39% and of 4 stars for the 36%. It is important to note that many times, the actual content of the video was rated by the users, something that is not important to the functionality of the tool, and so there could be some misinterpretation of the actual question. The limited availability of content could also play an important role in the results of the above questions.
Figure 43. Matching of the recommended videos to the user's expectations
(1: unacceptable, 5: excellent).
When asked about the overall Quality of Experience they had while using the tool, 49% of users rated the system with more than 4 stars (4 or 5 stars) stating that the Quality of Experience was more than satisfactory (Fig. 46).
Figure 44. Overall Quality of Experience (1: unacceptable, 5: excellent).
One very interesting result coming from the questionnaires, is the importance the users give on such recommendation systems on a documentary content provider platform such as the PRODUCER platform (Fig. 47, Fig. 48). According to the graph, the Social Recommendation and Personalization tool provides a highly appreciated feature of the platform that definitely increases the Quality of Experience of the user, while helping him achieve tasks faster and more efficiently.

122
International Journal on Advances in Software, vol 12 no 1 & 2, year 2019, http://www.iariajournals.org/software/
2019, © Copyright by authors, Published under agreement with IARIA - www.iaria.org
Figure 45. Importance of recommendations on videos (1: not essential, 5:
absolutely essential).
Figure 46. Importance of recommendations on enrichments (1: not
essential, 5: absolutely essential).
Finally, users were asked about the relation that they expect between the video content and the enrichments that are recommended to the user by the tool. As we can see from Fig. 49, the majority has responded that they would like a balance between being relevant to the video content and the user profile, which shows that they are open to having recommendations that are more loosely tied to the content itself.
Figure 47. Preferred relation of enrichments to the video content (1:
Tightly related to video content, 5: Tightly related to user profile).
Recommending something slightly out of context as far as it is of interest to the user seems to be an option opening
some interesting research topics for future exploration. Adding the capability to tune that relation based on user’s actions or the nature of the content could seem appropriate.
V. CONCLUSIONS
This paper analyses two software tools that aim to modernize the documentary creation methods. Initially the ITD tool is presented, which focuses on the targeted audience interests, identification and satisfaction. The ITD tool allows the identification of the most engaging topics to specified target audiences in order to facilitate professional users in the documentary preproduction phase. The SRP tool significantly improves the viewers’ perceived experience via the provision of tailored enriched documentaries that address their personal interests, requirements and preferences. The core innovations of these tools and the delta from previously published work of the authors can be summarized as follows. First, both tools are used to reduce cost for the documentary production by filtering the content provided on both pre-production and post-production phases. Second, the ITD tool supports the reorientation of the documentary early on the preproduction phase based on the interests of potential audiences, thus targeting topics likely to attract larger audiences. Third, the ITD tool is designed to couple the knowledge extracted from several social media networks to investigate the audience’s interests and identify the respective trends. This has already been tested over Twitter and Google Trends. Fourth, the ITD tool is also used to extract information regarding the user demographics, based on their interactions with social media. Evaluation results concerning the discovery of user gender have been presented. Fifth, the SRP tool exploits a different indexing method to classify the content on the 14 categories using NLP and the Word2Vec model instead of a naïve tf-idf algorithm. This has not been investigated before and it proves to be quite efficient in terms of performance. Sixth, the SRP tool supports collaborative filtering making use of the friends’ network of the user instead of the entire user database, which enhances the performance of the proposed approach. Seventh, the evaluation of the SRP tool was performed based on different similarity metrics resulting in favouring the Euclidean similarity over the cosine similarity. Usage of this metric further enhanced the SRP tool’s performance.
The prototype implementations of these two tools have been demonstrated and evaluated over a period of 3 months by end users of varying profiles. The evaluation process provided valuable feedback for further improving the overall functionality of the tools but also for the specification of reliable exploitation channels and the identification of related business opportunities
Future plans include the tools’ integration with proprietary documentary production support services and infrastructures, as well as the extension of various stand-alone features that have been identified as more interesting and useful during the evaluation process. Moreover, the integration of additional social media networks and open data repositories to enhance the accuracy of the trends and interests identified by the two tools also lies among the

123
International Journal on Advances in Software, vol 12 no 1 & 2, year 2019, http://www.iariajournals.org/software/
2019, © Copyright by authors, Published under agreement with IARIA - www.iaria.org
authors’ future plans. Finally, the authors plan to investigate the suitability of the tools for domains other than documentary production, adapt them and evaluate their performance in these domains.
ACKNOWLEDGMENT
This work has been partially supported by the European Commission, Horizon 2020 Framework Programme for research and innovation under grant agreement no 731893.
REFERENCES
[1] G. Mitsis, N. Kalatzis, I. Roussaki, E. E. Tsiropoulou, S. Papavassiliou, and S. Tonoli, “Social Media Analytics in Support of Documentary Production,” 10th International Conference on Creative Content Technologies (CONTENT 2018) IARIA, Feb. 2018, pp. 7-13, ISSN: 2308-4162 ISBN: 978-1-61208-611-8.
[2] The PRODUCER project, http://www.producer-project.eu, 2017. [Retrieved May 2019]
[3] G. Mitsis, N. Kalatzis, I. Roussaki, E. E. Tsiropoulou, S. Papavassiliou, and S. Tonoli, “Emerging ICT tools in Support of Documentary Production,” 14th European Conference on Visual Media Production, Dec. 2017, ISBN 978-1-4503-5329-8.
[4] J. Ginsberg, M. H. Mohebbi, R. S. Patel, L. Brammer, M. S. Smolinski, and L. Brilliant, “Detecting influenza epidemics using search engine query data,” Nature 457, pp. 1012-1014, 2009, doi:10.1038/nature07634.
[5] A. J. Ocampo, R. Chunara, and J. S. Brownstein, “Using search queries for malaria surveillance, Thailand,” Malaria Journal, Vol. 12, pp. 390-396, 2013, doi:10.1186/1475-2875-12-390.
[6] S. Yang, M. Santillana, J.S. Brownstein, J. Gray, S. Richardson and S.C. Kou, “Using electronic health records and Internet search information for accurate influenza forecasting,” BMC Infectious Diseases, Vol. 17, pp. 332-341, Dec. 2017, doi:10.1186/s12879-017-2424-7.
[7] F. Ahmed, R. Asif, S. Hina, and M. Muzammil, “Financial Market Prediction using Google Trends,” International Journal of Advanced Computer Science and Applications, Vol. 8, No.7, pp. 388-391, 2017.
[8] N. Askitas and K. F. Zimmermann, “Google econometrics and unemployment forecasting,” Applied Economics Quarterly, Vol. 55, pp. 107-120, Sep. 2009.
[9] S. Vosen and T. Schmidt, “Forecasting private consumption: survey-based indicators vs. Google trends,” Journal of Forecasting, Vol. 30, No. 6, pp. 565–578, Jan. 2011, doi:10.1002/for.1213.
[10] S. Goel, J. M. Hofman, S. Lahaie, D. M. Pennock, and D. J. Watts, “Predicting consumer behavior with Web search,” National Academy of Sciences, Vol. 107, No. 41, Oct. 2010, pp. 17486–17490, doi:10.1073/pnas.1005962107.
[11] B. O'Connor, R. Balasubramanyan, B. R. Routledge, and N. A. Smith, “From Tweets to Polls: Linking Text Sentiment to Public Opinion Time Series,” Fourth International AAAI Conference on Weblogs and Social Media, May 2010, pp. 122–129.
[12] M. X. Hoang, X. Dang, X. Wu, Z. Yan, and A. K. Singh, “GPOP: Scalable Group-level Popularity Prediction for Online Content in Social Networks,” 26th International Conference on World Wide Web, Apr. 2017, pp. 725-733, ISBN: 978-1-4503-4914-7.
[13] A. Oghina, M. Breuss, M. Tsagkias, and M. de Rijke, “Predicting IMDB movie ratings using social media,” 34th European conference on Advances in Information Retrieval Springer-Verlag, Apr. 2012, pp. 503-507, doi:10.1007/978-3-642-28997-2_51.
[14] B. Bhattacharjee, A. Sridhar, and A. Dutta, “Identifying the causal relationship between social media content of a Bollywood movie and its box-office success-a text mining approach,” International Journal of Business Information Systems, Vol. 24, No. 3, pp. 344-368, 2017.
[15] Source code for Integrated Trends Discovery tool, https://github.com/nikoskal/itd_tool [Retrieved May 2019]
[16] J. Osofsky, “After f8: Personalized Social Plugins Now on 100,000+Sites,” https://developers.facebook.com/blog/post/382, 2010. [Retrieved May 2019]
[17] Source code for Social Recommendation and Personalization tool, https://github.com/vinPopulaire/SRPtool [Retrieved May 2019]
[18] A. Micarelli and F. Sciarrone, “Anatomy and empirical evaluation of an adaptive web-based information filtering system,” User Modeling and User-Adapted Interaction, Vol. 14, No. 2-3, pp 159–200, Jun. 2004, doi:10.1023/B:USER.0000028981.43614.94.
[19] G. Gentili, A. Micarelli, and F. Sciarrone, “Infoweb: An adaptive information filtering system for the cultural heritage domain,” Applied Artificial Intelligence, Vol. 17, No. 8-9, pp. 715–744, Sep. 2003, doi:10.1080/713827256.
[20] T. Mikolov, K. Chen, G. Corrado, and J. Dean, "Efficient estimation of word representations in vector space," arXiv preprint arXiv:1301.3781, Jan. 2013.
[21] E. Stai, S. Kafetzoglou, E. E. Tsiropoulou, and S. Papavassiliou, “A holistic approach for personalization, relevance feedback & recommendation in enriched multimedia content,” Multimedia Tools and Applications, Vol. 77, No. 1, pp 283-326, Jan 2018, doi:10.1007/s11042-016-4209-1.
[22] J. MacQueen, “Some methods for classification and analysis of multivariate observations,” 5th Berkeley symposium on mathematical statistics and probability, Jun. 1967, Vol. 1, No. 14, pp. 281–297.
[23] J. D. Burger, J. Henderson, G. Kim, and G. Zarrella. “Discriminating gender on Twitter,” Conference on Empirical Methods in Natural Language Processing, Association for Computational Linguistics, Jul. 2011, pp. 1301–1309, ISBN: 978-1-937284-11-4.
[24] A. Culotta, N. R. Kumar, and J. Cutler, “Predicting the Demographics of Twitter Users from Website Traffic Data,” AAAI, Jan. 2015, pp. 72–78.
[25] Q. Fang, J. Sang, C. Xu, and M. S. Hossain, “Relational user attribute inference in social media,” IEEE Transactions on Multimedia, Vol. 17, No. 7, pp. 1031–1044, Jul. 2015, doi:10.1109/TMM.2015.2430819.
[26] Y. Fu, G. Guo, and T. S. Huang, “Age synthesis and estimation via faces: A survey,” IEEE transactions on pattern analysis and machine intelligence, Vol. 32, No. 11, pp. 1955–1976, Nov. 2010, doi:10.1109/TPAMI.2010.36.
[27] O. Giannakopoulos, N. Kalatzis, I. Roussaki, and S. Papavassiliou, “Gender Recognition Based on Social Networks for Multimedia Production,” 13th IEEE Image, Video, and Multidimensional Signal Processing Workshop (IVMSP 2018), IEEE Press, Jun. 2018, pp. 1-5, doi:10.1109/IVMSPW.2018.8448788

124
International Journal on Advances in Software, vol 12 no 1 & 2, year 2019, http://www.iariajournals.org/software/
2019, © Copyright by authors, Published under agreement with IARIA - www.iaria.org
[28] N. Kalatzis, I. Roussaki, C. Matsoukas, M. Paraskevopoulos, S. Papavassiliou, and S. Tonoli, “Social Media and Google Trends in Support of Audience Analytics: Methodology and Architecture,” 7th International Conference on Data Analytics (DATA ANALYTICS 2018), Nov. 2018.
[29] Google trends engine, https://trends.google.com/ [Retrieved May 2019]
[30] Wikipedia pretrained glove models, http://nlp.stanford.edu/data/glove.6B.zip [Retrieved May 2019]
[31] J. Pennington, R. Socher, and C. Manning, "Glove: Global vectors for word representation," proceedings of the 2014 conference on empirical methods in natural language processing (EMNLP), 2014, pp. 1532-1543, doi:10.3115/v1/D14-1162.
[32] Question-words test, https://storage.googleapis.com/google-code-archive-source/v2/code.google.com/word2vec/source-archive.zip [Retrieved May 2019]
[33] Deliverable D4.3, the PRODUCER project,
http://www.producer-project.eu/wp-content/uploads/2018/07/D4.3-Evaluation-Benchmarking.pdf [Retrieved May 2019]
[34] G, Shani and A. Gunawardana, "Evaluating recommendation systems," Recommender systems handbook, pp. 257-297. Springer, Boston, MA, 2011.
[35] C. L. Clarke, M. Kolla, G. V. Cormack, O. Vechtomova, A. Ashkan, S. Büttcher, and I. MacKinnon, "Novelty and diversity in information retrieval evaluation," Proceedings of the 31st annual international ACM SIGIR conference on Research and development in information retrieval, ACM, Jul. 2008, pp. 659-666, doi:10.1145/1390334.1390446.
[36] ITD questionnaire, https://docs.google.com/forms/d/e/ 1FAIpQLSfkjQPiQbyOxI2iCj2wTzmT8V2Ilee-s_eLyg8h3n_696vWBg/viewform [Retrieved May 2019]
[37] SRPT questionnaire, https://docs.google.com/forms/d/ 1ihDQ5kM5joDHa848JNug8gORpECSGhtRrsFTjLxelus. [Retrieved May 2019]

125
International Journal on Advances in Software, vol 12 no 1 & 2, year 2019, http://www.iariajournals.org/software/
2019, © Copyright by authors, Published under agreement with IARIA - www.iaria.org
Rethinking Enterprise Architecture Frameworks for the Digital Age: The Digital Diamond Framework and EA Tool
Roy Oberhauser Computer Science Dept.
Aalen University Aalen, Germany
email: [email protected]
Abstract - Enterprise Architecture (EA) Frameworks (EAFs) have attempted to support comprehensive and cohesive modeling and documentation of the enterprise. However, these EAFs were not conceived for today’s rapidly digitalized enterprises and the associated IT complexity. A digitally-centric EAF is needed, freed from the past restrictive EAF paradigms and embracing the new potential in a data-centric world. This paper proposes an alternative EAF that is digital, holistic, and digitally sustainable - the Digital Diamond Framework. D2F is designed for responsive and agile enterprises, for aligning business plans and initiatives with the actual enterprise state, and addressing the needs of EA for digitized structure, order, modeling, and documentation. The feasibility of D2F is demonstrated with a prototype implementation of an EA tool that applies its principles, showing how the framework can be practically realized, while a case study based on ArchiSurance example and an initial performance and scalability characterization provide additional insights as to its viability.
Keywords- enterprise architecture frameworks; enterprise architecture; enterprise modeling; business architecture; digitalization.
I. INTRODUCTION This paper contributes a digitized, holistic, hyper-model
EA conceptual framework called the Digital Diamond Enterprise Framework (D2F) to provide a fundamentally digital and sustainable EA framework for a digital EA future. It extends [1] with an analysis of other EAFs and describes a prototype implementation of the Digital Diamond Enterprise Framework (D2F) to show its feasibility.
Enterprise Architecture (EA) concerns itself with comprehensively and cohesively modeling and documenting the structure and behavior of the business and IT infrastructure of an enterprise as a set of artifacts in order to communicate, implement change, and develop insights in support of strategic business planning and management science. Historically, EA emerged from a necessity to document information systems for management stakeholders. One of the most well-known EA Frameworks (EAF) is the Zachman Framework, first publicized in 1987 [2]. While one might think that after 30 years the EA area must be mature, Gartner's 2017 Hype Cycle for Enterprise Architecture [3] shows EA and EA Tools within the slope of Enlightenment - not yet in the Plateau of Productivity, and EAFs are in the Trough of Disillusionment.
Enterprises now face multiple contemporaneous challenges:
1) A major digital transformation of their industry [4]. While the digitalization rate (digital score) may vary across industries and economies, it is nevertheless impacting business strategies and necessarily EA. As big data, data analytics, business intelligence, and machine learning make inroads into enterprises, improved decision-making capabilities at all levels and across organizational entities empowers employees with new insights and assistance and additional automation.
2) Agility is restructuring internal people-centric enterprise management, processes, and projects to continuously flexible and responsive business forms, accelerating product and service delivery and improving efficiency (e.g., Scrum, DevOps, BizDevOps).
3) Service-networked and mobile software: the IT landscape is rapidly changing from large, siloed, hierarchical, and static deployments to cloud-centric, networked, and containerized micro functionality deployments. Software/data functionality becomes easily reusable and accessible via standard protocols and formats independent of programming language or platform. Its scale can be seen in various “death star”-like microservice network landscape visualizations (see Figure 1).
Figure 1. Visualization of microservices at Amazon [5].
Considering these major trends, the reality that EA is attempting to comprehensively model, document, and change has become much more complex than in previous decades. The era of siloed functional teams and applications is being superseded by a highly networked and integrated digitized era.
126
International Journal on Advances in Software, vol 12 no 1 & 2, year 2019, http://www.iariajournals.org/software/
2019, © Copyright by authors, Published under agreement with IARIA - www.iaria.org
This challenges currently available EAFs, which were mostly developed before these trends swept into enterprises and typically rely on a simplified box-and-matrix paradigm.
As to the use of EAFs in industry, in 2007 Ivar Jacobson reckoned 90% of the EA initiatives he was aware of had not resulted in anything useful, stating big gaps vs. seamless relationships as a primary reason [6]. A 2008 study showed two-thirds of EA projects failing to improve IT and business alignment [7], with the most frequent explanation being that connecting EA to business elements was difficult in practice. Hence, the EAFs of the past with their associated paradigms and their models cannot continuously reflect the dynamic enterprise realities in this digital age, thus they are illusionary, ineffective, inefficient, and no longer viable.
The application of EA and an EAF typically involves some kind of EA tooling. Considering the support for EA provided by EA Management (EAM) tools, Jugel el al. [8] investigated their visual analytics capabilities and collaborative decision-making support. Their findings identified the following five challenges and needs for EAM tools: 1. View configuration: An easy way to configure views is
needed to react to dynamic information demands. 2. View consideration: A method is needed to consider
several views in parallel to avoid losing the overall context. Additionally, views should always be kept up to date.
3. Interacting with views: Stakeholders need more interaction and visual analytics capabilities to analyze and plan EAs more efficiently.
4. Communication & collaboration: Methods are needed to better support communication & collaboration, e.g. by adding additional knowledge to views.
5. Stakeholder identification: There is a need for methods to identify stakeholders that have to be involved in decision-making processes.
The following research questions guided our investigation:
RQ1: Are there obvious deficiencies in the EAF and EA tool landscape, and if so, how can these be characterized?
If a new EAF and/or EA tool appear justifiable: RQ2: What should a digital EA framework address? RQ3: What requirements and viewpoints should an
associated digital EA tool implementation support? RQ4: Is it feasible for a digital EAF graph-centric EA tool
implementation to flexibly support the ArchiMate ArchiSurance case study examples across the various viewpoints?
RQ5: Does a graph-centric EA tool implementation appear viable based on an initial performance and scalability characterization?
This paper contributes a description of our digital EAF proposal D2F. We also contribute a demonstration via case study of the feasibility of D2F by describing an implementation of an EA tool prototype based on D2F principles and having the following features that address the above five EAM tool challenges:
• enterprise information model agnostic, • flexible meta-model,
• supports tagging can be used to add knowledge to elements/views,
• (re)configurable interactive dynamic (up-to-date) views,
• visual analytical capabilities, • and cross-platform and web-centric to more easily
involve and be accessible to diverse stakeholders. This paper is organized as follows: Section II discusses
background material on EA and related work. Section III describes the D2F. In Section IV, we describe our prototype tool that demonstrates how D2F can be implemented. Section V evaluates the implementation, and is followed by a conclusion in Section VI.
II. BACKGROUND AND RELATED WORK EA comprises the structural and behavioral aspects needed
for the enterprise to function and their adaptation to align with a vision. It thus covers business (including people), information (data), and technology (IT, hardware and software). EA has been compared to city planning [9], designing in the face of many unknowns.
A. EA Frameworks (EAFs) EAFs offer structure, associated terminology, and at times
processes for EA-related work. The Zachman Framework [2] utilizes a matrix paradigm and has changed over the years, using rows (layers) to address highest level business, then logical to the most detailed technical levels, and columns for the 5W’s and H (who, what, where, when, why, how). Many of these EAFs have common ancestors and historical influences. The Open Group Architecture Framework (TOGAF) [10] was first publicized in 1995 and provides a methodology for EA and a boxed architecture. The National Institute of Standards and Technology (NIST) EA Model is a five-layered reference model stemming from the 1980s and formed the basis for the Federal Enterprise Architecture Framework (FEAF) [11]. The Generic Enterprise Reference Architecture and Method (GERAM) [12] is a generalized EAF from the 1990s and focuses on enterprise integration and business process engineering.
Most EAFs use a 2D box or 3D cube paradigm when attempting to deal with the inherent complexity. Stroud and Ertas [13] developed a taxonomy for EAFs to show their interrelationships (influence, chronology, evolution). Sultanow et al. [14] classified 55 EAFs based on multidimensions (size, architectural domain scope, mutability, alignment, intention, chronology). Lim et al. [15] did a comparative study of five well-known EAFs, extracting and reifying them based on four dimensional concepts: view, perspective, scope, and time. In order to provide an impression of the extent and breadth of EAFs, Table I provides a consolidated list of acronyms and names of EAFs or architecture frameworks (AFs) and the source list used, which can be used to find more information about it. Due to space limitations, this is not intended to be a complete nor comprehensive list. Since various AFs could also be applied in the context of EA as well, no differentiation between AF and pure EAFs was attempted. The sources provided can be referred to for additional details.

127
International Journal on Advances in Software, vol 12 no 1 & 2, year 2019, http://www.iariajournals.org/software/
2019, © Copyright by authors, Published under agreement with IARIA - www.iaria.org
TABLE I. LIST OF EAFS* AND AFS*
Acronym Name Source 4+1 Kruchten’s 4+1 view model [16] AAF Automotive AF [16] ADS Architecture Description Standard von IBM [17] AF-EAF Air Force EAF [16] AF4MgtSys AF for Management Systems [16] AFIoT IEEE P2413 AF for the Internet of Things [16]
AGA Australian Government Architecture Reference Models [16]
AGATE Atelier de Gestion de l’ArchiTecturE des Systemes d’Information et de Communication (AGATE)
[16][17]
AM Avancier Methods [16] ARCHI ArchiMate [16][17] ARIES Architecting Innovative Enterprise Strategies [16] ARIS Architektur integrierter Informationssysteme [17] AUSDAF Australian Defence AF [16][17] BCA Business Capability Architecture [16] BDAF Big Data AF [16] BEAM Business Enterprise Architecure Modeling [16]
BPEAM iteratec best-practice enterprise architecture management (EAM) method [16]
C4IF Connection, Communication, Consolidation, Collaboration Interoperability Framework [17]
C4ISR [17]
CAFCR Customer Objectives, Application, Functional, Conceptual, and Realisation model [16]
CAFEA Common Approach to Federal Enterprise Architecture [16]
Casewise Casewise Framework [17]
CBDI-SAE CBDI Service Architecture & Engineering (CBDI-SAE™) for SOA [16]
CEA CEA Framework: A Service Oriented EAF (SOEAF) [16]
CEAF Commision Enterprise IT Architcture Framework (CEAF) [16]
CIAF Capgemini Integrated AF [16] CIMOSA CIM Open System Architecture [17]
CLEAR Comprehensive, Landscaped, Enterprise Architecture Representation Framework [17]
DNDAF Department of National Defence and the Canadian Forces AF [16][17]
DoD TRM Technical Reference Model [17] DoDAF US Department of Defense AF [16] [17] DRA1 Dragon1 [16] DYA Dynamic Architecture [16] e-GIF UK e-Government Interoperability Framework [17] E2AF Extended EAF [16][17]
EAAF OMB Enterprise Architecture Assessment Framework [17]
EAB Enterprise Architecture Blueprinting [16]
EAMMF GAO Enterprise Architecture Management Maturity Framework [17]
EAP Spewak’s Enterprise Architecture Planning [17]
EEAF US OMB Enterprise Architecture Assessment Framework [16]
EIF European Interoperability Framework des IDABC-Programms [17]
EPCAF The EPCglobal AF [16] ESAAF European Space Agency AF [16] ESSAF Essential AF [16] eTOM Business Process Framework (eTOM) [16] EXAF Extreme AF [16] FEAF US Federal EAF [16][17] FESS Framework of Enterprise Systems and Structures [16]
FFLV+GODS Functions-Flows-Layers-Views + Governance-Operations-Development-Support [16]
Acronym Name Source
FMLS-ADF FMLS Architecture Description Framework 3.0 (SE) [16]
FSAM Federal Segment Architecture Methodology (FSAM) [16]
GA Garland and Anthony [16]
GEA-NZ All-of-Government (AoG) Government Enterprise Architecture for New Zealand [16]
GEAF Gartner’s EAF [16][17]
GERA ISO 15704 Generic Enterprise Reference Architecture [16]
GERAM Generalised Enterprise Reference Architecture and Methodology [17]
GIM GRAI Integrated Methodology [17] HEAF Health EAF [16]
HIF Healthcare Information Framework (DIN V ENV 12443) [17]
IADS IBM Architecture Description Standard [16] IAF Index AF [16] IAF Integrated AF (Capgemini) [17] ICODE iCode Security AF [16] IFW IBM Information FrameWork (IFW) [16] IFW Information FrameWork [17] IIRA Industrial Internet Reference Architecture [16] ISO/IEC 42010
Recommended Practice for Architectural Description [17]
IT City Planning IT City Planning AF (Gartner) [17]
JTA DoD Joint Technical Architecture [17]
LEAD Leading Enterprise Architecture Development (LEAD)ing Practice [16]
MACCIS An Architecture Description Framework for Technical Infostructures and their Enterprise Environment
[16]
MEGAF MEGAF [16]
MIKE2.0 Method for an Integrated Knowledge Environment [17]
MODAF (UK) Ministry of Defence AF [16][17] NAF NATO Architectural Framework [16][17] NEA National EAF [16] NIH (U.S. National Institutes of Health) EAF [17]
NIST (U.S. National Institute of Standards and Technology) Enterprise Architecture [16][17]
OBASHI ownership, business process, application, system, hardware and infrastructure framework [17]
OIO OIO Enterprise Architecture Method [16] OSSAF Open Safety & Security AF [16] PEAF Pragmatic EAF [16] PERA Purdue Enterprise Reference Architecture [17]
OSE RM ISO/IEC TR 14252, IEEE Std 1003.0 & ISO/IEC 9945 [17]
PPOOA Processes Pipelines in Object Oriented Architectures [16]
PRISM Partnership for Research in Information Systems Management [16]
QGEAF Queensland Government EAF [16][17] RASDS Reference Architecture for Space Data Systems [16]
RM-ODP ISO Reference Model for Open Distributed Processing [16][17]
RWSSA Rozanski and Woods [16] S4V Siemens 4 Views [16]
SABSA Sherwood Applied Business Security Architecture [16][17]
SAGA Standards and Architectures for eGovernment Applications [17]
SAP EAF SAP EAF [17] SASSY Self-Architecting Software SYstems [16] SGCAF Smart Grid Conceptual AF [16] SQUID Specification Quality In DevOps [16]

128
International Journal on Advances in Software, vol 12 no 1 & 2, year 2019, http://www.iariajournals.org/software/
2019, © Copyright by authors, Published under agreement with IARIA - www.iaria.org
Acronym Name Source t-eam toolbox for enterprise architecture management [17]
TAFIM Technical Architectural Framework for Information Management [17]
TEAF (US) Treasury EAF [16] TEAF Treasury EAF [17] TISAF Treasury Information AF [17] TOGAF The Open Group AF [16][17] TRAK The Rail AF [16][17] UADF Universal Architecture Description Framework [16]
VERAM Virtual Enterprise Reference Architecture and Methodology [17]
xAF Extensible AF [16][17] XAF eXtreme Enterprise Architecture Framework [17] ZF Zachman Framework [16][17]
*AF = Architecture Framework; EAF=Enterprise AF Considering that Gartner’s 2011 global EA survey showed
more than 60 EA frameworks in use, with the most popular being blended followed by homemade [18], it is indicative that the current state of EAFs is deficient, fragmented, and in need of rethinking from its core. To the author's knowledge, none of the EAFs in Table I meet all three essentials requirements: 1) conceived as purely digital in their essence for a digitized enterprise, are 2) domain and intention agnostic to be widely applicable for EA, and 3) provide the necessary visualization and tooling for digitized modeling and EA-centric data integration.
B. Enterprise Modeling Modeling abstracts and simplifies an area of interest while
maintaining certain its essential characteristics. Consequently reality is more complex than our models. We model in order to reason or understand within our cognitive limitations and to convey insights to others. Different domains and enterprises have different weightings and expectations as to what and how much, if any, modeling and its associated overhead should occur. The modeling spectrum can span from nothing for small organizations to modeling everything, but usually it is in the area between (see Figure 2). Something is inherently absent and models are imperfect, and manual adjustments may be necessary if the reality changes.
Figure 2. Modeling spectrum.
An international standard for enterprise modelling (EM) and enterprise integration is ISO 19439:2006, which based on GERAM and Computer Integrated Manufacturing Open System Architecture (CIMOSA). It uses a cube paradigm with model phase, model view, and genericity on each axis. As to business modeling, Meertens et al. [19] argue that there is hardly any agreement or standardization in the area as yet.
The reality is enterprise models for dynamic enterprises can become extremely complex and perhaps difficult to maintain, as illustrated in Figure 3 with a CHOOSE semantic meta-model [20] for an SME (small-to-medium enterprise).
Figure 3. An example CHOOSE enterprise model for an SME, from [20].
C. EA Tool Landscape As enterprises consist of a complex set of systems,
processes, resources, organizational structures, and technologies with various interdependencies, EA Management (EAM) attempts to provide an integrated view of these various aspects to enable alignment of the business with IT capabilities and support change and optimization. In order to assist with and provide insight for EAM, EA tools typically provide various visualization capabilities.
Matthes et al. [21] evaluated nine EA tools in detail, while Matthes et al. [22] evaluated four additional EA tools using the same criteria. A scenario-based approach with a consistent information model of a fictitious organization was used. The first part deals with specific functionality such as adapting the information model, supporting multiple users and collaborative work, visualizing the application landscape, or usability. The second part assesses the EAM support of the tools, e.g. landscape management, demand management, project portfolio management, synchronization management, strategies and goals management, business object management, IT architecture and infrastructure management, and service-oriented architecture (SOA) transformation.
Sultanow et al. [23] studied and compared 34 EA tools, basing their comparison criteria on that of Matthes et al. [21] and Filss [24]. They found that a complete evaluation and in-depth look at each tool is both difficult and time-consuming. This is due to the fact that the tools are advertised and described with relatively little detailed technical depth and a lack of transparency. Many of the tools do not offer a test version for trying out and comparing them. The authors were able to use questionnaires and direct contact with the vendors to gather certain information. One of the conclusions of the study is that the tools in the EA segment do include a basic set of capabilities, but these vary considerably in scope. Most tools can be customized to the customer’s needs. The organization of and access to EA data is similar, and most support TOGAF, Zachman, and/or ArchiMate. Some tools are

129
International Journal on Advances in Software, vol 12 no 1 & 2, year 2019, http://www.iariajournals.org/software/
2019, © Copyright by authors, Published under agreement with IARIA - www.iaria.org
quite flexible and offer additional visualizations that the other tools do not offer. The comparison criteria categories and subcategories used in the study were:
• Management functions: infrastructure, IT architecture, business/object, goal, strategy, synchronization, project portfolio, demand, landscape, and SOA transformation
• Visualization types: 3D, bubble charts, business model canvas, EPC, ERD, Cluster Card, dashboard, line charts, pie charts, timeline, tree view, matrix, geographic map, flow diagram, UML, BPMN
• Layout: manual, semi-automatic, or fully automatic • Programming paradigms: structured, modular, object-
oriented, component, scrum • Automation: manual, formatting, consistency checks,
generating, inter-productive The Enterprise Architecture Visualization Tool Survey by
Roth et al. [25] surveyed 18 EA tool vendors (over 50 invited) and 109 EA experts (out of 1200 invitations). Here is an excerpt of some of their findings, and our view on possible implications considering D2F:
• The reported tools EA experts use most frequently are Visio (87%), Powerpoint (86%), Excel (74%), then to a much smaller degree Enterprise Architect (33%), ARIS (25%), iteraplan (23%), and Archi (20%) followed by the rest. Our interpretation of this is that most of the participants (mostly enterprise architects) were not using comprehensive EA tools, nor were most using EA tools with a direct access to IT infrastructure (digitally integrated).
• Less than 20% were dissatisfied with their current EA tools (16% dissatisfied and 3% very dissatisfied), 49% were neutral, 24% satisfied, and only 9% were very satisfied. Considering the non-EA-centric tools mentioned above (like Microsoft Office), we interpret this as an indication that the EA digitalization challenges described in our paper had not yet fully materialized for the participants involved at the time of this study. Since 69% were neutral or dissatisfied with their currently available EA tools, it indicates that the EA tool market still has significant growth potential towards clear EA-specific tool market leaders that show high adoption and high satisfaction rates for EA architects (the go-to EA tool for them).
• The visualization update frequency required by enterprise architects was reported as primarily quarterly (22%), monthly (20%), weekly (17%), daily (13%), and semi-annually, annually, and other were 10% or less. Thus, we see that the pace of digitalization and the degree of change with which they needed to cope was relatively slow. When we compare this to the number of deployments of software between 2014 and 2019, we also see that the reported software deployment frequency in the 2017 State of DevOps Report [26] for high performers jumped from about 200 to 1600 annually between 2015 and 2016. In turn, we can speculate that today’s enterprise architect must also deal with much faster
software-centric change cycles and associated information models.
The above EA tool surveys show a large set of different capability profiles among vendors (as can be seen by the Kiviat diagram profiles in the Matthes et al. studies [21] 22]), a high degree of market fragmentation, high degrees of organizational customization, and a relatively low EA-centric tool adoption rate by enterprise architects. This is indicative that none of the current EA tools appears completely satisfactory.
D. Summary As to one of the more well-known EAFs, John Zachman
admitted in 2004 "if you ask who is successfully implementing the whole framework, the answer is nobody that we know of yet" [27]. And considering Gartner’s 2011 global EA survey showing more than 60 EA frameworks in use, and the most popular being blended followed by homemade [18], it indicates that none of the current EAFs suffice for enterprise needs, and many were not designed for the new digital enterprise era and lack the ability to leverage its capabilities. The EAFs and methods mentioned above typically use some layer-and-column matrix and most aspects related to models and views land in a box. This the clean-box paradigm (or syndrome depending on your view). Everything appears nicely modeled, complete, consistent, traceable, and semantically precise. But this apparent harmony is an illusion, the grey areas that cross boundaries or are cross-cutting concerns are not explicitly dealt with. E.g., automation, notification, policies, common vs. specific services, testing, staging, DevOps, etc.
Considering the EA tool popularity, satisfaction, and update rates, and the issues found when assessing the EA tools in detail, there is potential for the EAF landscape to offer a purely digital EAF and supportive EA tooling.
Thus, EAFs currently lack an integrated digitalized and data-centric concept from the ground up. They fail to provide real-time dynamic updates and thus reflect stale, inaccurate, or inconsistent data. They also require additional manual labor to maintain independent artifact consistency with a changing enterprise reality.
III. THE DIGITAL DIAMOND EA FRAMEWORK The depth and breadth of the digital impact and the deep
integration of complex IT into all aspects of the enterprise calls for a new and digitally sustainable ‘boxless’ EA framework paradigm for this new era that can deal with digitalization, ambiguity, further IT complexity, and further automation. In the following subsections, the key areas, activities, principles, integrative aspects (potentially applicable when applying D2F), maturity levels, and roadmap to D2F are portrayed.
A. D2F Key Areas Key Areas cluster related facets (concepts or elements) and
provide a focus for human thought. In contrast to boxes/levels, here boundaries are intentionally absent, reflecting the lack of boundaries in the digital world, wherein facets can relate to multiple areas. Mind maps can be seen as a useful analogy.
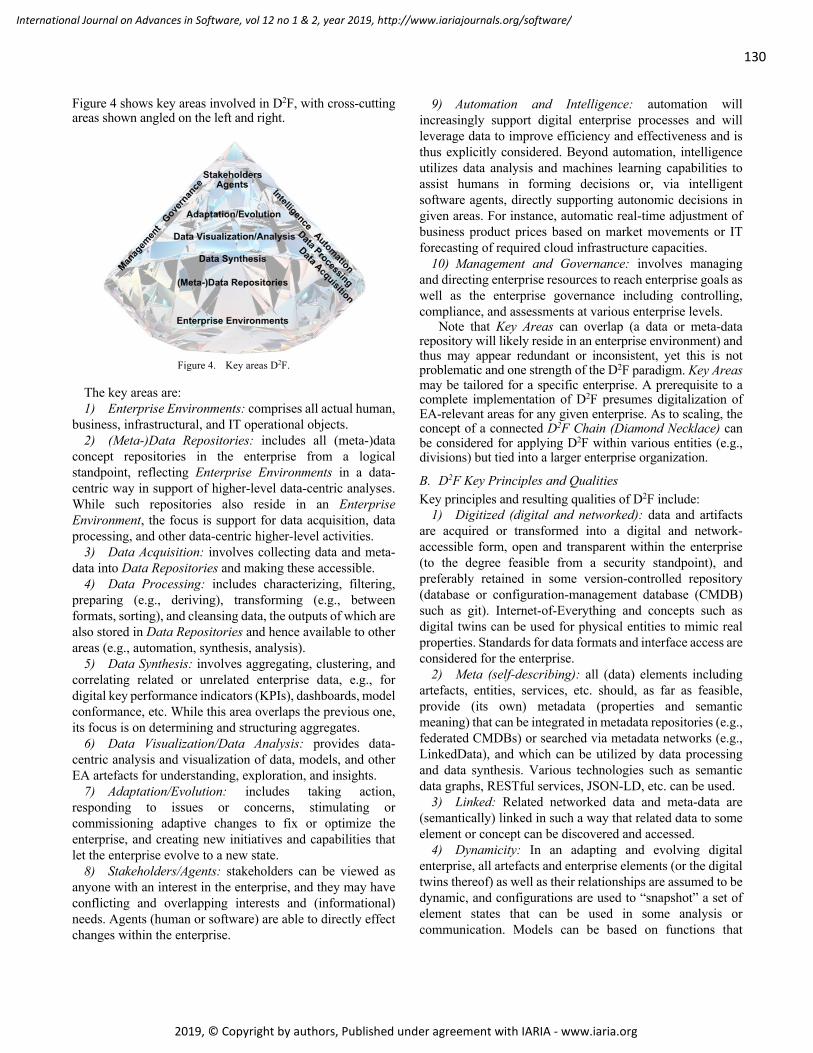
130
International Journal on Advances in Software, vol 12 no 1 & 2, year 2019, http://www.iariajournals.org/software/
2019, © Copyright by authors, Published under agreement with IARIA - www.iaria.org
Figure 4 shows key areas involved in D2F, with cross-cutting areas shown angled on the left and right.
Figure 4. Key areas D2F.
The key areas are: 1) Enterprise Environments: comprises all actual human,
business, infrastructural, and IT operational objects. 2) (Meta-)Data Repositories: includes all (meta-)data
concept repositories in the enterprise from a logical standpoint, reflecting Enterprise Environments in a data-centric way in support of higher-level data-centric analyses. While such repositories also reside in an Enterprise Environment, the focus is support for data acquisition, data processing, and other data-centric higher-level activities.
3) Data Acquisition: involves collecting data and meta-data into Data Repositories and making these accessible.
4) Data Processing: includes characterizing, filtering, preparing (e.g., deriving), transforming (e.g., between formats, sorting), and cleansing data, the outputs of which are also stored in Data Repositories and hence available to other areas (e.g., automation, synthesis, analysis).
5) Data Synthesis: involves aggregating, clustering, and correlating related or unrelated enterprise data, e.g., for digital key performance indicators (KPIs), dashboards, model conformance, etc. While this area overlaps the previous one, its focus is on determining and structuring aggregates.
6) Data Visualization/Data Analysis: provides data-centric analysis and visualization of data, models, and other EA artefacts for understanding, exploration, and insights.
7) Adaptation/Evolution: includes taking action, responding to issues or concerns, stimulating or commissioning adaptive changes to fix or optimize the enterprise, and creating new initiatives and capabilities that let the enterprise evolve to a new state.
8) Stakeholders/Agents: stakeholders can be viewed as anyone with an interest in the enterprise, and they may have conflicting and overlapping interests and (informational) needs. Agents (human or software) are able to directly effect changes within the enterprise.
9) Automation and Intelligence: automation will increasingly support digital enterprise processes and will leverage data to improve efficiency and effectiveness and is thus explicitly considered. Beyond automation, intelligence utilizes data analysis and machines learning capabilities to assist humans in forming decisions or, via intelligent software agents, directly supporting autonomic decisions in given areas. For instance, automatic real-time adjustment of business product prices based on market movements or IT forecasting of required cloud infrastructure capacities.
10) Management and Governance: involves managing and directing enterprise resources to reach enterprise goals as well as the enterprise governance including controlling, compliance, and assessments at various enterprise levels.
Note that Key Areas can overlap (a data or meta-data repository will likely reside in an enterprise environment) and thus may appear redundant or inconsistent, yet this is not problematic and one strength of the D2F paradigm. Key Areas may be tailored for a specific enterprise. A prerequisite to a complete implementation of D2F presumes digitalization of EA-relevant areas for any given enterprise. As to scaling, the concept of a connected D2F Chain (Diamond Necklace) can be considered for applying D2F within various entities (e.g., divisions) but tied into a larger enterprise organization.
B. D2F Key Principles and Qualities Key principles and resulting qualities of D2F include:
1) Digitized (digital and networked): data and artifacts are acquired or transformed into a digital and network-accessible form, open and transparent within the enterprise (to the degree feasible from a security standpoint), and preferably retained in some version-controlled repository (database or configuration-management database (CMDB) such as git). Internet-of-Everything and concepts such as digital twins can be used for physical entities to mimic real properties. Standards for data formats and interface access are considered for the enterprise.
2) Meta (self-describing): all (data) elements including artefacts, entities, services, etc. should, as far as feasible, provide (its own) metadata (properties and semantic meaning) that can be integrated in metadata repositories (e.g., federated CMDBs) or searched via metadata networks (e.g., LinkedData), and which can be utilized by data processing and data synthesis. Various technologies such as semantic data graphs, RESTful services, JSON-LD, etc. can be used.
3) Linked: Related networked data and meta-data are (semantically) linked in such a way that related data to some element or concept can be discovered and accessed.
4) Dynamicity: In an adapting and evolving digital enterprise, all artefacts and enterprise elements (or the digital twins thereof) as well as their relationships are assumed to be dynamic, and configurations are used to “snapshot” a set of element states that can be used in some analysis or communication. Models can be based on functions that

131
International Journal on Advances in Software, vol 12 no 1 & 2, year 2019, http://www.iariajournals.org/software/
2019, © Copyright by authors, Published under agreement with IARIA - www.iaria.org
transition from simulated to real data rather than static structures detached from external values.
5) Holistic: bottom-up and top-down deep integration of applicable enterprise facets, such that various concepts (e.g., business models, business strategies, policies, architectures) can be tied to various related artefacts, models, operational data, and actual enterprise entities and thus be holistically analyzed across various factors.
6) Hyper-models: embraces many coexistent and co-evolving intertwined models (domain, business, process, software, IT architectures, context), perspectives, viewpoints, and views (not necessarily consistent) supported by data processing. Automation will also affect how EA models are generated (manual vs automatic), thus we must adapt our tooling and methods towards sustainable integrative modeling. Humans desire simplicity and computers can better deal with complexity and massive data volume; thus, a symbiotic relationship should be pursued.
7) Actuality processing (real/continuous/resilient/fuzzy): ongoing data acquisition and processing should be able to continuously access and adjust the data picture to the real live enterprise truth. To have resilient processing (vs. expecting consistency or exact values), data processing should embrace data ranges and the inconsistencies that will occur between data, models (inter- and intra-), reality, etc., and develop (automated) strategies and methods for detecting and working with exceptions, ranges, and thresholds and escalating more serious issues. That may include automated discrepancy monitoring and analysis and criticality weightings based on thresholds, risks, and potential impacts. While data cleansing can remove some of the dirt, rather expect issues to occur and have measures and thresholds in place to detect and govern these and processing that can work with ambiguity such as semantic imprecision [28].
8) Analytics: data forms the basis for EA decisions. Data-centric processing and analysis capabilities are available for the present, past, and planned enterprise states to determine alignment to expectations. Digital KPIs, dashboards, reports, and visual data analytics enable investigation and exploration of EA-related views, perspectives, viewpoints, and any other factor of interest (X-Factors) to contribute to understanding and insights on various EA factors of interest to a stakeholder.
9) Actionable: data is leveraged to support decisions and governance, enabling responsive and predictive adaptation and evolution of the enterprise to a futures state.
10) Automation/Intelligence: Data is leveraged for automation to reduce sources of error and improve effectiveness and efficiency. For example, business process management systems and business and IT rules can be utilized. Intelligence via data-centric machine learning is integrated where possible to improve, support, or automate (human and software agent) decision making.
11) Traceability and Logging: mistakes will happen, and people and the enterprise can learn from mistakes. To
embrace this fact, changes to data, elements, artefacts, and all actions with their associated agents are tracked (and versioned if appropriate), logged, and traced in order to be able to investigate and resolve potential issues that might arise.
C. D2F Key Activities Various (ongoing) human and IT activities are involved to
apply and maintain D2F. We use the term activities instead of processes, as processes have a clearly-defined goal and workflow and can be documented with specified artifacts, whereas activities can be agile and integrated where and when needed in whatever agile method is currently being used and done in any order deemed appropriate. They can be recurring and continuous to maintain D2F capabilities.
Figure 5. Digital Diamond Framework (D2F) activities.
As shown in Figure 5, key D2F activities include: 1) Data Acquisition: ensures necessary and desired
(meta-)data is collected, characterized, and accessible. 2) Data Processing: ensures data is cleansed, filtered,
prepared, and transformed into expected (standard) formats. 3) Data Synthesis: aggregates and correlates data from
various repositories for a specific purpose, such as providing data needed for a certain viewpoint or dashboard.
4) Data Analysis, Visualization, & Exploration: involves agents (human or software) exploring, forming questions or hypotheses, utilizing various data and visualization analysis techniques from certain perspectives and viewpoints to address the concerns of various stakeholders, developing solutions, detecting opportunities and develop insights.
5) Adapting & Evolving: directing and commissioning change, usually involving the previous activity (4), be it adjustments to align or to evolve the enterprise, its EA, or its supporting infrastructure. It may utilize effectors available in the enterprise environments and/or human efforts via initiating projects or enacting processes.

132
International Journal on Advances in Software, vol 12 no 1 & 2, year 2019, http://www.iariajournals.org/software/
2019, © Copyright by authors, Published under agreement with IARIA - www.iaria.org
6) Modeling & Configuring: involves creating and maintaining (hyper) business, operational, architectural, product and other models (which can be logical in nature) and provide some simplification of some structure of interest and associated properties. These can be for a pre-development, development, or operational stage. While maintaining models is burdensome, incorrect models are worse, thus the basis for models should be tied into current enterprise data. Configuring involves (re)arranging enterprise elements in various ways to optimize certain desired properties.
7) Testing & Simulating: involves testing and/or simulating hypotheses and models with potential real or generated data on virtual or real staged or production elements. The goal is to develop an improved basis for decisions affecting elements of the EA, and might include concepts such as a delivery pipeline. These activities become more important as the systems increase in complexity. Without the data from these activities, decision making at the higher levels can be hampered.
8) Management & Governance: includes setting the vision and goals for the enterprise, perceiving and acting on opportunities and risk, planning, organizing, directing, and managing enterprise resources, making decisions, performing assessments, determining compliance with policies and alignment with expectations, supporting the development and application of strategies, best practices, policies, and guidelines, and making this information available to the enterprise. It is both top-down and bottom-up in its approach. It includes a feedback loop for continuous improvement or adjustment, enabling the enterprise to learn from mistakes and to optimize its future state. It ensures that logging and traceability of the data used for decisions, the decisions made, and the resulting actions are accessible.
9) Intelligence & Automation: involves developing, maintaining, and optimizing automation processes in the enterprise, including EA analysis activity. Activity to support intelligence builds on automation and includes decision assistance for humans and software agents.
D. D2F Enterprise Facets Any enterprise concept or element can be a facet. To
provide further detail on which enterprise facets might be of interest for an enterprise when using D2F, Figure 6 clusters facets (referred to below in italics), near Key Areas. Its intent is not to portray every possible facet, or by neglect thereof or apparent inconsistency to negate the entire approach. Rather, it shows that grey or inconsistent areas with which matrix approaches struggle are not as problematic with D2F, since it embraces these types of relations, be they local or holistic in nature. A short explanation of selected facets follows:
Enterprise Environments can involve a Business in a Market with Customers, involving Projects, Processes (business, development, agile, IT Infrastructure Library), Products, and Services (business, IT) together with Actors organized in Teams utilizing Infrastructure, IT (cloud,
microservices, mobile), Resources, Tools, and Technologies. Entities can be organizational units or any other enterprise element not already covered by other facets. Sensors permit data about changes in the enterprise state to be acquired, while Effectors permit desired changes to be applied. IT Rules and Biz (Business) Rules support automation or escalation.
Figure 6. Illustrative enterprise facets when applying D2F.
(Meta-)Data Repositories includes data and metadata about Projects, Processes, Products, and Services as well as Planning Data and Ops (Operational) Data. CMDBs provide data and metadata about the IT landscape, X-Assets are repositories for data and metadata about other enterprise assets (e.g., program code). Knowledge repositories may be used. Archives provide historical data. Digital Twins provide a digital representation of real enterprise elements not covered by the above. X-Architectures stands for any (enterprise, business, software, IT) architecture, describing the goals and representation of some structure and its properties and involving principles, rules, abstractions, and views. Models (conceptual, mathematical, business, data, etc.) are a partial representation of some reality.
Data Synthesis, Data Visualization, and Data Analysis can be used to develop Insights and can include digiKPIs (digital KPIs), Dashboards, and Reports. Perspectives address a particular quality property and have an implicit goal or intention. Views (partially) address some concern. Viewpoints are a class of views to address associated concerns. X-Factors can be qualities, capabilities, properties, aspects, etc. otherwise not addressed by the above.
Adaptation/Evolution includes Decisions and Actions to respond to disruptions, support change such as enterprise element lifecycle adjustments (acquire, prepare, operate, maintain, retire) as well as discovering and utilizing Innovations and instigating digital transformation initiatives.
Stakeholders/Agents are driven by some Motivation, have Knowledge, Values (what they hold to be good), and Beliefs (what they hold to be true), develop Ideas, and have future-oriented Goals and present-oriented Intentions with Expectations and Concerns they would like addressed,

133
International Journal on Advances in Software, vol 12 no 1 & 2, year 2019, http://www.iariajournals.org/software/
2019, © Copyright by authors, Published under agreement with IARIA - www.iaria.org
including a (common) Vision (future desired state) for the enterprise and some Mission (purpose) it intends to fulfill.
Automation involves Processes. In an intelligent enterprise, Autonomically-Capable Processes (ACPs) [29] will increasingly be desired and expected. These ACPs can be completely autonomic, involve human interaction, or assist human operators in some fashion. These intelligent ACPs are much more complex than normal business processes.
Figure 7. Colored graph showing possible linked facet instantiations.
The random colored node graph superimposed in Figure 7 conceptually illustrates how facet instantiations (data) across various areas could be linked via graph relations (lines in Figure 7) to provide various insights addressing stakeholder concerns. Consequently, queries can be used to find or determine relations that may otherwise not be apparent or would be ignored.
E. D2F Maturity Levels Because D2F is a digital EAF, to achieve and apply all D2F
principles across all levels of any existing large enterprise will require a transformation and enterprises will be in different states of digital transformation. The following Maturity Levels shown in Table II can be helpful to guide and ensure that requisite capabilities are addressed before focusing on higher level capabilities. Each level subsumes the one below.
TABLE II. D2F MATURITY LEVELS
Level Label D2F Qualities Data Perspective 0 Arbitrary - -
1 Digitized Digitized Meta Data Acquisition
2 Linked Dynamicity Linked Data Processing
3 Analytical Hyper-models
Analytics Actuality processing
Data Synthesis Data Analysis
Data Visualization
4 Adaptive Holistic
Actionable Traceability/Logging
Effectors
5 Autonomic /Intelligent
Automation Intelligence
Automation Intelligence
F. D2F Roadmap Each enterprise and its IT infrastructure are unique. The
digital nature of D2F requires access to (semantically annotated) data repositories and software functionality. Various methods and best practices related to enterprise application integration (EAI), EA and other IT tools, protocol standards and formats (JSON/REST), and data visualization techniques can be leveraged to realize D2F in an enterprise.
IV. D2F EA TOOL IMPLEMENTATION This section describes a D2F EA tool prototype we
developed. In contrast to the professional EA tools discussed in the prior section, this tool is not intended to be a professional EA tool nor to provide or compete with any of their features. Rather, the focus and point of this prototype is to demonstrate the practical feasibility of the D2F approach and to show one possible implementation approach. D2F approach is independent of any specific EA tool, and any EA tool could incorporate D2F or some subset thereof. ArchiSurance data is used here to help illustrate the implementation.
A. D2F EA Tool Requirements To develop our D2F EA tool and show its feasibility, we
solicited our requirements from sources in the literature to ensure we use a sufficiently generalized set of requirements.
1) EA visual requirements: Naranjo et al. [30] describe general visual requirements for EA tools summarized in Table III. We oriented our implementation on these EA tool visual requirements.
TABLE III. EA TOOL VISUAL REQUIREMENTS
ID Name MVE Maximize Visual Economy EVE Enhance Visual Expressiveness MN Minimize the Noise NI Navigate and Interact KC Keep the Context DNI Derive New Insights GSC Guarantee Semantic Correspondence
2) EA analysis requirements: Naranjo et al. [30] describe
general analysis requirements that EA tools should support, and is summarized in Table IV. We oriented our implementation on these EA tool analysis requirements.
TABLE IV. EA TOOL ANALYSIS REQUIREMENTS
ID Name IRD Identify and Relate Domains EKE Emphasize Key Elements OFI Offer a Focus of Interest FSD Facilitate Structural Diagnosis DSC Display Semantic Characteristics UAQ Uncover Architectural Qualities PFM Provide a Flexible Metamodel

134
International Journal on Advances in Software, vol 12 no 1 & 2, year 2019, http://www.iariajournals.org/software/
2019, © Copyright by authors, Published under agreement with IARIA - www.iaria.org
3) EA viewpoint requirements: the tool should support the configurable mapping of EA data to visualization types and a filtering capability. For determining initial viewpoints to consider implementing in our prototype and prove the feasibility of D2F, we used Khosroshahi et al. [31] as a reference. It provides a best-practice Enterprise Architecture Management Pattern Catalog (EAMPC) that describes concern-specific viewpoints (V-Patterns), which can be used as best-pattern reusable building blocks to tailor an organization-specific EAM approach. These viewpoint patterns (V-patterns) were analyzed, and due to project time and resource constraints we limited our initial support to the subset shown in Table V. This in no way indicates an inherent limit of D2F nor the EA tool to not support the other viewpoints, but rather this set is sufficient to demonstrate key viewpoint capabilities and show that D2F can be practically applied. Those not initially implemented due to time and resource constraints for the prototype are:
• V-110 Business application usage • V-112 Application costs • V-115 Number of interfaces per business
application • V-116 Number of redundant business functions per
business application • V-117 Number of business applications used
within a functional domain • V-118 Standard conformity of business
applications • V-120 Functional scope of a business application
4) D2F-based requirements: Requirements based on the D2F principles and qualities described in Section III.B and listed in Table V should be shown to be feasible or supported
by tooling (see Table VI). However, P:ActProc, P:Act, P:AI, and P:Trc (shown in italics) were not specified or yet implemented for the prototype due to time and resource constraints.
TABLE VI. D2F SUPPORT REQUIREMENTS
Acronym Principles and Qualities P:Dig Digitized P:Meta Meta (self-describing) P:Lnkd Linked P:Dyn Dynamicity P:Hol Holistic P:Hyp Hyper-models P:ActProc Actuality processing P:Anyltcs Analytics P:Act Actionable P:AI Automation/Intelligence P:Trc Traceability/Logging
5) EA data model requirements: the tool should support
the import of common EA information models and flexible information schemas. In particular, the popular ArchiMate [32] EA modeling language, which can model the motivation, structures, and behavior related to strategy, business, application, technology, physical, and implementation aspects for business organizations, and BPMN, which can model business processes at a technical detailed level.
B. D2F EA Tool Architecture The following architectural principles, based on the
expected features and functionality and in consideration of the requirements mentioned above in Section IV.A, played a significant role in structuring the implementation solution:
• AP:enterprise information model agnostic o Supports EA information model data
interchange.
TABLE V. IMPLEMENTED EA VIEWPOINTS AND ASSOCIATED STAKEHOLDER CONCERNS FROM [31]
ID Name Concerns V-107 Business application technical or business status See subviewpoint V-107.1 Complexity of business applications C-124 Reduce application landscape complexity V-108 Physical component status See subviewpoint V-108.2 Evaluate potential removal candidates C-129 Remove monolithic applications V-108.4 Increase transparency of application landscape C-34 Look of long-term application landscape
C-62 Determine business capabilities of application landscape C-119 Definition of target application landscape C-157 Detection of consolidation potential
V-109 Transparency about which physical components are used by which business applications
C-41 Determine used infrastructure for applications C-147 Merge two different application landscapes C-169 Architectural assessment of change requests
V-111 Business application status within a specific business capability See subviewpoint V-111.1 Use of business applications C-62 Determine business capabilities of application landscape
C-142 Map business applications to business capabilities V-111.2 Relation between business capability and business application C-147 Merge two different application landscapes
C-157 Detection of consolidation potentials V-113 Technical or business status of business application See subviewpoint V-113.1 Complexity of business applications C-124 Reduce application landscape complexity V-114 Layer diagram to visualize IT landscape status C-98 Determine shutdown impact of infrastructure component V-119 Number of infrastructure components used by a business
application C-120 Measure changes in application landscape C-124 Reduce application landscape complexity C-141 Get transparency about IT costs

135
International Journal on Advances in Software, vol 12 no 1 & 2, year 2019, http://www.iariajournals.org/software/
2019, © Copyright by authors, Published under agreement with IARIA - www.iaria.org
o Supports flexible meta-models or schemas. • AP:flexible metadata relation and tagging capabilities
o Enables additional knowledge to be flexibly joined to any elements/views.
• AP:flexible visualization o Support various visual types and
parameterization. o Support the configuration and mapping of EA
data to visualization types and filtering. o Provide interactive and dynamic visual
analytical capabilities. • AP: client web-centric cross-platform access
o Supports access and involvement of diverse stakeholders from anywhere on any platform.
• AP: cloud data/service backend access o All data needed for EA tool is accessible and
integratable, to minimize the inconsistency and redundancy issues resulting from locally-installed applications or isolated data.
• AP:internal common simple data format (JSON) o All data can be converted to/from this format.
• AP: graph database o Supports flexible (re)structuring of data
dependencies between elements via a graph structure.
Figure 8. D2F EA Tool Architecture.
As shown in the diagram in Figure 8, the following technologies were chosen:
• Node.js was chosen as a runtime environment due to its popularity and to maintain front and backend in JavaScript.
• Neo4j: graph database that supports the Cypher Query Language (CQL). Neo4j was chosen due to its popularity as a graph database.
• D3: JavaScript library for dynamic and interactive data visualizations, chosen due to its popularity and the available functionality.
• EJS: embedded JavaScript templating engine. • Express: Node.js web application server framework
handling GET/POST requests from the client. • Formidable: Node.js module for parsing form data • FS: Node.js file system module
C. D2F EA Tool Implementation On the main page when loaded by a browser, the following
four main tabs as shown in Figure 17 are provided: • Load data: provides the ability to import data from
various sources. • Connection: provides the ability to manage and
connect data with metadata • Analysis: provides pre-defined EA Viewpoints and
filtering options. • Visualization: provides a flexible visualization option
to provide custom search and filtering options Information about an element can be retrieved by clicking
on its ID within a table or in a visualization. A new view is opened which shows the ID, Name, and Creation timestamp as shown in Figure 18.
The following Cypher statement supports data retrieval for this view:
MATCH (n{id:{idParam}}) RETURN n
1) Load data tab. This tab supports importing metadata, infrastructure data, BPMN diagrams, and ArchiMate data in JSON format (see Figures 17 and 9). Any other formats such as XML must be converted beforehand and any special characters in keys or values (such as punctuation symbols) removed. Metadata can be imported as well from schema.org (e.g., we utilized PhysicalComponent and BusinessProcess) or similar sites. Since some of the metadata may not be applicable (since they may cover various domains or branches of industry), we provide a whitelist and blacklist in config.json in order to exclude inapplicable elements and thus reduce metadata clutter. The whitelist is for explicit inclusion with the assumption that the rest is not applicable, whereas the blacklist specifies elements to remove and allowing the rest.
Figure 9. Example ArchiMate data.
136
International Journal on Advances in Software, vol 12 no 1 & 2, year 2019, http://www.iariajournals.org/software/
2019, © Copyright by authors, Published under agreement with IARIA - www.iaria.org
Each element has a name, creation date, and a unique id to avoid inconsistencies. Metadata should also provide the subclass, type, description, and layer.
ArchiMate data involved additional folders and subfolders analogous to its layers: Business, Application, Technology, Motivation, Implementation and Migration, Relations and Views. While software to transform an ArchiMate model to a Neo4j database model exist, we were not satisfied with the conversion results using an Archi plugin [33]. The resulting structure differed from the original model while relations were converted into nodes. We thus chose to do our own mapping. The information about ArchiMate layers are stored via a property in the Neo4j database. One challenge was to find the individual elements in the various subfolders. The following Cypher statement is used to import ArchiMate data:
CREATE (node:Archi {foldername:{folderNameParam}, folderid: {folderidParam}, foldertype: {foldertypeparam}, instancename:{instanceNameParam}, instancenid:{instanceIdParam}, id: {nameParam}, identifier:{idParam}, name:{xsitetypeParam}, time:{timeParam}})
2) Connection tab. Metadata can be added or changed as seen on the right side of the screenshot shown in Figure 19. Once one of the fields is active, applicable context-specific recommendations are provided. A single node can be associated with metadata by providing a node ID in the top field, providing a Meta field, and then pressing the upper “Create metaconnection” button. Similarly, to associate a set of nodes, the bottom Name field provides a category to select the set of nodes, and the bottom Meta field specifies the metadata node to which it should be associated.
MATCH (a {id: {originalIdParam}}) SET a.meta = {metaParam} RETURN a, {originalIdParam: nodeMetaId, metaParam: metaMetaId} As seen to the left in Figure 20, metadata associations are
visualized with data elements as blue squares and metadata as green triangles. The following Cypher statement supports this visualization:
MATCH (n) WHERE EXISTS (n.meta) AND NOT ((n:Meta) OR (n.meta = "To be specified")) RETURN (n)
3) Analysis tab. This tab provides those predefined EA viewpoints listed in Table V. In our implementation of these viewpoints, options for filtering the elements by “IT Infrastructure”, ArchiMate, or All are provided via the respective “Show” buttons in the upper left of the view in Figure 21.
a) V-107 Business application status. In this viewpoint business applications are clustered by organizational unit and can be allocated multiple times, while color is used to visualize some status such as complexity that can be based on various metrics. Variants include architectural fit or architectural health.
V-107.1 Complexity of business applications was implemented (see screenshot in Figure 21), which deals with the following stakeholder concern:
• C-124 Reduce application landscape complexity In our implementation, the complexity is based on the
metric of the number of associations between architectural elements. These colors are associated with complexity: green (low), yellow (medium), red (high), white (unknown). In config.json the thresholds can be adjusted.
To realize this viewpoint, the following Cypher statement is used to find all applications a and their associated business unit(s) b:
MATCH (a) -[] ->(b) WHERE ((a.name ="Application") OR (a.name="BusinessService") OR (a.name="ApplicationFunction") OR (a.name="ApplicationService") OR (a.name="SystemSoftware") OR (a.name="InfraStructureService")) AND ((b.name ="BusinessActor") OR (b.name="BusinessObject") OR (b.name="BusinessProcess") OR (b.name="Project")) RETURN a, b, labels(a), labels(b) ORDER BY b ASC) The following Cypher statement finds applications that are
only indirectly associated via some other node. Due to the time needed to execute, it is limited to the first 500:
MATCH (a) - [] ->(c) - [] -> (b) WHERE ((a.name ="Application" OR a.meta ="SoftwareApplication" OR a.meta ="MobileApplication" OR a.meta = "WebApplication") AND b.name ="Project") RETURN a, b, labels(a), labels(b) ORDER BY b ASC LIMIT 500') The following Cypher statement then counts the number
of relations for each found node: MATCH (c {id:{idparam}})-[r]-() RETURN count(r) b) V-108 Physical Component Status. In this viewpoint
business applications are clustered by business capability, and physical components can be assigned to a business application. Color is then used to convey the technical status of a physical component.
V-108.2 Evaluate potential removal candidates was implemented (see screenshot in Figure 22), which deals with the following stakeholder concern:
• C-129 Remove monolithic applications Via the respective “Show” buttons at upper left, the
elements can be filtered by “IT Infrastructure”, ArchiMate, or All.
In contrast to [33], in our implementation of this viewpoint we show all elements that are isolated and that are not Metadata, and for this we use the Cypher statement:
MATCH (a) WHERE NOT(a)-[]-() AND NOT a: Meta RETURN DISTINCT a, labels(a) V-108.4 Increase transparency of application landscape
was implemented (see screenshot in Figure 23), which deals with the following stakeholder concerns:
• C-34 Look of long-term application landscape

137
International Journal on Advances in Software, vol 12 no 1 & 2, year 2019, http://www.iariajournals.org/software/
2019, © Copyright by authors, Published under agreement with IARIA - www.iaria.org
• C-62 Determine business capabilities of application landscape
• C-119 Definition of target application landscape • C-157 Detection of consolidation potential The following Cypher statement finds infrastructure
components based on metatags b which are associated with capability c:
MATCH (n) – [] – (b) – [] – (c) WHERE (b.meta = ‘SoftwareApplication‘ OR b.meta = ‘MobileApplication‘ OR b.meta = ‘WebApplication‘ OR b.foldername = ‘Application‘ OR b.name = ‘Software ‘ OR b.name = ‘Application‘) AND (n.foldername = ‘Technolo- gy‘ OR n.name = ‘PhysicalComponent‘ OR n.meta = ‘PhysicalComponent‘) AND (c.meta = ‘Capability‘ OR c.foldername = ‘Business‘ OR c.name = ‘Capability‘) RETURN n, b, c, labels(n), labels(b), labels(c) ORDER BY c ASC
4) V-109 Transparency about used physical components
for business applications. In this viewpoint, which physical components are used by which business applications are shown (see screenshot in Figure 24). Since multiple relations can exist between elements, we chose to use graphs using the D3 forced graph layout. Green triangles are used for physical components and yellow crosses for applications. The viewpoint deals with the following stakeholder concerns: • C-41 Determine used infrastructure for applications • C-147 Merge two different application landscapes • C-169 Architectural assessment of change requests
To realize this viewpoint, the following Cypher statement
is used: MATCH (n) - [r] - (b) WHERE ((n.name ="Application" OR n.foldername ="Application" OR n.name ="Software" OR n.meta ="SoftwareApplication" OR n.meta ="MobileApplication" OR n.meta = "WebApplication") AND (b.name = "PhysicalComponent" OR b.meta="PhysicalComponent" OR b.foldername ="Technology")) RETURN n, r, b, labels(n), labels(b)
5) V-111 Business application status within a specific
business capability. In this viewpoint, a matrix is used to depict business capabilities as rows and business applications as columns, while a business or technical status is depicted at their intersection.
Viewpoint 111.1 Use of business applications was implemented (see screenshot in Figure 25), which deals with the following stakeholder concerns:
• C-62 Determine business capabilities of application landscape
• C-142 Map business applications to business capabilities
To realize this viewpoint, the following Cypher statement is used:
MATCH (n) -[r]- (b) WHERE (n.foldername = "Business" OR n.meta ="Capability" OR n.name = "Capab-ility") AND
(b.name = "Application" OR b.foldername = "Application" OR b.meta = "SoftwareApplication" OR b.meta = "MobileApplication" OR b.meta = "WebApplication") RETURN n, r, b, labels(n), labels(b) V-111.2 Relation between business capability and
business application was implemented (see screenshot in Figure 26), which deals with the following stakeholder concerns:
• C-147 Merge two different application landscapes • C-157 Detection of consolidation potentials
6) V-113 Status of business application. In this viewpoint business applications are listed in a tabular format with a column that indicates a business or technical status.
Viewpoint 113.1 Complexity of business applications was
implemented (see screenshot in Figure 27), with the number of relations used as a metric for depicting the complexity of a business application. These colors are associated with complexity: green (low), yellow (medium), red (high), white (unknown). In config.json the thresholds can be adjusted. The viewpoint deals with the following stakeholder concern:
• C-124 Reduce application landscape complexity To realize this viewpoint, the following Cypher statement
is used: MATCH (a)-[c]-() WITH a, count(c) as relation WHERE (a.meta ="SoftwareApplication" OR a.meta ="MobileApplication" OR a.meta = "WebApplication" OR a.name="Application" OR a.name="Software" OR a.foldername ="Application") AND NOT a: Meta RETURN a, relation, labels(a)
7) V-114 Layer diagram to visualize IT landscape status.
In this viewpoint, business processes are depicted in the top layer, supported by various business applications in the middle layer, and the required physical components are visualized in the bottom layer (see screenshot in Figure 28). In contrast to Khosroshahi et al. [31], we chose to use colors and symbols instead of spatially separate layers to differentiate the layers, using green triangles for physical components, yellow crosses for applications, and red circles for business processes. The arrows in the relations show the direction of information flow. The viewpoint deals with the following stakeholder concerns:
• C-98 Determine shutdown impact of infrastructure Component To realize this viewpoint, the following Cypher statement
is used: MATCH (n) - [] -(b) - [] - () - [] - (c) WHERE ((n.meta ="PhysicalComponent" OR n.name ="PhysicalComponent" OR n.foldername ="Technology") AND' (b.foldername ="Application" OR b.name ="Software" OR b.meta ="SoftwareApplication" OR b.meta ="MobileApplication" OR b.name = "WebApplication") AND (c.foldername = "Business" AND c.instancename = "Processes")) RETURN n, b, c
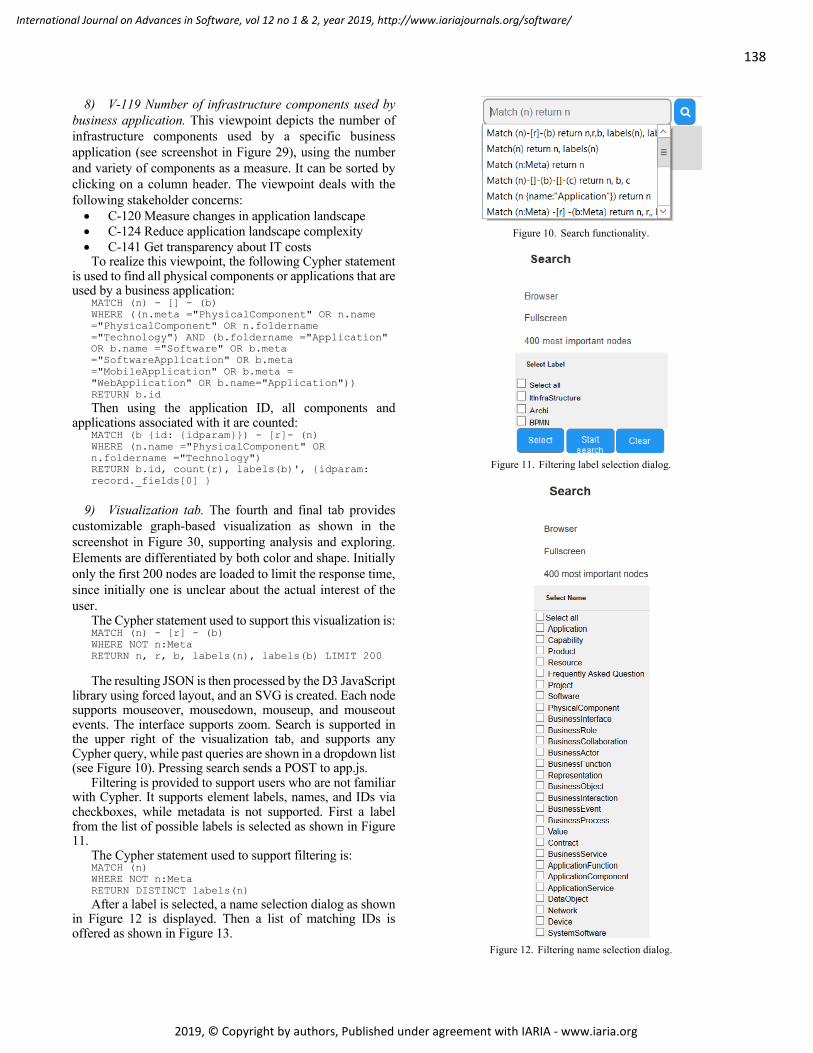
138
International Journal on Advances in Software, vol 12 no 1 & 2, year 2019, http://www.iariajournals.org/software/
2019, © Copyright by authors, Published under agreement with IARIA - www.iaria.org
8) V-119 Number of infrastructure components used by business application. This viewpoint depicts the number of infrastructure components used by a specific business application (see screenshot in Figure 29), using the number and variety of components as a measure. It can be sorted by clicking on a column header. The viewpoint deals with the following stakeholder concerns: • C-120 Measure changes in application landscape • C-124 Reduce application landscape complexity • C-141 Get transparency about IT costs
To realize this viewpoint, the following Cypher statement is used to find all physical components or applications that are used by a business application:
MATCH (n) - [] - (b) WHERE ((n.meta ="PhysicalComponent" OR n.name ="PhysicalComponent" OR n.foldername ="Technology") AND (b.foldername ="Application" OR b.name ="Software" OR b.meta ="SoftwareApplication" OR b.meta ="MobileApplication" OR b.meta = "WebApplication" OR b.name="Application")) RETURN b.id Then using the application ID, all components and
applications associated with it are counted: MATCH (b {id: {idparam}}) - [r]- (n) WHERE (n.name ="PhysicalComponent" OR n.foldername ="Technology") RETURN b.id, count(r), labels(b)', {idparam: record._fields[0] }
9) Visualization tab. The fourth and final tab provides customizable graph-based visualization as shown in the screenshot in Figure 30, supporting analysis and exploring. Elements are differentiated by both color and shape. Initially only the first 200 nodes are loaded to limit the response time, since initially one is unclear about the actual interest of the user.
The Cypher statement used to support this visualization is: MATCH (n) - [r] - (b) WHERE NOT n:Meta RETURN n, r, b, labels(n), labels(b) LIMIT 200 The resulting JSON is then processed by the D3 JavaScript
library using forced layout, and an SVG is created. Each node supports mouseover, mousedown, mouseup, and mouseout events. The interface supports zoom. Search is supported in the upper right of the visualization tab, and supports any Cypher query, while past queries are shown in a dropdown list (see Figure 10). Pressing search sends a POST to app.js.
Filtering is provided to support users who are not familiar with Cypher. It supports element labels, names, and IDs via checkboxes, while metadata is not supported. First a label from the list of possible labels is selected as shown in Figure 11.
The Cypher statement used to support filtering is: MATCH (n) WHERE NOT n:Meta RETURN DISTINCT labels(n) After a label is selected, a name selection dialog as shown
in Figure 12 is displayed. Then a list of matching IDs is offered as shown in Figure 13.
Figure 10. Search functionality.
Figure 11. Filtering label selection dialog.
Figure 12. Filtering name selection dialog.

139
International Journal on Advances in Software, vol 12 no 1 & 2, year 2019, http://www.iariajournals.org/software/
2019, © Copyright by authors, Published under agreement with IARIA - www.iaria.org
Figure 13. Filtering ID selection dialog.
Figure 14. Dialog for manually adding or deleting a node or relation.
Figure 15. Dialog for manually changing a node or relation.
Adding or deleting a node or relation is also supported via the dialog shown in Figure 14, while changing a node or relation is supported with the dialog shown in Figure 15.
D. D2F EA Tool Validation To validate the implementation against requirements, we
refer to the requirements described in Section IV.A. As to EA visual requirements (see Table III):
• Maximize Visual Economy (MVE): the implementation was able to demonstrate that concepts can be differentiated with a concrete syntax for specific concepts, e.g., with colors and shapes in V-109 (Figure 24) and V-114 (Figure 28).
• Enhance Visual Expressiveness (EVE): multiple visual attributes can be used together to assist with differentiating concepts, e.g., both colors and shapes were used in V-109 (Figure 24) and V-114 (Figure 28) to differentiate the same concepts. ´
• Minimize the Noise (MN): only a single ID was used to identify an element visually, minimizing irrelevant information (Figure 20).
• Navigate and Interact (NI): various common user navigation techniques support analysis.
• Keep the Context (KC): we applied self-organizing layouts to deal with placement and relatedness issues in large models (Figure 20).
• Derive New Insights (DNI): our implementation supports new insights via ad-hoc queries, e.g. via Cypher statements (Figure 10).
• Guarantee Semantic Correspondence (GSC): legends are provided to support graphic and conceptual correspondence (e.g., as in Figure 23).
As to EA analysis requirements (Table IV): • Identify and Relate Domains (IRD): multiple
domains, such as BPMN for process and ArchiMate for EA models can be differentiated and related (see Figure 28).
• Emphasize Key Elements (EKE): visual emphasis or distinction for elements of high structural or semantic importance is provided, for instance by interactive support via node selection (emphasizing relations of a node to its neighbors) or by color (green, yellow, red) as in Figure 21.
• Offer a Focus of Interest (OFI): spatial proximity is used to tie or cluster similar elements (e.g., Figure 24).
• Facilitate Structural Diagnosis (FSD): the visualization tab provides various structural diagnosis opportunities (e.g., Figures 23 and 28).
• Display Semantic Characteristics (DSC): semantic characteristics can be displayed that are not directly in the model, as the viewpoints showed with the relational complexity metrics (Figure 27).
• Uncover Architectural Qualities (UAQ): various supported viewpoints can be helpful in uncovering architectural qualities, such as frequency of use, isolation, etc. (Figure 21).

140
International Journal on Advances in Software, vol 12 no 1 & 2, year 2019, http://www.iariajournals.org/software/
2019, © Copyright by authors, Published under agreement with IARIA - www.iaria.org
• Provide a Flexible Metamodel (PFM): our visual model and mapping is decoupled from the conceptual models, allowing for flexible visualization opportunities (Figure 19).
Various EA viewpoints from EAMPC as listed in Table V were demonstrated to be supported, and the rest appear supportable with additional effort, indicating the flexibility of the D2F approach and the EA tool implementation architecture.
Various D2F principles and qualities are shown to be supported, namely digitized data and models, support for flexible metadata (self-describing), the elements are easily linked, dynamicity is supported should an element change, the various models are holistically viewed, hyper-models are supported, and analytics are shown.
In summary, the D2F EA tool was able to fulfill the given requirements with this prototype and show the feasibility and practicality of implementing the Digital Diamond Framework principles in an EA tool. The supported viewpoints showed the diversity of viewpoints and stakeholder concerns that could be addressed with the approach.
V. EVALUATION A case study and performance measurements provide
initial insights into the practicality of our solution. Because of security concerns, it is difficult to receive permission to access company internal IT infrastructure data and be able to publish any related visualization and evaluation data. We thus chose to use fictional data for our evaluation case study.
A. Case Study with ArchiSurance The Open Group created the ArchiSurance case study [34]
as a fictitious example to illustrate the realistic use of the ArchiMate enterprise modeling language. It is considered in the context of the Open Group’s TOGAF Framework, which is a method for EA. In this case study, we ignore the TOGAF method aspects and instead focus on the use of the ArchiSurance data. It is modeled using ArchiMate 3 and incorporates EA elements from the baseline and target business, application architecture, data architecture, and technology architecture. The fictitious ArchiSurance is the result of a merger of three previously independent insurance companies:
• Home & Away, specializing in homeowners’ insurance and travel insurance
• PRO-FIT, specializing in auto insurance • Legally Yours, specializing in legal expense insurance The data consists of 120 elements and 176 relations and is
available in an XML data format. We converted the data format to JSON, removing special characters present in the keys. The following screenshot in Figure 31 shows the actor cooperation view for ArchiSurance in the tool ArchiMate.
A sample subset of stakeholder concerns from Khosroshahi et al. [31] as shown in Table VII will be used in conjunction with the Viewpoints of Table IV to show how the ArchiSurance data can be analyzed with the D2F prototype.
TABLE VII. CONCERNS
ID Name C-41 Determine used infrastructure for applications C-62 Determine business capabilities of application landscape C-98 Determine shut-down impact of infrastructure component
C-124 Reduce application landscape complexity C-129 Remove monolithic applications
1) Determine used infrastructure for applications (C-
41): V-109 can be used as shown with ArchiSurance data in Figure 32 to show what infrastructure is used by which applications.
2) Determine business capabilities of application landscape (C-62): to show the business capabilities of the business applications, V-111 can be used as shown with ArchiSurance data in Figure 33.
3) Determine shut-down impact of infrastructure component (C-98): to show the shutdown impact of an infrastructure component, V-114 can be used as shown with ArchiSurance data in Figure 28.
4) Reduce application landscape complexity (C-124): to reduce the application landscape complexity, the following viewpoints shown with ArchiSurance data can be used to provide insights: V-107.1 (see Figure 34) complexity of business applications, V-113.1 (see Figure 35) complexity of business applications in tabular form by business application, and V-119 (see Figure 35) number of infrastructure components used by a business application.
5) Remove monolithic applications (C-129): V-108.2 Evaluate potential removal candidates provides information useful for this concern. E.g., in Figure 22, the Unix Server 1059 has no relation to any other element, and is thus a possible candidate for removal.
B. Performance and Scalability of Graph Database An initial characterization of the performance and
scalability of our prototype implementation used an Acer Aspire X3-710 notebook with a [email protected] CPU, 4GB RAM, Win10x64, Firefox, and Neo4j Community Edition (note that the Enterprise Edition this is intended for scalable commercial deployments). Thus, this is not an ideal or typical cloud deployment server setup, but rather a setup to investigate our implementation and characterize how the graph database behaves as we increase nodes. For any serious evaluation, real enterprise data and equivalent cloud and enterprise versions of components and databases should be used.
We measured the latency, CPU utilization, and RAM utilization based on this Cypher query to find all elements with relations as we increased the number of nodes:
MATCH (n) – [r] – (b) RETURN n, r, b, labels(n), labels(b) The resulting measurements are shown in Table VIII and
plotted in Figure 16. We note that the latency did not automatically go up as the number of nodes increased from 250 to 1750. As the nodes increase from 250 to 2500, the latency goes from 32 to 79 seconds. Between 1250 to 1500

141
International Journal on Advances in Software, vol 12 no 1 & 2, year 2019, http://www.iariajournals.org/software/
2019, © Copyright by authors, Published under agreement with IARIA - www.iaria.org
nodes we note significant changes in CPU utilization, between 1750 and 2000 nodes significant changes in latency, and between 2250 and 2500 nodes significant changes in RAM.
TABLE VIII. QUERY LATENCY (IN MILLISECONDS), CPU UTILIZATION (IN %), AND RAM (IN MIB) AS THE NUMBER OF NODES INCREASES.
Nodes CPU RAM (MiB) Latency (ms) 250 38% 47 32650 500 25% 50 35812 750 26% 57 34000
1000 38% 56 35479 1250 55% 59 34000 1500 82% 63 44495 1750 79% 65 36186 2000 85% 69 60832 2250 87% 72 66644 2500 73% 123 78580
Figure 16. RAM (MiB), Latency (seconds), and CPU (%) vs. number of nodes.
This indicates that especially as CPU utilization increases beyond 50%, performance impacts may become noticeable; thus, deployment planning should consider the maximum number of expected nodes and plan sufficient CPU and RAM with appropriate load-balancing techniques, or attempt to use the Enterprise Edition of Neo4j. On a positive note, below these thresholds increasing the number of nodes does not automatically have an equivalent impact on query latency.
C. D2F Assessment In summary, the D2F prototype shows that D2F can be
supported by any EA tool willing to adopt the D2F principles. Specifically, our prototype furthermore supports the Jugel el al. [8] visual EAM analytic tool findings mentioned in Section I, namely:
View configuration: views can be easily configured to react to dynamic information demands. Furthermore, complete flexibility and interaction for queries is provided.
View consideration: a method is provided via multiple browser tabs, such that several views can be considered in parallel to avoid losing the overall context. Additionally, the views can be kept up to date since they are based on a datastore that can extract, transform, and load enterprise data.
Interacting with views: additional interaction and visual analytics capabilities are provided to help analyze and plan EAs more efficiently.
Communication & collaboration: to better support communication & collaboration, additional knowledge can be added to views via its flexible (meta)tagging capability.
Stakeholder identification: by providing enhanced visual analytic capabilities with real EA data, actual stakeholders that have to be involved in decision-making processes can more readily be identified.
Other EA tool implementations could be implemented to support the D2F, our prototype implementation and performance characterization shown here is primarily intended to show that it is feasible and that graph-based implementation approaches can also work.
VI. CONCLUSION A sustainable EAF is needed that can embrace the
digitized enterprise era. This paper described the Digital Diamond Framework (D2F) to support digitized enterprises with structure, order, modeling, documentation, and analysis to enable more responsive and agile enterprises with better alignment of business plans and initiatives with the actual enterprise state. Key areas, principles, activities, facets, and maturity levels were elucidated.
The D2F EA tool prototype showed the feasibility of D2F, and that an EA tool based on D2F can support important features for enterprises in the digital age: enterprise information model agnostic, flexible meta-models, tagging for adding knowledge to elements/views, easily create and (re)configure interactive dynamic views, support visual analytical capabilities, and via a web-centric implementation diverse stakeholders can be incorporated. The implementation also demonstrated the power of graph databases for accessing and conveying facets in a very flexible manner. Furthermore, hyper- models were demonstrated, incorporating BPMN and ArchiMate models in one repository.
To be of significant value for enterprises in the digital age, integration and customization of EA tools to each specific enterprise is required. Future work includes studying the D2F EA tool prototype in industrial case studies.

142
International Journal on Advances in Software, vol 12 no 1 & 2, year 2019, http://www.iariajournals.org/software/
2019, © Copyright by authors, Published under agreement with IARIA - www.iaria.org
APPENDIX
Figure 17. Load data tab and other tabs.
Figure 18. Additional element information.
Figure 19. Metadata to data association screen.

143
International Journal on Advances in Software, vol 12 no 1 & 2, year 2019, http://www.iariajournals.org/software/
2019, © Copyright by authors, Published under agreement with IARIA - www.iaria.org
Figure 20. Metadata association visualization.
Figure 21. V-107.1 Complexity of business applications.

144
International Journal on Advances in Software, vol 12 no 1 & 2, year 2019, http://www.iariajournals.org/software/
2019, © Copyright by authors, Published under agreement with IARIA - www.iaria.org
Figure 22. V-108.2 Evaluate potential removal candidates.
Figure 23. V-108.4 Increase transparency of application landscape.

145
International Journal on Advances in Software, vol 12 no 1 & 2, year 2019, http://www.iariajournals.org/software/
2019, © Copyright by authors, Published under agreement with IARIA - www.iaria.org
Figure 24. V-109 Transparency about used physical components for business applications.
Figure 25. V-111.1 Use of business applications.

146
International Journal on Advances in Software, vol 12 no 1 & 2, year 2019, http://www.iariajournals.org/software/
2019, © Copyright by authors, Published under agreement with IARIA - www.iaria.org
Figure 26. V-111.2 Relation between business capability and business application.
Figure 27. V-113.1 Complexity of business applications.

147
International Journal on Advances in Software, vol 12 no 1 & 2, year 2019, http://www.iariajournals.org/software/
2019, © Copyright by authors, Published under agreement with IARIA - www.iaria.org
Figure 28. V-114 Layer diagram to visualize IT landscape status.
Figure 29. V-119 Number of infrastructure components used by business application.

148
International Journal on Advances in Software, vol 12 no 1 & 2, year 2019, http://www.iariajournals.org/software/
2019, © Copyright by authors, Published under agreement with IARIA - www.iaria.org
Figure 30. Visualization tab.
Figure 31. ArchiSurance Actor Cooperation View.

149
International Journal on Advances in Software, vol 12 no 1 & 2, year 2019, http://www.iariajournals.org/software/
2019, © Copyright by authors, Published under agreement with IARIA - www.iaria.org
Figure 32. V-109 with ArchiSurance data.
Figure 33. V-111 with ArchiSurance data.

150
International Journal on Advances in Software, vol 12 no 1 & 2, year 2019, http://www.iariajournals.org/software/
2019, © Copyright by authors, Published under agreement with IARIA - www.iaria.org
Figure 34. V-107.1 with ArchiSurance data.
Figure 35. V-111 with ArchiSurance data.
Figure 36. V-119 with ArchiSurance data.

151
International Journal on Advances in Software, vol 12 no 1 & 2, year 2019, http://www.iariajournals.org/software/
2019, © Copyright by authors, Published under agreement with IARIA - www.iaria.org
ACKNOWLEDGMENT The author thanks Sabine Hager for assistance with the
prototype implementation and evaluation.
REFERENCES [1] R. Oberhauser, “The Digital Diamond Framework: An
Enterprise Architecture Framework for the Digital Age,” Proceedings of The Tenth International Conference on Information, Process, and Knowledge Management (eKNOW 2018), IARIA, pp. 77-82, 2018.
[2] J. Zachman, "A framework for information systems architecture," IBM Systems Journal, 26(3), pp. 276-292, 1987.
[3] M. Blosch and B. Burton, “Hype Cycle for Enterprise Architecture, 2017,” Gartner, 2017.
[4] M. Muro, S. Liu, J. Whiton, and S. Kulkarni, "Digitalization and the American Workforce," Brookings Institution Metropolitan Policy Program, 2017.
[5] C. Munns, I Love APIs 2015: Microservices at Amazon. [Online]. Available from: https://www.slideshare.net/apigee/i-love-apis-2015-microservices-at-amazon-54487258 2019.06.02
[6] I. Jacobson, EA Failed Big Way! [Online]. Available from: http://blog.ivarjacobson.com/ 2019.06.02
[7] S. Roeleven, Why Two Thirds of Enterprise Architecture Projects Fail. ARIS, 2011. [Online]. Available from: https://www.computerworld.com.au/whitepaper/370709/why-two-thirds-of-enterprise-architecture-projects-fail/ 2019.06.02
[8] D. Jugel, C. Schweda, A. Zimmermann, and S. Läufer, "Tool Capability in Visual EAM Analytics," Complex Systems Informatics and Modeling Quarterly (CSIMQ), Issue 2, pp. 46-55, 2015, http://dx.doi.org/10.7250/csimq.2015-2.04
[9] R. Nolan and D. Mulryan, “Undertaking an Architecture Program,” Stage by Stage, 7(2), pp. 63- 64, 1987.
[10] The Open Group, “TOGAF Version 9.1,” Van Haren Publishing, 2011.
[11] Chief Information Officers Council: Federal Enterprise Architecture Framework Version 1.1.
[12] IFAC-IFIP Task Force, “GERAM - Generalized enterprise reference architecture and methodology, version 1.6.3,” 1999.
[13] B. Stroud and A. Ertas, "A taxonomy for enterprise architecture framework," 2015 Annual IEEE Systems Conference (SysCon) Proceedings, Vancouver, BC, 2015, pp. 828-831. doi: 10.1109/SYSCON.2015.7116853
[14] E. Sultanow, C. Brockmann, K. Schroeder, and S. Cox, "A multidimensional Classification of 55 Enterprise Architecture Frameworks," Americas Conference on Information Systems (AMCIS), 2016.
[15] N. Lim, T. Lee, and S. Park, "A Comparative Analysis of Enterprise Architecture Frameworks Based on EA Quality Attributes," 2009 10th ACIS International Conference on Software Engineering, Artificial Intelligences, Networking and Parallel/Distributed Computing, 2009, pp. 283-288. doi: 10.1109/SNPD.2009.97
[16] Survey of Architecture Frameworks. [Online]. Available from: http://www.iso-architecture.org/ieee-1471/afs/frameworks-table.html 2019.06.02
[17] D. Matthes, Enterprise Architecture Frameworks Kompendium. Xpert.press, Springer-Verlag Berlin Heidelberg 2011 DOI 10.1007/978-3-642-12955-1_3
[18] “Gartner’s 2011 Global Enterprise Architecture Survey: EA Frameworks Are Still Homemade and Hybrid,” Gartner, 2012.
[19] L. Meertens, M. Iacob, and L. Nieuwenhuis, “Developing the business modelling method,” In: First Int’l Symp. Bus. Model. & Softw. Design, BMSD 2011, SciTePress, pp. 88-95, 2011.
[20] M. Bernaert, G. Poels, M. Snoeck, and M. De Backer, “CHOOSE: Towards a metamodel for enterprise architecture in small and medium-sized enterprises,” Information systems frontiers, 18(4), pp. 781-818, 2016.
[21] F. Matthes, S. Buckl, J. Leitel, and C. M. Schweda, „Enterprise Architecture Management Tool Survey 2008”. Software Engineering for Business Information Systems (sebis), Technische Universität München, 2016.
[22] F. Matthes, M. Hauder, and N. Katinszky, „Enterprise Architecture Management Tool Survey 2014 Update,” Software Engineering for Business Information Systems (sebis), Technische Universität München, 2014.
[23] E. Sultanow, J. Christian, S. Lieben, and N. Parcej, EA-Frameworks – Teil 3: Ein Vergleich von 34 EA-Tools. [Online]. Available from: http://newsolutions.de/it/ea-frameworks-teil-3-ein-vergleich-von-34-ea-tools/ 2019.06.02
[24] C. Filss, „Vergleichsmethoden für Vorgehensmodelle,” Thesis, Technical University Dresden, 2004.
[25] S. Roth, M. Zec, F. Matthes, "Enterprise Architecture Visualization Tool Survey 2014," Technical Report, sebis, Technical University Munich, 2014.
[26] N. Forsgren, G. Kim, N. Kersten, J. Humble, and A. Brown, "2017 State of DevOps report," Puppet + DORA, 2017. [Online]. Available from https://puppet.com/resources/whitepaper/2017-state-of-devops-report 2019.06.02
[27] D. Ruby, Erecting the Framework, Part III. 2004-03-18 Interview with John Zachman. [Online]. Available from http://archive.visualstudiomagazine.com/ea/magazine/spring/online/druby3/default_pf.aspx 2019.06.02
[28] G. Shanks, E. Tansley, and R. Weber, "Using ontology to validate conceptual models," Communications of the ACM, 46(10), pp. 85-89, 2003.
[29] R. Oberhauser and G. Grambow, “Towards Autonomically-Capable Processes: A Vision and Potentially Supportive Methods.” In Adv. in Intell. Process-Aware Information Systems: Concepts, Methods, and Technologies. Springer, 2017, pp. 79-125.
[30] D. Naranjo, M. Sanchez, and J. Villalobos, "Evaluating the capabilities of Enterprise Architecture modeling tools for Visual Analysis," Journal of Object Technology, vol. 14, no. 1, 2015.
[31] P. A. Khosroshahi, M. Hauder, A.W. Schneider, and F. Matthes, "Enterprise Architecture Management Pattern Catalog," Sebis, 2015.
[32] I. Band et al., "ArchiMate 3.0 Specification," The Open Group, 2016.
[33] Archi Plugin. [Online]. Available from: https://github.com/archi-contribs/database- plugin/blob/master/v2/org.archicontribs.database_v2.1.3.jar 2019.06.02
[34] H. Jonkers, I. Band, and D. Quartel, "ArchiSurance Case Study Version 2," The Open Group, 2012.

152
International Journal on Advances in Software, vol 12 no 1 & 2, year 2019, http://www.iariajournals.org/software/
2019, © Copyright by authors, Published under agreement with IARIA - www.iaria.org
Model-centric and Phase-spanning Software Architecture for Surveys
Report on the Tool Coast and Lessons Learned
Thomas M. Prinz, Sebastian Apel, Raphael Bernhardt, Jan Plotner, and Anja VetterleinCourse Evaluation Service and Chair of Software Technology
Friedrich Schiller University JenaJena, Germany
e-mail: {Thomas.Prinz, Sebastian.Apel, Raphael.Bernhardt, Jan.Ploetner, Anja.Vetterlein}@uni-jena.de
Abstract—Surveys are used in empirical sciences to answerresearch questions. Such surveys can be separated into fivephases (e. g., planning and data collection), where each phaseshares information with each other. Since the interdependenciesbetween the phases are sometimes complex, it is helpful tohave a software system, which supports each phase of a survey.There already exist such systems, which cover all of the phases.However, the implementations of the phases have usually stronglimits; a more individual handling of the phases has to be donein external tools. But an external handling of the informationwould disrupt the links between the phases. The merging ofthe phases become a cumbersome task. This was one reasonto build the new survey and report tool Coast. This paperpresents a realization of the advanced requirements on thisnew survey system. The system keeps the links between thephases intact and is able to distribute surveys on differentdevices, e. g., paper and web. The focus on the meta-modelof surveys makes that possible. The model is derived as amathematical and as a data model. The data model builds adomain-specific language in order to construct the necessaryparts of a survey. The architecture with its components andservices is built around this language. Mainly, the architecturedescribes how the model of surveys is transferred and compiled.Its benefits and disadvantages provide lessons learned for otherresearchers and developers.
Keywords–Survey; Architecture; Model; Coast; Tools.
I. INTRODUCTIONSurveys are prevalent in the empirical sciences (for
example in psychology and sociology) [1]. In many cases,it is profitable to use surveys to reach a large and locallydispersed sample (e. g., [2]).
A survey can be separated in different phases: (1)Planning, design, and implementation, (2) data collection,(3) data preparation, (4) data analysis, and (5) reporting[3]. Each of the phases is interwoven with the others. Forexample, the reporting phase needs the specific questionsasked in the survey as well as the different variables andscales from the implementation phase. In turn, the collecteddata can only be interpreted by knowing the scales andvariables they belong to. So, it is beneficial to have asoftware system, which supports each of the phases of asurvey and which is phase-spanning.
Such software tools are available on the market, e. g.,EvaSys [4], KwikSurveys [5], LimeSurvey [6], SurveyMonkey[7], and Unipark [8]. Most of them cover all phases of a
survey. They provide predefined or simple data analyses andreports. However, the data analysis and reporting phases arevery individual processes and can become quite complex.For further analyses (e. g., multivariate analyses, machinelearning) exceeding the standard repertoire, these tools offerthe download of the raw data. This separation from the tool,unfortunately, disrupts the link between the data and theother phases of a survey — the individual data analysis in anexternal tool becomes a time consuming and cumbersometask.
This fact was one of the main reasons for the CourseEvaluation Center at the Friedrich Schiller University Jenain the year 2009 to build its own survey and report tool,called Coast. It focuses on the integration of the analysisand report phases for advanced analyses. Although it isin successful use for the course evaluation of the univer-sity, the first version of Coast had its disadvantages. Thedisadvantages resulted from varying requirements, wrongdesign decisions, and surveys, which got more complicatedthan the architecture could handle. A monolithic architec-ture emerged, which made it hard and risky to implementchanges in business logic. Although monolithic architecturesare profitable in early-stage development [9], such architec-tures become more confusing during growth. That makesthe architecture difficult to maintain and hard to understand[10][11].
As the questionnaires handled by Coast became morecomplex, the usage of the first version of Coast was notpossible anymore. However, like a tool comparison in Sec-tion II-C will show, the currently available tools do notfulfil all our requirements. Usage of those tools cannot hap-pen without significant changes on the questionnaires (andquestions asked in the survey). Since we use longitudinalanalyses [12] (which require equal questionnaires duringeach data collection), it is necessary to keep the existingstructure intact. The overhead to change the questionnairesand to build workarounds to solve the requirements is high.Therefore, it is not possible without high efforts to use adifferent survey tool. This high effort made it necessary totransfer our tool Coast into a different architecture.
As a result, a new version of the Coast applicationis currently under development. This new version dealswith the disadvantages of the first version by clarifying thearchitecture and modules as well as the model of ques-
153
International Journal on Advances in Software, vol 12 no 1 & 2, year 2019, http://www.iariajournals.org/software/
2019, © Copyright by authors, Published under agreement with IARIA - www.iaria.org
tionnaires and reports. The architecture is build up aroundthis model, which should offer a familiar development ofquestionnaires and reports. The model formulates a Domain-Specific Language (DSL) to handle the context-specificinteraction between humans and machines. Our domaincovers all phases of a survey and the model. In other words,one goal of Coast is to provide a DSL for surveys, whichallows the construction of questionnaires and reports in alanguage that everyone understands who has knowledge inthe domain.
This paper deals with our research question about therealization of a survey system that keeps links between thephases of surveys intact. We define requirements on sucha system, especially those being not fulfilled by existingsystems. A detailed presentation of the relationships andinformation of surveys and reports is done mathematicallyand as a data model. The data model builds a DSL for theconstruction of all the parts belonging to a survey. Basedon this DSL, we examine the necessary components andservices for the different phases of a survey and discussthem in terms of our software architecture. Benefits anddisadvantages of our approach provide experiences for otherresearchers who have to realize similar research questions.
This paper is structured as follows: Subsequent to thisintroduction, the reader finds an overview about relatedwork, our advanced requirements on a survey system, anda comparison of existing survey systems regarding thoserequirements (Section II). Section III describes the meta-model as a DSL, especially for questionnaires. This de-scription is done (1) mathematically to provide an overviewof the different information and relationships and (2) as adata model which gives more detailed information. Based onthis data model, Section IV explains the architecture of oursurvey system with a high focus on the interactions betweenthe phases of a survey. The benefits and problems of theproposed solution are shown afterwards in Section V. Thispaper concludes with a short outlook into future work inSection VI.
II. RELATED WORK AND REQUIREMENTSThis section explains the five phases of surveys and
defines our requirements on a survey system. An overview ofexisting solutions for creating, carrying out, and analysingsurveys makes it further possible to compare the require-ments for those solutions, subsequently.
A. Phases of an Electronic SurveyA survey can be separated into five phases [3]:1) Planning, design, and implementation,2) Data collection,3) Data preparation,4) Data analysis, and5) Reporting.
The first phase (planning, design, and implementation) in-cludes planning on the research questions you want toanswer, deciding what survey questions are necessary toanswer these research questions, and specifying who willbe surveyed (the population). Furthermore, the survey willbe implemented. As a result, there is a paper or web linkthat can be distributed to a sample of the population.
The population is surveyed with the implementation ofthe survey in the second phase. This phase is called datacollection where the answers of the respondents for thequestions are stored in a data set (for example in a database).
The third phase data preparation is necessary, becausethe collected data may contain malformed, incomplete, orwrong records. Sometimes, there are faults in the imple-mentation or conception of the questionnaire, which haveto be corrected. If other data sources are combined withthe collected data, some data may have to be recoded.Summarized, the data has to be cleaned and prepared tobe used in a data analysis, the fourth phase, afterwards.
In the analysis phase, the collected data are analysed inorder to answer the research questions from the first phase.The results of the analysis, as well as general informationabout the survey, are finally summarized in detail in a report.The report is the outcome of the last phase, reporting.
B. RequirementsThe primary requirement of a survey tool is its coverage
of all mentioned phases of a survey. Besides this basicrequirement, a tool in our context should fulfil the followingfunctional requirements:
DEV A questionnaire and report model should beusable for different devices (paper, web, smart-phone, etc.).
QAD New kinds of question visualizations can beadded (sliders, timetables, etc.).
AAD New kinds of analyses can be added (groupcomparisons, regressions, etc.).
MUL Multiple surveys should be analysed togetherin a single report.
ADA Questionnaires and reports should allowadaptivity, i. e., conditional branches.
DIS The survey conduction should be distributed onother systems than the construction of surveys.
PRI The survey conduction should be distributedalso on private systems.
Furthermore, it should fulfil the following two non-functional requirements:
FLE The creation of questionnaires and reportsshould be flexible.
SCA All the phases should be scalable.
C. Other Survey Tools and Their ComparisonCoast is not the only survey tool available on the market
supporting the phases of a survey. There are well-establishedtools like EvaSys [4], KwikSurveys [5], LimeSurvey [6],SurveyMonkey [7], and Unipark [8]. All of them cover thepreviously introduced five phases of surveys. Almost alltools allow the creation of a questionnaire via drag and dropof the questions. The resulting questionnaire can be used forthe data collection subsequently.
The tools are compared in Table I. The table compareslicensing, type of operation, types of questionnaires, analysistools, export of results, individualization of the layout, aswell as extensibility of question types and data analysisalgorithms. Concerning licensing, all tools offer a commer-cial license, which is usually accompanied by a managed

154
International Journal on Advances in Software, vol 12 no 1 & 2, year 2019, http://www.iariajournals.org/software/
2019, © Copyright by authors, Published under agreement with IARIA - www.iaria.org
Table I. Survey tool comparison for license types, hosting, and devices for questionnaires, as well as export options for data and modifications to layout,question types, and analysis algorithms. The compared aspects were assigned to the requirements.
Requirements EvaSys Unipark LimeSurvey KwikSurvey SurveyMonkeyCommercial - 3 3 3 3 3Open Source - 7 7 3 7 7Free Version - ( 3 ) 7 7 3 3SaaS DIS, PRI, SCA 3 3 3 3 3Self Hosting DEV, PRI, SCA 3 7 3 7 7Web Questionnaire DEV, PRI, DIS 3 3 3 3 3Paper Questionnaire DEV 3 7 7 7 7Hybrid Questionnaire DEV 3 7 7 7 7Analysis Tools FLE 3 3 3 3 3HTML Export FLE 3 3 3 3 3PDF Export FLE 3 3 ( 7 ) 3 3Spreadsheet Export FLE 7 3 3 3 3Raw Data Export FLE 3 3 3 3 3Add. Question Types QAD 7 7 3 7 7Add. Analysis Algorithms AAD 7 7 3 7 7Individualization FLE, ADA 3 3 3 7 3Multi-Survey-Report MUL 7 7 ( 3 ) 7 7
hosting and therefore a minimum of installation effort. Sucha Software-as-a-Service (SaaS) offer is an advantage, espe-cially with regard to the SCA, PRI, and DIS requirements.Some systems offer free test phases; others offer a permanentfree use of the system with limited functionality. A hybridconcept (use of paper and web surveys) in relation to theDEV requirement can only be realized with the EvaSystool. The realization of new question types and new analysisalgorithms is only possible in the case of the open sourceapplication LimeSurvey through independent hosting andindividual adaptation.
In conclusion, none of the tools considered would fullymeet the intended requirements. In particular, the MULrequirement does not seem to be possible in any tool. Thephases of data preparation, data analysis, and reporting arenot separated in most of the tools and, therefore, mergesmoothly. All the tools have the possibility to export thecollected data for further research in external tools (e. g.,IBM SPSS [13], Excel [14], or R [15]). Furthermore, theyprovide standardized reports, which include the questions ofthe questionnaires, frequencies, significance tests, and meanvalues, among other parameters. However, with all tools, thelink between phases is lost in the case of individual analysesand the accompanying export of the collected data.
III. A DOMAIN-SPECIFIC LANGUAGEThe tools mentioned in the previous section have a focus
on the development of the survey instead of a fine-granularand sophisticated data analysis and reporting. As mentionedbefore, a new focus on the data analysis and reporting wasone reason to build an own survey tool Coast. Anothermain reason to build Coast was the missing coverage ofour requirements of the existing survey tools.
As mentioned in Section II-A, conducting a surveyis an almost well-defined process. The same holds truefor the development of questionnaires (used to survey thepopulation) and reports. It is our goal for Coast to offera controlled and realistic modelling and development ofthem: We want to provide a DSL as a possible way to
handle the interaction between humans and machines in aspecific context. Our context contains all phases of a surveyas well as how questionnaires, analyses, and reports arestructured. In other words, the DSL can be used to modelsuch questionnaires, analyses, and reports. In this paper,the DSL focuses on the description of the questionnairesto avoid repetition, since the description of the reports isquite similar.
Since the DSL should be used to define questionnairesin a language that everyone understands who has knowledgeabout questionnaires, the focus lies on how a questionnaireis structured and what kind of information is important.More concrete, the DSL describes the meta-model of thequestionnaire. That means an instance of that meta-modelis a description of one questionnaire. The instance of thisdescription is one physical questionnaire, which can beanswered by one respondent. The meta-model of question-naires makes it possible to derive different kinds of surveysfrom the same model: For example, surveys representedonline on PC, on paper, or on smartphones.
It is useful to inspect the structures of questionnairesfrom a mathematical perspective to get a general andcompact model. Therefore, we considered questionnairemodels and descriptions in the literature [16], interviewedpsychologists in our department, and derived the followingmathematical questionnaire meta-model.
A. MathematicallyOne way to picture questionnaires is to consider them
as computer programs: Questionnaires have a starting pointand the respondent follows the questionnaire on a “path”question by question. Sometimes a path can branch outdepending on previous answers and a respondent follows oneor another. That means, the questionnaire forks — it allowsadaptivity. In other places in the questionnaire, differentpaths join each other. It is like a program with branches. Inother words, a questionnaire can be described as a (controlflow) graph (definitions of graphs and paths can be foundin [17, pp. 432] and [18, p. 1180]).

155
International Journal on Advances in Software, vol 12 no 1 & 2, year 2019, http://www.iariajournals.org/software/
2019, © Copyright by authors, Published under agreement with IARIA - www.iaria.org
Before it is possible to define a questionnaire based ongraphs, it has to be examined what the nodes of the graphsmean in this context. For this reason, we have to introducesome concepts of measurement theory.
1) Codomains and Variables: The theory of psychologi-cal measurements aims to study the properties of objects, es-pecially of humans [19, p. 8]. In reality, the (psychological)properties, e. g., intelligence or motivation, are too complexand varied in such that the measurement has to coarsen anddiscretise them. Therefore, each measurement describes themapping from the true domain to a set of discrete values [20,p. 22]. This set of discrete values is called the codomain.
Stevens describes four different kinds of codomainsnamed levels of measurement [21]. Depending on the levelof measurement of a codomain, it can be decided, whichstatistical analyses can be applied. The levels are nominal,ordinal, interval, and ratio. Starting from the ordinal level,the codomains are called scales. More information about thedifferent levels can be found in [21].
It is necessary to decide carefully which level of mea-surement is suited for a specific measurement since it isdifficult or impossible to transform the values of a low-levelto a higher level measurement.
A property of an object obj is measured with the helpof the values of a codomain D. A measure assigns a valueval ∈ D to obj and can be described as a pair (obj, val). Ifthe same property is measured for the set of all objects Oin a sample, it results in a mapping from those objects tothe codomain D. This mapping is called a variable [20, p.22]:
Definition 1 (Variable): A variable V is a left total map-ping from a sample set of all objects O to a codomain D,V : O 7→ D. The codomain of V is described with D(V ).
A variable describes the characteristics of one propertyfor different objects [22, p. 19]. However, in questionnaires,many of such properties should be measured. Therefore,there is a variable for each of the properties to measure.
2) Items, Pages, and Questionnaires: The measurementin questionnaires is done by asking the object (the respon-dent) with a set of instructions and questions — items [22,p. 19][23]. An item is a concrete question or request, whichmeasures one or more variables.
Definition 2 (Item): An item I consists of an instructionand a set of enquired variables.
In almost all questionnaires, more than one item ispresented to the respondent at the same time. They aregrouped thematically on pages:
Definition 3 (Page): A page is a finite set of items.Not each page has to appear for each respondent. For
example, if a respondent has never done a job, a page withitems about jobs is not suitable. In questionnaires, the exclu-sion of pages and items depends on previous answers of therespondent. There could be a previous item with the question“Do you ever had a job?” as an example whose answerincludes or excludes the page about jobs. Questionnaireswith conditional pages are called being adaptive. In adaptivequestionnaires, conditions are allowing the control of thepath a respondent follows:
Definition 4 (Condition): A condition on the variables
V1, . . . , Vm, m ≥ 1, is a left-total mapping from theCartesian product of the codomains of the variables to theboolean set {true, false}:
D(V0)× · · · × D(Vm) 7→ {true, false}
It is known from research that the structure of a ques-tionnaire can influence the measurement results [24, S. 68ff.]. The structure of a questionnaire seems to be important.For this reason, a questionnaire should not only be definedby an unordered set of pages and conditions. There has to bean order of the pages and items [25]. Sometimes, this orderis described as the item flow and sequence of questions [26].As mentioned before, it is promising to describe the structureof a questionnaire as a control flow graph, in our case as anacyclic, connected digraph [27, S. 547] (also proposed byBethlehem [16]).
Definition 5 (Questionnaire): A questionnaire Q is atriple (P,E, Cond). It consists of an acyclic, connecteddigraph (P,E) with a set of pages P and a set of edges E;and a left-total mapping, Cond, which assigns a conditionto each edge.
3) Measurement Methods and Surveys: A questionnairecan be used as a measurement method. A measurementmethod is applied for a single obj and a set of variables. Foreach of these variables var a pair (obj, var) is determined,val ∈ D(var). Assume the variables in a specific orderwithin the measurement method. Then it is a mapping fromthe set of all objects of the sample to the Cartesian productof all codomains collected in the measurement method.
Definition 6 (Measurement Method): A measurementmethod M is a mapping from the set of objects O tothe Cartesian product of all codomains of all measuredvariables V:
M : O 7→∏v∈VD(v)
Remark 1: A questionnaire is a specific measurementmethod. The set of objects is the set of respondents. Theset of all measured variables contains the variables in thequestionnaire. Therefore, a questionnaire is also a mappingfrom an object (respondent) to a set of values (the answers).
Since a questionnaire is a measurement method, a surveyis a special elicitation in our context using a questionnaire[22, p. 18]. Elicitation is the application of a measurementmethod to a set of objects.
Definition 7 (Survey): A survey S contains a question-naire Q and a set of respondents O, S = (Q,O). The unionof all measurements of all objects builds the results R ofthe survey S:
R(S) =⋃o∈O
Q(o)
B. Data ModelThere are some mathematical structures, which are not
trivial to implement, e. g., conditions. Some other structuresare too unspecific yet to be used in software. An exampleis a codomain, which is an arbitrary accurate set in a math-ematical sense. However, such a set cannot be implementedfor discrete computers. For these reasons, the mathematicalmodel has to be made concrete as a data model.
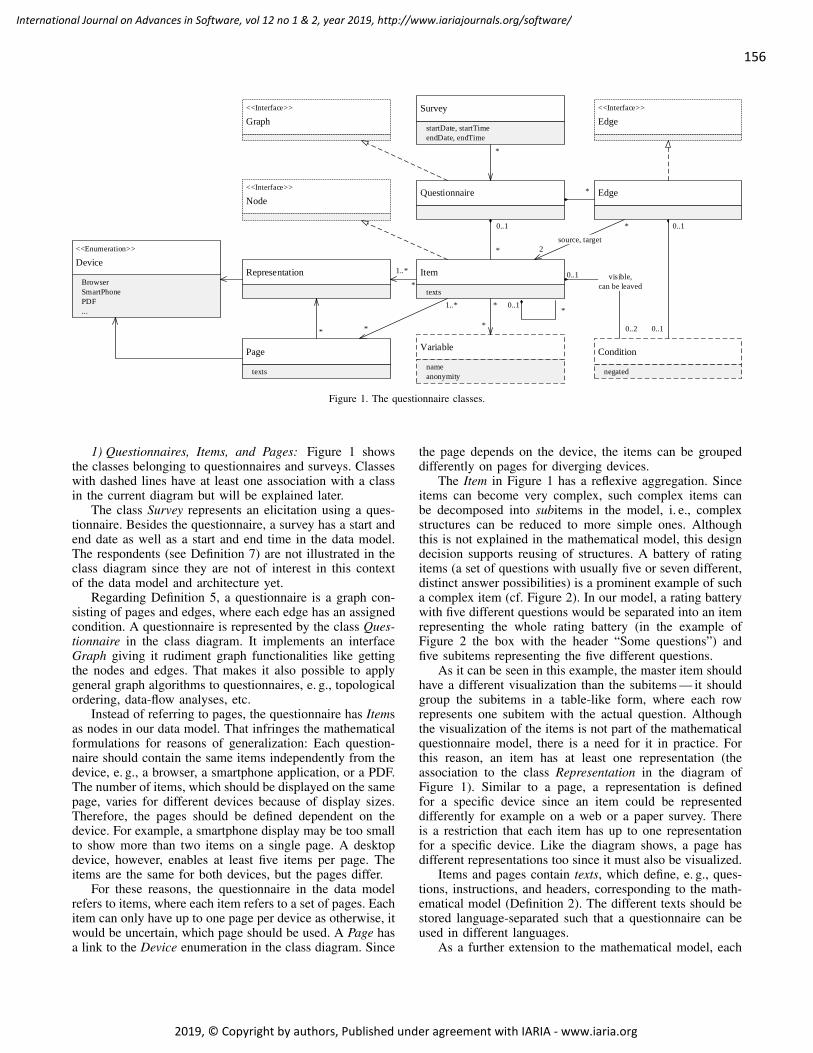
156
International Journal on Advances in Software, vol 12 no 1 & 2, year 2019, http://www.iariajournals.org/software/
2019, © Copyright by authors, Published under agreement with IARIA - www.iaria.org
Questionnaire
Survey
startDate, startTime
endDate, endTime
Item
Condition
negated
<<Interface>>
Graph
<<Interface>>
NodeEdge
<<Interface>>
Edge
*
*
0..1
2
source, target
0..2
visible,
can be leaved
*
Representation 1..*
<<Enumeration>>
Device
Browser
SmartPhone
...
Page
*
Variable
name
anonymity
*
texts
texts
0..1
0..1
0..1
0..1
1..*
*
*
*
*
*
Figure 1. The questionnaire classes.
1) Questionnaires, Items, and Pages: Figure 1 showsthe classes belonging to questionnaires and surveys. Classeswith dashed lines have at least one association with a classin the current diagram but will be explained later.
The class Survey represents an elicitation using a ques-tionnaire. Besides the questionnaire, a survey has a start andend date as well as a start and end time in the data model.The respondents (see Definition 7) are not illustrated in theclass diagram since they are not of interest in this contextof the data model and architecture yet.
Regarding Definition 5, a questionnaire is a graph con-sisting of pages and edges, where each edge has an assignedcondition. A questionnaire is represented by the class Ques-tionnaire in the class diagram. It implements an interfaceGraph giving it rudiment graph functionalities like gettingthe nodes and edges. That makes it also possible to applygeneral graph algorithms to questionnaires, e. g., topologicalordering, data-flow analyses, etc.
Instead of referring to pages, the questionnaire has Itemsas nodes in our data model. That infringes the mathematicalformulations for reasons of generalization: Each question-naire should contain the same items independently from thedevice, e. g., a browser, a smartphone application, or a PDF.The number of items, which should be displayed on the samepage, varies for different devices because of display sizes.Therefore, the pages should be defined dependent on thedevice. For example, a smartphone display may be too smallto show more than two items on a single page. A desktopdevice, however, enables at least five items per page. Theitems are the same for both devices, but the pages differ.
For these reasons, the questionnaire in the data modelrefers to items, where each item refers to a set of pages. Eachitem can only have up to one page per device as otherwise, itwould be uncertain, which page should be used. A Page hasa link to the Device enumeration in the class diagram. Since
the page depends on the device, the items can be groupeddifferently on pages for diverging devices.
The Item in Figure 1 has a reflexive aggregation. Sinceitems can become very complex, such complex items canbe decomposed into subitems in the model, i. e., complexstructures can be reduced to more simple ones. Althoughthis is not explained in the mathematical model, this designdecision supports reusing of structures. A battery of ratingitems (a set of questions with usually five or seven different,distinct answer possibilities) is a prominent example of sucha complex item (cf. Figure 2). In our model, a rating batterywith five different questions would be separated into an itemrepresenting the whole rating battery (in the example ofFigure 2 the box with the header “Some questions”) andfive subitems representing the five different questions.
As it can be seen in this example, the master item shouldhave a different visualization than the subitems — it shouldgroup the subitems in a table-like form, where each rowrepresents one subitem with the actual question. Althoughthe visualization of the items is not part of the mathematicalquestionnaire model, there is a need for it in practice. Forthis reason, an item has at least one representation (theassociation to the class Representation in the diagram ofFigure 1). Similar to a page, a representation is definedfor a specific device since an item could be representeddifferently for example on a web or a paper survey. Thereis a restriction that each item has up to one representationfor a specific device. Like the diagram shows, a page hasdifferent representations too since it must also be visualized.
Items and pages contain texts, which define, e. g., ques-tions, instructions, and headers, corresponding to the math-ematical model (Definition 2). The different texts should bestored language-separated such that a questionnaire can beused in different languages.
As a further extension to the mathematical model, each

157
International Journal on Advances in Software, vol 12 no 1 & 2, year 2019, http://www.iariajournals.org/software/
2019, © Copyright by authors, Published under agreement with IARIA - www.iaria.org
Statements(1=strongly disagree ... 3=neutral ... 5=strongly agree) 1 2 3 4 5 no answer
1 The instructor creates a stimulating work atmosphere. g g g g g g2 The course stimulated my interest in this topic. g g g g g g3 The subject matters fit my level of knowledge. g g g g g g4 Most of the participants attend the course regularly. g g g g g g5 Overall, I am satisfied with the general conditions of this course. g g g g g g
Figure 2. Example of a battery of rating items.
Item
Condition
negated
Clause
negated
Axiom
negated
<<Abstract>>
ComparativeValue
Edge
<<Enumeration>>
Operation
=
<
>
0..1 0..2
visible,
can be leaved
1..*
1..*
Variable
name
anonymity
ScalePoint
value
ScaleComparativeValue
ScalarComparativeValue
value
0..1 0..1
*
*
Figure 3. The condition classes.
item may have two conditions: (1) A condition whether theitem is visible to the participant, and (2) a condition whetherthe participant can leave the item. The latter condition ispractically necessary to avoid the reaching of the next pageby a participant if some questions are required to answer.The former condition is an extension to the adaptivity ofthe questionnaire: Items can be visible on a page to specificgroups of participants only.
Conditions are also used by the edges of the question-naire following the mathematical model. In the class diagramof Figure 1, the questionnaire consists of edges beside theitems. The class Edge implements an interface Edge andhas a source item, where the edge starts, and a target item,where the edge ends. As a restriction, an edge cannot startor end in a subitem.
2) Conditions: As mentioned before, adaptivity can berealized by multiple outgoing edges of an item. This adaptiv-ity is based on conditions following the mathematical model.If the condition holds true for an edge, then this edge ofthe questionnaire is subsequently followed. Mathematically,such a condition is easy to describe. However, the conditionsin the data model should be interpretable or executable fora computer program. Therefore, it has to be described asa term (string) or as a parse-tree [28, pp. 45] in the datamodel. We decided to describe a condition as a parse-treein disjunctive normal form (DNF). The advantages of usingthe DNF are that (1) each logical formula can be describedin DNF and that (2) the resulting tree of clauses and axioms(the parse tree) has always the depth of 3. The latter makesit possible (a) to generate a simple UI for adding anddescribing new conditions, (b) to avoid parsing of terms instring format, and (c) to transform it to source code very fast.The disadvantages are obvious, (i) the possible bigger sizeof such conditions and (ii) the expected knowledge aboutlogical equations in DNF and its transformations. However,the advantages prevail the disadvantages.
The class Condition in the class diagram of Figure 3represents a condition in DNF. As an addition to the DNF,a condition can be negated. Each condition consists of atleast one Clause, where each clause can be negated againand all clauses are connected by a logical OR (clause1 ∨. . . ∨ clausen , n ≥ 1). A clause object connects differentAxioms with a logical AND, axiom1 ∧ . . .∧axiomn , n ≥ 1.
In our model, each axiom is a simple expression(variable operator value). variable is a reference to avariable (cf. class Variable), operator is a relational op-erator, i. e., =, 6=, <,>,≥,≤, realized by the enumerationOperation. Eventually, value is a comparative value. Sincethe comparative values can have different data types, e. g.,a string, an integer, or a reference, they are realized asabstract class ComparativeValue. In the class diagram, twospecializations are illustrated: A ScalarComparativeValue,which represents an integer, real, or string value, and aScaleComparativeValue, which is associated with a specificscale point. Scale points are explained later. It is possibleto add other specializations of the ComparativeValue class,e. g., one for handling complex macros.
3) Variables: The classes Axiom and Item are associatedwith the class Variable of the class diagram in Figure 4.It represents a variable of the mathematical model (Defini-

158
International Journal on Advances in Software, vol 12 no 1 & 2, year 2019, http://www.iariajournals.org/software/
2019, © Copyright by authors, Published under agreement with IARIA - www.iaria.org
Item
Axiom
negated
Variable
name
anonymity
*
Codomain
name
ConstructionFunction
*
*constructed of
*
*
*
*
Figure 4. The classes of variables.
tion 1) and has a unique name and a rank of anonymity. Thelatter is technically important due for reasons of data securityand anonymous surveys. For example, if there is a variablerepresenting email addresses, the addresses should not bestored in the same context as other anonymous variables.Otherwise, the variables would lose their anonymity.
Another addition to the mathematical model is the pos-sibility to define construction functions for variables. Aconstruction function is a formula (e. g., source code), whichdescribes the deriving of values for the variable based on thevalues of other variables. Each variable may have differentConstructionFunctions. A construction function again usesvariables for their constructions. Obviously, each cyclicconstruction of variables should be avoided, i. e., no variableshould be able to be constructed of itself.
4) Codomains, Scales, and Scale Points: Each vari-able uses an object of class Codomain following Defini-tion 1 of the mathematical model. The classes belonging tocodomains are shown in Figure 5.
For codomains, several specializations represent differentlevels of measurement as explained before and introducedby Stevens [21]. A NominalCodomain is a codomain havinga relation (class Relation) defining equivalence between twovalues of this codomain. An OrdinalScale is a nominalcodomain with an additional relation, which defines a linearorder on the values of this domain. The class IntervalScalespecializes the ordinal scale with two additional relationsfor plus and minus operations. At last, the class RatioScaleis an interval scale with an identity element and additionalmultiplication and division relations.
Based on the measurement level one can decide whichanalyses are possible and could be applied on the collecteddata. For those analyses, it is good to know all the valuesin the codomain. For a large portion of codomains, there isa finite and enumerable set of discrete values describing it.These values are called scale points in the data model.
An object of the class ScalePoint consists of a valuefrom the base set of the codomain (which will be explainedlater). Furthermore, a scale point has texts describing thetextual answer printed to the respondent. For example, inthe previously shown battery of rating items in Figure 2,
the scale points of each statement are “strongly disagree”,“disagree”, “neutral”, “agree”, and “strongly agree” with thevalues 1 to 5. Most codomains have a list of such scalepoints. Furthermore, they have another list of special scalepoints. Special scale points are, for example, “default” and“no answer” scale points. As an example, each statementof Figure 2 has the value of the “default” scale point if therespondent saw it but has not answered; and it has the valueof the “no answer” scale point if the respondent chooses the“no answer” checkbox.
5) Base Sets: As mentioned before, the values of thescale points have to be part of the base set of the codomain.In mathematics, it is easy to describe a set D with D ⊆ Ras part of the real numbers or with D = [5, 10] as all realnumbers between 5 and 10 inclusively 5 and 10. In a datamodel, this has to be a part of the model too.
For this reason, the mathematical model was extended,and a BaseSet describes the set of values a codomain isbased on. It is shown in the class diagram of Figure 6.
A base set describes typical number systems in thefirst place, for example, integer and real numbers. If thecodomain contains texts, the base set is a set of strings(words), i. e., the Kleene star on the set of all characters.Alternatively, a base set can be a set of arbitrary objects,e. g., pictures or persons.
As base sets can look different, the class BaseSet isabstract. Therefore, a codomain must use one of its spe-cializations. The model defines four concrete specializations:(1) A CharacterSet defining arbitrary texts, (2) an ObjectSetfor arbitrary objects, (3) Integer for integer values, and (4)Real for real values. The latter both classes Integer and Realare specializations of the class NumberSet. Each number setrepresents a number systems and may define an intervalbetween from and to. The interval has a specific distancebetween all the values (stepsize). The NumberSet is abstractwith only two specializations Integer and Real.
With the description of the base sets, the mathematicalmodel was transferred to a data model. As the reader cancheck, the data model differs from the mathematical modelmostly for reasons of generalization in the resulting architec-ture and for more details and simplifications of mathematicalterms.
6) Reports: The report model is similar to the question-naire model, however, the model will not be introduced indetail in the context of this paper. Instead, the followingexplains the report model in short.
The class Report is a graph like a questionnaire. It con-sists of different Parts (pendants of items in questionnaires)and ReportEdges. The edges of a report use conditions again.This allows the creation of individual reports based on asingle report model. Report edges connect the parts in the re-port. Each part has different ComputationalRepresentations,up to one for each OutputDevice. There could be differentoutput devices, e. g., for online or paper reports. The rep-resentations contain information about the visualization ofa part and define Calculations. A calculation illustrates afunction performed on the collected data of the part. Fordoing this, it has different Parameters specifying the inputand output information of the function. The parameters could

159
International Journal on Advances in Software, vol 12 no 1 & 2, year 2019, http://www.iariajournals.org/software/
2019, © Copyright by authors, Published under agreement with IARIA - www.iaria.org
Variable
name
anonymity
Codomain
name
ScalePoint
value
texts
* *special
ScaleComparativeValue
NominalCodomain
<<abstract>>
BaseSet
Relationequivalence
OrdinalScale
linear order
IntervalScale
RatioScale
identity element
2
plus,
minus
2
times,
division
*
*
* *
*
*
*
1..*
Figure 5. The codomain classes.
Codomain
name
<<abstract>>
BaseSet
CharacterSet
ObjectSet
<<abstract>>
NumberSet
from, to, stepsize
Integer
Real
*
Figure 6. The base set classes.
be scalars or variables.Besides the Report class, there are EvaluationProjects
configuring the report. The evaluation projects define Data-Sources, which specify the places of different data col-lections. This makes it possible to combine different datasources (also external data) in a single report. Evaluationprojects also define sets of Filters. Filters filtrate the datasources and create groups. For example, in a longitudinalsurvey, one could filtrate the data based on the year andcreate a group and data for each year. This allows to comparegroups in the reports. Furthermore, each collection of filtersends in a single report.
IV. A SYSTEM ARCHITECTURE FOR SURVEYSOur central architectural concept is to build the archi-
tecture around the questionnaire and report models. Thesemodels form the language for psychologists, sociologists,and researchers of other empirical disciplines to describetheir needs. That means, the models also have to contain
the processes and logics, which the researcher needs; orthe architecture has to contain these processes and logics.Altogether, this is the domain of a survey: the domain coversall phases of conducting a survey and the models, processes,and logics. Since the models are part of the architecture, thearchitecture does finally represent the complete domain. Inthe topic of software engineering, this is a Domain-drivenDesign (DDD) approach [29].
The questionnaire model was derived to be a DSL todescribe a questionnaire as near as possible to the dailyexperiences of researchers in empirical sciences (the users).For this reason, researchers can describe their questionnaireson their own without deep experiences of the system. Thatmeans, the questionnaires are developed by the domainexperts and not by the developers of the system like orig-inally done in classic DDD approaches. In other words,the users create formal models of questionnaires, whichare afterwards able to be used to conduct web or papersurveys and to perform analyses and create reports. What thesystem has to achieve is to handle such formal models andto give an infrastructure for transformations, compilations,interpretations, executions, and other derivations.
The focus on a formal domain-specific model and itstransformations into runnable code or reports as well as thefocus on the infrastructure for such models make it a model-driven engineering (MDE) approach. MDE is the transitionof DDD to software architectural decisions. In classic MDEa software is automatically derived from a formal model sim-ilar to the way our questionnaires are compiled automaticallyto web surveys [11]. Prominent examples of MDE are themodel-driven architecture of the Object Management Group[30] and the Eclipse Modeling Framework [31]. Both focuson the Unified Modeling Language (UML) and provide aninfrastructure of transformations from UML into the sourcecode. In general, however, MDE is independent of UML andcan be applied to arbitrary DSLs.
Our architecture describes the infrastructure and thetransformations of the questionnaire and report model duringthe five phases of conducting a survey. Most parts of the

160
International Journal on Advances in Software, vol 12 no 1 & 2, year 2019, http://www.iariajournals.org/software/
2019, © Copyright by authors, Published under agreement with IARIA - www.iaria.org
Planning, design,
and implementation
Data
collection
Data
preparationData analysis Reporting
Survey designer
services
(Visualizer / editor)
Questionnaire model
with variables, etc.
Paper survey
Smartphone survey
Questionnaire
compiler
services
Verifier service
Paper scanner /
interpreter services
Collected
data
Report
transformation
service
Report model
with calculations,
etc.
Data preparation
services
OpenCPU R
services
Analysis / report
services
Report designer
services
(Visualizer / editor)
Report compiler
services
service
Online report
Paper report
...
Web
survey
Python
serviceModel
Data
Generation
User
Tool
Legend
Figure 7. The architecture of the Coast system regarding the survey phases.
architecture use a questionnaire or report as input. Forexample, a questionnaire designer is a part of the architectureand receives a (possibly empty) questionnaire as input andproduces a modified questionnaire as output.
Figure 7 shows our simplified architecture (infrastruc-ture) separated into the five phases of (1) planning, design,and implementation, (2) data collection, (3) data preparation,(4) data analysis, and (5) reporting. The architecture isexplained in the following.
A. Information Flows in the ArchitectureThe diagram contains different edges describing different
flows between the phases. The most important flow isthe bold one: The model flow. The model flow describesa questionnaire or report described in the DSL. It canbe interpreted as a specification, which is sent to somealgorithms or services (the term “service” will be explainedlater).
From the perspective of the user (the empirical re-searcher), the data flow seems to be the most important.It describes the collected data of the surveys and how itis transferred. The data flows are illustrated as dashed boldedges.
Regarding the MDE approach, the dotted edges areof interest. They show automatically generated programs,documents, etc. The primary input for those automaticallygenerated elements are the user-generated models. Althoughthere is more interaction between the user and the in-frastructure as illustrated in Figure 7, this interaction isreduced to the UI tools named survey and report designerfor reasons of clarity. The interactions between the user andthe services and models are illustrated as small dashed and
dotted lines. Eventually, interactions between external toolsand the architecture are illustrated as small solid edges.
B. Services in the ArchitectureSince the architecture covers the phases of conducting a
survey, there is a natural flow from the left side of Figure 7to the right side. The following description of the differentparts of the architecture follows this flow starting in the firstphase: planning, design, and implementation.
It all begins in the Survey designer services. These allowthe user to model a questionnaire using our questionnaireDSL. The services provide a visual designer and editorfor changing texts, variables, and others. They handle thecreation and modification of necessary instances of theclasses of the questionnaire meta-model. As a result of thedesigner, there is a well-specified questionnaire model.
If the user decides that the questionnaire is finished andshould be used in a paper and web survey, for example,the model of the questionnaire is given to the questionnairecompiler services via the model flow. The compiler servicesimplement the questionnaire and translate the model into apaper and web survey (illustrated as generation flows). Theweb survey can be accessed from the web and the resultsare stored directly in a data collection. This is illustratedas outgoing data flow from the web survey to the collecteddata.
In the case of a paper survey, a printable survey willbe generated by the compilers. The printed questionnairescan be given to the participants. Since the survey results arenot available digital, the compilers produce templates of thequestionnaire based on the printable survey too. These tem-plates can be used for scanning the printed and completed

161
International Journal on Advances in Software, vol 12 no 1 & 2, year 2019, http://www.iariajournals.org/software/
2019, © Copyright by authors, Published under agreement with IARIA - www.iaria.org
papers in the paper scanner and interpreter services. Duringthe scanning process, the data is extracted and the results arestored; illustrated as data flow from the scanner services tothe collected data. The scanner service is a separate toolcalled Amber Collector and will be available as open sourceunder this name in the future. It is built on Python andprovides (user) interfaces for performing and checking suchscans of paper surveys. The whole scanning process, websurveys, etc. are part of the phase data collection. The resultsof this phase are the collected data as data flow.
Besides the printable, web, and smartphone surveys andthe templates for the paper scanner, an automatically derivedverifier is another important result of the questionnairecompiler services. The verifier service uses that verifier,which belongs to the phase of data preparation. It checksthe collected data for malformations and unsoundnesses.This can happen for example if during the scanning processmultiple answers for a single-choice variable were identified.The application of the verifier results in a verified data.
The verified data arrive at the data preparation services.At this time, the user has created a questionnaire model, hasimplemented it by the compiler as paper and web survey, andhas verified the collected data. Now, the user wants to usethe data for a report. Therefore, the necessary data has to berequested. Furthermore, the user wants to delete or modifyopen (text) answers, which may contain profanity or mis-spellings. The preparation services contain functionality torequest, replace, and standardize data information. Naturally,it should not be able to modify the originally collected data.Therefore, each modification is done on a copy of the datainformation and is logged by the system. So it is possiblethat other researchers can reconstruct the modifications andare able to detect potential problems in other research. Thesame happens during the replacement of default, no choice,and other special values by user-defined values.
The replacements and computations of the data prepa-ration services are done with R, a statistical programminglanguage which is perfect for data handling. As shown inthe figure, there is a bidirectional data flow from the datapreparation services to the OpenCPU R services. The Rservices are like a pipe in which the data is transferred,processed, and the enriched data is sent back.
The analysis and report services receive the prepareddata from the data preparation phase. However, those ser-vices have to know which analyses should be performed.Therefore, there is another service during the data prepa-ration phase — the report transformation service — whichtranslates a questionnaire model into a report model. Toderive this information from the questionnaire model, thereport transformation service maps the questionnaire to anew report, e. g., the items of the questionnaire to reportparts and the representations of the items to computationalrepresentations. As a result of the service, there is a fullspecified standard report model for the entire questionnairemodel. This is illustrated as the model flow to the reportmodel in the figure.
Some users want to have more powerful and specializedcomputations in their reports, e. g., group comparisons, ge-ographical maps, and regressions. With the report designer
services, it is possible to modify the report model to one’sneed and remove items, change variables, add computations,add report items, add group comparisons, among otherthings.
The report model together with the collected and pre-pared data are combined in the analysis and report servicesfor computations. As mentioned before, the report modelcontains the information about necessary calculations. Thecollected data are then used as input for the computations.By doing this, the report model is transferred into a lineartopological order and the conditions on the edges are trans-lated into set operations in order to filter the data. Since theservices need a lot of statistical calculations, R is used againto perform the computations. All standard calculations arecollected in a R package, but the user can freely add newfunctions to the analysis and report services.
The result of the analysis and report services are thecomputed values. Together with the report model, thesevalues can be combined in a report. This is done by re-port compiler services similar to the questionnaire compilerservices explained before. Instead of compiling the model tosurveys, the report model is translated to reports for differentoutput devices. In this case, a device means the medium forwhich the report is generated. For example, the compileris able to create printable paper and online reports. Forthe former, the compiler services use a LATEX service. Theycompile the entire report model and the values into a LATEXdocument, which can then be compiled into a PDF or DVIdocument. This is where the report is finished.
C. Service-OrientationThe architecture uses a lot of concepts of MDE as
mentioned before. Especially, the questionnaire and reportcompiler services of Figure 7 are strictly model-driven anddo not allow modifications on the result without doing iton the model. Since the models are transferred within thearchitecture and a lot of statistical computations are done,the architecture contains possibly long-running and compu-tationally expensive tasks. Such tasks should, however, notaffect other tasks of the architecture, for example, the datacollection of a survey. In other words, the tasks should scaleand should be physically separable. With Service-orientedarchitectures (SOA) [11] such a separation and scalabilityis easier and, therefore, a good choice.
Another reason for using SOA is that important parts ofour architecture follow ongoing research in the context ofpsychoinformatics and compiler construction. That meansthat some of the tasks have to be flexible, evolutionarilygrowable, and replaceable. By encapsulating the tasks asservices, the tasks should become loose coupled and shouldhave high cohesion [32] — the services are almost indepen-dent of other services. Changing the services but retainingtheir interfaces makes them replaceable. For these reasons,each task (module) of the architecture is defined as a servicewith its own interface. If the functionality of the service isshared with other systems or users, it will be provided asa RESTful web interface. Otherwise, it is a simple systeminterface for reasons of performance. The flows in Figure 7indicate how the modules interact with each other. For

162
International Journal on Advances in Software, vol 12 no 1 & 2, year 2019, http://www.iariajournals.org/software/
2019, © Copyright by authors, Published under agreement with IARIA - www.iaria.org
Collected data
Data
Paper survey Web survey
Smartphone
survey
Paper scanner /
interpreter
services
Survey conduction
Survey
designer
services
Report designer
services
Designer
Questionnaire
modelReport model
Model
Paper reportOnline report
Report
Data
preparation
services
Verifier service
Analysis /
report services
Evaluation
Questionnaire
compiler
services
Report
transformation
service
Report
compiler
services
Compiler
Python serviceLaTeX service
OpenCPU R
services
External
Figure 8. The integration layer of the Coast system.
example, to use R as a service, the openCPU [33] engineis used. OpenCPU makes it possible to use R as a RESTfulweb service.
Although the architecture is service-oriented, it is not aclassic SOA. Some concepts have not been implemented inthe architecture (yet). One missing component is a classicservice repository. Right now, there is a repository for thedifferent hosts where the web surveys are running. But allnecessary system services are known in the architecture anddo not have to be linked dynamically. Other services do notwork via a network because of security and performancerelated issues.
Some of the services interact with the user. In order toachieve such communication, the architecture decomposesinto server and client applications following a typical en-terprise architecture. On the server, all the computations aredone, the models are stored, the compilations are performed,and the collected data is handled. The client applications aremainly functional user interfaces allowing to talk with theserver applications and to hide architectural and modellingdetails. Since the communication of the client to the serveris done via HTTP, the whole architecture also describes aweb application based on different modules.
It has become best practice during the development ofthe Coast architecture to maintain each module in separateprojects and to build up the system based on them. Thisapproach helped us to generalize modules, to define properinterfaces, to get loosely coupled functionality, and to reusecode whenever possible.
D. Integration LayerUsing services requires the componentization of the
application into subsystems and modules (services) as de-scribed in Figure 7. In general, the architecture of Coastdisintegrates into eight abstract layers: designer, model,compiler, survey conduction, data, evaluation, and report(illustrated in Figure 8). The collection of the different layersis called integration layer in SOA.
The designer contains the services belonging to theinteraction with the user. Most of the business logic isconfigured with the designer. Therefore, it is the mainapplication, which constructs the questionnaires and reports,starts the compilation of them, and initialize the analyses ofthe data. The survey and report designer services are part ofthe layer.
The model layer contains the structure of the ques-tionnaire and report models and arranges their storing, forexample, in a database.
The compiler layer with the compiler and report com-piler/transformation services uses the model and configura-tions (done in the designer layer) to transform them eitherin other models or in documents, programs, or intermediaterepresentations (IR). For example, the compiler produces theIR liQuid [34], which contains all necessary informationabout running a web survey. Furthermore, liQuid containspre-compiled representations of each page, computed re-maining pages, etc.
The survey conduction layer handles the data collectionwith the different kinds of surveys. This contains the paper,web, and smartphone surveys as well as the paper scannerand interpreter services. As part of the web surveys, thereis a virtual machine (a survey engine). liQuid can be trans-ferred to the survey engine, which executes it. Together, thecompiler and survey conduction layers follow an old com-puter science principle: Compilation and execution. Sincethe engine can be separated from the rest of the architecture,it is possible to have multiple survey engine instances ondifferent physical systems. As a result, the survey conductionbecomes scalable.
The survey conduction produces data. The data layerhandles the storing and processing of that data information.Furthermore, it allows the request and combination of dif-ferent data sources.
The evaluation layer uses the report model, which offerscomputations, variables, and structures needed during evalu-

163
International Journal on Advances in Software, vol 12 no 1 & 2, year 2019, http://www.iariajournals.org/software/
2019, © Copyright by authors, Published under agreement with IARIA - www.iaria.org
ation. The evaluation accesses the data layer to get the rightdata information. Furthermore, it stores its results back inthe data layer.
There is an external layer in Figure 8, which con-tains the LATEX, Python, and OpenCPU R services. Thoseservices build wrappers around existing tools to integratethem into the architecture. They have exclusively functionalinteractions with the other layers. The services/modules withdouble lines in Figure 8 instead have also interactions withthe user. They need user interfaces. For the paper surveysand reports the term “user interface” has a symbolic mean-ing. However, the web survey, online report, designers, andscanner services have high user interaction and, therefore,real user interfaces. The other services in the figure do notinteract with the user. Their interfaces are functional.
V. BENEFITS AND PROBLEMS OF THE APPROACHThe explained architecture used in our tool Coast is one
possibility and implementation of a software architecturefor surveys. In the previous sections, it was explained, howthe data model and architecture look like and why bothwere constructed in this way. This section further describesbenefits and problems emerged during implementation time,usage, and ongoing development.
The main benefit of the introduced architecture is thecoverage of our requirements specified in Section II. Thearchitecture allows the compilation of the questionnairesand reports to different devices, e. g., paper, web, andsmartphone, using mostly the same infrastructure of algo-rithms (requirement DEV). It enables the addition of newkinds of question visualizations (time tables, sliders, etc.)since each item has an assigned representation in the datamodel (requirement QAD, also cf. Section III-B). If there isresearch about new visualizations, it can be easily adapted inthe architecture. Although the reporting was not introducedin detail, the report model uses representations and abstractcalculations to extend the analyses with new functionality formore complex statistical analyses (requirement AAD). Dif-ferent surveys and data sources can be merged into a singlereport and new content can be added (requirement MUL).For questionnaires and reports, the mathematical and datamodels naturally define adaptivity as a graph (requirementADA). Altogether, both models are highly flexible and covermany types of surveys and reports (requirement FLE).
As mentioned at the end of the last section, the archi-tecture uses concepts of SOA. Therefore, almost all parts ofthe architecture are services. One main service is the surveyengine executing compiled questionnaire models (LiQuid[34]). This engine is installable and executable also in privatenetworks (requirement PRI). It can be hosted on differentservers making it scalable. Since the engine can run ondifferent servers from the other tasks, the processes donot interact and, therefore, do not reduce the performance(requirements DIS and SCA).
The consequent usage and the level of detail of the mod-els during all phases allow to use these detailed informationin each phase of a survey. For example, the report modelresults from a transformation of the questionnaire model.By doing this transformation, the report model gets the same
variables, conditions, and codomains like the questionnaire.There is no missing information for the report. Since thequestionnaire and report models are generalized and do notonly fit to Coast, they could be used in other survey tools,too. These models can be stored for their documentation andreuse in future as well.
Other benefits regarding the introduced model of ques-tionnaires (and reports) were shown in previous work [34][35]. The former considers the erroneous multiple asking ofthe same variable in a questionnaire. It explains an algorithmbased on static and dynamic analyses, which finds multipleoccurrences of and assignments to the same variable on thesame path. This could lead to the loss of information if avariable was wrongfully assigned to an item.
The latter work [35] reconsiders progress indicators inweb surveys, whose calculation is based on an abstractversion of the meta-model. This made it possible to definea general algorithm to calculate the progress in complexsurveys with branches in paths.
An improvement during questionnaire creation is thevisualization of the questionnaire model as a graph. Ithelps to keep the overview of all paths and variables aswell as to maintain the central theme. The control-flow-graph-like structure shows the adaptivity and individualpaths for groups of participants can be checked (by pre-assigning variables at construction). For example in a studentsurvey, if a set of items should only be visible to Masterstudents at different points of the questionnaire, the variablerepresenting the degree can be set to “Master” to visualizethe remaining paths.
A benefit of the graph-based model of reports is itsadvanced usage during the data analysis and reportingphases. The graph can be used to define wide varieties ofitem orders. A topological sorting helps to linearise theseorders in a paper-familiar way. Furthermore, the graph canbe used to produce code to only select data of the currentlyconsidered items. It reduces unnecessary data informationfor analyses.
The separation of the architecture in components and ser-vices is a great benefit during implementation. The previousmonolithic architecture of the first version of our tool Coastdecomposed into logically separable projects. These projectsare more reusable in other contexts and are easier to maintainfrom our own experiences. One mentionable example is thereimplementation of the database done in the architecturewithout high reimplementation costs in other projects.
The separation into different projects makes it also easierto talk about the architecture in the team since each projecthas a clearly defined purpose and functionality, and a uniquename to refer to it. A great advantage is the focus on thequestionnaire and reports instead of their implementation. Itmatters what is done, not how.
The new architecture has issues too, naturally. Some-times, the performance of the system is slower than in ourfirst monolithic application. This comes from the increasedoverhead by using SOA. Furthermore, there are sometimesa lot of messages being transferred between the differentservices. Especially, the communication between the clientand the server during the design of questionnaires and

164
International Journal on Advances in Software, vol 12 no 1 & 2, year 2019, http://www.iariajournals.org/software/
2019, © Copyright by authors, Published under agreement with IARIA - www.iaria.org
reports is verbose.The fine-grained models for the definition of question-
naires and reports result in large models of sometimesthousand to ten thousand objects. If a user wants to modifysuch a model within the web application, all those objectshave to be taken from the database and have to be sent to theclient. Sometimes, this took more than 30 seconds — whichis unacceptable. Therefore, the pattern of lazy loading [36]objects had to be introduced in the architecture. When theclient application tries to access an associated object, thesystem loads the required object from the server automat-ically if it was not already loaded before. Nevertheless, toallow a straight forward modelling and programming, theconcept of promises [37] was extended to an ordinary if-then-construct making the programming of asynchronousservices more intuitive.
Another disadvantage is the restriction of handling spe-cial cases within questionnaires and reports only via thedata model although it appears sometimes faster and easierto implement them directly. Such special cases need theextension of the data model and, therefore, mostly moretime. Examples are the representations of items in HTML.Sometimes these representations need only minor modifi-cations to fit the desired visualization. However, since themodification of the representation may result in undesiredside effects in other already implemented questionnaires, anew representation has to be introduced or the representationhas to be extended by additional parameters.
There are other kinds of surveys which cannot be han-dled intuitively with our architecture, yet. For example, incomputerized adaptive testing (CAT), the items of the test(survey) are not shown in sequence [38]. Their visibilitydepends on the answers of the previous items and they arerandomly chosen based on a user-specific score. Most partsof CAT can be achieved with our architecture proposal.However, the randomly chosen selection of items and thehighly connected structure of the items are not implementedyet and needs extensions of the current data models.
Although there are weaknesses and open issues on thecurrent design, the benefits at practice prevail the issues.Since its introduction in our department, the software com-pletely supports all phases of our surveys with high flexibil-ity.
VI. CONCLUSION AND OUTLOOKThis paper described the realization of a survey system
called Coast. The survey system keeps the interdependenciesbetween the survey phases intact. Since the analysis andreporting phases of surveys are highly individual tasks andneed a lot of information of the preceding phases, it wasnecessary to focus on the links between the phases.
The focus on the phases manifested in the paper as adetailed consideration of how questionnaires and reportsare structured. This consideration took place both as amathematical and a data model. The latter forms a DSL,which can be used to construct arbitrary questionnaires,reports, and other survey-related parts. Furthermore, thedata model is the centre of the architecture of Coast. Thearchitecture is, therefore, build up around the data model
and describes how the models are transformed within theapplication. It also describes the necessary services, flows,and components.
In the end, the paper discussed the benefits and disadvan-tages of the proposed architecture as lessons learned. Thiswas done especially regarding our advanced requirementson a survey tool, which were introduced too. There is noother survey tool, which fulfils all those requirements. Thismade this work necessary.
Since the Coast system is currently in an alpha version,the system is unpublished up to now. The future versionsshould be available to everyone via the web. For thispurpose, the application has to reach a stable stage, andsome of the concepts have to be extended. For example,the services and models used in the analysis and reportingphases can be used also for surveys conducted outside theCoast environment. This is possible by building a reportmodel up from scratch without having a preceding ques-tionnaire model. This report would receive the externallycollected data as input. These data have to be described withthe data model introduced in this paper. The concept of theuser interface has to be extended to allow the description ofvariables and codomains subsequent to the data collectionphase.
REFERENCES
[1] T. M. Prinz, R. Bernhardt, L. Grafe, J. Plotner, and A. Vetterlein,“Using Service-oriented Architectures for Online Surveys in Coast,”in Service Computation 2018: The Tenth International Conferenceson Advanced Service Computing, Barcelona, Spain, February 18–22,2018. Proceedings, pp. 1–4.
[2] V. M. Sue and L. A. Ritter, Conducting Online Surveys, 2nd ed.Los Angeles, USA: SAGE Publications, 2012.
[3] J. Reinecke, Handbuch Methoden der empirischen Sozialforschung(Handbook Methods of Empirical Social Research). Wiesbaden,Germany: Springer, 2014, vol. 1, ch. Grundlagen der standardisiertenBefragung (Basics of standardized Surveys), pp. 601–617.
[4] Electric Paper Ltd., “Survey Automation Software - EvaSys andEvaExam,” Website, available: http://en.evasys.de/main/home.html,retrieved: February, 2019.
[5] Problem Free Ltd., “KwikSurveys: Make online surveys, quizzesand forms,” Website, available: https://kwiksurveys.com/, retrieved:February, 2019.
[6] LimeSurvey GmbH, “LimeSurvey: the online survey tool - opensource surveys,” Website, available: https://www.limesurvey.org/, re-trieved: February, 2019.
[7] SurveyMonkey, “SurveyMonkey: The Worlds MostPopular Free Online Survey Tool,” Website, available:https://www.surveymonkey.com/, retrieved: February, 2019.
[8] QuestBack GmbH, “Startseite — Unipark,” Website, available:https://www.unipark.com/en/, retrieved: February, 2019.
[9] Butter CMS, “Microservices for Startups,” Open Access,https://s3-us-west-2.amazonaws.com/buttercms/ButterCMS+presents+MicroservicesForStartups.pdf, retrieved: February, 2019.
[10] J. Fritzsch, J. Bogner, A. Zimmermann, and S. Wagner, “FromMonolith to Microservices: A Classification of RefactoringApproaches,” CoRR, vol. abs/1807.10059, 2018.
[11] O. Vogel, I. Arnold, A. Chughtai, E. Ihler, T. Kehrer, U. Mehlig,and U. Zdun, Software-Architektur: Grundlagen - Konzepte - Praxis(Software Architecture: Basics - Concepts - Practice), 2nd ed.Heidelberg, Germany: Springer, 2009.
[12] T. Mika and M. Stegmann, Handbuch Methoden der empirischenSozialforschung (Handbook Methods of Empirical Social Research).

165
International Journal on Advances in Software, vol 12 no 1 & 2, year 2019, http://www.iariajournals.org/software/
2019, © Copyright by authors, Published under agreement with IARIA - www.iaria.org
Wiesbaden, Germany: Springer, 2014, vol. 1, ch. Langsschnittanalyse(Longitudinal Analysis), pp. 1077–1087.
[13] IBM United Kingdom Limited, “IBM SPSS Statistics - Overview- United Kingdom,” Website, available: https://www.ibm.com/uk-en/marketplace/spss-statistics, retrieved: February, 2019.
[14] Microsoft, “Microsoft Excel 2016, Download Spreadsheet software— XLS XLSX,” Website, available: https://products.office.com/en-gb/excel, retrieved: February, 2019.
[15] The R Foundation, “R: The R Project for Statistical Computing,”Website, available: https://www.r-project.org/, retrieved: February,2019.
[16] J. Bethlehem, “The TADEQ Project: Documentation of ElectronicQuestionnaires,” in Survey Automation: Report and Workshop Pro-ceedings, pp. 97–116, 2003.
[17] G. Chartrand and P. Zhang, Discrete Mathematics, ser. 1 edn. LongGrove, Illinois, USA: Waveland Press, Inc., 2011.
[18] T. H. Cormen, C. E. Leiserson, R. Rivest, and C. Stein, Introductionto Algorithms, ser. 3. Cambridge, UK: PHI Learning, 2010.
[19] M. Buhner and M. Ziegler, Statistik fur Psychologen und Sozialwis-senschaftler (Statistics for psychologists and social scientists), ser. 1.Auflage. Munich, Germany: Pearson, 2009.
[20] G. Brancato, S. Macchia, M. Murgia, M. Signore, G. Simeoni,K. Blanke, T. Korner, A. Nimmergut, P. Lima, R. Paulino, andJ. Hoffmeyer-Zlotnik, Handbook of Recommended Practices forQuestionnaire Development and Testing in the European StatisticalSystem, 1st ed. European Statistical System (ESS), 2006, no.European Commission Grant Agreement 200410300002.
[21] S. S. Stevens, “On the Theory of Scales of Measurement,” Science,vol. 103, no. 2684, pp. 677–680, 1946.
[22] J. Rost, Lehrbuch Testtheorie – Testkonstruktion (Textbook TestTheory – Test Construction), ser. Zweite, vollstandig uberarbeiteteund erweiterte Auflage. Bern, Switzerland: Huber, 2004.
[23] M. A. Robinson, “Using multi-item psychometric scales for researchand practice in human resource management,” Human ResourceManagement, vol. 57, no. 3, pp. 739–750, 2018.
[24] H. Moosbrugger and A. Kelava, Eds., Testtheorie und Fragebo-genkonstruktion (Test Theory and Survey Construction), ser. 2.,aktualisierte und uberarbeitete Auflage. Berlin, Germany: Springer,2011.
[25] E. Martin, Encyclopedia of Social Measurement. Elsevier, ch.Survey Questionnaire Construction, pp. 723–732, 2005.
[26] J. B. Gregg, “Questionnaire Construction,” Hospitality Review,vol. 7, no. 2, pp. 45–56, 1989.
[27] P. J. Pahl and R. Damrath, Mathematical Foundations of Computa-tional Engineering: A Handbook, ser. 1. Auflage, F. Pahl, Ed. Berlin,Germany: Springer, 2001.
[28] A. V. Aho, M. S. Lam, R. Sethi, and J. D. Ullman, Compilers: Pear-son New International Edition: Principles, Techniques, and Tools,2nd ed. Essex, UK: Pearson Education, 2013.
[29] E. J. Evans, Domain-Driven Design: Tackling Complexity in theHeart of Software. Addison Wesley, 2003.
[30] R. Soley and OMG Staff Strategy Group, “Model Driven Archi-tecture,” Object Management Group, Needham, USA, White PaperDraft 3.2, 2000.
[31] D. Steinberg, F. Budinsky, M. Paternostro, and E. Merks, EMF:Eclipse Modeling Framework, 2nd ed., ser. The Eclipse Series,E. Gamma, L. Nackman, and J. Wiegand, Eds. Boston, USA:Addison Wesley, 2008.
[32] E. Yourdon and L. L. Constantine, Structured Design: Fundamentalsof a Discipline of Computer Program and Systems Design, 1st ed.Upper Saddle River, New Jersey, USA: Prentice Hall, 1979.
[33] J. Ooms, “The OpenCPU System: Towards a Universal Interface forScientific Computing through Separation of Concerns,” ComputingResearch Repository (CoRR), vol. abs/1406.4806, pp. 1–23, 2014.
[34] T. M. Prinz, L. Grafe, J. Plotner, and A. Vetterlein, “StatischeAanalysen von Online-Befragungen mit der ProgrammierspracheliQuid (Static Aanalysis of Online Surveys with the Help of theProgramming Language liQuid),” in Proceedings 19. KolloquiumProgrammiersprachen und Grundlagen der Programmierung, KPS2017, Weimar, Germany, pp. 59–70, September 25–27, 2017.
[35] T. M. Prinz, R. Bernhardt, J. Plotner, and A. Vetterlein, “ProgressIndicators in Web Surveys Reconsidered — A General ProgressAlgorithm,” in ACHI 2019: The Twelfth International Conferenceon Advances in Computer-Human Interactions, Athens, Greece,February 24–28, 2019. Proceedings, pp. 101–107.
[36] M. Fowler, D. Rice, M. Foemmel, E. Hieatt, R. Mee, and R. Stafford,Patterns of Enterprise Application Architecture, 1st ed., M. Fowler,Ed. Boston, USA: Addison Wesley, 2003.
[37] B. Cavalier and D. Denicola, Promises/A+ Promise Specification,Open Access, Promises/A+ organization Std. 1.1.1, 2014, available:https://promisesaplus.com/, retrieved: January, 2018.
[38] W. J. van der Linden and C. A. W. Glas, Eds., ComputerizedAdaptive Testing: Theory and Practice. Netherlands: KluwerAcademic Publishers, 2000.
166
International Journal on Advances in Software, vol 12 no 1 & 2, year 2019, http://www.iariajournals.org/software/
2019, © Copyright by authors, Published under agreement with IARIA - www.iaria.org
Facilitating a Statewide GIS Metadata Standard through Training, Outreach and Programmatic
Metadata Evaluation
Timothy Mulrooney
Dept. of Environmental, Earth and Geospatial Sciences
North Carolina Central University
Durham, NC, USA
e-mail: [email protected]
Abstract— Under the supervision of the North Carolina Geo-
graphic Information Coordinating Council and Statewide
Mapping Advisory Committee, a committee defined and devel-
oped a State and Local Government Metadata profile intended
for use in North Carolina. This profile is based on the Inter-
national Organization for Standardization 191** standards.
In addition to dictating best practices and conventions for ex-
isting metadata entries such as the Title, Publication Date and
Use Constraints, this standard accounts for evolving technolo-
gies that did not exist when original metadata standards were
first developed. While the rate at which geoinformation is
created has exponentially increased, the time dedicated to cata-
loging and subsequently assessing and evaluating this metadata
information remains nearly the same. In addition to educating
the North Carolina Geographic Information Systems commu-
nity on the use and application of metadata, as well as this new
standard, the research team is developing tools so GIS manag-
ers can gauge standard compliance more efficiently and proac-
tively than in the past. In this paper, the research team has
been using programming methods in which metadata entries
from multiple layers in large geospatial databases can be as-
sessed and evaluated. These methods were tested using various
quantitative methods, including the Technology Acceptance
Model. This can provide insight into the various accuracies
(horizontal, vertical, temporal, etc.) of layers which in turn can
dictate future efforts. It can also be used to identify inconsist-
encies in metadata entries with an end goal of understanding
misinterpretation and misunderstanding of the profile so it can
be improved in future incarnations.
Keywords-GIS Metadata; Metadata; Metadata Profile; North
Carolina State and Local Government Profile.
I. INTRODUCTION
A Geographic Information System (GIS) serves as the tangible and intangible means by which information about spatially related phenomena can be created, stored, analyzed and rendered in the digital environment [1]. Experts in many dissimilar fields have seen the utility of GIS as a means of quantifying and expanding their research. GIS is used in disciplines such as business, sociology, justice stud-ies, surveying and the environmental sciences. In the North Carolina GIS community, GIS is used to represent transpor-tation routes, elevation, delineate land ownership parcels, school attendance, highlight patterns of crime and help make zoning decisions. The manner in which geospatial data is captured varies. Some methods include using a
Global Positioning System (GPS) unit, extracting or im-proving existing GIS data, downloading data from a web site, connecting to a service, the use of an Unmanned Aerial Vehicle (UAV) or some other remote sensing platform, or creating data from an analog format via digitization or georectification. Regardless of the method, the resources (e.g., the computers, time and people dedicated to the pro-cess of collecting and creating geospatial data) are the most time-consuming portion of a GIS-related project [2]. As a result, the GIS community needs to ensure the quality of geospatial data created from these methods is captured, stored and assessed in a systematic way.
Geospatial metadata serves as the formal framework to catalog descriptive, administrative and structural infor-mation about geospatial data. Geospatial metadata is inher-ently different from other forms of electronic metadata be-cause each metadata file can be applied a spatial component that is not implicit with other forms of metadata. These spatial components encompass a wide array of information to include the date, methods and sources by which geospa-tial information was captured, means to ensure that the geo-spatial information adheres to acceptable standards and/or aligns with other geospatial datasets to ensure seamless analysis, projection information of the dataset and bounding coordinates of the dataset. All of these entries, in addition to the data’s non-spatial components can be queried within the confines of geospatial data portal such as one found at North Carolina OneMap, the geospatial data portal for the state of North Carolina [3].
Given the capricious rate at which all forms of geo-information can be created, formal metadata (i.e. metadata stored using a widely-recognized and agreed-upon format) serves as a lifeline between the tacit knowledge of the data creator and current and future generations of geospatial data consumers. In the United States, the Federal Geographic Data Committee (FGDC) metadata standard, commonly referred to as the Content Standard for Digital Geospatial Metadata (CSDGM) allows for more than 400 individual metadata elements. The North Carolina GIS community has been proactive about understanding the importance of metadata.
Maintaining a complete and comprehensive metadata record is a continual and interactive process. GIS metadata is one of the most overlooked and underappreciated aspects of any GIS enterprise or project. If time or resources need to be sacrificed in the course of a project, it is usually at the

167
International Journal on Advances in Software, vol 12 no 1 & 2, year 2019, http://www.iariajournals.org/software/
2019, © Copyright by authors, Published under agreement with IARIA - www.iaria.org
expense of metadata. Information is key to an organiza-tion’s vitality, sustainability and success. Metadata should be treated as an investment. Maps and analysis are only as good as the data on which they are based. Metadata is a direct reflection of this investment and the organization which makes this investment. Metadata captures important information related to data creators, data quality and the various accuracies (horizontal, vertical, temporal, attribute, semantic, etc.) with which we can quantitatively measure GIS data. These measurements help guide the decision- making process, especially in larger (hundreds of layers) spatial databases. Not only is good metadata a wise busi-ness practice, but saves time, money and resources in the long run. Unfortunately, metadata’s true value is not real-ized until it is absent, and few studies have been done to place a direct monetary value on metadata.
Under the supervision of the North Carolina Geographic Information Coordinating Council (NCGICC) and Statewide Mapping Advisory Committee (SMAC), a com-mittee was tasked to develop a State and Local Government Metadata profile for geospatial data intended for use in North Carolina as well as educating the North Carolina GIS user community about this standard. This standard is based on the International Standards Organization (ISO) 191** format and is an improvement over prior metadata standards to account for evolving technologies such as remotely sensed imagery, online services and ontologies. These were not considered when original metadata standards such as the CSDGM (formally known as FGDC-STD-001-1998) were first published.
At this time, assessing and evaluating adherence to this
standard for large spatial databases is an exhaustive process,
as users must toggle through multiple levels of metadata
records among multiple features a using a metadata editor.
In this day and age, it is ‘‘unrealistic to depend on tradition-
al humanly generated metadata approaches’’ when attempt-
ing to assess metadata integrity [4]. However, a happy me-
dium must be found between quality assurance, quality con-
trol and the necessary human component involved in this
process that cannot be replicated in the digital environment.
While some research [5] subscribes to the mechanization of
metadata assessment processes as the most effective and
efficient, other research [6] [7] concedes that metadata is
best managed through the integration of the human and digi-
tal components. While the level of human interaction in this
process should be minimal, it should not be eliminated alto-
gether. On that end, the goal of this paper is to propose a
programmatic and faster assessment and evaluation alterna-
tive within the context of statewide metadata training that
can be used by GIS management to facilitate decision-
making. In doing so, it addresses and reinforces how pro-
grammatic metadata assessment and evaluation has begun to
be implemented by the professional community. The rest of this paper is organized as follows. Section II
describes the evolution of metadata. Section III describes the specific use and application of the North Carolina State metadata profile. Section IV addresses the how standard compliance is addressed. Section V discussed preliminary
results. The acknowledgement and conclusions close the article.
II. THE EVOLUTION OF METADATA SCIENCE
AND ASSESSMENT
Metadata serves as an organized means to describe a da-
taset, and it provides the formal framework for providing
information about a dataset’s lineage, age and creators.
Metadata is composed of both qualitative and quantitative
information and while metadata’s original use was simply as
a means to catalog data, its storage and assessment has be-
come a science in itself.
The FGDC regularly meets to determine all possible val-
ues, parameters and domains that can be captured and ex-
pressed within the confines of GIS metadata. First formed
in the early 1990s, the FGDC serves as a governing body for
geospatial data and metadata in the United States. The
FGDC defines metadata as the following:
A metadata record is a file of information, usually pre-
sented as an XML document, which captures the basic
characteristics of a data or information resource. It rep-
resents the who, what, when, where, why and how of
the resource. Geospatial metadata are used to document
geographic digital resources such as Geographic Infor-
mation System (GIS) files, geospatial databases, and
earth imagery. A geospatial metadata record includes
core library catalog elements such as Title, Abstract,
and Publication Data; geographic elements such as Ge-
ographic Extent and Projection Information; and data-
base elements such as Attribute Label Definitions and
Attribute Domain Values [8].
FGDC metadata standards dictate that a plethora of indi-
vidual entries (now more than 400 and counting) are popu-
lated for compliant GIS metadata [8]. Thus, ensuring
metadata integrity for large spatial data sets is a time-
consuming process if done by hand. It is not uncommon for
organizations to employ thousands of individual data layers
within their digital warehouses. Since traditional GIS data
are ever-evolving, metadata standards must be flexible
enough to account for new technologies. Policy should dic-
tate that these standards be revisited periodically to ensure
adaptability that can be implemented through large-scale
changes or the publishing of new metadata standards. The
GIS community has employed a set of content standards to
ensure compatibility across the entire GIS community. The
updated State and Local Government Metadata profile de-
veloped by the NCGICC based on the ISO 191** discussed
in this paper highlights this adaptability and is an example
of one of these standards.
While regarded as a relatively new concept, both formal
spatial and non-spatial metadata has existed in one form or
another for the past 50 years. MARC (Machine Readable
Cataloging) and its successor MARC 21 are used by the Li-
brary of Congress to catalog bibliographic resources. This
168
International Journal on Advances in Software, vol 12 no 1 & 2, year 2019, http://www.iariajournals.org/software/
2019, © Copyright by authors, Published under agreement with IARIA - www.iaria.org
system has been in place since the 1960s, but it was not
originally designed for computer interfacing, and the format
is not very intuitive [9]. A more popular format called the
Dublin Core was created in 1995 for electronic recourses
such as web pages and software applications. While the
FGDC and GIS metadata standards described here actually
predate this more generalized format, GIS metadata data
contains a variety of geographically-explicit descriptors that
may not be fully understood by the non-GIS community
[10].
Dublin Core and FGDC generally share a base level of
descriptive metadata elements. While Dublin Core is used
to describe electronic resources and digital representations
of physical resources such as artwork, GIS metadata adheres
to FGDC and more recently ISO standards. These require-
ments are always changing as dictated by technology. Be-
cause of the spatial nature of GIS data, FGDC requirements
dictate that information pertaining to absolute location be
retained. These fields include datum, coordinate system,
false easting, false northing and bounding coordinates.
While Dublin Core does make accommodations for place
keywords and spatial descriptors, it does not contain place-
holders for elements that help describe geodetic elements
associated with the quantitative representation of location
with as much detail as GIS metadata.
Because of the different goals of each standard, a pre-
cipitous balance between MARC, Dublin Core and FGDC
Metadata must be found. Cross-walking, a tedious and
sometimes imprecise process where either people or algo-
rithms find matching elements between the different stand-
ards may be necessary because various organizations use
these popular formats interchangeably on a routine basis.
Cross-walking methods have been used to match geospatial
data to standards outside of FGDC, such as examining the
feasibility of compatibility with the Dublin Core metadata
standard [11][12].
Current research in the field of metadata can be closely
associated with statistics and high-speed processing. Given
the exponential increase in electronic resources and media,
technologies must be able to accommodate the automation
of resources that are viewed, accessed, and assessed. Re-
search examined the role of metadata and its ability to be
assessed, arguing that metadata for metadata’s sake does no
good [13]. Metadata must have some utility as it needs to
be assessed and have a role within the decision-making pro-
cess. Metadata must ultimately serve a purpose and specifi-
cally the greater good of the user community. While other
research proposes a quality assessment for metadata, it fails
to do so with regards to changes in metadata quality, their
accompanying values and the holistic structure used to store
them [14]. With the standardization of XML-based FGDC
and ISO metadata standards, metadata can be compared
from one time period to the next. One of these structures is
through ontology, a semantic representation of a concept
through various domains and properties. Most recently, e-
learning technologies were applied to these ontological
metadata structures [15]. However, the lack of human cog-
nition within these ontologies cannot eliminate unnecessary
or ambiguous terms using results from previous analysis,
sometimes referred to as semantic accuracy within the con-
fines of GIS Quality Assessment/Quality Control (QA/QC)
circles.
The role of metadata assessment can be seen in a varie-
ty of different fields. An Electronic Metadata Record
(EMR), for example, is an emerging technology that is pro-
duced and edited when an electronic document is edited or
created, such as a patient record or digital x-ray. A number
of other related technologies for the medical industry have
been developed to serve as a quality assurance and adminis-
trative tools. The process of accessing, viewing, and com-
menting on patient files or x-rays by physicians in electronic
form can be documented and stored in a metadata file.
Hardcopy records are often times time-consuming to com-
plete, and they can be easily lost or destroyed. Thus, the
ease of storing, accessing, and retrieving electronic metadata
and files for medical data can help prevent litigation against
malpractice lawsuits [16]. For example, a complex statisti-
cal analysis was developed to retrieve biomedical articles
from more than 4,800 journals to help support the decision-
making process [17]. It is impossible to scrutinize each of
14 million individual manuscripts. Clustering and classifi-
cation methods performed on metadata derived from tradi-
tional statistical techniques are used to explore and retrieve
related information within biomedical literature. If properly
maintained, metadata serves as a capable surrogate when
querying scanned imagery or hard copy information is not
feasible and further validates in-situ decisions as they are
reinforced by easily accessible support literature.
Metadata has the flexibility to capture many forms of
qualitative and quantitative information stored as numbers,
text strings, domain values and dates. However, it does
have its drawbacks. In addition to the time, resources and
expertise required to populate the information, ancillary
concerns exist. Metadata can be applied to any electronic
resource, but there are data privacy concerns, especially
within the medical community. For example, metadata can
be updated and collected to determine the number of times a
medical professional has viewed patients’ information with-
in the EMR [16]. Not only does this address privacy con-
cerns by documenting access to particular records, but
serves to report when, by whom and how long a digital rec-
ord was viewed. In addition, EMR should not serve as an
end-all diagnostic tool, especially when clinical data do ex-
ist. Metadata should aid in the evaluation and decision-
making process. Other research used image sharing com-
munity to further reinforce this point and brought up more
excellent points [18]. Metadata for an image (date of image,
place, context, etc.) is collected and stored with the image.
Furthermore, social metadata not only explores information
about the image itself within its place in the social media
environment, but also tangential information related to an
image such as comments about the image, information about

169
International Journal on Advances in Software, vol 12 no 1 & 2, year 2019, http://www.iariajournals.org/software/
2019, © Copyright by authors, Published under agreement with IARIA - www.iaria.org
people who have posted comments about the image and the
user groups to which these commenters belong [19]. Limit-
ing this information greatly reduces the amount of analysis
that can be performed on the accompanying image, decreas-
ing the availability to knowledge in order to make sound
business decisions. As this applies to GIS metadata, a hap-
py medium must be found so privacy concerns can be satis-
fied while dutiful analysis can be performed. Given the
relative infancy of these subjects and lack of established
doctrine, the body of knowledge is still growing in this sub-
ject.
The very nature of spatial data dictates that a different
approach must be taken for assessment and reporting within
the digital environment. The proliferation of spatial tech-
nologies underscores the widely accepted and legitimate
role of metadata within the GIS user community [20]. All
elements intrinsic to spatial data, such as those associated
with position (e.g. latitude, longitude) as well as its repre-
sentation (e.g., accuracy) must be carefully documented and
recorded in GIS metadata. It is important that information
about the data format, a description of the data, the process-
es by which the data were created, the areal extent of the
data and the people who aided in data creation be retained.
Formal controls may dictate specific tolerances for horizon-
tal and temporal accuracy. This information is not only im-
portant from a legal standpoint, but it also validates GIS
analysis by speaking directly to such necessary components
as its horizontal and temporal accuracy. Since GIS analysis
is only as good as the data on which it is based, metadata
reinforces the data and ultimately the analysis and organiza-
tions which develop the GIS data.
As mentioned previously, metadata is important in help-
ing to document dimensions of quantifiable GIS data quality
such as attribute accuracy, horizontal accuracy and attribute
completeness. Other forms of GIS data accuracy do in fact
exist. FGDC and spatial data transfer standards (SDTS)
also consider vertical accuracy (error in measured vs. repre-
sented elevation), data lineage (source materials of data) and
logical consistency (compliance of qualitative relationships
inherent in the data structure) as part of data quality
[21][22]. In some GIS circles, temporal accuracy (age of
the data compared to usage date) and semantic accuracy or
“the quality with which geographical objects are described
in accordance with the selected model” are also considered
elements of data quality [23]. Placeholders within FGDC
metadata exist to capture all of this information either quan-
titatively or qualitatively.
Early pioneers of GIS recognized the importance of data
quality, not only from a cost efficiency standpoint, but be-
cause of the legal ramifications in publishing incorrect spa-
tial information which may lead to accidents or the misuse
of data [24]. Even then, they understood the reconciliation
between accuracy, the cost of creating accurate data and the
eventuality that some error will occur. It is unreasonable to
expect an organization such as the North Carolina Depart-
ment of Transportation (NCDOT) to photo-revise and field
check every single road in their GIS database, re-attribute it
correctly and then verify them using another party in a time-
ly manner given current personnel and financial constraints.
This compromise is referred to as uncertainty absorption
[25]. Regardless of resource allocation, verification of data
quality should be done by discipline experts with a long-
term goal of developing data quality standards. This helps
to protect the GIS data producer from the potential misuse
of GIS data and metadata serves as the means to formally
inform the data user of data quality measures applied to da-
ta, as well as protect GIS data stewards from its misman-
agement [26]. In and of itself, data quality has no inherent value or worth, but is ultimately realized when action is taken on information pertaining to data quality [27]. Along those same lines, the end goal of information quality is to satisfy customer needs, in this case being the many users who uti-lize GIS data with the understanding that the data have un-dergone some form of validation [28]. Quantitative measures related to this validation with qualitative processes needs to be highlighted in metadata.
Early research and commentary on the concept of geo-
spatial metadata has touted its value as an effective deci-
sion-support tool, regardless of its native format [29]. These formats include Hyper Text Markup Language (HTML), Extensible Markup Language (XML) along with its various ISO standards (19115, 19115-1, 19139), TXT (Text File), Geography Markup Language (GML) and Standard Generalized Markup Language (SGML), as well as proprietary formats. Methodology has explored the abil-ity to integrate spatial metadata to a stand-alone database long before GIS metadata was stored in a standardized for-mat, as well as compiling statistics about metadata elements within the confines of specific software [30] [31]. To that end, the population of geospatial metadata is a monotonous process and subject to error, although research has explored the large-scale production of standards-based metadata in order to alleviate these issues [32] [33]. Be-cause of this, research maintains that human nature alone undermines the immediate and long-term goals of metadata for an organization and the GIS user community [34]. While the omission of one minor element would not degrade a layer’s metadata or invalidate the geospatial data on which it is based, it may compromise quantitative data quality measures captured from which decisions can be made. More recently, feature level metadata has been able to cap-ture data quality information, but is typically limited to quantitative measures of positional accuracy and qualitative information related to data lineage within eight of the more than 400 entries that comprise a complete FGDC-compliant metadata file [35] [36]. Even now, the population of these metadata elements is not fully automated and some entries must be done by a GIS data steward. However, methodolo-gies to explore its assessment and evaluation are evolving. Efforts have been made to quantitively assess metadata quality using both a human and statistically-automated ele-ment [37] and this paper explores this notion within the con-fines of and applied to a particular standard.

170
International Journal on Advances in Software, vol 12 no 1 & 2, year 2019, http://www.iariajournals.org/software/
2019, © Copyright by authors, Published under agreement with IARIA - www.iaria.org
III. THE NORTH CAROLINA STATE AND LOCAL
GOVERNMENT PROFILE
Geospatial metadata standards serve as a cohesive and standardized means by which organizations can define, store and more importantly share information about geospatial data. It defines the categories of information that needs to be stored, individual entries, or tags, of individual elements within these categories and the types of data (text, date, number) and their lengths that can be stored while represent-ing these tags. FGDC metadata is divided into 7 sections or divisions that transcend descriptive, administrative and structural components. They are: Identification Infor-mation, Data Quality Information, Spatial Data Organiza-tion Information, Spatial Reference Information, Entity and Attribute Information, Distribution Information, and Metadata Reference Information [38]. Within these high-level divisions, subdivisions and even-tually individual metadata tags can be populated to catalog various forms of information about the GIS data layer. The hierarchy of these divisions and subdivisions are consistent with a standard. In addition to providing this structure, the FGDC also creates guidelines by dictating which metadata elements are to be populated. The FGDC requires seven metadata elements be populated for all GIS data. The FGDC also suggests that fifteen metadata elements be popu-lated. These suggested and required elements are included in Table I below.
TABLE I: REQUIRED AND SUGGESTED FGDC ELEMENTS. FGDC -Required
Elements
FGDC- Suggested Elements
Title
Reference Date
Language
Topic Category Abstract
Point of Contact
Metadata Date
• Dataset Responsible
Party
• Geography Locations
by Coordinates (X)
• Geography Locations
by Coordinates (Y)
• Data Character Set
• Spatial Resolution
• Distribution Format
• Spatial Representation
Type
• Reference System
• Metadata Character
Set
• Lineage Statement
• Online Resource
• Metadata File Iden-
tifier
• Metadata Standard
Name
• Metadata Standard
Version
• Metadata Language
Organizations actively create content standards for new
technologies and manners in which geospatial data are col-
lected and stored. One such example is the FGDC content
standard for Remotely Sensed Data. This includes two divi-
sions germane to the equipment and methods such as plat-
form name, sensor information and algorithm information
used to capture the imagery, in addition to the seven existing
aforementioned divisions [39]. In order to further elucidate
descriptive, administration and structural information, addi-
tional addendums to existing metadata standards are also
attached to specific geospatial-specific data such as address-
es, biological data, shoreline data, and vegetation data.
Standards such as these must be increasingly flexible and
updatable to account for the evolving technologies in which
geospatial data can now be captured (crowdsourcing, Un-
manned Aerial Vehicle, large scale geocoding), processed
(new geostatistical and interpolation algorithms) and ulti-
mately delivered (web map service, web feature service) to
the GIS user community. In recent years, the North Carolina SMAC has recog-
nized most GIS data managers lack the time and resources necessary to learn and apply a metadata standard that main-tains dataset integrity and retains pertinent information while not being too demanding on existing resources, most notably time and people. To address the problem of missing or incomplete metadata records among state and local data publishers, the SMAC chartered an ad-hoc Metadata Com-mittee in October 2012 to “recommend ways to expand and improve geospatial metadata in North Carolina that are effi-cient for the data producer and benefit data users in the dis-covery and application of geospatial data.” The Metadata Committee submitted a draft of this profile, based on the ISO 19115 (for Geographic Information – Metadata: 2003), ISO 19115-1 (for Geographic Information – Metadata – Part 1: Fundamentals: 2014) and ISO 19119 (Geographic In-formation – Services: 2016) standards. After review and modification by SMAC and its standing committees, the most current version of this standard has been in effect since December 30, 2016 and is available through the NCOneMap portal [40]. While not entirely ground-breaking, North Car-olina has been a forerunner in developing sub-country metadata standards. The SMAC worked with the Canadian Province of Alberta, who has already developed a standard germane to their province while states such as Missouri and Virginia have developed some level of uniform metadata available with their products. Internationally, GeoDCAT-AP is a metadata profile designed to facilitate interchange for data portals operated by EU Member States. It uses the aforementioned ISO 19115 format and the INSPIRE metadata standard, which is primarily used in Europe [41].
Given seven required and fifteen recommended metadata elements are fairly ambiguous and less than ideal for many organizations whose data is integrated into the NCOneMap, the North Carolina state geospatial data portal, this profile provides explicit guidance on required/suggested metadata elements, wording for these elements, standardization of naming/date conventions and domain fields for topic catego-ries for more than 75 metadata tags [42]. A few examples of the rules for geospatial metadata include: 1. Title is required as a free-text entry. 2. Publication Date is required and the format for Publica-
tion Date is YYYY-MM-DD or YYYYMMDD. If day is not known, use YYYY-MM and use YYYY if month is not known.
3. Abstract is required as a free text entry. Do not use YYYYMM since it can’t be distinguished from the in-correct, but still used YYMMDD.
4. Status is required and only possible values are ‘histori-calArchive’, ‘required’, ‘planned’, ‘onGoing’ ‘complet-ed’, ‘underDevelopment’ and ‘obsolete’.
5. Topic Category is required and can be one of 23 possible values from domain table.
6. Use Constraints required as a free-text entry to describe any restrictions with using the data.

171
International Journal on Advances in Software, vol 12 no 1 & 2, year 2019, http://www.iariajournals.org/software/
2019, © Copyright by authors, Published under agreement with IARIA - www.iaria.org
7. Online linkage is required to an URL address that pro-vides access, preferably direct access, to the data.
In addition, given their nature and distinct differences be-tween their geospatial data counterparts, the SMAC has defined rules for geospatial services to include the follow-ing:
1. Metadata Scope code must be ‘service’. 2. Online Function code is required from domain of one
of five possible values. 3. Title is required as a free-text entry. 4. Metadata Contact is required as a free-text entry, rep-
resenting Organization Name of the agency that serves as a point of contact for the metadata record.
This richer metadata enables content consistency and improves the search and discovery of data through NCOneMap.
As part of a needs assessment for this project, a survey was developed to help dictate and direct metadata needs within the state of North Carolina. This survey was devel-oped in 2017 and distributed to the North Carolina GIS user community. Forty (40) respondents answered the survey, who ranged from GIS Technicians and Property Mappers to GIS Coordinators and Managers throughout the state of North Carolina. Questions were asked about respondents’ experience with data development, metadata, as well as or-ganizational requirements as it pertains to metadata.
Most prominent was the schism between respondents’ experience with data development and experience with metadata, as shown in Figures 1 and 2. Respondents gen-erally had an ‘excellent working knowledge’ of data devel-opment, but only ‘some experience’ or ‘working knowledge’ on the metadata created as a result of these data development techniques. These underscore technical expe-rience in creating new data in support of analysis and pro-jects, but less experience in cataloging these same data used for analysis and maps.
Figure 1: A survey of GIS professionals and experience with data devel-opment.
Figure 2: A survey of GIS professionals and experience with metadata.
Not only is this schism evidenced at the individual level,
but also at the organizational level. In a same survey of these 40 GIS professionals, they describe their organiza-tion’s approach to metadata as shown in Figure 3. More than half of all respondents’ organizations have no metadata requirement whatsoever and only five respondents work in an organization that has a firm metadata requirement. The rest do have a metadata requirement, but it is not upheld.
Figure 3: A survey of metadata requirements at the organization level. In response to this need and the motivation for this paper, the research team earned a research and education grant through the NCDOT and NCGICC to provide metadata training, education and support to the state of North Caroli-na. The goal of the “Facilitating the New Statewide GIS Metadata Standards Through Training and Outreach” grant ran from August 2016 through March, 2019. The goals of this project include:
1. Assessing the existing knowledge base of GIS users on
the subject of GIS metadata through surveys given to
training attendees.
2. Technical and material support to the implementation
and education of the new metadata profile to the North
Carolina GIS user community.
3. Understanding needs of GIS data managers when it
comes to metadata population and requirements for data
under their purview through surveys given to GIS data
managers.
4. Determining best methods to deliver metadata training to
the North Carolina GIS user community that close gaps

172
International Journal on Advances in Software, vol 12 no 1 & 2, year 2019, http://www.iariajournals.org/software/
2019, © Copyright by authors, Published under agreement with IARIA - www.iaria.org
between existing knowledge base and needs of GIS data
managers and the larger NC GIS community.
5. Assessment and evaluation of training activities to de-
termine best practices for future training and future sup-
port through post-training quantitative and qualitative
surveys.
This grant has provided support to the North Carolina
GIS user community through an assessment and evaluation
of current metadata activities by the North Carolina GIS
user community, work on the North Carolina State and Lo-
cal Government Metadata Profile, development of online
and face-to-face training materials and data in response to
this evaluation, and the delivery of face-to-face and virtual
training to the North Carolina GIS user community. This
grant has provided the opportunity for North Carolina Cen-
tral University (NCCU) students to develop metadata skills
and interface with members of the North Carolina GIS user
community in this niche and unique training opportunity
relatively unique to this state. As such, specific measurable
research tasks over the life of the project include:
1. Curriculum Review and QA/QC
2. Material and Training Support
3. Data Development
4. Facilitation of Online Resources
5. Development and Assessment of Metadata Templates
6. Development of Metadata Scripts
7. Report of Training Activities
8. Outreach to Educational Institutions and Professional
Organizations
In support of many of these tasks, face-to-face training
was provided on the campus of North Carolina Central Uni-
versity (Figure 4), as well as online.
Figure 4: Face-to-face metadata training given at North Carolina Central
University in 2018.
The Department of Environmental, Earth and Geospatial Sciences (DEEGS) at NCCU hosts YouTube tutorials rang-ing from metadata basics and the use and application of the
North Carolina State and Local Government Profile to more advanced topics such as XML translators and Python pro-gramming solutions in metadata assessment and evaluation [43]. These tutorials have been utilized more than 3,500 times.
IV. ASSESSING STANDARD COMPLIANCE
Given the ever-increasing size of GIS data sets and the
metadata requirements for each data layer, there needs to be
a mechanism to assess the quality of these metadata not seen
in previous generations or documented in existing literature.
There also needs to be a means by which individual metada-
ta entries adhere to predefined profiles and standards. This
is in support of Task 6 of the research tasks. Computer pro-
gramming languages and templates have helped to stream-
line this process. Templates populate redundant features
that are common throughout an entire GIS database such as
the purpose, supplementary information, distribution liabil-
ity statements and ordering instructions that can be specific
to an agency or department. These templates can be import-
ed one at a time, but programming techniques and software
packages have allowed users to assess information that
would take a human days or perhaps weeks to do. The
NCGICC provides a number of templates through their web
portal, NCOneMap [44]. The themes for these templates are
at the request of North Carolina GIS users, and include
buildings, cadastre, municipal boundaries, school attendance
districts, street centerlines, address points and orthoimagery.
These templates contain much of the verbiage about a lay-
er’s description and creation processes, and can be easily
imported and edited specific to the user’s contact infor-
mation. A sample of the identification information for the
cadastral data template can be seen in Figure 5.
Figure 5. Identification information metadata entries for cadastral template provided through NCOneMap web portal.
Open source programming solutions using Perl and R have been used to assess and evaluate metadata by travers-ing geospatial metadata stored in XML format as per FGDC requirements, resulting in quantitative metrics, graphs and reports regarding metadata compliance, as shown in Figure 6 [45].

173
International Journal on Advances in Software, vol 12 no 1 & 2, year 2019, http://www.iariajournals.org/software/
2019, © Copyright by authors, Published under agreement with IARIA - www.iaria.org
Figure 6: Sample of Metadata Compliance Report Generated Using Open Source Assessment Tool.
As applied to the NC State and Local Government Pro-file, one major challenge exists. Primarily, geospatial data and metadata is typically software specific. While optimal open source solutions could be used to gleam information from metadata stored in XML using an appropriate xPath, these software-agnostic solutions are typically loosely-coupled and not intuitive to the average user. As a result of reliance on Esri products throughout the state, the Python programming language is being used to run this iteration of an assessment and evaluation tool before open source solu-tions are explored.
Using the NC State and Local Government Profile as a guideline, the research team has been developing tools for data managers to access and evaluate metadata entries. At the current time, metadata entries are written to CSV (Comma Separated Values) files. While doing this, string operations are run to ensure that required entries are popu-lated, date entries comply with required conventions and domain entries match those in the domain table, all while
agglomerating results and statistics at the database, layer (record) and tag (attribute) level. This can provide GIS managers with insight on non-compliant metadata entries to determine relationships between non-compliant entries and the responsible data steward or particular attributes that are continually non-compliant.
While QC procedures need to be performed to determine if a metadata entry is accurate, below are a few examples of the many programming rules employed to determine if en-tries are populated properly. 1. Title, Responsible Party Organization Name, Online
Linkage, Abstract, Use Constraints, Feature Catalogues, Process Description, Spatial Reference Information and Metadata Contact Name cannot be Null
2. Data Type can only have values of ‘creation’, ‘publica-tion’, or ‘revision’.
3. Publication Date, Temporal Extent of Data and Metada-ta Creation Date must follow appropriate format. This entails: a. The date cannot be Null and must be populated. b. The date can only have a length of 10 (YYYY-MM-
DD) 8 (YYYYMMDD), 7 (YYYY-MM) or 4 charac-ters (YYYY).
c. Besides the hyphens (‘-‘), the date can only contain numbers whose value range from 0 through 9. Let-ters and other characters are not allowed.
d. If a date contains hyphens (‘-‘), there will be 2 hy-phens in a string that has a length of 10 (YYYY-MM-YY) and there will be 1 hyphen in a string that has a length of 7 (YYYY-MM).
e. Regardless of the format used, the first character of a string will either be ‘1’ or ‘2’ since the year of publi-cation or creation will begin in only those 2 numbers.
4. Metadata Contact Role Code can only have values of ‘custodian’ or ‘pointOfContact’.
5. Progress Code can only have values of ‘completed’. ‘historicalArchive’, ‘obslete’, ‘onGoing’, ‘planned’, ‘re-quired’ or ‘underDevelopment’.
6. Maintenance and Update Frequency can only have val-ues of ‘continual’, ‘daily’, ‘weekly’, ‘fortnightly’, ‘monthly’, ‘quarterly’, ‘ biannually’, ‘annually’, ‘asNeeded’, ‘irregular’, ‘notPlanned’ or ‘unknown’.
The current application has a basic GUI (Figure 7) that
allows for 4 input parameters: 1) an input database that contains the features classes for which metadata will be checked 2) an output folder to which XML metadata is writ-ten. Python cannot directly access metadata in geodatabase format, so this proprietary metadata is converted to XML format and traversed. Options exist so these XML files are immediately deleted. 3) The name and location of the out-put entries that store all metadata entries that are checked from the North Carolina State and Local Government Pro-file, as well as a summary of the percentage of individual metadata elements that are correct and a summary of per-centage of correct elements on a feature class by feature class basis and 4) the location of an error file that highlights errors within the metadata (Figure 8).

174
International Journal on Advances in Software, vol 12 no 1 & 2, year 2019, http://www.iariajournals.org/software/
2019, © Copyright by authors, Published under agreement with IARIA - www.iaria.org
Figure 8: Sample Error File Output from Metadata Assessment and Evalu-ation.
V. RESULTS
The Technology Acceptance Model (TAM) was used to assess and quantify the effectiveness of the metadata as-sessment tool. The TAM that we know of today was origi-nally created as a means to universally quantify the effec-tiveness of technology by exploring relationships between the technology’s Perceived Ease of Use, Perceived Useful-ness, Attitude Towards Using and the Intention to Further Use the technology [46]. Using Chronbach’s Alpha, Princi-pal Components Analysis and Simple Linear Regression, associations can be found between these various compo-nents, as shown in Figure 9.
Given that the intended usership of this research is
geared towards GIS professionals as opposed to developers
or programmers, a testing mechanism geared toward this
group would be more appropriate than testing code efficien-
cy or complexity. The TAM has served as a means to as-
sess and quantify the effectiveness of a technology for more
than 35 years and will do so once again for this research.
The TAM was originally created as a means to universally
quantify the effectiveness of technology [46]. It was born
from the fact that the adoption of new technologies is de-
pendent upon ambiguous and sometimes qualitative notions
such as psychological disposition, attitudes, intentions and
our own personal biases related to this new technology that
make it difficult to test and validate [47]. TAM is actually
the technical manifestation of the Theory of Reasoned Ac-
tion (TRA) [48]. TRA is the theory in which beliefs, com-
posed of attitudes, values and opinions at the individual lev-
el, eventually result in enacted behavior. Within the TAM,
this enacted behavior is the decision to adopt technology.
Empirical studies on the use and application of TAM
find that a technology’s acceptance is most related to its 1)
Perceived Usefulness and 2) Perceived Ease of Use. Per-
ceived Usefulness refers to the quality in which a technolo-
gy would help one’s job performance. While research [49]
[50] [51] has explored this usefulness dimension, TAM also
looks at this in concert with this technology’s “freedom
from difficulty or great effort” [45]. This ease of use factor
helps support the self-efficacy theory which focuses on
one’s innate ability to accomplish goals [52]. While there
are differences between the roots of this effectiveness and
seminal outcomes which at times can be paradoxical, TAM
encapsulates this within one encompassing desired end-state
of ultimately accomplishing one’s tasks with as little effort
as possible. Studies have actually shown the relationship
between this Perceived Usefulness and Ease of Use with the
adoption of technology is regardless of variables such as
gender and computer experience [53].
Using these two indicators as a guideline, Davis creates
questions that try to explain the usage and acceptance pat-
terns of a technology as per TRA. Users of the technology
are asked to scale responses to these questions similar on a
7-point Likert-type scale, representing “Strongly Agree”
through “Strongly Disagree”. Regression analysis between
this effectiveness and ease of use variables is determined at
various confidence intervals. In addition, principal compo-
nents analysis is used to explain the variance of usage inten-
tions as a function of Perceived Usefulness and this attitude
towards the technology. This and other hypotheses related
to Perceived Usefulness, Perceived Ease of Use, Attitude
Towards Using the technology and behavioral intention of
use are tested among each other [54].
TAM represents a milestone towards understanding hu-
man behavior as applied to the technology realm. Germane
to this research, TAM has been applied to e-learning [54] as
well as its place in the e-commerce environment as TAM
integrates technology and human behavior when applied to
online shopping [55]. Visiting an online store for the first
time has overwhelming consequences on whether the visitor
will visit again or make unplanned purchases. Making this
online shopping experience an easy, enjoyable and memo-
rable one is of utmost concern to these businesses. The or-
der in which material is presented, the amount of material
presented and the user’s cognitive impression of this materi-
al, its volume and its underlying messages play into this
perceived enjoyment factor. Finally, all of these facets need
to be assessed in a manner free of bias, confusion, miscon-
ception and misunderstanding.
Figure 7: Metadata Assessment and Evaluation Tool.

175
International Journal on Advances in Software, vol 12 no 1 & 2, year 2019, http://www.iariajournals.org/software/
2019, © Copyright by authors, Published under agreement with IARIA - www.iaria.org
Figure 9: Regression Used to Test Research Hypotheses where TAM was Tested Against Null Hypotheses to Test Correlations.
The validity of these assessment tools was tested using a
TAM. Responses from GIS professionals regarding the
results of this methodology were captured to find a relation-
ship between this technology’s Perceived Ease of Use, Per-
ceived Usefulness, Attitude Towards Using and the Inten-
tion to Further use this technology.
The results from TAM analysis (Figure 9) show 3 out of
the 5 research hypotheses (H1, H2 and H4) relating the
tool’s Perceived Ease of Use, Perceived Usefulness, Atti-
tude Towards Using and Intention to Use were accepted at a
95% confidence interval. Another (H5) could be accepted
at about a 70% confidence interval. In one non-supported
hypothesis (H3), it seemed that the strong responses from
the Perceived Ease of Use component obfuscated the Per-
ceived Usefulness component. As a result, the Perceived
Usefulness did not have much of an effect on the linear re-
gression model used to support the hypothesis. In the other
model (H5), the dependent variable is the Intention to Use
component using the Attitude Towards Using component as
the independent variable. The two components delve into
the question of implementing these assessment tools onto
their individual system and have elicited a wide array of
responses from respondents due to technical experience and
familiarity or understanding with the programming envi-
ronment, which is essentially an extension to the typical GIS
system and typically requires training above and beyond
that of a GIS Technician or Junior Analyst. While the effi-
cacy for these programming solutions exists, the efficiency
may not reciprocate for this reason. Nonetheless, these are
difficult to model. Even modeled by themselves without the
Perceived Usefulness component, a linear regression model
between these two factors (Attitude Towards Using MART
vs. Intention to Use) only produces an R2 value of
.118. Other factors – either those not captured within the
assessment or just unquantifiable by their very nature factor
into the non-support of this hypothesis. For example, GIS
Technicians working on few GIS data layers have little to
no need for metadata assessment and therefore no intention
to further use it. When enough GIS Managers have com-
pleted the assessment on which TAM is based, it will be run
once again on this new tool to assess its effectiveness for a
more germane usership. Regardless, these results help sat-
isfy the theoretical impetus of this research and are both
intriguing and promising for the future of GIS metadata and
widening role as an effective tool to elicit action.
VI. DISCUSSION
While a powerful and efficient tool, the programmatic assessment and evaluation of geospatial metadata still can-not altogether replace the human component. While these technologies can traverse metadata schema and extract tags to deem if they are complete, compliant or belong to a par-ticular domain, it does not necessarily mean they are correct. For example, while the Publication Date tag may be proper-ly populated (2016-02-29 for example) as per the rules dic-tated in the North Carolina State and Local Government Profile, it may not necessarily mean the data were published on that date. QA/QC techniques should be used to deter-mine metadata quality across the entire dataset via Ameri-can National Standards Institute (ANSI), American Society of Quality Control (ANSQ) or other institution-wide QA/QC procedures that best fit needs, resources and limita-tions.
While the level of attribution within metadata has im-
proved with each new standard and this particular profile, it
is in no way complete. As technologies improve and there
include more diverse ways to collect, manipulate and create
GIS data, metadata must be flexible enough to accommo-
date all of these techniques. For example, the standard
CSDGM does not contain placeholders germane to the col-
lection of data created via a GPS unit like the various Dilu-
tion of Position (DOP) measures such as vertical, horizontal
and 3D. In addition, detailed information directly associat-
ed with the quality of data specific to GPS-collected data
such as ephemeris can be entered via a free text field, but
lacks the placeholders within the CSDGM as well as this
standard. In addition, GIS data now extend well beyond the
typical raster and data models that a GIS professional may
have solely encountered only a decade earlier. GIS data
may now include stand-along tables, Triangulated Irregular
Networks (TINs), relationship classes and even topologies.
They each have their own intrinsic qualities that make their
creation and update difficult to encapsulate within a single
catch-all metadata format.
In addition, TAM does have its limitations. TAM may
not adequately explain for social influences [56]. More spe-
cifically, it is difficult to discern whether intent, attitude or
some other referent characteristic sufficiently explain usage
behavior. Principal Component Analysis can only do so
much within the paradigm of the testing environment. In
addition, it is difficult to explain how this physiological at-
tachment related to attitude and behavioral intention can be
assessed within TAM. Research has attempted to explain
this by expanding the dimensionality of testing elements
within a rotated component matrix, but this begins to fall
outside of the scope of this research [57]. Nonetheless, any
technology is an investment. Even using this model, it is
difficult to realize the value of the large-scale investment for

176
International Journal on Advances in Software, vol 12 no 1 & 2, year 2019, http://www.iariajournals.org/software/
2019, © Copyright by authors, Published under agreement with IARIA - www.iaria.org
an organization at an individual level given the multiple
intrinsic behaviors and intentions independent of this organ-
izational goal.
While the intersection of these various subjects serves as
the theoretical impetus of this research, assessing these
techniques can take on a variety of different forms. How
will technology be further disseminated in the working
world? How can this technology be assessed? While fac-
tors such as lost income and usership are quantitative in
nature, they are interwoven with determinants such as mar-
keting, depth and level of human-computer interaction, or-
ganizational structure and management of the technology,
which are tangential at best to this technology. Some of
these factors do not speak to the effectiveness of the tech-
nology, but the diffusion of this technology which helps to
proliferate its use. With this ‘chicken or the egg’ scenario,
it is sometimes difficult to compartmentalize a valid meas-
urement scale to assess technology acceptance alone for a
single piece of technology within the user community.
VII. CONCLUSION
The increasing schism between the rate at which data are created and the efficiency at which the metadata are as-sessed serves as the impetus of this research. GIS metadata serves as the means by which spatially-related phenomena can be catalogued within a formal framework. It is here where implicit information can be codified for use by the larger GIS community. Given the ever-increasing size of GIS data sets and the proficiency with which GIS data are created, there needs to be a mechanism to educate, assess and evaluate the human element to keep up with this profi-ciency. A means has been created to educate and inform a statewide GIS data community about a new standard, creat-ed by North Carolinians for North Carolinians based on input from North Carolinians. Programming techniques and software packages have allowed users to assess descriptive information about this standard that would take a human days or perhaps weeks to do.
In addition to addressing the quantitative need for metadata as well as a means to educate the GIS community about the salient procedures and technologies necessary to be conversant in the science of metadata, this paper ad-dressed solutions to educate a statewide community about metadata as well as measure adherence to a state-level pro-file. As per one of the goals of this paper, a programmatic solution using the Python programming language has been implemented. However, it is too early to tell how well these can be integrated into business processes at organizations such as the NCGICC. Revisiting this at a later time will provide time for acceptance of these techniques into main-stream GIS with little to no prior programming knowledge.
This research highlights the importance and need of pro-grammatic approaches to the assessment and evaluation of metadata for large spatial datasets. This information can provide GIS Managers with already limited resources with the tools to make informed decisions that are not feasible with visual inspection or a qualitative understanding of these increasingly large datasets.
ACKNOWLEDGMENT
The author wishes to thank the North Carolina Depart-ment of Transportation (NCDOT) for their generous support of this research as well as NCCU Undergraduate Student Richard Foster for his work on programming solutions relat-ed to this paper.
REFERENCES
[1] T. Mulrooney. “Assessing and Evaluating Standard Compliance with a State and Local Government GIS Metadata Profile in Large Geospaital Databases,” Proceedings of the Tenth International Conference on Advanced Geographic Information Systems, pp. 36 – 39. Rome, Italy, 2018.
[2] K. Leiden, K. Laughery, J. Keller, J. French, J., W. Warwick and S. Wood, “A Review of Human Performance Models for the Prediction of Human Error,” Moffett Field, CA : National Aeronautics and Space Administration, 2001.
[3] North Carolina One Map, Geographic Data Serving a Statewide Community [online]. Available from http://www.nconemap.gov/ [retrieved October 2018]
[4] J. Greenberg, K. Spurgin and A. Crystal, “Functionalities for Automatic Metadata Generation Applications: A Survey of Metadata Experts’ Opinions,” International Journal of Metadata, Semantics and Ontologies vol. 1(1), pp 3–20, 2006.
[5] J. Anderson and J. Perez-Carballo, “The Nature of Indexing: How Humans and Machines Analyze Messages and Texts for Retrieval: Part I: Research, and the Nature of Human Indexing,” Information Processing and Management: An International Journal, vol. 37(2), pp. 231–254, 2001.
[6] C. Schwartz, “Sorting Out the Web: Approaches to Subject Access,” Westport, Connecticut: Ablex Publishing, 2002.
[7] T. Craven, “DESCRIPTION Meta Tags in Public Home and Linked pages,” LIBRES: Library and Information Science Research Electronic Journal, vol. 11(2), 2001.
[8] Federal Geographic Data Committee, “Content Standard for Digital Geosp atial Metadata Workbook.” Washington D.C.: Federal Geographic Data Committee, 2000.
[9] Library of Congress. MARC Standards. [online], available from http://www.loc.gov/marc/ [retrieved August 2018].
[10] Dublin Core Metadata Initiative. Dublin Core Metadata Element Set, Version 1.1: Reference Description. [online], available from http://dublincore.org/documents/dces/ [retrieved September 2018].
[11] T. Reese, “Bibliographic Freedom and the Future Direction of Map Cataloging,” Journal of Map and Geography Librariess, vol. 2(1), pp. 67-90, 2005.
[12] J. Batcheller, “Automating Geospatial Metadata Generation—An Integrated Data Management and Documentation Approach,” Computers & Geosciences, vol. 34, pp. 387 – 398, 2008.
[13] B. Stvilia and L. Gasser, “Value-Based Metadata Quality Assessment.” Library & Information Science Research, vol. 30(1), pp. 67 – 74, 2008.
[14] T. Bruce and D. Hillman, “The Continuum of Metadata Quality: Defining, Expressing, Exploiting,” In: D. Hillman and E. Westbrooks, Editors, Metadata in Practice, ALA Editions, Chicago, pp. 238–256, 2004.
[15] M. Lee, K. Hua Tsai and T. Wang, “A Practical Ontology Query Expansion Algorithm For Semantic-Aware Learning Objects Retrieval,” Computers & Education, vol. 50(4), pp. 1240-1257, 2008.
[16] T. McLean, L. Burton, C. Haller and P. McLean, “Electronic Medical Record Metadata: Uses and Liability.” Journal of the American College of Surgeons, vol. 206(3), pp. 405 – 411, 2008.

177
International Journal on Advances in Software, vol 12 no 1 & 2, year 2019, http://www.iariajournals.org/software/
2019, © Copyright by authors, Published under agreement with IARIA - www.iaria.org
[17] T. Theodosiou, L. Angelis and A. Vakali, “Non-Linear Correlation of Content and Metadata Information Extracted From Biomedical Article Datasets,” Journal of Biomedical Informatics, vol. 41(1), pp. 202 – 216, 2008.
[18] J. Skågeby, “Semi-Public End-User Content Contributions—A Case-Study of Concerns and Intentions in Online Photo-Sharing,” International Journal of Human-Computer Studies, vol. 66(4), pp. 287-300, 2008
[19] J. Skågeby, “Exploring Qualitative Sharing Practices of Social Metadata: Expanding the Attention Economy,” The Information Society, vol. 25(1), pp. 60 – 72, 2009.
[20] T. Limbach, A. Krawczyk, and G. Surowiec, “Metadata Lifecycle Management with GIS Context,” Proceedings of the 10th EC GI & GIS Workshop, Warsaw, Poland, 2004.
[21] Federal Geographic Data Committee, “Content Standard for Digital Geosp atial Metadata Workbook.” Washington D.C.: Federal Geographic Data Committee, 2000.
[22] United States Geological Survey, “Spatial Data Transfer Standard (SDTS): Logical specifications.” Reston, Virginia: United States Geologic Survey, 1997.
[23] F. Salgé, “Semantic accuracy,” In S.C. Guptill and J.L. Morrison (Eds.), Elements of Spatial Data Quality (pp. 139-152). New York: Elsevier Science Ltd., 1995.
[24] E. Epstein, “Litigation over information: The use and misuse of maps,” Proceedings, IGIS: The Research Agenda 1 (pp. 177-184). Washington, D.C.: NASA, 1988.
[25] Y. Bedard, “Uncertainties in land information systems databases,” Proceedings of the 8th International Symposium on Computer Assisted Cartography (Auto Carto 8), (pp. 175-184), Baltimore, Maryland, 1987.
[26] S. Aronoff, “Geographic Information Systems: A Management Perspective,” Ottawa: WDL Publications, 1989.
[27] E. Dalcin, “Data quality concepts and techniques applied to taxonomic databases,” Ph.D. Thesis, School of Biological Sciences, Faculty of Medicine, Health and Life Sciences, University of Southampton, 2004.
[28] L. English, “Improving data warehouse and business information quality: Methods for reducing costs and increasing profits,” New York: John Wiley and Sons, 1999.
[29] D. Wong and C. Wu, “Spatial Metadata and GIS for Decision Support,” Proceedings of the Twenty-Ninth Hawaii International Conference, vol. 3 (3 – 6), pp. 557 – 566, 2006.
[30] D. Lanter, “A Lineage Meta-Database Approach Towards Spatial Analytic Database Optimization,” Cartography and Geographic Information Systems, vol. 20(2), pp. 112-121, 1993.
[31] D. Lanter, “The Contribution of ARC/INFO's Log File to Metadata Analysis of GIS Data Processing,” Proceedings of the Fourteenth Annual ESRI User Conference, Palm Springs, California, 1994.
[32] G. Giuliani, Y. Guigoz, P. Lacroix, N. Ray and A. Lehmann, “Facilitating the production of ISO-compliant metadata of geospaital datasets,” International Journal of Applied Earth Observation and Geoinformation, vol. 44, 23-243.
[33] S. Trilles, L. Diaz and J. Huerta, “Approach to facilitating a geospatial data and metadata publication using a standard geoservice,” International Journal of Geo-Information, vol. 6(5), pp 126.
[34] C. Doctorow. Metacrap: Putting the Torch to Seven Straw-Men of the Meta-Utopia. [online]. Available from http://www.well.com/~doctorow/metacrap.htm. [retrieved February 2018].
[35] L. Qiu, G. Lingling, H. Feng and T. Yong, “A unified metadata information management framework for the digital city,” Proceedings of IEEE’s Geoscience and Remote Sensing Symposium, pp. 4422–4424, 2004
[36] R. Devillers, Y. Bédard, and R. Jeansoulin, “Multidimensional management of geospatial data quality information for its dynamic
use within Geographical Information Systems,” Photogrammetric Engineering and Remote Sensing, vol. 71(2), pp. 205–215, 2005.
[37] R. Tolosana-Calsanz, J. Alvarez-Robles, J. Lacasta, J. Iso-Noguera, P. Muro-Medrano and F. Zarazaga-Soria. “On the Problem of Identifying the Quality of Geographic Metadata” in J. Gonzalo, C. Thanos, M. Verdejo and R. Carrasco (Eds.), Research and Advanced Technology for Digital Libraries, ECDL, Lecture Notes in Computer Science, vol. 4172, Berlin: Springer, 2006.
[38] Federal Geographic Data Committee (FGDC), “Content Standard for Digital Geospatial Metadata Workbook,” Washington D.C.: Federal Geographic Data Committee, 2000.
[39] Federal Geographic Data Committee (FGDC), “Content Standard for Digital Metadata: Extensions for Remote Sensing Data,” Washington D.C.: Federal Geographic Data Committee, 2002.
[40] North Carolina Geographic Information Coordinating Council (NCGICC), North Carolina State and Local Government Metadata Profile for Geospatial Data and Services [online]. Available from http://www.nconemap.gov/DiscoverGetData/Metadata.aspx#iso. [retrieved February 2018]
[41] European Commission, Infrastructure for Spatial Information in Europe [online]. Available from https://inspire.ec.europa.eu/documents/geodcat-ap. [Retrieved May 2019].
[42] North Carolina Geographic Information Coordinating Council (NCGICC). North Carolina OneMap [online]. Available from http://www.nconemap.gov. [retrieved February 2018].
[43] Department of Environmental, Earth and Geospaital Sciences YouTube Portal. Metadata Training [online]. Available from https://www.youtube.com/playlist?list=PL0JtGFJGnWTONvMk6dBOXqIN6pTlmoj5o. [retrieved November 2018].
[44] North Carolina Geographic Information Coordinating Council (NCGICC). North Carolina OneMap [online]. Available from http://www.nconemap.gov. [retrieved February 2018].
[45] T. Mulrooney, “Turning Data into Information: Assessing and Reporting GIS Metadata Integrity Using Integrated Computing Technologies,” Greensboro, North Carolina: University of North Carolina, Greensboro, 2009.
[46] F. Davis, “Perceived Usefulness, Perceived Ease of Use and User Acceptance of Information Technology,” MIS Quarterly, vol. 13(3), pp. 319-340, 1989.
[47] R. Bagozzi, F. Davis and P. Warshaw, “Development and Test of a Theory of Technological Learning and Usage,” Human Relations, vol. 45(7), pp. 660-686, 1992.
[48] M. Fishbein and I. Ajzen, 1975. Belief, Attitude Intention and Behavior: An Introduction to Theory and Research. Reading, MA: Addison-Wesley.
[49] T. Stewart, “Task Fit, Ease-of-Use and Computer facilities,” In N. Bjørn-Andersen, K. Eason, and D. Robey (Eds.), Managing Computer Impact: An international Study of Management and Organizations (pp. 63-76), Norwood, NJ: Ablex, 1986.
[50] R. Schultz and D. Slevin, 1975. Implementation and Organizational Validity: An Empirical Investigation, New York: American Elsevier, NY, 1975.
[51] D. Robey, “User Attitudes and Management In- formation System Use,” Academy of Management Journal, vol. 22(3), pp. 527- 538, 1979.
[52] A. Bandura, “Self-Efficacy Mechanism in Human Agency,” American Psychologist, vol. 37(2), pp. 122-147, 1982.
[53] D. Dimitrova and Y. Chen, “Profiling the Adopters of E-government Information and Services: The Influence of Psychological Characteristics, Civic Mindedness, and Information Channels,” Social Science Computer Review, vol. 24(2), pp. 172-188, 2006.
[54] M. Masrom, “Technology Acceptance Model and E-learning,” In: 12th International Conference on Education, May 21 - 24, Sultan Hassanal Bolkiah Institute of Education, Universiti Brunei Darussalam, 2007

178
International Journal on Advances in Software, vol 12 no 1 & 2, year 2019, http://www.iariajournals.org/software/
2019, © Copyright by authors, Published under agreement with IARIA - www.iaria.org
[55] M. Koufaris, “Applying the Technology Acceptance Model and Flow Theory to Online Consumer Behavior,” Information Systems Research, vol. 13(2), pp. 205-223, 2002.
[56] E. Hufnagel and C. Conca, “Use Response Data: The Potential for Errors and Biases,” Information Systems Research, vol. 5, pp. 48-73, 1994.
[57] Y. Malhotra and F. Galletta, “Extending the Technology Acceptance Model to Account for Social Influence: Theoretical Bases and Empirical Validation,” Proceeding of the 32nd Hawaii International Conference on System Sciences, 1999.

179
International Journal on Advances in Software, vol 12 no 1 & 2, year 2019, http://www.iariajournals.org/software/
2019, © Copyright by authors, Published under agreement with IARIA - www.iaria.org
A Constructivist Grounded Theory of Trust in Agile Scrum Teams
Trish O’Connell
School of Science & Computing
Galway-Mayo Institute of Technology
Galway, Ireland
Owen Molloy
Dept. of Information Technology
National University of Ireland
Galway, Ireland
Abstract— As Scrum is predominantly a team-based activity, it
is consequently an intensely social endeavour. In order to
deliver on the mutually agreed goals of the Sprint, Scrum
teams need to collaborate and share knowledge effectively.
Many authors have cited trust as being crucial to fostering
collaboration and knowledge sharing. However, to date there
has been no published research into this crucial social
construct in the context of agile software development teams.
This paper revisits the conceptual model of trust presented at
SOFTENG 2018 in light of the findings from a preliminary
Constructivist Grounded Theory study conducted on two
Scrum teams in a major multinational software development
company in the West of Ireland.
Keywords-Agile; Scrum; Team; Trust; Collaboration;
Knowledge-sharing; Constructivist Grounded Theory;
I. INTRODUCTION
Agile software development is a “task oriented, social
activity [1].” This is particularly true of Scrum, the
ubiquitous software development framework most closely
associated with Agile. The Agile Manifesto [2] advocates
“business people and developers must work together daily
throughout the project... build projects around motivated
individuals. Give them the environment and support they
need and trust them to get the job done.” In Scrum, this is
accomplished by the Scrum team. The Scrum team is vital
to achieving the goals of the software development
initiative.
As Moe, Dingsøyr and Dybå posit “Software
development depends significantly on team performance, as
does any process that involves human interaction [3].” In
part, this is because, according to Schwaber, “When people
work by themselves, they can achieve great things. When
people work with others, they often achieve synergy, where
the joint effort far exceeds the sum of the individual efforts
[4].” In order to fully achieve synergy team members need
to share knowledge within the team and collaborate to
achieve the goals of the Scrum Sprint, which is the
timeboxed period used to develop a software increment.
Dorairaj, Noble and Malik cite trust as “one of the key
factors [5]” in successful Agile projects. Largely this is
because, “trust has been found to be a critical factor
facilitating collaboration [6].” Tschannen-Moran elucidates,
“collaboration and trust are reciprocal processes; they
depend upon and foster one another [7].” With regard to
knowledge sharing Ghobadi posits “the unique and inherent
characteristics of software development signify the
importance of effective knowledge sharing, referring to the
exchange of task-related information, ideas, know-hows,
and feedback regarding software products and processes
[8].” Butler refers to research conducted by Zand when he
states that “trust leads to the disclosure of information [9].”
Furthermore Zand describes how “persons who trust one
another will provide relevant, comprehensive, accurate, and
timely information, and thereby contribute realistic data for
problem-solving efforts [10].” The study by Fields and
Holste acknowledged the role of trust in a “willingness to
share and use knowledge [11] .”
Whilst trust has often been included in the academic
discourse it has predominantly been through a sociological,
psychological, economic or organizational lens.
Consequently, the findings have been somewhat
incongruous when applied to a software development
context. McKnight and Chervany referred to the lack of
consensus about trust as causing “conceptual confusion
[12].” In this study a preliminary constructivist grounded
theory will be presented which seeks to understand the
construct of trust and how it develops in the Agile Scrum
software development team engaged in the development of
software products.
Section II of this paper presents the background to the
study in terms of knowledge sharing, collaboration and
trust. Section III outlines the research that was conducted
including a breakdown of the study methodology and how it
was implemented. Section IV presents the results of the
research and leads into Section V, where the findings are
presented. Section VI presents a discussion of the results
and leads into Section VII which examines the limitations of
the research. Finally, Section VIII concludes and outlines
the plans for future work.
II. BACKGROUND
According to the co-creators of the Agile Manifesto,
Scrum teamwork is characterised by “intense collaboration
[2].” Tabaka specifically refers to the concept of
collaboration in a software development context, citing as
useful, the sharing of “ideas, information, decisions and

180
International Journal on Advances in Software, vol 12 no 1 & 2, year 2019, http://www.iariajournals.org/software/
2019, © Copyright by authors, Published under agreement with IARIA - www.iaria.org
solutions [13].” The relevance of collaboration to Agile
software development was highlighted by Nerur, Mahapatra
and Mangalaraj who expounded “A cooperative social
process characterized by communication and collaboration
between a community of members who value and trust each
other is critical for the success of agile methodologies [14].”
It is important for the team to work cooperatively to share
information where cooperation, according to Collier
involves the “ smooth transfer of work in progress, work
products, and information from one member to another
[15].” Collaboration, by contrast, “elevates groups beyond
cooperation, adding an essential ingredient for emergent,
innovative, and creative thinking [15].”
Ghobadi and Mathiassen posit, “Software development
is a collaborative process where success depends on
effective knowledge sharing [16].” Thus it may be argued
that knowledge sharing plays a vital part in enhancing the
success of the Sprint. As Ryan and O’Connor assert
“knowledge sharing is a key process in developing software
products [17].”
In order to facilitate collaboration and knowledge
sharing in a Scrum team there is one key ingredient, which
binds the team together, trust. Chen, Lin and Yen state
unequivocally that “trust leads to better inter-organizational
collaboration and knowledge sharing [18].”
A. Knowledge Sharing
Cummings (2004) argues that knowledge sharing within
a group “includes the implicit coordination of expertise …
and information about who knows what in the group [19].”
There are two types of knowledge which are of vital
significance in Scrum teams, explicit knowledge and tacit or
implicit knowledge. The distinction between these two
distinct types of knowledge was highlighted by Nonaka in
1994 when he wrote about the “joint creation of knowledge
[20]” in organizations. Wyatt defines explicit knowledge as
consisting of “of facts, rules, relationships and policies that
can be faithfully codified in paper or electronic form and
shared without need for discussion [21].” Nonaka concurs,
describing that explicit knowledge “refers to knowledge that
is transmittable in formal, systematic language [20].”
By contrast, Nonaka maintains that tacit knowledge is “a
personal quality, which makes it hard to formalize and
communicate. Tacit knowledge is deeply rooted in action,
commitment, and involvement in a specific context [20].”
Chau et al. posit that tacit knowledge includes “system
knowledge, coding convention, design practices, and tool
usage tricks [22] .” The authors argue that “developers tend
not to document this knowledge and it is usually not
explicitly taught through formal training [22].”
From a Scrum team perspective the sharing of both types
of knowledge is crucial to Scrum team performance since as
Levy and Hazzan claim “software development work
requires various forms of explicit as well as implicit
knowledge [23].”
At the outset, in a Scrum team, the Sprint Planning
meeting is the forum where the product backlog is discussed
and negotiated. In general the information is shared
explicitly among the team members. However, when the
Sprint commences it is not unusual for developers to
discover obstacles which are shared with the team at the
Daily Scrum. The sharing of information at the Daily Scrum
is mostly explicit in nature given that the team uses the
meeting as the vehicle to describe what progress has been
made during the previous day; what progress is expected to
be made in the current day and what, if any, blockers are
impeding progress and causing an impasse in the
development.
However, knowledge sharing, whilst vital is not
sufficient on its own for successful software development.
Judy and Krummins-Beens describe how the Agile
Manifesto emphasizes “collaboration among team members
and project sponsors [24].”
B. Collaboration
Tabaka establishes the importance of collaboration by
stating that “when teams declare a collaborative imperative
in their work, it is their pledge to employ consensus-based
decision approaches through participatory decision-making.
They apply high-bandwidth information gathering coupled
with well-formed and well-articulated priorities [13].” The
Agile Manifesto argues strongly for collaboration
advocating “customer collaboration over contract
negotiation [2]” and “developers must work together daily
throughout the project [2].” Fowler and Highsmith contend
that “only through ongoing collaboration can a development
team hope to understand and deliver what the client wants
[25].” Tabaka summarises that collaboration in Agile has
become “an integral component of what would be
considered a responsive, adaptive software development
approach [13].” Chau and Maurer concur, positing software
development is “a collaborative process that needs to bring
together domain expertise with technological skills and
process knowledge [26].”
That Scrum software development is a collaborative
endeavour is undeniable. The Agile Manifesto advocates
strongly for “face-to-face conversation [2].” Paulk argues
that this can best be achieved by having the team members
in close proximity to each other, stating “Agile teams are
expected to be co-located [27].” In Scrum, Deemer et al.
advocate “An excellent practice is for the team to be
collocated [28].” In addition to the informal opportunities
offered by collocation of having team members discuss
ideas and solutions to possible problems the Scrum
framework has a number of events which facilitate
181
International Journal on Advances in Software, vol 12 no 1 & 2, year 2019, http://www.iariajournals.org/software/
2019, © Copyright by authors, Published under agreement with IARIA - www.iaria.org
knowledge sharing and problem solving by providing
opportunities for collaboration.
McHugh, Conboy and Lang cite “sprint/ iteration
planning, daily stand-up, and sprint/iteration retrospective
[29]” as three key practices which require the “collective
participation of all team members with a focus on people,
communication, interaction, and teamwork [29].”
The Sprint planning meeting is the timeboxed meeting
which happens prior to each iteration. It is at this meeting
that the planning for the upcoming Sprint “is created by the
collaborative work of the entire Scrum Team [30].” It is at
this meeting that the Scrum team negotiates a shared
understanding of the work to be completed for the upcoming
Sprint.
The development team uses the Daily Scrum or Daily
Stand-Up as it is often called “to inspect progress toward the
Sprint Goal and to inspect how progress is trending toward
completing the work in the Sprint Backlog. The Daily
Scrum optimizes the probability that the Development Team
will meet the Sprint Goal [30].” The Daily Scrum is the
optimum vehicle for collaboration since it considers what
was accomplished in the previous day of the Sprint. It
explores what will be achieved in the coming day and it
seeks to clarify what, if any, impediments exist to progress.
It is at this point that collaboration comes into its own. If a
team member has a particular obstacle which is causing an
impasse to progress, the team can come together to
brainstorm possible solutions in what Levy and Hazzan
refer to as a “collaborative workspace – a space which
supports and facilitates communication [23].”
In similar vein, the Sprint Retrospective is the forum to
“encourage the Team to revise, within the Scrum process
framework, its development process to make it more
effective and enjoyable for the next Sprint [31].”
C. Trust in the Academic Discourse
Mach, Dolan and Tzafrir argue, “trust is an integral part
of teamwork because team tasks require a high level of
interdependence between members [32].” Furthermore,
Sandy Staples and Webster postulate, “team members must
rely on each other and share required knowledge with
others. If sharing does not happen within the team, it is
unlikely to meet its objectives [33].”
As previously stated, the literature on trust examines it
from a number of different perspectives. Consequently the
result is highly fragmented and unintegrated when it comes
to applying it to the Scrum team context. Nevertheless, it is
possible to take some generalities from the extant research
into trust.
Sociologists have often seen trust as a type of mystical
‘faith’ that one person has in another. Simmel in 1950
wrote “confidence is intermediate between knowledge and
ignorance about a man. The person who knows completely
need not trust [34].” Giddens would appear to concur
advocating “There would be no need to trust anyone whose
activities were continually visible and whose thought
processes were transparent [35].” It is likely that from a
psychological viewpoint these sociologists were referring to
trusters having a “propensity to trust” or “trusting
disposition” as referred to by Rotter [36] and McKnight and
Chervany [12].
The notion of expectancy or expectation is often
synonymous with trust in the literature. Largely this notion
emanates from the realm of social psychology. Deutsch
offers as a definition of trust that “Person I trusts Person II
to do something and I perceives that the behavior he
expects of Person II is perceived by II to have relevance to I
[37].” Barber concurs with Deutsch acknowledging that
trust is “a dimension of all social relationships [38].” In his
seminal volume The Logic and Limits of Trust he describes
how actors in social relationships have “expectations” of
each other [38]. Given that expectation has the connotation
of often being reciprocated, Deutsch associated trust with a
“reciprocal, cooperative relationship between people who
make the decision to trust [1].” Additionally Deutsch
introduced the notion of ‘competence’ being involved in
the fulfilment of expectations. One can only meet
someone’s expectations, if one has the competence to so do.
Gabarro added to Deutsch’s notion of competence and
included “openness about task problems [39].” Openness,
“freely sharing ideas and information [40],” and integrity,
“honesty and truthfulness [40],” were also cited by Butler
and Cantrell who listed these as conditions of trust.
Assuming that we trust people that we know better than
those we do not know Luhmann contended that familiarity
should also be seen as the “prerequisite for trust [41].”
Whilst initially Mayer [42] and Mishra [6] perceived
trust as a willingness to accept vulnerability, Mayer
described this willingness as largely cognitive. That this
cognitive based trust should eventually develop affective or
emotional overtones was postulated by McAllister who
described “affect based trust [43].” This view was
advocated also by Lewicki and Bunker who described
initial trust as being “calculus based [44].” To clarify,
calculus based trust is arrived at in a stepwise process with
each trusting endeavour being used as the basis for the next
level. In this sense it is described as “tactical climbing
[44].” From this cognitive position Lewicki and Bunker
then describe “knowledge based” trust as relying on
“information rather than deterrence. The better we know the
other individual, the more accurately we can predict what
he or she will do [44].” The authors also described
“identification based” trust in which a “collective identity
develops [44].”
Thus, it would seem that the academic discourse
presents trust as initially cognitive in that one makes a
judgement call on whether to trust, and if expectations are
fulfilled, this calculative trust can develop into an emotional

182
International Journal on Advances in Software, vol 12 no 1 & 2, year 2019, http://www.iariajournals.org/software/
2019, © Copyright by authors, Published under agreement with IARIA - www.iaria.org
connection with the person being trusted into a deeper
bond of genuine affect where both the trustee and the
truster have “fully internalized the other's preferences [45].”
D. The Scrum Team
Katzenbach and Smith define a team as “a small number
of people with complementary skills who are committed to
a common purpose, set of performance goals, and approach
for which they hold themselves mutually accountable [46].”
According to Schwaber and Sutherland, the co-creators of
the Scrum framework, Scrum teams should be “small
enough to remain nimble and large enough to complete
significant work within a Sprint [47].” Three to nine team
members is regarded as being optimal. In terms of
complementary skills Scrum team members, viewed as an
entity, tend to possess “technical expertise (knowledge
about a specialized technical area), (2) design expertise
(knowledge about software design principles and
architecture), and (3) domain expertise (knowledge about
the application domain area and client operations) [48].”
In addition Katzenbach and Smith advocate the need for
“problem-solving and decision-making skills, and
interpersonal skills [46].”
The common purpose element of the team definition
contributed by Katzenbach and Smith is unquestionable. By
its very design Scrum teams collaborate to achieve Sprint
goals. As Moe, Dingsøyr and Dybå explain “In a software
team, the members are jointly responsible for the end
product and must develop shared mental models by
negotiating shared understandings about both the teamwork
and the task. Project goals, system requirements, project
plans, project risks, individual responsibilities, and project
status must be visible and understood by all parties
involved [49].”
Similarly, mutual accountability in Scrum is de rigeur
given the requirement to account for progress at the Daily
Scrum meeting. Cervone explains “the purpose of the daily
Scrum is to both track the progress of the team as well as
allow team members to make commitments to each other
and the Scrum Master so that work can proceed in the most
expedient and unimpeded manner.” McHugh,Conboy and
Lang concur that the Daily Scrum meeting “provides
transparency and visibility on the day-to-day progression of
tasks [29].”
E. Trust in the Scrum Team
Having examined trust in isolation in the academic
discourse and furthermore having introduced the Scrum
team as the vehicle for collaboration and knowledge
sharing and collaboration it is somewhat surprising that no
published studies appear to have “examined trust in an agile
context [29].” Consequently, what follows is an attempt to
synthesize the extant literature with a view to applying it to
a Scrum team. Figure 1 represents a first stage conceptual
model of trust in a Scrum team.
1) Perception
Whilst perception does not really appear in the literature
on trust the authors contend that in any team scenario,
perception may well play a role. An individual who is new
to a team will most likely be subject to a degree of initial
judgement. Based on how they are initially perceived the
calculus based trust will enhance or detract from their
position.
2) Reputation
Some authors [29] contend that reputation is involved in
the trust construct. Undoubtedly, a team member’s
reputation for delivering on their commitments plays a part
in whether or not they can be trusted to deliver on their next
commitment. This too must surely play a part in the
decision to trust or calculus based trust scenario.
3) Integrity
As a team member becomes enmeshed in the Scrum
team their integrity and credibility is often tested by other
team members. Insofar as a team member does what s/he
says s/he will do, integrity is strengthened in the calculative
decision to trust.
4) Competence
As shown in Figure 1 the first four conditions for trust,
as described above function to enhance the positive
reinforcing feedback loop that is calculus based trust. In
other words, as a team member demonstrates integrity or
competence, for example, the trust in them grows. This
allows the relationship to transition to knowledge based
trust in which familiarity and openness themselves function
as positive feedback loops as described below.
5) Familiarity
As the team members spend time together they come to
know each other better; a good rapport is established and
the relationships within the team can move past the
calculus-based, cognitive decision to trust to a more affect-
based knowledge of the other. It is at this stage that the
team has really bonded. As Santos et al. describe “Agile
values and principles foster changes in team members’
attitudes and strengthen their relationships [50].”
6) Openness
Largely as a consequence of an increase in familiarity
the team members should become more open with each
other. As Zand described in Section I, “persons who trust
one another will provide relevant, comprehensive, accurate,
and timely information, and thereby contribute realistic data
for problem-solving efforts [10].” This happens directly as
a result of the openness in the team.
Once this reinforcing loop has begun it is argued that
the team members come to identify with each other’s goals
and the goals for the Sprint itself. At this stage the calculus
based trust has been sidelined in favor of affective bonds
within the team.

183
International Journal on Advances in Software, vol 12 no 1 & 2, year 2019, http://www.iariajournals.org/software/
2019, © Copyright by authors, Published under agreement with IARIA - www.iaria.org
7) Reciprocity
Once familiarity has become embedded in the team
DeVries et al. describe “a cycle of reciprocity, in which
team members are more likely to exchange (i.e., both
donate and collect) knowledge with each other [51]”
becomes the norm.
This again would appear to be a reinforcing loop since
as the team bonds the emotional ties become stronger and
team members are more likely, and willing, to help each
other.
It should be noted, however, that this is a conceptual
model of trust within the Scrum team. With a view to
understanding the construct of trust in the Scrum team and
how it develops in the Agile Scrum software development
team engaged in the development of software products the
research study that was undertaken will now be described.
III. THE RESEARCH
As this research involves the construct of trust, which
does not well suit quantitative analysis it would be more
usual for social science topics such as trust to fall into the
realm of qualitative data. Johnson and Onwuegbuzie outline
the strengths of qualitative research as “The data are based
on the participants’ own categories of meaning [52].”
Since this research is quite unequivocally involved in
the perceptions and feelings of the Agile team members
who will be interviewed the ontological perspective of this
study must be subjective. In terms of the epistemology that
underpins this research the constructivist epistemology
(also referred to in the literature as Interpretivist) asserts,
“social phenomena and their meanings are continually
being accomplished by social actors. It implies that social
phenomena are not only produced through social interaction
Figure 1. Conceptual Model of trust in a Scrum Team

184
International Journal on Advances in Software, vol 12 no 1 & 2, year 2019, http://www.iariajournals.org/software/
2019, © Copyright by authors, Published under agreement with IARIA - www.iaria.org
but are in a constant state of revision [53].” According to
Vanson, the interpretivist approach “suggests that facts are
based on perception rather than objective truth. With this
approach, the conclusions are derived from the
interpretations of the participants rather than the abstract
theories of the researcher [54].”
Thus, it is intended to use a constructivist grounded
theory approach to this research with the intent of gathering
the views, perspectives and feelings of the members of a
purposive sample of Agile software development teams
from a selection of different industries with a view to
generating a theory of how trust is developed and serves to
enhance collaboration in Agile teams.
It is hoped that using this inductive approach this study
will in some way contribute to understanding the construct
of trust enhancing team performance in Agile software
development teams.
Grounded theory was initially conceived by Glaser and
Strauss as a polemic against the logico-deductive method of
generating a theory whereby new knowledge (theory)
follows from old knowledge through the application of
research hypotheses and sound arguments that verify these
new theories. Glaser and Strauss, by contrast, argued against
data collection being influenced by pre-conceived
hypotheses. Rather, “systematic data collection and analysis
should lead into theory [55].” However, whilst Glaser and
Strauss adopted an ontologically positivist approach
Charmaz [56], by contrast advocates an interpretivist
approach to the process acknowledging “subjectivity and
the researcher’s involvement in the construction and
interpretation of data [56].” Since trust is socially
constructed the study will adopt the Constructivist
Grounded theory (CGT) method as described by Charmaz.
In CGT the researcher must obtain “rich data [56]” from
interviews with participants. Rich data refers to collecting
data which fully addresses the complexities and depth of the
topic under study. The data is then analysed, initially using
what is termed “initial coding [56]” where each sentence is
fractured and analysed for meaning. Through the process of
constant comparison the open codes eventually build into
focused codes which are basically at a higher level of
abstraction. Eventually the theory emerges from the data as
codes are elevated to categories.
With a view to ensuring that the codes fully describe the
emerging theory a process known as theoretical sampling is
used to elaborate and refine the newly-constructed
categories. This is achieved by continuing to sample until no
new categories emerge.
In order to conduct this study purposive sampling was
used to contact software development companies that use
Scrum as their development methodology. Purposive
sampling [57] is a type of focused sampling and in this case
an organization known to use Scrum was approached and
permission was sought to conduct the research. The
company has a number of onsite Scrum teams and given the
logistical issues, viz team availability, participant workload
etc. we were able to interview participants from two of the
local onsite teams as shown in Table I.
TABLE I. TEAM COMPOSITION AND ROLES
In-depth interviews were conducted with all of the
participants with a view to eliciting what Charmaz refers to
as ‘rich data’ [56]. The interviews lasted from 30 minutes
to 50 minutes. Each interview was audio recorded and
transcribed. With a view to ensuring that all of the nuances
and subtleties were captured by the author, as illustrated in
Figure 2, the transcribed interviews were subsequently
returned to the participants for verification.
Figure 2. The Constructivist Grounded Theory process
Participant # Team A
Participant # Team B
P#1 Scrum Master P#6
Scrum Master
P#2 Product Owner P#7
Product Owner
P#3 Developer P#8 Developer
P#4 Developer P#9 Developer
P#5 Developer P#10 Developer
P#11 Developer
Memoing
Purposive sampling to identify participant organisations
Data collection via interviews
Transcription & verification by participants
Initial coding
Focused coding
Elevating focused codes to categories
Theoretical sampling
Building theory

185
International Journal on Advances in Software, vol 12 no 1 & 2, year 2019, http://www.iariajournals.org/software/
2019, © Copyright by authors, Published under agreement with IARIA - www.iaria.org
Subsequent to gathering background data and obtaining
consent for audio recording from each participant, the
interviews focused initially on collaboration and then moved
on to describing how trust is established in the Scrum teams.
Following the interviews, the researcher, in accordance with
the established constructivist grounded theory methodology,
transcribed the interviews. Additionally, memos detailing
ideas and refinements that, it was hoped, would advance
theoretical understanding were written. It is, perhaps,
noteworthy that interviews were largely unstructured but
participants who were not naturally loquacious were
prompted in a semi-structured manner for their response to
topics that had been of interest in a prior interview with a
previous interviewee.
IV. RESULTS
In keeping with the tenets of Constructivist Grounded
Theory the transcribed interviews were uploaded into a
qualitative analysis software package. MAXQDA was
chosen for its intuitive easy to use interface. Transcribed
interviews can be stored, analysed and coded in MAXQDA.
Once participants interviews were transcribed and validated
the process of initial coding began. This is where each line
of the participants’ transcription was analysed with a view
to encapsulating the meaning in a code which essentially
describes what the segment of text is about.
Ideally the codes are gerunds which describe actions
e.g., “removing ego” [P#9] which is depicted in Figure 3.
On the right hand side, highlighted in yellow, is the
fragment of what was said by the participant. On the left, in
blue font, is the code that was used to encapsulate what it
was felt the participant meant. Similarly the code ‘helping
each other’ on the left hand side is associated with the
fragment of the interview on the right hand side where the
participant commented that “if somebody needs help you
will help them.”
Once the interview was coded, subsequent interviews
were analysed in a similar manner and compared to each
other. Constant comparison is a key strategy used in
grounded theory where each piece of elicited data is
compared to other pieces of data by the researcher to
identify and highlight similarities and differences in the
participants’ experiences.
MAXQDA was helpful in facilitating this process as
codes assigned from previous transcripts were available to
view in a portion of the window as shown in Figure 4. On
the right of Figure 4 is an interview displaying codes. This facilitated what Charmaz refers to as “focused
coding” [56] where codes are analysed to advance the
theoretical direction of the study. Charmaz describes these
codes as more conceptual than the initial coding.
Figure 3. Coding fragment from Interview with P#9
Figure 4. MAXQDA Window depicting codes and coding

186
International Journal on Advances in Software, vol 12 no 1 & 2, year 2019, http://www.iariajournals.org/software/
2019, © Copyright by authors, Published under agreement with IARIA - www.iaria.org
Finally, the focused codes were raised to conceptual
categories which, when integrated, addressed the question of
how trust is fostered and developed in Scrum teams. It is at
this stage that we had to co-construct the meaning with the
participants. Central to Constructivist Grounded Theory the
researcher brings their own experience into the analysis to
help make sense of the focused codes. Figure 5 depicts an
example of how the codes emerge as categories.
V. FINDINGS
Whilst this research is still ongoing it is nevertheless
believed useful to present the initial key findings.
For successful knowledge sharing and collaboration to
exist in Scrum teams, such as the ones investigated in this
study, various factors must be in place to promote inter-
team trust.
A. Commitment to the Sprint goal
During the Sprint planning meeting the team reaches a
consensus about the Product backlog. This dictates the plan
of what will be achieved in the upcoming Sprint, who will
undertake it and how long it is estimated to take. That the
teams are working towards a common goal for their team
Sprints is evidenced by:
“We are all focused in around a common goal, and a
common vision of what we are doing, and the guys buy into
that.” P#1, Scrum master.
Commitment to a common goal is of significant
importance as Badke-Schaub et al. state “Team performance
can benefit from shared mental models in situations with a
high need of information exchange in the team [56].”
Figure 5. Emerging categories from codes

187
International Journal on Advances in Software, vol 12 no 1 & 2, year 2019, http://www.iariajournals.org/software/
2019, © Copyright by authors, Published under agreement with IARIA - www.iaria.org
B. Having integrity
As a team member being honest and transparent with
team mates is a key requirement to foster trust. It is
important that:
“they do what they say, not what you say” P#3, Developer.
Another participant highlighted the importance of:
“If they say they are going to do something, they do it or
they put their hand up and say that didn’t get done today
we’ll get it tomorrow.” P#7, Developer.
“You could have saved us a lot of hassle and it would have
made for a lot simpler conversations if you had just
gone ahead and done what we had advised you to do in the
first place.” P#1, Scrum Master
C. Openness and Honesty
Openness and honesty are a crucial component of the
Scrum teams’ ability to move the project forward as
evidenced by:
“I have never heard anybody come in and lie at the stand-
up, you know, to say, oh, yeah, I am doing great, when they
are not.” P#5, Product Owner,
The participants agreed that delivering on what has been
committed at the Daily Stand up is the final arbiter of
success:
“There are a lot of people who talk but it doesn’t prove
anything really until it is actually done.” P#8, Developer.
D. Familiarity with team members
There was unanimity that having friendly relations with
one’s team mates improved trust and thus enhanced
knowledge sharing and collaboration:
“The more familiar you are with people and the friendlier
you get with them, the easier it is to work with them and
have those informal conversations.” P#9, Developer.
“You would be sitting together at lunchtimes and you would
be chatting about this and that and the rest of it.” P#7,
Product Owner.
“I know them all fairly well on a personal level outside of
work. We wouldn’t meet too much outside of work like, but
talk at breaks, etc.” P#4, Developer.
In fact, some members of the team seemed to know each
other so well that:
“You know the name of the kids, you know, more or less
when the birthday of the kids are, and that, kind of
thing.”P#2, Developer.
And from another team member:
“I would see Joe in here every day. His wife bought my
car.” P#3, Developer.
To sum up:
“Outside of work I would say that team members would
know each other socially, in either their kids going to Clubs
or sporting things.” P#1, Scrum Master.
E. Seeking and Accepting Help
It was somewhat surprising that one of the key findings
from the study was the importance of team members being
able to both ask for and accept help from their peers.
“it is okay to not be able to do something straight away like
you can ask your Team-mates and you will eventually get it
done” P#8, Developer.
“When the team is working well everyone is prepared to say
I do not know how to do this today but give me a day and
I’ll find out who is really good at it and they will help me.”
P#7, Developer.
“If you see someone has any problem or any concern, or
they, even any, kind of, questions that you have, we are
really not scared to ask them.” P#2, Developer.
Perhaps the rationale for this came from the developer
who commented
“Definitely, on our Team, people are motivated by
delivering a good product and delivering what they say they
will deliver. That is our primary motivation and we are
willing to help each other. There is no selfishness in it.”
P#9, Developer.
This lack of selfishness and team spirit was encapsulated
by the Scrum master who stated
“We are not an individual, we are a group here, we have to
fight this battle” and
“We are all in this or none of us are in it.” P#1, Scrum
Master.
F. Competence
It was expected that competence would feature
prominently in the interviews but surprisingly this did not
appear to be the case. Rather there was an acceptance that
“I think that with time enough everybody can be competent”
P#2, Product Owner.
There appeared to be a recognition that
“You have to accept that everyone has different levels of
abilities.” P#4, Developer and

188
International Journal on Advances in Software, vol 12 no 1 & 2, year 2019, http://www.iariajournals.org/software/
2019, © Copyright by authors, Published under agreement with IARIA - www.iaria.org
“Some people within the team could have competence in
certain areas and would have lower competence in other
areas.” P#1, Scrum master.
VI. DISCUSSION
It woud appear from the research that the conceptual
model as illustrated in Figure 1 came very close to
accounting for the empirical findings. However, the use of
CGT was not intended to validate the model. The strength of
CGT in this study lies in exploring the participants’ view of
trust within their Scrum teams. CGT builds the theory out
of the ‘rich data’ collected from the participants’ own
experience.
Whilst integrity, openness and familiarity featured
strongly throughout the interviews it would appear that
perception and reputation do not appear to matter unduly. It
might be argued that the category of seeking and accepting
help are components of reciprocity but there is a degree of
limitation in this as reciprocity has a two way connotation
whilst asking for and accepting help tends to only benefit
the team member who has requested the help.
Competence really did not seem to be as crucial to
building trust as had been expected. The emphasis appeared
to be more on the willingness to learn.
There was unanimity throughtout all of the interviews in the
team unifying behind the Sprint goal and this resonates with
the shared mental model as mentioned in Section II D.
The literature refers to a stepwise calculative approach to
building trust. Lewicki and Bunker describe how
“achievement of trust at one level enables the development
of trust at the next level [44].” This appears to be the
approach taken in the company we worked with. New team
members are firstly invited to pair with a more experienced
developer and tasks are worked on jointly. After a period of
time (which largely depends on the new team member) an
individual task is assigned and the experienced developer
steps back but is still available to mentor on an as needs
basis. As this happens the new team member is becoming
known to the team, familiarity and integrity are established.
Once the new team member has become embedded in the
team s/he begins to fully identify with the team, knowledge
sharing and collaboration are enhanced and the teams’ goals
for the Sprint are met.
VII. LIMITATIONS
The key limitation is that the research is not yet
concluded. Thus what is presented is a snapshot which
pertains to two collocated Scrum teams in a single
multinational. Consequently, at this stage the findings are in
no way generalizable.
VIII. CONCLUSION AND FUTURE WORK
Although this study forms the first of what is intended to
be part of several similar studies carried out as part of our
research on trust in Scrum teams in various Irish software
development organizations the findings are nevertheless
considered to be significant in that they represent the
findings from a large successful software development
multinational company based in the West of Ireland.
In terms of future work the research is ongoing in other
multinationals. It is hoped that from this work the body of
knowledge regarding the development of trust in co-located
Scrum teams will be enlarged.
REFERENCES
[1] T. O’Connell and O. Molloy, “The Antecedents and
Feedback Loops Contributing to Trust in Agile Scrum
Teams,” in SOFTENG 2018, 2018, pp. 16–23.
[2] J. Beck, K., Beedle, M., Van Bennekum, A., Cockburn,
A., Cunningham, W., Fowler, M., Grenning, J.,
Highsmith, J., Hunt, A., Jeffries, R. and Kern, “Manifesto
for agile software development,” 2001.
[3] N. B. Moe, T. Dingsøyr, and T. Dybå, “A teamwork
model for understanding an agile team: A case study of a
Scrum project,” Inf. Softw. Technol., vol. 52, no. 5, pp.
480–491, May 2010.
[4] K. Schwaber, Agile Project Management with Scrum.
2004.
[5] S. Dorairaj, J. Noble, and P. Malik, “Understanding the
Importance of Trust in Distributed Agile Projects: A
Practical Perspective,” in Understanding the Importance
of Trust in Distributed Agile Projects: A Practical
Perspective in: Sillitti A., Martin A., Wang X., Whitworth
E. (eds) Agile Processes in Software Engineering and
Extreme Programming. XP 2010. Lecture Notes in
Business Information Processing, vol. 48, pp. 172–177.
Springer, Berlin, Heidelberg.
[6] A. K. Mishra, “Organizational Responses to Crisis: The
Centrality of Trust,” in: Kramer, R, Tyler,T. (eds)Trust in
Organizations: Frontiers in Theory and Research, 1996,
pp. 261–287.
[7] M. Tschannen‐Moran, “Collaboration and the need for
trust,” ournal Educ. Adm., vol. 39, no. 4, pp. 308–331,
2001.
[8] S. Ghobadi, “What drives knowledge sharing in software
development teams: A literature review and classification
framework,” Inf. Manag., vol. 52, pp. 82–97, 2015.
[9] J. K. Butler, “Toward Understanding and Measuring
Conditions of Trust: Evolution of a Condit Toward
Understanding and Measuring Conditions of Trust:
Evolution of a Conditions of Trust Inventory,” J.
Manage., vol. 17, no. 3, pp. 643–663, 1991.

189
International Journal on Advances in Software, vol 12 no 1 & 2, year 2019, http://www.iariajournals.org/software/
2019, © Copyright by authors, Published under agreement with IARIA - www.iaria.org
[10] D. E. Zand, “Trust and Managerial Problem Solving,”
Adm. Sci. Q., pp. 229–239, 1972.
[11] D. Fields and J. S. Holste, “Trust and tacit knowledge
sharing and use,” Artic. J. Knowl. Manag., 2010.
[12] D. H. McKnight and N. L. Chervany, “The meanings of
trust.,” 1996.
[13] J. Tabaka, Collaboration Explained: Facilitation Skills for
Software Project Leaders, Pearson, 2006.
[14] S. Nerur, R. Mahapatra, and G. Mangalaraj, “Challenges
of Migrating to Agile Methodologies,” Commun. ACM
May Commun. ACM, vol. 48, no. 5, 2005.
[15] K. Collier, Agile analytics: A value-driven approach to
business intelligence and data warehousing, Addison-
Wesley, 2012.
[16] S. Ghobadi and K. Mathiassen, “Perceived Barriers to
Effective Knowledge Sharing in Agile Software Teams,”
Information Syst., vol. 26, no. 2, pp. 95–125, 2016.
[17] S. Ryan and R. V. O’Connor, “Acquiring and Sharing
tacit knowledge in software development teams: An
empirical study,” Inf. Softw. Technol., vol. 55, no. 9, pp.
1614–1624, 2013.
[18] Y.-H. Chen, T.-P. Lin, and D. C. Yen, “How to facilitate
inter-organizational knowledge sharing: The impact of
trust,” Information Management, vol 51, no 5, 2014.
[19] J. N. Cummings, “Work Groups, Structural Diversity, and
Knowledge Sharing in a Global Organization,” Manage.
Sci., vol. 50, no. 3, pp. 352–364, 2004.
[20] I. Nonaka, “A Dynamic Theory of Organizational
Knowledge Creation,” Organ.. Sci., vol. 5, no. 1, pp. 14–
37, 1994.
[21] J. C. Wyatt, “Management of explicit and tacit
knowledge,” Journal of the Royal Society of Medicine, vol
94, no. 1, pp. 6-9, 2001.
[22] T. Chau, F. Maurer, and G. Melnik, “Knowledge sharing:
Agile methods vs. Tayloristic methods,” in Proceedings
of the Workshop on Enabling Technologies:
Infrastructure for Collaborative Enterprises, WETICE,
2003, vol. 2003–Jan., pp. 302–307.
[23] M. Levy and O. Hazzan, “Knowledge management in
practice: The case of agile software development,” in
2009 ICSE Workshop on Cooperative and Human Aspects
on Software Engineering, pp. 60–65, 2009.
[24] K. H. Judy and I. Krumins-Beens, “Great Scrums Need
Great Product Owners: Unbounded Collaboration and
Collective Product Ownership,” in 41st Hawaii
International Conference on System Sciences, pp. 1-10,
2008.
[25] M. Fowler and J. Highsmith, “The Agile Manifesto,”
Softw. Dev., vol. 9, no. 8, pp. 28–35, 2001.
[26] T. Chau and F. Maurer, “Knowledge Sharing in Agile
Software Teams,” in Logic vs. Approximation 2004, pp.
173–183. Springer, Berlin, Heidelberg.
[27] M. C. Paulk, “Agile methodologies and process
discipline,” Crosstalk, 2002.
[28] P. Deemer, N. K. V. Hazarati, and G. Benefield, The
Distributed Scrum Guide. 2013.
[29] O. McHugh, K. Conboy, and M. Lang, “Agile Practices:
The Impact on Trust in Software Project Teams,” IEEE
Softw., vol. 29, no. 3, pp. 71–76, 2012.
[30] K. Schwaber and J. Sutherland, The Scrum Guide. The
definitive guide to scrum: The rules of the game.
Scrum.org 268, 2013.
[31] A. Sofia, C. Marçal, B. Celso, C. De Freitas, F. S. Furtado
Soares, and A. D. Belchior, “Mapping CMMI Project
Management Process Areas to SCRUM Practices,” in 31st
Software Engineering Worklshop, 2007, pp. 13–22.
[32] M. Mach, S. Dolan, and S. Tzafrir, “The differential effect
of team members’ trust on team performance: The
mediation role of team cohesion,” ournal Occup. Organ.
Psychol., vol. 83, pp. 771–794, 2010.
[33] D. Sandy Staples and J. Webster, “UKISJ Information
Systems,” Authors; J. Compil. ©, vol. 18, pp. 617–640,
2008.
[34] G. Simmel, The sociology of Georg Simmel. Free Press of
Glencoe, 1950.
[35] A. Giddens, The Consequences of Modernity Anthony
Giddens. 1990.
[36] J. B. Rotter, “A new scale for the measurement of
interpersonal trust,” J. Pers., vol. 35, no. 4, pp. 651–665,
Dec. 1967.
[37] M. Deutsch, “Conditions Affecting Cooperation Final
Technical |Report for the Office of Naval Research
Contract NONR- 285,” 1957.
[38] B. Barber, The Logic and Limits of Trust. 1983.
[39] J.J. Gabarro, “The development of trust, influence and
expectations,” Interpers. Behav. Commun. Underst.
relationships, pp. 290–303, 1978.
[40] J. K. Butler and R. S. Cantrell, “Communication Factors
and Trust: An Exploratory Study,” Psychol. Rep., vol. 74,
no. 1, pp. 33–34, Feb. 1994.
[41] N. Luhmann, “Familiarity, Confidence, Trust: Problems
and Alternatives,” in Trust: Making and Breaking
Cooperative Relations, 2000, pp. 94–107.
[42] R. C. Mayer, J. H. Davis, F. D. Schoorman, and F. David
Schoorman, “An Integrative Model of Organizational
Trust,” Acad. Manag. Rev., vol. 20, no. 3, pp. 709–734,
1995.
[43] D. J. McAllister, “Affect-and Cognition-Based Trust
Formations for Interpersonal Cooperation in

190
International Journal on Advances in Software, vol 12 no 1 & 2, year 2019, http://www.iariajournals.org/software/
2019, © Copyright by authors, Published under agreement with IARIA - www.iaria.org
Organizations,” Artic. Acad. Manag. J., vol. 38, no. 1, pp.
24–59, 1995.
[44] R. J. Lewicki and B. B. Bunker, “Trust in relationships: A
model of development and decline,” in The Jossey-Bass
conflict resolution series. Conflict, cooperation, and
justice: Essays inspired by the work of Morton Deutsch,
1995.
[45] D. . Shapiro, B. H. Sheppard, and L. Cheraskin, “Business
on a Handshake,” Negot. J., vol. 8, no. 4, pp. 365–377,
1992.
[46] J. R. Katzenbach and D. K. Smith, “The Discipline of
Teams Harvard Business Review,” 1991.
[47] K. Schwaber and J. Sutherland, “The Scrum GuideTM The
Definitive Guide to Scrum: The Rules of the Game,”
2017.
[48] L. Faraj, S. & Sproull, “Coordinating Expertise in
Software Development Teams,” Manage. Sci., vol. 46, no.
12, pp. 1554–1568, 2000.
[49] N. B. Moe, T. Dingsøyr, and T. Dybå, “A teamwork
model for understanding an agile team: A case study of a
Scrum project,” Inf. Softw. Technol., vol. 52, no. 5, pp.
480–491, May 2010.
[50] J. L. Guedes dos Santos et al., “Methodological
perspectives in the use of grounded theory in nursing and
health research,” Esc. Anna Nery - Rev. Enferm., vol. 20,
no. 3, 2016.
[51] R. E. De Vries, B. Van Den Hooff, and J. A. De Ridder,
“Explaining Knowledge Sharing,” Communic. Res., vol.
33, no. 2, pp. 115–135, 2010.
[52] R. Johnson, A. Onwuegbuzie, and L. Turner, “Toward a
Definition of Mixed Methods Research,” J. Mix. Methods
Res., vol. 1, pp. 112–133, 2007.
[53] A. Bryman and E. Bell, Business research methods. 2015.
[54] S. Vanson, “What on earth are Ontology and
Epistemology? - The Performance Solution,” What on
earth are Ontology and Epistemology?, 2014. [Online].
Available: https://theperformancesolution.com/earth-
ontology-epistemology/. [Accessed: 14-Feb-2019].
[55] D. Ezzy, Qualitative Analysis. Routledge, 2013.
[56] K. Charmaz, Constructing grounded theory. 2014.
[57] P. Nardi, Doing survey research : a guide to quantitative
methods. Pearson/Allyn & Bacon, 2003.
[58] P. Badke-Schaub, A. Neumann, K. Lauche, and S.
Mohammed, “Mental models in design teams: a valid
approach to performance in design collaboration?,”
CoDesign, vol. 3, no. 1, pp. 5–20, Mar. 2007.

www.iariajournals.org
International Journal On Advances in Intelligent Systems
issn: 1942-2679
International Journal On Advances in Internet Technology
issn: 1942-2652
International Journal On Advances in Life Sciences
issn: 1942-2660
International Journal On Advances in Networks and Services
issn: 1942-2644
International Journal On Advances in Security
issn: 1942-2636
International Journal On Advances in Software
issn: 1942-2628
International Journal On Advances in Systems and Measurements
issn: 1942-261x
International Journal On Advances in Telecommunications
issn: 1942-2601